UNITED STATES
SECURITIES AND EXCHANGE COMMISSION
Washington, D.C. 20549
FORM N-CSR
CERTIFIED SHAREHOLDER REPORT OF REGISTERED
MANAGEMENT INVESTMENT COMPANIES
Investment Company Act file number | 811-04367 |
|
Columbia Funds Series Trust I |
(Exact name of registrant as specified in charter) |
|
225 Franklin Street, Boston, Massachusetts | | 02110 |
(Address of principal executive offices) | | (Zip code) |
|
Ryan Larrenaga c/o Columbia Management Investment Advisers, LLC 225 Franklin Street Boston, MA 02110 |
(Name and address of agent for service) |
|
Registrant’s telephone number, including area code: | (800) 345-6611 | |
|
Date of fiscal year end: | March 31 | |
|
Date of reporting period: | March 31, 2016 | |
| | | | | | | | |
Form N-CSR is to be used by management investment companies to file reports with the Commission not later than 10 days after the transmission to stockholders of any report that is required to be transmitted to stockholders under Rule 30e-1 under the Investment Company Act of 1940 (17 CFR 270.30e-1). The Commission may use the information provided on Form N-CSR in its regulatory, disclosure review, inspection, and policymaking roles.
A registrant is required to disclose the information specified by Form N-CSR, and the Commission will make this information public. A registrant is not required to respond to the collection of information contained in Form N-CSR unless the Form displays a currently valid Office of Management and Budget (“OMB”) control number. Please direct comments concerning the accuracy of the information collection burden estimate and any suggestions for reducing the burden to Secretary, Securities and Exchange Commission, 450 Fifth Street, NW, Washington, DC 20549-0609. The OMB has reviewed this collection of information under the clearance requirements of 44 U.S.C. § 3507.
Item 1. Reports to Stockholders.

ANNUAL REPORT
March 31, 2016

COLUMBIA SELECT LARGE CAP GROWTH FUND


ABOUT COLUMBIA THREADNEEDLE INVESTMENTS
Columbia Threadneedle Investments is a leading global asset management group that provides a broad range of actively managed investment strategies and solutions for individual, institutional and corporate clients around the world.
With more than 2,000 people, including over 450 investment professionals based in North America, Europe and Asia, we manage $464 billion* of assets across developed and emerging market equities, fixed income, asset allocation solutions and alternatives. We are the 13th largest manager of long-term mutual fund assets in the U.S.** and the 3rd largest manager of retail funds in the U.K.***
Our priority is the investment success of our clients. We aim to deliver the investment outcomes they expect through an investment approach that is team-based, performance-driven and risk-aware. Our culture is dynamic and interactive. By sharing our insights across asset classes and geographies, we generate richer perspectives on global, regional and local investment landscapes. The ability to exchange and debate investment ideas in a collaborative environment enriches our teams' investment processes. More importantly, it results in better informed investment decisions for our clients.
Columbia funds are distributed by Columbia Management Investment Distributors, Inc., member FINRA, and managed by Columbia Management Investment Advisers, LLC.
Columbia Threadneedle Investments (Columbia Threadneedle) is the global brand name of the Columbia and Threadneedle group of companies.
* In U.S. dollars as of March 31, 2016. Source: Ameriprise Q1 Earnings Release. Includes all assets managed by entities in the Columbia and Threadneedle groups of companies. Contact us for more current data.
** Source: ICI as of March 31, 2016 for Columbia Management Investment Advisers, LLC.
*** Source: Investment Association as of December 2015 for Threadneedle Asset Management Limited.
© 2016 Columbia Management Investment Advisers, LLC. All rights reserved.
Not part of the shareholder report
Investment strategies to help meet investor needs
We are committed to helping investors navigate financial challenges to reach their desired outcomes. The possibilities are endless.
Your success is our priority.
 Retire comfortably
 Fund college or higher education
 Leave a legacy

Generate an appropriate stream of income in retirement
Traditional approaches to income may no longer be adequate — and they may no longer provide the diversification benefits they once did. Investors need to rethink how they generate retirement income.
Worried about running out of income? You are not alone.

Navigate a changing interest rate environment
Even in today's challenging interest rate environment, it's still possible to navigate markets and achieve your goals.
Make investment choices designed specifically for this market environment.

Maximize after-tax returns
In an environment where what you keep is more important than what you earn, municipal bonds can help mitigate higher taxes while providing attractive yields compared to other investment options.
You've worked too hard building your wealth to lose it to taxes.

Grow assets to achieve financial goals
Finding growth opportunities in today's complex market environment requires strong research capabilities, creative thinking and a disciplined approach.
Do your investments deliver the portfolio growth you need?

Ease the impact of volatile markets
With increasing concerns about market volatility, investors should consider diversifying their portfolios with non-traditional holdings.
Interested in turning volatility into opportunity?
To find out more, contact your financial professional, call 800.426.3750 or visit columbiathreadneedle.com/us
Not part of the shareholder report
Get the market insight you need from our investment experts and subscribe to our latest publications


Stay informed with Columbia Threadneedle Investments
Investor insight
Find economic and market commentary, investment videos, white papers, mutual fund commentary and more at columbiathreadneedle.com/us.
Subscribe to the latest information from Columbia Threadneedle. Register your information online at columbiathreadneedle.com/us/subscribe and select the publications you would like to receive, including:
n Columbia Threadneedle Investor Newsletter, highlighting the latest macro- and micro-economic trends, investment themes, products, service changes and other items of interest to our investors
n Investment Strategy Outlook, showcasing the Columbia Threadneedle Asset Allocation Team's perspective on global economic investment conditions and markets
n MarketTrack, featuring straightforward insight on current investment opportunities
n White papers that delve deep into a variety of investment topics
n Quarterly portfolio manager commentary and fund fact sheets
Update your subscriptions at any time by accessing the email subscription center.
Social media 
We offer you multiple ways to access our market commentary and investment insights.
n Perspectives blog at columbiathreadneedle.com/us
Read timely posts by our investment team, including our chief investment officer, chief economist and portfolio managers.
n Twitter.com/CTinvest_US
Follow us on Twitter for quick, up-to-the-minute comments on market news and more.
n Youtube.com/CTInvestUS
View our commentaries on the economy, markets and current investment opportunities.
n Linkedin.com/company/Columbia-Threadneedle-Investments-US
Connect with us on LinkedIn for updates from our thought leaders.
Not part of the shareholder report
 Dear Shareholders,
Volatility comes with the territory for long-term investors. Some investors instinctively want to pull out of the market or sell underperforming investments at the first sign of increased volatility or as soon as they perceive it on the horizon. But taking yourself out of the market could mean losing out on potential opportunities, and putting your longer-term investment goals at risk.
Cumulative return is not just about achieving high returns when markets are going up; it's also about remaining invested and minimizing losses during weak or volatile markets so that you can participate on the upside. Developing a deeper understanding of the various risks your portfolio is subject to can help you balance these risks.
Diversification is critical in seeking to achieve that balance. We believe that most portfolios could be more effectively diversified either by introducing holdings with performance profiles unrelated to existing holdings (like alternative products) or by rebalancing existing holdings with an eye toward risk allocation. Over time, distributing risk more evenly may produce a more pronounced diversification benefit and may improve portfolio efficiency. We believe market volatility can create significant opportunities and, in fact, these periods may be some of the very best times to invest.
With this in mind, I thought it important to highlight excerpts from a piece written by Colin Moore, Global Chief Investment Officer, in which he touches on some of these issues emphasizing the importance of a properly constructed portfolio in seeking to effectively manage volatility and to achieve consistency of returns. I encourage you to read the article in its entirety. To access the full article and for other insights on current market, please visit blog.columbiathreadneedleus.com/latest-perspectives.
You need investments that are designed to help you ease the impact of volatile market environments and keep the savings you have worked tirelessly to amass. Columbia Threadneedle Investments provides investment solutions to help you tackle financial challenges and achieve your desired outcome.
Best regards,

Christopher O. Petersen
President, Columbia Funds
Excerpts from:
Taking the scare out of the volatility bogeyman
By Colin Moore, Global Chief Investment Officer
Colin Moore is the global chief investment officer for Columbia Threadneedle Investments. His responsibilities include ensuring that a disciplined investment process is in place across all asset classes, including equity and fixed income. Mr. Moore joined one of the Columbia Threadneedle Investments legacy firms in 2002 as head of equity and was also head of fixed income and liquidity strategies from 2009 – 2010.

n In today's low growth, higher volatility world, the emphasis is shifting from maximization of returns to consistency of returns.
PRESIDENT'S MESSAGE (continued)
n Portfolios should represent the behavioral risk-return tradeoff of investors, remembering that they won't stay invested to realize the return if we get the risk tolerance wrong.
n Holding long-term savings in cash to avoid volatility (the financial equivalent of hiding under the sheets) is detrimental to achieving long-term goals.
According to Wikipedia, "The bogeyman is a common allusion to a mythical creature in many cultures used to control behavior. This monster has no specific appearance, and conceptions about it can vary drastically from household to household within the same community; in many cases he has no set appearance in the mind of an adult or child, but is simply a non-specific embodiment of terror." Different cultures have different names and physical representations for the bogeyman, and investors are no different. We have terrible monsters that we fear may destroy our portfolios, and we call one of the scariest of them volatility.
While the bogeyman is mythical (I hope!), volatility is real and can cause serious damage. To understand why investors have such a hard time coping with volatility, we first need to define three cognitive biases at work in today's investment environment:
1) Recency bias — something that has recently come to the forefront of our attention, regardless of how long established it is, suddenly seems to appear with improbable frequency.
2) Negativity bias — we tend to have a greater recall of unpleasant memories than positive memories.
3) Loss aversion — our dissatisfaction with losing money tends to be greater than our satisfaction with making money.
The level of volatility varies dramatically, and so does investor fear and panic selling — waxing when volatility rises, waning when it falls. Recent studies have pointed to demographics as an important driver of panic selling. The theory is that as people get closer to retirement, the prospects of a large (20% – 30%) loss in financial assets can have a much more pronounced effect on their sense of well-being. Wealth preservation instincts kick in much more quickly than for younger (and typically less wealthy) savers.
The reality is that there is little opportunity for return without volatility. Therefore, the bogeyman effect of holding long-term savings in cash to avoid volatility (the financial equivalent of hiding under the sheets) is detrimental to achieving long-term goals. This effect tends to be more pronounced during the episodic spikes in volatility. The significant spike in volatility in 2008 and 2009 led to significant withdrawals from long-term investment funds over the same period. Less pronounced effects can also be seen when comparing 2001 – 2003 and 2011 – 2012. Conversely, flows picked up when volatility returned to "normal" levels. Investor behavior of this type is consistent with the three behavioral biases.
I believe average volatility will be higher over the next 10 years than the last 10 years and episodic spikes will increase in frequency because sustainable economic growth will be structurally lower and geopolitical risk higher than any time since World War II. Low growth creates uncertainty while loss aversion will make investors fear that we are one economic mishap or geopolitical event away from no growth or recession. The result will be higher volatility on average. Negativity bias will tend to exacerbate "spike" reactions to event-driven geopolitical news, and the volatility bogeyman will appear more often. Assuming the behavioral biases continue, investor returns are likely to be very disappointing regardless of the total return generated by financial markets due to the bogeyman effect.
To mitigate this effect, we need to focus on portfolio construction and an improved understanding of diversification. I accept that equities are likely to offer the highest return over the next 10 years, but they also offer the highest volatility. Many portfolio construction optimization tools use historical average volatility, which is likely to underestimate the volatility investors will face. The bogeyman emerges when individual asset class volatility spikes and cross correlations rise, the combination of which increases overall portfolio volatility far beyond expectation. Diversification is meant to protect investors against volatility, but what's the point of owning lots of investments if the volatility bogeyman has not been properly estimated?
Most importantly, portfolios should be constructed to properly represent the behavioral risk-return tradeoff of investors, remembering that they won't stay invested to realize the return if we get the risk tolerance wrong. In a low growth, higher volatility world, the emphasis is shifting to return consistency rather than return maximization,
PRESIDENT'S MESSAGE (continued)
and investors are best served through investment approaches that appreciate that distinction. Even though it's a permanent feature of financial markets, volatility is less likely to be the bogeyman we all fear if portfolios are constructed with this understanding.
Please visit blog.columbiathreadneedleus.com/latest-perspectives to read the entire article.
Investors should consider the investment objectives, risks, charges and expenses of a mutual fund carefully before investing. For a free prospectus and summary prospectus, which contains this and other important information about a fund, visit columbiathreadneedle.com/us. The prospectus should be read carefully before investing.
The views expressed are as of April 2016, may change as market or other conditions change, and may differ from views expressed by other Columbia Management Investment Advisers, LLC (CMIA) associates or affiliates. Actual investments or investment decisions made by CMIA and its affiliates, whether for its own account or on behalf of clients, will not necessarily reflect the views expressed. This information is not intended to provide investment advice and does not account for individual investor circumstances. Investment decisions should always be made based on an investor's specific financial needs, objectives, goals, time horizon and risk tolerance. Asset classes described may not be suitable for all investors.
Past performance does not guarantee future results, and no forecast should be considered a guarantee either. Since economic and market conditions change frequently, there can be no assurance that the trends described here will continue or that the forecasts are accurate.
Diversification does not guarantee a profit or protect against loss.
Columbia Funds are distributed by Columbia Management Investment Distributors, Inc., member FINRA, and managed by Columbia Management Investment Advisers, LLC.
© 2016 Columbia Management Investment Advisers, LLC. All rights reserved
COLUMBIA SELECT LARGE CAP GROWTH FUND
Fund Investment Manager
Columbia Management Investment
Advisers, LLC
225 Franklin Street
Boston, MA 02110
Fund Distributor
Columbia Management Investment
Distributors, Inc.
225 Franklin Street
Boston, MA 02110
Fund Transfer Agent
Columbia Management Investment
Services Corp.
P.O. Box 8081
Boston, MA 02266-8081
For more information about any of the funds, please visit columbiathreadneedle.com/us or call 800.345.6611. Customer Service Representatives are available to answer your questions Monday through Friday from 8 a.m. to 7 p.m. Eastern time.
The views expressed in this report reflect the current views of the respective parties. These views are not guarantees of future performance and involve certain risks, uncertainties and assumptions that are difficult to predict, so actual outcomes and results may differ significantly from the views expressed. These views are subject to change at any time based upon economic, market or other conditions and the respective parties disclaim any responsibility to update such views. These views may not be relied on as investment advice and, because investment decisions for a Columbia fund are based on numerous factors, may not be relied on as an indication of trading intent on behalf of any particular Columbia fund. References to specific securities should not be construed as a recommendation or investment advice.
Performance Overview | | | 3 | | |
Manager Discussion of Fund Performance | | | 5 | | |
Understanding Your Fund's Expenses | | | 7 | | |
Portfolio of Investments | | | 8 | | |
Statement of Assets and Liabilities | | | 12 | | |
Statement of Operations | | | 14 | | |
Statement of Changes in Net Assets | | | 15 | | |
Financial Highlights | | | 18 | | |
Notes to Financial Statements | | | 27 | | |
Report of Independent Registered Public Accounting Firm | | | 34 | | |
Federal Income Tax Information | | | 35 | | |
Trustees and Officers | | | 36 | | |
Important Information About This Report | | | 41 | | |
COLUMBIA SELECT LARGE CAP GROWTH FUND
Performance Summary
n Columbia Select Large Cap Growth Fund (the Fund) Class A shares returned -10.08% excluding sales charges for the 12-month period that ended March 31, 2016.
n The Fund underperformed its benchmark, the Russell 1000 Growth Index, which returned 2.52% for the same time period.
n Underperformance in information technology and health care more than offset the Fund's gains from consumer discretionary stocks for the period.
Average Annual Total Returns (%) (for period ended March 31, 2016)
| | | Inception | | 1 Year | | 5 Years | | 10 Years | |
Class A* | | 09/28/07 | | | | | | | | | | | | | |
Excluding sales charges | | | | | | | -10.08 | | | | 8.57 | | | | 7.53 | | |
Including sales charges | | | | | | | -15.26 | | | | 7.29 | | | | 6.90 | | |
Class C* | | 09/28/07 | | | | | | | | | | | | | |
Excluding sales charges | | | | | | | -10.79 | | | | 7.75 | | | | 6.73 | | |
Including sales charges | | | | | | | -11.57 | | | | 7.75 | | | | 6.73 | | |
Class I* | | 09/27/10 | | | -9.73 | | | | 9.05 | | | | 7.91 | | |
Class R | | 12/31/04 | | | -10.34 | | | | 8.30 | | | | 7.26 | | |
Class R4* | | 11/08/12 | | | -9.89 | | | | 8.83 | | | | 7.79 | | |
Class R5* | | 11/08/12 | | | -9.75 | | | | 8.94 | | | | 7.84 | | |
Class W* | | 09/27/10 | | | -10.07 | | | | 8.57 | | | | 7.51 | | |
Class Y* | | 11/08/12 | | | -9.69 | | | | 8.98 | | | | 7.86 | | |
Class Z | | 10/01/97 | | | -9.88 | | | | 8.83 | | | | 7.79 | | |
Russell 1000 Growth Index | | | | | | | 2.52 | | | | 12.38 | | | | 8.28 | | |
Returns for Class A are shown with and without the maximum initial sales charge of 5.75%. Returns for Class C are shown with and without the applicable contingent deferred sales charge (CDSC) of 1.00% in the first year only. The Fund's other classes are not subject to sales charges and have limited eligibility. Please see the Fund's prospectus for details. Performance for different share classes will vary based on differences in sales charges and fees associated with each class. All results shown assume reinvestment of distributions during the period. Returns do not reflect the deduction of taxes that a shareholder may pay on Fund distributions or on the redemption of Fund shares. Performance results reflect the effect of any fee waivers or reimbursements of Fund expenses by Columbia Management Investment Advisers, LLC and/or any of its affiliates. Absent these fee waivers or expense reimbursement arrangements, performance results would have been lower.
The performance information shown represents past performance and is not a guarantee of future results. The investment return and principal value of your investment will fluctuate so that your shares, when redeemed, may be worth more or less than their original cost. Current performance may be lower or higher than the performance information shown. You may obtain performance information current to the most recent month-end by contacting your financial intermediary, visiting columbiathreadneedle.com/us or calling 800.345.6611.
*The returns shown for periods prior to the share class inception date (including returns for the Life of the Fund, if shown, which are since Fund inception) include the returns of the Fund's oldest share class. These returns are adjusted to reflect any higher class-related operating expenses of the newer share classes, as applicable. Please visit columbiathreadneedle.com/us/investment-products/mutual-funds/appended-performance for more information.
The Russell 1000 Growth Index, an unmanaged index, measures the performance of those Russell 1000 Index companies with higher price-to-book ratios and higher forecasted growth values.
Indices are not available for investment, are not professionally managed and do not reflect sales charges, fees, brokerage commissions, taxes or other expenses of investing. Securities in the Fund may not match those in an index.
Annual Report 2016
3
COLUMBIA SELECT LARGE CAP GROWTH FUND
PERFORMANCE OVERVIEW (continued)
Performance of a Hypothetical $10,000 Investment (April 1, 2006 – March 31, 2016)

The chart above shows the change in value of a hypothetical $10,000 investment in Class A shares of Columbia Select Large Cap Growth Fund during the stated time period, and does not reflect the deduction of taxes that a shareholder may pay on Fund distributions or on the redemption of Fund shares.
Annual Report 2016
4
COLUMBIA SELECT LARGE CAP GROWTH FUND
MANAGER DISCUSSION OF FUND PERFORMANCE
For the 12-month period that ended March 31, 2016, the Fund's Class A shares returned -10.08%. The Fund underperformed its benchmark, the Russell 1000 Growth Index, which returned 2.52% for the same time period. Underperformance in information technology and health care more than offset the Fund's gains from consumer discretionary stocks for the period.
Mounting Global Pressures Weighed on Markets
Around the world, investors turned cautious over the 12-month period that ended March 31, 2016, as lackluster economic growth, contentious geopolitical conflicts and a shift in U.S. monetary policy weighed on confidence. Subpar global economic growth continued for a fourth straight year, with China's slowdown heading the list of disappointments. Conflicts in the Middle East and terrorism, both at home and abroad, heightened security fears. Plummeting oil prices and a rising U.S. dollar rounded the list of mounting pressures in 2015, although they reversed course early in 2016. A widening trade deficit also negatively impacted growth.
Despite these setbacks, the U.S. economy continued to expand for the seventh consecutive year. U.S. labor markets recovered and consumer spending strengthened somewhat. The housing market inched forward, although sales slipped near the end of the period as new industry regulation led to longer closing periods. Manufacturing activity softened, putting a damper on growth. In December 2015, the Federal Reserve (Fed) raised the target range of its benchmark interest rate by a quarter of a point, ending a lengthy debate about whether the economy was strong enough to withstand higher borrowing costs. Mixed economic signals early in 2016 put additional rate hikes on hold — at least for now.
Stock market gains in the first half of the period were all but wiped out in the second half, despite a strong showing in the final month of the period. The S&P 500 Index, a broad measure of U.S. stock market performance, returned 1.78%, including dividends. In an increasingly risk-adverse environment, investors flocked to the safety of U.S. Treasuries and low-growth, high-yielding defensive sectors of the stock market. As a result, the Fund's growth-oriented holdings came under severe pressure and indiscriminate selling across high-growth equities (information technology and health care in particular) detracted from returns.
Contributors and Detractors
In the consumer discretionary sector, Amazon was a notable contributor to Fund performance. The company delivered an exceptional year with higher revenues and positive earnings. After a heavy period of capital expenditures, Amazon's margins increased and led to increased profitability. Given the stock's run this year, we trimmed the Fund's position. However, we continue to like the company's long-term growth prospects. As evidenced from the 2015 holiday shopping season, e-commerce has continued to take an increasing share of consumer spending, and we currently believe that Amazon is the clear leader in the field with its Prime membership and ecosystem.
In the information technology sector, the Fund's exposure to high-growth companies with higher price-to-earnings multiples was a drag on
Portfolio Management
Thomas Galvin, CFA
Todd Herget
Richard Carter
Morningstar Style BoxTM

The Morningstar Style BoxTM is based on a fund's portfolio holdings. For equity funds, the vertical axis shows the market capitalization of the stocks owned, and the horizontal axis shows investment style (value, blend, or growth). Information shown is based on the most recent data provided by Morningstar.
© 2016 Morningstar, Inc. All rights reserved. The Morningstar information contained herein: (1) is proprietary to Morningstar and/or its content providers; (2) may not be copied or distributed; and (3) is not warranted to be accurate, complete or timely. Neither Morningstar nor its content providers are responsible for any damages or losses arising from any use of this information.
Top Ten Holdings (%)
(at March 31, 2016) | |
Monster Beverage Corp. | | | 4.5 | | |
Illumina, Inc. | | | 4.3 | | |
Bristol-Myers Squibb Co. | | | 4.3 | | |
Splunk, Inc. | | | 4.3 | | |
Mobileye NV | | | 3.9 | | |
Priceline Group, Inc. (The) | | | 3.9 | | |
Alexion Pharmaceuticals, Inc. | | | 3.8 | | |
Biogen, Inc. | | | 3.8 | | |
Visa, Inc., Class A | | | 3.7 | | |
Facebook, Inc., Class A | | | 3.7 | | |
Percentages indicated are based upon total investments (excluding Money Market Funds).
For further detail about these holdings, please refer to the section entitled "Portfolio of Investments."
Fund holdings are as of the date given, are subject to change at any time, and are not recommendations to buy or sell any security.
Annual Report 2016
5
COLUMBIA SELECT LARGE CAP GROWTH FUND
MANAGER DISCUSSION OF FUND PERFORMANCE (continued)
Portfolio Breakdown (%)
(at March 31, 2016) | |
Common Stocks | | | 99.9 | | |
Money Market Funds | | | 0.1 | | |
Total | | | 100.0 | | |
Percentages indicated are based upon total investments. The Fund's portfolio composition is subject to change.
Equity Sector Breakdown (%)
(at March 31, 2016) | |
Consumer Discretionary | | | 13.6 | | |
Consumer Staples | | | 7.3 | | |
Financials | | | 2.6 | | |
Health Care | | | 32.7 | | |
Industrials | | | 2.6 | | |
Information Technology | | | 40.0 | | |
Materials | | | 1.2 | | |
Total | | | 100.0 | | |
Percentages indicated are based upon total equity investments. The Fund's portfolio composition is subject to change.
Investment Risks
Market risk may affect a single issuer, sector of the economy, industry or the market as a whole. Growth securities, at times, may not perform as well as value securities or the stock market in general and may be out of favor with investors. Foreign investments subject the Fund to risks, including political, economic, market, social and others within a particular country, as well as to currency instabilities and less stringent financial and accounting standards generally applicable to U.S. issuers. Investments in a limited number of companies or sectors, subject the Fund to greater risk of loss. The Fund may invest significantly in issuers within a particular sector, which may be negatively affected by market, economic or other conditions, making the Fund more vulnerable to unfavorable developments in the sector. See the Fund's prospectus for information on these and other risks.
performance, as these types of stocks came under selling pressure near the end of the Fund's fiscal year. Professional social networking firm LinkedIn and wearable fitness tracking device manufacturer Fitbit were the most notable detractors. Late in the period, LinkedIn announced solid revenue and earnings estimates, yet shares dropped sharply because its guidance was lower than expected. The company has a history of conservative guidance estimates, but its recent announcement was seen as a significant deceleration of its business, resulting from economic headwinds in Europe and Asia. We maintained the Fund's position in LinkedIn because we do not believe the company's long-term prospects have been damaged. In fact, we believe that management has been prudently cautious in setting expectations, and we believe the recent sell-off is an overreaction in light of the company's longer term opportunities. Fitbit, a position we established in the summer of 2015, also struggled during the period. We believe that investors looked past the company's strong results and increased full-year guidance to focus on projections, which estimated increased spending to ramp up product sales, and its share price declined. We continue to believe that the health-conscience wearables market remains attractive. However, we exited the position, as pessimism persists regarding the company's profit margins and the potential for increased competition. Software positions also detracted from Fund results. By contrast, a position in social media firm Facebook was a notable contributor to Fund returns as the company continued to execute well and gain share of global advertising.
Within the health care sector, the portfolio was hurt by its exposure to the biotechnology industry where drug pricing has been a political hot button in the highly polarized presidential primary races. In this regard, the Fund's positions in Vertex Pharmaceuticals, Intercept Pharmaceuticals, Biogen, Alexion Pharmaceuticals and Celgene all sold off during the period and were relative detractors. However, we believe the likelihood of significant reimbursement or pricing changes in the near to intermediate term remains quite low. Nevertheless, pricing scrutiny will likely continue for the few companies that are mostly looking to acquire existing products with little to no innovation. As such, we view the current environment as favorable for high-quality companies with unique product positioning as a result of innovation and focused research and development (R&D). Valuations of such companies currently traded below long-term historical levels on a price-to-earnings and a price-to-earnings growth basis. More established companies traded at a discount to many large pharmaceutical companies on a forward basis.
We believe the first quarter of 2016 will go down as one of the most difficult periods in decades for high-quality growth stocks. While volatility is painful to endure, we continue to believe that patience is one of the most significant factors in long-term investment success. Markets can be very inefficient over the short term, but over the long term, markets have rewarded companies with superior earnings and growth. With these thoughts in mind, we remain optimistic about the Fund's long-term prospects and view this recent period of volatility as an opportunity to seek out value and to stay the course.
Annual Report 2016
6
COLUMBIA SELECT LARGE CAP GROWTH FUND
UNDERSTANDING YOUR FUND'S EXPENSES
(Unaudited)
As an investor, you incur two types of costs. There are transaction costs, which generally include sales charges on purchases and may include redemption fees. There are also ongoing costs, which generally include management fees, distribution and/or service fees, and other fund expenses. The following information is intended to help you understand your ongoing costs (in dollars) of investing in the Fund and to help you compare these costs with the ongoing costs of investing in other mutual funds.
Analyzing Your Fund's Expenses
To illustrate these ongoing costs, we have provided examples and calculated the expenses paid by investors in each share class of the Fund during the period. The actual and hypothetical information in the table is based on an initial investment of $1,000 at the beginning of the period indicated and held for the entire period. Expense information is calculated two ways and each method provides you with different information. The amount listed in the "Actual" column is calculated using the Fund's actual operating expenses and total return for the period. You may use the Actual information, together with the amount invested, to estimate the expenses that you paid over the period. Simply divide your account value by $1,000 (for example, an $8,600 account value divided by $1,000 = 8.6), then multiply the results by the expenses paid during the period under the "Actual" column. The amount listed in the "Hypothetical" column assumes a 5% annual rate of return before expenses (which is not the Fund's actual return) and then applies the Fund's actual expense ratio for the period to the hypothetical return. You should not use the hypothetical account values and expenses to estimate either your actual account balance at the end of the period or the expenses you paid during the period. See "Compare With Other Funds" below for details on how to use the hypothetical data.
Compare With Other Funds
Since all mutual funds are required to include the same hypothetical calculations about expenses in shareholder reports, you can use this information to compare the ongoing cost of investing in the Fund with other funds. To do so, compare the hypothetical example with the 5% hypothetical examples that appear in the shareholder reports of other funds. As you compare hypothetical examples of other funds, it is important to note that hypothetical examples are meant to highlight the ongoing costs of investing in a fund only and do not reflect any transaction costs, such as sales charges, or redemption or exchange fees. Therefore, the hypothetical calculations are useful in comparing ongoing costs only, and will not help you determine the relative total costs of owning different funds. If transaction costs were included in these calculations, your costs would be higher.
October 1, 2015 – March 31, 2016
| | | Account Value at the Beginning of
the Period ($) | | Account Value at the End of
the Period ($) | | Expenses Paid During the
Period ($) | | Fund's Annualized
Expense Ratio (%) | |
| | | Actual | | Hypothetical | | Actual | | Hypothetical | | Actual | | Hypothetical | | Actual | |
Class A | | | 1,000.00 | | | | 1,000.00 | | | | 967.60 | | | | 1,019.60 | | | | 5.31 | | | | 5.45 | | | | 1.08 | | |
Class C | | | 1,000.00 | | | | 1,000.00 | | | | 963.90 | | | | 1,015.85 | | | | 8.98 | | | | 9.22 | | | | 1.83 | | |
Class I | | | 1,000.00 | | | | 1,000.00 | | | | 969.70 | | | | 1,021.75 | | | | 3.20 | | | | 3.29 | | | | 0.65 | | |
Class R | | | 1,000.00 | | | | 1,000.00 | | | | 966.10 | | | | 1,018.35 | | | | 6.54 | | | | 6.71 | | | | 1.33 | | |
Class R4 | | | 1,000.00 | | | | 1,000.00 | | | | 968.90 | | | | 1,020.85 | | | | 4.09 | | | | 4.19 | | | | 0.83 | | |
Class R5 | | | 1,000.00 | | | | 1,000.00 | | | | 969.50 | | | | 1,021.50 | | | | 3.45 | | | | 3.54 | | | | 0.70 | | |
Class W | | | 1,000.00 | | | | 1,000.00 | | | | 967.60 | | | | 1,019.65 | | | | 5.26 | | | | 5.40 | | | | 1.07 | | |
Class Y | | | 1,000.00 | | | | 1,000.00 | | | | 969.80 | | | | 1,021.75 | | | | 3.20 | | | | 3.29 | | | | 0.65 | | |
Class Z | | | 1,000.00 | | | | 1,000.00 | | | | 968.80 | | | | 1,020.85 | | | | 4.09 | | | | 4.19 | | | | 0.83 | | |
Expenses paid during the period are equal to the annualized expense ratio for each class as indicated above, multiplied by the average account value over the period and then multiplied by the number of days in the Fund's most recent fiscal half year and divided by 366.
Expenses do not include fees and expenses incurred indirectly by the Fund from its investment in underlying funds, including affiliated and non-affiliated pooled investment vehicles, such as mutual funds and exchange-traded funds.
Annual Report 2016
7
COLUMBIA SELECT LARGE CAP GROWTH FUND
PORTFOLIO OF INVESTMENTS
March 31, 2016
(Percentages represent value of investments compared to net assets)
Common Stocks 100.0%
Issuer | | Shares | | Value ($) | |
CONSUMER DISCRETIONARY 13.6% | |
Automobiles 3.1% | |
Tesla Motors, Inc.(a) | | | 752,267 | | | | 172,848,389 | | |
Internet & Catalog Retail 7.1% | |
Amazon.com, Inc.(a) | | | 310,871 | | | | 184,545,460 | | |
Priceline Group, Inc. (The)(a) | | | 168,505 | | | | 217,196,205 | | |
Total | | | | | 401,741,665 | | |
Textiles, Apparel & Luxury Goods 3.4% | |
Nike, Inc., Class B | | | 3,083,790 | | | | 189,560,571 | | |
Total Consumer Discretionary | | | | | 764,150,625 | | |
CONSUMER STAPLES 7.3% | |
Beverages 4.5% | |
Monster Beverage Corp.(a) | | | 1,883,250 | | | | 251,187,885 | | |
Food & Staples Retailing 2.8% | |
CVS Health Corp. | | | 1,535,230 | | | | 159,249,408 | | |
Total Consumer Staples | | | | | 410,437,293 | | |
FINANCIALS 2.6% | |
Diversified Financial Services 2.6% | |
Intercontinental Exchange, Inc. | | | 616,611 | | | | 144,989,910 | | |
Total Financials | | | | | 144,989,910 | | |
HEALTH CARE 32.7% | |
Biotechnology 17.2% | |
Alexion Pharmaceuticals, Inc.(a) | | | 1,547,734 | | | | 215,475,528 | | |
Biogen, Inc.(a) | | | 826,072 | | | | 215,043,063 | | |
Celgene Corp.(a) | | | 1,923,482 | | | | 192,521,313 | | |
Intercept Pharmaceuticals, Inc.(a)(b) | | | 1,270,483 | | | | 163,218,951 | | |
Vertex Pharmaceuticals, Inc.(a) | | | 2,227,325 | | | | 177,050,064 | | |
Total | | | | | 963,308,919 | | |
Health Care Equipment & Supplies 3.6% | |
DexCom, Inc.(a) | | | 1,763,520 | | | | 119,760,643 | | |
Edwards Lifesciences Corp.(a) | | | 884,230 | | | | 77,997,929 | | |
Total | | | | | 197,758,572 | | |
Life Sciences Tools & Services 4.3% | |
Illumina, Inc.(a) | | | 1,495,252 | | | | 242,395,302 | | |
Common Stocks (continued)
Issuer | | Shares | | Value ($) | |
Pharmaceuticals 7.6% | |
Bristol-Myers Squibb Co. | | | 3,770,643 | | | | 240,868,675 | | |
Novo Nordisk A/S, ADR | | | 3,395,250 | | | | 183,988,597 | | |
Total | | | | | 424,857,272 | | |
Total Health Care | | | | | 1,828,320,065 | | |
INDUSTRIALS 2.6% | |
Electrical Equipment 2.6% | |
Acuity Brands, Inc. | | | 669,350 | | | | 146,012,009 | | |
Total Industrials | | | | | 146,012,009 | | |
INFORMATION TECHNOLOGY 40.0% | |
Communications Equipment 2.8% | |
Palo Alto Networks, Inc.(a) | | | 954,820 | | | | 155,769,335 | | |
Internet Software & Services 13.3% | |
Alibaba Group Holding Ltd., ADR(a) | | | 2,536,800 | | | | 200,483,304 | | |
Facebook, Inc., Class A(a) | | | 1,830,573 | | | | 208,868,379 | | |
LinkedIn Corp., Class A(a) | | | 1,366,303 | | | | 156,236,748 | | |
MercadoLibre, Inc. | | | 1,509,648 | | | | 177,912,017 | | |
Total | | | | | 743,500,448 | | |
IT Services 7.2% | |
Cognizant Technology Solutions
Corp., Class A(a) | | | 3,060,816 | | | | 191,913,163 | | |
Visa, Inc., Class A | | | 2,742,416 | | | | 209,739,976 | | |
Total | | | | | 401,653,139 | | |
Software 16.7% | |
Adobe Systems, Inc.(a) | | | 1,945,280 | | | | 182,467,264 | | |
Mobileye NV(a) | | | 5,893,989 | | | | 219,786,850 | | |
Salesforce.com, Inc.(a) | | | 1,815,010 | | | | 134,002,188 | | |
ServiceNow, Inc.(a) | | | 2,644,681 | | | | 161,801,583 | | |
Splunk, Inc.(a) | | | 4,869,773 | | | | 238,277,993 | | |
Total | | | | | 936,335,878 | | |
Total Information Technology | | | | | 2,237,258,800 | | |
MATERIALS 1.2% | |
Chemicals 1.2% | |
Sherwin-Williams Co. (The) | | | 240,310 | | | | 68,409,048 | | |
Total Materials | | | | | 68,409,048 | | |
Total Common Stocks
(Cost: $4,469,560,833) | | | | | 5,599,577,750 | | |
The accompanying Notes to Financial Statements are an integral part of this statement.
Annual Report 2016
8
COLUMBIA SELECT LARGE CAP GROWTH FUND
PORTFOLIO OF INVESTMENTS (continued)
March 31, 2016
Money Market Funds 0.1%
| | | Shares | | Value ($) | |
Columbia Short-Term Cash Fund,
0.420%(b)(c) | | | 6,896,172 | | | | 6,896,172 | | |
Total Money Market Funds
(Cost: $6,896,172) | | | | | 6,896,172 | | |
Total Investments
(Cost: $4,476,457,005) | | | | | 5,606,473,922 | | |
Other Assets & Liabilities, Net | | | | | (6,175,777 | ) | |
Net Assets | | | | | 5,600,298,145 | | |
Notes to Portfolio of Investments
(a) Non-income producing investment.
(b) As defined in the Investment Company Act of 1940, an affiliated company is one in which the Fund owns 5% or more of the company's outstanding voting securities, or a company which is under common ownership or control with the Fund. Holdings and transactions in these affiliated companies during the year ended March 31, 2016 are as follows:
Issuer | | Beginning
Cost ($) | | Purchase
Cost ($) | | Proceeds
From
Sales ($) | | Realized
Gain
(Loss) ($) | | Ending
Cost ($) | | Dividends —
Affiliated
Issuers ($) | | Value ($) | |
Columbia Short-Term
Cash Fund | | | 116,529,953 | | | | 2,164,586,271 | | | | (2,274,220,052 | ) | | | — | | | | 6,896,172 | | | | 133,029 | | | | 6,896,172 | | |
Fitbit, Inc., Class A* | | | — | | | | 242,185,550 | | | | (80,713,987 | ) | | | (161,471,563 | ) | | | — | | | | — | | | | — | | |
Intercept
Pharmaceuticals,
Inc.* | | | 135,795,990 | | | | 143,219,562 | | | | — | | | | — | | | | 279,015,552 | | | | — | | | | 163,218,951 | | |
Total | | | 252,325,943 | | | | 2,549,991,383 | | | | (2,354,934,039 | ) | | | (161,471,563 | ) | | | 285,911,724 | | | | 133,029 | | | | 170,115,123 | | |
*Issuer was not an affiliate for the entire period ended March 31, 2016.
(c) The rate shown is the seven-day current annualized yield at March 31, 2016.
Abbreviation Legend
ADR American Depositary Receipt
Fair Value Measurements
The Fund categorizes its fair value measurements according to a three-level hierarchy that maximizes the use of observable inputs and minimizes the use of unobservable inputs by prioritizing that the most observable input be used when available. Observable inputs are those that market participants would use in pricing an investment based on market data obtained from sources independent of the reporting entity. Unobservable inputs are those that reflect the Fund's assumptions about the information market participants would use in pricing an investment. An investment's level within the fair value hierarchy is based on the lowest level of any input that is deemed significant to the asset's or liability's fair value measurement. The input levels are not necessarily an indication of the risk or liquidity associated with investments at that level. For example, certain U.S. government securities are generally high quality and liquid, however, they are reflected as Level 2 because the inputs used to determine fair value may not always be quoted prices in an active market.
Fair value inputs are summarized in the three broad levels listed below:
> Level 1 — Valuations based on quoted prices for investments in active markets that the Fund has the ability to access at the measurement date (including NAV for open-end mutual funds). Valuation adjustments are not applied to Level 1 investments.
> Level 2 — Valuations based on other significant observable inputs (including quoted prices for similar securities, interest rates, prepayment speeds, credit risks, etc.).
> Level 3 — Valuations based on significant unobservable inputs (including the Fund's own assumptions and judgment in determining the fair value of investments).
The accompanying Notes to Financial Statements are an integral part of this statement.
Annual Report 2016
9
COLUMBIA SELECT LARGE CAP GROWTH FUND
PORTFOLIO OF INVESTMENTS (continued)
March 31, 2016
Fair Value Measurements (continued)
Inputs that are used in determining fair value of an investment may include price information, credit data, volatility statistics, and other factors. These inputs can be either observable or unobservable. The availability of observable inputs can vary between investments, and is affected by various factors such as the type of investment, and the volume and level of activity for that investment or similar investments in the marketplace. The inputs will be considered by the Investment Manager, along with any other relevant factors in the calculation of an investment's fair value. The Fund uses prices and inputs that are current as of the measurement date, which may include periods of market dislocations. During these periods, the availability of prices and inputs may be reduced for many investments. This condition could cause an investment to be reclassified between the various levels within the hierarchy.
Certain investments that have been measured at fair value using the net asset value per share (or its equivalent) are not categorized in the fair value hierarchy. The fair value amounts presented in the table are intended to reconcile the fair value hierarchy to the amounts presented in the Portfolio of Investments. The Columbia Short-Term Cash Fund seeks to provide shareholders with maximum current income consistent with liquidity and stability of principal. Investments in Columbia Short-Term Cash Fund may be redeemed on a daily basis without restriction.
Investments falling into the Level 3 category are primarily supported by quoted prices from brokers and dealers participating in the market for those investments. However, these may be classified as Level 3 investments due to lack of market transparency and corroboration to support these quoted prices. Additionally, valuation models may be used as the pricing source for any remaining investments classified as Level 3. These models may rely on one or more significant unobservable inputs and/or significant assumptions by the Investment Manager. Inputs used in valuations may include, but are not limited to, financial statement analysis, capital account balances, discount rates and estimated cash flows, and comparable company data.
Under the direction of the Fund's Board of Trustees (the Board), the Investment Manager's Valuation Committee (the Committee) is responsible for overseeing the valuation procedures approved by the Board. The Committee consists of voting and non-voting members from various groups within the Investment Manager's organization, including operations and accounting, trading and investments, compliance, risk management and legal.
The Committee meets at least monthly to review and approve valuation matters, which may include a description of specific valuation determinations, data regarding pricing information received from approved pricing vendors and brokers and the results of Board-approved valuation control policies and procedures (the Policies). The Policies address, among other things, instances when market quotations are or are not readily available, including recommendations of third party pricing vendors and a determination of appropriate pricing methodologies; events that require specific valuation determinations and assessment of fair value techniques; securities with a potential for stale pricing, including those that are illiquid, restricted, or in default; and the effectiveness of third party pricing vendors, including periodic reviews of vendors. The Committee meets more frequently, as needed, to discuss additional valuation matters, which may include the need to review back-testing results, review time-sensitive information or approve related valuation actions. The Committee reports to the Board, with members of the Committee meeting with the Board at each of its regularly scheduled meetings to discuss valuation matters and actions during the period, similar to those described earlier.
For investments categorized as Level 3, the Committee monitors information similar to that described above, which may include: (i) data specific to the issuer or comparable issuers, (ii) general market or specific sector news and (iii) quoted prices and specific or similar security transactions. The Committee considers this data and any changes from prior periods in order to assess the reasonableness of observable and unobservable inputs, any assumptions or internal models used to value those securities and changes in fair value. This data is also used to corroborate, when available, information received from approved pricing vendors and brokers. Various factors impact the frequency of monitoring this information (which may occur as often as daily). However, the Committee may determine that changes to inputs, assumptions and models are not required as a result of the monitoring procedures performed.
The following table is a summary of the inputs used to value the Fund's investments at March 31, 2016:
| | | Level 1
Quoted Prices in Active
Markets for Identical
Assets ($) | | Level 2
Other Significant
Observable Inputs ($) | | Level 3
Significant
Unobservable Inputs ($) | | Total ($) | |
Investments | |
Common Stocks | |
Consumer Discretionary | | | 764,150,625 | | | | — | | | | — | | | | 764,150,625 | | |
Consumer Staples | | | 410,437,293 | | | | — | | | | — | | | | 410,437,293 | | |
Financials | | | 144,989,910 | | | | — | | | | — | | | | 144,989,910 | | |
Health Care | | | 1,828,320,065 | | | | — | | | | — | | | | 1,828,320,065 | | |
Industrials | | | 146,012,009 | | | | — | | | | — | | | | 146,012,009 | | |
Information Technology | | | 2,237,258,800 | | | | — | | | | — | | | | 2,237,258,800 | | |
Materials | | | 68,409,048 | | | | — | | | | — | | | | 68,409,048 | | |
Total Common Stocks | | | 5,599,577,750 | | | | — | | | | — | | | | 5,599,577,750 | | |
The accompanying Notes to Financial Statements are an integral part of this statement.
Annual Report 2016
10
COLUMBIA SELECT LARGE CAP GROWTH FUND
PORTFOLIO OF INVESTMENTS (continued)
March 31, 2016
Fair Value Measurements (continued)
| | | Level 1
Quoted Prices in Active
Markets for Identical
Assets ($) | | Level 2
Other Significant
Observable Inputs ($) | | Level 3
Significant
Unobservable Inputs ($) | | Total ($) | |
Investments measured at NAV per share
practical expedient | |
Money Market Funds | | | — | | | | — | | | | — | | | | 6,896,172 | | |
Total Investments | | | 5,599,577,750 | | | | — | | | | — | | | | 5,606,473,922 | | |
See the Portfolio of Investments for all investment classifications not indicated in the table.
There were no transfers of financial assets between levels during the period.
The accompanying Notes to Financial Statements are an integral part of this statement.
Annual Report 2016
11
COLUMBIA SELECT LARGE CAP GROWTH FUND
STATEMENT OF ASSETS AND LIABILITIES
March 31, 2016
Assets | |
Investments, at value | |
Unaffiliated issuers (identified cost $4,190,545,281) | | $ | 5,436,358,799 | | |
Affiliated issuers (identified cost $285,911,724) | | | 170,115,123 | | |
Total investments (identified cost $4,476,457,005) | | | 5,606,473,922 | | |
Receivable for: | |
Capital shares sold | | | 8,599,974 | | |
Dividends | | | 2,158,125 | | |
Foreign tax reclaims | | | 392,792 | | |
Prepaid expenses | | | 21,118 | | |
Trustees' deferred compensation plan | | | 147,997 | | |
Total assets | | | 5,617,793,928 | | |
Liabilities | |
Payable for: | |
Capital shares purchased | | | 16,118,273 | | |
Investment management fees | | | 97,191 | | |
Distribution and/or service fees | | | 13,768 | | |
Transfer agent fees | | | 886,813 | | |
Compensation of board members | | | 1,493 | | |
Chief compliance officer expenses | | | 855 | | |
Other expenses | | | 229,393 | | |
Trustees' deferred compensation plan | | | 147,997 | | |
Total liabilities | | | 17,495,783 | | |
Net assets applicable to outstanding capital stock | | $ | 5,600,298,145 | | |
Represented by | |
Paid-in capital | | $ | 4,425,428,658 | | |
Excess of distributions over net investment income | | | (5,735,188 | ) | |
Accumulated net realized gain | | | 50,587,758 | | |
Unrealized appreciation (depreciation) on: | |
Investments — unaffiliated issuers | | | 1,245,813,518 | | |
Investments — affiliated issuers | | | (115,796,601 | ) | |
Total — representing net assets applicable to outstanding capital stock | | $ | 5,600,298,145 | | |
The accompanying Notes to Financial Statements are an integral part of this statement.
Annual Report 2016
12
COLUMBIA SELECT LARGE CAP GROWTH FUND
STATEMENT OF ASSETS AND LIABILITIES (continued)
March 31, 2016
Class A | |
Net assets | | $ | 1,097,095,929 | | |
Shares outstanding | | | 75,246,830 | | |
Net asset value per share | | $ | 14.58 | | |
Maximum offering price per share(a) | | $ | 15.47 | | |
Class C | |
Net assets | | $ | 218,181,208 | | |
Shares outstanding | | | 16,125,892 | | |
Net asset value per share | | $ | 13.53 | | |
Class I | |
Net assets | | $ | 193,039,182 | | |
Shares outstanding | | | 12,832,943 | | |
Net asset value per share | | $ | 15.04 | | |
Class R | |
Net assets | | $ | 17,358,271 | | |
Shares outstanding | | | 1,248,637 | | |
Net asset value per share | | $ | 13.90 | | |
Class R4 | |
Net assets | | $ | 31,198,626 | | |
Shares outstanding | | | 2,048,519 | | |
Net asset value per share | | $ | 15.23 | | |
Class R5 | |
Net assets | | $ | 617,119,529 | | |
Shares outstanding | | | 40,412,770 | | |
Net asset value per share | | $ | 15.27 | | |
Class W | |
Net assets | | $ | 11,608,304 | | |
Shares outstanding | | | 796,192 | | |
Net asset value per share | | $ | 14.58 | | |
Class Y | |
Net assets | | $ | 29,697,965 | | |
Shares outstanding | | | 1,929,560 | | |
Net asset value per share | | $ | 15.39 | | |
Class Z | |
Net assets | | $ | 3,384,999,131 | | |
Shares outstanding | | | 227,313,621 | | |
Net asset value per share | | $ | 14.89 | | |
(a) The maximum offering price per share is calculated by dividing the net asset value per share by 1.0 minus the maximum sales charge of 5.75%.
The accompanying Notes to Financial Statements are an integral part of this statement.
Annual Report 2016
13
COLUMBIA SELECT LARGE CAP GROWTH FUND
STATEMENT OF OPERATIONS
Year Ended March 31, 2016
Net investment income | |
Income: | |
Dividends — unaffiliated issuers | | $ | 25,108,056 | | |
Dividends — affiliated issuers | | | 133,029 | | |
Foreign taxes withheld | | | (485,552 | ) | |
Total income | | | 24,755,533 | | |
Expenses: | |
Investment management fees | | | 42,670,271 | | |
Distribution and/or service fees | |
Class A | | | 3,752,327 | | |
Class C | | | 2,367,868 | | |
Class R | | | 105,960 | | |
Class W | | | 83,291 | | |
Transfer agent fees | |
Class A | | | 2,697,654 | | |
Class C | | | 425,172 | | |
Class R | | | 38,094 | | |
Class R4 | | | 48,312 | | |
Class R5 | | | 368,720 | | |
Class W | | | 60,335 | | |
Class Z | | | 7,161,502 | | |
Compensation of board members | | | 138,505 | | |
Custodian fees | | | 43,608 | | |
Printing and postage fees | | | 375,200 | | |
Registration fees | | | 236,637 | | |
Audit fees | | | 24,142 | | |
Legal fees | | | 248,764 | | |
Chief compliance officer expenses | | | 3,437 | | |
Other | | | 310,944 | | |
Total expenses | | | 61,160,743 | | |
Expense reductions | | | (1,676 | ) | |
Total net expenses | | | 61,159,067 | | |
Net investment loss | | | (36,403,534 | ) | |
Realized and unrealized gain (loss) — net | |
Net realized gain (loss) on: | |
Investments — unaffiliated issuers | | | 755,818,432 | | |
Investments — affiliated issuers | | | (161,471,563 | ) | |
Net realized gain | | | 594,346,869 | | |
Net change in unrealized appreciation (depreciation) on: | |
Investments — unaffiliated issuers | | | (1,135,017,273 | ) | |
Investments — affiliated issuers | | | (115,796,601 | ) | |
Net change in unrealized depreciation | | | (1,250,813,874 | ) | |
Net realized and unrealized loss | | | (656,467,005 | ) | |
Net decrease in net assets from operations | | $ | (692,870,539 | ) | |
The accompanying Notes to Financial Statements are an integral part of this statement.
Annual Report 2016
14
COLUMBIA SELECT LARGE CAP GROWTH FUND
STATEMENT OF CHANGES IN NET ASSETS
| | | Year Ended
March 31, 2016 | | Year Ended
March 31, 2015 | |
Operations | |
Net investment loss | | $ | (36,403,534 | ) | | $ | (37,901,471 | ) | |
Net realized gain | | | 594,346,869 | | | | 910,741,372 | | |
Net change in unrealized appreciation (depreciation) | | | (1,250,813,874 | ) | | | 71,185,810 | | |
Net increase (decrease) in net assets resulting from operations | | | (692,870,539 | ) | | | 944,025,711 | | |
Distributions to shareholders | |
Net realized gains | |
Class A | | | (207,310,300 | ) | | | (224,391,627 | ) | |
Class C | | | (31,998,695 | ) | | | (32,012,991 | ) | |
Class I | | | (29,812,081 | ) | | | (39,187,496 | ) | |
Class R | | | (2,969,678 | ) | | | (3,239,656 | ) | |
Class R4 | | | (3,781,096 | ) | | | (2,896,682 | ) | |
Class R5 | | | (97,847,755 | ) | | | (96,834,572 | ) | |
Class W | | | (4,338,892 | ) | | | (5,912,722 | ) | |
Class Y | | | (3,587,282 | ) | | | (3,379,406 | ) | |
Class Z | | | (538,819,677 | ) | | | (638,359,057 | ) | |
Total distributions to shareholders | | | (920,465,456 | ) | | | (1,046,214,209 | ) | |
Increase in net assets from capital stock activity | | | 123,382,781 | | | | 317,539,175 | | |
Total increase (decrease) in net assets | | | (1,489,953,214 | ) | | | 215,350,677 | | |
Net assets at beginning of year | | | 7,090,251,359 | | | | 6,874,900,682 | | |
Net assets at end of year | | $ | 5,600,298,145 | | | $ | 7,090,251,359 | | |
Excess of distributions over net investment income | | $ | (5,735,188 | ) | | $ | (123,699 | ) | |
The accompanying Notes to Financial Statements are an integral part of this statement.
Annual Report 2016
15
COLUMBIA SELECT LARGE CAP GROWTH FUND
STATEMENT OF CHANGES IN NET ASSETS (continued)
| | | Year Ended
March 31, 2016 | | Year Ended
March 31, 2015 | |
| | | Shares | | Dollars ($) | | Shares | | Dollars ($) | |
Capital stock activity | |
Class A shares | |
Subscriptions | | | 33,604,331 | | | | 577,993,852 | | | | 22,233,025 | | | | 404,335,050 | | |
Distributions reinvested | | | 11,736,669 | | | | 201,359,771 | | | | 12,574,955 | | | | 217,891,055 | | |
Redemptions | | | (49,393,090 | ) | | | (761,401,304 | ) | | | (36,146,375 | ) | | | (660,782,717 | ) | |
Net increase (decrease) | | | (4,052,090 | ) | | | 17,952,319 | | | | (1,338,395 | ) | | | (38,556,612 | ) | |
Class C shares | |
Subscriptions | | | 4,881,330 | | | | 78,573,992 | | | | 3,559,713 | | | | 60,612,288 | | |
Distributions reinvested | | | 1,528,222 | | | | 24,394,938 | | | | 1,470,220 | | | | 24,016,184 | | |
Redemptions | | | (3,366,249 | ) | | | (51,155,467 | ) | | | (2,309,540 | ) | | | (39,377,445 | ) | |
Net increase | | | 3,043,303 | | | | 51,813,463 | | | | 2,720,393 | | | | 45,251,027 | | |
Class I shares | |
Subscriptions | | | 4,906,524 | | | | 79,297,148 | | | | 2,704,124 | | | | 49,089,110 | | |
Distributions reinvested | | | 1,668,804 | | | | 29,811,765 | | | | 2,207,888 | | | | 39,187,115 | | |
Redemptions | | | (7,221,752 | ) | | | (127,863,035 | ) | | | (4,695,703 | ) | | | (89,921,042 | ) | |
Net increase (decrease) | | | (646,424 | ) | | | (18,754,122 | ) | | | 216,309 | | | | (1,644,817 | ) | |
Class R shares | |
Subscriptions | | | 458,371 | | | | 7,537,110 | | | | 422,716 | | | | 7,424,236 | | |
Distributions reinvested | | | 180,880 | | | | 2,968,428 | | | | 180,877 | | | | 3,015,512 | | |
Redemptions | | | (692,489 | ) | | | (11,058,563 | ) | | | (412,997 | ) | | | (7,225,463 | ) | |
Net increase (decrease) | | | (53,238 | ) | | | (553,025 | ) | | | 190,596 | | | | 3,214,285 | | |
Class R4 shares | |
Subscriptions | | | 1,569,831 | | | | 28,059,070 | | | | 1,104,065 | | | | 20,795,862 | | |
Distributions reinvested | | | 212,421 | | | | 3,776,290 | | | | 161,127 | | | | 2,890,202 | | |
Redemptions | | | (669,819 | ) | | | (11,261,720 | ) | | | (962,371 | ) | | | (17,720,757 | ) | |
Net increase | | | 1,112,433 | | | | 20,573,640 | | | | 302,821 | | | | 5,965,307 | | |
Class R5 shares | |
Subscriptions | | | 9,178,322 | | | | 158,238,591 | | | | 11,535,395 | | | | 220,091,651 | | |
Distributions reinvested | | | 5,430,905 | | | | 97,824,450 | | | | 5,381,599 | | | | 96,812,816 | | |
Redemptions | | | (13,380,260 | ) | | | (219,626,899 | ) | | | (10,165,758 | ) | | | (190,346,294 | ) | |
Net increase | | | 1,228,967 | | | | 36,436,142 | | | | 6,751,236 | | | | 126,558,173 | | |
Class W shares | |
Subscriptions | | | 247,756 | | | | 4,320,111 | | | | 366,457 | | | | 6,657,756 | | |
Distributions reinvested | | | 249,217 | | | | 4,338,576 | | | | 341,119 | | | | 5,912,339 | | |
Redemptions | | | (1,985,293 | ) | | | (31,305,255 | ) | | | (450,080 | ) | | | (8,197,836 | ) | |
Net increase (decrease) | | | (1,488,320 | ) | | | (22,646,568 | ) | | | 257,496 | | | | 4,372,259 | | |
Class Y shares | |
Subscriptions | | | 651,285 | | | | 11,506,365 | | | | 677,984 | | | | 12,798,124 | | |
Distributions reinvested | | | 197,867 | | | | 3,586,970 | | | | 186,569 | | | | 3,379,029 | | |
Redemptions | | | (341,733 | ) | | | (6,137,416 | ) | | | (521,989 | ) | | | (9,941,290 | ) | |
Net increase | | | 507,419 | | | | 8,955,919 | | | | 342,564 | | | | 6,235,863 | | |
The accompanying Notes to Financial Statements are an integral part of this statement.
Annual Report 2016
16
COLUMBIA SELECT LARGE CAP GROWTH FUND
STATEMENT OF CHANGES IN NET ASSETS (continued)
| | | Year Ended
March 31, 2016 | | Year Ended
March 31, 2015 | |
| | | Shares | | Dollars ($) | | Shares | | Dollars ($) | |
Capital stock activity (continued) | |
Class Z shares | |
Subscriptions | | | 45,039,675 | | | | 771,398,754 | | | | 52,594,708 | | | | 971,027,816 | | |
Distributions reinvested | | | 15,870,309 | | | | 278,815,373 | | | | 15,976,278 | | | | 281,585,327 | | |
Redemptions | | | (60,525,913 | ) | | | (1,020,609,114 | ) | | | (59,043,711 | ) | | | (1,086,469,453 | ) | |
Net increase | | | 384,071 | | | | 29,605,013 | | | | 9,527,275 | | | | 166,143,690 | | |
Total net increase | | | 36,121 | | | | 123,382,781 | | | | 18,970,295 | | | | 317,539,175 | | |
The accompanying Notes to Financial Statements are an integral part of this statement.
Annual Report 2016
17
COLUMBIA SELECT LARGE CAP GROWTH FUND
The following tables are intended to help you understand the Fund's financial performance. Certain information reflects financial results for a single share of a class held for the periods shown. Per share net investment income (loss) amounts are calculated based on average shares outstanding during the period. Total return assumes reinvestment of all dividends and distributions, if any. Total return does not reflect payment of sales charges, if any. Total return and portfolio turnover are not annualized for periods of less than one year. The portfolio turnover rate is calculated without regard to purchase and sales transactions of short-term instruments and certain derivatives, if any. If such transactions were included, the Fund's portfolio turnover rate may be higher.
| | | Year Ended March 31, | |
Class A | | 2016 | | 2015 | | 2014 | | 2013 | | 2012 | |
Per share data | |
Net asset value, beginning of period | | $ | 18.49 | | | $ | 18.92 | | | $ | 15.23 | | | $ | 14.28 | | | $ | 13.63 | | |
Income from investment operations: | |
Net investment loss | | | (0.12 | ) | | | (0.13 | ) | | | (0.14 | ) | | | (0.05 | ) | | | (0.09 | ) | |
Net realized and unrealized gain (loss) | | | (1.45 | ) | | | 2.54 | | | | 4.55 | | | | 1.00 | | | | 0.95 | | |
Total from investment operations | | | (1.57 | ) | | | 2.41 | | | | 4.41 | | | | 0.95 | | | | 0.86 | | |
Less distributions to shareholders: | |
Net realized gains | | | (2.34 | ) | | | (2.84 | ) | | | (0.72 | ) | | | — | | | | (0.21 | ) | |
Total distributions to shareholders | | | (2.34 | ) | | | (2.84 | ) | | | (0.72 | ) | | | — | | | | (0.21 | ) | |
Proceeds from regulatory settlements | | | — | | | | — | | | | — | | | | — | | | | 0.00 | (a) | |
Net asset value, end of period | | $ | 14.58 | | | $ | 18.49 | | | $ | 18.92 | | | $ | 15.23 | | | $ | 14.28 | | |
Total return | | | (10.08 | %) | | | 14.42 | % | | | 29.19 | % | | | 6.65 | % | | | 6.39 | % | |
Ratios to average net assets(b) | |
Total gross expenses | | | 1.08 | % | | | 1.09 | %(c) | | | 1.10 | %(c) | | | 1.11 | %(c) | | | 1.11 | % | |
Total net expenses(d) | | | 1.08 | %(e) | | | 1.09 | %(c)(e) | | | 1.10 | %(c)(e) | | | 1.11 | %(c)(e) | | | 1.11 | %(e) | |
Net investment loss | | | (0.72 | %) | | | (0.73 | %) | | | (0.81 | %) | | | (0.40 | %) | | | (0.66 | %) | |
Supplemental data | |
Net assets, end of period (in thousands) | | $ | 1,097,096 | | | $ | 1,466,541 | | | $ | 1,525,489 | | | $ | 1,173,231 | | | $ | 2,023,475 | | |
Portfolio turnover | | | 56 | % | | | 47 | % | | | 53 | % | | | 36 | % | | | 53 | % | |
Notes to Financial Highlights
(a) Rounds to zero.
(b) In addition to the fees and expenses that the Fund bears directly, the Fund indirectly bears a pro rata share of the fees and expenses of any other funds in which it invests. Such indirect expenses are not included in the Fund's reported expense ratios.
(c) Ratios include line of credit interest expense which is less than 0.01%.
(d) Total net expenses include the impact of certain fee waivers/expense reimbursements made by the Investment Manager and certain of its affiliates, if applicable.
(e) The benefits derived from expense reductions had an impact of less than 0.01%.
The accompanying Notes to Financial Statements are an integral part of this statement.
Annual Report 2016
18
COLUMBIA SELECT LARGE CAP GROWTH FUND
FINANCIAL HIGHLIGHTS (continued)
| | | Year Ended March 31, | |
Class C | | 2016 | | 2015 | | 2014 | | 2013 | | 2012 | |
Per share data | |
Net asset value, beginning of period | | $ | 17.32 | | | $ | 17.98 | | | $ | 14.61 | | | $ | 13.80 | | | $ | 13.28 | | |
Income from investment operations: | |
Net investment loss | | | (0.23 | ) | | | (0.26 | ) | | | (0.27 | ) | | | (0.15 | ) | | | (0.17 | ) | |
Net realized and unrealized gain (loss) | | | (1.35 | ) | | | 2.41 | | | | 4.36 | | | | 0.96 | | | | 0.90 | | |
Total from investment operations | | | (1.58 | ) | | | 2.15 | | | | 4.09 | | | | 0.81 | | | | 0.73 | | |
Less distributions to shareholders: | |
Net realized gains | | | (2.21 | ) | | | (2.81 | ) | | | (0.72 | ) | | | — | | | | (0.21 | ) | |
Total distributions to shareholders | | | (2.21 | ) | | | (2.81 | ) | | | (0.72 | ) | | | — | | | | (0.21 | ) | |
Proceeds from regulatory settlements | | | — | | | | — | | | | — | | | | — | | | | 0.00 | (a) | |
Net asset value, end of period | | $ | 13.53 | | | $ | 17.32 | | | $ | 17.98 | | | $ | 14.61 | | | $ | 13.80 | | |
Total return | | | (10.79 | %) | | | 13.62 | % | | | 28.23 | % | | | 5.87 | % | | | 5.57 | % | |
Ratios to average net assets(b) | |
Total gross expenses | | | 1.83 | % | | | 1.84 | %(c) | | | 1.85 | %(c) | | | 1.87 | %(c) | | | 1.86 | % | |
Total net expenses(d) | | | 1.83 | %(e) | | | 1.84 | %(c)(e) | | | 1.85 | %(c)(e) | | | 1.87 | %(c)(e) | | | 1.86 | %(e) | |
Net investment loss | | | (1.46 | %) | | | (1.49 | %) | | | (1.56 | %) | | | (1.12 | %) | | | (1.35 | %) | |
Supplemental data | |
Net assets, end of period (in thousands) | | $ | 218,181 | | | $ | 226,538 | | | $ | 186,302 | | | $ | 96,328 | | | $ | 81,441 | | |
Portfolio turnover | | | 56 | % | | | 47 | % | | | 53 | % | | | 36 | % | | | 53 | % | |
Notes to Financial Highlights
(a) Rounds to zero.
(b) In addition to the fees and expenses that the Fund bears directly, the Fund indirectly bears a pro rata share of the fees and expenses of any other funds in which it invests. Such indirect expenses are not included in the Fund's reported expense ratios.
(c) Ratios include line of credit interest expense which is less than 0.01%.
(d) Total net expenses include the impact of certain fee waivers/expense reimbursements made by the Investment Manager and certain of its affiliates, if applicable.
(e) The benefits derived from expense reductions had an impact of less than 0.01%.
The accompanying Notes to Financial Statements are an integral part of this statement.
Annual Report 2016
19
COLUMBIA SELECT LARGE CAP GROWTH FUND
FINANCIAL HIGHLIGHTS (continued)
| | | Year Ended March 31, | |
Class I | | 2016 | | 2015 | | 2014 | | 2013 | | 2012 | |
Per share data | |
Net asset value, beginning of period | | $ | 19.01 | | | $ | 19.37 | | | $ | 15.51 | | | $ | 14.47 | | | $ | 13.75 | | |
Income from investment operations: | |
Net investment income (loss) | | | (0.05 | ) | | | (0.05 | ) | | | (0.06 | ) | | | 0.01 | | | | (0.02 | ) | |
Net realized and unrealized gain (loss) | | | (1.50 | ) | | | 2.61 | | | | 4.64 | | | | 1.03 | | | | 0.95 | | |
Total from investment operations | | | (1.55 | ) | | | 2.56 | | | | 4.58 | | | | 1.04 | | | | 0.93 | | |
Less distributions to shareholders: | |
Net realized gains | | | (2.42 | ) | | | (2.92 | ) | | | (0.72 | ) | | | — | | | | (0.21 | ) | |
Total distributions to shareholders | | | (2.42 | ) | | | (2.92 | ) | | | (0.72 | ) | | | — | | | | (0.21 | ) | |
Proceeds from regulatory settlements | | | — | | | | — | | | | — | | | | — | | | | 0.00 | (a) | |
Net asset value, end of period | | $ | 15.04 | | | $ | 19.01 | | | $ | 19.37 | | | $ | 15.51 | | | $ | 14.47 | | |
Total return | | | (9.73 | %) | | | 14.96 | % | | | 29.77 | % | | | 7.19 | % | | | 6.85 | % | |
Ratios to average net assets(b) | |
Total gross expenses | | | 0.65 | % | | | 0.65 | %(c) | | | 0.65 | %(c) | | | 0.67 | %(c) | | | 0.67 | % | |
Total net expenses(d) | | | 0.65 | % | | | 0.65 | %(c) | | | 0.65 | %(c) | | | 0.67 | %(c) | | | 0.67 | %(e) | |
Net investment income (loss) | | | (0.28 | %) | | | (0.29 | %) | | | (0.35 | %) | | | 0.07 | % | | | (0.19 | %) | |
Supplemental data | |
Net assets, end of period (in thousands) | | $ | 193,039 | | | $ | 256,222 | | | $ | 256,893 | | | $ | 268,592 | | | $ | 283,920 | | |
Portfolio turnover | | | 56 | % | | | 47 | % | | | 53 | % | | | 36 | % | | | 53 | % | |
Notes to Financial Highlights
(a) Rounds to zero.
(b) In addition to the fees and expenses that the Fund bears directly, the Fund indirectly bears a pro rata share of the fees and expenses of any other funds in which it invests. Such indirect expenses are not included in the Fund's reported expense ratios.
(c) Ratios include line of credit interest expense which is less than 0.01%.
(d) Total net expenses include the impact of certain fee waivers/expense reimbursements made by the Investment Manager and certain of its affiliates, if applicable.
(e) The benefits derived from expense reductions had an impact of less than 0.01%.
The accompanying Notes to Financial Statements are an integral part of this statement.
Annual Report 2016
20
COLUMBIA SELECT LARGE CAP GROWTH FUND
FINANCIAL HIGHLIGHTS (continued)
| | | Year Ended March 31, | |
Class R | | 2016 | | 2015 | | 2014 | | 2013 | | 2012 | |
Per share data | |
Net asset value, beginning of period | | $ | 17.74 | | | $ | 18.27 | | | $ | 14.77 | | | $ | 13.87 | | | $ | 13.28 | | |
Income from investment operations: | |
Net investment loss | | | (0.16 | ) | | | (0.17 | ) | | | (0.18 | ) | | | (0.08 | ) | | | (0.10 | ) | |
Net realized and unrealized gain (loss) | | | (1.38 | ) | | | 2.45 | | | | 4.40 | | | | 0.98 | | | | 0.90 | | |
Total from investment operations | | | (1.54 | ) | | | 2.28 | | | | 4.22 | | | | 0.90 | | | | 0.80 | | |
Less distributions to shareholders: | |
Net realized gains | | | (2.30 | ) | | | (2.81 | ) | | | (0.72 | ) | | | — | | | | (0.21 | ) | |
Total distributions to shareholders | | | (2.30 | ) | | | (2.81 | ) | | | (0.72 | ) | | | — | | | | (0.21 | ) | |
Proceeds from regulatory settlements | | | — | | | | — | | | | — | | | | — | | | | 0.00 | (a) | |
Net asset value, end of period | | $ | 13.90 | | | $ | 17.74 | | | $ | 18.27 | | | $ | 14.77 | | | $ | 13.87 | | |
Total return | | | (10.34 | %) | | | 14.16 | % | | | 28.81 | % | | | 6.49 | % | | | 6.11 | % | |
Ratios to average net assets(b) | |
Total gross expenses | | | 1.33 | % | | | 1.34 | %(c) | | | 1.35 | %(c) | | | 1.37 | %(c) | | | 1.35 | % | |
Total net expenses(d) | | | 1.33 | %(e) | | | 1.34 | %(c)(e) | | | 1.35 | %(c)(e) | | | 1.37 | %(c)(e) | | | 1.35 | %(e) | |
Net investment loss | | | (0.97 | %) | | | (0.99 | %) | | | (1.06 | %) | | | (0.63 | %) | | | (0.84 | %) | |
Supplemental data | |
Net assets, end of period (in thousands) | | $ | 17,358 | | | $ | 23,092 | | | $ | 20,300 | | | $ | 13,498 | | | $ | 14,619 | | |
Portfolio turnover | | | 56 | % | | | 47 | % | | | 53 | % | | | 36 | % | | | 53 | % | |
Notes to Financial Highlights
(a) Rounds to zero.
(b) In addition to the fees and expenses that the Fund bears directly, the Fund indirectly bears a pro rata share of the fees and expenses of any other funds in which it invests. Such indirect expenses are not included in the Fund's reported expense ratios.
(c) Ratios include line of credit interest expense which is less than 0.01%.
(d) Total net expenses include the impact of certain fee waivers/expense reimbursements made by the Investment Manager and certain of its affiliates, if applicable.
(e) The benefits derived from expense reductions had an impact of less than 0.01%.
The accompanying Notes to Financial Statements are an integral part of this statement.
Annual Report 2016
21
COLUMBIA SELECT LARGE CAP GROWTH FUND
FINANCIAL HIGHLIGHTS (continued)
| | | Year Ended March 31, | |
Class R4 | | 2016 | | 2015 | | 2014 | | 2013(a) | |
Per share data | |
Net asset value, beginning of period | | $ | 19.22 | | | $ | 19.55 | | | $ | 15.69 | | | $ | 13.14 | | |
Income from investment operations: | |
Net investment income (loss) | | | (0.08 | ) | | | (0.10 | ) | | | (0.11 | ) | | | 0.03 | | |
Net realized and unrealized gain (loss) | | | (1.52 | ) | | | 2.66 | | | | 4.69 | | | | 2.52 | | |
Total from investment operations | | | (1.60 | ) | | | 2.56 | | | | 4.58 | | | | 2.55 | | |
Less distributions to shareholders: | |
Net realized gains | | | (2.39 | ) | | | (2.89 | ) | | | (0.72 | ) | | | — | | |
Total distributions to shareholders | | | (2.39 | ) | | | (2.89 | ) | | | (0.72 | ) | | | — | | |
Net asset value, end of period | | $ | 15.23 | | | $ | 19.22 | | | $ | 19.55 | | | $ | 15.69 | | |
Total return | | | (9.89 | %) | | | 14.76 | % | | | 29.42 | % | | | 19.41 | % | |
Ratios to average net assets(b) | |
Total gross expenses | | | 0.83 | % | | | 0.84 | %(c) | | | 0.85 | %(c) | | | 0.82 | %(d) | |
Total net expenses(e) | | | 0.83 | %(f) | | | 0.84 | %(c)(f) | | | 0.85 | %(c)(f) | | | 0.82 | %(d) | |
Net investment income (loss) | | | (0.45 | %) | | | (0.52 | %) | | | (0.59 | %) | | | 0.60 | %(d) | |
Supplemental data | |
Net assets, end of period (in thousands) | | $ | 31,199 | | | $ | 17,988 | | | $ | 12,381 | | | $ | 6 | | |
Portfolio turnover | | | 56 | % | | | 47 | % | | | 53 | % | | | 36 | % | |
Notes to Financial Highlights
(a) Based on operations from November 8, 2012 (commencement of operations) through the stated period end.
(b) In addition to the fees and expenses that the Fund bears directly, the Fund indirectly bears a pro rata share of the fees and expenses of any other funds in which it invests. Such indirect expenses are not included in the Fund's reported expense ratios.
(c) Ratios include line of credit interest expense which is less than 0.01%.
(d) Annualized.
(e) Total net expenses include the impact of certain fee waivers/expense reimbursements made by the Investment Manager and certain of its affiliates, if applicable.
(f) The benefits derived from expense reductions had an impact of less than 0.01%.
The accompanying Notes to Financial Statements are an integral part of this statement.
Annual Report 2016
22
COLUMBIA SELECT LARGE CAP GROWTH FUND
FINANCIAL HIGHLIGHTS (continued)
| | | Year Ended March 31, | |
Class R5 | | 2016 | | 2015 | | 2014 | | 2013(a) | |
Per share data | |
Net asset value, beginning of period | | $ | 19.26 | | | $ | 19.59 | | | $ | 15.69 | | | $ | 13.14 | | |
Income from investment operations: | |
Net investment income (loss) | | | (0.06 | ) | | | (0.06 | ) | | | (0.07 | ) | | | 0.01 | | |
Net realized and unrealized gain (loss) | | | (1.51 | ) | | | 2.64 | | | | 4.69 | | | | 2.54 | | |
Total from investment operations | | | (1.57 | ) | | | 2.58 | | | | 4.62 | | | | 2.55 | | |
Less distributions to shareholders: | |
Net realized gains | | | (2.42 | ) | | | (2.91 | ) | | | (0.72 | ) | | | — | | |
Total distributions to shareholders | | | (2.42 | ) | | | (2.91 | ) | | | (0.72 | ) | | | — | | |
Net asset value, end of period | | $ | 15.27 | | | $ | 19.26 | | | $ | 19.59 | | | $ | 15.69 | | |
Total return | | | (9.75 | %) | | | 14.89 | % | | | 29.68 | % | | | 19.41 | % | |
Ratios to average net assets(b) | |
Total gross expenses | | | 0.70 | % | | | 0.70 | %(c) | | | 0.70 | %(c) | | | 0.69 | %(d) | |
Total net expenses(e) | | | 0.70 | % | | | 0.70 | %(c) | | | 0.70 | %(c) | | | 0.69 | %(d) | |
Net investment income (loss) | | | (0.33 | %) | | | (0.34 | %) | | | (0.41 | %) | | | 0.13 | %(d) | |
Supplemental data | |
Net assets, end of period (in thousands) | | $ | 617,120 | | | $ | 754,744 | | | $ | 635,330 | | | $ | 66,054 | | |
Portfolio turnover | | | 56 | % | | | 47 | % | | | 53 | % | | | 36 | % | |
Notes to Financial Highlights
(a) Based on operations from November 8, 2012 (commencement of operations) through the stated period end.
(b) In addition to the fees and expenses that the Fund bears directly, the Fund indirectly bears a pro rata share of the fees and expenses of any other funds in which it invests. Such indirect expenses are not included in the Fund's reported expense ratios.
(c) Ratios include line of credit interest expense which is less than 0.01%.
(d) Annualized.
(e) Total net expenses include the impact of certain fee waivers/expense reimbursements made by the Investment Manager and certain of its affiliates, if applicable.
The accompanying Notes to Financial Statements are an integral part of this statement.
Annual Report 2016
23
COLUMBIA SELECT LARGE CAP GROWTH FUND
FINANCIAL HIGHLIGHTS (continued)
| | | Year Ended March 31, | |
Class W | | 2016 | | 2015 | | 2014 | | 2013 | | 2012 | |
Per share data | |
Net asset value, beginning of period | | $ | 18.49 | | | $ | 18.92 | | | $ | 15.23 | | | $ | 14.28 | | | $ | 13.63 | | |
Income from investment operations: | |
Net investment loss | | | (0.13 | ) | | | (0.13 | ) | | | (0.14 | ) | | | (0.06 | ) | | | (0.09 | ) | |
Net realized and unrealized gain (loss) | | | (1.44 | ) | | | 2.54 | | | | 4.55 | | | | 1.01 | | | | 0.95 | | |
Total from investment operations | | | (1.57 | ) | | | 2.41 | | | | 4.41 | | | | 0.95 | | | | 0.86 | | |
Less distributions to shareholders: | |
Net realized gains | | | (2.34 | ) | | | (2.84 | ) | | | (0.72 | ) | | | — | | | | (0.21 | ) | |
Total distributions to shareholders | | | (2.34 | ) | | | (2.84 | ) | | | (0.72 | ) | | | — | | | | (0.21 | ) | |
Proceeds from regulatory settlements | | | — | | | | — | | | | — | | | | — | | | | 0.00 | (a) | |
Net asset value, end of period | | $ | 14.58 | | | $ | 18.49 | | | $ | 18.92 | | | $ | 15.23 | | | $ | 14.28 | | |
Total return | | | (10.07 | %) | | | 14.41 | % | | | 29.19 | % | | | 6.65 | % | | | 6.39 | % | |
Ratios to average net assets(b) | |
Total gross expenses | | | 1.08 | % | | | 1.09 | %(c) | | | 1.11 | %(c) | | | 1.12 | %(c) | | | 1.12 | % | |
Total net expenses(d) | | | 1.08 | %(e) | | | 1.09 | %(c)(e) | | | 1.11 | %(c)(e) | | | 1.12 | %(c)(e) | | | 1.12 | %(e) | |
Net investment loss | | | (0.74 | %) | | | (0.74 | %) | | | (0.81 | %) | | | (0.46 | %) | | | (0.67 | %) | |
Supplemental data | |
Net assets, end of period (in thousands) | | $ | 11,608 | | | $ | 42,248 | | | $ | 38,342 | | | $ | 18,755 | | | $ | 52,432 | | |
Portfolio turnover | | | 56 | % | | | 47 | % | | | 53 | % | | | 36 | % | | | 53 | % | |
Notes to Financial Highlights
(a) Rounds to zero.
(b) In addition to the fees and expenses that the Fund bears directly, the Fund indirectly bears a pro rata share of the fees and expenses of any other funds in which it invests. Such indirect expenses are not included in the Fund's reported expense ratios.
(c) Ratios include line of credit interest expense which is less than 0.01%.
(d) Total net expenses include the impact of certain fee waivers/expense reimbursements made by the Investment Manager and certain of its affiliates, if applicable.
(e) The benefits derived from expense reductions had an impact of less than 0.01%.
The accompanying Notes to Financial Statements are an integral part of this statement.
Annual Report 2016
24
COLUMBIA SELECT LARGE CAP GROWTH FUND
FINANCIAL HIGHLIGHTS (continued)
| | | Year Ended March 31, | |
Class Y | | 2016 | | 2015 | | 2014 | | 2013(a) | |
Per share data | |
Net asset value, beginning of period | | $ | 19.39 | | | $ | 19.71 | | | $ | 15.77 | | | $ | 13.20 | | |
Income from investment operations: | |
Net investment income (loss) | | | (0.05 | ) | | | (0.06 | ) | | | (0.07 | ) | | | 0.05 | | |
Net realized and unrealized gain (loss) | | | (1.53 | ) | | | 2.66 | | | | 4.73 | | | | 2.52 | | |
Total from investment operations | | | (1.58 | ) | | | 2.60 | | | | 4.66 | | | | 2.57 | | |
Less distributions to shareholders: | |
Net realized gains | | | (2.42 | ) | | | (2.92 | ) | | | (0.72 | ) | | | — | | |
Total distributions to shareholders | | | (2.42 | ) | | | (2.92 | ) | | | (0.72 | ) | | | — | | |
Net asset value, end of period | | $ | 15.39 | | | $ | 19.39 | | | $ | 19.71 | | | $ | 15.77 | | |
Total return | | | (9.69 | %) | | | 14.91 | % | | | 29.78 | % | | | 19.47 | % | |
Ratios to average net assets(b) | |
Total gross expenses | | | 0.65 | % | | | 0.65 | %(c) | | | 0.65 | %(c) | | | 0.65 | %(d) | |
Total net expenses(e) | | | 0.65 | % | | | 0.65 | %(c) | | | 0.65 | %(c) | | | 0.65 | %(d) | |
Net investment income (loss) | | | (0.27 | %) | | | (0.30 | %) | | | (0.36 | %) | | | 0.81 | %(d) | |
Supplemental data | |
Net assets, end of period (in thousands) | | $ | 29,698 | | | $ | 27,581 | | | $ | 21,274 | | | $ | 3 | | |
Portfolio turnover | | | 56 | % | | | 47 | % | | | 53 | % | | | 36 | % | |
Notes to Financial Highlights
(a) Based on operations from November 8, 2012 (commencement of operations) through the stated period end.
(b) In addition to the fees and expenses that the Fund bears directly, the Fund indirectly bears a pro rata share of the fees and expenses of any other funds in which it invests. Such indirect expenses are not included in the Fund's reported expense ratios.
(c) Ratios include line of credit interest expense which is less than 0.01%.
(d) Annualized.
(e) Total net expenses include the impact of certain fee waivers/expense reimbursements made by the Investment Manager and certain of its affiliates, if applicable.
The accompanying Notes to Financial Statements are an integral part of this statement.
Annual Report 2016
25
COLUMBIA SELECT LARGE CAP GROWTH FUND
FINANCIAL HIGHLIGHTS (continued)
| | | Year Ended March 31, | |
Class Z | | 2016 | | 2015 | | 2014 | | 2013 | | 2012 | |
Per share data | |
Net asset value, beginning of period | | $ | 18.84 | | | $ | 19.22 | | | $ | 15.43 | | | $ | 14.43 | | | $ | 13.74 | | |
Income from investment operations: | |
Net investment loss | | | (0.08 | ) | | | (0.09 | ) | | | (0.10 | ) | | | (0.02 | ) | | | (0.06 | ) | |
Net realized and unrealized gain (loss) | | | (1.48 | ) | | | 2.60 | | | | 4.61 | | | | 1.02 | | | | 0.96 | | |
Total from investment operations | | | (1.56 | ) | | | 2.51 | | | | 4.51 | | | | 1.00 | | | | 0.90 | | |
Less distributions to shareholders: | |
Net realized gains | | | (2.39 | ) | | | (2.89 | ) | | | (0.72 | ) | | | — | | | | (0.21 | ) | |
Total distributions to shareholders | | | (2.39 | ) | | | (2.89 | ) | | | (0.72 | ) | | | — | | | | (0.21 | ) | |
Proceeds from regulatory settlements | | | — | | | | — | | | | — | | | | — | | | | 0.00 | (a) | |
Net asset value, end of period | | $ | 14.89 | | | $ | 18.84 | | | $ | 19.22 | | | $ | 15.43 | | | $ | 14.43 | | |
Total return | | | (9.88 | %) | | | 14.74 | % | | | 29.46 | % | | | 6.93 | % | | | 6.64 | % | |
Ratios to average net assets(b) | |
Total gross expenses | | | 0.83 | % | | | 0.84 | %(c) | | | 0.85 | %(c) | | | 0.87 | %(c) | | | 0.86 | % | |
Total net expenses(d) | | | 0.83 | %(e) | | | 0.84 | %(c)(e) | | | 0.85 | %(c)(e) | | | 0.87 | %(c)(e) | | | 0.86 | %(e) | |
Net investment loss | | | (0.46 | %) | | | (0.49 | %) | | | (0.56 | %) | | | (0.16 | %) | | | (0.43 | %) | |
Supplemental data | |
Net assets, end of period (in thousands) | | $ | 3,384,999 | | | $ | 4,275,296 | | | $ | 4,178,590 | | | $ | 3,534,748 | | | $ | 4,373,501 | | |
Portfolio turnover | | | 56 | % | | | 47 | % | | | 53 | % | | | 36 | % | | | 53 | % | |
Notes to Financial Highlights
(a) Rounds to zero.
(b) In addition to the fees and expenses that the Fund bears directly, the Fund indirectly bears a pro rata share of the fees and expenses of any other funds in which it invests. Such indirect expenses are not included in the Fund's reported expense ratios.
(c) Ratios include line of credit interest expense which is less than 0.01%.
(d) Total net expenses include the impact of certain fee waivers/expense reimbursements made by the Investment Manager and certain of its affiliates, if applicable.
(e) The benefits derived from expense reductions had an impact of less than 0.01%.
The accompanying Notes to Financial Statements are an integral part of this statement.
Annual Report 2016
26
COLUMBIA SELECT LARGE CAP GROWTH FUND
NOTES TO FINANCIAL STATEMENTS
March 31, 2016
Note 1. Organization
Columbia Select Large Cap Growth Fund (the Fund), a series of Columbia Funds Series Trust I (the Trust), is a diversified fund. The Trust is registered under the Investment Company Act of 1940, as amended (the 1940 Act), as an open-end management investment company organized as a Massachusetts business trust.
Fund Shares
The Trust may issue an unlimited number of shares (without par value). The Fund offers Class A, Class C, Class I, Class R, Class R4, Class R5, Class W, Class Y and Class Z shares. Although all share classes generally have identical voting, dividend and liquidation rights, each share class votes separately when required by the Trust's organizational documents or by law. Different share classes pay different distribution amounts to the extent the expenses of such share classes differ, and distributions in liquidation will be proportional to the net asset value of each share class. Each share class has its own expense and sales charge structure.
Class A shares are subject to a maximum front-end sales charge of 5.75% based on the initial investment amount. Class A shares purchased without an initial sales charge in accounts aggregating $1 million to $50 million at the time of purchase are subject to a contingent deferred sales charge (CDSC) if the shares are sold within 18 months after purchase, charged as follows: 1.00% CDSC if redeemed within 12 months after purchase, and 0.50% CDSC if redeemed more than 12, but less than 18, months after purchase.
Class C shares are subject to a 1.00% CDSC on shares redeemed within 12 months after purchase.
Class I shares are not subject to sales charges and are available only to the Columbia Family of Funds.
Class R shares are not subject to sales charges and are generally available only to certain retirement plans and other investors as described in the Fund's prospectus.
Class R4 shares are not subject to sales charges and are generally available only to omnibus retirement plans and certain investors as described in the Fund's prospectus.
Class R5 shares are not subject to sales charges and are generally available only to investors purchasing through authorized investment professionals and omnibus retirement plans.
Class W shares are not subject to sales charges and are available only to investors purchasing through authorized
investment programs managed by investment professionals, including discretionary managed account programs.
Class Y shares are not subject to sales charges and are generally available only to certain retirement plans as described in the Fund's prospectus.
Class Z shares are not subject to sales charges and are available only to eligible investors, which are subject to different investment minimums as described in the Fund's prospectus.
Note 2. Summary of Significant Accounting Policies
Basis of Preparation
The Fund is an investment company that applies the accounting and reporting guidance in the Financial Accounting Standards Board (FASB) Accounting Standards Codification Topic 946, Financial Services — Investment Companies (ASC 946). The financial statements are prepared in accordance with U.S. generally accepted accounting principles (GAAP), which requires management to make certain estimates and assumptions that affect the reported amounts of assets and liabilities, the disclosure of contingent assets and liabilities at the date of the financial statements and the reported amounts of income and expenses during the reporting period. Actual results could differ from those estimates.
The following is a summary of significant accounting policies followed by the Fund in the preparation of its financial statements.
Security Valuation
All equity securities are valued at the close of business of the New York Stock Exchange (NYSE). Equity securities are valued at the last quoted sales price on the principal exchange or market on which they trade, except for securities traded on the NASDAQ Stock Market, which are valued at the NASDAQ official close price. Unlisted securities or listed securities for which there were no sales during the day are valued at the mean of the latest quoted bid and ask prices on such exchanges or markets.
Foreign equity securities are valued based on the closing price on the foreign exchange in which such securities are primarily traded. If any foreign equity security closing prices are not readily available, the securities are valued at the mean of the latest quoted bid and ask prices on such exchanges or markets. Foreign currency exchange
Annual Report 2016
27
COLUMBIA SELECT LARGE CAP GROWTH FUND
NOTES TO FINANCIAL STATEMENTS (continued)
March 31, 2016
rates are generally determined at 4:00 p.m. Eastern (U.S.) time. Many securities markets and exchanges outside the U.S. close prior to the close of the NYSE; therefore, the closing prices for securities in such markets or on such exchanges may not fully reflect events that occur after such close but before the close of the NYSE. In those situations, foreign securities will be fair valued pursuant to a policy adopted by the Board of Trustees (the Board), including, if available, utilizing a third party pricing service to determine these fair values. The third party pricing service takes into account multiple factors, including, but not limited to, movements in the U.S. securities markets, certain depositary receipts, futures contracts and foreign exchange rates that have occurred subsequent to the close of the foreign exchange or market, to determine a good faith estimate that reasonably reflects the current market conditions as of the close of the NYSE. The fair value of a security is likely to be different from the quoted or published price, if available.
Investments in open-end investment companies, including money market funds, are valued at their latest net asset value.
Investments for which market quotations are not readily available, or that have quotations which management believes are not reflective of market value or reliable, are valued at fair value as determined in good faith under procedures approved by and under the general supervision of the Board. If a security or class of securities (such as foreign securities) is valued at fair value, such value is likely to be different from the quoted or published price for the security.
The determination of fair value often requires significant judgment. To determine fair value, management may use assumptions including but not limited to future cash flows and estimated risk premiums. Multiple inputs from various sources may be used to determine fair value.
GAAP requires disclosure regarding the inputs and valuation techniques used to measure fair value and any changes in valuation inputs or techniques. In addition, investments shall be disclosed by major category. This information is disclosed following the Fund's Portfolio of Investments.
Security Transactions
Security transactions are accounted for on the trade date. Cost is determined and gains (losses) are based upon the specific identification method for both financial statement and federal income tax purposes.
Income Recognition
Corporate actions and dividend income are generally recorded net of any non-reclaimable tax withholdings, on the ex-dividend date or upon receipt of ex-dividend notification in the case of certain foreign securities.
Awards from class action litigation are recorded as a reduction of cost basis if the Fund still owns the applicable securities on the payment date. If the Fund no longer owns the applicable securities, the proceeds are recorded as realized gains.
Expenses
General expenses of the Trust are allocated to the Fund and other funds of the Trust based upon relative net assets or other expense allocation methodologies determined by the nature of the expense. Expenses directly attributable to the Fund are charged to the Fund. Expenses directly attributable to a specific class of shares are charged to that share class.
Determination of Class Net Asset Value
All income, expenses (other than class-specific expenses, which are charged to that share class, as shown in the Statement of Operations) and realized and unrealized gains (losses) are allocated to each class of the Fund on a daily basis, based on the relative net assets of each class, for purposes of determining the net asset value of each class.
Federal Income Tax Status
The Fund intends to qualify each year as a regulated investment company under Subchapter M of the Internal Revenue Code, as amended, and will distribute substantially all of its taxable income (including net short-term capital gains), if any, for its tax year, and as such will not be subject to federal income taxes. In addition, the Fund intends to distribute in each calendar year substantially all of its net investment income, capital gains and certain other amounts, if any, such that the Fund should not be subject to federal excise tax. Therefore, no federal income or excise tax provision is recorded.
Distributions to Shareholders
Distributions from net investment income, if any, are declared and paid each calendar quarter. Net realized capital gains, if any, are distributed at least annually. Income distributions and capital gain distributions are determined in accordance with federal income tax regulations, which may differ from GAAP.
Annual Report 2016
28
COLUMBIA SELECT LARGE CAP GROWTH FUND
NOTES TO FINANCIAL STATEMENTS (continued)
March 31, 2016
Guarantees and Indemnifications
Under the Trust's organizational documents and, in some cases, by contract, its officers and trustees are indemnified against certain liabilities arising out of the performance of their duties to the Trust or its funds. In addition, certain of the Fund's contracts with its service providers contain general indemnification clauses. The Fund's maximum exposure under these arrangements is unknown since the amount of any future claims that may be made against the Fund cannot be determined, and the Fund has no historical basis for predicting the likelihood of any such claims.
Note 3. Fees and Other Transactions with Affiliates
Management Fees
Effective August 1, 2015, the Fund entered into a Management Agreement with Columbia Management Investment Advisers, LLC (the Investment Manager), a wholly-owned subsidiary of Ameriprise Financial, Inc. (Ameriprise Financial). Under the Management Agreement, the Investment Manager provides the Fund with investment research and advice, as well as administrative and accounting services. The management services fee is an annual fee that is equal to a percentage of the Fund's average daily net assets that declines from 0.77% to 0.57% as the Fund's net assets increase. The effective management services fee rate for the year ended March 31, 2016 was 0.63% of the Fund's average daily net assets.
Prior to August 1, 2015, the Fund paid the Investment Manager an annual fee for advisory services under an Investment Management Services Agreement and a separate annual fee for administrative and accounting services under an Administrative Services Agreement. For the period from April 1, 2015 through July 31, 2015, the investment advisory services fee paid to the Investment Manager was $14,071,760, and the administrative services fee paid to the Investment Manager was $1,095,275.
Compensation of Board Members
Board members, who are not officers or employees of the Investment Manager or Ameriprise Financial, are compensated for their services to the Fund as disclosed in the Statement of Operations. These Board members may participate in a Deferred Compensation Plan (the Plan) which may be terminated at any time. Obligations of the Plan will be paid solely out of the Fund's assets,
and all amounts payable under the Plan constitute a general unsecured obligation of the Fund.
Compensation of Chief Compliance Officer
The Board has appointed a Chief Compliance Officer to the Fund in accordance with federal securities regulations. The Fund is allocated a portion of the expenses associated with the Chief Compliance Officer based on relative net assets of the Trust.
Transfer Agency Fees
Under a Transfer and Dividend Disbursing Agent Agreement, Columbia Management Investment Services Corp. (the Transfer Agent), an affiliate of the Investment Manager and a wholly-owned subsidiary of Ameriprise Financial, is responsible for providing transfer agency services to the Fund. The Transfer Agent has contracted with Boston Financial Data Services (BFDS) to serve as sub-transfer agent.
The Transfer Agent receives a monthly transfer agency fee based on the number or the average value of accounts, depending on the type of account. In addition, the Transfer Agent also receives sub-transfer agency fees based on a percentage of the average aggregate value of the Fund's shares maintained in omnibus accounts (other than omnibus accounts for which American Enterprise Investment Services Inc. is the broker of record or accounts where the beneficial shareholder is a customer of Ameriprise Financial Services, Inc., for which the Transfer Agent receives a per account fee). The Transfer Agent pays the fees of BFDS for services as sub-transfer agent and is not entitled to reimbursement for such fees from the Fund (with the exception of out-of-pocket fees).
The Transfer Agent also receives compensation from the Fund for various shareholder services and reimbursements for certain out-of-pocket fees. Total transfer agency fees for Class R5 shares are subject to an annual limitation of not more than 0.05% of the average daily net assets attributable to Class R5 shares. Class I and Class Y shares do not pay transfer agency fees.
Annual Report 2016
29
COLUMBIA SELECT LARGE CAP GROWTH FUND
NOTES TO FINANCIAL STATEMENTS (continued)
March 31, 2016
For the year ended March 31, 2016, the Fund's effective transfer agency fee rates as a percentage of average daily net assets of each class were as follows:
Class A | | | 0.18 | % | |
Class C | | | 0.18 | | |
Class R | | | 0.18 | | |
Class R4 | | | 0.18 | | |
Class R5 | | | 0.05 | | |
Class W | | | 0.18 | | |
Class Z | | | 0.18 | | |
An annual minimum account balance fee of $20 may apply to certain accounts with a value below the applicable share class's initial minimum investment requirements to reduce the impact of small accounts on transfer agency fees. These minimum account balance fees are remitted to the Fund and recorded as part of expense reductions in the Statement of Operations. For the year ended March 31, 2016, these minimum account balance fees reduced total expenses of the Fund by $1,676.
Distribution and Service Fees
The Fund has an agreement with Columbia Management Investment Distributors, Inc. (the Distributor), an affiliate of the Investment Manager and a wholly-owned subsidiary of Ameriprise Financial, for distribution and shareholder services. The Board has approved, and the Fund has adopted, distribution and shareholder service plans (the Plans) applicable to certain share classes, which set the distribution and service fees for the Fund. These fees are calculated daily and are intended to compensate the Distributor and/or eligible selling and/or servicing agents for selling shares of the Fund and providing services to investors.
Under the Plans, the Fund pays a monthly service fee to the Distributor at the maximum annual rate of 0.25% of the average daily net assets attributable to Class A, Class C and Class W shares of the Fund. Also under the Plans, the Fund pays a monthly distribution fee to the Distributor at the maximum annual rates of 0.75%, 0.50% and 0.25% of the average daily net assets attributable to Class C, Class R and Class W shares of the Fund, respectively.
Although the Fund may pay a distribution fee up to 0.25% of the Fund's average daily net assets attributable to Class W shares and a service fee of up to 0.25% of the Fund's average daily net assets attributable to Class W shares, the aggregate fee shall not exceed 0.25% of the
Fund's average daily net assets attributable to Class W shares.
Sales Charges
Sales charges, including front-end charges and CDSCs, received by the Distributor for distributing Fund shares were $991,068 for Class A and $31,502 for Class C shares for the year ended March 31, 2016.
Expenses Waived/Reimbursed by the Investment Manager and its Affiliates
The Fund's expense ratio is subject to an expense reimbursement arrangement pursuant to which fees will be waived and/or expenses reimbursed (excluding certain fees and expenses described below), so that the Fund's net operating expenses, after giving effect to fees waived/expenses reimbursed and any balance credits and/or overdraft charges from the Fund's custodian, do not exceed the annual rates of:
| | | Contractual
Expense Cap
August 1, 2015
Through
July 31, 2016 | | Voluntary
Expense Cap
Prior to
August 1, 2015 | |
Class A | | | 1.23 | % | | | 1.22 | % | |
Class C | | | 1.98 | | | | 1.97 | | |
Class I | | | 0.85 | | | | 0.83 | | |
Class R | | | 1.48 | | | | 1.47 | | |
Class R4 | | | 0.98 | | | | 0.97 | | |
Class R5 | | | 0.90 | | | | 0.88 | | |
Class W | | | 1.23 | | | | 1.22 | | |
Class Y | | | 0.85 | | | | 0.83 | | |
Class Z | | | 0.98 | | | | 0.97 | | |
The contractual agreement may be modified or amended only with approval from the Investment Manager, certain of its affiliates and the Fund. Under the arrangements, the following fees and expenses are excluded from the waiver/reimbursement commitment, and therefore will be paid by the Fund, if applicable: taxes (including foreign transaction taxes), expenses associated with investments in affiliated and non-affiliated pooled investment vehicles (including mutual funds and exchange-traded funds), transaction costs and brokerage commissions, costs related to any securities lending program, dividend and interest expenses associated with securities sold short, inverse floater program fees and expenses, transaction charges and interest on borrowed money, interest and extraordinary expenses. Any fees waived and/or expenses reimbursed under the expense reimbursement arrangements described above are not
Annual Report 2016
30
COLUMBIA SELECT LARGE CAP GROWTH FUND
NOTES TO FINANCIAL STATEMENTS (continued)
March 31, 2016
recoverable by the Investment Manager or its affiliates in future periods.
Note 4. Federal Tax Information
The timing and character of income and capital gain distributions are determined in accordance with income tax regulations, which may differ from GAAP because of temporary or permanent book to tax differences.
At March 31, 2016, these differences are primarily due to differing treatment for deferral/reversal of wash sale losses, Trustees' deferred compensation, net operating loss reclassification and late-year ordinary losses. To the extent these differences are permanent, reclassifications are made among the components of the Fund's net assets in the Statement of Assets and Liabilities. Temporary differences do not require reclassifications. In the Statement of Assets and Liabilities the following reclassifications were made:
Excess of distributions over net investment income | | $ | 30,792,045 | | |
Paid-in capital | | | (30,792,045 | ) | |
Net investment income (loss) and net realized gains (losses), as disclosed in the Statement of Operations, and net assets were not affected by this reclassification.
The tax character of distributions paid during the years indicated was as follows:
Year Ended March 31, | | 2016 | | 2015 | |
Ordinary income | | $ | 113,136,465 | | | $ | 23,915,068 | | |
Long-term capital gains | | | 807,328,991 | | | | 1,022,299,141 | | |
Total | | $ | 920,465,456 | | | $ | 1,046,214,209 | | |
Short-term capital gain distributions, if any, are considered ordinary income distributions for tax purposes.
At March 31, 2016, the components of distributable earnings on a tax basis were as follows:
Undistributed long-term capital gains | | $ | 54,192,286 | | |
Net unrealized appreciation | | | 1,126,412,389 | | |
At March 31, 2016, the cost of investments for federal income tax purposes was $4,480,061,533 and the aggregate gross unrealized appreciation and depreciation based on that cost was:
Unrealized appreciation | | $ | 1,408,736,083 | | |
Unrealized depreciation | | | (282,323,694 | ) | |
Net unrealized appreciation | | $ | 1,126,412,389 | | |
Under current tax rules, regulated investment companies can elect to treat certain late-year ordinary losses
incurred and post-October capital losses (capital losses realized after October 31) as arising on the first day of the following taxable year. As of March 31, 2016, the Fund will elect to treat late-year ordinary losses of $5,584,136 as arising on April 1, 2016.
Management of the Fund has concluded that there are no significant uncertain tax positions in the Fund that would require recognition in the financial statements. However, management's conclusion may be subject to review and adjustment at a later date based on factors including, but not limited to, new tax laws, regulations, and administrative interpretations (including relevant court decisions). Generally, the Fund's federal tax returns for the prior three fiscal years remain subject to examination by the Internal Revenue Service.
Note 5. Portfolio Information
The cost of purchases and proceeds from sales of securities, excluding short-term investments and derivatives, if any, aggregated to $3,719,331,322 and $4,511,139,555, respectively, for the year ended March 31, 2016. The amount of purchase and sale activity impacts the portfolio turnover rate reported in the Financial Highlights.
Note 6. Affiliated Money Market Fund
The Fund invests in Columbia Short-Term Cash Fund, an affiliated money market fund established for the exclusive use by the Fund and other affiliated funds. The income earned by the Fund from such investments is included as Dividends-affiliated issuers in the Statement of Operations. As an investing fund, the Fund indirectly bears its proportionate share of the expenses of Columbia Short-Term Cash Fund.
Note 7. Line of Credit
The Fund has access to a revolving credit facility whereby the Fund may borrow for the temporary funding of shareholder redemptions or for other temporary or emergency purposes. Effective December 8, 2015, Citibank, N.A. and HSBC Bank USA, N.A. joined JPMorgan Chase Bank, N.A. (JPMorgan) as lead of a syndicate of banks under the credit facility, which is a collective agreement between the Fund and certain other funds managed by the Investment Manager, severally and not jointly, that permits collective borrowings up to $1 billion. Interest is charged to each participating fund based on its borrowings at a rate equal to the higher of (i) the overnight federal funds rate plus 1.00% or (ii) the one-month LIBOR rate plus 1.00%. Each borrowing under
Annual Report 2016
31
COLUMBIA SELECT LARGE CAP GROWTH FUND
NOTES TO FINANCIAL STATEMENTS (continued)
March 31, 2016
the credit facility matures no later than 60 days after the date of borrowing. The Fund also pays a commitment fee equal to its pro rata share of the amount of the credit facility at a rate of 0.15% per annum. The commitment fee is included in other expenses in the Statement of Operations. Prior to December 8, 2015, JPMorgan was the sole lead bank under the credit facility agreement that permitted borrowings up to $550 million under the same terms and interest rates as described above with the exception of the commitment fee which was charged at a rate of 0.075% per annum.
The Fund had no borrowings during the year ended March 31, 2016.
Note 8. Significant Risks
Shareholder Concentration Risk
At March 31, 2016, two unaffiliated shareholders of record owned 48.1% of the outstanding shares of the Fund in one or more accounts. The Fund has no knowledge about whether any portion of those shares was owned beneficially. Subscription and redemption activity by concentrated accounts may have a significant effect on the operations of the Fund. In the case of a large redemption, the Fund may be forced to sell investments at inopportune times, including its liquid or more liquid positions, resulting in Fund losses and the Fund holding a higher percentage of less liquid or illiquid securities. Large redemptions could result in decreased economies of scale and increased operating expenses for non-redeeming Fund shareholders.
Health Care Sector Risk
The Fund may be more susceptible to the particular risks that may affect companies in the health care sector than if it were invested in a wider variety of companies in unrelated sectors. Companies in the health care sector are subject to certain risks, including restrictions on government reimbursement for medical expenses, government approval of medical products and services, competitive pricing pressures, and the rising cost of medical products and services (especially for companies dependent upon a relatively limited number of products or services). Performance of such companies may be affected by factors including, government regulation, obtaining and protecting patents (or the failure to do so), product liability and other similar litigation as well as product obsolescence.
Technology and Technology-related Investment Risk
The Fund may be more susceptible to the particular risks that may affect companies in the information technology sector, as well as other technology-related sectors (collectively, the technology sectors) than if it were invested in a wider variety of companies in unrelated sectors. Companies in the technology sectors are subject to certain risks, including the risk that new services, equipment or technologies will not be accepted by consumers and businesses or will become rapidly obsolete. Performance of such companies may be affected by factors including obtaining and protecting patents (or the failure to do so) and significant competitive pressures, including aggressive pricing of their products or services, new market entrants, competition for market share and short product cycles due to an accelerated rate of technological developments. Such competitive pressures may lead to limited earnings and/or falling profit margins. As a result, the value of their securities may fall or fail to rise. In addition, many technology sector companies have limited operating histories and prices of these companies' securities historically have been more volatile than other securities, especially over the short term.
Note 9. Subsequent Events
Management has evaluated the events and transactions that have occurred through the date the financial statements were issued and noted no items requiring adjustment of the financial statements or additional disclosure.
Note 10. Information Regarding Pending and Settled Legal Proceedings
In December 2005, without admitting or denying the allegations, American Express Financial Corporation (AEFC, which is now known as Ameriprise Financial, Inc. (Ameriprise Financial)) entered into settlement agreements with the Securities and Exchange Commission (SEC) and Minnesota Department of Commerce (MDOC) related to market timing activities. As a result, AEFC was censured and ordered to cease and desist from committing or causing any violations of certain provisions of the Investment Advisers Act of 1940, the Investment Company Act of 1940, and various Minnesota laws. AEFC agreed to pay disgorgement of $10 million and civil money penalties of $7 million. AEFC also agreed to retain an independent distribution consultant to assist in developing a plan for distribution
Annual Report 2016
32
COLUMBIA SELECT LARGE CAP GROWTH FUND
NOTES TO FINANCIAL STATEMENTS (continued)
March 31, 2016
of all disgorgement and civil penalties ordered by the SEC in accordance with various undertakings detailed at http://www.sec.gov/litigation/admin/ia-2451.pdf. Ameriprise Financial and its affiliates have cooperated with the SEC and the MDOC in these legal proceedings, and have made regular reports to the Funds' Boards of Trustees.
Ameriprise Financial and certain of its affiliates have historically been involved in a number of legal, arbitration and regulatory proceedings, including routine litigation, class actions, and governmental actions, concerning matters arising in connection with the conduct of their business activities. Ameriprise Financial believes that the Funds are not currently the subject of, and that neither Ameriprise Financial nor any of its affiliates are the subject of, any pending legal, arbitration or regulatory proceedings that are likely to have a material adverse effect on the Funds or the ability of Ameriprise Financial or its affiliates to perform under their contracts with the Funds. Ameriprise Financial is required to make quarterly (10-Q), annual (10-K) and, as necessary, 8-K filings with the SEC on legal and regulatory matters that relate to Ameriprise Financial and its affiliates. Copies of these filings may be obtained by accessing the SEC website at www.sec.gov.
There can be no assurance that these matters, or the adverse publicity associated with them, will not result in increased fund redemptions, reduced sale of fund shares or other adverse consequences to the Funds. Further, although we believe proceedings are not likely to have a material adverse effect on the Funds or the ability of Ameriprise Financial or its affiliates to perform under their contracts with the Funds, these proceedings are subject to uncertainties and, as such, we are unable to estimate the possible loss or range of loss that may result. An adverse outcome in one or more of these proceedings could result in adverse judgments, settlements, fines, penalties or other relief that could have a material adverse effect on the consolidated financial condition or results of operations of Ameriprise Financial.
Annual Report 2016
33
COLUMBIA SELECT LARGE CAP GROWTH FUND
REPORT OF INDEPENDENT REGISTERED PUBLIC ACCOUNTING FIRM
To the Trustees of Columbia Funds Series Trust I and the Shareholders of
Columbia Select Large Cap Growth Fund
In our opinion, the accompanying statement of assets and liabilities, including the portfolio of investments, and the related statements of operations and of changes in net assets and the financial highlights present fairly, in all material respects, the financial position of Columbia Select Large Cap Growth Fund (the "Fund," a series of Columbia Funds Series Trust I) at March 31, 2016, and the results of its operations, the changes in its net assets and the financial highlights for each of the periods indicated, in conformity with accounting principles generally accepted in the United States of America. These financial statements and financial highlights (hereafter referred to as "financial statements") are the responsibility of the Fund's management. Our responsibility is to express an opinion on these financial statements based on our audits. We conducted our audits of these financial statements in accordance with the standards of the Public Company Accounting Oversight Board (United States). Those standards require that we plan and perform the audit to obtain reasonable assurance about whether the financial statements are free of material misstatement. An audit includes examining, on a test basis, evidence supporting the amounts and disclosures in the financial statements, assessing the accounting principles used and significant estimates made by management, and evaluating the overall financial statement presentation. We believe that our audits, which included confirmation of securities at March 31, 2016 by correspondence with the custodian, brokers and transfer agent, provide a reasonable basis for our opinion.
PricewaterhouseCoopers LLP
Minneapolis, MN
May 20, 2016
Annual Report 2016
34
COLUMBIA SELECT LARGE CAP GROWTH FUND
FEDERAL INCOME TAX INFORMATION
(Unaudited)
The Fund hereby designates the following tax attributes for the fiscal year ended March 31, 2016. Shareholders will be notified in early 2017 of the amounts for use in preparing 2016 income tax returns.
Tax Designations
| Qualified Dividend Income | | | 21.43 | % | |
| Dividends Received Deduction | | | 21.45 | % | |
Capital Gain Dividend | | $ | 622,242,038 | | |
Qualified Dividend Income. For taxable, non-corporate shareholders, the percentage of ordinary income distributed during the fiscal year that represents qualified dividend income subject to reduced tax rates.
Dividends Received Deduction. The percentage of ordinary income distributed during the fiscal year that qualifies for the corporate dividends received deduction.
Capital Gain Dividend. The Fund designates as a capital gain dividend the amount reflected above, or if subsequently determined to be different, the net capital gain of such fiscal period.
Annual Report 2016
35
COLUMBIA SELECT LARGE CAP GROWTH FUND
Shareholders elect the Board that oversees the Fund's operations. The Board appoints officers who are responsible for day-to-day business decisions based on policies set by the Board. The following table provides basic biographical information about the Fund's Trustees, including their principal occupations during the past five years, although specific titles for individuals may have varied over the period. The year set forth beneath Length of Service in the table below is the year in which the Trustee was first appointed or elected as Trustee to any Fund currently in the Columbia Funds Complex or a predecessor thereof. Under current Board policy, members serve terms of indefinite duration.
Trustees
Independent Trustees
Name,
Address,
Year of Birth | | Position Held With
the Funds and Length of
Service | | Principal Occupation(s)
During the Past Five Years
and Other Relevant
Professional Experience | | Number of
Funds in the
Columbia Funds
Complex
Overseen | | Other Directorships
Held by Trustee During
the Past Five Years | |
Janet Langford Carrig
c/o Columbia
Management Investment Advisers, LLC,
225 Franklin Street
Mail Drop BX32 05228,
Boston, MA 02110
1957 | | Trustee 1996 | | Senior Vice President, General Counsel and Corporate Secretary, ConocoPhillips (integrated energy company) since September 2007 | | | 58 | | | None | |
Douglas A. Hacker
c/o Columbia Management Investment Advisers, LLC,
225 Franklin Street
Mail Drop BX32 05228,
Boston, MA 02110
1955 | | Trustee and Chairman of the Board 1996 | | Independent business executive since May 2006; Executive Vice President — Strategy of United Airlines from December 2002 to May 2006; President of UAL Loyalty Services (airline marketing company) from September 2001 to December 2002; Executive Vice President and Chief Financial Officer of United Airlines from July 1999 to September 2001 | | | 58 | | | Spartan Nash Company (food distributor); Nash Finch Company (food distributor) from 2005 to 2013; Aircastle Limited (aircraft leasing); SeaCube Container Leasing Ltd. (container leasing) from 2010 to 2013; and Travelport Worldwide Limited (travel information technology) | |
Nancy T. Lukitsh
c/o Columbia Management Investment Advisers, LLC,
225 Franklin Street
Mail Drop BX32 05228,
Boston, MA 02110
1956 | | Trustee 2011 | | Senior Vice President, Partner and Director of Marketing, Wellington Management Company, LLP (investment adviser) from 1997 to 2010; Chair, Wellington Management Portfolios (commingled non-U.S. investment pools) from 2007 to 2010; Director, Wellington Trust Company, NA and other Wellington affiliates from 1997 to 2010 | | | 58 | | | None | |
Annual Report 2016
36
COLUMBIA SELECT LARGE CAP GROWTH FUND
TRUSTEES AND OFFICERS (continued)
Independent Trustees (continued)
Name,
Address,
Year of Birth | | Position Held With
the Funds and Length of
Service | | Principal Occupation(s)
During the Past Five Years
and Other Relevant
Professional Experience | | Number of
Funds in the
Columbia Funds
Complex
Overseen | | Other Directorships
Held by Trustee During
the Past Five Years | |
William E. Mayer
c/o Columbia Management Investment Advisers, LLC,
225 Franklin Street
Mail Drop BX32 05228,
Boston, MA 02110
1940 | | Trustee 1991 | | Partner, Park Avenue Equity Partners (private equity) since February 1999 | | | 58 | | | DynaVox Inc. (speech creation); Lee Enterprises (print media); WR Hambrecht + Co. (financial service provider) from 2000 to 2012; BlackRock Capital Investment Corporation (investment company); and Premier, Inc. (healthcare) | |
David M. Moffett
c/o Columbia Management Investment Advisers, LLC,
225 Franklin Street
Mail Drop BX32 05228,
Boston, MA 02110
1952 | | Trustee 2011 | | Retired. Consultant to Bridgewater and Associates | | | 58 | | | Director of CIT Bank, CIT Group Inc. (commercial and consumer finance); eBay Inc. (online trading community); Genworth Financial, Inc. (financial and insurance products and services); Paypal Holdings Inc. (payment and data processing services); and Trustee University of Oklahoma Foundation | |
Charles R. Nelson
c/o Columbia Management Investment Advisers, LLC,
225 Franklin Street
Mail Drop BX32 05228,
Boston, MA 02110
1942 | | Trustee 1981 | | Retired. Professor Emeritus, University of Washington since 2011; Professor of Economics, University of Washington from 1976 to 2011; Ford and Louisa Van Voorhis Professor of Political Economy, University of Washington from 1993 to 2011; Adjunct Professor of Statistics, University of Washington from 1980 to 2011; Associate Editor, Journal of Money, Credit and Banking from September 1993 to 2008; consultant on econometric and statistical matters | | | 58 | | | None | |
John J. Neuhauser
c/o Columbia Management Investment Advisers, LLC,
225 Franklin Street
Mail Drop BX32 05228,
Boston, MA 02110
1943 | | Trustee 1984 | | President, Saint Michael's College since August 2007; Director or Trustee of several non-profit organizations, including University of Vermont Medical Center; Academic Vice President and Dean of Faculties, Boston College from August 1999 to October 2005; University Professor, Boston College from November 2005 to August 2007 | | | 58 | | | Liberty All-Star Equity Fund and Liberty All-Star Growth Fund (closed-end funds) | |
Annual Report 2016
37
COLUMBIA SELECT LARGE CAP GROWTH FUND
TRUSTEES AND OFFICERS (continued)
Independent Trustees (continued)
Name,
Address,
Year of Birth | | Position Held With
the Funds and Length of
Service | | Principal Occupation(s)
During the Past Five Years
and Other Relevant
Professional Experience | | Number of
Funds in the
Columbia Funds
Complex
Overseen | | Other Directorships
Held by Trustee During
the Past Five Years | |
Patrick J. Simpson
c/o Columbia Management Investment Advisers, LLC,
225 Franklin Street
Mail Drop BX32 05228,
Boston, MA 02110
1944 | | Trustee 2000 | | Of Counsel, Perkins Coie LLP (law firm) since 2015; Partner, Perkins Coie LLP from 1988 to 2014 | | | 58 | | | None | |
Anne-Lee Verville
c/o Columbia Management Investment Advisers, LLC,
225 Franklin Street
Mail Drop BX32 05228,
Boston, MA 02110
1945 | | Trustee 1998 | | Retired. General Manager, Global Education Industry from 1994 to 1997, President — Application Systems Division from 1991 to 1994, Chief Financial Officer — US Marketing & Services from 1988 to 1991, and Chief Information Officer from 1987 to 1988, IBM Corporation (computer and technology) | | | 58 | | | Enesco Group, Inc. (producer of giftware and home and garden decor products) from 2001 to 2006 | |
Annual Report 2016
38
COLUMBIA SELECT LARGE CAP GROWTH FUND
TRUSTEES AND OFFICERS (continued)
Interested Trustee Affiliated with Investment Manager*
Name,
Address,
Year of Birth | | Position Held With
the Funds and Length of
Service | | Principal Occupation(s)
During the Past Five Years
and Other Relevant
Professional Experience | | Number of
Funds in the
Columbia Funds
Complex
Overseen | | Other Directorships
Held by Trustee During
the Past Five Years | |
William F. Truscott
c/o Columbia Management Investment Advisers, LLC,
225 Franklin Street
Boston, MA 02110
1960 | | Trustee 2012 | | Chairman of the Board and President, Columbia Management Investment Advisers, LLC since May 2010 and February 2012, respectively (previously President and Chief Investment Officer, 2001-April 2010); Chief Executive Officer, Global Asset Management, Ameriprise Financial, Inc. since September 2012 (previously Chief Executive Officer, U.S. Asset Management & President, Annuities, May 2010- September 2012 and President — U.S. Asset Management and Chief Investment Officer, 2005-April 2010); Director and Chief Executive Officer, Columbia Management Investment Distributors, Inc. since May 2010 and February 2012, respectively (previously Chairman of the Board and Chief Executive Officer, 2006-April 2010); Chairman of the Board and Chief Executive Officer, RiverSource Distributors, Inc. since 2006; Director, Threadneedle Asset Management Holdings, SARL since 2014; President and Chief Executive Officer, Ameriprise Certificate Company, 2006-August 2012. | | | 178 | | | Chairman of the Board, Columbia Management Investment Advisers, LLC since May 2010; Director, Columbia Management Investment Distributors, Inc. since May 2010; Former Director, Ameriprise Certificate Company, 2006-January 2013 | |
* Interested person (as defined under the 1940 Act) by reason of being an officer, director, security holder and/or employee of the Investment Manager or Ameriprise Financial.
The Statement of Additional Information has additional information about the Fund's Board members and is available, without charge, upon request by calling 800.345.6611; contacting your financial intermediary; or visiting columbiathreadneedle.com/us.
Annual Report 2016
39
COLUMBIA SELECT LARGE CAP GROWTH FUND
TRUSTEES AND OFFICERS (continued)
The Board has appointed officers who are responsible for day-to-day business decisions based on policies it has established. The officers serve at the pleasure of the Board. The following table provides basic information about the Officers of the Fund, including principal occupations during the past five years, although their specific titles may have varied over the period. In addition to Mr. Truscott, who is Senior Vice President, the Fund's other officers are:
Fund Officers
Name,
Address and
Year of Birth | | Position and Year
First Appointed to
Position for any Fund
in the Columbia
Funds Complex or a
Predecessor Thereof | |
Principal Occupation(s) During Past Five Years | |
Christopher O. Petersen
5228 Ameriprise Financial Center
Minneapolis, MN 55474
Born 1970 | | President and Principal Executive Officer (2015) | | Vice President and Lead Chief Counsel, Ameriprise Financial, Inc. since January 2015 (previously, Vice President and Chief Counsel January 2010-December 2014; and Vice President and Group Counsel or Counsel 2004-January 2010); officer of Columbia Funds and affiliated funds since 2007. | |
Michael G. Clarke
225 Franklin Street
Boston, MA 02110
Born 1969 | | Treasurer (2011), Chief Financial Officer (2009) and Chief Accounting Officer (2015) | | Vice President — Mutual Fund Administration, Columbia Management Investment Advisers, LLC, since May 2010; Managing Director of Fund Administration, Columbia Management Advisors, LLC, September 2004-April 2010; senior officer of Columbia Funds and affiliated funds since 2002. | |
Paul B. Goucher
100 Park Avenue
New York, NY 10017
Born 1968 | | Senior Vice President (2011), Chief Legal Officer (2015) and Assistant Secretary (2008) | | Vice President and Lead Chief Counsel, Ameriprise Financial, Inc. since November 2008 and January 2013, respectively (previously Chief Counsel, January 2010-January 2013 and Group Counsel, November 2008-January 2010). | |
Thomas P. McGuire
225 Franklin Street
Boston, MA 02110
Born 1972 | | Senior Vice President and Chief Compliance Officer (2012) | | Vice President — Asset Management Compliance, Ameriprise Financial, Inc., since May 2010; Chief Compliance Officer, Ameriprise Certificate Company since September 2010; Compliance Executive, Bank of America, 2005-April 2010. | |
Colin Moore
225 Franklin Street
Boston, MA 02110
Born 1958 | | Senior Vice President (2010) | | Executive Vice President and Global Chief Investment Officer, Ameriprise Financial, Inc., since July 2013; Director and Global Chief Investment Officer, Columbia Management Investment Advisers, LLC since May 2010; Manager, Managing Director and Chief Investment Officer, Columbia Management Advisors, LLC, 2007-April 2010. | |
Michael E. DeFao
225 Franklin Street
Boston, MA 02110
Born 1968 | | Vice President (2011) and Assistant Secretary (2010) | | Vice President and Chief Counsel, Ameriprise Financial, Inc. since May 2010; Associate General Counsel, Bank of America, 2005-April 2010. | |
Amy Johnson
5228 Ameriprise Financial Center
Minneapolis, MN 55474
Born 1965 | | Vice President (2006) | | Managing Director and Chief Operating Officer, Columbia Management Investment Advisers, LLC since May 2010 (previously Chief Administrative Officer, 2009-April 2010, and Vice President — Asset Management and Trust Company Services, 2006-2009). | |
Lyn Kephart-Strong
5228 Ameriprise
Financial Center
Minneapolis, MN 55474
Born 1960 | | Vice President (2015) | | President, Columbia Management Investment Services Corp. since October 2014; Vice President & Resolution Officer, Ameriprise Trust Company since August 2009; President, RiverSource Service Corporation 2004-2010. | |
Ryan C. Larrenaga
225 Franklin Street
Boston, MA 02110
Born 1970 | | Vice President and Secretary (2015) | | Vice President and Group Counsel, Ameriprise Financial, Inc. since August 2011 (previously, Counsel from May 2010 to August 2011); Assistant General Counsel, Bank of America, 2005-April 2010; officer of Columbia Funds and affiliated funds since 2005. | |
Annual Report 2016
40
COLUMBIA SELECT LARGE CAP GROWTH FUND
IMPORTANT INFORMATION ABOUT THIS REPORT
Each fund mails one shareholder report to each shareholder address. If you would like more than one report, please call shareholder services at 800.345.6611 and additional reports will be sent to you.
The policy of the Board is to vote the proxies of the companies in which each fund holds investments consistent with the procedures as stated in the Statement of Additional Information (SAI). You may obtain a copy of the SAI without charge by calling 800.345.6611; contacting your financial intermediary; visiting columbiathreadneedle.com/us; or searching the website of the Securities and Exchange Commission (SEC) at sec.gov. Information regarding how each fund voted proxies relating to portfolio securities is filed with the SEC by August 31st for the most recent 12-month period ending June 30th of that year, and is available without charge by visiting columbiathreadneedle.com/us, or searching the website of the SEC at sec.gov.
Each fund files a complete schedule of portfolio holdings with the SEC for the first and third quarters of each fiscal year on Form N-Q. Each fund's Form N-Q is available on the SEC's website at sec.gov and may be reviewed and copied at the SEC's Public Reference Room in Washington, D.C. Information on the operation of the Public Reference Room may be obtained by calling 800.SEC.0330. Each fund's complete schedule of portfolio holdings, as filed on Form N-Q, can also be obtained without charge, upon request, by calling 800.345.6611.
Annual Report 2016
41
Columbia Select Large Cap Growth Fund
P.O. Box 8081
Boston, MA 02266-8081

This information is for use with concurrent or prior delivery of a fund prospectus. Please read and consider the investment objectives, risks, charges and expenses for any fund carefully before investing. For a prospectus and summary prospectus, which contains this and other important information about the Fund, go to columbiathreadneedle.com/us. The Fund is distributed by Columbia Management Investment Distributors, Inc., member FINRA, and managed by Columbia Management Investment Advisers, LLC.
Columbia Threadneedle Investments (Columbia Threadneedle) is the global brand name of the Columbia and Threadneedle group of companies.
All rights reserved. Columbia Management Investment Distributors, Inc., 225 Franklin Street, Boston, MA 02110-2804
© 2016 Columbia Management Investment Advisers, LLC.
columbiathreadneedle.com/us
ANN215_03_F01_(05/16)

ANNUAL REPORT
March 31, 2016

COLUMBIA PACIFIC/ASIA FUND

ABOUT COLUMBIA THREADNEEDLE INVESTMENTS
Columbia Threadneedle Investments is a leading global asset management group that provides a broad range of actively managed investment strategies and solutions for individual, institutional and corporate clients around the world.
With more than 2,000 people, including over 450 investment professionals based in North America, Europe and Asia, we manage $464 billion* of assets across developed and emerging market equities, fixed income, asset allocation solutions and alternatives. We are the 13th largest manager of long-term mutual fund assets in the U.S.** and the 3rd largest manager of retail funds in the U.K.***
Our priority is the investment success of our clients. We aim to deliver the investment outcomes they expect through an investment approach that is team-based, performance-driven and risk-aware. Our culture is dynamic and interactive. By sharing our insights across asset classes and geographies, we generate richer perspectives on global, regional and local investment landscapes. The ability to exchange and debate investment ideas in a collaborative environment enriches our teams' investment processes. More importantly, it results in better informed investment decisions for our clients.
Columbia funds are distributed by Columbia Management Investment Distributors, Inc., member FINRA, and managed by Columbia Management Investment Advisers, LLC.
Columbia Threadneedle Investments (Columbia Threadneedle) is the global brand name of the Columbia and Threadneedle group of companies.
* In U.S. dollars as of March 31, 2016. Source: Ameriprise Q1 Earnings Release. Includes all assets managed by entities in the Columbia and Threadneedle groups of companies. Contact us for more current data.
** Source: ICI as of March 31, 2016 for Columbia Management Investment Advisers, LLC.
*** Source: Investment Association as of December 2015 for Threadneedle Asset Management Limited.
© 2016 Columbia Management Investment Advisers, LLC. All rights reserved.
Not part of the shareholder report
Investment strategies to help meet investor needs
We are committed to helping investors navigate financial challenges to reach their desired outcomes. The possibilities are endless.
Your success is our priority.
Retire comfortably
Fund college or higher education
Leave a legacy
Generate an appropriate stream of income in retirement
Traditional approaches to income may no longer be adequate — and they may no longer provide the diversification benefits they once did. Investors need to rethink how they generate retirement income.
Worried about running out of income? You are not alone.
Navigate a changing interest rate environment
Even in today's challenging interest rate environment, it's still possible to navigate markets and achieve your goals.
Make investment choices designed specifically for this market environment.
Maximize after-tax returns
In an environment where what you keep is more important than what you earn, municipal bonds can help mitigate higher taxes while providing attractive yields compared to other investment options.
You've worked too hard building your wealth to lose it to taxes.
Grow assets to achieve financial goals
Finding growth opportunities in today's complex market environment requires strong research capabilities, creative thinking and a disciplined approach.
Do your investments deliver the portfolio growth you need?
Ease the impact of volatile markets
With increasing concerns about market volatility, investors should consider diversifying their portfolios with non-traditional holdings.
Interested in turning volatility into opportunity?
To find out more, contact your financial professional, call 800.426.3750 or visit columbiathreadneedle.com/us
Not part of the shareholder report
 Dear Shareholders,
Volatility comes with the territory for long-term investors. Some investors instinctively want to pull out of the market or sell underperforming investments at the first sign of increased volatility or perhaps even as soon as they perceive it on the horizon. But taking yourself out of the market could mean losing out on potential opportunities, and putting your longer-term investment goals at risk.
Cumulative return is not just about achieving high returns when markets are going up; it's also about remaining invested and minimizing losses during weak or volatile markets so that you can participate on the upside. Developing a deeper understanding of the various risks your portfolio is subject to can help you balance these risks.
Diversification is critical in seeking to achieve that balance. We believe that most portfolios could be more effectively diversified either by introducing holdings with performance profiles unrelated to existing holdings (like alternative products) or by rebalancing existing holdings with an eye toward risk allocation. Over time, distributing risk more evenly may produce a more pronounced diversification benefit and may improve portfolio efficiency. We believe market volatility can create significant opportunities and, in fact, these periods may be some of the very best times to invest.
With this in mind, I thought it important to highlight excerpts from a piece written by Colin Moore, Global Chief Investment Officer, in which he touches on some of these issues emphasizing the importance of a properly constructed portfolio in seeking to effectively manage volatility and to achieve consistency of returns. I encourage you to read the article in its entirety. To access the full article and for other insights on current market, please visit blog.columbiathreadneedleus.com/latest-perspectives.
You need investments that are designed to help you ease the impact of volatile market environments and keep the savings you have worked tirelessly to amass. Columbia Threadneedle Investments provides investment solutions to help you tackle financial challenges and achieve your desired outcome.
Best regards,

Christopher O. Petersen
President, Columbia Funds
Excerpts from:
Taking the scare out of the volatility bogeyman
By Colin Moore, Global Chief Investment Officer
Colin Moore is the global chief investment officer for Columbia Threadneedle Investments. His responsibilities include ensuring that a disciplined investment process is in place across all asset classes, including equity and fixed income. Mr. Moore joined one of the Columbia Threadneedle Investments legacy firms in 2002 as head of equity and was also head of fixed income and liquidity strategies from 2009 – 2010.

n In today's low growth, higher volatility world, the emphasis is shifting from maximization of returns to consistency of returns.
PRESIDENT'S MESSAGE (continued)
n Portfolios should represent the behavioral risk-return tradeoff of investors, remembering that they won't stay invested to realize the return if we get the risk tolerance wrong.
n Holding long-term savings in cash to avoid volatility (the financial equivalent of hiding under the sheets) is detrimental to achieving long-term goals.
According to Wikipedia, "The bogeyman is a common allusion to a mythical creature in many cultures used to control behavior. This monster has no specific appearance, and conceptions about it can vary drastically from household to household within the same community; in many cases he has no set appearance in the mind of an adult or child, but is simply a non-specific embodiment of terror." Different cultures have different names and physical representations for the bogeyman, and investors are no different. We have terrible monsters that we fear may destroy our portfolios, and we call one of the scariest of them volatility.
While the bogeyman is mythical (I hope!), volatility is real and can cause serious damage. To understand why investors have such a hard time coping with volatility, we first need to define three cognitive biases at work in today's investment environment:
1) Recency bias — something that has recently come to the forefront of our attention, regardless of how long established it is, suddenly seems to appear with improbable frequency.
2) Negativity bias — we tend to have a greater recall of unpleasant memories than positive memories.
3) Loss aversion — our dissatisfaction with losing money tends to be greater than our satisfaction with making money.
The level of volatility varies dramatically, and so does investor fear and panic selling — waxing when volatility rises, waning when it falls. Recent studies have pointed to demographics as an important driver of panic selling. The theory is that as people get closer to retirement, the prospects of a large (20% – 30%) loss in financial assets can have a much more pronounced effect on their sense of well-being. Wealth preservation instincts kick in much more quickly than for younger (and typically less wealthy) savers.
The reality is that there is little opportunity for return without volatility. Therefore, the bogeyman effect of holding long-term savings in cash to avoid volatility (the financial equivalent of hiding under the sheets) is detrimental to achieving long-term goals. This effect tends to be more pronounced during the episodic spikes in volatility. The significant spike in volatility in 2008 and 2009 led to significant withdrawals from long-term investment funds over the same period. Less pronounced effects can also be seen when comparing 2001 – 2003 and 2011 – 2012. Conversely, flows picked up when volatility returned to "normal" levels. Investor behavior of this type is consistent with the three behavioral biases.
I believe average volatility will be higher over the next 10 years than the last 10 years and episodic spikes will increase in frequency because sustainable economic growth will be structurally lower and geopolitical risk higher than any time since World War II. Low growth creates uncertainty while loss aversion will make investors fear that we are one economic mishap or geopolitical event away from no growth or recession. The result will be higher volatility on average. Negativity bias will tend to exacerbate "spike" reactions to event-driven geopolitical news, and the volatility bogeyman will appear more often. Assuming the behavioral biases continue, investor returns are likely to be very disappointing regardless of the total return generated by financial markets due to the bogeyman effect.
To mitigate this effect, we need to focus on portfolio construction and an improved understanding of diversification. I accept that equities are likely to offer the highest return over the next 10 years, but they also offer the highest volatility. Many portfolio construction optimization tools use historical average volatility, which is likely to underestimate the volatility investors will face. The bogeyman emerges when individual asset class volatility spikes and cross correlations rise, the combination of which increases overall portfolio volatility far beyond expectation. Diversification is meant to protect investors against volatility, but what's the point of owning lots of investments if the volatility bogeyman has not been properly estimated?
Most importantly, portfolios should be constructed to properly represent the behavioral risk-return tradeoff of investors, remembering that they won't stay invested to realize the return if we get the risk tolerance wrong. In a low growth, higher volatility world, the emphasis is shifting to return consistency rather than return maximization,
PRESIDENT'S MESSAGE (continued)
and investors are best served through investment approaches that appreciate that distinction. Even though it's a permanent feature of financial markets, volatility is less likely to be the bogeyman we all fear if portfolios are constructed with this understanding.
Please visit blog.columbiathreadneedleus.com/latest-perspectives to read the entire article.
Investors should consider the investment objectives, risks, charges and expenses of a mutual fund carefully before investing. For a free prospectus and summary prospectus, which contains this and other important information about a fund, visit columbiathreadneedle.com/us. The prospectus should be read carefully before investing.
The views expressed are as of April 2016, may change as market or other conditions change, and may differ from views expressed by other Columbia Management Investment Advisers, LLC (CMIA) associates or affiliates. Actual investments or investment decisions made by CMIA and its affiliates, whether for its own account or on behalf of clients, will not necessarily reflect the views expressed. This information is not intended to provide investment advice and does not account for individual investor circumstances. Investment decisions should always be made based on an investor's specific financial needs, objectives, goals, time horizon and risk tolerance. Asset classes described may not be suitable for all investors.
Past performance does not guarantee future results, and no forecast should be considered a guarantee either. Since economic and market conditions change frequently, there can be no assurance that the trends described here will continue or that the forecasts are accurate.
Diversification does not guarantee a profit or protect against loss.
Columbia Funds are distributed by Columbia Management Investment Distributors, Inc., member FINRA, and managed by Columbia Management Investment Advisers, LLC.
© 2016 Columbia Management Investment Advisers, LLC. All rights reserved
COLUMBIA PACIFIC/ASIA FUND
Performance Overview | | | 2 | | |
Manager Discussion of Fund Performance | | | 4 | | |
Understanding Your Fund's Expenses | | | 7 | | |
Portfolio of Investments | | | 8 | | |
Statement of Assets and Liabilities | | | 13 | | |
Statement of Operations | | | 15 | | |
Statement of Changes in Net Assets | | | 16 | | |
Financial Highlights | | | 18 | | |
Notes to Financial Statements | | | 24 | | |
Report of Independent Registered Public Accounting Firm | | | 34 | | |
Federal Income Tax Information | | | 35 | | |
Trustees and Officers | | | 36 | | |
Important Information About This Report | | | 41 | | |
Fund Investment Manager
Columbia Management Investment
Advisers, LLC
225 Franklin Street
Boston, MA 02110
Fund Distributor
Columbia Management Investment
Distributors, Inc.
225 Franklin Street
Boston, MA 02110
Fund Transfer Agent
Columbia Management Investment
Services Corp.
P.O. Box 8081
Boston, MA 02266-8081
For more information about any of the funds, please visit columbiathreadneedle.com/us or call 800.345.6611. Customer Service Representatives are available to answer your questions Monday through Friday from 8 a.m. to 7 p.m. Eastern time.
The views expressed in this report reflect the current views of the respective parties. These views are not guarantees of future performance and involve certain risks, uncertainties and assumptions that are difficult to predict, so actual outcomes and results may differ significantly from the views expressed. These views are subject to change at any time based upon economic, market or other conditions and the respective parties disclaim any responsibility to update such views. These views may not be relied on as investment advice and, because investment decisions for a Columbia fund are based on numerous factors, may not be relied on as an indication of trading intent on behalf of any particular Columbia fund. References to specific securities should not be construed as a recommendation or investment advice.
COLUMBIA PACIFIC/ASIA FUND
Performance Summary
n Columbia Pacific/Asia Fund (the Fund) Class A shares returned -5.88% excluding sales charges for the 12-month period that ended March 31, 2016.
n During the same time period, the Fund outperformed both the MSCI All Country (AC) Asia Pacific Index (Net), which returned -9.68%, and the broader MSCI EAFE Index (Net), which returned -8.27%.
n Security selection, especially in the industrials and financials sectors and in Japan and China, generally accounted for the Fund's performance advantage over the MSCI AC Asia Pacific Index (Net).
Average Annual Total Returns (%) (for period ended March 31, 2016)
| | | Inception | | 1 Year | | 5 Years | | 10 Years | |
Class A* | | 03/31/08 | | | | | | | | | | | | | |
Excluding sales charges | | | | | | | -5.88 | | | | 3.10 | | | | 2.66 | | |
Including sales charges | | | | | | | -11.25 | | | | 1.89 | | | | 2.05 | | |
Class C* | | 03/31/08 | | | | | | | | | | | | | |
Excluding sales charges | | | | | | | -6.64 | | | | 2.34 | | | | 1.92 | | |
Including sales charges | | | | | | | -7.57 | | | | 2.34 | | | | 1.92 | | |
Class I* | | 09/27/10 | | | -5.52 | | | | 3.55 | | | | 3.05 | | |
Class R4* | | 03/19/13 | | | -5.61 | | | | 3.35 | | | | 2.95 | | |
Class W* | | 06/18/12 | | | -5.96 | | | | 3.09 | | | | 2.71 | | |
Class Z | | 12/31/92 | | | -5.61 | | | | 3.37 | | | | 2.95 | | |
MSCI AC Asia Pacific Index (Net) | | | | | | | -9.68 | | | | 1.51 | | | | 2.20 | | |
MSCI EAFE Index (Net) | | | | | | | -8.27 | | | | 2.29 | | | | 1.80 | | |
Returns for Class A are shown with and without the maximum initial sales charge of 5.75%. Returns for Class C are shown with and without the 1.00% contingent deferred sales charge for the first year only. The Fund's other classes are not subject to sales charges and have limited eligibility. Please see the Fund's prospectus for details. Performance for different share classes will vary based on differences in sales charges and fees associated with each class. All results shown assume reinvestment of distributions during the period. Returns do not reflect the deduction of taxes that a shareholder may pay on Fund distributions or on the redemption of Fund shares. Performance results reflect the effect of any fee waivers or reimbursements of Fund expenses by Columbia Management Investment Advisers, LLC and/or any of its affiliates. Absent these fee waivers or expense reimbursement arrangements, performance results would have been lower.
The performance information shown represents past performance and is not a guarantee of future results. The investment return and principal value of your investment will fluctuate so that your shares, when redeemed, may be worth more or less than their original cost. Current performance may be lower or higher than the performance information shown. You may obtain performance information current to the most recent month-end by contacting your financial intermediary, visiting columbiathreadneedle.com/us or calling 800.345.6611.
*The returns shown for periods prior to the share class inception date (including returns for the Life of the Fund, if shown, which are since Fund inception) include the returns of the Fund's oldest share class. These returns are adjusted to reflect any higher class-related operating expenses of the newer share classes, as applicable. Please visit columbiathreadneedle.com/us/investment-products/mutual-funds/appended-performance for more information.
The MSCI AC Asia Pacific Index (Net) is a free float-adjusted market capitalization weighted index that is designed to measure the equity market performance in 13 developed and emerging markets in the Asia Pacific region.
The MSCI EAFE Index (Net) is a free float-adjusted market capitalization index that is designed to measure the equity market performance of developed markets, excluding the U.S. and Canada. The index is compiled from a composite of securities markets of Europe, Australasia and the Far East and is widely recognized by investors in foreign markets as the measurement index for portfolios of non-North American securities.
Indices are not available for investment, are not professionally managed and do not reflect sales charges, fees, brokerage commissions, taxes (except the MSCI AC Asia Pacific Index (Net) and the MSCI EAFE Index (Net), which reflect reinvested dividends net of withholding taxes) or other expenses of investing. Securities in the Fund may not match those in an index.
Annual Report 2016
2
COLUMBIA PACIFIC/ASIA FUND
PERFORMANCE OVERVIEW (continued)
Performance of a Hypothetical $10,000 Investment (April 1, 2006 – March 31, 2016)

The chart above shows the change in value of a hypothetical $10,000 investment in Class A shares of Columbia Pacific/Asia Fund during the stated time period, and does not reflect the deduction of taxes that a shareholder may pay on Fund distributions or on the redemption of Fund shares.
Annual Report 2016
3
COLUMBIA PACIFIC/ASIA FUND
MANAGER DISCUSSION OF FUND PERFORMANCE
Portfolio Management
Daisuke Nomoto, CMA (SAAJ)
Jasmine Huang, CFA, CPA
(U.S. and China), CFM
Christine Seng, CFA
Morningstar Style BoxTM
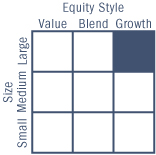
The Morningstar Style BoxTM is based on a fund's portfolio holdings. For equity funds, the vertical axis shows the market capitalization of the stocks owned, and the horizontal axis shows investment style (value, blend, or growth). Information shown is based on the most recent data provided by Morningstar.
© 2016 Morningstar, Inc. All rights reserved. The Morningstar information contained herein: (1) is proprietary to Morningstar and/or its content providers; (2) may not be copied or distributed; and (3) is not warranted to be accurate, complete or timely. Neither Morningstar nor its content providers are responsible for any damages or losses arising from any use of this information.
At March 31, 2016, approximately 73% of the Fund's shares were owned in the aggregate by affiliated funds-of-funds managed by Columbia Management Investment Advisers, LLC (the Investment Manager). As a result of asset allocation decisions by the Investment Manager, it is possible that the Fund may experience relatively large purchases or redemptions from affiliated funds-of-funds. The Investment Manager seeks to minimize the impact of these transactions by structuring them over a reasonable period of time. The Fund may experience increased expenses as it buys and sells securities as a result of purchases or redemptions by affiliated funds-of-funds.
For the 12-month period that ended March 31, 2016, the Fund's Class A shares returned -5.88% excluding sales charges. Despite a difficult period for stock markets around the world, the Fund held up significantly better than the MSCI AC Asia Pacific Index (Net) and the broader MSCI EAFE Index (Net), which returned -9.68% and -8.27% respectively over the same time period. Security selection, especially in the industrials and financials sectors and in Japan and China, generally accounted for the Fund's performance advantage over the MSCI AC Asia Pacific Index (Net).
Economic Slowdown Pressured Pacific-Asia Markets
Pacific-Asia equities declined amid worries about the economic slowdown in China and its implications for global growth. All markets in the MSCI AC Asia Pacific Index (Net) came under pressure during the year, with a plunge in Indonesia, China, India, Thailand and Singapore equities. New Zealand was the best-performing market on a relative basis during the period, and the only one with positive performance. While defensive sectors such as utilities, health care and consumer staples performed relatively well, financials, materials and energy lost approximately 14% (in U.S. dollars) for the period.
Chinese equities (China's domestic market "A" shares) experienced a sharp reversal in the summer of 2015. The 23% drop accounted for China's worst quarter in four years. A tightening in margin financing rules, an increase in interbank rates and high valuations drove the correction. Measures intended to stabilize China's shares were generally counter-productive and viewed as interference in the orderly development of capital markets. In August, the People's Bank of China (the PBOC) changed the rule of its currency peg despite the fact that the government had made a statement that it relies on market forces, which elevated global equity market volatility, then cut its benchmark interest rate in an effort to stimulate economic activity. Other Pacific-Asia central banks also cut policy rates. In Japan, the equity market suffered in response to weaker-than-expected economic news and the mid-February surge of the yen, due partly to market confusion caused by the Bank of Japan's negative interest rate policy. Despite the U.S. Federal Reserve's (the Fed's) decision to raise short-term interest rates in December 2015, the first time since 2004, subsequent, dovish comments from the Fed lowered expectations for further rate hikes and contributed to a sense of uncertainty in the markets throughout the period.
Annual Report 2016
4
COLUMBIA PACIFIC/ASIA FUND
MANAGER DISCUSSION OF FUND PERFORMANCE (continued)
A year-end rally in Pacific-Asia equities was not enough to wipe out the significant losses incurred earlier in the period; and when the rally was cut short, Pacific-Asia equity markets remained down for the 12-month period.
Contributors and Detractors
Security selection aided the Fund's performance, with a modest additional contribution from sector allocation. Country allocation slightly detracted from results for the period.
Security selection was particularly strong in Japan and also in the financials and industrials sectors. These positives were only partially offset by security selection in Korea and in the utilities sector.
The Fund's notable individual contributors included PeptiDream, Nihon M&A Center, and Daiichikosho. PeptiDream successfully licensed out its own Peptide discovery platform system technology to global pharmaceutical companies, and its shares delivered a triple digit gain. Nihon M&A Center provides advisory services to small and medium-sized enterprises in Japan. Given its unique business model and a favorable competitive environment, the company exceeded market expectations and delivered a solid return. Daiichikosho, which specializes in karaoke equipment, benefited as it gained market share, which was driven by a new product launch and Japan's aging population.
The Fund's most notable individual detractors for the period included Mitsubishi UFJ Financial Group, Japan's largest financial group; Ping An Insurance Group Co. of China, a Chinese insurance service provider and Japan-based Shinmaywa Industries, a manufacturer of special duty vehicles, aircraft parts, industrial machinery and other related systems. Mitsubishi UFJ shares declined as the company experienced lackluster loan growth, competitive pressures and the impact of Japan's negative interest-rate policy. Ping An Insurance underperformed the benchmark on the back of China's economic slowdown and volatile capital markets. Shinmaywa Industries shares declined late in the period as a stronger yen raised concerns about the company's aircraft parts business.
Portfolio Activity
The Fund's exposure to Japan rose during the period, the result of uncovering companies that we believed offered solid performance potential. By contrast, we reduced the Fund's exposure to China/Hong Kong given our cautious outlook on their economies. In China, we eliminated positions in Bank of China, Industrial & Commercial Bank of China and other financial names. We also sold Catcher Technology Co., Zhuzhou CSR Times Electric Co., Softbank, Sands China and BHP Billiton and used the proceeds to initiate positions in LG Chem, Asahi Intecc, CYBERDYNE and others. Through this process, we reduced the number of Fund holdings from 104 to 86.
A Positive Impact from Currency Contracts
We used forward currency contracts to keep the Fund's currency positioning generally in line with the MSCI AC Asia Pacific Index (Net). Although we followed this strategy with many currencies, we slightly overweighted or underweighted currency positions relative to the index
Top Ten Holdings (%)
(at March 31, 2016) | |
Taiwan Semiconductor Manufacturing
Co., Ltd., ADR (Taiwan) | | | 3.4 | | |
Tencent Holdings Ltd. (China) | | | 3.0 | | |
Samsung Electronics Co., Ltd.
(South Korea) | | | 2.6 | | |
China Mobile Ltd. (China) | | | 2.6 | | |
KDDI Corp. (Japan) | | | 2.2 | | |
Commonwealth Bank of Australia
(Australia) | | | 2.1 | | |
Nippon Telegraph & Telephone
Corp. (Japan) | | | 2.0 | | |
Keyence Corp. (Japan) | | | 1.9 | | |
Toyota Motor Corp. (Japan) | | | 1.8 | | |
Fuji Heavy Industries Ltd. (Japan) | | | 1.8 | | |
Percentages indicated are based upon total investments (excluding Money Market Funds).
For further detail about these holdings, please refer to the section entitled "Portfolio of Investments."
Fund holdings are as of the date given, are subject to change at any time, and are not recommendations to buy or sell any security.
Country Breakdown (%)
(at March 31, 2016) | |
Australia | | | 9.7 | | |
China | | | 13.0 | | |
Hong Kong | | | 3.1 | | |
India | | | 6.9 | | |
Indonesia | | | 2.5 | | |
Japan | | | 45.4 | | |
Philippines | | | 2.3 | | |
Singapore | | | 2.4 | | |
South Korea | | | 5.0 | | |
Taiwan | | | 4.3 | | |
Thailand | | | 0.8 | | |
United Kingdom | | | 0.8 | | |
United States(a) | | | 3.8 | | |
Total | | | 100.0 | | |
Country Breakdown is based primarily on issuer's place of organization/incorporation. Percentages indicated are based upon total investments. The Fund's portfolio composition is subject to change.
(a) Includes investments in Money Market Funds.
Annual Report 2016
5
COLUMBIA PACIFIC/ASIA FUND
MANAGER DISCUSSION OF FUND PERFORMANCE (continued)
Equity Sector Breakdown (%)
(at March 31, 2016) | |
Consumer Discretionary | | | 12.7 | | |
Consumer Staples | | | 3.0 | | |
Energy | | | 1.7 | | |
Financials | | | 24.8 | | |
Health Care | | | 11.9 | | |
Industrials | | | 14.5 | | |
Information Technology | | | 14.7 | | |
Materials | | | 7.1 | | |
Telecommunication Services | | | 8.7 | | |
Utilities | | | 0.9 | | |
Total | | | 100.0 | | |
Percentages indicated are based upon total equity investments. The Fund's portfolio composition is subject to change.
Investment Risks
Market risk may affect a single issuer, sector of the economy, industry or the market as a whole. International investing involves certain risks and volatility due to potential political, economic or currency instabilities and different financial and accounting standards. Risks are enhanced for emerging market issuers. Concentration in the Asia Pacific region, where issuers tend to be less developed than U.S. issuers, presents increased risk of loss than a fund that does not concentrate its investments. Investments in small- and mid-cap companies involve risks and volatility greater than investments in larger, more established companies. The Fund may invest significantly in issuers within a particular sector that may be negatively affected by similar market or other conditions, making the Fund more vulnerable to unfavorable developments in the sector. Investing in derivatives is a specialized activity that involves special risks that subject the Fund to significant loss potential, including when used as leverage, and may result in greater fluctuation in Fund value. See the Fund's prospectus for more information on these and other risks.
when we had a high conviction on the outlook for particular currencies. For example, we used currency contracts in 2015 to reduce exposure to the Japanese yen in light of Japan's new economic policies, while we overweighted U.S. dollars. This strategy had a slightly positive impact on results.
The Fund's Disciplined Approach
We believe that our actively managed, bottom-up/top-down approach added value during the 12-month period covered by this report. We emphasized companies which we believed to have the ability to control their own destinies over those whose fortunes are largely dependent on broader economic trends. We also looked for companies with robust returns on capital, good balance sheets, and rising market share and that operate in industries with high barriers to entry. We plan to maintain that disciplined approach, which we believe has served the Fund well over the long term.
Annual Report 2016
6
COLUMBIA PACIFIC/ASIA FUND
UNDERSTANDING YOUR FUND'S EXPENSES
(Unaudited)
As an investor, you incur two types of costs. There are transaction costs, which generally include sales charges on purchases and may include redemption fees. There are also ongoing costs, which generally include management fees, distribution and/or service fees, and other fund expenses. The following information is intended to help you understand your ongoing costs (in dollars) of investing in the Fund and to help you compare these costs with the ongoing costs of investing in other mutual funds.
Analyzing Your Fund's Expenses
To illustrate these ongoing costs, we have provided examples and calculated the expenses paid by investors in each share class of the Fund during the period. The actual and hypothetical information in the table is based on an initial investment of $1,000 at the beginning of the period indicated and held for the entire period. Expense information is calculated two ways and each method provides you with different information. The amount listed in the "Actual" column is calculated using the Fund's actual operating expenses and total return for the period. You may use the Actual information, together with the amount invested, to estimate the expenses that you paid over the period. Simply divide your account value by $1,000 (for example, an $8,600 account value divided by $1,000 = 8.6), then multiply the results by the expenses paid during the period under the "Actual" column. The amount listed in the "Hypothetical" column assumes a 5% annual rate of return before expenses (which is not the Fund's actual return) and then applies the Fund's actual expense ratio for the period to the hypothetical return. You should not use the hypothetical account values and expenses to estimate either your actual account balance at the end of the period or the expenses you paid during the period. See "Compare With Other Funds" below for details on how to use the hypothetical data.
Compare With Other Funds
Since all mutual funds are required to include the same hypothetical calculations about expenses in shareholder reports, you can use this information to compare the ongoing cost of investing in the Fund with other funds. To do so, compare the hypothetical example with the 5% hypothetical examples that appear in the shareholder reports of other funds. As you compare hypothetical examples of other funds, it is important to note that hypothetical examples are meant to highlight the ongoing costs of investing in a fund only and do not reflect any transaction costs, such as sales charges, or redemption or exchange fees. Therefore, the hypothetical calculations are useful in comparing ongoing costs only, and will not help you determine the relative total costs of owning different funds. If transaction costs were included in these calculations, your costs would be higher.
October 1, 2015 – March 31, 2016
| | | Account Value at the Beginning
of the Period ($) | | Account Value at the End of the
Period ($) | | Expenses Paid During the
Period ($) | | Fund's Annualized
Expense Ratio (%) | |
| | | Actual | | Hypothetical | | Actual | | Hypothetical | | Actual | | Hypothetical | | Actual | |
Class A | | | 1,000.00 | | | | 1,000.00 | | | | 1,064.60 | | | | 1,017.35 | | | | 7.90 | | | | 7.72 | | | | 1.53 | | |
Class C | | | 1,000.00 | | | | 1,000.00 | | | | 1,060.30 | | | | 1,013.60 | | | | 11.74 | | | | 11.48 | | | | 2.28 | | |
Class I | | | 1,000.00 | | | | 1,000.00 | | | | 1,065.80 | | | | 1,019.65 | | | | 5.53 | | | | 5.40 | | | | 1.07 | | |
Class R4 | | | 1,000.00 | | | | 1,000.00 | | | | 1,065.20 | | | | 1,018.80 | | | | 6.40 | | | | 6.26 | | | | 1.24 | | |
Class W | | | 1,000.00 | | | | 1,000.00 | | | | 1,063.80 | | | | 1,017.40 | | | | 7.84 | | | | 7.67 | | | | 1.52 | | |
Class Z | | | 1,000.00 | | | | 1,000.00 | | | | 1,065.30 | | | | 1,018.60 | | | | 6.61 | | | | 6.46 | | | | 1.28 | | |
Expenses paid during the period are equal to the annualized expense ratio for each class as indicated above, multiplied by the average account value over the period and then multiplied by the number of days in the Fund's most recent fiscal half year and divided by 366.
Expenses do not include fees and expenses incurred indirectly by the Fund from its investment in underlying funds, including affiliated and non-affiliated pooled investment vehicles, such as mutual funds and exchange-traded funds.
Annual Report 2016
7
COLUMBIA PACIFIC/ASIA FUND
PORTFOLIO OF INVESTMENTS
March 31, 2016
(Percentages represent value of investments compared to net assets)
Common Stocks 94.9%
Issuer | | Shares | | Value ($) | |
AUSTRALIA 9.7% | |
Amcor Ltd. | | | 265,277 | | | | 2,913,025 | | |
AMP Ltd. | | | 260,014 | | | | 1,152,530 | | |
Commonwealth Bank of Australia | | | 83,310 | | | | 4,776,087 | | |
CSL Ltd. | | | 42,705 | | | | 3,318,668 | | |
Macquarie Group Ltd. | | | 32,513 | | | | 1,645,619 | | |
Telstra Corp., Ltd. | | | 770,105 | | | | 3,142,780 | | |
Transurban Group | | | 140,435 | | | | 1,219,882 | | |
Westpac Banking Corp. | | | 112,730 | | | | 2,618,390 | | |
Woodside Petroleum Ltd. | | | 95,534 | | | | 1,911,043 | | |
Total | | | | | 22,698,024 | | |
CHINA 12.9% | |
Alibaba Group Holding Ltd., ADR(a) | | | 46,682 | | | | 3,689,279 | | |
China Biologic Products, Inc.(a) | | | 16,397 | | | | 1,877,129 | | |
China Mobile Ltd. | | | 526,500 | | | | 5,830,971 | | |
Chongqing Changan Automobile
Co., Ltd., Class B | | | 357,800 | | | | 668,997 | | |
CNOOC Ltd. | | | 1,555,000 | | | | 1,814,756 | | |
CSPC Pharmaceutical Group Ltd. | | | 1,302,000 | | | | 1,178,512 | | |
Guangdong Investment Ltd. | | | 1,694,000 | | | | 2,142,006 | | |
Luthai Textile Co., Ltd., Class B | | | 1,126,271 | | | | 1,495,037 | | |
New Oriental Education & Technology
Group, Inc., ADR | | | 63,187 | | | | 2,185,638 | | |
Ping An Insurance Group Co. of
China Ltd., Class H | | | 497,000 | | | | 2,384,993 | | |
Tencent Holdings Ltd. | | | 338,100 | | | | 6,912,241 | | |
Total | | | | | 30,179,559 | | |
HONG KONG 3.1% | |
AIA Group Ltd. | | | 650,800 | | | | 3,699,163 | | |
CK Hutchison Holdings Ltd. | | | 270,548 | | | | 3,514,971 | | |
Total | | | | | 7,214,134 | | |
INDIA 6.9% | |
Asian Paints Ltd. | | | 128,671 | | | | 1,687,027 | | |
Eicher Motors Ltd. | | | 9,659 | | | | 2,796,717 | | |
HCL Technologies Ltd. | | | 185,701 | | | | 2,282,349 | | |
HDFC Bank Ltd., ADR | | | 61,922 | | | | 3,816,253 | | |
InterGlobe Aviation Ltd.(a) | | | 117,069 | | | | 1,546,158 | | |
Motherson Sumi Systems Ltd. | | | 309,990 | | | | 1,247,434 | | |
Syngene International Ltd. | | | 143,408 | | | | 834,080 | | |
Common Stocks (continued)
Issuer | | Shares | | Value ($) | |
UPL Ltd. | | | 246,224 | | | | 1,776,497 | | |
Total | | | | | 15,986,515 | | |
INDONESIA 2.6% | |
PT Bank Rakyat Indonesia Persero Tbk | | | 2,729,900 | | | | 2,349,203 | | |
PT Matahari Department Store Tbk | | | 1,756,000 | | | | 2,429,893 | | |
PT Telekomunikasi Indonesia
Persero Tbk, ADR | | | 22,746 | | | | 1,156,634 | | |
Total | | | | | 5,935,730 | | |
JAPAN 45.3% | |
Ai Holdings Corp. | | | 42,400 | | | | 1,228,491 | | |
Aozora Bank Ltd. | | | 799,000 | | | | 2,788,878 | | |
Asahi Intecc Co., Ltd. | | | 52,600 | | | | 2,461,189 | | |
Astellas Pharma, Inc. | | | 144,300 | | | | 1,917,676 | | |
Central Japan Railway Co. | | | 16,800 | | | | 2,971,104 | | |
CYBERDYNE, Inc.(a) | | | 102,100 | | | | 1,949,837 | | |
Daicel Corp. | | | 133,100 | | | | 1,814,341 | | |
Daiichikosho Co., Ltd. | | | 79,300 | | | | 3,451,358 | | |
Fuji Heavy Industries Ltd. | | | 114,600 | | | | 4,046,897 | | |
Hoshizaki Electric Co., Ltd. | | | 21,500 | | | | 1,793,331 | | |
Hoya Corp. | | | 101,600 | | | | 3,861,880 | | |
Invincible Investment Corp. | | | 3,085 | | | | 2,308,959 | | |
ITOCHU Corp. | | | 329,100 | | | | 4,044,256 | | |
KDDI Corp. | | | 185,200 | | | | 4,941,280 | | |
Keyence Corp. | | | 7,700 | | | | 4,199,366 | | |
LaSalle Logiport REIT(a) | | | 2,114 | | | | 2,041,777 | | |
M3, Inc. | | | 86,300 | | | | 2,170,340 | | |
Mitsubishi UFJ Financial Group, Inc. | | | 257,600 | | | | 1,193,617 | | |
MonotaRO Co., Ltd | | | 66,700 | | | | 1,982,696 | | |
Murata Manufacturing Co., Ltd. | | | 8,600 | | | | 1,037,735 | | |
Nihon M&A Center, Inc. | | | 62,400 | | | | 3,622,320 | | |
Nihon Trim Co., Ltd. | | | 55,800 | | | | 2,585,966 | | |
Nippon Telegraph & Telephone Corp. | | | 105,500 | | | | 4,557,337 | | |
ORIX Corp. | | | 259,190 | | | | 3,691,698 | | |
PeptiDream, Inc.(a) | | | 54,900 | | | | 3,335,875 | | |
Raito Kogyo Co., Ltd. | | | 279,700 | | | | 2,578,747 | | |
Relo Holdings, Inc. | | | 28,500 | | | | 3,808,978 | | |
San-A Co., Ltd. | | | 69,400 | | | | 3,277,647 | | |
Seiren Co., Ltd. | | | 163,800 | | | | 1,838,071 | | |
Shimano, Inc. | | | 18,500 | | | | 2,901,297 | | |
The accompanying Notes to Financial Statements are an integral part of this statement.
Annual Report 2016
8
COLUMBIA PACIFIC/ASIA FUND
PORTFOLIO OF INVESTMENTS (continued)
March 31, 2016
Common Stocks (continued)
Issuer | | Shares | | Value ($) | |
Shinmaywa Industries Ltd. | | | 100,000 | | | | 708,662 | | |
Sony Corp. | | | 44,800 | | | | 1,151,859 | | |
Starts Corp., Inc. | | | 84,900 | | | | 1,885,458 | | |
Sumitomo Mitsui Financial Group, Inc. | | | 28,400 | | | | 862,158 | | |
Sysmex Corp. | | | 41,300 | | | | 2,581,907 | | |
Takuma Co., Ltd. | | | 280,000 | | | | 2,506,568 | | |
Tanseisha Co., Ltd. | | | 233,050 | | | | 1,764,772 | | |
Toyota Motor Corp. | | | 77,300 | | | | 4,099,637 | | |
Trancom Co., Ltd. | | | 41,400 | | | | 2,421,162 | | |
Tsuruha Holdings, Inc. | | | 34,300 | | | | 3,373,548 | | |
Total | | | | | 105,758,675 | | |
PHILIPPINES 2.3% | |
GT Capital Holdings, Inc. | | | 116,255 | | | | 3,506,484 | | |
Security Bank Corp. | | | 501,370 | | | | 1,904,966 | | |
Total | | | | | 5,411,450 | | |
SINGAPORE 2.4% | |
DBS Group Holdings Ltd. | | | 338,900 | | | | 3,860,740 | | |
Mapletree Commercial Trust | | | 1,749,000 | | | | 1,831,344 | | |
Total | | | | | 5,692,084 | | |
SOUTH KOREA 3.8% | |
Lotte Chemical Corp. | | | 10,089 | | | | 3,017,320 | | |
Samsung Electronics Co., Ltd. | | | 5,103 | | | | 5,856,239 | | |
Total | | | | | 8,873,559 | | |
TAIWAN 4.3% | |
Eclat Textile Co., Ltd. | | | 79,793 | | | | 1,051,312 | | |
St. Shine Optical Co., Ltd. | | | 59,318 | | | | 1,209,492 | | |
Taiwan Semiconductor Manufacturing
Co., Ltd., ADR | | | 293,914 | | | | 7,700,547 | | |
Total | | | | | 9,961,351 | | |
Common Stocks (continued)
Issuer | | Shares | | Value ($) | |
THAILAND 0.8% | |
Kasikornbank PCL, Foreign
Registered Shares | | | 373,400 | | | | 1,857,019 | | |
UNITED KINGDOM 0.8% | |
Rio Tinto PLC, ADR | | | 66,074 | | | | 1,867,912 | | |
Total Common Stocks
(Cost: $177,301,732) | | | | | 221,436,012 | | |
Preferred Stocks 1.2%
SOUTH KOREA 1.2% | |
LG Chem Ltd. | | | 14,049 | | | | 2,798,167 | | |
Total Preferred Stocks
(Cost: $2,526,339) | | | | | 2,798,167 | | |
Exchange-Traded Funds 1.1%
| | | Shares | | Value ($) | |
iShares MSCI Pacific ex-Japan ETF | | | 68,239 | | | | 2,676,334 | | |
Total Exchange-Traded Funds
(Cost: $2,704,615) | | | | | 2,676,334 | | |
Money Market Funds 2.6%
Columbia Short-Term Cash Fund,
0.420%(b)(c) | | | 6,152,609 | | | | 6,152,609 | | |
Total Money Market Funds
(Cost: $6,152,609) | | | | | 6,152,609 | | |
Total Investments
(Cost: $188,685,295) | | | | | 233,063,122 | | |
Other Assets & Liabilities, Net | | | | | 372,448 | | |
Net Assets | | | | | 233,435,570 | | |
The accompanying Notes to Financial Statements are an integral part of this statement.
Annual Report 2016
9
COLUMBIA PACIFIC/ASIA FUND
PORTFOLIO OF INVESTMENTS (continued)
March 31, 2016
Investments in Derivatives
Forward Foreign Currency Exchange Contracts Open at March 31, 2016
Counterparty | | Exchange Date | | Currency to
be Delivered | |
| | Currency to
be Received | |
| | Unrealized
Appreciation ($) | | Unrealized
Depreciation ($) | |
Morgan Stanley | | 4/20/2016 | | | 6,045,000 | | | CNY | | | | | 925,019 | | | USD | | | | | — | | | | (9,374 | ) | |
Morgan Stanley | | 4/20/2016 | | | 9,249,431,000 | | | IDR | | | | | 691,458 | | | USD | | | | | — | | | | (8,270 | ) | |
Morgan Stanley | | 4/20/2016 | | | 308,954,000 | | | INR | | | | | 4,485,086 | | | USD | | | | | — | | | | (168,807 | ) | |
Morgan Stanley | | 4/20/2016 | | | 181,663,000 | | | JPY | | | | | 1,630,683 | | | USD | | | | | 15,755 | | | | — | | |
Morgan Stanley | | 4/20/2016 | | | 870,036,000 | | | JPY | | | | | 7,683,373 | | | USD | | | | | — | | | | (50,978 | ) | |
Morgan Stanley | | 4/20/2016 | | | 69,913,000 | | | PHP | | | | | 1,504,491 | | | USD | | | | | — | | | | (14,136 | ) | |
Morgan Stanley | | 4/20/2016 | | | 3,508,783 | | | USD | | | | | 4,702,000 | | | AUD | | | | | 92,877 | | | | — | | |
Morgan Stanley | | 4/20/2016 | | | 6,945,055 | | | USD | | | | | 8,368,195,000 | | | KRW | | | | | 362,663 | | | | — | | |
Morgan Stanley | | 4/20/2016 | | | 3,327,619 | | | USD | | | | | 13,492,000 | | | MYR | | | | | 142,193 | | | | — | | |
Morgan Stanley | | 4/20/2016 | | | 3,107,040 | | | USD | | | | | 100,978,000 | | | TWD | | | | | 32,773 | | | | — | | |
Total | | | | | | | | | | | | | 646,261 | | | | (251,565 | ) | |
Notes to Portfolio of Investments
(a) Non-income producing investment.
(b) The rate shown is the seven-day current annualized yield at March 31, 2016.
(c) As defined in the Investment Company Act of 1940, an affiliated company is one in which the Fund owns 5% or more of the company's outstanding voting securities, or a company which is under common ownership or control with the Fund. Holdings and transactions in these affiliated companies during the year ended March 31, 2016 are as follows:
Issuer | | Beginning
Cost ($) | | Purchase
Cost ($) | | Proceeds
From Sales ($) | | Ending
Cost ($) | | Dividends —
Affiliated
Issuers ($) | | Value ($) | |
Columbia Short-Term Cash Fund | | | 943,243 | | | | 130,140,950 | | | | (124,931,584 | ) | | | 6,152,609 | | | | 15,437 | | | | 6,152,609 | | |
Abbreviation Legend
ADR American Depositary Receipt
Currency Legend
AUD Australian Dollar
CNY China, Yuan Renminbi
IDR Indonesian Rupiah
INR Indian Rupee
JPY Japanese Yen
KRW Korean Won
MYR Malaysia Ringgits
PHP Philippine Peso
TWD Taiwan Dollar
USD US Dollar
The accompanying Notes to Financial Statements are an integral part of this statement.
Annual Report 2016
10
COLUMBIA PACIFIC/ASIA FUND
PORTFOLIO OF INVESTMENTS (continued)
March 31, 2016
Fair Value Measurements
The Fund categorizes its fair value measurements according to a three-level hierarchy that maximizes the use of observable inputs and minimizes the use of unobservable inputs by prioritizing that the most observable input be used when available. Observable inputs are those that market participants would use in pricing an investment based on market data obtained from sources independent of the reporting entity. Unobservable inputs are those that reflect the Fund's assumptions about the information market participants would use in pricing an investment. An investment's level within the fair value hierarchy is based on the lowest level of any input that is deemed significant to the asset's or liability's fair value measurement. The input levels are not necessarily an indication of the risk or liquidity associated with investments at that level. For example, certain U.S. government securities are generally high quality and liquid, however, they are reflected as Level 2 because the inputs used to determine fair value may not always be quoted prices in an active market.
Fair value inputs are summarized in the three broad levels listed below:
> Level 1 — Valuations based on quoted prices for investments in active markets that the Fund has the ability to access at the measurement date (including NAV for open-end mutual funds). Valuation adjustments are not applied to Level 1 investments.
> Level 2 — Valuations based on other significant observable inputs (including quoted prices for similar securities, interest rates, prepayment speeds, credit risks, etc.).
> Level 3 — Valuations based on significant unobservable inputs (including the Fund's own assumptions and judgment in determining the fair value of investments).
Inputs that are used in determining fair value of an investment may include price information, credit data, volatility statistics, and other factors. These inputs can be either observable or unobservable. The availability of observable inputs can vary between investments, and is affected by various factors such as the type of investment, and the volume and level of activity for that investment or similar investments in the marketplace. The inputs will be considered by the Investment Manager, along with any other relevant factors in the calculation of an investment's fair value. The Fund uses prices and inputs that are current as of the measurement date, which may include periods of market dislocations. During these periods, the availability of prices and inputs may be reduced for many investments. This condition could cause an investment to be reclassified between the various levels within the hierarchy.
Foreign equity securities actively traded in markets where there is a significant delay in the local close relative to the New York Stock Exchange (NYSE) are classified as Level 2. The values of these securities may include an adjustment to reflect the impact of significant market movements following the close of local trading, as described in Note 2 to the financial statements — Security Valuation.
Certain investments that have been measured at fair value using the net asset value per share (or its equivalent) are not categorized in the fair value hierarchy. The fair value amounts presented in the table are intended to reconcile the fair value hierarchy to the amounts presented in the Portfolio of Investments. The Columbia Short-Term Cash Fund seeks to provide shareholders with maximum current income consistent with liquidity and stability of principal. Investments in Columbia Short-Term Cash Fund may be redeemed on a daily basis without restriction.
Investments falling into the Level 3 category are primarily supported by quoted prices from brokers and dealers participating in the market for those investments. However, these may be classified as Level 3 investments due to lack of market transparency and corroboration to support these quoted prices. Additionally, valuation models may be used as the pricing source for any remaining investments classified as Level 3. These models may rely on one or more significant unobservable inputs and/or significant assumptions by the Investment Manager. Inputs used in valuations may include, but are not limited to, financial statement analysis, capital account balances, discount rates and estimated cash flows, and comparable company data.
Under the direction of the Fund's Board of Trustees (the Board), the Investment Manager's Valuation Committee (the Committee) is responsible for overseeing the valuation procedures approved by the Board. The Committee consists of voting and non-voting members from various groups within the Investment Manager's organization, including operations and accounting, trading and investments, compliance, risk management and legal.
The Committee meets at least monthly to review and approve valuation matters, which may include a description of specific valuation determinations, data regarding pricing information received from approved pricing vendors and brokers and the results of Board-approved valuation control policies and procedures (the Policies). The Policies address, among other things, instances when market quotations are or are not readily available, including recommendations of third party pricing vendors and a determination of appropriate pricing methodologies; events that require specific valuation determinations and assessment of fair value techniques; securities with a potential for stale pricing, including those that are illiquid, restricted, or in default; and the effectiveness of third party pricing vendors, including periodic reviews of vendors. The Committee meets more frequently, as needed, to discuss additional valuation matters, which may include the need to review back-testing results, review time-sensitive information or approve related valuation actions. The Committee reports to the Board, with members of the Committee meeting with the Board at each of its regularly scheduled meetings to discuss valuation matters and actions during the period, similar to those described earlier.
For investments categorized as Level 3, the Committee monitors information similar to that described above, which may include: (i) data specific to the issuer or comparable issuers, (ii) general market or specific sector news and (iii) quoted prices and specific or similar security transactions. The Committee considers this data and any changes from prior periods in order to assess the reasonableness of observable and unobservable inputs, any assumptions or internal models used to value those securities and changes in fair value. This data is also used to corroborate, when available, information received from approved pricing vendors and brokers. Various factors impact the frequency of monitoring this information (which may occur as often as daily). However, the Committee may determine that changes to inputs, assumptions and models are not required as a result of the monitoring procedures performed.
The accompanying Notes to Financial Statements are an integral part of this statement.
Annual Report 2016
11
COLUMBIA PACIFIC/ASIA FUND
PORTFOLIO OF INVESTMENTS (continued)
March 31, 2016
Fair Value Measurements (continued)
The following table is a summary of the inputs used to value the Fund's investments at March 31, 2016:
| | | Level 1
Quoted Prices in Active
Markets for Identical
Assets ($) | | Level 2
Other Significant
Observable Inputs ($) | | Level 3
Significant
Unobservable Inputs ($) | | Total ($) | |
Investments | |
Common Stocks | |
Australia | | | — | | | | 22,698,024 | | | | — | | | | 22,698,024 | | |
China | | | 7,752,046 | | | | 22,427,513 | | | | — | | | | 30,179,559 | | |
Hong Kong | | | — | | | | 7,214,134 | | | | — | | | | 7,214,134 | | |
India | | | 3,816,253 | | | | 12,170,262 | | | | — | | | | 15,986,515 | | |
Indonesia | | | 1,156,634 | | | | 4,779,096 | | | | — | | | | 5,935,730 | | |
Japan | | | — | | | | 105,758,675 | | | | — | | | | 105,758,675 | | |
Philippines | | | — | | | | 5,411,450 | | | | — | | | | 5,411,450 | | |
Singapore | | | — | | | | 5,692,084 | | | | — | | | | 5,692,084 | | |
South Korea | | | — | | | | 8,873,559 | | | | — | | | | 8,873,559 | | |
Taiwan | | | 7,700,547 | | | | 2,260,804 | | | | — | | | | 9,961,351 | | |
Thailand | | | — | | | | 1,857,019 | | | | — | | | | 1,857,019 | | |
United Kingdom | | | 1,867,912 | | | | — | | | | — | | | | 1,867,912 | | |
Total Common Stocks | | | 22,293,392 | | | | 199,142,620 | | | | — | | | | 221,436,012 | | |
Preferred Stocks | |
South Korea | | | — | | | | 2,798,167 | | | | — | | | | 2,798,167 | | |
Exchange-Traded Funds | | | 2,676,334 | | | | — | | | | — | | | | 2,676,334 | | |
Investments measured at NAV per share
practical expedient | |
Money Market Funds | | | — | | | | — | | | | — | | | | 6,152,609 | | |
Total Investments | | | 24,969,726 | | | | 201,940,787 | | | | — | | | | 233,063,122 | | |
Derivatives | |
Assets | |
Forward Foreign Currency Exchange Contracts | | | — | | | | 646,261 | | | | — | | | | 646,261 | | |
Liabilities | |
Forward Foreign Currency Exchange Contracts | | | — | | | | (251,565 | ) | | | — | | | | (251,565 | ) | |
Total | | | 24,969,726 | | | | 202,335,483 | | | | — | | | | 233,457,818 | | |
See the Portfolio of Investments for all investment classifications not indicated in the table.
The Fund's assets assigned to the Level 2 input category are generally valued using the market approach, in which a security's value is determined through reference to prices and information from market transactions for similar or identical assets. These assets include certain foreign securities for which a third party statistical pricing service may be employed for purposes of fair market valuation. The model utilized by such third party statistical pricing service takes into account a security's correlation to available market data including, but not limited to, intraday index, ADR, and exchange-traded fund movements.
Derivative instruments are valued at unrealized appreciation (depreciation).
There were no transfers of financial assets between levels during the period.
The accompanying Notes to Financial Statements are an integral part of this statement.
Annual Report 2016
12
COLUMBIA PACIFIC/ASIA FUND
STATEMENT OF ASSETS AND LIABILITIES
March 31, 2016
Assets | |
Investments, at value | |
Unaffiliated issuers (identified cost $182,532,686) | | $ | 226,910,513 | | |
Affiliated issuers (identified cost $6,152,609) | | | 6,152,609 | | |
Total investments (identified cost $188,685,295) | | | 233,063,122 | | |
Foreign currency (identified cost $5,316) | | | 5,346 | | |
Unrealized appreciation on forward foreign currency exchange contracts | | | 646,261 | | |
Receivable for: | |
Investments sold | | | 877,586 | | |
Capital shares sold | | | 73 | | |
Dividends | | | 1,172,483 | | |
Foreign tax reclaims | | | 63,999 | | |
Prepaid expenses | | | 777 | | |
Trustees' deferred compensation plan | | | 22,348 | | |
Total assets | | | 235,851,995 | | |
Liabilities | |
Unrealized depreciation on forward foreign currency exchange contracts | | | 251,565 | | |
Payable for: | |
Investments purchased | | | 1,855,723 | | |
Capital shares purchased | | | 204,875 | | |
Investment management fees | | | 6,161 | | |
Distribution and/or service fees | | | 52 | | |
Transfer agent fees | | | 14,707 | | |
Compensation of board members | | | 244 | | |
Chief compliance officer expenses | | | 30 | | |
Other expenses | | | 50,280 | | |
Trustees' deferred compensation plan | | | 22,348 | | |
Other liabilities | | | 10,440 | | |
Total liabilities | | | 2,416,425 | | |
Net assets applicable to outstanding capital stock | | $ | 233,435,570 | | |
Represented by | |
Paid-in capital | | $ | 195,513,836 | | |
Excess of distributions over net investment income | | | (1,821,221 | ) | |
Accumulated net realized loss | | | (5,036,923 | ) | |
Unrealized appreciation (depreciation) on: | |
Investments | | | 44,377,827 | | |
Foreign currency translations | | | 7,355 | | |
Forward foreign currency exchange contracts | | | 394,696 | | |
Total — representing net assets applicable to outstanding capital stock | | $ | 233,435,570 | | |
The accompanying Notes to Financial Statements are an integral part of this statement.
Annual Report 2016
13
COLUMBIA PACIFIC/ASIA FUND
STATEMENT OF ASSETS AND LIABILITIES (continued)
March 31, 2016
Class A | |
Net assets | | $ | 3,189,932 | | |
Shares outstanding | | | 344,550 | | |
Net asset value per share | | $ | 9.26 | | |
Maximum offering price per share(a) | | $ | 9.82 | | |
Class C | |
Net assets | | $ | 1,079,997 | | |
Shares outstanding | | | 118,003 | | |
Net asset value per share | | $ | 9.15 | | |
Class I | |
Net assets | | $ | 145,463,693 | | |
Shares outstanding | | | 15,659,130 | | |
Net asset value per share | | $ | 9.29 | | |
Class R4 | |
Net assets | | $ | 3,729 | | |
Shares outstanding | | | 401 | | |
Net asset value per share(b) | | $ | 9.31 | | |
Class W | |
Net assets | | $ | 2,551 | | |
Shares outstanding | | | 276 | | |
Net asset value per share(b) | | $ | 9.25 | | |
Class Z | |
Net assets | | $ | 83,695,668 | | |
Shares outstanding | | | 9,003,850 | | |
Net asset value per share | | $ | 9.30 | | |
(a) The maximum offering price per share is calculated by dividing the net asset value per share by 1.0 minus the maximum sales charge of 5.75%.
(b) Net asset value per share rounds to this amount due to fractional shares outstanding.
The accompanying Notes to Financial Statements are an integral part of this statement.
Annual Report 2016
14
COLUMBIA PACIFIC/ASIA FUND
STATEMENT OF OPERATIONS
Year Ended March 31, 2016
Net investment income | |
Income: | |
Dividends — unaffiliated issuers | | $ | 5,426,829 | | |
Dividends — affiliated issuers | | | 15,437 | | |
Foreign taxes withheld | | | (414,636 | ) | |
Total income | | | 5,027,630 | | |
Expenses: | |
Investment management fees | | | 2,310,586 | | |
Distribution and/or service fees | |
Class A | | | 8,663 | | |
Class C | | | 10,488 | | |
Class W | | | 6 | | |
Transfer agent fees | |
Class A | | | 7,062 | | |
Class C | | | 2,135 | | |
Class R4 | | | 28 | | |
Class W | | | 4 | | |
Class Z | | | 171,917 | | |
Compensation of board members | | | 18,690 | | |
Custodian fees | | | 76,764 | | |
Printing and postage fees | | | 25,104 | | |
Registration fees | | | 77,306 | | |
Audit fees | | | 48,256 | | |
Legal fees | | | 8,483 | | |
Chief compliance officer expenses | | | 123 | | |
Other | | | 15,999 | | |
Total expenses | | | 2,781,614 | | |
Expense reductions | | | (360 | ) | |
Total net expenses | | | 2,781,254 | | |
Net investment income | | | 2,246,376 | | |
Realized and unrealized gain (loss) — net | |
Net realized gain (loss) on: | |
Investments | | | 6,482,622 | | |
Foreign currency translations | | | (171,106 | ) | |
Forward foreign currency exchange contracts | | | (2,013,510 | ) | |
Net realized gain | | | 4,298,006 | | |
Net change in unrealized appreciation (depreciation) on: | |
Investments | | | (22,654,280 | ) | |
Foreign currency translations | | | 16,377 | | |
Forward foreign currency exchange contracts | | | 579,897 | | |
Net change in unrealized depreciation | | | (22,058,006 | ) | |
Net realized and unrealized loss | | | (17,760,000 | ) | |
Net decrease in net assets from operations | | $ | (15,513,624 | ) | |
The accompanying Notes to Financial Statements are an integral part of this statement.
Annual Report 2016
15
COLUMBIA PACIFIC/ASIA FUND
STATEMENT OF CHANGES IN NET ASSETS
| | | Year Ended
March 31,
2016 | | Year Ended
March 31,
2015 | |
Operations | |
Net investment income | | $ | 2,246,376 | | | $ | 3,753,719 | | |
Net realized gain | | | 4,298,006 | | | | 11,520,263 | | |
Net change in unrealized appreciation (depreciation) | | | (22,058,006 | ) | | | 17,599,383 | | |
Net increase (decrease) in net assets resulting from operations | | | (15,513,624 | ) | | | 32,873,365 | | |
Distributions to shareholders | |
Net investment income | |
Class A | | | (17,683 | ) | | | (15,790 | ) | |
Class C | | | (496 | ) | | | (1,281 | ) | |
Class I | | | (1,456,581 | ) | | | (2,495,808 | ) | |
Class R4 | | | (68 | ) | | | (178 | ) | |
Class W | | | (13 | ) | | | (23 | ) | |
Class Z | | | (622,706 | ) | | | (916,575 | ) | |
Net realized gains | |
Class A | | | (11,724 | ) | | | — | | |
Class C | | | (2,965 | ) | | | — | | |
Class I | | | (455,514 | ) | | | — | | |
Class R4 | | | (49 | ) | | | — | | |
Class W | | | (7 | ) | | | — | | |
Class Z | | | (229,248 | ) | | | — | | |
Total distributions to shareholders | | | (2,797,054 | ) | | | (3,429,655 | ) | |
Decrease in net assets from capital stock activity | | | (8,860,660 | ) | | | (39,789,913 | ) | |
Total decrease in net assets | | | (27,171,338 | ) | | | (10,346,203 | ) | |
Net assets at beginning of year | | | 260,606,908 | | | | 270,953,111 | | |
Net assets at end of year | | $ | 233,435,570 | | | $ | 260,606,908 | | |
Excess of distributions over net investment income | | $ | (1,821,221 | ) | | $ | (1,593,030 | ) | |
The accompanying Notes to Financial Statements are an integral part of this statement.
Annual Report 2016
16
COLUMBIA PACIFIC/ASIA FUND
STATEMENT OF CHANGES IN NET ASSETS (continued)
| | | Year Ended March 31, 2016 | | Year Ended March 31, 2015 | |
| | | Shares | | Dollars ($) | | Shares | | Dollars ($) | |
Capital stock activity | |
Class A shares | |
Subscriptions | | | 517,511 | | | | 5,072,731 | | | | 350,646 | | | | 3,326,346 | | |
Distributions reinvested | | | 2,626 | | | | 25,750 | | | | 1,772 | | | | 15,790 | | |
Redemptions | | | (427,419 | ) | | | (4,061,710 | ) | | | (307,679 | ) | | | (2,918,278 | ) | |
Net increase | | | 92,718 | | | | 1,036,771 | | | | 44,739 | | | | 423,858 | | |
Class C shares | |
Subscriptions | | | 104,270 | | | | 1,032,037 | | | | 13,286 | | | | 123,405 | | |
Distributions reinvested | | | 345 | | | | 3,461 | | | | 145 | | | | 1,281 | | |
Redemptions | | | (24,086 | ) | | | (218,070 | ) | | | (38,563 | ) | | | (362,350 | ) | |
Net increase (decrease) | | | 80,529 | | | | 817,428 | | | | (25,132 | ) | | | (237,664 | ) | |
Class I shares | |
Subscriptions | | | 204,238 | | | | 1,886,039 | | | | 471,328 | | | | 4,344,150 | | |
Distributions reinvested | | | 197,736 | | | | 1,912,063 | | | | 278,557 | | | | 2,495,774 | | |
Redemptions | | | (2,786,924 | ) | | | (27,227,591 | ) | | | (4,329,372 | ) | | | (41,302,736 | ) | |
Net decrease | | | (2,384,950 | ) | | | (23,429,489 | ) | | | (3,579,487 | ) | | | (34,462,812 | ) | |
Class R4 shares | |
Subscriptions | | | — | | | | — | | | | 3,018 | | | | 28,580 | | |
Distributions reinvested | | | 9 | | | | 91 | | | | 17 | | | | 150 | | |
Redemptions | | | (2,129 | ) | | | (20,578 | ) | | | (798 | ) | | | (7,790 | ) | |
Net increase (decrease) | | | (2,120 | ) | | | (20,487 | ) | | | 2,237 | | | | 20,940 | | |
Class W shares | |
Redemptions | | | — | | | | — | | | | (55 | ) | | | (500 | ) | |
Net decrease | | | — | | | | — | | | | (55 | ) | | | (500 | ) | |
Class Z shares | |
Subscriptions | | | 5,056,775 | | | | 47,581,521 | | | | 2,786,665 | | | | 26,300,397 | | |
Distributions reinvested | | | 43,751 | | | | 427,144 | | | | 71,036 | | | | 636,281 | | |
Redemptions | | | (3,956,840 | ) | | | (35,273,548 | ) | | | (3,382,900 | ) | | | (32,470,413 | ) | |
Net increase (decrease) | | | 1,143,686 | | | | 12,735,117 | | | | (525,199 | ) | | | (5,533,735 | ) | |
Total net decrease | | | (1,070,137 | ) | | | (8,860,660 | ) | | | (4,082,897 | ) | | | (39,789,913 | ) | |
The accompanying Notes to Financial Statements are an integral part of this statement.
Annual Report 2016
17
COLUMBIA PACIFIC/ASIA FUND
The following tables are intended to help you understand the Fund's financial performance. Certain information reflects financial results for a single share of a class held for the periods shown. Per share net investment income (loss) amounts are calculated based on average shares outstanding during the period. Total return assumes reinvestment of all dividends and distributions, if any. Total return does not reflect payment of sales charges, if any. Total return and portfolio turnover are not annualized for periods of less than one year. The portfolio turnover rate is calculated without regard to purchase and sales transactions of short-term instruments and certain derivatives, if any. If such transactions were included, the Fund's portfolio turnover rate may be higher.
| | | Year Ended March 31, | |
Class A | | 2016 | | 2015 | | 2014 | | 2013 | | 2012 | |
Per share data | |
Net asset value, beginning of period | | $ | 9.91 | | | $ | 8.92 | | | $ | 8.93 | | | $ | 8.09 | | | $ | 8.56 | | |
Income from investment operations: | |
Net investment income | | | 0.06 | | | | 0.10 | | | | 0.11 | | | | 0.13 | | | | 0.13 | | |
Net realized and unrealized gain (loss) | | | (0.64 | ) | | | 0.98 | | | | 0.08 | | | | 0.88 | | | | (0.50 | )(a) | |
Total from investment operations | | | (0.58 | ) | | | 1.08 | | | | 0.19 | | | | 1.01 | | | | (0.37 | ) | |
Less distributions to shareholders: | |
Net investment income | | | (0.04 | ) | | | (0.09 | ) | | | (0.20 | ) | | | (0.17 | ) | | | (0.10 | ) | |
Net realized gains | | | (0.03 | ) | | | — | | | | — | | | | — | | | | — | | |
Total distributions to shareholders | | | (0.07 | ) | | | (0.09 | ) | | | (0.20 | ) | | | (0.17 | ) | | | (0.10 | ) | |
Proceeds from regulatory settlements | | | — | | | | — | | | | — | | | | — | | | | 0.00 | (b) | |
Net asset value, end of period | | $ | 9.26 | | | $ | 9.91 | | | $ | 8.92 | | | $ | 8.93 | | | $ | 8.09 | | |
Total return | | | (5.88 | %) | | | 12.17 | % | | | 2.25 | % | | | 12.74 | % | | | (4.28 | %) | |
Ratios to average net assets(c) | |
Total gross expenses | | | 1.52 | % | | | 1.48 | % | | | 1.48 | % | | | 1.53 | % | | | 1.60 | % | |
Total net expenses(d) | | | 1.52 | %(e) | | | 1.48 | %(e) | | | 1.48 | %(e) | | | 1.52 | %(e) | | | 1.60 | %(e) | |
Net investment income | | | 0.62 | % | | | 1.03 | % | | | 1.20 | % | | | 1.56 | % | | | 1.64 | % | |
Supplemental data | |
Net assets, end of period (in thousands) | | $ | 3,190 | | | $ | 2,496 | | | $ | 1,847 | | | $ | 2,924 | | | $ | 1,675 | | |
Portfolio turnover | | | 73 | % | | | 60 | % | | | 88 | % | | | 78 | % | | | 94 | % | |
Notes to Financial Highlights
(a) Calculation of the net gain (loss) per share (both realized and unrealized) does not correlate to the aggregate realized and unrealized gain (loss) presented in the Statement of Operations due to the timing of subscriptions and redemptions of Fund shares in relation to fluctuations in the market value of the portfolio.
(b) Rounds to zero.
(c) In addition to the fees and expenses that the Fund bears directly, the Fund indirectly bears a pro rata share of the fees and expenses of any other funds in which it invests. Such indirect expenses are not included in the Fund's reported expense ratios.
(d) Total net expenses include the impact of certain fee waivers/expense reimbursements made by the Investment Manager and certain of its affiliates, if applicable.
(e) The benefits derived from expense reductions had an impact of less than 0.01%.
The accompanying Notes to Financial Statements are an integral part of this statement.
Annual Report 2016
18
COLUMBIA PACIFIC/ASIA FUND
FINANCIAL HIGHLIGHTS (continued)
| | | Year Ended March 31, | |
Class C | | 2016 | | 2015 | | 2014 | | 2013 | | 2012 | |
Per share data | |
Net asset value, beginning of period | | $ | 9.83 | | | $ | 8.86 | | | $ | 8.87 | | | $ | 8.04 | | | $ | 8.47 | | |
Income from investment operations: | |
Net investment income (loss) | | | (0.01 | ) | | | 0.03 | | | | 0.03 | | | | 0.07 | | | | 0.07 | | |
Net realized and unrealized gain (loss) | | | (0.64 | ) | | | 0.97 | | | | 0.09 | | | | 0.87 | | | | (0.49 | )(a) | |
Total from investment operations | | | (0.65 | ) | | | 1.00 | | | | 0.12 | | | | 0.94 | | | | (0.42 | ) | |
Less distributions to shareholders: | |
Net investment income | | | (0.00 | )(b) | | | (0.03 | ) | | | (0.13 | ) | | | (0.11 | ) | | | (0.01 | ) | |
Net realized gains | | | (0.03 | ) | | | — | | | | — | | | | — | | | | — | | |
Total distributions to shareholders | | | (0.03 | ) | | | (0.03 | ) | | | (0.13 | ) | | | (0.11 | ) | | | (0.01 | ) | |
Proceeds from regulatory settlements | | | — | | | | — | | | | — | | | | — | | | | 0.00 | (b) | |
Net asset value, end of period | | $ | 9.15 | | | $ | 9.83 | | | $ | 8.86 | | | $ | 8.87 | | | $ | 8.04 | | |
Total return | | | (6.64 | %) | | | 11.36 | % | | | 1.48 | % | | | 11.88 | % | | | (4.91 | %) | |
Ratios to average net assets(c) | |
Total gross expenses | | | 2.27 | % | | | 2.23 | % | | | 2.23 | % | | | 2.28 | % | | | 2.32 | % | |
Total net expenses(d) | | | 2.27 | %(e) | | | 2.23 | %(e) | | | 2.23 | %(e) | | | 2.27 | %(e) | | | 2.32 | %(e) | |
Net investment income (loss) | | | (0.13 | %) | | | 0.33 | % | | | 0.31 | % | | | 0.93 | % | | | 0.92 | % | |
Supplemental data | |
Net assets, end of period (in thousands) | | $ | 1,080 | | | $ | 368 | | | $ | 554 | | | $ | 512 | | | $ | 300 | | |
Portfolio turnover | | | 73 | % | | | 60 | % | | | 88 | % | | | 78 | % | | | 94 | % | |
Notes to Financial Highlights
(a) Calculation of the net gain (loss) per share (both realized and unrealized) does not correlate to the aggregate realized and unrealized gain (loss) presented in the Statement of Operations due to the timing of subscriptions and redemptions of Fund shares in relation to fluctuations in the market value of the portfolio.
(b) Rounds to zero.
(c) In addition to the fees and expenses that the Fund bears directly, the Fund indirectly bears a pro rata share of the fees and expenses of any other funds in which it invests. Such indirect expenses are not included in the Fund's reported expense ratios.
(d) Total net expenses include the impact of certain fee waivers/expense reimbursements made by the Investment Manager and certain of its affiliates, if applicable.
(e) The benefits derived from expense reductions had an impact of less than 0.01%.
The accompanying Notes to Financial Statements are an integral part of this statement.
Annual Report 2016
19
COLUMBIA PACIFIC/ASIA FUND
FINANCIAL HIGHLIGHTS (continued)
| | | Year Ended March 31, | |
Class I | | 2016 | | 2015 | | 2014 | | 2013 | | 2012 | |
Per share data | |
Net asset value, beginning of period | | $ | 9.95 | | | $ | 8.95 | | | $ | 8.96 | | | $ | 8.12 | | | $ | 8.61 | | |
Income from investment operations: | |
Net investment income | | | 0.09 | | | | 0.14 | | | | 0.14 | | | | 0.16 | | | | 0.16 | | |
Net realized and unrealized gain (loss) | | | (0.64 | ) | | | 0.98 | | | | 0.09 | | | | 0.89 | | | | (0.49 | )(a) | |
Total from investment operations | | | (0.55 | ) | | | 1.12 | | | | 0.23 | | | | 1.05 | | | | (0.33 | ) | |
Less distributions to shareholders: | |
Net investment income | | | (0.08 | ) | | | (0.12 | ) | | | (0.24 | ) | | | (0.21 | ) | | | (0.16 | ) | |
Net realized gains | | | (0.03 | ) | | | — | | | | — | | | | — | | | | — | | |
Total distributions to shareholders | | | (0.11 | ) | | | (0.12 | ) | | | (0.24 | ) | | | (0.21 | ) | | | (0.16 | ) | |
Proceeds from regulatory settlements | | | — | | | | — | | | | — | | | | — | | | | 0.00 | (b) | |
Net asset value, end of period | | $ | 9.29 | | | $ | 9.95 | | | $ | 8.95 | | | $ | 8.96 | | | $ | 8.12 | | |
Total return | | | (5.52 | %) | | | 12.72 | % | | | 2.70 | % | | | 13.17 | % | | | (3.83 | %) | |
Ratios to average net assets(c) | |
Total gross expenses | | | 1.06 | % | | | 1.04 | % | | | 1.05 | % | | | 1.07 | % | | | 1.17 | % | |
Total net expenses(d) | | | 1.06 | % | | | 1.04 | % | | | 1.05 | % | | | 1.07 | % | | | 1.17 | % | |
Net investment income | | | 1.00 | % | | | 1.45 | % | | | 1.49 | % | | | 1.96 | % | | | 1.99 | % | |
Supplemental data | |
Net assets, end of period (in thousands) | | $ | 145,464 | | | $ | 179,479 | | | $ | 193,467 | | | $ | 256,086 | | | $ | 259,769 | | |
Portfolio turnover | | | 73 | % | | | 60 | % | | | 88 | % | | | 78 | % | | | 94 | % | |
Notes to Financial Highlights
(a) Calculation of the net gain (loss) per share (both realized and unrealized) does not correlate to the aggregate realized and unrealized gain (loss) presented in the Statement of Operations due to the timing of subscriptions and redemptions of Fund shares in relation to fluctuations in the market value of the portfolio.
(b) Rounds to zero.
(c) In addition to the fees and expenses that the Fund bears directly, the Fund indirectly bears a pro rata share of the fees and expenses of any other funds in which it invests. Such indirect expenses are not included in the Fund's reported expense ratios.
(d) Total net expenses include the impact of certain fee waivers/expense reimbursements made by the Investment Manager and certain of its affiliates, if applicable.
The accompanying Notes to Financial Statements are an integral part of this statement.
Annual Report 2016
20
COLUMBIA PACIFIC/ASIA FUND
FINANCIAL HIGHLIGHTS (continued)
| | | Year Ended March 31, | |
Class R4 | | 2016 | | 2015 | | 2014 | | 2013(a) | |
Per share data | |
Net asset value, beginning of period | | $ | 9.96 | | | $ | 8.96 | | | $ | 8.98 | | | $ | 8.81 | | |
Income from investment operations: | |
Net investment income | | | 0.07 | | | | 0.12 | | | | 0.12 | | | | 0.03 | | |
Net realized and unrealized gain (loss) | | | (0.62 | ) | | | 0.98 | | | | 0.09 | | | | 0.14 | | |
Total from investment operations | | | (0.55 | ) | | | 1.10 | | | | 0.21 | | | | 0.17 | | |
Less distributions to shareholders: | |
Net investment income | | | (0.07 | ) | | | (0.10 | ) | | | (0.23 | ) | | | — | | |
Net realized gains | | | (0.03 | ) | | | — | | | | — | | | | — | | |
Total distributions to shareholders | | | (0.10 | ) | | | (0.10 | ) | | | (0.23 | ) | | | — | | |
Net asset value, end of period | | $ | 9.31 | | | $ | 9.96 | | | $ | 8.96 | | | $ | 8.98 | | |
Total return | | | (5.61 | %) | | | 12.42 | % | | | 2.41 | % | | | 1.93 | % | |
Ratios to average net assets(b) | |
Total gross expenses | | | 1.25 | % | | | 1.26 | % | | | 1.25 | % | | | 1.63 | %(c) | |
Total net expenses(d) | | | 1.25 | %(e) | | | 1.26 | %(e) | | | 1.25 | %(e) | | | 1.14 | %(c) | |
Net investment income | | | 0.72 | % | | | 1.28 | % | | | 1.29 | % | | | 1.61 | %(c) | |
Supplemental data | |
Net assets, end of period (in thousands) | | $ | 4 | | | $ | 25 | | | $ | 3 | | | $ | 3 | | |
Portfolio turnover | | | 73 | % | | | 60 | % | | | 88 | % | | | 78 | % | |
Notes to Financial Highlights
(a) Based on operations from March 19, 2013 (commencement of operations) through the stated period end.
(b) In addition to the fees and expenses that the Fund bears directly, the Fund indirectly bears a pro rata share of the fees and expenses of any other funds in which it invests. Such indirect expenses are not included in the Fund's reported expense ratios.
(c) Annualized.
(d) Total net expenses include the impact of certain fee waivers/expense reimbursements made by the Investment Manager and certain of its affiliates, if applicable.
(e) The benefits derived from expense reductions had an impact of less than 0.01%.
The accompanying Notes to Financial Statements are an integral part of this statement.
Annual Report 2016
21
COLUMBIA PACIFIC/ASIA FUND
FINANCIAL HIGHLIGHTS (continued)
| | | Year Ended March 31, | |
Class W | | 2016 | | 2015 | | 2014 | | 2013(a) | |
Per share data | |
Net asset value, beginning of period | | $ | 9.91 | | | $ | 8.91 | | | $ | 8.92 | | | $ | 7.55 | | |
Income from investment operations: | |
Net investment income | | | 0.05 | | | | 0.09 | | | | 0.10 | | | | 0.08 | | |
Net realized and unrealized gain (loss) | | | (0.64 | ) | | | 0.99 | | | | 0.09 | | | | 1.46 | | |
Total from investment operations | | | (0.59 | ) | | | 1.08 | | | | 0.19 | | | | 1.54 | | |
Less distributions to shareholders: | |
Net investment income | | | (0.04 | ) | | | (0.08 | ) | | | (0.20 | ) | | | (0.17 | ) | |
Net realized gains | | | (0.03 | ) | | | — | | | | — | | | | — | | |
Total distributions to shareholders | | | (0.07 | ) | | | (0.08 | ) | | | (0.20 | ) | | | (0.17 | ) | |
Net asset value, end of period | | $ | 9.25 | | | $ | 9.91 | | | $ | 8.91 | | | $ | 8.92 | | |
Total return | | | (5.96 | %) | | | 12.27 | % | | | 2.25 | % | | | 20.67 | % | |
Ratios to average net assets(b) | |
Total gross expenses | | | 1.48 | % | | | 1.50 | % | | | 1.47 | % | | | 1.54 | %(c) | |
Total net expenses(d) | | | 1.48 | %(e) | | | 1.50 | %(e) | | | 1.47 | %(e) | | | 1.54 | %(c)(e) | |
Net investment income | | | 0.58 | % | | | 1.00 | % | | | 1.07 | % | | | 1.31 | %(c) | |
Supplemental data | |
Net assets, end of period (in thousands) | | $ | 3 | | | $ | 3 | | | $ | 3 | | | $ | 3 | | |
Portfolio turnover | | | 73 | % | | | 60 | % | | | 88 | % | | | 78 | % | |
Notes to Financial Highlights
(a) Based on operations from June 18, 2012 (commencement of operations) through the stated period end.
(b) In addition to the fees and expenses that the Fund bears directly, the Fund indirectly bears a pro rata share of the fees and expenses of any other funds in which it invests. Such indirect expenses are not included in the Fund's reported expense ratios.
(c) Annualized.
(d) Total net expenses include the impact of certain fee waivers/expense reimbursements made by the Investment Manager and certain of its affiliates, if applicable.
(e) The benefits derived from expense reductions had an impact of less than 0.01%.
The accompanying Notes to Financial Statements are an integral part of this statement.
Annual Report 2016
22
COLUMBIA PACIFIC/ASIA FUND
FINANCIAL HIGHLIGHTS (continued)
| | | Year Ended March 31, | |
Class Z | | 2016 | | 2015 | | 2014 | | 2013 | | 2012 | |
Per share data | |
Net asset value, beginning of period | | $ | 9.95 | | | $ | 8.95 | | | $ | 8.96 | | | $ | 8.12 | | | $ | 8.61 | | |
Income from investment operations: | |
Net investment income | | | 0.08 | | | | 0.12 | | | | 0.11 | | | | 0.12 | | | | 0.14 | | |
Net realized and unrealized gain (loss) | | | (0.63 | ) | | | 0.99 | | | | 0.10 | | | | 0.91 | | | | (0.49 | )(a) | |
Total from investment operations | | | (0.55 | ) | | | 1.11 | | | | 0.21 | | | | 1.03 | | | | (0.35 | ) | |
Less distributions to shareholders: | |
Net investment income | | | (0.07 | ) | | | (0.11 | ) | | | (0.22 | ) | | | (0.19 | ) | | | (0.14 | ) | |
Net realized gains | | | (0.03 | ) | | | — | | | | — | | | | — | | | | — | | |
Total distributions to shareholders | | | (0.10 | ) | | | (0.11 | ) | | | (0.22 | ) | | | (0.19 | ) | | | (0.14 | ) | |
Proceeds from regulatory settlements | | | — | | | | — | | | | — | | | | — | | | | 0.00 | (b) | |
Net asset value, end of period | | $ | 9.30 | | | $ | 9.95 | | | $ | 8.95 | | | $ | 8.96 | | | $ | 8.12 | | |
Total return | | | (5.61 | %) | | | 12.51 | % | | | 2.49 | % | | | 12.97 | % | | | (4.04 | %) | |
Ratios to average net assets(c) | |
Total gross expenses | | | 1.27 | % | | | 1.23 | % | | | 1.23 | % | | | 1.28 | % | | | 1.35 | % | |
Total net expenses(d) | | | 1.27 | %(e) | | | 1.23 | %(e) | | | 1.23 | %(e) | | | 1.28 | %(e) | | | 1.35 | % | |
Net investment income | | | 0.81 | % | | | 1.28 | % | | | 1.27 | % | | | 1.47 | % | | | 1.80 | % | |
Supplemental data | |
Net assets, end of period (in thousands) | | $ | 83,696 | | | $ | 78,236 | | | $ | 75,079 | | | $ | 51,013 | | | $ | 23,363 | | |
Portfolio turnover | | | 73 | % | | | 60 | % | | | 88 | % | | | 78 | % | | | 94 | % | |
Notes to Financial Highlights
(a) Calculation of the net gain (loss) per share (both realized and unrealized) does not correlate to the aggregate realized and unrealized gain (loss) presented in the Statement of Operations due to the timing of subscriptions and redemptions of Fund shares in relation to fluctuations in the market value of the portfolio.
(b) Rounds to zero.
(c) In addition to the fees and expenses that the Fund bears directly, the Fund indirectly bears a pro rata share of the fees and expenses of any other funds in which it invests. Such indirect expenses are not included in the Fund's reported expense ratios.
(d) Total net expenses include the impact of certain fee waivers/expense reimbursements made by the Investment Manager and certain of its affiliates, if applicable.
(e) The benefits derived from expense reductions had an impact of less than 0.01%.
The accompanying Notes to Financial Statements are an integral part of this statement.
Annual Report 2016
23
COLUMBIA PACIFIC/ASIA FUND
NOTES TO FINANCIAL STATEMENTS
March 31, 2016
Note 1. Organization
Columbia Pacific/Asia Fund (the Fund), a series of Columbia Funds Series Trust I (the Trust), is a diversified fund. The Trust is registered under the Investment Company Act of 1940, as amended (the 1940 Act), as an open-end management investment company organized as a Massachusetts business trust.
Fund Shares
The Trust may issue an unlimited number of shares (without par value). The Fund offers Class A, Class C, Class I, Class R4, Class W and Class Z shares. Although all share classes generally have identical voting, dividend and liquidation rights, each share class votes separately when required by the Trust's organizational documents or by law. Different share classes pay different distribution amounts to the extent the expenses of such share classes differ, and distributions in liquidation will be proportional to the net asset value of each share class. Each share class has its own expense and sales charge structure.
Class A shares are subject to a maximum front-end sales charge of 5.75% based on the initial investment amount. Class A shares purchased without an initial sales charge in accounts aggregating $1 million to $50 million at the time of purchase are subject to a contingent deferred sales charge (CDSC) if the shares are sold within 18 months after purchase, charged as follows: 1.00% CDSC if redeemed within 12 months after purchase, and 0.50% CDSC if redeemed more than 12, but less than 18, months after purchase.
Class C shares are subject to a 1.00% CDSC on shares redeemed within 12 months after purchase.
Class I shares are not subject to sales charges and are available only to the Columbia Family of Funds.
Class R4 shares are not subject to sales charges and are generally available only to omnibus retirement plans and certain investors as described in the Fund's prospectus.
Class W shares are not subject to sales charges and are available only to investors purchasing through authorized investment programs managed by investment professionals, including discretionary managed account programs.
Class Z shares are not subject to sales charges and are available only to eligible investors, which are subject to different investment minimums as described in the Fund's prospectus.
Note 2. Summary of Significant Accounting Policies
Basis of Preparation
The Fund is an investment company that applies the accounting and reporting guidance in the Financial Accounting Standards Board (FASB) Accounting Standards Codification Topic 946, Financial Services — Investment Companies (ASC 946). The financial statements are prepared in accordance with U.S. generally accepted accounting principles (GAAP), which requires management to make certain estimates and assumptions that affect the reported amounts of assets and liabilities, the disclosure of contingent assets and liabilities at the date of the financial statements and the reported amounts of income and expenses during the reporting period. Actual results could differ from those estimates.
The following is a summary of significant accounting policies followed by the Fund in the preparation of its financial statements.
Security Valuation
All equity securities and exchange-traded funds are valued at the close of business of the New York Stock Exchange (NYSE). Equity securities and exchange-traded funds are valued at the last quoted sales price on the principal exchange or market on which they trade, except for securities traded on the NASDAQ Stock Market, which are valued at the NASDAQ official close price. Unlisted securities or listed securities for which there were no sales during the day are valued at the mean of the latest quoted bid and ask prices on such exchanges or markets.
Foreign equity securities are valued based on the closing price on the foreign exchange in which such securities are primarily traded. If any foreign equity security closing prices are not readily available, the securities are valued at the mean of the latest quoted bid and ask prices on such exchanges or markets. Foreign currency exchange rates are generally determined at 4:00 p.m. Eastern (U.S.) time. Many securities markets and exchanges outside the U.S. close prior to the close of the NYSE; therefore, the closing prices for securities in such markets or on such exchanges may not fully reflect events that occur after such close but before the close of the NYSE. In those situations, foreign securities will be fair valued pursuant to a policy adopted by the Board of Trustees (the Board), including, if available, utilizing a third party pricing service to determine these fair values. The third party pricing service takes into account multiple
Annual Report 2016
24
COLUMBIA PACIFIC/ASIA FUND
NOTES TO FINANCIAL STATEMENTS (continued)
March 31, 2016
factors, including, but not limited to, movements in the U.S. securities markets, certain depositary receipts, futures contracts and foreign exchange rates that have occurred subsequent to the close of the foreign exchange or market, to determine a good faith estimate that reasonably reflects the current market conditions as of the close of the NYSE. The fair value of a security is likely to be different from the quoted or published price, if available.
Investments in open-end investment companies, including money market funds, are valued at their latest net asset value.
Forward foreign currency exchange contracts are marked-to-market based upon foreign currency exchange rates provided by a pricing service.
Investments for which market quotations are not readily available, or that have quotations which management believes are not reflective of market value or reliable, are valued at fair value as determined in good faith under procedures approved by and under the general supervision of the Board. If a security or class of securities (such as foreign securities) is valued at fair value, such value is likely to be different from the quoted or published price for the security.
The determination of fair value often requires significant judgment. To determine fair value, management may use assumptions including but not limited to future cash flows and estimated risk premiums. Multiple inputs from various sources may be used to determine fair value.
GAAP requires disclosure regarding the inputs and valuation techniques used to measure fair value and any changes in valuation inputs or techniques. In addition, investments shall be disclosed by major category. This information is disclosed following the Fund's Portfolio of Investments.
Foreign Currency Transactions and Translations
The values of all assets and liabilities denominated in foreign currencies are generally translated into U.S. dollars at exchange rates determined at the close of the NYSE on any given day. Net realized and unrealized gains (losses) on foreign currency transactions and translations include gains (losses) arising from the fluctuation in exchange rates between trade and settlement dates on securities transactions, gains (losses) arising from the disposition of foreign currency and currency gains (losses) between the accrual and payment dates on dividends, interest income and foreign withholding taxes.
For financial statement purposes, the Fund does not distinguish that portion of gains (losses) on investments which is due to changes in foreign exchange rates from that which is due to changes in market prices of the investments. Such fluctuations are included with the net realized and unrealized gains (losses) on investments in the Statement of Operations.
Derivative Instruments
The Fund invests in certain derivative instruments, as detailed below, to meet its investment objectives. Derivatives are instruments whose values depend on, or are derived from, in whole or in part, the value of one or more securities, currencies, commodities, indices, or other assets or instruments. Derivatives may be used to increase investment flexibility (including to maintain cash reserves while maintaining desired exposure to certain assets), for risk management (hedging) purposes, to facilitate trading, to reduce transaction costs and to pursue higher investment returns. The Fund may also use derivative instruments to mitigate certain investment risks, such as foreign currency exchange rate risk, interest rate risk and credit risk. Derivatives may involve various risks, including the potential inability of the counterparty to fulfill its obligation under the terms of the contract, the potential for an illiquid secondary market (making it difficult for the Fund to sell, including at favorable prices) and the potential for market movements which may expose the Fund to gains or losses in excess of the amount shown in the Statement of Assets and Liabilities. The notional amounts of derivative instruments, if applicable, are not recorded in the financial statements.
A derivative instrument may suffer a marked-to-market loss if the value of the contract decreases due to an unfavorable change in the market rates or values of the underlying instrument. Losses can also occur if the counterparty does not perform under the contract. The Fund's risk of loss from counterparty credit risk on over-the-counter derivatives is generally limited to the aggregate unrealized gain netted against any collateral held by the Fund and the amount of any variation margin held by the counterparty. With exchange-traded or centrally cleared derivatives, there is reduced counterparty credit risk to the Fund since the exchange's clearinghouse, as counterparty to such instruments, guarantees against a possible default. The clearinghouse stands between the buyer and the seller of the contract; therefore, the counterparty credit risk is failure of the clearinghouse. However, credit risk still exists in
Annual Report 2016
25
COLUMBIA PACIFIC/ASIA FUND
NOTES TO FINANCIAL STATEMENTS (continued)
March 31, 2016
exchange-traded or centrally cleared derivatives with respect to initial and variation margin that is held in a broker's customer account. While brokers are required to segregate customer margin from their own assets, in the event that a broker becomes insolvent or goes into bankruptcy and at that time there is a shortfall in the aggregate amount of margin held by the broker for all its clients, U.S. bankruptcy laws will typically allocate that shortfall on a pro-rata basis across all the broker's customers (including the Fund), potentially resulting in losses to the Fund.
In order to better define its contractual rights and to secure rights that will help the Fund mitigate its counterparty risk, the Fund may enter into an International Swaps and Derivatives Association, Inc. Master Agreement (ISDA Master Agreement) or similar agreement with its derivatives contract counterparties. An ISDA Master Agreement is an agreement between the Fund and a counterparty that governs over-the-counter derivatives and forward foreign currency exchange contracts and typically contains, among other things, collateral posting terms and netting provisions in the event of a default and/or termination event. Under an ISDA Master Agreement, the Fund may, under certain circumstances, offset with the counterparty certain derivative instrument's payables and/or receivables with collateral held and/or posted and create one single net payment. The provisions of the ISDA Master Agreement typically permit a single net payment in the event of default (close-out netting) including the bankruptcy or insolvency of the counterparty. Note, however, that bankruptcy or insolvency laws of a particular jurisdiction may impose restrictions on or prohibitions against the right of offset in bankruptcy, insolvency or other events.
Collateral (margin) requirements differ by type of derivative. Margin requirements are established by the exchange or clearinghouse for exchange-traded and centrally cleared derivatives. Brokers can ask for margin in excess of the minimum in certain circumstances. Collateral terms are contract specific for over-the-counter derivatives. For over-the-counter derivatives traded under an ISDA Master Agreement, the collateral requirements are typically calculated by netting the marked-to-market amount for each transaction under such agreement and comparing that amount to the value of any variation margin currently pledged by the Fund and/or the counterparty. Generally, the amount of collateral due from or to a party has to exceed a minimum transfer amount threshold (e.g., $500,000) before a transfer has to be made. To the extent amounts due to the Fund from its
counterparties are not fully collateralized, contractually or otherwise, the Fund bears the risk of loss from counterparty nonperformance. The Fund attempts to mitigate counterparty risk by only entering into agreements with counterparties that it believes have the financial resources to honor their obligations and by monitoring the financial stability of those counterparties.
Certain ISDA Master Agreements allow counterparties to over-the-counter derivatives transactions to terminate derivatives contracts prior to maturity in the event the Fund's net asset value declines by a stated percentage over a specified time period or if the Fund fails to meet certain terms of the ISDA Master Agreement, which would cause the Fund to accelerate payment of any net liability owed to the counterparty. The Fund also has termination rights if the counterparty fails to meet certain terms of the ISDA Master Agreement. In addition to considering counterparty credit risk, the Fund would consider terminating the derivatives contracts based on whether termination would result in a net liability owed from the counterparty.
For financial reporting purposes, the Fund does not offset derivative assets and derivative liabilities that are subject to netting arrangements in the Statement of Assets and Liabilities.
Forward Foreign Currency Exchange Contracts
Forward foreign currency exchange contracts are over-the-counter agreements between two parties to buy and sell a currency at a set price on a future date. The Fund utilized forward foreign currency exchange contracts to hedge the currency exposure associated with some or all of the Fund's securities, to shift investment exposure from one currency to another and to shift U.S. dollar exposure to achieve a representative weighted mix of major currencies in its benchmark and/or to recover an underweight country exposure in its portfolio. These instruments may be used for other purposes in future periods.
The values of forward foreign currency exchange contracts fluctuate daily with changes in foreign currency exchange rates. Changes in the value of these contracts are recorded as unrealized appreciation or depreciation until the contract is exercised or has expired. The Fund will realize a gain or loss when the forward foreign currency exchange contract is closed or expires.
The use of forward foreign currency exchange contracts does not eliminate fluctuations in the prices of the Fund's portfolio securities. The risks of forward foreign
Annual Report 2016
26
COLUMBIA PACIFIC/ASIA FUND
NOTES TO FINANCIAL STATEMENTS (continued)
March 31, 2016
currency exchange contracts include movement in the values of the foreign currencies relative to the U.S. dollar (or other foreign currencies) and the possibility that counterparties will not complete their contractual obligations, which may be in excess of the amount reflected, if any, in the Statement of Assets and Liabilities.
Effects of Derivative Transactions in the Financial Statements
The following tables are intended to provide additional information about the effect of derivatives on the financial statements of the Fund, including: the fair value of derivatives by risk category and the location of those fair values in the Statement of Assets and Liabilities; and the impact of derivative transactions over the period in the Statement of Operations, including realized and unrealized gains (losses). The derivative instrument schedules following the Portfolio of Investments present additional information regarding derivative instruments outstanding at the end of the period, if any.
The following table is a summary of the fair value of derivative instruments (not considered to be hedging instruments for accounting disclosure purposes) at March 31, 2016:
Asset Derivatives | |
Risk Exposure
Category | | Statement of Assets and
Liabilities Location | | Fair Value ($) | |
Foreign exchange
risk
| | Unrealized appreciation on
forward foreign currency
exchange contracts | | | 646,261
| | |
Liability Derivatives | |
Risk Exposure
Category | | Statement of Assets and
Liabilities Location | | Fair Value ($) | |
Foreign exchange
risk
| | Unrealized depreciation on
forward foreign currency
exchange contracts | | | 251,565
| | |
The following table indicates the effect of derivative instruments (not considered to be hedging instruments for accounting disclosure purposes) in the Statement of Operations for the year ended March 31, 2016:
Amount of Realized Gain (Loss) on Derivatives Recognized in Income | |
Risk Exposure Category | | Forward Foreign Currency
Exchange Contracts ($) | |
Foreign exchange risk | | | (2,013,510 | ) | |
Change in Unrealized Appreciation (Depreciation) on
Derivatives Recognized in Income | |
Risk Exposure Category | | Forward Foreign Currency
Exchange Contracts ($) | |
Foreign exchange risk | | | 579,897 | | |
The following table provides a summary of the average outstanding volume by derivative instrument for the year ended March 31, 2016:
Derivative Instrument | | Average unrealized
appreciation ($)* | | Average unrealized
depreciation ($)* | |
Forward foreign currency
exchange contracts | | | 223,334 | | | | (347,964 | ) | |
*Based on the ending quarterly outstanding amounts for the year ended March 31, 2016.
Offsetting of Assets and Liabilities
The following table presents the Fund's gross and net amount of assets and liabilities available for offset under netting arrangements as well as any related collateral received or pledged by the Fund as of March 31, 2016:
| | | Morgan Stanley ($) | |
Assets | |
Forward foreign currency exchange contracts | | | 646,261 | | |
Liabilities | |
Forward foreign currency exchange contracts | | | 251,565 | | |
Total Financial and Derivative Net Assets | | | 394,696 | | |
Total collateral received (pledged)(a) | | | — | | |
Net Amount(b) | | | 394,696 | | |
(a) In some instances, the actual collateral received and/or pledged may be more than the amount shown due to overcollateralization.
(b) Represents the net amount due from/ (to) counterparties in the event of default.
Security Transactions
Security transactions are accounted for on the trade date. Cost is determined and gains (losses) are based upon the specific identification method for both financial statement and federal income tax purposes.
Income Recognition
Corporate actions and dividend income are generally recorded net of any non-reclaimable tax withholdings, on the ex-dividend date or upon receipt of ex-dividend notification in the case of certain foreign securities.
Awards from class action litigation are recorded as a reduction of cost basis if the Fund still owns the applicable securities on the payment date. If the Fund no longer owns the applicable securities, the proceeds are recorded as realized gains.
Expenses
General expenses of the Trust are allocated to the Fund and other funds of the Trust based upon relative net assets or other expense allocation methodologies
Annual Report 2016
27
COLUMBIA PACIFIC/ASIA FUND
NOTES TO FINANCIAL STATEMENTS (continued)
March 31, 2016
determined by the nature of the expense. Expenses directly attributable to the Fund are charged to the Fund. Expenses directly attributable to a specific class of shares are charged to that share class.
Determination of Class Net Asset Value
All income, expenses (other than class-specific expenses, which are charged to that share class, as shown in the Statement of Operations) and realized and unrealized gains (losses) are allocated to each class of the Fund on a daily basis, based on the relative net assets of each class, for purposes of determining the net asset value of each class.
Federal Income Tax Status
The Fund intends to qualify each year as a regulated investment company under Subchapter M of the Internal Revenue Code, as amended, and will distribute substantially all of its taxable income (including net short-term capital gains), if any, for its tax year, and as such will not be subject to federal income taxes. In addition, the Fund intends to distribute in each calendar year substantially all of its net investment income, capital gains and certain other amounts, if any, such that the Fund should not be subject to federal excise tax. Therefore, no federal income or excise tax provision is recorded.
Foreign Taxes
The Fund may be subject to foreign taxes on income, gains on investments or currency repatriation, a portion of which may be recoverable. The Fund will accrue such taxes and recoveries, as applicable, based upon its current interpretation of tax rules and regulations that exist in the markets in which it invests.
Realized gains in certain countries may be subject to foreign taxes at the Fund level, based on statutory rates. The Fund accrues for such foreign taxes on realized and unrealized gains at the appropriate rate for each jurisdiction, as applicable. The amount, if any, is disclosed as a liability on the Statement of Assets and Liabilities.
Distributions to Shareholders
Distributions from net investment income, if any, are declared and paid semi-annually. Net realized capital gains, if any, are distributed at least annually. Income distributions and capital gain distributions are determined in accordance with federal income tax regulations, which may differ from GAAP.
Guarantees and Indemnifications
Under the Trust's organizational documents and, in some cases, by contract, its officers and trustees are indemnified against certain liabilities arising out of the performance of their duties to the Trust or its funds. In addition, certain of the Fund's contracts with its service providers contain general indemnification clauses. The Fund's maximum exposure under these arrangements is unknown since the amount of any future claims that may be made against the Fund cannot be determined, and the Fund has no historical basis for predicting the likelihood of any such claims.
Note 3. Fees and Other Transactions with Affiliates
Management Fees
Effective August 1, 2015, the Fund entered into a Management Agreement with Columbia Management Investment Advisers, LLC (the Investment Manager), a wholly-owned subsidiary of Ameriprise Financial, Inc. (Ameriprise Financial). Under the Management Agreement, the Investment Manager provides the Fund with investment research and advice, as well as administrative and accounting services. The management services fee is an annual fee that is equal to a percentage of the Fund's average daily net assets that declines from 0.95% to 0.72% as the Fund's net assets increase. The effective management services fee rate for the year ended March 31, 2016 was 0.95% of the Fund's average daily net assets.
Prior to August 1, 2015, the Fund paid the Investment Manager an annual fee for advisory services under an Investment Management Services Agreement and a separate annual fee for administrative and accounting services under an Administrative Services Agreement. For the period from April 1, 2015 through July 31, 2015, the investment advisory services fee paid to the Investment Manager was $772,948, and the administrative services fee paid to the Investment Manager was $71,076.
Participating Affiliates
The Investment Manager and its investment advisory affiliates (Participating Affiliates) around the world may coordinate in providing services to their clients. Such coordination may include functional leadership of the business (the "Global" business). From time to time the Investment Manager (or any affiliated investment subadviser to the Fund, as the case may be) may engage
Annual Report 2016
28
COLUMBIA PACIFIC/ASIA FUND
NOTES TO FINANCIAL STATEMENTS (continued)
March 31, 2016
its Participating Affiliates to provide a variety of services such as investment research, investment monitoring, trading and discretionary investment management (including portfolio management) to certain accounts managed by the Investment Manager, including the Fund. These Participating Affiliates will provide services to the Investment Manager (or any affiliated investment subadviser to the Fund as the case may be) either pursuant to subadvisory agreements, personnel-sharing agreements or similar inter-company arrangements and the Fund will pay no additional fees and expenses as a result of any such arrangements.
These Participating Affiliates, like the Investment Manager, are direct or indirect subsidiaries of Ameriprise Financial and are registered with appropriate respective regulators in their home jurisdictions and, where required, the Securities and Exchange Commission and the Commodity Futures Trading Commission in the United States.
Pursuant to some of these arrangements, certain employees of these Participating Affiliates may serve as "associated persons" of the Investment Manager and, in this capacity, subject to the oversight and supervision of the Investment Manager and consistent with the investment objectives, policies and limitations set forth in the Fund's prospectus and Statement of Additional Information (SAI), may provide such services to the Fund on behalf of the Investment Manager.
Compensation of Board Members
Board members, who are not officers or employees of the Investment Manager or Ameriprise Financial, are compensated for their services to the Fund as disclosed in the Statement of Operations. These Board members may participate in a Deferred Compensation Plan (the Plan) which may be terminated at any time. Obligations of the Plan will be paid solely out of the Fund's assets, and all amounts payable under the Plan constitute a general unsecured obligation of the Fund.
Compensation of Chief Compliance Officer
The Board has appointed a Chief Compliance Officer to the Fund in accordance with federal securities regulations. The Fund is allocated a portion of the expenses associated with the Chief Compliance Officer based on relative net assets of the Trust.
Transfer Agency Fees
Under a Transfer and Dividend Disbursing Agent Agreement, Columbia Management Investment Services Corp. (the Transfer Agent), an affiliate of the Investment
Manager and a wholly-owned subsidiary of Ameriprise Financial, is responsible for providing transfer agency services to the Fund. The Transfer Agent has contracted with Boston Financial Data Services (BFDS) to serve as sub-transfer agent.
The Transfer Agent receives a monthly transfer agency fee based on the number or the average value of accounts, depending on the type of account. In addition, the Transfer Agent also receives sub-transfer agency fees based on a percentage of the average aggregate value of the Fund's shares maintained in omnibus accounts (other than omnibus accounts for which American Enterprise Investment Services Inc. is the broker of record or accounts where the beneficial shareholder is a customer of Ameriprise Financial Services, Inc., for which the Transfer Agent receives a per account fee). The Transfer Agent pays the fees of BFDS for services as sub-transfer agent and is not entitled to reimbursement for such fees from the Fund (with the exception of out-of-pocket fees).
The Transfer Agent also receives compensation from the Fund for various shareholder services and reimbursements for certain out-of-pocket fees. Class I shares do not pay transfer agency fees.
For the year ended March 31, 2016, the Fund's effective transfer agency fee rates as a percentage of average daily net assets of each class were as follows:
Class A | | | 0.20 | % | |
Class C | | | 0.20 | | |
Class R4 | | | 0.20 | | |
Class W | | | 0.14 | | |
Class Z | | | 0.20 | | |
An annual minimum account balance fee of $20 may apply to certain accounts with a value below the applicable share class's initial minimum investment requirements to reduce the impact of small accounts on transfer agency fees. These minimum account balance fees are remitted to the Fund and recorded as part of expense reductions in the Statement of Operations. For the year ended March 31, 2016, these minimum account balance fees reduced total expenses of the Fund by $360.
Distribution and Service Fees
The Fund has an agreement with Columbia Management Investment Distributors, Inc. (the Distributor), an affiliate of the Investment Manager and a wholly-owned subsidiary of Ameriprise Financial, for distribution and shareholder services. The Board has approved, and the
Annual Report 2016
29
COLUMBIA PACIFIC/ASIA FUND
NOTES TO FINANCIAL STATEMENTS (continued)
March 31, 2016
Fund has adopted, distribution and shareholder service plans (the Plans) applicable to certain share classes, which set the distribution and service fees for the Fund. These fees are calculated daily and are intended to compensate the Distributor and/or eligible selling and/or servicing agents for selling shares of the Fund and providing services to investors.
Under the Plans, the Fund pays a monthly service fee to the Distributor at the maximum annual rate of 0.25% of the average daily net assets attributable to Class A, Class C and Class W shares of the Fund. Also under the Plans, the Fund pays a monthly distribution fee to the Distributor at the maximum annual rates of 0.75% and 0.25% of the average daily net assets attributable to Class C and Class W shares of the Fund, respectively.
Although the Fund may pay a distribution fee up to 0.25% of the Fund's average daily net assets attributable to Class W shares and a service fee of up to 0.25% of the Fund's average daily net assets attributable to Class W shares, the aggregate fee shall not exceed 0.25% of the Fund's average daily net assets attributable to Class W shares.
Sales Charges
Sales charges, including front-end charges and CDSCs, received by the Distributor for distributing Fund shares were $17,597 for Class A and $194 for Class C shares for the year ended March 31, 2016.
Expenses Waived/Reimbursed by the Investment Manager and its Affiliates
The Fund's expense ratio is subject to an expense reimbursement arrangement pursuant to which fees will be waived and/or expenses reimbursed (excluding certain fees and expenses described below), so that the Fund's net operating expenses, after giving effect to fees waived/expenses reimbursed and any balance credits and/or overdraft charges from the Fund's custodian, do not exceed the annual rates of:
| | | Contractual
Expense Cap
August 1, 2015
Through
July 31, 2016 | | Voluntary
Expense Cap
Prior to
August 1, 2015 | |
Class A | | | 1.68 | % | | | 1.68 | % | |
Class C | | | 2.43 | | | | 2.43 | | |
Class I | | | 1.28 | | | | 1.30 | | |
Class R4 | | | 1.43 | | | | 1.43 | | |
Class W | | | 1.68 | | | | 1.68 | | |
Class Z | | | 1.43 | | | | 1.43 | | |
The contractual agreement may be modified or amended only with approval from the Investment Manager, certain of its affiliates and the Fund. Under the arrangements, the following fees and expenses are excluded from the waiver/reimbursement commitment, and therefore will be paid by the Fund, if applicable: taxes (including foreign transaction taxes), expenses associated with investments in affiliated and non-affiliated pooled investment vehicles (including mutual funds and exchange-traded funds), transaction costs and brokerage commissions, costs related to any securities lending program, dividend and interest expenses associated with securities sold short, inverse floater program fees and expenses, transaction charges and interest on borrowed money, interest and extraordinary expenses. Any fees waived and/or expenses reimbursed under the expense reimbursement arrangements described above are not recoverable by the Investment Manager or its affiliates in future periods.
Note 4. Federal Tax Information
The timing and character of income and capital gain distributions are determined in accordance with income tax regulations, which may differ from GAAP because of temporary or permanent book to tax differences.
At March 31, 2016, these differences are primarily due to differing treatment for capital loss carryforwards, deferral/reversal of wash sale losses, Trustees' deferred compensation, distribution reclassifications, foreign currency transactions, passive foreign investment company (PFIC) holdings, post-October capital losses and derivative investments. To the extent these differences are permanent, reclassifications are made among the components of the Fund's net assets in the Statement of Assets and Liabilities. Temporary differences do not require reclassifications. In the Statement of Assets and Liabilities the following reclassifications were made:
Excess of distributions over net investment income | | $ | (377,020 | ) | |
Accumulated net realized loss | | | 1,831,899 | | |
Paid-in capital | | | (1,454,879 | ) | |
Net investment income (loss) and net realized gains (losses), as disclosed in the Statement of Operations, and net assets were not affected by this reclassification.
Annual Report 2016
30
COLUMBIA PACIFIC/ASIA FUND
NOTES TO FINANCIAL STATEMENTS (continued)
March 31, 2016
The tax character of distributions paid during the years indicated was as follows:
Year Ended March 31, | | 2016 | | 2015 | |
Ordinary income | | $ | 2,172,583 | | | $ | 3,429,655 | | |
Long-term capital gains | | | 624,471 | | | | — | | |
Total | | | 2,797,054 | | | | 3,429,655 | | |
Short-term capital gain distributions, if any, are considered ordinary income distributions for tax purposes.
At March 31, 2016, the components of distributable earnings on a tax basis were as follows:
Undistributed ordinary income | | $ | 427,229 | | |
Capital loss carryforwards | | | (3,989,621 | ) | |
Net unrealized appreciation | | | 41,654,459 | | |
At March 31, 2016, the cost of investments for federal income tax purposes was $191,408,663 and the aggregate gross unrealized appreciation and depreciation based on that cost was:
Unrealized appreciation | | $ | 44,081,316 | | |
Unrealized depreciation | | | (2,426,857 | ) | |
Net unrealized appreciation | | $ | 41,654,459 | | |
The following capital loss carryforwards, determined at March 31, 2016, may be available to reduce taxable income arising from future net realized gains on investments, if any, to the extent permitted by the Internal Revenue Code:
Year of Expiration | | Amount ($) | |
2018 | | | 3,573,332 | | |
2019 | | | 416,289 | | |
Total | | | 3,989,621 | | |
For the year ended March 31, 2016, $5,122,568 of capital loss carryforward was utilized and $1,454,882 was permanently lost.
Under current tax rules, regulated investment companies can elect to treat certain late-year ordinary losses incurred and post-October capital losses (capital losses realized after October 31) as arising on the first day of the following taxable year. As of March 31, 2016, the Fund will elect to treat post-October capital losses of $307,000 as arising on April 1, 2016.
Management of the Fund has concluded that there are no significant uncertain tax positions in the Fund that would require recognition in the financial statements. However, management's conclusion may be subject to review and adjustment at a later date based on factors
including, but not limited to, new tax laws, regulations, and administrative interpretations (including relevant court decisions). Generally, the Fund's federal tax returns for the prior three fiscal years remain subject to examination by the Internal Revenue Service.
Note 5. Portfolio Information
The cost of purchases and proceeds from sales of securities, excluding short-term investments and derivatives, if any, aggregated to $172,475,264 and $185,982,701, respectively, for the year ended March 31, 2016. The amount of purchase and sale activity impacts the portfolio turnover rate reported in the Financial Highlights.
Note 6. Affiliated Money Market Fund
The Fund invests in Columbia Short-Term Cash Fund, an affiliated money market fund established for the exclusive use by the Fund and other affiliated funds. The income earned by the Fund from such investments is included as Dividends — affiliated issuers in the Statement of Operations. As an investing fund, the Fund indirectly bears its proportionate share of the expenses of Columbia Short-Term Cash Fund.
Note 7. Line of Credit
The Fund has access to a revolving credit facility whereby the Fund may borrow for the temporary funding of shareholder redemptions or for other temporary or emergency purposes. Effective December 8, 2015, Citibank, N.A. and HSBC Bank USA, N.A. joined JPMorgan Chase Bank, N.A. (JPMorgan) as lead of a syndicate of banks under the credit facility, which is a collective agreement between the Fund and certain other funds managed by the Investment Manager, severally and not jointly, that permits collective borrowings up to $1 billion. Interest is charged to each participating fund based on its borrowings at a rate equal to the higher of (i) the overnight federal funds rate plus 1.00% or (ii) the one-month LIBOR rate plus 1.00%. Each borrowing under the credit facility matures no later than 60 days after the date of borrowing. The Fund also pays a commitment fee equal to its pro rata share of the amount of the credit facility at a rate of 0.15% per annum. The commitment fee is included in other expenses in the Statement of Operations. Prior to December 8, 2015, JPMorgan was the sole lead bank under the credit facility agreement that permitted borrowings up to $550 million under the same terms and interest rates as described above with the exception of the commitment fee which was charged at a rate of 0.075% per annum.
Annual Report 2016
31
COLUMBIA PACIFIC/ASIA FUND
NOTES TO FINANCIAL STATEMENTS (continued)
March 31, 2016
The Fund had no borrowings during the year ended March 31, 2016.
Note 8. Significant Risks
Shareholder Concentration Risk
At March 31, 2016, one unaffiliated shareholder of record owned 20.1% of the outstanding shares of the Fund in one or more accounts. The Fund has no knowledge about whether any portion of those shares was owned beneficially. Affiliated shareholders of record owned 73.7% of the outstanding shares of the Fund in one or more accounts. Subscription and redemption activity by concentrated accounts may have a significant effect on the operations of the Fund. In the case of a large redemption, the Fund may be forced to sell investments at inopportune times, including its liquid or more liquid positions, resulting in Fund losses and the Fund holding a higher percentage of less liquid or illiquid securities. Large redemptions could result in decreased economies of scale and increased operating expenses for non-redeeming Fund shareholders.
Financial Sector Risk
The Fund may be more susceptible to the particular risks that may affect companies in the financial services sector than if it were invested in a wider variety of companies in unrelated sectors. Companies in the financial services sector are subject to certain risks, including the risk of regulatory change, decreased liquidity in credit markets and unstable interest rates. Such companies may have concentrated portfolios, such as a high level of loans to real estate developers, which makes them vulnerable to economic conditions that affect that industry. Performance of such companies may be affected by competitive pressures and exposure to investments or agreements that, under certain circumstances, may lead to losses (e.g., subprime loans). Companies in the financial services sector are subject to extensive governmental regulation that may limit the amount and types of loans and other financial commitments they can make, and interest rates and fees that they may charge. In addition, profitability of such companies is largely dependent upon the availability and the cost of capital.
Foreign Securities and Emerging Market Countries Risk
Investing in foreign securities may include certain risks and considerations not typically associated with investing in U.S. securities, such as fluctuating currency values
and changing local and regional economic, political and social conditions, which may result in greater market volatility. In addition, certain foreign securities may not be as liquid as U.S. securities. Investing in emerging markets may accentuate these risks. These countries are also more likely to experience high levels of inflation, deflation or currency devaluation which could hurt their economies and securities markets. To the extent that the Fund concentrates its investment exposure to any one or a few specific countries, the Fund will be particularly susceptible to the various conditions, events or other factors impacting those countries and may, therefore, have a greater risk than that of a fund which is more geographically diversified.
Note 9. Subsequent Events
Management has evaluated the events and transactions that have occurred through the date the financial statements were issued and noted no items requiring adjustment of the financial statements or additional disclosure.
Note 10. Information Regarding Pending and Settled Legal Proceedings
In December 2005, without admitting or denying the allegations, American Express Financial Corporation (AEFC, which is now known as Ameriprise Financial, Inc. (Ameriprise Financial)) entered into settlement agreements with the Securities and Exchange Commission (SEC) and Minnesota Department of Commerce (MDOC) related to market timing activities. As a result, AEFC was censured and ordered to cease and desist from committing or causing any violations of certain provisions of the Investment Advisers Act of 1940, the Investment Company Act of 1940, and various Minnesota laws. AEFC agreed to pay disgorgement of $10 million and civil money penalties of $7 million. AEFC also agreed to retain an independent distribution consultant to assist in developing a plan for distribution of all disgorgement and civil penalties ordered by the SEC in accordance with various undertakings detailed at http://www.sec.gov/litigation/admin/ia-2451.pdf. Ameriprise Financial and its affiliates have cooperated with the SEC and the MDOC in these legal proceedings, and have made regular reports to the Funds' Boards of Trustees.
Ameriprise Financial and certain of its affiliates have historically been involved in a number of legal, arbitration and regulatory proceedings, including routine litigation, class actions, and governmental actions, concerning
Annual Report 2016
32
COLUMBIA PACIFIC/ASIA FUND
NOTES TO FINANCIAL STATEMENTS (continued)
March 31, 2016
matters arising in connection with the conduct of their business activities. Ameriprise Financial believes that the Funds are not currently the subject of, and that neither Ameriprise Financial nor any of its affiliates are the subject of, any pending legal, arbitration or regulatory proceedings that are likely to have a material adverse effect on the Funds or the ability of Ameriprise Financial or its affiliates to perform under their contracts with the Funds. Ameriprise Financial is required to make quarterly (10-Q), annual (10-K) and, as necessary, 8-K filings with the SEC on legal and regulatory matters that relate to Ameriprise Financial and its affiliates. Copies of these filings may be obtained by accessing the SEC website at www.sec.gov.
There can be no assurance that these matters, or the adverse publicity associated with them, will not result in increased fund redemptions, reduced sale of fund shares or other adverse consequences to the Funds. Further, although we believe proceedings are not likely to have a material adverse effect on the Funds or the ability of Ameriprise Financial or its affiliates to perform under their contracts with the Funds, these proceedings are subject to uncertainties and, as such, we are unable to estimate the possible loss or range of loss that may result. An adverse outcome in one or more of these proceedings could result in adverse judgments, settlements, fines, penalties or other relief that could have a material adverse effect on the consolidated financial condition or results of operations of Ameriprise Financial.
Annual Report 2016
33
COLUMBIA PACIFIC/ASIA FUND
REPORT OF INDEPENDENT REGISTERED PUBLIC ACCOUNTING FIRM
To the Trustees of Columbia Funds Series Trust I and the Shareholders of
Columbia Pacific/Asia Fund
In our opinion, the accompanying statement of assets and liabilities, including the portfolio of investments, and the related statements of operations and of changes in net assets and the financial highlights present fairly, in all material respects, the financial position of Columbia Pacific/Asia Fund (the "Fund," a series of Columbia Funds Series Trust I) at March 31, 2016, and the results of its operations, the changes in its net assets and the financial highlights for each of the periods indicated, in conformity with accounting principles generally accepted in the United States of America. These financial statements and financial highlights (hereafter referred to as "financial statements") are the responsibility of the Fund's management. Our responsibility is to express an opinion on these financial statements based on our audits. We conducted our audits of these financial statements in accordance with the standards of the Public Company Accounting Oversight Board (United States). Those standards require that we plan and perform the audit to obtain reasonable assurance about whether the financial statements are free of material misstatement. An audit includes examining, on a test basis, evidence supporting the amounts and disclosures in the financial statements, assessing the accounting principles used and significant estimates made by management, and evaluating the overall financial statement presentation. We believe that our audits, which included confirmation of securities at March 31, 2016 by correspondence with the custodian, brokers and transfer agent, and the application of alternative auditing procedures where such confirmations had not been received, provide a reasonable basis for our opinion.
PricewaterhouseCoopers LLP
Minneapolis, MN
May 20, 2016
Annual Report 2016
34
COLUMBIA PACIFIC/ASIA FUND
FEDERAL INCOME TAX INFORMATION
(Unaudited)
The Fund hereby designates the following tax attributes for the fiscal year ended March 31, 2016. Shareholders will be notified in early 2017 of the amounts for use in preparing 2016 income tax returns.
Tax Designations
Qualified Dividend Income | | | 100.00 | % | |
Foreign Taxes Paid | | $ | 433,304 | | |
Foreign Taxes Paid Per Share | | $ | 0.02 | | |
Foreign Source Income | | $ | 5,377,922 | | |
Foreign Source Income Per Share | | $ | 0.21 | | |
Qualified Dividend Income. For taxable, non-corporate shareholders, the percentage of ordinary income distributed during the fiscal year that represents qualified dividend income subject to reduced tax rates.
Foreign Taxes. The Fund makes the election to pass through to shareholders the foreign taxes paid. Eligible shareholders may claim a foreign tax credit. These taxes, and the corresponding foreign source income, are provided.
Annual Report 2016
35
COLUMBIA PACIFIC/ASIA FUND
Shareholders elect the Board that oversees the Fund's operations. The Board appoints officers who are responsible for day-to-day business decisions based on policies set by the Board. The following table provides basic biographical information about the Fund's Trustees, including their principal occupations during the past five years, although specific titles for individuals may have varied over the period. The year set forth beneath Length of Service in the table below is the year in which the Trustee was first appointed or elected as Trustee to any Fund currently in the Columbia Funds Complex or a predecessor thereof. Under current Board policy, members serve terms of indefinite duration.
Trustees
Independent Trustees
Name,
Address,
Year of Birth | | Position Held With
the Funds and Length of
Service | | Principal Occupation(s)
During the Past Five Years
and Other Relevant
Professional Experience | | Number of
Funds in the
Columbia Funds
Complex
Overseen | | Other Directorships
Held by Trustee During
the Past Five Years | |
Janet Langford Carrig
c/o Columbia
Management Investment Advisers, LLC,
225 Franklin Street
Mail Drop BX32 05228,
Boston, MA 02110
1957 | | Trustee 1996 | | Senior Vice President, General Counsel and Corporate Secretary, ConocoPhillips (integrated energy company) since September 2007 | | | 58 | | | None | |
Douglas A. Hacker
c/o Columbia Management Investment Advisers, LLC,
225 Franklin Street
Mail Drop BX32 05228,
Boston, MA 02110
1955 | | Trustee and Chairman of the Board 1996 | | Independent business executive since May 2006; Executive Vice President — Strategy of United Airlines from December 2002 to May 2006; President of UAL Loyalty Services (airline marketing company) from September 2001 to December 2002; Executive Vice President and Chief Financial Officer of United Airlines from July 1999 to September 2001 | | | 58 | | | Spartan Nash Company (food distributor); Nash Finch Company (food distributor) from 2005 to 2013; Aircastle Limited (aircraft leasing); SeaCube Container Leasing Ltd. (container leasing) from 2010 to 2013; and Travelport Worldwide Limited (travel information technology) | |
Nancy T. Lukitsh
c/o Columbia Management Investment Advisers, LLC,
225 Franklin Street
Mail Drop BX32 05228,
Boston, MA 02110
1956 | | Trustee 2011 | | Senior Vice President, Partner and Director of Marketing, Wellington Management Company, LLP (investment adviser) from 1997 to 2010; Chair, Wellington Management Portfolios (commingled non-U.S. investment pools) from 2007 to 2010; Director, Wellington Trust Company, NA and other Wellington affiliates from 1997 to 2010 | | | 58 | | | None | |
Annual Report 2016
36
COLUMBIA PACIFIC/ASIA FUND
TRUSTEES AND OFFICERS (continued)
Independent Trustees (continued)
Name,
Address,
Year of Birth | | Position Held With
the Funds and Length of
Service | | Principal Occupation(s)
During the Past Five Years
and Other Relevant
Professional Experience | | Number of
Funds in the
Columbia Funds
Complex
Overseen | | Other Directorships
Held by Trustee During
the Past Five Years | |
William E. Mayer
c/o Columbia Management Investment Advisers, LLC,
225 Franklin Street
Mail Drop BX32 05228,
Boston, MA 02110
1940 | | Trustee 1991 | | Partner, Park Avenue Equity Partners (private equity) since February 1999 | | | 58 | | | DynaVox Inc. (speech creation); Lee Enterprises (print media); WR Hambrecht + Co. (financial service provider) from 2000 to 2012; BlackRock Capital Investment Corporation (investment company); and Premier, Inc. (healthcare) | |
David M. Moffett
c/o Columbia Management Investment Advisers, LLC,
225 Franklin Street
Mail Drop BX32 05228,
Boston, MA 02110
1952 | | Trustee 2011 | | Retired. Consultant to Bridgewater and Associates | | | 58 | | | Director of CIT Bank, CIT Group Inc. (commercial and consumer finance); eBay Inc. (online trading community); Genworth Financial, Inc. (financial and insurance products and services); Paypal Holdings Inc. (payment and data processing services); and Trustee University of Oklahoma Foundation | |
Charles R. Nelson
c/o Columbia Management Investment Advisers, LLC,
225 Franklin Street
Mail Drop BX32 05228,
Boston, MA 02110
1942 | | Trustee 1981 | | Retired. Professor Emeritus, University of Washington since 2011; Professor of Economics, University of Washington from 1976 to 2011; Ford and Louisa Van Voorhis Professor of Political Economy, University of Washington from 1993 to 2011; Adjunct Professor of Statistics, University of Washington from 1980 to 2011; Associate Editor, Journal of Money, Credit and Banking from September 1993 to 2008; consultant on econometric and statistical matters | | | 58 | | | None | |
John J. Neuhauser
c/o Columbia Management Investment Advisers, LLC,
225 Franklin Street
Mail Drop BX32 05228,
Boston, MA 02110
1943 | | Trustee 1984 | | President, Saint Michael's College since August 2007; Director or Trustee of several non-profit organizations, including University of Vermont Medical Center; Academic Vice President and Dean of Faculties, Boston College from August 1999 to October 2005; University Professor, Boston College from November 2005 to August 2007 | | | 58 | | | Liberty All-Star Equity Fund and Liberty All-Star Growth Fund (closed-end funds) | |
Annual Report 2016
37
COLUMBIA PACIFIC/ASIA FUND
TRUSTEES AND OFFICERS (continued)
Independent Trustees (continued)
Name,
Address,
Year of Birth | | Position Held With
the Funds and Length of
Service | | Principal Occupation(s)
During the Past Five Years
and Other Relevant
Professional Experience | | Number of
Funds in the
Columbia Funds
Complex
Overseen | | Other Directorships
Held by Trustee During
the Past Five Years | |
Patrick J. Simpson
c/o Columbia Management Investment Advisers, LLC,
225 Franklin Street
Mail Drop BX32 05228,
Boston, MA 02110
1944 | | Trustee 2000 | | Of Counsel, Perkins Coie LLP (law firm) since 2015; Partner, Perkins Coie LLP from 1988 to 2014 | | | 58 | | | None | |
Anne-Lee Verville
c/o Columbia Management Investment Advisers, LLC,
225 Franklin Street
Mail Drop BX32 05228,
Boston, MA 02110
1945 | | Trustee 1998 | | Retired. General Manager, Global Education Industry from 1994 to 1997, President — Application Systems Division from 1991 to 1994, Chief Financial Officer — US Marketing & Services from 1988 to 1991, and Chief Information Officer from 1987 to 1988, IBM Corporation (computer and technology) | | | 58 | | | Enesco Group, Inc. (producer of giftware and home and garden decor products) from 2001 to 2006 | |
Annual Report 2016
38
COLUMBIA PACIFIC/ASIA FUND
TRUSTEES AND OFFICERS (continued)
Interested Trustee Affiliated with Investment Manager*
Name,
Address,
Year of Birth | | Position Held With
the Funds and Length of
Service | | Principal Occupation(s)
During the Past Five Years
and Other Relevant
Professional Experience | | Number of
Funds in the
Columbia Funds
Complex
Overseen | | Other Directorships
Held by Trustee During
the Past Five Years | |
William F. Truscott
c/o Columbia Management Investment Advisers, LLC,
225 Franklin Street
Boston, MA 02110
1960 | | Trustee 2012 | | Chairman of the Board and President, Columbia Management Investment Advisers, LLC since May 2010 and February 2012, respectively (previously President and Chief Investment Officer, 2001-April 2010); Chief Executive Officer, Global Asset Management, Ameriprise Financial, Inc. since September 2012 (previously Chief Executive Officer, U.S. Asset Management & President, Annuities, May 2010- September 2012 and President — U.S. Asset Management and Chief Investment Officer, 2005-April 2010); Director and Chief Executive Officer, Columbia Management Investment Distributors, Inc. since May 2010 and February 2012, respectively (previously Chairman of the Board and Chief Executive Officer, 2006-April 2010); Chairman of the Board and Chief Executive Officer, RiverSource Distributors, Inc. since 2006; Director, Threadneedle Asset Management Holdings, SARL since 2014; President and Chief Executive Officer, Ameriprise Certificate Company, 2006-August 2012. | | | 178 | | | Chairman of the Board, Columbia Management Investment Advisers, LLC since May 2010; Director, Columbia Management Investment Distributors, Inc. since May 2010; Former Director, Ameriprise Certificate Company, 2006-January 2013 | |
* Interested person (as defined under the 1940 Act) by reason of being an officer, director, security holder and/or employee of the Investment Manager or Ameriprise Financial.
The Statement of Additional Information has additional information about the Fund's Board members and is available, without charge, upon request by calling 800.345.6611; contacting your financial intermediary; or visiting columbiathreadneedle.com/us.
Annual Report 2016
39
COLUMBIA PACIFIC/ASIA FUND
TRUSTEES AND OFFICERS (continued)
The Board has appointed officers who are responsible for day-to-day business decisions based on policies it has established. The officers serve at the pleasure of the Board. The following table provides basic information about the Officers of the Fund, including principal occupations during the past five years, although their specific titles may have varied over the period. In addition to Mr. Truscott, who is Senior Vice President, the Fund's other officers are:
Fund Officers
Name,
Address and
Year of Birth | | Position and Year
First Appointed to
Position for any Fund
in the Columbia
Funds Complex or a
Predecessor Thereof | |
Principal Occupation(s) During Past Five Years | |
Christopher O. Petersen
5228 Ameriprise Financial Center
Minneapolis, MN 55474
Born 1970 | | President and Principal Executive Officer (2015) | | Vice President and Lead Chief Counsel, Ameriprise Financial, Inc. since January 2015 (previously, Vice President and Chief Counsel January 2010-December 2014; and Vice President and Group Counsel or Counsel 2004-January 2010); officer of Columbia Funds and affiliated funds since 2007. | |
Michael G. Clarke
225 Franklin Street
Boston, MA 02110
Born 1969 | | Treasurer (2011), Chief Financial Officer (2009) and Chief Accounting Officer (2015) | | Vice President — Mutual Fund Administration, Columbia Management Investment Advisers, LLC, since May 2010; Managing Director of Fund Administration, Columbia Management Advisors, LLC, September 2004-April 2010; senior officer of Columbia Funds and affiliated funds since 2002. | |
Paul B. Goucher
100 Park Avenue
New York, NY 10017
Born 1968 | | Senior Vice President (2011), Chief Legal Officer (2015) and Assistant Secretary (2008) | | Vice President and Lead Chief Counsel, Ameriprise Financial, Inc. since November 2008 and January 2013, respectively (previously Chief Counsel, January 2010-January 2013 and Group Counsel, November 2008-January 2010). | |
Thomas P. McGuire
225 Franklin Street
Boston, MA 02110
Born 1972 | | Senior Vice President and Chief Compliance Officer (2012) | | Vice President — Asset Management Compliance, Ameriprise Financial, Inc., since May 2010; Chief Compliance Officer, Ameriprise Certificate Company since September 2010; Compliance Executive, Bank of America, 2005-April 2010. | |
Colin Moore
225 Franklin Street
Boston, MA 02110
Born 1958 | | Senior Vice President (2010) | | Executive Vice President and Global Chief Investment Officer, Ameriprise Financial, Inc., since July 2013; Director and Global Chief Investment Officer, Columbia Management Investment Advisers, LLC since May 2010; Manager, Managing Director and Chief Investment Officer, Columbia Management Advisors, LLC, 2007-April 2010. | |
Michael E. DeFao
225 Franklin Street
Boston, MA 02110
Born 1968 | | Vice President (2011) and Assistant Secretary (2010) | | Vice President and Chief Counsel, Ameriprise Financial, Inc. since May 2010; Associate General Counsel, Bank of America, 2005-April 2010. | |
Amy Johnson
5228 Ameriprise Financial Center
Minneapolis, MN 55474
Born 1965 | | Vice President (2006) | | Managing Director and Chief Operating Officer, Columbia Management Investment Advisers, LLC since May 2010 (previously Chief Administrative Officer, 2009-April 2010, and Vice President — Asset Management and Trust Company Services, 2006-2009). | |
Lyn Kephart-Strong
5228 Ameriprise
Financial Center
Minneapolis, MN 55474
Born 1960 | | Vice President (2015) | | President, Columbia Management Investment Services Corp. since October 2014; Vice President & Resolution Officer, Ameriprise Trust Company since August 2009; President, RiverSource Service Corporation 2004-2010. | |
Ryan C. Larrenaga
225 Franklin Street
Boston, MA 02110
Born 1970 | | Vice President and Secretary (2015) | | Vice President and Group Counsel, Ameriprise Financial, Inc. since August 2011 (previously, Counsel from May 2010 to August 2011); Assistant General Counsel, Bank of America, 2005-April 2010; officer of Columbia Funds and affiliated funds since 2005. | |
Annual Report 2016
40
COLUMBIA PACIFIC/ASIA FUND
IMPORTANT INFORMATION ABOUT THIS REPORT
Each fund mails one shareholder report to each shareholder address. If you would like more than one report, please call shareholder services at 800.345.6611 and additional reports will be sent to you.
The policy of the Board is to vote the proxies of the companies in which each fund holds investments consistent with the procedures as stated in the Statement of Additional Information (SAI). You may obtain a copy of the SAI without charge by calling 800.345.6611; contacting your financial intermediary; visiting columbiathreadneedle.com/us; or searching the website of the Securities and Exchange Commission (SEC) at sec.gov. Information regarding how each fund voted proxies relating to portfolio securities is filed with the SEC by August 31st for the most recent 12-month period ending June 30th of that year, and is available without charge by visiting columbiathreadneedle.com/us, or searching the website of the SEC at sec.gov.
Each fund files a complete schedule of portfolio holdings with the SEC for the first and third quarters of each fiscal year on Form N-Q. Each fund's Form N-Q is available on the SEC's website at sec.gov and may be reviewed and copied at the SEC's Public Reference Room in Washington, D.C. Information on the operation of the Public Reference Room may be obtained by calling 800.SEC.0330. Each fund's complete schedule of portfolio holdings, as filed on Form N-Q, can also be obtained without charge, upon request, by calling 800.345.6611.
Annual Report 2016
41
Columbia Pacific/Asia Fund
P.O. Box 8081
Boston, MA 02266-8081

This information is for use with concurrent or prior delivery of a fund prospectus. Please read and consider the investment objectives, risks, charges and expenses for any fund carefully before investing. For a prospectus and summary prospectus, which contains this and other important information about the Fund, go to columbiathreadneedle.com/us. The Fund is distributed by Columbia Management Investment Distributors, Inc., member FINRA, and managed by Columbia Management Investment Advisers, LLC.
Columbia Threadneedle Investments (Columbia Threadneedle) is the global brand name of the Columbia and Threadneedle group of companies.
All rights reserved. Columbia Management Investment Distributors, Inc., 225 Franklin Street, Boston, MA 02110-2804
© 2016 Columbia Management Investment Advisers, LLC.
columbiathreadneedle.com/us
ANN209_03_F01_(05/16)

ANNUAL REPORT
March 31, 2016

ACTIVE PORTFOLIOS® MULTI-MANAGER GROWTH FUND


ABOUT COLUMBIA THREADNEEDLE INVESTMENTS
Columbia Threadneedle Investments is a leading global asset management group that provides a broad range of actively managed investment strategies and solutions for individual, institutional and corporate clients around the world.
With more than 2,000 people, including over 450 investment professionals based in North America, Europe and Asia, we manage $472 billion* of assets across developed and emerging market equities, fixed income, asset allocation solutions and alternatives. We are the 13th largest manager of long-term mutual fund assets in the U.S.** and the 4th largest manager of retail funds in the U.K.***
Our priority is the investment success of our clients. We aim to deliver the investment outcomes they expect through an investment approach that is team-based, performance-driven and risk-aware. Our culture is dynamic and interactive. By sharing our insights across asset classes and geographies, we generate richer perspectives on global, regional and local investment landscapes. The ability to exchange and debate investment ideas in a collaborative environment enriches our teams’ investment processes. More importantly, it results in better informed investment decisions for our clients.
Columbia funds are distributed by Columbia Management Investment Distributors, Inc., member FINRA, and managed by Columbia Management Investment Advisers, LLC.
Columbia Threadneedle Investments (Columbia Threadneedle) is the global brand name of the Columbia and Threadneedle group of companies.
| * | | In U.S. dollars as of December 31, 2015. Source: Ameriprise Q4 Earnings Release. Includes all assets managed by entities in the Columbia and Threadneedle groups of companies. Contact us for more current data. |
| ** | | Source: ICI as of December 31, 2015 for Columbia Management Investment Advisers, LLC. |
| *** | | Source: Investment Association as of September 2015 for Threadneedle Asset Management Limited. |
© 2016 Columbia Management Investment Advisers, LLC. All rights reserved.
Not part of the shareholder report
| | | | |
| | Investment strategies to help meet investor needs |
| |
| | We are committed to helping investors navigate financial challenges to reach their desired outcomes. The possibilities are endless. |
| | | | |
| | | | |
| | Your success is our priority. |
| | | | |
| | |
| |  | | Retire comfortably |
| | | | |
| | |
| | | | Fund college or higher education |
| | | | |
| | |
| | | | Leave a legacy |
| | | | |
| | | | |
 | | Generate an appropriate stream of income in retirement Traditional approaches to income may no longer be adequate — and they may no longer provide the diversification benefits they once did. Investors need to rethink how they generate retirement income. Worried about running out of income? You are not alone. |
| | | | |
| | | | |
 | | Navigate a changing interest rate environment Even in today’s challenging interest rate environment, it’s still possible to navigate markets and achieve your goals. Make investment choices designed specifically for this market environment. |
| | | | |
| | | | |
| |
 | | Maximize after-tax returns In an environment where what you keep is more important than what you earn, municipal bonds can help mitigate higher taxes while providing attractive yields compared to other investment options. You’ve worked too hard building your wealth to lose it to taxes. |
| | | | |
| | | | |
 | | Grow assets to achieve financial goals Finding growth opportunities in today’s complex market environment requires strong research capabilities, creative thinking and a disciplined approach. Do your investments deliver the portfolio growth you need? |
| | | | |
| | | | |
| |
 | | Ease the impact of volatile markets With increasing concerns about market volatility, investors should consider diversifying their portfolios with non-traditional holdings. Interested in turning volatility into opportunity? |
To find out more, contact your financial professional, call 800.426.3750 or visit columbiathreadneedle.com/us
Not part of the shareholder report
PRESIDENT’S MESSAGE

Dear Shareholders,
Volatility comes with the territory for long-term investors. Some investors instinctively want to pull out of the market or sell underperforming investments at the first sign of increased volatility or perhaps even as soon as they perceive it on the horizon. But taking yourself out of the market could mean losing out on potential opportunities, and putting your longer-term investment goals at risk.
Cumulative return is not just about achieving high returns when markets are going up; it’s also about remaining invested and minimizing losses during weak or volatile markets so that you can participate on the upside. Developing a deeper understanding of the various risks your portfolio is subject to can help you balance these risks.
Diversification is critical in seeking to achieve that balance. We believe that most portfolios could be more effectively diversified either by introducing holdings with performance profiles
unrelated to existing holdings (like alternative products) or by rebalancing existing holdings with an eye toward risk allocation. Over time, distributing risk more evenly may produce a more pronounced diversification benefit and may improve portfolio efficiency. We believe market volatility can create significant opportunities and, in fact, these periods may be some of the very best times to invest.
With this in mind, I thought it important to highlight excerpts from a piece written by Colin Moore, Global Chief Investment Officer, in which he touches on some of these issues emphasizing the importance of a properly constructed portfolio in seeking to effectively manage volatility and to achieve consistency of returns. I encourage you to read the article in its entirety. To access the full article and for other insights on current market, please visit blog.columbiathreadneedleus.com/latest-perspectives.
You need investments that are designed to help you ease the impact of volatile market environments and keep the savings you have worked tirelessly to amass. Columbia Threadneedle Investments provides investment solutions to help you tackle financial challenges and achieve your desired outcome.
Best Regards,

Christopher O. Petersen
President, Columbia Funds
Excerpts from:
Taking the scare out of the volatility bogeyman
By Colin Moore, Global Chief Investment Officer

Colin Moore is the global chief investment officer for Columbia Threadneedle Investments. His responsibilities include ensuring that a disciplined investment process is in place across all asset classes, including equity and fixed income. Mr. Moore joined one of the Columbia Threadneedle Investments legacy firms in 2002 as head of equity and was also head of fixed income and liquidity strategies from 2009-2010.
| n | | In today’s low growth, higher volatility world, the emphasis is shifting from maximization of returns to consistency of returns. |
| n | | Portfolios should represent the behavioral risk-return tradeoff of investors, remembering that they won’t stay invested to realize the return if we get the risk tolerance wrong. |
Annual Report 2016
PRESIDENT’S MESSAGE (continued)
| n | | Holding long-term savings in cash to avoid volatility (the financial equivalent of hiding under the sheets) is detrimental to achieving long-term goals. |
According to Wikipedia, “The bogeyman is a common allusion to a mythical creature in many cultures used to control behavior. This monster has no specific appearance, and conceptions about it can vary drastically from household to household within the same community; in many cases he has no set appearance in the mind of an adult or child, but is simply a non-specific embodiment of terror.” Different cultures have different names and physical representations for the bogeyman, and investors are no different. We have terrible monsters that we fear may destroy our portfolios, and we call one of the scariest of them volatility.
While the bogeyman is mythical (I hope!), volatility is real and can cause serious damage. To understand why investors have such a hard time coping with volatility, we first need to define three cognitive biases at work in today’s investment environment:
| | 1) | | Recency bias — something that has recently come to the forefront of our attention, regardless of how long established it is, suddenly seems to appear with improbable frequency. |
| | 2) | | Negativity bias — we tend to have a greater recall of unpleasant memories than positive memories. |
| | 3) | | Loss aversion — our dissatisfaction with losing money tends to be greater than our satisfaction with making money. |
The level of volatility varies dramatically, and so does investor fear and panic selling — waxing when volatility rises, waning when it falls. Recent studies have pointed to demographics as an important driver of panic selling. The theory is that as people get closer to retirement, the prospects of a large (20%-30%) loss in financial assets can have a much more pronounced effect on their sense of well-being. Wealth preservation instincts kick in much more quickly than for younger (and typically less wealthy) savers.
The reality is that there is little opportunity for return without volatility. Therefore, the bogeyman effect of holding long-term savings in cash to avoid volatility (the financial equivalent of hiding under the sheets) is detrimental to achieving long-term goals. This effect tends to be more pronounced during the episodic spikes in volatility. The significant spike in volatility in 2008 and 2009 led to significant withdrawals from long-term investment funds over the same period. Less pronounced effects can also be seen when comparing 2001–2003 and 2011–2012. Conversely, flows picked up when volatility returned to “normal” levels. Investor behavior of this type is consistent with the three behavioral biases.
I believe average volatility will be higher over the next 10 years than the last 10 years and episodic spikes will increase in frequency because sustainable economic growth will be structurally lower and geopolitical risk higher than any time since World War II. Low growth creates uncertainty while loss aversion will make investors fear that we are one economic mishap or geopolitical event away from no growth or recession. The result will be higher volatility on average. Negativity bias will tend to exacerbate “spike” reactions to event-driven geopolitical news, and the volatility bogeyman will appear more often. Assuming the behavioral biases continue, investor returns are likely to be very disappointing regardless of the total return generated by financial markets due to the bogeyman effect.
To mitigate this effect, we need to focus on portfolio construction and an improved understanding of diversification. I accept that equities are likely to offer the highest return over the next 10 years, but they also offer the highest volatility. Many portfolio construction optimization tools use historical average volatility, which is likely to underestimate the volatility investors will face. The bogeyman emerges when individual asset class volatility spikes and cross correlations rise, the combination of which increases overall portfolio volatility far beyond expectation. Diversification is meant to protect investors against volatility, but what’s the point of owning lots of investments if the volatility bogeyman has not been properly estimated?
Most importantly, portfolios should be constructed to properly represent the behavioral risk-return tradeoff of investors, remembering that they won’t stay invested to realize the return if we get the risk tolerance wrong. In a low growth, higher volatility world, the emphasis is shifting to return consistency rather than return maximization, and investors are
Annual Report 2016
PRESIDENT’S MESSAGE (continued)
best served through investment approaches that appreciate that distinction. Even though it’s a permanent feature of financial markets, volatility is less likely to be the bogeyman we all fear if portfolios are constructed with this understanding.
Please visit blog.columbiathreadneedleus.com/latest-perspectives to read the entire article.
Investors should consider the investment objectives, risks, charges and expenses of a mutual fund carefully before investing. For a free prospectus and summary prospectus, which contains this and other important information about a fund, visit columbiathreadneedle.com/us. The prospectus should be read carefully before investing.
The views expressed are as of April 2016, may change as market or other conditions change, and may differ from views expressed by other Columbia Management Investment Advisers, LLC (CMIA) associates or affiliates. Actual investments or investment decisions made by CMIA and its affiliates, whether for its own account or on behalf of clients, will not necessarily reflect the views expressed. This information is not intended to provide investment advice and does not account for individual investor circumstances. Investment decisions should always be made based on an investor’s specific financial needs, objectives, goals, time horizon and risk tolerance. Asset classes described may not be suitable for all investors.
Past performance does not guarantee future results, and no forecast should be considered a guarantee either. Since economic and market conditions change frequently, there can be no assurance that the trends described here will continue or that the forecasts are accurate.
Diversification does not guarantee a profit or protect against loss.
Columbia Funds are distributed by Columbia Management Investment Distributors, Inc., member FINRA, and managed by Columbia Management Investment Advisers, LLC.
© 2016 Columbia Management Investment Advisers, LLC. All rights reserved
Annual Report 2016
| | | | |
| | |
| | ACTIVE PORTFOLIOS® MULTI-MANAGER GROWTH FUND | | |
TABLE OF CONTENTS
Fund Investment Manager
Columbia Management Investment
Advisers, LLC
225 Franklin Street
Boston, MA 02110
Fund Distributor
Columbia Management Investment
Distributors, Inc.
225 Franklin Street
Boston, MA 02110
Fund Transfer Agent
Columbia Management Investment
Services Corp.
P.O. Box 8081
Boston, MA 02266-8081
For more information about any of the funds, please visit columbiathreadneedle.com/us or call 800.345.6611. Customer Service Representatives are available to answer your questions Monday through Friday from 8 a.m. to 7 p.m. Eastern time.
The views expressed in this report reflect the current views of the respective parties. These views are not guarantees of future performance and involve certain risks, uncertainties and assumptions that are difficult to predict, so actual outcomes and results may differ significantly from the views expressed. These views are subject to change at any time based upon economic, market or other conditions and the respective parties disclaim any responsibility to update such views. These views may not be relied on as investment advice and, because investment decisions for a Columbia fund are based on numerous factors, may not be relied on as an indication of trading intent on behalf of any particular Columbia fund. References to specific securities should not be construed as a recommendation or investment advice.
Annual Report 2016
| | | | |
| | |
| | ACTIVE PORTFOLIOS® MULTI-MANAGER GROWTH FUND | | |
PERFORMANCE OVERVIEW
Performance Summary
| n | | Active Portfolios® Multi-Manager Growth Fund (the Fund) Class A shares returned -4.80% for the 12-month period that ended March 31, 2016. |
| n | | The Fund underperformed its benchmark, the Russell 1000 Growth Index, which returned 2.52% during the same time period. |
| n | | Stock selection within the CMIA-managed segment of the Fund accounted for the shortfall relative to the benchmark. |
| | | | | | | | | | |
Average Annual Total Returns (%) (for period ended March 31, 2016) | |
| | | Inception | | 1 Year | | | Life | |
Class A | | 04/20/12 | | | -4.80 | | | | 11.01 | |
Russell 1000 Growth Index | | | | | 2.52 | | | | 13.38 | |
All results shown assume reinvestment of distributions during the period. Returns do not reflect the deduction of taxes that a shareholder may pay on Fund distributions or on the redemption of Fund shares. Performance results reflect the effect of any fee waivers or reimbursements of Fund expenses by Columbia Management Investment Advisers, LLC and/or any of its affiliates. Absent these fee waivers or expense reimbursement arrangements, performance results would have been lower.
The performance information shown represents past performance and is not a guarantee of future results. The investment return and principal value of your investment will fluctuate so that your shares, when redeemed, may be worth more or less than their original cost. Current performance may be lower or higher than the performance information shown. You may obtain performance information current to the most recent month-end by contacting your financial intermediary, visiting columbiathreadneedle.com/us or calling 800.345.6611.
The Russell 1000 Growth Index, an unmanaged index, measures the performance of those Russell 1000 Index companies with higher price-to-book ratios and higher forecasted growth values.
Indices are not available for investment, are not professionally managed and do not reflect sales charges, fees, brokerage commissions, taxes or other expenses of investing. Securities in the Fund may not match those in an index.
| | | | |
| | |
| | ACTIVE PORTFOLIOS® MULTI-MANAGER GROWTH FUND | | |
PERFORMANCE OVERVIEW (continued)
|
Performance of a Hypothetical $10,000 Investment (April 20, 2012 — March 31, 2016) |
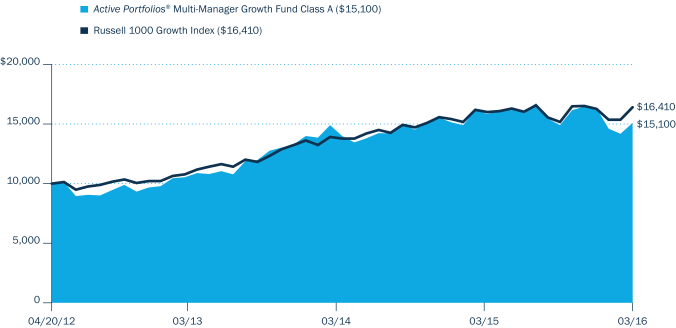
The chart above shows the change in value of a hypothetical $10,000 investment in Class A shares of Active Portfolios® Multi-Manager Growth Fund during the stated time period, and does not reflect the deduction of taxes that a shareholder may pay on Fund distributions or on the redemption of Fund shares.
| | | | |
| | |
| | ACTIVE PORTFOLIOS® MULTI-MANAGER GROWTH FUND | | |
MANAGER DISCUSSION OF FUND PERFORMANCE
Portfolio Management
Columbia Management Investment Advisers, LLC
Thomas Galvin, CFA
Todd Herget
Richard Carter
Loomis, Sayles & Company, L.P.
Aziz Hamzaogullari, CFA
Morningstar Style Box™
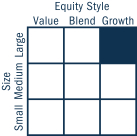
The Morningstar Style Box™ is based on a fund’s portfolio holdings. For equity funds, the vertical axis shows the market capitalization of the stocks owned, and the horizontal axis shows investment style (value, blend, or growth). Information shown is based on the most recent data provided by Morningstar.
© 2016 Morningstar, Inc. All rights reserved. The Morningstar information contained herein: (1) is proprietary to Morningstar and/or its content providers; (2) may not be copied or distributed; and (3) is not warranted to be accurate, complete or timely. Neither Morningstar nor its content providers are responsible for any damages or losses arising from any use of this information.
| | | | |
Top Ten Holdings (%)
(at March 31, 2016) | |
Facebook, Inc., Class A | | | 5.0 | |
Amazon.com, Inc. | | | 4.5 | |
Monster Beverage Corp. | | | 4.4 | |
Visa, Inc., Class A | | | 4.4 | |
Alibaba Group Holding Ltd., ADR | | | 3.7 | |
Novo Nordisk A/S, ADR | | | 3.5 | |
Bristol-Myers Squibb Co. | | | 2.5 | |
Illumina, Inc. | | | 2.4 | |
Splunk, Inc. | | | 2.3 | |
Cisco Systems, Inc. | | | 2.2 | |
Percentages indicated are based upon total investments (excluding Money Market Funds).
For further detail about these holdings, please refer to the section entitled “Portfolio of Investments.”
Fund holdings are as of the date given, are subject to change at any time, and are not recommendations to buy or sell any security.
Columbia Management Investment Advisers, LLC (CMIA) serves as the investment manager for the Fund and attempts to achieve the Fund’s objective by managing a portion of the Fund’s assets and selecting one or more subadvisers to manage other sleeves independently of each other and CMIA. A portion of the Fund’s assets is subadvised by Loomis, Sayles & Company, L.P. (Loomis Sayles). As of March 31, 2016, CMIA and Loomis Sayles managed approximately 56% and 44% of the portfolio, respectively.
For the 12-month period ended March 31, 2016, the Fund’s Class A shares returned -4.80% excluding sales charges. The Fund underperformed its benchmark, the Russell 1000 Growth Index, which returned 2.52% for the same time period. Stock selection within the CMIA-managed segment of the Fund accounted for the shortfall relative to the benchmark.
Mounting Global Pressures Weighed on Markets
Around the world, investors turned cautious over the 12-month period that ended March 31, 2016, as lackluster economic growth, contentious geopolitical conflicts and a shift in U.S. monetary policy weighed on confidence. Subpar global economic growth continued for a fourth straight year, with China’s slowdown heading the list of disappointments. Conflicts in the Middle East and terrorism, both at home and abroad, heightened security fears. Plummeting oil prices and a rising U.S. dollar rounded the list of mounting pressures in 2015, although they reversed course early in 2016. A widening trade deficit also negatively impacted growth.
Despite these setbacks, the U.S. economy continued to expand modestly for the seventh consecutive year. U.S. labor markets recovered to near-full employment and consumer spending strengthened somewhat. The housing market improved, although sales slipped near the end of the period as a new industry regulation led to longer closing periods. Manufacturing activity softened, putting a damper on growth. In December 2015, the Federal Reserve raised the target range of its benchmark interest rate by a quarter of a point. Mixed economic signals early in 2016 put additional rate hikes on hold — at least for now.
Stock market gains in the first half of the period were all but wiped out in the second half, despite a strong showing in the final month of the period. The S&P 500 Index, a broad measure of U.S. stock market performance, returned 1.78%, including dividends. In an increasingly risk-averse environment, investors flocked to the safety of U.S. Treasuries and low-growth, high-yielding defensive sectors of the stock market. As a result, the growth-oriented holdings in the CMIA-managed segment came under severe pressure and indiscriminate selling across high-growth equities (information technology and health care in particular) detracted from returns. These losses were partially offset by strong performance from the Loomis Sayles-subadvised segment. Stock selection and significant positions in some of the segment’s top performers bolstered the segment’s results.
Contributors and Detractors
CMIA: In the consumer discretionary sector, Amazon was a notable contributor to Fund performance. The company delivered an exceptional year on higher revenues and positive earnings. After a heavy period of capital expenditures, margins increased and led to higher profitability. Given the stock’s run this year, we trimmed the Fund’s position. However, we continue
| | | | |
| | |
| | ACTIVE PORTFOLIOS® MULTI-MANAGER GROWTH FUND | | |
MANAGER DISCUSSION OF FUND PERFORMANCE (continued)
to like the company’s long-term growth prospects. As evidenced from the 2015 holiday shopping season, e-commerce continued to take an increasing share of consumer spending, and we believe that Amazon is the clear leader in the field with its Prime membership and ecosystem.
In the information technology sector, the Fund’s exposure to certain high-growth companies with higher price-to-earnings multiples was a drag on performance, as many of these stocks came under selling pressure near the end of the Fund’s fiscal year. Professional social networking firm LinkedIn and wearable fitness tracking device manufacturer Fitbit were the most notable detractors. Late in the period, LinkedIn announced solid quarter-beating revenue and earnings estimates, yet shares dropped sharply because its guidance was lower than expected. The company has a history of conservative guidance estimates, but its recent announcement was seen as a significant deceleration of its business, resulting from economic headwinds in Europe and Asia. We maintained the Fund’s position in LinkedIn because we did not believe the company’s long-term prospects had been damaged. In fact, we believe that management has been prudently cautious in setting expectations, and we believed the recent sell-off was an overreaction in light of the company’s longer term opportunities. Fitbit, a position we established in the summer of 2015, struggled during the period. We believed that investors looked past the company’s strong results and increased full-year guidance to focus on projections, which indicated increased spending to ramp up product sales, and its share price declined. We continue to believe that the health-conscious wearables market remains attractive. However, we exited the position, as pessimism persisted regarding the company’s profit margins and the potential for increased competition. Software positions also detracted from Fund results. By contrast, a position in social media firm Facebook was a notable contributor to Fund returns as the company continued to execute well and gain share of global advertising.
Within the health care sector, the portfolio was hurt by its exposure to the biotechnology industry where drug pricing has been a political hot button in the highly polarized U.S. presidential primary races. In this regard, the Fund’s positions in Vertex Pharmaceuticals, Intercept Pharmaceuticals, Biogen, Alexion Pharmaceuticals and Celgene all sold off during the period and were relative detractors.
Loomis Sayles: Gains from positions in information technology, consumer discretionary and industrials stocks benefited performance relative to the benchmark. The Fund was overweight in information technology and underweight in consumer discretionary and industrials. Overweights and underweights are the result of bottom-up stock selection, rather than sector allocation.
The segment’s three top individual contributors were: Amazon, Facebook and Alphabet (Google). Rebounding from lows in late 2014 and early 2015 Amazon reported strong growth in revenue and gross merchandise volume. Social media company Facebook reported robust revenue growth (especially in mobile advertising revenue) throughout the period and continued to take market share with its growth more than three times its online competitors and many multiples faster than traditional advertisers. Alphabet reported solid results as Google advertising, the company’s core business, posted strong growth. YouTube and mobile search also helped drive growth during
| | | | |
Portfolio Breakdown (%)
(at March 31, 2016) | |
Common Stocks | | | 98.9 | |
Money Market Funds | | | 1.1 | |
Total | | | 100.0 | |
Percentages indicated are based upon total investments. The Fund’s portfolio composition is subject to change.
| | | | |
Equity Sector Breakdown (%)
(at March 31, 2016) | |
Consumer Discretionary | | | 11.7 | |
Consumer Staples | | | 12.1 | |
Energy | | | 1.1 | |
Financials | | | 4.1 | |
Health Care | | | 24.1 | |
Industrials | | | 4.0 | |
Information Technology | | | 42.3 | |
Materials | | | 0.6 | |
Total | | | 100.0 | |
Percentages indicated are based upon total equity investments. The Fund’s portfolio composition is subject to change.
Investment Risks
Market risk may affect a single issuer, sector of the economy, industry or the market as a whole. The Fund is managed by multiple advisers independently of one another, which may result in contradicting trades (i.e., with no net benefit to the Fund), while increasing transaction costs. Foreign investments subject the Fund to risks, including political, economic, market, social and others within a particular country, as well as to currency instabilities and less stringent financial and accounting standards generally applicable to U.S. issuers. Risks are enhanced for emerging market issuers. Growth securities, at times, may not perform as well as value securities or the stock market in general and may be out of favor with investors. Investments in a limited number of companies subject the Fund to greater risk of loss. The Fund may invest significantly in issuers within a particular sector, which may be negatively affected by market, economic or other conditions, making the Fund more vulnerable to unfavorable developments in the sector. See the Fund’s prospectus for more information on these and other risks.
| | | | |
| | |
| | ACTIVE PORTFOLIOS® MULTI-MANAGER GROWTH FUND | | |
MANAGER DISCUSSION OF FUND PERFORMANCE (continued)
the period, as margins improved and free cash flow growth was robust. All three of these top-performing stocks continued to sell at meaningful discounts to our estimate of their intrinsic values.
Fund holdings in the financials and consumer staples sectors detracted from overall returns relative to the benchmark. However, the three biggest disappointments in the portfolio were Qualcomm, an information technology stock, and Novartis and Varian Medical Systems in the health care sector. All three posted negative returns for the year.
Qualcomm has signed deals with some of the largest smartphone manufacturers in China. However, new licensing and improved reporting of devices shipped progressed slower than anticipated following the company’s positive settlement with China’s antitrust regulators. The company reported progress on its strategic realignment plan to improve shareholder value, but loss of market share in the premium-tier chipset market and higher-than-expected-share in the low- and mid-tier chipset markets hurt near term revenue. Novartis’s branded and generic pharmaceutical businesses reported solid results during the period. However, they were modestly offset by near-term weakness in the company’s Alcon eye care division. Varian Medical Systems, one of world’s leading manufacturer of radiation therapy equipment for the treatment of cancer, reported mixed results. A strong U.S. dollar hurt reported near-term results for its small imaging components business and regions outside United States. Share prices for all three of these companies embed expectations for growth well below our estimates and, in our view, offer compelling reward-to-risk opportunities.
We are patient investors and maintain coverage of high-quality businesses in order to take advantage of meaningful price dislocations if and when we believe they occur. During the previous fiscal year, we initiated a position in Certner Corporation, a leading supplier of health care information technology solutions. We believe the company possesses competitive advantages that are both sustainable and difficult to replicate, such as its brand, research and development, scale and large installed base of customers. We sold positions in Altera and Zimmer Biomet because both reached our estimate of intrinsic value.
Committed to Investment Approach
CMIA: We believe the first quarter of 2016 will go down as one of the most difficult periods in decades for high-quality growth stocks. While volatility is painful to endure, we continue to believe that patience is one of the most significant factors in long-term investment success. Markets can be very inefficient over the short term, but over the long term, markets have typically rewarded companies with superior earnings and growth. With these thoughts in mind, we remain optimistic about the Fund’s long-term prospects and view this recent period of volatility as an opportunity to seek out value and to stay the course.
Loomis Sayles: We remain committed to our long-term investment approach. We are an active manager with a long-term, private equity approach to investing. Through our proprietary bottom-up research framework, we look to invest in those few high-quality businesses with sustainable competitive advantages and profitable growth that trade at a significant discount to intrinsic value. All aspects of our investment thesis must be present simultaneously for us to make an investment.
| | | | |
| | |
| | ACTIVE PORTFOLIOS® MULTI-MANAGER GROWTH FUND | | |
UNDERSTANDING YOUR FUND’S EXPENSES
(Unaudited)
As an investor, you incur two types of costs. There are transaction costs, which generally include sales charges on purchases and may include redemption fees. There are also ongoing costs, which generally include management fees, distribution and/or service fees, and other fund expenses. The following information is intended to help you understand your ongoing costs (in dollars) of investing in the Fund and to help you compare these costs with the ongoing costs of investing in other mutual funds.
Analyzing Your Fund’s Expenses
To illustrate these ongoing costs, we have provided examples and calculated the expenses paid by investors of the Fund during the period. The actual and hypothetical information in the table is based on an initial investment of $1,000 at the beginning of the period indicated and held for the entire period. Expense information is calculated two ways and each method provides you with different information. The amount listed in the “Actual” column is calculated using the Fund’s actual operating expenses and total return for the period. You may use the Actual information, together with the amount invested, to estimate the expenses that you paid over the period. Simply divide your account value by $1,000 (for example, an $8,600 account value divided by $1,000 = 8.6), then multiply the results by the expenses paid during the period under the “Actual” column. The amount listed in the “Hypothetical” column assumes a 5% annual rate of return before expenses (which is not the Fund’s actual return) and then applies the Fund’s actual expense ratio for the period to the hypothetical return. You should not use the hypothetical account values and expenses to estimate either your actual account balance at the end of the period or the expenses you paid during the period. See “Compare With Other Funds” below for details on how to use the hypothetical data.
Compare With Other Funds
Since all mutual funds are required to include the same hypothetical calculations about expenses in shareholder reports, you can use this information to compare the ongoing cost of investing in the Fund with other funds. To do so, compare the hypothetical example with the 5% hypothetical examples that appear in the shareholder reports of other funds. As you compare hypothetical examples of other funds, it is important to note that hypothetical examples are meant to highlight the ongoing costs of investing in a fund only and do not reflect any transaction costs, such as sales charges, or redemption or exchange fees. Therefore, the hypothetical calculations are useful in comparing ongoing costs only, and will not help you determine the relative total costs of owning different funds. If transaction costs were included in these calculations, your costs would be higher.
October 1, 2015 – March 31, 2016
| | | | | | | | | | | | | | | | | | | | | | | | | | | | |
| | | Account Value at the
Beginning of the
Period ($) | | | Account Value at the
End of the
Period ($) | | | Expenses Paid During
the Period ($) | | | Fund’s Annualized
Expense Ratio (%) | |
| | | | Actual | | | | Hypothetical | | | | Actual | | | | Hypothetical | | | | Actual | | | | Hypothetical | | | | Actual | |
Class A | | | 1,000.00 | | | | 1,000.00 | | | | 1,012.10 | | | | 1,019.40 | | | | 5.63 | | | | 5.65 | | | | 1.12 | |
Expenses paid during the period are equal to the annualized expense ratio as indicated above, multiplied by the average account value over the period and then multiplied by the number of days in the Fund’s most recent fiscal half year and divided by 366.
Expenses do not include fees and expenses incurred indirectly by the Fund from its investment in underlying funds, including affiliated and non-affiliated pooled investment vehicles, such as mutual funds and exchange-traded funds.
| | | | |
| | |
| | ACTIVE PORTFOLIOS® MULTI-MANAGER GROWTH FUND | | |
PORTFOLIO OF INVESTMENTS
March 31, 2016
(Percentages represent value of investments compared to net assets)
| | | | | | | | |
| Common Stocks 98.9% | |
| Issuer | | Shares | | | Value ($) | |
CONSUMER DISCRETIONARY 11.6% | |
Automobiles 1.7% | |
| | |
Tesla Motors, Inc.(a) | | | 182,588 | | | | 41,953,245 | |
|
Hotels, Restaurants & Leisure 1.1% | |
| | |
Yum! Brands, Inc. | | | 349,275 | | | | 28,588,159 | |
|
Internet & Catalog Retail 6.5% | |
| | |
Amazon.com, Inc.(a) | | | 189,942 | | | | 112,757,169 | |
| | |
Priceline Group, Inc. (The)(a) | | | 42,093 | | | | 54,256,193 | |
| | | | | | | | | |
Total | | | | | | | 167,013,362 | |
|
Specialty Retail 0.4% | |
| | |
Lowe’s Companies, Inc. | | | 140,814 | | | | 10,666,661 | |
|
Textiles, Apparel & Luxury Goods 1.9% | |
| | |
Nike, Inc., Class B | | | 769,120 | | | | 47,277,806 | |
| | | | | | | | | |
Total Consumer Discretionary | | | | | | | 295,499,233 | |
| | |
| | | | | | | | |
CONSUMER STAPLES 11.9% | |
Beverages 7.2% | |
| | |
Coca-Cola Co. (The) | | | 950,441 | | | | 44,090,958 | |
| | |
Monster Beverage Corp.(a) | | | 839,789 | | | | 112,011,057 | |
| | |
SABMiller PLC, ADR | | | 438,013 | | | | 26,718,793 | |
| | | | | | | | | |
Total | | | | | | | 182,820,808 | |
|
Food & Staples Retailing 1.5% | |
| | |
CVS Health Corp. | | | 375,680 | | | | 38,969,286 | |
|
Food Products 1.7% | |
| | |
Danone SA, ADR | | | 3,095,105 | | | | 43,981,442 | |
|
Household Products 1.5% | |
| | |
Procter & Gamble Co. (The) | | | 476,921 | | | | 39,255,368 | |
| | | | | | | | | |
Total Consumer Staples | | | | | | | 305,026,904 | |
|
| |
ENERGY 1.1% | |
Energy Equipment & Services 1.1% | |
| | |
Schlumberger Ltd. | | | 381,633 | | | | 28,145,434 | |
| | | | | | | | | |
Total Energy | | | | | | | 28,145,434 | |
|
| |
FINANCIALS 4.0% | |
Capital Markets 1.2% | |
| | |
Greenhill & Co., Inc. | | | 76,513 | | | | 1,698,589 | |
| | |
SEI Investments Co. | | | 696,761 | | | | 29,995,561 | |
| | | | | | | | | |
Total | | | | | | | 31,694,150 | |
|
Consumer Finance 0.4% | |
| | |
American Express Co. | | | 170,713 | | | | 10,481,778 | |
|
Diversified Financial Services 2.4% | |
| | |
Factset Research Systems, Inc. | | | 132,920 | | | | 20,141,367 | |
| | |
Intercontinental Exchange, Inc. | | | 171,784 | | | | 40,393,290 | |
| | | | | | | | | |
Total | | | | | | | 60,534,657 | |
| | | | | | | | | |
Total Financials | | | | | | | 102,710,585 | |
| | | | | | | | |
| Common Stocks (continued) | |
| Issuer | | Shares | | | Value ($) | |
HEALTH CARE 23.8% | |
Biotechnology 10.4% | |
| | |
Alexion Pharmaceuticals, Inc.(a) | | | 365,575 | | | | 50,895,352 | |
| | |
Amgen, Inc. | | | 164,651 | | | | 24,686,124 | |
| | |
Biogen, Inc.(a) | | | 205,790 | | | | 53,571,253 | |
| | |
Celgene Corp.(a) | | | 515,314 | | | | 51,577,778 | |
| | |
Intercept Pharmaceuticals, Inc.(a) | | | 313,322 | | | | 40,252,477 | |
| | |
Vertex Pharmaceuticals, Inc.(a) | | | 567,420 | | | | 45,104,216 | |
| | | | | | | | | |
Total | | | | | | | 266,087,200 | |
|
Health Care Equipment & Supplies 2.7% | |
| | |
DexCom, Inc.(a) | | | 391,670 | | | | 26,598,310 | |
| | |
Edwards Lifesciences Corp.(a) | | | 189,490 | | | | 16,714,913 | |
| | |
Varian Medical Systems, Inc.(a) | | | 324,707 | | | | 25,983,054 | |
| | | | | | | | | |
Total | | | | | | | 69,296,277 | |
|
Health Care Technology 0.9% | |
| | |
Cerner Corp.(a) | | | 419,994 | | | | 22,242,882 | |
|
Life Sciences Tools & Services 2.3% | |
| | |
Illumina, Inc.(a) | | | 368,244 | | | | 59,696,035 | |
|
Pharmaceuticals 7.5% | |
| | |
Bristol-Myers Squibb Co. | | | 967,760 | | | | 61,820,509 | |
| | |
Merck & Co., Inc. | | | 282,117 | | | | 14,926,810 | |
| | |
Novartis AG, ADR | | | 349,914 | | | | 25,347,770 | |
| | |
Novo Nordisk A/S, ADR | | | 1,622,999 | | | | 87,950,316 | |
| | | | | | | | | |
Total | | | | | | | 190,045,405 | |
| | | | | | | | | |
Total Health Care | | | | | | | 607,367,799 | |
| | |
| | | | | | | | |
INDUSTRIALS 4.0% | |
Air Freight & Logistics 2.7% | |
| | |
Expeditors International of Washington, Inc. | | | 717,436 | | | | 35,018,051 | |
| | |
United Parcel Service, Inc., Class B | | | 306,254 | | | | 32,300,609 | |
| | | | | | | | | |
Total | | | | | | | 67,318,660 | |
|
Electrical Equipment 1.3% | |
| | |
Acuity Brands, Inc. | | | 155,000 | | | | 33,811,700 | |
| | | | | | | | | |
Total Industrials | | | | | | | 101,130,360 | |
|
| |
INFORMATION TECHNOLOGY 41.8% | |
Communications Equipment 3.7% | |
| | |
Cisco Systems, Inc. | | | 1,944,762 | | | | 55,367,374 | |
| | |
Palo Alto Networks, Inc.(a) | | | 236,820 | | | | 38,634,815 | |
| | | | | | | | | |
Total | | | | | | | 94,002,189 | |
|
Internet Software & Services 14.9% | |
| | |
Alibaba Group Holding Ltd., ADR(a) | | | 1,189,979 | | | | 94,044,040 | |
| | |
Alphabet, Inc., Class A(a) | | | 45,355 | | | | 34,601,329 | |
| | |
Alphabet, Inc., Class C(a) | | | 45,466 | | | | 33,869,897 | |
The accompanying Notes to Financial Statements are an integral part of this statement.
| | | | |
| | |
| | ACTIVE PORTFOLIOS® MULTI-MANAGER GROWTH FUND | | |
PORTFOLIO OF INVESTMENTS (continued)
March 31, 2016
| | | | | | | | |
| Common Stocks (continued) | |
| Issuer | | Shares | | | Value ($) | |
Facebook, Inc., Class A(a) | | | 1,116,546 | | | | 127,397,899 | |
| | |
LinkedIn Corp., Class A(a) | | | 315,185 | | | | 36,041,405 | |
| | |
MercadoLibre, Inc. | | | 456,280 | | | | 53,772,598 | |
| | | | | | | | | |
Total | | | | | | | 379,727,168 | |
|
IT Services 6.7% | |
| | |
Automatic Data Processing, Inc. | | | 119,430 | | | | 10,714,065 | |
| | |
Cognizant Technology Solutions Corp., Class A(a) | | | 777,512 | | | | 48,750,003 | |
| | |
Visa, Inc., Class A | | | 1,463,850 | | | | 111,955,248 | |
| | | | | | | | | |
Total | | | | | | | 171,419,316 | |
|
Semiconductors & Semiconductor Equipment 2.6% | |
| | |
Analog Devices, Inc. | | | 80,611 | | | | 4,771,365 | |
| | |
ARM Holdings PLC, ADR | | | 525,478 | | | | 22,958,134 | |
| | |
QUALCOMM, Inc. | | | 761,268 | | | | 38,931,245 | |
| | | | | | | | | |
Total | | | | | | | 66,660,744 | |
|
Software 13.9% | |
| | |
Adobe Systems, Inc.(a) | | | 562,900 | | | | 52,800,020 | |
| | |
Autodesk, Inc.(a) | | | 508,587 | | | | 29,655,708 | |
| | |
Microsoft Corp. | | | 546,041 | | | | 30,157,844 | |
| | |
Mobileye NV(a) | | | 1,461,086 | | | | 54,483,897 | |
| | |
Oracle Corp. | | | 1,315,534 | | | | 53,818,496 | |
| | |
Salesforce.com, Inc.(a) | | | 450,850 | | | | 33,286,256 | |
| | | | | | | | |
| Common Stocks (continued) | |
| Issuer | | Shares | | | Value ($) | |
ServiceNow, Inc.(a) | | | 680,260 | | | | 41,618,307 | |
| | |
Splunk, Inc.(a) | | | 1,203,437 | | | | 58,884,172 | |
| | | | | | | | | |
Total | | | | | | | 354,704,700 | |
| | | | | | | | | |
Total Information Technology | | | | | | | 1,066,514,117 | |
|
| |
MATERIALS 0.7% | |
Chemicals 0.7% | |
| | |
Sherwin-Williams Co. (The) | | | 58,070 | | | | 16,530,787 | |
| | | | | | | | | |
Total Materials | | | | | | | 16,530,787 | |
| | | | | | | | | |
Total Common Stocks | | | | | | | | |
(Cost: $2,355,403,758) | | | | | | | 2,522,925,219 | |
| | |
| | | | | | | | |
| Money Market Funds 1.1% | |
| | | Shares | | | Value ($) | |
| | |
Columbia Short-Term Cash Fund, 0.420%(b)(c) | | | 29,276,861 | | | | 29,276,861 | |
| | | | | | | | | |
Total Money Market Funds | | | | | | | | |
(Cost: $29,276,861) | | | | | | | 29,276,861 | |
| | | | | | | | | |
Total Investments | | | | | | | | |
(Cost: $2,384,680,619) | | | | | | | 2,552,202,080 | |
| | | | | | | | | |
Other Assets & Liabilities, Net | | | | 966,994 | |
| | | | | | | | | |
Net Assets | | | | | | | 2,553,169,074 | |
| | | | | | | | | |
Notes to Portfolio of Investments
| (a) | Non-income producing investment. |
| (b) | The rate shown is the seven-day current annualized yield at March 31, 2016. |
| (c) | As defined in the Investment Company Act of 1940, an affiliated company is one in which the Fund owns 5% or more of the company’s outstanding voting securities, or a company which is under common ownership or control with the Fund. Holdings and transactions in these affiliated companies during the year ended March 31, 2016 are as follows: |
| | | | | | | | | | | | | | | | | | | | | | | | |
| Issuer | | Beginning
Cost ($) | | | Purchase
Cost ($) | | | Proceeds
From Sales ($) | | | Ending
Cost ($) | | | Dividends —
Affiliated
Issuers ($) | | | Value ($) | |
Columbia Short-Term Cash Fund | | | 33,227,513 | | | | 1,054,041,091 | | | | (1,057,991,743 | ) | | | 29,276,861 | | | | 101,090 | | | | 29,276,861 | |
Abbreviation Legend
| | |
| ADR | | American Depositary Receipt |
Fair Value Measurements
The Fund categorizes its fair value measurements according to a three-level hierarchy that maximizes the use of observable inputs and minimizes the use of unobservable inputs by prioritizing that the most observable input be used when available. Observable inputs are those that market participants would use in pricing an investment based on market data obtained from sources independent of the reporting entity. Unobservable inputs are those that reflect the Fund’s assumptions about the information market participants would use in pricing an investment. An investment’s level within the fair value hierarchy is based on the lowest level of any input that is deemed significant to the asset’s or liability’s fair value measurement. The input levels are not necessarily an indication of the risk or liquidity associated with investments at that level. For example, certain U.S. government securities are generally high quality and liquid, however, they are reflected as Level 2 because the inputs used to determine fair value may not always be quoted prices in an active market.
Fair value inputs are summarized in the three broad levels listed below:
| n | | Level 1 — Valuations based on quoted prices for investments in active markets that the Fund has the ability to access at the measurement date (including NAV for open-end mutual funds). Valuation adjustments are not applied to Level 1 investments. |
The accompanying Notes to Financial Statements are an integral part of this statement.
| | | | |
| | |
| | ACTIVE PORTFOLIOS® MULTI-MANAGER GROWTH FUND | | |
PORTFOLIO OF INVESTMENTS (continued)
March 31, 2016
Fair Value Measurements (continued)
| n | | Level 2 — Valuations based on other significant observable inputs (including quoted prices for similar securities, interest rates, prepayment speeds, credit risks, etc.). |
| n | | Level 3 — Valuations based on significant unobservable inputs (including the Fund’s own assumptions and judgment in determining the fair value of investments). |
Inputs that are used in determining fair value of an investment may include price information, credit data, volatility statistics, and other factors. These inputs can be either observable or unobservable. The availability of observable inputs can vary between investments, and is affected by various factors such as the type of investment, and the volume and level of activity for that investment or similar investments in the marketplace. The inputs will be considered by the Investment Manager, along with any other relevant factors in the calculation of an investment’s fair value. The Fund uses prices and inputs that are current as of the measurement date, which may include periods of market dislocations. During these periods, the availability of prices and inputs may be reduced for many investments. This condition could cause an investment to be reclassified between the various levels within the hierarchy.
Certain investments that have been measured at fair value using the net asset value per share (or its equivalent) are not categorized in the fair value hierarchy. The fair value amounts presented in the table are intended to reconcile the fair value hierarchy to the amounts presented in the Portfolio of Investments. The Columbia Short-Term Cash Fund seeks to provide shareholders with maximum current income consistent with liquidity and stability of principal. Investments in Columbia Short-Term Cash Fund may be redeemed on a daily basis without restriction.
Investments falling into the Level 3 category are primarily supported by quoted prices from brokers and dealers participating in the market for those investments. However, these may be classified as Level 3 investments due to lack of market transparency and corroboration to support these quoted prices. Additionally, valuation models may be used as the pricing source for any remaining investments classified as Level 3. These models may rely on one or more significant unobservable inputs and/or significant assumptions by the Investment Manager. Inputs used in valuations may include, but are not limited to, financial statement analysis, capital account balances, discount rates and estimated cash flows, and comparable company data.
Under the direction of the Fund’s Board of Trustees (the Board), the Investment Manager’s Valuation Committee (the Committee) is responsible for overseeing the valuation procedures approved by the Board. The Committee consists of voting and non-voting members from various groups within the Investment Manager’s organization, including operations and accounting, trading and investments, compliance, risk management and legal.
The Committee meets at least monthly to review and approve valuation matters, which may include a description of specific valuation determinations, data regarding pricing information received from approved pricing vendors and brokers and the results of Board-approved valuation control policies and procedures (the Policies). The Policies address, among other things, instances when market quotations are or are not readily available, including recommendations of third party pricing vendors and a determination of appropriate pricing methodologies; events that require specific valuation determinations and assessment of fair value techniques; securities with a potential for stale pricing, including those that are illiquid, restricted, or in default; and the effectiveness of third party pricing vendors, including periodic reviews of vendors. The Committee meets more frequently, as needed, to discuss additional valuation matters, which may include the need to review back-testing results, review time-sensitive information or approve related valuation actions. The Committee reports to the Board, with members of the Committee meeting with the Board at each of its regularly scheduled meetings to discuss valuation matters and actions during the period, similar to those described earlier.
For investments categorized as Level 3, the Committee monitors information similar to that described above, which may include: (i) data specific to the issuer or comparable issuers, (ii) general market or specific sector news and (iii) quoted prices and specific or similar security transactions. The Committee considers this data and any changes from prior periods in order to assess the reasonableness of observable and unobservable inputs, any assumptions or internal models used to value those securities and changes in fair value. This data is also used to corroborate, when available, information received from approved pricing vendors and brokers. Various factors impact the frequency of monitoring this information (which may occur as often as daily). However, the Committee may determine that changes to inputs, assumptions and models are not required as a result of the monitoring procedures performed.
The accompanying Notes to Financial Statements are an integral part of this statement.
| | | | |
| | |
| | ACTIVE PORTFOLIOS® MULTI-MANAGER GROWTH FUND | | |
PORTFOLIO OF INVESTMENTS (continued)
March 31, 2016
Fair Value Measurements (continued)
The following table is a summary of the inputs used to value the Fund’s investments at March 31, 2016:
| | | | | | | | | | | | | | | | |
| | | Level 1
Quoted Prices in Active
Markets for Identical
Assets ($) | | | Level 2
Other Significant
Observable Inputs ($) | | | Level 3
Significant
Unobservable Inputs ($) | | | Total ($) | |
Investments | | | | | | | | | | | | | | | | |
| | | | |
Common Stocks | | | | | | | | | | | | | | | | |
| | | | |
Consumer Discretionary | | | 295,499,233 | | | | — | | | | — | | | | 295,499,233 | |
| | | | |
Consumer Staples | | | 305,026,904 | | | | — | | | | — | | | | 305,026,904 | |
| | | | |
Energy | | | 28,145,434 | | | | — | | | | — | | | | 28,145,434 | |
| | | | |
Financials | | | 102,710,585 | | | | — | | | | — | | | | 102,710,585 | |
| | | | |
Health Care | | | 607,367,799 | | | | — | | | | — | | | | 607,367,799 | |
| | | | |
Industrials | | | 101,130,360 | | | | — | | | | — | | | | 101,130,360 | |
| | | | |
Information Technology | �� | | 1,066,514,117 | | | | — | | | | — | | | | 1,066,514,117 | |
| | | | |
Materials | | | 16,530,787 | | | | — | | | | — | | | | 16,530,787 | |
| | | | | | | | | | | | | | | | | |
Total Common Stocks | | | 2,522,925,219 | | | | — | | | | — | | | | 2,522,925,219 | |
| | | | | | | | | | | | | | | | | |
Investments measured at NAV per share practical expedient | | | | | | | | | | | | | | | | |
| | | | |
Money Market Funds | | | — | | | | — | | | | — | | | | 29,276,861 | |
| | | | | | | | | | | | | | | | | |
Total Investments | | | 2,522,925,219 | | | | — | | | | — | | | | 2,552,202,080 | |
| | | | | | | | | | | | | | | | | |
See the Portfolio of Investments for all investment classifications not indicated in the table.
There were no transfers of financial assets between levels during the period.
The accompanying Notes to Financial Statements are an integral part of this statement.
| | | | |
| | |
| | ACTIVE PORTFOLIOS® MULTI-MANAGER GROWTH FUND | | |
STATEMENT OF ASSETS AND LIABILITIES
March 31, 2016
| | | | |
Assets | | | | |
| |
Investments, at value | | | | |
| |
Unaffiliated issuers (identified cost $2,355,403,758) | | | $2,522,925,219 | |
| |
Affiliated issuers (identified cost $29,276,861) | | | 29,276,861 | |
| |
Total investments (identified cost $2,384,680,619) | | | 2,552,202,080 | |
| |
Receivable for: | | | | |
| |
Capital shares sold | | | 5,856,154 | |
| |
Dividends | | | 1,914,869 | |
| |
Foreign tax reclaims | | | 431,264 | |
| |
Prepaid expenses | | | 6,732 | |
| |
Trustees’ deferred compensation plan | | | 31,507 | |
| |
Total assets | | | 2,560,442,606 | |
| |
| |
Liabilities | | | | |
| |
Payable for: | | | | |
| |
Capital shares purchased | | | 6,720,046 | |
| |
Investment management fees | | | 47,288 | |
| |
Distribution and/or service fees | | | 17,415 | |
| |
Transfer agent fees | | | 317,086 | |
| |
Compensation of board members | | | 1,839 | |
| |
Chief compliance officer expenses | | | 292 | |
| |
Other expenses | | | 138,059 | |
| |
Trustees’ deferred compensation plan | | | 31,507 | |
| |
Total liabilities | | | 7,273,532 | |
| |
Net assets applicable to outstanding capital stock | | | $2,553,169,074 | |
| |
| |
Represented by | | | | |
| |
Paid-in capital | | | $2,398,794,621 | |
| |
Excess of distributions over net investment income | | | (665,749 | ) |
| |
Accumulated net realized loss | | | (12,481,259 | ) |
| |
Unrealized appreciation (depreciation) on: | | | | |
| |
Investments | | | 167,521,461 | |
| |
Total — representing net assets applicable to outstanding capital stock | | | $2,553,169,074 | |
| |
| |
Class A | | | | |
| |
Net assets | | | $2,553,169,074 | |
| |
Shares outstanding | | | 210,308,228 | |
| |
Net asset value per share | | | $12.14 | |
| |
The accompanying Notes to Financial Statements are an integral part of this statement.
| | | | |
| | |
| | ACTIVE PORTFOLIOS® MULTI-MANAGER GROWTH FUND | | |
STATEMENT OF OPERATIONS
Year Ended March 31, 2016
| | | | |
Net investment income | | | | |
| |
Income: | | | | |
| |
Dividends — unaffiliated issuers | | | $17,081,639 | |
| |
Dividends — affiliated issuers | | | 101,090 | |
| |
Foreign taxes withheld | | | (466,707 | ) |
| |
Total income | | | 16,716,022 | |
| |
| |
Expenses: | | | | |
| |
Investment management fees | | | 15,828,966 | |
| |
Distribution and/or service fees | | | | |
| |
Class A | | | 5,776,564 | |
| |
Transfer agent fees | | | | |
| |
Class A | | | 3,465,264 | |
| |
Compensation of board members | | | 55,222 | |
| |
Custodian fees | | | 31,221 | |
| |
Printing and postage fees | | | 270,556 | |
| |
Registration fees | | | 144,150 | |
| |
Audit fees | | | 21,643 | |
| |
Legal fees | | | 78,318 | |
| |
Line of credit interest expense | | | 238 | |
| |
Chief compliance officer expenses | | | 1,117 | |
| |
Other | | | 118,344 | |
| |
Total expenses | | | 25,791,603 | |
| |
Net investment loss | | | (9,075,581 | ) |
| |
| |
Realized and unrealized gain (loss) — net | | | | |
| |
Net realized gain (loss) on: | | | | |
| |
Investments | | | 66,970,019 | |
| |
Net realized gain | | | 66,970,019 | |
| |
Net change in unrealized appreciation (depreciation) on: | | | | |
| |
Investments | | | (172,932,211 | ) |
| |
Net change in unrealized depreciation | | | (172,932,211 | ) |
| |
Net realized and unrealized loss | | | (105,962,192 | ) |
| |
Net decrease in net assets from operations | | | $(115,037,773 | ) |
| |
The accompanying Notes to Financial Statements are an integral part of this statement.
| | | | |
| | |
| | ACTIVE PORTFOLIOS® MULTI-MANAGER GROWTH FUND | | |
STATEMENT OF CHANGES IN NET ASSETS
| | | | | | | | |
| | | Year Ended
March 31, 2016 | | | Year Ended
March 31, 2015 | |
Operations | | | | | | | | |
| | |
Net investment loss | | | $(9,075,581 | ) | | | $(11,051,698 | ) |
| | |
Net realized gain | | | 66,970,019 | | | | 205,565,598 | |
| | |
Net change in unrealized appreciation (depreciation) | | | (172,932,211 | ) | | | 25,469,792 | |
| |
Net increase (decrease) in net assets resulting from operations | | | (115,037,773 | ) | | | 219,983,692 | |
| |
| | |
Distributions to shareholders | | | | | | | | |
| | |
Net realized gains | | | | | | | | |
| | |
Class A | | | (181,880,901 | ) | | | (224,723,028 | ) |
| |
Total distributions to shareholders | | | (181,880,901 | ) | | | (224,723,028 | ) |
| |
Increase in net assets from capital stock activity | | | 1,016,439,077 | | | | 303,960,903 | |
| |
Total increase in net assets | | | 719,520,403 | | | | 299,221,567 | |
| | |
Net assets at beginning of year | | | 1,833,648,671 | | | | 1,534,427,104 | |
| |
Net assets at end of year | | | $2,553,169,074 | | | | $1,833,648,671 | |
| |
Excess of distributions over net investment income | | | $(665,749 | ) | | | $(39,212 | ) |
| |
The accompanying Notes to Financial Statements are an integral part of this statement.
| | | | |
| | |
| | ACTIVE PORTFOLIOS® MULTI-MANAGER GROWTH FUND | | |
STATEMENT OF CHANGES IN NET ASSETS (continued)
| | | | | | | | | | | | | | | | |
| | | Year Ended
March 31, 2016 | | | Year Ended
March 31, 2015 | |
| | | Shares | | | Dollars ($) | | | Shares | | | Dollars ($) | |
Capital stock activity | | | | | | | | | | | | | | | | |
| | | | |
Class A shares | | | | | | | | | | | | | | | | |
| | | | |
Subscriptions | | | 101,726,398 | | | | 1,317,187,380 | | | | 35,065,687 | | | | 472,571,521 | |
| | | | |
Distributions reinvested | | | 13,504,371 | | | | 181,880,696 | | | | 17,410,669 | | | | 224,722,681 | |
| | | | |
Redemptions | | | (37,856,714 | ) | | | (482,628,999 | ) | | | (29,534,609 | ) | | | (393,333,299 | ) |
| |
Net increase | | | 77,374,055 | | | | 1,016,439,077 | | | | 22,941,747 | | | | 303,960,903 | |
| |
Total net increase | | | 77,374,055 | | | | 1,016,439,077 | | | | 22,941,747 | | | | 303,960,903 | |
| |
The accompanying Notes to Financial Statements are an integral part of this statement.
| | | | |
| | |
| | ACTIVE PORTFOLIOS® MULTI-MANAGER GROWTH FUND | | |
FINANCIAL HIGHLIGHTS
The following table is intended to help you understand the Fund’s financial performance. Certain information reflects financial results for a single share of a class held for the periods shown. Per share net investment income (loss) amounts are calculated based on average shares outstanding during the period. Total return assumes reinvestment of all dividends and distributions, if any. Total return does not reflect payment of sales charges, if any. Total return and portfolio turnover are not annualized for periods of less than one year. The portfolio turnover rate is calculated without regard to purchase and sales transactions of short-term instruments and certain derivatives, if any. If such transactions were included, the Fund’s portfolio turnover rate may be higher.
| | | | | | | | | | | | | | | | |
| | | Year Ended March 31, | |
Class A | | | 2016 | | | | 2015 | | | | 2014 | | | | 2013(a) | |
Per share data | | | | | | | | | | | | | | | | |
Net asset value, beginning of period | | | $13.79 | | | | $13.95 | | | | $10.89 | | | | $10.00 | |
| | | | | | | | | | | | | | | | | |
Income from investment operations: | | | | | | | | | | | | | | | | |
| | | | |
Net investment loss | | | (0.05 | ) | | | (0.09 | ) | | | (0.11 | ) | | | (0.04 | ) |
| | | | | | | | | | | | | | | | | |
Net realized and unrealized gain (loss) | | | (0.52 | ) | | | 1.75 | | | | 3.22 | | | | 0.93 | |
| | | | | | | | | | | | | | | | | |
Total from investment operations | | | (0.57 | ) | | | 1.66 | | | | 3.11 | | | | 0.89 | |
| | | | | | | | | | | | | | | | | |
Less distributions to shareholders: | | | | | | | | | | | | | | | | |
| | | | |
Net realized gains | | | (1.08 | ) | | | (1.82 | ) | | | (0.05 | ) | | | — | |
| | | | | | | | | | | | | | | | | |
Total distributions to shareholders | | | (1.08 | ) | | | (1.82 | ) | | | (0.05 | ) | | | — | |
| | | | | | | | | | | | | | | | | |
Net asset value, end of period | | | $12.14 | | | | $13.79 | | | | $13.95 | | | | $10.89 | |
| | | | | | | | | | | | | | | | | |
Total return | | | (4.80 | %) | | | 13.24 | % | | | 28.62 | % | | | 8.90 | % |
| | | | | | | | | | | | | | | | | |
Ratios to average net assets(b) | | | | | | | | | | | | | | | | |
| | | | |
Total gross expenses | | | 1.12 | %(c) | | | 1.16 | % | | | 1.19 | % | | | 1.25 | %(d) |
| | | | | | | | | | | | | | | | | |
Total net expenses(e) | | | 1.12 | %(c) | | | 1.16 | % | | | 1.19 | % | | | 1.19 | %(d) |
| | | | | | | | | | | | | | | | | |
Net investment loss | | | (0.39 | %) | | | (0.64 | %) | | | (0.87 | %) | | | (0.41 | %)(d) |
| | | | | | | | | | | | | | | | | |
Supplemental data | | | | | | | | | | | | | | | | |
| | | | |
Net assets, end of period (in thousands) | | | $2,553,169 | | | | $1,833,649 | | | | $1,534,427 | | | | $1,118,284 | |
| | | | | | | | | | | | | | | | | |
Portfolio turnover | | | 39 | % | | | 48 | % | | | 64 | % | | | 44 | % |
| | | | | | | | | | | | | | | | | |
Notes to Financial Highlights
| (a) | Based on operations from April 20, 2012 (commencement of operations) through the stated period end. |
| (b) | In addition to the fees and expenses that the Fund bears directly, the Fund indirectly bears a pro rata share of the fees and expenses of any other funds in which it invests. Such indirect expenses are not included in the Fund’s reported expense ratios. |
| (c) | Ratios include line of credit interest expense which is less than 0.01%. |
| (e) | Total net expenses include the impact of certain fee waivers/expense reimbursements made by the Investment Manager and certain of its affiliates, if applicable. |
The accompanying Notes to Financial Statements are an integral part of this statement.
| | | | |
| | |
| | ACTIVE PORTFOLIOS® MULTI-MANAGER GROWTH FUND | | |
NOTES TO FINANCIAL STATEMENTS
March 31, 2016
Note 1. Organization
Active Portfolios® Multi-Manager Growth Fund (the Fund), a series of Columbia Funds Series Trust I (the Trust), is a diversified fund. The Trust is registered under the Investment Company Act of 1940, as amended (the 1940 Act), as an open-end management investment company organized as a Massachusetts business trust.
Fund Shares
The Trust may issue an unlimited number of shares (without par value). The Fund only offers Class A shares that are available only to certain eligible investors through certain wrap fee programs sponsored and/or managed by Ameriprise Financial, Inc. (Ameriprise Financial) or its affiliates.
Class A shares are not subject to any front-end sales charge or contingent deferred sales charge.
Note 2. Summary of Significant Accounting Policies
Basis of Preparation
The Fund is an investment company that applies the accounting and reporting guidance in the Financial Accounting Standards Board (FASB) Accounting Standards Codification Topic 946, Financial Services — Investment Companies (ASC 946). The financial statements are prepared in accordance with U.S. generally accepted accounting principles (GAAP), which requires management to make certain estimates and assumptions that affect the reported amounts of assets and liabilities, the disclosure of contingent assets and liabilities at the date of the financial statements and the reported amounts of income and expenses during the reporting period. Actual results could differ from those estimates.
The following is a summary of significant accounting policies followed by the Fund in the preparation of its financial statements.
Security Valuation
All equity securities are valued at the close of business of the New York Stock Exchange (NYSE). Equity securities are valued at the last quoted sales price on the principal exchange or market on which they trade, except for securities traded on the NASDAQ Stock Market, which are valued at the NASDAQ official close price. Unlisted securities or listed securities for which there were no sales during the day are valued at the mean of the latest quoted bid and ask prices on such exchanges or markets.
Foreign equity securities are valued based on the closing price on the foreign exchange in which such securities are primarily traded. If any foreign equity security closing prices are not readily available, the securities are valued at the mean of the latest quoted bid and ask prices on such exchanges or markets. Foreign currency exchange rates are generally determined at 4:00 p.m. Eastern (U.S.) time. Many securities markets and exchanges outside the U.S. close prior to the close of the NYSE; therefore, the closing prices for securities in such markets or on such exchanges may not fully reflect events that occur after such close but before the close of the NYSE. In those situations, foreign securities will be fair valued pursuant to a policy adopted by the Board of Trustees (the Board), including, if available, utilizing a third party pricing service to determine these fair values. The third party pricing service takes into account multiple factors, including, but not limited to, movements in the U.S. securities markets, certain depositary receipts, futures contracts and foreign exchange rates that have occurred subsequent to the close of the foreign exchange or market, to determine a good faith estimate that reasonably reflects the current market conditions as of the close of the NYSE. The fair value of a security is likely to be different from the quoted or published price, if available.
Investments in open-end investment companies, including money market funds, are valued at their latest net asset value.
Investments for which market quotations are not readily available, or that have quotations which management believes are not reflective of market value or reliable, are valued at fair value as determined in good faith under procedures approved by and under the general supervision of the Board. If a security or class of securities (such as foreign securities) is valued at fair value, such value is likely to be different from the quoted or published price for the security.
The determination of fair value often requires significant judgment. To determine fair value, management may use assumptions including but not limited to future cash flows and estimated risk premiums. Multiple inputs from various sources may be used to determine fair value.
GAAP requires disclosure regarding the inputs and valuation techniques used to measure fair value and any changes in valuation inputs or techniques. In addition, investments shall be disclosed by major category. This information is disclosed following the Fund’s Portfolio of Investments.
| | | | |
| | |
| | ACTIVE PORTFOLIOS® MULTI-MANAGER GROWTH FUND | | |
NOTES TO FINANCIAL STATEMENTS (continued)
March 31, 2016
Security Transactions
Security transactions are accounted for on the trade date. Cost is determined and gains (losses) are based upon the specific identification method for both financial statement and federal income tax purposes.
Income Recognition
Corporate actions and dividend income are generally recorded net of any non-reclaimable tax withholdings, on the ex-dividend date or upon receipt of ex-dividend notification in the case of certain foreign securities.
The Fund may receive distributions from holdings in equity securities, business development companies (BDCs), exchange-traded funds, other regulated investment companies (RICs), and real estate investment trusts (REITs), which report information on the tax character of their distributions annually. These distributions are allocated to dividend income, capital gain and return of capital based on actual information reported. Return of capital is recorded as a reduction of the cost basis of securities held. If the Fund no longer owns the applicable securities, return of capital is recorded as a realized gain. With respect to REITs, to the extent actual information has not yet been reported, estimates for return of capital are made by the Fund’s management. Management’s estimates are subsequently adjusted when the actual character of the distributions is disclosed by the REITs, which could result in a proportionate change in return of capital to shareholders.
Awards from class action litigation are recorded as a reduction of cost basis if the Fund still owns the applicable securities on the payment date. If the Fund no longer owns the applicable securities, the proceeds are recorded as realized gains.
Expenses
General expenses of the Trust are allocated to the Fund and other funds of the Trust based upon relative net assets or other expense allocation methodologies determined by the nature of the expense. Expenses directly attributable to the Fund are charged to the Fund.
Federal Income Tax Status
The Fund intends to qualify each year as a regulated investment company under Subchapter M of the Internal Revenue Code, as amended, and will distribute substantially all of its taxable income (including net short-term capital gains), if any, for its tax year, and as such will not be subject to federal income taxes. In addition,
the Fund intends to distribute in each calendar year substantially all of its net investment income, capital gains and certain other amounts, if any, such that the Fund should not be subject to federal excise tax. Therefore, no federal income or excise tax provision is recorded.
Foreign Taxes
The Fund may be subject to foreign taxes on income, gains on investments or currency repatriation, a portion of which may be recoverable. The Fund will accrue such taxes and recoveries, as applicable, based upon its current interpretation of tax rules and regulations that exist in the markets in which it invests.
Realized gains in certain countries may be subject to foreign taxes at the Fund level, based on statutory rates. The Fund accrues for such foreign taxes on realized and unrealized gains at the appropriate rate for each jurisdiction, as applicable. The amount, if any, is disclosed as a liability on the Statement of Assets and Liabilities.
Distributions to Shareholders
Distributions from net investment income, if any, are declared and paid each calendar quarter. Net realized capital gains, if any, are distributed at least annually. Income distributions and capital gain distributions are determined in accordance with federal income tax regulations, which may differ from GAAP.
Guarantees and Indemnifications
Under the Trust’s organizational documents and, in some cases, by contract, its officers and trustees are indemnified against certain liabilities arising out of the performance of their duties to the Trust or its funds. In addition, certain of the Fund’s contracts with its service providers contain general indemnification clauses. The Fund’s maximum exposure under these arrangements is unknown since the amount of any future claims that may be made against the Fund cannot be determined, and the Fund has no historical basis for predicting the likelihood of any such claims.
Note 3. Fees and Other Transactions with Affiliates
Management Fees
Effective August 1, 2015, the Fund entered into a Management Agreement with Columbia Management Investment Advisers, LLC (the Investment Manager), a wholly-owned subsidiary of Ameriprise Financial. Under
| | | | |
| | |
| | ACTIVE PORTFOLIOS® MULTI-MANAGER GROWTH FUND | | |
NOTES TO FINANCIAL STATEMENTS (continued)
March 31, 2016
the Management Agreement, the Investment Manager provides the Fund with investment research and advice, as well as administrative and accounting services. The Investment Manager is responsible for the ultimate oversight of investments made by the Fund. The Fund’s subadviser (see Subadvisory Agreement below) has the primary responsibility for the day-to-day portfolio management of their portion of the Fund. The management services fee is an annual fee that is equal to a percentage of the Fund’s average daily net assets that declines from 0.77% to 0.57% as the Fund’s net assets increase. The effective management services fee rate for the year ended March 31, 2016 was 0.69% of the Fund’s average daily net assets.
Prior to August 1, 2015, the Fund paid the Investment Manager an annual fee for advisory services under an Investment Management Services Agreement and a separate annual fee for administrative and accounting services under an Administrative Services Agreement. For the period from April 1, 2015 through July 31, 2015, the investment advisory services fee paid to the Investment Manager was $4,662,175, and the administrative services fee paid to the Investment Manager was $392,250.
Subadvisory Agreement
The Investment Manager has entered into a Subadvisory Agreement with Loomis, Sayles & Company, L.P. (Loomis Sayles), to subadvise a portion of the Fund. The Investment Manager compensates Loomis Sayles to manage the investments of a portion of the Fund’s assets.
Compensation of Board Members
Board members, who are not officers or employees of the Investment Manager or Ameriprise Financial, are compensated for their services to the Fund as disclosed in the Statement of Operations. These Board members may participate in a Deferred Compensation Plan (the Plan) which may be terminated at any time. Obligations of the Plan will be paid solely out of the Fund’s assets, and all amounts payable under the Plan constitute a general unsecured obligation of the Fund.
Compensation of Chief Compliance Officer
The Board has appointed a Chief Compliance Officer to the Fund in accordance with federal securities regulations. The Fund is allocated a portion of the expenses associated with the Chief Compliance Officer based on relative net assets of the Trust.
Transfer Agency Fees
Under a Transfer and Dividend Disbursing Agent Agreement, Columbia Management Investment Services Corp. (the Transfer Agent), an affiliate of the Investment Manager and a wholly-owned subsidiary of Ameriprise Financial, is responsible for providing transfer agency services to the Fund. The Transfer Agent has contracted with Boston Financial Data Services (BFDS) to serve as sub-transfer agent.
The Transfer Agent receives a monthly transfer agency fee based on the number or the average value of accounts, depending on the type of account. In addition, the Transfer Agent also receives sub-transfer agency fees based on a percentage of the average aggregate value of the Fund’s shares maintained in omnibus accounts (other than omnibus accounts for which American Enterprise Investment Services Inc. is the broker of record or accounts where the beneficial shareholder is a customer of Ameriprise Financial Services, Inc., for which the Transfer Agent receives a per account fee). The Transfer Agent pays the fees of BFDS for services as sub-transfer agent and is not entitled to reimbursement for such fees from the Fund (with the exception of out-of-pocket fees).
The Transfer Agent also receives compensation from the Fund for various shareholder services and reimbursements for certain out-of-pocket fees.
For the year ended March 31, 2016, the Fund’s effective transfer agency fee rate as a percentage of average daily net assets for Class A shares was 0.15%.
An annual minimum account balance fee of $20 may apply to certain accounts with a value below the applicable Fund’s initial minimum investment requirements to reduce the impact of small accounts on transfer agency fees. These minimum account balance fees are remitted to the Fund and recorded as part of expense reductions in the Statement of Operations. For the year ended March 31, 2016, no minimum account balance fees were charged by the Fund.
Distribution and Service Fees
The Fund has an agreement with Columbia Management Investment Distributors, Inc. (the Distributor), an affiliate of the Investment Manager and a wholly-owned subsidiary of Ameriprise Financial, for distribution and shareholder services. The Board has approved, and the Fund has adopted, distribution and shareholder service plans (the Plans) applicable to certain share classes, which set the distribution and service fees for the Fund.
| | | | |
| | |
| | ACTIVE PORTFOLIOS® MULTI-MANAGER GROWTH FUND | | |
NOTES TO FINANCIAL STATEMENTS (continued)
March 31, 2016
These fees are calculated daily and are intended to compensate the Distributor and/or eligible selling and/or servicing agents for selling shares of the Fund and providing services to investors.
Under the Plans, the Fund pays a monthly service fee to the Distributor at the maximum annual rate of 0.25% of the average daily net assets attributable to Class A shares of the Fund, and a monthly distribution fee to the Distributor at the maximum annual rate of 0.25% of the average daily net assets attributable to Class A shares. However, the aggregate fee shall not exceed 0.25% of the Fund’s average daily net assets attributable to Class A shares.
Expenses Waived/Reimbursed by the Investment Manager and its Affiliates
The Fund’s expense ratio is subject to an expense reimbursement arrangement pursuant to which fees will be waived and/or expenses reimbursed (excluding certain fees and expenses described below), so that the Fund’s net operating expenses, after giving effect to fees waived/expenses reimbursed and any balance credits and/or overdraft charges from the Fund’s custodian, do not exceed the annual rates of:
| | | | | | | | |
| | | Contractual Expense Cap August 1, 2015 Through July 31, 2016 | | | Voluntary Expense Cap Prior to August 1, 2015 | |
Class A | | | 1.22 | % | | | 1.22 | % |
The contractual agreement may be modified or amended only with approval from the Investment Manager, certain of its affiliates and the Fund. Under the arrangements, the following fees and expenses are excluded from the waiver/reimbursement commitment, and therefore will be paid by the Fund, if applicable: taxes (including foreign transaction taxes), expenses associated with investments in affiliated and non-affiliated pooled investment vehicles (including mutual funds and exchange-traded funds), transaction costs and brokerage commissions, costs related to any securities lending program, dividend and interest expenses associated with securities sold short, inverse floater program fees and expenses, transaction charges and interest on borrowed money, interest and extraordinary expenses. Any fees waived and/or expenses reimbursed under the expense reimbursement arrangements described above are not recoverable by the Investment Manager or its affiliates in future periods.
Note 4. Federal Tax Information
The timing and character of income and capital gain distributions are determined in accordance with income tax regulations, which may differ from GAAP because of temporary or permanent book to tax differences.
At March 31, 2016, these differences are primarily due to differing treatment for deferral/reversal of wash sale losses, Trustees’ deferred compensation, net operating loss reclassification, non-deductible expenses, post-October capital losses and late-year ordinary losses. To the extent these differences are permanent, reclassifications are made among the components of the Fund’s net assets in the Statement of Assets and Liabilities. Temporary differences do not require reclassifications. In the Statement of Assets and Liabilities the following reclassifications were made:
| | | | |
Excess of distributions over net investment income | | | $8,449,044 | |
Paid-in capital | | | (8,449,044 | ) |
Net investment income (loss) and net realized gains (losses), as disclosed in the Statement of Operations, and net assets were not affected by this reclassification.
The tax character of distributions paid during the years indicated was as follows:
| | | | | | | | |
| | | Year Ended
March 31, 2016 ($) | | | Year Ended
March 31, 2015 ($) | |
Ordinary income | | | 5,619,411 | | | | 2,613,702 | |
Long-term capital gains | | | 176,261,490 | | | | 222,109,326 | |
Total | | | 181,880,901 | | | | 224,723,028 | |
Short-term capital gain distributions, if any, are considered ordinary income distributions for tax purposes.
At March 31, 2016, the components of distributable earnings on a tax basis were as follows:
| | | | |
Net unrealized appreciation | | | $164,686,013 | |
At March 31, 2016, the cost of investments for federal income tax purposes was $2,387,516,067 and the aggregate gross unrealized appreciation and depreciation based on that cost was:
| | | | |
Unrealized appreciation | | | $281,537,350 | |
Unrealized depreciation | | | (116,851,337 | ) |
Net unrealized appreciation | | | $164,686,013 | |
Under current tax rules, regulated investment companies can elect to treat certain late-year ordinary losses
| | | | |
| | |
| | ACTIVE PORTFOLIOS® MULTI-MANAGER GROWTH FUND | | |
NOTES TO FINANCIAL STATEMENTS (continued)
March 31, 2016
incurred and post-October capital losses (capital losses realized after October 31) as arising on the first day of the following taxable year. As of March 31, 2016, the Fund will elect to treat late-year ordinary losses of $615,491 and post-October capital losses of $9,645,811 as arising on April 1, 2016.
Management of the Fund has concluded that there are no significant uncertain tax positions in the Fund that would require recognition in the financial statements. However, management’s conclusion may be subject to review and adjustment at a later date based on factors including, but not limited to, new tax laws, regulations, and administrative interpretations (including relevant court decisions). Generally, the Fund’s federal tax returns for the prior three fiscal years remain subject to examination by the Internal Revenue Service.
Note 5. Portfolio Information
The cost of purchases and proceeds from sales of securities, excluding short-term investments and derivatives, if any, aggregated to $1,691,402,236 and $881,854,460, respectively, for the year ended March 31, 2016. The amount of purchase and sale activity impacts the portfolio turnover rate reported in the Financial Highlights.
Note 6. Affiliated Money Market Fund
The Fund invests in Columbia Short-Term Cash Fund, an affiliated money market fund established for the exclusive use by the Fund and other affiliated funds. The income earned by the Fund from such investments is included as Dividends — affiliated issuers in the Statement of Operations. As an investing fund, the Fund indirectly bears its proportionate share of the expenses of Columbia Short-Term Cash Fund.
Note 7. Line of Credit
The Fund has access to a revolving credit facility whereby the Fund may borrow for the temporary funding of shareholder redemptions or for other temporary or emergency purposes. Effective December 8, 2015, Citibank, N.A. and HSBC Bank USA, N.A. joined JPMorgan Chase Bank, N.A. (JPMorgan) as lead of a syndicate of banks under the credit facility, which is a collective agreement between the Fund and certain other funds managed by the Investment Manager, severally and not jointly, that permits collective borrowings up to $1 billion. Interest is charged to each participating fund based on its borrowings at a rate equal to the higher of (i) the
overnight federal funds rate plus 1.00% or (ii) the one-month LIBOR rate plus 1.00%. Each borrowing under the credit facility matures no later than 60 days after the date of borrowing. The Fund also pays a commitment fee equal to its pro rata share of the amount of the credit facility at a rate of 0.15% per annum. The commitment fee is included in other expenses in the Statement of Operations. Prior to December 8, 2015, JPMorgan was the sole lead bank under the credit facility agreement that permitted borrowings up to $550 million under the same terms and interest rates as described above with the exception of the commitment fee which was charged at a rate of 0.075% per annum.
For the year ended March 31, 2016, the average daily loan balance outstanding on days when borrowing existed was $6,000,000 at a weighted average interest rate of 1.43%. Interest expense incurred by the Fund is recorded as a line of credit interest expense in the Statement of Operations. The Fund had no outstanding borrowings at March 31, 2016.
Note 8. Significant Risks
Shareholder Concentration Risk
At March 31, 2016, affiliated shareholders of record owned 100.0% of the outstanding shares of the Fund in one or more accounts. Subscription and redemption activity by concentrated accounts may have a significant effect on the operations of the Fund. In the case of a large redemption, the Fund may be forced to sell investments at inopportune times, including its liquid or more liquid positions, resulting in Fund losses and the Fund holding a higher percentage of less liquid or illiquid securities. Large redemptions could result in decreased economies of scale and increased operating expenses for non-redeeming Fund shareholders.
Health Care Sector Risk
The Fund may be more susceptible to the particular risks that may affect companies in the health care sector than if it were invested in a wider variety of companies in unrelated sectors. Companies in the health care sector are subject to certain risks, including restrictions on government reimbursement for medical expenses, government approval of medical products and services, competitive pricing pressures, and the rising cost of medical products and services (especially for companies dependent upon a relatively limited number of products or services). Performance of such companies may be affected by factors including, government regulation,
| | | | |
| | |
| | ACTIVE PORTFOLIOS® MULTI-MANAGER GROWTH FUND | | |
NOTES TO FINANCIAL STATEMENTS (continued)
March 31, 2016
obtaining and protecting patents (or the failure to do so), product liability and other similar litigation as well as product obsolescence.
Technology and Technology-related Investment Risk
The Fund may be more susceptible to the particular risks that may affect companies in the information technology sector, as well as other technology-related sectors (collectively, the technology sectors) than if it were invested in a wider variety of companies in unrelated sectors. Companies in the technology sectors are subject to certain risks, including the risk that new services, equipment or technologies will not be accepted by consumers and businesses or will become rapidly obsolete. Performance of such companies may be affected by factors including obtaining and protecting patents (or the failure to do so) and significant competitive pressures, including aggressive pricing of their products or services, new market entrants, competition for market share and short product cycles due to an accelerated rate of technological developments. Such competitive pressures may lead to limited earnings and/or falling profit margins. As a result, the value of their securities may fall or fail to rise. In addition, many technology sector companies have limited operating histories and prices of these companies’ securities historically have been more volatile than other securities, especially over the short term.
Note 9. Subsequent Events
Management has evaluated the events and transactions that have occurred through the date the financial statements were issued and noted no items requiring adjustment of the financial statements or additional disclosure.
Note 10. Information Regarding Pending and Settled Legal Proceedings
In December 2005, without admitting or denying the allegations, American Express Financial Corporation (AEFC, which is now known as Ameriprise Financial, Inc. (Ameriprise Financial)) entered into settlement agreements with the Securities and Exchange Commission (SEC) and Minnesota Department of Commerce (MDOC) related to market timing activities. As a result, AEFC was censured and ordered to cease and desist from committing or causing any violations of
certain provisions of the Investment Advisers Act of 1940, the Investment Company Act of 1940, and various Minnesota laws. AEFC agreed to pay disgorgement of $10 million and civil money penalties of $7 million. AEFC also agreed to retain an independent distribution consultant to assist in developing a plan for distribution of all disgorgement and civil penalties ordered by the SEC in accordance with various undertakings detailed at http://www.sec.gov/litigation/admin/ia-2451.pdf. Ameriprise Financial and its affiliates have cooperated with the SEC and the MDOC in these legal proceedings, and have made regular reports to the Funds’ Boards of Trustees.
Ameriprise Financial and certain of its affiliates have historically been involved in a number of legal, arbitration and regulatory proceedings, including routine litigation, class actions, and governmental actions, concerning matters arising in connection with the conduct of their business activities. Ameriprise Financial believes that the Funds are not currently the subject of, and that neither Ameriprise Financial nor any of its affiliates are the subject of, any pending legal, arbitration or regulatory proceedings that are likely to have a material adverse effect on the Funds or the ability of Ameriprise Financial or its affiliates to perform under their contracts with the Funds. Ameriprise Financial is required to make quarterly (10-Q), annual (10-K) and, as necessary, 8-K filings with the SEC on legal and regulatory matters that relate to Ameriprise Financial and its affiliates. Copies of these filings may be obtained by accessing the SEC website at www.sec.gov.
There can be no assurance that these matters, or the adverse publicity associated with them, will not result in increased fund redemptions, reduced sale of fund shares or other adverse consequences to the Funds. Further, although we believe proceedings are not likely to have a material adverse effect on the Funds or the ability of Ameriprise Financial or its affiliates to perform under their contracts with the Funds, these proceedings are subject to uncertainties and, as such, we are unable to estimate the possible loss or range of loss that may result. An adverse outcome in one or more of these proceedings could result in adverse judgments, settlements, fines, penalties or other relief that could have a material adverse effect on the consolidated financial condition or results of operations of Ameriprise Financial.
| | | | |
| | |
| | ACTIVE PORTFOLIOS® MULTI-MANAGER GROWTH FUND | | |
REPORT OF INDEPENDENT REGISTERED PUBLIC ACCOUNTING FIRM
To the Trustees of Columbia Funds Series Trust I and the Shareholders of
Active Portfolios® Multi-Manager Growth Fund
In our opinion, the accompanying statement of assets and liabilities, including the portfolio of investments, and the related statements of operations and of changes in net assets and the financial highlights present fairly, in all material respects, the financial position of Active Portfolios® Multi-Manager Growth Fund (the “Fund,” a series of Columbia Funds Series Trust I) at March 31, 2016, and the results of its operations, the changes in its net assets and the financial highlights for each of the periods indicated, in conformity with accounting principles generally accepted in the United States of America. These financial statements and financial highlights (hereafter referred to as “financial statements”) are the responsibility of the Fund’s management. Our responsibility is to express an opinion on these financial statements based on our audits. We conducted our audits of these financial statements in accordance with the standards of the Public Company Accounting Oversight Board (United States). Those standards require that we plan and perform the audit to obtain reasonable assurance about whether the financial statements are free of material misstatement. An audit includes examining, on a test basis, evidence supporting the amounts and disclosures in the financial statements, assessing the accounting principles used and significant estimates made by management, and evaluating the overall financial statement presentation. We believe that our audits, which included confirmation of securities at March 31, 2016 by correspondence with the custodian, brokers and transfer agent, provide a reasonable basis for our opinion.
PricewaterhouseCoopers LLP
Minneapolis, MN
May 20, 2016
| | | | |
| | |
| | ACTIVE PORTFOLIOS® MULTI-MANAGER GROWTH FUND | | |
FEDERAL INCOME TAX INFORMATION
(Unaudited)
The Fund hereby designates the following tax attributes for the fiscal year ended March 31, 2016. Shareholders will be notified in early 2017 of the amounts for use in preparing 2016 income tax returns.
Tax Designations
| | | | |
Qualified Dividend Income | | | 100.00 | % |
Dividends Received Deduction | | | 100.00 | % |
Capital Gain Dividend | | | $81,971,610 | |
Qualified Dividend Income. For taxable, non-corporate shareholders, the percentage of ordinary income distributed during the fiscal year that represents qualified dividend income subject to reduced tax rates.
Dividends Received Deduction. The percentage of ordinary income distributed during the fiscal year that qualifies for the corporate dividends received deduction.
Capital Gain Dividend. The Fund designates as a capital gain dividend the amount reflected above, or if subsequently determined to be different, the net capital gain of such fiscal period.
| | | | |
| | |
| | ACTIVE PORTFOLIOS® MULTI-MANAGER GROWTH FUND | | |
TRUSTEES AND OFFICERS
Shareholders elect the Board that oversees the Fund’s operations. The Board appoints officers who are responsible for day-to-day business decisions based on policies set by the Board. The following table provides basic biographical information about the Fund’s Trustees, including their principal occupations during the past five years, although specific titles for individuals may have varied over the period. The year set forth beneath Length of Service in the table below is the year in which the Trustee was first appointed or elected as Trustee to any Fund currently in the Columbia Funds Complex or a predecessor thereof. Under current Board policy, members serve terms of indefinite duration.
Trustees
| | | | | | | | |
| Independent Trustees |
Name,
Address,
Year of Birth | | Position Held
With the Funds and
Length of Service | | Principal Occupation(s)
During the Past Five Years
and Other Relevant
Professional Experience | | Number of
Funds in the
Columbia Funds
Complex
Overseen | | Other Directorships
Held by Trustee
During the Past
Five Years |
Janet Langford Carrig c/o Columbia Management Investment Advisers, LLC, 225 Franklin Street Mail Drop BX32 05228, Boston, MA 02110 1957 | | Trustee 1996 | | Senior Vice President, General Counsel and Corporate Secretary, ConocoPhillips (integrated energy company) since September 2007 | | 58 | | None |
Douglas A. Hacker c/o Columbia Management Investment Advisers, LLC, 225 Franklin Street Mail Drop BX32 05228, Boston, MA 02110 1955 | | Trustee and Chairman of the Board 1996 | | Independent business executive since May 2006; Executive Vice President — Strategy of United Airlines from December 2002 to May 2006; President of UAL Loyalty Services (airline marketing company) from September 2001 to December 2002; Executive Vice President and Chief Financial Officer of United Airlines from July 1999 to September 2001 | | 58 | | Spartan Nash Company (food distributor); Nash Finch Company (food distributor) from 2005 to 2013; Aircastle Limited (aircraft leasing); SeaCube Container Leasing Ltd. (container leasing) from 2010 to 2013; and Travelport Worldwide Limited (travel information technology) |
Nancy T. Lukitsh c/o Columbia Management Investment Advisers, LLC, 225 Franklin Street Mail Drop BX32 05228, Boston, MA 02110 1956 | | Trustee 2011 | | Senior Vice President, Partner and Director of Marketing, Wellington Management Company, LLP (investment adviser) from 1997 to 2010; Chair, Wellington Management Portfolios (commingled non-U.S. investment pools) from 2007 to 2010; Director, Wellington Trust Company, NA and other Wellington affiliates from 1997 to 2010 | | 58 | | None |
William E. Mayer c/o Columbia Management Investment Advisers, LLC, 225 Franklin Street Mail Drop BX32 05228, Boston, MA 02110 1940 | | Trustee 1991 | | Partner, Park Avenue Equity Partners (private equity) since February 1999 | | 58 | | DynaVox Inc. (speech creation); Lee Enterprises (print media); WR Hambrecht + Co. (financial service provider) from 2000 to 2012; BlackRock Capital Investment Corporation (investment company); and Premier, Inc. (healthcare) |
| | | | |
| | |
| | ACTIVE PORTFOLIOS® MULTI-MANAGER GROWTH FUND | | |
TRUSTEES AND OFFICERS (continued)
| | | | | | | | |
| Independent Trustees (continued) |
Name,
Address,
Year of Birth | | Position Held
With the Funds and
Length of Service | | Principal Occupation(s)
During the Past Five Years
and Other Relevant
Professional Experience | | Number of
Funds in the
Columbia Funds
Complex
Overseen | | Other Directorships
Held by Trustee
During the Past
Five Years |
David M. Moffett c/o Columbia Management Investment Advisers, LLC, 225 Franklin Street Mail Drop BX32 05228, Boston, MA 02110 1952 | | Trustee 2011 | | Retired. Consultant to Bridgewater and Associates | | 58 | | Director of CIT Bank, CIT Group Inc. (commercial and consumer finance); eBay Inc. (online trading community); Genworth Financial, Inc. (financial and insurance products and services); Paypal Holdings Inc. (payment and data processing services); and Trustee University of Oklahoma Foundation |
Charles R. Nelson c/o Columbia Management Investment Advisers, LLC, 225 Franklin Street Mail Drop BX32 05228, Boston, MA 02110 1942 | | Trustee 1981 | | Retired. Professor Emeritus, University of Washington since 2011; Professor of Economics, University of Washington from 1976 to 2011; Ford and Louisa Van Voorhis Professor of Political Economy, University of Washington from 1993 to 2011; Adjunct Professor of Statistics, University of Washington from 1980 to 2011; Associate Editor, Journal of Money, Credit and Banking from September 1993 to 2008; consultant on econometric and statistical matters | | 58 | | None |
John J. Neuhauser c/o Columbia Management Investment Advisers, LLC, 225 Franklin Street Mail Drop BX32 05228, Boston, MA 02110 1943 | | Trustee 1984 | | President, Saint Michael’s College since August 2007; Director or Trustee of several non-profit organizations, including University of Vermont Medical Center; Academic Vice President and Dean of Faculties, Boston College from August 1999 to October 2005; University Professor, Boston College from November 2005 to August 2007 | | 58 | | Liberty All-Star Equity Fund and Liberty All- Star Growth Fund (closed-end funds) |
Patrick J. Simpson c/o Columbia Management Investment Advisers, LLC, 225 Franklin Street Mail Drop BX32 05228, Boston, MA 02110 1944 | | Trustee 2000 | | Of Counsel, Perkins Coie LLP (law firm) since 2015; Partner, Perkins Coie LLP from 1988 to 2014 | | 58 | | None |
Anne-Lee Verville c/o Columbia Management Investment Advisers, LLC, 225 Franklin Street Mail Drop BX32 05228, Boston, MA 02110 1945 | | Trustee 1998 | | Retired. General Manager, Global Education Industry from 1994 to 1997, President — Application Systems Division from 1991 to 1994, Chief Financial Officer — US Marketing & Services from 1988 to 1991, and Chief Information Officer from 1987 to 1988, IBM Corporation (computer and technology) | | 58 | | Enesco Group, Inc. (producer of giftware and home and garden decor products) from 2001 to 2006 |
| | | | |
| | |
| | ACTIVE PORTFOLIOS® MULTI-MANAGER GROWTH FUND | | |
TRUSTEES AND OFFICERS (continued)
| | | | | | | | |
| Interested Trustee Affiliated with Investment Manager* |
Name,
Address,
Year of Birth | | Position Held
With the Funds and
Length of Service | | Principal Occupation(s)
During the Past Five Years
and Other Relevant
Professional Experience | | Number of
Funds in the
Columbia Funds
Complex
Overseen | | Other Directorships
Held by Trustee
During the Past
Five Years |
William F. Truscott c/o Columbia Management Investment Advisers, LLC, 225 Franklin Street Boston, MA 02110 1960 | | Trustee 2012 | | Chairman of the Board and President, Columbia Management Investment Advisers, LLC since May 2010 and February 2012, respectively (previously President and Chief Investment Officer, 2001-April 2010); Chief Executive Officer, Global Asset Management, Ameriprise Financial, Inc. since September 2012 (previously Chief Executive Officer, U.S. Asset Management & President, Annuities, May 2010-September 2012 and President — U.S. Asset Management and Chief Investment Officer, 2005-April 2010); Director and Chief Executive Officer, Columbia Management Investment Distributors, Inc. since May 2010 and February 2012, respectively (previously Chairman of the Board and Chief Executive Officer, 2006-April 2010); Chairman of the Board and Chief Executive Officer, RiverSource Distributors, Inc. since 2006; Director, Threadneedle Asset Management Holdings, SARL since 2014; President and Chief Executive Officer, Ameriprise Certificate Company, 2006-August 2012. | | 178 | | Chairman of the Board, Columbia Management Investment Advisers, LLC since May 2010; Director, Columbia Management Investment Distributors, Inc. since May 2010; Former Director, Ameriprise Certificate Company, 2006-January 2013 |
| * | Interested person (as defined under the 1940 Act) by reason of being an officer, director, security holder and/or employee of the Investment Manager or Ameriprise Financial. |
The Statement of Additional Information has additional information about the Fund’s Board members and is available, without charge, upon request by calling 800.345.6611; contacting your financial intermediary; or visiting columbiathreadneedle.com/us.
The Board has appointed officers who are responsible for day-to-day business decisions based on policies it has established. The officers serve at the pleasure of the Board. The following table provides basic information about the Officers of the Fund, including principal occupations during the past five years, although their specific titles may have varied over the period. In addition to Mr. Truscott, who is Senior Vice President, the Fund’s other officers are:
| | | | |
| Fund Officers |
Name,
Address and
Year of Birth | | Position and Year
First Appointed to
Position for any Fund
in the Columbia
Funds Complex or a
Predecessor Thereof | | Principal Occupation(s) During Past Five Years |
Christopher O. Petersen 5228 Ameriprise Financial Center Minneapolis, MN 55474 Born 1970 | | President and Principal Executive Officer (2015) | | Vice President and Lead Chief Counsel, Ameriprise Financial, Inc. since January 2015 (previously, Vice President and Chief Counsel January 2010- December 2014; and Vice President and Group Counsel or Counsel 2004-January 2010); officer of Columbia Funds and affiliated funds since 2007. |
Michael G. Clarke 225 Franklin Street Boston, MA 02110 Born 1969 | | Treasurer (2011), Chief Financial Officer (2009) and Chief Accounting Officer (2015) | | Vice President — Mutual Fund Administration, Columbia Management Investment Advisers, LLC, since May 2010; Managing Director of Fund Administration, Columbia Management Advisors, LLC, September 2004-April 2010; senior officer of Columbia Funds and affiliated funds since 2002. |
Paul B. Goucher 100 Park Avenue New York, NY 10017 Born 1968 | | Senior Vice President (2011), Chief Legal Officer (2015) and Assistant Secretary (2008) | | Vice President and Lead Chief Counsel, Ameriprise Financial, Inc. since November 2008 and January 2013, respectively (previously Chief Counsel, January 2010-January 2013 and Group Counsel, November 2008-January 2010). |
| | | | |
| | |
| | ACTIVE PORTFOLIOS® MULTI-MANAGER GROWTH FUND | | |
TRUSTEES AND OFFICERS (continued)
| | | | |
| Fund Officers (continued) |
Name,
Address and
Year of Birth | | Position and Year
First Appointed to
Position for any Fund
in the Columbia
Funds Complex or a
Predecessor Thereof | | Principal Occupation(s) During Past Five Years |
Thomas P. McGuire 225 Franklin Street Boston, MA 02110 Born 1972 | | Senior Vice President and Chief Compliance Officer (2012) | | Vice President — Asset Management Compliance, Ameriprise Financial, Inc., since May 2010; Chief Compliance Officer, Ameriprise Certificate Company since September 2010; Compliance Executive, Bank of America, 2005-April 2010. |
Colin Moore 225 Franklin Street Boston, MA 02110 Born 1958 | | Senior Vice President (2010) | | Executive Vice President and Global Chief Investment Officer, Ameriprise Financial, Inc., since July 2013; Director and Global Chief Investment Officer, Columbia Management Investment Advisers, LLC since May 2010; Manager, Managing Director and Chief Investment Officer, Columbia Management Advisors, LLC, 2007-April 2010. |
Michael E. DeFao 225 Franklin Street Boston, MA 02110 Born 1968 | | Vice President (2011) and Assistant Secretary (2010) | | Vice President and Chief Counsel, Ameriprise Financial, Inc. since May 2010; Associate General Counsel, Bank of America, 2005-April 2010. |
Amy Johnson 5228 Ameriprise Financial Center Minneapolis, MN 55474 Born 1965 | | Vice President (2006) | | Managing Director and Chief Operating Officer, Columbia Management Investment Advisers, LLC since May 2010 (previously Chief Administrative Officer, 2009-April 2010, and Vice President — Asset Management and Trust Company Services, 2006-2009). |
Lyn Kephart-Strong 5228 Ameriprise Financial Center Minneapolis, MN 55474 Born 1960 | | Vice President (2015) | | President, Columbia Management Investment Services Corp. since October 2014; Vice President & Resolution Officer, Ameriprise Trust Company since August 2009; President, RiverSource Service Corporation 2004-2010. |
Ryan C. Larrenaga 225 Franklin Street Boston, MA 02110 Born 1970 | | Vice President and Secretary (2015) | | Vice President and Group Counsel, Ameriprise Financial, Inc. since August 2011 (previously, Counsel from May 2010 to August 2011); Assistant General Counsel, Bank of America, 2005-April 2010; officer of Columbia Funds and affiliated funds since 2005. |
| | | | |
| | |
| | ACTIVE PORTFOLIOS® MULTI-MANAGER GROWTH FUND | | |
IMPORTANT INFORMATION ABOUT THIS REPORT
Each fund mails one shareholder report to each shareholder address. If you would like more than one report, please call shareholder services at 800.345.6611 and additional reports will be sent to you.
The policy of the Board is to vote the proxies of the companies in which each fund holds investments consistent with the procedures as stated in the Statement of Additional Information (SAI). You may obtain a copy of the SAI without charge by calling 800.345.6611; contacting your financial intermediary; visiting columbiathreadneedle.com/us; or searching the website of the Securities and Exchange Commission (SEC) at sec.gov. Information regarding how each fund voted proxies relating to portfolio securities is filed with the SEC by August 31st for the most recent 12-month period ending June 30th of that year, and is available without charge by visiting columbiathreadneedle.com/us, or searching the website of the SEC at sec.gov.
Each fund files a complete schedule of portfolio holdings with the SEC for the first and third quarters of each fiscal year on Form N-Q. Each fund’s Form N-Q is available on the SEC’s website at sec.gov and may be reviewed and copied at the SEC’s Public Reference Room in Washington, D.C. Information on the operation of the Public Reference Room may be obtained by calling 800.SEC.0330. Each fund’s complete schedule of portfolio holdings, as filed on Form N-Q, can also be obtained without charge, upon request, by calling 800.345.6611.
Active Portfolios® Multi-Manager Growth Fund
P.O. Box 8081
Boston, MA 02266-8081
This information is for use with concurrent or prior delivery of a fund prospectus. Please read and consider the investment objectives, risks, charges and expenses for any fund carefully before investing. For a prospectus and summary prospectus, which contains this and other important information about the Fund, go to columbiathreadneedle.com/us. The Fund is distributed by Columbia Management Investment Distributors, Inc., member FINRA, and managed by Columbia Management Investment Advisers, LLC.
Columbia Threadneedle Investments (Columbia Threadneedle) is the global brand name of the Columbia and Threadneedle group of companies. All rights reserved. Columbia Management Investment Distributors, Inc., 225 Franklin Street, Boston, MA 02110-2804
© 2016 Columbia Management Investment Advisers, LLC.
columbiathreadneedle.com/us
ANN117_03_F01_(05/16)
Item 2. Code of Ethics.
(a) The registrant has adopted a code of ethics that applies to the registrant’s principal executive officer, principal financial officer, principal accounting officer or controller, or persons performing similar functions, regardless of whether these individuals are employed by the registrant or a third party.
(b) During the period covered by this report, there were not any amendments to a provision of the code of ethics adopted in 2(a) above.
(c) During the period covered by this report, there were no waivers, including any implicit waivers, from a provision of the code of ethics described in 2(a) above that relates to one or more of the items set forth in paragraph (b) of this item’s instructions.
Item 3. Audit Committee Financial Expert.
The registrant’s Board of Trustees has determined that Douglas A. Hacker, David M. Moffett and Anne-Lee Verville, each of whom are members of the registrant’s Board of Trustees and Audit Committee, each qualify as an audit committee financial expert. Mr. Hacker, Mr. Moffett and Ms. Verville are each independent trustees, as defined in paragraph (a)(2) of this item’s instructions.
Item 4. Principal Accountant Fees and Services.
Fee information below is disclosed for the three series of the registrant whose reports to stockholders are included in this annual filing.
(a) Audit Fees. Aggregate Audit Fees billed by the principal accountant for professional services rendered during the fiscal years ended March 31, 2016 and March 31, 2015 are approximately as follows:
2016 | | 2015 | |
$ | 66,100 | | $ | 66,100 | |
| | | | | |
Audit Fees include amounts related to the audit of the registrant’s annual financial statements or services that are normally provided by the accountant in connection with statutory and regulatory filings or engagements for those fiscal years.
(b) Audit-Related Fees. Aggregate Audit-Related Fees billed to the registrant by the principal accountant for professional services rendered during the fiscal years ended March 31, 2016 and March 31, 2015 are approximately as follows:
Audit-Related Fees include amounts for assurance and related services by the principal accountant that are reasonably related to the performance of the audit of the registrant’s financial statements and are not reported in Audit Fees above. In fiscal years 2016 and 2015, Audit-Related Fees consist of agreed-upon procedures performed for semi-annual shareholder reports.
During the fiscal years ended March 31, 2016 and March 31, 2015, there were no Audit-Related Fees billed by the registrant’s principal accountant to the registrant’s investment adviser (not including any sub-adviser whose role is primarily portfolio management and is subcontracted with or overseen by another investment adviser) and any entity controlling, controlled by, or under common control with the adviser that provides ongoing services to the registrant for an engagement that related directly to the operations and financial reporting of the registrant.
(c) Tax Fees. Aggregate Tax Fees billed by the principal accountant to the registrant for professional services rendered during the fiscal years ended March 31, 2016 and March 31, 2015 are approximately as follows:
2016 | | 2015 | |
$ | 16,700 | | $ | 14,400 | |
| | | | | |
Tax Fees include amounts for the review of annual tax returns, the review of required shareholder distribution calculations and typically include amounts for professional services by the principal accountant for tax compliance, tax advice and tax planning. Fiscal years 2016 and 2015 also include Tax Fees for agreed-upon procedures for foreign tax filings.
During the fiscal years ended March 31, 2016 and March 31, 2015, there were no Tax Fees billed by the registrant’s principal accountant to the registrant’s investment adviser (not including any sub-adviser whose role is primarily portfolio management and is subcontracted with or overseen by another investment adviser) and any entity controlling, controlled by, or under common control with the adviser that provides ongoing services to the registrant for an engagement that related directly to the operations and financial reporting of the registrant.
(d) All Other Fees. Aggregate All Other Fees billed by the principal accountant to the registrant for professional services rendered during the fiscal years ended March 31, 2016 and March 31, 2015 are approximately as follows:
All Other Fees include amounts for products and services provided by the principal accountant, other than the services reported in paragraphs (a) through (c) above.
Aggregate All Other Fees billed by the registrant’s principal accountant to the registrant’s investment adviser (not including any sub-adviser whose role is primarily portfolio management and is subcontracted with or overseen by another investment adviser) and any entity controlling, controlled by, or under common control with the adviser that provides ongoing services to the registrant for an engagement that related directly to the operations and financial reporting of the registrant during the fiscal years ended March 31, 2016 and March 31, 2015 are approximately as follows:
2016 | | 2015 | |
$ | 225,000 | | $ | 325,000 | |
| | | | | |
In fiscal years 2016 and 2015, All Other Fees primarily consists of fees billed for internal control examinations of the registrant’s transfer agent and investment adviser.
(e)(1) Audit Committee Pre-Approval Policies and Procedures
The registrant’s Audit Committee is required to pre-approve the engagement of the registrant’s independent auditors to provide audit and non-audit services to the registrant and non-audit services to its investment adviser (excluding any sub-adviser whose role is primarily portfolio management and is sub-contracted or overseen by another investment adviser (the “Adviser”) or any entity controlling, controlled by or under common control with the Adviser that provides ongoing services to the Fund (a “Control Affiliate”) if the engagement relates directly to the operations and financial reporting of the registrant.
The Audit Committee has adopted a Policy for Engagement of Independent Auditors for Audit and Non-Audit Services (the “Policy”). The Policy sets forth the understanding of the Audit Committee regarding the engagement of the registrant’s independent accountants to provide (i) audit and permissible audit-related, tax and other services to the registrant (“Fund Services”); (ii) non-audit services to the registrant’s Adviser and any Control Affiliates, that relates directly to the operations and financial reporting of a Fund (“Fund-related Adviser Services”); and (iii) certain other audit and non-audit services to the registrant’s Adviser and its Control Affiliates. A service will require specific pre-approval by the Audit Committee if it is to be provided by the Fund’s independent auditor; provided, however, that pre-approval of non-audit services to the Fund, the Adviser or Control Affiliates may be waived if certain de minimis requirements set forth in the SEC’s rules are met.
Under the Policy, the Audit Committee may delegate pre-approval authority to any pre-designated member or members who are independent board members. The member(s) to whom such authority is delegated must report, for informational purposes only, any pre-approval decisions to the Audit Committee at its next regular meeting. The Audit
Committee’s responsibilities with respect to the pre-approval of services performed by the independent auditor may not be delegated to management.
On an annual basis, at a regularly scheduled Audit Committee meeting, the Fund’s Treasurer or other Fund officer shall submit to the Audit Committee a schedule of the types of Fund Services and Fund-related Adviser Services that are subject to specific pre-approval. This schedule will provide a description of each type of service that is subject to specific pre-approval, along with total projected fees for each service. The pre-approval will generally cover a one-year period. The Audit Committee will review and approve the types of services and the projected fees for the next one-year period and may add to, or subtract from, the list of pre-approved services from time to time, based on subsequent determinations. This specific approval acknowledges that the Audit Committee is in agreement with the specific types of services that the independent auditor will be permitted to perform and the projected fees for each service.
The Fund’s Treasurer or other Fund officer shall report to the Audit Committee at each of its regular meetings regarding all Fund Services or Fund-related Adviser Services provided since the last such report was rendered, including a description of the services, by category, with forecasted fees for the annual reporting period, proposed changes requiring specific pre-approval and a description of services provided by the independent auditor, by category, with actual fees during the current reporting period.
*****
(e)(2) 100% of the services performed for items (b) through (d) above during 2016 and 2015 were pre-approved by the registrant’s Audit Committee.
(f) Not applicable.
(g) The aggregate non-audit fees billed by the registrant’s accountant for services rendered to the registrant, and rendered to the registrant’s investment adviser (not including any sub-adviser whose role is primarily portfolio management and is subcontracted with or overseen by another investment adviser), and any entity controlling, controlled by, or under common control with the adviser that provides ongoing services to the registrant during the fiscal years ended March 31, 2016 and March 31, 2015 are approximately as follows:
2016 | | 2015 | |
$ | 242,900 | | $ | 340,600 | |
| | | | | |
(h) The registrant’s Audit Committee of the Board of Directors has considered whether the provision of non-audit services that were rendered to the registrant’s adviser (not including any sub-adviser whose role is primarily portfolio management and is subcontracted with or overseen by another investment adviser), and any entity controlling, controlled by, or under common control with the investment adviser that provides ongoing services to the registrant that were not pre-approved pursuant to
paragraph (c)(7)(ii) of Rule 2-01 of Regulation S-X, is compatible with maintaining the principal accountant’s independence.
Item 5. Audit Committee of Listed Registrants.
Not applicable.
Item 6. Investments
(a) The registrant’s “Schedule I — Investments in securities of unaffiliated issuers” (as set forth in 17 CFR 210.12-12) is included in Item 1 of this Form N-CSR.
(b) Not applicable.
Item 7. Disclosure of Proxy Voting Policies and Procedures for Closed-End Management Investment Companies.
Not applicable.
Item 8. Portfolio Managers of Closed-End Management Investment Companies.
Not applicable.
Item 9. Purchases of Equity Securities by Closed-End Management Investment Company and Affiliated Purchasers.
Not applicable.
Item 10. Submission of Matters to a Vote of Security Holders.
There were no material changes to the procedures by which shareholders may recommend nominees to the registrant’s board of directors.
Item 11. Controls and Procedures.
(a) The registrant’s principal executive officer and principal financial officers, based on their evaluation of the registrant’s disclosure controls and procedures as of a date within 90 days of the filing of this report, have concluded that such controls and procedures are adequately designed to ensure that material information required to be disclosed by the registrant in Form N-CSR is accumulated and communicated to the registrant’s management, including the principal executive officer and principal financial officer, or persons performing similar functions, as appropriate to allow timely decisions regarding required disclosure.
(b) There was no change in the registrant’s internal control over financial reporting that occurred during the registrant’s second fiscal quarter of the period covered by this report that has materially affected, or is reasonably likely to materially affect, the registrant’s internal control over financial reporting.
Item 12. Exhibits.
(a)(1) Code of ethics required to be disclosed under Item 2 of Form N-CSR attached hereto as Exhibit 99.CODE ETH.
(a)(2) Certifications pursuant to Rule 30a-2(a) under the Investment Company Act of 1940 (17 CFR 270.30a-2(a)) attached hereto as Exhibit 99.CERT.
(a)(3) Not applicable.
(b) Certification pursuant to Rule 30a-2(b) under the Investment Company Act of 1940 (17 CFR 270.30a-2(b)) attached hereto as Exhibit 99.906CERT.
SIGNATURES
Pursuant to the requirements of the Securities Exchange Act of 1934 and the Investment Company Act of 1940, the registrant has duly caused this report to be signed on its behalf by the undersigned, thereunto duly authorized.
(registrant) | | Columbia Funds Series Trust I | |
| | |
| | |
By (Signature and Title) | | /s/ Christopher O. Petersen | |
| Christopher O. Petersen, President and Principal Executive Officer | |
| | |
| | |
Date | | May 20, 2016 | |
| | | | | |
Pursuant to the requirements of the Securities Exchange Act of 1934 and the Investment Company Act of 1940, this report has been signed below by the following persons on behalf of the registrant and in the capacities and on the dates indicated.
By (Signature and Title) | | /s/ Christopher O. Petersen | |
| Christopher O. Petersen, President and Principal Executive Officer | |
| | |
| | |
Date | | May 20, 2016 | |
| | | |
| | | |
By (Signature and Title) | | /s/ Michael G. Clarke | |
| | Michael G. Clarke, Treasurer and Chief Financial Officer | |
| | |
| | |
Date | | May 20, 2016 | |
| | | | |