UNITED STATES
SECURITIES AND EXCHANGE COMMISSION
Washington, D.C. 20549
FORM N-CSR
CERTIFIED SHAREHOLDER REPORT OF REGISTERED
MANAGEMENT INVESTMENT COMPANIES
Investment Company Act file number | 811-04367 |
|
Columbia Funds Series Trust I |
(Exact name of registrant as specified in charter) |
|
225 Franklin Street, Boston, Massachusetts | | 02110 |
(Address of principal executive offices) | | (Zip code) |
|
Ryan Larrenaga
c/o Columbia Management Investment Advisers, LLC
225 Franklin Street
Boston, MA 02110 |
(Name and address of agent for service) |
|
Registrant’s telephone number, including area code: | (800) 345-6611 | |
|
Date of fiscal year end: | December 31 | |
|
Date of reporting period: | December 31, 2015 | |
| | | | | | | | |
Form N-CSR is to be used by management investment companies to file reports with the Commission not later than 10 days after the transmission to stockholders of any report that is required to be transmitted to stockholders under Rule 30e-1 under the Investment Company Act of 1940 (17 CFR 270.30e-1). The Commission may use the information provided on Form N-CSR in its regulatory, disclosure review, inspection, and policymaking roles.
A registrant is required to disclose the information specified by Form N-CSR, and the Commission will make this information public. A registrant is not required to respond to the collection of information contained in Form N-CSR unless the Form displays a currently valid Office of Management and Budget (“OMB”) control number. Please direct comments concerning the accuracy of the information collection burden estimate and any suggestions for reducing the burden to Secretary, Securities and Exchange Commission, 450 Fifth Street, NW, Washington, DC 20549-0609. The OMB has reviewed this collection of information under the clearance requirements of 44 U.S.C. § 3507.
Item 1. Reports to Stockholders.

ANNUAL REPORT
December 31, 2015

COLUMBIA REAL ESTATE EQUITY FUND


ABOUT COLUMBIA THREADNEEDLE INVESTMENTS
Columbia Threadneedle Investments is a leading global asset management group that provides a broad range of actively managed investment strategies and solutions for individual, institutional and corporate clients around the world.
With more than 2,000 people, including over 450 investment professionals based in North America, Europe and Asia, we manage $471 billion* of assets across developed and emerging market equities, fixed income, asset allocation solutions and alternatives. We are the 13th largest manager of long-term mutual fund assets in the U.S.** and the 4th largest manager of retail funds in the U.K.***
Our priority is the investment success of our clients. We aim to deliver the investment outcomes they expect through an investment approach that is team-based, performance-driven and risk-aware. Our culture is dynamic and interactive. By sharing our insights across asset classes and geographies, we generate richer perspectives on global, regional and local investment landscapes. The ability to exchange and debate investment ideas in a collaborative environment enriches our teams' investment processes. More importantly, it results in better informed investment decisions for our clients.
Columbia funds are distributed by Columbia Management Investment Distributors, Inc., member FINRA, and managed by Columbia Management Investment Advisers, LLC.
Columbia Threadneedle Investments (Columbia Threadneedle) is the global brand name of the Columbia and Threadneedle group of companies.
* In U.S. dollars as of September 30, 2015. Source: Ameriprise Q3 Earnings Release. Includes all assets managed by entities in the Columbia and Threadneedle groups of companies. Contact us for more current data.
** Source: ICI as of September 30, 2015 for Columbia Management Investment Advisers, LLC.
*** Source: Investment Association as of September 2015 for Threadneedle Asset Management Limited.
© 2015 Columbia Management Investment Advisers, LLC. All rights reserved.
Not part of the shareholder report
Investment strategies to help meet investor needs
We are committed to helping investors navigate financial challenges to reach their desired outcomes. The possibilities are endless.
Your success is our priority.
 Retire comfortably
 Fund college or higher education
 Leave a legacy

Generate an appropriate stream of income in retirement
Traditional approaches to income may no longer be adequate — and they may no longer provide the diversification benefits they once did. Investors need to rethink how they generate retirement income.
Worried about running out of income? You are not alone.

Navigate a changing interest rate environment
Even in today's challenging interest rate environment, it's still possible to navigate markets and achieve your goals.
Make investment choices designed specifically for this market environment.

Maximize after-tax returns
In an environment where what you keep is more important than what you earn, municipal bonds can help mitigate higher taxes while providing attractive yields compared to other investment options.
You've worked too hard building your wealth to lose it to taxes.

Grow assets to achieve financial goals
Finding growth opportunities in today's complex market environment requires strong research capabilities, creative thinking and a disciplined approach.
Do your investments deliver the portfolio growth you need?

Ease the impact of volatile markets
With increasing concerns about market volatility, investors should consider diversifying their portfolios with non-traditional holdings.
Interested in turning volatility into opportunity?
To find out more, contact your financial professional, call 800.426.3750 or visit columbiathreadneedle.com/us
Not part of the shareholder report
Get the market insight you need from our investment experts and subscribe to our latest publications


Stay informed with Columbia Threadneedle Investments
Investor insight
Find economic and market commentary, investment videos, white papers, mutual fund commentary and more at columbiathreadneedle.com/us.
Subscribe to the latest information from Columbia Threadneedle. Register your information online at columbiathreadneedle.com/us/subscribe and select the publications you would like to receive, including:
n Columbia Threadneedle Investor Newsletter, highlighting the latest macro- and micro-economic trends, investment themes, products, service changes and other items of interest to our investors
n Investment Strategy Outlook, showcasing the Columbia Threadneedle Asset Allocation Team's perspective on global economic investment conditions and markets
n MarketTrack, featuring straightforward insight on current investment opportunities
n White papers that delve deep into a variety of investment topics
n Quarterly portfolio manager commentary and fund fact sheets
Update your subscriptions at any time by accessing the email subscription center.
Social media 
We offer you multiple ways to access our market commentary and investment insights.
n Perspectives blog at columbiathreadneedle.com/us
Read timely posts by our investment team, including our chief investment officer, chief economist and portfolio managers.
n Twitter.com/CTinvest_US
Follow us on Twitter for quick, up-to-the-minute comments on market news and more.
n Youtube.com/CTInvestUS
View our commentaries on the economy, markets and current investment opportunities.
n Linkedin.com/company/Columbia-Threadneedle-Investments-US
Connect with us on LinkedIn for updates from our thought leaders.
Not part of the shareholder report
 Dear Shareholder,
Today's investors are typically focused on outcomes, like living a certain retirement lifestyle, paying for college education or building a legacy. But in today's complex global investment landscape, even simple goals are not easily achieved.
At Columbia Threadneedle Investments, we aspire to help satisfy five core needs of today's investors:
n Generate an appropriate stream of income in retirement
Traditional approaches to generating income may not provide the diversification benefits they once did, and they may actually introduce unwanted risk in today's market. To seek to improve your potential to live comfortably long term, we endeavor to pursue investments that explore less traveled paths to income.
n Navigate a changing interest rate environment
Today's uncertain market environment includes the prospect of a rise in interest rates. Blending traditional investments with non-traditional or alternative products may help protect your wealth during periods of volatility. We can attempt to help strengthen your portfolio with agile products designed to take on the market's ups and downs.
n Maximize after-tax returns
In an environment where what you keep may be more important than what you earn, municipal bonds can help mitigate high tax burdens while providing potentially attractive yields. Our state and federal tax-exempt products are aimed at helping investors manage risk, minimize the fluctuation of capital and grow wealth on a more tax-efficient basis.
n Grow assets to achieve financial goals
We believe that finding and protecting growth comes from a disciplined security selection process designed to create excess return. Our goal is to provide investment solutions built to help you face today's market challenges and grow your assets at each crossroad of your journey.
n Ease the impact of volatile markets
Despite a bull market run that has benefited many investors over the past several years, it's important to remember the lessons of 2008 and the value that a well-diversified portfolio may provide through times of market volatility. We are here to help you hold onto the savings you have worked tirelessly to amass, and to provide you the best opportunity to maintain your standard of living regardless of market conditions.
Find out today how we can help you confidently invest to realize your dreams. Please visit us at blog.columbiathreadneedleus.com/our-best-ideas to learn more about our unique investment solutions.
The world is constantly changing, but our priority remains the same: to help you secure your finances, meet your goals and achieve success. Thank you for your continued investment with us.
Sincerely,

Christopher O. Petersen
President, Columbia Funds
Investors should consider the investment objectives, risks, charges and expenses of a mutual fund carefully before investing. For a free prospectus and summary prospectus, which contains this and other important information about a fund, visit columbiathreadneedle.com/us. The prospectus should be read carefully before investing.
Columbia Funds are distributed by Columbia Management Investment Distributors, Inc., member FINRA, and managed by Columbia Management Investment Advisers, LLC.
© 2016 Columbia Management Investment Advisers, LLC. All rights reserved.
COLUMBIA REAL ESTATE EQUITY FUND
Fund Investment Manager
Columbia Management Investment
Advisers, LLC
225 Franklin Street
Boston, MA 02110
Fund Distributor
Columbia Management Investment
Distributors, Inc.
225 Franklin Street
Boston, MA 02110
Fund Transfer Agent
Columbia Management Investment
Services Corp.
P.O. Box 8081
Boston, MA 02266-8081
For more information about any of the funds, please visit columbiathreadneedle.com/us or call 800.345.6611. Customer Service Representatives are available to answer your questions Monday through Friday from 8 a.m. to 7 p.m. Eastern time.
The views expressed in this report reflect the current views of the respective parties. These views are not guarantees of future performance and involve certain risks, uncertainties and assumptions that are difficult to predict, so actual outcomes and results may differ significantly from the views expressed. These views are subject to change at any time based upon economic, market or other conditions and the respective parties disclaim any responsibility to update such views. These views may not be relied on as investment advice and, because investment decisions for a Columbia fund are based on numerous factors, may not be relied on as an indication of trading intent on behalf of any particular Columbia fund. References to specific securities should not be construed as a recommendation or investment advice.
Performance Overview | | | 3 | | |
Manager Discussion of Fund Performance | | | 5 | | |
Understanding Your Fund's Expenses | | | 8 | | |
Portfolio of Investments | | | 9 | | |
Statement of Assets and Liabilities | | | 12 | | |
Statement of Operations | | | 14 | | |
Statement of Changes in Net Assets | | | 15 | | |
Financial Highlights | | | 18 | | |
Notes to Financial Statements | | | 28 | | |
Report of Independent Registered Public Accounting Firm | | | 36 | | |
Federal Income Tax Information | | | 37 | | |
Trustees and Officers | | | 38 | | |
Important Information About This Report | | | 43 | | |
Annual Report 2015
COLUMBIA REAL ESTATE EQUITY FUND
Performance Summary
n Columbia Real Estate Equity Fund (the Fund) Class A shares returned 4.32% excluding sales charges for the 12-month period that ended December 31, 2015.
n The Fund outperformed its benchmark, the FTSE NAREIT Equity REITs Index, which returned 3.20% for the same period.
n Allocation decisions overall contributed most favorably to the Fund's performance during the annual period, though stock selection as a whole also added value.
Average Annual Total Returns (%) (for period ended December 31, 2015)
| | | Inception | | 1 Year | | 5 Years | | 10 Years | |
Class A | | 11/01/02 | | | | | | | | | | | | | |
Excluding sales charges | | | | | | | 4.32 | | | | 10.83 | | | | 6.72 | | |
Including sales charges | | | | | | | -1.66 | | | | 9.52 | | | | 6.09 | | |
Class B | | 11/01/02 | | | | | | | | | | | | | |
Excluding sales charges | | | | | | | 3.52 | | | | 10.00 | | | | 5.93 | | |
Including sales charges | | | | | | | -1.28 | | | | 9.72 | | | | 5.93 | | |
Class C | | 10/13/03 | | | | | | | | | | | | | |
Excluding sales charges | | | | | | | 3.53 | | | | 10.00 | | | | 5.93 | | |
Including sales charges | | | | | | | 2.57 | | | | 10.00 | | | | 5.93 | | |
Class I* | | 09/27/10 | | | 4.78 | | | | 11.37 | | | | 7.12 | | |
Class K* | | 03/07/11 | | | 4.46 | | | | 10.99 | | | | 6.88 | | |
Class R* | | 09/27/10 | | | 4.06 | | | | 10.56 | | | | 6.34 | | |
Class R4* | | 11/08/12 | | | 4.56 | | | | 11.08 | | | | 6.98 | | |
Class R5* | | 03/07/11 | | | 4.74 | | | | 11.23 | | | | 7.06 | | |
Class W* | | 09/27/10 | | | 4.32 | | | | 10.83 | | | | 6.76 | | |
Class Z | | 04/01/94 | | | 4.57 | | | | 11.10 | | | | 6.99 | | |
FTSE NAREIT Equity REITs Index | | | | | | | 3.20 | | | | 11.96 | | | | 7.41 | | |
Returns for Class A are shown with and without the maximum initial sales charge of 5.75%. Returns for Class B are shown with and without the applicable contingent deferred sales charge (CDSC) of 5.00% in the first year, declining to 1.00% in the sixth year and eliminated thereafter. Returns for Class C are shown with and without the 1.00% contingent deferred sales charge for the first year only. The Fund's other classes are not subject to sales charges and have limited eligibility. Please see the Fund's prospectus for details. Performance for different share classes will vary based on differences in sales charges and fees associated with each class. All results shown assume reinvestment of distributions during the period. Returns do not reflect the deduction of taxes that a shareholder may pay on Fund distributions or on the redemption of Fund shares. Performance results reflect the effect of any fee waivers or reimbursements of Fund expenses by Columbia Management Investment Advisers, LLC and/or any of its affiliates. Absent these fee waivers or expense reimbursement arrangements, performance results would have been lower.
The performance information shown represents past performance and is not a guarantee of future results. The investment return and principal value of your investment will fluctuate so that your shares, when redeemed, may be worth more or less than their original cost. Current performance may be lower or higher than the performance information shown. You may obtain performance information current to the most recent month-end by contacting your financial intermediary, visiting columbiathreadneedle.com/us or calling 800.345.6611.
*The returns shown for periods prior to the share class inception date (including returns for the Life of the Fund, if shown, which are since Fund inception) include the returns of the Fund's oldest share class. These returns are adjusted to reflect any higher class-related operating expenses of the newer share classes, as applicable. Please visit columbiathreadneedle.com/us/investment-products/mutual-funds/appended-performance for more information.
The FTSE NAREIT Equity REITs Index reflects performance of all publicly traded equity real estate investment trusts (REITs), other than those designated as timber REITs.
Indices are not available for investment, are not professionally managed and do not reflect sales charges, fees, brokerage commissions, taxes or other expenses of investing. Securities in the Fund may not match those in an index.
Annual Report 2015
3
COLUMBIA REAL ESTATE EQUITY FUND
PERFORMANCE OVERVIEW (continued)
Performance of a Hypothetical $10,000 Investment (January 1, 2006 – December 31, 2015)
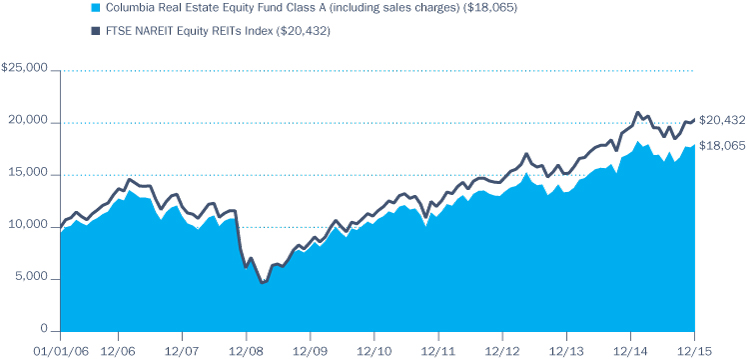
The chart above shows the change in value of a hypothetical $10,000 investment in Class A shares of Columbia Real Estate Equity Fund during the stated time period, and does not reflect the deduction of taxes that a shareholder may pay on Fund distributions or on the redemption of Fund shares.
Annual Report 2015
4
COLUMBIA REAL ESTATE EQUITY FUND
MANAGER DISCUSSION OF FUND PERFORMANCE
For the 12-month period that ended December 31, 2015, the Fund's Class A shares returned 4.32% excluding sales charges. The Fund outperformed its benchmark, the FTSE NAREIT Equity REITs Index, which returned 3.20% for the same period. Allocation decisions overall contributed most favorably to the Fund's performance during the annual period, though stock selection as a whole also added value.
Real Estate Market Outpaced Broad U.S. Equity Market
The U.S. real estate market, as measured by the benchmark, notably outpaced the broad U.S. equity market, as measured by the S&P 500 Index, during the annual period. However, such performance masks what was significant volatility in the U.S. real estate market. Also, it should be noted that the positive return came primarily from dividends. On a price only basis, real estate investment trusts (REITs) actually declined slightly.
Maintaining momentum from 2014, REITs started the year with strong share price performance, up almost 10% in January 2015, even as the U.S. economy demonstrated signs of slower growth, largely attributable to harsh winter weather conditions and a strengthening U.S. dollar. However, the prospect of higher interest rates and the fear of the real estate cycle being in the later stages started to weigh on shares. In contrast to the first calendar quarter, the U.S. real estate equity market experienced a sharp and broad-based sell-off during the second quarter. An interest rate-sensitive industry, REITs struggled as interest rates rose on encouraging news about both the U.S. and European economies and in anticipation of the Federal Reserve's (the Fed) initial rate hike some time in the fall of 2015. During the third quarter, REITs were not immune to the volatility in the broader U.S. equity market, and thus, by September 2015, the benchmark was down almost 10%. Growing uncertainty around the timing of the Fed's next move and the direction of longer term interest rates also created volatility in REITs. REITs subsequently enjoyed a particularly strong rally during the fourth quarter, with its reversal in performance from the prior quarter attributable in part to the continuing strong fundamentals of the group. Also, the Fed acting on the highly anticipated first rate increase, and its indication that future hikes would likely be measured, removed some uncertainty from the interest rate-sensitive industry. Still, the outlook for higher rates remained on investors' minds, and thus we believe the property types that contributed most to the rally were those real estate owners with the best growth prospects and the lowest exposure to rising interest rates.
Importantly, amid such volatility, the fundamentals of the group remained strong and even gained momentum in some cases. Occupancies were near all-time highs in many property sub-sectors; market rents moved higher; and supply remained low by historical measures relative to demand. Many REITs took advantage of this supply/demand scenario to generate attractive internal growth. Many others were able to make accretive acquisitions and source development opportunities to generate competitive overall growth.
Portfolio Management
Arthur Hurley, CFA
Morningstar Style BoxTM

The Morningstar Style BoxTM is based on a fund's portfolio holdings. For equity funds, the vertical axis shows the market capitalization of the stocks owned, and the horizontal axis shows investment style (value, blend, or growth). Information shown is based on the most recent data provided by Morningstar.
© 2016 Morningstar, Inc. All rights reserved. The Morningstar information contained herein: (1) is proprietary to Morningstar and/or its content providers; (2) may not be copied or distributed; and (3) is not warranted to be accurate, complete or timely. Neither Morningstar nor its content providers are responsible for any damages or losses arising from any use of this information.
Top Ten Holdings (%)
(at December 31, 2015) | |
Simon Property Group, Inc. | | | 12.2 | | |
Public Storage | | | 8.6 | | |
Equity Residential | | | 5.1 | | |
AvalonBay Communities, Inc. | | | 5.1 | | |
Equity LifeStyle Properties, Inc. | | | 4.9 | | |
General Growth Properties, Inc. | | | 4.4 | | |
SL Green Realty Corp. | | | 4.2 | | |
Duke Realty Corp. | | | 4.1 | | |
Ventas, Inc. | | | 3.9 | | |
Alexandria Real Estate
Equities, Inc. | | | 3.9 | | |
Percentages indicated are based upon total investments (excluding Money Market Funds).
For further detail about these holdings, please refer to the section entitled "Portfolio of Investments."
Fund holdings are as of the date given, are subject to change at any time, and are not recommendations to buy or sell any security.
Annual Report 2015
5
COLUMBIA REAL ESTATE EQUITY FUND
MANAGER DISCUSSION OF FUND PERFORMANCE (continued)
Portfolio Breakdown (%)
(at December 31, 2015) | |
Common Stocks | | | 99.6 | | |
Money Market Funds | | | 0.4 | | |
Total | | | 100.0 | | |
Percentages indicated are based upon total investments. The Fund's portfolio composition is subject to change.
Equity Sector Breakdown (%)
(at December 31, 2015) | |
Consumer Discretionary | | | 1.8 | | |
Financials | | | 98.2 | | |
Total | | | 100.0 | | |
Percentages indicated are based upon total equity investments. The Fund's portfolio composition is subject to change.
Investment Risks
Market risk may affect a single issuer, sector of the economy, industry or the market as a whole. Like real estate, real estate investment trusts (REITs) are subject to illiquidity, valuation and financing complexities, taxes, default, bankruptcy and other economic, political, or regulatory occurrences. As a non-diversified fund, fewer investments could have a greater effect on performance. See the Fund's prospectus for more information on these and other risks.
Overweight Allocation To Self-Storage Sub-Sector Aided Results Most
From a REIT industry exposure perspective, the Fund's results were helped most by having an overweight allocation to self-storage, which was the strongest sub-sector in the benchmark by a wide margin during the annual period. Having an overweight allocation to manufactured homes, which was the second-strongest performing sub-sector in the benchmark during the annual period, and an underweight allocation to the health care sub-sector, which was the second-weakest in the benchmark, also helped. Effective stock selection in the diversified sub-sector added significant value as well.
Among individual holdings, Equity LifeStyle Properties and Public Storage were standout performers. Equity LifeStyle Properties is a manufactured home and recreational vehicle community site REIT, which demonstrated attractive organic growth through higher occupancies and increased rents. The REIT also benefited from the shortage of affordable housing in the U.S. amid strong demand. Public Storage, a self-storage REIT, gained ground as the self-storage sub-sector broadly benefited from a tailwind of strong demand amidst the pre-dominance of renters and the declining trend of home ownership in the U.S. Additionally, Public Storage is the largest owner of self-storage facilities in the nation, taking advantage of its scale and gaining market share via accretive acquisitions it has made. Another strong performer for the Fund was Duke Realty in the diversified sub-sector. Duke Realty benefited both from simplifying its story and strengthening its balance sheet by selling many of its suburban office properties and reinvesting the proceeds into its core industrial property portfolio, which performed well during the annual period.
Positioning In Lodging/Resorts Sub-Sector Hurt Fund Results
Both stock selection in and having an overweight allocation to the lodging/resorts sub-sector, which was the weakest in the benchmark during the annual period, hurt the Fund's relative results most. Stock selection in the office, shopping centers and apartments sub-sectors also detracted. Having an underweight allocation to the apartments sub-sector, which outpaced the benchmark during the annual period, further dampened the Fund's performance.
Among individual holdings, the biggest disappointments were primarily in the lodging/resorts sub-sector, including RLJ Lodging Trust, Hilton Worldwide Holdings, Host Hotels & Resorts and Sunstone Hotel Investors. While there were no company-specific factors impacting these holdings during the annual period, each was hurt by the broad brush of concerns within the lodging/resorts industry, including fears of global economic sluggishness leading to a slowdown in global business and leisure travel and thus lower occupancy rates. Another weak performer during the annual period was Cousins Properties in the office sub-sector, which has its greatest exposure in the U.S. southeast and in Houston. Weakness in the energy sector, including the significant slide in crude oil prices, drove concerns about energy-related tenants being forced into vacating before
Annual Report 2015
6
COLUMBIA REAL ESTATE EQUITY FUND
MANAGER DISCUSSION OF FUND PERFORMANCE (continued)
leases expired. While such fears did not actually materialize, perceptions about the Houston real estate market were enough to create an overhang for Cousins Properties' stock.
Shifting Market Conditions Drove Portfolio Changes
During the annual period, we reduced the Fund's exposure to the lodging/resorts sub-sector, primarily through the sale of its position in Host Hotels & Resorts, and to the Houston market, largely via the elimination of the Fund's position in Cousins Properties. Also, while maintaining the Fund's overweight allocation to the self-storage sub-sector, we sold the Fund's position in Sovran Self Storage, taking profits, as the stock had performed well. We correspondingly increased the Fund's exposure to residential and data center properties, adding to a basket of names already in the portfolio.
Annual Report 2015
7
COLUMBIA REAL ESTATE EQUITY FUND
UNDERSTANDING YOUR FUND'S EXPENSES
(Unaudited)
As an investor, you incur two types of costs. There are transaction costs, which generally include sales charges on purchases and may include redemption fees. There are also ongoing costs, which generally include management fees, distribution and/or service fees, and other fund expenses. The following information is intended to help you understand your ongoing costs (in dollars) of investing in the Fund and to help you compare these costs with the ongoing costs of investing in other mutual funds.
Analyzing Your Fund's Expenses
To illustrate these ongoing costs, we have provided examples and calculated the expenses paid by investors in each share class of the Fund during the period. The actual and hypothetical information in the table is based on an initial investment of $1,000 at the beginning of the period indicated and held for the entire period. Expense information is calculated two ways and each method provides you with different information. The amount listed in the "Actual" column is calculated using the Fund's actual operating expenses and total return for the period. You may use the Actual information, together with the amount invested, to estimate the expenses that you paid over the period. Simply divide your account value by $1,000 (for example, an $8,600 account value divided by $1,000 = 8.6), then multiply the results by the expenses paid during the period under the "Actual" column. The amount listed in the "Hypothetical" column assumes a 5% annual rate of return before expenses (which is not the Fund's actual return) and then applies the Fund's actual expense ratio for the period to the hypothetical return. You should not use the hypothetical account values and expenses to estimate either your actual account balance at the end of the period or the expenses you paid during the period. See "Compare With Other Funds" below for details on how to use the hypothetical data.
Compare With Other Funds
Since all mutual funds are required to include the same hypothetical calculations about expenses in shareholder reports, you can use this information to compare the ongoing cost of investing in the Fund with other funds. To do so, compare the hypothetical example with the 5% hypothetical examples that appear in the shareholder reports of other funds. As you compare hypothetical examples of other funds, it is important to note that hypothetical examples are meant to highlight the ongoing costs of investing in a fund only and do not reflect any transaction costs, such as sales charges, or redemption or exchange fees. Therefore, the hypothetical calculations are useful in comparing ongoing costs only, and will not help you determine the relative total costs of owning different funds. If transaction costs were included in these calculations, your costs would be higher.
July 1, 2015 – December 31, 2015
| | | Account Value at the Beginning
of the Period ($) | | Account Value at the End of the
Period ($) | | Expenses Paid During the
Period ($) | | Fund's Annualized
Expense Ratio (%) | |
| | | Actual | | Hypothetical | | Actual | | Hypothetical | | Actual | | Hypothetical | | Actual | |
Class A | | | 1,000.00 | | | | 1,000.00 | | | | 1,108.90 | | | | 1,018.90 | | | | 6.64 | | | | 6.36 | | | | 1.25 | | |
Class B | | | 1,000.00 | | | | 1,000.00 | | | | 1,104.30 | | | | 1,015.12 | | | | 10.61 | | | | 10.16 | | | | 2.00 | | |
Class C | | | 1,000.00 | | | | 1,000.00 | | | | 1,104.60 | | | | 1,015.12 | | | | 10.61 | | | | 10.16 | | | | 2.00 | | |
Class I | | | 1,000.00 | | | | 1,000.00 | | | | 1,111.70 | | | | 1,021.17 | | | | 4.26 | | | | 4.08 | | | | 0.80 | | |
Class K | | | 1,000.00 | | | | 1,000.00 | | | | 1,109.40 | | | | 1,019.66 | | | | 5.85 | | | | 5.60 | | | | 1.10 | | |
Class R | | | 1,000.00 | | | | 1,000.00 | | | | 1,107.50 | | | | 1,017.64 | | | | 7.97 | | | | 7.63 | | | | 1.50 | | |
Class R4 | | | 1,000.00 | | | | 1,000.00 | | | | 1,109.80 | | | | 1,020.11 | | | | 5.37 | | | | 5.14 | | | | 1.01 | | |
Class R5 | | | 1,000.00 | | | | 1,000.00 | | | | 1,111.30 | | | | 1,020.87 | | | | 4.58 | | | | 4.38 | | | | 0.86 | | |
Class W | | | 1,000.00 | | | | 1,000.00 | | | | 1,108.80 | | | | 1,018.90 | | | | 6.64 | | | | 6.36 | | | | 1.25 | | |
Class Z | | | 1,000.00 | | | | 1,000.00 | | | | 1,110.10 | | | | 1,020.16 | | | | 5.32 | | | | 5.09 | | | | 1.00 | | |
Expenses paid during the period are equal to the annualized expense ratio for each class as indicated above, multiplied by the average account value over the period and then multiplied by the number of days in the Fund's most recent fiscal half year and divided by 365.
Expenses do not include fees and expenses incurred indirectly by the Fund from its investment in underlying funds, including affiliated and non-affiliated pooled investment vehicles, such as mutual funds and exchange-traded funds.
Annual Report 2015
8
COLUMBIA REAL ESTATE EQUITY FUND
PORTFOLIO OF INVESTMENTS
December 31, 2015
(Percentages represent value of investments compared to net assets)
Common Stocks 99.1%
Issuer | | Shares | | Value ($) | |
CONSUMER DISCRETIONARY 1.8% | |
Hotels, Restaurants & Leisure 1.3% | |
Hilton Worldwide Holdings, Inc. | | | 309,100 | | | | 6,614,740 | | |
Multiline Retail 0.5% | |
Hudson's Bay Co. | | | 206,800 | | | | 2,705,124 | | |
Total Consumer Discretionary | | | | | 9,319,864 | | |
FINANCIALS 97.3% | |
Real Estate Investment Trusts (REITs) 97.3% | |
Diversified REITs 4.0% | |
Duke Realty Corp. | | | 981,700 | | | | 20,635,334 | | |
Health Care REITs 7.4% | |
Healthcare Trust of America, Inc., Class A | | | 410,150 | | | | 11,061,745 | | |
Omega Healthcare Investors, Inc. | | | 192,300 | | | | 6,726,654 | | |
Ventas, Inc. | | | 351,474 | | | | 19,833,678 | | |
Total | | | | | 37,622,077 | | |
Hotel & Resort REITs 3.5% | |
Pebblebrook Hotel Trust | | | 78,100 | | | | 2,188,362 | | |
RLJ Lodging Trust | | | 452,900 | | | | 9,796,227 | | |
Sunstone Hotel Investors, Inc. | | | 458,078 | | | | 5,721,394 | | |
Total | | | | | 17,705,983 | | |
Industrial REITs 5.5% | |
First Industrial Realty Trust, Inc. | | | 807,500 | | | | 17,869,975 | | |
ProLogis, Inc. | | | 239,969 | | | | 10,299,469 | | |
Total | | | | | 28,169,444 | | |
Office REITs 16.0% | |
Alexandria Real Estate Equities, Inc. | | | 217,300 | | | | 19,635,228 | | |
Boston Properties, Inc. | | | 74,900 | | | | 9,552,746 | | |
Highwoods Properties, Inc. | | | 301,400 | | | | 13,141,040 | | |
Kilroy Realty Corp. | | | 66,000 | | | | 4,176,480 | | |
Mack-Cali Realty Corp. | | | 135,800 | | | | 3,170,930 | | |
SL Green Realty Corp. | | | 188,400 | | | | 21,285,432 | | |
Vornado Realty Trust | | | 108,100 | | | | 10,805,676 | | |
Total | | | | | 81,767,532 | | |
Common Stocks (continued)
Issuer | | Shares | | Value ($) | |
Residentials REITs 21.3% | |
AvalonBay Communities, Inc. | | | 139,879 | | | | 25,755,920 | | |
Equity LifeStyle Properties, Inc. | | | 374,000 | | | | 24,934,580 | | |
Equity Residential | | | 315,700 | | | | 25,757,963 | | |
Essex Property Trust, Inc. | | | 80,000 | | | | 19,152,800 | | |
Sun Communities, Inc. | | | 197,500 | | | | 13,534,675 | | |
Total | | | | | 109,135,938 | | |
Retail REITs 20.3% | |
Brixmor Property Group, Inc. | | | 237,400 | | | | 6,129,668 | | |
General Growth Properties, Inc. | | | 825,500 | | | | 22,461,855 | | |
Ramco-Gershenson Properties Trust | | | 294,800 | | | | 4,896,628 | | |
Retail Properties of America, Inc., Class A | | | 422,000 | | | | 6,232,940 | | |
Simon Property Group, Inc. | | | 318,054 | | | | 61,842,420 | | |
Taubman Centers, Inc. | | | 34,100 | | | | 2,616,152 | | |
Total | | | | | 104,179,663 | | |
Specialized REITs 19.3% | |
American Tower Corp. | | | 82,300 | | | | 7,978,985 | | |
Coresite Realty Corp. | | | 97,600 | | | | 5,535,872 | | |
CubeSmart | | | 277,170 | | | | 8,486,946 | | |
Digital Realty Trust, Inc. | | | 210,100 | | | | 15,887,762 | | |
Equinix, Inc. | | | 17,255 | | | | 5,217,912 | | |
Extra Space Storage, Inc. | | | 136,600 | | | | 12,049,486 | | |
Public Storage | | | 176,759 | | | | 43,783,205 | | |
Total | | | | | 98,940,168 | | |
Total Real Estate Investment Trusts
(REITs) | | | | | 498,156,139 | | |
Total Financials | | | | | 498,156,139 | | |
Total Common Stocks
(Cost: $354,463,697) | | | | | 507,476,003 | | |
Money Market Funds 0.4%
| | | Shares | | Value ($) | |
Columbia Short-Term Cash Fund,
0.284%(a)(b) | | | 2,193,080 | | | | 2,193,080 | | |
Total Money Market Funds
(Cost: $2,193,080) | | | | | 2,193,080 | | |
Total Investments
(Cost: $356,656,777) | | | 509,669,083 | | |
Other Assets & Liabilities, Net | | | 2,444,711 | | |
Net Assets | | | 512,113,794 | | |
The accompanying Notes to Financial Statements are an integral part of this statement.
Annual Report 2015
9
COLUMBIA REAL ESTATE EQUITY FUND
PORTFOLIO OF INVESTMENTS (continued)
December 31, 2015
Notes to Portfolio of Investments
(a) The rate shown is the seven-day current annualized yield at December 31, 2015.
(b) As defined in the Investment Company Act of 1940, an affiliated company is one in which the Fund owns 5% or more of the company's outstanding voting securities, or a company which is under common ownership or control with the Fund. Holdings and transactions in these affiliated companies during the year ended December 31, 2015 are as follows:
Issuer | | Beginning
Cost ($) | | Purchase
Cost ($) | | Proceeds
From Sales ($) | | Ending
Cost ($) | | Dividends —
Affiliated
Issuers ($) | | Value ($) | |
Columbia Short-Term Cash Fund | | | 15,052,887 | | | | 116,173,394 | | | | (129,033,201 | ) | | | 2,193,080 | | | | 7,593 | | | | 2,193,080 | | |
Fair Value Measurements
The Fund categorizes its fair value measurements according to a three-level hierarchy that maximizes the use of observable inputs and minimizes the use of unobservable inputs by prioritizing that the most observable input be used when available. Observable inputs are those that market participants would use in pricing an investment based on market data obtained from sources independent of the reporting entity. Unobservable inputs are those that reflect the Fund's assumptions about the information market participants would use in pricing an investment. An investment's level within the fair value hierarchy is based on the lowest level of any input that is deemed significant to the asset's or liability's fair value measurement. The input levels are not necessarily an indication of the risk or liquidity associated with investments at that level. For example, certain U.S. government securities are generally high quality and liquid, however, they are reflected as Level 2 because the inputs used to determine fair value may not always be quoted prices in an active market.
Fair value inputs are summarized in the three broad levels listed below:
> Level 1 — Valuations based on quoted prices for investments in active markets that the Fund has the ability to access at the measurement date (including NAV for open-end mutual funds). Valuation adjustments are not applied to Level 1 investments.
> Level 2 — Valuations based on other significant observable inputs (including quoted prices for similar securities, interest rates, prepayment speeds, credit risks, etc.).
> Level 3 — Valuations based on significant unobservable inputs (including the Fund's own assumptions and judgment in determining the fair value of investments).
Inputs that are used in determining fair value of an investment may include price information, credit data, volatility statistics, and other factors. These inputs can be either observable or unobservable. The availability of observable inputs can vary between investments, and is affected by various factors such as the type of investment, and the volume and level of activity for that investment or similar investments in the marketplace. The inputs will be considered by the Investment Manager, along with any other relevant factors in the calculation of an investment's fair value. The Fund uses prices and inputs that are current as of the measurement date, which may include periods of market dislocations. During these periods, the availability of prices and inputs may be reduced for many investments. This condition could cause an investment to be reclassified between the various levels within the hierarchy.
Investments falling into the Level 3 category are primarily supported by quoted prices from brokers and dealers participating in the market for those investments. However, these may be classified as Level 3 investments due to lack of market transparency and corroboration to support these quoted prices. Additionally, valuation models may be used as the pricing source for any remaining investments classified as Level 3. These models may rely on one or more significant unobservable inputs and/or significant assumptions by the Investment Manager. Inputs used in valuations may include, but are not limited to, financial statement analysis, capital account balances, discount rates and estimated cash flows, and comparable company data.
Under the direction of the Fund's Board of Trustees (the Board), the Investment Manager's Valuation Committee (the Committee) is responsible for overseeing the valuation procedures approved by the Board. The Committee consists of voting and non-voting members from various groups within the Investment Manager's organization, including operations and accounting, trading and investments, compliance, risk management and legal.
The Committee meets at least monthly to review and approve valuation matters, which may include a description of specific valuation determinations, data regarding pricing information received from approved pricing vendors and brokers and the results of Board-approved valuation control policies and procedures (the Policies). The Policies address, among other things, instances when market quotations are or are not readily available, including recommendations of third party pricing vendors and a determination of appropriate pricing methodologies; events that require specific valuation determinations and assessment of fair value techniques; securities with a potential for stale pricing, including those that are illiquid, restricted, or in default; and the effectiveness of third party pricing vendors, including periodic reviews of vendors. The Committee meets more frequently, as needed, to discuss additional valuation matters, which may include the need to review back-testing results, review time-sensitive information or approve related valuation actions. The Committee reports to the Board, with members of the Committee meeting with the Board at each of its regularly scheduled meetings to discuss valuation matters and actions during the period, similar to those described earlier.
The accompanying Notes to Financial Statements are an integral part of this statement.
Annual Report 2015
10
COLUMBIA REAL ESTATE EQUITY FUND
PORTFOLIO OF INVESTMENTS (continued)
December 31, 2015
Fair Value Measurements (continued)
For investments categorized as Level 3, the Committee monitors information similar to that described above, which may include: (i) data specific to the issuer or comparable issuers, (ii) general market or specific sector news and (iii) quoted prices and specific or similar security transactions. The Committee considers this data and any changes from prior periods in order to assess the reasonableness of observable and unobservable inputs, any assumptions or internal models used to value those securities and changes in fair value. This data is also used to corroborate, when available, information received from approved pricing vendors and brokers. Various factors impact the frequency of monitoring this information (which may occur as often as daily). However, the Committee may determine that changes to inputs, assumptions and models are not required as a result of the monitoring procedures performed.
The following table is a summary of the inputs used to value the Fund's investments at December 31, 2015:
| | | Level 1
Quoted Prices in Active
Markets for Identical
Assets ($) | | Level 2
Other Significant
Observable Inputs ($) | | Level 3
Significant
Unobservable Inputs ($) | | Total ($) | |
Investments | |
Common Stocks | |
Consumer Discretionary | | | 9,319,864 | | | | — | | | | — | | | | 9,319,864 | | |
Financials | | | 498,156,139 | | | | — | | | | — | | | | 498,156,139 | | |
Total Common Stocks | | | 507,476,003 | | | | — | | | | — | | | | 507,476,003 | | |
Money Market Funds | | | — | | | | 2,193,080 | | | | — | | | | 2,193,080 | | |
Total Investments | | | 507,476,003 | | | | 2,193,080 | | | | — | | | | 509,669,083 | | |
See the Portfolio of Investments for all investment classifications not indicated in the table.
The Fund's assets assigned to the Level 2 input category are valued based upon utilizing observable market inputs, in which a security's value is determined through reference to prices and information from market transactions for similar or identical assets and/or fund per share market values which are not considered publicly available.
Financial assets were transferred from Level 1 to Level 2 as the market for these assets is not considered publicly available. Fund per share market values were obtained using observable market inputs.
The following table shows transfers between Level 1 and Level 2 of the fair value hierarchy:
Transfers In | | Transfers Out | |
| Level 1 ($) | | Level 2 ($) | | Level 1 ($) | | Level 2 ($) | |
| | — | | | | 15,052,887 | | | | 15,052,887 | | | | — | | |
Transfers between Level 1 and Level 2 are determined based on the fair value at the beginning of the period for security positions held throughout the period.
There were no transfers of financial assets between Levels 2 and 3 during the period.
The accompanying Notes to Financial Statements are an integral part of this statement.
Annual Report 2015
11
COLUMBIA REAL ESTATE EQUITY FUND
STATEMENT OF ASSETS AND LIABILITIES
December 31, 2015
Assets | |
Investments, at value | |
Unaffiliated issuers (identified cost $354,463,697) | | $ | 507,476,003 | | |
Affiliated issuers (identified cost $2,193,080) | | | 2,193,080 | | |
Total investments (identified cost $356,656,777) | | | 509,669,083 | | |
Receivable for: | |
Capital shares sold | | | 141,068 | | |
Dividends | | | 2,808,068 | | |
Foreign tax reclaims | | | 839 | | |
Prepaid expenses | | | 3,179 | | |
Trustees' deferred compensation plan | | | 54,677 | | |
Total assets | | | 512,676,914 | | |
Liabilities | |
Payable for: | |
Capital shares purchased | | | 355,348 | | |
Investment management fees | | | 9,759 | | |
Distribution and/or service fees | | | 1,524 | | |
Transfer agent fees | | | 78,155 | | |
Administration fees | | | 846 | | |
Plan administration fees | | | 22 | | |
Compensation of board members | | | 463 | | |
Chief compliance officer expenses | | | 63 | | |
Other expenses | | | 62,263 | | |
Trustees' deferred compensation plan | | | 54,677 | | |
Total liabilities | | | 563,120 | | |
Net assets applicable to outstanding capital stock | | $ | 512,113,794 | | |
Represented by | |
Paid-in capital | | $ | 369,451,291 | | |
Excess of distributions over net investment income | | | (50,860 | ) | |
Accumulated net realized loss | | | (10,298,913 | ) | |
Unrealized appreciation (depreciation) on: | |
Investments | | | 153,012,306 | | |
Foreign currency translations | | | (30 | ) | |
Total — representing net assets applicable to outstanding capital stock | | $ | 512,113,794 | | |
The accompanying Notes to Financial Statements are an integral part of this statement.
Annual Report 2015
12
COLUMBIA REAL ESTATE EQUITY FUND
STATEMENT OF ASSETS AND LIABILITIES (continued)
December 31, 2015
Class A | |
Net assets | | $ | 123,136,257 | | |
Shares outstanding | | | 8,048,924 | | |
Net asset value per share | | $ | 15.30 | | |
Maximum offering price per share(a) | | $ | 16.23 | | |
Class B | |
Net assets | | $ | 1,227,245 | | |
Shares outstanding | | | 80,014 | | |
Net asset value per share | | $ | 15.34 | | |
Class C | |
Net assets | | $ | 18,522,702 | | |
Shares outstanding | | | 1,210,865 | | |
Net asset value per share | | $ | 15.30 | | |
Class I | |
Net assets | | $ | 33,308,378 | | |
Shares outstanding | | | 2,169,096 | | |
Net asset value per share | | $ | 15.36 | | |
Class K | |
Net assets | | $ | 51,817 | | |
Shares outstanding | | | 3,378 | | |
Net asset value per share | | $ | 15.34 | | |
Class R | |
Net assets | | $ | 9,139,949 | | |
Shares outstanding | | | 597,936 | | |
Net asset value per share | | $ | 15.29 | | |
Class R4 | |
Net assets | | $ | 362,805 | | |
Shares outstanding | | | 23,310 | | |
Net asset value per share | | $ | 15.56 | | |
Class R5 | |
Net assets | | $ | 7,101,800 | | |
Shares outstanding | | | 464,588 | | |
Net asset value per share | | $ | 15.29 | | |
Class W | |
Net assets | | $ | 26,243 | | |
Shares outstanding | | | 1,714 | | |
Net asset value per share | | $ | 15.31 | | |
Class Z | |
Net assets | | $ | 319,236,598 | | |
Shares outstanding | | | 20,831,095 | | |
Net asset value per share | | $ | 15.33 | | |
(a) The maximum offering price per share is calculated by dividing the net asset value per share by 1.0 minus the maximum sales charge of 5.75%.
The accompanying Notes to Financial Statements are an integral part of this statement.
Annual Report 2015
13
COLUMBIA REAL ESTATE EQUITY FUND
STATEMENT OF OPERATIONS
Year Ended December 31, 2015
Net investment income | |
Income: | |
Dividends — unaffiliated issuers | | $ | 14,062,594 | | |
Dividends — affiliated issuers | | | 7,593 | | |
Foreign taxes withheld | | | (4,874 | ) | |
Total income | | | 14,065,313 | | |
Expenses: | |
Investment management fees | | | 3,776,529 | | |
Distribution and/or service fees | |
Class A | | | 314,149 | | |
Class B | | | 19,012 | | |
Class C | | | 198,509 | | |
Class R | | | 45,295 | | |
Class W | | | 72 | | |
Transfer agent fees | |
Class A | | | 247,420 | | |
Class B | | | 3,759 | | |
Class C | | | 39,141 | | |
Class K | | | 27 | | |
Class R | | | 17,835 | | |
Class R4 | | | 399 | | |
Class R5 | | | 1,879 | | |
Class W | | | 57 | | |
Class Z | | | 667,627 | | |
Administration fees | | | 325,962 | | |
Plan administration fees | |
Class K | | | 136 | | |
Compensation of board members | | | 25,500 | | |
Custodian fees | | | 7,844 | | |
Printing and postage fees | | | 62,350 | | |
Registration fees | | | 118,009 | | |
Audit fees | | | 29,799 | | |
Legal fees | | | 19,785 | | |
Chief compliance officer expenses | | | 266 | | |
Other | | | 20,560 | | |
Total expenses | | | 5,941,921 | | |
Expense reductions | | | (1,460 | ) | |
Total net expenses | | | 5,940,461 | | |
Net investment income | | | 8,124,852 | | |
Realized and unrealized gain (loss) — net | |
Net realized gain (loss) on: | |
Investments | | | 31,477,499 | | |
Foreign currency translations | | | 2,095 | | |
Net realized gain | | | 31,479,594 | | |
Net change in unrealized appreciation (depreciation) on: | |
Investments | | | (20,119,139 | ) | |
Foreign currency translations | | | (17 | ) | |
Net change in unrealized depreciation | | | (20,119,156 | ) | |
Net realized and unrealized gain | | | 11,360,438 | | |
Net increase in net assets resulting from operations | | $ | 19,485,290 | | |
The accompanying Notes to Financial Statements are an integral part of this statement.
Annual Report 2015
14
COLUMBIA REAL ESTATE EQUITY FUND
STATEMENT OF CHANGES IN NET ASSETS
| | | Year Ended
December 31,
2015 | | Year Ended
December 31,
2014 | |
Operations | |
Net investment income | | $ | 8,124,852 | | | $ | 8,357,156 | | |
Net realized gain | | | 31,479,594 | | | | 42,164,258 | | |
Net change in unrealized appreciation (depreciation) | | | (20,119,156 | ) | | | 86,963,771 | | |
Net increase in net assets resulting from operations | | | 19,485,290 | | | | 137,485,185 | | |
Distributions to shareholders | |
Net investment income | |
Class A | | | (1,669,155 | ) | | | (1,647,804 | ) | |
Class B | | | (10,850 | ) | | | (18,925 | ) | |
Class C | | | (117,094 | ) | | | (120,327 | ) | |
Class I | | | (890,858 | ) | | | (1,133,368 | ) | |
Class K | | | (806 | ) | | | (893 | ) | |
Class R | | | (97,045 | ) | | | (101,779 | ) | |
Class R4 | | | (3,252 | ) | | | (8,696 | ) | |
Class R5 | | | (68,180 | ) | | | (1,314 | ) | |
Class W | | | (384 | ) | | | (514 | ) | |
Class Z | | | (5,349,955 | ) | | | (5,329,166 | ) | |
Net realized gains | |
Class A | | | (8,356,753 | ) | | | (4,493,133 | ) | |
Class B | | | (106,320 | ) | | | (101,322 | ) | |
Class C | | | (1,308,105 | ) | | | (721,091 | ) | |
Class I | | | (3,531,878 | ) | | | (1,416,585 | ) | |
Class K | | | (3,677 | ) | | | (2,021 | ) | |
Class R | | | (604,663 | ) | | | (349,373 | ) | |
Class R4 | | | (14,965 | ) | | | (3,159 | ) | |
Class R5 | | | (321,652 | ) | | | (4,923 | ) | |
Class W | | | (1,872 | ) | | | (1,237 | ) | |
Class Z | | | (22,345,300 | ) | | | (12,469,029 | ) | |
Total distributions to shareholders | | | (44,802,764 | ) | | | (27,924,659 | ) | |
Decrease in net assets from capital stock activity | | | (32,984,402 | ) | | | (12,127,923 | ) | |
Total increase (decrease) in net assets | | | (58,301,876 | ) | | | 97,432,603 | | |
Net assets at beginning of year | | | 570,415,670 | | | | 472,983,067 | | |
Net assets at end of year | | $ | 512,113,794 | | | $ | 570,415,670 | | |
Excess of distributions over net investment income | | $ | (50,860 | ) | | $ | (51,560 | ) | |
The accompanying Notes to Financial Statements are an integral part of this statement.
Annual Report 2015
15
COLUMBIA REAL ESTATE EQUITY FUND
STATEMENT OF CHANGES IN NET ASSETS (continued)
| | | Year Ended December 31, 2015 | | Year Ended December 31, 2014 | |
| | | Shares | | Dollars ($) | | Shares | | Dollars ($) | |
Capital stock activity | |
Class A shares | |
Subscriptions(a) | | | 1,938,354 | | | | 30,884,153 | | | | 2,158,461 | | | | 31,755,236 | | |
Distributions reinvested | | | 642,018 | | | | 9,604,337 | | | | 376,325 | | | | 5,807,434 | | |
Redemptions | | | (2,753,240 | ) | | | (43,265,889 | ) | | | (2,476,738 | ) | | | (36,464,049 | ) | |
Net increase (decrease) | | | (172,868 | ) | | | (2,777,399 | ) | | | 58,048 | | | | 1,098,621 | | |
Class B shares | |
Subscriptions | | | 5,058 | | | | 84,107 | | | | 11,896 | | | | 176,159 | | |
Distributions reinvested | | | 7,505 | | | | 112,718 | | | | 7,500 | | | | 116,565 | | |
Redemptions(a) | | | (103,427 | ) | | | (1,627,949 | ) | | | (121,990 | ) | | | (1,779,959 | ) | |
Net decrease | | | (90,864 | ) | | | (1,431,124 | ) | | | (102,594 | ) | | | (1,487,235 | ) | |
Class C shares | |
Subscriptions | | | 192,691 | | | | 3,072,955 | | | | 258,917 | | | | 3,838,340 | | |
Distributions reinvested | | | 80,896 | | | | 1,208,348 | | | | 42,976 | | | | 667,642 | | |
Redemptions | | | (389,187 | ) | | | (6,036,446 | ) | | | (365,356 | ) | | | (5,298,498 | ) | |
Net decrease | | | (115,600 | ) | | | (1,755,143 | ) | | | (63,463 | ) | | | (792,516 | ) | |
Class I shares | |
Subscriptions | | | 1,764,169 | | | | 28,623,042 | | | | 4,905,757 | | | | 71,414,732 | | |
Distributions reinvested | | | 292,825 | | | | 4,422,270 | | | | 167,509 | | | | 2,549,596 | | |
Redemptions | | | (2,749,864 | ) | | | (40,834,758 | ) | | | (5,785,793 | ) | | | (87,606,989 | ) | |
Net decrease | | | (692,870 | ) | | | (7,789,446 | ) | | | (712,527 | ) | | | (13,642,661 | ) | |
Class K shares | |
Distributions reinvested | | | 268 | | | | 4,028 | | | | 168 | | | | 2,587 | | |
Redemptions | | | (514 | ) | | | (7,678 | ) | | | (2,042 | ) | | | (29,775 | ) | |
Net decrease | | | (246 | ) | | | (3,650 | ) | | | (1,874 | ) | | | (27,188 | ) | |
Class R shares | |
Subscriptions | | | 208,107 | | | | 3,224,684 | | | | 220,547 | | | | 3,230,740 | | |
Distributions reinvested | | | 34,084 | | | | 509,482 | | | | 20,712 | | | | 320,292 | | |
Redemptions | | | (266,803 | ) | | | (4,171,948 | ) | | | (196,072 | ) | | | (2,916,998 | ) | |
Net increase (decrease) | | | (24,612 | ) | | | (437,782 | ) | | | 45,187 | | | | 634,034 | | |
Class R4 shares | |
Subscriptions | | | 17,503 | | | | 281,908 | | | | 230,796 | | | | 3,213,349 | | |
Distributions reinvested | | | 1,183 | | | | 17,969 | | | | 797 | | | | 11,705 | | |
Redemptions | | | (1,225 | ) | | | (18,880 | ) | | | (227,030 | ) | | | (3,422,966 | ) | |
Net increase | | | 17,461 | | | | 280,997 | | | | 4,563 | | | | (197,912 | ) | |
Class R5 shares | |
Subscriptions | | | 480,246 | | | | 7,227,583 | | | | 8,221 | | | | 126,580 | | |
Distributions reinvested | | | 26,341 | | | | 389,569 | | | | 390 | | | | 6,074 | | |
Redemptions | | | (51,864 | ) | | | (783,633 | ) | | | (132,767 | ) | | | (1,895,973 | ) | |
Net increase (decrease) | | | 454,723 | | | | 6,833,519 | | | | (124,156 | ) | | | (1,763,319 | ) | |
The accompanying Notes to Financial Statements are an integral part of this statement.
Annual Report 2015
16
COLUMBIA REAL ESTATE EQUITY FUND
STATEMENT OF CHANGES IN NET ASSETS (continued)
| | | Year Ended December 31, 2015 | | Year Ended December 31, 2014 | |
| | | Shares | | Dollars ($) | | Shares | | Dollars ($) | |
Capital stock activity (continued) | |
Class W shares | |
Subscriptions | | | — | | | | — | | | | 139 | | | | 1,833 | | |
Distributions reinvested | | | 132 | | | | 1,980 | | | | 103 | | | | 1,579 | | |
Redemptions | | | (516 | ) | | | (8,338 | ) | | | (2,524 | ) | | | (35,644 | ) | |
Net decrease | | | (384 | ) | | | (6,358 | ) | | | (2,282 | ) | | | (32,232 | ) | |
Class Z shares | |
Subscriptions | | | 2,111,165 | | | | 33,215,842 | | | | 4,314,381 | | | | 63,795,199 | | |
Distributions reinvested | | | 1,024,347 | | | | 15,368,216 | | | | 649,225 | | | | 10,015,546 | | |
Redemptions | | | (4,793,164 | ) | | | (74,482,074 | ) | | | (4,734,810 | ) | | | (69,728,260 | ) | |
Net increase (decrease) | | | (1,657,652 | ) | | | (25,898,016 | ) | | | 228,796 | | | | 4,082,485 | | |
Total net decrease | | | (2,282,912 | ) | | | (32,984,402 | ) | | | (670,302 | ) | | | (12,127,923 | ) | |
(a) Includes conversions of Class B shares to Class A shares, if any.
The accompanying Notes to Financial Statements are an integral part of this statement.
Annual Report 2015
17
COLUMBIA REAL ESTATE EQUITY FUND
The following tables are intended to help you understand the Fund's financial performance. Certain information reflects financial results for a single share of a class held for the periods shown. Per share net investment income (loss) amounts are calculated based on average shares outstanding during the period. Total return assumes reinvestment of all dividends and distributions, if any. Total return does not reflect payment of sales charges, if any. Total return and portfolio turnover are not annualized for periods of less than one year. The portfolio turnover rate is calculated without regard to purchase and sales transactions of short-term instruments and certain derivatives, if any. If such transactions were included, the Fund's portfolio turnover rate may be higher.
| | | Year Ended December 31, | |
Class A | | 2015 | | 2014 | | 2013 | | 2012 | | 2011 | |
Per share data | |
Net asset value, beginning of period | | $ | 15.95 | | | $ | 12.98 | | | $ | 14.35 | | | $ | 12.69 | | | $ | 12.41 | | |
Income from investment operations: | |
Net investment income | | | 0.21 | | | | 0.20 | | | | 0.16 | | | | 0.21 | | | | 0.18 | | |
Net realized and unrealized gain (loss) | | | 0.42 | | | | 3.54 | | | | (0.20 | ) | | | 1.92 | | | | 0.59 | | |
Total from investment operations | | | 0.63 | | | | 3.74 | | | | (0.04 | ) | | | 2.13 | | | | 0.77 | | |
Less distributions to shareholders: | |
Net investment income | | | (0.21 | ) | | | (0.20 | ) | | | (0.17 | ) | | | (0.21 | ) | | | (0.19 | ) | |
Net realized gains | | | (1.07 | ) | | | (0.57 | ) | | | (1.16 | ) | | | (0.26 | ) | | | (0.32 | ) | |
Total distributions to shareholders | | | (1.28 | ) | | | (0.77 | ) | | | (1.33 | ) | | | (0.47 | ) | | | (0.51 | ) | |
Redemption fees: | |
Redemption fees added to paid-in capital | | | — | | | | — | | | | — | | | | 0.00 | (a) | | | 0.02 | | |
Net asset value, end of period | | $ | 15.30 | | | $ | 15.95 | | | $ | 12.98 | | | $ | 14.35 | | | $ | 12.69 | | |
Total return | | | 4.32 | % | | | 29.08 | % | | | (0.37 | %) | | | 16.92 | % | | | 6.59 | % | |
Ratios to average net assets(b) | |
Total gross expenses | | | 1.25 | % | | | 1.24 | % | | | 1.28 | % | | | 1.31 | %(c) | | | 1.26 | % | |
Total net expenses(d) | | | 1.25 | %(e) | | | 1.24 | %(e) | | | 1.28 | %(e) | | | 1.30 | %(c)(e) | | | 1.24 | %(e) | |
Net investment income | | | 1.33 | % | | | 1.38 | % | | | 1.07 | % | | | 1.49 | % | | | 1.44 | % | |
Supplemental data | |
Net assets, end of period (in thousands) | | $ | 123,136 | | | $ | 131,148 | | | $ | 105,995 | | | $ | 112,410 | | | $ | 99,335 | | |
Portfolio turnover | | | 32 | % | | | 35 | % | | | 80 | % | | | 65 | % | | | 72 | % | |
Notes to Financial Highlights
(a) Rounds to zero.
(b) In addition to the fees and expenses that the Fund bears directly, the Fund indirectly bears a pro rata share of the fees and expenses of any other funds in which it invests. Such indirect expenses are not included in the Fund's reported expense ratios.
(c) Ratios include line of credit interest expense which is less than 0.01%.
(d) Total net expenses include the impact of certain fee waivers/expense reimbursements made by the Investment Manager and certain of its affiliates, if applicable.
(e) The benefits derived from expense reductions had an impact of less than 0.01%.
The accompanying Notes to Financial Statements are an integral part of this statement.
Annual Report 2015
18
COLUMBIA REAL ESTATE EQUITY FUND
FINANCIAL HIGHLIGHTS (continued)
| | | Year Ended December 31, | |
Class B | | 2015 | | 2014 | | 2013 | | 2012 | | 2011 | |
Per share data | |
Net asset value, beginning of period | | $ | 15.99 | | | $ | 13.01 | | | $ | 14.38 | | | $ | 12.71 | | | $ | 12.43 | | |
Income from investment operations: | |
Net investment income | | | 0.06 | | | | 0.08 | | | | 0.04 | | | | 0.10 | | | | 0.08 | | |
Net realized and unrealized gain (loss) | | | 0.45 | | | | 3.56 | | | | (0.19 | ) | | | 1.94 | | | | 0.58 | | |
Total from investment operations | | | 0.51 | | | | 3.64 | | | | (0.15 | ) | | | 2.04 | | | | 0.66 | | |
Less distributions to shareholders: | |
Net investment income | | | (0.09 | ) | | | (0.09 | ) | | | (0.06 | ) | | | (0.11 | ) | | | (0.09 | ) | |
Net realized gains | | | (1.07 | ) | | | (0.57 | ) | | | (1.16 | ) | | | (0.26 | ) | | | (0.32 | ) | |
Total distributions to shareholders | | | (1.16 | ) | | | (0.66 | ) | | | (1.22 | ) | | | (0.37 | ) | | | (0.41 | ) | |
Redemption fees: | |
Redemption fees added to paid-in capital | | | — | | | | — | | | | — | | | | 0.00 | (a) | | | 0.03 | | |
Net asset value, end of period | | $ | 15.34 | | | $ | 15.99 | | | $ | 13.01 | | | $ | 14.38 | | | $ | 12.71 | | |
Total return | | | 3.52 | % | | | 28.14 | % | | | (1.13 | %) | | | 16.10 | % | | | 5.76 | % | |
Ratios to average net assets(b) | |
Total gross expenses | | | 2.00 | % | | | 1.99 | % | | | 2.03 | % | | | 2.05 | %(c) | | | 2.02 | % | |
Total net expenses(d) | | | 2.00 | %(e) | | | 1.99 | %(e) | | | 2.03 | %(e) | | | 2.05 | %(c)(e) | | | 2.01 | %(e) | |
Net investment income | | | 0.38 | % | | | 0.53 | % | | | 0.26 | % | | | 0.68 | % | | | 0.61 | % | |
Supplemental data | |
Net assets, end of period (in thousands) | | $ | 1,227 | | | $ | 2,732 | | | $ | 3,559 | | | $ | 5,341 | | | $ | 7,274 | | |
Portfolio turnover | | | 32 | % | | | 35 | % | | | 80 | % | | | 65 | % | | | 72 | % | |
Notes to Financial Highlights
(a) Rounds to zero.
(b) In addition to the fees and expenses that the Fund bears directly, the Fund indirectly bears a pro rata share of the fees and expenses of any other funds in which it invests. Such indirect expenses are not included in the Fund's reported expense ratios.
(c) Ratios include line of credit interest expense which is less than 0.01%.
(d) Total net expenses include the impact of certain fee waivers/expense reimbursements made by the Investment Manager and certain of its affiliates, if applicable.
(e) The benefits derived from expense reductions had an impact of less than 0.01%.
The accompanying Notes to Financial Statements are an integral part of this statement.
Annual Report 2015
19
COLUMBIA REAL ESTATE EQUITY FUND
FINANCIAL HIGHLIGHTS (continued)
| | | Year Ended December 31, | |
Class C | | 2015 | | 2014 | | 2013 | | 2012 | | 2011 | |
Per share data | |
Net asset value, beginning of period | | $ | 15.95 | | | $ | 12.98 | | | $ | 14.34 | | | $ | 12.68 | | | $ | 12.40 | | |
Income from investment operations: | |
Net investment income | | | 0.09 | | | | 0.09 | | | | 0.04 | | | | 0.10 | | | | 0.08 | | |
Net realized and unrealized gain (loss) | | | 0.42 | | | | 3.54 | | | | (0.18 | ) | | | 1.93 | | | | 0.59 | | |
Total from investment operations | | | 0.51 | | | | 3.63 | | | | (0.14 | ) | | | 2.03 | | | | 0.67 | | |
Less distributions to shareholders: | |
Net investment income | | | (0.09 | ) | | | (0.09 | ) | | | (0.06 | ) | | | (0.11 | ) | | | (0.09 | ) | |
Net realized gains | | | (1.07 | ) | | | (0.57 | ) | | | (1.16 | ) | | | (0.26 | ) | | | (0.32 | ) | |
Total distributions to shareholders | | | (1.16 | ) | | | (0.66 | ) | | | (1.22 | ) | | | (0.37 | ) | | | (0.41 | ) | |
Redemption fees: | |
Redemption fees added to paid-in capital | | | — | | | | — | | | | — | | | | 0.00 | (a) | | | 0.02 | | |
Net asset value, end of period | | $ | 15.30 | | | $ | 15.95 | | | $ | 12.98 | | | $ | 14.34 | | | $ | 12.68 | | |
Total return | | | 3.53 | % | | | 28.13 | % | | | (1.08 | %) | | | 16.06 | % | | | 5.77 | % | |
Ratios to average net assets(b) | |
Total gross expenses | | | 2.00 | % | | | 1.99 | % | | | 2.03 | % | | | 2.06 | %(c) | | | 2.01 | % | |
Total net expenses(d) | | | 2.00 | %(e) | | | 1.99 | %(e) | | | 2.03 | %(e) | | | 2.05 | %(c)(e) | | | 2.00 | %(e) | |
Net investment income | | | 0.56 | % | | | 0.62 | % | | | 0.30 | % | | | 0.72 | % | | | 0.67 | % | |
Supplemental data | |
Net assets, end of period (in thousands) | | $ | 18,523 | | | $ | 21,155 | | | $ | 18,045 | | | $ | 21,001 | | | $ | 19,802 | | |
Portfolio turnover | | | 32 | % | | | 35 | % | | | 80 | % | | | 65 | % | | | 72 | % | |
Notes to Financial Highlights
(a) Rounds to zero.
(b) In addition to the fees and expenses that the Fund bears directly, the Fund indirectly bears a pro rata share of the fees and expenses of any other funds in which it invests. Such indirect expenses are not included in the Fund's reported expense ratios.
(c) Ratios include line of credit interest expense which is less than 0.01%.
(d) Total net expenses include the impact of certain fee waivers/expense reimbursements made by the Investment Manager and certain of its affiliates, if applicable.
(e) The benefits derived from expense reductions had an impact of less than 0.01%.
The accompanying Notes to Financial Statements are an integral part of this statement.
Annual Report 2015
20
COLUMBIA REAL ESTATE EQUITY FUND
FINANCIAL HIGHLIGHTS (continued)
| | | Year Ended December 31, | |
Class I | | 2015 | | 2014 | | 2013 | | 2012 | | 2011 | |
Per share data | |
Net asset value, beginning of period | | $ | 16.01 | | | $ | 13.03 | | | $ | 14.39 | | | $ | 12.72 | | | $ | 12.42 | | |
Income from investment operations: | |
Net investment income | | | 0.28 | | | | 0.25 | | | | 0.22 | | | | 0.27 | | | | 0.21 | | |
Net realized and unrealized gain (loss) | | | 0.42 | | | | 3.56 | | | | (0.18 | ) | | | 1.93 | | | | 0.62 | | |
Total from investment operations | | | 0.70 | | | | 3.81 | | | | 0.04 | | | | 2.20 | | | | 0.83 | | |
Less distributions to shareholders: | |
Net investment income | | | (0.28 | ) | | | (0.26 | ) | | | (0.24 | ) | | | (0.27 | ) | | | (0.24 | ) | |
Net realized gains | | | (1.07 | ) | | | (0.57 | ) | | | (1.16 | ) | | | (0.26 | ) | | | (0.32 | ) | |
Total distributions to shareholders | | | (1.35 | ) | | | (0.83 | ) | | | (1.40 | ) | | | (0.53 | ) | | | (0.56 | ) | |
Redemption fees: | |
Redemption fees added to paid-in capital | | | — | | | | — | | | | — | | | | 0.00 | (a) | | | 0.03 | | |
Net asset value, end of period | | $ | 15.36 | | | $ | 16.01 | | | $ | 13.03 | | | $ | 14.39 | | | $ | 12.72 | | |
Total return | | | 4.78 | % | | | 29.61 | % | | | 0.21 | % | | | 17.48 | % | | | 7.19 | % | |
Ratios to average net assets(b) | |
Total gross expenses | | | 0.80 | % | | | 0.80 | % | | | 0.80 | % | | | 0.84 | %(c) | | | 0.80 | % | |
Total net expenses(d) | | | 0.80 | % | | | 0.80 | % | | | 0.80 | % | | | 0.84 | %(c) | | | 0.80 | %(e) | |
Net investment income | | | 1.79 | % | | | 1.70 | % | | | 1.47 | % | | | 1.95 | % | | | 1.65 | % | |
Supplemental data | |
Net assets, end of period (in thousands) | | $ | 33,308 | | | $ | 45,809 | | | $ | 46,560 | | | $ | 70,213 | | | $ | 68,508 | | |
Portfolio turnover | | | 32 | % | | | 35 | % | | | 80 | % | | | 65 | % | | | 72 | % | |
Notes to Financial Highlights
(a) Rounds to zero.
(b) In addition to the fees and expenses that the Fund bears directly, the Fund indirectly bears a pro rata share of the fees and expenses of any other funds in which it invests. Such indirect expenses are not included in the Fund's reported expense ratios.
(c) Ratios include line of credit interest expense which is less than 0.01%.
(d) Total net expenses include the impact of certain fee waivers/expense reimbursements made by the Investment Manager and certain of its affiliates, if applicable.
(e) The benefits derived from expense reductions had an impact of less than 0.01%.
The accompanying Notes to Financial Statements are an integral part of this statement.
Annual Report 2015
21
COLUMBIA REAL ESTATE EQUITY FUND
FINANCIAL HIGHLIGHTS (continued)
| | | Year Ended December 31, | |
Class K | | 2015 | | 2014 | | 2013 | | 2012 | | 2011(a) | |
Per share data | |
Net asset value, beginning of period | | $ | 15.99 | | | $ | 13.02 | | | $ | 14.38 | | | $ | 12.72 | | | $ | 12.73 | | |
Income from investment operations: | |
Net investment income | | | 0.23 | | | | 0.22 | | | | 0.19 | | | | 0.23 | | | | 0.18 | | |
Net realized and unrealized gain (loss) | | | 0.42 | | | | 3.54 | | | | (0.19 | ) | | | 1.93 | | | | 0.31 | | |
Total from investment operations | | | 0.65 | | | | 3.76 | | | | — | | | | 2.16 | | | | 0.49 | | |
Less distributions to shareholders: | |
Net investment income | | | (0.23 | ) | | | (0.22 | ) | | | (0.20 | ) | | | (0.24 | ) | | | (0.20 | ) | |
Net realized gains | | | (1.07 | ) | | | (0.57 | ) | | | (1.16 | ) | | | (0.26 | ) | | | (0.32 | ) | |
Total distributions to shareholders | | | (1.30 | ) | | | (0.79 | ) | | | (1.36 | ) | | | (0.50 | ) | | | (0.52 | ) | |
Redemption fees: | |
Redemption fees added to paid-in capital | | | — | | | | — | | | | — | | | | 0.00 | (b) | | | 0.02 | | |
Net asset value, end of period | | $ | 15.34 | | | $ | 15.99 | | | $ | 13.02 | | | $ | 14.38 | | | $ | 12.72 | | |
Total return | | | 4.46 | % | | | 29.17 | % | | | (0.10 | %) | | | 17.09 | % | | | 4.24 | % | |
Ratios to average net assets(c) | |
Total gross expenses | | | 1.10 | % | | | 1.10 | % | | | 1.10 | % | | | 1.13 | %(d) | | | 1.12 | %(e) | |
Total net expenses(f) | | | 1.10 | % | | | 1.10 | % | | | 1.10 | % | | | 1.13 | %(d) | | | 1.12 | %(e)(g) | |
Net investment income | | | 1.48 | % | | | 1.50 | % | | | 1.26 | % | | | 1.64 | % | | | 1.66 | %(e) | |
Supplemental data | |
Net assets, end of period (in thousands) | | $ | 52 | | | $ | 58 | | | $ | 72 | | | $ | 74 | | | $ | 75 | | |
Portfolio turnover | | | 32 | % | | | 35 | % | | | 80 | % | | | 65 | % | | | 72 | % | |
Notes to Financial Highlights
(a) Based on operations from March 7, 2011 (commencement of operations) through the stated period end.
(b) Rounds to zero.
(c) In addition to the fees and expenses that the Fund bears directly, the Fund indirectly bears a pro rata share of the fees and expenses of any other funds in which it invests. Such indirect expenses are not included in the Fund's reported expense ratios.
(d) Ratios include line of credit interest expense which is less than 0.01%.
(e) Annualized.
(f) Total net expenses include the impact of certain fee waivers/expense reimbursements made by the Investment Manager and certain of its affiliates, if applicable.
(g) The benefits derived from expense reductions had an impact of less than 0.01%.
The accompanying Notes to Financial Statements are an integral part of this statement.
Annual Report 2015
22
COLUMBIA REAL ESTATE EQUITY FUND
FINANCIAL HIGHLIGHTS (continued)
| | | Year Ended December 31, | |
Class R | | 2015 | | 2014 | | 2013 | | 2012 | | 2011 | |
Per share data | |
Net asset value, beginning of period | | $ | 15.94 | | | $ | 12.97 | | | $ | 14.34 | | | $ | 12.67 | | | $ | 12.40 | | |
Income from investment operations: | |
Net investment income | | | 0.17 | | | | 0.17 | | | | 0.13 | | | | 0.17 | | | | 0.16 | | |
Net realized and unrealized gain (loss) | | | 0.42 | | | | 3.53 | | | | (0.21 | ) | | | 1.94 | | | | 0.56 | | |
Total from investment operations | | | 0.59 | | | | 3.70 | | | | (0.08 | ) | | | 2.11 | | | | 0.72 | | |
Less distributions to shareholders: | |
Net investment income | | | (0.17 | ) | | | (0.16 | ) | | | (0.13 | ) | | | (0.18 | ) | | | (0.16 | ) | |
Net realized gains | | | (1.07 | ) | | | (0.57 | ) | | | (1.16 | ) | | | (0.26 | ) | | | (0.32 | ) | |
Total distributions to shareholders | | | (1.24 | ) | | | (0.73 | ) | | | (1.29 | ) | | | (0.44 | ) | | | (0.48 | ) | |
Redemption fees: | |
Redemption fees added to paid-in capital | | | — | | | | — | | | | — | | | | 0.00 | (a) | | | 0.03 | | |
Net asset value, end of period | | $ | 15.29 | | | $ | 15.94 | | | $ | 12.97 | | | $ | 14.34 | | | $ | 12.67 | | |
Total return | | | 4.06 | % | | | 28.78 | % | | | (0.62 | %) | | | 16.74 | % | | | 6.25 | % | |
Ratios to average net assets(b) | |
Total gross expenses | | | 1.50 | % | | | 1.49 | % | | | 1.53 | % | | | 1.55 | %(c) | | | 1.51 | % | |
Total net expenses(d) | | | 1.50 | %(e) | | | 1.49 | %(e) | | | 1.53 | %(e) | | | 1.55 | %(c)(e) | | | 1.49 | %(e) | |
Net investment income | | | 1.09 | % | | | 1.15 | % | | | 0.87 | % | | | 1.20 | % | | | 1.29 | % | |
Supplemental data | |
Net assets, end of period (in thousands) | | $ | 9,140 | | | $ | 9,922 | | | $ | 7,491 | | | $ | 6,131 | | | $ | 6,004 | | |
Portfolio turnover | | | 32 | % | | | 35 | % | | | 80 | % | | | 65 | % | | | 72 | % | |
Notes to Financial Highlights
(a) Rounds to zero.
(b) In addition to the fees and expenses that the Fund bears directly, the Fund indirectly bears a pro rata share of the fees and expenses of any other funds in which it invests. Such indirect expenses are not included in the Fund's reported expense ratios.
(c) Ratios include line of credit interest expense which is less than 0.01%.
(d) Total net expenses include the impact of certain fee waivers/expense reimbursements made by the Investment Manager and certain of its affiliates, if applicable.
(e) The benefits derived from expense reductions had an impact of less than 0.01%.
The accompanying Notes to Financial Statements are an integral part of this statement.
Annual Report 2015
23
COLUMBIA REAL ESTATE EQUITY FUND
FINANCIAL HIGHLIGHTS (continued)
| | | Year Ended December 31, | |
Class R4 | | 2015 | | 2014 | | 2013 | | 2012(a) | |
Per share data | |
Net asset value, beginning of period | | $ | 16.20 | | | $ | 13.18 | | | $ | 14.56 | | | $ | 14.28 | | |
Income from investment operations: | |
Net investment income | | | 0.31 | | | | 0.25 | | | | 0.25 | | | | (0.00 | )(b) | |
Net realized and unrealized gain (loss) | | | 0.36 | | | | 3.57 | | | | (0.25 | ) | | | 0.58 | | |
Total from investment operations | | | 0.67 | | | | 3.82 | | | | — | | | | 0.58 | | |
Less distributions to shareholders: | |
Net investment income | | | (0.24 | ) | | | (0.23 | ) | | | (0.22 | ) | | | (0.04 | ) | |
Net realized gains | | | (1.07 | ) | | | (0.57 | ) | | | (1.16 | ) | | | (0.26 | ) | |
Total distributions to shareholders | | | (1.31 | ) | | | (0.80 | ) | | | (1.38 | ) | | | (0.30 | ) | |
Net asset value, end of period | | $ | 15.56 | | | $ | 16.20 | | | $ | 13.18 | | | $ | 14.56 | | |
Total return | | | 4.56 | % | | | 29.31 | % | | | (0.09 | %) | | | 4.08 | % | |
Ratios to average net assets(c) | |
Total gross expenses | | | 1.00 | % | | | 1.00 | % | | | 1.04 | % | | | 1.07 | %(d)(e) | |
Total net expenses(f) | | | 1.00 | %(g) | | | 0.99 | %(g) | | | 1.04 | %(g) | | | 1.07 | %(d)(e) | |
Net investment income (loss) | | | 1.98 | % | | | 1.71 | % | | | 1.74 | % | | | (0.01 | %)(d) | |
Supplemental data | |
Net assets, end of period (in thousands) | | $ | 363 | | | $ | 95 | | | $ | 17 | | | $ | 3 | | |
Portfolio turnover | | | 32 | % | | | 35 | % | | | 80 | % | | | 65 | % | |
Notes to Financial Highlights
(a) Based on operations from November 8, 2012 (commencement of operations) through the stated period end.
(b) Rounds to zero.
(c) In addition to the fees and expenses that the Fund bears directly, the Fund indirectly bears a pro rata share of the fees and expenses of any other funds in which it invests. Such indirect expenses are not included in the Fund's reported expense ratios.
(d) Annualized.
(e) Ratios include line of credit interest expense which is less than 0.01%.
(f) Total net expenses include the impact of certain fee waivers/expense reimbursements made by the Investment Manager and certain of its affiliates, if applicable.
(g) The benefits derived from expense reductions had an impact of less than 0.01%.
The accompanying Notes to Financial Statements are an integral part of this statement.
Annual Report 2015
24
COLUMBIA REAL ESTATE EQUITY FUND
FINANCIAL HIGHLIGHTS (continued)
| | | Year Ended December 31, | |
Class R5 | | 2015 | | 2014 | | 2013 | | 2012 | | 2011(a) | |
Per share data | |
Net asset value, beginning of period | | $ | 15.94 | | | $ | 12.98 | | | $ | 14.35 | | | $ | 12.71 | | | $ | 12.73 | | |
Income from investment operations: | |
Net investment income | | | 0.31 | | | | 0.11 | | | | 0.31 | | | | 0.21 | | | | 0.21 | | |
Net realized and unrealized gain (loss) | | | 0.38 | | | | 3.68 | | | | (0.29 | ) | | | 1.96 | | | | 0.31 | | |
Total from investment operations | | | 0.69 | | | | 3.79 | | | | 0.02 | | | | 2.17 | | | | 0.52 | | |
Less distributions to shareholders: | |
Net investment income | | | (0.27 | ) | | | (0.26 | ) | | | (0.23 | ) | | | (0.27 | ) | | | (0.24 | ) | |
Net realized gains | | | (1.07 | ) | | | (0.57 | ) | | | (1.16 | ) | | | (0.26 | ) | | | (0.32 | ) | |
Total distributions to shareholders | | | (1.34 | ) | | | (0.83 | ) | | | (1.39 | ) | | | (0.53 | ) | | | (0.56 | ) | |
Redemption fees: | |
Redemption fees added to paid-in capital | | | — | | | | — | | | | — | | | | 0.00 | (b) | | | 0.02 | | |
Net asset value, end of period | | $ | 15.29 | | | $ | 15.94 | | | $ | 12.98 | | | $ | 14.35 | | | $ | 12.71 | | |
Total return | | | 4.74 | % | | | 29.50 | % | | | 0.09 | % | | | 17.24 | % | | | 4.47 | % | |
Ratios to average net assets(c) | |
Total gross expenses | | | 0.85 | % | | | 0.85 | % | | | 0.86 | % | | | 0.84 | %(d) | | | 0.79 | %(e) | |
Total net expenses(f) | | | 0.85 | % | | | 0.85 | % | | | 0.86 | % | | | 0.84 | %(d) | | | 0.79 | %(e)(g) | |
Net investment income | | | 2.05 | % | | | 0.82 | % | | | 2.21 | % | | | 1.52 | % | | | 1.99 | %(e) | |
Supplemental data | |
Net assets, end of period (in thousands) | | $ | 7,102 | | | $ | 157 | | | $ | 1,739 | | | $ | 37 | | | $ | 3,463 | | |
Portfolio turnover | | | 32 | % | | | 35 | % | | | 80 | % | | | 65 | % | | | 72 | % | |
Notes to Financial Highlights
(a) Based on operations from March 7, 2011 (commencement of operations) through the stated period end.
(b) Rounds to zero.
(c) In addition to the fees and expenses that the Fund bears directly, the Fund indirectly bears a pro rata share of the fees and expenses of any other funds in which it invests. Such indirect expenses are not included in the Fund's reported expense ratios.
(d) Ratios include line of credit interest expense which is less than 0.01%.
(e) Annualized.
(f) Total net expenses include the impact of certain fee waivers/expense reimbursements made by the Investment Manager and certain of its affiliates, if applicable.
(g) The benefits derived from expense reductions had an impact of less than 0.01%.
The accompanying Notes to Financial Statements are an integral part of this statement.
Annual Report 2015
25
COLUMBIA REAL ESTATE EQUITY FUND
FINANCIAL HIGHLIGHTS (continued)
| | | Year Ended December 31, | |
Class W | | 2015 | | 2014 | | 2013 | | 2012 | | 2011 | |
Per share data | |
Net asset value, beginning of period | | $ | 15.96 | | | $ | 12.99 | | | $ | 14.36 | | | $ | 12.69 | | | $ | 12.41 | | |
Income from investment operations: | |
Net investment income | | | 0.20 | | | | 0.18 | | | | 0.12 | | | | 0.24 | | | | 0.18 | | |
Net realized and unrealized gain (loss) | | | 0.43 | | | | 3.56 | | | | (0.16 | ) | | | 1.90 | | | | 0.59 | | |
Total from investment operations | | | 0.63 | | | | 3.74 | | | | (0.04 | ) | | | 2.14 | | | | 0.77 | | |
Less distributions to shareholders: | |
Net investment income | | | (0.21 | ) | | | (0.20 | ) | | | (0.17 | ) | | | (0.21 | ) | | | (0.19 | ) | |
Net realized gains | | | (1.07 | ) | | | (0.57 | ) | | | (1.16 | ) | | | (0.26 | ) | | | (0.32 | ) | |
Total distributions to shareholders | | | (1.28 | ) | | | (0.77 | ) | | | (1.33 | ) | | | (0.47 | ) | | | (0.51 | ) | |
Redemption fees: | |
Redemption fees added to paid-in capital | | | — | | | | — | | | | — | | | | 0.00 | (a) | | | 0.02 | | |
Net asset value, end of period | | $ | 15.31 | | | $ | 15.96 | | | $ | 12.99 | | | $ | 14.36 | | | $ | 12.69 | | |
Total return | | | 4.32 | % | | | 29.06 | % | | | (0.36 | %) | | | 17.00 | % | | | 6.58 | % | |
Ratios to average net assets(b) | |
Total gross expenses | | | 1.25 | % | | | 1.24 | % | | | 1.27 | % | | | 1.32 | %(c) | | | 1.27 | % | |
Total net expenses(d) | | | 1.25 | %(e) | | | 1.24 | %(e) | | | 1.27 | %(e) | | | 1.31 | %(c)(e) | | | 1.24 | %(e) | |
Net investment income | | | 1.29 | % | | | 1.22 | % | | | 0.79 | % | | | 1.69 | % | | | 1.41 | % | |
Supplemental data | |
Net assets, end of period (in thousands) | | $ | 26 | | | $ | 33 | | | $ | 57 | | | $ | 9,432 | | | $ | 6 | | |
Portfolio turnover | | | 32 | % | | | 35 | % | | | 80 | % | | | 65 | % | | | 72 | % | |
Notes to Financial Highlights
(a) Rounds to zero.
(b) In addition to the fees and expenses that the Fund bears directly, the Fund indirectly bears a pro rata share of the fees and expenses of any other funds in which it invests. Such indirect expenses are not included in the Fund's reported expense ratios.
(c) Ratios include line of credit interest expense which is less than 0.01%.
(d) Total net expenses include the impact of certain fee waivers/expense reimbursements made by the Investment Manager and certain of its affiliates, if applicable.
(e) The benefits derived from expense reductions had an impact of less than 0.01%.
The accompanying Notes to Financial Statements are an integral part of this statement.
Annual Report 2015
26
COLUMBIA REAL ESTATE EQUITY FUND
FINANCIAL HIGHLIGHTS (continued)
| | | Year Ended December 31, | |
Class Z | | 2015 | | 2014 | | 2013 | | 2012 | | 2011 | |
Per share data | |
Net asset value, beginning of period | | $ | 15.98 | | | $ | 13.00 | | | $ | 14.37 | | | $ | 12.70 | | | $ | 12.43 | | |
Income from investment operations: | |
Net investment income | | | 0.24 | | | | 0.24 | | | | 0.19 | | | | 0.25 | | | | 0.19 | | |
Net realized and unrealized gain (loss) | | | 0.43 | | | | 3.54 | | | | (0.19 | ) | | | 1.93 | | | | 0.60 | | |
Total from investment operations | | | 0.67 | | | | 3.78 | | | | — | | | | 2.18 | | | | 0.79 | | |
Less distributions to shareholders: | |
Net investment income | | | (0.25 | ) | | | (0.23 | ) | | | (0.21 | ) | | | (0.25 | ) | | | (0.22 | ) | |
Net realized gains | | | (1.07 | ) | | | (0.57 | ) | | | (1.16 | ) | | | (0.26 | ) | | | (0.32 | ) | |
Total distributions to shareholders | | | (1.32 | ) | | | (0.80 | ) | | | (1.37 | ) | | | (0.51 | ) | | | (0.54 | ) | |
Redemption fees: | |
Redemption fees added to paid-in capital | | | — | | | | — | | | | — | | | | 0.00 | (a) | | | 0.02 | | |
Net asset value, end of period | | $ | 15.33 | | | $ | 15.98 | | | $ | 13.00 | | | $ | 14.37 | | | $ | 12.70 | | |
Total return | | | 4.57 | % | | | 29.43 | % | | | (0.10 | %) | | | 17.28 | % | | | 6.73 | % | |
Ratios to average net assets(b) | |
Total gross expenses | | | 1.00 | % | | | 0.99 | % | | | 1.03 | % | | | 1.06 | %(c) | | | 1.03 | % | |
Total net expenses(d) | | | 1.00 | %(e) | | | 0.99 | %(e) | | | 1.03 | %(e) | | | 1.05 | %(c)(e) | | | 1.01 | %(e) | |
Net investment income | | | 1.56 | % | | | 1.63 | % | | | 1.26 | % | | | 1.76 | % | | | 1.52 | % | |
Supplemental data | |
Net assets, end of period (in thousands) | | $ | 319,237 | | | $ | 359,305 | | | $ | 289,448 | | | $ | 384,007 | | | $ | 303,881 | | |
Portfolio turnover | | | 32 | % | | | 35 | % | | | 80 | % | | | 65 | % | | | 72 | % | |
Notes to Financial Highlights
(a) Rounds to zero.
(b) In addition to the fees and expenses that the Fund bears directly, the Fund indirectly bears a pro rata share of the fees and expenses of any other funds in which it invests. Such indirect expenses are not included in the Fund's reported expense ratios.
(c) Ratios include line of credit interest expense which is less than 0.01%.
(d) Total net expenses include the impact of certain fee waivers/expense reimbursements made by the Investment Manager and certain of its affiliates, if applicable.
(e) The benefits derived from expense reductions had an impact of less than 0.01%.
The accompanying Notes to Financial Statements are an integral part of this statement.
Annual Report 2015
27
COLUMBIA REAL ESTATE EQUITY FUND
NOTES TO FINANCIAL STATEMENTS
December 31, 2015
Note 1. Organization
Columbia Real Estate Equity Fund (the Fund), a series of Columbia Funds Series Trust I (the Trust), is a non-diversified fund. The Trust is registered under the Investment Company Act of 1940, as amended (the 1940 Act), as an open-end management investment company organized as a Massachusetts business trust.
Fund Shares
The Trust may issue an unlimited number of shares (without par value). The Fund offers Class A, Class B, Class C, Class I, Class K, Class R, Class R4, Class R5, Class W and Class Z shares. Although all share classes generally have identical voting, dividend and liquidation rights, each share class votes separately when required by the Trust's organizational documents or by law. Different share classes pay different distribution amounts to the extent the expenses of such share classes differ, and distributions in liquidation will be proportional to the net asset value of each share class. Each share class has its own expense and sales charge structure.
Class A shares are subject to a maximum front-end sales charge of 5.75% based on the initial investment amount. Class A shares purchased without an initial sales charge in accounts aggregating $1 million to $50 million at the time of purchase are subject to a contingent deferred sales charge (CDSC) if the shares are sold within 18 months after purchase, charged as follows: 1.00% CDSC if redeemed within 12 months after purchase, and 0.50% CDSC if redeemed more than 12, but less than 18, months after purchase.
Class B shares may be subject to a maximum CDSC of 5.00% based upon the holding period after purchase. Class B shares will generally convert to Class A shares eight years after purchase. The Fund no longer accepts investments by new or existing investors in the Fund's Class B shares, except in connection with the reinvestment of any dividend and/or capital gain distributions in Class B shares of the Fund and exchanges by existing Class B shareholders of certain other funds within the Columbia Family of Funds.
Class C shares are subject to a 1.00% CDSC on shares redeemed within 12 months after purchase.
Class I shares are not subject to sales charges and are available only to the Columbia Family of Funds.
Class K shares are not subject to sales charges, however this share class is closed to new investors.
Class R shares are not subject to sales charges and are generally available only to certain retirement plans and other investors as described in the Fund's prospectus.
Class R4 shares are not subject to sales charges and are generally available only to omnibus retirement plans and certain investors as described in the Fund's prospectus.
Class R5 shares are not subject to sales charges and are generally available only to investors purchasing through authorized investment professionals and omnibus retirement plans.
Class W shares are not subject to sales charges and are available only to investors purchasing through authorized investment programs managed by investment professionals, including discretionary managed account programs.
Class Z shares are not subject to sales charges and are available only to eligible investors, which are subject to different investment minimums as described in the Fund's prospectus.
Note 2. Summary of Significant Accounting Policies
Basis of Preparation
The Fund is an investment company that applies the accounting and reporting guidance in the Financial Accounting Standards Board (FASB) Accounting Standards Codification Topic 946, Financial Services — Investment Companies (ASC 946). The financial statements are prepared in accordance with U.S. generally accepted accounting principles (GAAP), which requires management to make certain estimates and assumptions that affect the reported amounts of assets and liabilities, the disclosure of contingent assets and liabilities at the date of the financial statements and the reported amounts of income and expenses during the reporting period. Actual results could differ from those estimates.
The following is a summary of significant accounting policies followed by the Fund in the preparation of its financial statements.
Security Valuation
All equity securities are valued at the close of business of the New York Stock Exchange (NYSE). Equity securities are valued at the last quoted sales price on the principal exchange or market on which they trade, except for securities traded on the NASDAQ Stock Market, which
Annual Report 2015
28
COLUMBIA REAL ESTATE EQUITY FUND
NOTES TO FINANCIAL STATEMENTS (continued)
December 31, 2015
are valued at the NASDAQ official close price. Unlisted securities or listed securities for which there were no sales during the day are valued at the mean of the latest quoted bid and ask prices on such exchanges or markets.
Investments in open-end investment companies, including money market funds, are valued at their latest net asset value.
Foreign equity securities are valued based on the closing price on the foreign exchange in which such securities are primarily traded. If any foreign equity security closing prices are not readily available, the securities are valued at the mean of the latest quoted bid and ask prices on such exchanges or markets. Foreign currency exchange rates are generally determined at 4:00 p.m. Eastern (U.S.) time. Many securities markets and exchanges outside the U.S. close prior to the close of the NYSE; therefore, the closing prices for securities in such markets or on such exchanges may not fully reflect events that occur after such close but before the close of the NYSE. In those situations, foreign securities will be fair valued pursuant to a policy adopted by the Board of Trustees (the Board), including, if available, utilizing a third party pricing service to determine these fair values. The third party pricing service takes into account multiple factors, including, but not limited to, movements in the U.S. securities markets, certain depositary receipts, futures contracts and foreign exchange rates that have occurred subsequent to the close of the foreign exchange or market, to determine a good faith estimate that reasonably reflects the current market conditions as of the close of the NYSE. The fair value of a security is likely to be different from the quoted or published price, if available.
Investments for which market quotations are not readily available, or that have quotations which management believes are not reflective of market value or reliable, are valued at fair value as determined in good faith under procedures approved by and under the general supervision of the Board. If a security or class of securities (such as foreign securities) is valued at fair value, such value is likely to be different from the quoted or published price for the security.
The determination of fair value often requires significant judgment. To determine fair value, management may use assumptions including but not limited to future cash flows and estimated risk premiums. Multiple inputs from various sources may be used to determine fair value.
GAAP requires disclosure regarding the inputs and valuation techniques used to measure fair value and any changes in valuation inputs or techniques. In addition, investments shall be disclosed by major category. This information is disclosed following the Fund's Portfolio of Investments.
Foreign Currency Transactions and Translations
The values of all assets and liabilities denominated in foreign currencies are generally translated into U.S. dollars at exchange rates determined at the close of the NYSE on any given day. Net realized and unrealized gains (losses) on foreign currency transactions and translations include gains (losses) arising from the fluctuation in exchange rates between trade and settlement dates on securities transactions, gains (losses) arising from the disposition of foreign currency and currency gains (losses) between the accrual and payment dates on dividends, interest income and foreign withholding taxes.
For financial statement purposes, the Fund does not distinguish that portion of gains (losses) on investments which is due to changes in foreign exchange rates from that which is due to changes in market prices of the investments. Such fluctuations are included with the net realized and unrealized gains (losses) on investments in the Statement of Operations.
Security Transactions
Security transactions are accounted for on the trade date. Cost is determined and gains (losses) are based upon the specific identification method for both financial statement and federal income tax purposes.
Income Recognition
Corporate actions and dividend income are generally recorded net of any non-reclaimable tax withholdings, on the ex-dividend date or upon receipt of ex-dividend notification in the case of certain foreign securities.
The Fund may receive distributions from holdings in equity securities, business development companies (BDCs), exchange-traded funds, other regulated investment companies (RICs), and real estate investment trusts (REITs), which report information on the tax character of their distributions annually. These distributions are allocated to dividend income, capital gain and return of capital based on actual information reported. Return of capital is recorded as a reduction of the cost basis of securities held. If the Fund no longer owns the applicable securities, return of capital is recorded as a realized gain. With respect to REITs, to the
Annual Report 2015
29
COLUMBIA REAL ESTATE EQUITY FUND
NOTES TO FINANCIAL STATEMENTS (continued)
December 31, 2015
extent actual information has not yet been reported, estimates for return of capital are made by the Fund's management. Management's estimates are subsequently adjusted when the actual character of the distributions is disclosed by the REITs, which could result in a proportionate change in return of capital to shareholders.
Awards from class action litigation are recorded as a reduction of cost basis if the Fund still owns the applicable securities on the payment date. If the Fund no longer owns the applicable securities, the proceeds are recorded as realized gains.
Expenses
General expenses of the Trust are allocated to the Fund and other funds of the Trust based upon relative net assets or other expense allocation methodologies determined by the nature of the expense. Expenses directly attributable to the Fund are charged to the Fund. Expenses directly attributable to a specific class of shares are charged to that share class.
Determination of Class Net Asset Value
All income, expenses (other than class-specific expenses, which are charged to that share class, as shown in the Statement of Operations) and realized and unrealized gains (losses) are allocated to each class of the Fund on a daily basis, based on the relative net assets of each class, for purposes of determining the net asset value of each class.
Federal Income Tax Status
The Fund intends to qualify each year as a regulated investment company under Subchapter M of the Internal Revenue Code, as amended, and will distribute substantially all of its taxable income (including net short-term capital gains), if any, for its tax year, and as such will not be subject to federal income taxes. In addition, the Fund intends to distribute in each calendar year substantially all of its net investment income, capital gains and certain other amounts, if any, such that the Fund should not be subject to federal excise tax. Therefore, no federal income or excise tax provision is recorded.
Foreign Taxes
The Fund may be subject to foreign taxes on income, gains on investments or currency repatriation, a portion of which may be recoverable. The Fund will accrue such taxes and recoveries, as applicable, based upon its
current interpretation of tax rules and regulations that exist in the markets in which it invests.
Realized gains in certain countries may be subject to foreign taxes at the Fund level, based on statutory rates. The Fund accrues for such foreign taxes on realized and unrealized gains at the appropriate rate for each jurisdiction, as applicable. The amount, if any, is disclosed as a liability on the Statement of Assets and Liabilities.
Distributions to Shareholders
Distributions from net investment income, if any, are declared and paid each calendar quarter. Net realized capital gains, if any, are distributed at least annually. Income distributions and capital gain distributions are determined in accordance with federal income tax regulations, which may differ from GAAP.
Guarantees and Indemnifications
Under the Trust's organizational documents and, in some cases, by contract, its officers and trustees are indemnified against certain liabilities arising out of the performance of their duties to the Trust or its funds. In addition, certain of the Fund's contracts with its service providers contain general indemnification clauses. The Fund's maximum exposure under these arrangements is unknown since the amount of any future claims that may be made against the Fund cannot be determined, and the Fund has no historical basis for predicting the likelihood of any such claims.
Recent Accounting Pronouncement
Fair Value Measurement (Topic 820), Disclosure for Investments in Certain Entities That Calculate Net Asset Value per Share (or Its Equivalent)
In May 2015, FASB issued Accounting Standards Update (ASU) No. 2015-07, Fair Value Measurement (Topic 820), Disclosure for Investments in Certain Entities That Calculate Net Asset Value per Share (or Its Equivalent). ASU No. 2015-07 changes the disclosure requirements for investments for which fair value is measured using the net asset value per share practical expedient. The disclosure requirements are effective for annual periods beginning after December 15, 2015 and interim periods within those fiscal years. At this time, management is evaluating the implications of this guidance and the impact it will have on the financial statement amounts and footnote disclosures, if any.
Annual Report 2015
30
COLUMBIA REAL ESTATE EQUITY FUND
NOTES TO FINANCIAL STATEMENTS (continued)
December 31, 2015
Note 3. Fees and Other Transactions with Affiliates
Investment Management Fees
Under an Investment Management Services Agreement, Columbia Management Investment Advisers, LLC (the Investment Manager), a wholly-owned subsidiary of Ameriprise Financial, Inc. (Ameriprise Financial), determines which securities will be purchased, held or sold. The investment management fee is an annual fee that is equal to a percentage of the Fund's average daily net assets that declines from 0.69% to 0.62% as the Fund's net assets increase. The effective investment management fee rate for the year ended December 31, 2015 was 0.69% of the Fund's average daily net assets.
Administration Fees
Under an Administrative Services Agreement, the Investment Manager also serves as the Fund Administrator. The Fund pays the Fund Administrator an annual fee for administration and accounting services equal to a percentage of the Fund's average daily net assets that declines from 0.06% to 0.04% as the Fund's net assets increase. The effective administration fee rate for the year ended December 31, 2015 was 0.06% of the Fund's average daily net assets.
Compensation of Board Members
Board members, who are not officers or employees of the Investment Manager or Ameriprise Financial, are compensated for their services to the Fund as disclosed in the Statement of Operations. These Board members may participate in a Deferred Compensation Plan (the Plan) which may be terminated at any time. Obligations of the Plan will be paid solely out of the Fund's assets, and all amounts payable under the Plan constitute a general unsecured obligation of the Fund.
Compensation of Chief Compliance Officer
The Board has appointed a Chief Compliance Officer to the Fund in accordance with federal securities regulations. The Fund is allocated a portion of the expenses associated with the Chief Compliance Officer based on relative net assets of the Trust.
Transfer Agency Fees
Under a Transfer and Dividend Disbursing Agent Agreement, Columbia Management Investment Services Corp. (the Transfer Agent), an affiliate of the Investment Manager and a wholly-owned subsidiary of Ameriprise Financial, is responsible for providing transfer agency
services to the Fund. The Transfer Agent has contracted with Boston Financial Data Services (BFDS) to serve as sub-transfer agent.
The Transfer Agent receives a monthly transfer agency fee based on the number or the average value of accounts, depending on the type of account. In addition, the Transfer Agent also receives sub-transfer agency fees based on a percentage of the average aggregate value of the Fund's shares maintained in omnibus accounts (other than omnibus accounts for which American Enterprise Investment Services Inc. is the broker of record or accounts where the beneficial shareholder is a customer of Ameriprise Financial Services, Inc., for which the Transfer Agent receives a per account fee). The Transfer Agent pays the fees of BFDS for services as sub-transfer agent and is not entitled to reimbursement for such fees from the Fund (with the exception of out-of-pocket fees).
The Transfer Agent also receives compensation from the Fund for various shareholder services and reimbursements for certain out-of-pocket fees. Class I shares do not pay transfer agency fees. Total transfer agency fees for Class K and Class R5 shares are subject to an annual limitation of not more than 0.05% of the average daily net assets attributable to each share class.
For the year ended December 31, 2015, the Fund's effective transfer agency fee rates as a percentage of average daily net assets of each class were as follows:
Class A | | | 0.20 | % | |
Class B | | | 0.20 | | |
Class C | | | 0.20 | | |
Class K | | | 0.05 | | |
Class R | | | 0.20 | | |
Class R4 | | | 0.20 | | |
Class R5 | | | 0.05 | | |
Class W | | | 0.20 | | |
Class Z | | | 0.20 | | |
An annual minimum account balance fee of $20 may apply to certain accounts with a value below the applicable share class's initial minimum investment requirements to reduce the impact of small accounts on transfer agency fees. These minimum account balance fees are remitted to the Fund and recorded as part of expense reductions in the Statement of Operations. For the year ended December 31, 2015, these minimum account balance fees reduced total expenses of the Fund by $1,460.
Annual Report 2015
31
COLUMBIA REAL ESTATE EQUITY FUND
NOTES TO FINANCIAL STATEMENTS (continued)
December 31, 2015
The Fund and certain other associated investment companies have severally, but not jointly, guaranteed the performance and observance of all the terms and conditions of a lease entered into by Seligman Data Corp. (SDC), the former transfer agent, including the payment of rent by SDC (the Guaranty). SDC was the legacy Seligman funds' former transfer agent.
The lease and the Guaranty expire in January 2019. At December 31, 2015, the Fund's total potential future obligation over the life of the Guaranty is $18,414. The liability remaining at December 31, 2015 for non-recurring charges associated with the lease amounted to $11,147 and is recorded as a part of the payable for other expenses in the Statement of Assets and Liabilities.
Plan Administration Fees
Under a Plan Administration Services Agreement with the Transfer Agent, the Fund pays an annual fee at a rate of 0.25% of the Fund's average daily net assets attributable to Class K shares for the provision of various administrative, recordkeeping, communication and educational services.
Distribution and Service Fees
The Fund has an agreement with Columbia Management Investment Distributors, Inc. (the Distributor), an affiliate of the Investment Manager and a wholly-owned subsidiary of Ameriprise Financial, for distribution and shareholder services. The Board has approved, and the Fund has adopted, distribution and shareholder service plans (the Plans) applicable to certain share classes, which set the distribution and service fees for the Fund. These fees are calculated daily and are intended to compensate the Distributor and/or eligible selling and/or servicing agents for selling shares of the Fund and providing services to investors.
Under the Plans, the Fund pays a monthly service fee to the Distributor at the maximum annual rate of 0.25% of the average daily net assets attributable to Class A, Class B, Class C and Class W shares of the Fund. Also under the Plans, the Fund pays a monthly distribution fee to the Distributor at the maximum annual rates of 0.10%, 0.75%, 0.75%, 0.50% and 0.25% of the average daily net assets attributable to Class A, Class B, Class C, Class R and Class W shares of the Fund, respectively.
Although the Fund may pay distribution and service fees up to a maximum annual rate of 0.35% of the Fund's average daily net assets attributable to Class A shares (comprised of up to 0.10% for distribution services and up to 0.25% for shareholder liaison services), the Fund
currently limits such fees to an aggregate fee of not more than 0.25% of the Fund's average daily net assets attributable to Class A shares.
Although the Fund may pay a distribution fee up to 0.25% of the Fund's average daily net assets attributable to Class W shares and a service fee of up to 0.25% of the Fund's average daily net assets attributable to Class W shares, the aggregate fee shall not exceed 0.25% of the Fund's average daily net assets attributable to Class W shares.
Sales Charges
Sales charges, including front-end charges and CDSCs, received by the Distributor for distributing Fund shares were $108,409 for Class A, $523 for Class B and $6,714 for Class C shares for the year ended December 31, 2015.
Expenses Waived/Reimbursed by the Investment Manager and its Affiliates
The Investment Manager and certain of its affiliates have contractually agreed to waive fees and/or reimburse expenses (excluding certain fees and expenses described below), so that the Fund's net operating expenses, after giving effect to fees waived/expenses reimbursed and any balance credits and/or overdraft charges from the Fund's custodian, do not exceed the annual rates of:
| | | Contractual
Expense Cap
July 1, 2015
through
April 30, 2016 | | Voluntary
Expense Cap
Effective
May 1, 2015
through
June 30, 2015 | | Voluntary
Expense Cap
Prior to
May 1, 2015 | |
Class A | | | 1.32 | % | | | 1.33 | % | | | 1.32 | % | |
Class B | | | 2.07 | | | | 2.08 | | | | 2.07 | | |
Class C | | | 2.07 | | | | 2.08 | | | | 2.07 | | |
Class I | | | 0.92 | | | | 0.93 | | | | 0.91 | | |
Class K | | | 1.22 | | | | 1.23 | | | | 1.21 | | |
Class R | | | 1.57 | | | | 1.58 | | | | 1.57 | | |
Class R4 | | | 1.07 | | | | 1.08 | | | | 1.07 | | |
Class R5 | | | 0.97 | | | | 0.98 | | | | 0.96 | | |
Class W | | | 1.32 | | | | 1.33 | | | | 1.32 | | |
Class Z | | | 1.07 | | | | 1.08 | | | | 1.07 | | |
The contractual agreement may be modified or amended only with approval from all parties. Under the arrangements, the following fees and expenses are excluded from the waiver/reimbursement commitment, and therefore will be paid by the Fund, if applicable: taxes (including foreign transaction taxes), expenses
Annual Report 2015
32
COLUMBIA REAL ESTATE EQUITY FUND
NOTES TO FINANCIAL STATEMENTS (continued)
December 31, 2015
associated with investments in affiliated and non-affiliated pooled investment vehicles (including mutual funds and exchange-traded funds), transaction costs and brokerage commissions, costs related to any securities lending program, dividend and interest expenses associated with securities sold short, inverse floater program fees and expenses, transaction charges and interest on borrowed money, interest and extraordinary expenses. Any fees waived and/or expenses reimbursed under the expense reimbursement arrangements described above are not recoverable by the Investment Manager or its affiliates in future periods.
Note 4. Federal Tax Information
The timing and character of income and capital gain distributions are determined in accordance with income tax regulations, which may differ from GAAP because of temporary or permanent book to tax differences.
At December 31, 2015, these differences are primarily due to differing treatment for capital loss carryforwards, deferral/reversal of wash sale losses, Trustees' deferred compensation and foreign currency transactions. To the extent these differences are permanent, reclassifications are made among the components of the Fund's net assets in the Statement of Assets and Liabilities. Temporary differences do not require reclassifications. In the Statement of Assets and Liabilities the following reclassifications were made:
Excess of distributions over net investment income | | $ | 83,427 | | |
Accumulated net realized loss | | | 40,845 | | |
Paid-in capital | | | (124,272 | ) | |
Net investment income (loss) and net realized gains (losses), as disclosed in the Statement of Operations, and net assets were not affected by this reclassification.
The tax character of distributions paid during the years indicated was as follows:
Year Ended December 31, | | 2015 | | 2014 | |
Ordinary income | | $ | 8,207,579 | | | $ | 8,362,786 | | |
Long-term capital gains | | | 36,595,185 | | | | 19,561,873 | | |
Total | | $ | 44,802,764 | | | $ | 27,924,659 | | |
Short-term capital gain distributions, if any, are considered ordinary income distributions for tax purposes.
At December 31, 2015, the components of distributable earnings on a tax basis were as follows:
Undistributed long-term capital gains | | | 4,991,376 | | |
Capital loss carryforwards | | | (13,840,472 | ) | |
Net unrealized appreciation | | | 151,562,489 | | |
At December 31, 2015, the cost of investments for federal income tax purposes was $358,106,594 and the aggregate gross unrealized appreciation and depreciation based on that cost was:
Unrealized appreciation | | $ | 158,092,765 | | |
Unrealized depreciation | | | (6,530,276 | ) | |
Net unrealized appreciation | | $ | 151,562,489 | | |
The following capital loss carryforwards, determined at December 31, 2015, may be available to reduce taxable income arising from future net realized gains on investments, if any, to the extent permitted by the Internal Revenue Code:
Year of Expiration | | Amount ($) | |
2016 | | | 8,814,909 | | |
2017 | | | 5,025,563 | | |
Total | | | 13,840,472 | | |
For the year ended December 31, 2015, $7,851,473 of capital loss carryforward was utilized and $36,227 was permanently lost.
Management of the Fund has concluded that there are no significant uncertain tax positions in the Fund that would require recognition in the financial statements. However, management's conclusion may be subject to review and adjustment at a later date based on factors including, but not limited to, new tax laws, regulations, and administrative interpretations (including relevant court decisions). Generally, the Fund's federal tax returns for the prior three fiscal years remain subject to examination by the Internal Revenue Service.
Note 5. Portfolio Information
The cost of purchases and proceeds from sales of securities, excluding short-term investments and derivatives, if any, aggregated to $173,614,556 and $228,559,340, respectively, for the year ended December 31, 2015. The amount of purchase and sale activity impacts the portfolio turnover rate reported in the Financial Highlights.
Note 6. Affiliated Money Market Fund
The Fund invests in Columbia Short-Term Cash Fund, an affiliated money market fund established for the exclusive use by the Fund and other affiliated funds. The income earned by the Fund from such investments is included as Dividends — affiliated issuers in the Statement of Operations. As an investing fund, the Fund indirectly bears its proportionate share of the expenses of Columbia Short-Term Cash Fund.
Annual Report 2015
33
COLUMBIA REAL ESTATE EQUITY FUND
NOTES TO FINANCIAL STATEMENTS (continued)
December 31, 2015
Note 7. Line of Credit
The Fund has access to a revolving credit facility whereby the Fund may borrow for the temporary funding of shareholder redemptions or for other temporary or emergency purposes. Effective December 8, 2015, Citibank, N.A. and HSBC Bank USA, N.A. joined JPMorgan Chase Bank, N.A. (JPMorgan) as lead of a syndicate of banks under the credit facility, which is a collective agreement between the Fund and certain other funds managed by the Investment Manager, severally and not jointly, that permits collective borrowings up to $1 billion. Interest is charged to each participating fund based on its borrowings at a rate equal to the higher of (i) the overnight federal funds rate plus 1.00% or (ii) the one-month LIBOR rate plus 1.00%. Each borrowing under the credit facility matures no later than 60 days after the date of borrowing. The Fund also pays a commitment fee equal to its pro rata share of the amount of the credit facility at a rate of 0.15% per annum. The commitment fee is included in other expenses in the Statement of Operations. Prior to December 8, 2015, JPMorgan was the sole lead bank under the credit facility agreement that permitted borrowings up to $550 million under the same terms and interest rates as described above with the exception of the commitment fee which was charged at a rate of 0.075% per annum.
The Fund had no borrowings during the year ended December 31, 2015.
Note 8. Significant Risks
Shareholder Concentration Risk
At December 31, 2015, two unaffiliated shareholders of record owned 40.5% of the outstanding shares of the Fund in one or more accounts. The Fund has no knowledge about whether any portion of those shares was owned beneficially. Affiliated shareholders of record owned 25.7% of the outstanding shares of the Fund in one or more accounts. Subscription and redemption activity by concentrated accounts may have a significant effect on the operations of the Fund. In the case of a large redemption, the Fund may be forced to sell investments at inopportune times, including its liquid or more liquid positions, resulting in Fund losses and the Fund holding a higher percentage of less liquid or illiquid securities. Large redemptions could result in decreased economies of scale and increased operating expenses for non-redeeming Fund shareholders.
Financial Sector Risk
The Fund may be more susceptible to the particular risks that may affect companies in the financial services sector than if it were invested in a wider variety of companies in unrelated sectors. Companies in the financial services sector are subject to certain risks, including the risk of regulatory change, decreased liquidity in credit markets and unstable interest rates. Such companies may have concentrated portfolios, such as a high level of loans to real estate developers, which makes them vulnerable to economic conditions that affect that industry. Performance of such companies may be affected by competitive pressures and exposure to investments or agreements that, under certain circumstances, may lead to losses (e.g., subprime loans). Companies in the financial services sector are subject to extensive governmental regulation that may limit the amount and types of loans and other financial commitments they can make, and interest rates and fees that they may charge. In addition, profitability of such companies is largely dependent upon the availability and the cost of capital.
Non-Diversification Risk
A non-diversified fund is permitted to invest a greater percentage of its total assets in fewer issuers than a diversified fund. The Fund may, therefore, have a greater risk of loss from a few issuers than a similar fund that invests more broadly.
Real Estate Industry Risk
The risks associated with the ownership of real estate and the real estate industry in general can include fluctuations in the value of the properties underlying the Fund's portfolio holdings, defaults by borrowers or tenants, market saturation, decreases in market rates for rents, and other economic, political, or regulatory occurrences affecting the real estate industry, including REITs.
REITs depend upon specialized management skills, may have limited financial resources, may have less trading volume, and may be subject to more abrupt or erratic price movements than the overall securities markets. REITs are also subject to the risk of failing to qualify for tax-free pass-through of income. Some REITs (especially mortgage REITs) are affected by risks similar to those associated with investments in debt securities including changes in interest rates and the quality of credit extended.
Annual Report 2015
34
COLUMBIA REAL ESTATE EQUITY FUND
NOTES TO FINANCIAL STATEMENTS (continued)
December 31, 2015
Note 9. Subsequent Events
Management has evaluated the events and transactions that have occurred through the date the financial statements were issued and noted no items requiring adjustment of the financial statements or additional disclosure.
Note 10. Information Regarding Pending and Settled Legal Proceedings
In December 2005, without admitting or denying the allegations, American Express Financial Corporation (AEFC, which is now known as Ameriprise Financial, Inc. (Ameriprise Financial)) entered into settlement agreements with the Securities and Exchange Commission (SEC) and Minnesota Department of Commerce (MDOC) related to market timing activities. As a result, AEFC was censured and ordered to cease and desist from committing or causing any violations of certain provisions of the Investment Advisers Act of 1940, the Investment Company Act of 1940, and various Minnesota laws. AEFC agreed to pay disgorgement of $10 million and civil money penalties of $7 million. AEFC also agreed to retain an independent distribution consultant to assist in developing a plan for distribution of all disgorgement and civil penalties ordered by the SEC in accordance with various undertakings detailed at http://www.sec.gov/litigation/admin/ia-2451.pdf. Ameriprise Financial and its affiliates have cooperated with the SEC and the MDOC in these legal proceedings, and have made regular reports to the Funds' Boards of Trustees.
Ameriprise Financial and certain of its affiliates have historically been involved in a number of legal, arbitration and regulatory proceedings, including routine litigation, class actions, and governmental actions, concerning matters arising in connection with the conduct of their business activities. Ameriprise Financial believes that the Funds are not currently the subject of, and that neither Ameriprise Financial nor any of its affiliates are the subject of, any pending legal, arbitration or regulatory proceedings that are likely to have a material adverse effect on the Funds or the ability of Ameriprise Financial or its affiliates to perform under their contracts with the Funds. Ameriprise Financial is required to make quarterly (10-Q), annual (10-K) and, as necessary, 8-K filings with the SEC on legal and regulatory matters that relate to Ameriprise Financial and its affiliates. Copies of these filings may be obtained by accessing the SEC website at www.sec.gov.
There can be no assurance that these matters, or the adverse publicity associated with them, will not result in increased fund redemptions, reduced sale of fund shares or other adverse consequences to the Funds. Further, although we believe proceedings are not likely to have a material adverse effect on the Funds or the ability of Ameriprise Financial or its affiliates to perform under their contracts with the Funds, these proceedings are subject to uncertainties and, as such, we are unable to estimate the possible loss or range of loss that may result. An adverse outcome in one or more of these proceedings could result in adverse judgments, settlements, fines, penalties or other relief that could have a material adverse effect on the consolidated financial condition or results of operations of Ameriprise Financial.
Annual Report 2015
35
COLUMBIA REAL ESTATE EQUITY FUND
REPORT OF INDEPENDENT REGISTERED PUBLIC ACCOUNTING FIRM
To the Trustees of Columbia Funds Series Trust I and the Shareholders of
Columbia Real Estate Equity Fund
In our opinion, the accompanying statement of assets and liabilities, including the portfolio of investments, and the related statements of operations and of changes in net assets and the financial highlights present fairly, in all material respects, the financial position of Columbia Real Estate Equity Fund (the "Fund," a series of Columbia Funds Series Trust I) at December 31, 2015, and the results of its operations, the changes in its net assets and the financial highlights for each of the periods indicated, in conformity with accounting principles generally accepted in the United States of America. These financial statements and financial highlights (hereafter referred to as "financial statements") are the responsibility of the Fund's management. Our responsibility is to express an opinion on these financial statements based on our audits. We conducted our audits of these financial statements in accordance with the standards of the Public Company Accounting Oversight Board (United States). Those standards require that we plan and perform the audit to obtain reasonable assurance about whether the financial statements are free of material misstatement. An audit includes examining, on a test basis, evidence supporting the amounts and disclosures in the financial statements, assessing the accounting principles used and significant estimates made by management, and evaluating the overall financial statement presentation. We believe that our audits, which included confirmation of securities at December 31, 2015 by correspondence with the custodian and transfer agent, provide a reasonable basis for our opinion.
PricewaterhouseCoopers LLP
Minneapolis, MN
February 22, 2016
Annual Report 2015
36
COLUMBIA REAL ESTATE EQUITY FUND
FEDERAL INCOME TAX INFORMATION
(Unaudited)
The Fund hereby designates the following tax attributes for the fiscal year ended December 31, 2015. Shareholders will be notified in early 2016 of the amounts for use in preparing 2015 income tax returns.
Tax Designations:
| Qualified Dividend Income | | | 0.98 | % | |
| Dividends Received Deduction | | | 0.58 | % | |
Capital Gain Dividend | | $ | 24,716,847 | | |
Qualified Dividend Income. For taxable, non-corporate shareholders, the percentage of ordinary income distributed during the fiscal year that represents qualified dividend income subject to reduced tax rates.
Dividends Received Deduction. The percentage of ordinary income distributed during the fiscal year that qualifies for the corporate dividends received deduction.
Capital Gain Dividend. The Fund designates as a capital gain dividend the amount reflected above, of which $22,106,928 was subject to a long term capital gains tax rate of not greater than 20%, and $1,609,919 to a long term capital gains tax rate of not greater than 25%.
Annual Report 2015
37
COLUMBIA REAL ESTATE EQUITY FUND
Shareholders elect the Board that oversees the Fund's operations. The Board appoints officers who are responsible for day-to-day business decisions based on policies set by the Board. The following table provides basic biographical information about the Fund's Trustees, including their principal occupations during the past five years, although specific titles for individuals may have varied over the period. The year set forth beneath Length of Service in the table below is the year in which the Trustee was first appointed or elected as Trustee to any Fund currently in the Columbia Funds Complex or a predecessor thereof. Under current Board policy, members serve terms of indefinite duration.
Trustees
Independent Trustees
Name,
Address,
Year of Birth | | Position Held With
the Funds and Length of
Service | | Principal Occupation(s)
During the Past Five Years
and Other Relevant
Professional Experience | | Number of
Funds in the
Columbia Funds
Complex
Overseen | | Other Directorships
Held by Trustee During
the Past Five Years | |
Janet Langford Carrig
c/o Columbia
Management Investment Advisers, LLC,
225 Franklin Street
Mail Drop BX32 05228,
Boston, MA 02110
1957 | | Trustee 1996 | | Senior Vice President, General Counsel and Corporate Secretary, ConocoPhillips (integrated energy company) since September 2007 | | | 58 | | | None | |
Douglas A. Hacker
c/o Columbia Management Investment Advisers, LLC,
225 Franklin Street
Mail Drop BX32 05228,
Boston, MA 02110
1955 | | Trustee and Chairman of the Board 1996 | | Independent business executive since May 2006; Executive Vice President — Strategy of United Airlines from December 2002 to May 2006; President of UAL Loyalty Services (airline marketing company) from September 2001 to December 2002; Executive Vice President and Chief Financial Officer of United Airlines from July 1999 to September 2001 | | | 58 | | | Spartan Nash Company (food distributor); Nash Finch Company (food distributor) from 2005 to 2013; Aircastle Limited (aircraft leasing); SeaCube Container Leasing Ltd. (container leasing) from 2010 to 2013; and Travelport Worldwide Limited (travel information technology) | |
Nancy T. Lukitsh
c/o Columbia Management Investment Advisers, LLC,
225 Franklin Street
Mail Drop BX32 05228,
Boston, MA 02110
1956 | | Trustee 2011 | | Senior Vice President, Partner and Director of Marketing, Wellington Management Company, LLP (investment adviser) from 1997 to 2010; Chair, Wellington Management Portfolios (commingled non-U.S. investment pools) from 2007 to 2010; Director, Wellington Trust Company, NA and other Wellington affiliates from 1997 to 2010 | | | 58 | | | None | |
Annual Report 2015
38
COLUMBIA REAL ESTATE EQUITY FUND
TRUSTEES AND OFFICERS (continued)
Independent Trustees (continued)
Name,
Address,
Year of Birth | | Position Held With
the Funds and Length of
Service | | Principal Occupation(s)
During the Past Five Years
and Other Relevant
Professional Experience | | Number of
Funds in the
Columbia Funds
Complex
Overseen | | Other Directorships
Held by Trustee During
the Past Five Years | |
William E. Mayer
c/o Columbia Management Investment Advisers, LLC,
225 Franklin Street
Mail Drop BX32 05228,
Boston, MA 02110
1940 | | Trustee 1991 | | Partner, Park Avenue Equity Partners (private equity) since February 1999 | | | 58 | | | DynaVox Inc. (speech creation); Lee Enterprises (print media); WR Hambrecht + Co. (financial service provider) from 2000 to 2012; BlackRock Capital Investment Corporation (investment company); and Premier, Inc. (healthcare) | |
David M. Moffett
c/o Columbia Management Investment Advisers, LLC,
225 Franklin Street
Mail Drop BX32 05228,
Boston, MA 02110
1952 | | Trustee 2011 | | Retired. Consultant to Bridgewater and Associates | | | 58 | | | Director of CIT Bank, CIT Group Inc. (commercial and consumer finance); eBay Inc. (online trading community); Genworth Financial, Inc. (financial and insurance products and services); Paypal Holdings Inc. (payment and data processing services); and Trustee University of Oklahoma Foundation | |
Charles R. Nelson
c/o Columbia Management Investment Advisers, LLC,
225 Franklin Street
Mail Drop BX32 05228,
Boston, MA 02110
1942 | | Trustee 1981 | | Retired. Professor Emeritus, University of Washington since 2011; Professor of Economics, University of Washington from 1976 to 2011; Ford and Louisa Van Voorhis Professor of Political Economy, University of Washington from 1993 to 2011; Adjunct Professor of Statistics, University of Washington from 1980 to 2011; Associate Editor, Journal of Money, Credit and Banking from September 1993 to 2008; consultant on econometric and statistical matters | | | 58 | | | None | |
John J. Neuhauser
c/o Columbia Management Investment Advisers, LLC,
225 Franklin Street
Mail Drop BX32 05228,
Boston, MA 02110
1943 | | Trustee 1984 | | President, Saint Michael's College since August 2007; Director or Trustee of several non-profit organizations, including University of Vermont Medical Center; Academic Vice President and Dean of Faculties, Boston College from August 1999 to October 2005; University Professor, Boston College from November 2005 to August 2007 | | | 58 | | | Liberty All-Star Equity Fund and Liberty All-Star Growth Fund (closed-end funds) | |
Annual Report 2015
39
COLUMBIA REAL ESTATE EQUITY FUND
TRUSTEES AND OFFICERS (continued)
Independent Trustees (continued)
Name,
Address,
Year of Birth | | Position Held With
the Funds and Length of
Service | | Principal Occupation(s)
During the Past Five Years
and Other Relevant
Professional Experience | | Number of
Funds in the
Columbia Funds
Complex
Overseen | | Other Directorships
Held by Trustee During
the Past Five Years | |
Patrick J. Simpson
c/o Columbia Management Investment Advisers, LLC,
225 Franklin Street
Mail Drop BX32 05228,
Boston, MA 02110
1944 | | Trustee 2000 | | Partner, Perkins Coie LLP (law firm) | | | 58 | | | None | |
Anne-Lee Verville
c/o Columbia Management Investment Advisers, LLC,
225 Franklin Street
Mail Drop BX32 05228,
Boston, MA 02110
1945 | | Trustee 1998 | | Retired. General Manager, Global Education Industry from 1994 to 1997, President — Application Systems Division from 1991 to 1994, Chief Financial Officer — US Marketing & Services from 1988 to 1991, and Chief Information Officer from 1987 to 1988, IBM Corporation (computer and technology) | | | 58 | | | Enesco Group, Inc. (producer of giftware and home and garden decor products) from 2001 to 2006 | |
Annual Report 2015
40
COLUMBIA REAL ESTATE EQUITY FUND
TRUSTEES AND OFFICERS (continued)
Interested Trustee Affiliated with Investment Manager*
Name,
Address,
Year of Birth | | Position Held With
the Funds and Length of
Service | | Principal Occupation(s)
During the Past Five Years
and Other Relevant
Professional Experience | | Number of
Funds in the
Columbia Funds
Complex
Overseen | | Other Directorships
Held by Trustee During
the Past Five Years | |
William F. Truscott
c/o Columbia Management Investment Advisers, LLC,
225 Franklin Street
Boston, MA 02110
1960 | | Trustee 2012 | | Chairman of the Board and President, Columbia Management Investment Advisers, LLC since May 2010 and February 2012, respectively (previously President and Chief Investment Officer, 2001-April 2010); Chief Executive Officer, Global Asset Management, Ameriprise Financial, Inc. since September 2012 (previously Chief Executive Officer, U.S. Asset Management & President, Annuities, May 2010- September 2012 and President — U.S. Asset Management and Chief Investment Officer, 2005-April 2010); Director and Chief Executive Officer, Columbia Management Investment Distributors, Inc. since May 2010 and February 2012, respectively (previously Chairman of the Board and Chief Executive Officer, 2006-April 2010); Chairman of the Board and Chief Executive Officer, RiverSource Distributors, Inc. since 2006; Director, Threadneedle Asset Management Holdings, SARL since 2014; President and Chief Executive Officer, Ameriprise Certificate Company, 2006-August 2012. | | | 182 | | | Chairman of the Board, Columbia Management Investment Advisers, LLC since May 2010; Director, Columbia Management Investment Distributors, Inc. since May 2010; Former Director, Ameriprise Certificate Company, 2006-January 2013 | |
* Interested person (as defined under the 1940 Act) by reason of being an officer, director, security holder and/or employee of the Investment Manager or Ameriprise Financial.
The Statement of Additional Information has additional information about the Fund's Board members and is available, without charge, upon request by calling 800.345.6611; contacting your financial intermediary; or visiting columbiathreadneedle.com/us.
Annual Report 2015
41
COLUMBIA REAL ESTATE EQUITY FUND
TRUSTEES AND OFFICERS (continued)
The Board has appointed officers who are responsible for day-to-day business decisions based on policies it has established. The officers serve at the pleasure of the Board. The following table provides basic information about the Officers of the Fund, including principal occupations during the past five years, although their specific titles may have varied over the period. In addition to Mr. Truscott, who is Senior Vice President, the Fund's other officers are:
Fund Officers
Name,
Address and
Year of Birth | | Position and Year
First Appointed to
Position for any Fund
in the Columbia
Funds Complex or a
Predecessor Thereof | |
Principal Occupation(s) During Past Five Years | |
Christopher O. Petersen
5228 Ameriprise Financial Center
Minneapolis, MN 55474
Born 1970 | | President and Principal Executive Officer (2015) | | Vice President and Lead Chief Counsel, Ameriprise Financial, Inc. since January 2015 (previously, Vice President and Chief Counsel January 2010-December 2014; and Vice President and Group Counsel or Counsel 2004-January 2010); officer of Columbia Funds and affiliated funds since 2007. | |
Michael G. Clarke
225 Franklin Street
Boston, MA 02110
Born 1969 | | Treasurer (2011), Chief Financial Officer (2009) and Chief Accounting Officer (2015) | | Vice President — Mutual Fund Administration, Columbia Management Investment Advisers, LLC, since May 2010; Managing Director of Fund Administration, Columbia Management Advisors, LLC, September 2004-April 2010; senior officer of Columbia Funds and affiliated funds since 2002. | |
Paul B. Goucher
100 Park Avenue
New York, NY 10017
Born 1968 | | Senior Vice President (2011), Chief Legal Officer (2015) and Assistant Secretary (2008) | | Vice President and Lead Chief Counsel, Ameriprise Financial, Inc. since November 2008 and January 2013, respectively (previously Chief Counsel, January 2010-January 2013 and Group Counsel, November 2008-January 2010). | |
Thomas P. McGuire
225 Franklin Street
Boston, MA 02110
Born 1972 | | Senior Vice President and Chief Compliance Officer (2012) | | Vice President — Asset Management Compliance, Ameriprise Financial, Inc., since May 2010; Chief Compliance Officer, Ameriprise Certificate Company since September 2010; Compliance Executive, Bank of America, 2005-April 2010. | |
Colin Moore
225 Franklin Street
Boston, MA 02110
Born 1958 | | Senior Vice President (2010) | | Executive Vice President and Global Chief Investment Officer, Ameriprise Financial, Inc., since July 2013; Director and Global Chief Investment Officer, Columbia Management Investment Advisers, LLC since May 2010; Manager, Managing Director and Chief Investment Officer, Columbia Management Advisors, LLC, 2007-April 2010. | |
Michael E. DeFao
225 Franklin Street
Boston, MA 02110
Born 1968 | | Vice President (2011) and Assistant Secretary (2010) | | Vice President and Chief Counsel, Ameriprise Financial, Inc. since May 2010; Associate General Counsel, Bank of America, 2005-April 2010. | |
Amy Johnson
5228 Ameriprise Financial Center
Minneapolis, MN 55474
Born 1965 | | Vice President (2006) | | Managing Director and Chief Operating Officer, Columbia Management Investment Advisers, LLC since May 2010 (previously Chief Administrative Officer, 2009-April 2010, and Vice President — Asset Management and Trust Company Services, 2006-2009). | |
Lyn Kephart-Strong
5228 Ameriprise
Financial Center
Minneapolis, MN 55474
Born 1960 | | Vice President (2015) | | President, Columbia Management Investment Services Corp. since October 2014; Vice President & Resolution Officer, Ameriprise Trust Company since August 2009; President, RiverSource Service Corporation 2004-2010. | |
Ryan C. Larrenaga
225 Franklin Street
Boston, MA 02110
Born 1970 | | Vice President and Secretary (2015) | | Vice President and Group Counsel, Ameriprise Financial, Inc. since August 2011 (previously, Counsel from May 2010 to August 2011); Assistant General Counsel, Bank of America, 2005-April 2010; officer of Columbia Funds and affiliated funds since 2005. | |
Annual Report 2015
42
COLUMBIA REAL ESTATE EQUITY FUND
IMPORTANT INFORMATION ABOUT THIS REPORT
Each fund mails one shareholder report to each shareholder address. If you would like more than one report, please call shareholder services at 800.345.6611 and additional reports will be sent to you.
The policy of the Board is to vote the proxies of the companies in which each fund holds investments consistent with the procedures as stated in the Statement of Additional Information (SAI). You may obtain a copy of the SAI without charge by calling 800.345.6611; contacting your financial intermediary; visiting columbiathreadneedle.com/us; or searching the website of the Securities and Exchange Commission (SEC) at sec.gov. Information regarding how each fund voted proxies relating to portfolio securities is filed with the SEC by August 31st for the most recent 12-month period ending June 30th of that year, and is available without charge by visiting columbiathreadneedle.com/us, or searching the website of the SEC at sec.gov.
Each fund files a complete schedule of portfolio holdings with the SEC for the first and third quarters of each fiscal year on Form N-Q. Each fund's Form N-Q is available on the SEC's website at sec.gov and may be reviewed and copied at the SEC's Public Reference Room in Washington, D.C. Information on the operation of the Public Reference Room may be obtained by calling 800.SEC.0330. Each fund's complete schedule of portfolio holdings, as filed on Form N-Q, can also be obtained without charge, upon request, by calling 800.345.6611.
Annual Report 2015
43
Columbia Real Estate Equity Fund
P.O. Box 8081
Boston, MA 02266-8081

This information is for use with concurrent or prior delivery of a fund prospectus. Please read and consider the investment objectives, risks, charges and expenses for any fund carefully before investing. For a prospectus and summary prospectus, which contains this and other important information about the Fund, go to columbiathreadneedle.com/us. The Fund is distributed by Columbia Management Investment Distributors, Inc., member FINRA, and managed by Columbia Management Investment Advisers, LLC.
Columbia Threadneedle Investments (Columbia Threadneedle) is the global brand name of the Columbia and Threadneedle group of companies.
All rights reserved. Columbia Management Investment Distributors, Inc., 225 Franklin Street, Boston, MA 02110-2804
© 2016 Columbia Management Investment Advisers, LLC.
columbiathreadneedle.com/us
ANN212_12_F01_(02/16)
Item 2. Code of Ethics.
(a) The registrant has adopted a code of ethics that applies to the registrant’s principal executive officer, principal financial officer, principal accounting officer or controller, or persons performing similar functions, regardless of whether these individuals are employed by the registrant or a third party.
(b) During the period covered by this report, there were not any amendments to a provision of the code of ethics adopted in 2(a) above.
(c) During the period covered by this report, there were no waivers, including any implicit waivers, from a provision of the code of ethics described in 2(a) above that relates to one or more of the items set forth in paragraph (b) of this item’s instructions.
Item 3. Audit Committee Financial Expert.
The registrant’s Board of Trustees has determined that Douglas A. Hacker, David M. Moffett and Anne-Lee Verville, each of whom are members of the registrant’s Board of Trustees and Audit Committee, each qualify as an audit committee financial expert. Mr. Hacker, Mr. Moffett and Ms. Verville are each independent trustees, as defined in paragraph (a)(2) of this item’s instructions.
Item 4. Principal Accountant Fees and Services.
Fee information below is disclosed for the one series of the registrant whose reports to stockholders are included in this annual filing.
(a) Audit Fees. Aggregate Audit Fees billed by the principal accountant for professional services rendered during the fiscal years ended December 31, 2015 and December 31, 2014 are approximately as follows:
2015 | | 2014 | |
$ | 23,300 | | $ | 23,300 | |
| | | | | |
Audit Fees include amounts related to the audit of the registrant’s annual financial statements or services that are normally provided by the accountant in connection with statutory and regulatory filings or engagements for those fiscal years.
(b) Audit-Related Fees. Aggregate Audit-Related Fees billed to the registrant by the principal accountant for professional services rendered during the fiscal years ended December 31, 2015 and December 31, 2014 are approximately as follows:
Audit-Related Fees include amounts for assurance and related services by the principal accountant that are reasonably related to the performance of the audit of the registrant’s financial statements and are not reported in Audit Fees above. In fiscal years 2015 and 2014, Audit-Related Fees consist of agreed-upon procedures performed for semi-annual shareholder reports.
During the fiscal years ended December 31, 2015 and December 31, 2014, there were no Audit-Related Fees billed by the registrant’s principal accountant to the registrant’s investment adviser (not including any sub-adviser whose role is primarily portfolio management and is subcontracted with or overseen by another investment adviser) and any entity controlling, controlled by, or under common control with the adviser that provides ongoing services to the registrant for an engagement that related directly to the operations and financial reporting of the registrant.
(c) Tax Fees. Aggregate Tax Fees billed by the principal accountant to the registrant for professional services rendered during the fiscal years ended December 31, 2015 and December 31, 2014 are approximately as follows:
Tax Fees include amounts for the review of annual tax returns, the review of required shareholder distribution calculations and typically include amounts for professional services by the principal accountant for tax compliance, tax advice and tax planning.
During the fiscal years ended December 31, 2015 and December 31, 2014, there were no Tax Fees billed by the registrant’s principal accountant to the registrant’s investment adviser (not including any sub-adviser whose role is primarily portfolio management and is subcontracted with or overseen by another investment adviser) and any entity controlling, controlled by, or under common control with the adviser that provides ongoing services to the registrant for an engagement that related directly to the operations and financial reporting of the registrant.
(d) All Other Fees. Aggregate All Other Fees billed by the principal accountant to the registrant for professional services rendered during the fiscal years ended December 31, 2015 and December 31, 2014 are approximately as follows:
All Other Fees include amounts for products and services provided by the principal accountant, other than the services reported in paragraphs (a) through (c) above.
Aggregate All Other Fees billed by the registrant’s principal accountant to the registrant’s investment adviser (not including any sub-adviser whose role is primarily portfolio management and is subcontracted with or overseen by another investment adviser) and any entity controlling, controlled by, or under common control with the adviser that provides ongoing services to the registrant for an engagement that related directly to the operations and financial reporting of the registrant during the fiscal years ended December 31, 2015 and December 31, 2014 are approximately as follows:
2015 | | 2014 | |
$ | 225,000 | | $ | 325,000 | |
| | | | | |
In fiscal years 2015 and 2014, All Other Fees primarily consists of fees billed for internal control examinations of the registrant’s transfer agent and investment adviser.
(e)(1) Audit Committee Pre-Approval Policies and Procedures
The registrant’s Audit Committee is required to pre-approve the engagement of the registrant’s independent auditors to provide audit and non-audit services to the registrant and non-audit services to its investment adviser (excluding any sub-adviser whose role is primarily portfolio management and is sub-contracted or overseen by another investment adviser (the “Adviser”) or any entity controlling, controlled by or under common control with the Adviser that provides ongoing services to the Fund (a “Control Affiliate”) if the engagement relates directly to the operations and financial reporting of the registrant.
The Audit Committee has adopted a Policy for Engagement of Independent Auditors for Audit and Non-Audit Services (the “Policy”). The Policy sets forth the understanding of the Audit Committee regarding the engagement of the registrant’s independent accountants to provide (i) audit and permissible audit-related, tax and other services to the registrant (“Fund Services”); (ii) non-audit services to the registrant’s Adviser and any Control Affiliates, that relates directly to the operations and financial reporting of a Fund (“Fund-related Adviser Services”); and (iii) certain other audit and non-audit services to the registrant’s Adviser and its Control Affiliates. A service will require specific pre-approval by the Audit Committee if it is to be provided by the Fund’s independent auditor; provided, however, that pre-approval of non-audit services to the Fund, the Adviser or Control Affiliates may be waived if certain de minimis requirements set forth in the SEC’s rules are met.
Under the Policy, the Audit Committee may delegate pre-approval authority to any pre-designated member or members who are independent board members. The member(s) to whom such authority is delegated must report, for informational purposes only, any pre-approval decisions to the Audit Committee at its next regular meeting. The Audit Committee’s responsibilities with respect to the pre-approval of services performed by the independent auditor may not be delegated to management.
On an annual basis, at a regularly scheduled Audit Committee meeting, the Fund’s Treasurer or other Fund officer shall submit to the Audit Committee a schedule of the types of Fund Services and Fund-related Adviser Services that are subject to specific pre-approval. This schedule will provide a description of each type of service that is subject to specific pre-approval, along with total projected fees for each service. The pre-approval will generally cover a one-year period. The Audit Committee will review and approve the types of services and the projected fees for the next one-year period and may add to, or subtract from, the list of pre-approved services from time to time, based on subsequent determinations. This specific approval acknowledges that the Audit Committee is in agreement with the specific types of services that the independent auditor will be permitted to perform and the projected fees for each service.
The Fund’s Treasurer or other Fund officer shall report to the Audit Committee at each of its regular meetings regarding all Fund Services or Fund-related Adviser Services provided since the last such report was rendered, including a description of the services, by category, with forecasted fees for the annual reporting period, proposed changes requiring specific pre-approval and a description of services provided by the independent auditor, by category, with actual fees during the current reporting period.
*****
(e)(2) 100% of the services performed for items (b) through (d) above during 2015 and 2014 were pre-approved by the registrant’s Audit Committee.
(f) Not applicable.
(g) The aggregate non-audit fees billed by the registrant’s accountant for services rendered to the registrant, and rendered to the registrant’s investment adviser (not including any sub-adviser whose role is primarily portfolio management and is subcontracted with or overseen by another investment adviser), and any entity controlling, controlled by, or under common control with the adviser that provides ongoing services to the registrant during the fiscal years ended December 31, 2015 and December 31, 2014 are approximately as follows:
2015 | | 2014 | |
$ | 231,200 | | $ | 331,200 | |
| | | | | |
(h) The registrant’s Audit Committee of the Board of Directors has considered whether the provision of non-audit services that were rendered to the registrant’s adviser (not including any sub-adviser whose role is primarily portfolio management and is subcontracted with or overseen by another investment adviser), and any entity controlling, controlled by, or under common control with the investment adviser that provides ongoing services to the registrant that were not pre-approved pursuant to paragraph (c)(7)(ii) of Rule 2-01 of Regulation S-X, is compatible with maintaining the principal accountant’s independence.
Item 5. Audit Committee of Listed Registrants.
Not applicable.
Item 6. Investments
(a) The registrant’s “Schedule I — Investments in securities of unaffiliated issuers” (as set forth in 17 CFR 210.12-12) is included in Item 1 of this Form N-CSR.
(b) Not applicable.
Item 7. Disclosure of Proxy Voting Policies and Procedures for Closed-End Management Investment Companies.
Not applicable.
Item 8. Portfolio Managers of Closed-End Management Investment Companies.
Not applicable.
Item 9. Purchases of Equity Securities by Closed-End Management Investment Company and Affiliated Purchasers.
Not applicable.
Item 10. Submission of Matters to a Vote of Security Holders.
There were no material changes to the procedures by which shareholders may recommend nominees to the registrant’s board of directors.
Item 11. Controls and Procedures.
(a) The registrant’s principal executive officer and principal financial officers, based on their evaluation of the registrant’s disclosure controls and procedures as of a date within 90 days of the filing of this report, have concluded that such controls and procedures are adequately designed to ensure that material information required to be disclosed by the registrant in Form N-CSR is accumulated and communicated to the registrant’s management, including the principal executive officer and principal financial officer, or persons performing similar functions, as appropriate to allow timely decisions regarding required disclosure.
(b) There was no change in the registrant’s internal control over financial reporting that occurred during the registrant’s second fiscal quarter of the period covered by this report that has materially affected, or is reasonably likely to materially affect, the registrant’s internal control over financial reporting.
Item 12. Exhibits.
(a)(1) Code of ethics required to be disclosed under Item 2 of Form N-CSR attached hereto as Exhibit 99.CODE ETH.
(a)(2) Certifications pursuant to Rule 30a-2(a) under the Investment Company Act of 1940 (17 CFR 270.30a-2(a)) attached hereto as Exhibit 99.CERT.
(a)(3) Not applicable.
(b) Certification pursuant to Rule 30a-2(b) under the Investment Company Act of 1940 (17 CFR 270.30a-2(b)) attached hereto as Exhibit 99.906CERT.
SIGNATURES
Pursuant to the requirements of the Securities Exchange Act of 1934 and the Investment Company Act of 1940, the registrant has duly caused this report to be signed on its behalf by the undersigned, thereunto duly authorized.
(registrant) | | Columbia Funds Series Trust I | |
| | | |
| | | |
By (Signature and Title) | | /s/ Christopher O. Petersen | |
| Christopher O. Petersen, President and Principal Executive Officer | |
| | | |
| | | |
Date | | February 22, 2016 | |
| | | | | |
Pursuant to the requirements of the Securities Exchange Act of 1934 and the Investment Company Act of 1940, this report has been signed below by the following persons on behalf of the registrant and in the capacities and on the dates indicated.
By (Signature and Title) | | /s/ Christopher O. Petersen | |
| Christopher O. Petersen, President and Principal Executive Officer | |
| | | |
| | | |
Date | | February 22, 2016 | |
| | |
| | |
By (Signature and Title) | | /s/ Michael G. Clarke | |
| | Michael G. Clarke, Treasurer and Chief Financial Officer | |
| | |
| | |
Date | | February 22, 2016 | |
| | | | | |