UNITED STATES
SECURITIES AND EXCHANGE COMMISSION
Washington, D.C. 20549
FORM N-CSR
CERTIFIED SHAREHOLDER REPORT OF REGISTERED
MANAGEMENT INVESTMENT COMPANIES
Investment Company Act file number | 811-04367 |
|
Columbia Funds Series Trust I |
(Exact name of registrant as specified in charter) |
|
225 Franklin Street, Boston, Massachusetts | | 02110 |
(Address of principal executive offices) | | (Zip code) |
|
Ryan Larrenaga c/o Columbia Management Investment Advisers, LLC 225 Franklin Street Boston, MA 02110 |
(Name and address of agent for service) |
|
Registrant’s telephone number, including area code: | (800) 345-6611 | |
|
Date of fiscal year end: | July 31 | |
|
Date of reporting period: | July 31, 2015 | |
| | | | | | | | |
Form N-CSR is to be used by management investment companies to file reports with the Commission not later than 10 days after the transmission to stockholders of any report that is required to be transmitted to stockholders under Rule 30e-1 under the Investment Company Act of 1940 (17 CFR 270.30e-1). The Commission may use the information provided on Form N-CSR in its regulatory, disclosure review, inspection, and policymaking roles.
A registrant is required to disclose the information specified by Form N-CSR, and the Commission will make this information public. A registrant is not required to respond to the collection of information contained in Form N-CSR unless the Form displays a currently valid Office of Management and Budget ("OMB") control number. Please direct comments concerning the accuracy of the information collection burden estimate and any suggestions for reducing the burden to Secretary, Securities and Exchange Commission, 450 Fifth Street, NW, Washington, DC 20549-0609. The OMB has reviewed this collection of information under the clearance requirements of 44 U.S.C. § 3507.
Item 1. Reports to Stockholders.

ANNUAL REPORT
July 31, 2015

COLUMBIA AMT-FREE OREGON INTERMEDIATE
MUNI BOND FUND


ABOUT COLUMBIA THREADNEEDLE INVESTMENTS
Columbia Threadneedle Investments is a leading global asset management group that provides a broad range of actively managed investment strategies and solutions for individual, institutional and corporate clients around the world.
With more than 2,000 people, including over 450 investment professionals based in North America, Europe and Asia, we manage $503 billion* of assets across developed and emerging market equities, fixed income, asset allocation solutions and alternatives. We are the 13th largest manager of long-term mutual fund assets in the U.S.** and the 4th largest manager of retail funds in the U.K.***
Our priority is the investment success of our clients. We aim to deliver the investment outcomes they expect through an investment approach that is team-based, performance-driven and risk-aware. Our culture is dynamic and interactive. By sharing our insights across asset classes and geographies, we generate richer perspectives on global, regional and local investment landscapes. The ability to exchange and debate investment ideas in a collaborative environment enriches our teams' investment processes. More importantly, it results in better informed investment decisions for our clients.
Columbia funds are distributed by Columbia Management Investment Distributors, Inc., member FINRA, and managed by Columbia Management Investment Advisers, LLC.
Columbia Threadneedle Investments (Columbia Threadneedle) is the global brand name of the Columbia and Threadneedle group of companies.
* In U.S. dollars as of June 30, 2015. Source: Ameriprise Q2 Earnings Release. Includes all assets managed by entities in the Columbia and Threadneedle groups of companies. Contact us for more current data.
** Source: ICI as of June 30, 2015 for Columbia Management Investment Advisers, LLC.
*** Source: Investment Association as of June 2015 for Threadneedle Asset Management Limited.
© 2015 Columbia Management Investment Advisers, LLC. All rights reserved.
Not part of the shareholder report
 Dear Shareholder,
Today's investors are typically focused on outcomes, like living a certain retirement lifestyle, paying for college education or building a legacy. But in today's complex global investment landscape, even simple goals are not easily achieved.
At Columbia Threadneedle Investments, we aspire to help satisfy five core needs of today's investors:
n Generate an appropriate stream of income in retirement
Traditional approaches to generating income may not provide the diversification benefits they once did, and they may actually introduce unwanted risk in today's market. To seek to improve your potential to live comfortably long term, we endeavor to pursue investments that explore less traveled paths to income.
n Navigate a changing interest rate environment
Today's uncertain market environment includes the prospect of a rise in interest rates. Blending traditional investments with non-traditional or alternative products may help protect your wealth during periods of volatility. We can attempt to help strengthen your portfolio with agile products designed to take on the market's ups and downs.
n Maximize after-tax returns
In an environment where what you keep may be more important than what you earn, municipal bonds can help mitigate high tax burdens while providing potentially attractive yields. Our state and federal tax-exempt products are aimed at helping investors manage risk, minimize the fluctuation of capital and grow wealth on a more tax-efficient basis.
n Grow assets to achieve financial goals
We believe that finding and protecting growth comes from a disciplined security selection process designed to create excess return. Our goal is to provide investment solutions built to help you face today's market challenges and grow your assets at each crossroad of your journey.
n Ease the impact of volatile markets
Despite a bull market run that has benefited many investors over the past several years, it's important to remember the lessons of 2008 and the value that a well-diversified portfolio may provide through times of market volatility. We are here to help you hold onto the savings you have worked tirelessly to amass, and to provide you the best opportunity to maintain your standard of living regardless of market conditions.
Find out today how we can help you confidently invest to realize your dreams. Please visit us at blog.columbiathreadneedleus.com/our-best-ideas to learn more about our unique investment solutions.
The world is constantly changing, but our priority remains the same: to help you secure your finances, meet your goals and achieve success. Thank you for your continued investment with us.
Sincerely,

Christopher O. Petersen
President, Columbia Funds
Investors should consider the investment objectives, risks, charges and expenses of a mutual fund carefully before investing. For a free prospectus and summary prospectus, which contains this and other important information about a fund, visit columbiathreadneedle.com/us. The prospectus should be read carefully before investing.
Columbia Funds are distributed by Columbia Management Investment Distributors, Inc., member FINRA, and managed by Columbia Management Investment Advisers, LLC.
© 2015 Columbia Management Investment Advisers, LLC. All rights reserved.
COLUMBIA AMT-FREE OREGON INTERMEDIATE MUNI BOND FUND
Fund Investment Manager
Columbia Management Investment
Advisers, LLC
225 Franklin Street
Boston, MA 02110
Fund Distributor
Columbia Management Investment
Distributors, Inc.
225 Franklin Street
Boston, MA 02110
Fund Transfer Agent
Columbia Management Investment
Services Corp.
P.O. Box 8081
Boston, MA 02266-8081
For more information about any of the funds, please visit columbiathreadneedle.com/us or call 800.345.6611. Customer Service Representatives are available to answer your questions Monday through Friday from 8 a.m. to 7 p.m. Eastern time.
The views expressed in this report reflect the current views of the respective parties. These views are not guarantees of future performance and involve certain risks, uncertainties and assumptions that are difficult to predict, so actual outcomes and results may differ significantly from the views expressed. These views are subject to change at any time based upon economic, market or other conditions and the respective parties disclaim any responsibility to update such views. These views may not be relied on as investment advice and, because investment decisions for a Columbia fund are based on numerous factors, may not be relied on as an indication of trading intent on behalf of any particular Columbia fund. References to specific securities should not be construed as a recommendation or investment advice.
Performance Overview | | | 3 | | |
Manager Discussion of Fund Performance | | | 5 | | |
Understanding Your Fund's Expenses | | | 7 | | |
Portfolio of Investments | | | 8 | | |
Statement of Assets and Liabilities | | | 16 | | |
Statement of Operations | | | 18 | | |
Statement of Changes in Net Assets | | | 19 | | |
Financial Highlights | | | 21 | | |
Notes to Financial Statements | | | 27 | | |
Report of Independent Registered
Public Accounting Firm | | | 34 | | |
Federal Income Tax Information | | | 35 | | |
Trustees and Officers | | | 36 | | |
Board Consideration and Approval of Advisory Agreement | | | 40 | | |
Important Information About This Report | | | 45 | | |
COLUMBIA AMT-FREE OREGON INTERMEDIATE MUNI BOND FUND
Performance Summary
n Columbia AMT-Free Oregon Intermediate Muni Bond Fund (the Fund) Class A shares returned 2.17% excluding sales charges for the 12-month period that ended July 31, 2015. Class Z shares of the Fund returned 2.42% for the same time period.
n The Fund's benchmark, the Barclays 3-15 Year Blend Municipal Bond Index, returned 2.87% during the 12-month period.
n The Fund's exposure to short-term bonds, which lagged the broader market, was the largest factor in its modest underperformance.
Average Annual Total Returns (%) (for period ended July 31, 2015)
| | | Inception | | 1 Year | | 5 Years | | 10 Years | |
Class A | | 11/01/02 | | | | | | | | | | | | | |
Excluding sales charges | | | | | | | 2.17 | | | | 3.11 | | | | 3.51 | | |
Including sales charges | | | | | -0.90 | | | | 2.47 | | | | 3.19 | | |
Class B | | 11/01/02 | | | | | | | | | | | | | |
Excluding sales charges | | | | | | | 1.49 | | | | 2.35 | | | | 2.74 | | |
Including sales charges | | | | | | | -1.49 | | | | 2.35 | | | | 2.74 | | |
Class C | | 10/13/03 | | | | | | | | | | | | | |
Excluding sales charges | | | | | | | 1.73 | | | | 2.69 | | | | 3.09 | | |
Including sales charges | | | | | | | 0.73 | | | | 2.69 | | | | 3.09 | | |
Class R4* | | 03/19/13 | | | 2.50 | | | | 3.37 | | | | 3.77 | | |
Class R5* | | 11/08/12 | | | 2.54 | | | | 3.39 | | | | 3.78 | | |
Class Z | | 07/02/84 | | | 2.42 | | | | 3.36 | | | | 3.76 | | |
Barclays 3-15 Year Blend Municipal Bond Index | | | | | | | 2.87 | | | | 3.91 | | | | 4.53 | | |
Returns for Class A are shown with and without the maximum initial sales charge of 3.00%. The maximum applicable sales charge was reduced from 3.25% to 3.00% on Class A share purchases made on or after February 19, 2015. Class A returns (including sales charges) for all periods reflect the current maximum applicable sales charge of 3.00%. Returns for Class B are shown with and without the applicable contingent deferred sales charge (CDSC) of 3.00% in the first year, declining to 1.00% in the fourth year and eliminated thereafter. Returns for Class C are shown with and without the 1.00% CDSC for the first year only. The Fund's other classes are not subject to sales charges and have limited eligibility. Please see the Fund's prospectus for details. Performance for different share classes will vary based on differences in sales charges and fees associated with each class. All results shown assume reinvestment of distributions during the period. Returns do not reflect the deduction of taxes that a shareholder may pay on Fund distributions or on the redemption of Fund shares. Performance results reflect the effect of any fee waivers or reimbursements of Fund expenses by Columbia Management Investment Advisers, LLC and/or any of its affiliates. Absent these fee waivers or expense reimbursement arrangements, performance results would have been lower.
The performance information shown represents past performance and is not a guarantee of future results. The investment return and principal value of your investment will fluctuate so that your shares, when redeemed, may be worth more or less than their original cost. Current performance may be lower or higher than the performance information shown. You may obtain performance information current to the most recent month-end by contacting your financial intermediary, visiting columbiathreadneedle.com/us or calling 800.345.6611.
*The returns shown for periods prior to the share class inception date (including returns for the Life of the Fund, if shown, which are since Fund inception) include the returns of the Fund's oldest share class. These returns are adjusted to reflect any higher class-related operating expenses of the newer share classes, as applicable. Please visit columbiathreadneedle.com/us/investment-products/mutual-funds/appended-performance for more information.
The Barclays 3-15 Year Blend Municipal Bond Index is an unmanaged index that tracks the performance of municipal bonds issued after December 31, 1990, with remaining maturities between 2 and 17 years and at least $7 million in principal amount outstanding.
Indices are not available for investment, are not professionally managed and do not reflect sales charges, fees, brokerage commissions, taxes or other expenses of investing. Securities in the Fund may not match those in an index.
Annual Report 2015
3
COLUMBIA AMT-FREE OREGON INTERMEDIATE MUNI BOND FUND
PERFORMANCE OVERVIEW (continued)
Performance of a Hypothetical $10,000 Investment (August 1, 2005 – July 31, 2015)
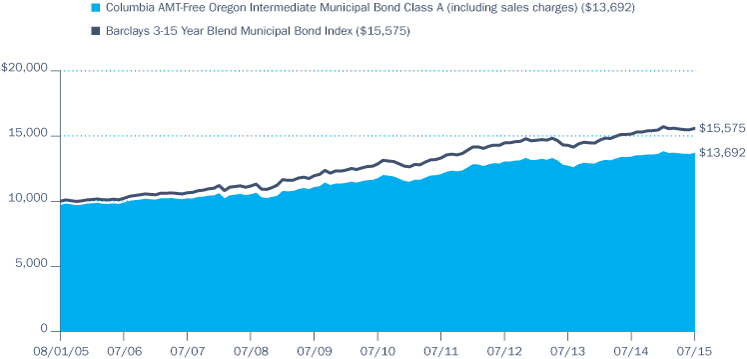
The chart above shows the change in value of a hypothetical $10,000 investment in Class A shares of Columbia AMT-Free Oregon Intermediate Muni Bond Fund during the stated time period, and does not reflect the deduction of taxes that a shareholder may pay on Fund distributions or on the redemption of Fund shares.
Annual Report 2015
4
COLUMBIA AMT-FREE OREGON INTERMEDIATE MUNI BOND FUND
MANAGER DISCUSSION OF FUND PERFORMANCE
The Fund's Class A shares returned 2.17%, excluding sales charges, during the 12-month period that ended July 31, 2015. Class Z shares of the Fund returned 2.42% for the same time period. The Fund's benchmark, the Barclays 3-15 Year Blend Municipal Bond Index, returned 2.87%. The Fund's exposure to short-term bonds, which lagged the broader market, was the largest factor in its modest underperformance.
Market Overview
The U.S. municipal bond market delivered a gain during the past 12 months, but the bulk of the positive performance occurred in the first half of the period. During this time, bond investors were buoyed by the backdrop of slow economic growth and favorable U.S. Federal Reserve (Fed) policy. In the second half of the period, however, the market began to factor in the prospect that the Fed could raise interest rates before the end of 2015, leading to weaker performance. During the course of the full period, yields generally rose (as prices fell) for bonds with maturities of five years and less. At the same time, bonds with maturities of 10 years and higher registered positive price performance.
Overall new issue supply has picked up in 2015, and is currently on pace to exceed $400 billion for the calendar year. Late in 2014, the market saw a significant increase in refunding volume. During this time, issuers took advantage of the low rates to refinance older, higher cost debt, thereby decreasing their interest costs and helping to manage their budgets. The refinancing wave continued through May 2015 before abating somewhat in the final two months of the period. In Oregon, new issuance and refinancing activity increased for both local school districts and the State of Oregon. These new issues were typically higher quality, AA-rated securities that offered below-average yields.
Oregon's Economy Continues to Expand
Oregon's economy has exhibited strength during the past year, thanks in part to accelerating manufacturing activity and the robust health of the technology sector. Moody's Investor Service reported that personal income in the state increased 6.4% during 2014, which was the strongest growth among all 50 states and above the 4.5% average for the country. Strength in tourism, exports and Oregon's real estate market have also been positive factors in the state's growth profile. Oregon's municipal bond market performed in line with the broader U.S. muni market during the 12-month period.
Contributors and Detractors
The largest detractor from performance was the Fund's weighting in high-quality, shorter-maturity issues with AAA and AA ratings. These holdings are typically older bonds that the Fund purchased when rates were higher, so they provided a steady income stream even though their total returns lagged the benchmark for the period. The Fund held some longer dated zero-coupon bonds, which detracted from performance when yields began to rise during the second half of the period. The Fund's above-benchmark exposure to local school district bonds, rated AA as a result of their guarantee under the Oregon School Bond Guaranty
Portfolio Management
Brian McGreevy
Quality Breakdown (%)
(at July 31, 2015) | |
AAA rating | | | 2.6 | | |
AA rating | | | 63.2 | | |
A rating | | | 20.0 | | |
BBB rating | | | 8.1 | | |
CC rating | | | 1.5 | | |
Not rated | | | 4.6 | | |
Total | | | 100.0 | | |
Percentages indicated are based upon total fixed income investments (excluding Money Market Funds).
Bond ratings apply to the underlying holdings of the Fund and not the Fund itself and are divided into categories ranging from highest to lowest credit quality, determined by using the middle rating of Moody's, S&P and Fitch, after dropping the highest and lowest available ratings. When ratings are available from only two rating agencies, the lower rating is used. When a rating is available from only one rating agency, that rating is used. When a bond is not rated by any rating agency, it is designated as "Not rated." Credit quality ratings assigned by a rating agency are subjective opinions, not statements of fact, and are subject to change, including daily. The ratings assigned by credit rating agencies are but one of the considerations that the Investment Manager and/or Fund's subadviser incorporates into its credit analysis process, along with such other issuer-specific factors as cash flows, capital structure and leverage ratios, ability to de-leverage (repay) through free cash flow, quality of management, market positioning and access to capital, as well as such security-specific factors as the terms of the security (e.g., interest rate and time to maturity) and the amount and type of any collateral.
Annual Report 2015
5
COLUMBIA AMT-FREE OREGON INTERMEDIATE MUNI BOND FUND
MANAGER DISCUSSION OF FUND PERFORMANCE (continued)
Investment Risks
Fixed-income securities present issuer default risk. The Fund invests substantially in municipal securities and will be affected by tax, legislative, regulatory, demographic or political changes, as well as changes impacting a state's financial, economic or other conditions. A relatively small number of tax-exempt issuers may necessitate the Fund investing more heavily in a single issuer and, therefore, be more exposed to the risk of loss than a fund that invests more broadly. The value of the Fund's portfolio may be more volatile than a more geographically diversified fund. Prepayment and extension risk exists as a loan, bond or other investment may be called, prepaid or redeemed before maturity and that similar yielding investments may not be available for purchase. A rise in interest rates may result in a price decline of fixed-income instruments held by the Fund, negatively impacting its performance and NAV. Falling rates may result in the Fund investing in lower yielding debt instruments, lowering the Fund's income and yield. These risks may be heightened for longer maturity and duration securities. Non-investment-grade (high-yield or junk) securities present greater price volatility and more risk to principal and income than higher rated securities. Market risk may affect a single issuer, sector of the economy, industry or the market as a whole. Federal and state tax rules apply to capital gain distributions and any gains or losses on sales. Income may be subject to state or local taxes. Liquidity risk is associated with the difficulty of selling underlying investments at a desirable time or price. See the Fund's prospectus for more information on these and other risks.
program, dragged on Fund performance during the period as higher quality bonds generally underperformed lower quality bonds.
The Fund's positions in longer maturity A and BBB rated bonds made the largest positive contribution to performance. The continuing care retirement community sector also generated robust results. In addition, several of the Fund's holdings in longer maturity bonds were pre-refunded, resulting in significant gains. Several of the Fund's holdings in U.S. territories such as Guam and the Virgin Islands also generated benchmark-beating results. This represents a contrast to Puerto Rico, where the bond market continued to weaken due to the deterioration of economic conditions on the island. Fund performance also benefited from holdings in special-tax bonds tied to property taxes, which benefited from the increased real estate values in the Portland area.
Fund Positioning
We sought to maintain a duration (interest-rate sensitivity) that closely matched the benchmark, and we decreased exposure to very short-term bonds in favor of those with maturities in the 12- to 17-year range. Given that the municipal yield curve remained steep vs. historical averages, we found that longer term debt offered good value. Bonds rated A and BBB, in particular, provided opportunities to pick up additional yield. Our purchases included bonds in the local guaranteed school district, education and airport/transportation sectors. We are cautious regarding the higher education sector, as the demographics and costs of private higher education continue to represent headwinds for small schools that rely heavily on tuition and fees. In our view, the yields in this sector do not adequately compensate investors for the risks.
We continue to rely on our internal credit analysis staff to review and value the issuers we purchase and to monitor all of our holdings. Oregon has not had to deal with significant issues regarding under-funded pension plans, as New Jersey and Illinois have, so the state's overall credit quality remained stable during the period. We continue to watch and to monitor funding levels for all issuers with pension obligations, however, as this has become a growing concern for investors. The rating agencies have downgraded several large issuers due to this problem, causing yield spreads to widen for bonds affected by potential pension obligations.
The Fund holds an allocation to pre-refunded bonds, which offer little additional yield due to their high quality. These bonds, which tend to be older holdings that were pre-refunded to shorter maturities based on their original call features, generate modest income and can provide a source of liquidity if needed. We may look to decrease this allocation to take advantage of more attractive opportunities in A and BBB rated credits.
Annual Report 2015
6
COLUMBIA AMT-FREE OREGON INTERMEDIATE MUNI BOND FUND
UNDERSTANDING YOUR FUND'S EXPENSES
(Unaudited)
As an investor, you incur two types of costs. There are transaction costs, which generally include sales charges on purchases and may include redemption fees. There are also ongoing costs, which generally include management fees, distribution and/or service fees, and other fund expenses. The following information is intended to help you understand your ongoing costs (in dollars) of investing in the Fund and to help you compare these costs with the ongoing costs of investing in other mutual funds.
Analyzing Your Fund's Expenses
To illustrate these ongoing costs, we have provided examples and calculated the expenses paid by investors in each share class of the Fund during the period. The actual and hypothetical information in the table is based on an initial investment of $1,000 at the beginning of the period indicated and held for the entire period. Expense information is calculated two ways and each method provides you with different information. The amount listed in the "Actual" column is calculated using the Fund's actual operating expenses and total return for the period. You may use the Actual information, together with the amount invested, to estimate the expenses that you paid over the period. Simply divide your account value by $1,000 (for example, an $8,600 account value divided by $1,000 = 8.6), then multiply the results by the expenses paid during the period under the "Actual" column. The amount listed in the "Hypothetical" column assumes a 5% annual rate of return before expenses (which is not the Fund's actual return) and then applies the Fund's actual expense ratio for the period to the hypothetical return. You should not use the hypothetical account values and expenses to estimate either your actual account balance at the end of the period or the expenses you paid during the period. See "Compare With Other Funds" below for details on how to use the hypothetical data.
Compare With Other Funds
Since all mutual funds are required to include the same hypothetical calculations about expenses in shareholder reports, you can use this information to compare the ongoing cost of investing in the Fund with other funds. To do so, compare the hypothetical example with the 5% hypothetical examples that appear in the shareholder reports of other funds. As you compare hypothetical examples of other funds, it is important to note that hypothetical examples are meant to highlight the ongoing costs of investing in a fund only and do not reflect any transaction costs, such as sales charges, or redemption or exchange fees. Therefore, the hypothetical calculations are useful in comparing ongoing costs only, and will not help you determine the relative total costs of owning different funds. If transaction costs were included in these calculations, your costs would be higher.
February 1, 2015 – July 31, 2015
| | | Account Value at the Beginning
of the Period ($) | | Account Value at the End of the
Period ($) | | Expenses Paid During the
Period ($) | | Fund's Annualized
Expense Ratio (%) | |
| | | Actual | | Hypothetical | | Actual | | Hypothetical | | Actual | | Hypothetical | | Actual | |
Class A | | | 1,000.00 | | | | 1,000.00 | | | | 991.30 | | | | 1,020.74 | | | | 4.17 | | | | 4.23 | | | | 0.84 | | |
Class B | | | 1,000.00 | | | | 1,000.00 | | | | 988.40 | | | | 1,017.00 | | | | 7.88 | | | | 8.00 | | | | 1.59 | | |
Class C | | | 1,000.00 | | | | 1,000.00 | | | | 989.10 | | | | 1,018.50 | | | | 6.40 | | | | 6.49 | | | | 1.29 | | |
Class R4 | | | 1,000.00 | | | | 1,000.00 | | | | 992.50 | | | | 1,021.99 | | | | 2.93 | | | | 2.97 | | | | 0.59 | | |
Class R5 | | | 1,000.00 | | | | 1,000.00 | | | | 993.50 | | | | 1,022.19 | | | | 2.73 | | | | 2.77 | | | | 0.55 | | |
Class Z | | | 1,000.00 | | | | 1,000.00 | | | | 992.50 | | | | 1,021.99 | | | | 2.93 | | | | 2.97 | | | | 0.59 | | |
Expenses paid during the period are equal to the annualized expense ratio for each class as indicated above, multiplied by the average account value over the period and then multiplied by the number of days in the Fund's most recent fiscal half year and divided by 365.
Expenses do not include fees and expenses incurred indirectly by the Fund from its investment in underlying funds, including affiliated and non-affiliated pooled investment vehicles, such as mutual funds and exchange-traded funds.
Had Columbia Management Investment Advisers, LLC and/or certain of its affiliates not waived/reimbursed certain fees and expenses, account value at the end of the period would have been reduced.
Annual Report 2015
7
COLUMBIA AMT-FREE OREGON INTERMEDIATE MUNI BOND FUND
PORTFOLIO OF INVESTMENTS
July 31, 2015
(Percentages represent value of investments compared to net assets)
Municipal Bonds 98.3%
Issue
Description | | Coupon
Rate | | Principal
Amount ($) | |
Value ($) | |
AIRPORT 3.0% | |
Port of Portland
Refunding Revenue Bonds
Portland International Airport
Series 2015-23
07/01/28 | | | 5.000 | % | | | 1,240,000 | | | | 1,461,241 | | |
07/01/31 | | | 5.000 | % | | | 1,750,000 | | | | 2,017,417 | | |
07/01/32 | | | 5.000 | % | | | 2,000,000 | | | | 2,296,460 | | |
Revenue Bonds
Passenger Facility Charge
Series 2011
07/01/27 | | | 5.500 | % | | | 6,635,000 | | | | 7,572,393 | | |
Total | | | | | | | 13,347,511 | | |
ASSISTED LIVING 0.4% | |
Clackamas County Hospital Facility Authority
Refunding Revenue Bonds
Robison Jewish Home
Series 2005
10/01/19 | | | 5.000 | % | | | 1,000,000 | | | | 1,002,340 | | |
10/01/24 | | | 5.125 | % | | | 1,000,000 | | | | 1,000,950 | | |
Total | | | | | | | 2,003,290 | | |
HIGHER EDUCATION 6.1% | |
City of Forest Grove
Refunding Revenue Bonds
Campus Improvement Pacific University Project
Series 2014
05/01/34 | | | 5.250 | % | | | 1,000,000 | | | | 1,100,560 | | |
Series 2015
05/01/30 | | | 5.000 | % | | | 550,000 | | | | 615,213 | | |
City of Portland
Refunding Revenue Bonds
Broadway Project LLC
Series 2008A
04/01/23 | | | 6.250 | % | | | 3,250,000 | | | | 3,676,302 | | |
Oregon Health & Science University
Revenue Bonds
Series 2012A
07/01/18 | | | 5.000 | % | | | 1,000,000 | | | | 1,110,110 | | |
Series 2012E
07/01/32 | | | 5.000 | % | | | 7,000,000 | | | | 7,859,180 | | |
Oregon Health & Science University(a)
Revenue Bonds
Capital Appreciation-Independent School District
Series 1996A (NPFGC)
07/01/21 | | | 0.000 | % | | | 9,700,000 | | | | 8,357,035 | | |
Oregon State Facilities Authority
Refunding Revenue Bonds
University Portland
Series 2015A
04/01/31 | | | 5.000 | % | | | 530,000 | | | | 591,936 | | |
Municipal Bonds (continued)
Issue
Description | | Coupon
Rate | | Principal
Amount ($) | |
Value ($) | |
University of Portland
Series 2015A
04/01/30 | | | 5.000 | % | | | 500,000 | | | | 560,600 | | |
Revenue Bonds
Linfield College Project
Series 2005A
10/01/20 | | | 5.000 | % | | | 1,825,000 | | | | 1,839,600 | | |
Series 2015A
10/01/24 | | | 5.000 | % | | | 1,390,000 | | | | 1,590,619 | | |
Total | | | | | | | 27,301,155 | | |
HOSPITAL 10.0% | |
Astoria Hospital Facilities Authority
Refunding Revenue Bonds
Columbia Memorial Hospital
Series 2012
08/01/17 | | | 4.000 | % | | | 810,000 | | | | 841,574 | | |
08/01/18 | | | 4.000 | % | | | 745,000 | | | | 778,823 | | |
08/01/19 | | | 4.000 | % | | | 855,000 | | | | 904,864 | | |
08/01/20 | | | 4.000 | % | | | 915,000 | | | | 963,495 | | |
08/01/21 | | | 4.000 | % | | | 725,000 | | | | 757,349 | | |
08/01/26 | | | 5.000 | % | | | 1,200,000 | | | | 1,286,520 | | |
08/01/27 | | | 5.000 | % | | | 1,260,000 | | | | 1,342,215 | | |
08/01/31 | | | 5.000 | % | | | 2,860,000 | | | | 2,990,473 | | |
Hospital Facilities Authority of Multnomah County
Revenue Bonds
Adventist Health West
Series 2009A
09/01/21 | | | 5.000 | % | | | 3,685,000 | | | | 4,165,782 | | |
Klamath Falls Intercommunity Hospital Authority
Refunding Revenue Bonds
Sky Lakes Medical Center Project
Series 2012
09/01/18 | | | 5.000 | % | | | 1,195,000 | | | | 1,305,645 | | |
09/01/19 | | | 5.000 | % | | | 1,255,000 | | | | 1,388,369 | | |
09/01/22 | | | 5.000 | % | | | 500,000 | | | | 559,200 | | |
Oregon State Facilities Authority
Refunding Revenue Bonds
Legacy Health Project
Series 2011A
05/01/20 | | | 5.250 | % | | | 5,000,000 | | | | 5,856,500 | | |
PeaceHealth Project
Series 2009A
11/01/17 | | | 5.000 | % | | | 4,450,000 | | | | 4,857,798 | | |
11/01/19 | | | 5.000 | % | | | 3,695,000 | | | | 4,255,051 | | |
Series 2014A
11/15/29 | | | 5.000 | % | | | 1,600,000 | | | | 1,815,120 | | |
Samaritan Health Services
Series 2010A
10/01/22 | | | 5.000 | % | | | 3,450,000 | | | | 3,843,817 | | |
Salem Hospital Facility Authority
Revenue Bonds
Salem Hospital Project
Series 2006A
08/15/27 | | | 5.000 | % | | | 3,500,000 | | | | 3,587,675 | | |
The accompanying Notes to Financial Statements are an integral part of this statement.
Annual Report 2015
8
COLUMBIA AMT-FREE OREGON INTERMEDIATE MUNI BOND FUND
PORTFOLIO OF INVESTMENTS (continued)
July 31, 2015
Municipal Bonds (continued)
Issue
Description | | Coupon
Rate | | Principal
Amount ($) | |
Value ($) | |
Series 2008A
08/15/15 | | | 5.750 | % | | | 785,000 | | | | 786,676 | | |
08/15/18 | | | 5.250 | % | | | 2,500,000 | | | | 2,776,300 | | |
Total | | | | | | | 45,063,246 | | |
INDEPENDENT POWER 1.4% | |
Western Generation Agency
Revenue Bonds
Wauna Cogeneration Project
Series 2006A
01/01/20 | | | 5.000 | % | | | 3,235,000 | | | | 3,244,899 | | |
01/01/21 | | | 5.000 | % | | | 3,000,000 | | | | 3,007,200 | | |
Total | | | | | | | 6,252,099 | | |
INVESTOR OWNED 0.9% | |
Port of Morrow
Refunding Revenue Bonds
Portland General Electric
Series 1998A(b)
05/01/33 | | | 5.000 | % | | | 3,750,000 | | | | 4,093,425 | | |
LOCAL GENERAL OBLIGATION 30.6% | |
Benton & Linn Counties Consolidated School
District No. 509J & 509A Corvallis
Unlimited General Obligation Refunding Bonds
Series 2007 (AGM)
06/15/20 | | | 5.000 | % | | | 5,000,000 | | | | 5,844,350 | | |
Blue Mountain Community College District
Unlimited General Obligation Bonds
Series 2015(c)
06/15/29 | | | 4.000 | % | | | 1,000,000 | | | | 1,076,890 | | |
Canyonville South Umpqua Rural Fire Protection District
Unlimited General Obligation Bonds
Series 2001
07/01/31 | | | 5.400 | % | | | 610,000 | | | | 610,598 | | |
Central Oregon Community College District
Limited General Obligation Bonds
Series 2014
06/01/29 | | | 5.000 | % | | | 500,000 | | | | 578,755 | | |
Unlimited General Obligation Bonds
Series 2010
06/15/24 | | | 4.750 | % | | | 2,580,000 | | | | 2,946,515 | | |
Chemeketa Community College District
Unlimited General Obligation Refunding Bonds
Series 2015
06/15/26 | | | 4.000 | % | | | 1,745,000 | | | | 1,944,925 | | |
Chemeketa Community College
Unlimited General Obligation Refunding Bonds
Series 2014
06/15/26 | | | 5.000 | % | | | 1,100,000 | | | | 1,313,543 | | |
Municipal Bonds (continued)
Issue
Description | | Coupon
Rate | | Principal
Amount ($) | |
Value ($) | |
City of Hillsboro
Limited General Obligation Refunding Bonds
Series 2012
06/01/25 | | | 4.000 | % | | | 1,875,000 | | | | 2,058,356 | | |
City of Madras
Unlimited General Obligation Refunding Bonds
Series 2013
02/15/24 | | | 4.000 | % | | | 745,000 | | | | 781,393 | | |
02/15/27 | | | 4.500 | % | | | 500,000 | | | | 524,465 | | |
City of Portland
Limited General Obligation Bonds
Limited Tax Sellwood Bridge Project
Series 2014
06/01/24 | | | 5.000 | % | | | 1,985,000 | | | | 2,419,139 | | |
Limited Tax General Obligation Refunding Bonds
Series 2011A
06/01/23 | | | 5.000 | % | | | 6,140,000 | | | | 7,285,294 | | |
Unlimited General Obligation Refunding Bonds
Public Safety Projects and Emergency Facilities
Series 2014
06/15/24 | | | 5.000 | % | | | 1,885,000 | | | | 2,310,727 | | |
City of Portland(a)
Limited Tax General Obligation Bonds
Series 2001B
06/01/18 | | | 0.000 | % | | | 4,000,000 | | | | 3,853,800 | | |
06/01/19 | | | 0.000 | % | | | 4,000,000 | | | | 3,764,840 | | |
06/01/20 | | | 0.000 | % | | | 4,000,000 | | | | 3,670,920 | | |
City of Redmond
Limited General Obligation Bonds
Series 2014A
06/01/27 | | | 5.000 | % | | | 685,000 | | | | 793,429 | | |
City of Salem
Limited General Obligation Bonds
Series 2009
06/01/26 | | | 5.000 | % | | | 3,315,000 | | | | 3,728,248 | | |
Unlimited General Obligation Bonds
Series 2009
06/01/19 | | | 5.000 | % | | | 2,025,000 | | | | 2,315,284 | | |
06/01/20 | | | 5.000 | % | | | 880,000 | | | | 997,797 | | |
Clackamas & Washington Counties School District No. 3
Unlimited General Obligation Bonds
Series 2003A (NPFGC)(a)
06/15/17 | | | 0.000 | % | | | 4,000,000 | | | | 3,929,880 | | |
Clackamas County School District No. 108 Estacada
Unlimited General Obligation Refunding Bonds
Series 2005 (AGM)
06/15/25 | | | 5.500 | % | | | 2,485,000 | | | | 3,192,181 | | |
Clackamas County School District No. 12 North Clackamas
Unlimited General Obligation Refunding Bonds
Series 2014
06/15/29 | | | 5.000 | % | | | 1,500,000 | | | | 1,752,480 | | |
The accompanying Notes to Financial Statements are an integral part of this statement.
Annual Report 2015
9
COLUMBIA AMT-FREE OREGON INTERMEDIATE MUNI BOND FUND
PORTFOLIO OF INVESTMENTS (continued)
July 31, 2015
Municipal Bonds (continued)
Issue
Description | | Coupon
Rate | | Principal
Amount ($) | |
Value ($) | |
Clackamas County School District No. 46 Oregon Trail
Unlimited General Obligation Bonds
Series 2009A
06/15/25 | | | 5.000 | % | | | 4,350,000 | | | | 4,927,767 | | |
06/15/26 | | | 5.000 | % | | | 3,000,000 | | | | 3,387,570 | | |
Clackamas County School District No. 62
Limited General Obligation Refunding Bonds
Series 2014
06/01/34 | | | 5.000 | % | | | 1,770,000 | | | | 1,988,754 | | |
Columbia Gorge Community College District
Unlimited General Obligation Refunding Bonds
Series 2012
06/15/18 | | | 3.000 | % | | | 810,000 | | | | 855,441 | | |
06/15/19 | | | 2.500 | % | | | 1,010,000 | | | | 1,059,056 | | |
County of Lane
Limited General Obligation Bonds
Series 2009A
11/01/24 | | | 5.000 | % | | | 1,000,000 | | | | 1,144,890 | | |
11/01/25 | | | 5.000 | % | | | 1,140,000 | | | | 1,301,390 | | |
Deschutes & Jefferson Counties School District No. 2J Redmond
Unlimited General Obligation Bonds
Series 2004B (NPFGC)(a)
06/15/22 | | | 0.000 | % | | | 2,335,000 | | | | 2,003,337 | | |
Jackson County School District No. 549C Medford
Unlimited General Obligation Refunding Bonds
Series 2015
12/15/23 | | | 5.000 | % | | | 1,000,000 | | | | 1,217,730 | | |
Jackson County School District No. 9 Eagle Point
Unlimited General Obligation Refunding Bonds
Series 2005 (NPFGC)
06/15/20 | | | 5.500 | % | | | 1,000,000 | | | | 1,186,020 | | |
06/15/21 | | | 5.500 | % | | | 1,410,000 | | | | 1,692,747 | | |
Jefferson County School District No. 509J
Unlimited General Obligation Bonds
Madras
Series 2013B
06/15/28 | | | 5.000 | % | | | 2,095,000 | | | | 2,417,379 | | |
Josephine County School District
Unlimited General Obligation Refunding Bonds
Series 2005 (NPFGC)
12/15/16 | | | 5.000 | % | | | 1,000,000 | | | | 1,061,950 | | |
Klamath Falls City Schools
Unlimited General Obligation Refunding Bonds
Series 2015A
06/15/28 | | | 4.000 | % | | | 500,000 | | | | 541,870 | | |
Lane & Douglas Counties School District No. 45J3
Unlimited General Obligation Refunding Bonds
South Lane
Series 2012
06/15/20 | | | 3.000 | % | | | 1,000,000 | | | | 1,069,940 | | |
06/15/21 | | | 3.000 | % | | | 1,610,000 | | | | 1,719,399 | | |
Municipal Bonds (continued)
Issue
Description | | Coupon
Rate | | Principal
Amount ($) | |
Value ($) | |
Lane Community College
Unlimited General Obligation Bonds
Series 2009
06/15/17 | | | 4.250 | % | | | 2,195,000 | | | | 2,346,894 | | |
06/15/18 | | | 4.250 | % | | | 2,000,000 | | | | 2,195,300 | | |
Series 2012
06/15/23 | | | 5.000 | % | | | 1,000,000 | | | | 1,193,000 | | |
Lane County School District No. 1 Pleasant Hill(a)
Unlimited General Obligation
Series 2014B
06/15/29 | | | 0.000 | % | | | 1,775,000 | | | | 1,073,981 | | |
06/15/30 | | | 0.000 | % | | | 1,825,000 | | | | 1,045,798 | | |
Lane County School District No. 19 Springfield
Unlimited General Obligation
Series 2015A
06/15/31 | | | 5.000 | % | | | 2,000,000 | | | | 2,350,740 | | |
Lane County School District No. 19 Springfield(a)
Unlimited General Obligation
Series 2015B
06/15/33 | | | 0.000 | % | | | 3,770,000 | | | | 1,810,882 | | |
Unlimited General Obligation Refunding Bonds
Series 2015D
06/15/24 | | | 0.000 | % | | | 2,305,000 | | | | 1,780,036 | | |
06/15/28 | | | 0.000 | % | | | 1,480,000 | | | | 936,870 | | |
Madras Aquatic Center District
Unlimited General Obligation Bonds
Series 2005
06/01/22 | | | 5.000 | % | | | 1,695,000 | | | | 1,698,458 | | |
Marion & Clackamas Counties School District No. 4J Silver Falls
Unlimited General Obligation Refunding Bonds
Series 2013
06/15/21 | | | 4.000 | % | | | 2,785,000 | | | | 3,128,892 | | |
Polk Marion & Benton Counties School District No. 13J Central
Unlimited General Obligation Refunding Bonds
Series 2015
02/01/27 | | | 4.000 | % | | | 750,000 | | | | 822,368 | | |
02/01/28 | | | 4.000 | % | | | 1,000,000 | | | | 1,086,000 | | |
Umatilla County School District No. 16R Pendleton
Unlimited General Obligation Bonds
Series 2014A
06/15/30 | | | 5.000 | % | | | 1,110,000 | | | | 1,296,835 | | |
06/15/31 | | | 5.000 | % | | | 2,890,000 | | | | 3,359,220 | | |
Umatilla County School District No. 8R Hermiston
Unlimited General Obligation Bonds
Series 2010
06/15/29 | | | 4.500 | % | | | 2,360,000 | | | | 2,584,271 | | |
Union County School District No. 1 La Grande
Unlimited General Obligation Bonds
Series 2015
06/15/30 | | | 4.000 | % | | | 1,000,000 | | | | 1,060,270 | | |
The accompanying Notes to Financial Statements are an integral part of this statement.
Annual Report 2015
10
COLUMBIA AMT-FREE OREGON INTERMEDIATE MUNI BOND FUND
PORTFOLIO OF INVESTMENTS (continued)
July 31, 2015
Municipal Bonds (continued)
Issue
Description | | Coupon
Rate | | Principal
Amount ($) | |
Value ($) | |
Washington & Clackamas Counties School
District No. 23J Tigard-Tualatin
Unlimited General Obligation Refunding Bonds
Series 2005 (NPFGC)
06/15/19 | | | 5.000 | % | | | 850,000 | | | | 972,120 | | |
06/15/21 | | | 5.000 | % | | | 6,575,000 | | | | 7,759,946 | | |
Washington & Multnomah Counties School District No 48J Beaverton
Refunding Unlimited General Obligation Bonds
Series 2012-B
06/15/23 | | | 4.000 | % | | | 4,090,000 | | | | 4,583,581 | | |
Unlimited General Obligation Bonds
Series 2014
06/15/33 | | | 5.000 | % | | | 4,000,000 | | | | 4,625,720 | | |
Washington County School District No. 1 West Union
Unlimited General Obligation Refunding Bonds
Hillsboro
Series 2012
06/15/20 | | | 4.000 | % | | | 1,400,000 | | | | 1,571,864 | | |
Washington County School District No. 15 Forest Grove
Unlimited General Obligation Bonds
Series 2012A
06/15/24 | | | 5.000 | % | | | 1,780,000 | | | | 2,095,309 | | |
Yamhill Clackamas & Washington Counties School District No. 29J Newberg
Unlimited General Obligation Refunding Bonds
Series 2005 (NPFGC)
06/15/21 | | | 5.500 | % | | | 1,000,000 | | | | 1,210,490 | | |
Total | | | | | | | 137,857,894 | | |
MULTI-FAMILY 2.0% | |
City of Forest Grove
Revenue Bonds
Oak Tree Foundation Project
Series 2007
03/01/37 | | | 5.500 | % | | | 3,915,000 | | | | 4,025,912 | | |
City of Portland
Revenue Bonds
Headwaters Apartments Project
Series 2005A
04/01/25 | | | 5.000 | % | | | 1,565,000 | | | | 1,571,260 | | |
Oregon State Facilities Authority
Refunding Revenue Bonds
College Housing Northwest Projects
Series 2013A
10/01/18 | | | 4.000 | % | | | 740,000 | | | | 775,416 | | |
10/01/19 | | | 4.000 | % | | | 780,000 | | | | 821,574 | | |
10/01/20 | | | 4.000 | % | | | 810,000 | | | | 853,635 | | |
10/01/22 | | | 4.000 | % | | | 875,000 | | | | 910,376 | | |
Total | | | | | | | 8,958,173 | | |
Municipal Bonds (continued)
Issue
Description | | Coupon
Rate | | Principal
Amount ($) | |
Value ($) | |
MUNICIPAL POWER 1.4% | |
City of Eugene Electric Utility System
Refunding Revenue Bonds
Series 2011A
08/01/28 | | | 5.000 | % | | | 2,200,000 | | | | 2,511,146 | | |
08/01/29 | | | 5.000 | % | | | 3,410,000 | | | | 3,861,279 | | |
Total | | | | | | | 6,372,425 | | |
PORTS 0.8% | |
Port of Morrow
Limited General Obligation Bonds
Series 2013
06/01/22 | | | 4.000 | % | | | 425,000 | | | | 440,551 | | |
06/01/23 | | | 4.000 | % | | | 440,000 | | | | 453,728 | | |
06/01/24 | | | 4.000 | % | | | 460,000 | | | | 473,266 | | |
06/01/25 | | | 4.000 | % | | | 480,000 | | | | 491,659 | | |
06/01/26 | | | 4.000 | % | | | 500,000 | | | | 509,285 | | |
06/01/27 | | | 4.000 | % | | | 515,000 | | | | 523,806 | | |
06/01/28 | | | 4.000 | % | | | 250,000 | | | | 253,308 | | |
Port of St. Helen's
Revenue Bonds
Series 1999
08/01/19 | | | 5.750 | % | | | 350,000 | | | | 350,536 | | |
Total | | | | | | | 3,496,139 | | |
RECREATION 0.8% | |
Oregon State Lottery
Revenue Bonds
Series 2012B
04/01/18 | | | 3.000 | % | | | 3,600,000 | | | | 3,805,596 | | |
REFUNDED / ESCROWED 17.5% | |
Clackamas & Washington Counties School District No. 3
Prerefunded 06/15/19 Unlimited General Obligation Bonds
West Linn-Wilsonville
Series 2009
06/15/24 | | | 5.000 | % | | | 4,150,000 | | | | 4,749,177 | | |
Clackamas County School District No. 12 North Clackamas
Prerefunded 06/15/17 Unlimited General Obligation Bonds
Series 2007B (AGM)
06/15/22 | | | 5.000 | % | | | 4,000,000 | | | | 4,324,920 | | |
Columbia Multnomah & Washington Counties School District No. 1J
Prerefunded 06/15/19 Unlimited General Obligation Bonds
Scappoose School District 1J
Series 2009
06/15/23 | | | 5.000 | % | | | 1,000,000 | | | | 1,147,650 | | |
06/15/24 | | | 5.000 | % | | | 1,165,000 | | | | 1,337,012 | | |
06/15/25 | | | 5.000 | % | | | 1,275,000 | | | | 1,463,254 | | |
Deschutes County Administrative School District No. 1 Bend-La Pine
Prerefunded 06/15/17 Unlimited General Obligation Bonds
Series 2007 (NPFGC)
06/15/20 | | | 4.500 | % | | | 5,000,000 | | | | 5,357,750 | | |
The accompanying Notes to Financial Statements are an integral part of this statement.
Annual Report 2015
11
COLUMBIA AMT-FREE OREGON INTERMEDIATE MUNI BOND FUND
PORTFOLIO OF INVESTMENTS (continued)
July 31, 2015
Municipal Bonds (continued)
Issue
Description | | Coupon
Rate | | Principal
Amount ($) | |
Value ($) | |
Deschutes County Hospital Facilities Authority
Prerefunded 01/01/19 Revenue Bonds
Cascade Health Services, Inc.
Series 2008
01/01/23 | | | 7.375 | % | | | 2,000,000 | | | | 2,421,180 | | |
Jackson County School District No. 549C Medford
Prerefunded 06/15/18 Unlimited General Obligation Bonds
Series 2008
06/15/27 | | | 4.625 | % | | | 1,500,000 | | | | 1,651,785 | | |
06/15/28 | | | 4.625 | % | | | 1,660,000 | | | | 1,827,976 | | |
Oregon State Lottery
Prerefunded 04/01/18 Revenue Bonds
Series 2008A
04/01/24 | | | 5.000 | % | | | 3,130,000 | | | | 3,463,001 | | |
Prerefunded 04/01/19 Revenue Bonds
Series 2009A
04/01/21 | | | 5.000 | % | | | 5,000,000 | | | | 5,689,150 | | |
04/01/22 | | | 5.000 | % | | | 5,000,000 | | | | 5,689,150 | | |
04/01/27 | | | 5.000 | % | | | 4,000,000 | | | | 4,551,320 | | |
Puerto Rico Public Finance Corp.
Unrefunded Revenue Bonds
Commonwealth Appropriation
Series 2002E Escrowed to Maturity(d)
08/01/26 | | | 6.000 | % | | | 5,000,000 | | | | 6,485,650 | | |
State of Oregon Department of Administrative Services
Prerefunded 05/01/17 Certificate of Participation
Series 2007A (NPFGC)
05/01/25 | | | 5.000 | % | | | 2,780,000 | | | | 2,992,781 | | |
05/01/26 | | | 5.000 | % | | | 2,800,000 | | | | 3,014,312 | | |
Prerefunded 05/01/19 Certificate of Participation
Series 2009A
05/01/23 | | | 5.000 | % | | | 3,100,000 | | | | 3,535,581 | | |
State of Oregon Department of Transportation
Prerefunded 05/15/19 Revenue Bonds
Senior Lien
Series 2009A
11/15/27 | | | 4.750 | % | | | 7,000,000 | | | | 7,927,570 | | |
Virgin Islands Public Finance Authority
Revenue Bonds
Series 1989A Escrowed to Maturity(d)
10/01/18 | | | 7.300 | % | | | 620,000 | | | | 685,422 | | |
Washington Clackamas & Yamhill Counties School District No. 88J
Prerefunded 06/15/17 Unlimited General Obligation Bonds
Sherwood
Series 2007B (NPFGC)
06/15/23 | | | 4.500 | % | | | 8,125,000 | | | | 8,706,344 | | |
Washington County School District No. 1 West Union
Prerefunded 06/15/17 Unlimited General Obligation Bonds
Capital Appreciation-Hillsboro
Series 2006 (NPFGC)(a)
06/15/25 | | | 0.000 | % | | | 2,565,000 | | | | 1,758,692 | | |
Total | | | | | | | 78,779,677 | | |
Municipal Bonds (continued)
Issue
Description | | Coupon
Rate | | Principal
Amount ($) | |
Value ($) | |
RETIREMENT COMMUNITIES 2.1% | |
Hospital Facilities Authority of Multnomah County
Refunding Revenue Bonds
Mirabella at South Waterfront
Series 2014A
10/01/34 | | | 5.125 | % | | | 4,000,000 | | | | 4,305,680 | | |
Terwilliger Plaza, Inc.
Series 2012
12/01/20 | | | 5.000 | % | | | 1,250,000 | | | | 1,349,575 | | |
12/01/22 | | | 5.000 | % | | | 500,000 | | | | 546,060 | | |
Revenue Bonds
Terwilliger Plaza Project
Series 2006A
12/01/26 | | | 5.250 | % | | | 1,400,000 | | | | 1,428,742 | | |
Medford Hospital Facilities Authority
Refunding Revenue Bonds
Rogue Valley Manor
Series 2013
10/01/22 | | | 5.000 | % | | | 625,000 | | | | 714,462 | | |
10/01/23 | | | 5.000 | % | | | 645,000 | | | | 737,925 | | |
10/01/24 | | | 5.000 | % | | | 455,000 | | | | 514,478 | | |
Total | | | | | | | 9,596,922 | | |
SINGLE FAMILY 1.3% | |
State of Oregon Housing & Community Services Department
Revenue Bonds
Single Family Mortgage Program
Series 2008G
07/01/28 | | | 5.200 | % | | | 1,510,000 | | | | 1,571,971 | | |
Series 2010A
07/01/27 | | | 5.250 | % | | | 410,000 | | | | 431,939 | | |
Series 2011A
07/01/25 | | | 5.250 | % | | | 2,370,000 | | | | 2,589,936 | | |
Series 2011B
07/01/28 | | | 5.250 | % | | | 1,215,000 | | | | 1,304,861 | | |
Total | | | | | | | 5,898,707 | | |
SPECIAL NON PROPERTY TAX 6.7% | |
Oregon State Lottery
Refunding Revenue Bonds
Series 2014B
04/01/27 | | | 5.000 | % | | | 1,750,000 | | | | 2,091,600 | | |
Series 2015D
04/01/27 | | | 5.000 | % | | | 2,500,000 | | | | 3,018,800 | | |
State of Oregon Department of Transportation
Refunding Revenue Bonds
Series 2015A
11/15/30 | | | 5.000 | % | | | 8,000,000 | | | | 9,452,000 | | |
Revenue Bonds
Senior Lien
Series 2007A
11/15/16 | | | 5.000 | % | | | 6,305,000 | | | | 6,680,210 | | |
The accompanying Notes to Financial Statements are an integral part of this statement.
Annual Report 2015
12
COLUMBIA AMT-FREE OREGON INTERMEDIATE MUNI BOND FUND
PORTFOLIO OF INVESTMENTS (continued)
July 31, 2015
Municipal Bonds (continued)
Issue
Description | | Coupon
Rate | | Principal
Amount ($) | |
Value ($) | |
Territory of Guam
Revenue Bonds
Series 2011A(d)
01/01/31 | | | 5.000 | % | | | 1,100,000 | | | | 1,204,654 | | |
Tri-County Metropolitan Transportation District
Revenue Bonds
Series 2009A
09/01/18 | | | 4.000 | % | | | 1,000,000 | | | | 1,094,040 | | |
09/01/21 | | | 4.250 | % | | | 1,815,000 | | | | 1,995,538 | | |
Virgin Islands Public Finance Authority
Revenue Bonds
Matching Fund Loan Notes-Senior Lien
Series 2010A(d)
10/01/25 | | | 5.000 | % | | | 4,410,000 | | | | 4,916,224 | | |
Total | | | | | | | 30,453,066 | | |
SPECIAL PROPERTY TAX 4.7% | |
City of Keizer
Special Assessment Bonds
Keizer Station Area
Series 2008A
06/01/31 | | | 5.200 | % | | | 3,215,000 | | | | 3,495,412 | | |
City of Portland
Refunding Tax Allocation Bonds
2nd Lien-Downtown Water
Series 2011
06/15/18 | | | 5.000 | % | | | 3,095,000 | | | | 3,436,286 | | |
Senior Lien-Oregon Convention Center
Series 2011
06/15/20 | | | 5.000 | % | | | 4,305,000 | | | | 4,975,418 | | |
Series 2015
06/15/24 | | | 5.000 | % | | | 1,480,000 | | | | 1,676,248 | | |
Tax Allocation Bonds
Central Eastside
Series 2011B
06/15/26 | | | 5.000 | % | | | 1,580,000 | | | | 1,768,383 | | |
06/15/27 | | | 5.000 | % | | | 1,370,000 | | | | 1,524,783 | | |
Lents Town Center
Series 2010B
06/15/25 | | | 5.000 | % | | | 1,550,000 | | | | 1,716,517 | | |
06/15/26 | | | 5.000 | % | | | 1,440,000 | | | | 1,583,568 | | |
Veneta Urban Renewal Agency
Revenue Bonds
Urban Renewal
Series 2001
02/15/16 | | | 5.375 | % | | | 155,000 | | | | 155,477 | | |
02/15/21 | | | 5.625 | % | | | 1,100,000 | | | | 1,102,255 | | |
Total | | | | | | | 21,434,347 | | |
STATE GENERAL OBLIGATION 1.7% | |
State of Oregon
Unlimited General Obligation Bonds
Series 2015F
05/01/30 | | | 5.000 | % | | | 5,565,000 | | | | 6,639,768 | | |
Municipal Bonds (continued)
Issue
Description | | Coupon
Rate | | Principal
Amount ($) | |
Value ($) | |
State of Oregon(a)
Unlimited General Obligation Bonds
State Board of Higher Education
Series 2001A
08/01/17 | | | 0.000 | % | | | 1,050,000 | | | | 1,030,145 | | |
Total | | | | | | | 7,669,913 | | |
TRANSPORTATION 1.9% | |
Tri-County Metropolitan Transportation District
Revenue Bonds
Capital Grant Receipt
Series 2011A
10/01/25 | | | 5.000 | % | | | 4,775,000 | | | | 5,405,014 | | |
10/01/27 | | | 5.000 | % | | | 3,000,000 | | | | 3,348,360 | | |
Total | | | | | | | 8,753,374 | | |
WATER & SEWER 5.0% | |
City of Albany
Limited General Obligation Refunding Bonds
Series 2013
08/01/22 | | | 4.000 | % | | | 1,240,000 | | | | 1,389,346 | | |
08/01/23 | | | 4.000 | % | | | 1,290,000 | | | | 1,447,419 | | |
City of Portland Water System
Refunding Revenue Bonds
1st Lien
Series 2006B
10/01/16 | | | 5.000 | % | | | 5,330,000 | | | | 5,619,206 | | |
Revenue Bonds
Series 2014A
05/01/28 | | | 4.000 | % | | | 3,390,000 | | | | 3,673,540 | | |
City of Woodburn Wastewater
Refunding Revenue Bonds
Series 2011A
03/01/18 | | | 3.000 | % | | | 1,115,000 | | | | 1,165,052 | | |
03/01/19 | | | 5.000 | % | | | 3,490,000 | | | | 3,916,373 | | |
03/01/22 | | | 5.000 | % | | | 4,620,000 | | | | 5,351,161 | | |
Total | | | | | | | 22,562,097 | | |
Total Municipal Bonds
(Cost: $418,495,600) | | | | | | | 443,699,056 | | |
Money Market Funds 0.4%
| | | Shares | | Value ($) | |
Dreyfus Tax-Exempt Cash Management
Fund, 0.000%(e) | | | 1,709,222 | | | | 1,709,222 | | |
Total Money Market Funds
(Cost: $1,709,222) | | | | | 1,709,222 | | |
Total Investments
(Cost: $420,204,822) | | | | | 445,408,278 | | |
Other Assets & Liabilities, Net | | | | | 5,780,062 | | |
Net Assets | | | | | 451,188,340 | | |
The accompanying Notes to Financial Statements are an integral part of this statement.
Annual Report 2015
13
COLUMBIA AMT-FREE OREGON INTERMEDIATE MUNI BOND FUND
PORTFOLIO OF INVESTMENTS (continued)
July 31, 2015
Notes to Portfolio of Investments
(a) Zero coupon bond.
(b) Variable rate security.
(c) Security, or a portion thereof, has been purchased on a when-issued or delayed delivery basis.
(d) Municipal obligations include debt obligations issued by or on behalf of territories, possessions, or sovereign nations within the territorial boundaries of the United States. At July 31, 2015, the value of these securities amounted to $13,291,950 or 2.95% of net assets.
(e) The rate shown is the seven-day current annualized yield at July 31, 2015.
Abbreviation Legend
AGM Assured Guaranty Municipal Corporation
NPFGC National Public Finance Guarantee Corporation
Fair Value Measurements
The Fund categorizes its fair value measurements according to a three-level hierarchy that maximizes the use of observable inputs and minimizes the use of unobservable inputs by prioritizing that the most observable input be used when available. Observable inputs are those that market participants would use in pricing an investment based on market data obtained from sources independent of the reporting entity. Unobservable inputs are those that reflect the Fund's assumptions about the information market participants would use in pricing an investment. An investment's level within the fair value hierarchy is based on the lowest level of any input that is deemed significant to the asset's or liability's fair value measurement. The input levels are not necessarily an indication of the risk or liquidity associated with investments at that level. For example, certain U.S. government securities are generally high quality and liquid, however, they are reflected as Level 2 because the inputs used to determine fair value may not always be quoted prices in an active market.
Fair value inputs are summarized in the three broad levels listed below:
> Level 1 — Valuations based on quoted prices for investments in active markets that the Fund has the ability to access at the measurement date (including NAV for open-end mutual funds). Valuation adjustments are not applied to Level 1 investments.
> Level 2 — Valuations based on other significant observable inputs (including quoted prices for similar securities, interest rates, prepayment speeds, credit risks, etc.).
> Level 3 — Valuations based on significant unobservable inputs (including the Fund's own assumptions and judgment in determining the fair value of investments).
Inputs that are used in determining fair value of an investment may include price information, credit data, volatility statistics, and other factors. These inputs can be either observable or unobservable. The availability of observable inputs can vary between investments, and is affected by various factors such as the type of investment, and the volume and level of activity for that investment or similar investments in the marketplace. The inputs will be considered by the Investment Manager, along with any other relevant factors in the calculation of an investment's fair value. The Fund uses prices and inputs that are current as of the measurement date, which may include periods of market dislocations. During these periods, the availability of prices and inputs may be reduced for many investments. This condition could cause an investment to be reclassified between the various levels within the hierarchy.
Investments falling into the Level 3 category are primarily supported by quoted prices from brokers and dealers participating in the market for those investments. However, these may be classified as Level 3 investments due to lack of market transparency and corroboration to support these quoted prices. Additionally, valuation models may be used as the pricing source for any remaining investments classified as Level 3. These models may rely on one or more significant unobservable inputs and/or significant assumptions by the Investment Manager. Inputs used in valuations may include, but are not limited to, financial statement analysis, capital account balances, discount rates and estimated cash flows, and comparable company data.
Under the direction of the Fund's Board of Trustees (the Board), the Investment Manager's Valuation Committee (the Committee) is responsible for overseeing the valuation procedures approved by the Board. The Committee consists of voting and non-voting members from various groups within the Investment Manager's organization, including operations and accounting, trading and investments, compliance, risk management and legal.
The accompanying Notes to Financial Statements are an integral part of this statement.
Annual Report 2015
14
COLUMBIA AMT-FREE OREGON INTERMEDIATE MUNI BOND FUND
PORTFOLIO OF INVESTMENTS (continued)
July 31, 2015
Fair Value Measurements (continued)
The Committee meets at least monthly to review and approve valuation matters, which may include a description of specific valuation determinations, data regarding pricing information received from approved pricing vendors and brokers and the results of Board-approved valuation control policies and procedures (the Policies). The Policies address, among other things, instances when market quotations are or are not readily available, including recommendations of third party pricing vendors and a determination of appropriate pricing methodologies; events that require specific valuation determinations and assessment of fair value techniques; securities with a potential for stale pricing, including those that are illiquid, restricted, or in default; and the effectiveness of third party pricing vendors, including periodic reviews of vendors. The Committee meets more frequently, as needed, to discuss additional valuation matters, which may include the need to review back-testing results, review time-sensitive information or approve related valuation actions. The Committee reports to the Board, with members of the Committee meeting with the Board at each of its regularly scheduled meetings to discuss valuation matters and actions during the period, similar to those described earlier.
For investments categorized as Level 3, the Committee monitors information similar to that described above, which may include: (i) data specific to the issuer or comparable issuers, (ii) general market or specific sector news and (iii) quoted prices and specific or similar security transactions. The Committee considers this data and any changes from prior periods in order to assess the reasonableness of observable and unobservable inputs, any assumptions or internal models used to value those securities and changes in fair value. This data is also used to corroborate, when available, information received from approved pricing vendors and brokers. Various factors impact the frequency of monitoring this information (which may occur as often as daily). However, the Committee may determine that changes to inputs, assumptions and models are not required as a result of the monitoring procedures performed.
The following table is a summary of the inputs used to value the Fund's investments at July 31, 2015:
| | | Level 1
Quoted Prices in Active
Markets for Identical
Assets ($) | |
Level 2
Other Significant
Observable Inputs ($) | |
Level 3
Significant
Unobservable Inputs ($) | |
Total ($) | |
Investments | |
Municipal Bonds | | | — | | | | 443,699,056 | | | | — | | | | 443,699,056 | | |
Money Market Funds | | | 1,709,222 | | | | — | | | | — | | | | 1,709,222 | | |
Total Investments | | | 1,709,222 | | | | 443,699,056 | | | | — | | | | 445,408,278 | | |
See the Portfolio of Investments for all investment classifications not indicated in the table.
The Fund's assets assigned to the Level 2 input category are generally valued using the market approach, in which a security's value is determined through reference to prices and information from market transactions for similar or identical assets.
There were no transfers of financial assets between levels during the period.
The accompanying Notes to Financial Statements are an integral part of this statement.
Annual Report 2015
15
COLUMBIA AMT-FREE OREGON INTERMEDIATE MUNI BOND FUND
STATEMENT OF ASSETS AND LIABILITIES
July 31, 2015
Assets | |
Investments, at value | |
(identified cost $420,204,822) | | $ | 445,408,278 | | |
Cash | | | 3,030,332 | | |
Receivable for: | |
Investments sold | | | 77,156 | | |
Capital shares sold | | | 1,019,058 | | |
Interest | | | 4,253,998 | | |
Prepaid expenses | | | 4,831 | | |
Trustees' deferred compensation plan | | | 48,966 | | |
Total assets | | | 453,842,619 | | |
Liabilities | |
Payable for: | |
Investments purchased on a delayed delivery basis | | | 1,074,060 | | |
Capital shares purchased | | | 342,578 | | |
Dividend distributions to shareholders | | | 1,099,085 | | |
Investment management fees | | | 4,930 | | |
Distribution and/or service fees | | | 757 | | |
Transfer agent fees | | | 46,288 | | |
Administration fees | | | 835 | | |
Chief compliance officer expenses | | | 20 | | |
Other expenses | | | 36,760 | | |
Trustees' deferred compensation plan | | | 48,966 | | |
Total liabilities | | | 2,654,279 | | |
Net assets applicable to outstanding capital stock | | $ | 451,188,340 | | |
Represented by | |
Paid-in capital | | $ | 427,060,159 | | |
Undistributed net investment income | | | 303,623 | | |
Accumulated net realized loss | | | (1,378,898 | ) | |
Unrealized appreciation (depreciation) on: | |
Investments | | | 25,203,456 | | |
Total — representing net assets applicable to outstanding capital stock | | $ | 451,188,340 | | |
The accompanying Notes to Financial Statements are an integral part of this statement.
Annual Report 2015
16
COLUMBIA AMT-FREE OREGON INTERMEDIATE MUNI BOND FUND
STATEMENT OF ASSETS AND LIABILITIES (continued)
July 31, 2015
Class A | |
Net assets | | $ | 41,121,126 | | |
Shares outstanding | | | 3,278,079 | | |
Net asset value per share | | $ | 12.54 | | |
Maximum offering price per share(a) | | $ | 12.93 | | |
Class B | |
Net assets | | $ | 10,696 | | |
Shares outstanding | | | 853 | | |
Net asset value per share | | $ | 12.54 | | |
Class C | |
Net assets | | $ | 24,863,485 | | |
Shares outstanding | | | 1,981,974 | | |
Net asset value per share | | $ | 12.54 | | |
Class R4 | |
Net assets | | $ | 129,531 | | |
Shares outstanding | | | 10,326 | | |
Net asset value per share | | $ | 12.54 | | |
Class R5 | |
Net assets | | $ | 18,712,006 | | |
Shares outstanding | | | 1,493,776 | | |
Net asset value per share | | $ | 12.53 | | |
Class Z | |
Net assets | | $ | 366,351,496 | | |
Shares outstanding | | | 29,203,290 | | |
Net asset value per share | | $ | 12.54 | | |
(a) The maximum offering price per share is calculated by dividing the net asset value per share by 1.0 minus the maximum sales charge of 3.00%.
The accompanying Notes to Financial Statements are an integral part of this statement.
Annual Report 2015
17
COLUMBIA AMT-FREE OREGON INTERMEDIATE MUNI BOND FUND
STATEMENT OF OPERATIONS
Year Ended July 31, 2015
Net investment income | |
Income: | |
Dividends | | $ | 200 | | |
Interest | | | 15,946,215 | | |
Total income | | | 15,946,415 | | |
Expenses: | |
Investment management fees | | | 1,802,859 | | |
Distribution and/or service fees | |
Class A | | | 99,585 | | |
Class B | | | 105 | | |
Class C | | | 241,853 | | |
Transfer agent fees | |
Class A | | | 46,241 | | |
Class B | | | 13 | | |
Class C | | | 28,069 | | |
Class R4 | | | 149 | | |
Class R5 | | | 6,002 | | |
Class Z | | | 434,566 | | |
Administration fees | | | 305,465 | | |
Compensation of board members | | | 25,597 | | |
Custodian fees | | | 4,698 | | |
Printing and postage fees | | | 36,924 | | |
Registration fees | | | 21,866 | | |
Professional fees | | | 39,280 | | |
Chief compliance officer expenses | | | 224 | | |
Other | | | 13,480 | | |
Total expenses | | | 3,106,976 | | |
Fees waived or expenses reimbursed by Investment Manager and its affiliates | | | (153,915 | ) | |
Fees waived by Distributor — Class C | | | (76,493 | ) | |
Expense reductions | | | (520 | ) | |
Total net expenses | | | 2,876,048 | | |
Net investment income | | | 13,070,367 | | |
Realized and unrealized gain (loss) — net | |
Net realized gain (loss) on: | |
Investments | | | 1,121,220 | | |
Net realized gain | | | 1,121,220 | | |
Net change in unrealized appreciation (depreciation) on: | |
Investments | | | (3,560,711 | ) | |
Net change in unrealized depreciation | | | (3,560,711 | ) | |
Net realized and unrealized loss | | | (2,439,491 | ) | |
Net increase in net assets resulting from operations | | $ | 10,630,876 | | |
The accompanying Notes to Financial Statements are an integral part of this statement.
Annual Report 2015
18
COLUMBIA AMT-FREE OREGON INTERMEDIATE MUNI BOND FUND
STATEMENT OF CHANGES IN NET ASSETS
| | | Year Ended
July 31,
2015 | | Year Ended
July 31,
2014 | |
Operations | |
Net investment income | | $ | 13,070,367 | | | $ | 13,237,566 | | |
Net realized gain (loss) | | | 1,121,220 | | | | (2,500,118 | ) | |
Net change in unrealized appreciation (depreciation) | | | (3,560,711 | ) | | | 12,991,628 | | |
Net increase in net assets resulting from operations | | | 10,630,876 | | | | 23,729,076 | | |
Distributions to shareholders | |
Net investment income | |
Class A | | | (1,077,580 | ) | | | (1,063,203 | ) | |
Class B | | | (205 | ) | | | (187 | ) | |
Class C | | | (549,434 | ) | | | (576,032 | ) | |
Class R4 | | | (3,765 | ) | | | (607 | ) | |
Class R5 | | | (359,677 | ) | | | (222,645 | ) | |
Class Z | | | (11,069,000 | ) | | | (11,355,571 | ) | |
Net realized gains | |
Class A | | | — | | | | (89 | ) | |
Class C | | | — | | | | (59 | ) | |
Class R5 | | | — | | | | (18 | ) | |
Class Z | | | — | | | | (908 | ) | |
Total distributions to shareholders | | | (13,059,661 | ) | | | (13,219,319 | ) | |
Increase (decrease) in net assets from capital stock activity | | | 12,947,598 | | | | (27,910,321 | ) | |
Total increase (decrease) in net assets | | | 10,518,813 | | | | (17,400,564 | ) | |
Net assets at beginning of year | | | 440,669,527 | | | | 458,070,091 | | |
Net assets at end of year | | $ | 451,188,340 | | | $ | 440,669,527 | | |
Undistributed net investment income | | $ | 303,623 | | | $ | 292,917 | | |
The accompanying Notes to Financial Statements are an integral part of this statement.
Annual Report 2015
19
COLUMBIA AMT-FREE OREGON INTERMEDIATE MUNI BOND FUND
STATEMENT OF CHANGES IN NET ASSETS (continued)
| | | Year Ended July 31, 2015 | | Year Ended July 31, 2014 | |
| | | Shares | | Dollars ($) | | Shares | | Dollars ($) | |
Capital stock activity | |
Class A shares | |
Subscriptions(a) | | | 818,404 | | | | 10,322,599 | | | | 893,255 | | | | 11,066,878 | | |
Distributions reinvested | | | 82,080 | | | | 1,037,036 | | | | 81,883 | | | | 1,019,858 | | |
Redemptions | | | (631,296 | ) | | | (7,977,617 | ) | | | (846,256 | ) | | | (10,507,721 | ) | |
Net increase | | | 269,188 | | | | 3,382,018 | | | | 128,882 | | | | 1,579,015 | | |
Class B shares | |
Subscriptions | | | 793 | | | | 10,001 | | | | — | | | | — | | |
Distributions reinvested | | | 16 | | | | 205 | | | | 15 | | | | 186 | | |
Redemptions(a) | | | — | | | | — | | | | (1,541 | ) | | | (19,137 | ) | |
Net increase (decrease) | | | 809 | | | | 10,206 | | | | (1,526 | ) | | | (18,951 | ) | |
Class C shares | |
Subscriptions | | | 328,135 | | | | 4,153,192 | | | | 269,741 | | | | 3,363,719 | | |
Distributions reinvested | | | 39,977 | | | | 505,125 | | | | 41,382 | | | | 515,112 | | |
Redemptions | | | (265,466 | ) | | | (3,353,173 | ) | | | (549,139 | ) | | | (6,800,179 | ) | |
Net increase (decrease) | | | 102,646 | | | | 1,305,144 | | | | (238,016 | ) | | | (2,921,348 | ) | |
Class R4 shares | |
Subscriptions | | | 8,699 | | | | 109,999 | | | | 5,884 | | | | 73,601 | | |
Distributions reinvested | | | 298 | | | | 3,765 | | | | 48 | | | | 601 | | |
Redemptions | | | (4,762 | ) | | | (60,198 | ) | | | (36 | ) | | | (457 | ) | |
Net increase | | | 4,235 | | | | 53,566 | | | | 5,896 | | | | 73,745 | | |
Class R5 shares | |
Subscriptions | | | 973,339 | | | | 12,239,272 | | | | 293,944 | | | | 3,629,511 | | |
Distributions reinvested | | | 28,517 | | | | 359,374 | | | | 17,877 | | | | 222,507 | | |
Redemptions | | | (150,825 | ) | | | (1,895,620 | ) | | | (106,662 | ) | | | (1,317,976 | ) | |
Net increase | | | 851,031 | | | | 10,703,026 | | | | 205,159 | | | | 2,534,042 | | |
Class Z shares | |
Subscriptions | | | 2,287,978 | | | | 28,937,048 | | | | 1,515,187 | | | | 18,911,904 | | |
Distributions reinvested | | | 653,490 | | | | 8,257,559 | | | | 678,138 | | | | 8,441,435 | | |
Redemptions | | | (3,153,479 | ) | | | (39,700,969 | ) | | | (4,567,746 | ) | | | (56,510,163 | ) | |
Net decrease | | | (212,011 | ) | | | (2,506,362 | ) | | | (2,374,421 | ) | | | (29,156,824 | ) | |
Total net increase (decrease) | | | 1,015,898 | | | | 12,947,598 | | | | (2,274,026 | ) | | | (27,910,321 | ) | |
(a) Includes conversions of Class B shares to Class A shares, if any.
The accompanying Notes to Financial Statements are an integral part of this statement.
Annual Report 2015
20
COLUMBIA AMT-FREE OREGON INTERMEDIATE MUNI BOND FUND
The following tables are intended to help you understand the Fund's financial performance. Certain information reflects financial results for a single share of a class held for the periods shown. Per share net investment income (loss) amounts are calculated based on average shares outstanding during the period. Total return assumes reinvestment of all dividends and distributions, if any. Total return does not reflect payment of sales charges, if any. Total return and portfolio turnover are not annualized for periods of less than one year. The portfolio turnover rate is calculated without regard to purchase and sales transactions of short-term instruments and certain derivatives, if any. If such transactions were included, the Fund's portfolio turnover rate may be higher.
| | | Year Ended July 31, | | Year Ended
August 31, | |
Class A | | 2015 | | 2014 | | 2013 | | 2012(a) | | 2011 | | 2010 | |
Per share data | |
Net asset value, beginning of period | | $ | 12.61 | | | $ | 12.30 | | | $ | 12.95 | | | $ | 12.49 | | | $ | 12.67 | | | $ | 12.17 | | |
Income from investment operations: | |
Net investment income | | | 0.34 | | | | 0.35 | | | | 0.34 | | | | 0.34 | | | | 0.40 | | | | 0.41 | | |
Net realized and unrealized gain (loss) | | | (0.07 | ) | | | 0.31 | | | | (0.65 | ) | | | 0.46 | | | | (0.15 | ) | | | 0.51 | | |
Total from investment operations | | | 0.27 | | | | 0.66 | | | | (0.31 | ) | | | 0.80 | | | | 0.25 | | | | 0.92 | | |
Less distributions to shareholders: | |
Net investment income | | | (0.34 | ) | | | (0.35 | ) | | | (0.34 | ) | | | (0.34 | ) | | | (0.41 | ) | | | (0.42 | ) | |
Net realized gains | | | — | | | | (0.00 | )(b) | | | — | | | | — | | | | (0.02 | ) | | | — | | |
Total distributions to shareholders | | | (0.34 | ) | | | (0.35 | ) | | | (0.34 | ) | | | (0.34 | ) | | | (0.43 | ) | | | (0.42 | ) | |
Net asset value, end of period | | $ | 12.54 | | | $ | 12.61 | | | $ | 12.30 | | | $ | 12.95 | | | $ | 12.49 | | | $ | 12.67 | | |
Total return | | | 2.17 | % | | | 5.43 | % | | | (2.47 | %) | | | 6.50 | % | | | 2.07 | % | | | 7.68 | % | |
Ratios to average net assets(c) | |
Total gross expenses | | | 0.87 | % | | | 0.86 | % | | | 0.86 | % | | | 0.86 | %(d) | | | 0.89 | % | | | 0.89 | % | |
Total net expenses(e) | | | 0.83 | %(f) | | | 0.81 | %(f) | | | 0.80 | %(f) | | | 0.79 | %(d)(f) | | | 0.80 | %(f) | | | 0.78 | %(f) | |
Net investment income | | | 2.71 | % | | | 2.81 | % | | | 2.65 | % | | | 2.92 | %(d) | | | 3.28 | % | | | 3.35 | % | |
Supplemental data | |
Net assets, end of period (in thousands) | | $ | 41,121 | | | $ | 37,935 | | | $ | 35,438 | | | $ | 31,484 | | | $ | 24,998 | | | $ | 27,661 | | |
Portfolio turnover | | | 11 | % | | | 9 | % | | | 15 | % | | | 9 | % | | | 13 | % | | | 12 | % | |
Notes to Financial Highlights
(a) For the period from September 1, 2011 to July 31, 2012. During the period, the Fund's fiscal year end was changed from August 31 to July 31.
(b) Rounds to zero.
(c) In addition to the fees and expenses that the Fund bears directly, the Fund indirectly bears a pro rata share of the fees and expenses of any other funds in which it invests. Such indirect expenses are not included in the Fund's reported expense ratios.
(d) Annualized.
(e) Total net expenses include the impact of certain fee waivers/expense reimbursements made by the Investment Manager and certain of its affiliates, if applicable.
(f) The benefits derived from expense reductions had an impact of less than 0.01%.
The accompanying Notes to Financial Statements are an integral part of this statement.
Annual Report 2015
21
COLUMBIA AMT-FREE OREGON INTERMEDIATE MUNI BOND FUND
FINANCIAL HIGHLIGHTS (continued)
| | | Year Ended July 31, | | Year Ended
August 31, | |
Class B | | 2015 | | 2014 | | 2013 | | 2012(a) | | 2011 | | 2010 | |
Per share data | |
Net asset value, beginning of period | | $ | 12.60 | | | $ | 12.30 | | | $ | 12.95 | | | $ | 12.49 | | | $ | 12.67 | | | $ | 12.17 | | |
Income from investment operations: | |
Net investment income | | | 0.25 | | | | 0.26 | | | | 0.25 | | | | 0.26 | | | | 0.32 | | | | 0.33 | | |
Net realized and unrealized gain (loss) | | | (0.06 | ) | | | 0.30 | | | | (0.66 | ) | | | 0.45 | | | | (0.17 | ) | | | 0.49 | | |
Total from investment operations | | | 0.19 | | | | 0.56 | | | | (0.41 | ) | | | 0.71 | | | | 0.15 | | | | 0.82 | | |
Less distributions to shareholders: | |
Net investment income | | | (0.25 | ) | | | (0.26 | ) | | | (0.24 | ) | | | (0.25 | ) | | | (0.31 | ) | | | (0.32 | ) | |
Net realized gains | | | — | | | | (0.00 | )(b) | | | — | | | | — | | | | (0.02 | ) | | | — | | |
Total distributions to shareholders | | | (0.25 | ) | | | (0.26 | ) | | | (0.24 | ) | | | (0.25 | ) | | | (0.33 | ) | | | (0.32 | ) | |
Net asset value, end of period | | $ | 12.54 | | | $ | 12.60 | | | $ | 12.30 | | | $ | 12.95 | | | $ | 12.49 | | | $ | 12.67 | | |
Total return | | | 1.49 | % | | | 4.63 | % | | | (3.19 | %) | | | 5.77 | % | | | 1.30 | % | | | 6.88 | % | |
Ratios to average net assets(c) | |
Total gross expenses | | | 1.64 | % | | | 1.60 | % | | | 1.61 | % | | | 1.61 | %(d) | | | 1.66 | % | | | 1.64 | % | |
Total net expenses(e) | | | 1.58 | %(f) | | | 1.56 | %(f) | | | 1.55 | %(f) | | | 1.54 | %(d)(f) | | | 1.55 | %(f) | | | 1.53 | %(f) | |
Net investment income | | | 1.96 | % | | | 2.08 | % | | | 1.91 | % | | | 2.22 | %(d) | | | 2.57 | % | | | 2.66 | % | |
Supplemental data | |
Net assets, end of period (in thousands) | | $ | 11 | | | $ | 1 | | | $ | 19 | | | $ | 41 | | | $ | 79 | | | $ | 403 | | |
Portfolio turnover | | | 11 | % | | | 9 | % | | | 15 | % | | | 9 | % | | | 13 | % | | | 12 | % | |
Notes to Financial Highlights
(a) For the period from September 1, 2011 to July 31, 2012. During the period, the Fund's fiscal year end was changed from August 31 to July 31.
(b) Rounds to zero.
(c) In addition to the fees and expenses that the Fund bears directly, the Fund indirectly bears a pro rata share of the fees and expenses of any other funds in which it invests. Such indirect expenses are not included in the Fund's reported expense ratios.
(d) Annualized.
(e) Total net expenses include the impact of certain fee waivers/expense reimbursements made by the Investment Manager and certain of its affiliates, if applicable.
(f) The benefits derived from expense reductions had an impact of less than 0.01%.
The accompanying Notes to Financial Statements are an integral part of this statement.
Annual Report 2015
22
COLUMBIA AMT-FREE OREGON INTERMEDIATE MUNI BOND FUND
FINANCIAL HIGHLIGHTS (continued)
| | | Year Ended July 31, | | Year Ended
August 31, | |
Class C | | 2015 | | 2014 | | 2013 | | 2012(a) | | 2011 | | 2010 | |
Per share data | |
Net asset value, beginning of period | | $ | 12.61 | | | $ | 12.31 | | | $ | 12.95 | | | $ | 12.49 | | | $ | 12.67 | | | $ | 12.17 | | |
Income from investment operations: | |
Net investment income | | | 0.29 | | | | 0.30 | | | | 0.29 | | | | 0.29 | | | | 0.35 | | | | 0.37 | | |
Net realized and unrealized gain (loss) | | | (0.07 | ) | | | 0.30 | | | | (0.64 | ) | | | 0.46 | | | | (0.15 | ) | | | 0.50 | | |
Total from investment operations | | | 0.22 | | | | 0.60 | | | | (0.35 | ) | | | 0.75 | | | | 0.20 | | | | 0.87 | | |
Less distributions to shareholders: | |
Net investment income | | | (0.29 | ) | | | (0.30 | ) | | | (0.29 | ) | | | (0.29 | ) | | | (0.36 | ) | | | (0.37 | ) | |
Net realized gains | | | — | | | | (0.00 | )(b) | | | — | | | | — | | | | (0.02 | ) | | | — | | |
Total distributions to shareholders | | | (0.29 | ) | | | (0.30 | ) | | | (0.29 | ) | | | (0.29 | ) | | | (0.38 | ) | | | (0.37 | ) | |
Net asset value, end of period | | $ | 12.54 | | | $ | 12.61 | | | $ | 12.31 | | | $ | 12.95 | | | $ | 12.49 | | | $ | 12.67 | | |
Total return | | | 1.73 | % | | | 4.93 | % | | | (2.78 | %) | | | 6.10 | % | | | 1.65 | % | | | 7.25 | % | |
Ratios to average net assets(c) | |
Total gross expenses | | | 1.62 | % | | | 1.61 | % | | | 1.61 | % | | | 1.61 | %(d) | | | 1.64 | % | | | 1.64 | % | |
Total net expenses(e) | | | 1.26 | %(f) | | | 1.21 | %(f) | | | 1.20 | %(f) | | | 1.19 | %(d)(f) | | | 1.19 | %(f) | | | 1.18 | %(f) | |
Net investment income | | | 2.27 | % | | | 2.41 | % | | | 2.25 | % | | | 2.51 | %(d) | | | 2.88 | % | | | 2.96 | % | |
Supplemental data | |
Net assets, end of period (in thousands) | | $ | 24,863 | | | $ | 23,694 | | | $ | 26,055 | | | $ | 23,812 | | | $ | 18,069 | | | $ | 16,722 | | |
Portfolio turnover | | | 11 | % | | | 9 | % | | | 15 | % | | | 9 | % | | | 13 | % | | | 12 | % | |
Notes to Financial Highlights
(a) For the period from September 1, 2011 to July 31, 2012. During the period, the Fund's fiscal year end was changed from August 31 to July 31.
(b) Rounds to zero.
(c) In addition to the fees and expenses that the Fund bears directly, the Fund indirectly bears a pro rata share of the fees and expenses of any other funds in which it invests. Such indirect expenses are not included in the Fund's reported expense ratios.
(d) Annualized.
(e) Total net expenses include the impact of certain fee waivers/expense reimbursements made by the Investment Manager and certain of its affiliates, if applicable.
(f) The benefits derived from expense reductions had an impact of less than 0.01%.
The accompanying Notes to Financial Statements are an integral part of this statement.
Annual Report 2015
23
COLUMBIA AMT-FREE OREGON INTERMEDIATE MUNI BOND FUND
FINANCIAL HIGHLIGHTS (continued)
| | | Year Ended July 31, | |
Class R4 | | 2015 | | 2014 | | 2013(a) | |
Per share data | |
Net asset value, beginning of period | | $ | 12.60 | | | $ | 12.30 | | | $ | 12.83 | | |
Income from investment operations: | |
Net investment income | | | 0.37 | | | | 0.38 | | | | 0.13 | | |
Net realized and unrealized gain (loss) | | | (0.06 | ) | | | 0.30 | | | | (0.53 | ) | |
Total from investment operations | | | 0.31 | | | | 0.68 | | | | (0.40 | ) | |
Less distributions to shareholders: | |
Net investment income | | | (0.37 | ) | | | (0.38 | ) | | | (0.13 | ) | |
Net realized gains | | | — | | | | (0.00 | )(b) | | | — | | |
Total distributions to shareholders | | | (0.37 | ) | | | (0.38 | ) | | | (0.13 | ) | |
Net asset value, end of period | | $ | 12.54 | | | $ | 12.60 | | | $ | 12.30 | | |
Total return | | | 2.50 | % | | | 5.58 | % | | | (3.13 | %) | |
Ratios to average net assets(c) | |
Total gross expenses | | | 0.62 | % | | | 0.62 | % | | | 0.58 | %(d) | |
Total net expenses(e) | | | 0.58 | %(f) | | | 0.56 | %(f) | | | 0.56 | %(d) | |
Net investment income | | | 2.97 | % | | | 3.08 | % | | | 2.92 | %(d) | |
Supplemental data | |
Net assets, end of period (in thousands) | | $ | 130 | | | $ | 77 | | | $ | 2 | | |
Portfolio turnover | | | 11 | % | | | 9 | % | | | 15 | % | |
Notes to Financial Highlights
(a) Based on operations from March 19, 2013 (commencement of operations) through the stated period end.
(b) Rounds to zero.
(c) In addition to the fees and expenses that the Fund bears directly, the Fund indirectly bears a pro rata share of the fees and expenses of any other funds in which it invests. Such indirect expenses are not included in the Fund's reported expense ratios.
(d) Annualized.
(e) Total net expenses include the impact of certain fee waivers/expense reimbursements made by the Investment Manager and certain of its affiliates, if applicable.
(f) The benefits derived from expense reductions had an impact of less than 0.01%.
The accompanying Notes to Financial Statements are an integral part of this statement.
Annual Report 2015
24
COLUMBIA AMT-FREE OREGON INTERMEDIATE MUNI BOND FUND
FINANCIAL HIGHLIGHTS (continued)
| | | Year Ended July 31, | |
Class R5 | | 2015 | | 2014 | | 2013(a) | |
Per share data | |
Net asset value, beginning of period | | $ | 12.59 | | | $ | 12.29 | | | $ | 12.99 | | |
Income from investment operations: | |
Net investment income | | | 0.38 | | | | 0.38 | | | | 0.27 | | |
Net realized and unrealized gain (loss) | | | (0.06 | ) | | | 0.30 | | | | (0.70 | ) | |
Total from investment operations | | | 0.32 | | | | 0.68 | | | | (0.43 | ) | |
Less distributions to shareholders: | |
Net investment income | | | (0.38 | ) | | | (0.38 | ) | | | (0.27 | ) | |
Net realized gains | | | — | | | | (0.00 | )(b) | | | — | | |
Total distributions to shareholders | | | (0.38 | ) | | | (0.38 | ) | | | (0.27 | ) | |
Net asset value, end of period | | $ | 12.53 | | | $ | 12.59 | | | $ | 12.29 | | |
Total return | | | 2.54 | % | | | 5.64 | % | | | (3.38 | %) | |
Ratios to average net assets(c) | |
Total gross expenses | | | 0.55 | % | | | 0.56 | % | | | 0.55 | %(d) | |
Total net expenses(e) | | | 0.55 | % | | | 0.53 | % | | | 0.54 | %(d) | |
Net investment income | | | 3.00 | % | | | 3.09 | % | | | 2.97 | %(d) | |
Supplemental data | |
Net assets, end of period (in thousands) | | $ | 18,712 | | | $ | 8,092 | | | $ | 5,377 | | |
Portfolio turnover | | | 11 | % | | | 9 | % | | | 15 | % | |
Notes to Financial Highlights
(a) Based on operations from November 8, 2012 (commencement of operations) through the stated period end.
(b) Rounds to zero.
(c) In addition to the fees and expenses that the Fund bears directly, the Fund indirectly bears a pro rata share of the fees and expenses of any other funds in which it invests. Such indirect expenses are not included in the Fund's reported expense ratios.
(d) Annualized.
(e) Total net expenses include the impact of certain fee waivers/expense reimbursements made by the Investment Manager and certain of its affiliates, if applicable.
The accompanying Notes to Financial Statements are an integral part of this statement.
Annual Report 2015
25
COLUMBIA AMT-FREE OREGON INTERMEDIATE MUNI BOND FUND
FINANCIAL HIGHLIGHTS (continued)
| | | Year Ended July 31, | | Year Ended
August 31, | |
Class Z | | 2015 | | 2014 | | 2013 | | 2012(a) | | 2011 | | 2010 | |
Per share data | |
Net asset value, beginning of period | | $ | 12.61 | | | $ | 12.31 | | | $ | 12.95 | | | $ | 12.49 | | | $ | 12.67 | | | $ | 12.17 | | |
Income from investment operations: | |
Net investment income | | | 0.37 | | | | 0.38 | | | | 0.37 | | | | 0.37 | | | | 0.43 | | | | 0.45 | | |
Net realized and unrealized gain (loss) | | | (0.07 | ) | | | 0.30 | | | | (0.64 | ) | | | 0.46 | | | | (0.15 | ) | | | 0.50 | | |
Total from investment operations | | | 0.30 | | | | 0.68 | | | | (0.27 | ) | | | 0.83 | | | | 0.28 | | | | 0.95 | | |
Less distributions to shareholders: | |
Net investment income | | | (0.37 | ) | | | (0.38 | ) | | | (0.37 | ) | | | (0.37 | ) | | | (0.44 | ) | | | (0.45 | ) | |
Net realized gains | | | — | | | | (0.00 | )(b) | | | — | | | | — | | | | (0.02 | ) | | | — | | |
Total distributions to shareholders | | | (0.37 | ) | | | (0.38 | ) | | | (0.37 | ) | | | (0.37 | ) | | | (0.46 | ) | | | (0.45 | ) | |
Net asset value, end of period | | $ | 12.54 | | | $ | 12.61 | | | $ | 12.31 | | | $ | 12.95 | | | $ | 12.49 | | | $ | 12.67 | | |
Total return | | | 2.42 | % | | | 5.61 | % | | | (2.14 | %) | | | 6.73 | % | | | 2.31 | % | | | 7.95 | % | |
Ratios to average net assets(c) | |
Total gross expenses | | | 0.62 | % | | | 0.61 | % | | | 0.61 | % | | | 0.61 | %(d) | | | 0.64 | % | | | 0.64 | % | |
Total net expenses(e) | | | 0.58 | %(f) | | | 0.56 | %(f) | | | 0.55 | %(f) | | | 0.54 | %(d)(f) | | | 0.55 | %(f) | | | 0.53 | %(f) | |
Net investment income | | | 2.96 | % | | | 3.06 | % | | | 2.90 | % | | | 3.17 | %(d) | | | 3.53 | % | | | 3.63 | % | |
Supplemental data | |
Net assets, end of period (in thousands) | | $ | 366,351 | | | $ | 370,871 | | | $ | 391,179 | | | $ | 437,800 | | | $ | 402,393 | | | $ | 450,422 | | |
Portfolio turnover | | | 11 | % | | | 9 | % | | | 15 | % | | | 9 | % | | | 13 | % | | | 12 | % | |
Notes to Financial Highlights
(a) For the period from September 1, 2011 to July 31, 2012. During the period, the Fund's fiscal year end was changed from August 31 to July 31.
(b) Rounds to zero.
(c) In addition to the fees and expenses that the Fund bears directly, the Fund indirectly bears a pro rata share of the fees and expenses of any other funds in which it invests. Such indirect expenses are not included in the Fund's reported expense ratios.
(d) Annualized.
(e) Total net expenses include the impact of certain fee waivers/expense reimbursements made by the Investment Manager and certain of its affiliates, if applicable.
(f) The benefits derived from expense reductions had an impact of less than 0.01%.
The accompanying Notes to Financial Statements are an integral part of this statement.
Annual Report 2015
26
COLUMBIA AMT-FREE OREGON INTERMEDIATE MUNI BOND FUND
NOTES TO FINANCIAL STATEMENTS
July 31, 2015
Note 1. Organization
Columbia AMT-Free Oregon Intermediate Muni Bond Fund (the Fund), a series of Columbia Funds Series Trust I (the Trust), is a diversified fund. The Trust is registered under the Investment Company Act of 1940, as amended (the 1940 Act), as an open-end management investment company organized as a Massachusetts business trust.
Fund Shares
The Trust may issue an unlimited number of shares (without par value). The Fund offers Class A, Class B, Class C, Class R4, Class R5 and Class Z shares. Although all share classes generally have identical voting, dividend and liquidation rights, each share class votes separately when required by the Trust's organizational documents or by law. Different share classes pay different distribution amounts to the extent the expenses of such share classes differ, and distributions in liquidation will be proportional to the net asset value of each share class. Each share class has its own expense and sales charge structure.
Class A shares are subject to a maximum front-end sales charge of 3.00% based on the initial investment amount. In addition, Class A shares purchased on or after February 19, 2015 are subject to a contingent deferred sales charge (CDSC) of 0.75% on certain investments of $500,000 or more if redeemed within 12 months after purchase. Redemptions of Class A shares purchased prior to February 19, 2015, without an initial sales charge in accounts aggregating $1 million to $50 million at the time of purchase, are subject to a CDSC of 1.00% if redeemed within 12 months after purchase, and 0.50% if redeemed more than 12, but less than 18, months after purchase.
Class B shares may be subject to a maximum CDSC of 3.00% based upon the holding period after purchase. Class B shares will generally convert to Class A shares eight years after purchase. The Fund no longer accepts investments by new or existing investors in the Fund's Class B shares, except in connection with the reinvestment of any dividend and/or capital gain distributions in Class B shares of the Fund and exchanges by existing Class B shareholders of certain other funds within the Columbia Family of Funds.
Class C shares are subject to a 1.00% CDSC on shares redeemed within one year after purchase.
Class R4 shares are not subject to sales charges and are generally available only to omnibus retirement plans and certain investors as described in the Fund's prospectus.
Class R5 shares are not subject to sales charges and are generally available only to investors purchasing through authorized investment professionals and omnibus retirement plans.
Class Z shares are not subject to sales charges and are available only to eligible investors, which are subject to different investment minimums as described in the Fund's prospectus.
Note 2. Summary of Significant Accounting Policies
Basis of Preparation
The Fund is an investment company that applies the accounting and reporting guidance in the Financial Accounting Standards Board (FASB) Accounting Standards Codification Topic 946, Financial Services — Investment Companies (ASC 946). The financial statements are prepared in accordance with U.S. generally accepted accounting principles (GAAP), which requires management to make certain estimates and assumptions that affect the reported amounts of assets and liabilities, the disclosure of contingent assets and liabilities at the date of the financial statements and the reported amounts of income and expenses during the reporting period. Actual results could differ from those estimates.
The following is a summary of significant accounting policies followed by the Fund in the preparation of its financial statements.
Security Valuation
Debt securities generally are valued by pricing services approved by the Board of Trustees (the Board) based upon market transactions for normal, institutional-size trading units of similar securities. The services may use various pricing techniques that take into account, as applicable, factors such as yield, quality, coupon rate, maturity, type of issue, trading characteristics and other data, as well as broker quotes. Debt securities for which quotations are not readily available or not believed to be reflective of market value may also be valued based upon a bid quote from an approved independent broker-dealer.
Investments in open-end investment companies, including money market funds, are valued at their latest net asset value.
Investments for which market quotations are not readily available, or that have quotations which management believes are not reflective of market value or reliable, are
Annual Report 2015
27
COLUMBIA AMT-FREE OREGON INTERMEDIATE MUNI BOND FUND
NOTES TO FINANCIAL STATEMENTS (continued)
July 31, 2015
valued at fair value as determined in good faith under procedures approved by and under the general supervision of the Board. If a security or class of securities (such as foreign securities) is valued at fair value, such value is likely to be different from the quoted or published price for the security.
The determination of fair value often requires significant judgment. To determine fair value, management may use assumptions including but not limited to future cash flows and estimated risk premiums. Multiple inputs from various sources may be used to determine fair value.
GAAP requires disclosure regarding the inputs and valuation techniques used to measure fair value and any changes in valuation inputs or techniques. In addition, investments shall be disclosed by major category. This information is disclosed following the Fund's Portfolio of Investments.
Delayed Delivery Securities
The Fund may trade securities on other than normal settlement terms, including securities purchased or sold on a "when-issued" basis. This may increase risk to the Fund since the other party to the transaction may fail to deliver, which could cause the Fund to subsequently invest at less advantageous prices. The Fund designates cash or liquid securities in an amount equal to the delayed delivery commitment.
Security Transactions
Security transactions are accounted for on the trade date. Cost is determined and gains (losses) are based upon the specific identification method for both financial statement and federal income tax purposes.
Income Recognition
Interest income is recorded on an accrual basis. Market premiums and discounts, including original issue discounts, are amortized and accreted, respectively, over the expected life of the security on all debt securities, unless otherwise noted.
The Fund may place a debt security on non-accrual status and reduce related interest income when it becomes probable that the interest will not be collected and the amount of uncollectible interest can be reasonably estimated. A defaulted debt security is removed from non-accrual status when the issuer resumes interest payments or when collectibility of interest is reasonably assured.
Dividend income is recorded on the ex-dividend date.
Expenses
General expenses of the Trust are allocated to the Fund and other funds of the Trust based upon relative net assets or other expense allocation methodologies determined by the nature of the expense. Expenses directly attributable to the Fund are charged to the Fund. Expenses directly attributable to a specific class of shares are charged to that share class.
Determination of Class Net Asset Value
All income, expenses (other than class-specific expenses, which are charged to that share class, as shown in the Statement of Operations) and realized and unrealized gains (losses) are allocated to each class of the Fund on a daily basis, based on the relative net assets of each class, for purposes of determining the net asset value of each class.
Federal Income Tax Status
The Fund intends to qualify each year as a regulated investment company under Subchapter M of the Internal Revenue Code, as amended, and will distribute substantially all of its tax exempt and taxable income (including net short-term capital gains), if any, for its tax year, and as such will not be subject to federal income taxes. In addition, the Fund intends to distribute in each calendar year substantially all of its net investment income, capital gains and certain other amounts, if any, such that the Fund should not be subject to federal excise tax. Therefore, no federal income or excise tax provision is recorded.
Distributions to Shareholders
Distributions from net investment income, if any, are declared daily and paid monthly. Net realized capital gains, if any, are distributed at least annually. Income distributions and capital gain distributions are determined in accordance with federal income tax regulations, which may differ from GAAP.
Guarantees and Indemnifications
Under the Trust's organizational documents and, in some cases, by contract, its officers and trustees are indemnified against certain liabilities arising out of the performance of their duties to the Trust or its funds. In addition, certain of the Fund's contracts with its service providers contain general indemnification clauses. The Fund's maximum exposure under these arrangements is unknown since the amount of any future claims that may be made against the Fund cannot be determined, and
Annual Report 2015
28
COLUMBIA AMT-FREE OREGON INTERMEDIATE MUNI BOND FUND
NOTES TO FINANCIAL STATEMENTS (continued)
July 31, 2015
the Fund has no historical basis for predicting the likelihood of any such claims.
Recent Accounting Pronouncement
Fair Value Measurement (Topic 820), Disclosure for Investments in Certain Entities That Calculate Net Asset Value per Share (or Its Equivalent)
In May 2015, the Financial Accounting Standards Board (FASB) issued Accounting Standards Update (ASU) No. 2015-07, Fair Value Measurement (Topic 820), Disclosure for Investments in Certain Entities That Calculate Net Asset Value per Share (or Its Equivalent). ASU No. 2015-07 changes the disclosure requirements for investments for which fair value is measured using the net asset value per share practical expedient. The disclosure requirements are effective for annual periods beginning after December 15, 2016 and interim periods within those fiscal years. At this time, management is evaluating the implications of this guidance and the impact it will have on the financial statement amounts and footnote disclosures, if any.
Note 3. Fees and Other Transactions with Affiliates
Investment Management Fees
Under an Investment Management Services Agreement, Columbia Management Investment Advisers, LLC (the Investment Manager), a wholly-owned subsidiary of Ameriprise Financial, Inc. (Ameriprise Financial), determines which securities will be purchased, held or sold. The investment management fee is an annual fee that is equal to a percentage of the Fund's average daily net assets that declines from 0.40% to 0.27% as the Fund's net assets increase. The effective investment management fee rate for the year ended July 31, 2015 was 0.40% of the Fund's average daily net assets.
Administration Fees
Under an Administrative Services Agreement, the Investment Manager also serves as the Fund Administrator. The Fund pays the Fund Administrator an annual fee for administration and accounting services equal to a percentage of the Fund's average daily net assets that declines from 0.07% to 0.04% as the Fund's net assets increase. The effective administration fee rate for the year ended July 31, 2015 was 0.07% of the Fund's average daily net assets.
Compensation of Board Members
Board members, who are not officers or employees of the Investment Manager or Ameriprise Financial, are compensated for their services to the Fund as disclosed in the Statement of Operations. These Board members may participate in a Deferred Compensation Plan (the Plan) which may be terminated at any time. Obligations of the Plan will be paid solely out of the Fund's assets, and all amounts payable under the Plan constitute a general unsecured obligation of the Fund.
Compensation of Chief Compliance Officer
The Board has appointed a Chief Compliance Officer to the Fund in accordance with federal securities regulations. The Fund is allocated a portion of the expenses associated with the Chief Compliance Officer based on relative net assets of the Trust.
Transfer Agency Fees
Under a Transfer and Dividend Disbursing Agent Agreement, Columbia Management Investment Services Corp. (the Transfer Agent), an affiliate of the Investment Manager and a wholly-owned subsidiary of Ameriprise Financial, is responsible for providing transfer agency services to the Fund. The Transfer Agent has contracted with Boston Financial Data Services (BFDS) to serve as sub-transfer agent.
Effective November 1, 2014, the Transfer Agent receives a monthly transfer agency fee based on the number or the average value of accounts, depending on the type of account. Prior to November 1, 2014, the Transfer Agent received a monthly account-based service fee based on the number of open accounts. In addition, the Transfer Agent also receives sub-transfer agency fees based on a percentage of the average aggregate value of the Fund's shares maintained in omnibus accounts (other than omnibus accounts for which American Enterprise Investment Services Inc. is the broker of record or accounts where the beneficial shareholder is a customer of Ameriprise Financial Services, Inc., for which the Transfer Agent receives a per account fee). The Transfer Agent pays the fees of BFDS for services as sub-transfer agent and is not entitled to reimbursement for such fees from the Fund (with the exception of out-of-pocket fees).
The Transfer Agent also receives compensation from the Fund for various shareholder services and reimbursements for certain out-of-pocket fees. Total transfer agency fees for Class R5 shares are subject to an annual limitation of
Annual Report 2015
29
COLUMBIA AMT-FREE OREGON INTERMEDIATE MUNI BOND FUND
NOTES TO FINANCIAL STATEMENTS (continued)
July 31, 2015
not more than 0.05% of the average daily net assets attributable to Class R5 shares.
For the year ended July 31, 2015, the Fund's effective transfer agency fee rates as a percentage of average daily net assets of each class were as follows:
Class A | | | 0.12 | % | |
Class B | | | 0.13 | | |
Class C | | | 0.12 | | |
Class R4 | | | 0.12 | | |
Class R5 | | | 0.05 | | |
Class Z | | | 0.12 | | |
An annual minimum account balance fee of $20 may apply to certain accounts with a value below the applicable share class's initial minimum investment requirements to reduce the impact of small accounts on transfer agency fees. These minimum account balance fees are remitted to the Fund and recorded as part of expense reductions in the Statement of Operations. For the year ended July 31, 2015, these minimum account balance fees reduced total expenses of the Fund by $520.
Distribution and Service Fees
The Fund has an agreement with Columbia Management Investment Distributors, Inc. (the Distributor), an affiliate of the Investment Manager and a wholly-owned subsidiary of Ameriprise Financial, for distribution and shareholder services. The Board has approved, and the Fund has adopted, distribution and shareholder service plans (the Plans) applicable to certain share classes, which set the distribution and service fees for the Fund. These fees are calculated daily and are intended to compensate the Distributor and/or eligible selling and/or servicing agents for selling shares of the Fund and providing services to investors.
Under the Plans, the Fund pays a monthly service fee to the Distributor at the maximum annual rate of 0.25% of the average daily net assets attributable to Class A, Class B and Class C shares of the Fund. Also under the Plans, the Fund pays a monthly distribution fee to the Distributor at the maximum annual rates of 0.10%, 0.75%and 0.75% of the average daily net assets attributable to Class A, Class B and Class C shares of the Fund, respectively.
Although the Fund may pay distribution and service fees up to a maximum annual rate of 0.35% of the Fund's average daily net assets attributable to Class A shares (comprised of up to 0.10% for distribution services and up to 0.25% for shareholder liaison services), the Fund
currently limits such fees to an aggregate fee of not more than 0.25% of the Fund's average daily net assets attributable to Class A shares.
Effective December 1, 2014, the Distributor has voluntarily agreed to waive a portion of the distribution fee for Class C shares so that the distribution fee does not exceed 0.45% annually of the average daily net assets attributable to Class C shares. This arrangement may be modified or terminated by the Distributor at any time. Prior to December 1, 2014, the Distributor voluntarily waived a portion of the distribution fee for Class C shares so that the distribution fee did not exceed 0.40% annually of the average daily net assets attributable to Class C shares.
Sales Charges
Sales charges, including front-end charges and CDSCs, received by the Distributor for distributing Fund shares were $71,710 for Class A and $968 for Class C shares for the year ended July 31, 2015.
Expenses Waived/Reimbursed by the Investment Manager and its Affiliates
The Fund's expense ratio is subject to an expense reimbursement arrangement pursuant to which fees will be waived and/or expenses reimbursed (excluding certain fees and expenses described below), so that the Fund's net operating expenses, after giving effect to fees waived/expenses reimbursed and any balance credits and/or overdraft charges from the Fund's custodian, do not exceed the annual rates of:
| | | Voluntary
Expense Cap
Effective
December 1, 2014 | | Contractual
Expense Cap
Prior to
December 1, 2014 | |
Class A | | | 0.84 | % | | | 0.81 | % | |
Class B | | | 1.59 | | | | 1.56 | | |
Class C | | | 1.59 | | | | 1.56 | | |
Class R4 | | | 0.59 | | | | 0.56 | | |
Class R5 | | | 0.55 | | | | 0.53 | | |
Class Z | | | 0.59 | | | | 0.56 | | |
The voluntary expense cap arrangement may be revised or discontinued at any time. Under the arrangements, the following fees and expenses are excluded from the waiver/reimbursement commitment, and therefore will be paid by the Fund, if applicable: taxes (including foreign transaction taxes), expenses associated with investments in affiliated and non-affiliated pooled investment vehicles (including mutual funds and exchange-traded funds), transaction costs and brokerage commissions, costs
Annual Report 2015
30
COLUMBIA AMT-FREE OREGON INTERMEDIATE MUNI BOND FUND
NOTES TO FINANCIAL STATEMENTS (continued)
July 31, 2015
related to any securities lending program, dividend and interest expenses associated with securities sold short, inverse floater program fees and expenses, transaction charges and interest on borrowed money, interest and extraordinary expenses. Any fees waived and/or expenses reimbursed under the expense reimbursement arrangements described above are not recoverable by the Investment Manager or its affiliates in future periods. Class C distribution fees waived by the Distributor, as discussed above, are in addition to the waiver/ reimbursement commitment under the agreement.
Note 4. Federal Tax Information
The timing and character of income and capital gain distributions are determined in accordance with income tax regulations, which may differ from GAAP because of temporary or permanent book to tax differences.
At July 31, 2015, these differences are primarily due to differing treatment for capital loss carryforwards, principal and/or interest from fixed income securities, Trustees' deferred compensation and distributions.
The Fund did not have any permanent differences; therefore, no reclassifications were made to the Statement of Assets and Liabilities.
The tax character of distributions paid during the years indicated was as follows:
Year Ended July 31, | | 2015 | | 2014 | |
Ordinary income | | $ | — | | | $ | 9,568 | | |
Tax-exempt income | | | 13,059,661 | | | | 13,209,023 | | |
Long-term capital gains | | | — | | | | 728 | | |
Total | | | 13,059,661 | | | | 13,219,319 | | |
Short-term capital gain distributions, if any, are considered ordinary income distributions for tax purposes.
At July 31, 2015, the components of distributable earnings on a tax basis were as follows:
Undistributed tax-exempt income | | $ | 1,426,447 | | |
Capital loss carryforwards | | | (1,378,898 | ) | |
Net unrealized appreciation | | | 25,226,673 | | |
At July 31, 2015, the cost of investments for federal income tax purposes was $420,181,605 and the aggregate gross unrealized appreciation and depreciation based on that cost was:
Unrealized appreciation | | $ | 26,221,289 | | |
Unrealized depreciation | | | (994,616 | ) | |
Net unrealized appreciation | | | 25,226,673 | | |
The following capital loss carryforwards, determined at July 31, 2015, may be available to reduce taxable income arising from future net realized gains on investments, if any, to the extent permitted by the Internal Revenue Code:
Year of Expiration | | Amount ($) | |
No expiration — short-term | | | 1,378,898 | | |
For the year ended July 31, 2015, $1,121,220 of capital loss carryforward was utilized.
Management of the Fund has concluded that there are no significant uncertain tax positions in the Fund that would require recognition in the financial statements. However, management's conclusion may be subject to review and adjustment at a later date based on factors including, but not limited to, new tax laws, regulations, and administrative interpretations (including relevant court decisions). Generally, the Fund's federal tax returns for the prior three fiscal years remain subject to examination by the Internal Revenue Service.
Note 5. Portfolio Information
The cost of purchases and proceeds from sales of securities, excluding short-term investments and derivatives, if any, aggregated to $65,375,091 and $49,304,719, respectively, for the year ended July 31, 2015. The amount of purchase and sale activity impacts the portfolio turnover rate reported in the Financial Highlights.
Note 6. Shareholder Concentration
At July 31, 2015, one unaffiliated shareholder of record owned 15.9% of the outstanding shares of the Fund in one or more accounts. The Fund has no knowledge about whether any portion of those shares was owned beneficially. Subscription and redemption activity by concentrated accounts may have a significant effect on the operations of the Fund.
Note 7. Line of Credit
The Fund has entered into a revolving credit facility with a syndicate of banks led by JPMorgan Chase Bank, N.A. whereby the Fund may borrow for the temporary funding of shareholder redemptions or for other temporary or emergency purposes. Pursuant to a December 9, 2014 amendment, the credit facility agreement, which is a collective agreement between the Fund and certain other funds managed by the Investment Manager, severally and not jointly, permits collective borrowings up to $550 million. Interest is charged to each participating fund based on its borrowings at a rate equal to the higher of (i) the overnight federal funds rate plus 1.00% or
Annual Report 2015
31
COLUMBIA AMT-FREE OREGON INTERMEDIATE MUNI BOND FUND
NOTES TO FINANCIAL STATEMENTS (continued)
July 31, 2015
(ii) the one-month LIBOR rate plus 1.00%. Each borrowing under the credit facility matures no later than 60 days after the date of borrowing. The Fund also pays a commitment fee equal to its pro rata share of the amount of the credit facility at a rate of 0.075% per annum. The commitment fee is included in other expenses in the Statement of Operations. Prior to the December 9, 2014 amendment, the credit facility agreement permitted borrowings up to $500 million under the same terms and interest rates as described above.
The Fund had no borrowings during the year ended July 31, 2015.
Note 8. Significant Risks
Credit Risk
Credit risk is the risk that the value of debt securities in the Fund's portfolio may decline because the issuer may default and fail to pay interest or repay principal when due. Rating agencies assign credit ratings to debt securities to indicate their credit risk. Lower rated or unrated debt securities held by the Fund may present increased credit risk as compared to higher-rated debt securities.
Interest Rate Risk
Interest rate risk is the risk of losses attributable to changes in interest rates. In general, if prevailing interest rates rise, the values of debt securities tend to fall, and if interest rates fall, the values of debt securities tend to rise. Actions by governments and central banking authorities can result in increases in interest rates. Increasing interest rates may negatively affect the value of debt securities held by the Fund, resulting in a negative impact on the Fund's performance and net asset value per share. In general, the longer the maturity or duration of a debt security, the greater its sensitivity to changes in interest rates.
Liquidity Risk
Liquidity risk is the risk associated with a lack of marketability of investments which may make it difficult to sell the investment at a desirable time or price. Changing regulatory, market or other conditions or environments (for example, the interest rate or credit environments) may adversely affect the liquidity of the Fund's investments. The Fund may have to accept a lower selling price for the holding, sell other investments, or forego another, more appealing investment opportunity. Generally, the less liquid the market at the time the Fund sells a portfolio investment, the greater the risk of loss or decline of value to the Fund. A less
liquid market can lead to an increase in Fund redemptions, which may negatively impact Fund performance and net asset value per share, including, for example, if the Fund is forced to sell securities in a down market.
Geographic Concentration Risk
Because the Fund invests substantially in municipal securities issued by the state identified in the Fund's name and political sub-division of that state, the Fund will be particularly affected by the adverse tax, legislative, regulatory, demographic or political changes as well as changes impacting the state's financial, economic or other condition and prospects. In addition, because of the relatively small number of issuers of tax-exempt securities in the state, the Fund may invest a higher percentage of assets in a single issuer and, therefore, be more exposed to the risk of loss than a fund that invests more broadly. The value of municipal and other securities owned by the Fund also may be adversely affected by future changes in federal or state income tax laws.
Note 9. Subsequent Events
Management has evaluated the events and transactions that have occurred through the date the financial statements were issued and noted no items requiring adjustment of the financial statements or additional disclosure.
Note 10. Information Regarding Pending and Settled Legal Proceedings
In December 2005, without admitting or denying the allegations, American Express Financial Corporation (AEFC, which is now known as Ameriprise Financial, Inc. (Ameriprise Financial)) entered into settlement agreements with the Securities and Exchange Commission (SEC) and Minnesota Department of Commerce (MDOC) related to market timing activities. As a result, AEFC was censured and ordered to cease and desist from committing or causing any violations of certain provisions of the Investment Advisers Act of 1940, the Investment Company Act of 1940, and various Minnesota laws. AEFC agreed to pay disgorgement of $10 million and civil money penalties of $7 million. AEFC also agreed to retain an independent distribution consultant to assist in developing a plan for distribution of all disgorgement and civil penalties ordered by the SEC in accordance with various undertakings detailed at http://www.sec.gov/litigation/admin/ia-2451.pdf. Ameriprise Financial and its affiliates have cooperated with the SEC and the MDOC in these legal proceedings,
Annual Report 2015
32
COLUMBIA AMT-FREE OREGON INTERMEDIATE MUNI BOND FUND
NOTES TO FINANCIAL STATEMENTS (continued)
July 31, 2015
and have made regular reports to the Funds' Boards of Trustees.
Ameriprise Financial and certain of its affiliates have historically been involved in a number of legal, arbitration and regulatory proceedings, including routine litigation, class actions, and governmental actions, concerning matters arising in connection with the conduct of their business activities. Ameriprise Financial believes that the Funds are not currently the subject of, and that neither Ameriprise Financial nor any of its affiliates are the subject of, any pending legal, arbitration or regulatory proceedings that are likely to have a material adverse effect on the Funds or the ability of Ameriprise Financial or its affiliates to perform under their contracts with the Funds. Ameriprise Financial is required to make quarterly (10-Q), annual (10-K) and, as necessary, 8-K filings with the SEC on legal and regulatory matters that relate to Ameriprise Financial and its affiliates. Copies of these filings may be obtained by accessing the SEC website at www.sec.gov.
There can be no assurance that these matters, or the adverse publicity associated with them, will not result in increased fund redemptions, reduced sale of fund shares or other adverse consequences to the Funds. Further, although we believe proceedings are not likely to have a material adverse effect on the Funds or the ability of Ameriprise Financial or its affiliates to perform under their contracts with the Funds, these proceedings are subject to uncertainties and, as such, we are unable to estimate the possible loss or range of loss that may result. An adverse outcome in one or more of these proceedings could result in adverse judgments, settlements, fines, penalties or other relief that could have a material adverse effect on the consolidated financial condition or results of operations of Ameriprise Financial.
Annual Report 2015
33
COLUMBIA AMT-FREE OREGON INTERMEDIATE MUNI BOND FUND
REPORT OF INDEPENDENT REGISTERED PUBLIC ACCOUNTING FIRM
To the Trustees of Columbia Funds Series Trust I and the Shareholders of
Columbia AMT-Free Oregon Intermediate Muni Bond Fund
In our opinion, the accompanying statement of assets and liabilities, including the portfolio of investments, and the related statements of operations and of changes in net assets and the financial highlights present fairly, in all material respects, the financial position of Columbia AMT-Free Oregon Intermediate Muni Bond Fund (the "Fund," a series of Columbia Funds Series Trust I) at July 31, 2015, and the results of its operations, the changes in its net assets and the financial highlights for each of the periods indicated, in conformity with accounting principles generally accepted in the United States of America. These financial statements and financial highlights (hereafter referred to as "financial statements") are the responsibility of the Fund's management. Our responsibility is to express an opinion on these financial statements based on our audits. We conducted our audits of these financial statements in accordance with the standards of the Public Company Accounting Oversight Board (United States). Those standards require that we plan and perform the audit to obtain reasonable assurance about whether the financial statements are free of material misstatement. An audit includes examining, on a test basis, evidence supporting the amounts and disclosures in the financial statements, assessing the accounting principles used and significant estimates made by management, and evaluating the overall financial statement presentation. We believe that our audits, which included confirmation of securities at July 31, 2015 by correspondence with the custodian and brokers, provide a reasonable basis for our opinion.
PricewaterhouseCoopers LLP
Minneapolis, MN
September 21, 2015
Annual Report 2015
34
COLUMBIA AMT-FREE OREGON INTERMEDIATE MUNI BOND FUND
FEDERAL INCOME TAX INFORMATION
(Unaudited)
The Fund hereby designates the following tax attributes for the fiscal year ended July 31, 2015. Shareholders will be notified in early 2016 of the amounts for use in preparing 2015 income tax returns.
Tax Designations:
| Exempt-Interest Dividends | | | 100.00 | % | |
Exempt-Interest Dividends. The percentage of net investment income distributed during the fiscal year that qualifies as exempt-interest dividends for federal income tax purposes.
Annual Report 2015
35
COLUMBIA AMT-FREE OREGON INTERMEDIATE MUNI BOND FUND
The Trustees serve terms of indefinite duration. The names and birth years of the Trustees and Officers of the Funds in Columbia Funds Series Trust I, the year each was first elected or appointed to office, their principal business occupations during at least the last five years, the number of Funds overseen by each Trustee and other directorships they hold are shown below. Each officer listed below serves as an officer of each Fund in Columbia Funds Series Trust I. The mailing address of each Trustee is: c/o Columbia Management Investment Advisers, LLC, 225 Franklin Street, Mail Drop BX32 05228, Boston, MA 02110.
Independent Trustees
Name, Year of Birth
and Position Held
with the Trust | | Year First
Appointed or
Elected as
Trustee to any
Fund Currently
in the Columbia
Funds Complex
or a Predecessor
Thereof | | Principal Occupation(s)
during the Past Five Years | | Number
of Funds
in the
Columbia
Funds
Complex
Overseen | | Other Directorships
Held by Trustee During
the Past Five Years | |
Janet Langford Carrig
(Born 1957)
Trustee | | | 1996 | | | Senior Vice President, General Counsel and Corporate Secretary, ConocoPhillips (integrated energy company) since September 2007; Deputy General Counsel — Corporate Legal Services, ConocoPhillips from August 2006 to August 2007; Partner, Zelle, Hofmann, Voelbel, Mason & Gette LLP (law firm) from March 2005 to July 2006; Adjunct Professor of Law, Northwestern University from September 2004 to June 2006; Director, UAL Corporation (airline) from February 2006 to July 2006; Chief Administrative Officer and Senior Vice President, Kmart Holding Corporation (consumer goods) from September 2003 to March 2004 | | | 60 | | | None | |
Douglas A. Hacker
(Born 1955)
Trustee and Chairman
of the Board | | | 1996 | | | Independent business executive since May 2006; Executive Vice President — Strategy of United Airlines from December 2002 to May 2006; President of UAL Loyalty Services (airline marketing company) from September 2001 to December 2002; Executive Vice President and Chief Financial Officer of United Airlines from July 1999 to September 2001 | | | 60 | | | Spartan Nash Company, (food distributor); Nash Finch Company (food distributor) from 2005 to 2013; Aircastle Limited (aircraft leasing); SeaCube Container Leasing Ltd. (container leasing) from 2010 to 2013; and Travelport Worldwide Limited (travel information technology) | |
Nancy T. Lukitsh
(Born 1956)
Trustee | | | 2011 | | | Senior Vice President, Partner and Director of Marketing, Wellington Management Company, LLP (investment adviser) from 1997 to 2010; Chair, Wellington Management Investment Portfolios (commingled non-U.S. investment pools) from 2007 to 2010; Director, Wellington Trust Company, NA and other Wellington affiliates from 1997 to 2010 | | | 60 | | | None | |
William E. Mayer
(Born 1940)
Trustee | | | 1991 | | | Partner, Park Avenue Equity Partners (private equity) since February 1999 | | | 60 | | | DynaVox Inc. (speech creation); Lee Enterprises (print media); WR Hambrecht + Co. (financial service provider) from 2000 to 2012; BlackRock Kelso Capital Corporation (investment company); and Premier, Inc. (healthcare) | |
Annual Report 2015
36
COLUMBIA AMT-FREE OREGON INTERMEDIATE MUNI BOND FUND
TRUSTEES AND OFFICERS (continued)
Independent Trustees (continued)
Name, Year of Birth
and Position Held
with the Trust | | Year First
Appointed or
Elected as
Trustee to any
Fund Currently
in the Columbia
Funds Complex
or a Predecessor
Thereof | | Principal Occupation(s)
during the Past Five Years | | Number
of Funds
in the
Columbia
Funds
Complex
Overseen | | Other Directorships
Held by Trustee During
the Past Five Years | |
David M. Moffett
(Born 1952)
Trustee | | | 2011 | | | Retired. Consultant to Bridgewater and Associates; Chief Executive Officer, Federal Home Loan Mortgage Corporation, from 2008 to 2009; Senior Adviser, Global Financial Services Group, Carlyle Group, Inc., from 2007 to 2008; Vice Chairman and Chief Financial Officer, U.S. Bancorp, from 1993 to 2007 | | | 60 | | | Building Materials Holding Corp. (building materials and construction services); CIT Group Inc. (commercial and consumer finance); eBay Inc. (online trading community); E.W. Scripps Co. (print and television media); Genworth Financial, Inc. (financial and insurance products and services); MBIA Inc. (financial service provider); Paypal Holdings Inc. (payment and data processing services); and University of Oklahoma Foundation | |
Charles R. Nelson
(Born 1942)
Trustee | | | 1981 | | | Retired. Professor Emeritus, University of Washington since 2011; Professor of Economics, University of Washington from 1976 to 2011; Ford and Louisa Van Voorhis Professor of Political Economy, University of Washington from 1993 to 2011; Adjunct Professor of Statistics, University of Washington from 1980 to 2011; Associate Editor, Journal of Money, Credit and Banking from September 1993 to 2008; consultant on econometric and statistical matters | | | 60 | | | None | |
John J. Neuhauser
(Born 1943)
Trustee | | | 1984 | | | President, Saint Michael's College since August 2007; Director or Trustee of several non-profit organizations, including Fletcher Allen Health Care, Inc.; Academic Vice President and Dean of Faculties, Boston College from August 1999 to October 2005; University Professor, Boston College from November 2005 to August 2007 | | | 60 | | | Liberty All-Star Equity Fund and Liberty All-Star Growth Fund (closed-end funds) | |
Patrick J. Simpson
(Born 1944)
Trustee | | | 2000 | | | Partner, Perkins Coie LLP (law firm) | | | 60 | | | None | |
Anne-Lee Verville
(Born 1945)
Trustee | | | 1998 | | | Retired. General Manager, Global Education Industry from 1994 to 1997, President — Application Systems Division from 1991 to 1994, Chief Financial Officer — US Marketing & Services from 1988 to 1991, and Chief Information Officer from 1987 to 1988, IBM Corporation (computer and technology) | | | 60 | | | Enesco Group, Inc. (producer of giftware and home and garden decor products) from 2001 to 2006 | |
Annual Report 2015
37
COLUMBIA AMT-FREE OREGON INTERMEDIATE MUNI BOND FUND
TRUSTEES AND OFFICERS (continued)
Interested Trustee Affiliate with Investment Manager*
Name, Year of Birth
and Position Held
with the Trust | | Year First
Appointed or
Elected as
Trustee to any
Fund Currently
in the Columbia
Funds Complex
or a Predecessor
Thereof | | Principal Occupation(s)
during the Past Five Years | | Number
of Funds
in the
Columbia
Funds
Complex
Overseen | | Other Directorships
Held by Trustee During
the Past Five Years | |
William F. Truscott
(Born 1960)
Trustee | | | 2012 | | | Chairman of the Board and President, Columbia Management Investment Advisers, LLC since May 2010 and February 2012, respectively (previously President and Chief Investment Officer, 2001-April 2010); Chief Executive Officer, Global Asset Management, Ameriprise Financial, Inc. since September 2012 (previously Chief Executive Officer, U.S. Asset Management & President, Annuities, May 2010-September 2012 and President — U.S. Asset Management and Chief Investment Officer, 2005-April 2010); Director and Chief Executive Officer, Columbia Management Investment Distributors, Inc. since May 2010 and February 2012, respectively (previously Chairman of the Board and Chief Executive Officer, 2006-April 2010); Chairman of the Board and Chief Executive Officer, RiverSource Distributors, Inc. since 2006; Director, Threadneedle Asset Management Holdings, SARL since 2014; President and Chief Executive Officer, Ameriprise Certificate Company, 2006-August 2012 | | | 187 | | | Chairman of the Board, Columbia Management Investment Advisers, LLC since May 2010; Director, Columbia Management Investment Distributors, Inc. since May 2010; Director, Ameriprise Certificate Company, 2006 to January 2013 | |
* Interested person (as defined under the 1940 Act) by reason of being an officer, director, security holder and/or employee of the Investment Manager or Ameriprise Financial.
The Statement of Additional Information has additional information about the Fund's Board members and is available, without charge, upon request by calling 800.345.6611; contacting your financial intermediary; or visiting columbiathreadneedle.com/us.
The Board has appointed officers who are responsible for day-to-day business decisions based on policies it has established. The officers serve at the pleasure of the Board. In addition to Mr. Truscott, who is Senior Vice President, the Funds' other officers are:
Fund Officers
Name,
Address and
Year of Birth | | Position and Year
First Appointed to
Position for any Fund
in the Columbia
Funds Complex or a
Predecessor Thereof | | Principal Occupation(s) During Past Five Years | |
Christopher O. Petersen
5228 Ameriprise
Financial Center
Minneapolis, MN 55474
Born 1970 | | President and Principal Executive Officer (2015) | | Vice President and Lead Chief Counsel, Ameriprise Financial, Inc. since January 2015 (previously, Vice President and Chief Counsel January 2010-December 2014; and Vice President and Group Counsel or Counsel 2004- January 2010); officer of Columbia Funds and affiliated funds since 2007. | |
Michael G. Clarke
225 Franklin Street
Boston, MA 02110
Born 1969 | | Treasurer (2011) and Chief Financial Officer (2009) | | Vice President — Mutual Fund Administration, Columbia Management Investment Advisers, LLC, since May 2010; Managing Director of Fund Administration, Columbia Management Advisors, LLC, September 2004-April 2010; senior officer of Columbia Funds and affiliated funds since 2002. | |
Annual Report 2015
38
COLUMBIA AMT-FREE OREGON INTERMEDIATE MUNI BOND FUND
TRUSTEES AND OFFICERS (continued)
Fund Officers (continued)
Name,
Address and
Year of Birth | | Position and Year
First Appointed to
Position for any Fund
in the Columbia
Funds Complex or a
Predecessor Thereof | | Principal Occupation(s) During Past Five Years | |
Paul B. Goucher
100 Park Avenue
New York, NY 10017
Born 1968 | | Senior Vice President (2011), Chief Legal Officer (2015) and Assistant Secretary (2008) | | Vice President and Lead Chief Counsel, Ameriprise Financial, Inc. since November 2008 and January 2013, respectively (previously Chief Counsel, January 2010-January 2013 and Group Counsel, November 2008-January 2010). | |
Thomas P. McGuire
225 Franklin Street
Boston, MA 02110
Born 1972 | | Vice President and Chief Compliance Officer (2012) | | Vice President — Asset Management Compliance, Ameriprise Financial, Inc., since May 2010; Chief Compliance Officer, Ameriprise Certificate Company since September 2010; Compliance Executive, Bank of America, 2005-April 2010. | |
Colin Moore
225 Franklin Street
Boston, MA 02110
Born 1958 | | Senior Vice President (2010) | | Executive Vice President and Global Chief Investment Officer, Ameriprise Financial, Inc., since July 2013; Director and Global Chief Investment Officer, Columbia Management Investment Advisers, LLC since May 2010; Manager, Managing Director and Chief Investment Officer, Columbia Management Advisors, LLC, 2007-April 2010. | |
Michael E. DeFao
225 Franklin Street
Boston, MA 02110
Born 1968 | | Vice President (2011) and Assistant Secretary (2010) | | Vice President and Chief Counsel, Ameriprise Financial, Inc. since May 2010; Associate General Counsel, Bank of America, 2005-April 2010. | |
Joseph F. DiMaria
225 Franklin Street
Boston, MA 02110
Born 1968 | | Vice President (2011), Assistant Treasurer (2012) and Chief Accounting Officer (2008) | | Vice President — Mutual Fund Treasurer, Columbia Management Investment Advisers, LLC since May 2010; Director of Fund Administration, Columbia Management Advisors, LLC, 2006-April 2010. | |
Amy Johnson
5228 Ameriprise
Financial Center
Minneapolis, MN 55474
Born 1965 | | Vice President (2006) | | Managing Director and Chief Operating Officer, Columbia Management Investment Advisers, LLC since May 2010 (previously Chief Administrative Officer, 2009-April 2010, and Vice President — Asset Management and Trust Company Services, 2006-2009). | |
Lyn Kephart-Strong
5228 Ameriprise
Financial Center
Minneapolis, MN 55474
Born 1960 | | Vice President (2015) | | President, Columbia Management Investment Services Corp. since October 2014; Vice President & Resolution Officer, Ameriprise Trust Company since August 2009; President, RiverSource Service Corporation 2004-2010. | |
Ryan C. Larrenaga
225 Franklin Street
Boston, MA 02110
Born 1970 | | Vice President and Secretary (2015) | | Vice President and Group Counsel, Ameriprise Financial, Inc. since August 2011 (previously, Counsel from May 2010 to August 2011); Assistant General Counsel, Bank of America, 2005-April 2010; officer of Columbia Funds and affiliated funds since 2005. | |
Annual Report 2015
39
COLUMBIA AMT-FREE OREGON INTERMEDIATE MUNI BOND FUND
BOARD CONSIDERATION AND APPROVAL OF ADVISORY AGREEMENT
On June 10, 2015, the Board of Trustees (the Board) and the Trustees who are not interested persons (as defined in the Investment Company Act of 1940) (the Independent Trustees) of Columbia Funds Series Trust I (the Trust) unanimously approved the continuation of the Investment Management Services Agreement (the Advisory Agreement) with Columbia Management Investment Advisers, LLC (the Investment Manager) with respect to Columbia AMT-Free Oregon Intermediate Muni Bond Fund (the Fund), a series of the Trust. The Board and the Independent Trustees also unanimously approved an agreement (the Management Agreement and, together with the Advisory Agreement, the Agreements) combining the Advisory Agreement and the Fund's existing administrative services agreement (the Administrative Services Agreement) in a single agreement. The Board and the Independent Trustees approved the restatement of the Advisory Agreement with the Management Agreement to be effective for the Fund on December 1, 2015, the Fund's next annual prospectus update. As detailed below, the Board's Advisory Fees and Expenses Committee (the Committee) and the Board met on multiple occasions to review and discuss, both among themselves and with the management team of the Investment Manager, materials provided by the Investment Manager and others before determining to approve the Management Agreement and the continuation of the Advisory Agreement.
In connection with their deliberations regarding the approval of the Management Agreement and the continuation of the Advisory Agreement, the Committee and the Board evaluated materials requested from the Investment Manager regarding the Fund and the Agreements, and discussed these materials with representatives of the Investment Manager at Committee meetings held on March 3, 2015, April 29, 2015 and June 9, 2015 and at Board meetings held on March 4, 2015 and June 10, 2015. In addition, the Board considers matters bearing on the Agreements at most of its other meetings throughout the year and meets regularly with senior management of the Trust and the Investment Manager. Through the Board's Investment Oversight Committees, Trustees also meet with selected portfolio managers of the funds the Trustees oversee and other investment personnel at various times throughout the year. The Committee and the Board also consulted with its independent fee consultant, Fund counsel and with the Independent Trustees' independent legal counsel, who advised on various matters with respect to the Committee's and the Board's considerations and otherwise assisted the Committee and the Board in their deliberations. On June 9, 2015, the Committee recommended that the Board approve the Management Agreement and the continuation of the Advisory Agreement. On June 10, 2015, the Board, including the Independent Trustees, voting separately, unanimously approved the Management Agreement and the continuation of the Advisory Agreement for the Fund.
The Committee and the Board considered all information that they, their legal counsel or the Investment Manager believed reasonably necessary to evaluate and to determine whether to approve the Management Agreement and the continuation of the Advisory Agreement. The information and factors considered by the Committee and the Board in recommending for approval or approving the Management Agreement and the continuation of the Advisory Agreement for the Fund included the following:
• Information on the investment performance of the Fund relative to the performance of a group of mutual funds determined to be comparable to the Fund by an independent third-party data provider, as well as performance relative to benchmarks;
• Information on the Fund's advisory fees and total expenses, including information comparing the Fund's expenses to those of a group of comparable mutual funds, as determined by the independent third-party data provider;
• The Investment Manager's agreement to contractually limit or cap total operating expenses for the Fund so that total operating expenses (excluding certain fees and expenses, such as portfolio transaction costs and certain other investment related expenses, interest, taxes, acquired fund fees and expenses, and extraordinary expenses) would not exceed a specified percentage of the Fund's average annual net assets from December 1, 2015 through November 30, 2016;
Annual Report 2015
40
COLUMBIA AMT-FREE OREGON INTERMEDIATE MUNI BOND FUND
BOARD CONSIDERATION AND APPROVAL OF ADVISORY AGREEMENT (continued)
• The terms and conditions of the Agreements;
• The current and proposed terms and conditions of other agreements and arrangements with affiliates of the Investment Manager relating to the operations of the Fund, including the Administrative Services Agreement1 and agreements with respect to the provision of distribution and transfer agency services to the Fund;
• Descriptions of various functions performed by the Investment Manager under the Agreements, including portfolio management and portfolio trading practices;
• Information regarding the management fees and investment performance of similarly-managed portfolios of other clients of the Investment Manager, including institutional separate accounts;
• Information regarding the reputation, regulatory history and resources of the Investment Manager, including information regarding senior management, portfolio managers and other personnel;
• Information regarding the capabilities of the Investment Manager with respect to compliance monitoring services, including an assessment of the Investment Manager's compliance system by the Fund's Chief Compliance Officer; and
• The profitability to the Investment Manager and its affiliates from their relationships with the Fund.
Nature, Extent and Quality of Services Provided under the Agreements
The Committee and the Board considered the nature, extent and quality of services provided to the Fund by the Investment Manager and its affiliates under the Agreements and under separate agreements for the provision of transfer agency and administrative services, and the resources dedicated to the Fund and the other Columbia Funds by the Investment Manager and its affiliates. The Committee and the Board also determined that the nature and level of the services to be provided under the Management Agreement would not decrease relative to the services provided under the Advisory Agreement and the Administrative Services Agreement. The Committee and the Board considered, among other things, the Investment Manager's ability to attract, motivate and retain highly qualified research, advisory and supervisory investment professionals (including personnel and other resources, compensation programs for personnel involved in fund management, reputation and other attributes), the portfolio management services provided by those investment professionals, and the quality of the Investment Manager's investment research capabilities and trade execution services. The Committee and the Board also considered the potential benefits to shareholders of investing in a mutual fund that is part of a fund complex offering exposure to a variety of asset classes and investment disciplines and providing a variety of fund and shareholder services.
The Committee and the Board also considered the professional experience and qualifications of the senior personnel of the Investment Manager, which included consideration of the Investment Manager's experience with similarly-structured funds. The Committee and the Board noted the compliance programs of and the compliance-related resources provided to the Fund by the Investment Manager and its affiliates, and considered the Investment Manager's ability to provide administrative services to the Fund and coordinate the activities of the Fund's other service providers. In evaluating the nature, extent and quality of services provided under the Agreements, the Committee and the Board considered that these services were provided to the Fund, rather than directly to Fund shareholders. The Committee and the Board accordingly affirmed, after considering various other matters, including the potential benefits to the Fund and its shareholders of the Independent Trustees' important role as pre-suit gatekeepers with respect to claims that they may determine are meritless or contrary to the Fund's best interests, that it was not the intention of the Board or the Investment Manager that there be any third-party beneficiaries of the Agreements. After reviewing these and related factors, the Committee and the Board concluded, within the context of their overall conclusions, that the nature, extent and quality of the services provided to the Fund under the Agreements supported the approval of the Management Agreement and the continuation of the Advisory Agreement.
1 Like the Advisory Agreement, the Administrative Services Agreement will terminate with respect to the Fund once the Management Agreement is effective for the Fund.
Annual Report 2015
41
COLUMBIA AMT-FREE OREGON INTERMEDIATE MUNI BOND FUND
BOARD CONSIDERATION AND APPROVAL OF ADVISORY AGREEMENT (continued)
Investment Performance
The Committee and the Board reviewed information about the performance of the Fund over various time periods, including performance information relative to benchmarks and information based on reports of the independent third-party data provider that compared the performance of the Fund to the performance of a group of comparable mutual funds, and data provided by the independent fee consultant. The Committee and the Board also reviewed a description of the third party's methodology for identifying the Fund's peer groups for purposes of performance and expense comparisons.
The Committee and the Board noted that, through December 31, 2014, the Fund's performance was in the thirtieth, thirtieth and thirty-sixth percentile (where the best performance would be in the first percentile) of its category selected by the independent third-party data provider for the purposes of performance comparisons for the one-, three- and five-year periods, respectively.
The Committee and the Board also considered the Investment Manager's performance and reputation generally, the Investment Manager's historical responsiveness to Board concerns about performance, and the Investment Manager's willingness to take steps intended to improve performance. After reviewing these and related factors, the Committee and the Board concluded, within the context of their overall conclusions, that the performance of the Fund was sufficient, in light of other considerations, to warrant the continuation of the Advisory Agreement and the approval of the Management Agreement.
Investment Advisory Fee Rates and Other Expenses
The Committee and the Board considered the advisory fees charged to the Fund under the Advisory Agreement as well as the total expenses incurred by the Fund. In assessing the reasonableness of the fees under the Advisory Agreement, the Committee and the Board considered, among other information, the Fund's advisory fee and its total expense ratio as a percentage of average daily net assets. The Committee and the Board also considered that the proposed management fee would not exceed the sum of the fee rates payable under the Advisory Agreement and the Administrative Services Agreement. The Committee and the Board considered data provided by the independent fee consultant. The Committee and the Board noted that, as of December 31, 2014, the Fund's actual management fee and net expense ratio are both ranked in the 3rd quintile (where the lowest fees and expenses would be in the first quintile) against the Fund's expense universe as determined by the independent third-party data provider for purposes of expense comparison. The Committee and the Board also took into account the fee waiver and expense limitation arrangements agreed to by the Investment Manager, as noted above.
The Committee and the Board also received and considered information about the advisory fees charged by the Investment Manager to institutional separate accounts. In considering the fees charged to those accounts, the Committee and the Board took into account, among other things, the Investment Manager's representations about the differences between managing mutual funds as compared to other types of accounts, including differences in the services provided, differences in the risk profile of such business for the Investment Manager and the additional resources required to manage mutual funds effectively. The Committee and the Board also received and considered information about the fees charged by the Investment Manager for sub-advisory services provided to comparable unaffiliated funds. In evaluating the Fund's advisory fees, the Committee and the Board also took into account the demands, complexity and quality of the investment management of the Fund.
After reviewing these and related factors, the Committee and the Board concluded, within the context of their overall conclusions, that the advisory/management fee rates and expenses of the Fund were sufficient, in light of other considerations, to warrant the approval of the Management Agreement and continuation of the Advisory Agreement.
Costs of Services Provided and Profitability
The Committee and the Board also took note of the costs the Investment Manager and its affiliates incur in connection with the services provided (both on an absolute and relative basis) and the profitability to the Investment Manager and its affiliates in connection with their relationships with the Fund.
Annual Report 2015
42
COLUMBIA AMT-FREE OREGON INTERMEDIATE MUNI BOND FUND
BOARD CONSIDERATION AND APPROVAL OF ADVISORY AGREEMENT (continued)
The Committee and the Board also considered the compensation directly or indirectly received by the Investment Manager's affiliates in connection with their relationships with the Fund. The Committee and the Board reviewed information provided by management as to the profitability to the Investment Manager and its affiliates of their relationships with the Fund, information about the allocation of expenses used to calculate profitability, and comparisons of profitability levels realized in 2014 to profitability levels realized in 2013. When reviewing profitability, the Committee and the Board also considered court cases in which adviser profitability was an issue in whole or in part, the performance of similarly managed funds, the performance of the Fund, and the expense ratio of the Fund. The Committee and the Board also considered information provided by the Investment Manager regarding the Investment Manager's financial condition and comparing its profitability to that of other asset management firms that are, or are subsidiaries of, publicly traded companies.
After reviewing these and related factors, the Committee and the Board concluded, within the context of their overall conclusions, that the costs of services provided and the profitability to the Investment Manager and its affiliates from their relationships with the Fund supported the approval of the Management Agreement and the continuation of the Advisory Agreement.
Economies of Scale
The Committee and the Board considered the potential existence of economies of scale in the provision by the Investment Manager of services to the Fund, to groups of related funds, and to the Investment Manager's investment advisory clients as a whole, and whether those economies of scale were shared with the Fund through breakpoints in investment advisory fees or other means, such as expense limitation arrangements and additional investments by the Investment Manager in investment, trading and compliance resources. The Committee and the Board noted that the investment advisory and management fee schedules for the Fund contained breakpoints that would reduce the fee rate on assets above specified threshold levels.
In considering these matters, the Committee and the Board also considered the costs of the services provided and the profitability to the Investment Manager and its affiliates from their relationships with the Fund, as discussed above. After reviewing these and related factors, the Committee and the Board concluded, within the context of their overall conclusions, that the extent to which any economies of scale were expected to be shared with the Fund supported the approval of the Management Agreement and the continuation of the Advisory Agreement.
Other Benefits to the Investment Manager
The Committee and the Board received and considered information regarding "fall-out" or ancillary benefits received by the Investment Manager and its affiliates as a result of their relationships with the Fund, such as the engagement of the Investment Manager to provide administrative services to the Fund and the engagement of the Investment Manager's affiliates to provide distribution and transfer agency services to the Fund. In this regard, among other matters, the Committee and the Board considered that the Fund's distributor retains a portion of the distribution fees from the Fund and receives a portion of the sales charges on sales or redemptions of certain classes of shares of the Fund. The Committee and the Board also considered the benefits of research made available to the Investment Manager by reason of brokerage commissions generated by the Fund's securities transactions, and reviewed information about the Investment Manager's practices with respect to allocating portfolio transactions for brokerage and research services. The Committee and the Board considered the possible conflicts of interest associated with certain fall-out or other ancillary benefits and the reporting, disclosure and other processes that are in place to address such possible conflicts of interest. The Committee and the Board recognized that the Investment Manager's profitability would be somewhat lower without these benefits.
Annual Report 2015
43
COLUMBIA AMT-FREE OREGON INTERMEDIATE MUNI BOND FUND
BOARD CONSIDERATION AND APPROVAL OF ADVISORY AGREEMENT (continued)
Conclusion
The Committee and the Board reviewed all of the above considerations in reaching their decisions to recommend or approve the Management Agreement and the continuation of the Advisory Agreement. In their deliberations, the Trustees did not identify any particular information that was all-important or controlling, and individual Trustees may have attributed different weights to the various factors. Based on their evaluation of all factors that they deemed to be material, including those factors described above, and assisted by the advice of independent legal counsel, the Board, including the Independent Trustees, voting separately, unanimously approved the Management Agreement and the continuation of the Advisory Agreement.
Annual Report 2015
44
COLUMBIA AMT-FREE OREGON INTERMEDIATE MUNI BOND FUND
IMPORTANT INFORMATION ABOUT THIS REPORT
Each fund mails one shareholder report to each shareholder address. If you would like more than one report, please call shareholder services at 800.345.6611 and additional reports will be sent to you.
The policy of the Board is to vote the proxies of the companies in which each fund holds investments consistent with the procedures as stated in the Statement of Additional Information (SAI). You may obtain a copy of the SAI without charge by calling 800.345.6611; contacting your financial intermediary; visiting columbiathreadneedle.com/us; or searching the website of the Securities and Exchange Commission (SEC) at sec.gov. Information regarding how each fund voted proxies relating to portfolio securities is filed with the SEC by August 31st for the most recent 12-month period ending June 30th of that year, and is available without charge by visiting columbiathreadneedle.com/us, or searching the website of the SEC at sec.gov.
Each fund files a complete schedule of portfolio holdings with the SEC for the first and third quarters of each fiscal year on Form N-Q. Each fund's Form N-Q is available on the SEC's website at sec.gov and may be reviewed and copied at the SEC's Public Reference Room in Washington, D.C. Information on the operation of the Public Reference Room may be obtained by calling 800.SEC.0330. Each fund's complete schedule of portfolio holdings, as filed on Form N-Q, can also be obtained without charge, upon request, by calling 800.345.6611.
Annual Report 2015
45
Columbia AMT-Free Oregon Intermediate Muni Bond Fund
P.O. Box 8081
Boston, MA 02266-8081

This information is for use with concurrent or prior delivery of a fund prospectus. Please read and consider the investment objectives, risks, charges and expenses for any fund carefully before investing. For a prospectus and summary prospectus, which contains this and other important information about the Fund, go to columbiathreadneedle.com/us. The Fund is distributed by Columbia Management Investment Distributors, Inc., member FINRA, and managed by Columbia Management Investment Advisers, LLC.
Columbia Threadneedle Investments (Columbia Threadneedle) is the global brand name of the Columbia and Threadneedle group of companies.
All rights reserved. Columbia Management Investment Distributors, Inc., 225 Franklin Street, Boston, MA 02110-2804
© 2015 Columbia Management Investment Advisers, LLC.
columbiathreadneedle.com/us
ANN207_07_E01_(09/15)

ANNUAL REPORT
July 31, 2015

COLUMBIA U.S. SOCIAL BOND FUND

 Dear Shareholder,
Today's investors are typically focused on outcomes, like living a certain retirement lifestyle, paying for college education or building a legacy. But in today's complex global investment landscape, even simple goals are not easily achieved.
At Columbia Threadneedle Investments, we aspire to help satisfy five core needs of today's investors:
n Generate an appropriate stream of income in retirement
Traditional approaches to generating income may not provide the diversification benefits they once did, and they may actually introduce unwanted risk in today's market. To seek to improve your potential to live comfortably long term, we endeavor to pursue investments that explore less traveled paths to income.
n Navigate a changing interest rate environment
Today's uncertain market environment includes the prospect of a rise in interest rates. Blending traditional investments with non-traditional or alternative products may help protect your wealth during periods of volatility. We can attempt to help strengthen your portfolio with agile products designed to take on the market's ups and downs.
n Maximize after-tax returns
In an environment where what you keep may be more important than what you earn, municipal bonds can help mitigate high tax burdens while providing potentially attractive yields. Our state and federal tax-exempt products are aimed at helping investors manage risk, minimize the fluctuation of capital and grow wealth on a more tax-efficient basis.
n Grow assets to achieve financial goals
We believe that finding and protecting growth comes from a disciplined security selection process designed to create excess return. Our goal is to provide investment solutions built to help you face today's market challenges and grow your assets at each crossroad of your journey.
n Ease the impact of volatile markets
Despite a bull market run that has benefited many investors over the past several years, it's important to remember the lessons of 2008 and the value that a well-diversified portfolio may provide through times of market volatility. We are here to help you hold onto the savings you have worked tirelessly to amass, and to provide you the best opportunity to maintain your standard of living regardless of market conditions.
Find out today how we can help you confidently invest to realize your dreams. Please visit us at blog.columbiathreadneedleus.com/our-best-ideas to learn more about our unique investment solutions.
The world is constantly changing, but our priority remains the same: to help you secure your finances, meet your goals and achieve success. Thank you for your continued investment with us.
Sincerely,

Christopher O. Petersen
President, Columbia Funds
Investors should consider the investment objectives, risks, charges and expenses of a mutual fund carefully before investing. For a free prospectus and summary prospectus, which contains this and other important information about a fund, visit columbiathreadneedle.com/us. The prospectus should be read carefully before investing.
Columbia Funds are distributed by Columbia Management Investment Distributors, Inc., member FINRA, and managed by Columbia Management Investment Advisers, LLC.
© 2015 Columbia Management Investment Advisers, LLC. All rights reserved.
COLUMBIA U.S. SOCIAL BOND FUND
Portfolio Overview | | | 2 | | |
Understanding Your Fund's Expenses | | | 3 | | |
Portfolio of Investments | | | 4 | | |
Statement of Assets and Liabilities | | | 10 | | |
Statement of Operations | | | 12 | | |
Statement of Changes in Net Assets | | | 13 | | |
Financial Highlights | | | 15 | | |
Notes to Financial Statements | | | 20 | | |
Report of Independent Registered
Public Accounting Firm | | | 27 | | |
Federal Income Tax Information | | | 28 | | |
Trustees and Officers | | | 29 | | |
Board Consideration and Approval of Advisory Agreement and Subadvisory Agreement | | | 33 | | |
Important Information About This Report | | | 37 | | |
Fund Investment Manager
Columbia Management Investment
Advisers, LLC
225 Franklin Street
Boston, MA 02110
Fund Distributor
Columbia Management Investment
Distributors, Inc.
225 Franklin Street
Boston, MA 02110
Fund Transfer Agent
Columbia Management Investment
Services Corp.
P.O. Box 8081
Boston, MA 02266-8081
For more information about any of the funds, please visit columbiathreadneedle.com/us or call 800.345.6611. Customer Service Representatives are available to answer your questions Monday through Friday from 8 a.m. to 7 p.m. Eastern time.
The views expressed in this report reflect the current views of the respective parties. These views are not guarantees of future performance and involve certain risks, uncertainties and assumptions that are difficult to predict, so actual outcomes and results may differ significantly from the views expressed. These views are subject to change at any time based upon economic, market or other conditions and the respective parties disclaim any responsibility to update such views. These views may not be relied on as investment advice and, because investment decisions for a Columbia fund are based on numerous factors, may not be relied on as an indication of trading intent on behalf of any particular Columbia fund. References to specific securities should not be construed as a recommendation or investment advice.
COLUMBIA U.S. SOCIAL BOND FUND
PORTFOLIO OVERVIEW
(Unaudited)
Portfolio Management
James Dearborn
Chad Farrington, CFA
Tom Murphy, CFA
Portfolio Breakdown (%)
(at July 31, 2015) | |
Corporate Bonds & Notes | | | 8.9 | | |
Floating Rate Notes | | | 8.4 | | |
Money Market Funds | | | 5.9 | | |
Municipal Bonds | | | 76.8 | | |
Total | | | 100.0 | | |
Percentages indicated are based upon total investments. The Fund's portfolio composition is subject to change.
Quality Breakdown (%)
(at July 31, 2015) | |
AAA rating | | | 17.0 | | |
AA rating | | | 34.5 | | |
A rating | | | 29.9 | | |
BBB rating | | | 13.8 | | |
Not rated | | | 4.8 | | |
Total | | | 100.0 | | |
Percentages indicated are based upon total fixed income investments (excluding Money Market Funds).
Bond ratings apply to the underlying holdings of the Fund and not the Fund itself and are divided into categories ranging from highest to lowest credit quality, determined by using the middle rating of Moody's, S&P and Fitch, after dropping the highest and lowest available ratings. When ratings are available from only two rating agencies, the lower rating is used. When a rating is available from only one rating agency, that rating is used. When a bond is not rated by any rating agency, it is designated as "Not rated." Credit quality ratings assigned by a rating agency are subjective opinions, not statements of fact, and are subject to change, including daily. The ratings assigned by credit rating agencies are but one of the considerations that the Investment Manager and/or Fund's subadviser incorporates into its credit analysis process, along with such other issuer-specific factors as cash flows, capital structure and leverage ratios, ability to de-leverage (repay) through free cash flow, quality of management, market positioning and access to capital, as well as such security-specific factors as the terms of the security (e.g., interest rate and time to maturity) and the amount and type of any collateral.
Annual Report 2015
2
COLUMBIA U.S. SOCIAL BOND FUND
UNDERSTANDING YOUR FUND'S EXPENSES
(Unaudited)
As an investor, you incur two types of costs. There are transaction costs, which generally include sales charges on purchases and may include redemption fees. There are also ongoing costs, which generally include management fees, distribution and/or service fees, and other fund expenses. The following information is intended to help you understand your ongoing costs (in dollars) of investing in the Fund and to help you compare these costs with the ongoing costs of investing in other mutual funds.
Analyzing Your Fund's Expenses
To illustrate these ongoing costs, we have provided examples and calculated the expenses paid by investors in each share class of the Fund during the period. The actual and hypothetical information in the table is based on an initial investment of $1,000 at the beginning of the period indicated and held for the entire period. Expense information is calculated two ways and each method provides you with different information. The amount listed in the "Actual" column is calculated using the Fund's actual operating expenses and total return for the period. You may use the Actual information, together with the amount invested, to estimate the expenses that you paid over the period. Simply divide your account value by $1,000 (for example, an $8,600 account value divided by $1,000 = 8.6), then multiply the results by the expenses paid during the period under the "Actual" column. The amount listed in the "Hypothetical" column assumes a 5% annual rate of return before expenses (which is not the Fund's actual return) and then applies the Fund's actual expense ratio for the period to the hypothetical return. You should not use the hypothetical account values and expenses to estimate either your actual account balance at the end of the period or the expenses you paid during the period. See "Compare With Other Funds" below for details on how to use the hypothetical data.
Compare With Other Funds
Since all mutual funds are required to include the same hypothetical calculations about expenses in shareholder reports, you can use this information to compare the ongoing cost of investing in the Fund with other funds. To do so, compare the hypothetical example with the 5% hypothetical examples that appear in the shareholder reports of other funds. As you compare hypothetical examples of other funds, it is important to note that hypothetical examples are meant to highlight the ongoing costs of investing in a fund only and do not reflect any transaction costs, such as sales charges, or redemption or exchange fees. Therefore, the hypothetical calculations are useful in comparing ongoing costs only, and will not help you determine the relative total costs of owning different funds. If transaction costs were included in these calculations, your costs would be higher.
February 1, 2015 – July 31, 2015
| | | Account Value at the Beginning
of the Period ($) | | Account Value at the End of the
Period ($) | | Expenses Paid During the
Period ($) | | Fund's Annualized
Expense Ratio (%) | |
| | | Actual | | Hypothetical | | Actual | | Hypothetical | | Actual | | Hypothetical | | Actual | |
Class A | | | 1,000.00 | | | | 1,000.00 | | | | 996.20 | (a) | | | 1,020.94 | | | | 2.78 | (a) | | | 4.03 | | | | 0.80 | (a) | |
Class C | | | 1,000.00 | | | | 1,000.00 | | | | 994.60 | (a) | | | 1,017.70 | | | | 5.03 | (a) | | | 7.29 | | | | 1.45 | (a) | |
Class R4 | | | 1,000.00 | | | | 1,000.00 | | | | 997.10 | (a) | | | 1,022.19 | | | | 1.91 | (a) | | | 2.77 | | | | 0.55 | (a) | |
Class R5 | | | 1,000.00 | | | | 1,000.00 | | | | 996.90 | (a) | | | 1,021.94 | | | | 2.08 | (a) | | | 3.02 | | | | 0.60 | (a) | |
Class Z | | | 1,000.00 | | | | 1,000.00 | | | | 997.10 | (a) | | | 1,022.19 | | | | 1.91 | (a) | | | 2.77 | | | | 0.55 | (a) | |
(a) Based on operations from March 26, 2015 (commencement of operations) through the stated period end.
Expenses paid during the period are equal to the annualized expense ratio for each class as indicated above, multiplied by the average account value over the period and then multiplied by the number of days in the Fund's most recent fiscal half year and divided by 365.
Expenses do not include fees and expenses incurred indirectly by the Fund from its investment in underlying funds, including affiliated and non-affiliated pooled investment vehicles, such as mutual funds and exchange-traded funds.
Had Columbia Management Investment Advisers, LLC and/or certain of its affiliates not waived/reimbursed certain fees and expenses, account value at the end of the period would have been reduced.
Annual Report 2015
3
COLUMBIA U.S. SOCIAL BOND FUND
PORTFOLIO OF INVESTMENTS
July 31, 2015
(Percentages represent value of investments compared to net assets)
Municipal Bonds 80.5%
Issue
Description | | Coupon
Rate | | Principal
Amount ($) | |
Value ($) | |
ALABAMA 2.9% | |
Birmingham Water Works Board
Revenue Bonds
Series 2015B
01/01/31 | | | 5.000 | % | | | 250,000 | | | | 281,995 | | |
Butler County Board of Education
Refunding Revenue Bonds
Series 2015 (AGM)
07/01/26 | | | 5.000 | % | | | 250,000 | | | | 289,972 | | |
Total | | | | | | | 571,967 | | |
ARIZONA 1.5% | |
Pinal County Union High School District No. 82 Casa Grande
Unlimited General Obligation Refunding Bonds
Series 2015 (AGM)
07/01/26 | | | 5.000 | % | | | 250,000 | | | | 293,668 | | |
CALIFORNIA 18.6% | |
California Municipal Finance Authority
Refunding Revenue Bonds
Community Medical Centers
Series 2015A
02/01/22 | | | 5.000 | % | | | 215,000 | | | | 246,515 | | |
Harbor Regional Center Project
Series 2015
11/01/24 | | | 5.000 | % | | | 250,000 | | | | 290,843 | | |
Revenue Bonds
NorthBay Healthcare Group
Series 2015
11/01/26 | | | 5.000 | % | | | 250,000 | | | | 276,140 | | |
California Statewide Communities Development Authority
Refunding Revenue Bonds
Adventist Health System West
Series 2015
03/01/25 | | | 5.000 | % | | | 250,000 | | | | 294,990 | | |
City of Riverside Sewer
Refunding Revenue Bonds
Series 2015A
08/01/21 | | | 5.000 | % | | | 250,000 | | | | 293,057 | | |
Jurupa Unified School District
Unlimited General Obligation Bonds
Series 2015A
08/01/23 | | | 5.000 | % | | | 225,000 | | | | 270,878 | | |
Los Angeles County Sanitation Districts Financing Authority
Subordinated Refunding Revenue Bonds
Capital Projects — District #14
Series 2015
10/01/28 | | | 5.000 | % | | | 500,000 | | | | 593,435 | | |
Municipal Bonds (continued)
Issue
Description | | Coupon
Rate | | Principal
Amount ($) | |
Value ($) | |
Monterey Regional Waste Management Authority
Revenue Bonds
Series 2015B AMT(a)
04/01/21 | | | 4.000 | % | | | 250,000 | | | | 270,800 | | |
Moreno Valley Unified School District
Unlimited General Obligation Bonds
Election 2014
Series 2015A (AGM)
08/01/28 | | | 5.000 | % | | | 250,000 | | | | 294,597 | | |
Pajaro Valley Water Management Agency
Refunding Revenue Bonds
Series 2015 (AGM)
03/01/22 | | | 5.000 | % | | | 250,000 | | | | 291,388 | | |
Santa Maria Bonita School District
Unlimited General Obligation Bonds
Series 2015
08/01/31 | | | 5.000 | % | | | 250,000 | | | | 289,875 | | |
West Kern Community College District
Unlimited General Obligation Refunding Bonds
Series 2015A (AGM)
11/01/24 | | | 5.000 | % | | | 250,000 | | | | 299,792 | | |
Total | | | | | | | 3,712,310 | | |
COLORADO 1.4% | |
Colorado Health Facilities Authority
Refunding Revenue Bonds
Parkview Medical Center
Series 2015B
09/01/26 | | | 5.000 | % | | | 250,000 | | | | 283,363 | | |
CONNECTICUT 1.4% | |
State of Connecticut Clean Water Fund-State Revolving Fund
Revenue Bonds
Green Bonds
Series 2015A
03/01/19 | | | 5.000 | % | | | 250,000 | | | | 285,118 | | |
GEORGIA 2.5% | |
Georgia Housing & Finance Authority
Refunding Revenue Bonds
Series 2015A-2 AMT(a)
06/01/20 | | | 2.000 | % | | | 500,000 | | | | 499,060 | | |
IDAHO 1.3% | |
Idaho Housing & Finance Association
Revenue Bonds
Series 2015A-1
07/01/25 | | | 3.200 | % | | | 250,000 | | | | 252,618 | | |
The accompanying Notes to Financial Statements are an integral part of this statement.
Annual Report 2015
4
COLUMBIA U.S. SOCIAL BOND FUND
PORTFOLIO OF INVESTMENTS (continued)
July 31, 2015
Municipal Bonds (continued)
Issue
Description | | Coupon
Rate | | Principal
Amount ($) | |
Value ($) | |
INDIANA 1.5% | |
Ivy Tech Community College
Refunding Revenue Bonds
Student Fee
Series 2015T(b)
07/01/24 | | | 5.000 | % | | | 250,000 | | | | 299,565 | | |
LOUISIANA 2.5% | |
Louisiana Local Government Environmental Facilities & Community Development Authority
Revenue Bonds
Bellemont Apartments Homes Project
Series 2015
04/01/34 | | | 4.125 | % | | | 250,000 | | | | 244,098 | | |
Louisiana Public Facilities Authority
Revenue Bonds
Louisiana Pellets, Inc. Project
Series 2015 AMT(a)(c)
07/01/24 | | | 7.000 | % | | | 250,000 | | | | 249,717 | | |
Total | | | | | | | 493,815 | | |
MARYLAND 4.2% | |
Maryland Health & Higher Educational Facilities Authority
Refunding Revenue Bonds
Meritus Medical Center Issue
Series 2015
07/01/23 | | | 5.000 | % | | | 250,000 | | | | 284,905 | | |
The John Hopkins Health System
Series 2015
05/15/19 | | | 5.000 | % | | | 250,000 | | | | 285,810 | | |
University of Maryland Medical System
Series 2015
07/01/19 | | | 4.000 | % | | | 250,000 | | | | 274,787 | | |
Total | | | | | | | 845,502 | | |
MASSACHUSETTS 1.3% | |
Massachusetts Development Finance Agency
Revenue Bonds
Green Bonds — Boston Medical Center
Series 2015
07/01/44 | | | 5.000 | % | | | 250,000 | | | | 264,205 | | |
MINNESOTA 1.5% | |
Dakota County Community Development Agency
Refunding Revenue Bonds
Series 2015B
01/01/21 | | | 5.000 | % | | | 250,000 | | | | 293,365 | | |
Municipal Bonds (continued)
Issue
Description | | Coupon
Rate | | Principal
Amount ($) | |
Value ($) | |
MISSISSIPPI 1.5% | |
City of Gulfport
Unlimited General Obligation Refunding Bonds
Water & Sewer
Series 2015
07/01/21 | | | 5.000 | % | | | 250,000 | | | | 291,658 | | |
NEBRASKA 1.2% | |
Nebraska Investment Finance Authority
Single Family Housing Revenue Bonds
Series 2015 (GNMA/FNMA)
09/01/30 | | | 3.450 | % | | | 250,000 | | | | 249,703 | | |
NEW MEXICO 1.5% | |
New Mexico Hospital Equipment Loan Council
Revenue Bonds
Presbyterian Healthcare Services
Series 2015
08/01/21 | | | 5.000 | % | | | 250,000 | | | | 293,677 | | |
NEW YORK 5.2% | |
Build NYC Resource Corp.
Revenue Bonds
Series 2015
07/01/28 | | | 5.000 | % | | | 250,000 | | | | 290,282 | | |
Housing Development Corp.
Refunding Revenue Bonds
Series 2015A-1
11/01/18 | | | 1.150 | % | | | 250,000 | | | | 249,705 | | |
Housing Development Corp.(b)
Refunding Revenue Bonds
Sustainable Neighborhood
Series 2015S
05/01/26 | | | 3.400 | % | | | 500,000 | | | | 507,320 | | |
Total | | | | | | | 1,047,307 | | |
OREGON 1.5% | |
State of Oregon
Unlimited General Obligation Bonds — Community
College Projects
Series 2015J
08/01/28 | | | 5.000 | % | | | 250,000 | | | | 303,047 | | |
PENNSYLVANIA 7.1% | |
City of Philadelphia Water & Wastewater
Refunding Revenue Bonds
Series 2015B
07/01/28 | | | 5.000 | % | | | 250,000 | | | | 291,092 | | |
The accompanying Notes to Financial Statements are an integral part of this statement.
Annual Report 2015
5
COLUMBIA U.S. SOCIAL BOND FUND
PORTFOLIO OF INVESTMENTS (continued)
July 31, 2015
Municipal Bonds (continued)
Issue
Description | | Coupon
Rate | | Principal
Amount ($) | |
Value ($) | |
Montgomery County Industrial Development Authority
Refunding Revenue Bonds
Albert Einstein HealthCare Network
Series 2015
01/15/22 | | | 5.000 | % | | | 250,000 | | | | 277,220 | | |
Philadelphia Redevelopment Authority
Refunding Revenue Bonds
Series 2015A
04/15/28 | | | 5.000 | % | | | 250,000 | | | | 280,400 | | |
State Public School Building Authority
Refunding Revenue Bonds
The School District of Philadelphia Project
Series 2015
06/01/24 | | | 5.000 | % | | | 500,000 | | | | 574,320 | | |
Total | | | | | | | 1,423,032 | | |
RHODE ISLAND 1.2% | |
Rhode Island Housing & Mortgage Finance Corp.
Refunding Revenue Bonds
Homeownership Opportunity
Series 2015 AMT(a)(b)
10/01/25 | | | 3.550 | % | | | 250,000 | | | | 250,595 | | |
SOUTH CAROLINA 2.9% | |
SCAGO Educational Facilities Corp. for Cherokee School
District No. 1
Refunding Revenue Bonds
Series 2015
12/01/27 | | | 5.000 | % | | | 250,000 | | | | 288,722 | | |
SCAGO Educational Facilities Corp. for Colleton School District
Refunding Revenue Bonds
Series 2015
12/01/20 | | | 5.000 | % | | | 250,000 | | | | 286,513 | | |
Total | | | | | | | 575,235 | | |
TENNESSEE 1.2% | |
Tennessee Housing Development Agency
Revenue Bonds
Series 2015-1C
01/01/22 | | | 2.450 | % | | | 250,000 | | | | 251,628 | | |
TEXAS 11.8% | |
Austin Community College District Public Facility Corp.
Refunding Revenue Bonds
Series 2015
08/01/19 | | | 5.000 | % | | | 250,000 | | | | 284,315 | | |
Municipal Bonds (continued)
Issue
Description | | Coupon
Rate | | Principal
Amount ($) | |
Value ($) | |
Cotulla Independent School District
Unlimited General Obligation Bonds
School Building
Series 2015
02/15/19 | | | 5.000 | % | | | 250,000 | | | | 281,752 | | |
Ennis Independent School District
Unlimited General Obligation Refunding Bonds
Series 2015
08/15/23 | | | 5.000 | % | | | 500,000 | | | | 603,015 | | |
Harris County Cultural Education Facilities Finance Corp.
Refunding Revenue Bonds
Texas Children's Hospital
Series 2015
10/01/21 | | | 5.000 | % | | | 250,000 | | | | 294,175 | | |
Lone Star College System
Limited General Obligation Refunding Bonds
Series 2015B
02/15/22 | | | 5.000 | % | | | 500,000 | | | | 591,770 | | |
San Antonio Independent School District
Unlimited General Obligation Refunding Bonds
Series 2015 (Permenant School Fund Guarantee)
02/15/22 | | | 5.000 | % | | | 250,000 | | | | 297,720 | | |
Total | | | | | | | 2,352,747 | | |
WASHINGTON 3.6% | |
Energy Northwest
Wind Project Refunding Revenue Bonds
Series 2015
07/01/29 | | | 4.000 | % | | | 500,000 | | | | 518,235 | | |
King County Public Hospital District No. 4
Revenue Bonds
Series 2015A
12/01/35 | | | 6.000 | % | | | 200,000 | | | | 195,618 | | |
Total | | | | | | | 713,853 | | |
WEST VIRGINIA 1.2% | |
West Virginia Housing Development Fund
Refunding Revenue Bonds
Series 2015A AMT(a)
11/01/18 | | | 1.500 | % | | | 250,000 | | | | 250,260 | | |
Total Municipal Bonds
(Cost: $16,118,462) | | | | | | | 16,097,298 | | |
The accompanying Notes to Financial Statements are an integral part of this statement.
Annual Report 2015
6
COLUMBIA U.S. SOCIAL BOND FUND
PORTFOLIO OF INVESTMENTS (continued)
July 31, 2015
Corporate Bonds & Notes 9.3%
Issuer | | Coupon
Rate | | Principal
Amount ($) | |
Value ($) | |
BANKING 2.5% | |
Bank of America Corp.
Green Bond
05/12/18 | | | 1.950 | % | | | 250,000 | | | | 249,776 | | |
Morgan Stanley
Green Bond
12/07/18 | | | 2.200 | % | | | 250,000 | | | | 252,638 | | |
Total | | | | | | | 502,414 | | |
ELECTRIC 1.3% | |
NextEra Energy Capital Holdings, Inc.
06/01/17 | | | 1.586 | % | | | 250,000 | | | | 250,647 | | |
LIFE INSURANCE 0.5% | |
Five Corners Funding Trust(c)
11/15/23 | | | 4.419 | % | | | 100,000 | | | | 104,175 | | |
MEDIA AND ENTERTAINMENT 1.4% | |
Time Warner, Inc.
03/15/20 | | | 4.875 | % | | | 250,000 | | | | 274,018 | | |
NATURAL GAS 1.2% | |
Sempra Energy
03/15/20 | | | 2.400 | % | | | 250,000 | | | | 248,338 | | |
PHARMACEUTICALS 1.2% | |
AbbVie, Inc.
05/14/18 | | | 1.800 | % | | | 250,000 | | | | 249,318 | | |
WIRELINES 1.2% | |
Verizon Communications, Inc.
11/01/22 | | | 2.450 | % | | | 250,000 | | | | 238,334 | | |
Total Corporate Bonds & Notes
(Cost: $1,888,152) | | | | | | | 1,867,244 | | |
Floating Rate Notes 8.8%
Issue
Description | | Effective
Yield | | Principal
Amount ($) | | Value ($) | |
CALIFORNIA 1.2% | |
California Statewide Communities Development Authority
Revenue Bonds
John Muir Health
VRDN Series 2008C (Wells Fargo Bank)(d)(e)
08/15/27 | | | 0.010 | % | | | 250,000 | | | | 250,000 | | |
Floating Rate Notes (continued)
Issue
Description | | Effective
Yield | | Principal
Amount ($) | |
Value ($) | |
MICHIGAN 2.5% | |
Michigan State Housing Development Authority
Revenue Bonds
VRDN Series 2008A (JPMorgan Chase Bank) AMT(a)(d)(e)
10/01/37 | | | 0.060 | % | | | 500,000 | | | | 500,000 | | |
NEW YORK 3.8% | |
New York City Water & Sewer System
Revenue Bonds
VRDN Series 2010 (U.S. Bank)(d)(e)
06/15/43 | | | 0.010 | % | | | 250,000 | | | | 250,000 | | |
New York Mortgage Agency
Revenue Bonds
VRDN Series 2006-139 (JPMorgan Chase
Bank) AMT(a)(d)(e)
10/01/37 | | | 0.020 | % | | | 500,000 | | | | 500,000 | | |
Total | | | | | | | 750,000 | | |
TEXAS 1.3% | |
Harris County Cultural Education Facilities Finance Corp.
Refunding Revenue Bonds
Texas Medical Center
VRDN Subordinated Series 2008B-2 (JPMorgan
Chase Bank)(d)(e)
09/01/31 | | | 0.010 | % | | | 250,000 | | | | 250,000 | | |
Total Floating Rate Notes
(Cost: $1,750,000) | | | | | | | 1,750,000 | | |
Money Market Funds 6.2%
| | | Shares | | Value ($) | |
JPMorgan Tax-Free Money Market Fund,
0.010%(f) | | | 1,231,539 | | | | 1,231,539 | | |
Total Money Market Funds
(Cost: $1,231,539) | | | | | 1,231,539 | | |
Total Investments
(Cost: $20,988,153) | | | | | 20,946,081 | | |
Other Assets & Liabilities, Net | | | | | (957,725 | ) | |
Net Assets | | | | | 19,988,356 | | |
The accompanying Notes to Financial Statements are an integral part of this statement.
Annual Report 2015
7
COLUMBIA U.S. SOCIAL BOND FUND
PORTFOLIO OF INVESTMENTS (continued)
July 31, 2015
Notes to Portfolio of Investments
(a) Income from this security may be subject to alternative minimum tax.
(b) Security, or a portion thereof, has been purchased on a when-issued or delayed delivery basis.
(c) Security exempt from registration pursuant to Rule 144A under the Securities Act of 1933. This security may be resold in transactions exempt from registration, normally to qualified institutional buyers. At July 31, 2015, the value of these securities amounted to $353,892 or 1.77% of net assets.
(d) Variable rate security.
(e) The Fund is entitled to receive principal and interest from the guarantor after a day or a week's notice or upon maturity. The maturity date disclosed represents the final maturity.
(f) The rate shown is the seven-day current annualized yield at July 31, 2015.
Abbreviation Legend
AGM Assured Guaranty Municipal Corporation
AMT Alternative Minimum Tax
FNMA Federal National Mortgage Association
GNMA Government National Mortgage Association
VRDN Variable Rate Demand Note
Fair Value Measurements
The Fund categorizes its fair value measurements according to a three-level hierarchy that maximizes the use of observable inputs and minimizes the use of unobservable inputs by prioritizing that the most observable input be used when available. Observable inputs are those that market participants would use in pricing an investment based on market data obtained from sources independent of the reporting entity. Unobservable inputs are those that reflect the Fund's assumptions about the information market participants would use in pricing an investment. An investment's level within the fair value hierarchy is based on the lowest level of any input that is deemed significant to the asset's or liability's fair value measurement. The input levels are not necessarily an indication of the risk or liquidity associated with investments at that level. For example, certain U.S. government securities are generally high quality and liquid, however, they are reflected as Level 2 because the inputs used to determine fair value may not always be quoted prices in an active market.
Fair value inputs are summarized in the three broad levels listed below:
> Level 1 — Valuations based on quoted prices for investments in active markets that the Fund has the ability to access at the measurement date (including NAV for open-end mutual funds). Valuation adjustments are not applied to Level 1 investments.
> Level 2 — Valuations based on other significant observable inputs (including quoted prices for similar securities, interest rates, prepayment speeds, credit risks, etc.).
> Level 3 — Valuations based on significant unobservable inputs (including the Fund's own assumptions and judgment in determining the fair value of investments).
Inputs that are used in determining fair value of an investment may include price information, credit data, volatility statistics, and other factors. These inputs can be either observable or unobservable. The availability of observable inputs can vary between investments, and is affected by various factors such as the type of investment, and the volume and level of activity for that investment or similar investments in the marketplace. The inputs will be considered by the Investment Manager, along with any other relevant factors in the calculation of an investment's fair value. The Fund uses prices and inputs that are current as of the measurement date, which may include periods of market dislocations. During these periods, the availability of prices and inputs may be reduced for many investments. This condition could cause an investment to be reclassified between the various levels within the hierarchy.
Investments falling into the Level 3 category are primarily supported by quoted prices from brokers and dealers participating in the market for those investments. However, these may be classified as Level 3 investments due to lack of market transparency and corroboration to support these quoted prices. Additionally, valuation models may be used as the pricing source for any remaining investments classified as Level 3. These models may rely on one or more significant unobservable inputs and/or significant assumptions by the Investment Manager. Inputs used in valuations may include, but are not limited to, financial statement analysis, capital account balances, discount rates and estimated cash flows, and comparable company data.
Under the direction of the Fund's Board of Trustees (the Board), the Investment Manager's Valuation Committee (the Committee) is responsible for overseeing the valuation procedures approved by the Board. The Committee consists of voting and non-voting members from various groups within the Investment Manager's organization, including operations and accounting, trading and investments, compliance, risk management and legal.
The accompanying Notes to Financial Statements are an integral part of this statement.
Annual Report 2015
8
COLUMBIA U.S. SOCIAL BOND FUND
PORTFOLIO OF INVESTMENTS (continued)
July 31, 2015
Fair Value Measurements (continued)
The Committee meets at least monthly to review and approve valuation matters, which may include a description of specific valuation determinations, data regarding pricing information received from approved pricing vendors and brokers and the results of Board-approved valuation control policies and procedures (the Policies). The Policies address, among other things, instances when market quotations are or are not readily available, including recommendations of third party pricing vendors and a determination of appropriate pricing methodologies; events that require specific valuation determinations and assessment of fair value techniques; securities with a potential for stale pricing, including those that are illiquid, restricted, or in default; and the effectiveness of third party pricing vendors, including periodic reviews of vendors. The Committee meets more frequently, as needed, to discuss additional valuation matters, which may include the need to review back-testing results, review time-sensitive information or approve related valuation actions. The Committee reports to the Board, with members of the Committee meeting with the Board at each of its regularly scheduled meetings to discuss valuation matters and actions during the period, similar to those described earlier.
For investments categorized as Level 3, the Committee monitors information similar to that described above, which may include: (i) data specific to the issuer or comparable issuers, (ii) general market or specific sector news and (iii) quoted prices and specific or similar security transactions. The Committee considers this data and any changes from prior periods in order to assess the reasonableness of observable and unobservable inputs, any assumptions or internal models used to value those securities and changes in fair value. This data is also used to corroborate, when available, information received from approved pricing vendors and brokers. Various factors impact the frequency of monitoring this information (which may occur as often as daily). However, the Committee may determine that changes to inputs, assumptions and models are not required as a result of the monitoring procedures performed.
The following table is a summary of the inputs used to value the Fund's investments at July 31, 2015:
| | | Level 1
Quoted Prices in Active
Markets for Identical
Assets ($) | |
Level 2
Other Significant
Observable Inputs ($) | |
Level 3
Significant
Unobservable Inputs ($) | |
Total ($) | |
Investments | |
Municipal Bonds | | | — | | | | 16,097,298 | | | | — | | | | 16,097,298 | | |
Corporate Bonds & Notes | | | — | | | | 1,867,244 | | | | — | | | | 1,867,244 | | |
Floating Rate Notes | | | — | | | | 1,750,000 | | | | — | | | | 1,750,000 | | |
Money Market Funds | | | 1,231,539 | | | | — | | | | — | | | | 1,231,539 | | |
Total Investments | | | 1,231,539 | | | | 19,714,542 | | | | — | | | | 20,946,081 | | |
See the Portfolio of Investments for all investment classifications not indicated in the table.
The Fund's assets assigned to the Level 2 input category are generally valued using the market approach, in which a security's value is determined through reference to prices and information from market transactions for similar or identical assets.
There were no transfers of financial assets between levels during the period.
The accompanying Notes to Financial Statements are an integral part of this statement.
Annual Report 2015
9
COLUMBIA U.S. SOCIAL BOND FUND
STATEMENT OF ASSETS AND LIABILITIES
July 31, 2015
Assets | |
Investments, at value | |
(identified cost $20,988,153) | | $ | 20,946,081 | | |
Receivable for: | |
Capital shares sold | | | 130 | | |
Interest | | | 117,968 | | |
Expense reimbursement due from Investment Manager | | | 460 | | |
Trustees' deferred compensation plan | | | 813 | | |
Other assets | | | 56,676 | | |
Total assets | | | 21,122,128 | | |
Liabilities | |
Payable for: | |
Investments purchased on a delayed delivery basis | | | 1,047,885 | | |
Dividend distributions to shareholders | | | 61,394 | | |
Investment management fees | | | 273 | | |
Transfer agent fees | | | 28 | | |
Administration fees | | | 38 | | |
Chief compliance officer expenses | | | 1 | | |
Other expenses | | | 23,340 | | |
Trustees' deferred compensation plan | | | 813 | | |
Total liabilities | | | 1,133,772 | | |
Net assets applicable to outstanding capital stock | | $ | 19,988,356 | | |
Represented by | |
Paid-in capital | | $ | 20,040,130 | | |
Undistributed net investment income | | | 176 | | |
Accumulated net realized loss | | | (9,878 | ) | |
Unrealized appreciation (depreciation) on: | |
Investments | | | (42,072 | ) | |
Total — representing net assets applicable to outstanding capital stock | | $ | 19,988,356 | | |
The accompanying Notes to Financial Statements are an integral part of this statement.
Annual Report 2015
10
COLUMBIA U.S. SOCIAL BOND FUND
STATEMENT OF ASSETS AND LIABILITIES (continued)
July 31, 2015
Class A | |
Net assets | | $ | 9,939 | | |
Shares outstanding | | | 1,000 | | |
Net asset value per share | | $ | 9.94 | | |
Maximum offering price per share(a) | | $ | 10.25 | | |
Class C | |
Net assets | | $ | 9,945 | | |
Shares outstanding | | | 1,001 | | |
Net asset value per share | | $ | 9.94 | | |
Class R4 | |
Net assets | | $ | 9,939 | | |
Shares outstanding | | | 1,000 | | |
Net asset value per share | | $ | 9.94 | | |
Class R5 | |
Net assets | | $ | 9,939 | | |
Shares outstanding | | | 1,000 | | |
Net asset value per share | | $ | 9.94 | | |
Class Z | |
Net assets | | $ | 19,948,594 | | |
Shares outstanding | | | 2,007,147 | | |
Net asset value per share | | $ | 9.94 | | |
(a) The maximum offering price per share is calculated by dividing the net asset value per share by 1.0 minus the maximum sales charge of 3.00% for Class A.
The accompanying Notes to Financial Statements are an integral part of this statement.
Annual Report 2015
11
COLUMBIA U.S. SOCIAL BOND FUND
STATEMENT OF OPERATIONS
Year Ended July 31, 2015(a)
Net investment income | |
Income: | |
Dividends | | $ | 138 | | |
Interest | | | 91,240 | | |
Total income | | | 91,378 | | |
Expenses: | |
Investment management fees | | | 26,951 | | |
Distribution and/or service fees | |
Class A | | | 9 | | |
Class C | | | 35 | | |
Transfer agent fees | |
Class R5 | | | 2 | | |
Class Z | | | 125 | | |
Administration fees | | | 3,773 | | |
Compensation of board members | | | 1,945 | | |
Custodian fees | | | 3,816 | | |
Printing and postage fees | | | 7,266 | | |
Registration fees | | | 7,532 | | |
Professional fees | | | 16,120 | | |
Offering costs | | | 29,848 | | |
Chief compliance officer expenses | | | 2 | | |
Other | | | 2,045 | | |
Total expenses | | | 99,469 | | |
Fees waived or expenses reimbursed by Investment Manager and its affiliates | | | (69,661 | ) | |
Total net expenses | | | 29,808 | | |
Net investment income | | | 61,570 | | |
Realized and unrealized gain (loss) — net | |
Net realized gain (loss) on: | |
Investments | | | (9,878 | ) | |
Net realized loss | | | (9,878 | ) | |
Net change in unrealized appreciation (depreciation) on: | |
Investments | | | (42,072 | ) | |
Net change in unrealized depreciation | | | (42,072 | ) | |
Net realized and unrealized loss | | | (51,950 | ) | |
Net increase in net assets resulting from operations | | $ | 9,620 | | |
(a) Based on operations from March 26, 2015 (commencement of operations) through the stated period end.
The accompanying Notes to Financial Statements are an integral part of this statement.
Annual Report 2015
12
COLUMBIA U.S. SOCIAL BOND FUND
STATEMENT OF CHANGES IN NET ASSETS
| | | Year Ended
July 31,
2015(a) | |
Operations | |
Net investment income | | $ | 61,570 | | |
Net realized loss | | | (9,878 | ) | |
Net change in unrealized depreciation | | | (42,072 | ) | |
Net increase in net assets resulting from operations | | | 9,620 | | |
Distributions to shareholders | |
Net investment income | |
Class A | | | (22 | ) | |
Class C | | | (6 | ) | |
Class R4 | | | (31 | ) | |
Class R5 | | | (29 | ) | |
Class Z | | | (61,306 | ) | |
Total distributions to shareholders | | | (61,394 | ) | |
Increase in net assets from capital stock activity | | | 17,540,130 | | |
Total increase in net assets | | | 17,488,356 | | |
Net assets at beginning of year | | | 2,500,000 | | |
Net assets at end of year | | $ | 19,988,356 | | |
Undistributed net investment income | | $ | 176 | | |
(a) Based on operations from March 26, 2015 (commencement of operations) through the stated period end.
The accompanying Notes to Financial Statements are an integral part of this statement.
Annual Report 2015
13
COLUMBIA U.S. SOCIAL BOND FUND
STATEMENT OF CHANGES IN NET ASSETS (continued)
| | | Year Ended July 31, 2015(a) | |
| | | Shares | | Dollars ($) | |
Capital stock activity | |
Class C shares | |
Distributions reinvested | | | 1 | | | | 6 | | |
Net increase | | | 1 | | | | 6 | | |
Class Z shares | |
Subscriptions | | | 1,761,135 | | | | 17,540,000 | | |
Distributions reinvested | | | 12 | | | | 124 | | |
Net increase | | | 1,761,147 | | | | 17,540,124 | | |
Total net increase | | | 1,761,148 | | | | 17,540,130 | | |
(a) Based on operations from March 26, 2015 (commencement of operations) through the stated period end.
The accompanying Notes to Financial Statements are an integral part of this statement.
Annual Report 2015
14
COLUMBIA U.S. SOCIAL BOND FUND
The following tables are intended to help you understand the Fund's financial performance. Certain information reflects financial results for a single share of a class held for the periods shown. Per share net investment income (loss) amounts are calculated based on average shares outstanding during the period. Total return assumes reinvestment of all dividends and distributions, if any. Total return does not reflect payment of sales charges, if any. Total return and portfolio turnover are not annualized for periods of less than one year. The portfolio turnover rate is calculated without regard to purchase and sales transactions of short-term instruments and certain derivatives, if any. If such transactions were included, the Fund's portfolio turnover rate may be higher.
Class A | | Year Ended
July 31,
2015(a) | |
Per share data | |
Net asset value, beginning of period | | $ | 10.00 | | |
Income from investment operations: | |
Net investment income | | | 0.02 | | |
Net realized and unrealized loss | | | (0.06 | ) | |
Total from investment operations | | | (0.04 | ) | |
Less distributions to shareholders: | |
Net investment income | | | (0.02 | ) | |
Total distributions to shareholders | | | (0.02 | ) | |
Net asset value, end of period | | $ | 9.94 | | |
Total return | | | (0.38 | %) | |
Ratios to average net assets(b) | |
Total gross expenses | | | 1.72 | %(c) | |
Total net expenses(d) | | | 0.80 | %(c) | |
Net investment income | | | 0.67 | %(c) | |
Supplemental data | |
Net assets, end of period (in thousands) | | $ | 10 | | |
Portfolio turnover | | | 11 | % | |
Notes to Financial Highlights
(a) Based on operations from March 26, 2015 (commencement of operations) through the stated period end.
(b) In addition to the fees and expenses that the Fund bears directly, the Fund indirectly bears a pro rata share of the fees and expenses of any other funds in which it invests. Such indirect expenses are not included in the Fund's reported expense ratios.
(c) Annualized.
(d) Total net expenses include the impact of certain fee waivers/expense reimbursements made by the Investment Manager and certain of its affiliates, if applicable.
The accompanying Notes to Financial Statements are an integral part of this statement.
Annual Report 2015
15
COLUMBIA U.S. SOCIAL BOND FUND
FINANCIAL HIGHLIGHTS (continued)
Class C | | Year Ended
July 31,
2015(a) | |
Per share data | |
Net asset value, beginning of period | | $ | 10.00 | | |
Income from investment operations: | |
Net investment income | | | 0.01 | | |
Net realized and unrealized loss | | | (0.06 | ) | |
Total from investment operations | | | (0.05 | ) | |
Less distributions to shareholders: | |
Net investment income | | | (0.01 | ) | |
Total distributions to shareholders | | | (0.01 | ) | |
Net asset value, end of period | | $ | 9.94 | | |
Total return | | | (0.54 | %) | |
Ratios to average net assets(b) | |
Total gross expenses | | | 2.47 | %(c) | |
Total net expenses(d) | | | 1.45 | %(c) | |
Net investment income | | | 0.02 | %(c) | |
Supplemental data | |
Net assets, end of period (in thousands) | | $ | 10 | | |
Portfolio turnover | | | 11 | % | |
Notes to Financial Highlights
(a) Based on operations from March 26, 2015 (commencement of operations) through the stated period end.
(b) In addition to the fees and expenses that the Fund bears directly, the Fund indirectly bears a pro rata share of the fees and expenses of any other funds in which it invests. Such indirect expenses are not included in the Fund's reported expense ratios.
(c) Annualized.
(d) Total net expenses include the impact of certain fee waivers/expense reimbursements made by the Investment Manager and certain of its affiliates, if applicable.
The accompanying Notes to Financial Statements are an integral part of this statement.
Annual Report 2015
16
COLUMBIA U.S. SOCIAL BOND FUND
FINANCIAL HIGHLIGHTS (continued)
Class R4 | | Year Ended
July 31,
2015(a) | |
Per share data | |
Net asset value, beginning of period | | $ | 10.00 | | |
Income from investment operations: | |
Net investment income | | | 0.03 | | |
Net realized and unrealized loss | | | (0.06 | ) | |
Total from investment operations | | | (0.03 | ) | |
Less distributions to shareholders: | |
Net investment income | | | (0.03 | ) | |
Total distributions to shareholders | | | (0.03 | ) | |
Net asset value, end of period | | $ | 9.94 | | |
Total return | | | (0.29 | %) | |
Ratios to average net assets(b) | |
Total gross expenses | | | 1.47 | %(c) | |
Total net expenses(d) | | | 0.55 | %(c) | |
Net investment income | | | 0.92 | %(c) | |
Supplemental data | |
Net assets, end of period (in thousands) | | $ | 10 | | |
Portfolio turnover | | | 11 | % | |
Notes to Financial Highlights
(a) Based on operations from March 26, 2015 (commencement of operations) through the stated period end.
(b) In addition to the fees and expenses that the Fund bears directly, the Fund indirectly bears a pro rata share of the fees and expenses of any other funds in which it invests. Such indirect expenses are not included in the Fund's reported expense ratios.
(c) Annualized.
(d) Total net expenses include the impact of certain fee waivers/expense reimbursements made by the Investment Manager and certain of its affiliates, if applicable.
The accompanying Notes to Financial Statements are an integral part of this statement.
Annual Report 2015
17
COLUMBIA U.S. SOCIAL BOND FUND
FINANCIAL HIGHLIGHTS (continued)
Class R5 | | Year Ended
July 31,
2015(a) | |
Per share data | |
Net asset value, beginning of period | | $ | 10.00 | | |
Income from investment operations: | |
Net investment income | | | 0.03 | | |
Net realized and unrealized loss | | | (0.06 | ) | |
Total from investment operations | | | (0.03 | ) | |
Less distributions to shareholders: | |
Net investment income | | | (0.03 | ) | |
Total distributions to shareholders | | | (0.03 | ) | |
Net asset value, end of period | | $ | 9.94 | | |
Total return | | | (0.31 | %) | |
Ratios to average net assets(b) | |
Total gross expenses | | | 1.52 | %(c) | |
Total net expenses(d) | | | 0.60 | %(c) | |
Net investment income | | | 0.87 | %(c) | |
Supplemental data | |
Net assets, end of period (in thousands) | | $ | 10 | | |
Portfolio turnover | | | 11 | % | |
Notes to Financial Highlights
(a) Based on operations from March 26, 2015 (commencement of operations) through the stated period end.
(b) In addition to the fees and expenses that the Fund bears directly, the Fund indirectly bears a pro rata share of the fees and expenses of any other funds in which it invests. Such indirect expenses are not included in the Fund's reported expense ratios.
(c) Annualized.
(d) Total net expenses include the impact of certain fee waivers/expense reimbursements made by the Investment Manager and certain of its affiliates, if applicable.
The accompanying Notes to Financial Statements are an integral part of this statement.
Annual Report 2015
18
COLUMBIA U.S. SOCIAL BOND FUND
FINANCIAL HIGHLIGHTS (continued)
Class Z | | Year Ended
July 31,
2015(a) | |
Per share data | |
Net asset value, beginning of period | | $ | 10.00 | | |
Income from investment operations: | |
Net investment income | | | 0.04 | | |
Net realized and unrealized loss | | | (0.07 | ) | |
Total from investment operations | | | (0.03 | ) | |
Less distributions to shareholders: | |
Net investment income | | | (0.03 | ) | |
Total distributions to shareholders | | | (0.03 | ) | |
Net asset value, end of period | | $ | 9.94 | | |
Total return | | | (0.29 | %) | |
Ratios to average net assets(b) | |
Total gross expenses | | | 1.47 | %(c) | |
Total net expenses(d) | | | 0.55 | %(c) | |
Net investment income | | | 1.14 | %(c) | |
Supplemental data | |
Net assets, end of period (in thousands) | | $ | 19,949 | | |
Portfolio turnover | | | 11 | % | |
Notes to Financial Highlights
(a) Based on operations from March 26, 2015 (commencement of operations) through the stated period end.
(b) In addition to the fees and expenses that the Fund bears directly, the Fund indirectly bears a pro rata share of the fees and expenses of any other funds in which it invests. Such indirect expenses are not included in the Fund's reported expense ratios.
(c) Annualized.
(d) Total net expenses include the impact of certain fee waivers/expense reimbursements made by the Investment Manager and certain of its affiliates, if applicable.
The accompanying Notes to Financial Statements are an integral part of this statement.
Annual Report 2015
19
COLUMBIA U.S. SOCIAL BOND FUND
NOTES TO FINANCIAL STATEMENTS
July 31, 2015
Note 1. Organization
Columbia U.S. Social Bond Fund (the Fund), a series of Columbia Funds Series Trust I (the Trust), is a non-diversified fund. The Trust is registered under the Investment Company Act of 1940, as amended (the 1940 Act), as an open-end management investment company organized as a Massachusetts business trust.
On March 25, 2015, Columbia Management Investment Advisers, LLC (the Investment Manager), a wholly-owned subsidiary of Ameriprise Financial, Inc. (Ameriprise Financial), invested $2,500,000 in the Fund (1000 shares for Class A, 1000 shares for Class C, 1000 shares for Class R4, 1000 shares for Class R5 and 246,000 shares for Class Z), which represented the initial capital for each class at $10 per share. An additional $17,500,000 was invested in shares of Class Z over 7 consecutive weeks beginning April 2, 2015. Shares of the Fund were first offered to the public on March 26, 2015.
These financial statements cover the period from March 26, 2015 (commencement of operations) through July 31, 2015.
Fund Shares
The Trust may issue an unlimited number of shares (without par value). The Fund offers Class A, Class C, Class R4, Class R5 and Class Z shares. Although all share classes generally have identical voting, dividend and liquidation rights, each share class votes separately when required by the Trust's organizational documents or by law. Different share classes pay different distribution amounts to the extent the expenses of such share classes differ, and distributions in liquidation will be proportional to the net asset value of each share class. Each share class has its own expense and sales charge structure.
Class A shares are subject to a maximum front-end sales charge of 3.00% based on the initial investment amount. Class A shares purchased without an initial sales charge in accounts aggregating $1 million to $50 million at the time of purchase are subject to a contingent deferred sales charge (CDSC) if the shares are sold within 18 months after purchase, charged as follows: 1.00% CDSC if redeemed within 12 months after purchase, and 0.50% CDSC if redeemed more than 12, but less than 18, months after purchase.
Class C shares are subject to a 1.00% CDSC on shares redeemed within one year after purchase.
Class R4 shares are not subject to sales charges and are generally available only to omnibus retirement plans and certain investors as described in the Fund's prospectus.
Class R5 shares are not subject to sales charges and are generally available only to investors purchasing through authorized investment professionals and omnibus retirement plans.
Class Z shares are not subject to sales charges and are available only to eligible investors, which are subject to different investment minimums as described in the Fund's prospectus.
Note 2. Summary of Significant Accounting Policies
Basis of Preparation
The Fund is an investment company that applies the accounting and reporting guidance in the Financial Accounting Standards Board (FASB) Accounting Standards Codification Topic 946, Financial Services — Investment Companies (ASC 946). The financial statements are prepared in accordance with U.S. generally accepted accounting principles (GAAP), which requires management to make certain estimates and assumptions that affect the reported amounts of assets and liabilities, the disclosure of contingent assets and liabilities at the date of the financial statements and the reported amounts of income and expenses during the reporting period. Actual results could differ from those estimates.
The following is a summary of significant accounting policies followed by the Fund in the preparation of its financial statements.
Security Valuation
Debt securities generally are valued by pricing services approved by the Board of Trustees (the Board) based upon market transactions for normal, institutional-size trading units of similar securities. The services may use various pricing techniques that take into account, as applicable, factors such as yield, quality, coupon rate, maturity, type of issue, trading characteristics and other data, as well as broker quotes. Debt securities for which quotations are not readily available or not believed to be reflective of market value may also be valued based upon a bid quote from an approved independent broker-dealer.
Annual Report 2015
20
COLUMBIA U.S. SOCIAL BOND FUND
NOTES TO FINANCIAL STATEMENTS (continued)
July 31, 2015
Investments in open-end investment companies, including money market funds, are valued at their latest net asset value.
Debt securities maturing in 60 days or less are valued primarily at amortized cost value, unless this method results in a valuation that management believes does not approximate market value.
Investments for which market quotations are not readily available, or that have quotations which management believes are not reflective of market value or reliable, are valued at fair value as determined in good faith under procedures approved by and under the general supervision of the Board. If a security or class of securities (such as foreign securities) is valued at fair value, such value is likely to be different from the quoted or published price for the security.
The determination of fair value often requires significant judgment. To determine fair value, management may use assumptions including but not limited to future cash flows and estimated risk premiums. Multiple inputs from various sources may be used to determine fair value.
GAAP requires disclosure regarding the inputs and valuation techniques used to measure fair value and any changes in valuation inputs or techniques. In addition, investments shall be disclosed by major category. This information is disclosed following the Fund's Portfolio of Investments.
Delayed Delivery Securities
The Fund may trade securities on other than normal settlement terms, including securities purchased or sold on a "when-issued" basis. This may increase risk to the Fund since the other party to the transaction may fail to deliver, which could cause the Fund to subsequently invest at less advantageous prices. The Fund designates cash or liquid securities in an amount equal to the delayed delivery commitment.
Security Transactions
Security transactions are accounted for on the trade date. Cost is determined and gains (losses) are based upon the specific identification method for both financial statement and federal income tax purposes.
Income Recognition
Interest income is recorded on an accrual basis. Market premiums and discounts, including original issue discounts, are amortized and accreted, respectively, over the expected life of the security on all debt securities, unless otherwise noted.
Dividend income is recorded on the ex-dividend date.
The Fund may place a debt security on non-accrual status and reduce related interest income when it becomes probable that the interest will not be collected and the amount of uncollectible interest can be reasonably estimated. A defaulted debt security is removed from non-accrual status when the issuer resumes interest payments or when collectibility of interest is reasonably assured.
Expenses
General expenses of the Trust are allocated to the Fund and other funds of the Trust based upon relative net assets or other expense allocation methodologies determined by the nature of the expense. Expenses directly attributable to the Fund are charged to the Fund. Expenses directly attributable to a specific class of shares are charged to that share class.
Determination of Class Net Asset Value
All income, expenses (other than class-specific expenses, which are charged to that share class, as shown in the Statement of Operations) and realized and unrealized gains (losses) are allocated to each class of the Fund on a daily basis, based on the relative net assets of each class, for purposes of determining the net asset value of each class.
Federal Income Tax Status
The Fund intends to qualify each year as a regulated investment company under Subchapter M of the Internal Revenue Code, as amended, and will distribute substantially all of its tax exempt and taxable income (including net short-term capital gains), if any, for its tax year, and as such will not be subject to federal income taxes. In addition, the Fund intends to distribute in each calendar year substantially all of its net investment income, capital gains and certain other amounts, if any, such that the Fund should not be subject to federal excise tax. Therefore, no federal income or excise tax provision is recorded.
Distributions to Shareholders
Distributions from net investment income, if any, are declared daily and paid monthly. Net realized capital gains, if any, are distributed at least annually. Income distributions and capital gain distributions are determined in accordance with federal income tax regulations, which may differ from GAAP.
Annual Report 2015
21
COLUMBIA U.S. SOCIAL BOND FUND
NOTES TO FINANCIAL STATEMENTS (continued)
July 31, 2015
Guarantees and Indemnifications
Under the Trust's organizational documents and, in some cases, by contract, its officers and trustees are indemnified against certain liabilities arising out of the performance of their duties to the Trust or its funds. In addition, certain of the Fund's contracts with its service providers contain general indemnification clauses. The Fund's maximum exposure under these arrangements is unknown since the amount of any future claims that may be made against the Fund cannot be determined, and the Fund has no historical basis for predicting the likelihood of any such claims.
Recent Accounting Pronouncement
Fair Value Measurement (Topic 820), Disclosure for Investments in Certain Entities That Calculate Net Asset Value per Share (or Its Equivalent)
In May 2015, the Financial Accounting Standards Board (FASB) issued Accounting Standards Update (ASU) No. 2015-07, Fair Value Measurement (Topic 820), Disclosure for Investments in Certain Entities That Calculate Net Asset Value per Share (or Its Equivalent). ASU No. 2015-07 changes the disclosure requirements for investments for which fair value is measured using the net asset value per share practical expedient. The disclosure requirements are effective for annual periods beginning after December 15, 2016 and interim periods within those fiscal years. At this time, management is evaluating the implications of this guidance and the impact it will have on the financial statement amounts and footnote disclosures, if any.
Note 3. Fees and Other Transactions with Affiliates
Investment Management Fees
Under an Investment Management Services Agreement, the Investment Manager determines which securities will be purchased, held or sold. The investment management fee is an annual fee that is equal to 0.50% of the Fund's average daily net assets.
Subadvisory Agreement
The Fund's Board has approved a subadvisory agreement between the Investment Manager and Threadneedle International Limited (Threadneedle), an affiliate of the Investment Manager and wholly-owned subsidiary of Ameriprise Financial. As of July 31, 2015, Threadneedle is not providing services to the Fund pursuant to the subadvisory agreement.
Administration Fees
Under an Administrative Services Agreement, the Investment Manager also serves as the Fund Administrator. The Fund pays the Fund Administrator an annual fee for administration and accounting services equal to a percentage of the Fund's average daily net assets that declines from 0.07% to 0.04% as the Fund's net assets increase. The annualized effective administration fee rate for the period ended July 31, 2015 was 0.07% of the Fund's average daily net assets.
Offering Costs
Offering costs were incurred prior to the shares of the Fund being offered. Offering costs include, among other things, state registration filing fees and printing costs. The Fund amortizes offering costs over a period of 12 months from the commencement of operations.
Compensation of Board Members
Board members, who are not officers or employees of the Investment Manager or Ameriprise Financial, are compensated for their services to the Fund as disclosed in the Statement of Operations. These Board members may participate in a Deferred Compensation Plan (the Plan) which may be terminated at any time. Obligations of the Plan will be paid solely out of the Fund's assets, and all amounts payable under the Plan constitute a general unsecured obligation of the Fund.
Compensation of Chief Compliance Officer
The Board has appointed a Chief Compliance Officer to the Fund in accordance with federal securities regulations. The Fund is allocated a portion of the expenses associated with the Chief Compliance Officer based on relative net assets of the Trust.
Transfer Agency Fees
Under a Transfer and Dividend Disbursing Agent Agreement, Columbia Management Investment Services Corp. (the Transfer Agent), an affiliate of the Investment Manager and a wholly-owned subsidiary of Ameriprise Financial, is responsible for providing transfer agency services to the Fund. The Transfer Agent has contracted with Boston Financial Data Services (BFDS) to serve as sub-transfer agent.
The Transfer Agent receives a monthly transfer agency fee based on the number or the average value of accounts, depending on the type of account. In addition, the Transfer Agent also receives sub-transfer agency fees
Annual Report 2015
22
COLUMBIA U.S. SOCIAL BOND FUND
NOTES TO FINANCIAL STATEMENTS (continued)
July 31, 2015
based on a percentage of the average aggregate value of the Fund's shares maintained in omnibus accounts (other than omnibus accounts for which American Enterprise Investment Services Inc. is the broker of record or accounts where the beneficial shareholder is a customer of Ameriprise Financial Services, Inc., for which the Transfer Agent receives a per account fee). The Transfer Agent pays the fees of BFDS for services as sub-transfer agent and is not entitled to reimbursement for such fees from the Fund (with the exception of out-of-pocket fees).
The Transfer Agent also receives compensation from the Fund for various shareholder services and reimbursements for certain out-of-pocket fees. Total transfer agency fees for Class R5 shares are subject to an annual limitation of not more than 0.05% of the average daily net assets attributable to Class R5 shares.
For the period ended July 31, 2015, the Fund's annualized effective transfer agency fee rates as a percentage of average daily net assets of each class were as follows:
Class A | | | 0.00 | * | |
Class C | | | 0.00 | * | |
Class R4 | | | 0.00 | * | |
Class R5 | | | 0.05 | | |
Class Z | | | 0.00 | * | |
* Rounds to zero
An annual minimum account balance fee of $20 may apply to certain accounts with a value below the applicable share class's initial minimum investment requirements to reduce the impact of small accounts on transfer agency fees. These minimum account balance fees are remitted to the Fund and recorded as part of expense reductions in the Statement of Operations. For the period ended July 31, 2015, no minimum account balance fees were charged by the Fund.
Distribution and Service Fees
The Fund has an agreement with Columbia Management Investment Distributors, Inc. (the Distributor), an affiliate of the Investment Manager and a wholly-owned subsidiary of Ameriprise Financial, for distribution and shareholder services. The Board has approved, and the Fund has adopted, distribution and shareholder service plans (the Plans) applicable to certain share classes, which set the distribution and service fees for the Fund. These fees are calculated daily and are intended to compensate the Distributor and/or eligible selling and/or
servicing agents for selling shares of the Fund and providing services to investors.
Under the Plans, the Fund pays a monthly service fee to the Distributor at the maximum annual rate of 0.25% of the average daily net assets attributable to Class A and Class C shares of the Fund. Also under the Plans, the Fund pays a monthly distribution fee to the Distributor at the maximum annual rates of 0.75% of the average daily net assets attributable to Class C shares.
Expenses Waived/Reimbursed by the Investment Manager and its Affiliates
The Investment Manager and certain of its affiliates have contractually agreed to waive fees and/or reimburse expenses (excluding certain fees and expenses described below) for the period disclosed below, unless sooner terminated at the sole discretion of the Board, so that the Fund's net operating expenses, after giving effect to fees waived/expenses reimbursed and any balance credits and/or overdraft charges from the Fund's custodian, do not exceed the following annual rates as a percentage of the class' average daily net assets:
| | | Fee Rates Contractual
through
November 30, 2016 | |
Class A | | | 0.95 | % | |
Class C | | | 1.70 | | |
Class R4 | | | 0.70 | | |
Class R5 | | | 0.60 | | |
Class Z | | | 0.70 | | |
Under the agreement governing these fee waivers and/or expense reimbursement arrangements, the following fees and expenses are excluded from the waiver/reimbursement commitment, and therefore will be paid by the Fund, if applicable: taxes (including foreign transaction taxes), expenses associated with investments in affiliated and non-affiliated pooled investment vehicles (including mutual funds and exchange-traded funds), transaction costs and brokerage commissions, costs related to any securities lending program, dividend and interest expenses associated with securities sold short, inverse floater program fees and expenses, transaction charges and interest on borrowed money, interest, extraordinary expenses and any other expenses the exclusion of which is specifically approved by the Board. This agreement may be modified or amended only with approval from all parties. In addition to the contractual agreement, the Investment Manager and certain of its affiliates have voluntarily agreed to
Annual Report 2015
23
COLUMBIA U.S. SOCIAL BOND FUND
NOTES TO FINANCIAL STATEMENTS (continued)
July 31, 2015
waive fees and/or reimburse Fund expenses (excluding certain fees and expenses described above) so that Fund level expenses (expenses directly attributable to the Fund and not to a specific share class) are waived proportionately across all share classes, but the Fund's net operating expenses shall not exceed the contractual annual rates listed in the table above. This arrangement may be revised or discontinued at any time. Any fees waived and/or expenses reimbursed under the expense reimbursement arrangements described above are not recoverable by the Investment Manager or its affiliates in future periods.
Note 4. Federal Tax Information
The timing and character of income and capital gain distributions are determined in accordance with income tax regulations, which may differ from GAAP because of temporary or permanent book to tax differences.
At July 31, 2015, these differences are primarily due to differing treatment for capital loss carryforwards, Trustees' deferred compensation and distributions. To the extent these differences are permanent, reclassifications are made among the components of the Fund's net assets in the Statement of Assets and Liabilities. Temporary differences do not require reclassifications. In the Statement of Assets and Liabilities the following reclassifications were made:
The Fund did not have any permanent differences; therefore, no reclassifications were made to the Statement of Assets and Liabilities.
The tax character of distributions paid during the years indicated was as follows:
Year Ended July 31, | | 2015 | |
Ordinary income | | $ | 8,074 | | |
Tax-exempt income | | | 53,320 | | |
Total | | | 61,394 | | |
Short-term capital gain distributions, if any, are considered ordinary income distributions for tax purposes.
At July 31, 2015, the components of distributable earnings on a tax basis were as follows:
Undistributed tax-exempt income | | | 66,069 | | |
Capital loss carryforwards | | | (9,878 | ) | |
Net unrealized depreciation | | | (42,072 | ) | |
At July 31, 2015, the cost of investments for federal income tax purposes was $20,988,153 and the aggregate gross unrealized appreciation and depreciation based on that cost was:
Unrealized appreciation | | $ | 65,866 | | |
Unrealized depreciation | | | (107,938 | ) | |
Net unrealized depreciation | | | (42,072 | ) | |
The following capital loss carryforwards, determined at July 31, 2015, may be available to reduce taxable income arising from future net realized gains on investments, if any, to the extent permitted by the Internal Revenue Code:
Year of Expiration | | Amount ($) | |
No expiration — short-term | | | 9,878 | | |
Management of the Fund has concluded that there are no significant uncertain tax positions in the Fund that would require recognition in the financial statements. However, management's conclusion may be subject to review and adjustment at a later date based on factors including, but not limited to, new tax laws, regulations, and administrative interpretations (including relevant court decisions). Generally, the Fund's federal tax returns for the prior three fiscal years remain subject to examination by the Internal Revenue Service.
Note 5. Portfolio Information
The cost of purchases and proceeds from sales of securities, excluding short-term investments and derivatives, if any, aggregated to $19,346,467 and $1,285,563, respectively, for the period ended July 31, 2015. The amount of purchase and sale activity impacts the portfolio turnover rate reported in the Financial Highlights.
Note 6. Shareholder Concentration
At July 31, 2015, affiliated shareholders of record owned 99.8 % of the outstanding shares of the Fund in one or more accounts. Subscription and redemption activity by concentrated accounts may have a significant effect on the operations of the Fund.
Note 7. Line of Credit
The Fund has entered into a revolving credit facility with a syndicate of banks led by JPMorgan Chase Bank, N.A. whereby the Fund may borrow for the temporary funding of shareholder redemptions or for other temporary or emergency purposes. The credit facility agreement, which is a collective agreement between the Fund and certain other funds managed by the Investment Manager,
Annual Report 2015
24
COLUMBIA U.S. SOCIAL BOND FUND
NOTES TO FINANCIAL STATEMENTS (continued)
July 31, 2015
severally and not jointly, permits collective borrowings up to $550 million. Interest is charged to each participating fund based on its borrowings at a rate equal to the higher of (i) the overnight federal funds rate plus 1.00% or (ii) the one-month LIBOR rate plus 1.00%. Each borrowing under the credit facility matures no later than 60 days after the date of borrowing. The Fund also pays a commitment fee equal to its pro rata share of the amount of the credit facility at a rate of 0.075% per annum. The commitment fee is included in other expenses in the Statement of Operations.
The Fund had no borrowings during the period ended July 31, 2015.
Note 8. Significant Risks
Credit Risk
Credit risk is the risk that the value of debt securities in the Fund's portfolio may decline because the issuer may default and fail to pay interest or repay principal when due. Rating agencies assign credit ratings to debt securities to indicate their credit risk. Lower rated or unrated debt securities held by the Fund may present increased credit risk as compared to higher-rated debt securities.
Interest Rate Risk
Interest rate risk is the risk of losses attributable to changes in interest rates. In general, if prevailing interest rates rise, the values of debt securities tend to fall, and if interest rates fall, the values of debt securities tend to rise. Actions by governments and central banking authorities can result in increases in interest rates. Increasing interest rates may negatively affect the value of debt securities held by the Fund, resulting in a negative impact on the Fund's performance and net asset value per share. In general, the longer the maturity or duration of a debt security, the greater its sensitivity to changes in interest rates.
Liquidity Risk
Liquidity risk is the risk associated with a lack of marketability of investments which may make it difficult to sell the investment at a desirable time or price. Changing regulatory, market or other conditions or environments (for example, the interest rate or credit environments) may adversely affect the liquidity of the Fund's investments. The Fund may have to accept a lower selling price for the holding, sell other investments, or forego another, more appealing investment opportunity. Generally, the less liquid the market at the time the Fund sells a portfolio investment, the greater
the risk of loss or decline of value to the Fund. A less liquid market can lead to an increase in Fund redemptions, which may negatively impact Fund performance and net asset value per share, including, for example, if the Fund is forced to sell securities in a down market.
Non-Diversification Risk
A non-diversified fund is permitted to invest a greater percentage of its total assets in fewer issuers than a diversified fund. The Fund may, therefore, have a greater risk of loss from a few issuers than a similar fund that invests more broadly.
Social Impact Risk
Social impact investing may increase risk due to the limitations and contraints involved in investment selection and, as a result, the Fund may underperform other funds that do not consider the social impact.
Note 9. Subsequent Events
Management has evaluated the events and transactions that have occurred through the date the financial statements were issued and noted no items requiring adjustment of the financial statements or additional disclosure.
Note 10. Information Regarding Pending and Settled Legal Proceedings
In December 2005, without admitting or denying the allegations, American Express Financial Corporation (AEFC, which is now known as Ameriprise Financial, Inc. (Ameriprise Financial)) entered into settlement agreements with the Securities and Exchange Commission (SEC) and Minnesota Department of Commerce (MDOC) related to market timing activities. As a result, AEFC was censured and ordered to cease and desist from committing or causing any violations of certain provisions of the Investment Advisers Act of 1940, the Investment Company Act of 1940, and various Minnesota laws. AEFC agreed to pay disgorgement of $10 million and civil money penalties of $7 million. AEFC also agreed to retain an independent distribution consultant to assist in developing a plan for distribution of all disgorgement and civil penalties ordered by the SEC in accordance with various undertakings detailed at http://www.sec.gov/litigation/admin/ia-2451.pdf. Ameriprise Financial and its affiliates have cooperated with the SEC and the MDOC in these legal proceedings, and have made regular reports to the Funds' Boards of Trustees.
Annual Report 2015
25
COLUMBIA U.S. SOCIAL BOND FUND
NOTES TO FINANCIAL STATEMENTS (continued)
July 31, 2015
Ameriprise Financial and certain of its affiliates have historically been involved in a number of legal, arbitration and regulatory proceedings, including routine litigation, class actions, and governmental actions, concerning matters arising in connection with the conduct of their business activities. Ameriprise Financial believes that the Funds are not currently the subject of, and that neither Ameriprise Financial nor any of its affiliates are the subject of, any pending legal, arbitration or regulatory proceedings that are likely to have a material adverse effect on the Funds or the ability of Ameriprise Financial or its affiliates to perform under their contracts with the Funds. Ameriprise Financial is required to make quarterly (10-Q), annual (10-K) and, as necessary, 8-K filings with the SEC on legal and regulatory matters that relate to Ameriprise Financial and its affiliates. Copies of these filings may be obtained by accessing the SEC website at www.sec.gov.
There can be no assurance that these matters, or the adverse publicity associated with them, will not result in increased fund redemptions, reduced sale of fund shares or other adverse consequences to the Funds. Further, although we believe proceedings are not likely to have a material adverse effect on the Funds or the ability of Ameriprise Financial or its affiliates to perform under their contracts with the Funds, these proceedings are subject to uncertainties and, as such, we are unable to estimate the possible loss or range of loss that may result. An adverse outcome in one or more of these proceedings could result in adverse judgments, settlements, fines, penalties or other relief that could have a material adverse effect on the consolidated financial condition or results of operations of Ameriprise Financial.
Annual Report 2015
26
COLUMBIA U.S. SOCIAL BOND FUND
REPORT OF INDEPENDENT REGISTERED PUBLIC ACCOUNTING FIRM
To the Trustees of Columbia Funds Series Trust I and the Shareholders of
Columbia U.S. Social Bond Fund
In our opinion, the accompanying statement of assets and liabilities, including the portfolio of investments, and the related statements of operations and of changes in net assets and the financial highlights present fairly, in all material respects, the financial position of Columbia U.S. Social Bond Fund (the "Fund," a series of Columbia Funds Series Trust I) at July 31, 2015, the results of its operations, the changes in its net assets and the financial highlights for the period March 26, 2015 (commencement of operations) through July 31, 2015, in conformity with accounting principles generally accepted in the United States of America. These financial statements and financial highlights (hereafter referred to as "financial statements") are the responsibility of the Fund's management. Our responsibility is to express an opinion on these financial statements based on our audit. We conducted our audit of these financial statements in accordance with the standards of the Public Company Accounting Oversight Board (United States). Those standards require that we plan and perform the audit to obtain reasonable assurance about whether the financial statements are free of material misstatement. An audit includes examining, on a test basis, evidence supporting the amounts and disclosures in the financial statements, assessing the accounting principles used and significant estimates made by management, and evaluating the overall financial statement presentation. We believe that our audit which included confirmation of securities at July 31, 2015 by correspondence with the custodian and brokers, provides a reasonable basis for our opinion.
PricewaterhouseCoopers LLP
Minneapolis, Minnesota
September 21, 2015
Annual Report 2015
27
COLUMBIA U.S. SOCIAL BOND FUND
FEDERAL INCOME TAX INFORMATION
(Unaudited)
The Fund hereby designates the following tax attributes for the fiscal year ended July 31, 2015. Shareholders will be notified in early 2016 of the amounts for use in preparing 2015 income tax returns.
Tax Designations:
| Exempt-Interest Dividends | | | 86.85 | % | |
Exempt-Interest Dividends. The percentage of net investment income distributed during the fiscal year that qualifies as exempt-interest dividends for federal income tax purposes. A portion of the income may be subject to federal alternative minimum tax.
Annual Report 2015
28
COLUMBIA U.S. SOCIAL BOND FUND
The Trustees serve terms of indefinite duration. The names and birth years of the Trustees and Officers of the Funds in Columbia Funds Series Trust I, the year each was first elected or appointed to office, their principal business occupations during at least the last five years, the number of Funds overseen by each Trustee and other directorships they hold are shown below. Each officer listed below serves as an officer of each Fund in Columbia Funds Series Trust I. The mailing address of each Trustee is: c/o Columbia Management Investment Advisers, LLC, 225 Franklin Street, Mail Drop BX32 05228, Boston, MA 02110.
Independent Trustees
Name, Year of Birth
and Position Held
with the Trust | | Year First
Appointed or
Elected as
Trustee to any
Fund Currently
in the Columbia
Funds Complex
or a Predecessor
Thereof | | Principal Occupation(s)
during the Past Five Years | | Number
of Funds
in the
Columbia
Funds
Complex
Overseen | | Other Directorships
Held by Trustee During
the Past Five Years | |
Janet Langford Carrig
(Born 1957)
Trustee | | | 1996 | | | Senior Vice President, General Counsel and Corporate Secretary, ConocoPhillips (integrated energy company) since September 2007; Deputy General Counsel — Corporate Legal Services, ConocoPhillips from August 2006 to August 2007; Partner, Zelle, Hofmann, Voelbel, Mason & Gette LLP (law firm) from March 2005 to July 2006; Adjunct Professor of Law, Northwestern University from September 2004 to June 2006; Director, UAL Corporation (airline) from February 2006 to July 2006; Chief Administrative Officer and Senior Vice President, Kmart Holding Corporation (consumer goods) from September 2003 to March 2004 | | | 60 | | | None | |
Douglas A. Hacker
(Born 1955)
Trustee and Chairman
of the Board | | | 1996 | | | Independent business executive since May 2006; Executive Vice President — Strategy of United Airlines from December 2002 to May 2006; President of UAL Loyalty Services (airline marketing company) from September 2001 to December 2002; Executive Vice President and Chief Financial Officer of United Airlines from July 1999 to September 2001 | | | 60 | | | Spartan Nash Company, (food distributor); Nash Finch Company (food distributor) from 2005 to 2013; Aircastle Limited (aircraft leasing); SeaCube Container Leasing Ltd. (container leasing) from 2010 to 2013; and Travelport Worldwide Limited (travel information technology) | |
Nancy T. Lukitsh
(Born 1956)
Trustee | | | 2011 | | | Senior Vice President, Partner and Director of Marketing, Wellington Management Company, LLP (investment adviser) from 1997 to 2010; Chair, Wellington Management Investment Portfolios (commingled non-U.S. investment pools) from 2007 to 2010; Director, Wellington Trust Company, NA and other Wellington affiliates from 1997 to 2010 | | | 60 | | | None | |
William E. Mayer
(Born 1940)
Trustee | | | 1991 | | | Partner, Park Avenue Equity Partners (private equity) since February 1999 | | | 60 | | | DynaVox Inc. (speech creation); Lee Enterprises (print media); WR Hambrecht + Co. (financial service provider) from 2000 to 2012; BlackRock Kelso Capital Corporation (investment company); and Premier, Inc. (healthcare) | |
Annual Report 2015
29
COLUMBIA U.S. SOCIAL BOND FUND
TRUSTEES AND OFFICERS (continued)
Independent Trustees (continued)
Name, Year of Birth
and Position Held
with the Trust | | Year First
Appointed or
Elected as
Trustee to any
Fund Currently
in the Columbia
Funds Complex
or a Predecessor
Thereof | | Principal Occupation(s)
during the Past Five Years | | Number
of Funds
in the
Columbia
Funds
Complex
Overseen | | Other Directorships
Held by Trustee During
the Past Five Years | |
David M. Moffett
(Born 1952)
Trustee | | | 2011 | | | Retired. Consultant to Bridgewater and Associates; Chief Executive Officer, Federal Home Loan Mortgage Corporation, from 2008 to 2009; Senior Adviser, Global Financial Services Group, Carlyle Group, Inc., from 2007 to 2008; Vice Chairman and Chief Financial Officer, U.S. Bancorp, from 1993 to 2007 | | | 60 | | | Building Materials Holding Corp. (building materials and construction services); CIT Group Inc. (commercial and consumer finance); eBay Inc. (online trading community); E.W. Scripps Co. (print and television media); Genworth Financial, Inc. (financial and insurance products and services); MBIA Inc. (financial service provider); Paypal Holdings Inc. (payment and data processing services); and University of Oklahoma Foundation | |
Charles R. Nelson
(Born 1942)
Trustee | | | 1981 | | | Retired. Professor Emeritus, University of Washington since 2011; Professor of Economics, University of Washington from 1976 to 2011; Ford and Louisa Van Voorhis Professor of Political Economy, University of Washington from 1993 to 2011; Adjunct Professor of Statistics, University of Washington from 1980 to 2011; Associate Editor, Journal of Money, Credit and Banking from September 1993 to 2008; consultant on econometric and statistical matters | | | 60 | | | None | |
John J. Neuhauser
(Born 1943)
Trustee | | | 1984 | | | President, Saint Michael's College since August 2007; Director or Trustee of several non-profit organizations, including Fletcher Allen Health Care, Inc.; Academic Vice President and Dean of Faculties, Boston College from August 1999 to October 2005; University Professor, Boston College from November 2005 to August 2007 | | | 60 | | | Liberty All-Star Equity Fund and Liberty All-Star Growth Fund (closed-end funds) | |
Patrick J. Simpson
(Born 1944)
Trustee | | | 2000 | | | Partner, Perkins Coie LLP (law firm) | | | 60 | | | None | |
Anne-Lee Verville
(Born 1945)
Trustee | | | 1998 | | | Retired. General Manager, Global Education Industry from 1994 to 1997, President — Application Systems Division from 1991 to 1994, Chief Financial Officer — US Marketing & Services from 1988 to 1991, and Chief Information Officer from 1987 to 1988, IBM Corporation (computer and technology) | | | 60 | | | Enesco Group, Inc. (producer of giftware and home and garden decor products) from 2001 to 2006 | |
Annual Report 2015
30
COLUMBIA U.S. SOCIAL BOND FUND
TRUSTEES AND OFFICERS (continued)
Interested Trustee Affiliate with Investment Manager*
Name, Year of Birth
and Position Held
with the Trust | | Year First
Appointed or
Elected as
Trustee to any
Fund Currently
in the Columbia
Funds Complex
or a Predecessor
Thereof | | Principal Occupation(s)
during the Past Five Years | | Number
of Funds
in the
Columbia
Funds
Complex
Overseen | | Other Directorships
Held by Trustee During
the Past Five Years | |
William F. Truscott
(Born 1960)
Trustee | | | 2012 | | | Chairman of the Board and President, Columbia Management Investment Advisers, LLC since May 2010 and February 2012, respectively (previously President and Chief Investment Officer, 2001-April 2010); Chief Executive Officer, Global Asset Management, Ameriprise Financial, Inc. since September 2012 (previously Chief Executive Officer, U.S. Asset Management & President, Annuities, May 2010-September 2012 and President — U.S. Asset Management and Chief Investment Officer, 2005-April 2010); Director and Chief Executive Officer, Columbia Management Investment Distributors, Inc. since May 2010 and February 2012, respectively (previously Chairman of the Board and Chief Executive Officer, 2006-April 2010); Chairman of the Board and Chief Executive Officer, RiverSource Distributors, Inc. since 2006; Director, Threadneedle Asset Management Holdings, SARL since 2014; President and Chief Executive Officer, Ameriprise Certificate Company, 2006-August 2012 | | | 187 | | | Chairman of the Board, Columbia Management Investment Advisers, LLC since May 2010; Director, Columbia Management Investment Distributors, Inc. since May 2010; Director, Ameriprise Certificate Company, 2006 to January 2013 | |
* Interested person (as defined under the 1940 Act) by reason of being an officer, director, security holder and/or employee of the Investment Manager or Ameriprise Financial.
The Statement of Additional Information has additional information about the Fund's Board members and is available, without charge, upon request by calling 800.345.6611; contacting your financial intermediary; or visiting columbiathreadneedle.com/us.
The Board has appointed officers who are responsible for day-to-day business decisions based on policies it has established. The officers serve at the pleasure of the Board. In addition to Mr. Truscott, who is Senior Vice President, the Funds' other officers are:
Fund Officers
Name,
Address and
Year of Birth | | Position and Year
First Appointed to
Position for any Fund
in the Columbia
Funds Complex or a
Predecessor Thereof | | Principal Occupation(s) During Past Five Years | |
Christopher O. Petersen
5228 Ameriprise
Financial Center
Minneapolis, MN 55474
Born 1970 | | President and Principal Executive Officer (2015) | | Vice President and Lead Chief Counsel, Ameriprise Financial, Inc. since January 2015 (previously, Vice President and Chief Counsel January 2010-December 2014; and Vice President and Group Counsel or Counsel 2004- January 2010); officer of Columbia Funds and affiliated funds since 2007. | |
Michael G. Clarke
225 Franklin Street
Boston, MA 02110
Born 1969 | | Treasurer (2011) and Chief Financial Officer (2009) | | Vice President — Mutual Fund Administration, Columbia Management Investment Advisers, LLC, since May 2010; Managing Director of Fund Administration, Columbia Management Advisors, LLC, September 2004-April 2010; senior officer of Columbia Funds and affiliated funds since 2002. | |
Annual Report 2015
31
COLUMBIA U.S. SOCIAL BOND FUND
TRUSTEES AND OFFICERS (continued)
Fund Officers (continued)
Name,
Address and
Year of Birth | | Position and Year
First Appointed to
Position for any Fund
in the Columbia
Funds Complex or a
Predecessor Thereof | | Principal Occupation(s) During Past Five Years | |
Paul B. Goucher
100 Park Avenue
New York, NY 10017
Born 1968 | | Senior Vice President (2011), Chief Legal Officer (2015) and Assistant Secretary (2008) | | Vice President and Lead Chief Counsel, Ameriprise Financial, Inc. since November 2008 and January 2013, respectively (previously Chief Counsel, January 2010-January 2013 and Group Counsel, November 2008-January 2010). | |
Thomas P. McGuire
225 Franklin Street
Boston, MA 02110
Born 1972 | | Vice President and Chief Compliance Officer (2012) | | Vice President — Asset Management Compliance, Ameriprise Financial, Inc., since May 2010; Chief Compliance Officer, Ameriprise Certificate Company since September 2010; Compliance Executive, Bank of America, 2005-April 2010. | |
Colin Moore
225 Franklin Street
Boston, MA 02110
Born 1958 | | Senior Vice President (2010) | | Executive Vice President and Global Chief Investment Officer, Ameriprise Financial, Inc., since July 2013; Director and Global Chief Investment Officer, Columbia Management Investment Advisers, LLC since May 2010; Manager, Managing Director and Chief Investment Officer, Columbia Management Advisors, LLC, 2007-April 2010. | |
Michael E. DeFao
225 Franklin Street
Boston, MA 02110
Born 1968 | | Vice President (2011) and Assistant Secretary (2010) | | Vice President and Chief Counsel, Ameriprise Financial, Inc. since May 2010; Associate General Counsel, Bank of America, 2005-April 2010. | |
Joseph F. DiMaria
225 Franklin Street
Boston, MA 02110
Born 1968 | | Vice President (2011), Assistant Treasurer (2012) and Chief Accounting Officer (2008) | | Vice President — Mutual Fund Treasurer, Columbia Management Investment Advisers, LLC since May 2010; Director of Fund Administration, Columbia Management Advisors, LLC, 2006-April 2010. | |
Amy Johnson
5228 Ameriprise
Financial Center
Minneapolis, MN 55474
Born 1965 | | Vice President (2006) | | Managing Director and Chief Operating Officer, Columbia Management Investment Advisers, LLC since May 2010 (previously Chief Administrative Officer, 2009-April 2010, and Vice President — Asset Management and Trust Company Services, 2006-2009). | |
Lyn Kephart-Strong
5228 Ameriprise
Financial Center
Minneapolis, MN 55474
Born 1960 | | Vice President (2015) | | President, Columbia Management Investment Services Corp. since October 2014; Vice President & Resolution Officer, Ameriprise Trust Company since August 2009; President, RiverSource Service Corporation 2004-2010. | |
Ryan C. Larrenaga
225 Franklin Street
Boston, MA 02110
Born 1970 | | Vice President and Secretary (2015) | | Vice President and Group Counsel, Ameriprise Financial, Inc. since August 2011 (previously, Counsel from May 2010 to August 2011); Assistant General Counsel, Bank of America, 2005-April 2010; officer of Columbia Funds and affiliated funds since 2005. | |
Annual Report 2015
32
COLUMBIA U.S. SOCIAL BOND FUND
BOARD CONSIDERATION AND APPROVAL OF ADVISORY AGREEMENT AND SUBADVISORY AGREEMENT
On March 4, 2015, the Board of Trustees (the Board) and the Trustees who are not interested persons (as defined in the Investment Company Act of 1940) (the Independent Trustees) of Columbia Funds Series Trust I (the Trust) unanimously approved the Investment Management Services Agreement (the Advisory Agreement) with Columbia Management Investment Advisers, LLC (the Investment Manager) and the Subadvisory Agreement (the Subadvisory Agreement) between the Investment Manager and Threadneedle International Limited (the Subadviser) with respect to Columbia U.S. Social Bond Fund (the Fund), a series of the Trust. On June 10, 2015, the Board and the Independent Trustees unanimously approved an agreement (the Management Agreement) combining the Advisory Agreement and the Fund's administrative services agreement (the Administrative Services Agreement) in a single agreement. The Board and the Independent Trustees approved the Management Agreement to be effective for the Fund on December 1, 2015, the Fund's next annual prospectus update. As detailed below, the Board's Advisory Fees and Expenses Committee (the Committee) and the Board met to review and discuss, both among themselves and with the management team of the Investment Manager, materials provided by the Investment Manager before determining to approve the Management Agreement, Advisory Agreement and the Subadvisory Agreement (collectively, the Agreements).
In connection with their deliberations regarding the proposed Agreements, the Committee and the Board evaluated materials requested from the Investment Manager regarding the Fund and the Agreements, and discussed these materials, as well as other materials provided by the Investment Manager in connection with the Board's most recent and its upcoming annual approval of the continuation of the advisory agreements with respect to other series of the Trust, with representatives of the Investment Manager at the Committee meetings held on March 3, 2015 and June 9, 2015, and at the Board meetings held on March 4, 2015 and June 10, 2015. The Committee and the Board also consulted with Fund counsel and with the Independent Trustees' independent legal counsel, who advised on various matters with respect to the Committee's and the Board's considerations and otherwise assisted the Committee and the Board in their deliberations. On March 4, 2015 and June 10, 2015, the Board, including the Independent Trustees, voting separately, approved the Agreements for the Fund.
The Committee and the Board considered all information that they, their legal counsel, or the Investment Manager believed reasonably necessary to evaluate and to determine whether to approve the Agreements. The information and factors considered by the Committee and the Board in recommending for approval or approving the Agreements for the Fund included the following:
• Information regarding the reputation, financial strength, regulatory history and resources of the Investment Manager and the Subadviser, including information regarding senior management, portfolio managers and other personnel proposed to provide investment management, administrative and other services to the Fund;
• Information regarding the capabilities of the Investment Manager and the Subadviser with respect to compliance monitoring services, including an assessment of the Investment Manager's and the Subadviser's compliance system by the Fund's Chief Compliance Officer;
• The terms and conditions of the Agreements;
• The current and proposed terms and conditions of other agreements and arrangements with affiliates of the Investment Manager relating to the operations of the Fund, including the Administrative Services Agreement1, the Distribution Agreement and the Transfer and Dividend Disbursing Agent Agreement;
• The Investment Manager's agreement to contractually limit or cap total operating expenses for the Fund through November 30, 2016, so that total operating expenses (excluding certain fees and expenses, such as transaction costs and certain other investment related expenses, interest, taxes, acquired fund fees and expenses, and extraordinary expenses) would not exceed an annual rate of 0.95% for Class A, 1.70% for Class C, 0.70% for Class R4, 0.60% for Class R5 and 0.70% for Class Z;
• Descriptions of various functions performed by the Investment Manager and the Subadviser under the Agreements, including portfolio management and portfolio trading practices;
1 Like the Advisory Agreement, the Administrative Services Agreement will terminate with respect to the Fund once the Management Agreement is effective for the Fund.
Annual Report 2015
33
COLUMBIA U.S. SOCIAL BOND FUND
BOARD CONSIDERATION AND APPROVAL OF ADVISORY AGREEMENT AND SUBADVISORY AGREEMENT (continued)
• Information regarding the management fees and investment performance of comparable portfolios of other clients of the Investment Manager; and
• Information regarding the investment management fees and other expenses of the Fund relative to those of comparable funds determined by the independent third-party data provider to be in the same peer group or universe of funds.
Nature, Extent and Quality of Services to be Provided under the Agreements
The Committee and the Board considered the nature, extent and quality of services to be provided to the Fund by the Investment Manager and the Subadviser and the Investment Manager's affiliates under the Agreements and under separate agreements for the provision of transfer agency and administrative services, and the similar type of services currently provided by the Investment Manager to other funds in the fund complex, and the resources dedicated to the Fund and the other Columbia Funds by the Investment Manager and the Subadviser and the Investment Manager's affiliates. The Committee and the Board also determined that the nature and level of the services to be provided under the Management Agreement would not decrease relative to the services provided under the Advisory Agreement and the Administrative Services Agreement. The Committee and the Board considered, among other things, the Investment Manager's ability to attract, motivate and retain highly qualified research, advisory and supervisory investment professionals (including personnel and other resources, compensation programs for personnel involved in fund management, reputation and other attributes), the portfolio management services provided by those investment professionals, and the quality of the Investment Manager's investment research capabilities and trade execution services. The Committee and the Board also considered the potential benefits to shareholders of investing in a mutual fund that is part of a fund complex offering exposure to a variety of asset classes and investment disciplines and providing a variety of fund and shareholder services.
The Committee and the Board also considered the professional experience and qualifications of the senior personnel of the Investment Manager and the Subadviser, which included consideration of the Investment Manager's and the Subadviser's experience with similarly-structured funds. The Committee and the Board noted the compliance programs of and the compliance-related resources provided to the Fund by the Investment Manager and its affiliates, and considered the Investment Manager's ability to provide administrative services to the Fund and coordinate the activities of the Fund's other service providers. The Committee and the Board also noted that the Board had approved the Subadviser's code of ethics and compliance program, and that the Chief Compliance Officer of the Funds monitors the code of ethics and compliance program. In evaluating the nature, extent and quality of services provided under the Agreements, the Committee and the Board considered that these services were provided to the Fund, rather than directly to Fund shareholders. The Committee and the Board accordingly affirmed, after considering various other matters, including the potential benefits to the Fund and its shareholders of the Independent Trustees' important role as pre-suit gatekeepers with respect to claims that they may determine are meritless or contrary to the Fund's best interests, that it was not the intention of the Board or the Investment Manager that there be any third-party beneficiaries of the Agreements.
After reviewing these and related factors, the Committee and the Board concluded, within the context of their overall conclusions, that the expected nature, extent and quality of the services to be provided to the Fund under the Agreements supported the approval of the Agreements.
Advisory Fee Rates and Other Expenses
The Committee and the Board considered the advisory fees to be charged to the Fund under the Agreements as well as the total expenses expected to be incurred by the Fund. In assessing the reasonableness of the proposed fees under the Agreements, the Committee and the Board considered, among other information, the Fund's proposed advisory fee and its expected total expense ratio as a percentage of average daily net assets. The Committee and the Board also considered that the proposed management fee payable under the Management Agreement would not exceed the sum of the fee rates payable under the Advisory Agreement and the Administrative Services Agreement. The Board also took into account the proposed fee waiver and expense
Annual Report 2015
34
COLUMBIA U.S. SOCIAL BOND FUND
BOARD CONSIDERATION AND APPROVAL OF ADVISORY AGREEMENT AND SUBADVISORY AGREEMENT (continued)
limitation arrangements that the Investment Manager and Subadviser would observe during the Fund's first year, and the advisory fees and total expense ratios of comparable funds identified by the independent third-party data provider for purposes of expense comparison.
After reviewing these and related factors, the Committee and the Board concluded, within the context of their overall conclusions, that the advisory/management fee rates and expenses of the Fund supported the approval of the Agreements.
Costs of Services to be Provided and Profitability
The Committee and the Board considered information provided by the Investment Manager with respect to estimated costs of services and profitability, and expected to consider the costs of services and the profitability of the Investment Manager and its affiliates in connection with the Committee's and the Board's next review and consideration of the continuation of the Agreements. The Committee and the Board also considered court cases in which adviser profitability was an issue in whole or in part, the expected expense ratio of the Fund, and the implementation of expense limitations with respect to the Fund. The Committee and the Board also considered information provided by the Investment Manager regarding its financial condition.
After reviewing these and related factors, the Committee and the Board concluded, within the context of their overall conclusions, that the anticipated costs of services to be provided and the expected profitability to the Investment Manager and its affiliates from their relationships with the Fund supported the approval of the Agreements.
Investment Performance
Because the Fund had not yet commenced operations, the Committee and the Board did not have investment performance to compare to the returns of a group of comparable mutual funds. However, the Committee and the Board expected to consider, in connection with their next review and consideration of the continuation of the Agreements, the investment performance of the Fund in relation to the annualized return for various time periods of both a group of comparable funds, as determined by the independent third-party data provider, and a benchmark.
The Committee and the Board also considered the Investment Manager's performance and reputation generally, the Investment Manager's historical responsiveness to Board concerns about performance, and the Investment Manager's willingness to take steps intended to improve performance. After reviewing these and related factors, the Committee and the Board concluded, within the context of their overall conclusions, that the performance of the Investment Manager and the Subadviser supported approval of the Agreements.
Economies of Scale
The Committee and the Board considered the potential existence of economies of scale in the provision by the Investment Manager and its affiliates of services to the Fund, to groups of related funds, and to the investment advisory clients of the Investment Manager and its affiliates as a whole, and whether those economies of scale were expected to be shared with the Fund through breakpoints in the proposed investment advisory fees or other means, such as expense limitation arrangements and additional investments by the Investment Manager and its affiliates in investment, trading and compliance resources. The Committee and the Board noted that the investment management fee schedule for the Fund contained breakpoints that would reduce the fee rate on assets above specified threshold levels.
After reviewing these and related factors, the Committee and the Board concluded, within the context of their overall conclusions, that the extent to which any economies of scale were expected to be shared with the Fund supported the approval of the Agreements.
Other Benefits to the Investment Manager
The Committee and the Board received and considered information regarding "fall-out" or ancillary benefits to be received by the Investment Manager and its affiliates as a result of their relationships with the Fund, such as the
Annual Report 2015
35
COLUMBIA U.S. SOCIAL BOND FUND
BOARD CONSIDERATION AND APPROVAL OF ADVISORY AGREEMENT AND SUBADVISORY AGREEMENT (continued)
engagement of the Investment Manager to provide administrative services to the Fund and the engagement of the Investment Manager's affiliates to provide distribution and transfer agency services to the Fund. The Committee and the Board considered that the Fund's distributor retains a portion of the distribution fees from the Fund. The Committee and the Board also considered the benefits of research made available to the Investment Manager by reason of brokerage commissions to be generated by the Fund's securities transactions, and reviewed information about the Investment Manager's practices with respect to allocating portfolio transactions for brokerage and research services. The Committee and the Board considered the possible conflicts of interest associated with certain fall-out or other ancillary benefits and the reporting, disclosure and other processes that are in place to address such possible conflicts of interest. The Committee and the Board recognized that the Investment Manager's profitability would be somewhat lower without these benefits.
Conclusion
The Committee and the Board reviewed all of the above considerations in reaching their decision to recommend or approve the proposed Agreements. In their deliberations, the Trustees did not identify any particular information that was all-important or controlling, and individual Trustees may have attributed different weights to the various factors. Based on their evaluation of all factors that they deemed to be material, including those factors described above, and assisted by the advice of independent legal counsel, the Board, including the Independent Trustees, voting separately, approved the Agreements.
Annual Report 2015
36
COLUMBIA U.S. SOCIAL BOND FUND
IMPORTANT INFORMATION ABOUT THIS REPORT
Each fund mails one shareholder report to each shareholder address. If you would like more than one report, please call shareholder services at 800.345.6611 and additional reports will be sent to you.
The policy of the Board is to vote the proxies of the companies in which each fund holds investments consistent with the procedures as stated in the Statement of Additional Information (SAI). You may obtain a copy of the SAI without charge by calling 800.345.6611; contacting your financial intermediary; visiting columbiathreadneedle.com/us; or searching the website of the Securities and Exchange Commission (SEC) at sec.gov. Information regarding how each fund voted proxies relating to portfolio securities is filed with the SEC by August 31st for the most recent 12-month period ending June 30th of that year, and is available without charge by visiting columbiathreadneedle.com/us, or searching the website of the SEC at sec.gov.
Each fund files a complete schedule of portfolio holdings with the SEC for the first and third quarters of each fiscal year on Form N-Q. Each fund's Form N-Q is available on the SEC's website at sec.gov and may be reviewed and copied at the SEC's Public Reference Room in Washington, D.C. Information on the operation of the Public Reference Room may be obtained by calling 800.SEC.0330. Each fund's complete schedule of portfolio holdings, as filed on Form N-Q, can also be obtained without charge, upon request, by calling 800.345.6611.
Annual Report 2015
37
Columbia U.S. Social Bond Fund
P.O. Box 8081
Boston, MA 02266-8081

This information is for use with concurrent or prior delivery of a fund prospectus. Please read and consider the investment objectives, risks, charges and expenses for any fund carefully before investing. For a prospectus and summary prospectus, which contains this and other important information about the Fund, go to columbiathreadneedle.com/us. The Fund is distributed by Columbia Management Investment Distributors, Inc., member FINRA, and managed by Columbia Management Investment Advisers, LLC.
Columbia Threadneedle Investments (Columbia Threadneedle) is the global brand name of the Columbia and Threadneedle group of companies.
All rights reserved. Columbia Management Investment Distributors, Inc., 225 Franklin Street, Boston, MA 02110-2804
© 2015 Columbia Management Investment Advisers, LLC.
columbiathreadneedle.com/us
ANN262_07_E01_(09/15)

ANNUAL REPORT
July 31, 2015

COLUMBIA LARGE CAP GROWTH FUND

ABOUT COLUMBIA THREADNEEDLE INVESTMENTS
Columbia Threadneedle Investments is a leading global asset management group that provides a broad range of actively managed investment strategies and solutions for individual, institutional and corporate clients around the world.
With more than 2,000 people, including over 450 investment professionals based in North America, Europe and Asia, we manage $503 billion* of assets across developed and emerging market equities, fixed income, asset allocation solutions and alternatives. We are the 13th largest manager of long-term mutual fund assets in the U.S.** and the 4th largest manager of retail funds in the U.K.***
Our priority is the investment success of our clients. We aim to deliver the investment outcomes they expect through an investment approach that is team-based, performance-driven and risk-aware. Our culture is dynamic and interactive. By sharing our insights across asset classes and geographies, we generate richer perspectives on global, regional and local investment landscapes. The ability to exchange and debate investment ideas in a collaborative environment enriches our teams' investment processes. More importantly, it results in better informed investment decisions for our clients.
Columbia funds are distributed by Columbia Management Investment Distributors, Inc., member FINRA, and managed by Columbia Management Investment Advisers, LLC.
Columbia Threadneedle Investments (Columbia Threadneedle) is the global brand name of the Columbia and Threadneedle group of companies.
* In U.S. dollars as of June 30, 2015. Source: Ameriprise Q2 Earnings Release. Includes all assets managed by entities in the Columbia and Threadneedle groups of companies. Contact us for more current data.
** Source: ICI as of June 30, 2015 for Columbia Management Investment Advisers, LLC.
*** Source: Investment Association as of June 2015 for Threadneedle Asset Management Limited.
© 2015 Columbia Management Investment Advisers, LLC. All rights reserved.
Not part of the shareholder report
 Dear Shareholder,
Today's investors are typically focused on outcomes, like living a certain retirement lifestyle, paying for college education or building a legacy. But in today's complex global investment landscape, even simple goals are not easily achieved.
At Columbia Threadneedle Investments, we aspire to help satisfy five core needs of today's investors:
n Generate an appropriate stream of income in retirement
Traditional approaches to generating income may not provide the diversification benefits they once did, and may actually introduce unwanted risk in today's market. To seek to improve your potential to live comfortably long term, we endeavor to pursue investments that explore less traveled paths to income.
n Navigate a changing interest rate environment
Today's uncertain market environment includes the prospect of a rise in interest rates. Blending traditional investments with non-traditional or alternative products may help protect your wealth during periods of volatility. We can attempt to help strengthen your portfolio with agile products designed to take on the market's ups and downs.
n Maximize after-tax returns
In an environment where what you keep may be more important than what you earn, municipal bonds can help mitigate high tax burdens while providing potentially attractive yields. Our state and federal tax-exempt products are aimed at helping investors manage risk, minimize the fluctuation of capital and grow wealth on a more tax-efficient basis.
n Grow assets to achieve financial goals
We believe that finding and protecting growth comes from a disciplined security selection process designed to create excess return. Our goal is to provide investment solutions built to help you face today's market challenges and grow your assets at each crossroad of your journey.
n Ease the impact of volatile markets
Despite a bull market run that has benefited many investors over the past several years, it's important to remember the lessons of 2008 and the value that a well-diversified portfolio may provide through times of market volatility. We are here to help you hold onto the savings you have worked tirelessly to amass, and to provide you the best opportunity to maintain your standard of living regardless of market conditions.
Find out today how we can help you confidently invest to realize your dreams. Please visit us at blog.columbiathreadneedleus.com/our-best-ideas to learn more about our unique investment solutions.
The world is constantly changing, but our priority remains the same: to help you secure your finances, meet your goals and achieve success. Thank you for your continued investment with us.
Sincerely,

Christopher O. Petersen
President, Columbia Funds
Investors should consider the investment objectives, risks, charges and expenses of a mutual fund carefully before investing. For a free prospectus and summary prospectus, which contains this and other important information about a fund, visit columbiathreadneedle.com/us. The prospectus should be read carefully before investing.
Columbia Funds are distributed by Columbia Management Investment Distributors, Inc., member FINRA, and managed by Columbia Management Investment Advisers, LLC.
© 2015 Columbia Management Investment Advisers, LLC. All rights reserved.
COLUMBIA LARGE CAP GROWTH FUND
Fund Investment Manager
Columbia Management Investment
Advisers, LLC
225 Franklin Street
Boston, MA 02110
Fund Distributor
Columbia Management Investment
Distributors, Inc.
225 Franklin Street
Boston, MA 02110
Fund Transfer Agent
Columbia Management Investment
Services Corp.
P.O. Box 8081
Boston, MA 02266-8081
For more information about any of the funds, please visit columbiathreadneedle.com/us or call 800.345.6611. Customer Service Representatives are available to answer your questions Monday through Friday from 8 a.m. to 7 p.m. Eastern time.
The views expressed in this report reflect the current views of the respective parties. These views are not guarantees of future performance and involve certain risks, uncertainties and assumptions that are difficult to predict, so actual outcomes and results may differ significantly from the views expressed. These views are subject to change at any time based upon economic, market or other conditions and the respective parties disclaim any responsibility to update such views. These views may not be relied on as investment advice and, because investment decisions for a Columbia fund are based on numerous factors, may not be relied on as an indication of trading intent on behalf of any particular Columbia fund. References to specific securities should not be construed as a recommendation or investment advice.
Performance Overview | | | 3 | | |
Manager Discussion of Fund Performance | | | 5 | | |
Understanding Your Fund's Expenses | | | 7 | | |
Portfolio of Investments | | | 8 | | |
Statement of Assets and Liabilities | | | 12 | | |
Statement of Operations | | | 15 | | |
Statement of Changes in Net Assets | | | 16 | | |
Financial Highlights | | | 19 | | |
Notes to Financial Statements | | | 33 | | |
Report of Independent Registered
Public Accounting Firm | | | 42 | | |
Federal Income Tax Information | | | 43 | | |
Trustees and Officers | | | 44 | | |
Board Consideration and Approval of Advisory Agreement | | | 48 | | |
Important Information About This Report | | | 53 | | |
COLUMBIA LARGE CAP GROWTH FUND
Performance Summary
n Columbia Large Cap Growth Fund (the Fund) Class A shares returned 22.51% excluding sales charges for the 12-month period that ended July 31, 2015.
n The Fund outperformed its benchmark, the Russell 1000 Growth Index, which returned 16.08% during the same time period.
n Stock selection generally accounted for the Fund's significant performance advantage over the benchmark.
Average Annual Total Returns (%) (for period ended July 31, 2015)
| | | Inception | | 1 Year | | 5 Years | | 10 Years | |
Class A | | 11/01/98 | | | | | | | | | | | | | |
Excluding sales charges | | | | | | | 22.51 | | | | 17.81 | | | | 8.89 | | |
Including sales charges | | | | | | | 15.45 | | | | 16.43 | | | | 8.24 | | |
Class B | | 11/01/98 | | | | | | | | | | | | | |
Excluding sales charges | | | | | | | 21.57 | | | | 16.92 | | | | 8.08 | | |
Including sales charges | | | | | | | 16.57 | | | | 16.70 | | | | 8.08 | | |
Class C | | 11/18/02 | | | | | | | | | | | | | |
Excluding sales charges | | | | | | | 21.59 | | | | 16.92 | | | | 8.07 | | |
Including sales charges | | | | | | | 20.59 | | | | 16.92 | | | | 8.07 | | |
Class E* | | 09/22/06 | | | | | | | | | | | | | |
Excluding sales charges | | | | | | | 22.37 | | | | 17.69 | | | | 8.78 | | |
Including sales charges | | | | | | | 16.88 | | | | 16.61 | | | | 8.29 | | |
Class F* | | 09/22/06 | | | | | | | | | | | | | |
Excluding sales charges | | | | | | | 21.57 | | | | 16.92 | | | | 8.07 | | |
Including sales charges | | | | | | | 16.57 | | | | 16.71 | | | | 8.07 | | |
Class I* | | 09/27/10 | | | 23.00 | | | | 18.33 | | | | 9.27 | | |
Class K* | | 03/07/11 | | | 22.66 | | | | 17.99 | | | | 9.05 | | |
Class R* | | 09/27/10 | | | 22.20 | | | | 17.53 | | | | 8.59 | | |
Class R4* | | 11/08/12 | | | 22.80 | | | | 18.12 | | | | 9.17 | | |
Class R5* | | 03/07/11 | | | 22.95 | | | | 18.27 | | | | 9.24 | | |
Class T | | 12/14/90 | | | | | | | | | | | | | |
Excluding sales charges | | | | | | | 22.49 | | | | 17.76 | | | | 8.84 | | |
Including sales charges | | | | | | | 15.45 | | | | 16.38 | | | | 8.19 | | |
Class W* | | 09/27/10 | | | 22.47 | | | | 17.84 | | | | 8.93 | | |
Class Y* | | 07/15/09 | | | 23.03 | | | | 18.34 | | | | 9.29 | | |
Class Z | | 12/14/90 | | | 22.80 | | | | 18.10 | | | | 9.16 | | |
Russell 1000 Growth Index | | | | | | | 16.08 | | | | 17.75 | | | | 8.95 | | |
Returns for Class A and T are shown with and without the maximum initial sales charge of 5.75%. Returns for Class E are shown with and without the maximum sales charge of 4.50%. Returns for Class B and Class F are shown with and without the applicable contingent deferred sales charge (CDSC) of 5.00% in the first year, declining to 1.00% in the sixth year and eliminated thereafter. Returns for Class C are shown with and without the 1.00% CDSC for the first year only. The Fund's other classes are not subject to sales charges and have limited eligibility. Please see the Fund's prospectus for details. Performance for different share classes will vary based on differences in sales charges and fees associated with each class. All results shown assume reinvestment of distributions during the period. Returns do not reflect the deduction of taxes that a shareholder may pay on Fund distributions or on the redemption of Fund shares. Performance results reflect the effect of any fee waivers or reimbursements of Fund expenses by Columbia Management Investment Advisers, LLC and/or any of its affiliates. Absent these fee waivers or expense reimbursement arrangements, performance results would have been lower.
The performance information shown represents past performance and is not a guarantee of future results. The investment return and principal value of your investment will fluctuate so that your shares, when redeemed, may be worth more or less than their original cost. Current performance may be lower or higher than the performance information shown. You may obtain performance information current to the most recent month-end by contacting your financial intermediary, visiting columbiathreadneedle.com/us or calling 800.345.6611.
*The returns shown for periods prior to the share class inception date (including returns for the Life of the Fund, if shown, which are since Fund inception) include the returns of the Fund's oldest share class. Since the Fund launched more than one share class at its inception, Class Z shares were used. These returns are adjusted to reflect any higher class-related operating expenses of the newer share classes, as applicable. Please visit columbiathreadneedle.com/us/investment-products/mutual-funds/appended-performance for more information.
The Russell 1000 Growth Index, an unmanaged index, measures the performance of those Russell 1000 Index companies with higher price-to-book ratios and higher forecasted growth values.
Indices are not available for investment, are not professionally managed and do not reflect sales charges, fees, brokerage commissions, taxes or other expenses of investing. Securities in the Fund may not match those in an index.
Annual Report 2015
3
COLUMBIA LARGE CAP GROWTH FUND
PERFORMANCE OVERVIEW (continued)
Performance of a Hypothetical $10,000 Investment (August 1, 2005 – July 31, 2015)
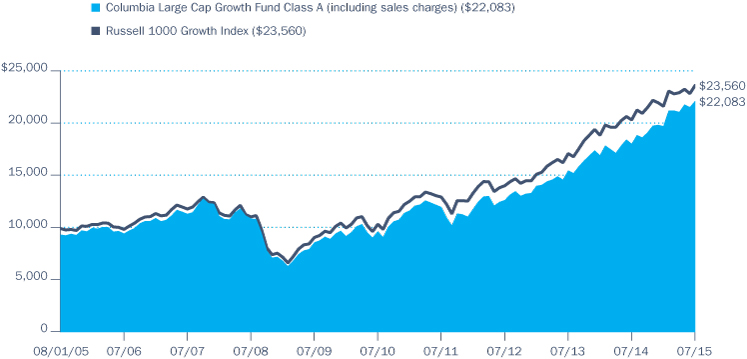
The chart above shows the change in value of a hypothetical $10,000 investment in Class A shares of Columbia Large Cap Growth Fund during the stated time period, and does not reflect the deduction of taxes that a shareholder may pay on Fund distributions or on the redemption of Fund shares.
Annual Report 2015
4
COLUMBIA LARGE CAP GROWTH FUND
MANAGER DISCUSSION OF FUND PERFORMANCE
For the 12-month period that ended July 31, 2015, the Fund's Class A shares returned 22.51% excluding sales charges. The Fund outperformed its benchmark, the Russell 1000 Growth Index, which returned 16.08% during the same period. Stock selection in the information technology, health care and industrials sectors aided results relative to the benchmark, as did modest overweight positions in information technology and health care. Both sectors were top performers for the year.
Stocks Climbed in Volatile Environment
After a strong start, the pace of U.S. economic growth fluctuated during the 12-month period that ended July 31, 2015. Another stormy winter in the Northeast and Midwest whittled away at gross domestic product (GDP) early in 2015. A strong dollar, a widening trade deficit and declining oil prices also negatively impacted growth. Yet most of these setbacks proved to be temporary as the U.S. economy rebounded in the second quarter of 2015. An average of 243,000 new jobs were added monthly to the U.S. workforce, driving the unemployment rate down to 5.3%. With the labor market tightening, wage pressures increased. The housing market continued to recover, even though first-time home buyers have yet to enter the market in large numbers. Home sales rose and pending sales also trended higher.
Against this backdrop, investors bid up stock prices in the first nine months of the period. However, volatility ensued as concerns about a sluggish global economy and uncertainty about the timing of a Federal Reserve interest rate hike became more pronounced during the final months of the 12-month period. The general expectation has been for an increase in short-term interest rates sometime in the fall of 2015. Against this backdrop, growth stocks outperformed value stocks by a comfortable margin.
Stock Selection Drove Favorable Results
Stock selection was favorable across most sectors represented in the Fund. It was particularly strong in the information technology, health care and industrials sectors. Within information technology, Electronic Arts continued to deliver outstanding results. An overweight in the stock amplified the impact of its gains on Fund returns. Electronic Arts develops, markets, publishes and distributes video games. Investors continued to respond favorably to the company's strong earnings and solid margin improvement. Red Hat and Salesforce.com, both cloud-related software companies, were also strong contributors. Both have been in a sweet spot of productivity enhancement and technological architecture changes, which have driven strong revenue and earnings growth. A structural shift toward software spending has also benefited both companies. Salesforce.com is a leader in sales force productivity measurement and improvement. Red Hat is a leading enterprise infrastructure software company. Avago Technologies, NXP Semiconductors and Broadcom were strong performers within the semiconductor industry. The Fund gained ground with an overweight in Broadcom, which was acquired at a premium by Avago Technologies. Avago Technologies and NXP Semiconductors made solid contributions to relative results. Strong handset demand and increased
Portfolio Management
John Wilson, CFA
Peter Deininger, CFA, CAIA
Tchintcia Barros, CFA
Morningstar Style BoxTM
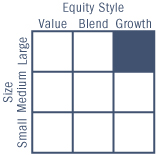
The Morningstar Style BoxTM is based on a fund's portfolio holdings. For equity funds, the vertical axis shows the market capitalization of the stocks owned, and the horizontal axis shows investment style (value, blend, or growth). Information shown is based on the most recent data provided by Morningstar.
© 2015 Morningstar, Inc. All rights reserved. The Morningstar information contained herein: (1) is proprietary to Morningstar and/or its content providers; (2) may not be copied or distributed; and (3) is not warranted to be accurate, complete or timely. Neither Morningstar nor its content providers are responsible for any damages or losses arising from any use of this information.
Top Ten Holdings (%)
(at July 31, 2015) | |
Apple, Inc. | | | 5.3 | | |
Amazon.com, Inc. | | | 2.8 | | |
Facebook, Inc., Class A | | | 2.6 | | |
Visa, Inc., Class A | | | 2.5 | | |
CVS Health Corp. | | | 2.5 | | |
Lowe's Companies, Inc. | | | 2.5 | | |
Celgene Corp. | | | 2.4 | | |
Google, Inc., Class A | | | 2.2 | | |
Bristol-Myers Squibb Co. | | | 2.2 | | |
Comcast Corp., Class A | | | 2.2 | | |
Percentages indicated are based upon total investments (excluding Money Market Funds).
For further detail about these holdings, please refer to the section entitled "Portfolio of Investments."
Fund holdings are as of the date given, are subject to change at any time, and are not recommendations to buy or sell any security.
Annual Report 2015
5
COLUMBIA LARGE CAP GROWTH FUND
MANAGER DISCUSSION OF FUND PERFORMANCE (continued)
Portfolio Breakdown (%)
(at July 31, 2015) | |
Common Stocks | | | 95.8 | | |
Money Market Funds | | | 4.2 | | |
Total | | | 100.0 | | |
Percentages indicated are based upon total investments. The Fund's portfolio composition is subject to change.
Equity Sector Breakdown (%)
(at July 31, 2015) | |
Consumer Discretionary | | | 20.8 | | |
Consumer Staples | | | 8.4 | | |
Energy | | | 1.5 | | |
Financials | | | 5.9 | | |
Health Care | | | 22.5 | | |
Industrials | | | 8.8 | | |
Information Technology | | | 30.7 | | |
Materials | | | 1.4 | | |
Total | | | 100.0 | | |
Percentages indicated are based upon total equity investments. The Fund's portfolio composition is subject to change.
Investment Risks
Market risk may affect a single issuer, sector of the economy, industry or the market as a whole. Growth securities, at times, may not perform as well as value securities or the stock market in general and may be out of favor with investors. Foreign investments subject the Fund to risks, including political, economic, market, social and others within a particular country, as well as to currency instabilities and less stringent financial and accounting standards generally applicable to U.S. issuers. The Fund may invest significantly in issuers within a particular sector, which may be negatively affected by market, economic or other conditions, making the Fund more vulnerable to unfavorable developments in the sector. See the Fund's prospectus for more information on these and other risks.
content within Apple products boosted the shares of both Avago Technologies and NXP Semiconductors.
An overweight in Cubist, which was bought out by Merck in an all cash deal, aided relative performance in the health care sector. AbbVie acquired Pharmacyclics, prized for its flagship asset Imbruvica® , considered to be an effective treatment for hematological malignancies, such as leukemia and lymphoma. The acquisition supports our thesis that innovative products can make smaller biotechnology companies attractive to larger, more traditional pharmaceutical companies, and we continue to be positive regarding biotechnology. Also in biotechnology, outsized positions in Vertex Pharmaceuticals, Celgene and Alkermes benefited relative returns. All three companies performed well as prospects improved for key products in their pipelines. Vertex Pharmaceuticals has strong new therapies for cystic fibrosis and an additional therapy was just approved.
In the industrials sector, Pall Corporation, a leading manufacturer of industrial and medical filtration devices, was acquired by Danaher. Filtration technology is increasingly important in quality control in the biotechnology industry. The acquisition resulted in a solid gain for the portfolio. A position in Snap-On also performed well. The company manufactures and distributes tools and equipment for auto and other service-related industries and has been gaining market share in both the United States and Europe. We also were generally successful in avoiding problem areas in the industrials sector by avoiding industries that took a direct hit from the decline in energy prices, such as road and rail, marine and building products companies. Elsewhere in the portfolio, Kroger in the consumer staples sector was a stand-out performer. The company has increased its share of the organic food segment and enjoyed strong revenue and earnings growth as the result of consistent execution of its strategy.
Energy Stocks Led Disappointments
It was another difficult year for energy. The Fund had more exposure than the benchmark to Anadarko Petroleum and Schlumberger, which detracted from the Fund's relative performance. Overall, the Fund's performance in energy was generally in line with the sector, which was off sharply for the year.
Looking Ahead
We continue to prune winners and reallocate resources to names that we believe have the potential for additional appreciation. This process has not resulted in any major changes to the Fund's sector allocations. It remains overweight in health care and information technology in an environment that we believe currently favors high quality growth names. On balance, we believe that U.S.-centric companies are well positioned at this time to face the current environment of global uncertainty, which supports the Fund's focus on high quality consistent growth companies.
Annual Report 2015
6
COLUMBIA LARGE CAP GROWTH FUND
UNDERSTANDING YOUR FUND'S EXPENSES
(Unaudited)
As an investor, you incur two types of costs. There are transaction costs, which generally include sales charges on purchases and may include redemption fees. There are also ongoing costs, which generally include management fees, distribution and/or service fees, and other fund expenses. The following information is intended to help you understand your ongoing costs (in dollars) of investing in the Fund and to help you compare these costs with the ongoing costs of investing in other mutual funds.
Analyzing Your Fund's Expenses
To illustrate these ongoing costs, we have provided examples and calculated the expenses paid by investors in each share class of the Fund during the period. The actual and hypothetical information in the table is based on an initial investment of $1,000 at the beginning of the period indicated and held for the entire period. Expense information is calculated two ways and each method provides you with different information. The amount listed in the "Actual" column is calculated using the Fund's actual operating expenses and total return for the period. You may use the Actual information, together with the amount invested, to estimate the expenses that you paid over the period. Simply divide your account value by $1,000 (for example, an $8,600 account value divided by $1,000 = 8.6), then multiply the results by the expenses paid during the period under the "Actual" column. The amount listed in the "Hypothetical" column assumes a 5% annual rate of return before expenses (which is not the Fund's actual return) and then applies the Fund's actual expense ratio for the period to the hypothetical return. You should not use the hypothetical account values and expenses to estimate either your actual account balance at the end of the period or the expenses you paid during the period. See "Compare With Other Funds" below for details on how to use the hypothetical data.
Compare With Other Funds
Since all mutual funds are required to include the same hypothetical calculations about expenses in shareholder reports, you can use this information to compare the ongoing cost of investing in the Fund with other funds. To do so, compare the hypothetical example with the 5% hypothetical examples that appear in the shareholder reports of other funds. As you compare hypothetical examples of other funds, it is important to note that hypothetical examples are meant to highlight the ongoing costs of investing in a fund only and do not reflect any transaction costs, such as sales charges, or redemption or exchange fees. Therefore, the hypothetical calculations are useful in comparing ongoing costs only, and will not help you determine the relative total costs of owning different funds. If transaction costs were included in these calculations, your costs would be higher.
February 1, 2015 – July 31, 2015
| | | Account Value at the Beginning
of the Period ($) | | Account Value at the End of the
Period ($) | | Expenses Paid During the
Period ($) | | Fund's Annualized
Expense Ratio (%) | |
| | | Actual | | Hypothetical | | Actual | | Hypothetical | | Actual | | Hypothetical | | Actual | |
Class A | | | 1,000.00 | | | | 1,000.00 | | | | 1,121.10 | | | | 1,019.45 | | | | 5.82 | | | | 5.54 | | | | 1.10 | | |
Class B | | | 1,000.00 | | | | 1,000.00 | | | | 1,116.80 | | | | 1,015.71 | | | | 9.76 | | | | 9.30 | | | | 1.85 | | |
Class C | | | 1,000.00 | | | | 1,000.00 | | | | 1,116.70 | | | | 1,015.71 | | | | 9.76 | | | | 9.30 | | | | 1.85 | | |
Class E | | | 1,000.00 | | | | 1,000.00 | | | | 1,120.40 | | | | 1,018.95 | | | | 6.34 | | | | 6.04 | | | | 1.20 | | |
Class F | | | 1,000.00 | | | | 1,000.00 | | | | 1,116.50 | | | | 1,015.71 | | | | 9.76 | | | | 9.30 | | | | 1.85 | | |
Class I | | | 1,000.00 | | | | 1,000.00 | | | | 1,123.30 | | | | 1,021.49 | | | | 3.65 | | | | 3.48 | | | | 0.69 | | |
Class K | | | 1,000.00 | | | | 1,000.00 | | | | 1,121.50 | | | | 1,020.04 | | | | 5.18 | | | | 4.94 | | | | 0.98 | | |
Class R | | | 1,000.00 | | | | 1,000.00 | | | | 1,119.70 | | | | 1,018.20 | | | | 7.13 | | | | 6.79 | | | | 1.35 | | |
Class R4 | | | 1,000.00 | | | | 1,000.00 | | | | 1,122.50 | | | | 1,020.69 | | | | 4.50 | | | | 4.28 | | | | 0.85 | | |
Class R5 | | | 1,000.00 | | | | 1,000.00 | | | | 1,122.80 | | | | 1,021.19 | | | | 3.97 | | | | 3.78 | | | | 0.75 | | |
Class T | | | 1,000.00 | | | | 1,000.00 | | | | 1,121.10 | | | | 1,019.45 | | | | 5.82 | | | | 5.54 | | | | 1.10 | | |
Class W | | | 1,000.00 | | | | 1,000.00 | | | | 1,120.80 | | | | 1,019.45 | | | | 5.82 | | | | 5.54 | | | | 1.10 | | |
Class Y | | | 1,000.00 | | | | 1,000.00 | | | | 1,123.20 | | | | 1,021.39 | | | | 3.76 | | | | 3.58 | | | | 0.71 | | |
Class Z | | | 1,000.00 | | | | 1,000.00 | | | | 1,122.40 | | | | 1,020.69 | | | | 4.50 | | | | 4.28 | | | | 0.85 | | |
Expenses paid during the period are equal to the annualized expense ratio for each class as indicated above, multiplied by the average account value over the period and then multiplied by the number of days in the Fund's most recent fiscal half year and divided by 365.
Expenses do not include fees and expenses incurred indirectly by the Fund from its investment in underlying funds, including affiliated and non-affiliated pooled investment vehicles, such as mutual funds and exchange-traded funds.
Annual Report 2015
7
COLUMBIA LARGE CAP GROWTH FUND
PORTFOLIO OF INVESTMENTS
July 31, 2015
(Percentages represent value of investments compared to net assets)
Common Stocks 96.0%
Issuer | | Shares | | Value ($) | |
CONSUMER DISCRETIONARY 19.9% | |
Auto Components 0.6% | |
Visteon Corp.(a) | | | 223,400 | | | | 22,235,002 | | |
Hotels, Restaurants & Leisure 1.9% | |
Norwegian Cruise Line Holdings Ltd.(a) | | | 376,306 | | | | 23,489,021 | | |
Starwood Hotels & Resorts
Worldwide, Inc. | | | 551,100 | | | | 43,790,406 | | |
Total | | | | | 67,279,427 | | |
Household Durables 1.0% | |
Jarden Corp.(a) | | | 635,500 | | | | 34,952,500 | | |
Internet & Catalog Retail 5.4% | |
Amazon.com, Inc.(a) | | | 180,885 | | | | 96,981,492 | | |
Ctrip.com International Ltd., ADR(a) | | | 192,300 | | | | 13,764,834 | | |
Expedia, Inc. | | | 305,229 | | | | 37,067,010 | | |
Priceline Group, Inc. (The)(a) | | | 35,800 | | | | 44,519,806 | | |
Total | | | | | 192,333,142 | | |
Media 4.8% | |
Comcast Corp., Class A | | | 1,205,100 | | | | 75,210,291 | | |
DISH Network Corp., Class A(a) | | | 660,200 | | | | 42,655,522 | | |
Time Warner, Inc. | | | 639,400 | | | | 56,292,776 | | |
Total | | | | | 174,158,589 | | |
Multiline Retail 0.8% | |
Hudson's Bay Co. | | | 1,521,522 | | | | 30,829,478 | | |
Specialty Retail 2.4% | |
Lowe's Companies, Inc. | | | 1,223,200 | | | | 84,841,152 | | |
Textiles, Apparel & Luxury Goods 3.0% | |
Hanesbrands, Inc. | | | 1,649,600 | | | | 51,187,088 | | |
lululemon athletica, Inc.(a) | | | 382,300 | | | | 24,031,378 | | |
VF Corp. | | | 416,000 | | | | 32,069,440 | | |
Total | | | | | 107,287,906 | | |
Total Consumer Discretionary | | | | | 713,917,196 | | |
CONSUMER STAPLES 8.1% | |
Beverages 1.3% | |
Coca-Cola Enterprises, Inc. | | | 903,500 | | | | 46,150,780 | | |
Food & Staples Retailing 3.4% | |
CVS Health Corp. | | | 755,800 | | | | 85,004,826 | | |
Kroger Co. (The) | | | 931,000 | | | | 36,532,440 | | |
Total | | | | | 121,537,266 | | |
Common Stocks (continued)
Issuer | | Shares | | Value ($) | |
Food Products 1.4% | |
Mead Johnson Nutrition Co. | | | 340,500 | | | | 30,096,795 | | |
WhiteWave Foods Co. (The), Class A(a) | | | 414,800 | | | | 21,411,976 | | |
Total | | | | | 51,508,771 | | |
Tobacco 2.0% | |
Philip Morris International, Inc. | | | 825,600 | | | | 70,613,568 | | |
Total Consumer Staples | | | | | 289,810,385 | | |
ENERGY 1.5% | |
Oil, Gas & Consumable Fuels 1.5% | |
Anadarko Petroleum Corp. | | | 391,500 | | | | 29,108,025 | | |
Kinder Morgan, Inc. | | | 678,201 | | | | 23,492,883 | | |
Total | | | | | 52,600,908 | | |
Total Energy | | | | | 52,600,908 | | |
FINANCIALS 5.6% | |
Banks 1.4% | |
Fifth Third Bancorp | | | 851,400 | | | | 17,938,998 | | |
Wells Fargo & Co. | | | 593,500 | | | | 34,345,845 | | |
Total | | | | | 52,284,843 | | |
Capital Markets 3.2% | |
BlackRock, Inc. | | | 69,600 | | | | 23,407,872 | | |
Goldman Sachs Group, Inc. (The) | | | 129,900 | | | | 26,638,593 | | |
Invesco Ltd. | | | 969,500 | | | | 37,422,700 | | |
TD Ameritrade Holding Corp. | | | 707,300 | | | | 25,979,129 | | |
Total | | | | | 113,448,294 | | |
Real Estate Investment Trusts (REITs) 1.0% | |
Simon Property Group, Inc. | | | 186,000 | | | | 34,822,920 | | |
Total Financials | | | | | 200,556,057 | | |
HEALTH CARE 21.6% | |
Biotechnology 10.7% | |
Alexion Pharmaceuticals, Inc.(a) | | | 309,900 | | | | 61,186,656 | | |
Alkermes PLC(a) | | | 601,400 | | | | 42,110,028 | | |
Biogen, Inc.(a) | | | 121,200 | | | | 38,636,136 | | |
BioMarin Pharmaceutical, Inc.(a) | | | 160,900 | | | | 23,534,843 | | |
Bluebird Bio, Inc.(a) | | | 47,700 | | | | 7,910,091 | | |
Celgene Corp.(a) | | | 640,400 | | | | 84,052,500 | | |
Dyax Corp.(a) | | | 427,518 | | | | 10,521,218 | | |
The accompanying Notes to Financial Statements are an integral part of this statement.
Annual Report 2015
8
COLUMBIA LARGE CAP GROWTH FUND
PORTFOLIO OF INVESTMENTS (continued)
July 31, 2015
Common Stocks (continued)
Issuer | | Shares | | Value ($) | |
Incyte Corp.(a) | | | 288,600 | | | | 30,095,208 | | |
Intercept Pharmaceuticals, Inc.(a) | | | 51,977 | | | | 13,712,052 | | |
Novavax, Inc.(a) | | | 1,247,900 | | | | 15,049,674 | | |
Ultragenyx Pharmaceutical, Inc.(a) | | | 100,185 | | | | 12,115,372 | | |
Vertex Pharmaceuticals, Inc.(a) | | | 327,500 | | | | 44,212,500 | | |
Total | | | | | 383,136,278 | | |
Health Care Equipment & Supplies 1.5% | |
Medtronic PLC | | | 705,278 | | | | 55,286,743 | | |
Health Care Providers & Services 3.7% | |
Express Scripts Holding Co.(a) | | | 544,000 | | | | 48,998,080 | | |
Laboratory Corp. of America Holdings(a) | | | 315,800 | | | | 40,198,182 | | |
McKesson Corp. | | | 189,800 | | | | 41,864,186 | | |
Total | | | | | 131,060,448 | | |
Life Sciences Tools & Services 1.5% | |
Thermo Fisher Scientific, Inc. | | | 386,900 | | | | 53,984,157 | | |
Pharmaceuticals 4.2% | |
Allergan PLC(a) | | | 222,200 | | | | 73,581,530 | | |
Bristol-Myers Squibb Co. | | | 1,149,800 | | | | 75,472,872 | | |
Total | | | | | 149,054,402 | | |
Total Health Care | | | | | 772,522,028 | | |
INDUSTRIALS 8.5% | |
Aerospace & Defense 2.8% | |
Honeywell International, Inc. | | | 574,800 | | | | 60,382,740 | | |
Northrop Grumman Corp. | | | 221,100 | | | | 38,252,511 | | |
Total | | | | | 98,635,251 | | |
Air Freight & Logistics 1.4% | |
FedEx Corp. | | | 297,700 | | | | 51,031,734 | | |
Construction & Engineering 0.5% | |
Quanta Services, Inc.(a) | | | 591,600 | | | | 16,339,992 | | |
Industrial Conglomerates 1.3% | |
Carlisle Companies, Inc. | | | 460,500 | | | | 46,630,230 | | |
Machinery 2.5% | |
Ingersoll-Rand PLC | | | 769,200 | | | | 47,228,880 | | |
Snap-On, Inc. | | | 260,400 | | | | 42,913,920 | | |
Total | | | | | 90,142,800 | | |
Total Industrials | | | | | 302,780,007 | | |
Common Stocks (continued)
Issuer | | Shares | | Value ($) | |
INFORMATION TECHNOLOGY 29.5% | |
Communications Equipment 1.4% | |
Palo Alto Networks, Inc.(a) | | | 262,600 | | | | 48,798,958 | | |
Internet Software & Services 7.9% | |
Alibaba Group Holding Ltd., ADR(a) | | | 235,400 | | | | 18,441,236 | | |
Facebook, Inc., Class A(a) | | | 941,200 | | | | 88,482,212 | | |
Google, Inc., Class A(a) | | | 115,456 | | | | 75,912,320 | | |
Google, Inc., Class C(a) | | | 115,973 | | | | 72,553,868 | | |
LinkedIn Corp., Class A(a) | | | 137,700 | | | | 27,988,902 | | |
Total | | | | | 283,378,538 | | |
IT Services 2.4% | |
Visa, Inc., Class A | | | 1,145,200 | | | | 86,279,368 | | |
Semiconductors & Semiconductor Equipment 4.9% | |
Avago Technologies Ltd. | | | 202,000 | | | | 25,278,280 | | |
Broadcom Corp., Class A | | | 722,900 | | | | 36,585,969 | | |
NXP Semiconductors NV(a) | | | 276,574 | | | | 26,824,912 | | |
Qorvo, Inc.(a) | | | 415,300 | | | | 24,066,635 | | |
Skyworks Solutions, Inc. | | | 378,000 | | | | 36,163,260 | | |
SunEdison, Inc.(a) | | | 1,063,100 | | | | 24,748,968 | | |
Total | | | | | 173,668,024 | | |
Software 7.8% | |
Electronic Arts, Inc.(a) | | | 1,049,900 | | | | 75,120,345 | | |
Microsoft Corp. | | | 1,155,900 | | | | 53,980,530 | | |
Red Hat, Inc.(a) | | | 843,800 | | | | 66,727,704 | | |
Salesforce.com, inc.(a) | | | 685,200 | | | | 50,225,160 | | |
ServiceNow, Inc.(a) | | | 427,000 | | | | 34,373,500 | | |
Total | | | | | 280,427,239 | | |
Technology Hardware, Storage & Peripherals 5.1% | |
Apple, Inc. | | | 1,507,962 | | | | 182,915,791 | | |
Total Information Technology | | | | | 1,055,467,918 | | |
MATERIALS 1.3% | |
Chemicals 1.3% | |
Eastman Chemical Co. | | | 616,500 | | | | 48,333,600 | | |
Total Materials | | | | | 48,333,600 | | |
Total Common Stocks
(Cost: $2,557,611,365) | | | | | 3,435,988,099 | | |
The accompanying Notes to Financial Statements are an integral part of this statement.
Annual Report 2015
9
COLUMBIA LARGE CAP GROWTH FUND
PORTFOLIO OF INVESTMENTS (continued)
July 31, 2015
Money Market Funds 4.3%
| | | Shares | | Value ($) | |
Columbia Short-Term Cash Fund,
0.124%(b)(c) | | | 152,443,896 | | | | 152,443,896 | | |
Total Money Market Funds
(Cost: $152,443,896) | | | | | 152,443,896 | | |
Total Investments
(Cost: $2,710,055,261) | | | | | 3,588,431,995 | | |
Other Assets & Liabilities, Net | | | | | (8,978,155 | ) | |
Net Assets | | | | | 3,579,453,840 | | |
Notes to Portfolio of Investments
(a) Non-income producing investment.
(b) The rate shown is the seven-day current annualized yield at July 31, 2015.
(c) As defined in the Investment Company Act of 1940, an affiliated company is one in which the Fund owns 5% or more of the company's outstanding voting securities, or a company which is under common ownership or control with the Fund. Holdings and transactions in these affiliated companies during the year ended July 31, 2015 are as follows:
Issuer | | Beginning
Cost ($) | | Purchase
Cost ($) | | Proceeds
From Sales ($) | | Ending
Cost ($) | | Dividends —
Affiliated
Issuers ($) | | Value ($) | |
Columbia Short-Term Cash Fund | | | 71,697,171 | | | | 847,259,583 | | | | (766,512,858 | ) | | | 152,443,896 | | | | 93,267 | | | | 152,443,896 | | |
Abbreviation Legend
ADR American Depositary Receipt
Fair Value Measurements
The Fund categorizes its fair value measurements according to a three-level hierarchy that maximizes the use of observable inputs and minimizes the use of unobservable inputs by prioritizing that the most observable input be used when available. Observable inputs are those that market participants would use in pricing an investment based on market data obtained from sources independent of the reporting entity. Unobservable inputs are those that reflect the Fund's assumptions about the information market participants would use in pricing an investment. An investment's level within the fair value hierarchy is based on the lowest level of any input that is deemed significant to the asset's or liability's fair value measurement. The input levels are not necessarily an indication of the risk or liquidity associated with investments at that level. For example, certain U.S. government securities are generally high quality and liquid, however, they are reflected as Level 2 because the inputs used to determine fair value may not always be quoted prices in an active market.
Fair value inputs are summarized in the three broad levels listed below:
> Level 1 — Valuations based on quoted prices for investments in active markets that the Fund has the ability to access at the measurement date (including NAV for open-end mutual funds). Valuation adjustments are not applied to Level 1 investments.
> Level 2 — Valuations based on other significant observable inputs (including quoted prices for similar securities, interest rates, prepayment speeds, credit risks, etc.).
> Level 3 — Valuations based on significant unobservable inputs (including the Fund's own assumptions and judgment in determining the fair value of investments).
Inputs that are used in determining fair value of an investment may include price information, credit data, volatility statistics, and other factors. These inputs can be either observable or unobservable. The availability of observable inputs can vary between investments, and is affected by various factors such as the type of investment, and the volume and level of activity for that investment or similar investments in the marketplace. The inputs will be considered by the Investment Manager, along with any other relevant factors in the calculation of an investment's fair value. The Fund uses prices and inputs that are current as of the measurement date, which may include periods of market dislocations. During these periods, the availability of prices and inputs may be reduced for many investments. This condition could cause an investment to be reclassified between the various levels within the hierarchy.
The accompanying Notes to Financial Statements are an integral part of this statement.
Annual Report 2015
10
COLUMBIA LARGE CAP GROWTH FUND
PORTFOLIO OF INVESTMENTS (continued)
July 31, 2015
Fair Value Measurements (continued)
Investments falling into the Level 3 category are primarily supported by quoted prices from brokers and dealers participating in the market for those investments. However, these may be classified as Level 3 investments due to lack of market transparency and corroboration to support these quoted prices. Additionally, valuation models may be used as the pricing source for any remaining investments classified as Level 3. These models may rely on one or more significant unobservable inputs and/or significant assumptions by the Investment Manager. Inputs used in valuations may include, but are not limited to, financial statement analysis, capital account balances, discount rates and estimated cash flows, and comparable company data.
Under the direction of the Fund's Board of Trustees (the Board), the Investment Manager's Valuation Committee (the Committee) is responsible for overseeing the valuation procedures approved by the Board. The Committee consists of voting and non-voting members from various groups within the Investment Manager's organization, including operations and accounting, trading and investments, compliance, risk management and legal.
The Committee meets at least monthly to review and approve valuation matters, which may include a description of specific valuation determinations, data regarding pricing information received from approved pricing vendors and brokers and the results of Board-approved valuation control policies and procedures (the Policies). The Policies address, among other things, instances when market quotations are or are not readily available, including recommendations of third party pricing vendors and a determination of appropriate pricing methodologies; events that require specific valuation determinations and assessment of fair value techniques; securities with a potential for stale pricing, including those that are illiquid, restricted, or in default; and the effectiveness of third party pricing vendors, including periodic reviews of vendors. The Committee meets more frequently, as needed, to discuss additional valuation matters, which may include the need to review back-testing results, review time-sensitive information or approve related valuation actions. The Committee reports to the Board, with members of the Committee meeting with the Board at each of its regularly scheduled meetings to discuss valuation matters and actions during the period, similar to those described earlier.
For investments categorized as Level 3, the Committee monitors information similar to that described above, which may include: (i) data specific to the issuer or comparable issuers, (ii) general market or specific sector news and (iii) quoted prices and specific or similar security transactions. The Committee considers this data and any changes from prior periods in order to assess the reasonableness of observable and unobservable inputs, any assumptions or internal models used to value those securities and changes in fair value. This data is also used to corroborate, when available, information received from approved pricing vendors and brokers. Various factors impact the frequency of monitoring this information (which may occur as often as daily). However, the Committee may determine that changes to inputs, assumptions and models are not required as a result of the monitoring procedures performed.
The following table is a summary of the inputs used to value the Fund's investments at July 31, 2015:
| | | Level 1
Quoted Prices in Active
Markets for Identical
Assets ($) | |
Level 2
Other Significant
Observable Inputs ($) | |
Level 3
Significant
Unobservable Inputs ($) | |
Total ($) | |
Investments | |
Common Stocks | |
Consumer Discretionary | | | 713,917,196 | | | | — | | | | — | | | | 713,917,196 | | |
Consumer Staples | | | 289,810,385 | | | | — | | | | — | | | | 289,810,385 | | |
Energy | | | 52,600,908 | | | | — | | | | — | | | | 52,600,908 | | |
Financials | | | 200,556,057 | | | | — | | | | — | | | | 200,556,057 | | |
Health Care | | | 772,522,028 | | | | — | | | | — | | | | 772,522,028 | | |
Industrials | | | 302,780,007 | | | | — | | | | — | | | | 302,780,007 | | |
Information Technology | | | 1,055,467,918 | | | | — | | | | — | | | | 1,055,467,918 | | |
Materials | | | 48,333,600 | | | | — | | | | — | | | | 48,333,600 | | |
Total Common Stocks | | | 3,435,988,099 | | | | — | | | | — | | | | 3,435,988,099 | | |
Money Market Funds | | | 152,443,896 | | | | — | | | | — | | | | 152,443,896 | | |
Total Investments | | | 3,588,431,995 | | | | — | | | | — | | | | 3,588,431,995 | | |
See the Portfolio of Investments for all investment classifications not indicated in the table.
There were no transfers of financial assets between levels during the period.
The accompanying Notes to Financial Statements are an integral part of this statement.
Annual Report 2015
11
COLUMBIA LARGE CAP GROWTH FUND
STATEMENT OF ASSETS AND LIABILITIES
July 31, 2015
Assets | |
Investments, at value | |
Unaffiliated issuers (identified cost $2,557,611,365) | | $ | 3,435,988,099 | | |
Affiliated issuers (identified cost $152,443,896) | | | 152,443,896 | | |
Total investments (identified cost $2,710,055,261) | | | 3,588,431,995 | | |
Receivable for: | |
Investments sold | | | 35,349,483 | | |
Capital shares sold | | | 2,660,753 | | |
Dividends | | | 1,650,547 | | |
Prepaid expenses | | | 37,758 | | |
Trustees' deferred compensation plan | | | 212,628 | | |
Other assets | | | 43,170 | | |
Total assets | | | 3,628,386,334 | | |
Liabilities | |
Payable for: | |
Investments purchased | | | 46,497,627 | | |
Capital shares purchased | | | 1,579,692 | | |
Investment management fees | | | 59,729 | | |
Distribution and/or service fees | | | 18,254 | | |
Transfer agent fees | | | 324,192 | | |
Administration fees | | | 4,956 | | |
Plan administration fees | | | 1 | | |
Compensation of board members | | | 1,717 | | |
Chief compliance officer expenses | | | 125 | | |
Other expenses | | | 233,573 | | |
Trustees' deferred compensation plan | | | 212,628 | | |
Total liabilities | | | 48,932,494 | | |
Net assets applicable to outstanding capital stock | | $ | 3,579,453,840 | | |
Represented by | |
Paid-in capital | | $ | 2,394,762,715 | | |
Excess of distributions over net investment income | | | (206,886 | ) | |
Accumulated net realized gain | | | 306,521,277 | | |
Unrealized appreciation (depreciation) on: | |
Investments | | | 878,376,734 | | |
Total — representing net assets applicable to outstanding capital stock | | $ | 3,579,453,840 | | |
The accompanying Notes to Financial Statements are an integral part of this statement.
Annual Report 2015
12
COLUMBIA LARGE CAP GROWTH FUND
STATEMENT OF ASSETS AND LIABILITIES (continued)
July 31, 2015
Class A | |
Net assets | | $ | 1,870,451,775 | | |
Shares outstanding | | | 49,630,575 | | |
Net asset value per share | | $ | 37.69 | | |
Maximum offering price per share(a) | | $ | 39.99 | | |
Class B | |
Net assets | | $ | 17,337,835 | | |
Shares outstanding | | | 524,148 | | |
Net asset value per share | | $ | 33.08 | | |
Class C | |
Net assets | | $ | 85,723,737 | | |
Shares outstanding | | | 2,589,047 | | |
Net asset value per share | | $ | 33.11 | | |
Class E | |
Net assets | | $ | 16,539,470 | | |
Shares outstanding | | | 439,832 | | |
Net asset value per share | | $ | 37.60 | | |
Maximum offering price per share(b) | | $ | 39.37 | | |
Class F | |
Net assets | | $ | 870,995 | | |
Shares outstanding | | | 26,335 | | |
Net asset value per share | | $ | 33.07 | | |
Class I | |
Net assets | | $ | 179,141,522 | | |
Shares outstanding | | | 4,615,738 | | |
Net asset value per share | | $ | 38.81 | | |
Class K | |
Net assets | | $ | 176,190 | | |
Shares outstanding | | | 4,555 | | |
Net asset value per share | | $ | 38.68 | | |
Class R | |
Net assets | | $ | 5,421,229 | | |
Shares outstanding | | | 144,193 | | |
Net asset value per share | | $ | 37.60 | | |
Class R4 | |
Net assets | | $ | 6,506,293 | | |
Shares outstanding | | | 164,779 | | |
Net asset value per share(c) | | $ | 39.49 | | |
Class R5 | |
Net assets | | $ | 3,879,453 | | |
Shares outstanding | | | 100,061 | | |
Net asset value per share | | $ | 38.77 | | |
The accompanying Notes to Financial Statements are an integral part of this statement.
Annual Report 2015
13
COLUMBIA LARGE CAP GROWTH FUND
STATEMENT OF ASSETS AND LIABILITIES (continued)
July 31, 2015
Class T | |
Net assets | | $ | 197,025,572 | | |
Shares outstanding | | | 5,266,830 | | |
Net asset value per share | | $ | 37.41 | | |
Maximum offering price per share(a) | | $ | 39.69 | | |
Class W | |
Net assets | | $ | 144,249,901 | | |
Shares outstanding | | | 3,820,807 | | |
Net asset value per share | | $ | 37.75 | | |
Class Y | |
Net assets | | $ | 2,750,046 | | |
Shares outstanding | | | 70,820 | | |
Net asset value per share | | $ | 38.83 | | |
Class Z | |
Net assets | | $ | 1,049,379,822 | | |
Shares outstanding | | | 27,051,842 | | |
Net asset value per share | | $ | 38.79 | | |
(a) The maximum offering price per share is calculated by dividing the net asset value per share by 1.0 minus the maximum sales charge of 5.75%.
(b) The maximum offering price per share is calculated by dividing the net asset value by 1.0 minus the maximum sales charge of 4.50%.
(c) Net asset value per share rounds to this amount due to fractional shares outstanding.
The accompanying Notes to Financial Statements are an integral part of this statement.
Annual Report 2015
14
COLUMBIA LARGE CAP GROWTH FUND
STATEMENT OF OPERATIONS
Year Ended July 31, 2015
Net investment income | |
Income: | |
Dividends — unaffiliated issuers | | $ | 39,605,382 | | |
Dividends — affiliated issuers | | | 93,267 | | |
Foreign taxes withheld | | | (139,045 | ) | |
Total income | | | 39,559,604 | | |
Expenses: | |
Investment management fees | | | 20,114,401 | | |
Distribution and/or service fees | |
Class A | | | 4,291,241 | | |
Class B | | | 210,601 | | |
Class C | | | 720,794 | | |
Class E | | | 56,005 | | |
Class F | | | 8,638 | | |
Class R | | | 12,040 | | |
Class T | | | 495,307 | | |
Class W | | | 342,561 | | |
Transfer agent fees | |
Class A | | | 2,951,053 | | |
Class B | | | 36,391 | | |
Class C | | | 123,737 | | |
Class E | | | 27,532 | | |
Class F | | | 1,486 | | |
Class K | | | 92 | | |
Class R | | | 4,107 | | |
Class R4 | | | 4,213 | | |
Class R5 | | | 253 | | |
Class T | | | 320,755 | | |
Class W | | | 235,669 | | |
Class Z | | | 1,646,933 | | |
Administration fees | | | 1,688,311 | | |
Plan administration fees | |
Class K | | | 459 | | |
Compensation of board members | | | 80,159 | | |
Custodian fees | | | 28,133 | | |
Printing and postage fees | | | 317,415 | | |
Registration fees | | | 190,439 | | |
Professional fees | | | 131,977 | | |
Chief compliance officer expenses | | | 1,591 | | |
Other | | | 106,314 | | |
Total expenses | | | 34,148,607 | | |
Expense reductions | | | (33,192 | ) | |
Total net expenses | | | 34,115,415 | | |
Net investment income | | | 5,444,189 | | |
Realized and unrealized gain (loss) — net | |
Net realized gain (loss) on: | |
Investments | | | 402,007,125 | | |
Foreign currency translations | | | 27,263 | | |
Net realized gain | | | 402,034,388 | | |
Net change in unrealized appreciation (depreciation) on: | |
Investments | | | 254,665,312 | | |
Net change in unrealized appreciation | | | 254,665,312 | | |
Net realized and unrealized gain | | | 656,699,700 | | |
Net increase in net assets resulting from operations | | $ | 662,143,889 | | |
The accompanying Notes to Financial Statements are an integral part of this statement.
Annual Report 2015
15
COLUMBIA LARGE CAP GROWTH FUND
STATEMENT OF CHANGES IN NET ASSETS
| | | Year Ended
July 31,
2015 | | Year Ended
July 31,
2014 | |
Operations | |
Net investment income | | $ | 5,444,189 | | | $ | 7,741,896 | | |
Net realized gain | | | 402,034,388 | | | | 427,707,186 | | |
Net change in unrealized appreciation | | | 254,665,312 | | | | 16,831,090 | | |
Net increase in net assets resulting from operations | | | 662,143,889 | | | | 452,280,172 | | |
Distributions to shareholders | |
Net investment income | |
Class A | | | (4,224,160 | ) | | | (3,609,523 | ) | |
Class E | | | (25,566 | ) | | | (21,998 | ) | |
Class I | | | (1,053,124 | ) | | | (1,344,313 | ) | |
Class K | | | (688 | ) | | | (731 | ) | |
Class R | | | (422 | ) | | | (138 | ) | |
Class R4 | | | (4,872 | ) | | | (1,016 | ) | |
Class R5 | | | (1,227 | ) | | | (230 | ) | |
Class T | | | (380,969 | ) | | | (322,002 | ) | |
Class W | | | (339,410 | ) | | | (224,236 | ) | |
Class Y | | | (18 | ) | | | (25,513 | ) | |
Class Z | | | (4,420,247 | ) | | | (4,017,823 | ) | |
Net realized gains | |
Class A | | | (178,378,477 | ) | | | (74,009,629 | ) | |
Class B | | | (2,682,748 | ) | | | (1,710,706 | ) | |
Class C | | | (8,102,561 | ) | | | (3,086,077 | ) | |
Class E | | | (1,702,793 | ) | | | (735,060 | ) | |
Class F | | | (99,906 | ) | | | (47,690 | ) | |
Class I | | | (17,279,907 | ) | | | (10,207,426 | ) | |
Class K | | | (19,688 | ) | | | (9,725 | ) | |
Class R | | | (209,809 | ) | | | (83,179 | ) | |
Class R4 | | | (107,449 | ) | | | (10,809 | ) | |
Class R5 | | | (22,019 | ) | | | (1,881 | ) | |
Class T | | | (19,688,881 | ) | | | (8,185,082 | ) | |
Class W | | | (14,332,809 | ) | | | (5,984,855 | ) | |
Class Y | | | (297 | ) | | | (193,721 | ) | |
Class Z | | | (97,491,407 | ) | | | (41,898,356 | ) | |
Total distributions to shareholders | | | (350,569,454 | ) | | | (155,731,719 | ) | |
Increase (decrease) in net assets from capital stock activity | | | 208,308,213 | | | | (36,287,987 | ) | |
Increase from payment by affiliate (Note 6) | | | — | | | | 78,764 | | |
Total increase in net assets | | | 519,882,648 | | | | 260,339,230 | | |
Net assets at beginning of year | | | 3,059,571,192 | | | | 2,799,231,962 | | |
Net assets at end of year | | $ | 3,579,453,840 | | | $ | 3,059,571,192 | | |
Undistributed (excess of distributions over) net investment income | | $ | (206,886 | ) | | $ | 3,077,451 | | |
The accompanying Notes to Financial Statements are an integral part of this statement.
Annual Report 2015
16
COLUMBIA LARGE CAP GROWTH FUND
STATEMENT OF CHANGES IN NET ASSETS (continued)
| | | Year Ended July 31, 2015 | | Year Ended July 31, 2014 | |
| | | Shares | | Dollars ($) | | Shares | | Dollars ($) | |
Capital stock activity | |
Class A shares | |
Subscriptions(a) | | | 3,615,277 | | | | 130,987,958 | | | | 2,074,225 | | | | 68,846,981 | | |
Distributions reinvested | | | 5,129,835 | | | | 172,465,036 | | | | 2,291,356 | | | | 73,437,969 | | |
Redemptions | | | (4,927,952 | ) | | | (176,147,559 | ) | | | (5,269,960 | ) | | | (175,121,398 | ) | |
Net increase (decrease) | | | 3,817,160 | | | | 127,305,435 | | | | (904,379 | ) | | | (32,836,448 | ) | |
Class B shares | |
Subscriptions | | | 17,489 | | | | 557,246 | | | | 22,973 | | | | 684,834 | | |
Distributions reinvested | | | 88,438 | | | | 2,622,192 | | | | 57,861 | | | | 1,666,977 | | |
Redemptions(a) | | | (362,855 | ) | | | (11,407,278 | ) | | | (506,141 | ) | | | (15,051,027 | ) | |
Net decrease | | | (256,928 | ) | | | (8,227,840 | ) | | | (425,307 | ) | | | (12,699,216 | ) | |
Class C shares | |
Subscriptions | | | 694,398 | | | | 21,993,332 | | | | 350,479 | | | | 10,436,656 | | |
Distributions reinvested | | | 214,542 | | | | 6,367,599 | | | | 85,987 | | | | 2,479,009 | | |
Redemptions | | | (365,117 | ) | | | (11,529,982 | ) | | | (261,698 | ) | | | (7,818,208 | ) | |
Net increase | | | 543,823 | | | | 16,830,949 | | | | 174,768 | | | | 5,097,457 | | |
Class E shares | |
Subscriptions(b) | | | 4,677 | | | | 167,093 | | | | 8,415 | | | | 279,337 | | |
Distributions reinvested | | | 51,398 | | | | 1,725,434 | | | | 23,538 | | | | 753,452 | | |
Redemptions | | | (61,396 | ) | | | (2,169,645 | ) | | | (62,973 | ) | | | (2,076,447 | ) | |
Net decrease | | | (5,321 | ) | | | (277,118 | ) | | | (31,020 | ) | | | (1,043,658 | ) | |
Class F shares | |
Subscriptions | | | 1,977 | | | | 60,075 | | | | 2,013 | | | | 60,115 | | |
Distributions reinvested | | | 3,370 | | | | 99,906 | | | | 1,655 | | | | 47,690 | | |
Redemptions(b) | | | (4,620 | ) | | | (145,647 | ) | | | (8,466 | ) | | | (253,088 | ) | |
Net increase (decrease) | | | 727 | | | | 14,334 | | | | (4,798 | ) | | | (145,283 | ) | |
Class I shares | |
Subscriptions | | | 491,870 | | | | 18,865,971 | | | | 25,509 | | | | 863,134 | | |
Distributions reinvested | | | 530,921 | | | | 18,332,686 | | | | 352,049 | | | | 11,550,733 | | |
Redemptions | | | (1,623,790 | ) | | | (59,746,672 | ) | | | (2,043,662 | ) | | | (69,849,015 | ) | |
Net decrease | | | (600,999 | ) | | | (22,548,015 | ) | | | (1,666,104 | ) | | | (57,435,148 | ) | |
Class K shares | |
Subscriptions | | | — | | | | — | | | | 1 | | | | 37 | | |
Distributions reinvested | | | 581 | | | | 20,031 | | | | 284 | | | | 9,328 | | |
Redemptions | | | (1,744 | ) | | | (63,352 | ) | | | (563 | ) | | | (19,500 | ) | |
Net decrease | | | (1,163 | ) | | | (43,321 | ) | | | (278 | ) | | | (10,135 | ) | |
The accompanying Notes to Financial Statements are an integral part of this statement.
Annual Report 2015
17
COLUMBIA LARGE CAP GROWTH FUND
STATEMENT OF CHANGES IN NET ASSETS (continued)
| | | Year Ended July 31, 2015 | | Year Ended July 31, 2014 | |
| | | Shares | | Dollars ($) | | Shares | | Dollars ($) | |
Capital stock activity (continued) | |
Class R shares | |
Subscriptions | | | 107,187 | | | | 3,931,268 | | | | 20,519 | | | | 688,191 | | |
Distributions reinvested | | | 3,652 | | | | 122,670 | | | | 1,293 | | | | 41,423 | | |
Redemptions | | | (11,188 | ) | | | (400,351 | ) | | | (29,945 | ) | | | (1,015,126 | ) | |
Net increase (decrease) | | | 99,651 | | | | 3,653,587 | | | | (8,133 | ) | | | (285,512 | ) | |
Class R4 shares | |
Subscriptions | | | 167,063 | | | | 6,337,410 | | | | 22,055 | | | | 770,700 | | |
Distributions reinvested | | | 3,186 | | | | 112,015 | | | | 350 | | | | 11,659 | | |
Redemptions | | | (26,767 | ) | | | (1,019,257 | ) | | | (2,131 | ) | | | (73,739 | ) | |
Net increase | | | 143,482 | | | | 5,430,168 | | | | 20,274 | | | | 708,620 | | |
Class R5 shares | |
Subscriptions | | | 94,827 | | | | 3,653,684 | | | | 4,838 | | | | 167,746 | | |
Distributions reinvested | | | 664 | | | | 22,918 | | | | 49 | | | | 1,602 | | |
Redemptions | | | (937 | ) | | | (34,558 | ) | | | (515 | ) | | | (18,000 | ) | |
Net increase | | | 94,554 | | | | 3,642,044 | | | | 4,372 | | | | 151,348 | | |
Class T shares | |
Subscriptions | | | 166,177 | | | | 5,626,315 | | | | 90,722 | | | | 2,926,841 | | |
Distributions reinvested | | | 447,540 | | | | 14,934,411 | | | | 198,349 | | | | 6,315,433 | | |
Redemptions | | | (389,375 | ) | | | (13,869,887 | ) | | | (415,016 | ) | | | (13,723,915 | ) | |
Net increase (decrease) | | | 224,342 | | | | 6,690,839 | | | | (125,945 | ) | | | (4,481,641 | ) | |
Class W shares | |
Subscriptions | | | 503,370 | | | | 18,076,640 | | | | 4,169,238 | | | | 138,927,385 | | |
Distributions reinvested | | | 435,627 | | | | 14,671,906 | | | | 193,544 | | | | 6,208,888 | | |
Redemptions | | | (749,188 | ) | | | (26,937,846 | ) | | | (731,905 | ) | | | (24,521,708 | ) | |
Net increase | | | 189,809 | | | | 5,810,700 | | | | 3,630,877 | | | | 120,614,565 | | |
Class Y shares | |
Subscriptions | | | 71,064 | | | | 2,690,256 | | | | — | | | | — | | |
Redemptions | | | (318 | ) | | | (12,230 | ) | | | (119,363 | ) | | | (4,070,077 | ) | |
Net increase (decrease) | | | 70,746 | | | | 2,678,026 | | | | (119,363 | ) | | | (4,070,077 | ) | |
Class Z shares | |
Subscriptions | | | 2,959,312 | | | | 109,067,852 | | | | 1,347,061 | | | | 46,062,582 | | |
Distributions reinvested | | | 1,979,931 | | | | 68,406,606 | | | | 884,148 | | | | 29,026,585 | | |
Redemptions | | | (2,998,161 | ) | | | (110,126,033 | ) | | | (3,672,110 | ) | | | (124,942,026 | ) | |
Net increase (decrease) | | | 1,941,082 | | | | 67,348,425 | | | | (1,440,901 | ) | | | (49,852,859 | ) | |
Total net increase (decrease) | | | 6,260,965 | | | | 208,308,213 | | | | (895,937 | ) | | | (36,287,987 | ) | |
(a) Includes conversions of Class B shares to Class A shares, if any.
(b) Includes conversions of Class F shares to Class E shares, if any.
The accompanying Notes to Financial Statements are an integral part of this statement.
Annual Report 2015
18
COLUMBIA LARGE CAP GROWTH FUND
The following tables are intended to help you understand the Fund's financial performance. Certain information reflects financial results for a single share of a class held for the periods shown. Per share net investment income (loss) amounts are calculated based on average shares outstanding during the period. Total return assumes reinvestment of all dividends and distributions, if any. Total return does not reflect payment of sales charges, if any. Total return and portfolio turnover are not annualized for periods of less than one year. The portfolio turnover rate is calculated without regard to purchase and sales transactions of short-term instruments and certain derivatives, if any. If such transactions were included, the Fund's portfolio turnover rate may be higher.
| | | Year Ended July 31, | | Year Ended
September 30, | |
Class A | | 2015 | | 2014 | | 2013 | | 2012(a) | | 2011 | | 2010 | |
Per share data | |
Net asset value, beginning of period | | $ | 34.51 | | | $ | 31.25 | | | $ | 25.65 | | | $ | 20.84 | | | $ | 20.64 | | | $ | 18.77 | | |
Income from investment operations: | |
Net investment income (loss) | | | 0.03 | | | | 0.06 | | | | 0.11 | | | | 0.02 | | | | (0.01 | ) | | | 0.04 | | |
Net realized and unrealized gain | | | 7.24 | | | | 4.90 | | | | 5.55 | | | | 4.82 | | | | 0.25 | (b) | | | 1.92 | | |
Total from investment operations | | | 7.27 | | | | 4.96 | | | | 5.66 | | | | 4.84 | | | | 0.24 | | | | 1.96 | | |
Less distributions to shareholders: | |
Net investment income | | | (0.09 | ) | | | (0.08 | ) | | | (0.06 | ) | | | (0.03 | ) | | | (0.04 | ) | | | (0.09 | ) | |
Net realized gains | | | (4.00 | ) | | | (1.62 | ) | | | — | | | | — | | | | — | | | | — | | |
Total distributions to shareholders | | | (4.09 | ) | | | (1.70 | ) | | | (0.06 | ) | | | (0.03 | ) | | | (0.04 | ) | | | (0.09 | ) | |
Proceeds from regulatory settlements | | | — | | | | — | | | | — | | | | 0.00 | (c) | | | — | | | | 0.00 | (c) | |
Net asset value, end of period | | $ | 37.69 | | | $ | 34.51 | | | $ | 31.25 | | | $ | 25.65 | | | $ | 20.84 | | | $ | 20.64 | | |
Total return | | | 22.51 | % | | | 16.29 | % | | | 22.09 | % | | | 23.22 | % | | | 1.16 | % | | | 10.48 | % | |
Ratios to average net assets(d) | |
Total gross expenses | | | 1.11 | % | | | 1.14 | % | | | 1.18 | % | | | 1.16 | %(e) | | | 1.15 | %(f) | | | 1.10 | %(f) | |
Total net expenses(g) | | | 1.11 | %(h) | | | 1.14 | %(h) | | | 1.18 | %(h) | | | 1.16 | %(e)(h) | | | 1.14 | %(f)(i) | | | 1.10 | %(f)(h) | |
Net investment income (loss) | | | 0.09 | % | | | 0.18 | % | | | 0.40 | % | | | 0.10 | %(e) | | | (0.06 | %) | | | 0.19 | % | |
Supplemental data | |
Net assets, end of period (in thousands) | | $ | 1,870,452 | | | $ | 1,581,112 | | | $ | 1,459,893 | | | $ | 1,316,211 | | | $ | 1,187,715 | | | $ | 148,455 | | |
Portfolio turnover | | | 59 | % | | | 88 | % | | | 104 | % | | | 80 | % | | | 116 | % | | | 122 | % | |
Notes to Financial Highlights
(a) For the period from October 1, 2011 to July 31, 2012. During the period, the Fund's fiscal year end was changed from September 30 to July 31.
(b) Calculation of the net gain (loss) per share (both realized and unrealized) does not correlate to the aggregate realized and unrealized gain (loss) presented in the Statement of Operations due to the timing of subscriptions and redemptions of Fund shares in relation to fluctuations in the market value of the portfolio.
(c) Rounds to zero.
(d) In addition to the fees and expenses that the Fund bears directly, the Fund indirectly bears a pro rata share of the fees and expenses of any other funds in which it invests. Such indirect expenses are not included in the Fund's reported expense ratios.
(e) Annualized.
(f) Ratios include line of credit interest expense which is less than 0.01%.
(g) Total net expenses include the impact of certain fee waivers/expense reimbursements made by the Investment Manager and certain of its affiliates, if applicable.
(h) The benefits derived from expense reductions had an impact of less than 0.01%.
(i) The benefits derived from expense reductions had an impact of 0.01%.
The accompanying Notes to Financial Statements are an integral part of this statement.
Annual Report 2015
19
COLUMBIA LARGE CAP GROWTH FUND
FINANCIAL HIGHLIGHTS (continued)
| | | Year Ended July 31, | | Year Ended
September 30, | |
Class B | | 2015 | | 2014 | | 2013 | | 2012(a) | | 2011 | | 2010 | |
Per share data | |
Net asset value, beginning of period | | $ | 30.88 | | | $ | 28.25 | | | $ | 23.32 | | | $ | 19.04 | | | $ | 18.97 | | | $ | 17.30 | | |
Income from investment operations: | |
Net investment loss | | | (0.20 | ) | | | (0.17 | ) | | | (0.09 | ) | | | (0.12 | ) | | | (0.18 | ) | | | (0.10 | ) | |
Net realized and unrealized gain | | | 6.40 | | | | 4.42 | | | | 5.02 | | | | 4.40 | | | | 0.25 | (b) | | | 1.77 | | |
Total from investment operations | | | 6.20 | | | | 4.25 | | | | 4.93 | | | | 4.28 | | | | 0.07 | | | | 1.67 | | |
Less distributions to shareholders: | |
Net realized gains | | | (4.00 | ) | | | (1.62 | ) | | | — | | | | — | | | | — | | | | — | | |
Total distributions to shareholders | | | (4.00 | ) | | | (1.62 | ) | | | — | | | | — | | | | — | | | | — | | |
Proceeds from regulatory settlements | | | — | | | | — | | | | — | | | | 0.00 | (c) | | | — | | | | 0.00 | (c) | |
Net asset value, end of period | | $ | 33.08 | | | $ | 30.88 | | | $ | 28.25 | | | $ | 23.32 | | | $ | 19.04 | | | $ | 18.97 | | |
Total return | | | 21.57 | % | | | 15.46 | % | | | 21.14 | % | | | 22.48 | % | | | 0.37 | % | | | 9.65 | % | |
Ratios to average net assets(d) | |
Total gross expenses | | | 1.86 | % | | | 1.89 | % | | | 1.93 | % | | | 1.91 | %(e) | | | 1.90 | %(f) | | | 1.85 | %(f) | |
Total net expenses(g) | | | 1.86 | %(h) | | | 1.89 | %(h) | | | 1.93 | %(h) | | | 1.91 | %(e)(h) | | | 1.89 | %(f)(i) | | | 1.85 | %(f)(h) | |
Net investment loss | | | (0.62 | %) | | | (0.56 | %) | | | (0.34 | %) | | | (0.64 | %)(e) | | | (0.82 | %) | | | (0.56 | %) | |
Supplemental data | |
Net assets, end of period (in thousands) | | $ | 17,338 | | | $ | 24,117 | | | $ | 34,085 | | | $ | 39,046 | | | $ | 49,290 | | | $ | 14,527 | | |
Portfolio turnover | | | 59 | % | | | 88 | % | | | 104 | % | | | 80 | % | | | 116 | % | | | 122 | % | |
Notes to Financial Highlights
(a) For the period from October 1, 2011 to July 31, 2012. During the period, the Fund's fiscal year end was changed from September 30 to July 31.
(b) Calculation of the net gain (loss) per share (both realized and unrealized) does not correlate to the aggregate realized and unrealized gain (loss) presented in the Statement of Operations due to the timing of subscriptions and redemptions of Fund shares in relation to fluctuations in the market value of the portfolio.
(c) Rounds to zero.
(d) In addition to the fees and expenses that the Fund bears directly, the Fund indirectly bears a pro rata share of the fees and expenses of any other funds in which it invests. Such indirect expenses are not included in the Fund's reported expense ratios.
(e) Annualized.
(f) Ratios include line of credit interest expense which is less than 0.01%.
(g) Total net expenses include the impact of certain fee waivers/expense reimbursements made by the Investment Manager and certain of its affiliates, if applicable.
(h) The benefits derived from expense reductions had an impact of less than 0.01%.
(i) The benefits derived from expense reductions had an impact of 0.01%.
The accompanying Notes to Financial Statements are an integral part of this statement.
Annual Report 2015
20
COLUMBIA LARGE CAP GROWTH FUND
FINANCIAL HIGHLIGHTS (continued)
| | | Year Ended July 31, | | Year Ended
September 30, | |
Class C | | 2015 | | 2014 | | 2013 | | 2012(a) | | 2011 | | 2010 | |
Per share data | |
Net asset value, beginning of period | | $ | 30.90 | | | $ | 28.27 | | | $ | 23.34 | | | $ | 19.06 | | | $ | 18.98 | | | $ | 17.31 | | |
Income from investment operations: | |
Net investment loss | | | (0.21 | ) | | | (0.17 | ) | | | (0.09 | ) | | | (0.12 | ) | | | (0.17 | ) | | | (0.10 | ) | |
Net realized and unrealized gain | | | 6.42 | | | | 4.42 | | | | 5.02 | | | | 4.40 | | | | 0.25 | (b) | | | 1.77 | | |
Total from investment operations | | | 6.21 | | | | 4.25 | | | | 4.93 | | | | 4.28 | | | | 0.08 | | | | 1.67 | | |
Less distributions to shareholders: | |
Net realized gains | | | (4.00 | ) | | | (1.62 | ) | | | — | | | | — | | | | — | | | | — | | |
Total distributions to shareholders | | | (4.00 | ) | | | (1.62 | ) | | | — | | | | — | | | | — | | | | — | | |
Proceeds from regulatory settlements | | | — | | | | — | | | | — | | | | 0.00 | (c) | | | — | | | | 0.00 | (c) | |
Net asset value, end of period | | $ | 33.11 | | | $ | 30.90 | | | $ | 28.27 | | | $ | 23.34 | | | $ | 19.06 | | | $ | 18.98 | | |
Total return | | | 21.59 | % | | | 15.45 | % | | | 21.12 | % | | | 22.46 | % | | | 0.42 | % | | | 9.65 | % | |
Ratios to average net assets(d) | |
Total gross expenses | | | 1.86 | % | | | 1.89 | % | | | 1.93 | % | | | 1.91 | %(e) | | | 1.88 | %(f) | | | 1.85 | %(f) | |
Total net expenses(g) | | | 1.86 | %(h) | | | 1.89 | %(h) | | | 1.93 | %(h) | | | 1.91 | %(e)(h) | | | 1.87 | %(f)(i) | | | 1.85 | %(f)(h) | |
Net investment loss | | | (0.67 | %) | | | (0.57 | %) | | | (0.36 | %) | | | (0.65 | %)(e) | | | (0.77 | %) | | | (0.55 | %) | |
Supplemental data | |
Net assets, end of period (in thousands) | | $ | 85,724 | | | $ | 63,200 | | | $ | 52,885 | | | $ | 39,542 | | | $ | 36,860 | | | $ | 15,990 | | |
Portfolio turnover | | | 59 | % | | | 88 | % | | | 104 | % | | | 80 | % | | | 116 | % | | | 122 | % | |
Notes to Financial Highlights
(a) For the period from October 1, 2011 to July 31, 2012. During the period, the Fund's fiscal year end was changed from September 30 to July 31.
(b) Calculation of the net gain (loss) per share (both realized and unrealized) does not correlate to the aggregate realized and unrealized gain (loss) presented in the Statement of Operations due to the timing of subscriptions and redemptions of Fund shares in relation to fluctuations in the market value of the portfolio.
(c) Rounds to zero.
(d) In addition to the fees and expenses that the Fund bears directly, the Fund indirectly bears a pro rata share of the fees and expenses of any other funds in which it invests. Such indirect expenses are not included in the Fund's reported expense ratios.
(e) Annualized.
(f) Ratios include line of credit interest expense which is less than 0.01%.
(g) Total net expenses include the impact of certain fee waivers/expense reimbursements made by the Investment Manager and certain of its affiliates, if applicable.
(h) The benefits derived from expense reductions had an impact of less than 0.01%.
(i) The benefits derived from expense reductions had an impact of 0.01%.
The accompanying Notes to Financial Statements are an integral part of this statement.
Annual Report 2015
21
COLUMBIA LARGE CAP GROWTH FUND
FINANCIAL HIGHLIGHTS (continued)
| | | Year Ended July 31, | | Year Ended
September 30, | |
Class E | | 2015 | | 2014 | | 2013 | | 2012(a) | | 2011 | | 2010 | |
Per share data | |
Net asset value, beginning of period | | $ | 34.44 | | | $ | 31.19 | | | $ | 25.61 | | | $ | 20.80 | | | $ | 20.60 | | | $ | 18.73 | | |
Income from investment operations: | |
Net investment income (loss) | | | (0.00 | )(b) | | | 0.03 | | | | 0.08 | | | | (0.00 | )(b) | | | (0.02 | ) | | | 0.02 | | |
Net realized and unrealized gain | | | 7.22 | | | | 4.89 | | | | 5.53 | | | | 4.81 | | | | 0.24 | (c) | | | 1.93 | | |
Total from investment operations | | | 7.22 | | | | 4.92 | | | | 5.61 | | | | 4.81 | | | | 0.22 | | | | 1.95 | | |
Less distributions to shareholders: | |
Net investment income | | | (0.06 | ) | | | (0.05 | ) | | | (0.03 | ) | | | — | | | | (0.02 | ) | | | (0.08 | ) | |
Net realized gains | | | (4.00 | ) | | | (1.62 | ) | | | — | | | | — | | | | — | | | | — | | |
Total distributions to shareholders | | | (4.06 | ) | | | (1.67 | ) | | | (0.03 | ) | | | — | | | | (0.02 | ) | | | (0.08 | ) | |
Proceeds from regulatory settlements | | | — | | | | — | | | | — | | | | 0.00 | (b) | | | — | | | | 0.00 | (b) | |
Net asset value, end of period | | $ | 37.60 | | | $ | 34.44 | | | $ | 31.19 | | | $ | 25.61 | | | $ | 20.80 | | | $ | 20.60 | | |
Total return | | | 22.37 | % | | | 16.18 | % | | | 21.93 | % | | | 23.13 | % | | | 1.07 | % | | | 10.41 | % | |
Ratios to average net assets(d) | |
Total gross expenses | | | 1.21 | % | | | 1.24 | % | | | 1.28 | % | | | 1.26 | %(e) | | | 1.20 | %(f) | | | 1.20 | %(f) | |
Total net expenses(g) | | | 1.21 | %(h) | | | 1.24 | %(h) | | | 1.28 | %(h) | | | 1.26 | %(e)(h) | | | 1.19 | %(f)(i) | | | 1.20 | %(f)(h) | |
Net investment income (loss) | | | (0.00 | %)(b) | | | 0.08 | % | | | 0.30 | % | | | (0.00 | %)(b)(e) | | | (0.08 | %) | | | 0.10 | % | |
Supplemental data | |
Net assets, end of period (in thousands) | | $ | 16,539 | | | $ | 15,333 | | | $ | 14,853 | | | $ | 13,437 | | | $ | 11,784 | | | $ | 12,800 | | |
Portfolio Turnover | | | 59 | % | | | 88 | % | | | 104 | % | | | 80 | % | | | 116 | % | | | 122 | % | |
Notes to Financial Highlights
(a) For the period from October 1, 2011 to July 31, 2012. During the period, the Fund's fiscal year end was changed from September 30 to July 31.
(b) Rounds to zero.
(c) Calculation of the net gain (loss) per share (both realized and unrealized) does not correlate to the aggregate realized and unrealized gain (loss) presented in the Statement of Operations due to the timing of subscriptions and redemptions of Fund shares in relation to fluctuations in the market value of the portfolio.
(d) In addition to the fees and expenses that the Fund bears directly, the Fund indirectly bears a pro rata share of the fees and expenses of any other funds in which it invests. Such indirect expenses are not included in the Fund's reported expense ratios.
(e) Annualized.
(f) Ratios include line of credit interest expense which is less than 0.01%.
(g) Total net expenses include the impact of certain fee waivers/expense reimbursements made by the Investment Manager and certain of its affiliates, if applicable.
(h) The benefits derived from expense reductions had an impact of less than 0.01%.
(i) The benefits derived from expense reductions had an impact of 0.01%.
The accompanying Notes to Financial Statements are an integral part of this statement.
Annual Report 2015
22
COLUMBIA LARGE CAP GROWTH FUND
FINANCIAL HIGHLIGHTS (continued)
| | | Year Ended July 31, | | Year Ended
September 30, | |
Class F | | 2015 | | 2014 | | 2013 | | 2012(a) | | 2011 | | 2010 | |
Per share data | |
Net asset value, beginning of period | | $ | 30.87 | | | $ | 28.25 | | | $ | 23.32 | | | $ | 19.04 | | | $ | 18.96 | | | $ | 17.29 | | |
Income from investment operations: | |
Net investment loss | | | (0.21 | ) | | | (0.17 | ) | | | (0.09 | ) | | | (0.12 | ) | | | (0.16 | ) | | | (0.10 | ) | |
Net realized and unrealized gain | | | 6.41 | | | | 4.41 | | | | 5.02 | | | | 4.40 | | | | 0.24 | (b) | | | 1.77 | | |
Total from investment operations | | | 6.20 | | | | 4.24 | | | | 4.93 | | | | 4.28 | | | | 0.08 | | | | 1.67 | | |
Less distributions to shareholders: | |
Net realized gains | | | (4.00 | ) | | | (1.62 | ) | | | — | | | | — | | | | — | | | | — | | |
Total distributions to shareholders | | | (4.00 | ) | | | (1.62 | ) | | | — | | | | — | | | | — | | | | — | | |
Proceeds from regulatory settlements | | | — | | | | — | | | | — | | | | 0.00 | (c) | | | — | | | | 0.00 | (c) | |
Net asset value, end of period | | $ | 33.07 | | | $ | 30.87 | | | $ | 28.25 | | | $ | 23.32 | | | $ | 19.04 | | | $ | 18.96 | | |
Total return | | | 21.57 | % | | | 15.43 | % | | | 21.14 | % | | | 22.48 | % | | | 0.42 | % | | | 9.66 | % | |
Ratios to average net assets(d) | |
Total gross expenses | | | 1.86 | % | | | 1.89 | % | | | 1.93 | % | | | 1.91 | %(e) | | | 1.85 | %(f) | | | 1.85 | %(f) | |
Total net expenses(g) | | | 1.86 | %(h) | | | 1.89 | %(h) | | | 1.93 | %(h) | | | 1.91 | %(e)(h) | | | 1.84 | %(f)(i) | | | 1.85 | %(f)(h) | |
Net investment loss | | | (0.66 | %) | | | (0.57 | %) | | | (0.36 | %) | | | (0.65 | %)(e) | | | (0.73 | %) | | | (0.55 | %) | |
Supplemental data | |
Net assets, end of period (in thousands) | | $ | 871 | | | $ | 791 | | | $ | 859 | | | $ | 655 | | | $ | 484 | | | $ | 425 | | |
Portfolio turnover | | | 59 | % | | | 88 | % | | | 104 | % | | | 80 | % | | | 116 | % | | | 122 | % | |
Notes to Financial Highlights
(a) For the period from October 1, 2011 to July 31, 2012. During the period, the Fund's fiscal year end was changed from September 30 to July 31.
(b) Calculation of the net gain (loss) per share (both realized and unrealized) does not correlate to the aggregate realized and unrealized gain (loss) presented in the Statement of Operations due to the timing of subscriptions and redemptions of Fund shares in relation to fluctuations in the market value of the portfolio.
(c) Rounds to zero.
(d) In addition to the fees and expenses that the Fund bears directly, the Fund indirectly bears a pro rata share of the fees and expenses of any other funds in which it invests. Such indirect expenses are not included in the Fund's reported expense ratios.
(e) Annualized.
(f) Ratios include line of credit interest expense which is less than 0.01%.
(g) Total net expenses include the impact of certain fee waivers/expense reimbursements made by the Investment Manager and certain of its affiliates, if applicable.
(h) The benefits derived from expense reductions had an impact of less than 0.01%.
(i) The benefits derived from expense reductions had an impact of 0.01%.
The accompanying Notes to Financial Statements are an integral part of this statement.
Annual Report 2015
23
COLUMBIA LARGE CAP GROWTH FUND
FINANCIAL HIGHLIGHTS (continued)
| | | Year Ended July 31, | | Year Ended
September 30, | |
Class I | | 2015 | | 2014 | | 2013 | | 2012(a) | | 2011 | | 2010(b) | |
Per share data | |
Net asset value, beginning of period | | $ | 35.43 | | | $ | 32.02 | | | $ | 26.29 | | | $ | 21.37 | | | $ | 21.14 | | | $ | 21.18 | | |
Income from investment operations: | |
Net investment income | | | 0.19 | | | | 0.21 | | | | 0.25 | | | | 0.11 | | | | 0.11 | | | | 0.00 | (c) | |
Net realized and unrealized gain (loss) | | | 7.43 | | | | 5.04 | | | | 5.66 | | | | 4.94 | | | | 0.24 | (d) | | | (0.04 | ) | |
Total from investment operations | | | 7.62 | | | | 5.25 | | | | 5.91 | | | | 5.05 | | | | 0.35 | | | | (0.04 | ) | |
Less distributions to shareholders: | |
Net investment income | | | (0.24 | ) | | | (0.22 | ) | | | (0.18 | ) | | | (0.13 | ) | | | (0.12 | ) | | | — | | |
Net realized gains | | | (4.00 | ) | | | (1.62 | ) | | | — | | | | — | | | | — | | | | — | | |
Total distributions to shareholders | | | (4.24 | ) | | | (1.84 | ) | | | (0.18 | ) | | | (0.13 | ) | | | (0.12 | ) | | | — | | |
Proceeds from regulatory settlements | | | — | | | | — | | | | — | | | | 0.00 | (c) | | | — | | | | — | | |
Net asset value, end of period | | $ | 38.81 | | | $ | 35.43 | | | $ | 32.02 | | | $ | 26.29 | | | $ | 21.37 | | | $ | 21.14 | | |
Total return | | | 23.00 | % | | | 16.84 | % | | | 22.60 | % | | | 23.71 | % | | | 1.61 | % | | | (0.19 | %) | |
Ratios to average net assets(e) | |
Total gross expenses | | | 0.69 | % | | | 0.70 | % | | | 0.71 | % | | | 0.72 | %(f) | | | 0.68 | %(g) | | | 0.60 | %(f) | |
Total net expenses(h) | | | 0.69 | % | | | 0.70 | % | | | 0.71 | % | | | 0.72 | %(f) | | | 0.68 | %(g)(i) | | | 0.60 | %(f)(i) | |
Net investment income | | | 0.52 | % | | | 0.62 | % | | | 0.87 | % | | | 0.54 | %(f) | | | 0.46 | % | | | 1.89 | %(f) | |
Supplemental data | |
Net assets, end of period (in thousands) | | $ | 179,142 | | | $ | 184,811 | | | $ | 220,421 | | | $ | 203,848 | | | $ | 279,510 | | | $ | 2 | | |
Portfolio turnover | | | 59 | % | | | 88 | % | | | 104 | % | | | 80 | % | | | 116 | % | | | 122 | % | |
Notes to Financial Highlights
(a) For the period from October 1, 2011 to July 31, 2012. During the period, the Fund's fiscal year end was changed from September 30 to July 31.
(b) Based on operations from September 27, 2010 (commencement of operations) through the stated period end.
(c) Rounds to zero.
(d) Calculation of the net gain (loss) per share (both realized and unrealized) does not correlate to the aggregate realized and unrealized gain (loss) presented in the Statement of Operations due to the timing of subscriptions and redemptions of Fund shares in relation to fluctuations in the market value of the portfolio.
(e) In addition to the fees and expenses that the Fund bears directly, the Fund indirectly bears a pro rata share of the fees and expenses of any other funds in which it invests. Such indirect expenses are not included in the Fund's reported expense ratios.
(f) Annualized.
(g) Ratios include line of credit interest expense which is less than 0.01%.
(h) Total net expenses include the impact of certain fee waivers/expense reimbursements made by the Investment Manager and certain of its affiliates, if applicable.
(i) The benefits derived from expense reductions had an impact of less than 0.01%.
The accompanying Notes to Financial Statements are an integral part of this statement.
Annual Report 2015
24
COLUMBIA LARGE CAP GROWTH FUND
FINANCIAL HIGHLIGHTS (continued)
| | | Year Ended July 31, | | Year Ended
September 30, | |
Class K | | 2015 | | 2014 | | 2013 | | 2012(a) | | 2011(b) | |
Per share data | |
Net asset value, beginning of period | | $ | 35.32 | | | $ | 31.94 | | | $ | 26.24 | | | $ | 21.33 | | | $ | 24.86 | | |
Income from investment operations: | |
Net investment income | | | 0.09 | | | | 0.11 | | | | 0.18 | | | | 0.08 | | | | 0.02 | | |
Net realized and unrealized gain (loss) | | | 7.41 | | | | 5.01 | | | | 5.64 | | | | 4.90 | | | | (3.55 | ) | |
Total from investment operations | | | 7.50 | | | | 5.12 | | | | 5.82 | | | | 4.98 | | | | (3.53 | ) | |
Less distributions to shareholders: | |
Net investment income | | | (0.14 | ) | | | (0.12 | ) | | | (0.12 | ) | | | (0.07 | ) | | | — | | |
Net realized gains | | | (4.00 | ) | | | (1.62 | ) | | | — | | | | — | | | | — | | |
Total distributions to shareholders | | | (4.14 | ) | | | (1.74 | ) | | | (0.12 | ) | | | (0.07 | ) | | | — | | |
Proceeds from regulatory settlements | | | — | | | | — | | | | — | | | | 0.00 | (c) | | | — | | |
Net asset value, end of period | | $ | 38.68 | | | $ | 35.32 | | | $ | 31.94 | | | $ | 26.24 | | | $ | 21.33 | | |
Total return | | | 22.66 | % | | | 16.47 | % | | | 22.25 | % | | | 23.38 | % | | | (14.20 | %) | |
Ratios to average net assets(d) | |
Total gross expenses | | | 0.99 | % | | | 1.00 | % | | | 0.96 | % | | | 0.97 | %(e) | | | 0.95 | %(e)(f) | |
Total net expenses(g) | | | 0.99 | % | | | 1.00 | % | | | 0.96 | % | | | 0.97 | %(e) | | | 0.95 | %(e)(f)(h) | |
Net investment income | | | 0.23 | % | | | 0.32 | % | | | 0.64 | % | | | 0.40 | %(e) | | | 0.12 | %(e) | |
Supplemental data | |
Net assets, end of period (in thousands) | | $ | 176 | | | $ | 202 | | | $ | 191 | | | $ | 4,270 | | | $ | 46,696 | | |
Portfolio turnover | | | 59 | % | | | 88 | % | | | 104 | % | | | 80 | % | | | 116 | % | |
Notes to Financial Highlights
(a) For the period from October 1, 2011 to July 31, 2012. During the period, the Fund's fiscal year end was changed from September 30 to July 31.
(b) Based on operations from March 7, 2011 (commencement of operations) through the stated period end.
(c) Rounds to zero.
(d) In addition to the fees and expenses that the Fund bears directly, the Fund indirectly bears a pro rata share of the fees and expenses of any other funds in which it invests. Such indirect expenses are not included in the Fund's reported expense ratios.
(e) Annualized.
(f) Ratios include line of credit interest expense which is less than 0.01%.
(g) Total net expenses include the impact of certain fee waivers/expense reimbursements made by the Investment Manager and certain of its affiliates, if applicable.
(h) The benefits derived from expense reductions had an impact of less than 0.01%.
The accompanying Notes to Financial Statements are an integral part of this statement.
Annual Report 2015
25
COLUMBIA LARGE CAP GROWTH FUND
FINANCIAL HIGHLIGHTS (continued)
| | | Year Ended July 31, | | Year Ended
September 30, | |
Class R | | 2015 | | 2014 | | 2013 | | 2012(a) | | 2011 | | 2010(b) | |
Per share data | |
Net asset value, beginning of period | | $ | 34.44 | | | $ | 31.18 | | | $ | 25.61 | | | $ | 20.83 | | | $ | 20.64 | | | $ | 20.68 | | |
Income from investment operations: | |
Net investment income (loss) | | | (0.07 | ) | | | (0.02 | ) | | | 0.05 | | | | (0.01 | ) | | | (0.07 | ) | | | 0.00 | (c) | |
Net realized and unrealized gain (loss) | | | 7.24 | | | | 4.89 | | | | 5.52 | | | | 4.79 | | | | 0.26 | (d) | | | (0.04 | ) | |
Total from investment operations | | | 7.17 | | | | 4.87 | | | | 5.57 | | | | 4.78 | | | | 0.19 | | | | (0.04 | ) | |
Less distributions to shareholders: | |
Net investment income | | | (0.01 | ) | | | (0.00 | )(c) | | | — | | | | — | | | | — | | | | — | | |
Net realized gains | | | (4.00 | ) | | | (1.62 | ) | | | — | | | | — | | | | — | | | | — | | |
Total distributions to shareholders | | | (4.01 | ) | | | (1.62 | ) | | | — | | | | — | | | | — | | | | — | | |
Proceeds from regulatory settlements | | | — | | | | — | | | | — | | | | 0.00 | (c) | | | — | | | | — | | |
Increase from payment by affiliate | | | — | | | | 0.01 | | | | — | | | | — | | | | — | | | | — | | |
Net asset value, end of period | | $ | 37.60 | | | $ | 34.44 | | | $ | 31.18 | | | $ | 25.61 | | | $ | 20.83 | | | $ | 20.64 | | |
Total return | | | 22.20 | % | | | 16.06 | %(e) | | | 21.75 | % | | | 22.95 | % | | | 0.92 | % | | | (0.19 | %) | |
Ratios to average net assets(f) | |
Total gross expenses | | | 1.36 | % | | | 1.39 | % | | | 1.43 | % | | | 1.40 | %(g) | | | 1.41 | %(h) | | | 1.21 | %(g) | |
Total net expenses(i) | | | 1.36 | %(j) | | | 1.39 | %(j) | | | 1.43 | %(j) | | | 1.40 | %(g)(j) | | | 1.40 | %(h)(k) | | | 1.21 | %(g)(j) | |
Net investment income (loss) | | | (0.20 | %) | | | (0.06 | %) | | | 0.17 | % | | | (0.07 | %)(g) | | | (0.32 | %) | | | 1.28 | %(g) | |
Supplemental data | |
Net assets, end of period (in thousands) | | $ | 5,421 | | | $ | 1,534 | | | $ | 1,643 | | | $ | 726 | | | $ | 2,002 | | | $ | 2 | | |
Portfolio turnover | | | 59 | % | | | 88 | % | | | 104 | % | | | 80 | % | | | 116 | % | | | 122 | % | |
Notes to Financial Highlights
(a) For the period from October 1, 2011 to July 31, 2012. During the period, the Fund's fiscal year end was changed from September 30 to July 31.
(b) Based on operations from September 27, 2010 (commencement of operations) through the stated period end.
(c) Rounds to zero.
(d) Calculation of the net gain (loss) per share (both realized and unrealized) does not correlate to the aggregate realized and unrealized gain (loss) presented in the Statement of Operations due to the timing of subscriptions and redemptions of Fund shares in relation to fluctuations in the market value of the portfolio.
(e) The Fund received a payment from an affiliate. Had the Fund not received this payment, the total return would have been lower by 0.02%.
(f) In addition to the fees and expenses that the Fund bears directly, the Fund indirectly bears a pro rata share of the fees and expenses of any other funds in which it invests. Such indirect expenses are not included in the Fund's reported expense ratios.
(g) Annualized.
(h) Ratios include line of credit interest expense which is less than 0.01%.
(i) Total net expenses include the impact of certain fee waivers/expense reimbursements made by the Investment Manager and certain of its affiliates, if applicable.
(j) The benefits derived from expense reductions had an impact of less than 0.01%.
(k) The benefits derived from expense reductions had an impact of 0.01%.
The accompanying Notes to Financial Statements are an integral part of this statement.
Annual Report 2015
26
COLUMBIA LARGE CAP GROWTH FUND
FINANCIAL HIGHLIGHTS (continued)
| | | Year Ended July 31, | |
Class R4 | | 2015 | | 2014 | | 2013(a) | |
Per share data | |
Net asset value, beginning of period | | $ | 35.98 | | | $ | 32.48 | | | $ | 26.79 | | |
Income from investment operations: | |
Net investment income | | | 0.06 | | | | 0.15 | | | | 0.11 | | |
Net realized and unrealized gain | | | 7.63 | | | | 5.10 | | | | 5.69 | | |
Total from investment operations | | | 7.69 | | | | 5.25 | | | | 5.80 | | |
Less distributions to shareholders: | |
Net investment income | | | (0.18 | ) | | | (0.15 | ) | | | (0.11 | ) | |
Net realized gains | | | (4.00 | ) | | | (1.62 | ) | | | — | | |
Total distributions to shareholders | | | (4.18 | ) | | | (1.77 | ) | | | (0.11 | ) | |
Increase from payment by affiliate | | | — | | | | 0.02 | | | | — | | |
Net asset value, end of period | | $ | 39.49 | | | $ | 35.98 | | | $ | 32.48 | | |
Total return | | | 22.80 | % | | | 16.67 | %(b) | | | 21.70 | % | |
Ratios to average net assets(c) | |
Total gross expenses | | | 0.86 | % | | | 0.89 | % | | | 0.93 | %(d) | |
Total net expenses(e) | | | 0.86 | %(f) | | | 0.89 | %(f) | | | 0.93 | %(d)(f) | |
Net investment income | | | 0.17 | % | | | 0.42 | % | | | 0.49 | %(d) | |
Supplemental data | |
Net assets, end of period (in thousands) | | $ | 6,506 | | | $ | 766 | | | $ | 33 | | |
Portfolio turnover | | | 59 | % | | | 88 | % | | | 104 | % | |
Notes to Financial Highlights
(a) Based on operations from November 8, 2012 (commencement of operations) through the stated period end.
(b) The Fund received a payment from an affiliate. Had the Fund not received this payment, the total return would have been lower by 0.05%.
(c) In addition to the fees and expenses that the Fund bears directly, the Fund indirectly bears a pro rata share of the fees and expenses of any other funds in which it invests. Such indirect expenses are not included in the Fund's reported expense ratios.
(d) Annualized.
(e) Total net expenses include the impact of certain fee waivers/expense reimbursements made by the Investment Manager and certain of its affiliates, if applicable.
(f) The benefits derived from expense reductions had an impact of less than 0.01%.
The accompanying Notes to Financial Statements are an integral part of this statement.
Annual Report 2015
27
COLUMBIA LARGE CAP GROWTH FUND
FINANCIAL HIGHLIGHTS (continued)
| | | Year Ended July 31, | | Year Ended
September 30, | |
Class R5 | | 2015 | | 2014 | | 2013 | | 2012(a) | | 2011(b) | |
Per share data | |
Net asset value, beginning of period | | $ | 35.39 | | | $ | 32.00 | | | $ | 26.28 | | | $ | 21.36 | | | $ | 24.86 | | |
Income from investment operations: | |
Net investment income | | | 0.09 | | | | 0.19 | | | | 0.26 | | | | 0.11 | | | | 0.05 | | |
Net realized and unrealized gain (loss) | | | 7.51 | | | | 5.02 | | | | 5.64 | | | | 4.94 | | | | (3.55 | ) | |
Total from investment operations | | | 7.60 | | | | 5.21 | | | | 5.90 | | | | 5.05 | | | | (3.50 | ) | |
Less distributions to shareholders: | |
Net investment income | | | (0.22 | ) | | | (0.20 | ) | | | (0.18 | ) | | | (0.13 | ) | | | — | | |
Net realized gains | | | (4.00 | ) | | | (1.62 | ) | | | — | | | | — | | | | — | | |
Total distributions to shareholders | | | (4.22 | ) | | | (1.82 | ) | | | (0.18 | ) | | | (0.13 | ) | | | — | | |
Proceeds from regulatory settlements | | | — | | | | — | | | | — | | | | 0.00 | (c) | | | — | | |
Net asset value, end of period | | $ | 38.77 | | | $ | 35.39 | | | $ | 32.00 | | | $ | 26.28 | | | $ | 21.36 | | |
Total return | | | 22.95 | % | | | 16.74 | % | | | 22.59 | % | | | 23.70 | % | | | (14.08 | %) | |
| Ratios to average net assets(d) | |
Total gross expenses | | | 0.75 | % | | | 0.75 | % | | | 0.72 | % | | | 0.73 | %(e) | | | 0.70 | %(e)(f) | |
Total net expenses(g) | | | 0.75 | % | | | 0.75 | % | | | 0.72 | % | | | 0.73 | %(e) | | | 0.70 | %(e)(f)(h) | |
Net investment income | | | 0.25 | % | | | 0.57 | % | | | 0.89 | % | | | 0.53 | %(e) | | | 0.37 | %(e) | |
Supplemental data | |
Net assets, end of period (in thousands) | | $ | 3,879 | | | $ | 195 | | | $ | 36 | | | $ | 497 | | | $ | 407 | | |
Portfolio turnover | | | 59 | % | | | 88 | % | | | 104 | % | | | 80 | % | | | 116 | % | |
Notes to Financial Highlights
(a) For the period from October 1, 2011 to July 31, 2012. During the period, the Fund's fiscal year end was changed from September 30 to July 31.
(b) Based on operations from March 7, 2011 (commencement of operations) through the stated period end.
(c) Rounds to zero.
(d) In addition to the fees and expenses that the Fund bears directly, the Fund indirectly bears a pro rata share of the fees and expenses of any other funds in which it invests. Such indirect expenses are not included in the Fund's reported expense ratios.
(e) Annualized.
(f) Ratios include line of credit interest expense which is less than 0.01%.
(g) Total net expenses include the impact of certain fee waivers/expense reimbursements made by the Investment Manager and certain of its affiliates, if applicable.
(h) The benefits derived from expense reductions had an impact of less than 0.01%.
The accompanying Notes to Financial Statements are an integral part of this statement.
Annual Report 2015
28
COLUMBIA LARGE CAP GROWTH FUND
FINANCIAL HIGHLIGHTS (continued)
| | | Year Ended July 31, | | Year Ended
September 30, | |
Class T | | 2015 | | 2014 | | 2013 | | 2012(a) | | 2011 | | 2010 | |
Per share data | |
Net asset value, beginning of period | | $ | 34.27 | | | $ | 31.05 | | | $ | 25.49 | | | $ | 20.69 | | | $ | 20.49 | | | $ | 18.64 | | |
Income from investment operations: | |
Net investment income (loss) | | | 0.03 | | | | 0.04 | | | | 0.10 | | | | 0.01 | | | | (0.01 | ) | | | 0.03 | | |
Net realized and unrealized gain | | | 7.19 | | | | 4.87 | | | | 5.50 | | | | 4.79 | | | | 0.24 | (b) | | | 1.90 | | |
Total from investment operations | | | 7.22 | | | | 4.91 | | | | 5.60 | | | | 4.80 | | | | 0.23 | | | | 1.93 | | |
Less distributions to shareholders: | |
Net investment income | | | (0.08 | ) | | | (0.07 | ) | | | (0.04 | ) | | | — | | | | (0.03 | ) | | | (0.08 | ) | |
Net realized gains | | | (4.00 | ) | | | (1.62 | ) | | | — | | | | — | | | | — | | | | — | | |
Total distributions to shareholders | | | (4.08 | ) | | | (1.69 | ) | | | (0.04 | ) | | | — | | | | (0.03 | ) | | | (0.08 | ) | |
Proceeds from regulatory settlements | | | — | | | | — | | | | — | | | | 0.00 | (c) | | | — | | | | 0.00 | (c) | |
Net asset value, end of period | | $ | 37.41 | | | $ | 34.27 | | | $ | 31.05 | | | $ | 25.49 | | | $ | 20.69 | | | $ | 20.49 | | |
Total return | | | 22.49 | % | | | 16.21 | % | | | 22.01 | % | | | 23.20 | % | | | 1.12 | % | | | 10.40 | % | |
| Ratios to average net assets(d) | |
Total gross expenses | | | 1.13 | % | | | 1.19 | % | | | 1.23 | % | | | 1.21 | %(e) | | | 1.15 | %(f) | | | 1.15 | %(f) | |
Total net expenses(g) | | | 1.13 | %(h) | | | 1.19 | %(h) | | | 1.23 | %(h) | | | 1.21 | %(e)(h) | | | 1.14 | %(f)(i) | | | 1.15 | %(f)(h) | |
Net investment income | | | 0.08 | % | | | 0.13 | % | | | 0.35 | % | | | 0.05 | %(e) | | | (0.03 | %) | | | 0.15 | % | |
Supplemental data | |
Net assets, end of period (in thousands) | | $ | 197,026 | | | $ | 172,830 | | | $ | 160,462 | | | $ | 146,207 | | | $ | 130,081 | | | $ | 143,784 | | |
Portfolio turnover | | | 59 | % | | | 88 | % | | | 104 | % | | | 80 | % | | | 116 | % | | | 122 | % | |
Notes to Financial Highlights
(a) For the period from October 1, 2011 to July 31, 2012. During the period, the Fund's fiscal year end was changed from September 30 to July 31.
(b) Calculation of the net gain (loss) per share (both realized and unrealized) does not correlate to the aggregate realized and unrealized gain (loss) presented in the Statement of Operations due to the timing of subscriptions and redemptions of Fund shares in relation to fluctuations in the market value of the portfolio.
(c) Rounds to zero.
(d) In addition to the fees and expenses that the Fund bears directly, the Fund indirectly bears a pro rata share of the fees and expenses of any other funds in which it invests. Such indirect expenses are not included in the Fund's reported expense ratios.
(e) Annualized.
(f) Ratios include line of credit interest expense which is less than 0.01%.
(g) Total net expenses include the impact of certain fee waivers/expense reimbursements made by the Investment Manager and certain of its affiliates, if applicable.
(h) The benefits derived from expense reductions had an impact of less than 0.01%.
(i) The benefits derived from expense reductions had an impact of 0.01%.
The accompanying Notes to Financial Statements are an integral part of this statement.
Annual Report 2015
29
COLUMBIA LARGE CAP GROWTH FUND
FINANCIAL HIGHLIGHTS (continued)
| | | Year Ended July 31, | | Year Ended
September 30, | |
Class W | | 2015 | | 2014 | | 2013 | | 2012(a) | | 2011 | | 2010(b) | |
Per share data | |
Net asset value, beginning of period | | $ | 34.57 | | | $ | 31.26 | | | $ | 25.66 | | | $ | 20.85 | | | $ | 20.64 | | | $ | 20.68 | | |
Income from investment operations: | |
Net investment income | | | 0.03 | | | | 0.06 | | | | 0.12 | | | | 0.01 | | | | 0.02 | | | | 0.00 | (c) | |
Net realized and unrealized gain (loss) | | | 7.24 | | | | 4.91 | | | | 5.54 | | | | 4.82 | | | | 0.23 | (d) | | | (0.04 | ) | |
Total from investment operations | | | 7.27 | | | | 4.97 | | | | 5.66 | | | | 4.83 | | | | 0.25 | | | | (0.04 | ) | |
Less distributions to shareholders: | |
Net investment income | | | (0.09 | ) | | | (0.06 | ) | | | (0.06 | ) | | | (0.02 | ) | | | (0.04 | ) | | | — | | |
Net realized gains | | | (4.00 | ) | | | (1.62 | ) | | | — | | | | — | | | | — | | | | — | | |
Total distributions to shareholders | | | (4.09 | ) | | | (1.68 | ) | | | (0.06 | ) | | | (0.02 | ) | | | (0.04 | ) | | | — | | |
Proceeds from regulatory settlements | | | — | | | | — | | | | — | | | | 0.00 | (c) | | | — | | | | — | | |
Increase from payment by affiliate | | | — | | | | 0.02 | | | | — | | | | — | | | | — | | | | — | | |
Net asset value, end of period | | $ | 37.75 | | | $ | 34.57 | | | $ | 31.26 | | | $ | 25.66 | | | $ | 20.85 | | | $ | 20.64 | | |
Total return | | | 22.47 | % | | | 16.39 | %(e) | | | 22.12 | % | | | 23.19 | % | | | 1.21 | % | | | (0.19 | %) | |
Ratios to average net assets(f) | |
Total gross expenses | | | 1.11 | % | | | 1.14 | % | | | 1.14 | % | | | 1.19 | %(g) | | | 1.05 | %(h) | | | 0.96 | %(g) | |
Total net expenses(i) | | | 1.11 | %(j) | | | 1.14 | %(j) | | | 1.14 | %(j) | | | 1.19 | %(g)(j) | | | 1.04 | %(h)(k) | | | 0.96 | %(g)(j) | |
Net investment income | | | 0.09 | % | | | 0.18 | % | | | 0.43 | % | | | 0.07 | %(g) | | | 0.07 | % | | | 1.52 | %(g) | |
Supplemental data | |
Net assets, end of period (in thousands) | | $ | 144,250 | | | $ | 125,509 | | | $ | 4 | | | $ | 3 | | | $ | 3 | | | $ | 2 | | |
Portfolio turnover | | | 59 | % | | | 88 | % | | | 104 | % | | | 80 | % | | | 116 | % | | | 122 | % | |
Notes to Financial Highlights
(a) For the period from October 1, 2011 to July 31, 2012. During the period, the Fund's fiscal year end was changed from September 30 to July 31.
(b) Based on operations from September 27, 2010 (commencement of operations) through the stated period end.
(c) Rounds to zero.
(d) Calculation of the net gain (loss) per share (both realized and unrealized) does not correlate to the aggregate realized and unrealized gain (loss) presented in the Statement of Operations due to the timing of subscriptions and redemptions of Fund shares in relation to fluctuations in the market value of the portfolio.
(e) The Fund received a payment from an affiliate. Had the Fund not received this payment, the total return would have been lower by 0.06%.
(f) In addition to the fees and expenses that the Fund bears directly, the Fund indirectly bears a pro rata share of the fees and expenses of any other funds in which it invests. Such indirect expenses are not included in the Fund's reported expense ratios.
(g) Annualized.
(h) Ratios include line of credit interest expense which is less than 0.01%.
(i) Total net expenses include the impact of certain fee waivers/expense reimbursements made by the Investment Manager and certain of its affiliates, if applicable.
(j) The benefits derived from expense reductions had an impact of less than 0.01%.
(k) The benefits derived from expense reductions had an impact of 0.01%.
The accompanying Notes to Financial Statements are an integral part of this statement.
Annual Report 2015
30
COLUMBIA LARGE CAP GROWTH FUND
FINANCIAL HIGHLIGHTS (continued)
| | | Year Ended July 31, | | Year Ended
September 30, | |
Class Y | | 2015 | | 2014 | | 2013 | | 2012(a) | | 2011 | | 2010 | |
Per share data | |
Net asset value, beginning of period | | $ | 35.44 | | | $ | 32.03 | | | $ | 26.29 | | | $ | 21.36 | | | $ | 21.14 | | | $ | 19.20 | | |
Income from investment operations: | |
Net investment income | | | 0.07 | | | | 0.22 | | | | 0.25 | | | | 0.11 | | | | 0.11 | | | | 0.13 | | |
Net realized and unrealized gain | | | 7.57 | | | | 5.03 | | | | 5.67 | | | | 4.94 | | | | 0.23 | (b) | | | 1.97 | | |
Total from investment operations | | | 7.64 | | | | 5.25 | | | | 5.92 | | | | 5.05 | | | | 0.34 | | | | 2.10 | | |
Less distributions to shareholders: | |
Net investment income | | | (0.25 | ) | | | (0.22 | ) | | | (0.18 | ) | | | (0.12 | ) | | | (0.12 | ) | | | (0.16 | ) | |
Net realized gains | | | (4.00 | ) | | | (1.62 | ) | | | — | | | | — | | | | — | | | | — | | |
Total distributions to shareholders | | | (4.25 | ) | | | (1.84 | ) | | | (0.18 | ) | | | (0.12 | ) | | | (0.12 | ) | | | (0.16 | ) | |
Proceeds from regulatory settlements | | | — | | | | — | | | | — | | | | 0.00 | (c) | | | — | | | | 0.00 | (c) | |
Net asset value, end of period | | $ | 38.83 | | | $ | 35.44 | | | $ | 32.03 | | | $ | 26.29 | | | $ | 21.36 | | | $ | 21.14 | | |
Total return | | | 23.03 | % | | | 16.84 | % | | | 22.64 | % | | | 23.72 | % | | | 1.56 | % | | | 11.01 | % | |
Ratios to average net assets(d) | |
Total gross expenses | | | 0.71 | % | | | 0.70 | % | | | 0.71 | % | | | 0.72 | %(e) | | | 0.67 | %(f) | | | 0.64 | %(f) | |
Total net expenses(g) | | | 0.71 | % | | | 0.70 | % | | | 0.71 | % | | | 0.72 | %(e) | | | 0.67 | %(f)(h) | | | 0.64 | %(f)(h) | |
Net investment income | | | 0.19 | % | | | 0.66 | % | | | 0.90 | % | | | 0.55 | %(e) | | | 0.48 | % | | | 0.66 | % | |
Supplemental data | |
Net assets, end of period (in thousands) | | $ | 2,750 | | | $ | 3 | | | $ | 3,826 | | | $ | 14,446 | | | $ | 15,311 | | | $ | 22,272 | | |
Portfolio turnover | | | 59 | % | | | 88 | % | | | 104 | % | | | 80 | % | | | 116 | % | | | 122 | % | |
Notes to Financial Highlights
(a) For the period from October 1, 2011 to July 31, 2012. During the period, the Fund's fiscal year end was changed from September 30 to July 31.
(b) Calculation of the net gain (loss) per share (both realized and unrealized) does not correlate to the aggregate realized and unrealized gain (loss) presented in the Statement of Operations due to the timing of subscriptions and redemptions of Fund shares in relation to fluctuations in the market value of the portfolio.
(c) Rounds to zero.
(d) In addition to the fees and expenses that the Fund bears directly, the Fund indirectly bears a pro rata share of the fees and expenses of any other funds in which it invests. Such indirect expenses are not included in the Fund's reported expense ratios.
(e) Annualized.
(f) Ratios include line of credit interest expense which is less than 0.01%.
(g) Total net expenses include the impact of certain fee waivers/expense reimbursements made by the Investment Manager and certain of its affiliates, if applicable.
(h) The benefits derived from expense reductions had an impact of less than 0.01%.
The accompanying Notes to Financial Statements are an integral part of this statement.
Annual Report 2015
31
COLUMBIA LARGE CAP GROWTH FUND
FINANCIAL HIGHLIGHTS (continued)
| | | Year Ended July 31, | | Year Ended
September 30, | |
Class Z | | 2015 | | 2014 | | 2013 | | 2012(a) | | 2011 | | 2010 | |
Per share data | |
Net asset value, beginning of period | | $ | 35.41 | | | $ | 32.01 | | | $ | 26.28 | | | $ | 21.33 | | | $ | 21.12 | | | $ | 19.20 | | |
Income from investment operations: | |
Net investment income | | | 0.13 | | | | 0.15 | | | | 0.19 | | | | 0.07 | | | | 0.07 | | | | 0.09 | | |
Net realized and unrealized gain | | | 7.43 | | | | 5.03 | | | | 5.66 | | | | 4.94 | | | | 0.24 | (b) | | | 1.96 | | |
Total from investment operations | | | 7.56 | | | | 5.18 | | | | 5.85 | | | | 5.01 | | | | 0.31 | | | | 2.05 | | |
Less distributions to shareholders: | |
Net investment income | | | (0.18 | ) | | | (0.16 | ) | | | (0.12 | ) | | | (0.06 | ) | | | (0.10 | ) | | | (0.13 | ) | |
Net realized gains | | | (4.00 | ) | | | (1.62 | ) | | | — | | | | — | | | | — | | | | — | | |
Total distributions to shareholders | | | (4.18 | ) | | | (1.78 | ) | | | (0.12 | ) | | | (0.06 | ) | | | (0.10 | ) | | | (0.13 | ) | |
Proceeds from regulatory settlements | | | — | | | | — | | | | — | | | | 0.00 | (c) | | | — | | | | 0.00 | (c) | |
Net asset value, end of period | | $ | 38.79 | | | $ | 35.41 | | | $ | 32.01 | | | $ | 26.28 | | | $ | 21.33 | | | $ | 21.12 | | |
Total return | | | 22.80 | % | | | 16.61 | % | | | 22.34 | % | | | 23.52 | % | | | 1.41 | % | | | 10.74 | % | |
Ratios to average net assets(d) | |
Total gross expenses | | | 0.86 | % | | | 0.89 | % | | | 0.93 | % | | | 0.91 | %(e) | | | 0.85 | %(f) | | | 0.85 | %(f) | |
Total net expenses(g) | | | 0.86 | %(h) | | | 0.89 | %(h) | | | 0.93 | %(h) | | | 0.91 | %(e)(h) | | | 0.84 | %(f)(i) | | | 0.85 | %(f)(h) | |
Net investment income | | | 0.34 | % | | | 0.43 | % | | | 0.65 | % | | | 0.35 | %(e) | | | 0.28 | % | | | 0.45 | % | |
Supplemental data | |
Net assets, end of period (in thousands) | | $ | 1,049,380 | | | $ | 889,169 | | | $ | 850,041 | | | $ | 735,315 | | | $ | 683,738 | | | $ | 860,959 | | |
Portfolio turnover | | | 59 | % | | | 88 | % | | | 104 | % | | | 80 | % | | | 116 | % | | | 122 | % | |
Notes to Financial Highlights
(a) For the period from October 1, 2011 to July 31, 2012. During the period, the Fund's fiscal year end was changed from September 30 to July 31.
(b) Calculation of the net gain (loss) per share (both realized and unrealized) does not correlate to the aggregate realized and unrealized gain (loss) presented in the Statement of Operations due to the timing of subscriptions and redemptions of Fund shares in relation to fluctuations in the market value of the portfolio.
(c) Rounds to zero.
(d) In addition to the fees and expenses that the Fund bears directly, the Fund indirectly bears a pro rata share of the fees and expenses of any other funds in which it invests. Such indirect expenses are not included in the Fund's reported expense ratios.
(e) Annualized.
(f) Ratios include line of credit interest expense which is less than 0.01%.
(g) Total net expenses include the impact of certain fee waivers/expense reimbursements made by the Investment Manager and certain of its affiliates, if applicable.
(h) The benefits derived from expense reductions had an impact of less than 0.01%.
(i) The benefits derived from expense reductions had an impact of 0.01%.
The accompanying Notes to Financial Statements are an integral part of this statement.
Annual Report 2015
32
COLUMBIA LARGE CAP GROWTH FUND
NOTES TO FINANCIAL STATEMENTS
July 31, 2015
Note 1. Organization
Columbia Large Cap Growth Fund (the Fund), a series of Columbia Funds Series Trust I (the Trust), is a diversified fund. The Trust is registered under the Investment Company Act of 1940, as amended (the 1940 Act), as an open-end management investment company organized as a Massachusetts business trust.
Fund Shares
The Trust may issue an unlimited number of shares (without par value). The Fund offers Class A, Class B, Class C, Class E, Class F, Class I, Class K, Class R, Class R4, Class R5, Class T, Class W, Class Y and Class Z shares. Although all share classes generally have identical voting, dividend and liquidation rights, each share class votes separately when required by the Trust's organizational documents or by law. Different share classes pay different distribution amounts to the extent the expenses of such share classes differ, and distributions in liquidation will be proportional to the net asset value of each share class. Each share class has its own expense and sales charge structure.
Class A shares are subject to a maximum front-end sales charge of 5.75% based on the initial investment amount. Class A shares purchased without an initial sales charge in accounts aggregating $1 million to $50 million at the time of purchase are subject to a contingent deferred sales charge (CDSC) if the shares are sold within 18 months after purchase, charged as follows: 1.00% CDSC if redeemed within 12 months after purchase, and 0.50% CDSC if redeemed more than 12, but less than 18, months after purchase.
Class B shares may be subject to a maximum CDSC of 5.00% based upon the holding period after purchase. Class B shares will generally convert to Class A shares eight years after purchase. The Fund no longer accepts investments by new or existing investors in the Fund's Class B shares, except in connection with the reinvestment of any dividend and/or capital gain distributions in Class B shares of the Fund and exchanges by existing Class B shareholders of certain other funds within the Columbia Family of Funds.
Class C shares are subject to a 1.00% CDSC on shares redeemed within one year after purchase.
Class E shares are trust shares which are held in an irrevocable trust until the specified trust termination date. Class E shares are subject to a maximum front-end sales charge of 4.50% based on the investment amount. Class E shares purchased without an initial sales charge
in accounts aggregating $1 million to $5 million at the time of purchase are subject to a 1.00% CDSC if the shares are sold within one year after purchase. Class E shares are closed to new investors and new accounts.
Class F shares are trust shares which are held in an irrevocable trust until the specified trust termination date. Class F shares are subject to a maximum CDSC of 5.00% based upon the holding period after purchase. Class F shares will generally convert to Class E shares eight years after purchase. Class F shares are closed to new investors and new accounts.
Class I shares are not subject to sales charges and are available only to the Columbia Family of Funds.
Class K shares are not subject to sales charges, however this share class is closed to new investors.
Class R shares are not subject to sales charges and are generally available only to certain retirement plans and other investors as described in the Fund's prospectus.
Class R4 shares are not subject to sales charges and are generally available only to omnibus retirement plans and certain investors as described in the Fund's prospectus.
Class R5 shares are not subject to sales charges and are generally available only to investors purchasing through authorized investment professionals and omnibus retirement plans.
Class T shares are subject to a maximum front-end sales charge of 5.75% based on the investment amount. Class T shares purchased without an initial sales charge in accounts aggregating $1 million to $50 million at the time of purchase are subject to a CDSC if the shares are sold within 18 months after purchase, charged as follows: 1.00% CDSC if redeemed within 12 months after purchase, and 0.50% CDSC if redeemed more than 12, but less than 18, months after purchase. Class T shares are available only to investors who received (and who have continuously held) Class T shares in connection with previous fund reorganizations.
Class W shares are not subject to sales charges and are available only to investors purchasing through authorized investment programs managed by investment professionals, including discretionary managed account programs.
Class Y shares are not subject to sales charges and are generally available only to certain retirement plans as described in the Fund's prospectus.
Annual Report 2015
33
COLUMBIA LARGE CAP GROWTH FUND
NOTES TO FINANCIAL STATEMENTS (continued)
July 31, 2015
Class Z shares are not subject to sales charges and are available only to eligible investors, which are subject to different investment minimums as described in the Fund's prospectus.
Note 2. Summary of Significant Accounting Policies
Basis of Preparation
The Fund is an investment company that applies the accounting and reporting guidance in the Financial Accounting Standards Board (FASB) Accounting Standards Codification Topic 946, Financial Services — Investment Companies (ASC 946). The financial statements are prepared in accordance with U.S. generally accepted accounting principles (GAAP), which requires management to make certain estimates and assumptions that affect the reported amounts of assets and liabilities, the disclosure of contingent assets and liabilities at the date of the financial statements and the reported amounts of income and expenses during the reporting period. Actual results could differ from those estimates.
The following is a summary of significant accounting policies followed by the Fund in the preparation of its financial statements.
Security Valuation
All equity securities are valued at the close of business of the New York Stock Exchange (NYSE). Equity securities are valued at the last quoted sales price on the principal exchange or market on which they trade, except for securities traded on the NASDAQ Stock Market, which are valued at the NASDAQ official close price. Unlisted securities or listed securities for which there were no sales during the day are valued at the mean of the latest quoted bid and ask prices on such exchanges or markets.
Foreign equity securities are valued based on the closing price on the foreign exchange in which such securities are primarily traded. If any foreign equity security closing prices are not readily available, the securities are valued at the mean of the latest quoted bid and ask prices on such exchanges or markets. Foreign currency exchange rates are generally determined at 4:00 p.m. Eastern (U.S.) time. Many securities markets and exchanges outside the U.S. close prior to the close of the NYSE; therefore, the closing prices for securities in such markets or on such exchanges may not fully reflect events that occur after such close but before the close of the NYSE. In those situations, foreign securities will be
fair valued pursuant to a policy adopted by the Board of Trustees (the Board), including, if available, utilizing a third party pricing service to determine these fair values. The third party pricing service takes into account multiple factors, including, but not limited to, movements in the U.S. securities markets, certain depositary receipts, futures contracts and foreign exchange rates that have occurred subsequent to the close of the foreign exchange or market, to determine a good faith estimate that reasonably reflects the current market conditions as of the close of the NYSE. The fair value of a security is likely to be different from the quoted or published price, if available.
Investments in open-end investment companies, including money market funds, are valued at their latest net asset value.
Investments for which market quotations are not readily available, or that have quotations which management believes are not reflective of market value or reliable, are valued at fair value as determined in good faith under procedures approved by and under the general supervision of the Board. If a security or class of securities (such as foreign securities) is valued at fair value, such value is likely to be different from the quoted or published price for the security.
The determination of fair value often requires significant judgment. To determine fair value, management may use assumptions including but not limited to future cash flows and estimated risk premiums. Multiple inputs from various sources may be used to determine fair value.
GAAP requires disclosure regarding the inputs and valuation techniques used to measure fair value and any changes in valuation inputs or techniques. In addition, investments shall be disclosed by major category. This information is disclosed following the Fund's Portfolio of Investments.
Foreign Currency Transactions and Translations
The values of all assets and liabilities denominated in foreign currencies are generally translated into U.S. dollars at exchange rates determined at the close of the NYSE. Net realized and unrealized gains (losses) on foreign currency transactions and translations include gains (losses) arising from the fluctuation in exchange rates between trade and settlement dates on securities transactions, gains (losses) arising from the disposition of foreign currency and currency gains (losses) between the accrual and payment dates on dividends, interest income and foreign withholding taxes.
Annual Report 2015
34
COLUMBIA LARGE CAP GROWTH FUND
NOTES TO FINANCIAL STATEMENTS (continued)
July 31, 2015
For financial statement purposes, the Fund does not distinguish that portion of gains (losses) on investments which is due to changes in foreign exchange rates from that which is due to changes in market prices of the investments. Such fluctuations are included with the net realized and unrealized gains (losses) on investments in the Statement of Operations.
Security Transactions
Security transactions are accounted for on the trade date. Cost is determined and gains (losses) are based upon the specific identification method for both financial statement and federal income tax purposes.
Income Recognition
Corporate actions and dividend income are generally recorded net of any non-reclaimable tax withholdings, on the ex-dividend date or upon receipt of ex-dividend notification in the case of certain foreign securities.
The Fund may receive distributions from holdings in equity securities, business development companies (BDCs), exchange-traded funds, other regulated investment companies (RICs), and real estate investment trusts (REITs), which report information on the tax character of their distributions annually. These distributions are allocated to dividend income, capital gain and return of capital based on actual information reported. Return of capital is recorded as a reduction of the cost basis of securities held. If the Fund no longer owns the applicable securities, return of capital is recorded as a realized gain. With respect to REITs, to the extent actual information has not yet been reported, estimates for return of capital are made by the Fund's management. Management's estimates are subsequently adjusted when the actual character of the distributions is disclosed by the REITs, which could result in a proportionate change in return of capital to shareholders.
Awards from class action litigation are recorded as a reduction of cost basis if the Fund still owns the applicable securities on the payment date. If the Fund no longer owns the applicable securities, the proceeds are recorded as realized gains.
Expenses
General expenses of the Trust are allocated to the Fund and other funds of the Trust based upon relative net assets or other expense allocation methodologies determined by the nature of the expense. Expenses
directly attributable to the Fund are charged to the Fund. Expenses directly attributable to a specific class of shares are charged to that share class.
Determination of Class Net Asset Value
All income, expenses (other than class-specific expenses, which are charged to that share class, as shown in the Statement of Operations) and realized and unrealized gains (losses) are allocated to each class of the Fund on a daily basis, based on the relative net assets of each class, for purposes of determining the net asset value of each class.
Federal Income Tax Status
The Fund intends to qualify each year as a regulated investment company under Subchapter M of the Internal Revenue Code, as amended, and will distribute substantially all of its taxable income (including net short-term capital gains), if any, for its tax year, and as such will not be subject to federal income taxes. In addition, the Fund intends to distribute in each calendar year substantially all of its net investment income, capital gains and certain other amounts, if any, such that the Fund should not be subject to federal excise tax. Therefore, no federal income or excise tax provision is recorded.
Foreign Taxes
The Fund may be subject to foreign taxes on income, gains on investments or currency repatriation, a portion of which may be recoverable. The Fund will accrue such taxes and recoveries, as applicable, based upon its current interpretation of tax rules and regulations that exist in the markets in which it invests.
Realized gains in certain countries may be subject to foreign taxes at the Fund level, based on statutory rates. The Fund accrues for such foreign taxes on realized and unrealized gains at the appropriate rate for each jurisdiction, as applicable. The amount, if any, is disclosed as a liability on the Statement of Assets and Liabilities.
Distributions to Shareholders
Distributions from net investment income, if any, are declared and paid annually. Net realized capital gains, if any, are distributed along with the income distribution. Income distributions and capital gain distributions are determined in accordance with federal income tax regulations, which may differ from GAAP.
Annual Report 2015
35
COLUMBIA LARGE CAP GROWTH FUND
NOTES TO FINANCIAL STATEMENTS (continued)
July 31, 2015
Guarantees and Indemnifications
Under the Trust's organizational documents and, in some cases, by contract, its officers and trustees are indemnified against certain liabilities arising out of the performance of their duties to the Trust or its funds. In addition, certain of the Fund's contracts with its service providers contain general indemnification clauses. The Fund's maximum exposure under these arrangements is unknown since the amount of any future claims that may be made against the Fund cannot be determined, and the Fund has no historical basis for predicting the likelihood of any such claims.
Recent Accounting Pronouncement
Fair Value Measurement (Topic 820), Disclosure for Investments in Certain Entities That Calculate Net Asset Value per Share (or Its Equivalent)
In May 2015, the Financial Accounting Standards Board (FASB) issued Accounting Standards Update (ASU) No. 2015-07, Fair Value Measurement (Topic 820), Disclosure for Investments in Certain Entities That Calculate Net Asset Value per Share (or Its Equivalent). ASU No. 2015-07 changes the disclosure requirements for investments for which fair value is measured using the net asset value per share practical expedient. The disclosure requirements are effective for annual periods beginning after December 15, 2016 and interim periods within those fiscal years. At this time, management is evaluating the implications of this guidance and the impact it will have on the financial statement amounts and footnote disclosures, if any.
Note 3. Fees and Other Transactions with Affiliates
Investment Management Fees
Under an Investment Management Services Agreement, Columbia Management Investment Advisers, LLC (the Investment Manager), a wholly-owned subsidiary of Ameriprise Financial, Inc. (Ameriprise Financial), determines which securities will be purchased, held or sold. The investment management fee is an annual fee that is equal to a percentage of the Fund's average daily net assets that declines from 0.71% to 0.54% as the Fund's net assets increase. The effective investment management fee rate for the year ended July 31, 2015 was 0.61% of the Fund's average daily net assets.
Administration Fees
Under an Administrative Services Agreement, the Investment Manager also serves as the Fund
Administrator. The Fund pays the Fund Administrator an annual fee for administration and accounting services equal to a percentage of the Fund's average daily net assets that declines from 0.06% to 0.03% as the Fund's net assets increase. The effective administration fee rate for the year ended July 31, 2015 was 0.05% of the Fund's average daily net assets.
Compensation of Board Members
Board members, who are not officers or employees of the Investment Manager or Ameriprise Financial, are compensated for their services to the Fund as disclosed in the Statement of Operations. These Board members may participate in a Deferred Compensation Plan (the Plan) which may be terminated at any time. Obligations of the Plan will be paid solely out of the Fund's assets, and all amounts payable under the Plan constitute a general unsecured obligation of the Fund.
Compensation of Chief Compliance Officer
The Board has appointed a Chief Compliance Officer to the Fund in accordance with federal securities regulations. The Fund is allocated a portion of the expenses associated with the Chief Compliance Officer based on relative net assets of the Trust.
Transfer Agency Fees
Under a Transfer and Dividend Disbursing Agent Agreement, Columbia Management Investment Services Corp. (the Transfer Agent), an affiliate of the Investment Manager and a wholly-owned subsidiary of Ameriprise Financial, is responsible for providing transfer agency services to the Fund. The Transfer Agent has contracted with Boston Financial Data Services (BFDS) to serve as sub-transfer agent.
Effective November 1, 2014, the Transfer Agent receives a monthly transfer agency fee based on the number or the average value of accounts, depending on the type of account. Prior to November 1, 2014, the Transfer Agent received a monthly account-based service fee based on the number of open accounts. In addition, the Transfer Agent also receives sub-transfer agency fees based on a percentage of the average aggregate value of the Fund's shares maintained in omnibus accounts (other than omnibus accounts for which American Enterprise Investment Services Inc. is the broker of record or accounts where the beneficial shareholder is a customer of Ameriprise Financial Services, Inc., for which the Transfer Agent receives a per account fee). The Transfer Agent pays the fees of BFDS for services as sub-transfer
Annual Report 2015
36
COLUMBIA LARGE CAP GROWTH FUND
NOTES TO FINANCIAL STATEMENTS (continued)
July 31, 2015
agent and is not entitled to reimbursement for such fees from the Fund (with the exception of out-of-pocket fees).
The Transfer Agent also receives compensation from the Fund for various shareholder services and reimbursements for certain out-of-pocket fees. Total transfer agency fees for Class K and Class R5 shares are subject to an annual limitation of not more than 0.05% of the average daily net assets attributable to each share class. Class I and Class Y shares do not pay transfer agency fees.
For the year ended July 31, 2015, the Fund's effective transfer agency fee rates as a percentage of average daily net assets of each class were as follows:
Class A | | | 0.17 | % | |
Class B | | | 0.17 | | |
Class C | | | 0.17 | | |
Class E | | | 0.17 | | |
Class F | | | 0.17 | | |
Class K | | | 0.05 | | |
Class R | | | 0.17 | | |
Class R4 | | | 0.17 | | |
Class R5 | | | 0.05 | | |
Class T | | | 0.17 | | |
Class W | | | 0.17 | | |
Class Z | | | 0.17 | | |
The Fund and certain other associated investment companies have severally, but not jointly, guaranteed the performance and observance of all the terms and conditions of a lease entered into by Seligman Data Corp. (SDC), the former transfer agent, including the payment of rent by SDC (the Guaranty). SDC was the legacy Seligman funds' former transfer agent.
The lease and the Guaranty expire in January 2019. At July 31, 2015, the Fund's total potential future obligation over the life of the Guaranty is $149,343. The liability remaining at July 31, 2015 for non-recurring charges associated with the lease amounted to $83,691 and is recorded as a part of the payable for other expenses in the Statement of Assets and Liabilities. SDC is owned by six associated investment companies, including the Fund. The Fund's ownership interest in SDC at July 31, 2015 is recorded as a part of other assets in the Statement of Assets and Liabilities at a cost of $43,170, which approximates the fair value of the ownership interest.
An annual minimum account balance fee of $20 may apply to certain accounts with a value below the applicable share class's initial minimum investment requirements to reduce the impact of small accounts on transfer agency fees. These minimum account balance fees are remitted to the Fund and recorded as part of expense reductions in the Statement of Operations. For the year ended July 31, 2015, these minimum account balance fees reduced total expenses of the Fund by $33,192.
Plan Administration Fees
Under a Plan Administration Services Agreement with the Transfer Agent, the Fund pays an annual fee at a rate of 0.25% of the Fund's average daily net assets attributable to Class K shares for the provision of various administrative, recordkeeping, communication and educational services.
Distribution and Service Fees
The Fund has an agreement with Columbia Management Investment Distributors, Inc. (the Distributor), an affiliate of the Investment Manager and a wholly-owned subsidiary of Ameriprise Financial, for distribution and shareholder services. The Board has approved, and the Fund has adopted, distribution and shareholder service plans (the Plans) applicable to certain share classes, which set the distribution and service fees for the Fund. These fees are calculated daily and are intended to compensate the Distributor and/or eligible selling and/or servicing agents for selling shares of the Fund and providing services to investors.
Under the Plans, the Fund pays a monthly service fee to the Distributor at the maximum annual rate of 0.25% of the average daily net assets attributable to Class A, Class B, Class C, Class E, Class F and Class W shares of the Fund. Also under the Plans, the Fund pays a monthly distribution fee to the Distributor at the maximum annual rates of 0.10%, 0.75%, 0.75%, 0.10%, 0.75%, 0.50% and 0.25% of the average daily net assets attributable to Class A, Class B, Class C, Class E, Class F, Class R and Class W shares of the Fund, respectively.
Although the Fund may pay distribution and service fees up to a maximum annual rate of 0.35% of the Fund's average daily net assets attributable to Class A shares (comprised of up to 0.10% for distribution services and up to 0.25% for shareholder liaison services), the Fund currently limits such fees to an aggregate fee of not
Annual Report 2015
37
COLUMBIA LARGE CAP GROWTH FUND
NOTES TO FINANCIAL STATEMENTS (continued)
July 31, 2015
more than 0.25% of the Fund's average daily net assets attributable to Class A shares.
Although the Fund may pay a distribution fee up to 0.25% of the Fund's average daily net assets attributable to Class W shares and a service fee of up to 0.25% of the Fund's average daily net assets attributable to Class W shares, however the aggregate fee shall not exceed 0.25% of the Fund's average daily net assets attributable to Class W shares.
Shareholder Services Fees
The Fund has adopted a shareholder services plan that permits it to pay for certain services provided to Class T shareholders by their selling and/or servicing agents. The Fund may pay shareholder servicing fees up to an aggregate annual rate of 0.50% of the Fund's average daily net assets attributable to Class T shares (comprised of up to 0.25% for shareholder liaison services and up to 0.25% for administrative support services). Effective December 1, 2014, these fees are currently limited to an aggregate annual rate of not more than 0.25% of the Fund's average daily net assets attributable to Class T shares. Prior to December 1, 2014, these fees were limited to 0.30% of the Fund's average daily net assets attributable to Class T shares. The effective shareholder services fee rate for the year ended July 31, 2015 was 0.27% of the Fund's average daily net assets attributable to Class T shares.
Sales Charges
Sales charges, including front-end charges and CDSCs, received by the Distributor for distributing Fund shares were $969,310 for Class A, $4,021 for Class B, $3,842 for Class C, $810 for Class E, $8 for Class F and $27,658 for Class T shares for the year ended July 31, 2015.
Expenses Waived/Reimbursed by the Investment Manager and its Affiliates
The Fund's expense ratio is subject to an expense reimbursement arrangement pursuant to which fees will be waived and/or expenses reimbursed (excluding certain fees and expenses described below), so that the Fund's net operating expenses, after giving effect to fees waived/expenses reimbursed and any balance credits
and/or overdraft charges from the Fund's custodian, do not exceed the annual rates of:
| | | Voluntary
Expense Cap
Effective
December 1, 2014 | | Contractual
Expense Cap
Prior to
December 1, 2014 | |
Class A | | | 1.22 | % | | | 1.24 | % | |
Class B | | | 1.97 | | | | 1.99 | | |
Class C | | | 1.97 | | | | 1.99 | | |
Class E | | | 1.32 | | | | 1.34 | | |
Class F | | | 1.97 | | | | 1.99 | | |
Class I | | | 0.83 | | | | 0.84 | | |
Class K | | | 1.13 | | | | 1.14 | | |
Class R | | | 1.47 | | | | 1.49 | | |
Class R4 | | | 0.97 | | | | 0.99 | | |
Class R5 | | | 0.88 | | | | 0.89 | | |
Class T | | | 1.22 | | | | 1.29 | | |
Class W | | | 1.22 | | | | 1.24 | | |
Class Y | | | 0.83 | | | | 0.84 | | |
Class Z | | | 0.97 | | | | 0.99 | | |
The voluntary expense cap arrangement may be revised or discontinued at any time. Under the arrangements, the following fees and expenses are excluded from the waiver/reimbursement commitment, and therefore will be paid by the Fund, if applicable: taxes (including foreign transaction taxes), expenses associated with investments in affiliated and non-affiliated pooled investment vehicles (including mutual funds and exchange-traded funds), transaction costs and brokerage commissions, costs related to any securities lending program, dividend and interest expenses associated with securities sold short, inverse floater program fees and expenses, transaction charges and interest on borrowed money, interest and extraordinary expenses. Any fees waived and/or expenses reimbursed under the expense reimbursement arrangements described above are not recoverable by the Investment Manager or its affiliates in future periods.
Note 4. Federal Tax Information
The timing and character of income and capital gain distributions are determined in accordance with income tax regulations, which may differ from GAAP because of temporary or permanent book to tax differences.
Annual Report 2015
38
COLUMBIA LARGE CAP GROWTH FUND
NOTES TO FINANCIAL STATEMENTS (continued)
July 31, 2015
At July 31, 2015, these differences are primarily due to differing treatment for capital loss carryforwards, deferral/reversal of wash sale losses, Trustees' deferred compensation, distribution reclassifications, foreign currency transactions and proceeds from regulatory settlements. To the extent these differences are permanent, reclassifications are made among the components of the Fund's net assets in the Statement of Assets and Liabilities. Temporary differences do not require reclassifications. In the Statement of Assets and Liabilities the following reclassifications were made:
Excess of distributions over net investment income | | $ | 1,722,177 | | |
Accumulated net realized gain | | | 9,022,098 | | |
Paid-in capital | | | (10,744,275 | ) | |
Net investment income (loss) and net realized gains (losses), as disclosed in the Statement of Operations, and net assets were not affected by this reclassification.
The tax character of distributions paid during the years indicated was as follows:
Year Ended July 31, | | 2015 | | 2014 | |
Ordinary income | | $ | 10,450,703 | | | $ | 9,567,523 | | |
Long-term capital gains | | | 340,118,751 | | | | 146,164,196 | | |
Total | | $ | 350,569,454 | | | $ | 155,731,719 | | |
Short-term capital gain distributions, if any, are considered ordinary income distributions for tax purposes.
At July 31, 2015, the components of distributable earnings on a tax basis were as follows:
Undistributed ordinary income | | $ | 1,789,200 | | |
Undistributed long-term capital gains | | | 309,534,188 | | |
Net unrealized appreciation | | | 873,574,623 | | |
At July 31, 2015, the cost of investments for federal income tax purposes was $2,714,857,372 and the aggregate gross unrealized appreciation and depreciation based on that cost was:
Unrealized appreciation | | $ | 917,161,621 | | |
Unrealized depreciation | | | (43,586,998 | ) | |
Net unrealized appreciation | | $ | 873,574,623 | | |
For the year ended July 31, 2015, $86,833,288 of capital loss carryforward was utilized and $10,644,238 expired unused.
Management of the Fund has concluded that there are no significant uncertain tax positions in the Fund that would require recognition in the financial statements. However, management's conclusion may be subject to review and adjustment at a later date based on factors including, but not limited to, new tax laws, regulations,
and administrative interpretations (including relevant court decisions). Generally, the Fund's federal tax returns for the prior three fiscal years remain subject to examination by the Internal Revenue Service.
Note 5. Portfolio Information
The cost of purchases and proceeds from sales of securities, excluding short-term investments and derivatives, if any, aggregated to $1,887,569,989 and $2,082,774,723, respectively, for the year ended July 31, 2015. The amount of purchase and sale activity impacts the portfolio turnover rate reported in the Financial Highlights.
Note 6. Payments by Affiliates
During the year ended July 31, 2014, the Fund received a payment of $78,764 from the Investment Manager as a reimbursement for certain shareholders transactions processed at an incorrect price. The payment is included in Increase from payment by affiliate on the Statement of Changes in Net Assets.
Note 7. Affiliated Money Market Fund
The Fund invests in Columbia Short-Term Cash Fund, an affiliated money market fund established for the exclusive use by the Fund and other affiliated funds. The income earned by the Fund from such investments is included as Dividends — affiliated issuers in the Statement of Operations. As an investing fund, the Fund indirectly bears its proportionate share of the expenses of Columbia Short-Term Cash Fund.
Note 8. Shareholder Concentration
At July 31, 2015, one unaffiliated shareholder of record owned 11.8% of the outstanding shares of the Fund in one or more accounts. The Fund has no knowledge about whether any portion of those shares was owned beneficially. Affiliated shareholders of record owned 45.4% of the outstanding shares of the Fund in one or more accounts. Subscription and redemption activity by concentrated accounts may have a significant effect on the operations of the Fund.
Note 9. Line of Credit
The Fund has entered into a revolving credit facility with a syndicate of banks led by JPMorgan Chase Bank, N.A. whereby the Fund may borrow for the temporary funding of shareholder redemptions or for other temporary or emergency purposes. Pursuant to a December 9, 2014 amendment, the credit facility agreement, which is a collective agreement between the Fund and certain other funds managed by the Investment Manager, severally
Annual Report 2015
39
COLUMBIA LARGE CAP GROWTH FUND
NOTES TO FINANCIAL STATEMENTS (continued)
July 31, 2015
and not jointly, permits collective borrowings up to $550 million. Interest is charged to each participating fund based on its borrowings at a rate equal to the higher of (i) the overnight federal funds rate plus 1.00% or (ii) the one-month LIBOR rate plus 1.00%. Each borrowing under the credit facility matures no later than 60 days after the date of borrowing. The Fund also pays a commitment fee equal to its pro rata share of the amount of the credit facility at a rate of 0.075% per annum. The commitment fee is included in other expenses in the Statement of Operations. Prior to the December 9, 2014 amendment, the credit facility agreement permitted borrowings up to $500 million under the same terms and interest rates as described above.
The Fund had no borrowings during the year ended July 31, 2015.
Note 10. Significant Risks
Health Care Sector Risk
The Fund may be more susceptible to the particular risks that may affect companies in the health care sector than if it were invested in a wider variety of companies in unrelated sectors. Companies in the health care sector are subject to certain risks, including restrictions on government reimbursement for medical expenses, government approval of medical products and services, competitive pricing pressures, and the rising cost of medical products and services (especially for companies dependent upon a relatively limited number of products or services). Performance of such companies may be affected by factors including, government regulation, obtaining and protecting patents (or the failure to do so), product liability and other similar litigation as well as product obsolescence.
Technology and Technology-Related Investment Risk
Sector risk occurs when a fund invests a significant portion of its assets in securities of companies conducting business in a related group of industries within an economic sector. Companies in the same economic sector may be similarly affected by economic, regulatory, political or market events or conditions, making a fund more vulnerable to unfavorable developments in that economic sector than funds that invest more broadly. The Fund may be more susceptible to the particular risks that may affect companies in the technology and technology-related sectors than if it were
invested in a wider variety of companies in unrelated sectors.
Note 11. Subsequent Events
Management has evaluated the events and transactions that have occurred through the date the financial statements were issued and noted no items requiring adjustment of the financial statements or additional disclosure.
Note 12. Information Regarding Pending and Settled Legal Proceedings
In December 2005, without admitting or denying the allegations, American Express Financial Corporation (AEFC, which is now known as Ameriprise Financial, Inc. (Ameriprise Financial)) entered into settlement agreements with the Securities and Exchange Commission (SEC) and Minnesota Department of Commerce (MDOC) related to market timing activities. As a result, AEFC was censured and ordered to cease and desist from committing or causing any violations of certain provisions of the Investment Advisers Act of 1940, the Investment Company Act of 1940, and various Minnesota laws. AEFC agreed to pay disgorgement of $10 million and civil money penalties of $7 million. AEFC also agreed to retain an independent distribution consultant to assist in developing a plan for distribution of all disgorgement and civil penalties ordered by the SEC in accordance with various undertakings detailed at http://www.sec.gov/litigation/admin/ia-2451.pdf. Ameriprise Financial and its affiliates have cooperated with the SEC and the MDOC in these legal proceedings, and have made regular reports to the Funds' Boards of Trustees.
Ameriprise Financial and certain of its affiliates have historically been involved in a number of legal, arbitration and regulatory proceedings, including routine litigation, class actions, and governmental actions, concerning matters arising in connection with the conduct of their business activities. Ameriprise Financial believes that the Funds are not currently the subject of, and that neither Ameriprise Financial nor any of its affiliates are the subject of, any pending legal, arbitration or regulatory proceedings that are likely to have a material adverse effect on the Funds or the ability of Ameriprise Financial or its affiliates to perform under their contracts with the Funds. Ameriprise Financial is required to make quarterly (10-Q), annual (10-K) and, as necessary,
Annual Report 2015
40
COLUMBIA LARGE CAP GROWTH FUND
NOTES TO FINANCIAL STATEMENTS (continued)
July 31, 2015
8-K filings with the SEC on legal and regulatory matters that relate to Ameriprise Financial and its affiliates. Copies of these filings may be obtained by accessing the SEC website at www.sec.gov.
There can be no assurance that these matters, or the adverse publicity associated with them, will not result in increased fund redemptions, reduced sale of fund shares or other adverse consequences to the Funds. Further, although we believe proceedings are not likely to have a material adverse effect on the Funds or the ability of Ameriprise Financial or its affiliates to perform under their contracts with the Funds, these proceedings are subject to uncertainties and, as such, we are unable to estimate the possible loss or range of loss that may result. An adverse outcome in one or more of these proceedings could result in adverse judgments, settlements, fines, penalties or other relief that could have a material adverse effect on the consolidated financial condition or results of operations of Ameriprise Financial.
Annual Report 2015
41
COLUMBIA LARGE CAP GROWTH FUND
REPORT OF INDEPENDENT REGISTERED PUBLIC ACCOUNTING FIRM
To the Trustees of Columbia Funds Series Trust I and the Shareholders of
Columbia Large Cap Growth Fund
In our opinion, the accompanying statement of assets and liabilities, including the portfolio of investments, and the related statements of operations and of changes in net assets and the financial highlights present fairly, in all material respects, the financial position of Columbia Large Cap Growth Fund (the "Fund," a series of Columbia Funds Series Trust I) at July 31, 2015, and the results of its operations, the changes in its net assets and the financial highlights for each of the periods indicated, in conformity with accounting principles generally accepted in the United States of America. These financial statements and financial highlights (hereafter referred to as "financial statements") are the responsibility of the Fund's management. Our responsibility is to express an opinion on these financial statements based on our audits. We conducted our audits of these financial statements in accordance with the standards of the Public Company Accounting Oversight Board (United States). Those standards require that we plan and perform the audit to obtain reasonable assurance about whether the financial statements are free of material misstatement. An audit includes examining, on a test basis, evidence supporting the amounts and disclosures in the financial statements, assessing the accounting principles used and significant estimates made by management, and evaluating the overall financial statement presentation. We believe that our audits, which included confirmation of securities at July 31, 2015 by correspondence with the custodian, brokers and transfer agent, provide a reasonable basis for our opinion.
PricewaterhouseCoopers LLP
Minneapolis, MN
September 21, 2015
Annual Report 2015
42
COLUMBIA LARGE CAP GROWTH FUND
FEDERAL INCOME TAX INFORMATION
(Unaudited)
The Fund hereby designates the following tax attributes for the fiscal year ended July 31, 2015. Shareholders will be notified in early 2016 of the amounts for use in preparing 2015 income tax returns.
Tax Designations:
| Qualified Dividend Income | | | 100.00 | % | |
| Dividends Received Deduction | | | 100.00 | % | |
Capital Gain Dividend | | $ | 325,135,043 | | |
Qualified Dividend Income. For taxable, non-corporate shareholders, the percentage of ordinary income distributed during the fiscal year that represents qualified dividend income subject to reduced tax rates.
Dividends Received Deduction. The percentage of ordinary income distributed during the fiscal year that qualifies for the corporate dividends received deduction.
Capital Gain Dividend. The Fund designates as a capital gain dividend the amount reflected above, or if subsequently determined to be different, the net capital gain of such fiscal period.
Annual Report 2015
43
COLUMBIA LARGE CAP GROWTH FUND
The Trustees serve terms of indefinite duration. The names and birth years of the Trustees and Officers of the Funds in Columbia Funds Series Trust I, the year each was first elected or appointed to office, their principal business occupations during at least the last five years, the number of Funds overseen by each Trustee and other directorships they hold are shown below. Each officer listed below serves as an officer of each Fund in Columbia Funds Series Trust I. The mailing address of each Trustee is: c/o Columbia Management Investment Advisers, LLC, 225 Franklin Street, Mail Drop BX32 05228, Boston, MA 02110.
Independent Trustees
Name, Year of Birth
and Position Held
with the Trust | | Year First
Appointed or
Elected as
Trustee to any
Fund Currently
in the Columbia
Funds Complex
or a Predecessor
Thereof | | Principal Occupation(s)
during the Past Five Years | | Number
of Funds
in the
Columbia
Funds
Complex
Overseen | | Other Directorships
Held by Trustee During
the Past Five Years | |
Janet Langford Carrig
(Born 1957)
Trustee | | | 1996 | | | Senior Vice President, General Counsel and Corporate Secretary, ConocoPhillips (integrated energy company) since September 2007; Deputy General Counsel — Corporate Legal Services, ConocoPhillips from August 2006 to August 2007; Partner, Zelle, Hofmann, Voelbel, Mason & Gette LLP (law firm) from March 2005 to July 2006; Adjunct Professor of Law, Northwestern University from September 2004 to June 2006; Director, UAL Corporation (airline) from February 2006 to July 2006; Chief Administrative Officer and Senior Vice President, Kmart Holding Corporation (consumer goods) from September 2003 to March 2004 | | | 60 | | | None | |
Douglas A. Hacker
(Born 1955)
Trustee and Chairman
of the Board | | | 1996 | | | Independent business executive since May 2006; Executive Vice President — Strategy of United Airlines from December 2002 to May 2006; President of UAL Loyalty Services (airline marketing company) from September 2001 to December 2002; Executive Vice President and Chief Financial Officer of United Airlines from July 1999 to September 2001 | | | 60 | | | Spartan Nash Company, (food distributor); Nash Finch Company (food distributor) from 2005 to 2013; Aircastle Limited (aircraft leasing); SeaCube Container Leasing Ltd. (container leasing) from 2010 to 2013; and Travelport Worldwide Limited (travel information technology) | |
Nancy T. Lukitsh
(Born 1956)
Trustee | | | 2011 | | | Senior Vice President, Partner and Director of Marketing, Wellington Management Company, LLP (investment adviser) from 1997 to 2010; Chair, Wellington Management Investment Portfolios (commingled non-U.S. investment pools) from 2007 to 2010; Director, Wellington Trust Company, NA and other Wellington affiliates from 1997 to 2010 | | | 60 | | | None | |
William E. Mayer
(Born 1940)
Trustee | | | 1991 | | | Partner, Park Avenue Equity Partners (private equity) since February 1999 | | | 60 | | | DynaVox Inc. (speech creation); Lee Enterprises (print media); WR Hambrecht + Co. (financial service provider) from 2000 to 2012; BlackRock Kelso Capital Corporation (investment company); and Premier, Inc. (healthcare) | |
Annual Report 2015
44
COLUMBIA LARGE CAP GROWTH FUND
TRUSTEES AND OFFICERS (continued)
Independent Trustees (continued)
Name, Year of Birth
and Position Held
with the Trust | | Year First
Appointed or
Elected as
Trustee to any
Fund Currently
in the Columbia
Funds Complex
or a Predecessor
Thereof | | Principal Occupation(s)
during the Past Five Years | | Number
of Funds
in the
Columbia
Funds
Complex
Overseen | | Other Directorships
Held by Trustee During
the Past Five Years | |
David M. Moffett
(Born 1952)
Trustee | | | 2011 | | | Retired. Consultant to Bridgewater and Associates; Chief Executive Officer, Federal Home Loan Mortgage Corporation, from 2008 to 2009; Senior Adviser, Global Financial Services Group, Carlyle Group, Inc., from 2007 to 2008; Vice Chairman and Chief Financial Officer, U.S. Bancorp, from 1993 to 2007 | | | 60 | | | Building Materials Holding Corp. (building materials and construction services); CIT Group Inc. (commercial and consumer finance); eBay Inc. (online trading community); E.W. Scripps Co. (print and television media); Genworth Financial, Inc. (financial and insurance products and services); MBIA Inc. (financial service provider); Paypal Holdings Inc. (payment and data processing services); and University of Oklahoma Foundation | |
Charles R. Nelson
(Born 1942)
Trustee | | | 1981 | | | Retired. Professor Emeritus, University of Washington since 2011; Professor of Economics, University of Washington from 1976 to 2011; Ford and Louisa Van Voorhis Professor of Political Economy, University of Washington from 1993 to 2011; Adjunct Professor of Statistics, University of Washington from 1980 to 2011; Associate Editor, Journal of Money, Credit and Banking from September 1993 to 2008; consultant on econometric and statistical matters | | | 60 | | | None | |
John J. Neuhauser
(Born 1943)
Trustee | | | 1984 | | | President, Saint Michael's College since August 2007; Director or Trustee of several non-profit organizations, including Fletcher Allen Health Care, Inc.; Academic Vice President and Dean of Faculties, Boston College from August 1999 to October 2005; University Professor, Boston College from November 2005 to August 2007 | | | 60 | | | Liberty All-Star Equity Fund and Liberty All-Star Growth Fund (closed-end funds) | |
Patrick J. Simpson
(Born 1944)
Trustee | | | 2000 | | | Partner, Perkins Coie LLP (law firm) | | | 60 | | | None | |
Anne-Lee Verville
(Born 1945)
Trustee | | | 1998 | | | Retired. General Manager, Global Education Industry from 1994 to 1997, President — Application Systems Division from 1991 to 1994, Chief Financial Officer — US Marketing & Services from 1988 to 1991, and Chief Information Officer from 1987 to 1988, IBM Corporation (computer and technology) | | | 60 | | | Enesco Group, Inc. (producer of giftware and home and garden decor products) from 2001 to 2006 | |
Annual Report 2015
45
COLUMBIA LARGE CAP GROWTH FUND
TRUSTEES AND OFFICERS (continued)
Interested Trustee Affiliate with Investment Manager*
Name, Year of Birth
and Position Held
with the Trust | | Year First
Appointed or
Elected as
Trustee to any
Fund Currently
in the Columbia
Funds Complex
or a Predecessor
Thereof | | Principal Occupation(s)
during the Past Five Years | | Number
of Funds
in the
Columbia
Funds
Complex
Overseen | | Other Directorships
Held by Trustee During
the Past Five Years | |
William F. Truscott
(Born 1960)
Trustee | | | 2012 | | | Chairman of the Board and President, Columbia Management Investment Advisers, LLC since May 2010 and February 2012, respectively (previously President and Chief Investment Officer, 2001-April 2010); Chief Executive Officer, Global Asset Management, Ameriprise Financial, Inc. since September 2012 (previously Chief Executive Officer, U.S. Asset Management & President, Annuities, May 2010-September 2012 and President — U.S. Asset Management and Chief Investment Officer, 2005-April 2010); Director and Chief Executive Officer, Columbia Management Investment Distributors, Inc. since May 2010 and February 2012, respectively (previously Chairman of the Board and Chief Executive Officer, 2006-April 2010); Chairman of the Board and Chief Executive Officer, RiverSource Distributors, Inc. since 2006; Director, Threadneedle Asset Management Holdings, SARL since 2014; President and Chief Executive Officer, Ameriprise Certificate Company, 2006-August 2012 | | | 187 | | | Chairman of the Board, Columbia Management Investment Advisers, LLC since May 2010; Director, Columbia Management Investment Distributors, Inc. since May 2010; Director, Ameriprise Certificate Company, 2006 to January 2013 | |
* Interested person (as defined under the 1940 Act) by reason of being an officer, director, security holder and/or employee of the Investment Manager or Ameriprise Financial.
The Statement of Additional Information has additional information about the Fund's Board members and is available, without charge, upon request by calling 800.345.6611; contacting your financial intermediary; or visiting columbiathreadneedle.com/us.
The Board has appointed officers who are responsible for day-to-day business decisions based on policies it has established. The officers serve at the pleasure of the Board. In addition to Mr. Truscott, who is Senior Vice President, the Funds' other officers are:
Fund Officers
Name,
Address and
Year of Birth | | Position and Year
First Appointed to
Position for any Fund
in the Columbia
Funds Complex or a
Predecessor Thereof | | Principal Occupation(s) During Past Five Years | |
Christopher O. Petersen
5228 Ameriprise
Financial Center
Minneapolis, MN 55474
Born 1970 | | President and Principal Executive Officer (2015) | | Vice President and Lead Chief Counsel, Ameriprise Financial, Inc. since January 2015 (previously, Vice President and Chief Counsel January 2010-December 2014; and Vice President and Group Counsel or Counsel 2004- January 2010); officer of Columbia Funds and affiliated funds since 2007. | |
Michael G. Clarke
225 Franklin Street
Boston, MA 02110
Born 1969 | | Treasurer (2011) and Chief Financial Officer (2009) | | Vice President — Mutual Fund Administration, Columbia Management Investment Advisers, LLC, since May 2010; Managing Director of Fund Administration, Columbia Management Advisors, LLC, September 2004-April 2010; senior officer of Columbia Funds and affiliated funds since 2002. | |
Annual Report 2015
46
COLUMBIA LARGE CAP GROWTH FUND
TRUSTEES AND OFFICERS (continued)
Fund Officers (continued)
Name,
Address and
Year of Birth | | Position and Year
First Appointed to
Position for any Fund
in the Columbia
Funds Complex or a
Predecessor Thereof | | Principal Occupation(s) During Past Five Years | |
Paul B. Goucher
100 Park Avenue
New York, NY 10017
Born 1968 | | Senior Vice President (2011), Chief Legal Officer (2015) and Assistant Secretary (2008) | | Vice President and Lead Chief Counsel, Ameriprise Financial, Inc. since November 2008 and January 2013, respectively (previously Chief Counsel, January 2010-January 2013 and Group Counsel, November 2008-January 2010). | |
Thomas P. McGuire
225 Franklin Street
Boston, MA 02110
Born 1972 | | Vice President and Chief Compliance Officer (2012) | | Vice President — Asset Management Compliance, Ameriprise Financial, Inc., since May 2010; Chief Compliance Officer, Ameriprise Certificate Company since September 2010; Compliance Executive, Bank of America, 2005-April 2010. | |
Colin Moore
225 Franklin Street
Boston, MA 02110
Born 1958 | | Senior Vice President (2010) | | Executive Vice President and Global Chief Investment Officer, Ameriprise Financial, Inc., since July 2013; Director and Global Chief Investment Officer, Columbia Management Investment Advisers, LLC since May 2010; Manager, Managing Director and Chief Investment Officer, Columbia Management Advisors, LLC, 2007-April 2010. | |
Michael E. DeFao
225 Franklin Street
Boston, MA 02110
Born 1968 | | Vice President (2011) and Assistant Secretary (2010) | | Vice President and Chief Counsel, Ameriprise Financial, Inc. since May 2010; Associate General Counsel, Bank of America, 2005-April 2010. | |
Joseph F. DiMaria
225 Franklin Street
Boston, MA 02110
Born 1968 | | Vice President (2011), Assistant Treasurer (2012) and Chief Accounting Officer (2008) | | Vice President — Mutual Fund Treasurer, Columbia Management Investment Advisers, LLC since May 2010; Director of Fund Administration, Columbia Management Advisors, LLC, 2006-April 2010. | |
Amy Johnson
5228 Ameriprise
Financial Center
Minneapolis, MN 55474
Born 1965 | | Vice President (2006) | | Managing Director and Chief Operating Officer, Columbia Management Investment Advisers, LLC since May 2010 (previously Chief Administrative Officer, 2009-April 2010, and Vice President — Asset Management and Trust Company Services, 2006-2009). | |
Lyn Kephart-Strong
5228 Ameriprise
Financial Center
Minneapolis, MN 55474
Born 1960 | | Vice President (2015) | | President, Columbia Management Investment Services Corp. since October 2014; Vice President & Resolution Officer, Ameriprise Trust Company since August 2009; President, RiverSource Service Corporation 2004-2010. | |
Ryan C. Larrenaga
225 Franklin Street
Boston, MA 02110
Born 1970 | | Vice President and Secretary (2015) | | Vice President and Group Counsel, Ameriprise Financial, Inc. since August 2011 (previously, Counsel from May 2010 to August 2011); Assistant General Counsel, Bank of America, 2005-April 2010; officer of Columbia Funds and affiliated funds since 2005. | |
Annual Report 2015
47
COLUMBIA LARGE CAP GROWTH FUND
BOARD CONSIDERATION AND APPROVAL OF ADVISORY AGREEMENT
On June 10, 2015, the Board of Trustees (the Board) and the Trustees who are not interested persons (as defined in the Investment Company Act of 1940) (the Independent Trustees) of Columbia Funds Series Trust I (the Trust) unanimously approved the continuation of the Investment Management Services Agreement (the Advisory Agreement) with Columbia Management Investment Advisers, LLC (the Investment Manager) with respect to Columbia Large Cap Growth Fund (the Fund), a series of the Trust. The Board and the Independent Trustees also unanimously approved an agreement (the Management Agreement and, together with the Advisory Agreement, the Agreements) combining the Advisory Agreement and the Fund's existing administrative services agreement (the Administrative Services Agreement) in a single agreement. The Board and the Independent Trustees approved the restatement of the Advisory Agreement with the Management Agreement to be effective for the Fund on December 1, 2015, the Fund's next annual prospectus update. As detailed below, the Board's Advisory Fees and Expenses Committee (the Committee) and the Board met on multiple occasions to review and discuss, both among themselves and with the management team of the Investment Manager, materials provided by the Investment Manager and others before determining to approve the Management Agreement and the continuation of the Advisory Agreement.
In connection with their deliberations regarding the approval of the Management Agreement and the continuation of the Advisory Agreement, the Committee and the Board evaluated materials requested from the Investment Manager regarding the Fund and the Agreements, and discussed these materials with representatives of the Investment Manager at Committee meetings held on March 3, 2015, April 29, 2015 and June 9, 2015 and at Board meetings held on March 4, 2015 and June 10, 2015. In addition, the Board considers matters bearing on the Agreements at most of its other meetings throughout the year and meets regularly with senior management of the Trust and the Investment Manager. Through the Board's Investment Oversight Committees, Trustees also meet with selected portfolio managers of the funds the Trustees oversee and other investment personnel at various times throughout the year. The Committee and the Board also consulted with its independent fee consultant, Fund counsel and with the Independent Trustees' independent legal counsel, who advised on various matters with respect to the Committee's and the Board's considerations and otherwise assisted the Committee and the Board in their deliberations. On June 9, 2015, the Committee recommended that the Board approve the Management Agreement and the continuation of the Advisory Agreement. On June 10, 2015, the Board, including the Independent Trustees, voting separately, unanimously approved the Management Agreement and the continuation of the Advisory Agreement for the Fund.
The Committee and the Board considered all information that they, their legal counsel or the Investment Manager believed reasonably necessary to evaluate and to determine whether to approve the Management Agreement and the continuation of the Advisory Agreement. The information and factors considered by the Committee and the Board in recommending for approval or approving the Management Agreement and the continuation of the Advisory Agreement for the Fund included the following:
• Information on the investment performance of the Fund relative to the performance of a group of mutual funds determined to be comparable to the Fund by an independent third-party data provider, as well as performance relative to benchmarks;
• Information on the Fund's advisory fees and total expenses, including information comparing the Fund's expenses to those of a group of comparable mutual funds, as determined by the independent third-party data provider;
• The Investment Manager's agreement to contractually limit or cap total operating expenses for the Fund so that total operating expenses (excluding certain fees and expenses, such as portfolio transaction costs and certain other investment related expenses, interest, taxes, acquired fund fees and expenses, and extraordinary expenses) would not exceed a specified percentage of the Fund's average annual net assets from December 31, 2015 through November 30, 2016;
• The terms and conditions of the Agreements;
Annual Report 2015
48
COLUMBIA LARGE CAP GROWTH FUND
BOARD CONSIDERATION AND APPROVAL OF ADVISORY AGREEMENT (continued)
• The current and proposed terms and conditions of other agreements and arrangements with affiliates of the Investment Manager relating to the operations of the Fund, including the Administrative Services Agreement1 and agreements with respect to the provision of distribution and transfer agency services to the Fund;
• Descriptions of various functions performed by the Investment Manager under the Agreements, including portfolio management and portfolio trading practices;
• Information regarding the management fees and investment performance of similarly-managed portfolios of other clients of the Investment Manager, including institutional separate accounts;
• Information regarding the reputation, regulatory history and resources of the Investment Manager, including information regarding senior management, portfolio managers and other personnel;
• Information regarding the capabilities of the Investment Manager with respect to compliance monitoring services, including an assessment of the Investment Manager's compliance system by the Fund's Chief Compliance Officer; and
• The profitability to the Investment Manager and its affiliates from their relationships with the Fund.
Nature, Extent and Quality of Services Provided under the Agreements
The Committee and the Board considered the nature, extent and quality of services provided to the Fund by the Investment Manager and its affiliates under the Agreements and under separate agreements for the provision of transfer agency and administrative services, and the resources dedicated to the Fund and the other Columbia Funds by the Investment Manager and its affiliates. The Committee and the Board also determined that the nature and level of the services to be provided under the Management Agreement would not decrease relative to the services provided under the Advisory Agreement and the Administrative Services Agreement. The Committee and the Board considered, among other things, the Investment Manager's ability to attract, motivate and retain highly qualified research, advisory and supervisory investment professionals (including personnel and other resources, compensation programs for personnel involved in fund management, reputation and other attributes), the portfolio management services provided by those investment professionals, and the quality of the Investment Manager's investment research capabilities and trade execution services. The Committee and the Board also considered the potential benefits to shareholders of investing in a mutual fund that is part of a fund complex offering exposure to a variety of asset classes and investment disciplines and providing a variety of fund and shareholder services.
The Committee and the Board also considered the professional experience and qualifications of the senior personnel of the Investment Manager, which included consideration of the Investment Manager's experience with similarly-structured funds. The Committee and the Board noted the compliance programs of and the compliance-related resources provided to the Fund by the Investment Manager and its affiliates, and considered the Investment Manager's ability to provide administrative services to the Fund and coordinate the activities of the Fund's other service providers. In evaluating the nature, extent and quality of services provided under the Agreements, the Committee and the Board considered that these services were provided to the Fund, rather than directly to Fund shareholders. The Committee and the Board accordingly affirmed, after considering various other matters, including the potential benefits to the Fund and its shareholders of the Independent Trustees' important role as pre-suit gatekeepers with respect to claims that they may determine are meritless or contrary to the Fund's best interests, that it was not the intention of the Board or the Investment Manager that there be any third-party beneficiaries of the Agreements. After reviewing these and related factors, the Committee and the Board concluded, within the context of their overall conclusions, that the nature, extent and quality of the services provided to the Fund under the Agreements supported the approval of the Management Agreement and the continuation of the Advisory Agreement.
1 Like the Advisory Agreement, the Administrative Services Agreement will terminate with respect to the Fund once the Management Agreement is effective for the Fund.
Annual Report 2015
49
COLUMBIA LARGE CAP GROWTH FUND
BOARD CONSIDERATION AND APPROVAL OF ADVISORY AGREEMENT (continued)
Investment Performance
The Committee and the Board reviewed information about the performance of the Fund over various time periods, including performance information relative to benchmarks and information based on reports of the independent third-party data provider that compared the performance of the Fund to the performance of a group of comparable mutual funds, and data provided by the independent fee consultant. The Committee and the Board also reviewed a description of the third party's methodology for identifying the Fund's peer groups for purposes of performance and expense comparisons.
The Committee and the Board noted that, through December 31, 2014, the Fund's performance was in the thirteenth, twenty-first and twenty-sixth percentile (where the best performance would be in the first percentile) of its category selected by the independent third-party data provider for the purposes of performance comparisons for the one-, three- and five-year periods, respectively.
The Committee and the Board also considered the Investment Manager's performance and reputation generally, the Investment Manager's historical responsiveness to Board concerns about performance, and the Investment Manager's willingness to take steps intended to improve performance. After reviewing these and related factors, the Committee and the Board concluded, within the context of their overall conclusions, that the performance of the Fund was sufficient, in light of other considerations, to warrant the continuation of the Advisory Agreement and the approval of the Management Agreement.
Investment Advisory Fee Rates and Other Expenses
The Committee and the Board considered the advisory fees charged to the Fund under the Advisory Agreement as well as the total expenses incurred by the Fund. In assessing the reasonableness of the fees under the Advisory Agreement, the Committee and the Board considered, among other information, the Fund's advisory fee and its total expense ratio as a percentage of average daily net assets. The Committee and the Board also considered that the proposed management fee would not exceed the sum of the fee rates payable under the Advisory Agreement and the Administrative Services Agreement. The Committee and the Board considered data provided by the independent fee consultant. The Committee and the Board noted that, as of December 31, 2014, the Fund's actual management fee and net expense ratio are ranked in the 3rd and 2nd quintiles, respectively, (where the lowest fees and expenses would be in the first quintile) against the Fund's expense universe as determined by the independent third-party data provider for purposes of expense comparison. The Committee and the Board also took into account the fee waiver and expense limitation arrangements agreed to by the Investment Manager, as noted above.
The Committee and the Board also received and considered information about the advisory fees charged by the Investment Manager to institutional separate accounts. In considering the fees charged to those accounts, the Committee and the Board took into account, among other things, the Investment Manager's representations about the differences between managing mutual funds as compared to other types of accounts, including differences in the services provided, differences in the risk profile of such business for the Investment Manager and the additional resources required to manage mutual funds effectively. The Committee and the Board also received and considered information about the fees charged by the Investment Manager for sub-advisory services provided to comparable unaffiliated funds. In evaluating the Fund's advisory fees, the Committee and the Board also took into account the demands, complexity and quality of the investment management of the Fund.
After reviewing these and related factors, the Committee and the Board concluded, within the context of their overall conclusions, that the advisory/management fee rates and expenses of the Fund were sufficient, in light of other considerations, to warrant the approval of the Management Agreement and continuation of the Advisory Agreement.
Costs of Services Provided and Profitability
The Committee and the Board also took note of the costs the Investment Manager and its affiliates incur in connection with the services provided (both on an absolute and relative basis) and the profitability to the Investment Manager and its affiliates in connection with their relationships with the Fund.
Annual Report 2015
50
COLUMBIA LARGE CAP GROWTH FUND
BOARD CONSIDERATION AND APPROVAL OF ADVISORY AGREEMENT (continued)
The Committee and the Board also considered the compensation directly or indirectly received by the Investment Manager's affiliates in connection with their relationships with the Fund. The Committee and the Board reviewed information provided by management as to the profitability to the Investment Manager and its affiliates of their relationships with the Fund, information about the allocation of expenses used to calculate profitability, and comparisons of profitability levels realized in 2014 to profitability levels realized in 2013. When reviewing profitability, the Committee and the Board also considered court cases in which adviser profitability was an issue in whole or in part, the performance of similarly managed funds, the performance of the Fund, and the expense ratio of the Fund. The Committee and the Board also considered information provided by the Investment Manager regarding the Investment Manager's financial condition and comparing its profitability to that of other asset management firms that are, or are subsidiaries of, publicly traded companies.
After reviewing these and related factors, the Committee and the Board concluded, within the context of their overall conclusions, that the costs of services provided and the profitability to the Investment Manager and its affiliates from their relationships with the Fund supported the approval of the Management Agreement and the continuation of the Advisory Agreement.
Economies of Scale
The Committee and the Board considered the potential existence of economies of scale in the provision by the Investment Manager of services to the Fund, to groups of related funds, and to the Investment Manager's investment advisory clients as a whole, and whether those economies of scale were shared with the Fund through breakpoints in investment advisory fees or other means, such as expense limitation arrangements and additional investments by the Investment Manager in investment, trading and compliance resources. The Committee and the Board noted that the investment advisory and management fee schedules for the Fund contained breakpoints that would reduce the fee rate on assets above specified threshold levels.
In considering these matters, the Committee and the Board also considered the costs of the services provided and the profitability to the Investment Manager and its affiliates from their relationships with the Fund, as discussed above. After reviewing these and related factors, the Committee and the Board concluded, within the context of their overall conclusions, that the extent to which any economies of scale were expected to be shared with the Fund supported the approval of the Management Agreement and the continuation of the Advisory Agreement.
Other Benefits to the Investment Manager
The Committee and the Board received and considered information regarding "fall-out" or ancillary benefits received by the Investment Manager and its affiliates as a result of their relationships with the Fund, such as the engagement of the Investment Manager to provide administrative services to the Fund and the engagement of the Investment Manager's affiliates to provide distribution and transfer agency services to the Fund. In this regard, among other matters, the Committee and the Board considered that the Fund's distributor retains a portion of the distribution fees from the Fund and receives a portion of the sales charges on sales or redemptions of certain classes of shares of the Fund. The Committee and the Board also considered the benefits of research made available to the Investment Manager by reason of brokerage commissions generated by the Fund's securities transactions, and reviewed information about the Investment Manager's practices with respect to allocating portfolio transactions for brokerage and research services. The Committee and the Board considered the possible conflicts of interest associated with certain fall-out or other ancillary benefits and the reporting, disclosure and other processes that are in place to address such possible conflicts of interest. The Committee and the Board recognized that the Investment Manager's profitability would be somewhat lower without these benefits.
Conclusion
The Committee and the Board reviewed all of the above considerations in reaching their decisions to recommend or approve the Management Agreement and the continuation of the Advisory Agreement. In their deliberations, the Trustees did not identify any particular information that was all-important or controlling, and individual
Annual Report 2015
51
COLUMBIA LARGE CAP GROWTH FUND
BOARD CONSIDERATION AND APPROVAL OF ADVISORY AGREEMENT (continued)
Trustees may have attributed different weights to the various factors. Based on their evaluation of all factors that they deemed to be material, including those factors described above, and assisted by the advice of independent legal counsel, the Board, including the Independent Trustees, voting separately, unanimously approved the Management Agreement and the continuation of the Advisory Agreement.
Annual Report 2015
52
COLUMBIA LARGE CAP GROWTH FUND
IMPORTANT INFORMATION ABOUT THIS REPORT
Each fund mails one shareholder report to each shareholder address. If you would like more than one report, please call shareholder services at 800.345.6611 and additional reports will be sent to you.
The policy of the Board is to vote the proxies of the companies in which each fund holds investments consistent with the procedures as stated in the Statement of Additional Information (SAI). You may obtain a copy of the SAI without charge by calling 800.345.6611; contacting your financial intermediary; visiting columbiathreadneedle.com/us; or searching the website of the Securities and Exchange Commission (SEC) at sec.gov. Information regarding how each fund voted proxies relating to portfolio securities is filed with the SEC by August 31st for the most recent 12-month period ending June 30th of that year, and is available without charge by visiting columbiathreadneedle.com/us, or searching the website of the SEC at sec.gov.
Each fund files a complete schedule of portfolio holdings with the SEC for the first and third quarters of each fiscal year on Form N-Q. Each fund's Form N-Q is available on the SEC's website at sec.gov and may be reviewed and copied at the SEC's Public Reference Room in Washington, D.C. Information on the operation of the Public Reference Room may be obtained by calling 800.SEC.0330. Each fund's complete schedule of portfolio holdings, as filed on Form N-Q, can also be obtained without charge, upon request, by calling 800.345.6611.
Annual Report 2015
53
Columbia Large Cap Growth Fund
P.O. Box 8081
Boston, MA 02266-8081

This information is for use with concurrent or prior delivery of a fund prospectus. Please read and consider the investment objectives, risks, charges and expenses for any fund carefully before investing. For a prospectus and summary prospectus, which contains this and other important information about the Fund, go to columbiathreadneedle.com/us. The Fund is distributed by Columbia Management Investment Distributors, Inc., member FINRA, and managed by Columbia Management Investment Advisers, LLC.
Columbia Threadneedle Investments (Columbia Threadneedle) is the global brand name of the Columbia and Threadneedle group of companies.
All rights reserved. Columbia Management Investment Distributors, Inc., 225 Franklin Street, Boston, MA 02110-2804
© 2015 Columbia Management Investment Advisers, LLC.
columbiathreadneedle.com/us
ANN174_07_E01_(09/15)

ANNUAL REPORT
July 31, 2015

CMG ULTRA SHORT TERM BOND FUND

 Dear Shareholder,
Today's investors are typically focused on outcomes, like living a certain retirement lifestyle, paying for college education or building a legacy. But in today's complex global investment landscape, even simple goals are not easily achieved.
At Columbia Threadneedle Investments, we aspire to help satisfy five core needs of today's investors:
n Generate an appropriate stream of income in retirement
Traditional approaches to generating income may not provide the diversification benefits they once did, and they may actually introduce unwanted risk in today's market. To seek to improve your potential to live comfortably long term, we endeavor to pursue investments that explore less traveled paths to income.
n Navigate a changing interest rate environment
Today's uncertain market environment includes the prospect of a rise in interest rates. Blending traditional investments with non-traditional or alternative products may help protect your wealth during periods of volatility. We can attempt to help strengthen your portfolio with agile products designed to take on the market's ups and downs.
n Maximize after-tax returns
In an environment where what you keep may be more important than what you earn, municipal bonds can help mitigate high tax burdens while providing potentially attractive yields. Our state and federal tax-exempt products are aimed at helping investors manage risk, minimize the fluctuation of capital and grow wealth on a more tax-efficient basis.
n Grow assets to achieve financial goals
We believe that finding and protecting growth comes from a disciplined security selection process designed to create excess return. Our goal is to provide investment solutions built to help you face today's market challenges and grow your assets at each crossroad of your journey.
n Ease the impact of volatile markets
Despite a bull market run that has benefited many investors over the past several years, it's important to remember the lessons of 2008 and the value that a well-diversified portfolio may provide through times of market volatility. We are here to help you hold onto the savings you have worked tirelessly to amass, and to provide you the best opportunity to maintain your standard of living regardless of market conditions.
Find out today how we can help you confidently invest to realize your dreams. Please visit us at blog.columbiathreadneedleus.com/our-best-ideas to learn more about our unique investment solutions.
The world is constantly changing, but our priority remains the same: to help you secure your finances, meet your goals and achieve success. Thank you for your continued investment with us.
Sincerely,

Christopher O. Petersen
President, Columbia Funds
Investors should consider the investment objectives, risks, charges and expenses of a mutual fund carefully before investing. For a free prospectus and summary prospectus, which contains this and other important information about a fund, visit columbiathreadneedle.com/us. The prospectus should be read carefully before investing.
Columbia Funds are distributed by Columbia Management Investment Distributors, Inc., member FINRA, and managed by Columbia Management Investment Advisers, LLC.
© 2015 Columbia Management Investment Advisers, LLC. All rights reserved.
CMG ULTRA SHORT TERM BOND FUND
Performance Overview | | | 2 | | |
Manager Discussion of Fund Performance | | | 4 | | |
Understanding Your Fund's Expenses | | | 6 | | |
Portfolio of Investments | | | 7 | | |
Statement of Assets and Liabilities | | | 16 | | |
Statement of Operations | | | 17 | | |
Statement of Changes in Net Assets | | | 18 | | |
Financial Highlights | | | 20 | | |
Notes to Financial Statements | | | 21 | | |
Report of Independent Registered
Public Accounting Firm | | | 27 | | |
Trustees and Officers | | | 28 | | |
Board Consideration and Approval of Advisory Agreement | | | 32 | | |
Important Information About This Report | | | 37 | | |
Fund Investment Manager
Columbia Management Investment
Advisers, LLC
225 Franklin Street
Boston, MA 02110
Fund Distributor
Columbia Management Investment
Distributors, Inc.
225 Franklin Street
Boston, MA 02110
Fund Transfer Agent
Columbia Management Investment
Services Corp.
P.O. Box 8081
Boston, MA 02266-8081
For more information about any of the funds, please visit columbiathreadneedle.com/us or call 800.345.6611. Customer Service Representatives are available to answer your questions Monday through Friday from 8 a.m. to 7 p.m. Eastern time.
The views expressed in this report reflect the current views of the respective parties. These views are not guarantees of future performance and involve certain risks, uncertainties and assumptions that are difficult to predict, so actual outcomes and results may differ significantly from the views expressed. These views are subject to change at any time based upon economic, market or other conditions and the respective parties disclaim any responsibility to update such views. These views may not be relied on as investment advice and, because investment decisions for a Columbia fund are based on numerous factors, may not be relied on as an indication of trading intent on behalf of any particular Columbia fund. References to specific securities should not be construed as a recommendation or investment advice.
CMG ULTRA SHORT TERM BOND FUND
Performance Summary
n CMG Ultra Short Term Bond Fund (the Fund) returned 0.37% for the 12-month period that ended July 31, 2015.
n The Fund outperformed its benchmark, the Barclays U.S. Short-Term Government/Corporate Index, which returned 0.23% during the same time period.
n Overweight positions in non-Treasury sectors, especially in the corporate and securitized sectors, and the Fund's duration positioning aided performance relative to the benchmark.
Average Annual Total Returns (%) (for period ended July 31, 2015)
| | | Inception | | 1 Year | | 5 Years | | 10 Years | |
CMG Ultra Short Term Bond Fund | | 03/08/04 | | | 0.37 | | | | 0.76 | | | | 1.79 | | |
Barclays U.S. Short-Term Government/Corporate Index | | | | | | | 0.23 | | | | 0.31 | | | | 1.88 | | |
The Fund commenced operations on November 23, 2009. The returns shown for periods prior to November 23, 2009 are the returns of CMG Ultra Short Term Bond Fund, the predecessor to the Fund and a portfolio of Columbia Funds Institutional Trust. Performance results reflect the effect of any fee waivers or reimbursements of Fund expenses by Columbia Management Investment Advisers, LLC and/or any of its affiliates. Absent these fee waivers or expense reimbursement arrangements, performance results would have been lower. All results shown assume reinvestment of distributions. The table does not reflect the deduction of taxes that a shareholder may pay on fund distributions or on the redemption of shares.
The performance information shown represents past performance and is not a guarantee of future results. The investment return and principal value of your investment will fluctuate so that your shares, when redeemed, may be worth more or less than their original cost. Current performance may be lower or higher than the performance information shown. You may obtain performance information current to the most recent month-end by contacting your financial intermediary, visiting columbiathreadneedle.com/us or calling 800.345.6611.
The Barclays U.S. Short-Term Government/Corporate Index tracks the performance of U.S. Government and corporate bonds rated investment grade or better, with maturities of less than one year.
Indices are not available for investment, are not professionally managed and do not reflect sales charges, fees, brokerage commissions, taxes or other expenses of investing. Securities in the Fund may not match those in an index.
Annual Report 2015
2
CMG ULTRA SHORT TERM BOND FUND
PERFORMANCE OVERVIEW (continued)
Performance of a Hypothetical $3,000,000 Investment (August 1, 2005 – July 31, 2015)

The chart above shows the change in value of a hypothetical $3,000,000 investment in CMG Ultra Short Term Bond Fund during the stated time period, and does not reflect the deduction of taxes that a shareholder may pay on Fund distributions or on the redemption of Fund shares.
Annual Report 2015
3
CMG ULTRA SHORT TERM BOND FUND
MANAGER DISCUSSION OF FUND PERFORMANCE
Portfolio Management
Leonard Aplet, CFA
James Sims, CFA*
Ronald Stahl, CFA*
*Effective April 2015, Messrs. Sims and Stahl were named Portfolio Managers of the Fund. Mary Werler no longer serves as a Portfolio Manager of the Fund.
Portfolio Breakdown (%)
(at July 31, 2015) | |
Asset-Backed Securities —
Non-Agency | | | 22.0 | | |
Commercial Mortgage-Backed Securities — Non-Agency | | | 7.5 | | |
Corporate Bonds & Notes | | | 52.0 | | |
Foreign Government
Obligations | | | 0.0 | (a) | |
Money Market Funds | | | 4.7 | | |
Municipal Bonds | | | 0.6 | | |
Residential Mortgage-Backed
Securities — Agency | | | 0.1 | | |
Treasury Bills | | | 1.0 | | |
U.S. Government & Agency
Obligations | | | 7.0 | | |
U.S. Treasury Obligations | | | 5.1 | | |
Total | | | 100.0 | | |
Percentages indicated are based upon total investments. The Fund's portfolio composition is subject to change.
(a) Rounds to zero.
Investment Risks
Market risk may affect a single issuer, sector of the economy, industry or the market as a whole. Mortgage- and asset-backed securities are affected by interest rates, financial health of issuers/originators, creditworthiness of entities providing credit enhancements and the value of underlying assets. Fixed-income securities present issuer default risk. A rise in interest rates may result in a price decline of fixed-income instruments held by the Fund, negatively impacting its performance and NAV. Falling rates may result in the Fund investing in lower yielding debt instruments, lowering the Fund's income and yield. These risks may be heightened for longer maturity and duration securities. Prepayment and extension risk exists as a loan, bond or other investment may be called, prepaid or redeemed before maturity and that similar yielding investments may not be available for purchase. Investing in derivatives is a
For the 12-month period that ended July 31, 2015, the Fund returned 0.37%. The Fund outperformed its benchmark, the Barclays U.S. Short-Term Government/Corporate Index, which returned 0.23% during the same time period. Overweight positions in non-Treasury sectors, especially in the corporate and securitized sectors, aided performance relative to the benchmark. The Fund's slightly longer duration (sensitivity to interest rates) also figured into its performance advantage over its benchmark.
A Volatile Environment for U.S. Financial Markets
After a strong start, the pace of U.S. economic growth fluctuated during the 12-month period that ended July 31, 2015. Another stormy winter in the Northeast and Midwest whittled away at gross domestic product (GDP) growth early in 2015. A strong dollar, a widening trade deficit and declining oil prices also took a bite out of growth. Yet most of these setbacks proved to be temporary as the U.S. economy rebounded in the second quarter of 2015. An average of 243,000 new jobs were added monthly to the U.S. workforce, driving the unemployment rate down to 5.3%. With the labor market tightening, wage pressures increased. The housing market continued to recover, even though first-time home buyers have yet to enter the market in large numbers. Home sales rose and pending sales also trended higher.
Against this backdrop, financial markets fluctuated as concerns about a sluggish global economy and uncertainty about the timing of a Federal Reserve (Fed) interest rate hike resulted in bouts of volatility that became more pronounced as the months wore on. The general expectation is for an increase in short-term interest rates sometime in the fall of 2015, even though inflation remains below the Fed's target rate of 2%. The Fed maintained the fed funds rate, a key short-term borrowing rate, at 0.00%-0.25%, keeping yields on short-term securities low throughout the period.
Yield Targeted to Improve Results
Short-term yields remained low throughout the period. In order to improve results, we took several steps to increase the Fund's yield without significantly adding to the Fund's risk exposure.
We maintained the Fund's overweight exposure to corporate and asset-backed securities (ABS), while gradually reducing the weight in commercial mortgage-backed securities (CMBS). These sectors outperformed similar-duration Treasury securities, which made up a modest 6% of the Fund's holdings — well below their weight in the benchmark index. Corporate securities outperformed Treasuries by 54 basis points, as measured by the Barclay's Short-Term Corporate Index. (A basis point is one hundredth of one percent.) Basic industry, real estate investment trust and wireline and wireless communications subsectors were the strongest contributors. The Fund's overweight in BBB rated credits also was a positive performance factor, as lower-rated credits outperformed. The Fund's overweight in ABS, which accounted for approximately 22% of the Fund, also benefited results. ABS outperformed similar-duration Treasuries by 41 basis points.
Annual Report 2015
4
CMG ULTRA SHORT TERM BOND FUND
MANAGER DISCUSSION OF FUND PERFORMANCE (continued)
The Fund's slightly longer duration also served to boost the Fund's yield. Although we lowered the Fund's duration from 0.67 years to 0.57 years during the period, we maintained a duration that was slightly longer than the benchmark's 0.54 years. Approximately 17% of the Fund's assets had a duration greater than one year. (Benchmark holdings are all shorter than one year.) These longer-duration holdings were balanced by floating-rate securities, whose yields reset periodically. This "barbelled" structure allowed the Fund to generate relatively higher yields without significantly raising overall duration.
Looking Ahead
As the market continues to assess the strength of the U.S. economy and uncertainty about the path and timing of changes in monetary policy, we presently expect interest rate volatility to remain moderate. We continue to watch inflation and unemployment, as interest rate policy remains tied to these key data. In this current environment, we continue to target duration that is slightly longer than that of the benchmark. However, as we get closer to the Fed's first interest rate increase in nearly seven years, which we expect to occur sometime in 2015, we would look to decrease duration in line with or slightly below that of the benchmark.
We currently plan to maintain the Fund's underweight in U.S. Treasury securities and its overweight in the corporate sector and in ABS, which we believe remain attractive. We continue to believe the corporate sector has the potential to outperform Treasuries because of its yield advantage. We believe corporate balance sheets currently remain in good shape despite relatively high debt issuance and the sharp drop in commodity prices. We also intend to continue to target the Fund's BBB exposure inside 18 months, aiming to reduce price variability. Within CMBS, we plan to continue to look for opportunities at this time in seasoned, AAA rated, super-senior securities.
specialized activity that involves special risks, which may result in significant losses. Market or other (e.g., interest rate) environments may adversely affect the liquidity of Fund investments, negatively impacting their price. Generally, the less liquid the market at the time the Fund sells a holding, the greater the risk of loss or decline of value to the Fund. See the Fund's prospectus for more information on these and other risks.
Quality Breakdown (%)
(at July 31, 2015) | |
AAA rating | | | 44.6 | | |
AA rating | | | 10.2 | | |
A rating | | | 25.9 | | |
BBB rating | | | 19.3 | | |
Total | | | 100.0 | | |
Percentages indicated are based upon total fixed income investments (excluding Money Market Funds).
Bond ratings apply to the underlying holdings of the Fund and not the Fund itself and are divided into categories ranging from highest to lowest credit quality, determined by using the middle rating of Moody's, S&P and Fitch, after dropping the highest and lowest available ratings. When ratings are available from only two rating agencies, the lower rating is used. When a rating is available from only one rating agency, that rating is used. When a bond is not rated by any rating agency, it is designated as "Not rated." Credit quality ratings assigned by a rating agency are subjective opinions, not statements of fact, and are subject to change, including daily. The ratings assigned by credit rating agencies are but one of the considerations that the Investment Manager incorporates into its credit analysis process, along with such other issuer-specific factors as cash flows, capital structure and leverage ratios, ability to de-leverage (repay) through free cash flow, quality of management, market positioning and access to capital, as well as such security-specific factors as the terms of the security (e.g., interest rate and time to maturity) and the amount and type of any collateral.
Annual Report 2015
5
CMG ULTRA SHORT TERM BOND FUND
UNDERSTANDING YOUR FUND'S EXPENSES
(Unaudited)
As an investor, you incur two types of costs. There are transaction costs, which generally include sales charges on purchases and may include redemption fees. There are also ongoing costs, which generally include management fees, distribution and/or service fees, and other fund expenses. The following information is intended to help you understand your ongoing costs (in dollars) of investing in the Fund and to help you compare these costs with the ongoing costs of investing in other mutual funds.
Analyzing Your Fund's Expenses
To illustrate these ongoing costs, we have provided examples and calculated the expenses paid by investors of the Fund during the period. The actual and hypothetical information in the table is based on an initial investment of $1,000 at the beginning of the period indicated and held for the entire period. Expense information is calculated two ways and each method provides you with different information. The amount listed in the "Actual" column is calculated using the Fund's actual operating expenses and total return for the period. You may use the Actual information, together with the amount invested, to estimate the expenses that you paid over the period. Simply divide your account value by $1,000 (for example, an $8,600 account value divided by $1,000 = 8.6), then multiply the results by the expenses paid during the period under the "Actual" column. The amount listed in the "Hypothetical" column assumes a 5% annual rate of return before expenses (which is not the Fund's actual return) and then applies the Fund's actual expense ratio for the period to the hypothetical return. You should not use the hypothetical account values and expenses to estimate either your actual account balance at the end of the period or the expenses you paid during the period. See "Compare With Other Funds" below for details on how to use the hypothetical data.
Compare With Other Funds
Since all mutual funds are required to include the same hypothetical calculations about expenses in shareholder reports, you can use this information to compare the ongoing cost of investing in the Fund with other funds. To do so, compare the hypothetical example with the 5% hypothetical examples that appear in the shareholder reports of other funds. As you compare hypothetical examples of other funds, it is important to note that hypothetical examples are meant to highlight the ongoing costs of investing in a fund only and do not reflect any transaction costs, such as sales charges, or redemption or exchange fees. Therefore, the hypothetical calculations are useful in comparing ongoing costs only, and will not help you determine the relative total costs of owning different funds. If transaction costs were included in these calculations, your costs would be higher.
February 1, 2015 – July 31, 2015
Account Value at the Beginning
of the Period ($) | | Account Value at the End of the
Period ($) | | Expenses Paid During the
Period ($) | | Fund's Annualized
Expense Ratio (%) | |
| Actual | | Hypothetical | | Actual | | Hypothetical | | Actual | | Hypothetical | | Actual | |
| | 1,000.00 | | | | 1,000.00 | | | | 1,003.10 | | | | 1,023.68 | | | | 1.25 | | | | 1.26 | | | | 0.25 | | |
Expenses paid during the period are equal to the annualized expense ratio as indicated above, multiplied by the average account value over the period and then multiplied by the number of days in the Fund's most recent fiscal half year and divided by 365.
Expenses do not include fees and expenses incurred indirectly by the Fund from its investment in underlying funds, including affiliated and non-affiliated pooled investment vehicles, such as mutual funds and exchange-traded funds.
Had Columbia Management Investment Advisers, LLC and/or certain of its affiliates not waived/reimbursed certain fees and expenses, account value at the end of the period would have been reduced.
Annual Report 2015
6
CMG ULTRA SHORT TERM BOND FUND
PORTFOLIO OF INVESTMENTS
July 31, 2015
(Percentages represent value of investments compared to net assets)
Corporate Bonds & Notes 51.5%
Issuer | | Coupon
Rate | | Principal
Amount ($) | | Value ($) | |
AUTOMOTIVE 1.6% | |
American Honda Finance Corp.(a)
10/07/16 | | | 0.784 | % | | | 7,200,000 | | | | 7,227,821 | | |
Daimler Finance North America LLC(a)(b)
08/01/17 | | | 0.640 | % | | | 7,500,000 | | | | 7,491,120 | | |
Ford Motor Credit Co. LLC
09/15/15 | | | 5.625 | % | | | 5,000,000 | | | | 5,025,530 | | |
01/15/16 | | | 2.500 | % | | | 5,000,000 | | | | 5,030,585 | | |
Total | | | | | | | 24,775,056 | | |
BANKING 13.6% | |
American Express Credit Corp.(a)
07/29/16 | | | 0.804 | % | | | 10,000,000 | | | | 10,013,760 | | |
Australia and New Zealand Banking Group Ltd.(a)(b)
01/10/17 | | | 0.663 | % | | | 10,000,000 | | | | 10,012,550 | | |
BB&T Corp.
12/01/16 | | | 1.050 | % | | | 9,000,000 | | | | 9,002,232 | | |
Bank of America Corp.
01/11/16 | | | 1.250 | % | | | 12,000,000 | | | | 12,024,264 | | |
Bank of Montreal(a)
07/15/16 | | | 0.809 | % | | | 10,000,000 | | | | 10,033,310 | | |
Bank of New York Mellon Corp. (The)(a)
05/22/18 | | | 0.664 | % | | | 9,000,000 | | | | 8,972,460 | | |
Bank of Nova Scotia (The)
10/09/15 | | | 0.750 | % | | | 5,000,000 | | | | 5,001,675 | | |
Canadian Imperial Bank of Commerce
07/18/16 | | | 1.350 | % | | | 7,500,000 | | | | 7,540,635 | | |
Canadian Imperial Bank of Commerce(a)
07/18/16 | | | 0.807 | % | | | 820,000 | | | | 822,989 | | |
Capital One Financial Corp.
07/15/16 | | | 3.150 | % | | | 2,500,000 | | | | 2,546,745 | | |
Capital One NA(a)
02/05/18 | | | 0.984 | % | | | 5,000,000 | | | | 5,001,235 | | |
Citigroup, Inc.
04/01/16 | | | 1.300 | % | | | 10,000,000 | | | | 10,025,420 | | |
DNB Bank ASA(b)
04/03/17 | | | 3.200 | % | | | 3,975,000 | | | | 4,089,925 | | |
Fifth Third Bancorp
01/25/16 | | | 3.625 | % | | | 10,000,000 | | | | 10,130,890 | | |
Goldman Sachs Group, Inc. (The)(a)
05/22/17 | | | 0.954 | % | | | 13,000,000 | | | | 12,997,491 | | |
Huntington National Bank (The)
08/02/16 | | | 1.350 | % | | | 9,035,000 | | | | 9,040,430 | | |
JPMorgan Chase & Co.
07/05/16 | | | 3.150 | % | | | 7,500,000 | | | | 7,642,635 | | |
JPMorgan Chase Bank NA(a)
06/13/16 | | | 0.616 | % | | | 7,500,000 | | | | 7,485,150 | | |
Corporate Bonds & Notes (continued)
Issuer | | Coupon
Rate | | Principal
Amount ($) | | Value ($) | |
KeyCorp
08/13/15 | | | 3.750 | % | | | 5,000,000 | | | | 5,004,906 | | |
Morgan Stanley
04/29/16 | | | 3.800 | % | | | 10,000,000 | | | | 10,215,890 | | |
National Bank of Canada(a)
11/06/15 | | | 0.441 | % | | | 10,000,000 | | | | 9,999,680 | | |
Royal Bank of Canada(a)
02/03/17 | | | 0.569 | % | | | 15,000,000 | | | | 14,999,910 | | |
Toronto-Dominion Bank (The)(a)
07/13/16 | | | 0.456 | % | | | 5,000,000 | | | | 5,000,200 | | |
09/09/16 | | | 0.741 | % | | | 7,500,000 | | | | 7,525,073 | | |
US Bank NA(a)
01/30/17 | | | 0.527 | % | | | 5,000,000 | | | | 4,996,385 | | |
Wells Fargo & Co.(a)
04/23/18 | | | 0.924 | % | | | 5,992,000 | | | | 6,002,989 | | |
Total | | | | | | | 206,128,829 | | |
CABLE AND SATELLITE 0.7% | |
DIRECTV Holdings LLC/Financing Co., Inc.
02/15/16 | | | 3.125 | % | | | 5,000,000 | | | | 5,057,505 | | |
NBCUniversal Enterprise, Inc.(a)(b)
04/15/16 | | | 0.826 | % | | | 5,625,000 | | | | 5,636,137 | | |
Total | | | | | | | 10,693,642 | | |
CONSTRUCTION MACHINERY 1.0% | |
Caterpillar Financial Services Corp.(a)
02/26/16 | | | 0.522 | % | | | 4,990,000 | | | | 4,993,862 | | |
03/03/17 | | | 0.513 | % | | | 2,500,000 | | | | 2,497,920 | | |
John Deere Capital Corp.
01/13/17 | | | 2.000 | % | | | 7,000,000 | | | | 7,106,778 | | |
Total | | | | | | | 14,598,560 | | |
ELECTRIC 4.0% | |
DTE Energy Co.
06/01/16 | | | 6.350 | % | | | 8,780,000 | | | | 9,169,525 | | |
Dominion Resources, Inc.
03/15/17 | | | 1.250 | % | | | 5,170,000 | | | | 5,158,652 | | |
Duke Energy Indiana, Inc.(a)
07/11/16 | | | 0.636 | % | | | 3,500,000 | | | | 3,501,435 | | |
Duke Energy Progress, Inc.(a)
03/06/17 | | | 0.479 | % | | | 6,250,000 | | | | 6,229,975 | | |
Exelon Corp.
06/09/17 | | | 1.550 | % | | | 3,000,000 | | | | 3,001,356 | | |
NSTAR Electric Co.(a)
05/17/16 | | | 0.516 | % | | | 5,000,000 | | | | 4,990,195 | | |
National Rural Utilities Cooperative
Finance Corp.(a)
11/23/16 | | | 0.582 | % | | | 10,000,000 | | | | 10,008,650 | | |
The accompanying Notes to Financial Statements are an integral part of this statement.
Annual Report 2015
7
CMG ULTRA SHORT TERM BOND FUND
PORTFOLIO OF INVESTMENTS (continued)
July 31, 2015
Corporate Bonds & Notes (continued)
Issuer | | Coupon
Rate | | Principal
Amount ($) | | Value ($) | |
NextEra Energy Capital Holdings, Inc.
06/01/17 | | | 1.586 | % | | | 5,000,000 | | | | 5,012,935 | | |
Southern California Edison Co.
11/01/17 | | | 1.250 | % | | | 2,000,000 | | | | 1,998,020 | | |
Southern Co. (The)
09/15/15 | | | 2.375 | % | | | 6,531,000 | | | | 6,543,701 | | |
WEC Energy Group, Inc.
06/15/18 | | | 1.650 | % | | | 5,835,000 | | | | 5,840,543 | | |
Total | | | | | | | 61,454,987 | | |
FINANCE COMPANIES 1.0% | |
General Electric Capital Corp.
01/08/16 | | | 1.000 | % | | | 10,000,000 | | | | 10,019,980 | | |
General Electric Capital Corp.(a)
01/09/17 | | | 0.563 | % | | | 5,000,000 | | | | 5,005,555 | | |
Total | | | | | | | 15,025,535 | | |
FOOD AND BEVERAGE 3.1% | |
Anheuser-Busch InBev Finance, Inc.(a)
01/27/17 | | | 0.485 | % | | | 5,000,000 | | | | 4,990,495 | | |
Anheuser-Busch InBev Worldwide, Inc.
07/15/17 | | | 1.375 | % | | | 5,000,000 | | | | 5,023,860 | | |
ConAgra Foods, Inc.(a)
07/21/16 | | | 0.662 | % | | | 5,000,000 | | | | 4,985,375 | | |
Diageo Capital PLC
05/11/17 | | | 1.500 | % | | | 5,000,000 | | | | 5,007,815 | | |
FBG Finance Pty Ltd.(b)
06/01/16 | | | 7.875 | % | | | 8,750,000 | | | | 9,219,438 | | |
General Mills, Inc.(a)
01/29/16 | | | 0.594 | % | | | 2,625,000 | | | | 2,623,228 | | |
Kraft Heinz Foods Co.(b)
06/30/17 | | | 1.600 | % | | | 5,000,000 | | | | 5,005,995 | | |
PepsiCo, Inc.(a)
07/17/17 | | | 0.539 | % | | | 10,600,000 | | | | 10,601,643 | | |
Total | | | | | | | 47,457,849 | | |
HEALTH CARE 2.0% | |
AmerisourceBergen Corp.
05/15/17 | | | 1.150 | % | | | 7,500,000 | | | | 7,463,362 | | |
Becton Dickinson and Co.(a)
06/15/16 | | | 0.736 | % | | | 5,000,000 | | | | 5,000,465 | | |
Cardinal Health, Inc.
06/15/18 | | | 1.950 | % | | | 2,000,000 | | | | 2,003,394 | | |
Express Scripts Holding Co.
05/15/16 | | | 3.125 | % | | | 4,500,000 | | | | 4,568,733 | | |
McKesson Corp.
03/10/17 | | | 1.292 | % | | | 5,000,000 | | | | 4,989,145 | | |
Corporate Bonds & Notes (continued)
Issuer | | Coupon
Rate | | Principal
Amount ($) | | Value ($) | |
Medtronic, Inc.(a)
02/27/17 | | | 0.375 | % | | | 7,000,000 | | | | 6,976,879 | | |
Total | | | | | | | 31,001,978 | | |
HEALTHCARE INSURANCE 1.3% | |
UnitedHealth Group, Inc.
12/15/17 | | | 1.400 | % | | | 3,700,000 | | | | 3,686,413 | | |
UnitedHealth Group, Inc.(a)
01/17/17 | | | 0.744 | % | | | 7,000,000 | | | | 7,005,901 | | |
WellPoint, Inc.
09/10/15 | | | 1.250 | % | | | 8,275,000 | | | | 8,279,439 | | |
Total | | | | | | | 18,971,753 | | |
INDEPENDENT ENERGY 1.5% | |
Anadarko Petroleum Corp.
09/15/16 | | | 5.950 | % | | | 5,012,000 | | | | 5,259,092 | | |
Canadian Natural Resources Ltd.(a)
03/30/16 | | | 0.657 | % | | | 5,000,000 | | | | 4,991,530 | | |
Devon Energy Corp.(a)
12/15/15 | | | 0.736 | % | | | 7,500,000 | | | | 7,495,125 | | |
Occidental Petroleum Corp.
02/01/16 | | | 2.500 | % | | | 5,080,000 | | | | 5,128,214 | | |
Total | | | | | | | 22,873,961 | | |
INTEGRATED ENERGY 1.4% | |
BP Capital Markets PLC
03/11/16 | | | 3.200 | % | | | 7,500,000 | | | | 7,609,800 | | |
Shell International Finance BV
03/22/17 | | | 5.200 | % | | | 5,595,000 | | | | 5,966,530 | | |
Total Capital International SA
01/10/17 | | | 1.000 | % | | | 7,500,000 | | | | 7,509,503 | | |
Total | | | | | | | 21,085,833 | | |
LIFE INSURANCE 2.3% | |
American International Group, Inc.
05/18/17 | | | 5.450 | % | | | 7,000,000 | | | | 7,501,214 | | |
Metropolitan Life Global Funding I(a)(b)
04/10/17 | | | 0.663 | % | | | 10,000,000 | | | | 10,013,080 | | |
New York Life Global Funding(a)(b)
09/06/16 | | | 0.379 | % | | | 10,000,000 | | | | 9,996,410 | | |
Prudential Financial, Inc.
09/17/15 | | | 4.750 | % | | | 7,000,000 | | | | 7,033,457 | | |
Total | | | | | | | 34,544,161 | | |
MEDIA AND ENTERTAINMENT 0.9% | |
21st Century Fox America, Inc.
10/17/16 | | | 8.000 | % | | | 1,815,000 | | | | 1,958,596 | | |
The accompanying Notes to Financial Statements are an integral part of this statement.
Annual Report 2015
8
CMG ULTRA SHORT TERM BOND FUND
PORTFOLIO OF INVESTMENTS (continued)
July 31, 2015
Corporate Bonds & Notes (continued)
Issuer | | Coupon
Rate | | Principal
Amount ($) | | Value ($) | |
Scripps Networks Interactive, Inc.
12/15/16 | | | 2.700 | % | | | 5,000,000 | | | | 5,086,890 | | |
Thomson Reuters Corp.
05/23/16 | | | 0.875 | % | | | 6,405,000 | | | | 6,396,430 | | |
Total | | | | | | | 13,441,916 | | |
METALS 0.8% | |
Rio Tinto Finance USA PLC
08/21/17 | | | 1.625 | % | | | 7,474,000 | | | | 7,452,355 | | |
Vale Overseas Ltd
01/11/16 | | | 6.250 | % | | | 5,000,000 | | | | 5,091,100 | | |
Total | | | | | | | 12,543,455 | | |
MIDSTREAM 1.4% | |
Columbia Pipeline Group, Inc.(b)
06/01/18 | | | 2.450 | % | | | 5,000,000 | | | | 5,032,270 | | |
Enterprise Products Operating LLC
02/01/16 | | | 3.200 | % | | | 3,084,000 | | | | 3,116,444 | | |
TransCanada PipeLines Ltd.(a)
01/12/18 | | | 1.076 | % | | | 7,500,000 | | | | 7,481,400 | | |
Transcontinental Gas Pipe Line Co. LLC
04/15/16 | | | 6.400 | % | | | 5,000,000 | | | | 5,183,065 | | |
Total | | | | | | | 20,813,179 | | |
NATURAL GAS 0.6% | |
Sempra Energy
06/01/16 | | | 6.500 | % | | | 8,640,000 | | | | 9,021,802 | | |
OIL FIELD SERVICES 1.0% | |
Halliburton Co.
08/01/16 | | | 1.000 | % | | | 6,500,000 | | | | 6,493,760 | | |
Noble Holding International Ltd.
03/01/16 | | | 3.050 | % | | | 8,425,000 | | | | 8,446,627 | | |
Total | | | | | | | 14,940,387 | | |
PHARMACEUTICALS 2.4% | |
AbbVie, Inc.
11/06/15 | | | 1.200 | % | | | 7,000,000 | | | | 7,007,959 | | |
Actavis Funding SCS(a)
09/01/16 | | | 1.158 | % | | | 4,750,000 | | | | 4,751,549 | | |
Amgen, Inc.
11/15/16 | | | 2.500 | % | | | 7,500,000 | | | | 7,628,250 | | |
GlaxoSmithKline Capital, Inc.
03/18/16 | | | 0.700 | % | | | 5,000,000 | | | | 5,007,370 | | |
Merck & Co., Inc.(a)
05/18/18 | | | 0.636 | % | | | 4,935,000 | | | | 4,948,571 | | |
Corporate Bonds & Notes (continued)
Issuer | | Coupon
Rate | | Principal
Amount ($) | | Value ($) | |
Roche Holdings, Inc.(b)
09/29/17 | | | 1.350 | % | | | 7,500,000 | | | | 7,542,645 | | |
Total | | | | | | | 36,886,344 | | |
PROPERTY & CASUALTY 2.1% | |
Berkshire Hathaway Finance Corp.(a)
01/10/17 | | | 0.433 | % | | | 5,000,000 | | | | 5,002,660 | | |
01/12/18 | | | 0.586 | % | | | 10,000,000 | | | | 9,999,030 | | |
Liberty Mutual Group, Inc.(b)
08/15/16 | | | 6.700 | % | | | 5,000,000 | | | | 5,287,645 | | |
Transatlantic Holdings, Inc.
12/14/15 | | | 5.750 | % | | | 1,547,000 | | | | 1,573,724 | | |
Travelers Companies, Inc. (The)
06/20/16 | | | 6.250 | % | | | 10,000,000 | | | | 10,493,280 | | |
Total | | | | | | | 32,356,339 | | |
RAILROADS 0.5% | |
Canadian National Railway Co.(a)
11/06/15 | | | 0.501 | % | | | 6,820,000 | | | | 6,818,425 | | |
REFINING 0.3% | |
Marathon Petroleum Corp.
03/01/16 | | | 3.500 | % | | | 5,180,000 | | | | 5,253,877 | | |
RESTAURANTS 0.3% | |
Yum! Brands, Inc.
04/15/16 | | | 6.250 | % | | | 5,101,000 | | | | 5,274,363 | | |
RETAIL REIT 1.0% | |
Kimco Realty Corp.
03/15/16 | | | 5.783 | % | | | 7,500,000 | | | | 7,703,917 | | |
Simon Property Group LP
01/30/17 | | | 2.800 | % | | | 7,500,000 | | | | 7,665,683 | | |
Total | | | | | | | 15,369,600 | | |
RETAILERS 1.0% | |
CVS Health Corp.
12/05/16 | | | 1.200 | % | | | 7,000,000 | | | | 7,018,753 | | |
Wal-Mart Stores, Inc.
04/21/17 | | | 1.000 | % | | | 7,500,000 | | | | 7,513,995 | | |
Total | | | | | | | 14,532,748 | | |
SUPRANATIONAL 1.3% | |
Inter-American Development Bank(a)
02/11/16 | | | 0.227 | % | | | 20,000,000 | | | | 20,004,100 | | |
The accompanying Notes to Financial Statements are an integral part of this statement.
Annual Report 2015
9
CMG ULTRA SHORT TERM BOND FUND
PORTFOLIO OF INVESTMENTS (continued)
July 31, 2015
Corporate Bonds & Notes (continued)
Issuer | | Coupon
Rate | | Principal
Amount ($) | | Value ($) | |
TECHNOLOGY 2.1% | |
Apple, Inc.
05/03/16 | | | 0.450 | % | | | 5,000,000 | | | | 5,000,815 | | |
05/05/17 | | | 1.050 | % | | | 5,000,000 | | | | 5,011,925 | | |
Cisco Systems, Inc.(a)
06/15/18 | | | 0.593 | % | | | 7,500,000 | | | | 7,484,962 | | |
Hewlett-Packard Co.
06/01/16 | | | 2.650 | % | | | 5,000,000 | | | | 5,060,540 | | |
Oracle Corp.(a)
07/07/17 | | | 0.484 | % | | | 10,000,000 | | | | 10,000,690 | | |
Total | | | | | | | 32,558,932 | | |
TRANSPORTATION SERVICES 0.4% | |
ERAC U.S.A. Finance LLC(b)
11/15/15 | | | 5.900 | % | | | 6,000,000 | | | | 6,083,034 | | |
WIRELINES 1.9% | |
AT&T, Inc.(a)
03/30/17 | | | 0.702 | % | | | 9,000,000 | | | | 8,951,886 | | |
Deutsche Telekom International
Finance BV(b)
04/11/16 | | | 3.125 | % | | | 5,000,000 | | | | 5,072,905 | | |
Orange SA
09/14/16 | | | 2.750 | % | | | 5,000,000 | | | | 5,083,850 | | |
Verizon Communications, Inc.
06/09/17 | | | 1.350 | % | | | 5,000,000 | | | | 4,995,715 | | |
Verizon Communications, Inc.(a)
06/09/17 | | | 0.681 | % | | | 5,000,000 | | | | 4,978,640 | | |
Total | | | | | | | 29,082,996 | | |
Total Corporate Bonds & Notes
(Cost: $783,865,879) | | | | | | | 783,593,641 | | |
Residential Mortgage-Backed Securities —
Agency 0.1% | |
Federal Home Loan Mortgage Corp.(a)
02/01/36 | | | 2.384 | % | | | 211,380 | | | | 226,854 | | |
Federal National Mortgage Association
CMO Series 2011-18 Class EM
06/25/37 | | | 4.000 | % | | | 555,393 | | | | 560,396 | | |
Federal National Mortgage Association(a)
03/01/34 | | | 2.755 | % | | | 145,005 | | | | 148,571 | | |
Total Residential Mortgage-Backed
Securities — Agency
(Cost: $928,111) | | | | | | | 935,821 | | |
Commercial Mortgage-Backed Securities —
Non-Agency 7.4%
Issuer | | Coupon
Rate | | Principal
Amount ($) | | Value ($) | |
Banc of America Commercial Mortgage Trust(a)
Series 2006-1 Class A1A
09/10/45 | | | 5.378 | % | | | 8,900,231 | | | | 8,972,447 | | |
Series 2006-1 Class A4
09/10/45 | | | 5.372 | % | | | 12,671,925 | | | | 12,682,808 | | |
Series 2006-4 Class A1A
07/10/46 | | | 5.617 | % | | | 13,399,187 | | | | 13,829,140 | | |
Banc of America Merrill Lynch Commercial Mortgage, Inc.
Series 2005-6 Class A4(a)
09/10/47 | | | 5.156 | % | | | 9,880,281 | | | | 9,886,605 | | |
Bear Stearns Commercial Mortgage Securities Trust
Series 2006-T24 Class A4
10/12/41 | | | 5.537 | % | | | 5,126,414 | | | | 5,305,038 | | |
Credit Suisse Commercial Mortgage Trust
Series 2006-C3 Class A3(a)
06/15/38 | | | 5.806 | % | | | 8,682,801 | | | | 8,818,148 | | |
GMAC Commercial Mortgage Securities, Inc.
Series 2006-C1 Class A1A(a)
11/10/45 | | | 5.233 | % | | | 15,171,238 | | | | 15,250,296 | | |
LB-UBS Commercial Mortgage Trust
Series 2006-C1 Class A4
02/15/31 | | | 5.156 | % | | | 4,794,495 | | | | 4,825,386 | | |
Series 2007-C2 Class A3
02/15/40 | | | 5.430 | % | | | 6,925,053 | | | | 7,259,124 | | |
LB-UBS Commercial Mortgage Trust(a)
Series 2006-C3 Class A4
03/15/39 | | | 5.661 | % | | | 6,251,066 | | | | 6,336,506 | | |
Series 2006-C4 Class A4
06/15/38 | | | 5.832 | % | | | 8,423,527 | | | | 8,627,756 | | |
Morgan Stanley Capital I Trust
Series 2006-T21 Class A4(a)
10/12/52 | | | 5.162 | % | | | 4,984,789 | | | | 4,993,941 | | |
Wachovia Bank Commercial Mortgage Trust
Series 2006-C24 Class A1A(a)
03/15/45 | | | 5.557 | % | | | 5,373,382 | | | | 5,465,530 | | |
Total Commercial Mortgage-Backed
Securities — Non-Agency
(Cost: $116,424,923) | | | | | | | 112,252,725 | | |
Asset-Backed Securities — Non-Agency 21.8% | |
ARI Fleet Lease Trust(b)
Series 2013-A Class A2
12/15/15 | | | 0.700 | % | | | 365,544 | | | | 365,539 | | |
Series 2014-A Class A2
11/15/22 | | | 0.810 | % | | | 2,616,127 | | | | 2,613,449 | | |
Ally Auto Receivables Trust
Series 2014-2 Class A2
07/17/17 | | | 0.680 | % | | | 7,477,865 | | | | 7,481,656 | | |
Series 2015-1 Class A2
02/15/18 | | | 0.920 | % | | | 4,425,000 | | | | 4,420,852 | | |
The accompanying Notes to Financial Statements are an integral part of this statement.
Annual Report 2015
10
CMG ULTRA SHORT TERM BOND FUND
PORTFOLIO OF INVESTMENTS (continued)
July 31, 2015
Asset-Backed Securities — Non-Agency (continued)
Issuer | | Coupon
Rate | | Principal
Amount ($) | | Value ($) | |
Ally Master Owner Trust(a)
Series 2013-1 Class A1
02/15/18 | | | 0.637 | % | | | 7,500,000 | | | | 7,505,110 | | |
Series 2013-3 Class A
09/15/18 | | | 0.707 | % | | | 5,000,000 | | | | 5,009,441 | | |
Series 2014-1 Class A1
01/15/19 | | | 0.657 | % | | | 1,750,000 | | | | 1,751,798 | | |
AmeriCredit Automobile Receivables Trust
Series 2014-2 Class A2A
10/10/17 | | | 0.540 | % | | | 3,215,559 | | | | 3,213,309 | | |
Series 2015-1 Class A2A
04/09/18 | | | 0.770 | % | | | 6,751,678 | | | | 6,748,754 | | |
American Credit Acceptance Receivables Trust(b)
Series 2013-1 Class A
04/16/18 | | | 1.450 | % | | | 492,500 | | | | 492,961 | | |
Series 2014-1 Class A
03/12/18 | | | 1.140 | % | | | 420,034 | | | | 420,101 | | |
Series 2014-3 Class A
08/10/18 | | | 0.990 | % | | | 2,110,097 | | | | 2,109,292 | | |
Series 2015-2 Class A
06/12/19 | | | 1.570 | % | | | 4,892,385 | | | | 4,890,587 | | |
Bank of the West Auto Trust
Series 2015-1 Class A2A(b)
04/16/18 | | | 0.870 | % | | | 5,050,000 | | | | 5,048,455 | | |
Barclays Dryrock Issuance Trust
Series 2014-1 Class A(a)
12/16/19 | | | 0.547 | % | | | 7,500,000 | | | | 7,493,266 | | |
CIT Equipment Collateral
Series 2014-VT1 Class A2(b)
05/22/17 | | | 0.860 | % | | | 6,750,000 | | | | 6,748,568 | | |
CNH Equipment Trust
Series 2014-A Class A2
06/15/17 | | | 0.490 | % | | | 1,056,631 | | | | 1,056,365 | | |
California Republic Auto Receivables Trust
Series 2014-3 Class A2
06/15/17 | | | 0.630 | % | | | 2,531,495 | | | | 2,531,363 | | |
Series 2015-2 Class A2
02/15/18 | | | 0.880 | % | | | 4,800,000 | | | | 4,798,864 | | |
Capital Auto Receivables Asset Trust
Series 2013-4 Class A3
03/20/18 | | | 1.090 | % | | | 4,350,000 | | | | 4,353,497 | | |
Series 2015-2 Class A1A
10/20/17 | | | 0.990 | % | | | 2,890,000 | | | | 2,889,277 | | |
Capital Auto Receivables Asset Trust(a)
Series 2014-3 Class A1
02/21/17 | | | 0.508 | % | | | 7,000,000 | | | | 6,997,800 | | |
Series 2015-2 Class A1B
10/20/17 | | | 0.588 | % | | | 2,000,000 | | | | 1,999,800 | | |
Chesapeake Funding LLC(a)(b)
Series 2011-2A Class A
04/07/24 | | | 1.438 | % | | | 5,221,229 | | | | 5,261,120 | | |
Series 2012-1A Class A
11/07/23 | | | 0.938 | % | | | 606,624 | | | | 606,772 | | |
Asset-Backed Securities — Non-Agency (continued)
Issuer | | Coupon
Rate | | Principal
Amount ($) | | Value ($) | |
Series 2014-1A Class A
03/07/26 | | | 0.608 | % | | | 7,561,129 | | | | 7,555,556 | | |
Chrysler Capital Auto Receivables Trust
Series 2014-BA Class A2(b)
09/15/17 | | | 0.690 | % | | | 6,023,694 | | | | 6,024,475 | | |
DT Auto Owner Trust(b)
Series 2014-3A Class A
04/16/18 | | | 0.980 | % | | | 2,440,813 | | | | 2,439,361 | | |
Series 2015-1A Class A
09/17/18 | | | 1.060 | % | | | 4,674,612 | | | | 4,672,559 | | |
Series 2015-2A Class A
09/17/18 | | | 1.240 | % | | | 6,162,476 | | | | 6,158,624 | | |
Drive Auto Receivables Trust(b)
Series 2015-BA Class A2A
12/15/17 | | | 0.930 | % | | | 5,000,000 | | | | 4,998,415 | | |
Series 2015-CA Class A2A
02/15/18 | | | 1.030 | % | | | 6,110,000 | | | | 6,107,910 | | |
Enterprise Fleet Financing LLC(b)
Series 2013-2 Class A2
03/20/19 | | | 1.060 | % | | | 2,825,543 | | | | 2,826,783 | | |
Series 2014-1 Class A2
09/20/19 | | | 0.870 | % | | | 4,273,521 | | | | 4,267,736 | | |
Series 2014-2 Class A2
03/20/20 | | | 1.050 | % | | | 5,146,131 | | | | 5,139,176 | | |
Series 2015-2 Class A2
02/22/21 | | | 1.590 | % | | | 6,500,000 | | | | 6,499,464 | | |
Exeter Automobile Receivables Trust(b)
Series 2014-2A Class A
08/15/18 | | | 1.060 | % | | | 604,875 | | | | 603,681 | | |
Series 2014-3A Class A
01/15/19 | | | 1.320 | % | | | 4,431,506 | | | | 4,425,608 | | |
Series 2015-1A Class A
06/17/19 | | | 1.600 | % | | | 4,201,350 | | | | 4,195,871 | | |
Series 2015-2A Class A
11/15/19 | | | 1.540 | % | | | 6,688,870 | | | | 6,682,171 | | |
First Investors Auto Owner Trust
Series 2014-3A Class A2(b)
11/15/18 | | | 1.060 | % | | | 2,085,436 | | | | 2,083,995 | | |
Ford Credit Auto Owner Trust
Series 2014-A Class A2
11/15/16 | | | 0.480 | % | | | 83,636 | | | | 83,638 | | |
Series 2014-B Class A2
03/15/17 | | | 0.470 | % | | | 3,166,373 | | | | 3,166,352 | | |
Ford Credit Floorplan Master Owner Trust
Series 2013-5 Class A2(a)
09/15/18 | | | 0.657 | % | | | 8,000,000 | | | | 8,001,081 | | |
GE Dealer Floorplan Master Note Trust
Series 2014-1 Class A(a)
07/20/19 | | | 0.568 | % | | | 5,000,000 | | | | 4,980,002 | | |
GE Equipment Small Ticket LLC
Series 2014-1A Class A2(b)
08/24/16 | | | 0.590 | % | | | 2,417,830 | | | | 2,416,728 | | |
The accompanying Notes to Financial Statements are an integral part of this statement.
Annual Report 2015
11
CMG ULTRA SHORT TERM BOND FUND
PORTFOLIO OF INVESTMENTS (continued)
July 31, 2015
Asset-Backed Securities — Non-Agency (continued)
Issuer | | Coupon
Rate | | Principal
Amount ($) | | Value ($) | |
GE Equipment Transportation LLC
Series 2013-2 Class A2
06/24/16 | | | 0.610 | % | | | 43,398 | | | | 43,395 | | |
Series 2014-1 Class A2
12/23/16 | | | 0.550 | % | | | 1,726,736 | | | | 1,725,470 | | |
Series 2015-1 Class A2
11/24/17 | | | 0.890 | % | | | 4,285,000 | | | | 4,280,697 | | |
GM Financial Automobile Leasing Trust
Series 2015-1 Class A2
12/20/17 | | | 1.100 | % | | | 9,000,000 | | | | 9,021,592 | | |
GreatAmerica Leasing Receivables Funding LLC
Series 2014-1 Class A2(b)
05/15/16 | | | 0.610 | % | | | 2,814,307 | | | | 2,813,863 | | |
Harley-Davidson Motorcycle Trust
Series 2015-1 Class A2A
01/15/19 | | | 0.800 | % | | | 3,759,840 | | | | 3,756,597 | | |
Hertz Fleet Lease Funding LP(a)(b)
Series 2014-1 Class A
04/10/28 | | | 0.589 | % | | | 6,937,662 | | | | 6,942,818 | | |
Series 2015-1 Class A
07/10/29 | | | 0.759 | % | | | 7,500,000 | | | | 7,499,999 | | |
Honda Auto Receivables Owner Trust
Series 2014-4 Class A2
01/17/17 | | | 0.580 | % | | | 3,000,000 | | | | 2,999,711 | | |
Hyundai Auto Lease Securitization Trust
Series 2014-B Class A2(b)
02/15/17 | | | 0.610 | % | | | 4,926,999 | | | | 4,927,341 | | |
MMAF Equipment Finance LLC
Series 2013-AA Class A2(b)
05/09/16 | | | 0.690 | % | | | 92,941 | | | | 92,958 | | |
Macquarie Equipment Funding Trust
Series 2014-A Class A2(b)
11/21/16 | | | 0.800 | % | | | 8,241,970 | | | | 8,257,737 | | |
Navitas Equipment Receivables LLC
Series 2013-1 Class A(b)
11/15/16 | | | 1.950 | % | | | 982,409 | | | | 982,329 | | |
New York City Tax Lien Trust
Series 2015-A Class A(b)(c)
11/10/28 | | | 1.340 | % | | | 4,400,000 | | | | 4,400,000 | | |
Prestige Auto Receivables Trust(b)
Series 2013-1A Class A2
02/15/18 | | | 1.090 | % | | | 330,627 | | | | 330,803 | | |
Series 2014-1A Class A2
03/15/18 | | | 0.970 | % | | | 931,677 | | | | 931,634 | | |
SLM Private Education Loan Trust(a)(b)
Series 2011-A Class A1
10/15/24 | | | 1.187 | % | | | 509,903 | | | | 511,538 | | |
Series 2011-B Class A1
12/16/24 | | | 1.037 | % | | | 1,132,781 | | | | 1,135,620 | | |
Series 2012-B Class A1
12/15/21 | | | 1.287 | % | | | 172,156 | | | | 172,334 | | |
Asset-Backed Securities — Non-Agency (continued)
Issuer | | Coupon
Rate | | Principal
Amount ($) | | Value ($) | |
Series 2013-A Class A1
08/15/22 | | | 0.787 | % | | | 3,152,258 | | | | 3,155,479 | | |
Series 2013-B Class A1
07/15/22 | | | 0.837 | % | | | 5,402,643 | | | | 5,410,734 | | |
SLM Student Loan Trust
Series 2006-1 Class A4(a)
07/25/19 | | | 0.385 | % | | | 6,805,005 | | | | 6,749,136 | | |
SMART Trust
Series 2012-4US Class A3B(a)
03/14/17 | | | 0.736 | % | | | 1,386,900 | | | | 1,385,546 | | |
SMB Private Education Loan Trust
Series 2015-B Class A1(a)(b)
02/15/23 | | | 0.891 | % | | | 4,090,000 | | | | 4,083,821 | | |
Santander Drive Auto Receivables Trust
Series 2014-1 Class A2A
06/15/17 | | | 0.660 | % | | | 722,582 | | | | 722,606 | | |
Series 2014-3 Class A2A
08/15/17 | | | 0.540 | % | | | 1,100,259 | | | | 1,100,224 | | |
Series 2015-3 Class A2A
09/17/18 | | | 1.020 | % | | | 4,175,000 | | | | 4,174,901 | | |
SunTrust Auto Receivables Trust
Series 2015-1A Class A2(b)
06/15/18 | | | 0.990 | % | | | 7,500,000 | | | | 7,499,841 | | |
TCF Auto Receivables Owner Trust(b)
Series 2014-1A Class A2
05/15/17 | | | 0.590 | % | | | 1,886,035 | | | | 1,886,007 | | |
Series 2015-1A Class A2
08/15/18 | | | 1.020 | % | | | 9,000,000 | | | | 8,997,939 | | |
Volkswagen Auto Lease Trust
Series 2015-A Class A2A
06/20/17 | | | 0.870 | % | | | 7,000,000 | | | | 6,998,836 | | |
Volvo Financial Equipment LLC
Series 2014-1A Class A2(b)
11/15/16 | | | 0.540 | % | | | 2,259,959 | | | | 2,259,690 | | |
Westlake Automobile Receivables Trust(b)
Series 2014-1A Class A2
05/15/17 | | | 0.700 | % | | | 1,892,341 | | | | 1,891,700 | | |
Series 2015-2A Class A2A
07/16/18 | | | 1.280 | % | | | 5,400,000 | | | | 5,399,508 | | |
Wheels SPV 2 LLC
Series 2015-1A Class A2(b)
04/22/24 | | | 1.270 | % | | | 4,950,000 | | | | 4,948,228 | | |
World Omni Automobile Lease Securitization Trust
Series 2015-A Class A2A
05/15/18 | | | 1.060 | % | | | 5,430,000 | | | | 5,429,544 | | |
World Omni Master Owner Trust
Series 2013-1 Class A(a)(b)
02/15/18 | | | 0.537 | % | | | 8,070,000 | | | | 8,071,309 | | |
Total Asset-Backed Securities — Non-Agency
(Cost: $331,154,408) | | | | | | | 331,128,667 | | |
The accompanying Notes to Financial Statements are an integral part of this statement.
Annual Report 2015
12
CMG ULTRA SHORT TERM BOND FUND
PORTFOLIO OF INVESTMENTS (continued)
July 31, 2015
U.S. Treasury Obligations 5.0%
Issuer | | Coupon
Rate | | Principal
Amount ($) | | Value ($) | |
U.S. Treasury
03/31/16 | | | 0.375 | % | | | 19,500,000 | | | | 19,515,234 | | |
04/30/16 | | | 2.625 | % | | | 18,600,000 | | | | 18,925,500 | | |
06/15/16 | | | 0.500 | % | | | 25,000,000 | | | | 25,044,825 | | |
10/31/16 | | | 0.375 | % | | | 13,000,000 | | | | 12,989,844 | | |
Total U.S. Treasury Obligations
(Cost: $76,365,874) | | | | | | | 76,475,403 | | |
U.S. Government & Agency Obligations 7.0% | |
Federal Farm Credit Banks(a)
10/26/15 | | | 0.221 | % | | | 20,000,000 | | | | 20,005,000 | | |
10/26/15 | | | 0.241 | % | | | 20,000,000 | | | | 20,005,900 | | |
02/24/16 | | | 0.237 | % | | | 35,000,000 | | | | 35,023,345 | | |
Federal Home Loan Mortgage Corp.
03/08/17 | | | 1.000 | % | | | 25,000,000 | | | | 25,162,375 | | |
Federal National Mortgage Association(a)
08/26/16 | | | 0.211 | % | | | 6,000,000 | | | | 6,004,884 | | |
Total U.S. Government & Agency Obligations
(Cost: $106,143,635) | | | | | | | 106,201,504 | | |
Foreign Government Obligations —%
CANADA —% | |
Province of Nova Scotia
01/26/17 | | | 5.125 | % | | | 306,000 | | | | 325,027 | | |
Total Foreign Government Obligations
(Cost: $325,532) | | | | | | | 325,027 | | |
Municipal Bonds 0.6%
Issue
Description | | Coupon
Rate | | Principal
Amount ($) | | Value ($) | |
CALIFORNIA 0.3% | |
University of California
Revenue Bonds
Taxable
Series 2011Y-1(a)
07/01/41 | | | 0.688 | % | | | 5,000,000 | | | | 4,999,500 | | |
ILLINOIS 0.3% | |
State of Illinois
Unlimited General Obligation Bonds
Taxable
Series 2011
03/01/17 | | | 5.365 | % | | | 3,715,000 | | | | 3,892,763 | | |
Total Municipal Bonds
(Cost: $8,876,824) | | | | | | | 8,892,263 | | |
Treasury Bills 1.0%
Issuer | | Effective
Yield | | Principal
Amount ($) | | Value ($) | |
UNITED STATES 1.0% | |
U.S. Treasury Bills
03/03/16 | | | 0.190 | % | | | 15,000,000 | | | | 14,983,365 | | |
Total Treasury Bills
(Cost: $14,977,873) | | | | | | | 14,983,365 | | |
Money Market Funds 4.7%
| | | Shares | | Value ($) | |
Columbia Short-Term Cash Fund,
0.124%(d)(e) | | | 71,337,227 | | | | 71,337,227 | | |
Total Money Market Funds
(Cost: $71,337,227) | | | | | 71,337,227 | | |
Total Investments
(Cost: $1,510,400,286) | | | | | 1,506,125,643 | | |
Other Assets & Liabilities, Net | | | | | 13,054,773 | | |
Net Assets | | | | | 1,519,180,416 | | |
The accompanying Notes to Financial Statements are an integral part of this statement.
Annual Report 2015
13
CMG ULTRA SHORT TERM BOND FUND
PORTFOLIO OF INVESTMENTS (continued)
July 31, 2015
Notes to Portfolio of Investments
(a) Variable rate security.
(b) Security exempt from registration pursuant to Rule 144A under the Securities Act of 1933. This security may be resold in transactions exempt from registration, normally to qualified institutional buyers. At July 31, 2015, the value of these securities amounted to $288,741,341 or 19.01% of net assets.
(c) Security, or a portion thereof, has been purchased on a when-issued or delayed delivery basis.
(d) The rate shown is the seven-day current annualized yield at July 31, 2015.
(e) As defined in the Investment Company Act of 1940, an affiliated company is one in which the Fund owns 5% or more of the company's outstanding voting securities, or a company which is under common ownership or control with the Fund. Holdings and transactions in these affiliated companies during the year ended July 31, 2015 are as follows:
Issuer | | Beginning
Cost ($) | | Purchase
Cost ($) | | Proceeds
From Sales ($) | | Ending
Cost ($) | | Dividends —
Affiliated
Issuers ($) | | Value ($) | |
Columbia Short-Term Cash Fund | | | 102,657,409 | | | | 949,681,023 | | | | (981,001,205 | ) | | | 71,337,227 | | | | 67,960 | | | | 71,337,227 | | |
Abbreviation Legend
CMO Collateralized Mortgage Obligation
Fair Value Measurements
The Fund categorizes its fair value measurements according to a three-level hierarchy that maximizes the use of observable inputs and minimizes the use of unobservable inputs by prioritizing that the most observable input be used when available. Observable inputs are those that market participants would use in pricing an investment based on market data obtained from sources independent of the reporting entity. Unobservable inputs are those that reflect the Fund's assumptions about the information market participants would use in pricing an investment. An investment's level within the fair value hierarchy is based on the lowest level of any input that is deemed significant to the asset's or liability's fair value measurement. The input levels are not necessarily an indication of the risk or liquidity associated with investments at that level. For example, certain U.S. government securities are generally high quality and liquid, however, they are reflected as Level 2 because the inputs used to determine fair value may not always be quoted prices in an active market.
Fair value inputs are summarized in the three broad levels listed below:
> Level 1 — Valuations based on quoted prices for investments in active markets that the Fund has the ability to access at the measurement date (including NAV for open-end mutual funds). Valuation adjustments are not applied to Level 1 investments.
> Level 2 — Valuations based on other significant observable inputs (including quoted prices for similar securities, interest rates, prepayment speeds, credit risks, etc.).
> Level 3 — Valuations based on significant unobservable inputs (including the Fund's own assumptions and judgment in determining the fair value of investments).
Inputs that are used in determining fair value of an investment may include price information, credit data, volatility statistics, and other factors. These inputs can be either observable or unobservable. The availability of observable inputs can vary between investments, and is affected by various factors such as the type of investment, and the volume and level of activity for that investment or similar investments in the marketplace. The inputs will be considered by the Investment Manager, along with any other relevant factors in the calculation of an investment's fair value. The Fund uses prices and inputs that are current as of the measurement date, which may include periods of market dislocations. During these periods, the availability of prices and inputs may be reduced for many investments. This condition could cause an investment to be reclassified between the various levels within the hierarchy.
Investments falling into the Level 3 category are primarily supported by quoted prices from brokers and dealers participating in the market for those investments. However, these may be classified as Level 3 investments due to lack of market transparency and corroboration to support these quoted prices. Additionally, valuation models may be used as the pricing source for any remaining investments classified as Level 3. These models may rely on one or more significant unobservable inputs and/or significant assumptions by the Investment Manager. Inputs used in valuations may include, but are not limited to, financial statement analysis, capital account balances, discount rates and estimated cash flows, and comparable company data.
Under the direction of the Fund's Board of Trustees (the Board), the Investment Manager's Valuation Committee (the Committee) is responsible for overseeing the valuation procedures approved by the Board. The Committee consists of voting and non-voting members from various groups within the Investment Manager's organization, including operations and accounting, trading and investments, compliance, risk management and legal.
The accompanying Notes to Financial Statements are an integral part of this statement.
Annual Report 2015
14
CMG ULTRA SHORT TERM BOND FUND
PORTFOLIO OF INVESTMENTS (continued)
July 31, 2015
Fair Value Measurements (continued)
The Committee meets at least monthly to review and approve valuation matters, which may include a description of specific valuation determinations, data regarding pricing information received from approved pricing vendors and brokers and the results of Board-approved valuation control policies and procedures (the Policies). The Policies address, among other things, instances when market quotations are or are not readily available, including recommendations of third party pricing vendors and a determination of appropriate pricing methodologies; events that require specific valuation determinations and assessment of fair value techniques; securities with a potential for stale pricing, including those that are illiquid, restricted, or in default; and the effectiveness of third party pricing vendors, including periodic reviews of vendors. The Committee meets more frequently, as needed, to discuss additional valuation matters, which may include the need to review back-testing results, review time-sensitive information or approve related valuation actions. The Committee reports to the Board, with members of the Committee meeting with the Board at each of its regularly scheduled meetings to discuss valuation matters and actions during the period, similar to those described earlier.
For investments categorized as Level 3, the Committee monitors information similar to that described above, which may include: (i) data specific to the issuer or comparable issuers, (ii) general market or specific sector news and (iii) quoted prices and specific or similar security transactions. The Committee considers this data and any changes from prior periods in order to assess the reasonableness of observable and unobservable inputs, any assumptions or internal models used to value those securities and changes in fair value. This data is also used to corroborate, when available, information received from approved pricing vendors and brokers. Various factors impact the frequency of monitoring this information (which may occur as often as daily). However, the Committee may determine that changes to inputs, assumptions and models are not required as a result of the monitoring procedures performed.
The following table is a summary of the inputs used to value the Fund's investments at July 31, 2015:
| | | Level 1
Quoted Prices in Active
Markets for Identical
Assets ($) | | Level 2
Other Significant
Observable Inputs ($) | | Level 3
Significant
Unobservable Inputs ($) | | Total ($) | |
Investments | |
Corporate Bonds & Notes | | | — | | | | 783,593,641 | | | | — | | | | 783,593,641 | | |
Residential Mortgage-Backed Securities —
Agency | | | — | | | | 935,821 | | | | — | | | | 935,821 | | |
Commercial Mortgage-Backed Securities —
Non-Agency | | | — | | | | 112,252,725 | | | | — | | | | 112,252,725 | | |
Asset-Backed Securities — Non-Agency | | | — | | | | 331,128,667 | | | | — | | | | 331,128,667 | | |
U.S. Treasury Obligations | | | 76,475,403 | | | | — | | | | — | | | | 76,475,403 | | |
U.S. Government & Agency Obligations | | | — | | | | 106,201,504 | | | | — | | | | 106,201,504 | | |
Foreign Government Obligations | | | — | | | | 325,027 | | | | — | | | | 325,027 | | |
Municipal Bonds | | | — | | | | 8,892,263 | | | | — | | | | 8,892,263 | | |
Treasury Bills | | | 14,983,365 | | | | — | | | | — | | | | 14,983,365 | | |
Money Market Funds | | | 71,337,227 | | | | — | | | | — | | | | 71,337,227 | | |
Total Investments | | | 162,795,995 | | | | 1,343,329,648 | | | | — | | | | 1,506,125,643 | | |
See the Portfolio of Investments for all investment classifications not indicated in the table.
The Fund's assets assigned to the Level 2 input category are generally valued using the market approach, in which a security's value is determined through reference to prices and information from market transactions for similar or identical assets.
There were no transfers of financial assets between levels during the period.
The accompanying Notes to Financial Statements are an integral part of this statement.
Annual Report 2015
15
CMG ULTRA SHORT TERM BOND FUND
STATEMENT OF ASSETS AND LIABILITIES
July 31, 2015
Assets | |
Investments, at value | |
Unaffiliated issuers (identified cost $1,439,063,059) | | $ | 1,434,788,416 | | |
Affiliated issuers (identified cost $71,337,227) | | | 71,337,227 | | |
Total investments (identified cost $1,510,400,286) | | | 1,506,125,643 | | |
Cash | | | 7,117 | | |
Receivable for: | |
Investments sold | | | 700 | | |
Capital shares sold | | | 13,627,709 | | |
Dividends | | | 8,178 | | |
Interest | | | 4,530,571 | | |
Expense reimbursement due from Investment Manager | | | 206 | | |
Trustees' deferred compensation plan | | | 54,125 | | |
Total assets | | | 1,524,354,249 | | |
Liabilities | |
Payable for: | |
Investments purchased on a delayed delivery basis | | | 4,399,820 | | |
Capital shares purchased | | | 540,024 | | |
Dividend distributions to shareholders | | | 139,697 | | |
Investment management fees | | | 10,296 | | |
Other expenses | | | 29,871 | | |
Trustees' deferred compensation plan | | | 54,125 | | |
Total liabilities | | | 5,173,833 | | |
Net assets applicable to outstanding capital stock | | $ | 1,519,180,416 | | |
Represented by | |
Paid-in capital | | $ | 1,548,249,087 | | |
Excess of distributions over net investment income | | | (189,846 | ) | |
Accumulated net realized loss | | | (24,604,182 | ) | |
Unrealized appreciation (depreciation) on: | |
Investments | | | (4,274,643 | ) | |
Total — representing net assets applicable to outstanding capital stock | | $ | 1,519,180,416 | | |
Shares outstanding | | | 168,883,998 | | |
Net asset value per share | | $ | 9.00 | | |
The accompanying Notes to Financial Statements are an integral part of this statement.
Annual Report 2015
16
CMG ULTRA SHORT TERM BOND FUND
STATEMENT OF OPERATIONS
Year Ended July 31, 2015
Net investment income | |
Income: | |
Dividends — affiliated issuers | | $ | 67,960 | | |
Interest | | | 10,066,085 | | |
Total income | | | 10,134,045 | | |
Expenses: | |
Investment management fees | | | 4,102,773 | | |
Compensation of board members | | | 51,195 | | |
Professional fees | | | 42,514 | | |
Total expenses | | | 4,196,482 | | |
Fees waived or expenses reimbursed by Investment Manager and its affiliates | | | (93,709 | ) | |
Total net expenses | | | 4,102,773 | | |
Net investment income | | | 6,031,272 | | |
Realized and unrealized gain (loss) — net | |
Net realized gain (loss) on: | |
Investments | | | 347,586 | | |
Net realized gain | | | 347,586 | | |
Net change in unrealized appreciation (depreciation) on: | |
Investments | | | (848,079 | ) | |
Net change in unrealized depreciation | | | (848,079 | ) | |
Net realized and unrealized loss | | | (500,493 | ) | |
Net increase in net assets resulting from operations | | $ | 5,530,779 | | |
The accompanying Notes to Financial Statements are an integral part of this statement.
Annual Report 2015
17
CMG ULTRA SHORT TERM BOND FUND
STATEMENT OF CHANGES IN NET ASSETS
| | | Year Ended
July 31,
2015 | | Year Ended
July 31,
2014 | |
Operations | |
Net investment income | | $ | 6,031,272 | | | $ | 7,391,953 | | |
Net realized gain | | | 347,586 | | | | 1,069,121 | | |
Net change in unrealized appreciation (depreciation) | | | (848,079 | ) | | | 929,067 | | |
Net increase in net assets resulting from operations | | | 5,530,779 | | | | 9,390,141 | | |
Distributions to shareholders | |
Net investment income | | | (6,031,234 | ) | | | (7,391,723 | ) | |
Total distributions to shareholders | | | (6,031,234 | ) | | | (7,391,723 | ) | |
Decrease in net assets from capital stock activity | | | (272,945,627 | ) | | | (45,827,682 | ) | |
Total decrease in net assets | | | (273,446,082 | ) | | | (43,829,264 | ) | |
Net assets at beginning of year | | | 1,792,626,498 | | | | 1,836,455,762 | | |
Net assets at end of year | | $ | 1,519,180,416 | | | $ | 1,792,626,498 | | |
Excess of distributions over net investment income | | $ | (189,846 | ) | | $ | (309,826 | ) | |
The accompanying Notes to Financial Statements are an integral part of this statement.
Annual Report 2015
18
CMG ULTRA SHORT TERM BOND FUND
STATEMENT OF CHANGES IN NET ASSETS (continued)
| | | Year Ended July 31, 2015 | | Year Ended July 31, 2014 | |
| | | Shares | | Dollars ($) | | Shares | | Dollars ($) | |
Capital stock activity | |
Subscriptions | | | 98,244,384 | | | | 883,570,711 | | | | 150,126,578 | | | | 1,350,317,682 | | |
Distributions reinvested | | | 43,948 | | | | 395,275 | | | | 39,565 | | | | 355,952 | | |
Redemptions | | | (128,629,269 | ) | | | (1,156,911,613 | ) | | | (155,242,254 | ) | | | (1,396,501,316 | ) | |
Total decrease | | | (30,340,937 | ) | | | (272,945,627 | ) | | | (5,076,111 | ) | | | (45,827,682 | ) | |
Total net decrease | | | (30,340,937 | ) | | | (272,945,627 | ) | | | (5,076,111 | ) | | | (45,827,682 | ) | |
The accompanying Notes to Financial Statements are an integral part of this statement.
Annual Report 2015
19
CMG ULTRA SHORT TERM BOND FUND
The following table is intended to help you understand the Fund's financial performance. Certain information reflects financial results for a single share of a class held for the periods shown. Per share net investment income (loss) amounts are calculated based on average shares outstanding during the period. Total return assumes reinvestment of all dividends and distributions, if any. Total return does not reflect payment of sales charges, if any. Total return and portfolio turnover are not annualized for periods of less than one year. The portfolio turnover rate is calculated without regard to purchase and sales transactions of short-term instruments and certain derivatives, if any. If such transactions were included, the Fund's portfolio turnover rate may be higher.
| | | Year Ended July 31, | |
| | | 2015 | | 2014 | | 2013 | | 2012 | | 2011 | |
Per share data | |
Net asset value, beginning of period | | $ | 9.00 | | | $ | 8.99 | | | $ | 9.01 | | | $ | 9.02 | | | $ | 9.10 | | |
Income from investment operations: | |
Net investment income | | | 0.03 | | | | 0.04 | | | | 0.07 | | | | 0.08 | | | | 0.13 | | |
Net realized and unrealized gain (loss) | | | (0.00 | )(a) | | | 0.01 | | | | (0.02 | ) | | | 0.00 | (a) | | | 0.00 | (a) | |
Total from investment operations | | | 0.03 | | | | 0.05 | | | | 0.05 | | | | 0.08 | | | | 0.13 | | |
Less distributions to shareholders from: | |
Net investment income | | | (0.03 | ) | | | (0.04 | ) | | | (0.07 | ) | | | (0.09 | ) | | | (0.21 | ) | |
Total distributions to shareholders | | | (0.03 | ) | | | (0.04 | ) | | | (0.07 | ) | | | (0.09 | ) | | | (0.21 | ) | |
Net asset value, end of period | | $ | 9.00 | | | $ | 9.00 | | | $ | 8.99 | | | $ | 9.01 | | | $ | 9.02 | | |
Total return | | | 0.37 | % | | | 0.52 | % | | | 0.55 | % | | | 0.93 | % | | | 1.45 | % | |
Ratios to average net assets(b) | |
Total gross expenses | | | 0.26 | % | | | 0.26 | % | | | 0.26 | % | | | 0.26 | % | | | 0.26 | %(c) | |
Total net expenses(d) | | | 0.25 | % | | | 0.25 | % | | | 0.25 | % | | | 0.25 | % | | | 0.25 | %(c) | |
Net investment income | | | 0.37 | % | | | 0.40 | % | | | 0.76 | % | | | 0.93 | % | | | 1.39 | % | |
Supplemental data | |
Net assets, end of period (in thousands) | | $ | 1,519,180 | | | $ | 1,792,626 | | | $ | 1,836,456 | | | $ | 1,365,792 | | | $ | 968,267 | | |
Portfolio turnover | | | 62 | % | | | 68 | % | | | 67 | % | | | 66 | % | | | 51 | % | |
Notes to Financial Highlights
(a) Rounds to zero.
(b) In addition to the fees and expenses that the Fund bears directly, the Fund indirectly bears a pro rata share of the fees and expenses of any other funds in which it invests. Such indirect expenses are not included in the Fund's reported expense ratios.
(c) Ratios include line of credit interest expense which is less than 0.01%.
(d) Total net expenses include the impact of certain fee waivers/expense reimbursements made by the Investment Manager and certain of its affiliates, if applicable.
The accompanying Notes to Financial Statements are an integral part of this statement.
Annual Report 2015
20
CMG ULTRA SHORT TERM BOND FUND
NOTES TO FINANCIAL STATEMENTS
July 31, 2015
Note 1. Organization
CMG Ultra Short Term Bond Fund (the Fund), a series of Columbia Funds Series Trust I (the Trust), is a diversified fund. The Trust is registered under the Investment Company Act of 1940, as amended (the 1940 Act), as an open-end management investment company organized as a Massachusetts business trust.
Shares of the Fund are available for purchase by institutional entities, including corporations, partnerships, trusts, foundations, endowments, affiliated funds, government entities or other similar organizations, and to certain qualifying advisory clients of Bank of America. Please see the Fund's prospectus for further details, including applicable investment minimums.
Fund Shares
The Trust may issue an unlimited number of shares (without par value), which are offered continuously at net asset value.
Note 2. Summary of Significant Accounting Policies
Basis of Preparation
The Fund is an investment company that applies the accounting and reporting guidance in the Financial Accounting Standards Board (FASB) Accounting Standards Codification Topic 946, Financial Services — Investment Companies (ASC 946). The financial statements are prepared in accordance with U.S. generally accepted accounting principles (GAAP), which requires management to make certain estimates and assumptions that affect the reported amounts of assets and liabilities, the disclosure of contingent assets and liabilities at the date of the financial statements and the reported amounts of income and expenses during the reporting period. Actual results could differ from those estimates.
The following is a summary of significant accounting policies followed by the Fund in the preparation of its financial statements.
Security Valuation
Debt securities generally are valued by pricing services approved by the Board of Trustees (the Board) based upon market transactions for normal, institutional-size trading units of similar securities. The services may use various pricing techniques that take into account, as applicable, factors such as yield, quality, coupon rate, maturity, type of issue, trading characteristics and other
data, as well as broker quotes. Debt securities for which quotations are not readily available or not believed to be reflective of market value may also be valued based upon a bid quote from an approved independent broker-dealer.
Asset- and mortgage-backed securities are generally valued by pricing services, which utilize pricing models that incorporate the securities' cash flow and loan performance data. These models also take into account available market data, including trades, market quotations, and benchmark yield curves for identical or similar securities. Factors used to identify similar securities may include, but are not limited to, issuer, collateral type, vintage, prepayment speeds, collateral performance, credit ratings, credit enhancement and expected life. Asset-backed securities for which quotations are readily available may also be valued based upon an over-the-counter or exchange bid quote from an approved independent broker-dealer.
Debt securities maturing in 60 days or less are valued primarily at amortized cost value, unless this method results in a valuation that management believes does not approximate market value.
Investments in open-end investment companies, including money market funds, are valued at their latest net asset value.
Investments for which market quotations are not readily available, or that have quotations which management believes are not reflective of market value or reliable, are valued at fair value as determined in good faith under procedures approved by and under the general supervision of the Board. If a security or class of securities (such as foreign securities) is valued at fair value, such value is likely to be different from the quoted or published price for the security.
The determination of fair value often requires significant judgment. To determine fair value, management may use assumptions including but not limited to future cash flows and estimated risk premiums. Multiple inputs from various sources may be used to determine fair value.
GAAP requires disclosure regarding the inputs and valuation techniques used to measure fair value and any changes in valuation inputs or techniques. In addition, investments shall be disclosed by major category. This information is disclosed following the Fund's Portfolio of Investments.
Annual Report 2015
21
CMG ULTRA SHORT TERM BOND FUND
NOTES TO FINANCIAL STATEMENTS (continued)
July 31, 2015
Asset- and Mortgage-Backed Securities
The Fund may invest in asset-backed and mortgage-backed securities. The maturity dates shown represent the original maturity of the underlying obligation. Actual maturity may vary based upon prepayment activity on these obligations. All, or a portion, of the obligation may be prepaid at any time because the underlying asset may be prepaid. As a result, decreasing market interest rates could result in an increased level of prepayment. An increased prepayment rate will have the effect of shortening the maturity of the security. Unless otherwise noted, the coupon rates presented are fixed rates.
Delayed Delivery Securities
The Fund may trade securities on other than normal settlement terms, including securities purchased or sold on a "when-issued" basis. This may increase risk to the Fund since the other party to the transaction may fail to deliver, which could cause the Fund to subsequently invest at less advantageous prices. The Fund designates cash or liquid securities in an amount equal to the delayed delivery commitment.
Security Transactions
Security transactions are accounted for on the trade date. Cost is determined and gains (losses) are based upon the specific identification method for both financial statement and federal income tax purposes.
Income Recognition
Interest income is recorded on an accrual basis. Market premiums and discounts, including original issue discounts, are amortized and accreted, respectively, over the expected life of the security on all debt securities, unless otherwise noted.
The Fund may place a debt security on non-accrual status and reduce related interest income when it becomes probable that the interest will not be collected and the amount of uncollectible interest can be reasonably estimated. A defaulted debt security is removed from non-accrual status when the issuer resumes interest payments or when collectability of interest is reasonably assured.
Dividend income is recorded on the ex-dividend date.
Expenses
General expenses of the Trust are allocated to the Fund and other funds of the Trust based upon relative net assets or other expense allocation methodologies
determined by the nature of the expense. Expenses directly attributable to the Fund are charged to the Fund.
Federal Income Tax Status
The Fund intends to qualify each year as a regulated investment company under Subchapter M of the Internal Revenue Code, as amended, and will distribute substantially all of its taxable income (including net short-term capital gains), if any, for its tax year, and as such will not be subject to federal income taxes. In addition, the Fund intends to distribute in each calendar year substantially all of its net investment income, capital gains and certain other amounts, if any, such that the Fund should not be subject to federal excise tax. Therefore, no federal income or excise tax provision is recorded.
Distributions to Shareholders
Distributions from net investment income, if any, are declared daily and paid monthly. Net realized capital gains, if any, are distributed at least annually. Income distributions and capital gain distributions are determined in accordance with federal income tax regulations, which may differ from GAAP.
Guarantees and Indemnifications
Under the Trust's organizational documents and, in some cases, by contract, its officers and trustees are indemnified against certain liabilities arising out of the performance of their duties to the Trust or its funds. In addition, certain of the Fund's contracts with its service providers contain general indemnification clauses. The Fund's maximum exposure under these arrangements is unknown since the amount of any future claims that may be made against the Fund cannot be determined, and the Fund has no historical basis for predicting the likelihood of any such claims.
Recent Accounting Pronouncement
Fair Value Measurement (Topic 820), Disclosure for Investments in Certain Entities That Calculate Net Asset Value per Share (or Its Equivalent)
In May 2015, FASB issued Accounting Standards Update (ASU) No. 2015-07, Fair Value Measurement (Topic 820), Disclosure for Investments in Certain Entities That Calculate Net Asset Value per Share (or Its Equivalent). ASU No. 2015-07 changes the disclosure requirements for investments for which fair value is measured using the net asset value per share practical expedient. The disclosure requirements are effective for annual periods beginning after December 15, 2016 and interim periods
Annual Report 2015
22
CMG ULTRA SHORT TERM BOND FUND
NOTES TO FINANCIAL STATEMENTS (continued)
July 31, 2015
within those fiscal years. At this time, management is evaluating the implications of this guidance and the impact it will have on the financial statement amounts and footnote disclosures, if any.
Note 3. Fees and Other Transactions with Affiliates
Investment Management Fees
Under an Investment Management Services Agreement, Columbia Management Investment Advisers, LLC (the Investment Manager), a wholly-owned subsidiary of Ameriprise Financial, Inc. (Ameriprise Financial), determines which securities will be purchased, held or sold. The Fund's investment management fee is a unified fee. The Investment Manager, out of the unified fee it receives from the Fund, pays all operating costs and expenses of the Fund (other than the expenses described below or in the Fund's prospectus), including accounting expenses (other than audit fees), legal fees for the Fund, transfer agent and custodian fees, and other expenses. The Fund pays the following expenses: disinterested trustees fees and expenses, including their legal counsel, auditing expense, interest on borrowings by the Fund, if any, portfolio transaction expenses, taxes and extraordinary expenses of the Fund. The unified fee is paid monthly to the Investment Manager at the annual rate of 0.25% of the Fund's average net assets.
Administration Fees
Under an Administrative Services Agreement, the Investment Manager also serves as the Fund Administrator. The Fund Administrator does not receive a fee for its administration and accounting services under the Administrative Services Agreement.
Compensation of Board Members
Board members, who are not officers or employees of the Investment Manager or Ameriprise Financial, are compensated for their services to the Fund as disclosed in the Statement of Operations. These Board members may participate in a Deferred Compensation Plan (the Plan) which may be terminated at any time. Obligations of the Plan will be paid solely out of the Fund's assets, and all amounts payable under the Plan constitute a general unsecured obligation of the Fund.
Compensation of Chief Compliance Officer
The Board has appointed a Chief Compliance Officer to the Fund in accordance with federal securities regulations. The Fund is allocated a portion of the
expenses associated with the Chief Compliance Officer based on relative net assets of the Trust. The expenses of the Chief Compliance Officer allocated to the Fund are payable by the Investment Manager.
Transfer Agency Fees
Under a Transfer and Dividend Disbursing Agent Agreement, Columbia Management Investment Services Corp. (the Transfer Agent), an affiliate of the Investment Manager and a wholly-owned subsidiary of Ameriprise Financial, is responsible for providing transfer agency services to the Fund. The Transfer Agent has contracted with Boston Financial Data Services (BFDS) to serve as sub-transfer agent. The Transfer Agent pays the fees of BFDS for services as sub-transfer agent and is not entitled to reimbursement for such fees from the Fund.
Expenses Waived/Reimbursed by the Investment Manager and its Affiliates
The Investment Manager and certain of its affiliates have contractually agreed to waive fees and/or reimburse expenses (excluding certain fees and expenses described below), through November 30, 2015, unless sooner terminated at the sole discretion of the Board, so that the Fund's net operating expenses, after giving effect to fees waived/expenses reimbursed and any balance credits and/or overdraft charges from the Fund's custodian, do not exceed the annual rate of 0.25% of the Fund's average daily net assets.
Under the agreement governing these fee waivers and/or expense reimbursement arrangement, the following fees and expenses are excluded from the waiver/reimbursement commitment, and therefore will be paid by the Fund, if applicable: taxes (including foreign transaction taxes), expenses associated with investments in affiliated and non-affiliated pooled investment vehicles (including mutual funds and exchange-traded funds), transaction costs and brokerage commissions, costs related to any securities lending program, dividend and interest expenses associated with securities sold short, inverse floater program fees and expenses, transaction charges and interest on borrowed money, interest, extraordinary expenses and any other expenses the exclusion of which is specifically approved by the Board. This agreement may be modified or amended only with approval from all parties. Any fees waived and/or expenses reimbursed under the expense reimbursement arrangements described above are not recoverable by the Investment Manager or its affiliates in future periods.
Annual Report 2015
23
CMG ULTRA SHORT TERM BOND FUND
NOTES TO FINANCIAL STATEMENTS (continued)
July 31, 2015
Note 4. Federal Tax Information
The timing and character of income and capital gain distributions are determined in accordance with income tax regulations, which may differ from GAAP because of temporary or permanent book to tax differences.
At July 31, 2015, these differences are primarily due to differing treatment for capital loss carryforwards, principal and/or interest from fixed income securities, Trustees' deferred compensation and distributions. To the extent these differences are permanent, reclassifications are made among the components of the Fund's net assets in the Statement of Assets and Liabilities. Temporary differences do not require reclassifications. In the Statement of Assets and Liabilities the following reclassifications were made:
Excess of distributions over net investment income | | $ | 119,942 | | |
Accumulated net realized loss | | | 652,453 | | |
Paid-in capital | | | (772,395 | ) | |
Net investment income (loss) and net realized gains (losses), as disclosed in the Statement of Operations, and net assets were not affected by this reclassification.
The tax character of distributions paid during the years indicated was as follows:
Year Ended July 31, | | 2015 | | 2014 | |
Ordinary income | | $ | 6,031,234 | | | $ | 7,391,723 | | |
Short-term capital gain distributions, if any, are considered ordinary income distributions for tax purposes.
At July 31, 2015, the components of distributable earnings on a tax basis were as follows:
Capital loss carryforwards | | | (24,604,182 | ) | |
Net unrealized depreciation | | | (4,274,643 | ) | |
At July 31, 2015, the cost of investments for federal income tax purposes was $1,510,400,286 and the aggregate gross unrealized appreciation and depreciation based on that cost was:
Unrealized appreciation | | $ | 829,019 | | |
Unrealized depreciation | | | (5,103,662 | ) | |
Net unrealized depreciation | | $ | (4,274,643 | ) | |
The following capital loss carryforwards, determined at July 31, 2015, may be available to reduce taxable income arising from future net realized gains on investments, if any, to the extent permitted by the Internal Revenue Code:
Year of Expiration | | Amount ($) | |
2016 | | | 213,699 | | |
2017 | | | 2,249,159 | | |
2018 | | | 1,023,617 | | |
2019 | | | 11,369,928 | | |
No expiration — short-term | | | 3,417,204 | | |
No expiration — long-term | | | 6,330,575 | | |
Total | | | 24,604,182 | | |
Capital loss carryforwards with no expiration are required to be utilized prior to any capital losses which carry an expiration date. As a result of this ordering rule, capital loss carryforwards which carry an expiration date may be more likely to expire unused.
For the year ended July 31, 2015, $314,288 of capital loss carryforward was utilized and $685,751 expired unused.
Management of the Fund has concluded that there are no significant uncertain tax positions in the Fund that would require recognition in the financial statements. However, management's conclusion may be subject to review and adjustment at a later date based on factors including, but not limited to, new tax laws, regulations, and administrative interpretations (including relevant court decisions). Generally, the Fund's federal tax returns for the prior three fiscal years remain subject to examination by the Internal Revenue Service.
Note 5. Portfolio Information
The cost of purchases and proceeds from sales of securities, excluding short-term investments and derivatives, if any, aggregated to $975,193,051 and $1,267,898,654, respectively, for the year ended July 31, 2015, of which $109,278,200 and $195,559,804, respectively, were U.S. government securities. The amount of purchase and sale activity impacts the portfolio turnover rate reported in the Financial Highlights.
Note 6. Affiliated Money Market Fund
The Fund invests in Columbia Short-Term Cash Fund, an affiliated money market fund established for the exclusive use by the Fund and other affiliated funds. The income earned by the Fund from such investments is
Annual Report 2015
24
CMG ULTRA SHORT TERM BOND FUND
NOTES TO FINANCIAL STATEMENTS (continued)
July 31, 2015
included as Dividends — affiliated issuers in the Statement of Operations. As an investing fund, the Fund indirectly bears its proportionate share of the expenses of Columbia Short-Term Cash Fund.
Note 7. Shareholder Concentration
At July 31, 2015, one unaffiliated shareholder of record owned 92.4% of the outstanding shares of the Fund in one or more accounts. The Fund has no knowledge about whether any portion of those shares was owned beneficially. Subscription and redemption activity by concentrated accounts may have a significant effect on the operations of the Fund.
Note 8. Line of Credit
The Fund has entered into a revolving credit facility with a syndicate of banks led by JPMorgan Chase Bank, N.A. whereby the Fund may borrow for the temporary funding of shareholder redemptions or for other temporary or emergency purposes. Pursuant to a December 9, 2014 amendment, the credit facility agreement, which is a collective agreement between the Fund and certain other funds managed by the Investment Manager, severally and not jointly, permits collective borrowings up to $550 million. Interest is charged to each participating fund based on its borrowings at a rate equal to the higher of (i) the overnight federal funds rate plus 1.00% or (ii) the one-month LIBOR rate plus 1.00%. Each borrowing under the credit facility matures no later than 60 days after the date of borrowing. The Fund also pays a commitment fee equal to its pro rata share of the amount of the credit facility at a rate of 0.075% per annum. The commitment fee is included in other expenses in the Statement of Operations. Prior to the December 9, 2014 amendment, the credit facility agreement permitted borrowings up to $500 million under the same terms and interest rates as described above.
The Fund had no borrowings during the year ended July 31, 2015.
Note 9. Significant Risks
Asset-Backed Securities Risk
The value of the Fund's asset-backed securities may be affected by, among other things, changes in interest rates, factors concerning the interests in and structure of the issuer or the originator of the receivables, the creditworthiness of the entities that provide any supporting letters of credit, surety bonds or other credit enhancements, or the market's assessment of the quality of underlying assets. Most asset-backed
securities are subject to prepayment risk (i.e., the risk that the Fund will have to reinvest the money received in securities that have lower yields). Rising or high interest rates tend to extend the duration of asset-backed securities, resulting in valuations that are volatile and sensitive to changes in interest rates.
Credit Risk
Credit risk is the risk that the value of debt securities in the Fund's portfolio may decline because the issuer may default and fail to pay interest or repay principal when due. Rating agencies assign credit ratings to debt securities to indicate their credit risk. Lower rated or unrated debt securities held by the Fund may present increased credit risk as compared to higher-rated debt securities.
Interest Rate Risk
Interest rate risk is the risk of losses attributable to changes in interest rates. In general, if prevailing interest rates rise, the values of debt securities tend to fall, and if interest rates fall, the values of debt securities tend to rise. Actions by governments and central banking authorities can result in increases in interest rates. Increasing interest rates may negatively affect the value of debt securities held by the Fund, resulting in a negative impact on the Fund's performance and net asset value per share. In general, the longer the maturity or duration of a debt security, the greater its sensitivity to changes in interest rates.
Liquidity Risk
Liquidity risk is the risk associated with a lack of marketability of investments which may make it difficult to sell the investment at a desirable time or price. Changing regulatory, market or other conditions or environments (for example, the interest rate or credit environments) may adversely affect the liquidity of the Fund's investments. The Fund may have to accept a lower selling price for the holding, sell other investments, or forego another, more appealing investment opportunity. Generally, the less liquid the market at the time the Fund sells a portfolio investment, the greater the risk of loss or decline of value to the Fund. A less liquid market can lead to an increase in Fund redemptions, which may negatively impact Fund performance and net asset value per share, including, for example, if the Fund is forced to sell securities in a down market.
Annual Report 2015
25
CMG ULTRA SHORT TERM BOND FUND
NOTES TO FINANCIAL STATEMENTS (continued)
July 31, 2015
Mortgage-Backed Securities Risk
The value of any mortgage-backed and other asset-backed securities held by the Fund may be affected by, among other things, changes or perceived changes in: interest rates; factors concerning the interests in and structure of the issuer or the originator of the mortgages or other assets; the creditworthiness of the entities that provide any supporting letters of credit, surety bonds or other credit enhancements; or the market's assessment of the quality of underlying assets. Payment of principal and interest on some mortgage-backed securities (but not the market value of the securities themselves) may be guaranteed by the full faith and credit of a particular U.S. Government agency, authority, enterprise or instrumentality, and some, but not all, are also insured or guaranteed by the U.S. Government. Mortgage-backed securities issued by non-governmental issuers (such as commercial banks, savings and loan institutions, private mortgage insurance companies, mortgage bankers and other secondary market issuers) may entail greater risk than obligations guaranteed by the U.S. Government. Mortgage- and other asset-backed securities are subject to prepayment risk, which is the possibility that the underlying mortgage or other asset may be refinanced or prepaid prior to maturity during periods of declining or low interest rates, causing the Fund to have to reinvest the money received in securities that have lower yields. Rising or high interest rates tend to extend the duration of mortgage- and other asset-backed securities, making their prices more volatile and more sensitive to changes in interest rates.
Note 10. Subsequent Events
Management has evaluated the events and transactions that have occurred through the date the financial statements were issued and noted no items requiring adjustment of the financial statements or additional disclosure.
Note 11. Information Regarding Pending and Settled Legal Proceedings
In December 2005, without admitting or denying the allegations, American Express Financial Corporation (AEFC, which is now known as Ameriprise Financial, Inc. (Ameriprise Financial)) entered into settlement agreements with the Securities and Exchange Commission (SEC) and Minnesota Department of Commerce (MDOC) related to market timing activities. As a result, AEFC was censured and ordered to cease and desist from committing or causing any violations of
certain provisions of the Investment Advisers Act of 1940, the Investment Company Act of 1940, and various Minnesota laws. AEFC agreed to pay disgorgement of $10 million and civil money penalties of $7 million. AEFC also agreed to retain an independent distribution consultant to assist in developing a plan for distribution of all disgorgement and civil penalties ordered by the SEC in accordance with various undertakings detailed at http://www.sec.gov/litigation/admin/ia-2451.pdf. Ameriprise Financial and its affiliates have cooperated with the SEC and the MDOC in these legal proceedings, and have made regular reports to the Funds' Boards of Trustees.
Ameriprise Financial and certain of its affiliates have historically been involved in a number of legal, arbitration and regulatory proceedings, including routine litigation, class actions, and governmental actions, concerning matters arising in connection with the conduct of their business activities. Ameriprise Financial believes that the Funds are not currently the subject of, and that neither Ameriprise Financial nor any of its affiliates are the subject of, any pending legal, arbitration or regulatory proceedings that are likely to have a material adverse effect on the Funds or the ability of Ameriprise Financial or its affiliates to perform under their contracts with the Funds. Ameriprise Financial is required to make quarterly (10-Q), annual (10-K) and, as necessary, 8-K filings with the SEC on legal and regulatory matters that relate to Ameriprise Financial and its affiliates. Copies of these filings may be obtained by accessing the SEC website at www.sec.gov.
There can be no assurance that these matters, or the adverse publicity associated with them, will not result in increased fund redemptions, reduced sale of fund shares or other adverse consequences to the Funds. Further, although we believe proceedings are not likely to have a material adverse effect on the Funds or the ability of Ameriprise Financial or its affiliates to perform under their contracts with the Funds, these proceedings are subject to uncertainties and, as such, we are unable to estimate the possible loss or range of loss that may result. An adverse outcome in one or more of these proceedings could result in adverse judgments, settlements, fines, penalties or other relief that could have a material adverse effect on the consolidated financial condition or results of operations of Ameriprise Financial.
Annual Report 2015
26
CMG ULTRA SHORT TERM BOND FUND
REPORT OF INDEPENDENT REGISTERED PUBLIC ACCOUNTING FIRM
To the Trustees of Columbia Funds Series Trust I and the Shareholders of
CMG Ultra Short Term Bond Fund
In our opinion, the accompanying statement of assets and liabilities, including the portfolio of investments, and the related statements of operations and of changes in net assets and the financial highlights present fairly, in all material respects, the financial position of CMG Ultra Short Term Bond Fund (the "Fund," a series of Columbia Funds Series Trust I) at July 31, 2015, and the results of its operations, the changes in its net assets and the financial highlights for each of the periods indicated, in conformity with accounting principles generally accepted in the United States of America. These financial statements and financial highlights (hereafter referred to as "financial statements") are the responsibility of the Fund's management. Our responsibility is to express an opinion on these financial statements based on our audits. We conducted our audits of these financial statements in accordance with the standards of the Public Company Accounting Oversight Board (United States). Those standards require that we plan and perform the audit to obtain reasonable assurance about whether the financial statements are free of material misstatement. An audit includes examining, on a test basis, evidence supporting the amounts and disclosures in the financial statements, assessing the accounting principles used and significant estimates made by management, and evaluating the overall financial statement presentation. We believe that our audits, which included confirmation of securities at July 31, 2015 by correspondence with the custodian, brokers and transfer agent, provide a reasonable basis for our opinion.
PricewaterhouseCoopers LLP
Minneapolis, MN
September 21, 2015
Annual Report 2015
27
CMG ULTRA SHORT TERM BOND FUND
The Trustees serve terms of indefinite duration. The names and birth years of the Trustees and Officers of the Funds in Columbia Funds Series Trust I, the year each was first elected or appointed to office, their principal business occupations during at least the last five years, the number of Funds overseen by each Trustee and other directorships they hold are shown below. Each officer listed below serves as an officer of each Fund in Columbia Funds Series Trust I. The mailing address of each Trustee is: c/o Columbia Management Investment Advisers, LLC, 225 Franklin Street, Mail Drop BX32 05228, Boston, MA 02110.
Independent Trustees
Name, Year of Birth
and Position Held
with the Trust | | Year First
Appointed or
Elected as
Trustee to any
Fund Currently
in the Columbia
Funds Complex
or a Predecessor
Thereof | | Principal Occupation(s)
during the Past Five Years | | Number
of Funds
in the
Columbia
Funds
Complex
Overseen | | Other Directorships
Held by Trustee During
the Past Five Years | |
Janet Langford Carrig
(Born 1957)
Trustee | | | 1996 | | | Senior Vice President, General Counsel and Corporate Secretary, ConocoPhillips (integrated energy company) since September 2007; Deputy General Counsel — Corporate Legal Services, ConocoPhillips from August 2006 to August 2007; Partner, Zelle, Hofmann, Voelbel, Mason & Gette LLP (law firm) from March 2005 to July 2006; Adjunct Professor of Law, Northwestern University from September 2004 to June 2006; Director, UAL Corporation (airline) from February 2006 to July 2006; Chief Administrative Officer and Senior Vice President, Kmart Holding Corporation (consumer goods) from September 2003 to March 2004 | | | 60 | | | None | |
Douglas A. Hacker
(Born 1955)
Trustee and Chairman
of the Board | | | 1996 | | | Independent business executive since May 2006; Executive Vice President — Strategy of United Airlines from December 2002 to May 2006; President of UAL Loyalty Services (airline marketing company) from September 2001 to December 2002; Executive Vice President and Chief Financial Officer of United Airlines from July 1999 to September 2001 | | | 60 | | | Spartan Nash Company, (food distributor); Nash Finch Company (food distributor) from 2005 to 2013; Aircastle Limited (aircraft leasing); SeaCube Container Leasing Ltd. (container leasing) from 2010 to 2013; and Travelport Worldwide Limited (travel information technology) | |
Nancy T. Lukitsh
(Born 1956)
Trustee | | | 2011 | | | Senior Vice President, Partner and Director of Marketing, Wellington Management Company, LLP (investment adviser) from 1997 to 2010; Chair, Wellington Management Investment Portfolios (commingled non-U.S. investment pools) from 2007 to 2010; Director, Wellington Trust Company, NA and other Wellington affiliates from 1997 to 2010 | | | 60 | | | None | |
William E. Mayer
(Born 1940)
Trustee | | | 1991 | | | Partner, Park Avenue Equity Partners (private equity) since February 1999 | | | 60 | | | DynaVox Inc. (speech creation); Lee Enterprises (print media); WR Hambrecht + Co. (financial service provider) from 2000 to 2012; BlackRock Kelso Capital Corporation (investment company); and Premier, Inc. (healthcare) | |
Annual Report 2015
28
CMG ULTRA SHORT TERM BOND FUND
TRUSTEES AND OFFICERS (continued)
Independent Trustees (continued)
Name, Year of Birth
and Position Held
with the Trust | | Year First
Appointed or
Elected as
Trustee to any
Fund Currently
in the Columbia
Funds Complex
or a Predecessor
Thereof | | Principal Occupation(s)
during the Past Five Years | | Number
of Funds
in the
Columbia
Funds
Complex
Overseen | | Other Directorships
Held by Trustee During
the Past Five Years | |
David M. Moffett
(Born 1952)
Trustee | | | 2011 | | | Retired. Consultant to Bridgewater and Associates; Chief Executive Officer, Federal Home Loan Mortgage Corporation, from 2008 to 2009; Senior Adviser, Global Financial Services Group, Carlyle Group, Inc., from 2007 to 2008; Vice Chairman and Chief Financial Officer, U.S. Bancorp, from 1993 to 2007 | | | 60 | | | Building Materials Holding Corp. (building materials and construction services); CIT Group Inc. (commercial and consumer finance); eBay Inc. (online trading community); E.W. Scripps Co. (print and television media); Genworth Financial, Inc. (financial and insurance products and services); MBIA Inc. (financial service provider); Paypal Holdings Inc. (payment and data processing services); and University of Oklahoma Foundation | |
Charles R. Nelson
(Born 1942)
Trustee | | | 1981 | | | Retired. Professor Emeritus, University of Washington since 2011; Professor of Economics, University of Washington from 1976 to 2011; Ford and Louisa Van Voorhis Professor of Political Economy, University of Washington from 1993 to 2011; Adjunct Professor of Statistics, University of Washington from 1980 to 2011; Associate Editor, Journal of Money, Credit and Banking from September 1993 to 2008; consultant on econometric and statistical matters | | | 60 | | | None | |
John J. Neuhauser
(Born 1943)
Trustee | | | 1984 | | | President, Saint Michael's College since August 2007; Director or Trustee of several non-profit organizations, including Fletcher Allen Health Care, Inc.; Academic Vice President and Dean of Faculties, Boston College from August 1999 to October 2005; University Professor, Boston College from November 2005 to August 2007 | | | 60 | | | Liberty All-Star Equity Fund and Liberty All-Star Growth Fund (closed-end funds) | |
Patrick J. Simpson
(Born 1944)
Trustee | | | 2000 | | | Partner, Perkins Coie LLP (law firm) | | | 60 | | | None | |
Anne-Lee Verville
(Born 1945)
Trustee | | | 1998 | | | Retired. General Manager, Global Education Industry from 1994 to 1997, President — Application Systems Division from 1991 to 1994, Chief Financial Officer — US Marketing & Services from 1988 to 1991, and Chief Information Officer from 1987 to 1988, IBM Corporation (computer and technology) | | | 60 | | | Enesco Group, Inc. (producer of giftware and home and garden decor products) from 2001 to 2006 | |
Annual Report 2015
29
CMG ULTRA SHORT TERM BOND FUND
TRUSTEES AND OFFICERS (continued)
Interested Trustee Affiliate with Investment Manager*
Name, Year of Birth
and Position Held
with the Trust | | Year First
Appointed or
Elected as
Trustee to any
Fund Currently
in the Columbia
Funds Complex
or a Predecessor
Thereof | | Principal Occupation(s)
during the Past Five Years | | Number
of Funds
in the
Columbia
Funds
Complex
Overseen | | Other Directorships
Held by Trustee During
the Past Five Years | |
William F. Truscott
(Born 1960)
Trustee | | | 2012 | | | Chairman of the Board and President, Columbia Management Investment Advisers, LLC since May 2010 and February 2012, respectively (previously President and Chief Investment Officer, 2001-April 2010); Chief Executive Officer, Global Asset Management, Ameriprise Financial, Inc. since September 2012 (previously Chief Executive Officer, U.S. Asset Management & President, Annuities, May 2010-September 2012 and President — U.S. Asset Management and Chief Investment Officer, 2005-April 2010); Director and Chief Executive Officer, Columbia Management Investment Distributors, Inc. since May 2010 and February 2012, respectively (previously Chairman of the Board and Chief Executive Officer, 2006-April 2010); Chairman of the Board and Chief Executive Officer, RiverSource Distributors, Inc. since 2006; Director, Threadneedle Asset Management Holdings, SARL since 2014; President and Chief Executive Officer, Ameriprise Certificate Company, 2006-August 2012 | | | 187 | | | Chairman of the Board, Columbia Management Investment Advisers, LLC since May 2010; Director, Columbia Management Investment Distributors, Inc. since May 2010; Director, Ameriprise Certificate Company, 2006 to January 2013 | |
* Interested person (as defined under the 1940 Act) by reason of being an officer, director, security holder and/or employee of the Investment Manager or Ameriprise Financial.
The Statement of Additional Information has additional information about the Fund's Board members and is available, without charge, upon request by calling 800.345.6611; contacting your financial intermediary; or visiting columbiathreadneedle.com/us.
The Board has appointed officers who are responsible for day-to-day business decisions based on policies it has established. The officers serve at the pleasure of the Board. In addition to Mr. Truscott, who is Senior Vice President, the Funds' other officers are:
Fund Officers
Name,
Address and
Year of Birth | | Position and Year
First Appointed to
Position for any Fund
in the Columbia
Funds Complex or a
Predecessor Thereof | | Principal Occupation(s) During Past Five Years | |
Christopher O. Petersen
5228 Ameriprise
Financial Center
Minneapolis, MN 55474
Born 1970 | | President and Principal Executive Officer (2015) | | Vice President and Lead Chief Counsel, Ameriprise Financial, Inc. since January 2015 (previously, Vice President and Chief Counsel January 2010-December 2014; and Vice President and Group Counsel or Counsel 2004- January 2010); officer of Columbia Funds and affiliated funds since 2007. | |
Michael G. Clarke
225 Franklin Street
Boston, MA 02110
Born 1969 | | Treasurer (2011) and Chief Financial Officer (2009) | | Vice President — Mutual Fund Administration, Columbia Management Investment Advisers, LLC, since May 2010; Managing Director of Fund Administration, Columbia Management Advisors, LLC, September 2004-April 2010; senior officer of Columbia Funds and affiliated funds since 2002. | |
Annual Report 2015
30
CMG ULTRA SHORT TERM BOND FUND
TRUSTEES AND OFFICERS (continued)
Fund Officers (continued)
Name,
Address and
Year of Birth | | Position and Year
First Appointed to
Position for any Fund
in the Columbia
Funds Complex or a
Predecessor Thereof | | Principal Occupation(s) During Past Five Years | |
Paul B. Goucher
100 Park Avenue
New York, NY 10017
Born 1968 | | Senior Vice President (2011), Chief Legal Officer (2015) and Assistant Secretary (2008) | | Vice President and Lead Chief Counsel, Ameriprise Financial, Inc. since November 2008 and January 2013, respectively (previously Chief Counsel, January 2010-January 2013 and Group Counsel, November 2008-January 2010). | |
Thomas P. McGuire
225 Franklin Street
Boston, MA 02110
Born 1972 | | Vice President and Chief Compliance Officer (2012) | | Vice President — Asset Management Compliance, Ameriprise Financial, Inc., since May 2010; Chief Compliance Officer, Ameriprise Certificate Company since September 2010; Compliance Executive, Bank of America, 2005-April 2010. | |
Colin Moore
225 Franklin Street
Boston, MA 02110
Born 1958 | | Senior Vice President (2010) | | Executive Vice President and Global Chief Investment Officer, Ameriprise Financial, Inc., since July 2013; Director and Global Chief Investment Officer, Columbia Management Investment Advisers, LLC since May 2010; Manager, Managing Director and Chief Investment Officer, Columbia Management Advisors, LLC, 2007-April 2010. | |
Michael E. DeFao
225 Franklin Street
Boston, MA 02110
Born 1968 | | Vice President (2011) and Assistant Secretary (2010) | | Vice President and Chief Counsel, Ameriprise Financial, Inc. since May 2010; Associate General Counsel, Bank of America, 2005-April 2010. | |
Joseph F. DiMaria
225 Franklin Street
Boston, MA 02110
Born 1968 | | Vice President (2011), Assistant Treasurer (2012) and Chief Accounting Officer (2008) | | Vice President — Mutual Fund Treasurer, Columbia Management Investment Advisers, LLC since May 2010; Director of Fund Administration, Columbia Management Advisors, LLC, 2006-April 2010. | |
Amy Johnson
5228 Ameriprise
Financial Center
Minneapolis, MN 55474
Born 1965 | | Vice President (2006) | | Managing Director and Chief Operating Officer, Columbia Management Investment Advisers, LLC since May 2010 (previously Chief Administrative Officer, 2009-April 2010, and Vice President — Asset Management and Trust Company Services, 2006-2009). | |
Lyn Kephart-Strong
5228 Ameriprise
Financial Center
Minneapolis, MN 55474
Born 1960 | | Vice President (2015) | | President, Columbia Management Investment Services Corp. since October 2014; Vice President & Resolution Officer, Ameriprise Trust Company since August 2009; President, RiverSource Service Corporation 2004-2010. | |
Ryan C. Larrenaga
225 Franklin Street
Boston, MA 02110
Born 1970 | | Vice President and Secretary (2015) | | Vice President and Group Counsel, Ameriprise Financial, Inc. since August 2011 (previously, Counsel from May 2010 to August 2011); Assistant General Counsel, Bank of America, 2005-April 2010; officer of Columbia Funds and affiliated funds since 2005. | |
Annual Report 2015
31
CMG ULTRA SHORT TERM BOND FUND
BOARD CONSIDERATION AND APPROVAL OF ADVISORY AGREEMENT
On June 10, 2015, the Board of Trustees (the Board) and the Trustees who are not interested persons (as defined in the Investment Company Act of 1940) (the Independent Trustees) of Columbia Funds Series Trust I (the Trust) unanimously approved the continuation of the Investment Management Services Agreement (the Advisory Agreement) with Columbia Management Investment Advisers, LLC (the Investment Manager) with respect to CMG Ultra Short Term Bond Fund (the Fund), a series of the Trust. The Board and the Independent Trustees also unanimously approved an agreement (the Management Agreement and, together with the Advisory Agreement, the Agreements) combining the Advisory Agreement and the Fund's existing administrative services agreement (the Administrative Services Agreement) in a single agreement. The Board and the Independent Trustees approved the restatement of the Advisory Agreement with the Management Agreement to be effective for the Fund on December 1, 2015, the Fund's next annual prospectus update. As detailed below, the Board's Advisory Fees and Expenses Committee (the Committee) and the Board met on multiple occasions to review and discuss, both among themselves and with the management team of the Investment Manager, materials provided by the Investment Manager and others before determining to approve the Management Agreement and the continuation of the Advisory Agreement.
In connection with their deliberations regarding the approval of the Management Agreement and the continuation of the Advisory Agreement, the Committee and the Board evaluated materials requested from the Investment Manager regarding the Fund and the Agreements, and discussed these materials with representatives of the Investment Manager at Committee meetings held on March 3, 2015, April 29, 2015 and June 9, 2015 and at Board meetings held on March 4, 2015 and June 10, 2015. In addition, the Board considers matters bearing on the Agreements at most of its other meetings throughout the year and meets regularly with senior management of the Trust and the Investment Manager. Through the Board's Investment Oversight Committees, Trustees also meet with selected portfolio managers of the funds the Trustees oversee and other investment personnel at various times throughout the year. The Committee and the Board also consulted with its independent fee consultant, Fund counsel and with the Independent Trustees' independent legal counsel, who advised on various matters with respect to the Committee's and the Board's considerations and otherwise assisted the Committee and the Board in their deliberations. On June 9, 2015, the Committee recommended that the Board approve the Management Agreement and the continuation of the Advisory Agreement. On June 10, 2015, the Board, including the Independent Trustees, voting separately, unanimously approved the Management Agreement and the continuation of the Advisory Agreement for the Fund.
The Committee and the Board considered all information that they, their legal counsel or the Investment Manager believed reasonably necessary to evaluate and to determine whether to approve the Management Agreement and the continuation of the Advisory Agreement. The information and factors considered by the Committee and the Board in recommending for approval or approving the Management Agreement and the continuation of the Advisory Agreement for the Fund included the following:
• Information on the investment performance of the Fund relative to the performance of a group of mutual funds determined to be comparable to the Fund by an independent third-party data provider, as well as performance relative to benchmarks;
• Information on the Fund's advisory fees and total expenses, including information comparing the Fund's expenses to those of a group of comparable mutual funds, as determined by the independent third-party data provider;
• The Investment Manager's agreement to contractually limit or cap total operating expenses for the Fund so that total operating expenses (excluding certain fees and expenses, such as portfolio transaction costs and certain other investment related expenses, interest, taxes, acquired fund fees and expenses, and extraordinary expenses) would not exceed a specified percentage of the Fund's average annual net assets from December 1, 2015 through November 30, 2016;
• The terms and conditions of the Agreements;
Annual Report 2015
32
CMG ULTRA SHORT TERM BOND FUND
BOARD CONSIDERATION AND APPROVAL OF ADVISORY AGREEMENT (continued)
• The current and proposed terms and conditions of other agreements and arrangements with affiliates of the Investment Manager relating to the operations of the Fund, including the Administrative Services Agreement1 and agreements with respect to the provision of distribution and transfer agency services to the Fund;
• Descriptions of various functions performed by the Investment Manager under the Agreements, including portfolio management and portfolio trading practices;
• Information regarding the management fees and investment performance of similarly-managed portfolios of other clients of the Investment Manager, including institutional separate accounts;
• Information regarding the reputation, regulatory history and resources of the Investment Manager, including information regarding senior management, portfolio managers and other personnel;
• Information regarding the capabilities of the Investment Manager with respect to compliance monitoring services, including an assessment of the Investment Manager's compliance system by the Fund's Chief Compliance Officer; and
• The profitability to the Investment Manager and its affiliates from their relationships with the Fund.
Nature, Extent and Quality of Services Provided under the Agreements
The Committee and the Board considered the nature, extent and quality of services provided to the Fund by the Investment Manager and its affiliates under the Agreements and under separate agreements for the provision of transfer agency and administrative services, and the resources dedicated to the Fund and the other Columbia Funds by the Investment Manager and its affiliates. The Committee and the Board also determined that the nature and level of the services to be provided under the Management Agreement would not decrease relative to the services provided under the Advisory Agreement and the Administrative Services Agreement. The Committee and the Board considered, among other things, the Investment Manager's ability to attract, motivate and retain highly qualified research, advisory and supervisory investment professionals (including personnel and other resources, compensation programs for personnel involved in fund management, reputation and other attributes), the portfolio management services provided by those investment professionals, and the quality of the Investment Manager's investment research capabilities and trade execution services. The Committee and the Board also considered the potential benefits to shareholders of investing in a mutual fund that is part of a fund complex offering exposure to a variety of asset classes and investment disciplines and providing a variety of fund and shareholder services.
The Committee and the Board also considered the professional experience and qualifications of the senior personnel of the Investment Manager, which included consideration of the Investment Manager's experience with similarly-structured funds. The Committee and the Board noted the compliance programs of and the compliance-related resources provided to the Fund by the Investment Manager and its affiliates, and considered the Investment Manager's ability to provide administrative services to the Fund and coordinate the activities of the Fund's other service providers. In evaluating the nature, extent and quality of services provided under the Agreements, the Committee and the Board considered that these services were provided to the Fund, rather than directly to Fund shareholders. The Committee and the Board accordingly affirmed, after considering various other matters, including the potential benefits to the Fund and its shareholders of the Independent Trustees' important role as pre-suit gatekeepers with respect to claims that they may determine are meritless or contrary to the Fund's best interests, that it was not the intention of the Board or the Investment Manager that there be any third-party beneficiaries of the Agreements. After reviewing these and related factors, the Committee and the Board concluded, within the context of their overall conclusions, that the nature, extent and quality of the services provided to the Fund under the Agreements supported the approval of the Management Agreement and the continuation of the Advisory Agreement.
1 Like the Advisory Agreement, the Administrative Services Agreement will terminate with respect to the Fund once the Management Agreement is effective for the Fund.
Annual Report 2015
33
CMG ULTRA SHORT TERM BOND FUND
BOARD CONSIDERATION AND APPROVAL OF ADVISORY AGREEMENT (continued)
Investment Performance
The Committee and the Board reviewed information about the performance of the Fund over various time periods, including performance information relative to benchmarks and information based on reports of the independent third-party data provider that compared the performance of the Fund to the performance of a group of comparable mutual funds, and data provided by the independent fee consultant. The Committee and the Board also reviewed a description of the third party's methodology for identifying the Fund's peer groups for purposes of performance and expense comparisons. Although the Fund's performance lagged that of a relevant peer group for certain (although not necessarily all) periods, the Committee and the Board concluded that other factors relevant to performance were sufficient, in light of other considerations, to warrant continuation of the Advisory Agreement and approval of the Management Agreement. Those factors included one or more of the following: (i) that the Fund's performance, although lagging in certain recent periods, was stronger over the longer term; (ii) that the underperformance was attributable, to a significant extent, to investment decisions that were reasonable and consistent with the Fund's investment strategy and policies and that the Fund was performing within a reasonable range of expectations, given those investment decisions, market conditions and the Fund's investment strategy; (iii) that the Fund's performance was competitive when compared to other relevant performance benchmarks or peer groups; and (iv) that the Investment Manager had taken or was taking steps designed to help improve the Fund's investment performance, including, but not limited to, replacing portfolio managers, enhancing the resources supporting the portfolio managers, or modifying investment strategies.
The Committee and the Board noted that, through December 31, 2014, the Fund's performance was in the sixty-fourth, sixty-seventh and sixty-first percentile (where the best performance would be in the first percentile) of its category selected by the independent third-party data provider for the purposes of performance comparisons for the one-, three- and five-year periods, respectively.
The Committee and the Board also considered the Investment Manager's performance and reputation generally, the Investment Manager's historical responsiveness to Board concerns about performance, and the Investment Manager's willingness to take steps intended to improve performance. After reviewing these and related factors, the Committee and the Board concluded, within the context of their overall conclusions, that the performance of the Fund was sufficient, in light of other considerations, to warrant the continuation of the Advisory Agreement and the approval of the Management Agreement.
Investment Advisory Fee Rates and Other Expenses
The Committee and the Board considered the advisory fees charged to the Fund under the Advisory Agreement as well as the total expenses incurred by the Fund. In assessing the reasonableness of the fees under the Advisory Agreement, the Committee and the Board considered, among other information, the Fund's advisory fee and its total expense ratio as a percentage of average daily net assets. The Committee and the Board also considered that the proposed management fee would not exceed the sum of the fee rates payable under the Advisory Agreement and the Administrative Services Agreement. The Committee and the Board considered data provided by the independent fee consultant. The Committee and the Board noted that, as of December 31, 2014, the Fund's actual management fee and net expense ratio are ranked in the third and first quintiles, respectively, (where the lowest fees and expenses would be in the first quintile) against the Fund's expense universe as determined by the independent third-party data provider for purposes of expense comparison. The Committee and the Board also took into account the fee waiver and expense limitation arrangements agreed to by the Investment Manager, as noted above.
The Committee and the Board also received and considered information about the advisory fees charged by the Investment Manager to institutional separate accounts. In considering the fees charged to those accounts, the Committee and the Board took into account, among other things, the Investment Manager's representations about the differences between managing mutual funds as compared to other types of accounts, including differences in the services provided, differences in the risk profile of such business for the Investment Manager and the additional resources required to manage mutual funds effectively. The Committee and the Board also received and considered information about the fees charged by the Investment Manager for sub-advisory services
Annual Report 2015
34
CMG ULTRA SHORT TERM BOND FUND
BOARD CONSIDERATION AND APPROVAL OF ADVISORY AGREEMENT (continued)
provided to comparable unaffiliated funds. In evaluating the Fund's advisory fees, the Committee and the Board also took into account the demands, complexity and quality of the investment management of the Fund.
After reviewing these and related factors, the Committee and the Board concluded, within the context of their overall conclusions, that the advisory/management fee rates and expenses of the Fund were sufficient, in light of other considerations, to warrant the approval of the Management Agreement and continuation of the Advisory Agreement.
Costs of Services Provided and Profitability
The Committee and the Board also took note of the costs the Investment Manager and its affiliates incur in connection with the services provided (both on an absolute and relative basis) and the profitability to the Investment Manager and its affiliates in connection with their relationships with the Fund.
The Committee and the Board also considered the compensation directly or indirectly received by the Investment Manager's affiliates in connection with their relationships with the Fund. The Committee and the Board reviewed information provided by management as to the profitability to the Investment Manager and its affiliates of their relationships with the Fund, information about the allocation of expenses used to calculate profitability, and comparisons of profitability levels realized in 2014 to profitability levels realized in 2013. When reviewing profitability, the Committee and the Board also considered court cases in which adviser profitability was an issue in whole or in part, the performance of similarly managed funds, the performance of the Fund, and the expense ratio of the Fund. The Committee and the Board also considered information provided by the Investment Manager regarding the Investment Manager's financial condition and comparing its profitability to that of other asset management firms that are, or are subsidiaries of, publicly traded companies.
After reviewing these and related factors, the Committee and the Board concluded, within the context of their overall conclusions, that the costs of services provided and the profitability to the Investment Manager and its affiliates from their relationships with the Fund supported the approval of the Management Agreement and the continuation of the Advisory Agreement.
Economies of Scale
The Committee and the Board considered the potential existence of economies of scale in the provision by the Investment Manager of services to the Fund, to groups of related funds, and to the Investment Manager's investment advisory clients as a whole, and whether those economies of scale were shared with the Fund through breakpoints in investment advisory fees or other means, such as expense limitation arrangements and additional investments by the Investment Manager in investment, trading and compliance resources.
In considering these matters, the Committee and the Board also considered the costs of the services provided and the profitability to the Investment Manager and its affiliates from their relationships with the Fund, as discussed above. After reviewing these and related factors, the Committee and the Board concluded, within the context of their overall conclusions, that the extent to which any economies of scale were expected to be shared with the Fund supported the approval of the Management Agreement and the continuation of the Advisory Agreement.
Other Benefits to the Investment Manager
The Committee and the Board received and considered information regarding "fall-out" or ancillary benefits received by the Investment Manager and its affiliates as a result of their relationships with the Fund, such as the engagement of the Investment Manager to provide administrative services to the Fund and the engagement of the Investment Manager's affiliates to provide distribution and transfer agency services to the Fund. In this regard, among other matters, the Committee and the Board considered that the Fund's distributor retains a portion of the distribution fees from the Fund and receives a portion of the sales charges on sales or redemptions of certain classes of shares of the Fund. The Committee and the Board also considered the benefits of research made available to the Investment Manager by reason of brokerage commissions generated by the Fund's securities transactions, and reviewed information about the Investment Manager's practices with respect
Annual Report 2015
35
CMG ULTRA SHORT TERM BOND FUND
BOARD CONSIDERATION AND APPROVAL OF ADVISORY AGREEMENT (continued)
to allocating portfolio transactions for brokerage and research services. The Committee and the Board considered the possible conflicts of interest associated with certain fall-out or other ancillary benefits and the reporting, disclosure and other processes that are in place to address such possible conflicts of interest. The Committee and the Board recognized that the Investment Manager's profitability would be somewhat lower without these benefits.
Conclusion
The Committee and the Board reviewed all of the above considerations in reaching their decisions to recommend or approve the Management Agreement and the continuation of the Advisory Agreement. In their deliberations, the Trustees did not identify any particular information that was all-important or controlling, and individual Trustees may have attributed different weights to the various factors. Based on their evaluation of all factors that they deemed to be material, including those factors described above, and assisted by the advice of independent legal counsel, the Board, including the Independent Trustees, voting separately, unanimously approved the Management Agreement and the continuation of the Advisory Agreement.
Annual Report 2015
36
CMG ULTRA SHORT TERM BOND FUND
IMPORTANT INFORMATION ABOUT THIS REPORT
Each fund mails one shareholder report to each shareholder address. If you would like more than one report, please call shareholder services at 800.345.6611 and additional reports will be sent to you.
The policy of the Board is to vote the proxies of the companies in which each fund holds investments consistent with the procedures as stated in the Statement of Additional Information (SAI). You may obtain a copy of the SAI without charge by calling 800.345.6611; contacting your financial intermediary; visiting columbiathreadneedle.com/us; or searching the website of the Securities and Exchange Commission (SEC) at sec.gov. Information regarding how each fund voted proxies relating to portfolio securities is filed with the SEC by August 31st for the most recent 12-month period ending June 30th of that year, and is available without charge by visiting columbiathreadneedle.com/us, or searching the website of the SEC at sec.gov.
Each fund files a complete schedule of portfolio holdings with the SEC for the first and third quarters of each fiscal year on Form N-Q. Each fund's Form N-Q is available on the SEC's website at sec.gov and may be reviewed and copied at the SEC's Public Reference Room in Washington, D.C. Information on the operation of the Public Reference Room may be obtained by calling 800.SEC.0330. Each fund's complete schedule of portfolio holdings, as filed on Form N-Q, can also be obtained without charge, upon request, by calling 800.345.6611.
Annual Report 2015
37
CMG Ultra Short Term Bond Fund
P.O. Box 8081
Boston, MA 02266-8081

This information is for use with concurrent or prior delivery of a fund prospectus. Please read and consider the investment objectives, risks, charges and expenses for any fund carefully before investing. For a prospectus and summary prospectus, which contains this and other important information about the Fund, go to columbiathreadneedle.com/us. The Fund is distributed by Columbia Management Investment Distributors, Inc., member FINRA, and managed by Columbia Management Investment Advisers, LLC.
Columbia Threadneedle Investments (Columbia Threadneedle) is the global brand name of the Columbia and Threadneedle group of companies.
All rights reserved. Columbia Management Investment Distributors, Inc., 225 Franklin Street, Boston, MA 02110-2804
© 2015 Columbia Management Investment Advisers, LLC.
columbiathreadneedle.com/us
ANN103_07_E01_(09/15)

ANNUAL REPORT
July 31, 2015


ABOUT COLUMBIA THREADNEEDLE INVESTMENTS
Columbia Threadneedle Investments is a leading global asset management group that provides a broad range of actively managed investment strategies and solutions for individual, institutional and corporate clients around the world.
With more than 2,000 people, including over 450 investment professionals based in North America, Europe and Asia, we manage $503 billion* of assets across developed and emerging market equities, fixed income, asset allocation solutions and alternatives. We are the 13th largest manager of long-term mutual fund assets in the U.S.** and the 4th largest manager of retail funds in the U.K.***
Our priority is the investment success of our clients. We aim to deliver the investment outcomes they expect through an investment approach that is team-based, performance-driven and risk-aware. Our culture is dynamic and interactive. By sharing our insights across asset classes and geographies, we generate richer perspectives on global, regional and local investment landscapes. The ability to exchange and debate investment ideas in a collaborative environment enriches our teams' investment processes. More importantly, it results in better informed investment decisions for our clients.
Columbia funds are distributed by Columbia Management Investment Distributors, Inc., member FINRA, and managed by Columbia Management Investment Advisers, LLC.
Columbia Threadneedle Investments (Columbia Threadneedle) is the global brand name of the Columbia and Threadneedle group of companies.
* In U.S. dollars as of June 30, 2015. Source: Ameriprise Q2 Earnings Release. Includes all assets managed by entities in the Columbia and Threadneedle groups of companies. Contact us for more current data.
** Source: ICI as of June 30, 2015 for Columbia Management Investment Advisers, LLC.
*** Source: Investment Association as of June 2015 for Threadneedle Asset Management Limited.
© 2015 Columbia Management Investment Advisers, LLC. All rights reserved.
Not part of the shareholder report
Get the market insight you need from our investment experts
Connect with Columbia Threadneedle Investments
Investor insight
Find economic and market commentary, investment videos, white papers, mutual fund commentary and more at columbiathreadneedle.com/us.
 Columbia Threadneedle Investor Newsletter (e-newsletter)
Read our award-winning* shareholder newsletter. Our quarterly newsletter is available online and provides timely and relevant content about economic trends, fund news, service enhancements and changes. Sign up to receive the newsletter electronically at columbiathreadneedle.com/
us/newsletter.

 Investment videos
Get analysis of current events and trends that may affect your investments. Visit our online video library to watch and discover what our thought leaders are saying about the financial markets and economy.
 Social media
We offer you multiple ways to access our market commentary and investment insights.
n Perspectives blog at columbiathreadneedle.com/us
Read timely posts by our investment team, including our chief investment officer, chief economist and portfolio managers.
n twitter.com/CTinvest_US
Follow us on Twitter for quick, up-to-the-minute comments on market news and more.
n youtube.com/CTinvestUS
View our commentaries on the economy, markets and current investment opportunities.
n linkedin.com/company/columbia-threadneedle-investments-us
Connect with us on LinkedIn for updates from our thought leaders.
*Columbia Threadneedle Investor Newsletter was awarded top honors in the Mutual Fund Education Alliance STAR Awards competition for excellence in mutual fund marketing and communications in 2011, 2012 and 2013. Materials in the competition were evaluated on educational value, message comprehension, effective design and objectives.
Not part of the shareholder report
Stay informed
Become a subscriber to receive the latest investment publications and mutual fund commentaries
Subscribe to Columbia Threadneedle Investments
Email subscription center
Subscribe to the latest information from Columbia Threadneedle. Visit our email subscription center at columbiathreadneedle.com/us/subscribe to register for economic and market commentary, product and service updates, white papers and more.
n Columbia Threadneedle Investor Newsletter
Quarterly newsletter featuring the latest macro- and micro-economic trends, investment themes, products, service changes and other items of interest to our investors
n Investment Strategy Outlook
Quarterly publication featuring the Columbia Threadneedle Asset Allocation Team's perspective on global economic investment conditions and markets
n MarketTrack
Quarterly publication featuring more than 40 charts and graphs that highlight the current state of the economy and the markets; includes straightforward insight on current investment opportunities
n White papers
Frequent articles that delve deep into a variety of investment topics
n Mutual fund updates
Quarterly portfolio manager commentary and fund fact sheets available for Columbia funds. (Not all funds have a commentary.)
Register your information online at columbiathreadneedle.com/us/subscribe and select the publications you would like to receive. Update your subscriptions at any time by accessing the email subscription center.

 Dear Shareholder,
Today's investors are typically focused on outcomes, like living a certain retirement lifestyle, paying for college education or building a legacy. But in today's complex global investment landscape, even simple goals are not easily achieved.
At Columbia Threadneedle Investments, we aspire to help satisfy five core needs of today's investors:
n Generate an appropriate stream of income in retirement
Traditional approaches to generating income may not provide the diversification benefits they once did, and they may actually introduce unwanted risk in today's market. To seek to improve your potential to live comfortably long term, we endeavor to pursue investments that explore less traveled paths to income.
n Navigate a changing interest rate environment
Today's uncertain market environment includes the prospect of a rise in interest rates. Blending traditional investments with non-traditional or alternative products may help protect your wealth during periods of volatility. We can attempt to help strengthen your portfolio with agile products designed to take on the market's ups and downs.
n Maximize after-tax returns
In an environment where what you keep may be more important than what you earn, municipal bonds can help mitigate high tax burdens while providing potentially attractive yields. Our state and federal tax-exempt products are aimed at helping investors manage risk, minimize the fluctuation of capital and grow wealth on a more tax-efficient basis.
n Grow assets to achieve financial goals
We believe that finding and protecting growth comes from a disciplined security selection process designed to create excess return. Our goal is to provide investment solutions built to help you face today's market challenges and grow your assets at each crossroad of your journey.
n Ease the impact of volatile markets
Despite a bull market run that has benefited many investors over the past several years, it's important to remember the lessons of 2008 and the value that a well-diversified portfolio may provide through times of market volatility. We are here to help you hold onto the savings you have worked tirelessly to amass, and to provide you the best opportunity to maintain your standard of living regardless of market conditions.
Find out today how we can help you confidently invest to realize your dreams. Please visit us at blog.columbiathreadneedleus.com/our-best-ideas to learn more about our unique investment solutions.
The world is constantly changing, but our priority remains the same: to help you secure your finances, meet your goals and achieve success. Thank you for your continued investment with us.
Sincerely,

Christopher O. Petersen
President, Columbia Funds
Investors should consider the investment objectives, risks, charges and expenses of a mutual fund carefully before investing. For a free prospectus and summary prospectus, which contains this and other important information about a fund, visit columbiathreadneedle.com/us. The prospectus should be read carefully before investing.
Columbia Funds are distributed by Columbia Management Investment Distributors, Inc., member FINRA, and managed by Columbia Management Investment Advisers, LLC.
© 2015 Columbia Management Investment Advisers, LLC. All rights reserved.
Fund Investment Manager
Columbia Management Investment
Advisers, LLC
225 Franklin Street
Boston, MA 02110
Fund Distributor
Columbia Management Investment
Distributors, Inc.
225 Franklin Street
Boston, MA 02110
Fund Transfer Agent
Columbia Management Investment
Services Corp.
P.O. Box 8081
Boston, MA 02266-8081
For more information about any of the funds, please visit columbiathreadneedle.com/us or call 800.345.6611. Customer Service Representatives are available to answer your questions Monday through Friday from 8 a.m. to 7 p.m. Eastern time.
The views expressed in this report reflect the current views of the respective parties. These views are not guarantees of future performance and involve certain risks, uncertainties and assumptions that are difficult to predict, so actual outcomes and results may differ significantly from the views expressed. These views are subject to change at any time based upon economic, market or other conditions and the respective parties disclaim any responsibility to update such views. These views may not be relied on as investment advice and, because investment decisions for a Columbia fund are based on numerous factors, may not be relied on as an indication of trading intent on behalf of any particular Columbia fund. References to specific securities should not be construed as a recommendation or investment advice.
Performance Overview | | | 3 | | |
Manager Discussion of Fund Performance | | | 5 | | |
Understanding Your Fund's Expenses | | | 8 | | |
Portfolio of Investments | | | 9 | | |
Statement of Assets and Liabilities | | | 37 | | |
Statement of Operations | | | 39 | | |
Statement of Changes in Net Assets | | | 40 | | |
Financial Highlights | | | 42 | | |
Notes to Financial Statements | | | 48 | | |
Report of Independent Registered
Public Accounting Firm | | | 56 | | |
Federal Income Tax Information | | | 57 | | |
Trustees and Officers | | | 58 | | |
Board Consideration and Approval of Advisory Agreement | | | 62 | | |
Important Information About This Report | | | 67 | | |
Performance Summary
n Columbia Tax-Exempt Fund (the Fund) Class A shares returned 4.41% excluding sales charges for the 12-month period that ended July 31, 2015. Class Z shares of the Fund returned 4.62% for the same time period.
n The Fund's benchmark, the Barclays Municipal Bond Index, returned 3.56% for the same 12 months.
n The Fund's yield curve positioning focusing on bonds maturing 15 years and longer and its credit quality allocation decision to overweight medium and lower rated bonds generally accounted for the Fund's performance advantage over its benchmark.
Average Annual Total Returns (%) (for period ended July 31, 2015)
| | | Inception | | 1 Year | | 5 Years | | 10 Years | |
Class A | | 11/21/78 | | | | | | | | | | | | | |
Excluding sales charges | | | | | | | 4.41 | | | | 4.99 | | | | 4.54 | | |
Including sales charges | | | | | | | 1.26 | | | | 4.36 | | | | 4.23 | | |
Class B | | 05/05/92 | | | | | | | | | | | | | |
Excluding sales charges | | | | | | | 3.63 | | | | 4.19 | | | | 3.76 | | |
Including sales charges | | | | | | | -1.37 | | | | 3.85 | | | | 3.76 | | |
Class C | | 08/01/97 | | | | | | | | | | | | | |
Excluding sales charges | | | | | | | 3.80 | | | | 4.41 | | | | 3.94 | | |
Including sales charges | | | | | | | 2.80 | | | | 4.41 | | | | 3.94 | | |
Class R4* | | 03/19/13 | | | 4.62 | | | | 5.10 | | | | 4.60 | | |
Class R5* | | 12/11/13 | | | 4.69 | | | | 5.07 | | | | 4.59 | | |
Class Z* | | 09/16/05 | | | 4.62 | | | | 5.18 | | | | 4.74 | | |
Barclays Municipal Bond Index | | | | | | | 3.56 | | | | 4.39 | | | | 4.57 | | |
Returns for Class A are shown with and without the maximum initial sales charge of 3.00%. The maximum applicable sales charge was reduced from 4.75% to 3.00% on Class A share purchases made on or after February 19, 2015. Class A returns (including sales charges) for all periods reflect the current maximum applicable sales charge of 3.00%. Returns for Class B are shown with and without the applicable contingent deferred sales charge (CDSC) of 5.00% in the first year, declining to 1.00% in the sixth year and eliminated thereafter. Returns for Class C are shown with and without the 1.00% CDSC for the first year only. The Fund's other classes are not subject to sales charges and have limited eligibility. Please see the Fund's prospectus for details. Performance for different share classes will vary based on differences in sales charges and fees associated with each class. All results shown assume reinvestment of distributions during the period. Returns do not reflect the deduction of taxes that a shareholder may pay on Fund distributions or on the redemption of Fund shares. Performance results reflect the effect of any fee waivers or reimbursements of Fund expenses by Columbia Management Investment Advisers, LLC and/or any of its affiliates. Absent these fee waivers or expense reimbursement arrangements, performance results would have been lower.
The performance information shown represents past performance and is not a guarantee of future results. The investment return and principal value of your investment will fluctuate so that your shares, when redeemed, may be worth more or less than their original cost. Current performance may be lower or higher than the performance information shown. You may obtain performance information current to the most recent month-end by contacting your financial intermediary, visiting columbiathreadneedle.com/us or calling 800.345.6611.
*The returns shown for periods prior to the share class inception date (including returns for the Life of the Fund, if shown, which are since Fund inception) include the returns of the Fund's oldest share class. These returns are adjusted to reflect any higher class-related operating expenses of the newer share classes, as applicable. Please visit columbiathreadneedle.com/us/investment-products/mutual-funds/appended-performance for more information.
The Barclays Municipal Bond Index is an unmanaged index considered representative of the broad market for investment-grade, tax-exempt bonds with a maturity of at least one year.
Indices are not available for investment, are not professionally managed and do not reflect sales charges, fees, brokerage commissions, taxes or other expenses of investing. Securities in the Fund may not match those in an index.
Annual Report 2015
3
PERFORMANCE OVERVIEW (continued)
Performance of a Hypothetical $10,000 Investment (August 1, 2005 – July 31, 2015)
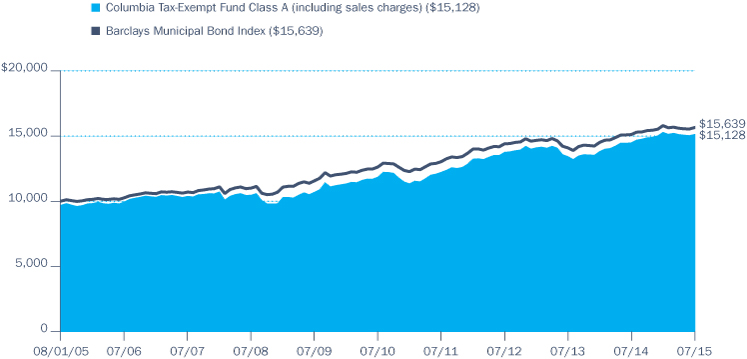
The chart above shows the change in value of a hypothetical $10,000 investment in Class A shares of Columbia Tax-Exempt Fund during the stated time period, and does not reflect the deduction of taxes that a shareholder may pay on Fund distributions or on the redemption of Fund shares.
Annual Report 2015
4
MANAGER DISCUSSION OF FUND PERFORMANCE
For the 12-month period that ended July 31, 2015, the Fund's Class A shares returned 4.41% excluding sales charges. Class Z shares of the Fund returned 4.62%. The Fund's benchmark, the Barclays Municipal Bond Index, returned 3.56% over the same 12-month period. Overweight positions relative to the benchmark in longer maturity bonds and medium and lower quality issues provided the biggest boost to the Fund's outperformance during the period.
Solid Gain for Municipal Bond Market
Municipal bonds continued to advance over the 12-month period against a mixed economic backdrop and muted inflation. The U.S. Federal Reserve (the Fed) kept key short-term interest rates near historical lows. During its March 2015 meeting, the Fed removed the word "patient" from its policy statement, signaling that it was moving closer to the first rate increase in nine years. However, the Fed has indicated that it would wait for inflation to approach 2% before removing accommodation, and that its decision to increase the federal funds rate would be data dependent and the pace gradual. In anticipation of higher rates, yields on short-term municipal bonds rose during the period. The AAA municipal yield curve — a graph that plots yields on short to long maturity bonds — flattened over the 12-month period as yields on short-term bonds increased and long-term bond yields fell. While the curve flattening benefited longer maturity bonds, yields on longer bonds fluctuated during the period. Between July and December 2014, yields on 30-year municipal bonds declined 42 basis points (bps) (a basis point is one one-hundredth of one percent) and then increased 24 bps to close the calendar year 2014 18 bps lower. The increase in yields on shorter bonds (two-year yields increased by 31 bps) was likely caused by the anticipation and uncertainty concerning the timing and magnitude of the Fed's rate hike decision. Conversely, the change in long bond yields was likely affected more by growth and inflation expectations, both of which we expect to remain modest, and by municipal bond supply and demand.
On the supply front, municipal bond issuance increased during the period, particularly during the spring. A large portion of the new supply was driven by refunding of existing issues, which allowed entities to refinance higher cost debt in today's lower rate environment. At the same time, demand for the attractive taxable-equivalent yields offered by municipal bonds remained strong, as evidenced by positive inflows into municipal bond mutual funds.
Regarding credit fundamentals, municipal bonds also benefited as improved consumer confidence, a positive employment picture and a recovery in the housing market bolstered sales, income and property tax revenues for many state and local issuers. Against this backdrop, it was no surprise that bond defaults continued to decline. On the other hand, certain troubled credits, such as Illinois, New Jersey and Puerto Rico, made headlines due to budget issues, pension problems and/or credit downgrades. Nonetheless, we do not believe that these issues are indicative of the general health of the municipal market.
Portfolio Management
Kimberly Campbell
Top Ten States/Territories (%)
(at July 31, 2015) | |
Illinois | | | 13.1 | | |
California | | | 12.8 | | |
Texas | | | 9.6 | | |
Massachusetts | | | 5.3 | | |
New York | | | 4.8 | | |
Florida | | | 4.3 | | |
Minnesota | | | 4.2 | | |
Wisconsin | | | 4.1 | | |
Pennsylvania | | | 4.0 | | |
Louisiana | | | 3.1 | | |
Percentages indicated are based upon total investments (excluding Money Market Funds).
For further detail about these holdings, please refer to the section entitled "Portfolio of Investments."
Fund holdings are as of the date given, are subject to change at any time, and are not recommendations to buy or sell any security.
Annual Report 2015
5
MANAGER DISCUSSION OF FUND PERFORMANCE (continued)
INVESTMENT RISKS
Fixed-income securities present issuer default risk. The Fund invests substantially in municipal securities and will be affected by tax, legislative, regulatory, demographic or political changes, as well as changes impacting a state's financial, economic or other conditions. A relatively small number of tax-exempt issuers may necessitate the Fund investing more heavily in a single issuer and, therefore, be more exposed to the risk of loss than a fund that invests more broadly. Prepayment and extension risk exists as a loan, bond or other investment may be called, prepaid or redeemed before maturity and that similar yielding investments may not be available for purchase. Market risk may affect a single issuer, sector of the economy, industry or the market as a whole. A rise in interest rates may result in a price decline of fixed-income instruments held by the Fund, negatively impacting its performance and NAV. Falling rates may result in the Fund investing in lower yielding debt instruments, lowering the Fund's income and yield. These risks may be heightened for longer maturity and duration securities. Federal and state tax rules apply to capital gain distributions and any gains or losses on sales. Income may be subject to state, local or alternative minimum taxes. See the Fund's prospectus for more information on these and other risks.
For the period, municipal market credit spreads — the incremental yield offered by lower quality issues vs. AAA rated bonds — generally narrowed, as A and BBB rated bonds significantly outperformed higher quality bonds. BBB rated bonds were the best performing investment grade credit category.
Favorable Yield Curve and Duration Positioning
The Fund's yield curve positioning substantially contributed to its outperformance. The Fund's overweight in the 15- to 30-year maturity range and underweight at the short end of the curve were major contributors to performance, as yields on 30-year muni bonds moved slightly lower and yields on short-term bonds increased substantially. (Bond prices move in the opposite direction of yields.) The Fund had a longer duration than the benchmark, which also aided relative performance. (Duration, expressed in years, is a measure of a bond's sensitivity to changing interest rates.)
Boost from Credit Quality Allocations and Security Selection
Overweight positions in A and BBB rated bonds and out-of-benchmark exposure to below-investment-grade issues also helped the Fund's relative performance. Both the A and BBB credit quality segments were strong performers within the benchmark, and the Fund's below-investment-grade bonds outperformed the benchmark. Having less exposure than the benchmark to the high quality AAA and AA rated bonds also helped performance, as both segments were laggards within the benchmark this past year.
Security selection in the hospital, education and transportation sectors provided an added boost to performance. The Fund further benefited from an overweight in hospital bonds, the top performing sector in the benchmark during the period. Finally, about 6% of the Fund's assets were pre-refunded during the period, resulting in price appreciation and improved credit quality. Pre-refunding occurs when an issuer sells new bonds and invests the proceeds in U.S. Treasury securities that are pledged to pay off the older debt. The old bonds are "pre-refunded" until they are called or paid off, boosting their credit quality.
Disappointments from Some Local GOs
Security selection within the local government obligation (GO) sector hampered relative performance. The biggest disappointment came from bonds issued by the city of Chicago, as issues around pension funding, budget gaps and liquidity management led to agency downgrades and rising yields. Despite these serious challenges, we believe yields reached levels that offered an attractive long-term investment opportunity. Furthermore, we believe Chicago, the nation's third most populous city, has the economy, tax base and political willingness to improve its fiscal position.
Elsewhere, the Fund's underweight in strong performing sectors, such as transportation and water and sewer, dampened performance vs. the benchmark. We continued to look for opportunities in the transportation
Annual Report 2015
6
MANAGER DISCUSSION OF FUND PERFORMANCE (continued)
sector and successfully added to its exposure during the year. A very small investment in Puerto Rico bonds detracted from results, as the difference between the yields on these bonds and high quality AAA issues widened amid the Commonwealth's well-publicized economic troubles.
Portfolio Changes Guided by Relative Value Analysis
During the period, we increased the Fund's exposure to several sectors, including health care, transportation, local GO and charter schools. We focused on bonds rated A and BBB, as we believe they provided attractive relative value when compared to higher quality bonds and the potential for price appreciation. Furthermore, we found investment opportunities in bonds rated below investment grade, which provided the Fund with significant income in addition to the previously mentioned benefits.
Looking Ahead
Overall, municipal market credit fundamentals continue to improve as the pace of economic growth is moderate and inflationary pressures remain muted. Although municipal yields at the end of the period were low relative to historical standards, they were attractive relative to U.S. Treasury yields. As of July 31, 2015, the yield on 10-year AAA rated municipal bonds was 100% of 10-year U.S. Treasuries, meaning that while municipals and Treasuries provided the same stated yield, municipal investors benefited further from the additional tax advantage that municipal bonds provide. While the yield curve flattened, we currently believe that bonds maturing in 15 years and beyond continue to offer a meaningful yield advantage.
Given our expectations that the Fed will begin raising key short-term interest rates, we have currently positioned the Fund for a further flattening of the yield curve, in which yields on short bonds rise more than yields on long bonds. Therefore, we plan to maintain an overweight at this time in bonds with maturities of 15 to 30 years, which we believe offer good relative value and attractive income. It is important to remember that total return is the combination of the change in a bond's price plus the income it provides. As long-term investors, we find that income is often a major contributor to performance.
We also currently expect to maintain overweight positions in the A and BBB credit quality categories and to invest selectively in the non-rated area. We have favored bonds with medium or lower credit ratings because they provide a relatively attractive level of income, perform well in an improving economy and tend to be less sensitive to interest rate fluctuations than higher quality issues. At period-end, about 32% of the Fund's assets were invested in A rated securities, 27% in BBB and below and 14.5% in non-rated bonds. We believe the yield advantage that lower quality bonds offer has the potential to dampen the effect of the Fund's slightly longer duration. Going forward, we will continue to rely on our relative value investment process and the independent credit research of our analysts to guide our bottom-up investment decisions, while closely monitoring economic data, monetary policy and inflation expectations that could affect our long-term outlook.
Quality Breakdown (%)
(at July 31, 2015) | |
AAA rating | | | 3.9 | | |
AA rating | | | 21.3 | | |
A rating | | | 32.3 | | |
BBB rating | | | 23.6 | | |
BB rating | | | 2.5 | | |
B rating | | | 0.6 | | |
CCC rating | | | 0.6 | | |
CC rating | | | 0.2 | | |
Not rated | | | 15.0 | | |
Total | | | 100.0 | | |
Percentages indicated are based upon total fixed income investments (excluding Money Market Funds).
Bond ratings apply to the underlying holdings of the Fund and not the Fund itself and are divided into categories ranging from highest to lowest credit quality, determined by using the middle rating of Moody's, S&P and Fitch, after dropping the highest and lowest available ratings. When ratings are available from only two rating agencies, the lower rating is used. When a rating is available from only one rating agency, that rating is used. When a bond is not rated by any rating agency, it is designated as "Not rated." Credit quality ratings assigned by a rating agency are subjective opinions, not statements of fact, and are subject to change, including daily. The ratings assigned by credit rating agencies are but one of the considerations that the Investment Manager and/or Fund's subadviser incorporates into its credit analysis process, along with such other issuer-specific factors as cash flows, capital structure and leverage ratios, ability to de-leverage (repay) through free cash flow, quality of management, market positioning and access to capital, as well as such security-specific factors as the terms of the security (e.g., interest rate and time to maturity) and the amount and type of any collateral.
Annual Report 2015
7
UNDERSTANDING YOUR FUND'S EXPENSES
(Unaudited)
As an investor, you incur two types of costs. There are transaction costs, which generally include sales charges on purchases and may include redemption fees. There are also ongoing costs, which generally include management fees, distribution and/or service fees, and other fund expenses. The following information is intended to help you understand your ongoing costs (in dollars) of investing in the Fund and to help you compare these costs with the ongoing costs of investing in other mutual funds.
Analyzing Your Fund's Expenses
To illustrate these ongoing costs, we have provided examples and calculated the expenses paid by investors in each share class of the Fund during the period. The actual and hypothetical information in the table is based on an initial investment of $1,000 at the beginning of the period indicated and held for the entire period. Expense information is calculated two ways and each method provides you with different information. The amount listed in the "Actual" column is calculated using the Fund's actual operating expenses and total return for the period. You may use the Actual information, together with the amount invested, to estimate the expenses that you paid over the period. Simply divide your account value by $1,000 (for example, an $8,600 account value divided by $1,000 = 8.6), then multiply the results by the expenses paid during the period under the "Actual" column. The amount listed in the "Hypothetical" column assumes a 5% annual rate of return before expenses (which is not the Fund's actual return) and then applies the Fund's actual expense ratio for the period to the hypothetical return. You should not use the hypothetical account values and expenses to estimate either your actual account balance at the end of the period or the expenses you paid during the period. See "Compare With Other Funds" below for details on how to use the hypothetical data.
Compare With Other Funds
Since all mutual funds are required to include the same hypothetical calculations about expenses in shareholder reports, you can use this information to compare the ongoing cost of investing in the Fund with other funds. To do so, compare the hypothetical example with the 5% hypothetical examples that appear in the shareholder reports of other funds. As you compare hypothetical examples of other funds, it is important to note that hypothetical examples are meant to highlight the ongoing costs of investing in a fund only and do not reflect any transaction costs, such as sales charges, or redemption or exchange fees. Therefore, the hypothetical calculations are useful in comparing ongoing costs only, and will not help you determine the relative total costs of owning different funds. If transaction costs were included in these calculations, your costs would be higher.
February 1, 2015 – July 31, 2015
| | | Account Value at the Beginning
of the Period ($) | | Account Value at the End of the
Period ($) | | Expenses Paid During the
Period ($) | | Fund's Annualized
Expense Ratio (%) | |
| | | Actual | | Hypothetical | | Actual | | Hypothetical | | Actual | | Hypothetical | | Actual | |
Class A | | | 1,000.00 | | | | 1,000.00 | | | | 989.40 | | | | 1,021.09 | | | | 3.82 | | | | 3.88 | | | | 0.77 | | |
Class B | | | 1,000.00 | | | | 1,000.00 | | | | 985.80 | | | | 1,017.35 | | | | 7.53 | | | | 7.64 | | | | 1.52 | | |
Class C | | | 1,000.00 | | | | 1,000.00 | | | | 987.00 | | | | 1,017.85 | | | | 7.03 | | | | 7.14 | | | | 1.42 | | |
Class R4 | | | 1,000.00 | | | | 1,000.00 | | | | 991.10 | | | | 1,022.09 | | | | 2.83 | | | | 2.87 | | | | 0.57 | | |
Class R5 | | | 1,000.00 | | | | 1,000.00 | | | | 990.80 | | | | 1,022.39 | | | | 2.53 | | | | 2.57 | | | | 0.51 | | |
Class Z | | | 1,000.00 | | | | 1,000.00 | | | | 990.40 | | | | 1,022.09 | | | | 2.83 | | | | 2.87 | | | | 0.57 | | |
Expenses paid during the period are equal to the annualized expense ratio for each class as indicated above, multiplied by the average account value over the period and then multiplied by the number of days in the Fund's most recent fiscal half year and divided by 365.
Expenses do not include fees and expenses incurred indirectly by the Fund from its investment in underlying funds, including affiliated and non-affiliated pooled investment vehicles, such as mutual funds and exchange-traded funds.
Had Columbia Management Investment Advisers, LLC and/or certain of its affiliates not waived/reimbursed certain fees and expenses, account value at the end of the period would have been reduced.
Annual Report 2015
8
PORTFOLIO OF INVESTMENTS
July 31, 2015
(Percentages represent value of investments compared to net assets)
Municipal Bonds 97.4%
Issue
Description | | Coupon
Rate | | Principal
Amount ($) | |
Value ($) | |
ALABAMA 0.2% | |
County of Jefferson
Revenue Bonds
Series 2004A
01/01/23 | | | 5.250 | % | | | 7,500,000 | | | | 7,556,250 | | |
ALASKA 0.6% | |
City of Koyukuk
Revenue Bonds
Tanana Chiefs Conference Health Care
Series 2011
10/01/32 | | | 7.500 | % | | | 18,330,000 | | | | 20,957,422 | | |
10/01/41 | | | 7.750 | % | | | 4,350,000 | | | | 5,000,978 | | |
Total | | | | | | | 25,958,400 | | |
ARIZONA 1.8% | |
Arizona Health Facilities Authority
Refunding Revenue Bonds
Scottsdale Lincoln Hospital Project
Series 2014
12/01/42 | | | 5.000 | % | | | 7,000,000 | | | | 7,574,420 | | |
Revenue Bonds
Banner Health
Series 2008D
01/01/32 | | | 5.375 | % | | | 7,800,000 | | | | 8,297,952 | | |
Series 2014A
01/01/44 | | | 5.000 | % | | | 14,000,000 | | | | 15,305,500 | | |
Glendale Industrial Development Authority
Revenue Bonds
Midwestern University
Series 2010
05/15/35 | | | 5.000 | % | | | 13,750,000 | | | | 15,139,300 | | |
Industrial Development Authority of the
County of Pima (The)
Revenue Bonds
GNMA Mortgage-Backed Securities
Series 1989 Escrowed to Maturity AMT(a)
09/01/21 | | | 8.200 | % | | | 8,900,000 | | | | 11,138,884 | | |
Maricopa County Pollution Control Corp.
Refunding Revenue Bonds
Southern California Edison Co.
Series 2000B
06/01/35 | | | 5.000 | % | | | 9,775,000 | | | | 10,904,110 | | |
Salt Verde Financial Corp.
Revenue Bonds
Senior Series 2007
12/01/32 | | | 5.000 | % | | | 5,400,000 | | | | 5,955,984 | | |
Total | | | | | | | 74,316,150 | | |
Municipal Bonds (continued)
Issue
Description | | Coupon
Rate | | Principal
Amount ($) | |
Value ($) | |
ARKANSAS 0.3% | |
Pulaski County Public Facilities Board
Revenue Bonds
Series 2014
12/01/39 | | | 5.000 | % | | | 8,725,000 | | | | 9,426,839 | | |
12/01/42 | | | 5.000 | % | | | 2,000,000 | | | | 2,152,780 | | |
Total | | | | | | | 11,579,619 | | |
CALIFORNIA 12.5% | |
ABAG Finance Authority for Nonprofit Corps.
Refunding Revenue Bonds
Episcopal Senior Communities
Series 2011
07/01/26 | | | 6.125 | % | | | 3,420,000 | | �� | | 3,943,328 | | |
07/01/41 | | | 6.125 | % | | | 7,015,000 | | | | 7,907,308 | | |
Revenue Bonds
Sharp Healthcare
Series 2009
08/01/39 | | | 6.250 | % | | | 4,000,000 | | | | 4,668,840 | | |
Agua Caliente Band of Cahuilla Indians
Revenue Bonds
Series 2003(b)(c)
07/01/18 | | | 6.000 | % | | | 1,265,000 | | | | 1,251,971 | | |
Cabazon Band Mission Indians(b)(c)(d)(e)
Revenue Bonds
Mortgage Notes
Series 2004
10/01/13 | | | 13.000 | % | | | 379,550 | | | | 189,524 | | |
10/01/15 | | | 8.375 | % | | | 1,740,000 | | | | 586,102 | | |
10/01/19 | | | 8.750 | % | | | 8,670,000 | | | | 2,919,536 | | |
Series 2010
10/01/20 | | | 8.375 | % | | | 1,415,000 | | | | 536,625 | | |
California Health Facilities Financing Authority
Prerefunded 10/01/18 Revenue Bonds
Providence Health
Series 2008
10/01/38 | | | 6.500 | % | | | 110,000 | | | | 129,262 | | |
Providence Health & Services
Series 2008C
10/01/28 | | | 6.250 | % | | | 2,000,000 | | | | 2,336,020 | | |
Revenue Bonds
Kaiser Permanente
Series 2006A
04/01/39 | | | 5.250 | % | | | 4,500,000 | | | | 4,590,495 | | |
California Housing Finance Agency(a)
Revenue Bonds
Home Mortgage
Series 2006H (FGIC) AMT
08/01/30 | | | 5.750 | % | | | 855,000 | | | | 870,193 | | |
Series 2006K AMT
02/01/42 | | | 5.500 | % | | | 535,000 | | | | 544,261 | | |
The accompanying Notes to Financial Statements are an integral part of this statement.
Annual Report 2015
9
PORTFOLIO OF INVESTMENTS (continued)
July 31, 2015
Municipal Bonds (continued)
Issue
Description | | Coupon
Rate | | Principal
Amount ($) | |
Value ($) | |
California Municipal Finance Authority
Revenue Bonds
American Heritage Education Foundation Project
Series 2006A
06/01/36 | | | 5.250 | % | | | 1,750,000 | | | | 1,757,368 | | |
Biola University
Series 2008
10/01/34 | | | 5.875 | % | | | 4,000,000 | | | | 4,352,280 | | |
California Municipal Finance Authority(a)(b)(d)
Revenue Bonds
UTS Renewable Energy-Waste Water Facilities
Series 2011 AMT
12/01/32 | | | 7.500 | % | | | 1,830,000 | | | | 1,877,781 | | |
California State Public Works Board
Revenue Bonds
Various Capital Projects
Series 2012A
04/01/37 | | | 5.000 | % | | | 4,660,000 | | | | 5,186,394 | | |
Subordinated Series 2009I-1
11/01/29 | | | 6.125 | % | | | 6,000,000 | | | | 7,159,200 | | |
Various Correctional Facilities
Series 2014A
09/01/39 | | | 5.000 | % | | | 7,000,000 | | | | 7,868,770 | | |
California Statewide Communities Development Authority
Refunding Revenue Bonds
899 Charleston Project
Series 2014A
11/01/29 | | | 5.000 | % | | | 1,650,000 | | | | 1,701,662 | | |
11/01/34 | | | 5.000 | % | | | 3,700,000 | | | | 3,743,438 | | |
Revenue Bonds
Aspire Public Schools
Series 2010
07/01/30 | | | 6.000 | % | | | 3,555,000 | | | | 3,785,648 | | |
California Baptist University
Series 2014A
11/01/33 | | | 6.125 | % | | | 1,560,000 | | | | 1,687,171 | | |
11/01/43 | | | 6.375 | % | | | 1,035,000 | | | | 1,129,775 | | |
John Muir Health
Series 2006A
08/15/32 | | | 5.000 | % | | | 1,000,000 | | | | 1,040,380 | | |
Kaiser Permanente
Series 2006B
03/01/45 | | | 5.250 | % | | | 9,000,000 | | | | 9,184,500 | | |
Lancer Plaza Project
Series 2013
11/01/43 | | | 5.875 | % | | | 1,875,000 | | | | 1,898,006 | | |
Loma Linda University Medical Center
Series 2014
12/01/44 | | | 5.250 | % | | | 3,500,000 | | | | 3,698,030 | | |
University of California Irvine East Campus Apartments
Series 2008
05/15/32 | | | 5.750 | % | | | 5,500,000 | | | | 5,984,935 | | |
Municipal Bonds (continued)
Issue
Description | | Coupon
Rate | | Principal
Amount ($) | |
Value ($) | |
Castaic Lake Water Agency
Certificate of Participation
Capital Appreciation-Water System Improvement Project
Series 1999 (AMBAC)(f)
08/01/24 | | | 0.000 | % | | | 9,445,000 | | | | 7,237,987 | | |
Chino Public Financing Authority
Refunding Special Tax Bonds
Series 2012
09/01/22 | | | 4.000 | % | | | 1,500,000 | | | | 1,585,215 | | |
09/01/24 | | | 5.000 | % | | | 1,110,000 | | | | 1,228,026 | | |
09/01/25 | | | 5.000 | % | | | 790,000 | | | | 867,381 | | |
09/01/26 | | | 5.000 | % | | | 1,230,000 | | | | 1,344,821 | | |
09/01/27 | | | 5.000 | % | | | 1,280,000 | | | | 1,393,344 | | |
City of Pomona
Refunding Revenue Bonds
Mortgage-Backed Securities
Series 1990A (GNMA/FNMA)
05/01/23 | | | 7.600 | % | | | 6,160,000 | | | | 7,654,662 | | |
City of Vernon Electric System
Revenue Bonds
Series 2009A
08/01/21 | | | 5.125 | % | | | 2,500,000 | | | | 2,757,700 | | |
County of Sacramento Airport System
Revenue Bonds
Senior Series 2009B
07/01/39 | | | 5.750 | % | | | 4,000,000 | | | | 4,468,160 | | |
Foothill-Eastern Transportation Corridor Agency
Refunding Revenue Bonds
Junior Lien
Series 2014C
01/15/33 | | | 6.250 | % | | | 3,845,000 | | | | 4,514,645 | | |
Series 2014A
01/15/46 | | | 5.750 | % | | | 19,005,000 | | | | 21,855,940 | | |
Foothill-Eastern Transportation Corridor Agency(f)
Revenue Bonds
Capital Appreciation-Senior Lien
Series 1995A Escrowed to Maturity
01/01/18 | | | 0.000 | % | | | 10,000,000 | | | | 9,780,600 | | |
Los Angeles County Schools Regionalized
Business Services Corp.
Certificate of Participation
Capital Appreciation-Pooled Financing
Series 1999A (AMBAC)(f)
08/01/22 | | | 0.000 | % | | | 2,180,000 | | | | 1,775,850 | | |
Los Angeles Unified School District
Unlimited General Obligation Bonds
Series 2009I
07/01/29 | | | 5.000 | % | | | 4,800,000 | | | | 5,438,688 | | |
Norwalk-La Mirada Unified School District
Unlimited General Obligation Bonds
Capital Appreciation
Series 2005B (NPFGC)(f)
08/01/23 | | | 0.000 | % | | | 9,790,000 | | | | 7,750,939 | | |
The accompanying Notes to Financial Statements are an integral part of this statement.
Annual Report 2015
10
PORTFOLIO OF INVESTMENTS (continued)
July 31, 2015
Municipal Bonds (continued)
Issue
Description | | Coupon
Rate | | Principal
Amount ($) | |
Value ($) | |
Perris Community Facilities District
Special Tax Bonds
Series 1991-90-2 Escrowed to Maturity
10/01/21 | | | 8.750 | % | | | 6,165,000 | | | | 8,613,368 | | |
San Diego Public Facilities Financing Authority Sewer
Revenue Bonds
Senior Series 2009A
05/15/34 | | | 5.250 | % | | | 4,500,000 | | | | 5,105,700 | | |
05/15/39 | | | 5.250 | % | | | 17,000,000 | | | | 19,174,470 | | |
San Francisco City & County Airports
Commission-San Francisco International Airport
Revenue Bonds
Series 2014A AMT(a)
05/01/44 | | | 5.000 | % | | | 24,000,000 | | | | 25,958,400 | | |
San Francisco City & County Redevelopment Agency
Tax Allocation Bonds
Mission Bay South Redevelopment
Series 2009D
08/01/31 | | | 6.500 | % | | | 500,000 | | | | 573,460 | | |
08/01/39 | | | 6.625 | % | | | 1,500,000 | | | | 1,720,545 | | |
San Juan Unified School District
Unlimited General Obligation Bonds
Capital Appreciation
Series 2001 (AGM)(f)
08/01/18 | | | 0.000 | % | | | 1,785,000 | | | | 1,714,635 | | |
State of California
Unlimited General Obligation Bonds
Series 2006
10/01/36 | | | 4.500 | % | | | 4,015,000 | | | | 4,153,236 | | |
Various Purpose
Series 2007
12/01/32 | | | 5.000 | % | | | 8,000,000 | | | | 8,691,520 | | |
06/01/37 | | | 5.000 | % | | | 13,145,000 | | | | 13,990,881 | | |
11/01/37 | | | 5.000 | % | | | 18,000,000 | | | | 19,396,620 | | |
12/01/37 | | | 5.000 | % | | | 10,200,000 | | | | 11,020,284 | | |
Series 2008
03/01/27 | | | 5.500 | % | | | 1,000,000 | | | | 1,110,530 | | |
03/01/38 | | | 5.250 | % | | | 8,250,000 | | | | 9,002,400 | | |
Series 2009
04/01/31 | | | 5.750 | % | | | 32,500,000 | | | | 37,712,025 | | |
04/01/35 | | | 6.000 | % | | | 15,000,000 | | | | 17,486,700 | | |
04/01/38 | | | 6.000 | % | | | 22,500,000 | | | | 26,221,275 | | |
11/01/39 | | | 5.500 | % | | | 15,520,000 | | | | 18,122,238 | | |
Series 2010
03/01/30 | | | 5.250 | % | | | 3,000,000 | | | | 3,476,250 | | |
03/01/33 | | | 6.000 | % | | | 5,000,000 | | | | 6,034,850 | | |
03/01/40 | | | 5.500 | % | | | 17,200,000 | | | | 19,987,432 | | |
Series 2011
09/01/30 | | | 5.250 | % | | | 8,750,000 | | | | 10,126,637 | | |
Series 2012
04/01/35 | | | 5.250 | % | | | 19,275,000 | | | | 22,064,863 | | |
Unlimited General Obligation Refunding Bonds
Series 2007
08/01/30 | | | 4.500 | % | | | 34,950,000 | | | | 36,654,162 | | |
Municipal Bonds (continued)
Issue
Description | | Coupon
Rate | | Principal
Amount ($) | |
Value ($) | |
Unrefunded Unlimited General Obligation Bonds
Series 2004
04/01/29 | | | 5.300 | % | | | 6,000 | | | | 6,024 | | |
Temecula Public Financing Authority
Refunding Special Tax Bonds
Wolf Creek Community Facilities District
Series 2012
09/01/27 | | | 5.000 | % | | | 1,275,000 | | | | 1,404,668 | | |
09/01/28 | | | 5.000 | % | | | 1,315,000 | | | | 1,444,961 | | |
09/01/29 | | | 5.000 | % | | | 1,405,000 | | | | 1,535,244 | | |
09/01/30 | | | 5.000 | % | | | 1,480,000 | | | | 1,615,257 | | |
09/01/31 | | | 5.000 | % | | | 1,555,000 | | | | 1,689,321 | | |
West Contra Costa Unified School District
Unlimited General Obligation Refunding Bonds
Series 2001B (NPFGC)
08/01/24 | | | 6.000 | % | | | 2,320,000 | | | | 2,707,649 | | |
Yuba City Unified School District
Unlimited General Obligation Bonds
Capital Appreciation
Series 2000 (NPFGC)(f)
09/01/18 | | | 0.000 | % | | | 1,160,000 | | | | 1,087,198 | | |
Total | | | | | | | 511,785,564 | | |
COLORADO 2.4% | |
Baptist Road Rural Transportation Authority
Revenue Bonds
Series 2007
12/01/17 | | | 4.800 | % | | | 450,000 | | | | 452,538 | | |
12/01/22 | | | 4.950 | % | | | 1,570,000 | | | | 1,531,268 | | |
12/01/26 | | | 5.000 | % | | | 1,575,000 | | | | 1,502,471 | | |
City & County of Denver
Refunding Revenue Bonds
United Air Lines Project
Series 2007A AMT(a)
10/01/32 | | | 5.250 | % | | | 5,000,000 | | | | 5,173,600 | | |
Colorado Educational & Cultural Facilities Authority
Refunding Revenue Bonds
Student Housing-Campus Village Apartments LLC
Series 2008
06/01/33 | | | 5.500 | % | | | 2,000,000 | | | | 2,190,240 | | |
06/01/38 | | | 5.500 | % | | | 6,000,000 | | | | 6,570,720 | | |
Colorado Educational & Cultural Facilities Authority(b)
Improvement Refunding Revenue Bonds
Skyview Charter School
Series 2014
07/01/34 | | | 5.125 | % | | | 1,525,000 | | | | 1,596,019 | | |
07/01/44 | | | 5.375 | % | | | 2,100,000 | | | | 2,202,984 | | |
07/01/49 | | | 5.500 | % | | | 925,000 | | | | 968,494 | | |
Colorado Health Facilities Authority
Refunding Revenue Bonds
Covenant Retirement Communities
Series 2012A
12/01/33 | | | 5.000 | % | | | 5,500,000 | | | | 5,750,195 | | |
The accompanying Notes to Financial Statements are an integral part of this statement.
Annual Report 2015
11
PORTFOLIO OF INVESTMENTS (continued)
July 31, 2015
Municipal Bonds (continued)
Issue
Description | | Coupon
Rate | | Principal
Amount ($) | |
Value ($) | |
Series 2015
12/01/35 | | | 5.000 | % | | | 3,800,000 | | | | 4,023,782 | | |
Health Facilities Evangelical Lutheran
Series 2005
06/01/23 | | | 5.250 | % | | | 1,200,000 | | | | 1,232,748 | | |
Valley View Hospital Association
Series 2008
05/15/28 | | | 5.500 | % | | | 5,745,000 | | | | 6,267,967 | | |
Revenue Bonds
Catholic Health Initiatives
Series 2013A
01/01/45 | | | 5.250 | % | | | 10,000,000 | | | | 10,835,100 | | |
E-470 Public Highway Authority
Revenue Bonds
Series 2010C
09/01/26 | | | 5.375 | % | | | 5,000,000 | | | | 5,576,250 | | |
E-470 Public Highway Authority(f)
Revenue Bonds
Capital Appreciation
Senior Series 1997B (NPFGC)
09/01/22 | | | 0.000 | % | | | 6,515,000 | | | | 5,423,021 | | |
Senior Series 2000B (NPFGC)
09/01/18 | | | 0.000 | % | | | 18,600,000 | | | | 17,482,326 | | |
Foothills Metropolitan District
Special Assessment Bonds
Series 2014
12/01/30 | | | 5.750 | % | | | 1,500,000 | | | | 1,586,325 | | |
North Range Metropolitan District No. 2
Limited Tax General Obligation Bonds
Series 2007
12/15/27 | | | 5.500 | % | | | 2,765,000 | | | | 2,800,752 | | |
12/15/37 | | | 5.500 | % | | | 3,100,000 | | | | 3,126,474 | | |
University of Colorado Hospital Authority
Refunding Revenue Bonds
Series 2009A
11/15/29 | | | 6.000 | % | | | 5,000,000 | | | | 5,744,650 | | |
Revenue Bonds
Series 2012A
11/15/42 | | | 5.000 | % | | | 7,325,000 | | | | 7,908,656 | | |
Total | | | | | | | 99,946,580 | | |
CONNECTICUT 0.8% | |
Bridgeport Housing Authority
Revenue Bonds
Custodial Receipts Energy Performance
Series 2009
06/01/30 | | | 5.600 | % | | | 1,000,000 | | | | 1,023,510 | | |
City of New Haven
Unlimited General Obligation Bonds
Series 2002C Escrowed to Maturity (NPFGC)
11/01/20 | | | 5.000 | % | | | 10,000 | | | | 10,386 | | |
Municipal Bonds (continued)
Issue
Description | | Coupon
Rate | | Principal
Amount ($) | |
Value ($) | |
Connecticut Housing Finance Authority
Revenue Bonds
State Supported Special Obligation
Series 2009-10
06/15/28 | | | 5.000 | % | | | 750,000 | | | | 826,815 | | |
Connecticut State Development Authority
Refunding Revenue Bonds
Connecticut Light & Power Co. Project
Series 2011
09/01/28 | | | 4.375 | % | | | 1,500,000 | | | | 1,620,945 | | |
Revenue Bonds
Alzheimers Resource Center, Inc. Project
Series 2007
08/15/27 | | | 5.500 | % | | | 2,375,000 | | | | 2,435,159 | | |
Connecticut State Health & Educational
Facility Authority
Revenue Bonds
Connecticut College
Series 2011H-1
07/01/41 | | | 5.000 | % | | | 1,625,000 | | | | 1,760,525 | | |
Danbury Hospital
Series 2006H (AMBAC)
07/01/33 | | | 4.500 | % | | | 2,000,000 | | | | 2,002,420 | | |
Loomis Chaffe School
Series 2005F (AMBAC)
07/01/25 | | | 5.250 | % | | | 2,035,000 | | | | 2,533,962 | | |
07/01/26 | | | 5.250 | % | | | 1,045,000 | | | | 1,308,413 | | |
Middlesex Hospital
Series 2011N
07/01/24 | | | 5.000 | % | | | 425,000 | | | | 474,419 | | |
07/01/26 | | | 5.000 | % | | | 900,000 | | | | 990,243 | | |
Sacred Heart University
Series 2011G
07/01/31 | | | 5.375 | % | | | 500,000 | | | | 542,050 | | |
Stamford Hospital
Series 2012J
07/01/37 | | | 5.000 | % | | | 1,000,000 | | | | 1,073,610 | | |
State Supported Child Care
Series 2011
07/01/28 | | | 5.000 | % | | | 1,030,000 | | | | 1,133,855 | | |
07/01/29 | | | 5.000 | % | | | 860,000 | | | | 944,761 | | |
Western Connecticut Health
Series 2011M
07/01/41 | | | 5.375 | % | | | 1,500,000 | | | | 1,654,980 | | |
Western Connecticut Health Network
Series 2011
07/01/29 | | | 5.000 | % | | | 1,000,000 | | | | 1,094,610 | | |
Harbor Point Infrastructure Improvement District
Tax Allocation Bonds
Harbor Point Project
Series 2010A
04/01/39 | | | 7.875 | % | | | 8,750,000 | | | | 10,388,525 | | |
New Haven Solid Waste Authority
Revenue Bonds
Series 2008
06/01/28 | | | 5.375 | % | | | 1,750,000 | | | | 1,874,775 | | |
The accompanying Notes to Financial Statements are an integral part of this statement.
Annual Report 2015
12
PORTFOLIO OF INVESTMENTS (continued)
July 31, 2015
Municipal Bonds (continued)
Issue
Description | | Coupon
Rate | | Principal
Amount ($) | |
Value ($) | |
University of Connecticut
Revenue Bonds
Series 2009A
02/15/28 | | | 5.000 | % | | | 500,000 | | | | 556,930 | | |
Total | | | | | | | 34,250,893 | | |
DELAWARE 0.2% | |
Delaware State Economic Development Authority
Refunding Revenue Bonds
Gas Facilities-Delmarva Power
Series 2010
02/01/31 | | | 5.400 | % | | | 5,000,000 | | | | 5,545,000 | | |
Revenue Bonds
Newark Charter School
Series 2012
09/01/32 | | | 4.625 | % | | | 2,000,000 | | | | 2,021,420 | | |
09/01/42 | | | 5.000 | % | | | 1,350,000 | | | | 1,403,636 | | |
Total | | | | | | | 8,970,056 | | |
DISTRICT OF COLUMBIA —% | |
District of Columbia
Revenue Bonds
KIPP Charter School
Series 2013
07/01/33 | | | 6.000 | % | | | 250,000 | | | | 290,070 | | |
07/01/48 | | | 6.000 | % | | | 1,150,000 | | | | 1,314,772 | | |
Total | | | | | | | 1,604,842 | | |
FLORIDA 4.2% | |
Brevard County Housing Finance Authority
Revenue Bonds
Compound Interest
Series 1985 (FGIC/MGIC)(f)
04/01/17 | | | 0.000 | % | | | 375,000 | | | | 315,746 | | |
Capital Trust Agency, Inc.
Revenue Bonds
Atlantic Housing Foundation
Subordinated Series 2008B(d)(e)
07/15/32 | | | 7.000 | % | | | 1,820,000 | | | | 364,055 | | |
City of Lakeland
Revenue Bonds
Lakeland Regional Health
Series 2015
11/15/45 | | | 5.000 | % | | | 22,000,000 | | | | 23,515,360 | | |
County of Broward Airport System
Refunding Revenue Bonds
Series 2012P-1 AMT(a)
10/01/25 | | | 5.000 | % | | | 6,000,000 | | | | 6,824,400 | | |
County of Miami-Dade Aviation(a)
Refunding Revenue Bonds
Series 2014A AMT
10/01/33 | | | 5.000 | % | | | 10,000,000 | | | | 10,961,600 | | |
10/01/36 | | | 5.000 | % | | | 21,400,000 | | | | 23,232,910 | | |
Municipal Bonds (continued)
Issue
Description | | Coupon
Rate | | Principal
Amount ($) | |
Value ($) | |
County of Seminole Water & Sewer
Revenue Bonds
Series 1992 Escrowed to Maturity (NPFGC)
10/01/19 | | | 6.000 | % | | | 1,030,000 | | | | 1,144,948 | | |
Unrefunded Revenue Bonds
Series 1992 (NPFGC)
10/01/19 | | | 6.000 | % | | | 100,000 | | | | 100,790 | | |
Florida Development Finance Corp.
Revenue Bonds
Renaissance Charter School
Series 2012A
06/15/22 | | | 5.500 | % | | | 1,240,000 | | | | 1,286,549 | | |
06/15/32 | | | 6.000 | % | | | 4,000,000 | | | | 4,060,320 | | |
06/15/43 | | | 6.125 | % | | | 5,000,000 | | | | 5,068,000 | | |
Renaissance Charter School Projects
Series 2013A
06/15/44 | | | 8.500 | % | | | 15,000,000 | | | | 17,354,400 | | |
Florida Development Finance Corp.(b)
Revenue Bonds
Miami Arts Charter School Project
Series 2014A
06/15/34 | | | 5.875 | % | | | 420,000 | | | | 419,966 | | |
Highlands County Health Facilities Authority
Prerefunded 11/15/16 Revenue Bonds
Adventist Health
Series 2006G
11/15/21 | | | 5.125 | % | | | 70,000 | | | | 74,152 | | |
Jacksonville Health Facilities Authority
Revenue Bonds
Brooks Health System
Series 2007
11/01/38 | | | 5.250 | % | | | 5,000,000 | | | | 5,253,900 | | |
Miami-Dade County Expressway Authority
Revenue Bonds
Series 2014A
07/01/44 | | | 5.000 | % | | | 5,000,000 | | | | 5,446,100 | | |
Mid-Bay Bridge Authority
Prerefunded 10/01/21 Revenue Bonds
Series 2011A
10/01/40 | | | 7.250 | % | | | 7,000,000 | | | | 9,194,290 | | |
Refunding Revenue Bonds
Series 2015A
10/01/35 | | | 5.000 | % | | | 3,765,000 | | | | 4,073,504 | | |
Revenue Bonds
Series 1991A Escrowed to Maturity
10/01/22 | | | 6.875 | % | | | 2,000,000 | | | | 2,520,400 | | |
Orange County Industrial Development Authority
Revenue Bonds
VITAG Florida LLC Project
Series 2014 AMT(a)(b)
07/01/36 | | | 8.000 | % | | | 12,000,000 | | | | 12,126,360 | | |
The accompanying Notes to Financial Statements are an integral part of this statement.
Annual Report 2015
13
PORTFOLIO OF INVESTMENTS (continued)
July 31, 2015
Municipal Bonds (continued)
Issue
Description | | Coupon
Rate | | Principal
Amount ($) | |
Value ($) | |
Palm Beach County Health Facilities Authority
Refunding Revenue Bonds
Boca Raton Community Hospital Obligation Group
Series 2014
12/01/31 | | | 5.000 | % | | | 1,500,000 | | | | 1,657,635 | | |
Revenue Bonds
Sinai Residences of Boca Raton
Series 2014
06/01/34 | | | 7.250 | % | | | 685,000 | | | | 777,448 | | |
Sarasota County Public Hospital District
Refunding Revenue Bonds
Sarasota Memorial Hospital
Series 1998B (NPFGC)
07/01/28 | | | 5.500 | % | | | 6,980,000 | | | | 7,966,274 | | |
Seminole Tribe of Florida, Inc.
Revenue Bonds
Series 2007A(b)(c)
10/01/27 | | | 5.250 | % | | | 9,750,000 | | | | 10,252,612 | | |
State of Florida
Unlimited General Obligation Bonds
Capital Outlay 2008
Series 2009B
06/01/26 | | | 5.000 | % | | | 5,525,000 | | | | 6,169,602 | | |
06/01/27 | | | 5.000 | % | | | 5,800,000 | | | | 6,445,656 | | |
Tampa Sports Authority
Sales Tax Revenue Bonds
Tampa Bay Arena Project
Series 1995 (NPFGC)
10/01/25 | | | 5.750 | % | | | 2,500,000 | | | | 2,919,200 | | |
Waterset North Community Development District
Special Assessment Bonds
Series 2007A
05/01/39 | | | 6.600 | % | | | 2,755,000 | | | | 2,691,718 | | |
Total | | | | | | | 172,217,895 | | |
GEORGIA 1.5% | |
Barnesville-Lamar County Industrial
Development Authority
Revenue Bonds
Gordon College Properties
Series 2004A
08/01/25 | | | 5.000 | % | | | 1,250,000 | | | | 1,251,900 | | |
DeKalb County Hospital Authority
Revenue Bonds
DeKalb Medical Center, Inc. Project
Series 2010
09/01/40 | | | 6.125 | % | | | 6,250,000 | | | | 6,772,500 | | |
Gainesville & Hall County Hospital Authority
Revenue Bonds
Northeast Georgia Healthcare
Series 2010A
02/15/45 | | | 5.500 | % | | | 30,000,000 | | | | 32,919,600 | | |
Municipal Bonds (continued)
Issue
Description | | Coupon
Rate | | Principal
Amount ($) | |
Value ($) | |
Georgia State Road & Tollway Authority
Revenue Bonds
I-75 S Express Lanes Project
Series 2014(b)(f)
06/01/24 | | | 0.000 | % | | | 625,000 | | | | 371,137 | | |
Metropolitan Atlanta Rapid Transit Authority
Refunding Revenue Bonds
Series 1992N
07/01/18 | | | 6.250 | % | | | 220,000 | | | | 241,263 | | |
Series 1992P (AMBAC)
07/01/20 | | | 6.250 | % | | | 3,335,000 | | | | 3,690,177 | | |
Series 2007A (AMBAC)
07/01/26 | | | 5.250 | % | | | 1,000,000 | | | | 1,223,270 | | |
Municipal Electric Authority of Georgia
Revenue Bonds
Series 1991V Escrowed to Maturity (NPFGC IBC)
01/01/18 | | | 6.600 | % | | | 2,735,000 | | | | 2,955,797 | | |
Unrefunded Revenue Bonds
Series 1991V (NPFGC)
01/01/18 | | | 6.600 | % | | | 7,835,000 | | | | 8,378,279 | | |
Rockdale County Development Authority
Revenue Bonds
Visy Paper Project
Series 2007A AMT(a)
01/01/34 | | | 6.125 | % | | | 3,000,000 | | | | 3,071,100 | | |
Total | | | | | | | 60,875,023 | | |
GUAM 0.1% | |
Territory of Guam(c)
Revenue Bonds
Section 30
Series 2009A
12/01/34 | | | 5.750 | % | | | 4,150,000 | | | | 4,606,749 | | |
Series 2011A
01/01/42 | | | 5.125 | % | | | 800,000 | | | | 862,192 | | |
Total | | | | | | | 5,468,941 | | |
HAWAII 0.7% | |
Hawaii Pacific Health
Revenue Bonds
Series 2010A
07/01/40 | | | 5.500 | % | | | 6,500,000 | | | | 7,209,280 | | |
Series 2010B
07/01/30 | | | 5.625 | % | | | 1,220,000 | | | | 1,381,443 | | |
07/01/40 | | | 5.750 | % | | | 1,630,000 | | | | 1,834,239 | | |
State of Hawaii Airports System
Certificate of Participation
Series 2013 AMT(a)
08/01/28 | | | 5.000 | % | | | 1,775,000 | | | | 1,989,509 | | |
The accompanying Notes to Financial Statements are an integral part of this statement.
Annual Report 2015
14
PORTFOLIO OF INVESTMENTS (continued)
July 31, 2015
Municipal Bonds (continued)
Issue
Description | | Coupon
Rate | | Principal
Amount ($) | |
Value ($) | |
State of Hawaii Department of Budget & Finance
Refunding Revenue Bonds
Special Purpose - Kahala Nui
Series 2012
11/15/21 | | | 5.000 | % | | | 1,000,000 | | | | 1,115,640 | | |
11/15/27 | | | 5.000 | % | | | 1,400,000 | | | | 1,515,052 | | |
11/15/32 | | | 5.125 | % | | | 1,300,000 | | | | 1,389,050 | | |
11/15/37 | | | 5.250 | % | | | 1,945,000 | | | | 2,085,837 | | |
Revenue Bonds
15 Craigside Project
Series 2009A
11/15/29 | | | 8.750 | % | | | 1,000,000 | | | | 1,256,990 | | |
11/15/44 | | | 9.000 | % | | | 3,000,000 | | | | 3,771,180 | | |
Hawaii Pacific University
Series 2013A
07/01/33 | | | 6.625 | % | | | 1,430,000 | | | | 1,592,419 | | |
07/01/43 | | | 6.875 | % | | | 2,795,000 | | | | 3,147,142 | | |
Total | | | | | | | 28,287,781 | | |
IDAHO 0.7% | |
Idaho Health Facilities Authority
Prerefunded 12/01/18 Revenue Bonds
Trinity Health Group
Series 2008B
12/01/23 | | | 6.000 | % | | | 1,000,000 | | | | 1,162,840 | | |
12/01/33 | | | 6.250 | % | | | 6,000,000 | | | | 7,026,060 | | |
Revenue Bonds
Terraces of Boise Project
Series 2014A
10/01/34 | | | 7.750 | % | | | 9,135,000 | | | | 9,705,755 | | |
10/01/44 | | | 8.000 | % | | | 3,635,000 | | | | 3,859,679 | | |
10/01/49 | | | 8.125 | % | | | 4,365,000 | | | | 4,655,971 | | |
Total | | | | | | | 26,410,305 | | |
ILLINOIS 12.9% | |
Chicago Midway International Airport
Refunding Revenue Bonds
2nd Lien
Series 2014A AMT(a)
01/01/41 | | | 5.000 | % | | | 10,000,000 | | | | 10,518,500 | | |
City of Chicago Wastewater Transmission
Revenue Bonds
2nd Lien
Series 2014
01/01/39 | | | 5.000 | % | | | 4,000,000 | | | | 4,152,880 | | |
01/01/44 | | | 5.000 | % | | | 4,000,000 | | | | 4,124,560 | | |
City of Chicago Wastewater Transmission(f)
Refunding Revenue Bonds
Capital Appreciation
Series 1998A (NPFGC)
01/01/20 | | | 0.000 | % | | | 7,275,000 | | | | 6,350,784 | | |
Municipal Bonds (continued)
Issue
Description | | Coupon
Rate | | Principal
Amount ($) | |
Value ($) | |
City of Chicago Waterworks
Revenue Bonds
2nd Lien
Series 2014
11/01/34 | | | 5.000 | % | | | 1,000,000 | | | | 1,059,950 | | |
11/01/39 | | | 5.000 | % | | | 2,000,000 | | | | 2,093,340 | | |
11/01/44 | | | 5.000 | % | | | 2,850,000 | | | | 2,961,036 | | |
City of Chicago
Limited General Obligation Refunding Bonds
Emergency Telephone System
Series 1999 (NPFGC)
01/01/23 | | | 5.500 | % | | | 9,750,000 | | | | 10,569,585 | | |
Revenue Bonds
Asphalt Operating Services - Recovery Zone Facility
Series 2010
12/01/18 | | | 6.125 | % | | | 3,650,000 | | | | 3,761,982 | | |
Unlimited General Obligation Bonds
Project
Series 2011A
01/01/40 | | | 5.000 | % | | | 23,025,000 | | | | 20,913,147 | | |
Series 2012A
01/01/33 | | | 5.000 | % | | | 7,450,000 | | | | 6,956,438 | | |
01/01/34 | | | 5.000 | % | | | 10,510,000 | | | | 9,756,433 | | |
Series 2009C
01/01/40 | | | 5.000 | % | | | 17,730,000 | | | | 16,103,804 | | |
Series 2015A
01/01/33 | | | 5.500 | % | | | 7,000,000 | | | | 6,907,110 | | |
01/01/39 | | | 5.500 | % | | | 1,500,000 | | | | 1,457,625 | | |
Unlimited General Obligation Refunding Bonds
Project
Series 2014A
01/01/30 | | | 5.250 | % | | | 4,200,000 | | | | 4,083,996 | | |
01/01/33 | | | 5.250 | % | | | 10,250,000 | | | | 9,853,632 | | |
01/01/34 | | | 5.000 | % | | | 5,000,000 | | | | 4,641,500 | | |
01/01/35 | | | 5.000 | % | | | 3,000,000 | | | | 2,771,700 | | |
01/01/36 | | | 5.000 | % | | | 21,360,000 | | | | 19,640,947 | | |
Series 2005D
01/01/40 | | | 5.500 | % | | | 2,000,000 | | | | 1,934,720 | | |
Series 2007E
01/01/42 | | | 5.500 | % | | | 1,000,000 | | | | 960,950 | | |
County of Champaign
Unlimited General Obligation Bonds
Public Safety Sales Tax
Series 1999 (NPFGC)
01/01/20 | | | 8.250 | % | | | 1,015,000 | | | | 1,290,248 | | |
01/01/23 | | | 8.250 | % | | | 1,420,000 | | | | 1,939,578 | | |
DeKalb County Community Unit School
District No. 424 Genoa-Kingston
Unlimited General Obligation Bonds
Capital Appreciation
Series 2001 (AMBAC)(f)
01/01/21 | | | 0.000 | % | | | 2,675,000 | | | | 2,291,164 | | |
The accompanying Notes to Financial Statements are an integral part of this statement.
Annual Report 2015
15
PORTFOLIO OF INVESTMENTS (continued)
July 31, 2015
Municipal Bonds (continued)
Issue
Description | | Coupon
Rate | | Principal
Amount ($) | |
Value ($) | |
Illinois Finance Authority
Prerefunded 05/01/19 Revenue Bonds
Rush University Medical Center
Series 2009C
11/01/39 | | | 6.625 | % | | | 8,000,000 | | | | 9,610,640 | | |
Prerefunded 08/01/17 Revenue Bonds
Sherman Health System
Series 2007A
08/01/37 | | | 5.500 | % | | | 11,000,000 | | | | 12,053,250 | | |
Prerefunded 08/15/19 Revenue Bonds
Silver Cross & Medical Centers
Series 2009
08/15/38 | | | 6.875 | % | | | 39,300,000 | | | | 48,193,983 | | |
Refunding Revenue Bonds
Rush University Medical Center
Series 2015A
11/15/38 | | | 5.000 | % | | | 20,145,000 | | | | 22,001,160 | | |
Series 2015B
11/15/39 | | | 5.000 | % | | | 6,590,000 | | | | 7,191,601 | | |
Silver Cross Hospital & Medical Centers
Series 2015C
08/15/44 | | | 5.000 | % | | | 9,400,000 | | | | 10,010,624 | | |
Swedish Covenant
Series 2010A
08/15/38 | | | 6.000 | % | | | 12,505,000 | | | | 13,811,772 | | |
Revenue Bonds
CHF-Normal LLC-Illinois State University
Series 2011
04/01/43 | | | 7.000 | % | | | 5,550,000 | | | | 6,386,330 | | |
Northwestern Memorial Hospital
Series 2009A
08/15/30 | | | 5.750 | % | | | 2,000,000 | | | | 2,281,240 | | |
Series 2009B
08/15/30 | | | 5.750 | % | | | 10,000,000 | | | | 11,406,200 | | |
Riverside Health System
Series 2009
11/15/35 | | | 6.250 | % | | | 8,200,000 | | | | 9,475,346 | | |
South Suburban
Series 1992 Escrowed to Maturity
02/15/18 | | | 7.000 | % | | | 1,220,000 | | | | 1,328,495 | | |
Illinois Finance Authority(f)
Subordinated Revenue Bonds
Regency
Series 1990-RMK Escrowed to Maturity
04/15/20 | | | 0.000 | % | | | 68,000,000 | | | | 62,671,520 | | |
Illinois Sports Facilities Authority (The)
Revenue Bonds
State Tax Supported-Capital Appreciation
Series 2001 (AMBAC)(f)
06/15/18 | | | 0.000 | % | | | 4,000,000 | | | | 3,676,320 | | |
Illinois State Toll Highway Authority
Revenue Bonds
Series 2014C
01/01/36 | | | 5.000 | % | | | 5,000,000 | | | | 5,537,900 | | |
01/01/38 | | | 5.000 | % | | | 6,650,000 | | | | 7,326,371 | | |
01/01/39 | | | 5.000 | % | | | 5,000,000 | | | | 5,512,700 | | |
Municipal Bonds (continued)
Issue
Description | | Coupon
Rate | | Principal
Amount ($) | |
Value ($) | |
Lake County School District No. 56 Gurnee
Prerefunded Unlimited General Obligation Bonds
Series 1997 Escrowed to Maturity (NPFGC)
01/01/17 | | | 9.000 | % | | | 1,235,000 | | | | 1,294,428 | | |
Unrefunded Unlimited General Obligation Bonds
Series 1997 (NPFGC)
01/01/17 | | | 9.000 | % | | | 1,480,000 | | | | 1,542,042 | | |
Metropolitan Water Reclamation
District of Greater Chicago
Limited General Obligation Refunding Bonds
Series 2007C
12/01/33 | | | 5.250 | % | | | 13,210,000 | | | | 15,472,477 | | |
Railsplitter Tobacco Settlement Authority
Revenue Bonds
Series 2010
06/01/28 | | | 6.000 | % | | | 15,000,000 | | | | 17,653,650 | | |
Regional Transportation Authority
Revenue Bonds
Series 1994C (NPFGC)
06/01/20 | | | 7.750 | % | | | 4,325,000 | | | | 5,007,139 | | |
Series 2002A (NPFGC)
07/01/31 | | | 6.000 | % | | | 5,400,000 | | | | 7,154,082 | | |
State of Illinois
Revenue Bonds
1st Series 2002 (NPFGC)
06/15/23 | | | 6.000 | % | | | 4,000,000 | | | | 5,002,680 | | |
Unlimited General Obligation Bonds
1st Series 2001 (NPFGC)
11/01/26 | | | 6.000 | % | | | 3,000,000 | | | | 3,420,180 | | |
Series 2004A
03/01/34 | | | 5.000 | % | | | 3,000,000 | | | | 3,001,560 | | |
Series 2006
01/01/31 | | | 5.500 | % | | | 7,985,000 | | | | 8,744,214 | | |
Series 2012
03/01/35 | | | 5.000 | % | | | 2,725,000 | | | | 2,753,803 | | |
03/01/36 | | | 5.000 | % | | | 2,000,000 | | | | 2,017,780 | | |
Series 2013
07/01/38 | | | 5.500 | % | | | 4,125,000 | | | | 4,371,634 | | |
Series 2013A
04/01/36 | | | 5.000 | % | | | 8,000,000 | | | | 8,080,640 | | |
Series 2014
05/01/36 | | | 5.000 | % | | | 2,300,000 | | | | 2,325,829 | | |
02/01/39 | | | 5.000 | % | | | 23,000,000 | | | | 23,110,630 | | |
04/01/39 | | | 5.000 | % | | | 10,000,000 | | | | 10,048,200 | | |
05/01/39 | | | 5.000 | % | | | 6,175,000 | | | | 6,204,949 | | |
Unlimited General Obligation Refunding Bonds
Series 2012
08/01/25 | | | 5.000 | % | | | 3,100,000 | | | | 3,263,959 | | |
Village of Glendale Heights
Refunding Revenue Bonds
Glendale Heights Project
Series 1985B Escrowed to Maturity
12/01/15 | | | 7.100 | % | | | 220,000 | | | | 225,071 | | |
Total | | | | | | | 526,266,008 | | |
The accompanying Notes to Financial Statements are an integral part of this statement.
Annual Report 2015
16
PORTFOLIO OF INVESTMENTS (continued)
July 31, 2015
Municipal Bonds (continued)
Issue
Description | | Coupon
Rate | | Principal
Amount ($) | |
Value ($) | |
INDIANA 1.8% | |
County of Jasper
Refunding Revenue Bonds
Northern Indiana Public Services
Series 1994C (NPFGC)
04/01/19 | | | 5.850 | % | | | 3,000,000 | | | | 3,399,720 | | |
Series 2003-RMKT (AMBAC)
07/01/17 | | | 5.700 | % | | | 2,000,000 | | | | 2,138,820 | | |
Crown Point Multi School Building Corp.
Revenue Bonds
1st Mortgage
Series 2000 (NPFGC)(f)
01/15/19 | | | 0.000 | % | | | 8,165,000 | | | | 7,731,194 | | |
Indiana Finance Authority
Refunding Revenue Bonds
Series 2007A (NPFGC)
06/01/29 | | | 4.500 | % | | | 10,000,000 | | | | 10,207,400 | | |
Sisters of St. Francis Health
Series 2008
11/01/32 | | | 5.375 | % | | | 4,000,000 | | | | 4,424,120 | | |
Revenue Bonds
1st Lien-CWA Authority, Inc.
Series 2011A
10/01/31 | | | 5.250 | % | | | 8,335,000 | | | | 9,631,009 | | |
BHI Senior Living
Series 2011
11/15/31 | | | 5.500 | % | | | 1,175,000 | | | | 1,262,608 | | |
11/15/41 | | | 5.750 | % | | | 5,655,000 | | | | 6,092,527 | | |
Parkview Health System
Series 2009A
05/01/31 | | | 5.750 | % | | | 6,500,000 | | | | 7,393,880 | | |
Indiana Finance Authority(a)
Revenue Bonds
I-69 Development Partners LLC
Series 2014 AMT
09/01/40 | | | 5.250 | % | | | 8,000,000 | | | | 8,535,200 | | |
Indiana Health & Educational Facilities
Financing Authority
Refunding Revenue Bonds
Clarian Health Obligation Group
Series 2006B
02/15/33 | | | 5.000 | % | | | 6,950,000 | | | | 7,090,668 | | |
Indianapolis Airport Authority
Revenue Bonds
Special Facilities-United Air Lines Project
Series 1995A AMT(a)(d)(e)
11/15/31 | | | 6.500 | % | | | 1,022,832 | | | | 11,108 | | |
Vigo County Hospital Authority
Revenue Bonds
Union Hospital, Inc.
Series 2007(b)
09/01/37 | | | 5.700 | % | | | 3,950,000 | | | | 4,095,360 | | |
Total | | | | | | | 72,013,614 | | |
Municipal Bonds (continued)
Issue
Description | | Coupon
Rate | | Principal
Amount ($) | |
Value ($) | |
IOWA 1.0% | |
City of Ames
Revenue Bonds
Mary Greely Medical Center
Series 2011
06/15/36 | | | 5.250 | % | | | 6,000,000 | | | | 6,457,980 | | |
Iowa Finance Authority
Refunding Revenue Bonds
Sunrise Retirement Community
Series 2012
09/01/32 | | | 5.500 | % | | | 1,500,000 | | | | 1,527,195 | | |
09/01/37 | | | 5.500 | % | | | 2,500,000 | | | | 2,523,200 | | |
09/01/43 | | | 5.750 | % | | | 2,630,000 | | | | 2,685,782 | | |
Revenue Bonds
Iowa Fertilizer Co. Project
Series 2013
12/01/25 | | | 5.250 | % | | | 15,000,000 | | | | 16,297,950 | | |
Iowa Student Loan Liquidity Corp.(a)
Revenue Bonds
Senior Series 2011A-2 AMT
12/01/26 | | | 5.600 | % | | | 5,615,000 | | | | 6,062,684 | | |
12/01/27 | | | 5.700 | % | | | 3,865,000 | | | | 4,149,928 | | |
Total | | | | | | | 39,704,719 | | |
KANSAS 1.1% | |
City of Overland Park
Revenue Bonds
Prairiefire Lionsgate Project
Series 2012
12/15/29 | | | 5.250 | % | | | 11,000,000 | | | | 11,072,820 | | |
University of Kansas Hospital Authority
Improvement Refunding Revenue Bonds
Kansas University Health System
Series 2015
09/01/45 | | | 5.000 | % | | | 29,000,000 | | | | 31,968,150 | | |
Total | | | | | | | 43,040,970 | | |
KENTUCKY 1.3% | |
Kentucky Economic Development Finance Authority
Refunding Revenue Bonds
Owensboro Medical Health System
Series 2010B
03/01/40 | | | 6.375 | % | | | 5,800,000 | | | | 6,609,912 | | |
Revenue Bonds
Louisville Arena
Subordinated Series 2008A-1 (AGM)
12/01/33 | | | 6.000 | % | | | 3,200,000 | | | | 3,412,928 | | |
12/01/38 | | | 6.000 | % | | | 2,850,000 | | | | 3,035,678 | | |
Owensboro Medical Health System
Series 2010A
03/01/45 | | | 6.500 | % | | | 14,550,000 | | | | 16,634,578 | | |
The accompanying Notes to Financial Statements are an integral part of this statement.
Annual Report 2015
17
PORTFOLIO OF INVESTMENTS (continued)
July 31, 2015
Municipal Bonds (continued)
Issue
Description | | Coupon
Rate | | Principal
Amount ($) | |
Value ($) | |
Kentucky Municipal Power Agency
Refunding Revenue Bonds
Series 2015A
09/01/42 | | | 5.000 | % | | | 6,600,000 | | | | 7,177,302 | | |
Louisville & Jefferson County Metropolitan Government
Prerefunded 02/01/18 Revenue Bonds
Jewish Hospital St. Mary's Healthcare
Series 2008
02/01/27 | | | 5.750 | % | | | 14,000,000 | | | | 15,711,640 | | |
Total | | | | | | | 52,582,038 | | |
LOUISIANA 3.1% | |
Louisiana Housing Corp.
Revenue Bonds
Homeownership Program
Series 2008A (GNMA/FHLMC)
12/01/23 | | | 4.875 | % | | | 560,000 | | | | 586,947 | | |
Louisiana Local Government Environmental
Facilities & Community Development Authority
Revenue Bonds
Westlake Chemical Corp.
Series 2010A-2
11/01/35 | | | 6.500 | % | | | 6,250,000 | | | | 7,438,688 | | |
Louisiana Public Facilities Authority
Unrefunded Revenue Bonds
Tulane University Project
Series 2007 (NPFGC)
02/15/26 | | | 5.000 | % | | | 905,000 | | | | 958,829 | | |
Louisiana Public Facilities Authority(a)
Revenue Bonds
Impala Warehousing LLC Project
Series 2013 AMT
07/01/36 | | | 6.500 | % | | | 25,000,000 | | | | 27,952,000 | | |
Louisiana Pellets, Inc. Project
Series 2013 AMT
07/01/39 | | | 10.500 | % | | | 10,000,000 | | | | 10,890,300 | | |
Louisiana Public Facilities Authority(a)(b)
Revenue Bonds
Louisiana Pellets, Inc. Project
Series 2015 AMT
07/01/39 | | | 7.750 | % | | | 10,000,000 | | | | 9,913,100 | | |
New Orleans Aviation Board
Revenue Bonds
Consolidated Rental Car
Series 2009A
01/01/30 | | | 6.250 | % | | | 5,250,000 | | | | 5,905,463 | | |
01/01/40 | | | 6.500 | % | | | 20,400,000 | | | | 23,156,244 | | |
New Orleans Aviation Board(a)
Revenue Bonds
Series 2015B AMT
01/01/45 | | | 5.000 | % | | | 10,000,000 | | | | 10,688,800 | | |
Municipal Bonds (continued)
Issue
Description | | Coupon
Rate | | Principal
Amount ($) | |
Value ($) | |
Parish of St. Charles
Revenue Bonds
Valero Energy Corp.
Series 2010(g)
12/01/40 | | | 4.000 | % | | | 7,900,000 | | | | 8,576,793 | | |
Parish of St. John the Baptist
Revenue Bonds
Marathon Oil Corp.
Series 2007A
06/01/37 | | | 5.125 | % | | | 18,600,000 | | | | 19,349,580 | | |
Total | | | | | | | 125,416,744 | | |
MARYLAND 1.6% | |
City of Brunswick
Special Tax Bonds
Brunswick Crossing Special Taxing
Series 2006
07/01/36 | | | 5.500 | % | | | 6,587,000 | | | | 6,630,672 | | |
County of Baltimore
Revenue Bonds
Oak Crest Village, Inc. Facility
Series 2007A
01/01/37 | | | 5.000 | % | | | 5,000,000 | | | | 5,135,450 | | |
Maryland Economic Development Corp.
Refunding Revenue Bonds
CNX Marine Terminals, Inc.
Series 2010
09/01/25 | | | 5.750 | % | | | 4,000,000 | | | | 4,221,600 | | |
Revenue Bonds
Salisbury University Project
Series 2012
06/01/30 | | | 5.000 | % | | | 400,000 | | | | 423,936 | | |
Towson University Project
Senior Series 2012
07/01/29 | | | 5.000 | % | | | 650,000 | | | | 696,625 | | |
University of Maryland College Park Projects
Series 2008
06/01/33 | | | 5.750 | % | | | 1,600,000 | | | | 1,736,112 | | |
Maryland Health & Higher Educational
Facilities Authority
Prerefunded 01/01/18 Revenue Bonds
Washington County Hospital
Series 2008
01/01/33 | | | 5.750 | % | | | 3,495,000 | | | | 3,877,073 | | |
Prerefunded 07/01/19 Revenue Bonds
Anne Arundel Health System
Series 2009A
07/01/39 | | | 6.750 | % | | | 5,000,000 | | | | 6,075,700 | | |
Refunding Revenue Bonds
MedStar Health, Inc.
Series 2015
08/15/42 | | | 5.000 | % | | | 15,825,000 | | | | 17,121,700 | | |
The accompanying Notes to Financial Statements are an integral part of this statement.
Annual Report 2015
18
PORTFOLIO OF INVESTMENTS (continued)
July 31, 2015
Municipal Bonds (continued)
Issue
Description | | Coupon
Rate | | Principal
Amount ($) | |
Value ($) | |
Meritus Medical Center Issue
Series 2015
07/01/45 | | | 5.000 | % | | | 3,000,000 | | | | 3,195,420 | | |
Western Maryland Health System
Series 2014
07/01/34 | | | 5.250 | % | | | 6,885,000 | | | | 7,633,881 | | |
Revenue Bonds
University of Maryland Medical System
Series 2005 (AMBAC)
07/01/28 | | | 5.250 | % | | | 3,000,000 | | | | 3,283,920 | | |
Resolution Trust Corp.
Pass-Through Certificates
Series 1993A(d)
12/01/16 | | | 8.500 | % | | | 6,615,223 | | | | 6,605,366 | | |
Total | | | | | | | 66,637,455 | | |
MASSACHUSETTS 4.7% | |
Berkshire Wind Power Cooperative Corp.
Revenue Bonds
Series 2010-1
07/01/30 | | | 5.250 | % | | | 1,000,000 | | | | 1,115,630 | | |
Boston Industrial Development Financing Authority
Revenue Bonds
Crosstown Center Project
Senior Series 2002 AMT(a)(d)
09/01/35 | | | 6.500 | % | | | 5,030,000 | | | | 3,552,739 | | |
Boston Water & Sewer Commission
Refunding Revenue Bonds
General
Senior Series 2009A
11/01/28 | | | 5.000 | % | | | 1,250,000 | | | | 1,415,575 | | |
Revenue Bonds
General
Senior Series 1993A
11/01/19 | | | 5.250 | % | | | 3,400,000 | | | | 3,713,752 | | |
Commonwealth of Massachusetts
Refunding Revenue Bonds
Series 2005 (NPFGC)
01/01/27 | | | 5.500 | % | | | 4,500,000 | | | | 5,590,485 | | |
01/01/30 | | | 5.500 | % | | | 2,500,000 | | | | 3,133,425 | | |
Massachusetts Bay Transportation Authority
Refunding Revenue Bonds
General Transportation System
Series 1994C (AGM)
03/01/19 | | | 7.000 | % | | | 1,215,000 | | | | 1,298,847 | | |
Revenue Bonds
Senior Series 2005B (NPFGC)
07/01/26 | | | 5.500 | % | | | 1,500,000 | | | | 1,911,945 | | |
07/01/29 | | | 5.500 | % | | | 2,000,000 | | | | 2,583,920 | | |
Senior Series 2008B
07/01/27 | | | 5.250 | % | | | 710,000 | | | | 893,436 | | |
Municipal Bonds (continued)
Issue
Description | | Coupon
Rate | | Principal
Amount ($) | |
Value ($) | |
Unrefunded Revenue Bonds
General Transportation
Series 1991 (NPFGC)
03/01/21 | | | 7.000 | % | | | 625,000 | | | | 747,788 | | |
Massachusetts Clean Water Trust (The)
Refunding Revenue Bonds
Pool Program
Series 2006
08/01/30 | | | 5.250 | % | | | 1,000,000 | | | | 1,274,360 | | |
Revenue Bonds
MWRA Program
Subordinated Series 1999A
08/01/17 | | | 6.000 | % | | | 12,445,000 | | | | 13,762,303 | | |
Massachusetts Department of Transportation
Revenue Bonds
Capital Appreciation
Senior Series 1997C (NPFGC)(f)
01/01/18 | | | 0.000 | % | | | 4,700,000 | | | | 4,564,969 | | |
Massachusetts Development Finance Agency
Prerefunded 07/01/22 Revenue Bonds
Boston Medical Center
Series 2012
07/01/29 | | | 5.000 | % | | | 80,000 | | | | 95,803 | | |
Revenue Bonds
Adventcare Project
Series 2007A
10/15/28 | | | 6.650 | % | | | 5,000,000 | | | | 5,200,800 | | |
Boston College
Series 2009Q-2
07/01/29 | | | 5.000 | % | | | 1,455,000 | | | | 1,634,416 | | |
Boston University
Series 2005T-1 (AMBAC)
10/01/39 | | | 5.000 | % | | | 2,000,000 | | | | 2,013,120 | | |
Covenant Health System Obligation Group
Series 2012
07/01/31 | | | 5.000 | % | | | 1,000,000 | | | | 1,083,110 | | |
Education-Dexter School Project
Series 2007
05/01/26 | | | 4.500 | % | | | 1,600,000 | | | | 1,633,328 | | |
Evergreen Center, Inc.
Series 2005
01/01/35 | | | 5.500 | % | | | 750,000 | | | | 750,428 | | |
Foxborough Regional Charter School
Series 2010A
07/01/42 | | | 7.000 | % | | | 1,000,000 | | | | 1,120,810 | | |
Linden Ponds, Inc. Facility
Series 2011A-2
11/15/46 | | | 5.500 | % | | | 154,325 | | | | 131,423 | | |
Partners Healthcare
Series 2012L
07/01/36 | | | 5.000 | % | | | 1,000,000 | | | | 1,140,230 | | |
WGBH Educational Foundation
Series 2002A (AMBAC)
01/01/42 | | | 5.750 | % | | | 2,000,000 | | | | 2,406,000 | | |
The accompanying Notes to Financial Statements are an integral part of this statement.
Annual Report 2015
19
PORTFOLIO OF INVESTMENTS (continued)
July 31, 2015
Municipal Bonds (continued)
Issue
Description | | Coupon
Rate | | Principal
Amount ($) | |
Value ($) | |
Unrefunded Revenue Bonds
Boston Medical Center
Series 2012
07/01/29 | | | 5.000 | % | | | 425,000 | | | | 461,673 | | |
Massachusetts Development Finance Agency(b)
Refunding Revenue Bonds
1st Mortgage-VOA Concord
Series 2007
11/01/41 | | | 5.200 | % | | | 1,145,000 | | | | 1,113,272 | | |
Massachusetts Development Finance Agency(d)(f)
Revenue Bonds
Linden Ponds, Inc. Facility
Series 2011B
11/15/56 | | | 0.000 | % | | | 767,588 | | | | 4,506 | | |
Massachusetts Educational Financing Authority
Revenue Bonds
Series 2009I
01/01/28 | | | 6.000 | % | | | 525,000 | | | | 555,203 | | |
Massachusetts Educational Financing Authority(a)
Revenue Bonds
Education Loan
Series 2014-I AMT
01/01/25 | | | 5.000 | % | | | 12,450,000 | | | | 13,873,408 | | |
01/01/27 | | | 5.000 | % | | | 3,000,000 | | | | 3,295,110 | | |
Issue I
Series 2010B AMT
01/01/31 | | | 5.700 | % | | | 5,230,000 | | | | 5,597,408 | | |
Series 2008H (AGM) AMT
01/01/30 | | | 6.350 | % | | | 5,265,000 | | | | 5,547,783 | | |
Series 2011J AMT
07/01/33 | | | 5.625 | % | | | 1,880,000 | | | | 2,040,514 | | |
Series 2012J AMT
07/01/25 | | | 4.625 | % | | | 8,350,000 | | | | 8,850,248 | | |
07/01/28 | | | 4.900 | % | | | 805,000 | | | | 847,190 | | |
Massachusetts Health & Educational Facilities Authority
Revenue Bonds
Boston College
Series 2008M-2
06/01/35 | | | 5.500 | % | | | 22,000,000 | | | | 28,549,840 | | |
Caregroup, Inc.
Series 1998B-2 (NPFGC)
02/01/28 | | | 5.375 | % | | | 1,380,000 | | | | 1,523,161 | | |
Series 2008E-1
07/01/33 | | | 5.125 | % | | | 3,000,000 | | | | 3,192,240 | | |
Harvard University
Series 2009A
11/15/36 | | | 5.500 | % | | | 1,000,000 | | | | 1,138,120 | | |
Massachusetts Eye & Ear Infirmary
Series 2010C
07/01/35 | | | 5.375 | % | | | 1,000,000 | | | | 1,080,700 | | |
Massachusetts Institute of Technology
Series 2004M
07/01/25 | | | 5.250 | % | | | 500,000 | | | | 631,645 | | |
Municipal Bonds (continued)
Issue
Description | | Coupon
Rate | | Principal
Amount ($) | |
Value ($) | |
Milford Regional Medical Center
Series 2007E
07/15/22 | | | 5.000 | % | | | 1,250,000 | | | | 1,302,963 | | |
07/15/32 | | | 5.000 | % | | | 4,720,000 | | | | 4,798,966 | | |
07/15/37 | | | 5.000 | % | | | 500,000 | | | | 506,580 | | |
Partners Healthcare
Series 2010J-1
07/01/34 | | | 5.000 | % | | | 11,400,000 | | | | 12,784,986 | | |
Springfield College
Series 2010
10/15/40 | | | 5.625 | % | | | 4,500,000 | | | | 4,807,125 | | |
Suffolk University
Series 2009A
07/01/30 | | | 6.250 | % | | | 1,000,000 | | | | 1,156,880 | | |
Tufts University
Series 2009M
02/15/28 | | | 5.500 | % | | | 1,000,000 | | | | 1,266,100 | | |
Unrefunded Revenue Bonds
South Shore
Series 1999F
07/01/29 | | | 5.750 | % | | | 1,845,000 | | | | 1,852,731 | | |
Massachusetts Housing Finance Agency
Revenue Bonds
Series 2009-147 (FNMA)
06/01/28 | | | 4.800 | % | | | 5,000 | | | | 5,061 | | |
Massachusetts Housing Finance Agency(a)
Revenue Bonds
Housing
Series 2011A AMT
12/01/36 | | | 5.250 | % | | | 1,185,000 | | | | 1,228,359 | | |
Series 2010C AMT
12/01/30 | �� | | 5.000 | % | | | 1,000,000 | | | | 1,034,610 | | |
Massachusetts Port Authority
Revenue Bonds
Bosfuel Project
Series 2007 (NPFGC) AMT(a)
07/01/32 | | | 5.000 | % | | | 2,000,000 | | | | 2,104,320 | | |
Massachusetts State College Building Authority
Revenue Bonds
Series 2008A (AGM)
05/01/38 | | | 5.000 | % | | | 3,000,000 | | | | 3,269,640 | | |
Massachusetts State College Building Authority(f)
Revenue Bonds
Capital Appreciation
Senior Series 1999A Escrowed to Maturity (NPFGC)
05/01/19 | | | 0.000 | % | | | 7,710,000 | | | | 7,299,828 | | |
05/01/23 | | | 0.000 | % | | | 3,000,000 | | | | 2,506,410 | | |
Massachusetts Water Resources Authority
Revenue Bonds
Series 1992A Escrowed to Maturity
07/15/19 | | | 6.500 | % | | | 3,240,000 | | | | 3,598,474 | | |
Unrefunded Revenue Bonds
General
Series 1993C (AMBAC/TCRS)
12/01/15 | | | 5.250 | % | | | 105,000 | | | | 106,597 | | |
The accompanying Notes to Financial Statements are an integral part of this statement.
Annual Report 2015
20
PORTFOLIO OF INVESTMENTS (continued)
July 31, 2015
Municipal Bonds (continued)
Issue
Description | | Coupon
Rate | | Principal
Amount ($) | |
Value ($) | |
Metropolitan Boston Transit Parking Corp.
Revenue Bonds
Series 2011
07/01/36 | | | 5.250 | % | | | 3,000,000 | | | | 3,435,480 | | |
Total | | | | | | | 194,135,773 | | |
MICHIGAN 1.4% | |
Allen Academy
Refunding Revenue Bonds
Public School Academy
Series 2013
06/01/22 | | | 5.500 | % | | | 2,000,000 | | | | 2,042,040 | | |
City of Detroit Sewage Disposal System
Refunding Revenue Bonds
Senior Lien
Series 2012A
07/01/39 | | | 5.250 | % | | | 11,925,000 | | | | 12,720,994 | | |
City of Detroit Water Supply System
Revenue Bonds
Senior Lien
Series 2003A (NPFGC)
07/01/34 | | | 5.000 | % | | | 395,000 | | | | 396,284 | | |
Series 2005A (NPFGC)
07/01/27 | | | 5.000 | % | | | 1,290,000 | | | | 1,307,750 | | |
Series 2011A
07/01/36 | | | 5.000 | % | | | 4,105,000 | | | | 4,266,614 | | |
07/01/41 | | | 5.250 | % | | | 8,765,000 | | | | 9,223,673 | | |
Grand Traverse Academy
Refunding Revenue Bonds
Series 2007
11/01/17 | | | 5.000 | % | | | 390,000 | | | | 397,531 | | |
11/01/22 | | | 5.000 | % | | | 750,000 | | | | 754,695 | | |
11/01/32 | | | 4.750 | % | | | 1,170,000 | | | | 1,074,165 | | |
Grand Traverse County Hospital Finance Authority
Revenue Bonds
Munson Healthcare
Series 2014A
07/01/47 | | | 5.000 | % | | | 1,200,000 | | | | 1,283,640 | | |
Michigan Finance Authority
Refunding Revenue Bonds
Senior Lien-Detroit Water & Sewer
Series 2014C-6
07/01/33 | | | 5.000 | % | | | 1,070,000 | | | | 1,138,812 | | |
Revenue Bonds
Senior Lien-Detroit Water & Sewer
Series 2014C-1
07/01/44 | | | 5.000 | % | | | 2,000,000 | | | | 2,072,020 | | |
Michigan Finance Authority(a)
Revenue Bonds
Senior Lien-Detroit Water & Sewer
Series 2014C-2 AMT
07/01/44 | | | 5.000 | % | | | 1,500,000 | | | | 1,539,615 | | |
Municipal Bonds (continued)
Issue
Description | | Coupon
Rate | | Principal
Amount ($) | |
Value ($) | |
Michigan Strategic Fund
Refunding Revenue Bonds
Collateral Detroit Fund-Pollution
Series 1991BB (AMBAC)
05/01/21 | | | 7.000 | % | | | 2,505,000 | | | | 3,162,437 | | |
Paw Paw Public Schools
Unlimited General Obligation Refunding Bonds
Series 1998 (NPFGC) (Qualified School Board Loan Fund)
05/01/25 | | | 5.000 | % | | | 1,020,000 | | | | 1,243,696 | | |
Royal Oak Hospital Finance Authority
Refunding Revenue Bonds
William Beaumont Hospital
Series 2014D
09/01/39 | | | 5.000 | % | | | 9,425,000 | | | | 10,146,295 | | |
St. Johns Public Schools
Unlimited General Obligation Refunding Bonds
Series 1998 (NPFGC) (Qualified School Bond Loan Fund)
05/01/25 | | | 5.100 | % | | | 1,790,000 | | | | 2,083,542 | | |
Williamston Community School District
Unlimited General Obligation Bonds
Series 1996 (NPFGC) (Qualified School Bond Loan Fund)
05/01/25 | | | 5.500 | % | | | 1,000,000 | | | | 1,146,560 | | |
Total | | | | | | | 56,000,363 | | |
MINNESOTA 4.1% | |
City of Blaine
Refunding Revenue Bonds
Crest View Senior Community Project
Series 2015
07/01/45 | | | 6.125 | % | | | 11,775,000 | | | | 11,835,052 | | |
City of Minneapolis
Revenue Bonds
Fairview Health Services
Series 2008A
11/15/32 | | | 6.750 | % | | | 7,500,000 | | | | 8,637,600 | | |
City of St. Louis Park
Prerefunded 07/01/18 Revenue Bonds
Park Nicollet Health Services
Series 2008C
07/01/23 | | | 5.500 | % | | | 22,775,000 | | | | 25,762,852 | | |
07/01/30 | | | 5.750 | % | | | 3,200,000 | | | | 3,642,784 | | |
Prerefunded 07/01/19 Revenue Bonds
Park Nicollet Health Services
Series 2009
07/01/39 | | | 5.750 | % | | | 16,825,000 | | | | 19,752,213 | | |
County of Meeker
Revenue Bonds
Hospital Facilities Memorial Hospital Project
Series 2007
11/01/37 | | | 5.750 | % | | | 1,750,000 | | | | 1,802,115 | | |
The accompanying Notes to Financial Statements are an integral part of this statement.
Annual Report 2015
21
PORTFOLIO OF INVESTMENTS (continued)
July 31, 2015
Municipal Bonds (continued)
Issue
Description | | Coupon
Rate | | Principal
Amount ($) | |
Value ($) | |
Perham Hospital District
Revenue Bonds
Perham Memorial Hospital & Home
Series 2010
03/01/35 | | | 6.350 | % | | | 4,000,000 | | | | 4,322,120 | | |
03/01/40 | | | 6.500 | % | | | 2,800,000 | | | | 3,036,712 | | |
Southern Minnesota Municipal Power Agency(f)
Revenue Bonds
Capital Appreciation
Series 1994A (NPFGC)
01/01/22 | | | 0.000 | % | | | 27,500,000 | | | | 23,521,850 | | |
01/01/23 | | | 0.000 | % | | | 26,500,000 | | | | 21,751,730 | | |
01/01/25 | | | 0.000 | % | | | 17,500,000 | | | | 13,233,150 | | |
St. Paul Housing & Redevelopment Authority
Prerefunded 11/15/15 Revenue Bonds
Healtheast Project
Series 2005
11/15/25 | | | 6.000 | % | | | 3,500,000 | | | | 3,557,645 | | |
11/15/30 | | | 6.000 | % | | | 10,000,000 | | | | 10,164,700 | | |
11/15/35 | | | 6.000 | % | | | 11,500,000 | | | | 11,689,405 | | |
Prerefunded 11/15/16 Revenue Bonds
HealthPartners Obligation Group Project
Series 2006
05/15/36 | | | 5.250 | % | | | 4,550,000 | | | | 4,827,141 | | |
Refunding Revenue Bonds
HealthEast Care System Project
Series 2015
11/15/30 | | | 5.000 | % | | | 900,000 | | | | 969,732 | | |
11/15/40 | | | 5.000 | % | | | 935,000 | | | | 988,099 | | |
Total | | | | | | | 169,494,900 | | |
MISSISSIPPI 0.4% | |
County of Lowndes
Refunding Revenue Bonds
Weyerhaeuser Co. Project
Series 1992A
04/01/22 | | | 6.800 | % | | | 2,470,000 | | | | 3,080,535 | | |
Medical Center Educational Building Corp.
Refunding Revenue Bonds
University of Mississippi Medical Center
Series 1998B (AMBAC)
12/01/23 | | | 5.500 | % | | | 5,300,000 | | | | 6,134,061 | | |
Mississippi Business Finance Corp.
Revenue Bonds
Series 2009A
05/01/24 | | | 4.700 | % | | | 6,090,000 | | | | 6,468,493 | | |
Rankin County Five Lakes Utility District
Series 1994(d)
07/15/37 | | | 7.000 | % | | | 445,000 | | | | 445,267 | | |
Total | | | | | | | 16,128,356 | | |
Municipal Bonds (continued)
Issue
Description | | Coupon
Rate | | Principal
Amount ($) | |
Value ($) | |
MISSOURI 1.6% | |
City of Manchester
Refunding Tax Allocation Bonds
Highway 141/Manchester Road Project
Series 2010
11/01/25 | | | 6.000 | % | | | 1,835,000 | | | | 1,928,879 | | |
11/01/39 | | | 6.875 | % | | | 1,500,000 | | | | 1,582,335 | | |
Health & Educational Facilities Authority of the
State of Missouri
Revenue Bonds
Lutheran Senior Services
Senior Series 2010
02/01/42 | | | 5.500 | % | | | 2,000,000 | | | | 2,143,700 | | |
Series 2011
02/01/31 | | | 5.750 | % | | | 1,730,000 | | | | 1,888,849 | | |
02/01/41 | | | 6.000 | % | | | 2,600,000 | | | | 2,837,042 | | |
Series 2014
02/01/35 | | | 5.000 | % | | | 7,350,000 | | | | 7,788,280 | | |
02/01/44 | | | 5.000 | % | | | 12,725,000 | | | | 13,362,904 | | |
Industrial Development Authority of the
City of St. Louis (The)
Revenue Bonds
Convention Center Hotel
Series 2000 (AMBAC)(f)
07/15/18 | | | 0.000 | % | | | 2,000,000 | | | | 1,863,560 | | |
Kirkwood Industrial Development Authority
Revenue Bonds
Aberdeen Heights
Series 2010A
05/15/39 | | | 8.250 | % | | | 12,000,000 | | | | 13,652,280 | | |
Missouri Development Finance Board
Revenue Bonds
Procter & Gamble Paper Products
Series 1999 AMT(a)
03/15/29 | | | 5.200 | % | | | 6,385,000 | | | | 7,597,192 | | |
St. Louis Area Housing Finance Corp.
Revenue Bonds
Wellington Arms III Project
Series 1979
01/01/21 | | | 7.375 | % | | | 825,145 | | | | 826,573 | | |
St. Louis County Industrial Development Authority
Revenue Bonds
Friendship Village Sunset Hills
Series 2013A
09/01/33 | | | 5.500 | % | | | 2,750,000 | �� | | | 3,008,555 | | |
St. Andrews Residence for Seniors
Series 2007A
12/01/41 | | | 6.375 | % | | | 7,000,000 | | | | 7,226,800 | | |
University of Missouri
Unrefunded Revenue Bonds
System Facilities
Series 2006A
11/01/26 | | | 5.000 | % | | | 740,000 | | | | 748,799 | | |
Total | | | | | | | 66,455,748 | | |
The accompanying Notes to Financial Statements are an integral part of this statement.
Annual Report 2015
22
PORTFOLIO OF INVESTMENTS (continued)
July 31, 2015
Municipal Bonds (continued)
Issue
Description | | Coupon
Rate | | Principal
Amount ($) | |
Value ($) | |
NEBRASKA 1.2% | |
Douglas County Hospital Authority No. 2
Revenue Bonds
Health Facilities-Immanuel Obligation Group
Series 2010
01/01/40 | | | 5.625 | % | | | 875,000 | | | | 954,188 | | |
Madonna Rehabilitation Hospital
Series 2014
05/15/28 | | | 5.000 | % | | | 2,025,000 | | | | 2,231,469 | | |
05/15/29 | | | 5.000 | % | | | 2,125,000 | | | | 2,327,215 | | |
05/15/30 | | | 5.000 | % | | | 2,000,000 | | | | 2,190,320 | | |
05/15/36 | | | 5.000 | % | | | 1,000,000 | | | | 1,071,130 | | |
05/15/44 | | | 5.000 | % | | | 6,400,000 | | | | 6,787,136 | | |
Douglas County Hospital Authority No. 3
Refunding Revenue Bonds
Health Facilities - Nebraska Methodist Health System
Series 2015
11/01/45 | | | 5.000 | % | | | 12,500,000 | | | | 13,465,625 | | |
Madison County Hospital Authority No. 1
Revenue Bonds
Faith Regional Health Services Project
Series 2008A-1
07/01/33 | | | 6.000 | % | | | 11,500,000 | | | | 12,562,025 | | |
Nebraska Elementary & Secondary School Finance Authority
Revenue Bonds
Boys Town Project
Series 2008
09/01/28 | | | 4.750 | % | | | 6,800,000 | | | | 7,409,076 | | |
Total | | | | | | | 48,998,184 | | |
NEVADA 1.4% | |
Carson City
Refunding Revenue Bonds
Carson Tahoe Regional Medical Center
Series 2012
09/01/33 | | | 5.000 | % | | | 2,500,000 | | | | 2,660,725 | | |
City of Sparks
Tax Anticipation Revenue Bonds
Senior Sales
Series 2008A(b)
06/15/28 | | | 6.750 | % | | | 2,000,000 | | | | 2,149,240 | | |
Clark County Water Reclamation District
Limited General Obligation Bonds
Series 2009A
07/01/34 | | | 5.250 | % | | | 12,000,000 | | | | 13,580,640 | | |
County of Clark
Revenue Bonds
Las Vegas-McCarran International Airport
Series 2010A
07/01/34 | | | 5.125 | % | | | 18,750,000 | | | | 20,903,625 | | |
Municipal Bonds (continued)
Issue
Description | | Coupon
Rate | | Principal
Amount ($) | |
Value ($) | |
County of Clark(a)
Revenue Bonds
Southwest Gas Corp. Project
Series 2005A (AMBAC) AMT
10/01/35 | | | 4.850 | % | | | 5,000,000 | | | | 5,006,250 | | |
Henderson Local Improvement Districts
Special Assessment Bonds
No. T-18
Series 2006T-18
09/01/35 | | | 5.300 | % | | | 7,650,000 | | | | 5,772,690 | | |
Las Vegas Valley Water District
Limited General Obligation Bonds
Water Improvement
Series 2006A (AGM)
06/01/24 | | | 5.000 | % | | | 4,095,000 | | | | 4,249,668 | | |
State of Nevada Department of Business & Industry(a)(g)
Revenue Bonds
Republic Services, Inc. Project
Series 2003 AMT
12/01/26 | | | 5.625 | % | | | 2,000,000 | | | | 2,180,760 | | |
State of Nevada Department of Business & Industry(b)
Revenue Bonds
Somerset Academy
Series 2015A
12/15/35 | | | 5.000 | % | | | 1,025,000 | | | | 1,006,950 | | |
Total | | | | | | | 57,510,548 | | |
NEW JERSEY 3.0% | |
Middlesex County Improvement Authority(d)(e)
Revenue Bonds
Heldrich Center Hotel
Series 2005C
01/01/37 | | | 8.750 | % | | | 1,500,000 | | | | 73,875 | | |
Subordinated Revenue Bonds
Heldrich Center Hotel
Series 2005B
01/01/37 | | | 6.250 | % | | | 4,000,000 | | | | 194,800 | | |
New Jersey Economic Development Authority
Refunding Revenue Bonds
School Facilities Construction
Series 2005N-1 (AGM)
09/01/25 | | | 5.500 | % | | | 23,990,000 | | | | 27,858,867 | | |
Series 2005N-1 (NPFGC)
09/01/27 | | | 5.500 | % | | | 5,000,000 | | | | 5,714,600 | | |
Revenue Bonds
Lions Gate Project
Series 2014
01/01/34 | | | 5.000 | % | | | 1,000,000 | | | | 1,029,730 | | |
01/01/44 | | | 5.250 | % | | | 2,000,000 | | | | 2,074,960 | | |
MSU Student Housing Project-Provident
Series 2010
06/01/31 | | | 5.750 | % | | | 4,350,000 | | | | 4,849,076 | | |
06/01/42 | | | 5.875 | % | | | 14,500,000 | | | | 16,062,520 | | |
The accompanying Notes to Financial Statements are an integral part of this statement.
Annual Report 2015
23
PORTFOLIO OF INVESTMENTS (continued)
July 31, 2015
Municipal Bonds (continued)
Issue
Description | | Coupon
Rate | | Principal
Amount ($) | |
Value ($) | |
Provident Group-Rowan Properties LLC
Series 2015
01/01/48 | | | 5.000 | % | | | 7,200,000 | | | | 7,496,064 | | |
New Jersey Economic Development Authority(a)
Refunding Revenue Bonds
Series 2006B AMT
01/01/37 | | | 6.875 | % | | | 6,980,000 | | | | 7,005,268 | | |
Revenue Bonds
Continental Airlines, Inc. Project
Series 1999 AMT
09/15/23 | | | 5.125 | % | | | 5,000,000 | | | | 5,444,750 | | |
09/15/29 | | | 5.250 | % | | | 2,500,000 | | | | 2,714,375 | | |
New Jersey Environmental Infrastructure Trust
Prerefunded 09/01/16 Revenue Bonds
Environmental
Series 2007
09/01/22 | | | 5.000 | % | | | 35,000 | | | | 36,767 | | |
Series 2007A
09/01/22 | | | 5.000 | % | | | 10,000 | | | | 10,505 | | |
09/01/22 | | | 5.000 | % | | | 5,000 | | | | 5,252 | | |
New Jersey Health Care Facilities Financing Authority
Revenue Bonds
St. Josephs Healthcare Systems
Series 2008
07/01/38 | | | 6.625 | % | | | 4,000,000 | | | | 4,455,280 | | |
Virtua Health
Series 2009
07/01/33 | | | 5.750 | % | | | 750,000 | | | | 844,268 | | |
New Jersey State Turnpike Authority
Refunding Revenue Bonds
Series 2005A (AGM)
01/01/30 | | | 5.250 | % | | | 2,000,000 | | | | 2,452,260 | | |
Revenue Bonds
Series 2004C-2 (AMBAC)
01/01/25 | | | 5.500 | % | | | 2,500,000 | | | | 3,064,575 | | |
New Jersey Transportation Trust Fund Authority
Revenue Bonds
Transportation System
Series 1999A
06/15/20 | | | 5.750 | % | | | 4,150,000 | | | | 4,642,688 | | |
Series 2006A
12/15/23 | | | 5.500 | % | | | 3,000,000 | | | | 3,347,610 | | |
Series 2011B
06/15/31 | | | 5.500 | % | | | 7,250,000 | | | | 7,743,362 | | |
Union County Utilities Authority
Refunding Revenue Bonds
Covanta Union
Series 2011 AMT(a)
12/01/31 | | | 5.250 | % | | | 15,000,000 | | | | 16,318,950 | | |
Total | | | | | | | 123,440,402 | | |
Municipal Bonds (continued)
Issue
Description | | Coupon
Rate | | Principal
Amount ($) | |
Value ($) | |
NEW MEXICO 0.4% | |
New Mexico Hospital Equipment Loan Council
Prerefunded 08/01/18 Revenue Bonds
Presbyterian Healthcare Services
Series 2008
08/01/32 | | | 6.375 | % | | | 2,730,000 | | | | 3,165,080 | | |
08/01/32 | | | 6.375 | % | | | 5,920,000 | | | | 6,859,682 | | |
Revenue Bonds
Presbyterian Healthcare Services
Series 2009
08/01/39 | | | 5.000 | % | | | 6,500,000 | | | | 7,089,030 | | |
Total | | | | | | | 17,113,792 | | |
NEW YORK 4.6% | |
Brooklyn Arena Local Development Corp.
Revenue Bonds
Barclays Center Project
Series 2009
07/15/30 | | | 6.000 | % | | | 6,500,000 | | | | 7,441,720 | | |
Build NYC Resource Corp.
Refunding Revenue Bonds
Pratt Paper, Inc. Project
Series 2014 AMT(a)(b)
01/01/25 | | | 4.500 | % | | | 500,000 | | | | 530,120 | | |
Housing Development Corp.
Revenue Bonds
Series 2005F-1
11/01/25 | | | 4.650 | % | | | 4,160,000 | | | | 4,191,242 | | |
Long Island Power Authority
Refunding Revenue Bonds
Series 2014A
09/01/44 | | | 5.000 | % | | | 2,250,000 | | | | 2,461,117 | | |
Revenue Bonds
Series 2008A
05/01/33 | | | 6.000 | % | | | 2,725,000 | | | | 3,148,547 | | |
Metropolitan Transportation Authority
Revenue Bonds
Transportation
Series 2007A (AGM)
11/15/33 | | | 5.000 | % | | | 12,000,000 | | | | 12,941,640 | | |
New York City Industrial Development Agency
Revenue Bonds
Pilot-Queens Baseball Stadium
Series 2006 (AMBAC)
01/01/24 | | | 5.000 | % | | | 3,000,000 | | | | 3,109,230 | | |
Pilot-Yankee Stadium-Payment I
Series 2006I (FGIC)
03/01/46 | | | 5.000 | % | | | 2,000,000 | | | | 2,056,800 | | |
New York City Industrial Development Agency(a)(g)
Revenue Bonds
Terminal One Group Association Project
Series 2005 AMT
01/01/24 | | | 5.500 | % | | | 5,500,000 | | | | 5,609,395 | | |
The accompanying Notes to Financial Statements are an integral part of this statement.
Annual Report 2015
24
PORTFOLIO OF INVESTMENTS (continued)
July 31, 2015
Municipal Bonds (continued)
Issue
Description | | Coupon
Rate | | Principal
Amount ($) | |
Value ($) | |
New York City Transitional Finance Authority
Building Aid
Revenue Bonds
Fiscal 2009
Series 2009S-4
01/15/25 | | | 5.125 | % | | | 2,000,000 | | | | 2,247,860 | | |
New York Mortgage Agency
Revenue Bonds
Series 2007-140 AMT(a)
10/01/21 | | | 4.600 | % | | | 1,455,000 | | | | 1,472,751 | | |
New York State Dormitory Authority
Prerefunded 05/01/19 Revenue Bonds
North Shore-Long Island Jewish Obligation Group
Series 2009A
05/01/37 | | | 5.500 | % | | | 6,250,000 | | | | 7,206,000 | | |
Refunding Revenue Bonds
Education
Series 2005B (AMBAC)
03/15/29 | | | 5.500 | % | | | 2,030,000 | | | | 2,615,087 | | |
Revenue Bonds
Consolidated City University System 2nd Generation
Series 1993A
07/01/18 | | | 5.750 | % | | | 3,475,000 | | | | 3,753,382 | | |
07/01/20 | | | 6.000 | % | | | 13,350,000 | | | | 15,436,338 | | |
Series 1993A (AGM)
07/01/20 | | | 6.000 | % | | | 6,140,000 | | | | 7,099,559 | | |
Independent School District-Educational
Housing Services
Series 2005 (AMBAC)
07/01/30 | | | 5.250 | % | | | 3,000,000 | | | | 3,392,820 | | |
Mount Sinai School of Medicine
Series 2009
07/01/39 | | | 5.125 | % | | | 15,000,000 | | | | 16,664,550 | | |
Orange Regional Medical Center
Series 2008
12/01/29 | | | 6.125 | % | | | 2,250,000 | | | | 2,480,377 | | |
State University Educational Facilities
Series 1993A (NPFGC/IBC)
05/15/17 | | | 5.875 | % | | | 15,000,000 | | | | 15,965,100 | | |
New York State Energy Research &
Development Authority
Revenue Bonds
Series 1993(g)
04/01/20 | | | 12.325 | % | | | 13,000,000 | | | | 13,026,780 | | |
New York State Environmental Facilities Corp.
Revenue Bonds
Revolving Funds-New York City Municipal Water
Series 2008A
06/15/28 | | | 5.000 | % | | | 1,000,000 | | | | 1,108,790 | | |
Port Authority of New York & New Jersey
Revenue Bonds
Consolidated 144th
Series 2006
10/01/28 | | | 5.000 | % | | | 1,000,000 | | | | 1,049,010 | | |
Municipal Bonds (continued)
Issue
Description | | Coupon
Rate | | Principal
Amount ($) | |
Value ($) | |
JFK International Air Terminal
Series 2010
12/01/36 | | | 6.000 | % | | | 7,000,000 | | | | 8,147,510 | | |
Port Authority of New York & New Jersey(a)
Revenue Bonds
5th Installment-Special Project
Series 1996-4 AMT
10/01/19 | | | 6.750 | % | | | 4,800,000 | | | | 4,793,568 | | |
JFK International Air Terminal Special Project
Series 1997 (NPFGC) AMT
12/01/22 | | | 5.750 | % | | | 6,500,000 | | | | 6,535,100 | | |
Suffolk County Industrial Development Agency
Revenue Bonds
Nissequogue Cogen Partners Facility
Series 1998 AMT(a)
01/01/23 | | | 5.500 | % | | | 6,700,000 | | | | 6,700,335 | | |
Triborough Bridge & Tunnel Authority
Revenue Bonds
General Purpose
Series 1992Y Escrowed to Maturity
01/01/21 | | | 6.125 | % | | | 11,000,000 | | | | 12,971,970 | | |
Ulster County Capital Resource Corp.(b)
Refunding Revenue Bonds
Alliance Senior Living Co.
Series 2014B
09/15/44 | | | 7.000 | % | | | 2,765,000 | | | | 2,816,871 | | |
Ulster County Capital Resource Corp.(b)(g)
Refunding Revenue Bonds
Alliance Senior Living Co.
Series 2014A
09/15/44 | | | 0.000 | % | | | 545,000 | | | | 409,873 | | |
Ulster County Industrial Development Agency
Revenue Bonds
Series 2007A
09/15/37 | | | 6.000 | % | | | 2,000,000 | | | | 2,000,220 | | |
09/15/42 | | | 6.000 | % | | | 7,000,000 | | | | 6,897,100 | | |
Total | | | | | | | 186,280,762 | | |
NORTH CAROLINA 1.2% | |
City of Charlotte Water & Sewer System
Revenue Bonds
Series 2008
07/01/26 | | | 5.000 | % | | | 8,450,000 | | | | 9,400,033 | | |
City of High Point Combined Water & Sewer System
Revenue Bonds
Series 2008 (AGM)
11/01/28 | | | 5.000 | % | | | 350,000 | | | | 391,762 | | |
Durham Housing Authority
Revenue Bonds
Magnolia Pointe Apartments
Series 2005 AMT(a)(d)
02/01/38 | | | 5.650 | % | | | 3,102,997 | | | | 3,140,885 | | |
The accompanying Notes to Financial Statements are an integral part of this statement.
Annual Report 2015
25
PORTFOLIO OF INVESTMENTS (continued)
July 31, 2015
Municipal Bonds (continued)
Issue
Description | | Coupon
Rate | | Principal
Amount ($) | |
Value ($) | |
North Carolina Department of Transportation
Revenue Bonds
I-77 Hot Lanes Project
Series 2015 AMT(a)
06/30/54 | | | 5.000 | % | | | 10,000,000 | | | | 10,355,600 | | |
North Carolina Eastern Municipal Power Agency
Prerefunded 01/01/19 Revenue Bonds
Series 2009A
01/01/26 | | | 5.500 | % | | | 300,000 | | | | 344,358 | | |
Series 2009B
01/01/26 | | | 5.000 | % | | | 7,000,000 | | | | 7,917,980 | | |
Prerefunded 01/01/22 Revenue Bonds
Series 1988A
01/01/26 | | | 6.000 | % | | | 1,940,000 | | | | 2,431,654 | | |
Unrefunded Revenue Bonds
Series 1991A Escrowed to Maturity
01/01/18 | | | 6.500 | % | | | 2,185,000 | | | | 2,479,669 | | |
North Carolina Medical Care Commission
Refunding Revenue Bonds
1st Mortgage-Givens Estates
Series 2007
07/01/33 | | | 5.000 | % | | | 5,000,000 | | | | 5,170,300 | | |
Revenue Bonds
1st Mortgage-Deerfield Episcopal
Series 2008A
11/01/33 | | | 6.000 | % | | | 4,060,000 | | | | 4,438,230 | | |
1st Mortgage-Presbyterian Homes
Series 2006
10/01/31 | | | 5.500 | % | | | 2,500,000 | | | | 2,560,300 | | |
Health Care Housing-Arc Projects
Series 2004A
10/01/34 | | | 5.800 | % | | | 1,400,000 | | | | 1,406,664 | | |
Total | | | | | | | 50,037,435 | | |
NORTH DAKOTA 0.3% | |
County of McLean
Revenue Bonds
Great River Energy
Series 2010B
07/01/40 | | | 5.150 | % | | | 7,900,000 | | | | 8,317,436 | | |
County of Ward
Revenue Bonds
Trinity Obligated Group
Series 2006
07/01/29 | | | 5.125 | % | | | 4,490,000 | | | | 4,532,026 | | |
Total | | | | | | | 12,849,462 | | |
OHIO 1.4% | |
Adams County/Ohio Valley Local School District
Unlimited General Obligation Bonds
Adams and Highland Counties
Series 1995 (NPFGC)
12/01/15 | | | 7.000 | % | | | 600,000 | | | | 611,724 | | |
Municipal Bonds (continued)
Issue
Description | | Coupon
Rate | | Principal
Amount ($) | |
Value ($) | |
American Municipal Power, Inc.
Revenue Bonds
AMP Fremont Energy Center Project
Series 2012
02/15/37 | | | 5.000 | % | | | 13,220,000 | | | | 14,523,756 | | |
City of Lakewood Water System
Revenue Bonds
Mortgage
Series 1995 (AMBAC)
07/01/20 | | | 5.850 | % | | | 1,050,000 | | | | 1,169,690 | | |
City of Middleburg Heights
Revenue Bonds
Southwest General Facilities
Series 2011
08/01/36 | | | 5.250 | % | | | 2,380,000 | | | | 2,538,627 | | |
08/01/41 | | | 5.250 | % | | | 6,900,000 | | | | 7,344,705 | | |
Cleveland Department of Public Utilities
Division of Public Power
Revenue Bonds
Series 2008B-1 (NPFGC)
11/15/28 | | | 5.000 | % | | | 500,000 | | | | 545,970 | | |
Cleveland Department of Public Utilities
Division of Water
Refunding Revenue Bonds
1st Mortgage
Series 1993G (NPFGC)
01/01/21 | | | 5.500 | % | | | 3,975,000 | | | | 4,441,745 | | |
Ohio Higher Educational Facility Commission
Revenue Bonds
University of Dayton Project
Series 2009
12/01/24 | | | 5.500 | % | | | 3,000,000 | | | | 3,394,950 | | |
Ohio State Turnpike Commission
Refunding Revenue Bonds
Series 1998A (NPFGC)
02/15/26 | | | 5.500 | % | | | 3,000,000 | | | | 3,785,250 | | |
State of Ohio
Revenue Bonds
Portsmouth Bypass Project
Series 2015 AMT(a)
06/30/53 | | | 5.000 | % | | | 8,250,000 | | | | 8,705,152 | | |
Toledo-Lucas County Port Authority
Revenue Bonds
University of Toledo Project
Series 2014
07/01/46 | | | 5.000 | % | | | 5,000,000 | | | | 5,200,400 | | |
Toledo-Lucas County Port Authority(d)(e)
Special Assessment Bonds
Town Square at Levi Commons
Series 2007
11/01/36 | | | 5.400 | % | | | 2,605,000 | | | | 1,291,793 | | |
The accompanying Notes to Financial Statements are an integral part of this statement.
Annual Report 2015
26
PORTFOLIO OF INVESTMENTS (continued)
July 31, 2015
Municipal Bonds (continued)
Issue
Description | | Coupon
Rate | | Principal
Amount ($) | |
Value ($) | |
Toledo-Lucas County Port Authority(g)
Refunding Revenue Bonds
CSX Transportation, Inc. Project
Series 1992
12/15/21 | | | 6.450 | % | | | 3,950,000 | | | | 4,901,516 | | |
Total | | | | | | | 58,455,278 | | |
OREGON 0.4% | |
Benton County Hospital Facilities Authority
Unrefunded Revenue Bonds
Samaritan Health
Series 1998
10/01/28 | | | 5.125 | % | | | 655,000 | | | | 656,625 | | |
City of Forest Grove
Refunding Revenue Bonds
Campus Improvement Pacific University Project
Series 2014
05/01/40 | | | 5.000 | % | | | 1,500,000 | | | | 1,597,920 | | |
Cow Creek Band of Umpqua Tribe of Indians
Revenue Bonds
Series 2006C(b)(c)
10/01/26 | | | 5.625 | % | | | 3,500,000 | | | | 3,553,655 | | |
Hospital Facilities Authority of Multnomah County
Refunding Revenue Bonds
Mirabella at South Waterfront
Series 2014A
10/01/44 | | | 5.400 | % | | | 3,225,000 | | | | 3,506,510 | | |
Oregon Health & Science University
Revenue Bonds
Series 2009A
07/01/39 | | | 5.750 | % | | | 4,500,000 | | | | 5,162,850 | | |
Total | | | | | | | 14,477,560 | | |
PENNSYLVANIA 3.9% | |
Allegheny County Higher Education Building Authority
Revenue Bonds
Duquesne University
Series 2008
03/01/28 | | | 5.000 | % | | | 490,000 | | | | 526,755 | | |
Butler County Hospital Authority
Prerefunded 07/01/19 Revenue Bonds
Butler Health Systems Project
Series 2009
07/01/39 | | | 7.250 | % | | | 7,000,000 | | | | 8,615,530 | | |
Commonwealth Financing Authority
Revenue Bonds
Series 2015A
06/01/35 | | | 5.000 | % | | | 7,010,000 | | | | 7,670,412 | | |
Municipal Bonds (continued)
Issue
Description | | Coupon
Rate | | Principal
Amount ($) | |
Value ($) | |
Cumberland County Municipal Authority
Refunding Revenue Bonds
Diakon Lutheran Ministries
Series 2015
01/01/38 | | | 5.000 | % | | | 8,490,000 | | | | 8,986,410 | | |
Dauphin County Industrial Development Authority
Revenue Bonds
Dauphin Consolidated Water Supply
Series 1992A AMT(a)
06/01/24 | | | 6.900 | % | | | 3,400,000 | | | | 4,236,502 | | |
Delaware Valley Regional Finance Authority
Revenue Bonds
Series 1997C (AMBAC)
07/01/27 | | | 7.750 | % | | | 1,000,000 | | | | 1,403,410 | | |
Montgomery County Industrial Development Authority
Refunding Revenue Bonds
Albert Einstein HealthCare Network
Series 2015
01/15/45 | | | 5.250 | % | | | 11,150,000 | | | | 11,761,689 | | |
Northampton County General Purpose Authority
Revenue Bonds
Saint Luke's Hospital Project
Series 2008A
08/15/28 | | | 5.375 | % | | | 4,000,000 | | | | 4,387,400 | | |
Pennsylvania Convention Center Authority
Revenue Bonds
Series 1989A Escrowed to Maturity (FGIC)
09/01/19 | | | 6.000 | % | | | 14,010,000 | | | | 16,058,402 | | |
Pennsylvania Economic Development
Financing Authority
Revenue Bonds
Philadelphia Biosolids Facility
Series 2009
01/01/32 | | | 6.250 | % | | | 5,325,000 | | | | 5,900,899 | | |
Pennsylvania Economic Development
Financing Authority(a)
Revenue Bonds
PA Bridges Finco LP
Series 2015 AMT
06/30/42 | | | 5.000 | % | | | 6,950,000 | | | | 7,277,414 | | |
Proctor & Gamble Paper Project
Series 2001 AMT
03/01/31 | | | 5.375 | % | | | 1,000,000 | | | | 1,218,980 | | |
Pennsylvania Higher Educational Facilities Authority
Revenue Bonds
Edinboro University Foundation
Series 2008
07/01/28 | | | 5.750 | % | | | 3,000,000 | | | | 3,142,230 | | |
Series 2010
07/01/43 | | | 6.000 | % | | | 4,750,000 | | | | 5,121,688 | | |
The accompanying Notes to Financial Statements are an integral part of this statement.
Annual Report 2015
27
PORTFOLIO OF INVESTMENTS (continued)
July 31, 2015
Municipal Bonds (continued)
Issue
Description | | Coupon
Rate | | Principal
Amount ($) | |
Value ($) | |
Pennsylvania Turnpike Commission
Refunding Subordinated Revenue Bonds
Series 2015A-1
12/01/45 | | | 5.250 | % | | | 25,295,000 | | | | 28,129,558 | | |
Revenue Bonds
Series 2014B
12/01/44 | | | 5.250 | % | | | 10,000,000 | | | | 11,055,400 | | |
Subordinated Series 2014A-1
12/01/43 | | | 5.000 | % | | | 16,940,000 | | | | 18,234,047 | | |
Philadelphia Authority for Industrial Development
Revenue Bonds
First Philadelphia Preparatory Charter School
Series 2014
06/15/43 | | | 7.250 | % | | | 5,475,000 | | | | 6,172,843 | | |
Philadelphia Municipal Authority
Revenue Bonds
Lease
Series 2009
04/01/34 | | | 6.500 | % | | | 2,500,000 | | | | 2,852,200 | | |
Philadelphia Redevelopment Authority
Revenue Bonds
Subordinated Series 1986B Escrowed to Maturity (GNMA)
06/01/17 | | | 9.000 | % | | | 450,000 | | | | 517,311 | | |
Washington County Industrial Development Authority
Revenue Bonds
Washington Jefferson College
Series 2010
11/01/36 | | | 5.000 | % | | | 4,850,000 | | | | 5,326,658 | | |
Westmoreland County Municipal Authority
Revenue Bonds
Capital Appreciation
Series 1999A (NPFGC)(f)
08/15/22 | | | 0.000 | % | | | 2,000,000 | | | | 1,664,480 | | |
Total | | | | | | | 160,260,218 | | |
PUERTO RICO 0.8% | |
Commonwealth of Puerto Rico
Unlimited General Obligation Bonds
Series 2014A(c)
07/01/35 | | | 8.000 | % | | | 4,000,000 | | | | 2,779,920 | | |
Puerto Rico Electric Power Authority(c)
Refunding Revenue Bonds
Series 2007UU (AGM)
07/01/23 | | | 5.000 | % | | | 1,000,000 | | | | 989,860 | | |
Revenue Bonds
Series 2003NN (NPFGC)
07/01/21 | | | 5.250 | % | | | 3,500,000 | | | | 3,398,080 | | |
Puerto Rico Highways & Transportation Authority(c)
Refunding Revenue Bonds
Series 2003AA (NPFGC)
07/01/20 | | | 5.500 | % | | | 180,000 | | | | 176,918 | | |
Municipal Bonds (continued)
Issue
Description | | Coupon
Rate | | Principal
Amount ($) | |
Value ($) | |
Revenue Bonds
Series 2005K
07/01/20 | | | 5.000 | % | | | 5,000,000 | | | | 1,827,350 | | |
Puerto Rico Public Buildings Authority(c)
Refunding Revenue Bonds
Government Facilities
Series 2002F
07/01/20 | | | 5.250 | % | | | 2,000,000 | | | | 1,279,120 | | |
Series 2007M
07/01/31 | | | 6.250 | % | | | 27,000,000 | | | | 16,335,810 | | |
Puerto Rico Public Finance Corp.(c)
Prerefunded Revenue Bonds
Commonwealth Appropriation
Series 2002E Escrowed to Maturity (AMBAC)
08/01/27 | | | 5.500 | % | | | 450,000 | | | | 566,042 | | |
Unrefunded Revenue Bonds
Commonwealth Appropriation
Series 2002E Escrowed to Maturity
08/01/26 | | | 6.000 | % | | | 2,470,000 | | | | 3,203,911 | | |
Series 2002E Escrowed to Maturity (AMBAC)
08/01/27 | | | 5.500 | % | | | 1,050,000 | | | | 1,320,764 | | |
Total | | | | | | | 31,877,775 | | |
SOUTH CAROLINA 0.7% | |
City of Myrtle Beach
Tax Allocation Bonds
Myrtle Beach Air Force Base
Series 2006A
10/01/26 | | | 5.250 | % | | | 1,610,000 | | | | 1,609,952 | | |
Piedmont Municipal Power Agency
Refunding Revenue Bonds
Electric
Series 1991 (NPFGC)
01/01/21 | | | 6.250 | % | | | 1,250,000 | | | | 1,526,263 | | |
Unrefunded Revenue Bonds
Series 1993 (NPFGC)
01/01/25 | | | 5.375 | % | | | 11,280,000 | | | | 13,114,015 | | |
South Carolina Jobs-Economic Development Authority
Refunding Revenue Bonds
The Woodlands at Furman Project
Series 2012
11/15/42 | | | 6.000 | % | | | 5,133,239 | | | | 4,979,344 | | |
Revenue Bonds
York Preparatory Academy Project
Series 2014A
11/01/23 | | | 5.750 | % | | | 1,275,000 | | | | 1,328,384 | | |
11/01/33 | | | 7.000 | % | | | 910,000 | | | | 988,579 | | |
11/01/45 | | | 7.250 | % | | | 3,935,000 | | | | 4,311,973 | | |
South Carolina Jobs-Economic Development Authority(f)
Refunding Revenue Bonds
The Woodlands at Furman Project
Subordinated Series 2012
11/15/47 | | | 0.000 | % | | | 1,283,310 | | | | 125,559 | | |
The accompanying Notes to Financial Statements are an integral part of this statement.
Annual Report 2015
28
PORTFOLIO OF INVESTMENTS (continued)
July 31, 2015
Municipal Bonds (continued)
Issue
Description | | Coupon
Rate | | Principal
Amount ($) | |
Value ($) | |
South Carolina State Public Service Authority
Unrefunded Revenue Bonds
Series 2008A
01/01/28 | | | 5.375 | % | | | 10,000 | | | | 11,186 | | |
Total | | | | | | | 27,995,255 | | |
SOUTH DAKOTA 0.2% | |
Heartland Consumers Power District
Refunding Revenue Bonds
Series 1992 Escrowed to Maturity (AGM)
01/01/17 | | | 6.000 | % | | | 5,930,000 | | | | 6,223,239 | | |
State of South Dakota
Revenue Bonds
Series 1993A Escrowed to Maturity (AGM)
09/01/17 | | | 6.700 | % | | | 3,165,000 | | | | 3,363,129 | | |
Total | | | | | | | 9,586,368 | | |
TEXAS 9.4% | |
Bexar County Health Facilities Development Corp.
Revenue Bonds
Army Retirement Residence Project
Series 2010
07/01/30 | | | 5.875 | % | | | 1,370,000 | | | | 1,513,151 | | |
07/01/45 | | | 6.200 | % | | | 7,200,000 | | | | 8,088,120 | | |
Capital Area Cultural Education Facilities Finance Corp.
Revenue Bonds
Roman Catholic Diocese
Series 2005B(g)
04/01/45 | | | 6.125 | % | | | 13,450,000 | | | | 15,501,125 | | |
Central Texas Regional Mobility Authority
Refunding Revenue Bonds
Senior Lien
Series 2013A
01/01/33 | | | 5.000 | % | | | 2,700,000 | | | | 2,936,709 | | |
Revenue Bonds
Senior Lien
Series 2011
01/01/41 | | | 6.000 | % | | | 8,620,000 | | | | 9,868,952 | | |
Central Texas Regional Mobility Authority(f)
Revenue Bonds
Capital Appreciation
Series 2010
01/01/25 | | | 0.000 | % | | | 2,000,000 | | | | 1,354,700 | | |
Central Texas Turnpike System
Refunding Revenue Bonds
1st Tier
Series 2012A
08/15/41 | | | 5.000 | % | | | 16,075,000 | | | | 17,431,891 | | |
Subordinated Series 2015C
08/15/37 | | | 5.000 | % | | | 10,000,000 | | | | 10,838,900 | | |
Subordinated Refunding Revenue Bonds
Series 2015C
08/15/42 | | | 5.000 | % | | | 14,730,000 | | | | 15,757,123 | | |
Municipal Bonds (continued)
Issue
Description | | Coupon
Rate | | Principal
Amount ($) | |
Value ($) | |
Central Texas Turnpike System(f)
Unrefunded Revenue Bonds
1st Tier
Series 2002A (AMBAC)
08/15/18 | | | 0.000 | % | | | 4,250,000 | | | | 4,045,448 | | |
City of Austin Electric Utility
Refunding Revenue Bonds
Series 2008A
11/15/35 | | | 5.250 | % | | | 8,000,000 | | | | 8,846,640 | | |
City of Houston Airport System
Refunding Revenue Bonds
Senior Lien
Series 2009A
07/01/34 | | | 5.500 | % | | | 10,500,000 | | | | 11,698,995 | | |
City of Houston Airport System(a)
Refunding Revenue Bonds
Special Facilities-Continental Airlines
Series 2011A AMT
07/15/30 | | | 6.500 | % | | | 5,555,000 | | | | 6,458,354 | | |
Subordinated Lien
Series 2012A AMT
07/01/31 | | | 5.000 | % | | | 5,000,000 | | | | 5,466,700 | | |
United Airlines, Inc.
Series 2014 AMT
07/01/29 | | | 5.000 | % | | | 4,000,000 | | | | 4,178,280 | | |
City of Houston
Revenue Bonds
Capital Appreciation-Convention
Series 2001B (AMBAC)(f)
09/01/17 | | | 0.000 | % | | | 2,000,000 | | | | 1,937,880 | | |
Clifton Higher Education Finance Corp.
Revenue Bonds
Idea Public Schools
Series 2011
08/15/41 | | | 5.750 | % | | | 2,000,000 | | | | 2,231,480 | | |
Series 2012
08/15/32 | | | 5.000 | % | | | 2,165,000 | | | | 2,311,700 | | |
08/15/42 | | | 5.000 | % | | | 5,575,000 | | | | 5,872,370 | | |
Series 2013
08/15/33 | | | 6.000 | % | | | 990,000 | | | | 1,173,536 | | |
Series 2015A
12/01/35 | | | 5.000 | % | | | 2,200,000 | | | | 2,303,422 | | |
12/01/45 | | | 5.000 | % | | | 1,100,000 | | | | 1,129,601 | | |
Dallas County Flood Control District No. 1
Unlimited General Obligation Refunding Bonds
Series 2002
04/01/32 | | | 7.250 | % | | | 7,500,000 | | | | 7,523,175 | | |
Dallas/Fort Worth International Airport
Refunding Revenue Bonds
Series 2012B
11/01/35 | | | 5.000 | % | | | 10,000,000 | | | | 11,214,700 | | |
The accompanying Notes to Financial Statements are an integral part of this statement.
Annual Report 2015
29
PORTFOLIO OF INVESTMENTS (continued)
July 31, 2015
Municipal Bonds (continued)
Issue
Description | | Coupon
Rate | | Principal
Amount ($) | |
Value ($) | |
Dallas/Fort Worth International Airport(a)
Refunding Revenue Bonds
Series 2014A AMT
11/01/32 | | | 5.000 | % | | | 3,400,000 | | | | 3,739,524 | | |
Deaf Smith County Hospital District
Limited General Obligation Bonds
Series 2010A
03/01/40 | | | 6.500 | % | | | 4,000,000 | | | | 4,439,560 | | |
Harris County Health Facilities Development Corp.
Prerefunded 12/01/18 Revenue Bonds
Memorial Hermann Healthcare System
Series 2008B
12/01/35 | | | 7.250 | % | | | 8,800,000 | | | | 10,573,288 | | |
Revenue Bonds
St. Luke's Episcopal Hospital Project
Series 1991 Escrowed to Maturity
02/15/21 | | | 6.750 | % | | | 1,965,000 | | | | 2,207,560 | | |
Houston Higher Education Finance Corp.
Prerefunded 05/15/21 Revenue Bonds
Harmony Public Schools
Series 2011A
05/15/41 | | | 6.875 | % | | | 4,045,000 | | | | 5,211,659 | | |
La Vernia Higher Education Finance Corp.
Prerefunded 08/15/19 Revenue Bonds
Kipp, Inc.
Series 2009A
08/15/44 | | | 6.375 | % | | | 7,500,000 | | | | 8,983,950 | | |
Matagorda County Navigation District No. 1
Refunding Revenue Bonds
Central Power & Light Co. Project
Series 2001A
11/01/29 | | | 6.300 | % | | | 2,800,000 | | | | 3,178,756 | | |
Mission Economic Development Corp
Revenue Bonds
Dallas Clean Energy McCommas
Series 2011 AMT(a)
12/01/24 | | | 6.875 | % | | | 15,000,000 | | | | 15,653,700 | | |
New Hope Cultural Education Facilities Corp.
Revenue Bonds
Collegiate Housing College Station
Series 2014
04/01/46 | | | 5.000 | % | | | 7,250,000 | | | | 7,402,902 | | |
Collegiate Housing Tarleton State University
Series 2015
04/01/47 | | | 5.000 | % | | | 2,995,000 | | | | 3,068,647 | | |
NCCD-College Station Properties LLC
Series 2015A
07/01/47 | | | 5.000 | % | | | 20,775,000 | | | | 21,263,628 | | |
North Texas Tollway Authority
Prerefunded 01/01/18 Revenue Bonds
Toll 2nd Tier
Series 2008F (GNMA/FNMA)
01/01/38 | | | 5.750 | % | | | 11,355,000 | | | | 12,668,546 | | |
Municipal Bonds (continued)
Issue
Description | | Coupon
Rate | | Principal
Amount ($) | |
Value ($) | |
Refunding Revenue Bonds
1st Tier
Series 2009C
01/01/44 | | | 5.250 | % | | | 5,000,000 | | | | 5,447,500 | | |
Series 2011
01/01/38 | | | 5.000 | % | | | 5,500,000 | | | | 5,923,390 | | |
Series 2012B
01/01/42 | | | 5.000 | % | | | 12,845,000 | | | | 13,920,383 | | |
Series 2015A
01/01/38 | | | 5.000 | % | | | 9,230,000 | | | | 10,031,072 | | |
Red River Health Facilities Development Corp.
Revenue Bonds
MRC Crossings Project
Series 2014A
11/15/34 | | | 7.500 | % | | | 2,000,000 | | | | 2,317,680 | | |
11/15/44 | | | 7.750 | % | | | 2,800,000 | | | | 3,261,972 | | |
San Juan Higher Education Finance Authority
Revenue Bonds
Idea Public Schools
Series 2010A
08/15/40 | | | 6.700 | % | | | 2,700,000 | | | | 3,147,444 | | |
Sanger Industrial Development Corp.
Revenue Bonds
Texas Pellets Project
Series 2012B AMT(a)
07/01/38 | | | 8.000 | % | | | 34,645,000 | | | | 37,209,423 | | |
Tarrant County Cultural Education Facilities Finance Corp.
Refunding Revenue Bonds
Trinity Terrace Project
Series 2014
10/01/44 | | | 5.000 | % | | | 2,500,000 | | | | 2,612,000 | | |
10/01/49 | | | 5.000 | % | | | 1,870,000 | | | | 1,952,430 | | |
Revenue Bonds
Air Force Villages, Inc. Obligation Group
Series 2007
05/15/27 | | | 5.125 | % | | | 2,000,000 | | | | 2,018,780 | | |
05/15/37 | | | 5.125 | % | | | 2,000,000 | | | | 2,006,780 | | |
CC Young Memorial Home
Series 2009A
02/15/38 | | | 8.000 | % | | | 4,000,000 | | | | 4,516,400 | | |
Stayton at Museum Way
Series 2009A
11/15/44 | | | 8.250 | % | | | 12,000,000 | | | | 11,958,120 | | |
Texas City Industrial Development Corp.
Refunding Revenue Bonds
Arco Pipe Line Co. Project
Series 1990
10/01/20 | | | 7.375 | % | | | 2,000,000 | | | | 2,521,460 | | |
Texas Municipal Gas Acquisition & Supply Corp. III
Revenue Bonds
Series 2012
12/15/29 | | | 5.000 | % | | | 8,300,000 | | | | 9,023,760 | | |
12/15/32 | | | 5.000 | % | | | 7,500,000 | | | | 8,053,650 | | |
The accompanying Notes to Financial Statements are an integral part of this statement.
Annual Report 2015
30
PORTFOLIO OF INVESTMENTS (continued)
July 31, 2015
Municipal Bonds (continued)
Issue
Description | | Coupon
Rate | | Principal
Amount ($) | |
Value ($) | |
Travis County Health Facilities Development Corp.
Revenue Bonds
Querencia Barton Creek Project
Series 2005
11/15/25 | | | 5.500 | % | | | 1,000,000 | | | | 1,004,620 | | |
Uptown Development Authority
Tax Allocation Bonds
Infrastructure Improvement Facilities
Series 2009
09/01/29 | | | 5.500 | % | | | 500,000 | | | | 548,295 | | |
Total | | | | | | | 385,549,831 | | |
UTAH —% | |
Utah Housing Corp.
Revenue Bonds
Series 2003A-1 AMT(a)
07/01/24 | | | 5.125 | % | | | 415,000 | | | | 415,938 | | |
VIRGIN ISLANDS 0.1% | |
Virgin Islands Public Finance Authority
Refunding Revenue Bonds
Gross Receipts Taxes Loan
Series 2012-A(c)
10/01/32 | | | 5.000 | % | | | 4,000,000 | | | | 4,319,320 | | |
VIRGINIA 0.8% | |
City of Chesapeake Expressway Toll Road
Revenue Bonds
Transportation System
Senior Series 2012A
07/15/47 | | | 5.000 | % | | | 7,505,000 | | | | 7,867,641 | | |
Fairfax County Industrial Development Authority
Refunding Revenue Bonds
Inova Health System Project
Series 1993
08/15/23 | | | 5.000 | % | | | 10,000,000 | | | | 11,569,300 | | |
Fredericksburg Economic Development Authority
Refunding Revenue Bonds
Mary Washington Healthcare Obligation
Series 2014
06/15/30 | | | 5.000 | % | | | 1,000,000 | | | | 1,085,690 | | |
06/15/31 | | | 5.000 | % | | | 800,000 | | | | 866,056 | | |
06/15/33 | | | 5.000 | % | | | 500,000 | | | | 537,015 | | |
Mosaic District Community Development Authority
Special Assessment Bonds
Series 2011A
03/01/26 | | | 6.625 | % | | | 2,145,000 | | | | 2,443,713 | | |
Richmond Metropolitan Transportation Authority (The)
Refunding Revenue Bonds
Series 1998 (NPFGC)
07/15/22 | | | 5.250 | % | | | 5,380,000 | | | | 5,976,696 | | |
Total | | | | | | | 30,346,111 | | |
Municipal Bonds (continued)
Issue
Description | | Coupon
Rate | | Principal
Amount ($) | |
Value ($) | |
WASHINGTON 2.1% | |
Greater Wenatchee Regional Events Center
Public Facilities District
Revenue Bonds
Series 2012A
09/01/27 | | | 5.000 | % | | | 1,540,000 | | | | 1,631,692 | | |
09/01/32 | | | 5.250 | % | | | 1,000,000 | | | | 1,043,480 | | |
King County Public Hospital District No. 4
Revenue Bonds
Series 2015A
12/01/35 | | | 6.000 | % | | | 1,300,000 | | | | 1,271,517 | | |
12/01/45 | | | 6.250 | % | | | 2,500,000 | | | | 2,453,075 | | |
Skagit County Public Hospital District No. 1
Revenue Bonds
Skagit Valley Hospital
Series 2005
12/01/30 | | | 5.500 | % | | | 1,235,000 | | | | 1,247,115 | | |
Series 2007
12/01/28 | | | 5.750 | % | | | 1,500,000 | | | | 1,616,505 | | |
12/01/32 | | | 5.750 | % | | | 2,000,000 | | | | 2,130,420 | | |
Snohomish County Public Utility District No. 1
Refunding Revenue Bonds
Generation System
Series 1986A Escrowed to Maturity
01/01/20 | | | 5.000 | % | | | 12,000,000 | | | | 13,927,680 | | |
Washington Health Care Facilities Authority
Revenue Bonds
Overlake Hospital Medical Center
Series 2010
07/01/30 | | | 5.500 | % | | | 3,000,000 | | | | 3,378,390 | | |
Washington Higher Education Facilities Authority
Refunding Revenue Bonds
Whitworth University Project
Series 2009
10/01/40 | | | 5.625 | % | | | 4,685,000 | | | | 5,011,357 | | |
Washington State Housing Finance Commission
Refunding Revenue Bonds
Nonprofit Housing-Mirabella
Series 2012
10/01/32 | | | 6.500 | % | | | 9,900,000 | | | | 10,697,742 | | |
10/01/47 | | | 6.750 | % | | | 1,000,000 | | | | 1,082,380 | | |
Presbyterian Retirement
Series 2013
01/01/23 | | | 5.000 | % | | | 1,325,000 | | | | 1,397,955 | | |
01/01/28 | | | 5.000 | % | | | 2,015,000 | | | | 2,066,362 | | |
01/01/33 | | | 5.000 | % | | | 2,570,000 | | | | 2,601,662 | | |
01/01/43 | | | 5.250 | % | | | 7,550,000 | | | | 7,681,823 | | |
Revenue Bonds
Skyline at First Hill Project
Series 2007A
01/01/27 | | | 5.625 | % | | | 2,500,000 | | | | 2,510,150 | | |
01/01/38 | | | 5.625 | % | | | 19,450,000 | | | | 19,048,747 | | |
The accompanying Notes to Financial Statements are an integral part of this statement.
Annual Report 2015
31
PORTFOLIO OF INVESTMENTS (continued)
July 31, 2015
Municipal Bonds (continued)
Issue
Description | | Coupon
Rate | | Principal
Amount ($) | |
Value ($) | |
Washington State Housing Finance Commission(b)(h)
Revenue Bonds
Heron's Key
Series 2015A
07/01/30 | | | 6.500 | % | | | 480,000 | | | | 485,558 | | |
07/01/35 | | | 6.750 | % | | | 550,000 | | | | 558,289 | | |
07/01/45 | | | 7.000 | % | | | 1,800,000 | | | | 1,826,820 | | |
Total | | | | | | | 83,668,719 | | |
WEST VIRGINIA 0.3% | |
West Virginia Economic Development Authority
Refunding Revenue Bonds
Appalachian Power Co.-Amos Project
Series 2010A(g)
12/01/38 | | | 5.375 | % | | | 3,850,000 | | | | 4,183,603 | | |
West Virginia State Building Commission
Refunding Revenue Bonds
West Virginia Regional Jail
Series 1998A (AMBAC)
07/01/21 | | | 5.375 | % | | | 3,215,000 | | | | 3,628,931 | | |
West Virginia University
Revenue Bonds
University of West Virginia System Projects
Series 1998A (NFPGC)
04/01/28 | | | 5.250 | % | | | 5,000,000 | | | | 5,949,400 | | |
Total | | | | | | | 13,761,934 | | |
WISCONSIN 4.0% | |
City of La Crosse
Refunding Revenue Bonds
Northern States Power Co. Project
Series 1996 AMT(a)
11/01/21 | | | 6.000 | % | | | 6,000,000 | | | | 7,263,840 | | |
Monroe Redevelopment Authority
Revenue Bonds
Monroe Clinic, Inc.
Series 2009
02/15/39 | | | 5.875 | % | | | 5,000,000 | | | | 5,489,750 | | |
Public Finance Authority(a)
Refunding Revenue Bonds
TRIPS Senior Obligation Group
Series 2012 AMT
07/01/28 | | | 5.250 | % | | | 4,000,000 | | | | 4,339,600 | | |
07/01/42 | | | 5.000 | % | | | 2,000,000 | | | | 2,068,400 | | |
State of Wisconsin
Revenue Bonds
Series 2009A
05/01/33 | | | 5.750 | % | | | 17,700,000 | | | | 20,416,419 | | |
Wisconsin Health & Educational Facilities Authority
Prerefunded 02/15/19 Revenue Bonds
ProHealth Care, Inc. Obligation Group
Series 2009
02/15/39 | | | 6.625 | % | | | 25,150,000 | | | | 29,952,644 | | |
Municipal Bonds (continued)
Issue
Description | | Coupon
Rate | | Principal
Amount ($) | |
Value ($) | |
Prerefunded 04/01/18 Revenue Bonds
Riverview Hospital Association
Series 2008
04/01/33 | | | 5.750 | % | | | 6,000,000 | | | | 6,761,640 | | |
04/01/38 | | | 5.750 | % | | | 4,000,000 | | | | 4,507,760 | | |
Refunding Revenue Bonds
Wheaton Healthcare
Series 2006B
08/15/24 | | | 5.125 | % | | | 15,910,000 | | | | 16,569,151 | | |
08/15/25 | | | 5.125 | % | | | 15,500,000 | | | | 16,128,990 | | |
Revenue Bonds
Aurora Health Care, Inc.
Series 2010A
04/15/39 | | | 5.625 | % | | | 6,100,000 | | | | 6,786,189 | | |
Beaver Dam Community Hospitals
Series 2013A
08/15/28 | | | 5.125 | % | | | 6,750,000 | | | | 7,173,900 | | |
08/15/34 | | | 5.250 | % | | | 8,000,000 | | | | 8,472,720 | | |
Medical College of Wisconsin
Series 2008A
12/01/35 | | | 5.250 | % | | | 14,400,000 | | | | 15,813,792 | | |
ProHealth Care, Inc.
Series 2012
08/15/28 | | | 5.000 | % | | | 1,570,000 | | | | 1,760,661 | | |
St. John's Community, Inc.
Series 2009A
09/15/29 | | | 7.250 | % | | | 1,000,000 | | | | 1,157,260 | | |
09/15/39 | | | 7.625 | % | | | 1,000,000 | | | | 1,167,040 | | |
ThedaCare, Inc.
Series 2015
12/15/44 | | | 5.000 | % | | | 6,725,000 | | | | 7,284,318 | | |
Total | | | | | | | 163,114,074 | | |
WYOMING 0.2% | |
County of Campbell
Revenue Bonds
Basin Electric Power Cooperative
Series 2009A
07/15/39 | | | 5.750 | % | | | 7,900,000 | | | | 8,999,443 | | |
Total Municipal Bonds
(Cost: $3,679,521,131) | | | | | | | 3,986,163,396 | | |
Municipal Bonds Held in Trust 0.4%
MASSACHUSETTS 0.4% | |
Massachusetts Health & Educational
Facilities Authority
Revenue Bonds
Harvard University
Series 2009A(b)(g)(i)
11/15/36 | | | 5.500 | % | | | 16,000,000 | | | | 18,209,920 | | |
Total Municipal Bonds Held in Trust
(Cost: $17,435,538) | | | | | | | 18,209,920 | | |
The accompanying Notes to Financial Statements are an integral part of this statement.
Annual Report 2015
32
PORTFOLIO OF INVESTMENTS (continued)
July 31, 2015
Floating Rate Notes 0.2%
Issue
Description | | Effective
Yield | | Principal
Amount ($) | |
Value ($) | |
NEW YORK 0.2% | |
New York City Water & Sewer System
Revenue Bonds
2nd General Resolution
VRDN Series 2013
(JPMorgan Chase Bank)(g)(j)
06/15/50 | | | 0.010 | % | | | 6,600,000 | | | | 6,600,000 | | |
Total Floating Rate Notes
(Cost: $6,600,000) | | | | | | | 6,600,000 | | |
Money Market Fund 1.4%
| | | Shares | | Value ($) | |
Dreyfus Tax-Exempt Cash Management Fund,
0.000%(k) | | | 20,069,335 | | | | 20,069,335 | | |
JPMorgan Municipal Money Market Fund,
0.010%(k) | | | 37,917,502 | | | | 37,917,502 | | |
Total Money Market Funds
(Cost: $57,986,837) | | | | | 57,986,837 | | |
Total Investments
(Cost: $3,761,543,506) | | | | | 4,068,960,153 | | |
Other Assets & Liabilities, Net | | | | | 25,935,617 | | |
Net Assets | | | | | 4,094,895,770 | | |
Notes to Portfolio of Investments
(a) Income from this security may be subject to alternative minimum tax.
(b) Security exempt from registration pursuant to Rule 144A under the Securities Act of 1933. This security may be resold in transactions exempt from registration, normally to qualified institutional buyers. At July 31, 2015, the value of these securities amounted to $81,968,139 or 2.00% of net assets.
(c) Municipal obligations include debt obligations issued by or on behalf of territories, possessions, or sovereign nations within the territorial boundaries of the United States. At July 31, 2015, the value of these securities amounted to $60,956,061 or 1.49% of net assets.
(d) Identifies securities considered by the Investment Manager to be illiquid and may be difficult to sell. The aggregate value of such securities at July 31, 2015 was $21,793,962, which represents 0.53% of net assets. Information concerning such security holdings at July 31, 2015 is as follows:
Security Description | | Acquisition Dates | | Cost ($) | |
Boston Industrial Development Financing Authority
Revenue Bonds
Crosstown Center Project
Senior Series 2002 AMT
09/01/35 6.500% | | 09/20/2002 - 04/07/2008 | | | 4,956,280 | | |
Cabazon Band Mission Indians
Revenue Bonds
Mortgage Notes
Series 2004
10/01/13 13.000% | | 05/14/2010 | | | 352,656 | | |
Cabazon Band Mission Indians
Revenue Bonds
Mortgage Notes
Series 2004
10/01/15 8.375% | | 10/04/2004 - 05/14/2010 | | | 1,691,224 | | |
Cabazon Band Mission Indians
Revenue Bonds
Mortgage Notes
Series 2004
10/01/19 8.750% | | 10/04/2004 - 05/14/2010 | | | 8,381,812 | | |
Cabazon Band Mission Indians
Revenue Bonds
Mortgage Notes
Series 2010
10/01/20 8.375% | | 05/14/2010 | | | 1,415,000 | | |
The accompanying Notes to Financial Statements are an integral part of this statement.
Annual Report 2015
33
PORTFOLIO OF INVESTMENTS (continued)
July 31, 2015
Notes to Portfolio of Investments (continued)
Security Description | | Acquisition Dates | | Cost ($) | |
California Municipal Finance Authority
Revenue Bonds
UTS Renewable Energy-Waste Water Facilities
Series 2011 AMT
12/01/32 7.500% | | 12/22/2011 | | | 1,830,000 | | |
Capital Trust Agency, Inc.
Revenue Bonds
Atlantic Housing Foundation
Subordinated Series 2008B
07/15/32 7.000% | | 07/23/2008 | | | 1,820,000 | | |
Durham Housing Authority
Revenue Bonds
Magnolia Pointe Apartments
Series 2005 AMT
02/01/38 5.650% | | 12/18/2006 | | | 3,102,997 | | |
Indianapolis Airport Authority
Revenue Bonds
Special Facilities-United Air Lines Project
Series 1995A AMT
11/15/31 6.500% | | 10/17/1995 - 10/31/2012 | | | 780,786 | | |
Massachusetts Development Finance Agency
Revenue Bonds
Linden Ponds, Inc. Facility
Series 2011B
11/15/56 0.000% | | 07/07/2008 - 06/04/2011 | | | 10,062 | | |
Middlesex County Improvement Authority
Subordinated Revenue Bonds
Heldrich Center Hotel
Series 2005B
01/01/37 6.250% | | 03/18/2005 | | | 3,865,993 | | |
Middlesex County Improvement Authority
Revenue Bonds
Heldrich Center Hotel
Series 2005C
01/01/37 8.750% | | 09/25/2007 | | | 1,461,135 | | |
Rankin County Five Lakes Utility District
Series 1994
07/15/37 7.000% | | 10/02/2007 | | | 445,000 | | |
Resolution Trust Corp.
Pass-Through Certificates
Series 1993A
12/01/16 8.500% | | 08/27/1993 | | | 6,635,517 | | |
Toledo-Lucas County Port Authority
Special Assessment Bonds
Town Square at Levi Commons
Series 2007
11/01/36 5.400% | | 08/15/2007 | | | 2,605,000 | | |
(e) Represents securities that have defaulted on payment of interest. The Fund has stopped accruing interest on these securities. At July 31, 2015, the value of these securities amounted to $6,167,418, which represents 0.15% of net assets.
(f) Zero coupon bond.
(g) Variable rate security.
(h) Security, or a portion thereof, has been purchased on a when-issued or delayed delivery basis.
The accompanying Notes to Financial Statements are an integral part of this statement.
Annual Report 2015
34
PORTFOLIO OF INVESTMENTS (continued)
July 31, 2015
Notes to Portfolio of Investments (continued)
(i) The Fund entered into transactions in which it transfers to trusts fixed rate municipal bonds in exchange for cash and residual interests in the trusts' assets and cash flows, which are in the form of inverse floating rate securities. The trust funds the purchases of the municipal bonds by issuing short-term floating rate notes to third parties. The municipal bonds transferred to the trusts remain in the Fund's Portfolio of Investments.
(j) The Fund is entitled to receive principal and interest from the guarantor after a day or a week's notice or upon maturity. The maturity date disclosed represents the final maturity.
(k) The rate shown is the seven-day current annualized yield at July 31, 2015.
Abbreviation Legend
AGM Assured Guaranty Municipal Corporation
AMBAC Ambac Assurance Corporation
AMT Alternative Minimum Tax
FGIC Financial Guaranty Insurance Company
FHLMC Federal Home Loan Mortgage Corporation
FNMA Federal National Mortgage Association
GNMA Government National Mortgage Association
IBC Insurance Bond Certificate
MGIC Mortgage Guaranty Insurance Corporation
NPFGC National Public Finance Guarantee Corporation
TCRS Transferable Custodial Receipts
VRDN Variable Rate Demand Note
Fair Value Measurements
The Fund categorizes its fair value measurements according to a three-level hierarchy that maximizes the use of observable inputs and minimizes the use of unobservable inputs by prioritizing that the most observable input be used when available. Observable inputs are those that market participants would use in pricing an investment based on market data obtained from sources independent of the reporting entity. Unobservable inputs are those that reflect the Fund's assumptions about the information market participants would use in pricing an investment. An investment's level within the fair value hierarchy is based on the lowest level of any input that is deemed significant to the asset's or liability's fair value measurement. The input levels are not necessarily an indication of the risk or liquidity associated with investments at that level. For example, certain U.S. government securities are generally high quality and liquid, however, they are reflected as Level 2 because the inputs used to determine fair value may not always be quoted prices in an active market.
Fair value inputs are summarized in the three broad levels listed below:
> Level 1 — Valuations based on quoted prices for investments in active markets that the Fund has the ability to access at the measurement date (including NAV for open-end mutual funds). Valuation adjustments are not applied to Level 1 investments.
> Level 2 — Valuations based on other significant observable inputs (including quoted prices for similar securities, interest rates, prepayment speeds, credit risks, etc.).
> Level 3 — Valuations based on significant unobservable inputs (including the Fund's own assumptions and judgment in determining the fair value of investments).
Inputs that are used in determining fair value of an investment may include price information, credit data, volatility statistics, and other factors. These inputs can be either observable or unobservable. The availability of observable inputs can vary between investments, and is affected by various factors such as the type of investment, and the volume and level of activity for that investment or similar investments in the marketplace. The inputs will be considered by the Investment Manager, along with any other relevant factors in the calculation of an investment's fair value. The Fund uses prices and inputs that are current as of the measurement date, which may include periods of market dislocations. During these periods, the availability of prices and inputs may be reduced for many investments. This condition could cause an investment to be reclassified between the various levels within the hierarchy.
Investments falling into the Level 3 category are primarily supported by quoted prices from brokers and dealers participating in the market for those investments. However, these may be classified as Level 3 investments due to lack of market transparency and corroboration to support these quoted prices. Additionally, valuation models may be used as the pricing source for any remaining investments classified as Level 3. These models may rely on one or more significant unobservable inputs and/or significant assumptions by the Investment Manager. Inputs used in valuations may include, but are not limited to, financial statement analysis, capital account balances, discount rates and estimated cash flows, and comparable company data.
The accompanying Notes to Financial Statements are an integral part of this statement.
Annual Report 2015
35
PORTFOLIO OF INVESTMENTS (continued)
July 31, 2015
Fair Value Measurements (continued)
Under the direction of the Fund's Board of Trustees (the Board), the Investment Manager's Valuation Committee (the Committee) is responsible for overseeing the valuation procedures approved by the Board. The Committee consists of voting and non-voting members from various groups within the Investment Manager's organization, including operations and accounting, trading and investments, compliance, risk management and legal.
The Committee meets at least monthly to review and approve valuation matters, which may include a description of specific valuation determinations, data regarding pricing information received from approved pricing vendors and brokers and the results of Board-approved valuation control policies and procedures (the Policies). The Policies address, among other things, instances when market quotations are or are not readily available, including recommendations of third party pricing vendors and a determination of appropriate pricing methodologies; events that require specific valuation determinations and assessment of fair value techniques; securities with a potential for stale pricing, including those that are illiquid, restricted, or in default; and the effectiveness of third party pricing vendors, including periodic reviews of vendors. The Committee meets more frequently, as needed, to discuss additional valuation matters, which may include the need to review back-testing results, review time-sensitive information or approve related valuation actions. The Committee reports to the Board, with members of the Committee meeting with the Board at each of its regularly scheduled meetings to discuss valuation matters and actions during the period, similar to those described earlier.
For investments categorized as Level 3, the Committee monitors information similar to that described above, which may include: (i) data specific to the issuer or comparable issuers, (ii) general market or specific sector news and (iii) quoted prices and specific or similar security transactions. The Committee considers this data and any changes from prior periods in order to assess the reasonableness of observable and unobservable inputs, any assumptions or internal models used to value those securities and changes in fair value. This data is also used to corroborate, when available, information received from approved pricing vendors and brokers. Various factors impact the frequency of monitoring this information (which may occur as often as daily). However, the Committee may determine that changes to inputs, assumptions and models are not required as a result of the monitoring procedures performed.
The following table is a summary of the inputs used to value the Fund's investments at July 31, 2015:
| | | Level 1
Quoted Prices in Active
Markets for Identical
Assets ($) | | Level 2
Other Significant
Observable Inputs ($) | | Level 3
Significant
Unobservable Inputs ($) | | Total ($) | |
Investments | |
Municipal Bonds | | | — | | | | 3,986,163,396 | | | | — | | | | 3,986,163,396 | | |
Municipal Bonds Held in Trust | | | — | | | | 18,209,920 | | | | — | | | | 18,209,920 | | |
Floating Rate Notes | | | — | | | | 6,600,000 | | | | — | | | | 6,600,000 | | |
Money Market Funds | | | 57,986,837 | | | | — | | | | — | | | | 57,986,837 | | |
Total Investments | | | 57,986,837 | | | | 4,010,973,316 | | | | — | | | | 4,068,960,153 | | |
See the Portfolio of Investments for all investment classifications not indicated in the table.
The Fund's assets assigned to the Level 2 input category are generally valued using the market approach, in which a security's value is determined through reference to prices and information from market transactions for similar or identical assets.
There were no transfers of financial assets between levels during the period.
The accompanying Notes to Financial Statements are an integral part of this statement.
Annual Report 2015
36
STATEMENT OF ASSETS AND LIABILITIES
July 31, 2015
Assets | |
Investments, at value | |
(identified cost $3,761,543,506) | | $ | 4,068,960,153 | | |
Receivable for: | |
Investments sold | | | 2,521,339 | | |
Capital shares sold | | | 12,626,266 | | |
Interest | | | 45,538,922 | | |
Prepaid expenses | | | 43,030 | | |
Trustees' deferred compensation plan | | | 374,289 | | |
Total assets | | | 4,130,063,999 | | |
Liabilities | |
Short-term floating rate notes outstanding | | | 12,000,000 | | |
Payable for: | |
Investments purchased | | | 255,620 | | |
Investments purchased on a delayed delivery basis | | | 2,601,714 | | |
Capital shares purchased | | | 4,698,304 | | |
Dividend distributions to shareholders | | | 14,340,200 | | |
Investment management fees | | | 41,578 | | |
Distribution and/or service fees | | | 20,046 | | |
Transfer agent fees | | | 400,690 | | |
Administration fees | | | 6,620 | | |
Compensation of board members | | | 46,201 | | |
Chief compliance officer expenses | | | 183 | | |
Other expenses | | | 382,784 | | |
Trustees' deferred compensation plan | | | 374,289 | | |
Total liabilities | | | 35,168,229 | | |
Net assets applicable to outstanding capital stock | | $ | 4,094,895,770 | | |
Represented by | |
Paid-in capital | | $ | 3,819,846,515 | | |
Undistributed net investment income | | | 21,311,418 | | |
Accumulated net realized loss | | | (53,678,810 | ) | |
Unrealized appreciation (depreciation) on: | |
Investments | | | 307,416,647 | | |
Total — representing net assets applicable to outstanding capital stock | | $ | 4,094,895,770 | | |
The accompanying Notes to Financial Statements are an integral part of this statement.
Annual Report 2015
37
STATEMENT OF ASSETS AND LIABILITIES (continued)
July 31, 2015
Class A | |
Net assets | | $ | 3,238,956,189 | | |
Shares outstanding | | | 233,973,520 | | |
Net asset value per share | | $ | 13.84 | | |
Maximum offering price per share(a) | | $ | 14.27 | | |
Class B | |
Net assets | | $ | 2,041,341 | | |
Shares outstanding | | | 147,608 | | |
Net asset value per share | | $ | 13.83 | | |
Class C | |
Net assets | | $ | 99,273,102 | | |
Shares outstanding | | | 7,174,252 | | |
Net asset value per share | | $ | 13.84 | | |
Class R4 | |
Net assets | | $ | 1,634,254 | | |
Shares outstanding | | | 118,085 | | |
Net asset value per share | | $ | 13.84 | | |
Class R5 | |
Net assets | | $ | 622,360 | | |
Shares outstanding | | | 44,965 | | |
Net asset value per share | | $ | 13.84 | | |
Class Z | |
Net assets | | $ | 752,368,524 | | |
Shares outstanding | | | 54,343,659 | | |
Net asset value per share | | $ | 13.84 | | |
(a) The maximum offering price per share is calculated by dividing the net asset value per share by 1.0 minus the maximum sales charge of 3.00%.
The accompanying Notes to Financial Statements are an integral part of this statement.
Annual Report 2015
38
STATEMENT OF OPERATIONS
Year Ended July 31, 2015
Net investment income | |
Income: | |
Dividends | | $ | 3,339 | | |
Interest | | | 201,235,441 | | |
Total income | | | 201,238,780 | | |
Expenses: | |
Investment management fees | | | 15,029,336 | | |
Distribution and/or service fees | |
Class A | | | 6,628,301 | | |
Class B | | | 26,762 | | |
Class C | | | 928,289 | | |
Transfer agent fees | |
Class A | | | 3,893,773 | | |
Class B | | | 3,301 | | |
Class C | | | 114,877 | | |
Class R4 | | | 1,786 | | |
Class R5 | | | 192 | | |
Class Z | | | 731,784 | | |
Administration fees | | | 2,394,304 | | |
Compensation of board members | | | 98,575 | | |
Custodian fees | | | 27,896 | | |
Printing and postage fees | | | 191,302 | | |
Registration fees | | | 118,506 | | |
Professional fees | | | 168,444 | | |
Interest expense | | | 76,834 | | |
Chief compliance officer expenses | | | 2,009 | | |
Other | | | 121,284 | | |
Total expenses | | | 30,557,555 | | |
Fees waived by Distributor — Class C | | | (160,023 | ) | |
Expense reductions | | | (3,912 | ) | |
Total net expenses | | | 30,393,620 | | |
Net investment income | | | 170,845,160 | | |
Realized and unrealized gain (loss) — net | |
Net realized gain (loss) on: | |
Investments | | | 39,508,642 | | |
Net realized gain | | | 39,508,642 | | |
Net change in unrealized appreciation (depreciation) on: | |
Investments | | | (37,400,245 | ) | |
Net change in unrealized depreciation | | | (37,400,245 | ) | |
Net realized and unrealized gain | | | 2,108,397 | | |
Net increase in net assets resulting from operations | | $ | 172,953,557 | | |
The accompanying Notes to Financial Statements are an integral part of this statement.
Annual Report 2015
39
STATEMENT OF CHANGES IN NET ASSETS
| | | Year Ended
July 31,
2015 | | Year Ended
July 31,
2014(a) | |
Operations | |
Net investment income | | $ | 170,845,160 | | | $ | 179,427,457 | | |
Net realized gain | | | 39,508,642 | | | | 10,851,509 | | |
Net change in unrealized appreciation (depreciation) | | | (37,400,245 | ) | | | 113,164,811 | | |
Net increase in net assets resulting from operations | | | 172,953,557 | | | | 303,443,777 | | |
Distributions to shareholders | |
Net investment income | |
Class A | | | (138,541,543 | ) | | | (146,368,923 | ) | |
Class B | | | (96,524 | ) | | | (164,148 | ) | |
Class C | | | (3,512,467 | ) | | | (3,666,007 | ) | |
Class R4 | | | (66,353 | ) | | | (30,965 | ) | |
Class R5 | | | (17,129 | ) | | | (2,624 | ) | |
Class Z | | | (27,232,176 | ) | | | (26,565,323 | ) | |
Total distributions to shareholders | | | (169,466,192 | ) | | | (176,797,990 | ) | |
Increase (decrease) in net assets from capital stock activity | | | 108,986,662 | | | | (456,194,559 | ) | |
Proceeds from regulatory settlements (Note 6) | | | 1,138,577 | | | | — | | |
Total increase (decrease) in net assets | | | 113,612,604 | | | | (329,548,772 | ) | |
Net assets at beginning of year | | | 3,981,283,166 | | | | 4,310,831,938 | | |
Net assets at end of year | | $ | 4,094,895,770 | | | $ | 3,981,283,166 | | |
Undistributed net investment income | | $ | 21,311,418 | | | $ | 18,789,073 | | |
(a) Class R5 shares are based on operations from December 11, 2013 (commencement of operations) through the stated period end.
The accompanying Notes to Financial Statements are an integral part of this statement.
Annual Report 2015
40
STATEMENT OF CHANGES IN NET ASSETS (continued)
| | | Year Ended July 31, 2015 | | Year Ended July 31, 2014(a) | |
| | | Shares | | Dollars ($) | | Shares | | Dollars ($) | |
Capital stock activity | |
Class A shares | |
Subscriptions(b) | | | 9,167,141 | | | | 128,420,367 | | | | 6,427,346 | | | | 87,089,242 | | |
Distributions reinvested | | | 8,086,782 | | | | 113,294,556 | | | | 8,768,016 | | | | 118,551,845 | | |
Redemptions | | | (23,038,191 | ) | | | (322,256,213 | ) | | | (40,533,666 | ) | | | (544,036,422 | ) | |
Net decrease | | | (5,784,268 | ) | | | (80,541,290 | ) | | | (25,338,304 | ) | | | (338,395,335 | ) | |
Class B shares | |
Subscriptions | | | 8,859 | | | | 123,601 | | | | 3,698 | | | | 50,836 | | |
Distributions reinvested | | | 5,815 | | | | 81,431 | | | | 10,394 | | | | 140,071 | | |
Redemptions(b) | | | (116,342 | ) | | | (1,627,299 | ) | | | (201,463 | ) | | | (2,711,432 | ) | |
Net decrease | | | (101,668 | ) | | | (1,422,267 | ) | | | (187,371 | ) | | | (2,520,525 | ) | |
Class C shares | |
Subscriptions | | | 1,189,363 | | | | 16,642,965 | | | | 679,353 | | | | 9,253,314 | | |
Distributions reinvested | | | 206,104 | | | | 2,885,662 | | | | 219,288 | | | | 2,962,618 | | |
Redemptions | | | (929,181 | ) | | | (12,981,541 | ) | | | (2,073,103 | ) | | | (27,750,794 | ) | |
Net increase (decrease) | | | 466,286 | | | | 6,547,086 | | | | (1,174,462 | ) | | | (15,534,862 | ) | |
Class R4 shares | |
Subscriptions | | | 39,946 | | | | 558,043 | | | | 92,894 | | | | 1,256,619 | | |
Distributions reinvested | | | 4,707 | | | | 65,898 | | | | 2,250 | | | | 30,732 | | |
Redemptions | | | (23,563 | ) | | | (330,615 | ) | | | (5,956 | ) | | | (80,637 | ) | |
Net increase | | | 21,090 | | | | 293,326 | | | | 89,188 | | | | 1,206,714 | | |
Class R5 shares | |
Subscriptions | | | 23,203 | | | | 322,245 | | | | 22,473 | | | | 309,657 | | |
Distributions reinvested | | | 1,191 | | | | 16,669 | | | | 176 | | | | 2,434 | | |
Redemptions | | | (2,002 | ) | | | (27,880 | ) | | | (76 | ) | | | (1,053 | ) | |
Net increase | | | 22,392 | | | | 311,034 | | | | 22,573 | | | | 311,038 | | |
Class Z shares | |
Subscriptions | | | 16,880,119 | | | | 235,743,464 | | | | 2,584,409 | | | | 35,044,075 | | |
Distributions reinvested | | | 683,300 | | | | 9,573,139 | | | | 651,192 | | | | 8,808,391 | | |
Redemptions | | | (4,396,012 | ) | | | (61,517,830 | ) | | | (10,851,508 | ) | | | (145,114,055 | ) | |
Net increase (decrease) | | | 13,167,407 | | | | 183,798,773 | | | | (7,615,907 | ) | | | (101,261,589 | ) | |
Total net increase (decrease) | | | 7,791,239 | | | | 108,986,662 | | | | (34,204,283 | ) | | | (456,194,559 | ) | |
(a) Class R5 shares are based on operations from December 11, 2013 (commencement of operations) through the stated period end.
(b) Includes conversions of Class B shares to Class A shares, if any.
The accompanying Notes to Financial Statements are an integral part of this statement.
Annual Report 2015
41
The following tables are intended to help you understand the Fund's financial performance. Certain information reflects financial results for a single share of a class held for the periods shown. Per share net investment income (loss) amounts are calculated based on average shares outstanding during the period. Total return assumes reinvestment of all dividends and distributions, if any. Total return does not reflect payment of sales charges, if any. Total return and portfolio turnover are not annualized for periods of less than one year. The portfolio turnover rate is calculated without regard to purchase and sales transactions of short-term instruments and certain derivatives, if any. If such transactions were included, the Fund's portfolio turnover rate may be higher.
| | | Year Ended July 31, | | Year Ended
November 30, | |
Class A | | 2015 | | 2014 | | 2013 | | 2012(a) | | 2011 | | 2010 | |
Per share data | |
Net asset value, beginning of period | | $ | 13.82 | | | $ | 13.38 | | | $ | 14.27 | | | $ | 13.43 | | | $ | 13.13 | | | $ | 13.05 | | |
Income from investment operations: | |
Net investment income | | | 0.59 | | | | 0.60 | | | | 0.57 | | | | 0.39 | | | | 0.58 | | | | 0.59 | | |
Net realized and unrealized gain (loss) | | | 0.02 | | | | 0.43 | | | | (0.89 | ) | | | 0.83 | | | | 0.31 | | | | 0.08 | | |
Total from investment operations | | | 0.61 | | | | 1.03 | | | | (0.32 | ) | | | 1.22 | | | | 0.89 | | | | 0.67 | | |
Less distributions to shareholders: | |
Net investment income | | | (0.59 | ) | | | (0.59 | ) | | | (0.57 | ) | | | (0.38 | ) | | | (0.59 | ) | | | (0.59 | ) | |
Total distributions to shareholders | | | (0.59 | ) | | | (0.59 | ) | | | (0.57 | ) | | | (0.38 | ) | | | (0.59 | ) | | | (0.59 | ) | |
Proceeds from regulatory settlements | | | 0.00 | (b) | | | — | | | | — | | | | 0.00 | (b) | | | — | | | | 0.00 | (b) | |
Net asset value, end of period | | $ | 13.84 | | | $ | 13.82 | | | $ | 13.38 | | | $ | 14.27 | | | $ | 13.43 | | | $ | 13.13 | | |
Total return | | | 4.41 | %(c) | | | 7.89 | % | | | (2.42 | %) | | | 9.18 | % | | | 7.00 | % | | | 5.12 | % | |
Ratios to average net assets(d) | |
Total gross expenses | | | 0.77 | %(e) | | | 0.77 | %(e) | | | 0.76 | %(e) | | | 0.76 | %(e)(f) | | | 0.76 | %(e) | | | 0.80 | %(e) | |
Total net expenses(g) | | | 0.77 | %(e)(h) | | | 0.77 | %(e)(h) | | | 0.76 | %(e)(h) | | | 0.76 | %(e)(f)(h) | | | 0.75 | %(e)(h) | | | 0.80 | %(e)(h) | |
Net investment income | | | 4.21 | % | | | 4.44 | % | | | 4.02 | % | | | 4.17 | %(f) | | | 4.41 | % | | | 4.43 | % | |
Supplemental data | |
Net assets, end of period (in thousands) | | $ | 3,238,956 | | | $ | 3,314,256 | | | $ | 3,546,639 | | | $ | 3,848,957 | | | $ | 3,708,744 | | | $ | 1,305,921 | | |
Portfolio turnover | | | 13 | % | | | 10 | % | | | 8 | % | | | 5 | % | | | 11 | % | | | 11 | % | |
Notes to Financial Highlights
(a) For the period from December 1, 2011 to July 31, 2012. During the period, the Fund's fiscal year end was changed from November 30 to July 31.
(b) Rounds to zero.
(c) The Fund received proceeds from regulatory settlements. Had the Fund not received these proceeds, the total return would have been lower by 0.03%.
(d) In addition to the fees and expenses that the Fund bears directly, the Fund indirectly bears a pro rata share of the fees and expenses of any other funds in which it invests. Such indirect expenses are not included in the Fund's reported expense ratios.
(e) Ratios include interest and fee expense related to the participation in certain inverse floater programs which is less than 0.01%. Due to an equal increase in interest income from fixed rate municipal bonds held in trust, there is no impact on the Fund's net assets, net asset value per share, total return or net investment income.
(f) Annualized.
(g) Total net expenses include the impact of certain fee waivers/expense reimbursements made by the Investment Manager and certain of its affiliates, if applicable.
(h) The benefits derived from expense reductions had an impact of less than 0.01%.
The accompanying Notes to Financial Statements are an integral part of this statement.
Annual Report 2015
42
FINANCIAL HIGHLIGHTS (continued)
| | | Year Ended July 31, | | Year Ended
November 30, | |
Class B | | 2015 | | 2014 | | 2013 | | 2012(a) | | 2011 | | 2010 | |
Per share data | |
Net asset value, beginning of period | | $ | 13.81 | | | $ | 13.37 | | | $ | 14.26 | | | $ | 13.42 | | | $ | 13.13 | | | $ | 13.05 | | |
Income from investment operations: | |
Net investment income | | | 0.48 | | | | 0.50 | | | | 0.46 | | | | 0.32 | | | | 0.48 | | | | 0.49 | | |
Net realized and unrealized gain (loss) | | | 0.02 | | | | 0.43 | | | | (0.89 | ) | | | 0.84 | | | | 0.30 | | | | 0.08 | | |
Total from investment operations | | | 0.50 | | | | 0.93 | | | | (0.43 | ) | | | 1.16 | | | | 0.78 | | | | 0.57 | | |
Less distributions to shareholders: | |
Net investment income | | | (0.48 | ) | | | (0.49 | ) | | | (0.46 | ) | | | (0.32 | ) | | | (0.49 | ) | | | (0.49 | ) | |
Total distributions to shareholders | | | (0.48 | ) | | | (0.49 | ) | | | (0.46 | ) | | | (0.32 | ) | | | (0.49 | ) | | | (0.49 | ) | |
Proceeds from regulatory settlements | | | 0.00 | (b) | | | — | | | | — | | | | 0.00 | (b) | | | — | | | | 0.00 | (b) | |
Net asset value, end of period | | $ | 13.83 | | | $ | 13.81 | | | $ | 13.37 | | | $ | 14.26 | | | $ | 13.42 | | | $ | 13.13 | | |
Total return | | | 3.63 | %(c) | | | 7.09 | % | | | (3.15 | %) | | | 8.68 | % | | | 6.12 | % | | | 4.34 | % | |
Ratios to average net assets(d) | |
Total gross expenses | | | 1.52 | %(e) | | | 1.52 | %(e) | | | 1.51 | %(e) | | | 1.51 | %(e)(f) | | | 1.51 | %(e) | | | 1.55 | %(e) | |
Total net expenses(g) | | | 1.52 | %(e)(h) | | | 1.52 | %(e)(h) | | | 1.51 | %(e)(h) | | | 1.51 | %(e)(f)(h) | | | 1.50 | %(e)(h) | | | 1.55 | %(e)(h) | |
Net investment income | | | 3.46 | % | | | 3.69 | % | | | 3.26 | % | | | 3.41 | %(f) | | | 3.65 | % | | | 3.69 | % | |
Supplemental data | |
Net assets, end of period (in thousands) | | $ | 2,041 | | | $ | 3,442 | | | $ | 5,836 | | | $ | 9,008 | | | $ | 12,630 | | | $ | 6,817 | | |
Portfolio turnover | | | 13 | % | | | 10 | % | | | 8 | % | | | 5 | % | | | 11 | % | | | 11 | % | |
Notes to Financial Highlights
(a) For the period from December 1, 2011 to July 31, 2012. During the period, the Fund's fiscal year end was changed from November 30 to July 31.
(b) Rounds to zero.
(c) The Fund received proceeds from regulatory settlements. Had the Fund not received these proceeds, the total return would have been lower by 0.03%.
(d) In addition to the fees and expenses that the Fund bears directly, the Fund indirectly bears a pro rata share of the fees and expenses of any other funds in which it invests. Such indirect expenses are not included in the Fund's reported expense ratios.
(e) Ratios include interest and fee expense related to the participation in certain inverse floater programs which is less than 0.01%. Due to an equal increase in interest income from fixed rate municipal bonds held in trust, there is no impact on the Fund's net assets, net asset value per share, total return or net investment income.
(f) Annualized.
(g) Total net expenses include the impact of certain fee waivers/expense reimbursements made by the Investment Manager and certain of its affiliates, if applicable.
(h) The benefits derived from expense reductions had an impact of less than 0.01%.
The accompanying Notes to Financial Statements are an integral part of this statement.
Annual Report 2015
43
FINANCIAL HIGHLIGHTS (continued)
| | | Year Ended July 31, | | Year Ended
November 30, | |
Class C | | 2015 | | 2014 | | 2013 | | 2012(a) | | 2011 | | 2010 | |
Per share data | |
Net asset value, beginning of period | | $ | 13.82 | | | $ | 13.37 | | | $ | 14.26 | | | $ | 13.43 | | | $ | 13.13 | | | $ | 13.05 | | |
Income from investment operations: | |
Net investment income | | | 0.51 | | | | 0.54 | | | | 0.49 | | | | 0.33 | | | | 0.50 | | | | 0.51 | | |
Net realized and unrealized gain (loss) | | | 0.01 | | | | 0.44 | | | | (0.89 | ) | | | 0.83 | | | | 0.31 | | | | 0.08 | | |
Total from investment operations | | | 0.52 | | | | 0.98 | | | | (0.40 | ) | | | 1.16 | | | | 0.81 | | | | 0.59 | | |
Less distributions to shareholders: | |
Net investment income | | | (0.50 | ) | | | (0.53 | ) | | | (0.49 | ) | | | (0.33 | ) | | | (0.51 | ) | | | (0.51 | ) | |
Total distributions to shareholders | | | (0.50 | ) | | | (0.53 | ) | | | (0.49 | ) | | | (0.33 | ) | | | (0.51 | ) | | | (0.51 | ) | |
Proceeds from regulatory settlements | | | 0.00 | (b) | | | — | | | | — | | | | 0.00 | (b) | | | — | | | | 0.00 | (b) | |
Net asset value, end of period | | $ | 13.84 | | | $ | 13.82 | | | $ | 13.37 | | | $ | 14.26 | | | $ | 13.43 | | | $ | 13.13 | | |
Total return | | | 3.80 | %(c) | | | 7.48 | % | | | (2.97 | %) | | | 8.70 | % | | | 6.36 | % | | | 4.49 | % | |
Ratios to average net assets(d) | |
Total gross expenses | | | 1.52 | %(e) | | | 1.52 | %(e) | | | 1.51 | %(e) | | | 1.51 | %(e)(f) | | | 1.52 | %(e) | | | 1.55 | %(e) | |
Total net expenses(g) | | | 1.36 | %(e)(h) | | | 1.22 | %(e)(h) | | | 1.31 | %(e)(h) | | | 1.36 | %(e)(f)(h) | | | 1.36 | %(e)(h) | | | 1.40 | %(e)(h) | |
Net investment income | | | 3.63 | % | | | 3.99 | % | | | 3.47 | % | | | 3.57 | %(f) | | | 3.82 | % | | | 3.83 | % | |
Supplemental data | |
Net assets, end of period (in thousands) | | $ | 99,273 | | | $ | 92,689 | | | $ | 105,414 | | | $ | 93,117 | | | $ | 81,742 | | | $ | 37,377 | | |
Portfolio turnover | | | 13 | % | | | 10 | % | | | 8 | % | | | 5 | % | | | 11 | % | | | 11 | % | |
Notes to Financial Highlights
(a) For the period from December 1, 2011 to July 31, 2012. During the period, the Fund's fiscal year end was changed from November 30 to July 31.
(b) Rounds to zero.
(c) The Fund received proceeds from regulatory settlements. Had the Fund not received these proceeds, the total return would have been lower by 0.03%.
(d) In addition to the fees and expenses that the Fund bears directly, the Fund indirectly bears a pro rata share of the fees and expenses of any other funds in which it invests. Such indirect expenses are not included in the Fund's reported expense ratios.
(e) Ratios include interest and fee expense related to the participation in certain inverse floater programs which is less than 0.01%. Due to an equal increase in interest income from fixed rate municipal bonds held in trust, there is no impact on the Fund's net assets, net asset value per share, total return or net investment income.
(f) Annualized.
(g) Total net expenses include the impact of certain fee waivers/expense reimbursements made by the Investment Manager and certain of its affiliates, if applicable.
(h) The benefits derived from expense reductions had an impact of less than 0.01%.
The accompanying Notes to Financial Statements are an integral part of this statement.
Annual Report 2015
44
FINANCIAL HIGHLIGHTS (continued)
| | | Year Ended July 31, | |
Class R4 | | 2015 | | 2014 | | 2013(a) | |
Per share data | |
Net asset value, beginning of period | | $ | 13.82 | | | $ | 13.37 | | | $ | 14.23 | | |
Income from investment operations: | |
Net investment income | | | 0.62 | | | | 0.63 | | | | 0.22 | | |
Net realized and unrealized gain (loss) | | | 0.01 | | | | 0.44 | | | | (0.86 | ) | |
Total from investment operations | | | 0.63 | | | | 1.07 | | | | (0.64 | ) | |
Less distributions to shareholders: | |
Net investment income | | | (0.61 | ) | | | (0.62 | ) | | | (0.22 | ) | |
Total distributions to shareholders | | | (0.61 | ) | | | (0.62 | ) | | | (0.22 | ) | |
Proceeds from regulatory settlements | | | 0.00 | (b) | | | — | | | | — | | |
Net asset value, end of period | | $ | 13.84 | | | $ | 13.82 | | | $ | 13.37 | | |
Total return | | | 4.62 | %(c) | | | 8.18 | % | | | (4.56 | %) | |
Ratios to average net assets(d) | |
Total gross expenses | | | 0.57 | %(e) | | | 0.57 | %(e) | | | 0.56 | %(e)(f) | |
Total net expenses(g) | | | 0.57 | %(e)(h) | | | 0.57 | %(e)(h) | | | 0.56 | %(e)(f)(h) | |
Net investment income | | | 4.42 | % | | | 4.63 | % | | | 4.39 | %(f) | |
Supplemental data | |
Net assets, end of period (in thousands) | | $ | 1,634 | | | $ | 1,340 | | | $ | 104 | | |
Portfolio turnover | | | 13 | % | | | 10 | % | | | 8 | % | |
Notes to Financial Highlights
(a) Based on operations from March 19, 2013 (commencement of operations) through the stated period end.
(b) Rounds to zero.
(c) The Fund received proceeds from regulatory settlements. Had the Fund not received these proceeds, the total return would have been lower by 0.03%.
(d) In addition to the fees and expenses that the Fund bears directly, the Fund indirectly bears a pro rata share of the fees and expenses of any other funds in which it invests. Such indirect expenses are not included in the Fund's reported expense ratios.
(e) Ratios include interest and fee expense related to the participation in certain inverse floater programs which is less than 0.01%. Due to an equal increase in interest income from fixed rate municipal bonds held in trust, there is no impact on the Fund's net assets, net asset value per share, total return or net investment income.
(f) Annualized.
(g) Total net expenses include the impact of certain fee waivers/expense reimbursements made by the Investment Manager and certain of its affiliates, if applicable.
(h) The benefits derived from expense reductions had an impact of less than 0.01%.
The accompanying Notes to Financial Statements are an integral part of this statement.
Annual Report 2015
45
FINANCIAL HIGHLIGHTS (continued)
| | | Year Ended July 31, | |
Class R5 | | 2015 | | 2014(a) | |
Per share data | |
Net asset value, beginning of period | | $ | 13.82 | | | $ | 13.27 | | |
Income from investment operations: | |
Net investment income | | | 0.63 | | | | 0.41 | | |
Net realized and unrealized gain | | | 0.01 | | | | 0.54 | | |
Total from investment operations | | | 0.64 | | | | 0.95 | | |
Less distributions to shareholders: | |
Net investment income | | | (0.62 | ) | | | (0.40 | ) | |
Total distributions to shareholders | | | (0.62 | ) | | | (0.40 | ) | |
Proceeds from regulatory settlements | | | 0.00 | (b) | | | — | | |
Net asset value, end of period | | $ | 13.84 | | | $ | 13.82 | | |
Total return | | | 4.69 | %(c) | | | 7.24 | % | |
Ratios to average net assets(d) | |
Total gross expenses | | | 0.50 | %(e) | | | 0.51 | %(e)(f) | |
Total net expenses(g) | | | 0.50 | %(e) | | | 0.51 | %(e)(f) | |
Net investment income | | | 4.51 | % | | | 4.69 | %(f) | |
Supplemental data | |
Net assets, end of period (in thousands) | | $ | 622 | | | $ | 312 | | |
Portfolio turnover | | | 13 | % | | | 10 | % | |
Notes to Financial Highlights
(a) Based on operations from December 11, 2013 (commencement of operations) through the stated period end.
(b) Rounds to zero.
(c) The Fund received proceeds from regulatory settlements. Had the Fund not received these proceeds, the total return would have been lower by 0.03%.
(d) In addition to the fees and expenses that the Fund bears directly, the Fund indirectly bears a pro rata share of the fees and expenses of any other funds in which it invests. Such indirect expenses are not included in the Fund's reported expense ratios.
(e) Ratios include interest and fee expense related to the participation in certain inverse floater programs which is less than 0.01%. Due to an equal increase in interest income from fixed rate municipal bonds held in trust, there is no impact on the Fund's net assets, net asset value per share, total return or net investment income.
(f) Annualized.
(g) Total net expenses include the impact of certain fee waivers/expense reimbursements made by the Investment Manager and certain of its affiliates, if applicable.
The accompanying Notes to Financial Statements are an integral part of this statement.
Annual Report 2015
46
FINANCIAL HIGHLIGHTS (continued)
| | | Year Ended July 31, | | Year Ended
November 30, | |
Class Z | | 2015 | | 2014 | | 2013 | | 2012(a) | | 2011 | | 2010 | |
Per share data | |
Net asset value, beginning of period | | $ | 13.82 | | | $ | 13.38 | | | $ | 14.27 | | | $ | 13.43 | | | $ | 13.13 | | | $ | 13.05 | | |
Income from investment operations: | |
Net investment income | | | 0.62 | | | | 0.63 | | | | 0.60 | | | | 0.41 | | | | 0.61 | | | | 0.62 | | |
Net realized and unrealized gain (loss) | | | 0.01 | | | | 0.43 | | | | (0.90 | ) | | | 0.83 | | | | 0.30 | | | | 0.07 | | |
Total from investment operations | | | 0.63 | | | | 1.06 | | | | (0.30 | ) | | | 1.24 | | | | 0.91 | | | | 0.69 | | |
Less distributions to shareholders: | |
Net investment income | | | (0.61 | ) | | | (0.62 | ) | | | (0.59 | ) | | | (0.40 | ) | | | (0.61 | ) | | | (0.61 | ) | |
Total distributions to shareholders | | | (0.61 | ) | | | (0.62 | ) | | | (0.59 | ) | | | (0.40 | ) | | | (0.61 | ) | | | (0.61 | ) | |
Proceeds from regulatory settlements | | | 0.00 | (b) | | | — | | | | — | | | | 0.00 | (b) | | | — | | | | 0.00 | (b) | |
Net asset value, end of period | | $ | 13.84 | | | $ | 13.82 | | | $ | 13.38 | | | $ | 14.27 | | | $ | 13.43 | | | $ | 13.13 | | |
Total return | | | 4.62 | %(c) | | | 8.10 | % | | | (2.22 | %) | | | 9.32 | % | | | 7.16 | % | | | 5.33 | % | |
Ratios to average net assets(d) | |
Total gross expenses | | | 0.57 | %(e) | | | 0.57 | %(e) | | | 0.56 | %(e) | | | 0.56 | %(e)(f) | | | 0.59 | %(e) | | | 0.60 | %(e) | |
Total net expenses(g) | | | 0.57 | %(e)(h) | | | 0.57 | %(e)(h) | | | 0.56 | %(e)(h) | | | 0.56 | %(e)(f)(h) | | | 0.56 | %(e)(h) | | | 0.60 | %(e)(h) | |
Net investment income | | | 4.41 | % | | | 4.63 | % | | | 4.21 | % | | | 4.37 | %(f) | | | 4.68 | % | | | 4.63 | % | |
Supplemental data | |
Net assets, end of period (in thousands) | | $ | 752,369 | | | $ | 569,243 | | | $ | 652,839 | | | $ | 780,836 | | | $ | 716,844 | | | $ | 793,302 | | |
Portfolio turnover | | | 13 | % | | | 10 | % | | | 8 | % | | | 5 | % | | | 11 | % | | | 11 | % | |
Notes to Financial Highlights
(a) For the period from December 1, 2011 to July 31, 2012. During the period, the Fund's fiscal year end was changed from November 30 to July 31.
(b) Rounds to zero.
(c) The Fund received proceeds from regulatory settlements. Had the Fund not received these proceeds, the total return would have been lower by 0.03%.
(d) In addition to the fees and expenses that the Fund bears directly, the Fund indirectly bears a pro rata share of the fees and expenses of any other funds in which it invests. Such indirect expenses are not included in the Fund's reported expense ratios.
(e) Ratios include interest and fee expense related to the participation in certain inverse floater programs which is less than 0.01%. Due to an equal increase in interest income from fixed rate municipal bonds held in trust, there is no impact on the Fund's net assets, net asset value per share, total return or net investment income.
(f) Annualized.
(g) Total net expenses include the impact of certain fee waivers/expense reimbursements made by the Investment Manager and certain of its affiliates, if applicable.
(h) The benefits derived from expense reductions had an impact of less than 0.01%.
The accompanying Notes to Financial Statements are an integral part of this statement.
Annual Report 2015
47
NOTES TO FINANCIAL STATEMENTS
July 31, 2015
Note 1. Organization
Columbia Tax-Exempt Fund (the Fund), a series of Columbia Funds Series Trust I (the Trust), is a diversified fund. The Trust is registered under the Investment Company Act of 1940, as amended (the 1940 Act), as an open-end management investment company organized as a Massachusetts business trust.
Fund Shares
The Trust may issue an unlimited number of shares (without par value). The Fund offers Class A, Class B, Class C, Class R4, Class R5 and Class Z shares. Although all share classes generally have identical voting, dividend and liquidation rights, each share class votes separately when required by the Trust's organizational documents or by law. Different share classes pay different distribution amounts to the extent the expenses of such share classes differ, and distributions in liquidation will be proportional to the net asset value of each share class. Each share class has its own expense and sales charge structure.
Class A shares are subject to a maximum front-end sales charge of 3.00% based on the initial investment amount. In addition, Class A shares purchased on or after February 19, 2015 are subject to a contingent deferred sales charge (CDSC) of 0.75% on certain investments of $500,000 or more if redeemed within 12 months after purchase. Redemptions of Class A shares purchased prior to February 19, 2015, without an initial sales charge in accounts aggregating $1 million to $50 million at the time of purchase, are subject to a CDSC of 1.00% if redeemed within 12 months after purchase, and 0.50% if redeemed more than 12, but less than 18, months after purchase.
Class B shares may be subject to a maximum CDSC of 5.00% based upon the holding period after purchase. Class B shares will generally convert to Class A shares eight years after purchase. The Fund no longer accepts investments by new or existing investors in the Fund's Class B shares, except in connection with the reinvestment of any dividend and/or capital gain distributions in Class B shares of the Fund and exchanges by existing Class B shareholders of certain other funds within the Columbia Family of Funds.
Class C shares are subject to a 1.00% CDSC on shares redeemed within one year after purchase.
Class R4 shares are not subject to sales charges and are generally available only to omnibus retirement plans
and certain investors as described in the Fund's prospectus.
Class R5 shares are not subject to sales charges and are generally available only to investors purchasing through authorized investment professionals and omnibus retirement plans.
Class Z shares are not subject to sales charges and are available only to eligible investors, which are subject to different investment minimums as described in the Fund's prospectus.
Note 2. Summary of Significant Accounting Policies
Basis of Preparation
The Fund is an investment company that applies the accounting and reporting guidance in the Financial Accounting Standards Board (FASB) Accounting Standards Codification Topic 946, Financial Services — Investment Companies (ASC 946). The financial statements are prepared in accordance with U.S. generally accepted accounting principles (GAAP), which requires management to make certain estimates and assumptions that affect the reported amounts of assets and liabilities, the disclosure of contingent assets and liabilities at the date of the financial statements and the reported amounts of income and expenses during the reporting period. Actual results could differ from those estimates.
The following is a summary of significant accounting policies followed by the Fund in the preparation of its financial statements.
Security Valuation
Debt securities generally are valued by pricing services approved by the Board of Trustees (the Board) based upon market transactions for normal, institutional-size trading units of similar securities. The services may use various pricing techniques that take into account, as applicable, factors such as yield, quality, coupon rate, maturity, type of issue, trading characteristics and other data, as well as broker quotes. Debt securities for which quotations are not readily available or not believed to be reflective of market value may also be valued based upon a bid quote from an approved independent broker-dealer.
Investments in open-end investment companies, including money market funds, are valued at their latest net asset value.
Annual Report 2015
48
NOTES TO FINANCIAL STATEMENTS (continued)
July 31, 2015
Debt securities maturing in 60 days or less are valued primarily at amortized cost value, unless this method results in a valuation that management believes does not approximate market value.
Investments for which market quotations are not readily available, or that have quotations which management believes are not reflective of market value or reliable, are valued at fair value as determined in good faith under procedures approved by and under the general supervision of the Board. If a security or class of securities (such as foreign securities) is valued at fair value, such value is likely to be different from the quoted or published price for the security.
The determination of fair value often requires significant judgment. To determine fair value, management may use assumptions including but not limited to future cash flows and estimated risk premiums. Multiple inputs from various sources may be used to determine fair value.
GAAP requires disclosure regarding the inputs and valuation techniques used to measure fair value and any changes in valuation inputs or techniques. In addition, investments shall be disclosed by major category. This information is disclosed following the Fund's Portfolio of Investments.
Delayed Delivery Securities
The Fund may trade securities on other than normal settlement terms, including securities purchased or sold on a "when-issued" basis. This may increase risk to the Fund since the other party to the transaction may fail to deliver, which could cause the Fund to subsequently invest at less advantageous prices. The Fund designates cash or liquid securities in an amount equal to the delayed delivery commitment.
Inverse Floater Program Transactions
The Fund may enter into transactions in which it transfers to trusts fixed rate municipal bonds in exchange for cash and residual interests in the trusts' assets and cash flows, which are in the form of inverse floating rate securities. The trusts fund the purchases of the municipal bonds by issuing short-term floating rate notes to third parties. The residual interests held by the Fund (inverse floating rate securities) include the right of the Fund (i) to cause the holders of the short-term floating rate notes to tender their notes at par, and (ii) to transfer the municipal bonds from the trusts to the Fund, thereby collapsing the trusts. The municipal bonds transferred to the trusts, if any, remain in the Fund's investments in securities and the related short-term
floating rate notes are reflected as Fund liabilities under the caption "Short-term floating rate notes outstanding" in the Statement of Assets and Liabilities. The liability approximates the fair market value of the short-term notes. The notes issued by the trusts have interest rates that are multi-modal, which means that they can be reset to a new or different mode at the reset date (e.g., mode can be daily, weekly, monthly, or a fixed specific date) at the discretion of the holder of the inverse floating rate security. The floating rate note holders have the option to tender their notes to the trusts for redemption at par at each reset date. The income received by the inverse floating rate security holder varies inversely with the short-term rate paid to the floating rate note holders, and in most circumstances the inverse floating rate security holder bears substantially all of the underlying bond's downside investment risk and also benefits disproportionately from any potential appreciation of the underlying bond's value. The inverse floating rate security holder will be subject to greater interest rate risk than if they were to hold the underlying bond because the interest rate is dependent on both the fixed coupon rate of the underlying bond and the short-term interest rate paid on the floating rate notes. The inverse floating rate security holder is also subject to the credit risk, liquidity risk and market risk associated with the underlying bond. The bonds held by the trusts serve as collateral for the short-term floating rate notes outstanding. Contractual maturities and interest rates of the municipal bonds held in trusts, if any, at July 31, 2015 are presented in the Portfolio of Investments. Interest and fee expense related to the short-term floating rate notes, which is accrued daily, is presented in the Statement of Operations and corresponds to an equal increase in interest income from the fixed rate municipal bonds held in trust. For the year ended July 31, 2015, the average value of short-term floating rate notes outstanding was $12,000,000 and the annualized average interest rate and fees related to these short-term floating rate notes was 0.05% and 0.52%.
Security Transactions
Security transactions are accounted for on the trade date. Cost is determined and gains (losses) are based upon the specific identification method for both financial statement and federal income tax purposes.
Income Recognition
Interest income is recorded on an accrual basis. Market premiums and discounts, including original issue discounts, are amortized and accreted, respectively, over
Annual Report 2015
49
NOTES TO FINANCIAL STATEMENTS (continued)
July 31, 2015
the expected life of the security on all debt securities, unless otherwise noted.
The Fund may place a debt security on non-accrual status and reduce related interest income when it becomes probable that the interest will not be collected and the amount of uncollectible interest can be reasonably estimated. A defaulted debt security is removed from non-accrual status when the issuer resumes interest payments or when collectibility of interest is reasonably assured.
Dividend income is recorded on the ex-dividend date.
Expenses
General expenses of the Trust are allocated to the Fund and other funds of the Trust based upon relative net assets or other expense allocation methodologies determined by the nature of the expense. Expenses directly attributable to the Fund are charged to the Fund. Expenses directly attributable to a specific class of shares are charged to that share class.
Determination of Class Net Asset Value
All income, expenses (other than class-specific expenses, which are charged to that share class, as shown in the Statement of Operations) and realized and unrealized gains (losses) are allocated to each class of the Fund on a daily basis, based on the relative net assets of each class, for purposes of determining the net asset value of each class.
Federal Income Tax Status
The Fund intends to qualify each year as a regulated investment company under Subchapter M of the Internal Revenue Code, as amended, and will distribute substantially all of its tax exempt and taxable income (including net short-term capital gains), if any, for its tax year, and as such will not be subject to federal income taxes. In addition, the Fund intends to distribute in each calendar year substantially all of its net investment income, capital gains and certain other amounts, if any, such that the Fund should not be subject to federal excise tax. Therefore, no federal income or excise tax provision is recorded.
Distributions to Shareholders
Distributions from net investment income, if any, are declared daily and paid monthly. Net realized capital gains, if any, are distributed at least annually. Income distributions and capital gain distributions are determined in accordance with federal income tax regulations, which may differ from GAAP.
Guarantees and Indemnifications
Under the Trust's organizational documents and, in some cases, by contract, its officers and trustees are indemnified against certain liabilities arising out of the performance of their duties to the Trust or its funds. In addition, certain of the Fund's contracts with its service providers contain general indemnification clauses. The Fund's maximum exposure under these arrangements is unknown since the amount of any future claims that may be made against the Fund cannot be determined, and the Fund has no historical basis for predicting the likelihood of any such claims.
Recent Accounting Pronouncement
Fair Value Measurement (Topic 820), Disclosure for Investments in Certain Entities That Calculate Net Asset Value per Share (or Its Equivalent)
In May 2015, the Financial Accounting Standards Board (FASB) issued Accounting Standards Update (ASU) No. 2015-07, Fair Value Measurement (Topic 820), Disclosure for Investments in Certain Entities That Calculate Net Asset Value per Share (or Its Equivalent). ASU No. 2015-07 changes the disclosure requirements for investments for which fair value is measured using the net asset value per share practical expedient. The disclosure requirements are effective for annual periods beginning after December 15, 2016 and interim periods within those fiscal years. At this time, management is evaluating the implications of this guidance and the impact it will have on the financial statement amounts and footnote disclosures, if any.
Note 3. Fees and Other Transactions with Affiliates
Investment Management Fees
Under an Investment Management Services Agreement, Columbia Management Investment Advisers, LLC (the Investment Manager), a wholly-owned subsidiary of Ameriprise Financial, Inc. (Ameriprise Financial), determines which securities will be purchased, held or sold. The investment management fee is an annual fee that is equal to a percentage of the Fund's average daily net assets that declines from 0.41% to 0.25% as the Fund's net assets increase. The effective investment management fee rate for the year ended July 31, 2015 was 0.37% of the Fund's average daily net assets.
Annual Report 2015
50
NOTES TO FINANCIAL STATEMENTS (continued)
July 31, 2015
Administration Fees
Under an Administrative Services Agreement, the Investment Manager also serves as the Fund Administrator. The Fund pays the Fund Administrator an annual fee for administration and accounting services equal to a percentage of the Fund's average daily net assets that declines from 0.07% to 0.04% as the Fund's net assets increase. The effective administration fee rate for the year ended July 31, 2015 was 0.06% of the Fund's average daily net assets.
Compensation of Board Members
Board members, who are not officers or employees of the Investment Manager or Ameriprise Financial, are compensated for their services to the Fund as disclosed in the Statement of Operations. These Board members may participate in a Deferred Compensation Plan (the Plan) which may be terminated at any time. Obligations of the Plan will be paid solely out of the Fund's assets, and all amounts payable under the Plan constitute a general unsecured obligation of the Fund.
Compensation of Chief Compliance Officer
The Board has appointed a Chief Compliance Officer to the Fund in accordance with federal securities regulations. The Fund is allocated a portion of the expenses associated with the Chief Compliance Officer based on relative net assets of the Trust.
Transfer Agency Fees
Under a Transfer and Dividend Disbursing Agent Agreement, Columbia Management Investment Services Corp. (the Transfer Agent), an affiliate of the Investment Manager and a wholly-owned subsidiary of Ameriprise Financial, is responsible for providing transfer agency services to the Fund. The Transfer Agent has contracted with Boston Financial Data Services (BFDS) to serve as sub-transfer agent.
Effective November 1, 2014, the Transfer Agent receives a monthly transfer agency fee based on the number or the average value of accounts, depending on the type of account. Prior to November 1, 2014, the Transfer Agent received a monthly account-based service fee based on the number of open accounts. In addition, the Transfer Agent also receives sub-transfer agency fees based on a percentage of the average aggregate value of the Fund's shares maintained in omnibus accounts (other than omnibus accounts for which American Enterprise Investment Services Inc. is the broker of record or accounts where the beneficial shareholder is a customer
of Ameriprise Financial Services, Inc., for which the Transfer Agent receives a per account fee). The Transfer Agent pays the fees of BFDS for services as sub-transfer agent and is not entitled to reimbursement for such fees from the Fund (with the exception of out-of-pocket fees).
The Transfer Agent also receives compensation from the Fund for various shareholder services and reimbursements for certain out-of-pocket fees. Total transfer agency fees for Class R5 shares are subject to an annual limitation of not more than 0.05% of the average daily net assets attributable to Class R5 shares.
For the year ended July 31, 2015, the Fund's effective transfer agency fee rates as a percentage of average daily net assets of each class were as follows:
Class A | | | 0.12 | % | |
Class B | | | 0.12 | | |
Class C | | | 0.12 | | |
Class R4 | | | 0.12 | | |
Class R5 | | | 0.05 | | |
Class Z | | | 0.12 | | |
The Fund and certain other associated investment companies have severally, but not jointly, guaranteed the performance and observance of all the terms and conditions of a lease entered into by Seligman Data Corp. (SDC), the former transfer agent, including the payment of rent by SDC (the Guaranty). SDC was the legacy Seligman funds' former transfer agent.
The lease and the Guaranty expire in January 2019. At July 31, 2015, the Fund's total potential future obligation over the life of the Guaranty is $409,993. The liability remaining at July 31, 2015 for non-recurring charges associated with the lease amounted to $240,918 and is recorded as a part of the payable for other expenses in the Statement of Assets and Liabilities.
An annual minimum account balance fee of $20 may apply to certain accounts with a value below the applicable share class's initial minimum investment requirements to reduce the impact of small accounts on transfer agency fees. These minimum account balance fees are remitted to the Fund and recorded as part of expense reductions in the Statement of Operations. For the year ended July 31, 2015, these minimum account balance fees reduced total expenses of the Fund by $3,912.
Distribution and Service Fees
The Fund has an agreement with Columbia Management Investment Distributors, Inc. (the Distributor), an affiliate
Annual Report 2015
51
NOTES TO FINANCIAL STATEMENTS (continued)
July 31, 2015
of the Investment Manager and a wholly-owned subsidiary of Ameriprise Financial, for distribution and shareholder services. The Board has approved, and the Fund has adopted, distribution and shareholder service plans (the Plans) applicable to certain share classes, which set the distribution and service fees for the Fund. These fees are calculated daily and are intended to compensate the Distributor and/or eligible selling and/or servicing agents for selling shares of the Fund and providing services to investors.
Under the Plans, the Fund pays a monthly service fee to the Distributor at the maximum annual rate of 0.20% of the average daily net assets attributable to Class A, Class B and Class C shares of the Fund. Also under the Plans, the Fund pays a monthly distribution fee to the Distributor at the maximum annual rate of 0.75% of the average daily net assets attributable to Class B and Class C shares only.
Effective December 1, 2014, the Distributor has voluntarily agreed to waive a portion of the distribution fee for Class C shares so that the distribution fee does not exceed 0.65% annually of the average daily net assets attributable to Class C shares. This arrangement may be modified or terminated by the Distributor at any time. Prior to December 1, 2014, the Distributor voluntarily waived a portion of the distribution fee for Class C shares so that the distribution fee did not exceed 0.45% annually of the average daily net assets attributable to Class C shares.
Sales Charges
Sales charges, including front-end charges and CDSCs, received by the Distributor for distributing Fund shares were $1,550,098 for Class A, $234 for Class B and $7,408 for Class C shares for the year ended July 31, 2015.
Expenses Waived/Reimbursed by the Investment Manager and its Affiliates
The Fund's expense ratio is subject to an expense reimbursement arrangement pursuant to which fees will be waived and/or expenses reimbursed (excluding certain fees and expenses described below), so that the Fund's net operating expenses, after giving effect to fees waived/expenses reimbursed and any balance credits
and/or overdraft charges from the Fund's custodian, do not exceed the annual rates of:
| | | Voluntary
Expense Cap
Effective
December 1, 2014 | | Contractual
Expense Cap
Prior to
December 1, 2014 | |
Class A | | | 0.80 | % | | | 0.81 | % | |
Class B | | | 1.55 | | | | 1.56 | | |
Class C | | | 1.55 | | | | 1.56 | | |
Class R4 | | | 0.60 | | | | 0.61 | | |
Class R5 | | | 0.56 | | | | 0.57 | | |
Class Z | | | 0.60 | | | | 0.61 | | |
The voluntary expense cap arrangement may be revised or discontinued at any time. Under the arrangements, the following fees and expenses are excluded from the waiver/reimbursement commitment, and therefore will be paid by the Fund, if applicable: taxes (including foreign transaction taxes), expenses associated with investments in affiliated and non-affiliated pooled investment vehicles (including mutual funds and exchange-traded funds), transaction costs and brokerage commissions, costs related to any securities lending program, dividend and interest expenses associated with securities sold short, inverse floater program fees and expenses, transaction charges and interest on borrowed money, interest and extraordinary expenses. Any fees waived and/or expenses reimbursed under the expense reimbursement arrangements described above are not recoverable by the Investment Manager or its affiliates in future periods. Class C distribution fees waived by the distributor, as discussed above, are in addition to the waiver/reimbursement commitment under the agreement.
Note 4. Federal Tax Information
The timing and character of income and capital gain distributions are determined in accordance with income tax regulations, which may differ from GAAP because of temporary or permanent book to tax differences.
At July 31, 2015, these differences are primarily due to differing treatment for capital loss carryforwards, principal and/or interest from fixed income securities, Trustees' deferred compensation, distributions, proceeds from regulatory settlements and tax straddles. To the extent these differences are permanent, reclassifications are made among the components of the Fund's net assets in the Statement of Assets and Liabilities. Temporary differences do not require reclassifications. In
Annual Report 2015
52
NOTES TO FINANCIAL STATEMENTS (continued)
July 31, 2015
the Statement of Assets and Liabilities the following reclassifications were made:
Undistributed net investment income | | $ | 1,143,377 | | |
Accumulated net realized loss | | | (4,802 | ) | |
Paid-in capital | | | (1,138,575 | ) | |
Net investment income (loss) and net realized gains (losses), as disclosed in the Statement of Operations, and net assets were not affected by this reclassification.
The tax character of distributions paid during the years indicated was as follows:
Year Ended July 31, | | 2015 | | 2014 | |
Ordinary income | | $ | 2,312,779 | | | $ | 600,042 | | |
Tax-exempt income | | | 167,153,413 | | | | 176,197,948 | | |
Total | | | 169,466,192 | | | | 176,797,990 | | |
Short-term capital gain distributions, if any, are considered ordinary income distributions for tax purposes.
At July 31, 2015, the components of distributable earnings on a tax basis were as follows:
Undistributed tax-exempt income | | | 29,430,048 | | |
Capital loss carryforwards | | | (45,506,818 | ) | |
Net unrealized appreciation | | | 326,232,253 | | |
At July 31, 2015, the cost of investments for federal income tax purposes was $3,742,727,900 and the aggregate gross unrealized appreciation and depreciation based on that cost was:
Unrealized appreciation | | $ | 383,399,361 | | |
Unrealized depreciation | | | (57,167,108 | ) | |
Net unrealized appreciation | | | 326,232,253 | | |
The following capital loss carryforwards, determined at July 31, 2015, may be available to reduce taxable income arising from future net realized gains on investments, if any, to the extent permitted by the Internal Revenue Code:
Year of Expiration | | Amount ($) | |
2016 | | | 24,820,789 | | |
2018 | | | 6,621,391 | | |
2019 | | | 14,064,638 | | |
Total | | | 45,506,818 | | |
For the year ended July 31, 2015, $26,360,488 of capital loss carryforward was utilized.
Management of the Fund has concluded that there are no significant uncertain tax positions in the Fund that would require recognition in the financial statements.
However, management's conclusion may be subject to review and adjustment at a later date based on factors including, but not limited to, new tax laws, regulations, and administrative interpretations (including relevant court decisions). Generally, the Fund's federal tax returns for the prior three fiscal years remain subject to examination by the Internal Revenue Service.
Note 5. Portfolio Information
The cost of purchases and proceeds from sales of securities, excluding short-term investments and derivatives, if any, aggregated to $651,224,986 and $510,570,895, respectively, for the year ended July 31, 2015. The amount of purchase and sale activity impacts the portfolio turnover rate reported in the Financial Highlights.
Note 6. Regulatory Settlements
During the year ended July 31, 2015, the Fund received $1,138,577 as a result of a regulatory settlement proceeding brought by the Securities and Exchange Commission against an unaffiliated third party relating to market timing and/or late trading of mutual funds. This amount represented the Fund's portion of the proceeds from the settlement (neither the Fund nor the Investment Manager were a party to the proceeding). The payments have been included in Proceeds from regulatory settlements in the Statement of Changes in Net Assets.
Note 7. Shareholder Concentration
At July 31, 2015, one unaffiliated shareholder of record owned 10.9% of the outstanding shares of the Fund in one or more accounts. The Fund has no knowledge about whether any portion of those shares was owned beneficially. Affiliated shareholders of record owned 41.2% of the outstanding shares of the Fund in one or more accounts. Subscription and redemption activity by concentrated accounts may have a significant effect on the operations of the Fund.
Note 8. Line of Credit
The Fund has entered into a revolving credit facility with a syndicate of banks led by JPMorgan Chase Bank, N.A. whereby the Fund may borrow for the temporary funding of shareholder redemptions or for other temporary or emergency purposes. Pursuant to a December 9, 2014 amendment, the credit facility agreement, which is a collective agreement between the Fund and certain other funds managed by the Investment Manager, severally and not jointly, permits collective borrowings up to $550 million. Interest is charged to each participating
Annual Report 2015
53
NOTES TO FINANCIAL STATEMENTS (continued)
July 31, 2015
fund based on its borrowings at a rate equal to the higher of (i) the overnight federal funds rate plus 1.00% or (ii) the one-month LIBOR rate plus 1.00%. Each borrowing under the credit facility matures no later than 60 days after the date of borrowing. The Fund also pays a commitment fee equal to its pro rata share of the amount of the credit facility at a rate of 0.075% per annum. The commitment fee is included in other expenses in the Statement of Operations. Prior to the December 9, 2014 amendment, the credit facility agreement permitted borrowings up to $500 million under the same terms and interest rates as described above.
The Fund had no borrowings during the year ended July 31, 2015.
Note 9. Significant Risks
Credit Risk
Credit risk is the risk that the value of debt securities in the Fund's portfolio may decline because the issuer may default and fail to pay interest or repay principal when due. Rating agencies assign credit ratings to debt securities to indicate their credit risk. Lower rated or unrated debt securities held by the Fund may present increased credit risk as compared to higher-rated debt securities.
Interest Rate Risk
Interest rate risk is the risk of losses attributable to changes in interest rates. In general, if prevailing interest rates rise, the values of debt securities tend to fall, and if interest rates fall, the values of debt securities tend to rise. Actions by governments and central banking authorities can result in increases in interest rates. Increasing interest rates may negatively affect the value of debt securities held by the Fund, resulting in a negative impact on the Fund's performance and net asset value per share. In general, the longer the maturity or duration of a debt security, the greater its sensitivity to changes in interest rates.
Liquidity Risk
Liquidity risk is the risk associated with a lack of marketability of investments which may make it difficult to sell the investment at a desirable time or price. Changing regulatory, market or other conditions or environments (for example, the interest rate or credit environments) may adversely affect the liquidity of the Fund's investments. The Fund may have to accept a lower selling price for the holding, sell other investments,
or forego another, more appealing investment opportunity. Generally, the less liquid the market at the time the Fund sells a portfolio investment, the greater the risk of loss or decline of value to the Fund. A less liquid market can lead to an increase in Fund redemptions, which may negatively impact Fund performance and net asset value per share, including, for example, if the Fund is forced to sell securities in a down market.
Note 10. Subsequent Events
Management has evaluated the events and transactions that have occurred through the date the financial statements were issued and noted no items requiring adjustment of the financial statements or additional disclosure.
Note 11. Information Regarding Pending and Settled Legal Proceedings
In December 2005, without admitting or denying the allegations, American Express Financial Corporation (AEFC, which is now known as Ameriprise Financial, Inc. (Ameriprise Financial)) entered into settlement agreements with the Securities and Exchange Commission (SEC) and Minnesota Department of Commerce (MDOC) related to market timing activities. As a result, AEFC was censured and ordered to cease and desist from committing or causing any violations of certain provisions of the Investment Advisers Act of 1940, the Investment Company Act of 1940, and various Minnesota laws. AEFC agreed to pay disgorgement of $10 million and civil money penalties of $7 million. AEFC also agreed to retain an independent distribution consultant to assist in developing a plan for distribution of all disgorgement and civil penalties ordered by the SEC in accordance with various undertakings detailed at http://www.sec.gov/litigation/admin/ia-2451.pdf. Ameriprise Financial and its affiliates have cooperated with the SEC and the MDOC in these legal proceedings, and have made regular reports to the Funds' Boards of Trustees.
Ameriprise Financial and certain of its affiliates have historically been involved in a number of legal, arbitration and regulatory proceedings, including routine litigation, class actions, and governmental actions, concerning matters arising in connection with the conduct of their business activities. Ameriprise Financial believes that the Funds are not currently the subject of, and that neither Ameriprise Financial nor any of its affiliates are the subject of, any pending legal, arbitration or regulatory
Annual Report 2015
54
NOTES TO FINANCIAL STATEMENTS (continued)
July 31, 2015
proceedings that are likely to have a material adverse effect on the Funds or the ability of Ameriprise Financial or its affiliates to perform under their contracts with the Funds. Ameriprise Financial is required to make quarterly (10-Q), annual (10-K) and, as necessary, 8-K filings with the SEC on legal and regulatory matters that relate to Ameriprise Financial and its affiliates. Copies of these filings may be obtained by accessing the SEC website at www.sec.gov.
There can be no assurance that these matters, or the adverse publicity associated with them, will not result in increased fund redemptions, reduced sale of fund shares or other adverse consequences to the Funds. Further, although we believe proceedings are not likely to have a material adverse effect on the Funds or the ability of Ameriprise Financial or its affiliates to perform under their contracts with the Funds, these proceedings are subject to uncertainties and, as such, we are unable to estimate the possible loss or range of loss that may result. An adverse outcome in one or more of these proceedings could result in adverse judgments, settlements, fines, penalties or other relief that could have a material adverse effect on the consolidated financial condition or results of operations of Ameriprise Financial.
Annual Report 2015
55
REPORT OF INDEPENDENT REGISTERED PUBLIC ACCOUNTING FIRM
To the Trustees of Columbia Funds Series Trust I and the Shareholders of
Columbia Tax-Exempt Fund
In our opinion, the accompanying statement of assets and liabilities, including the portfolio of investments, and the related statements of operations and of changes in net assets and the financial highlights present fairly, in all material respects, the financial position of Columbia Tax-Exempt Fund (the "Fund," a series of Columbia Funds Series Trust I) at July 31, 2015, and the results of its operations, the changes in its net assets and the financial highlights for each of the periods indicated, in conformity with accounting principles generally accepted in the United States of America. These financial statements and financial highlights (hereafter referred to as "financial statements") are the responsibility of the Fund's management. Our responsibility is to express an opinion on these financial statements based on our audits. We conducted our audits of these financial statements in accordance with the standards of the Public Company Accounting Oversight Board (United States). Those standards require that we plan and perform the audit to obtain reasonable assurance about whether the financial statements are free of material misstatement. An audit includes examining, on a test basis, evidence supporting the amounts and disclosures in the financial statements, assessing the accounting principles used and significant estimates made by management, and evaluating the overall financial statement presentation. We believe that our audits, which included confirmation of securities at July 31, 2015 by correspondence with the custodian and brokers, provide a reasonable basis for our opinion.
PricewaterhouseCoopers LLP
Minneapolis, MN
September 21, 2015
Annual Report 2015
56
FEDERAL INCOME TAX INFORMATION
(Unaudited)
The Fund hereby designates the following tax attributes for the fiscal year ended July 31, 2015. Shareholders will be notified in early 2016 of the amounts for use in preparing 2015 income tax returns.
Tax Designations:
| Exempt-Interest Dividends | | | 98.64 | % | |
Exempt-Interest Dividends. The percentage of net investment income distributed during the fiscal year that qualifies as exempt-interest dividends for federal income tax purposes. A portion of the income may be subject to federal alternative minimum tax.
Annual Report 2015
57
The Trustees serve terms of indefinite duration. The names and birth years of the Trustees and Officers of the Funds in Columbia Funds Series Trust I, the year each was first elected or appointed to office, their principal business occupations during at least the last five years, the number of Funds overseen by each Trustee and other directorships they hold are shown below. Each officer listed below serves as an officer of each Fund in Columbia Funds Series Trust I. The mailing address of each Trustee is: c/o Columbia Management Investment Advisers, LLC, 225 Franklin Street, Mail Drop BX32 05228, Boston, MA 02110.
Independent Trustees
Name, Year of Birth
and Position Held
with the Trust | | Year First
Appointed or
Elected as
Trustee to any
Fund Currently
in the Columbia
Funds Complex
or a Predecessor
Thereof | | Principal Occupation(s)
during the Past Five Years | | Number
of Funds
in the
Columbia
Funds
Complex
Overseen | | Other Directorships
Held by Trustee During
the Past Five Years | |
Janet Langford Carrig
(Born 1957)
Trustee | | | 1996 | | | Senior Vice President, General Counsel and Corporate Secretary, ConocoPhillips (integrated energy company) since September 2007; Deputy General Counsel — Corporate Legal Services, ConocoPhillips from August 2006 to August 2007; Partner, Zelle, Hofmann, Voelbel, Mason & Gette LLP (law firm) from March 2005 to July 2006; Adjunct Professor of Law, Northwestern University from September 2004 to June 2006; Director, UAL Corporation (airline) from February 2006 to July 2006; Chief Administrative Officer and Senior Vice President, Kmart Holding Corporation (consumer goods) from September 2003 to March 2004 | | | 60 | | | None | |
Douglas A. Hacker
(Born 1955)
Trustee and Chairman
of the Board | | | 1996 | | | Independent business executive since May 2006; Executive Vice President — Strategy of United Airlines from December 2002 to May 2006; President of UAL Loyalty Services (airline marketing company) from September 2001 to December 2002; Executive Vice President and Chief Financial Officer of United Airlines from July 1999 to September 2001 | | | 60 | | | Spartan Nash Company, (food distributor); Nash Finch Company (food distributor) from 2005 to 2013; Aircastle Limited (aircraft leasing); SeaCube Container Leasing Ltd. (container leasing) from 2010 to 2013; and Travelport Worldwide Limited (travel information technology) | |
Nancy T. Lukitsh
(Born 1956)
Trustee | | | 2011 | | | Senior Vice President, Partner and Director of Marketing, Wellington Management Company, LLP (investment adviser) from 1997 to 2010; Chair, Wellington Management Investment Portfolios (commingled non-U.S. investment pools) from 2007 to 2010; Director, Wellington Trust Company, NA and other Wellington affiliates from 1997 to 2010 | | | 60 | | | None | |
William E. Mayer
(Born 1940)
Trustee | | | 1991 | | | Partner, Park Avenue Equity Partners (private equity) since February 1999 | | | 60 | | | DynaVox Inc. (speech creation); Lee Enterprises (print media); WR Hambrecht + Co. (financial service provider) from 2000 to 2012; BlackRock Kelso Capital Corporation (investment company); and Premier, Inc. (healthcare) | |
Annual Report 2015
58
TRUSTEES AND OFFICERS (continued)
Independent Trustees (continued)
Name, Year of Birth
and Position Held
with the Trust | | Year First
Appointed or
Elected as
Trustee to any
Fund Currently
in the Columbia
Funds Complex
or a Predecessor
Thereof | | Principal Occupation(s)
during the Past Five Years | | Number
of Funds
in the
Columbia
Funds
Complex
Overseen | | Other Directorships
Held by Trustee During
the Past Five Years | |
David M. Moffett
(Born 1952)
Trustee | | | 2011 | | | Retired. Consultant to Bridgewater and Associates; Chief Executive Officer, Federal Home Loan Mortgage Corporation, from 2008 to 2009; Senior Adviser, Global Financial Services Group, Carlyle Group, Inc., from 2007 to 2008; Vice Chairman and Chief Financial Officer, U.S. Bancorp, from 1993 to 2007 | | | 60 | | | Building Materials Holding Corp. (building materials and construction services); CIT Group Inc. (commercial and consumer finance); eBay Inc. (online trading community); E.W. Scripps Co. (print and television media); Genworth Financial, Inc. (financial and insurance products and services); MBIA Inc. (financial service provider); Paypal Holdings Inc. (payment and data processing services); and University of Oklahoma Foundation | |
Charles R. Nelson
(Born 1942)
Trustee | | | 1981 | | | Retired. Professor Emeritus, University of Washington since 2011; Professor of Economics, University of Washington from 1976 to 2011; Ford and Louisa Van Voorhis Professor of Political Economy, University of Washington from 1993 to 2011; Adjunct Professor of Statistics, University of Washington from 1980 to 2011; Associate Editor, Journal of Money, Credit and Banking from September 1993 to 2008; consultant on econometric and statistical matters | | | 60 | | | None | |
John J. Neuhauser
(Born 1943)
Trustee | | | 1984 | | | President, Saint Michael's College since August 2007; Director or Trustee of several non-profit organizations, including Fletcher Allen Health Care, Inc.; Academic Vice President and Dean of Faculties, Boston College from August 1999 to October 2005; University Professor, Boston College from November 2005 to August 2007 | | | 60 | | | Liberty All-Star Equity Fund and Liberty All-Star Growth Fund (closed-end funds) | |
Patrick J. Simpson
(Born 1944)
Trustee | | | 2000 | | | Partner, Perkins Coie LLP (law firm) | | | 60 | | | None | |
Anne-Lee Verville
(Born 1945)
Trustee | | | 1998 | | | Retired. General Manager, Global Education Industry from 1994 to 1997, President — Application Systems Division from 1991 to 1994, Chief Financial Officer — US Marketing & Services from 1988 to 1991, and Chief Information Officer from 1987 to 1988, IBM Corporation (computer and technology) | | | 60 | | | Enesco Group, Inc. (producer of giftware and home and garden decor products) from 2001 to 2006 | |
Annual Report 2015
59
TRUSTEES AND OFFICERS (continued)
Interested Trustee Affiliate with Investment Manager*
Name, Year of Birth
and Position Held
with the Trust | | Year First
Appointed or
Elected as
Trustee to any
Fund Currently
in the Columbia
Funds Complex
or a Predecessor
Thereof | | Principal Occupation(s)
during the Past Five Years | | Number
of Funds
in the
Columbia
Funds
Complex
Overseen | | Other Directorships
Held by Trustee During
the Past Five Years | |
William F. Truscott
(Born 1960)
Trustee | | | 2012 | | | Chairman of the Board and President, Columbia Management Investment Advisers, LLC since May 2010 and February 2012, respectively (previously President and Chief Investment Officer, 2001-April 2010); Chief Executive Officer, Global Asset Management, Ameriprise Financial, Inc. since September 2012 (previously Chief Executive Officer, U.S. Asset Management & President, Annuities, May 2010-September 2012 and President — U.S. Asset Management and Chief Investment Officer, 2005-April 2010); Director and Chief Executive Officer, Columbia Management Investment Distributors, Inc. since May 2010 and February 2012, respectively (previously Chairman of the Board and Chief Executive Officer, 2006-April 2010); Chairman of the Board and Chief Executive Officer, RiverSource Distributors, Inc. since 2006; Director, Threadneedle Asset Management Holdings, SARL since 2014; President and Chief Executive Officer, Ameriprise Certificate Company, 2006-August 2012 | | | 187 | | | Chairman of the Board, Columbia Management Investment Advisers, LLC since May 2010; Director, Columbia Management Investment Distributors, Inc. since May 2010; Director, Ameriprise Certificate Company, 2006 to January 2013 | |
* Interested person (as defined under the 1940 Act) by reason of being an officer, director, security holder and/or employee of the Investment Manager or Ameriprise Financial.
The Statement of Additional Information has additional information about the Fund's Board members and is available, without charge, upon request by calling 800.345.6611; contacting your financial intermediary; or visiting columbiathreadneedle.com/us.
The Board has appointed officers who are responsible for day-to-day business decisions based on policies it has established. The officers serve at the pleasure of the Board. In addition to Mr. Truscott, who is Senior Vice President, the Funds' other officers are:
Fund Officers
Name,
Address and
Year of Birth | | Position and Year
First Appointed to
Position for any Fund
in the Columbia
Funds Complex or a
Predecessor Thereof | | Principal Occupation(s) During Past Five Years | |
Christopher O. Petersen
5228 Ameriprise
Financial Center
Minneapolis, MN 55474
Born 1970 | | President and Principal Executive Officer (2015) | | Vice President and Lead Chief Counsel, Ameriprise Financial, Inc. since January 2015 (previously, Vice President and Chief Counsel January 2010-December 2014; and Vice President and Group Counsel or Counsel 2004- January 2010); officer of Columbia Funds and affiliated funds since 2007. | |
Michael G. Clarke
225 Franklin Street
Boston, MA 02110
Born 1969 | | Treasurer (2011) and Chief Financial Officer (2009) | | Vice President — Mutual Fund Administration, Columbia Management Investment Advisers, LLC, since May 2010; Managing Director of Fund Administration, Columbia Management Advisors, LLC, September 2004-April 2010; senior officer of Columbia Funds and affiliated funds since 2002. | |
Annual Report 2015
60
TRUSTEES AND OFFICERS (continued)
Fund Officers (continued)
Name,
Address and
Year of Birth | | Position and Year
First Appointed to
Position for any Fund
in the Columbia
Funds Complex or a
Predecessor Thereof | | Principal Occupation(s) During Past Five Years | |
Paul B. Goucher
100 Park Avenue
New York, NY 10017
Born 1968 | | Senior Vice President (2011), Chief Legal Officer (2015) and Assistant Secretary (2008) | | Vice President and Lead Chief Counsel, Ameriprise Financial, Inc. since November 2008 and January 2013, respectively (previously Chief Counsel, January 2010-January 2013 and Group Counsel, November 2008-January 2010). | |
Thomas P. McGuire
225 Franklin Street
Boston, MA 02110
Born 1972 | | Vice President and Chief Compliance Officer (2012) | | Vice President — Asset Management Compliance, Ameriprise Financial, Inc., since May 2010; Chief Compliance Officer, Ameriprise Certificate Company since September 2010; Compliance Executive, Bank of America, 2005-April 2010. | |
Colin Moore
225 Franklin Street
Boston, MA 02110
Born 1958 | | Senior Vice President (2010) | | Executive Vice President and Global Chief Investment Officer, Ameriprise Financial, Inc., since July 2013; Director and Global Chief Investment Officer, Columbia Management Investment Advisers, LLC since May 2010; Manager, Managing Director and Chief Investment Officer, Columbia Management Advisors, LLC, 2007-April 2010. | |
Michael E. DeFao
225 Franklin Street
Boston, MA 02110
Born 1968 | | Vice President (2011) and Assistant Secretary (2010) | | Vice President and Chief Counsel, Ameriprise Financial, Inc. since May 2010; Associate General Counsel, Bank of America, 2005-April 2010. | |
Joseph F. DiMaria
225 Franklin Street
Boston, MA 02110
Born 1968 | | Vice President (2011), Assistant Treasurer (2012) and Chief Accounting Officer (2008) | | Vice President — Mutual Fund Treasurer, Columbia Management Investment Advisers, LLC since May 2010; Director of Fund Administration, Columbia Management Advisors, LLC, 2006-April 2010. | |
Amy Johnson
5228 Ameriprise
Financial Center
Minneapolis, MN 55474
Born 1965 | | Vice President (2006) | | Managing Director and Chief Operating Officer, Columbia Management Investment Advisers, LLC since May 2010 (previously Chief Administrative Officer, 2009-April 2010, and Vice President — Asset Management and Trust Company Services, 2006-2009). | |
Lyn Kephart-Strong
5228 Ameriprise
Financial Center
Minneapolis, MN 55474
Born 1960 | | Vice President (2015) | | President, Columbia Management Investment Services Corp. since October 2014; Vice President & Resolution Officer, Ameriprise Trust Company since August 2009; President, RiverSource Service Corporation 2004-2010. | |
Ryan C. Larrenaga
225 Franklin Street
Boston, MA 02110
Born 1970 | | Vice President and Secretary (2015) | | Vice President and Group Counsel, Ameriprise Financial, Inc. since August 2011 (previously, Counsel from May 2010 to August 2011); Assistant General Counsel, Bank of America, 2005-April 2010; officer of Columbia Funds and affiliated funds since 2005. | |
Annual Report 2015
61
BOARD CONSIDERATION AND APPROVAL OF ADVISORY AGREEMENT
On June 10, 2015, the Board of Trustees (the Board) and the Trustees who are not interested persons (as defined in the Investment Company Act of 1940) (the Independent Trustees) of Columbia Funds Series Trust I (the Trust) unanimously approved the continuation of the Investment Management Services Agreement (the Advisory Agreement) with Columbia Management Investment Advisers, LLC (the Investment Manager) with respect to Columbia Tax-Exempt Fund (the Fund), a series of the Trust. The Board and the Independent Trustees also unanimously approved an agreement (the Management Agreement and, together with the Advisory Agreement, the Agreements) combining the Advisory Agreement and the Fund's existing administrative services agreement (the Administrative Services Agreement) in a single agreement. The Board and the Independent Trustees approved the restatement of the Advisory Agreement with the Management Agreement to be effective for the Fund on December 1, 2015, the Fund's next annual prospectus update. As detailed below, the Board's Advisory Fees and Expenses Committee (the Committee) and the Board met on multiple occasions to review and discuss, both among themselves and with the management team of the Investment Manager, materials provided by the Investment Manager and others before determining to approve the Management Agreement and the continuation of the Advisory Agreement.
In connection with their deliberations regarding the approval of the Management Agreement and the continuation of the Advisory Agreement, the Committee and the Board evaluated materials requested from the Investment Manager regarding the Fund and the Agreements, and discussed these materials with representatives of the Investment Manager at Committee meetings held on March 3, 2015, April 29, 2015 and June 9, 2015 and at Board meetings held on March 4, 2015 and June 10, 2015. In addition, the Board considers matters bearing on the Agreements at most of its other meetings throughout the year and meets regularly with senior management of the Trust and the Investment Manager. Through the Board's Investment Oversight Committees, Trustees also meet with selected portfolio managers of the funds the Trustees oversee and other investment personnel at various times throughout the year. The Committee and the Board also consulted with its independent fee consultant, Fund counsel and with the Independent Trustees' independent legal counsel, who advised on various matters with respect to the Committee's and the Board's considerations and otherwise assisted the Committee and the Board in their deliberations. On June 9, 2015, the Committee recommended that the Board approve the Management Agreement and the continuation of the Advisory Agreement. On June 10, 2015, the Board, including the Independent Trustees, voting separately, unanimously approved the Management Agreement and the continuation of the Advisory Agreement for the Fund.
The Committee and the Board considered all information that they, their legal counsel or the Investment Manager believed reasonably necessary to evaluate and to determine whether to approve the Management Agreement and the continuation of the Advisory Agreement. The information and factors considered by the Committee and the Board in recommending for approval or approving the Management Agreement and the continuation of the Advisory Agreement for the Fund included the following:
• Information on the investment performance of the Fund relative to the performance of a group of mutual funds determined to be comparable to the Fund by an independent third-party data provider, as well as performance relative to benchmarks;
• Information on the Fund's advisory fees and total expenses, including information comparing the Fund's expenses to those of a group of comparable mutual funds, as determined by the independent third-party data provider;
• The Investment Manager's agreement to contractually limit or cap total operating expenses for the Fund so that total operating expenses (excluding certain fees and expenses, such as portfolio transaction costs and certain other investment related expenses, interest, taxes, acquired fund fees and expenses, and extraordinary expenses) would not exceed a specified percentage of the Fund's average annual net assets from December 31, 2015 through November 30, 2016;
• The terms and conditions of the Agreements;
Annual Report 2015
62
BOARD CONSIDERATION AND APPROVAL OF ADVISORY AGREEMENT (continued)
• The current and proposed terms and conditions of other agreements and arrangements with affiliates of the Investment Manager relating to the operations of the Fund, including the Administrative Services Agreement1 and agreements with respect to the provision of distribution and transfer agency services to the Fund;
• Descriptions of various functions performed by the Investment Manager under the Agreements, including portfolio management and portfolio trading practices;
• Information regarding the management fees and investment performance of similarly-managed portfolios of other clients of the Investment Manager, including institutional separate accounts;
• Information regarding the reputation, regulatory history and resources of the Investment Manager, including information regarding senior management, portfolio managers and other personnel;
• Information regarding the capabilities of the Investment Manager with respect to compliance monitoring services, including an assessment of the Investment Manager's compliance system by the Fund's Chief Compliance Officer; and
• The profitability to the Investment Manager and its affiliates from their relationships with the Fund.
Nature, Extent and Quality of Services Provided under the Agreements
The Committee and the Board considered the nature, extent and quality of services provided to the Fund by the Investment Manager and its affiliates under the Agreements and under separate agreements for the provision of transfer agency and administrative services, and the resources dedicated to the Fund and the other Columbia Funds by the Investment Manager and its affiliates. The Committee and the Board also determined that the nature and level of the services to be provided under the Management Agreement would not decrease relative to the services provided under the Advisory Agreement and the Administrative Services Agreement. The Committee and the Board considered, among other things, the Investment Manager's ability to attract, motivate and retain highly qualified research, advisory and supervisory investment professionals (including personnel and other resources, compensation programs for personnel involved in fund management, reputation and other attributes), the portfolio management services provided by those investment professionals, and the quality of the Investment Manager's investment research capabilities and trade execution services. The Committee and the Board also considered the potential benefits to shareholders of investing in a mutual fund that is part of a fund complex offering exposure to a variety of asset classes and investment disciplines and providing a variety of fund and shareholder services.
The Committee and the Board also considered the professional experience and qualifications of the senior personnel of the Investment Manager, which included consideration of the Investment Manager's experience with similarly-structured funds. The Committee and the Board noted the compliance programs of and the compliance-related resources provided to the Fund by the Investment Manager and its affiliates, and considered the Investment Manager's ability to provide administrative services to the Fund and coordinate the activities of the Fund's other service providers. In evaluating the nature, extent and quality of services provided under the Agreements, the Committee and the Board considered that these services were provided to the Fund, rather than directly to Fund shareholders. The Committee and the Board accordingly affirmed, after considering various other matters, including the potential benefits to the Fund and its shareholders of the Independent Trustees' important role as pre-suit gatekeepers with respect to claims that they may determine are meritless or contrary to the Fund's best interests, that it was not the intention of the Board or the Investment Manager that there be any third-party beneficiaries of the Agreements. After reviewing these and related factors, the Committee and the Board concluded, within the context of their overall conclusions, that the nature, extent and quality of the services provided to the Fund under the Agreements supported the approval of the Management Agreement and the continuation of the Advisory Agreement.
1 Like the Advisory Agreement, the Administrative Services Agreement will terminate with respect to the Fund once the Management Agreement is effective for the Fund.
Annual Report 2015
63
BOARD CONSIDERATION AND APPROVAL OF ADVISORY AGREEMENT (continued)
Investment Performance
The Committee and the Board reviewed information about the performance of the Fund over various time periods, including performance information relative to benchmarks and information based on reports of the independent third-party data provider that compared the performance of the Fund to the performance of a group of comparable mutual funds, and data provided by the independent fee consultant. The Committee and the Board also reviewed a description of the third party's methodology for identifying the Fund's peer groups for purposes of performance and expense comparisons.
The Committee and the Board noted that, through December 31, 2014, the Fund's performance was in the thirty-fourth, twenty-seventh and twenty-fourth percentile (where the best performance would be in the first percentile) of its category selected by the independent third-party data provider for the purposes of performance comparisons for the one-, three- and five-year periods, respectively.
The Committee and the Board also considered the Investment Manager's performance and reputation generally, the Investment Manager's historical responsiveness to Board concerns about performance, and the Investment Manager's willingness to take steps intended to improve performance. After reviewing these and related factors, the Committee and the Board concluded, within the context of their overall conclusions, that the performance of the Fund was sufficient, in light of other considerations, to warrant the continuation of the Advisory Agreement and the approval of the Management Agreement.
Investment Advisory Fee Rates and Other Expenses
The Committee and the Board considered the advisory fees charged to the Fund under the Advisory Agreement as well as the total expenses incurred by the Fund. In assessing the reasonableness of the fees under the Advisory Agreement, the Committee and the Board considered, among other information, the Fund's advisory fee and its total expense ratio as a percentage of average daily net assets. The Committee and the Board also considered that the proposed management fee would not exceed the sum of the fee rates payable under the Advisory Agreement and the Administrative Services Agreement. The Committee and the Board considered data provided by the independent fee consultant. The Committee and the Board noted that, as of December 31, 2014, the Fund's actual management fee and net expense ratio are ranked in the 1st and 3rd quintiles, respectively, (where the lowest fees and expenses would be in the first quintile) against the Fund's expense universe as determined by the independent third-party data provider for purposes of expense comparison. The Committee and the Board also took into account the fee waiver and expense limitation arrangements agreed to by the Investment Manager, as noted above.
The Committee and the Board also received and considered information about the advisory fees charged by the Investment Manager to institutional separate accounts. In considering the fees charged to those accounts, the Committee and the Board took into account, among other things, the Investment Manager's representations about the differences between managing mutual funds as compared to other types of accounts, including differences in the services provided, differences in the risk profile of such business for the Investment Manager and the additional resources required to manage mutual funds effectively. The Committee and the Board also received and considered information about the fees charged by the Investment Manager for sub-advisory services provided to comparable unaffiliated funds. In evaluating the Fund's advisory fees, the Committee and the Board also took into account the demands, complexity and quality of the investment management of the Fund.
After reviewing these and related factors, the Committee and the Board concluded, within the context of their overall conclusions, that the advisory/management fee rates and expenses of the Fund were sufficient, in light of other considerations, to warrant the approval of the Management Agreement and continuation of the Advisory Agreement.
Costs of Services Provided and Profitability
The Committee and the Board also took note of the costs the Investment Manager and its affiliates incur in connection with the services provided (both on an absolute and relative basis) and the profitability to the Investment Manager and its affiliates in connection with their relationships with the Fund.
Annual Report 2015
64
BOARD CONSIDERATION AND APPROVAL OF ADVISORY AGREEMENT (continued)
The Committee and the Board also considered the compensation directly or indirectly received by the Investment Manager's affiliates in connection with their relationships with the Fund. The Committee and the Board reviewed information provided by management as to the profitability to the Investment Manager and its affiliates of their relationships with the Fund, information about the allocation of expenses used to calculate profitability, and comparisons of profitability levels realized in 2014 to profitability levels realized in 2013. When reviewing profitability, the Committee and the Board also considered court cases in which adviser profitability was an issue in whole or in part, the performance of similarly managed funds, the performance of the Fund, and the expense ratio of the Fund. The Committee and the Board also considered information provided by the Investment Manager regarding the Investment Manager's financial condition and comparing its profitability to that of other asset management firms that are, or are subsidiaries of, publicly traded companies.
After reviewing these and related factors, the Committee and the Board concluded, within the context of their overall conclusions, that the costs of services provided and the profitability to the Investment Manager and its affiliates from their relationships with the Fund supported the approval of the Management Agreement and the continuation of the Advisory Agreement.
Economies of Scale
The Committee and the Board considered the potential existence of economies of scale in the provision by the Investment Manager of services to the Fund, to groups of related funds, and to the Investment Manager's investment advisory clients as a whole, and whether those economies of scale were shared with the Fund through breakpoints in investment advisory fees or other means, such as expense limitation arrangements and additional investments by the Investment Manager in investment, trading and compliance resources. The Committee and the Board noted that the investment advisory and management fee schedules for the Fund contained breakpoints that would reduce the fee rate on assets above specified threshold levels.
In considering these matters, the Committee and the Board also considered the costs of the services provided and the profitability to the Investment Manager and its affiliates from their relationships with the Fund, as discussed above. After reviewing these and related factors, the Committee and the Board concluded, within the context of their overall conclusions, that the extent to which any economies of scale were expected to be shared with the Fund supported the approval of the Management Agreement and the continuation of the Advisory Agreement.
Other Benefits to the Investment Manager
The Committee and the Board received and considered information regarding "fall-out" or ancillary benefits received by the Investment Manager and its affiliates as a result of their relationships with the Fund, such as the engagement of the Investment Manager to provide administrative services to the Fund and the engagement of the Investment Manager's affiliates to provide distribution and transfer agency services to the Fund. In this regard, among other matters, the Committee and the Board considered that the Fund's distributor retains a portion of the distribution fees from the Fund and receives a portion of the sales charges on sales or redemptions of certain classes of shares of the Fund. The Committee and the Board also considered the benefits of research made available to the Investment Manager by reason of brokerage commissions generated by the Fund's securities transactions, and reviewed information about the Investment Manager's practices with respect to allocating portfolio transactions for brokerage and research services. The Committee and the Board considered the possible conflicts of interest associated with certain fall-out or other ancillary benefits and the reporting, disclosure and other processes that are in place to address such possible conflicts of interest. The Committee and the Board recognized that the Investment Manager's profitability would be somewhat lower without these benefits.
Conclusion
The Committee and the Board reviewed all of the above considerations in reaching their decisions to recommend or approve the Management Agreement and the continuation of the Advisory Agreement. In their deliberations, the Trustees did not identify any particular information that was all-important or controlling, and individual
Annual Report 2015
65
BOARD CONSIDERATION AND APPROVAL OF ADVISORY AGREEMENT (continued)
Trustees may have attributed different weights to the various factors. Based on their evaluation of all factors that they deemed to be material, including those factors described above, and assisted by the advice of independent legal counsel, the Board, including the Independent Trustees, voting separately, unanimously approved the Management Agreement and the continuation of the Advisory Agreement.
Annual Report 2015
66
IMPORTANT INFORMATION ABOUT THIS REPORT
Each fund mails one shareholder report to each shareholder address. If you would like more than one report, please call shareholder services at 800.345.6611 and additional reports will be sent to you.
The policy of the Board is to vote the proxies of the companies in which each fund holds investments consistent with the procedures as stated in the Statement of Additional Information (SAI). You may obtain a copy of the SAI without charge by calling 800.345.6611; contacting your financial intermediary; visiting columbiathreadneedle.com/us; or searching the website of the Securities and Exchange Commission (SEC) at sec.gov. Information regarding how each fund voted proxies relating to portfolio securities is filed with the SEC by August 31st for the most recent 12-month period ending June 30th of that year, and is available without charge by visiting columbiathreadneedle.com/us, or searching the website of the SEC at sec.gov.
Each fund files a complete schedule of portfolio holdings with the SEC for the first and third quarters of each fiscal year on Form N-Q. Each fund's Form N-Q is available on the SEC's website at sec.gov and may be reviewed and copied at the SEC's Public Reference Room in Washington, D.C. Information on the operation of the Public Reference Room may be obtained by calling 800.SEC.0330. Each fund's complete schedule of portfolio holdings, as filed on Form N-Q, can also be obtained without charge, upon request, by calling 800.345.6611.
Annual Report 2015
67
Columbia Tax-Exempt Fund
P.O. Box 8081
Boston, MA 02266-8081

This information is for use with concurrent or prior delivery of a fund prospectus. Please read and consider the investment objectives, risks, charges and expenses for any fund carefully before investing. For a prospectus and summary prospectus, which contains this and other important information about the Fund, go to columbiathreadneedle.com/us. The Fund is distributed by Columbia Management Investment Distributors, Inc., member FINRA, and managed by Columbia Management Investment Advisers, LLC.
Columbia Threadneedle Investments (Columbia Threadneedle) is the global brand name of the Columbia and Threadneedle group of companies.
All rights reserved. Columbia Management Investment Distributors, Inc., 225 Franklin Street, Boston, MA 02110-2804
© 2015 Columbia Management Investment Advisers, LLC.
columbiathreadneedle.com/us
ANN233_07_E01_(09/15)

ANNUAL REPORT
July 31, 2015

COLUMBIA GLOBAL INFLATION-LINKED BOND PLUS FUND

ABOUT COLUMBIA THREADNEEDLE INVESTMENTS
Columbia Threadneedle Investments is a leading global asset management group that provides a broad range of actively managed investment strategies and solutions for individual, institutional and corporate clients around the world.
With more than 2,000 people, including over 450 investment professionals based in North America, Europe and Asia, we manage $503 billion* of assets across developed and emerging market equities, fixed income, asset allocation solutions and alternatives. We are the 13th largest manager of long-term mutual fund assets in the U.S.** and the 4th largest manager of retail funds in the U.K.***
Our priority is the investment success of our clients. We aim to deliver the investment outcomes they expect through an investment approach that is team-based, performance-driven and risk-aware. Our culture is dynamic and interactive. By sharing our insights across asset classes and geographies, we generate richer perspectives on global, regional and local investment landscapes. The ability to exchange and debate investment ideas in a collaborative environment enriches our teams' investment processes. More importantly, it results in better informed investment decisions for our clients.
Columbia funds are distributed by Columbia Management Investment Distributors, Inc., member FINRA, and managed by Columbia Management Investment Advisers, LLC.
Columbia Threadneedle Investments (Columbia Threadneedle) is the global brand name of the Columbia and Threadneedle group of companies.
* In U.S. dollars as of June 30, 2015. Source: Ameriprise Q2 Earnings Release. Includes all assets managed by entities in the Columbia and Threadneedle groups of companies. Contact us for more current data.
** Source: ICI as of June 30, 2015 for Columbia Management Investment Advisers, LLC.
*** Source: Investment Association as of June 2015 for Threadneedle Asset Management Limited.
© 2015 Columbia Management Investment Advisers, LLC. All rights reserved.
Not part of the shareholder report
Get the market insight you need from our investment experts
Connect with Columbia Threadneedle Investments
Investor insight
Find economic and market commentary, investment videos, white papers, mutual fund commentary and more at columbiathreadneedle.com/us.
Columbia Threadneedle Investor Newsletter (e-newsletter)
Read our award-winning* shareholder newsletter. Our quarterly newsletter is available online and provides timely and relevant content about economic trends, fund news, service enhancements and changes. Sign up to receive the newsletter electronically at columbiathreadneedle.com/
us/newsletter.
Investment videos
Get analysis of current events and trends that may affect your investments. Visit our online video library to watch and discover what our thought leaders are saying about the financial markets and economy.
Social media
We offer you multiple ways to access our market commentary and investment insights.
n Perspectives blog at columbiathreadneedle.com/us
Read timely posts by our investment team, including our chief investment officer, chief economist and portfolio managers.
n twitter.com/CTinvest_US
Follow us on Twitter for quick, up-to-the-minute comments on market news and more.
n youtube.com/CTinvestUS
View our commentaries on the economy, markets and current investment opportunities.
n linkedin.com/company/columbia-threadneedle-investments-us
Connect with us on LinkedIn for updates from our thought leaders.
*Columbia Threadneedle Investor Newsletter was awarded top honors in the Mutual Fund Education Alliance STAR Awards competition for excellence in mutual fund marketing and communications in 2011, 2012 and 2013. Materials in the competition were evaluated on educational value, message comprehension, effective design and objectives.
Not part of the shareholder report
Stay informed
Become a subscriber to receive the latest investment publications and mutual fund commentaries
Subscribe to Columbia Threadneedle Investments
Email subscription center
Subscribe to the latest information from Columbia Threadneedle. Visit our email subscription center at columbiathreadneedle.com/us/subscribe to register for economic and market commentary, product and service updates, white papers and more.
n Columbia Threadneedle Investor Newsletter
Quarterly newsletter featuring the latest macro- and micro-economic trends, investment themes, products, service changes and other items of interest to our investors
n Investment Strategy Outlook
Quarterly publication featuring the Columbia Threadneedle Asset Allocation Team's perspective on global economic investment conditions and markets
n MarketTrack
Quarterly publication featuring more than 40 charts and graphs that highlight the current state of the economy and the markets; includes straightforward insight on current investment opportunities
n White papers
Frequent articles that delve deep into a variety of investment topics
n Mutual fund updates
Quarterly portfolio manager commentary and fund fact sheets available for Columbia funds. (Not all funds have a commentary.)
Register your information online at columbiathreadneedle.com/us/subscribe and select the publications you would like to receive. Update your subscriptions at any time by accessing the email subscription center.
 Dear Shareholder,
Today's investors are typically focused on outcomes, like living a certain retirement lifestyle, paying for college education or building a legacy. But in today's complex global investment landscape, even simple goals are not easily achieved.
At Columbia Threadneedle Investments, we aspire to help satisfy five core needs of today's investors:
n Generate an appropriate stream of income in retirement
Traditional approaches to generating income may not provide the diversification benefits they once did, and they may actually introduce unwanted risk in today's market. To seek to improve your potential to live comfortably long term, we endeavor to pursue investments that explore less traveled paths to income.
n Navigate a changing interest rate environment
Today's uncertain market environment includes the prospect of a rise in interest rates. Blending traditional investments with non-traditional or alternative products may help protect your wealth during periods of volatility. We can attempt to help strengthen your portfolio with agile products designed to take on the market's ups and downs.
n Maximize after-tax returns
In an environment where what you keep may be more important than what you earn, municipal bonds can help mitigate high tax burdens while providing potentially attractive yields. Our state and federal tax-exempt products are aimed at helping investors manage risk, minimize the fluctuation of capital and grow wealth on a more tax-efficient basis.
n Grow assets to achieve financial goals
We believe that finding and protecting growth comes from a disciplined security selection process designed to create excess return. Our goal is to provide investment solutions built to help you face today's market challenges and grow your assets at each crossroad of your journey.
n Ease the impact of volatile markets
Despite a bull market run that has benefited many investors over the past several years, it's important to remember the lessons of 2008 and the value that a well-diversified portfolio may provide through times of market volatility. We are here to help you hold onto the savings you have worked tirelessly to amass, and to provide you the best opportunity to maintain your standard of living regardless of market conditions.
Find out today how we can help you confidently invest to realize your dreams. Please visit us at blog.columbiathreadneedleus.com/our-best-ideas to learn more about our unique investment solutions.
The world is constantly changing, but our priority remains the same: to help you secure your finances, meet your goals and achieve success. Thank you for your continued investment with us.
Sincerely,

Christopher O. Petersen
President, Columbia Funds
Investors should consider the investment objectives, risks, charges and expenses of a mutual fund carefully before investing. For a free prospectus and summary prospectus, which contains this and other important information about a fund, visit columbiathreadneedle.com/us. The prospectus should be read carefully before investing.
Columbia Funds are distributed by Columbia Management Investment Distributors, Inc., member FINRA, and managed by Columbia Management Investment Advisers, LLC.
© 2015 Columbia Management Investment Advisers, LLC. All rights reserved.
COLUMBIA GLOBAL INFLATION-LINKED BOND PLUS FUND
Fund Investment Manager
Columbia Management Investment
Advisers, LLC
225 Franklin Street
Boston, MA 02110
Fund Distributor
Columbia Management Investment
Distributors, Inc.
225 Franklin Street
Boston, MA 02110
Fund Transfer Agent
Columbia Management Investment
Services Corp.
P.O. Box 8081
Boston, MA 02266-8081
For more information about any of the funds, please visit columbiathreadneedle.com/us or call 800.345.6611. Customer Service Representatives are available to answer your questions Monday through Friday from 8 a.m. to 7 p.m. Eastern time.
The views expressed in this report reflect the current views of the respective parties. These views are not guarantees of future performance and involve certain risks, uncertainties and assumptions that are difficult to predict, so actual outcomes and results may differ significantly from the views expressed. These views are subject to change at any time based upon economic, market or other conditions and the respective parties disclaim any responsibility to update such views. These views may not be relied on as investment advice and, because investment decisions for a Columbia fund are based on numerous factors, may not be relied on as an indication of trading intent on behalf of any particular Columbia fund. References to specific securities should not be construed as a recommendation or investment advice.
Performance Overview | | | 3 | | |
Manager Discussion of Fund Performance | | | 5 | | |
Understanding Your Fund's Expenses | | | 8 | | |
Portfolio of Investments | | | 9 | | |
Statement of Assets and Liabilities | | | 13 | | |
Statement of Operations | | | 15 | | |
Statement of Changes in Net Assets | | | 16 | | |
Financial Highlights | | | 18 | | |
Notes to Financial Statements | | | 21 | | |
Report of Independent Registered
Public Accounting Firm | | | 33 | | |
Trustees and Officers | | | 34 | | |
Board Consideration and Approval of Advisory Agreement
and Subadvisory Agreement | | | 38 | | |
Important Information About This Report | | | 43 | | |
COLUMBIA GLOBAL INFLATION-LINKED BOND PLUS FUND
Performance Summary
n Columbia Global Inflation-Linked Bond Plus Fund (the Fund) Class Z shares returned 2.73% for the 12-month period ended July 31, 2015.
n The Fund underperformed its benchmark, the Barclays Global Inflation-Linked Index (USD) Hedged, which returned 4.93% for the same time period.
n The Fund's performance was constrained during the period as its holdings of Treasury Inflation Protected Securities (TIPS) were hurt by a decline in U.S. inflation expectations, as well by a relatively conservative stance with respect to duration and corresponding interest rate sensitivity in core Europe.
Average Annual Total Returns (%) (for period ended July 31, 2015)
| | | Inception | | 1 Year | | Life | |
Class I | | 03/12/14 | | | 2.93 | | | | 5.11 | | |
Class W* | | 06/25/14 | | | 2.51 | | | | 4.74 | | |
Class Z | | 03/12/14 | | | 2.73 | | | | 4.96 | | |
Barclays Global Inflation-Linked Index (USD) Hedged | | | | | | | 4.93 | | | | 6.39 | | |
Performance for different share classes will vary based on differences in sales charges and fees associated with each class. All results shown assume reinvestment of distributions during the period. Returns do not reflect the deduction of taxes that a shareholder may pay on Fund distributions or on the redemption of Fund shares. Performance results reflect the effect of any fee waivers or reimbursements of Fund expenses by Columbia Management Investment Advisers, LLC and/or any of its affiliates. Absent these fee waivers or expense reimbursement arrangements, performance results would have been lower.
The performance information shown represents past performance and is not a guarantee of future results. The investment return and principal value of your investment will fluctuate so that your shares, when redeemed, may be worth more or less than their original cost. Current performance may be lower or higher than the performance information shown. You may obtain performance information current to the most recent month-end by contacting your financial intermediary, visiting columbiathreadneedle.com/us or calling 800.345.6611.
*The returns shown for periods prior to the share class inception date (including returns for the Life of the Fund, if shown, which are since Fund inception) include the returns of the Fund's oldest share class. Since the Fund launched more than one share class at its inception, Class Z shares were used. These returns are adjusted to reflect any higher class-related operating expenses of the newer share classes, as applicable. Please visit columbiathreadneedle.com/us/investment-products/mutual-funds/appended-performance for more information.
The Barclays Global Inflation-Linked Index (USD) Hedged includes securities which offer the potential for protection against inflation as their cash flows are linked to an underlying inflation index. All securities included in the index have to be issued by an investment-grade rated sovereign in its local currency. The index represents a standalone multi-currency index exposed to the real yield curve for each relevant currency.
Indices are not available for investment, are not professionally managed and do not reflect sales charges, fees, brokerage commissions, taxes or other expenses of investing. Securities in the Fund may not match those in an index.
Annual Report 2015
3
COLUMBIA GLOBAL INFLATION-LINKED BOND PLUS FUND
PERFORMANCE OVERVIEW (continued)
Performance of a Hypothetical $10,000 Investment (March 12, 2014 – July 31, 2015)
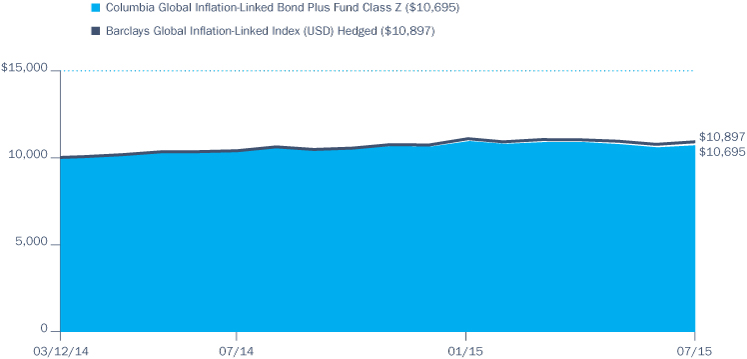
The chart above shows the change in value of a hypothetical $10,000 investment in Class Z shares of Columbia Global Inflation-Linked Bond Plus Fund during the stated time period, and does not reflect the deduction of taxes that a shareholder may pay on Fund distributions or on the redemption of Fund shares.
Annual Report 2015
4
COLUMBIA GLOBAL INFLATION-LINKED BOND PLUS FUND
MANAGER DISCUSSION OF FUND PERFORMANCE
At July 31, 2015, approximately 99% of the Fund's shares were owned in the aggregate by affiliated funds-of-funds managed by Columbia Management Investment Advisers, LLC (the Investment Manager). As a result of asset allocation decisions by the Investment Manager, it is possible that the Fund may experience relatively large purchases or redemptions from affiliated funds-of-funds. The Investment Manager seeks to minimize the impact of these transactions by structuring them over a reasonable period of time. The Fund may experience increased expenses as it buys and sells securities as a result of purchases or redemptions by affiliated funds-of-funds.
For the 12-month period that ended July 31, 2015, the Fund's Class Z shares returned 2.73%. The Fund's benchmark, the Barclays Global Inflation-Linked Index (USD) Hedged, returned 4.93% over the same time period. The Fund's performance was constrained during the period as its holdings of Treasury Inflation Protected Securities (TIPS) were hurt by a decline in U.S. inflation expectations, as well by a relatively conservative stance with respect to duration and corresponding interest rate sensitivity in core Europe.
Inflation Expectations Tempered by Strong U.S. Dollar, Weak Oil Price
Returns for inflation-linked sovereign bonds are influenced not only by changes in inflation expectations, but also the direction of nominal yields in those markets. The latter factor was generally supportive of fixed-income securities, including inflation-linkers, for the 12 months ended July 31, 2015, as interest rates generally drifted downward. The U.S. bond market appeared to be comfortable with the trajectory of the U.S. Federal Reserve (the Fed), as it tapered its purchases of longer term bonds towards zero, while actively monitoring conditions with an eye toward beginning to hike its benchmark short term interest rate. Even as the Fed was preparing to tighten policy, the European Central Bank (ECB), Bank of Japan, and People's Bank of China stepped up efforts to suppress borrowing costs and stimulate their respective economies.
The result of these diverging central bank policies was increased support for the dollar against other leading currencies and a perception that there was little risk of an acceleration in U.S. inflation. The U.S. inflation outlook was further undermined by a collapse in the price of crude oil and commodities generally over the latter part of 2014, driven largely by concerns over slowing growth in China. So-called "headline inflation," which includes energy and food prices, was nearly flat for the 12-month reporting period, despite reasonable strength in key sectors such as housing. Against this backdrop of subdued inflation expectations, U.S. break-even rates (the difference between yields on nominal Treasuries and those for comparable-maturity TIPS) declined over the period, leading to negative price performance for TIPS. By contrast, performance for inflation-linked instruments in Europe was generally positive, as investors viewed the ECB's purchases of sovereign bonds as likely to have the desired impact of helping to reflate Eurozone economies.
Portfolio Management
Orhan Imer, Ph.D., CFA
Dave Chappell
Quality Breakdown (%)
(at July 31, 2015) | |
AAA rating | | | 38.5 | | |
AA rating | | | 28.5 | | |
BBB rating | | | 6.3 | | |
Not rated | | | 26.7 | | |
Total | | | 100.0 | | |
Percentages indicated are based upon total fixed income investments (excluding Money Market Funds).
Bond ratings apply to the underlying holdings of the Fund and not the Fund itself and are divided into categories ranging from highest to lowest credit quality, determined by using the middle rating of Moody's, S&P and Fitch, after dropping the highest and lowest available ratings. When ratings are available from only two rating agencies, the lower rating is used. When a rating is available from only one rating agency, that rating is used. When a bond is not rated by any rating agency, it is designated as "Not rated." Credit quality ratings assigned by a rating agency are subjective opinions, not statements of fact, and are subject to change, including daily. The ratings assigned by credit rating agencies are but one of the considerations that the Investment Manager and/or Fund's subadviser incorporates into its credit analysis process, along with such other country-specific factors as the direction and stance of fiscal policy, balance of payment trends and commodity prices, the level and structure of public debt as well as political stability and commitment to strong macroeconomic policies.
Annual Report 2015
5
COLUMBIA GLOBAL INFLATION-LINKED BOND PLUS FUND
MANAGER DISCUSSION OF FUND PERFORMANCE (continued)
Country Breakdown (%)
(at July 31, 2015) | |
Australia | | | 2.3 | | |
Brazil | | | 1.4 | | |
France | | | 8.4 | | |
Germany | | | 1.3 | | |
Italy | | | 8.8 | | |
Spain | | | 2.0 | | |
Sweden | | | 1.0 | | |
United Kingdom | | | 24.5 | | |
United States(a) | | | 50.3 | | |
Total | | | 100.0 | | |
Country Breakdown is based primarily on issuer's place of organization/incorporation. The Fund may use this and/or other criteria, for purposes of its investment policies, in determining whether an issuer is domestic (U.S.) or foreign. Percentages indicated are based upon total investments. The Fund's portfolio composition is subject to change.
(a) Includes investments in Money Market Funds.
Diverging Central Bank Policies Drive Performance
With respect to its U.S. TIPS exposure, the Fund was positioned for a strengthening in expectations for U.S. inflation, and this acted as a constraint on returns as break-even rates declined. The break-even rate refers to the difference between the yield on a nominal fixed-rate bond and the real yield on an inflation-linked bond of similar maturity and credit quality. The Fund was positioned overall to benefit from a steepening in the TIPS break-even curve, adding modestly to relative return as inflation expectations held up better over longer horizons. An emphasis on the long-end of the TIPS maturity spectrum also helped performance, as this segment benefited the most from the backdrop of declining nominal yields.
In Europe, the Fund maintained a shorter duration and corresponding interest rate sensitivity than the benchmark in the core markets of Germany and France, constraining returns to a degree as rates declined in those markets. An emphasis on inflation-linked bonds in peripheral European markets, most notably Italy but also Spain and Portugal, added to relative return. Nominal sovereign yield spreads narrowed for peripherals vs. core markets, helping support returns for inflation-linkers along with other fixed-income assets in those markets.
While the Fund is permitted to utilize leverage, it did not do so during the period as we took a conservative approach with respect to the direction of interest rates. We invested in forward contracts to manage currency risk, seeking to mitigate the impact of changing exchange rates on Fund returns from investments denominated in foreign currencies. These forward contracts had a positive impact on the Fund's performance. We also invested in highly liquid, widely traded Treasury futures contracts to help manage overall portfolio duration and corresponding sensitivity to changes in market interest rates. These futures contracts had a negative impact on Fund performance. Overall derivatives usage, however, impacted the Fund's performance positively.
Looking Ahead
With respect to the principal constituents of its benchmark, the Fund is currently slightly overweight the U.S. at the expense of the U.K., based on an assessment of relative valuation, while maintaining a basically neutral allocation to Europe. In Europe, we continue to be overweight the peripheral versus core economies.
Overall, the Fund remains positioned at this time for inflation to surprise the market on the upside. Expectations for U.S. headline inflation, which drive movements in TIPS break-even rates, appear to reflect more sustained weakness in energy prices than we anticipate. In addition, our current view is that the dollar has likely already experienced most of the positive impact from the anticipation of Fed tightening, and that it could ease from current levels. With the Fed appearing to approach the beginning of a tightening cycle, the Fund is positioned at this time for a flattening of the U.S. yield curve, and overall portfolio duration is somewhat lower than the benchmark.
Annual Report 2015
6
COLUMBIA GLOBAL INFLATION-LINKED BOND PLUS FUND
MANAGER DISCUSSION OF FUND PERFORMANCE (continued)
Investment Risks
Market risk may affect a single issuer, sector of the economy, industry or the market as a whole. Foreign investments subject the Fund to risks, including political, economic, market, social and others within a particular country, as well as to currency instabilities and less stringent financial and accounting standards generally applicable to U.S. issuers. Risks are enhanced for emerging market issuers. Fixed-income securities present issuer default risk. A rise in interest rates may result in a price decline of fixed-income instruments held by the Fund, negatively impacting its performance and NAV. Falling rates may result in the Fund investing in lower yielding debt instruments, lowering the Fund's income and yield. These risks may be heightened for longer maturity and duration securities. Non-investment-grade (high-yield or junk) securities present greater price volatility and more risk to principal and income than higher rated securities. Prepayment and extension risk exists as a loan, bond or other investment may be called, prepaid or redeemed before maturity and that similar yielding investments may not be available for purchase. Interest payments on inflation-protected securities may be more volatile than interest payments on ordinary bonds. In periods of deflation, these securities may provide no income. Investing in derivatives is a specialized activity that involves special risks that subject the Fund to significant loss potential, including when used as leverage, and may result in greater fluctuation in Fund value. As a non-diversified fund, fewer investments could have a greater effect on performance. See the Fund's prospectus for more information on these and other risks.
Annual Report 2015
7
COLUMBIA GLOBAL INFLATION-LINKED BOND PLUS FUND
UNDERSTANDING YOUR FUND'S EXPENSES
(Unaudited)
As an investor, you incur two types of costs. There are transaction costs, which generally include sales charges on purchases and may include redemption fees. There are also ongoing costs, which generally include management fees, distribution and/or service fees, and other fund expenses. The following information is intended to help you understand your ongoing costs (in dollars) of investing in the Fund and to help you compare these costs with the ongoing costs of investing in other mutual funds.
Analyzing Your Fund's Expenses
To illustrate these ongoing costs, we have provided examples and calculated the expenses paid by investors in each share class of the Fund during the period. The actual and hypothetical information in the table is based on an initial investment of $1,000 at the beginning of the period indicated and held for the entire period. Expense information is calculated two ways and each method provides you with different information. The amount listed in the "Actual" column is calculated using the Fund's actual operating expenses and total return for the period. You may use the Actual information, together with the amount invested, to estimate the expenses that you paid over the period. Simply divide your account value by $1,000 (for example, an $8,600 account value divided by $1,000 = 8.6), then multiply the results by the expenses paid during the period under the "Actual" column. The amount listed in the "Hypothetical" column assumes a 5% annual rate of return before expenses (which is not the Fund's actual return) and then applies the Fund's actual expense ratio for the period to the hypothetical return. You should not use the hypothetical account values and expenses to estimate either your actual account balance at the end of the period or the expenses you paid during the period. See "Compare With Other Funds" below for details on how to use the hypothetical data.
Compare With Other Funds
Since all mutual funds are required to include the same hypothetical calculations about expenses in shareholder reports, you can use this information to compare the ongoing cost of investing in the Fund with other funds. To do so, compare the hypothetical example with the 5% hypothetical examples that appear in the shareholder reports of other funds. As you compare hypothetical examples of other funds, it is important to note that hypothetical examples are meant to highlight the ongoing costs of investing in a fund only and do not reflect any transaction costs, such as sales charges, or redemption or exchange fees. Therefore, the hypothetical calculations are useful in comparing ongoing costs only, and will not help you determine the relative total costs of owning different funds. If transaction costs were included in these calculations, your costs would be higher.
February 1, 2015 – July 31, 2015
| | | Account Value at the Beginning
of the Period ($) | | Account Value at the End of the
Period ($) | | Expenses Paid During the
Period ($) | | Fund's Annualized
Expense Ratio (%) | |
| | | Actual | | Hypothetical | | Actual | | Hypothetical | | Actual | | Hypothetical | | Actual | |
Class I | | | 1,000.00 | | | | 1,000.00 | | | | 978.70 | | | | 1,021.19 | | | | 3.70 | | | | 3.78 | | | | 0.75 | | |
Class W | | | 1,000.00 | | | | 1,000.00 | | | | 976.70 | | | | 1,019.20 | | | | 5.67 | | | | 5.79 | | | | 1.15 | | |
Class Z | | | 1,000.00 | | | | 1,000.00 | | | | 978.00 | | | | 1,020.44 | | | | 4.44 | | | | 4.53 | | | | 0.90 | | |
Expenses paid during the period are equal to the annualized expense ratio for each class as indicated above, multiplied by the average account value over the period and then multiplied by the number of days in the Fund's most recent fiscal half year and divided by 365.
Expenses do not include fees and expenses incurred indirectly by the Fund from its investment in underlying funds, including affiliated and non-affiliated pooled investment vehicles, such as mutual funds and exchange-traded funds.
Had Columbia Management Investment Advisers, LLC and/or certain of its affiliates not waived/reimbursed certain fees and expenses, account value at the end of the period would have been reduced.
Annual Report 2015
8
COLUMBIA GLOBAL INFLATION-LINKED BOND PLUS FUND
PORTFOLIO OF INVESTMENTS
July 31, 2015
(Percentages represent value of investments compared to net assets)
Inflation-Indexed Bonds(a) 81.1%
Issuer | | Coupon
Rate | | Principal
Amount ($) | | Value ($) | |
AUSTRALIA 2.3% | |
Australia Government Bond
09/20/30 | | | 2.500 | % | | AUD | | | | | 39,383 | | | | 35,642 | | |
Australia Government Index-Linked Bond
09/20/25 | | | 3.000 | % | | AUD | | | | | 69,203 | | | | 62,895 | | |
Total | | | | | | | | | 98,537 | | |
BRAZIL 1.4% | |
Brazil Notas do Tesouro Nacional
08/15/40 | | | 6.000 | % | | BRL | | | | | 214,240 | | | | 60,786 | | |
FRANCE 8.5% | |
France Government Bond OAT
07/25/24 | | | 0.250 | % | | EUR | | | | | 229,545 | | | | 269,290 | | |
France Government Bond OAT
07/25/18 | | | 0.250 | % | | EUR | | | | | 83,554 | | | | 94,440 | | |
Total | | | | | | | | | 363,730 | | |
GERMANY 1.3% | |
Bundesrepublik Deutschland Bundesobligation Inflation-Linked Bond
04/15/30 | | | 0.500 | % | | EUR | | | | | 45,666 | | | | 57,465 | | |
ITALY 8.8% | |
Italy Buoni Poliennali Del Tesoro
09/15/16 | | | 2.100 | % | | EUR | | | | | 161,270 | | | | 180,897 | | |
09/15/23 | | | 2.600 | % | | EUR | | | | | 57,329 | | | | 72,857 | | |
09/15/35 | | | 2.350 | % | | EUR | | | | | 66,031 | | | | 87,695 | | |
09/15/41 | | | 2.550 | % | | EUR | | | | | 27,279 | | | | 37,494 | | |
Total | | | | | | | | | 378,943 | | |
SPAIN 2.0% | |
Spain Government Inflation-Linked Bond(b)
11/30/24 | | | 1.800 | % | | EUR | | | | | 70,395 | | | | 84,112 | | |
SWEDEN 1.0% | |
Sweden Inflation-Linked Bond
06/01/25 | | | 1.000 | % | | SEK | | | | | 325,004 | | | | 43,645 | | |
UNITED KINGDOM 24.6% | |
United Kingdom Gilt Inflation-Linked Bond
03/22/29 | | | 0.125 | % | | GBP | | | | | 76,210 | | | | 134,103 | | |
03/22/34 | | | 0.750 | % | | GBP | | | | | 155,828 | | | | 318,499 | | |
03/22/44 | | | 0.125 | % | | GBP | | | | | 92,764 | | | | 189,051 | | |
11/22/47 | | | 0.750 | % | | GBP | | | | | 25,504 | | | | 63,557 | | |
03/22/52 | | | 0.250 | % | | GBP | | | | | 64,073 | | | | 148,114 | | |
03/22/62 | | | 0.375 | % | | GBP | | | | | 63,571 | | | | 176,066 | | |
03/22/68 | | | 0.125 | % | | GBP | | | | | 10,352 | | | | 28,400 | | |
Total | | | | | | | | | 1,057,790 | | |
Inflation-Indexed Bonds(a) (continued)
Issuer | | Coupon
RatePrincipal
Amount ($) | | Value ($) | |
UNITED STATES 31.2% | |
U.S. Treasury Inflation-Indexed Bond
04/15/20 | | | 0.125 | % | | | 25,387 | | | | 25,357 | | |
01/15/21 | | | 1.125 | % | | | 163,065 | | | | 171,142 | | |
01/15/24 | | | 0.625 | % | | | 112,110 | | | | 113,494 | | |
01/15/25 | | | 2.375 | % | | | 44,156 | | | | 51,728 | | |
01/15/26 | | | 2.000 | % | | | 215,667 | | | | 247,074 | | |
01/15/28 | | | 1.750 | % | | | 113,513 | | | | 128,890 | | |
04/15/28 | | | 3.625 | % | | | 58,811 | | | | 80,154 | | |
01/15/29 | | | 2.500 | % | | | 110,762 | | | | 136,808 | | |
04/15/32 | | | 3.375 | % | | | 20,096 | | | | 28,406 | | |
02/15/40 | | | 2.125 | % | | | 165,036 | | | | 204,967 | | |
02/15/43 | | | 0.625 | % | | | 10,343 | | | | 9,278 | | |
02/15/44 | | | 1.375 | % | | | 102,036 | | | | 110,071 | | |
02/15/45 | | | 0.750 | % | | | 40,395 | | | | 37,356 | | |
Total | | | | | | | 1,344,725 | | |
Total Inflation-Indexed Bonds
(Cost: $3,491,439) | | | | | | | 3,489,733 | | |
Money Market Funds 19.1%
| | | Shares | | Value ($) | |
Columbia Short-Term Cash Fund,
0.124%(c)(d) | | | 823,504 | | | | 823,504 | | |
Total Money Market Funds
(Cost: $823,504) | | | | | 823,504 | | |
Total Investments
(Cost: $4,314,943) | | | | | 4,313,237 | | |
Other Assets & Liabilities, Net | | | | | (6,500 | ) | |
Net Assets | | | | | 4,306,737 | | |
The accompanying Notes to Financial Statements are an integral part of this statement.
Annual Report 2015
9
COLUMBIA GLOBAL INFLATION-LINKED BOND PLUS FUND
PORTFOLIO OF INVESTMENTS (continued)
July 31, 2015
At July 31, 2015, cash totaling $7,475 was pledged as collateral.
Investments in Derivatives
Forward Foreign Currency Exchange Contracts Open at July 31, 2015
Counterparty | | Exchange Date | | Currency to
be Delivered | |
| | Currency to
be Received | |
| | Unrealized
Appreciation ($) | | Unrealized
Depreciation ($) | |
Barclays Bank PLC | | 9/3/15 | | | 876,000 | | | EUR | | | | | 956,952 | | | USD | | | | | — | | | | (5,483 | ) | |
Citigroup Global Markets Inc. | | 8/6/15 | | | 30,000 | | | AUD | | | | | 22,211 | | | USD | | | | | 285 | | | | — | | |
Citigroup Global Markets Inc. | | 8/6/15 | | | 22,948 | | | USD | | | | | 30,000 | | | AUD | | | | | — | | | | (1,022 | ) | |
Citigroup Global Markets Inc. | | 9/3/15 | | | 103,000 | | | AUD | | | | | 74,963 | | | USD | | | | | — | | | | (186 | ) | |
Standard Chartered Bank | | 9/3/15 | | | 724,000 | | | GBP | | | | | 1,129,672 | | | USD | | | | | — | | | | (709 | ) | |
Standard Chartered Bank | | 9/3/15 | | | 640,000 | | | SEK | | | | | 74,211 | | | USD | | | | | — | | | | (15 | ) | |
UBS Securities | | 8/6/15 | | | 57,000 | | | NZD | | | | | 38,227 | | | USD | | | | | 608 | | | | — | | |
UBS Securities | | 8/6/15 | | | 37,226 | | | USD | | | | | 57,000 | | | NZD | | | | | 393 | | | | — | | |
UBS Securities | | 9/3/15 | | | 7,908 | | | USD | | | | | 12,000 | | | NZD | | | | | — | | | | (8 | ) | |
Total | | | | | | | | | | | | | 1,286 | | | | (7,423 | ) | |
Futures Contracts Outstanding at July 31, 2015
Short Futures Contracts Outstanding
Contract Description | | Number of
Contracts | | Trading
Currency | | Notional
Market
Value ($) | | Expiration
Date | | Unrealized
Appreciation ($) | | Unrealized
Depreciation ($) | |
| EURO-BOBL | | | (1 | ) | | EUR | | | | | (143,113 | ) | | 09/2015 | | | — | | | | (70 | ) | |
US 10YR NOTE (CBT) | | | (2 | ) | | USD | | | | | (254,875 | ) | | 09/2015 | | | — | | | | (2,535 | ) | |
US 5YR NOTE (CBT) | | | (4 | ) | | USD | | | | | (479,375 | ) | | 09/2015 | | | — | | | | (1,884 | ) | |
Total | | | | | | | (877,363 | ) | | | | | — | | | | (4,489 | ) | |
Notes to Portfolio of Investments
(a) Principal amounts are denominated in United States Dollars unless otherwise noted.
(b) Security exempt from registration pursuant to Rule 144A under the Securities Act of 1933. This security may be resold in transactions exempt from registration, normally to qualified institutional buyers. At July 31, 2015, the value of these securities amounted to $84,112 or 1.95% of net assets.
(c) The rate shown is the seven-day current annualized yield at July 31, 2015.
(d) As defined in the Investment Company Act of 1940, an affiliated company is one in which the Fund owns 5% or more of the company's outstanding voting securities, or a company which is under common ownership or control with the Fund. Holdings and transactions in these affiliated companies during the year ended July 31, 2015 are as follows:
Issuer | | Beginning
Cost ($) | | Purchase
Cost ($) | | Proceeds
From Sales ($) | | Ending
Cost ($) | | Dividends —
Affiliated
Issuers ($) | | Value ($) | |
Columbia Short-Term Cash Fund | | | 167,057 | | | | 1,911,934 | | | | (1,255,487 | ) | | | 823,504 | | | | 280 | | | | 823,504 | | |
The accompanying Notes to Financial Statements are an integral part of this statement.
Annual Report 2015
10
COLUMBIA GLOBAL INFLATION-LINKED BOND PLUS FUND
PORTFOLIO OF INVESTMENTS (continued)
July 31, 2015
AUD Australian Dollar
BRL Brazilian Real
EUR Euro
GBP British Pound
NZD New Zealand Dollar
SEK Swedish Krona
USD US Dollar
Fair Value Measurements
The Fund categorizes its fair value measurements according to a three-level hierarchy that maximizes the use of observable inputs and minimizes the use of unobservable inputs by prioritizing that the most observable input be used when available. Observable inputs are those that market participants would use in pricing an investment based on market data obtained from sources independent of the reporting entity. Unobservable inputs are those that reflect the Fund's assumptions about the information market participants would use in pricing an investment. An investment's level within the fair value hierarchy is based on the lowest level of any input that is deemed significant to the asset's or liability's fair value measurement. The input levels are not necessarily an indication of the risk or liquidity associated with investments at that level. For example, certain U.S. government securities are generally high quality and liquid, however, they are reflected as Level 2 because the inputs used to determine fair value may not always be quoted prices in an active market.
Fair value inputs are summarized in the three broad levels listed below:
> Level 1 — Valuations based on quoted prices for investments in active markets that the Fund has the ability to access at the measurement date (including NAV for open-end mutual funds). Valuation adjustments are not applied to Level 1 investments.
> Level 2 — Valuations based on other significant observable inputs (including quoted prices for similar securities, interest rates, prepayment speeds, credit risks, etc.).
> Level 3 — Valuations based on significant unobservable inputs (including the Fund's own assumptions and judgment in determining the fair value of investments).
Inputs that are used in determining fair value of an investment may include price information, credit data, volatility statistics, and other factors. These inputs can be either observable or unobservable. The availability of observable inputs can vary between investments, and is affected by various factors such as the type of investment, and the volume and level of activity for that investment or similar investments in the marketplace. The inputs will be considered by the Investment Manager, along with any other relevant factors in the calculation of an investment's fair value. The Fund uses prices and inputs that are current as of the measurement date, which may include periods of market dislocations. During these periods, the availability of prices and inputs may be reduced for many investments. This condition could cause an investment to be reclassified between the various levels within the hierarchy.
Investments falling into the Level 3 category are primarily supported by quoted prices from brokers and dealers participating in the market for those investments. However, these may be classified as Level 3 investments due to lack of market transparency and corroboration to support these quoted prices. Additionally, valuation models may be used as the pricing source for any remaining investments classified as Level 3. These models may rely on one or more significant unobservable inputs and/or significant assumptions by the Investment Manager. Inputs used in valuations may include, but are not limited to, financial statement analysis, capital account balances, discount rates and estimated cash flows, and comparable company data.
Under the direction of the Fund's Board of Trustees (the Board), the Investment Manager's Valuation Committee (the Committee) is responsible for overseeing the valuation procedures approved by the Board. The Committee consists of voting and non-voting members from various groups within the Investment Manager's organization, including operations and accounting, trading and investments, compliance, risk management and legal.
The Committee meets at least monthly to review and approve valuation matters, which may include a description of specific valuation determinations, data regarding pricing information received from approved pricing vendors and brokers and the results of Board-approved valuation control policies and procedures (the Policies). The Policies address, among other things, instances when market quotations are or are not readily available, including recommendations of third party pricing vendors and a determination of appropriate pricing methodologies; events that require specific valuation determinations and assessment of fair value techniques; securities with a potential for stale pricing, including those that are illiquid, restricted, or in default; and the effectiveness of third party pricing vendors, including periodic reviews of vendors. The Committee meets more frequently, as needed, to discuss additional valuation matters, which may include the need to review back-testing results, review time-sensitive information or approve related valuation actions. The Committee reports to the Board, with members of the Committee meeting with the Board at each of its regularly scheduled meetings to discuss valuation matters and actions during the period, similar to those described earlier.
The accompanying Notes to Financial Statements are an integral part of this statement.
Annual Report 2015
11
COLUMBIA GLOBAL INFLATION-LINKED BOND PLUS FUND
PORTFOLIO OF INVESTMENTS (continued)
July 31, 2015
Fair Value Measurements (continued)
For investments categorized as Level 3, the Committee monitors information similar to that described above, which may include: (i) data specific to the issuer or comparable issuers, (ii) general market or specific sector news and (iii) quoted prices and specific or similar security transactions. The Committee considers this data and any changes from prior periods in order to assess the reasonableness of observable and unobservable inputs, any assumptions or internal models used to value those securities and changes in fair value. This data is also used to corroborate, when available, information received from approved pricing vendors and brokers. Various factors impact the frequency of monitoring this information (which may occur as often as daily). However, the Committee may determine that changes to inputs, assumptions and models are not required as a result of the monitoring procedures performed.
The following table is a summary of the inputs used to value the Fund's investments at July 31, 2015:
| | | Level 1
Quoted Prices in Active
Markets for Identical
Assets ($) | | Level 2
Other Significant
Observable Inputs ($) | | Level 3
Significant
Unobservable Inputs ($) | | Total ($) | |
Investments | |
Inflation-Indexed Bonds | | | — | | | | 3,489,733 | | | | — | | | | 3,489,733 | | |
Money Market Funds | | | 823,504 | | | | — | | | | — | | | | 823,504 | | |
Total Investments | | | 823,504 | | | | 3,489,733 | | | | — | | | | 4,313,237 | | |
Derivatives | |
Assets | |
Forward Foreign Currency
Exchange Contracts | | | — | | | | 1,286 | | | | — | | | | 1,286 | | |
Liabilities | |
Forward Foreign Currency
Exchange Contracts | | | — | | | | (7,423 | ) | | | — | | | | (7,423 | ) | |
Futures Contracts | | | (4,489 | ) | | | — | | | | — | | | | (4,489 | ) | |
Total | | | 819,015 | | | | 3,483,596 | | | | — | | | | 4,302,611 | | |
See the Portfolio of Investments for all investment classifications not indicated in the table.
The Fund's assets assigned to the Level 2 input category are generally valued using the market approach, in which a security's value is determined through reference to prices and information from market transactions for similar or identical assets.
There were no transfers of financial assets between levels during the period.
Derivative instruments are valued at unrealized appreciation (depreciation).
The accompanying Notes to Financial Statements are an integral part of this statement.
Annual Report 2015
12
COLUMBIA GLOBAL INFLATION-LINKED BOND PLUS FUND
STATEMENT OF ASSETS AND LIABILITIES
July 31, 2015
Assets | |
Investments, at value | |
Unaffiliated issuers (identified cost $3,491,439) | | $ | 3,489,733 | | |
Affiliated issuers (identified cost $823,504) | | | 823,504 | | |
Total investments (identified cost $4,314,943) | | | 4,313,237 | | |
Foreign currency (identified cost $5,926) | | | 4,689 | | |
Margin deposits | | | 7,475 | | |
Unrealized appreciation on forward foreign currency exchange contracts | | | 1,286 | | |
Receivable for: | |
Investments sold | | | 43,155 | | |
Capital shares sold | | | 4 | | |
Dividends | | | 70 | | |
Interest | | | 8,589 | | |
Foreign tax reclaims | | | 1,113 | | |
Variation margin | | | 33 | | |
Expense reimbursement due from Investment Manager | | | 544 | | |
Prepaid expenses | | | 45 | | |
Trustees' deferred compensation plan | | | 3,208 | | |
Total assets | | | 4,383,448 | | |
Liabilities | |
Unrealized depreciation on forward foreign currency exchange contracts | | | 7,423 | | |
Payable for: | |
Investments purchased | | | 25,411 | | |
Capital shares purchased | | | 965 | | |
Variation margin | | | 2,688 | | |
Investment management fees | | | 73 | | |
Administration fees | | | 9 | | |
Printing and postage fees | | | 5,632 | | |
Accounting fees | | | 29,780 | | |
Other expenses | | | 1,522 | | |
Trustees' deferred compensation plan | | | 3,208 | | |
Total liabilities | | | 76,711 | | |
Net assets applicable to outstanding capital stock | | $ | 4,306,737 | | |
Represented by | |
Paid-in capital | | $ | 4,378,998 | | |
Undistributed net investment income | | | 2,281 | | |
Accumulated net realized loss | | | (60,770 | ) | |
Unrealized appreciation (depreciation) on: | |
Investments | | | (1,706 | ) | |
Foreign currency translations | | | (1,440 | ) | |
Forward foreign currency exchange contracts | | | (6,137 | ) | |
Futures contracts | | | (4,489 | ) | |
Total — representing net assets applicable to outstanding capital stock | | $ | 4,306,737 | | |
The accompanying Notes to Financial Statements are an integral part of this statement.
Annual Report 2015
13
COLUMBIA GLOBAL INFLATION-LINKED BOND PLUS FUND
STATEMENT OF ASSETS AND LIABILITIES (continued)
July 31, 2015
Class I | |
Net assets | | $ | 4,287,436 | | |
Shares outstanding | | | 437,014 | | |
Net asset value per share | | $ | 9.81 | | |
Class W | |
Net assets | | $ | 9,492 | | |
Shares outstanding | | | 971 | | |
Net asset value per share | | $ | 9.78 | | |
Class Z | |
Net assets | | $ | 9,809 | | |
Shares outstanding | | | 1,000 | | |
Net asset value per share | | $ | 9.81 | | |
The accompanying Notes to Financial Statements are an integral part of this statement.
Annual Report 2015
14
COLUMBIA GLOBAL INFLATION-LINKED BOND PLUS FUND
STATEMENT OF OPERATIONS
Year Ended July 31, 2015
Net investment income | |
Income: | |
Dividends — affiliated issuers | | $ | 280 | | |
Interest | | | 40,380 | | |
Foreign taxes withheld | | | (606 | ) | |
Total income | | | 40,054 | | |
Expenses: | |
Investment management fees | | | 28,329 | | |
Distribution and/or service fees | |
Class W | | | 25 | | |
Transfer agent fees | |
Class W | | | 31 | | |
Class Z | | | 32 | | |
Administration fees | | | 3,655 | | |
Compensation of board members | | | 16,701 | | |
Custodian fees | | | 5,010 | | |
Printing and postage fees | | | 33,269 | | |
Registration fees | | | 47,794 | | |
Professional fees | | | 33,851 | | |
Chief compliance officer expenses | | | 2 | | |
Other | | | 9,921 | | |
Total expenses | | | 178,620 | | |
Fees waived or expenses reimbursed by Investment Manager and its affiliates | | | (144,298 | ) | |
Total net expenses | | | 34,322 | | |
Net investment income | | | 5,732 | | |
Realized and unrealized gain (loss) — net | |
Net realized gain (loss) on: | |
Investments | | | (60,786 | ) | |
Foreign currency translations | | | (4,581 | ) | |
Forward foreign currency exchange contracts | | | 377,124 | | |
Futures contracts | | | (61,757 | ) | |
Swap contracts | | | 1,827 | | |
Net realized gain | | | 251,827 | | |
Net change in unrealized appreciation (depreciation) on: | |
Investments | | | (91,903 | ) | |
Foreign currency translations | | | (765 | ) | |
Forward foreign currency exchange contracts | | | (30,130 | ) | |
Futures contracts | | | 1,132 | | |
Swap contracts | | | 1,859 | | |
Net change in unrealized depreciation | | | (119,807 | ) | |
Net realized and unrealized gain | | | 132,020 | | |
Net increase in net assets resulting from operations | | $ | 137,752 | | |
The accompanying Notes to Financial Statements are an integral part of this statement.
Annual Report 2015
15
COLUMBIA GLOBAL INFLATION-LINKED BOND PLUS FUND
STATEMENT OF CHANGES IN NET ASSETS
| | | Year Ended
July 31, 2015 | | Year Ended
July 31, 2014(a)(b) | |
Operations | |
Net investment income | | $ | 5,732 | | | $ | 45,892 | | |
Net realized gain | | | 251,827 | | | | 43,694 | | |
Net change in unrealized appreciation (depreciation) | | | (119,807 | ) | | | 106,035 | | |
Net increase in net assets resulting from operations | | | 137,752 | | | | 195,621 | | |
Distributions to shareholders | |
Net investment income | |
Class I | | | (358,810 | ) | | | — | | |
Class W | | | (724 | ) | | | — | | |
Class Z | | | (779 | ) | | | — | | |
Net realized gains | |
Class I | | | (45,129 | ) | | | — | | |
Class W | | | (97 | ) | | | — | | |
Class Z | | | (100 | ) | | | — | | |
Total distributions to shareholders | | | (405,639 | ) | | | — | | |
Increase (decrease) in net assets from capital stock activity | | | (377,736 | ) | | | 4,736,739 | | |
Total increase (decrease) in net assets | | | (645,623 | ) | | | 4,932,360 | | |
Net assets at beginning of year | | | 4,952,360 | | | | 20,000 | | |
Net assets at end of year | | $ | 4,306,737 | | | $ | 4,952,360 | | |
Undistributed net investment income | | $ | 2,281 | | | $ | 60,680 | | |
(a) Based on operations from March 12, 2014 (commencement of operations) through the stated period end.
(b) Class W shares are based on operations from June 25, 2014 (commencement of operations) through the stated period end.
The accompanying Notes to Financial Statements are an integral part of this statement.
Annual Report 2015
16
COLUMBIA GLOBAL INFLATION-LINKED BOND PLUS FUND
STATEMENT OF CHANGES IN NET ASSETS (continued)
| | | Year Ended July 31, 2015 | | Year Ended July 31, 2014(a)(b) | |
| | | Shares | | Dollars ($) | | Shares | | Dollars ($) | |
Capital stock activity | |
Class I shares | |
Subscriptions | | | 13,207 | | | | 135,552 | | | | 506,758 | | | | 5,069,026 | | |
Distributions reinvested | | | 40,305 | | | | 403,041 | | | | — | | | | — | | |
Redemptions | | | (90,196 | ) | | | (916,329 | ) | | | (34,060 | ) | | | (342,287 | ) | |
Net increase (decrease) | | | (36,684 | ) | | | (377,736 | ) | | | 472,698 | | | | 4,726,739 | | |
Class W shares | |
Subscriptions | | | — | | | | — | | | | 971 | | | | 10,000 | | |
Net increase | | | — | | | | — | | | | 971 | | | | 10,000 | | |
Total net increase (decrease) | | | (36,684 | ) | | | (377,736 | ) | | | 473,669 | | | | 4,736,739 | | |
(a) Based on operations from March 12, 2014 (commencement of operations) through the stated period end.
(b) Class W shares are based on operations from June 25, 2014 (commencement of operations) through the stated period end.
The accompanying Notes to Financial Statements are an integral part of this statement.
Annual Report 2015
17
COLUMBIA GLOBAL INFLATION-LINKED BOND PLUS FUND
The following tables are intended to help you understand the Fund's financial performance. Certain information reflects financial results for a single share of a class held for the periods shown. Per share net investment income (loss) amounts are calculated based on average shares outstanding during the period. Total return assumes reinvestment of all dividends and distributions, if any. Total return does not reflect payment of sales charges, if any. Total return and portfolio turnover are not annualized for periods of less than one year. The portfolio turnover rate is calculated without regard to purchase and sales transactions of short-term instruments and certain derivatives, if any. If such transactions were included, the Fund's portfolio turnover rate may be higher.
| | | Year Ended July 31, | |
Class I | | 2015 | | 2014(a) | |
Per share data | |
Net asset value, beginning of period | | $ | 10.41 | | | $ | 10.00 | | |
Income from investment operations: | |
Net investment income | | | 0.01 | | | | 0.10 | | |
Net realized and unrealized gain | | | 0.29 | | | | 0.31 | | |
Total from investment operations | | | 0.30 | | | | 0.41 | | |
Less distributions to shareholders: | |
Net investment income | | | (0.80 | ) | | | — | | |
Net realized gains | | | (0.10 | ) | | | — | | |
Total distributions to shareholders | | | (0.90 | ) | | | — | | |
Net asset value, end of period | | $ | 9.81 | | | $ | 10.41 | | |
Total return | | | 2.93 | % | | | 4.10 | % | |
Ratios to average net assets(b) | |
Total gross expenses | | | 3.91 | % | | | 2.18 | %(c) | |
Total net expenses(d) | | | 0.75 | % | | | 0.75 | %(c) | |
Net investment income | | | 0.13 | % | | | 2.44 | %(c) | |
Supplemental data | |
Net assets, end of period (in thousands) | | $ | 4,287 | | | $ | 4,932 | | |
Portfolio turnover | | | 29 | % | | | 54 | % | |
Notes to Financial Highlights
(a) Based on operations from March 12, 2014 (commencement of operations) through the stated period end.
(b) In addition to the fees and expenses that the Fund bears directly, the Fund indirectly bears a pro rata share of the fees and expenses of any other funds in which it invests. Such indirect expenses are not included in the Fund's reported expense ratios.
(c) Annualized.
(d) Total net expenses include the impact of certain fee waivers/expense reimbursements made by the Investment Manager and certain of its affiliates, if applicable.
The accompanying Notes to Financial Statements are an integral part of this statement.
Annual Report 2015
18
COLUMBIA GLOBAL INFLATION-LINKED BOND PLUS FUND
FINANCIAL HIGHLIGHTS (continued)
| | | Year Ended July 31, | |
Class W | | 2015 | | 2014(a) | |
Per share data | |
Net asset value, beginning of period | | $ | 10.37 | | | $ | 10.30 | | |
Income from investment operations: | |
Net investment income (loss) | | | (0.03 | ) | | | 0.04 | | |
Net realized and unrealized gain | | | 0.29 | | | | 0.03 | | |
Total from investment operations | | | 0.26 | | | | 0.07 | | |
Less distributions to shareholders: | |
Net investment income | | | (0.75 | ) | | | — | | |
Net realized gains | | | (0.10 | ) | | | — | | |
Total distributions to shareholders | | | (0.85 | ) | | | — | | |
Net asset value, end of period | | $ | 9.78 | | | $ | 10.37 | | |
Total return | | | 2.51 | % | | | 0.68 | % | |
Ratios to average net assets(b) | |
Total gross expenses | | | 4.49 | % | | | 2.03 | %(c) | |
Total net expenses(d) | | | 1.15 | % | | | 1.15 | %(c) | |
Net investment income (loss) | | | (0.27 | %) | | | 3.68 | %(c) | |
Supplemental data | |
Net assets, end of period (in thousands) | | $ | 9 | | | $ | 10 | | |
Portfolio turnover | | | 29 | % | | | 54 | % | |
Notes to Financial Highlights
(a) Based on operations from June 25, 2014 (commencement of operations) through the stated period end.
(b) In addition to the fees and expenses that the Fund bears directly, the Fund indirectly bears a pro rata share of the fees and expenses of any other funds in which it invests. Such indirect expenses are not included in the Fund's reported expense ratios.
(c) Annualized.
(d) Total net expenses include the impact of certain fee waivers/expense reimbursements made by the Investment Manager and certain of its affiliates, if applicable.
The accompanying Notes to Financial Statements are an integral part of this statement.
Annual Report 2015
19
COLUMBIA GLOBAL INFLATION-LINKED BOND PLUS FUND
FINANCIAL HIGHLIGHTS (continued)
| | | Year Ended July 31, | |
Class Z | | 2015 | | 2014(a) | |
Per share data | |
Net asset value, beginning of period | | $ | 10.41 | | | $ | 10.00 | | |
Income from investment operations: | |
Net investment income | | | (0.00 | )(b) | | | 0.09 | | |
Net realized and unrealized gain | | | 0.28 | | | | 0.32 | | |
Total from investment operations | | | 0.28 | | | | 0.41 | | |
Less distributions to shareholders: | |
Net investment income | | | (0.78 | ) | | | — | | |
Net realized gains | | | (0.10 | ) | | | — | | |
Total distributions to shareholders | | | (0.88 | ) | | | — | | |
Net asset value, end of period | | $ | 9.81 | | | $ | 10.41 | | |
Total return | | | 2.73 | % | | | 4.10 | % | |
Ratios to average net assets(c) | |
Total gross expenses | | | 4.23 | % | | | 2.40 | %(d) | |
Total net expenses(e) | | | 0.90 | % | | | 0.90 | %(d) | |
Net investment income (loss) | | | (0.02 | %) | | | 2.28 | %(d) | |
Supplemental data | |
Net assets, end of period (in thousands) | | $ | 10 | | | $ | 10 | | |
Portfolio turnover | | | 29 | % | | | 54 | % | |
Notes to Financial Highlights
(a) Based on operations from March 12, 2014 (commencement of operations) through the stated period end.
(b) Rounds to zero.
(c) In addition to the fees and expenses that the Fund bears directly, the Fund indirectly bears a pro rata share of the fees and expenses of any other funds in which it invests. Such indirect expenses are not included in the Fund's reported expense ratios.
(d) Annualized.
(e) Total net expenses include the impact of certain fee waivers/expense reimbursements made by the Investment Manager and certain of its affiliates, if applicable.
The accompanying Notes to Financial Statements are an integral part of this statement.
Annual Report 2015
20
COLUMBIA GLOBAL INFLATION-LINKED BOND PLUS FUND
NOTES TO FINANCIAL STATEMENTS
July 31, 2015
Note 1. Organization
Columbia Global Inflation-Linked Bond Plus Fund (the Fund), a series of Columbia Funds Series Trust I (the Trust), is a non-diversified fund. The Trust is registered under the Investment Company Act of 1940, as amended (the 1940 Act), as an open-end management investment company organized as a Massachusetts business trust.
Fund Shares
The Trust may issue an unlimited number of shares (without par value). The Fund offers Class I, Class W and Class Z shares. Although all share classes generally have identical voting, dividend and liquidation rights, each share class votes separately when required by the Trust's organizational documents or by law. Different share classes pay different distribution amounts to the extent the expenses of such share classes differ, and distributions in liquidation will be proportional to the net asset value of each share class. Each share class has its own expense and sales charge structure.
Class I shares are not subject to sales charges and are available only to the Columbia Family of Funds.
Class W shares are not subject to sales charges and are available only to investors purchasing through authorized investment programs managed by investment professionals, including discretionary managed account programs.
Class Z shares are not subject to sales charges and are available only to eligible investors, which are subject to different investment minimums as described in the Fund's prospectus.
Note 2. Summary of Significant Accounting Policies
Basis of Preparation
The Fund is an investment company that applies the accounting and reporting guidance in the Financial Accounting Standards Board (FASB) Accounting Standards Codification Topic 946, Financial Services — Investment Companies (ASC 946). The financial statements are prepared in accordance with U.S. generally accepted accounting principles (GAAP), which requires management to make certain estimates and assumptions that affect the reported amounts of assets and liabilities, the disclosure of contingent assets and liabilities at the date of the financial statements and the reported amounts of income and expenses during the
reporting period. Actual results could differ from those estimates.
The following is a summary of significant accounting policies followed by the Fund in the preparation of its financial statements.
Security Valuation
Debt securities generally are valued by pricing services approved by the Board of Trustees (the Board) based upon market transactions for normal, institutional-size trading units of similar securities. The services may use various pricing techniques that take into account, as applicable, factors such as yield, quality, coupon rate, maturity, type of issue, trading characteristics and other data, as well as broker quotes. Debt securities for which quotations are not readily available or not believed to be reflective of market value may also be valued based upon a bid quote from an approved independent broker-dealer.
Investments in open-end investment companies, including money market funds, are valued at their latest net asset value.
Forward foreign currency exchange contracts are marked-to-market based upon foreign currency exchange rates provided by a pricing service.
Futures and options on futures contracts are valued based upon the settlement price at the close of regular trading on their principal exchanges or, in the absence of transactions, at the mean of the latest quoted bid and ask prices.
Swap transactions are valued through an independent pricing service or broker, or if neither is available, through an internal model based upon observable inputs.
Investments for which market quotations are not readily available, or that have quotations which management believes are not reflective of market value or reliable, are valued at fair value as determined in good faith under procedures approved by and under the general supervision of the Board. If a security or class of securities (such as foreign securities) is valued at fair value, such value is likely to be different from the quoted or published price for the security.
The determination of fair value often requires significant judgment. To determine fair value, management may use assumptions including but not limited to future cash flows and estimated risk premiums. Multiple inputs from various sources may be used to determine fair value.
Annual Report 2015
21
COLUMBIA GLOBAL INFLATION-LINKED BOND PLUS FUND
NOTES TO FINANCIAL STATEMENTS (continued)
July 31, 2015
GAAP requires disclosure regarding the inputs and valuation techniques used to measure fair value and any changes in valuation inputs or techniques. In addition, investments shall be disclosed by major category. This information is disclosed following the Fund's Portfolio of Investments.
Foreign Currency Transactions and Translations
The values of all assets and liabilities denominated in foreign currencies are generally translated into U.S. dollars at exchange rates determined at the close of the New York Stock Exchange (NYSE). Net realized and unrealized gains (losses) on foreign currency transactions and translations include gains (losses) arising from the fluctuation in exchange rates between trade and settlement dates on securities transactions, gains (losses) arising from the disposition of foreign currency and currency gains (losses) between the accrual and payment dates on dividends, interest income and foreign withholding taxes.
For financial statement purposes, the Fund does not distinguish that portion of gains (losses) on investments which is due to changes in foreign exchange rates from that which is due to changes in market prices of the investments. Such fluctuations are included with the net realized and unrealized gains (losses) on investments in the Statement of Operations.
Derivative Instruments
The Fund invests in certain derivative instruments, as detailed below, to meet its investment objectives. Derivatives are instruments whose values depend on, or are derived from, in whole or in part, the value of one or more securities, currencies, commodities, indices, or other assets or instruments. Derivatives may be used to increase investment flexibility (including to maintain cash reserves while maintaining desired exposure to certain assets), for risk management (hedging) purposes, to facilitate trading, to reduce transaction costs and to pursue higher investment returns. The Fund may also use derivative instruments to mitigate certain investment risks, such as foreign currency exchange rate risk, interest rate risk and credit risk. Derivatives may involve various risks, including the potential inability of the counterparty to fulfill its obligation under the terms of the contract, the potential for an illiquid secondary market (making it difficult for the Fund to sell, including at favorable prices) and the potential for market movements which may expose the Fund to gains or losses in excess of the amount shown in the Statement of Assets and Liabilities. The notional amounts of derivative
instruments, if applicable, are not recorded in the financial statements.
A derivative instrument may suffer a marked-to-market loss if the value of the contract decreases due to an unfavorable change in the market rates or values of the underlying instrument. Losses can also occur if the counterparty does not perform under the contract. The Fund's risk of loss from counterparty credit risk on over-the-counter derivatives is generally limited to the aggregate unrealized gain netted against any collateral held by the Fund and the amount of any variation margin held by the counterparty. With exchange-traded or centrally cleared derivatives, there is reduced counterparty credit risk to the Fund since the exchange's clearinghouse, as counterparty to such instruments, guarantees against a possible default. The clearinghouse stands between the buyer and the seller of the contract; therefore, the counterparty credit risk is failure of the clearinghouse. However, credit risk still exists in exchange-traded or centrally cleared derivatives with respect to initial and variation margin that is held in a broker's customer account. While brokers are required to segregate customer margin from their own assets, in the event that a broker becomes insolvent or goes into bankruptcy and at that time there is a shortfall in the aggregate amount of margin held by the broker for all its clients, U.S. bankruptcy laws will typically allocate that shortfall on a pro-rata basis across all the broker's customers (including the Fund), potentially resulting in losses to the Fund.
In order to better define its contractual rights and to secure rights that will help the Fund mitigate its counterparty risk, the Fund may enter into an International Swaps and Derivatives Association, Inc. Master Agreement (ISDA Master Agreement) or similar agreement with its derivatives contract counterparties. An ISDA Master Agreement is an agreement between the Fund and a counterparty that governs over-the-counter derivatives and forward foreign currency exchange contracts and typically contains, among other things, collateral posting terms and netting provisions in the event of a default and/or termination event. Under an ISDA Master Agreement, the Fund may, under certain circumstances, offset with the counterparty certain derivative instrument's payables and/or receivables with collateral held and/or posted and create one single net payment. The provisions of the ISDA Master Agreement typically permit a single net payment in the event of default (close-out netting) including the bankruptcy or insolvency of the counterparty. Note, however, that
Annual Report 2015
22
COLUMBIA GLOBAL INFLATION-LINKED BOND PLUS FUND
NOTES TO FINANCIAL STATEMENTS (continued)
July 31, 2015
bankruptcy or insolvency laws of a particular jurisdiction may impose restrictions on or prohibitions against the right of offset in bankruptcy, insolvency or other events.
Collateral (margin) requirements differ by type of derivative. Margin requirements are established by the exchange or clearinghouse for exchange-traded and centrally cleared derivatives. Brokers can ask for margin in excess of the minimum in certain circumstances. Collateral terms are contract specific for over-the-counter derivatives. For over-the-counter derivatives traded under an ISDA Master Agreement, the collateral requirements are typically calculated by netting the marked-to-market amount for each transaction under such agreement and comparing that amount to the value of any variation margin currently pledged by the Fund and/or the counterparty. Generally, the amount of collateral due from or to a party has to exceed a minimum transfer amount threshold (e.g., $500,000) before a transfer has to be made. To the extent amounts due to the Fund from its counterparties are not fully collateralized, contractually or otherwise, the Fund bears the risk of loss from counterparty nonperformance. The Fund attempts to mitigate counterparty risk by only entering into agreements with counterparties that it believes have the financial resources to honor their obligations and by monitoring the financial stability of those counterparties.
Certain ISDA Master Agreements allow counterparties to over-the-counter derivatives transactions to terminate derivatives contracts prior to maturity in the event the Fund's net asset value declines by a stated percentage over a specified time period or if the Fund fails to meet certain terms of the ISDA Master Agreement, which would cause the Fund to accelerate payment of any net liability owed to the counterparty. The Fund also has termination rights if the counterparty fails to meet certain terms of the ISDA Master Agreement. In addition to considering counterparty credit risk, the Fund would consider terminating the derivatives contracts based on whether termination would result in a net liability owed from the counterparty.
For financial reporting purposes, the Fund does not offset derivative assets and derivative liabilities that are subject to netting arrangements in the Statement of Assets and Liabilities.
Forward Foreign Currency Exchange Contracts
Forward foreign currency exchange contracts are over-the-counter agreements between two parties to buy and sell a currency at a set price on a future date. The Fund utilized forward foreign currency exchange contracts to
hedge the currency exposure associated with some or all of the Fund's securities, to shift foreign currency exposure back to U.S. dollars, to shift investment exposure from one currency to another, to shift U.S. dollar exposure to achieve a representative weighted mix of major currencies in its benchmark, and/or to recover an underweight country exposure in its portfolio and to generate total return through long and short currency positions versus the U.S. dollar. These instruments may be used for other purposes in future periods.
The values of forward foreign currency exchange contracts fluctuate daily with changes in foreign currency exchange rates. Changes in the value of these contracts are recorded as unrealized appreciation or depreciation until the contract is exercised or has expired. The Fund will realize a gain or loss when the forward foreign currency exchange contract is closed or expires.
The use of forward foreign currency exchange contracts does not eliminate fluctuations in the prices of the Fund's portfolio securities. The risks of forward foreign currency exchange contracts include movement in the values of the foreign currencies relative to the U.S. dollar (or other foreign currencies) and the possibility that counterparties will not complete their contractual obligations, which may be in excess of the amount reflected, if any, in the Statement of Assets and Liabilities.
Futures Contracts
Futures contracts are exchange traded and represent commitments for the future purchase or sale of an asset at a specified price on a specified date. The Fund bought and sold futures contracts to manage exposure to movements in interest rates and to take breakeven positions. These instruments may be used for other purposes in future periods. Upon entering into futures contracts, the Fund bears risks that it may not achieve the anticipated benefits of the futures contracts and may realize a loss. Additional risks include counterparty credit risk, the possibility of an illiquid market, and that a change in the value of the contract or option may not correlate with changes in the value of the underlying asset.
Upon entering into a futures contract, the Fund pledges cash or securities with the broker in an amount sufficient to meet the initial margin requirement. The initial margin deposit must be maintained at an established level over the life of the contract. Cash deposited as initial margin is recorded in the Statement of Assets and Liabilities as margin deposits. Securities deposited as initial margin are designated in the Portfolio of Investments. Subsequent payments (variation margin) are made or
Annual Report 2015
23
COLUMBIA GLOBAL INFLATION-LINKED BOND PLUS FUND
NOTES TO FINANCIAL STATEMENTS (continued)
July 31, 2015
received by the Fund each day. The variation margin payments are equal to the daily change in the contract value and are recorded as variation margin receivable or payable and are offset in unrealized gains or losses. The Fund recognizes a realized gain or loss when the contract is closed or expires. Futures contracts involve, to varying degrees, risk of loss in excess of the variation margin disclosed in the Statement of Assets and Liabilities.
Swap Contracts
Swap contracts are negotiated in the over-the-counter market and may be entered into as a bilateral contract or centrally cleared (centrally cleared swap contract). In a centrally cleared swap contract, immediately following execution of the swap contract with a broker, the swap contract is novated to a central counterparty (the CCP) and the CCP becomes the Fund's counterparty to the centrally cleared swap contract. The Fund is required to deposit initial margin with the broker in the form of cash or securities in an amount that varies depending on the size and risk profile of the particular swap contract. Securities deposited as initial margin are designated in the Portfolio of Investments and cash deposited is recorded in the Statement of Assets and Liabilities as margin deposits. Unlike a bilateral swap contract, for centrally cleared swap contracts, the Fund has minimal credit exposure to the counterparty because the CCP stands between the Fund and the counterparty. Swap contracts are marked-to-market daily and changes in value are recorded as unrealized appreciation (depreciation). The daily change in valuation of centrally cleared swap contracts, if any, is recorded as a receivable or payable for variation margin in the Statement of Assets and Liabilities.
Interest Rate Swap Contracts
The Fund entered into interest rate swap transactions to gain exposure to or protect itself from market rate changes and to synthetically add or subtract principal exposure to a market. These instruments may be used for other purposes in future periods. Interest rate swaps are agreements between two parties that involve the exchange of one type of interest rate for another type of interest rate cash flow on specified dates in the future, based on a predetermined, specified notional amount. Certain interest rate swaps are considered forward-starting, whereby the accrual for the exchange of cash flows does not begin until a specified date in the future (the effective date). The net cash flow for a standard interest rate swap transaction is generally the difference between a floating market interest rate versus a fixed interest rate.
Interest rate swaps are valued daily and unrealized appreciation (depreciation) is recorded. Certain interest rate swaps may accrue periodic interest on a daily basis as a component of unrealized appreciation (depreciation); the Fund will realize a gain or loss upon the payment or receipt of accrued interest. The Fund will realize a gain or a loss when the interest rate swap is terminated.
Risks of entering into interest rate swaps include a lack of correlation between the swaps and the portfolio of bonds the swaps are designed to hedge or replicate. A lack of correlation may cause the interest rate swaps to experience adverse changes in value relative to expectations. In addition, interest rate swaps are subject to the risk of default of a counterparty, and the risk of adverse movements in market interest rates relative to the interest rate swap positions taken. The Fund's maximum risk of loss from counterparty credit risk is the discounted net value of the cash flows to be received from/paid to the counterparty over the contract's remaining life to the extent that such amount is positive, plus the cost of entering into a similar transaction with another counterparty.
The Fund attempts to mitigate counterparty credit risk by entering into interest rate swap transactions only with counterparties that meet prescribed levels of creditworthiness, as determined by the Investment Manager. The Fund and any counterparty are required to maintain an agreement that requires the Fund and that counterparty to monitor (on a daily basis) the net market value of all derivative transactions entered into pursuant to the agreement between the Fund and such counterparty. If the net market value of such derivatives transactions between the Fund and that counterparty exceeds a certain threshold (as defined in the agreement), the Fund or the counterparty is required to post cash and/or securities as collateral. Market values of derivatives transactions presented in the financial statements are not netted with the market values of other derivatives transactions or with any collateral amounts posted by the Fund or any counterparty.
Effects of Derivative Transactions in the Financial Statements
The following tables are intended to provide additional information about the effect of derivatives on the financial statements of the Fund, including: the fair value of derivatives by risk category and the location of those fair values in the Statement of Assets and Liabilities; and the impact of derivative transactions over the period in the Statement of Operations, including realized and
Annual Report 2015
24
COLUMBIA GLOBAL INFLATION-LINKED BOND PLUS FUND
NOTES TO FINANCIAL STATEMENTS (continued)
July 31, 2015
unrealized gains (losses). The derivative instrument schedules following the Portfolio of Investments present additional information regarding derivative instruments outstanding at the end of the period, if any.
The following table provides a summary of the average outstanding volume by derivative instrument for the year ended July 31, 2015:
| Derivative Instrument | | Average Notional
Amounts ($)* | |
Futures contracts — Short | | | 1,349,517 | | |
| Derivative Instrument | | Average Unrealized
Appreciation ($) | | Average Unrealized
Depreciation ($) | |
Forward foreign currency
exchange contracts | | | 19,054
| * | | | (11,042
| )* | |
Interest rate swap contracts | | | 282 | ** | | | (19 | )** | |
*Based on the ending quarterly outstanding amounts for the year ended July 31, 2015.
**Based on the daily outstanding amounts for the year ended July 31, 2015.
The following table provides a summary of the fair value of derivative instruments (not considered to be hedging instruments for accounting disclosure purposes) at July 31, 2015:
Asset Derivatives | |
Risk Exposure
Category | | Statement of Assets and
Liabilities Location | |
Fair Value ($) | |
Foreign exchange
risk
| | Unrealized appreciation on
forward foreign currency
exchange contracts | | | 1,286
| | |
Liability Derivatives | |
Risk Exposure
Category | | Statement of Assets and
Liabilities Location | |
Fair Value ($) | |
Foreign exchange
risk
| | Unrealized depreciation on
forward foreign currency
exchange contracts | | | 7,423
| | |
Interest rate risk
| | Net assets — unrealized
depreciation on futures
contracts | | | 4,489
| * | |
Total | | | | | 11,912 | | |
*Includes cumulative appreciation (depreciation) as reported in the tables following the Portfolio of Investments. Only the current day's variation margin is reported in receivables or payables in the Statement of Assets and Liabilities.
The following table indicates the effect of derivative instruments (not considered to be hedging instruments for accounting disclosure purposes) in the Statement of Operations for the year ended July 31, 2015:
Amount of Realized Gain (Loss) on Derivatives Recognized in Income | |
| Risk Exposure Category | | Forward Foreign
Currency Exchange
Contracts ($) | | Futures
Contracts ($) | | Swap
Contracts ($) | | Total ($) | |
Foreign exchange risk | | | 377,124 | | | | — | | | | — | | | | 377,124 | | |
Interest rate risk | | | — | | | | (61,757 | ) | | | 1,827 | | | | (59,930 | ) | |
Total | | | 377,124 | | | | (61,757 | ) | | | 1,827 | | | | 317,194 | | |
Change in Unrealized Appreciation (Depreciation) on Derivatives Recognized in Income | |
Risk Exposure Category | | Forward Foreign
Currency Exchange
Contracts ($) | | Futures
Contracts ($) | | Swap
Contracts ($) | | Total ($) | |
Foreign exchange risk | | | (30,130 | ) | | | — | | | | — | | | | (30,130 | ) | |
Interest rate risk | | | — | | | | 1,132 | | | | 1,859 | | | | 2,991 | | |
Total | | | (30,130 | ) | | | 1,132 | | | | 1,859 | | | | (27,139 | ) | |
Treasury Inflation Protected Securities
The Fund may invest in treasury inflation protected securities (TIPS). The principal amount of TIPS is adjusted periodically and is increased for inflation or decreased for deflation based on a monthly published
index. These adjustments are recorded as interest income in the Statement of Operations. Coupon payments are based on the adjusted principal at the time the interest is paid.
Annual Report 2015
25
COLUMBIA GLOBAL INFLATION-LINKED BOND PLUS FUND
NOTES TO FINANCIAL STATEMENTS (continued)
July 31, 2015
Offsetting of Assets and Liabilities
The following table presents the Fund's gross and net amount of assets and liabilities available for offset under netting arrangements as well as any related collateral received or pledged by the Fund as of July 31, 2015:
| | | Barclays ($) | | Citigroup Global
Markets Inc. ($) | | Standard
Chartered
Bank ($) | | UBS
Securities ($) | | Total ($) | |
Assets | |
Forward foreign currency exchange contracts | | | — | | | | 285 | | | | — | | | | 1,001 | | | | 1,286 | | |
Total Assets | | | — | | | | 285 | | | | — | | | | 1,001 | | | | 1,286 | | |
Liabilities | |
Forward foreign currency exchange contracts | | | 5,483 | | | | 1,208 | | | | 724 | | | | 8 | | | | 7,423 | | |
Total Liabilities | | | 5,483 | | | | 1,208 | | | | 724 | | | | 8 | | | | 7,423 | | |
Total Financial and Derivative Net Assets | | | (5,483 | ) | | | (923 | ) | | | (724 | ) | | | 993 | | | | (6,137 | ) | |
Total collateral received (pledged)(a) | | | — | | | | — | | | | — | | | | — | | | | — | | |
Net Amount(b) | | | (5,483 | ) | | | (923 | ) | | | (724 | ) | | | 993 | | | | (6,137 | ) | |
(a) In some instances, the actual collateral received and/or pledged may be more than the amount shown due to overcollateralization.
(b) Represents the net amount due from/ (to) counterparties in the event of default.
Security Transactions
Security transactions are accounted for on the trade date. Cost is determined and gains (losses) are based upon the specific identification method for both financial statement and federal income tax purposes.
Income Recognition
Interest income is recorded on an accrual basis. Market premiums and discounts, including original issue discounts, are amortized and accreted, respectively, over the expected life of the security on all debt securities, unless otherwise noted.
The Fund may place a debt security on non-accrual status and reduce related interest income when it becomes probable that the interest will not be collected and the amount of uncollectible interest can be reasonably estimated. A defaulted debt security is removed from non-accrual status when the issuer resumes interest payments or when collectibility of interest is reasonably assured.
Dividend income is recorded on the ex-dividend date.
Expenses
General expenses of the Trust are allocated to the Fund and other funds of the Trust based upon relative net assets or other expense allocation methodologies determined by the nature of the expense. Expenses directly attributable to the Fund are charged to the Fund. Expenses directly attributable to a specific class of shares are charged to that share class.
Determination of Class Net Asset Value
All income, expenses (other than class-specific expenses, which are charged to that share class, as shown in the Statement of Operations) and realized and unrealized gains (losses) are allocated to each class of the Fund on a daily basis, based on the relative net assets of each class, for purposes of determining the net asset value of each class.
Federal Income Tax Status
The Fund intends to qualify each year as a regulated investment company under Subchapter M of the Internal Revenue Code, as amended, and will distribute substantially all of its taxable income (including net short-term capital gains), if any, for its tax year, and as such will not be subject to federal income taxes. In addition, the Fund intends to distribute in each calendar year substantially all of its net investment income, capital gains and certain other amounts, if any, such that the Fund should not be subject to federal excise tax. Therefore, no federal income or excise tax provision is recorded.
Foreign Taxes
The Fund may be subject to foreign taxes on income, gains on investments or currency repatriation, a portion of which may be recoverable. The Fund will accrue such taxes and recoveries, as applicable, based upon its current interpretation of tax rules and regulations that exist in the markets in which it invests.
Annual Report 2015
26
COLUMBIA GLOBAL INFLATION-LINKED BOND PLUS FUND
NOTES TO FINANCIAL STATEMENTS (continued)
July 31, 2015
Realized gains in certain countries may be subject to foreign taxes at the Fund level, based on statutory rates. The Fund accrues for such foreign taxes on realized and unrealized gains at the appropriate rate for each jurisdiction, as applicable. The amount, if any, is disclosed as a liability on the Statement of Assets and Liabilities.
Distributions to Shareholders
Distributions from net investment income, if any, are declared and paid each calendar quarter. Net realized capital gains, if any, are distributed at least annually. Income distributions and capital gain distributions are determined in accordance with federal income tax regulations, which may differ from GAAP.
Guarantees and Indemnifications
Under the Trust's organizational documents and, in some cases, by contract, its officers and trustees are indemnified against certain liabilities arising out of the performance of their duties to the Trust or its funds. In addition, certain of the Fund's contracts with its service providers contain general indemnification clauses. The Fund's maximum exposure under these arrangements is unknown since the amount of any future claims that may be made against the Fund cannot be determined, and the Fund has no historical basis for predicting the likelihood of any such claims.
Recent Accounting Pronouncements
Transfers and Servicing (Topic 860), Repurchase-to-Maturity Transactions, Repurchase Financings, and Disclosures
In June 2014, the Financial Accounting Standards Board (FASB) issued Accounting Standards Update (ASU) No. 2014-11, Transfers and Servicing (Topic 860), Repurchase-to-Maturity Transactions, Repurchase Financings, and Disclosures. ASU No. 2014-11 changes the disclosure requirements for certain reverse repurchase agreements and similar transactions accounted for as secured borrowings. The disclosure requirements are effective for annual periods beginning after December 15, 2014, and for interim periods beginning after March 15, 2015. At this time, management is evaluating the implications of this guidance and the impact it will have on the financial statement amounts and footnote disclosures, if any.
Fair Value Measurement (Topic 820), Disclosure for Investments in Certain Entities That Calculate Net Asset Value per Share (or Its Equivalent)
In May 2015, the Financial Accounting Standards Board (FASB) issued Accounting Standards Update (ASU)
No. 2015-07, Fair Value Measurement (Topic 820), Disclosure for Investments in Certain Entities That Calculate Net Asset Value per Share (or Its Equivalent). ASU No. 2015-07 changes the disclosure requirements for investments for which fair value is measured using the net asset value per share practical expedient. The disclosure requirements are effective for annual periods beginning after December 15, 2016 and interim periods within those fiscal years. At this time, management is evaluating the implications of this guidance and the impact it will have on the financial statement amounts and footnote disclosures, if any.
Note 3. Fees and Other Transactions with Affiliates
Investment Management Fees
Under an Investment Management Services Agreement, Columbia Management Investment Advisers, LLC (the Investment Manager), a wholly-owned subsidiary of Ameriprise Financial, Inc. (Ameriprise Financial), determines which securities will be purchased, held or sold. The investment management fee is an annual fee that is equal to 0.62% of the Fund's average daily net assets.
Participating Affiliates
The Investment Manager and its investment advisory affiliates (Participating Affiliates) around the world may coordinate in providing services to their clients. Such coordination may include functional leadership of the business (the "Global" business). From time to time the Investment Manager (or any affiliated investment subadviser to the Fund, as the case may be) may engage its Participating Affiliates to provide a variety of services such as investment research, investment monitoring, trading and discretionary investment management (including portfolio management) to certain accounts managed by the Investment Manager, including the Fund. These Participating Affiliates will provide services to the Investment Manager (or any affiliated investment subadviser to the Fund as the case may be) either pursuant to subadvisory agreements, personnel-sharing agreements or similar inter-company arrangements and the Fund will pay no additional fees and expenses as a result of any such arrangements.
These Participating Affiliates, like the Investment Manager, are direct or indirect subsidiaries of Ameriprise Financial and are registered with appropriate respective regulators in their home jurisdictions and, where required, the Securities and Exchange Commission and
Annual Report 2015
27
COLUMBIA GLOBAL INFLATION-LINKED BOND PLUS FUND
NOTES TO FINANCIAL STATEMENTS (continued)
July 31, 2015
the Commodity Futures Trading Commission in the United States.
Pursuant to some of these arrangements, certain employees of these Participating Affiliates may serve as "associated persons" of the Investment Manager and, in this capacity, subject to the oversight and supervision of the Investment Manager and consistent with the investment objectives, policies and limitations set forth in the Fund's prospectus and Statement of Additional Information (SAI), may provide such services to the Fund on behalf of the Investment Manager.
Subadvisory Agreement
The Fund's Board has approved a subadvisory agreement between the Investment Manager and Threadneedle International Limited (Threadneedle), an affiliate of the Investment Manager and wholly-owned subsidiary of Ameriprise Financial. As of July 31, 2015, Threadneedle is not providing services to the Fund pursuant to the subadvisory agreement.
Administration Fees
Under an Administrative Services Agreement, the Investment Manager also serves as the Fund Administrator. The Fund pays the Fund Administrator an annual fee for administration and accounting services equal to 0.08% of the Fund's average daily net assets.
Other Expenses
Other expenses include offering costs which were incurred prior to the shares of the Fund being offered. Offering costs include, among other things, state registration filing fees and printing costs. The Fund amortizes offering costs over a period of 12 months from the commencement of operations.
Compensation of Board Members
Board members, who are not officers or employees of the Investment Manager or Ameriprise Financial, are compensated for their services to the Fund as disclosed in the Statement of Operations. These Board members may participate in a Deferred Compensation Plan (the Plan) which may be terminated at any time. Obligations of the Plan will be paid solely out of the Fund's assets, and all amounts payable under the Plan constitute a general unsecured obligation of the Fund.
Compensation of Chief Compliance Officer
The Board has appointed a Chief Compliance Officer to the Fund in accordance with federal securities regulations. The Fund is allocated a portion of the
expenses associated with the Chief Compliance Officer based on relative net assets of the Trust.
Transfer Agency Fees
Under a Transfer and Dividend Disbursing Agent Agreement, Columbia Management Investment Services Corp. (the Transfer Agent), an affiliate of the Investment Manager and a wholly-owned subsidiary of Ameriprise Financial, is responsible for providing transfer agency services to the Fund. The Transfer Agent has contracted with Boston Financial Data Services (BFDS) to serve as sub-transfer agent.
Effective November 1, 2014, the Transfer Agent receives a monthly transfer agency fee based on the number or the average value of accounts, depending on the type of account. Prior to November 1, 2014, the Transfer Agent received a monthly account-based service fee based on the number of open accounts. In addition, the Transfer Agent also receives sub-transfer agency fees based on a percentage of the average aggregate value of the Fund's shares maintained in omnibus accounts (other than omnibus accounts for which American Enterprise Investment Services Inc. is the broker of record or accounts where the beneficial shareholder is a customer of Ameriprise Financial Services, Inc., for which the Transfer Agent receives a per account fee). The Transfer Agent pays the fees of BFDS for services as sub-transfer agent and is not entitled to reimbursement for such fees from the Fund (with the exception of out-of-pocket fees).
The Transfer Agent also receives compensation from the Fund for various shareholder services and reimbursements for certain out-of-pocket fees. Class I shares do not pay transfer agency fees.
For the year ended July 31, 2015, the Fund's effective transfer agency fee rates as a percentage of average daily net assets of each class were as follows:
Class W | | | 0.32 | % | |
Class Z | | | 0.32 | | |
An annual minimum account balance fee of $20 may apply to certain accounts with a value below the applicable share class's initial minimum investment requirements to reduce the impact of small accounts on transfer agency fees. These minimum account balance fees are remitted to the Fund and recorded as part of expense reductions in the Statement of Operations. For the year ended July 31, 2015, no minimum account balance fees were charged by the Fund.
Annual Report 2015
28
COLUMBIA GLOBAL INFLATION-LINKED BOND PLUS FUND
NOTES TO FINANCIAL STATEMENTS (continued)
July 31, 2015
Distribution and Service Fees
The Fund has an agreement with Columbia Management Investment Distributors, Inc. (the Distributor), an affiliate of the Investment Manager and a wholly-owned subsidiary of Ameriprise Financial, for distribution and shareholder services. The Board has approved, and the Fund has adopted, distribution and shareholder service plans (the Plans) applicable to certain share classes, which set the distribution and service fees for the Fund. These fees are calculated daily and are intended to compensate the Distributor and/or eligible selling and/or servicing agents for selling shares of the Fund and providing services to investors.
The Fund may pay a distribution fee up to 0.25% of the Fund's average daily net assets attributable to Class W shares and a service fee of up to 0.25% of the Fund's average daily net assets attributable to Class W shares, however the aggregate fee shall not exceed 0.25% of the Fund's average daily net assets attributable to Class W shares.
Expenses Waived/Reimbursed by the Investment Manager and its Affiliates
The Investment Manager and certain of its affiliates have contractually agreed to waive fees and/or reimburse expenses (excluding certain fees and expenses described below) for the period disclosed below, unless sooner terminated at the sole discretion of the Board, so that the Fund's net operating expenses, after giving effect to fees waived/expenses reimbursed and any balance credits and/or overdraft charges from the Fund's custodian, do not exceed the following annual rates as a percentage of the class' average daily net assets:
| | | Fee Rates Contractual
through
November 30, 2015 | |
Class I | | | 0.75 | % | |
Class W | | | 1.15 | | |
Class Z | | | 0.90 | | |
Under the agreement governing these fee waivers and/or expense reimbursement arrangements, the following fees and expenses are excluded from the waiver/reimbursement commitment, and therefore will be paid by the Fund, if applicable: taxes (including foreign transaction taxes), expenses associated with investments in affiliated and non-affiliated pooled investment vehicles (including mutual funds and exchange-traded funds), transaction costs and brokerage commissions, costs related to any securities lending
program, dividend and interest expenses associated with securities sold short, inverse floater program fees and expenses, transaction charges and interest on borrowed money, interest, extraordinary expenses and any other expenses the exclusion of which is specifically approved by the Board. This agreement may be modified or amended only with approval from all parties. Any fees waived and/or expenses reimbursed under the expense reimbursement arrangements described above are not recoverable by the Investment Manager or its affiliates in future periods.
Note 4. Federal Tax Information
The timing and character of income and capital gain distributions are determined in accordance with income tax regulations, which may differ from GAAP because of temporary or permanent book to tax differences.
At July 31, 2015, these differences are primarily due to differing treatment for capital loss carryforwards, principal and/or interest of fixed income securities, Trustees' deferred compensation, distribution reclassifications, foreign currency transactions, post-October capital losses, derivative investments and tax straddles. To the extent these differences are permanent, reclassifications are made among the components of the Fund's net assets in the Statement of Assets and Liabilities. Temporary differences do not require reclassifications. In the Statement of Assets and Liabilities the following reclassifications were made:
Undistributed net investment income | | $ | 296,182 | | |
Accumulated net realized loss | | | (296,177 | ) | |
Paid-in capital | | | (5 | ) | |
Net investment income (loss) and net realized gains (losses), as disclosed in the Statement of Operations, and net assets were not affected by this reclassification.
The tax character of distributions paid during the years indicated was as follows:
Year Ended July 31, | | 2015 | |
Ordinary income | | $ | 398,801 | | |
Long-term capital gains | | | 6,838 | | |
Total | | | 405,639 | | |
Short-term capital gain distributions, if any, are considered ordinary income distributions for tax purposes.
Annual Report 2015
29
COLUMBIA GLOBAL INFLATION-LINKED BOND PLUS FUND
NOTES TO FINANCIAL STATEMENTS (continued)
July 31, 2015
At July 31, 2015, the components of distributable earnings on a tax basis were as follows:
Undistributed ordinary income | | $ | 43,073 | | |
Capital loss carryforwards | | | (8,006 | ) | |
Net unrealized depreciation | | | (1,706 | ) | |
At July 31, 2015, the cost of investments for federal income tax purposes was $4,314,943 and the aggregate gross unrealized appreciation and depreciation based on that cost was:
Unrealized appreciation | | $ | 193,866 | | |
Unrealized depreciation | | | (195,572 | ) | |
Net unrealized depreciation | | $ | (1,706 | ) | |
The following capital loss carryforwards, determined at July 31, 2015, may be available to reduce taxable income arising from future net realized gains on investments, if any, to the extent permitted by the Internal Revenue Code:
Year of Expiration | | Amount ($) | |
No expiration — short-term | | | 5,483 | | |
No expiration — long-term | | | 2,523 | | |
Total | | | 8,006 | | |
Under current tax rules, regulated investment companies can elect to treat certain late-year ordinary losses incurred and post-October capital losses (capital losses realized after October 31) as arising on the first day of the following taxable year. As of July 31, 2015, the Fund will elect to treat post-October capital losses of $19,954 as arising on August 1, 2015.
Management of the Fund has concluded that there are no significant uncertain tax positions in the Fund that would require recognition in the financial statements. However, management's conclusion may be subject to review and adjustment at a later date based on factors including, but not limited to, new tax laws, regulations, and administrative interpretations (including relevant court decisions). Generally, the Fund's federal tax returns for the prior three fiscal years remain subject to examination by the Internal Revenue Service.
Note 5. Portfolio Information
The cost of purchases and proceeds from sales of securities, excluding short-term investments and derivatives, if any, aggregated to $1,250,323 and $2,269,565, respectively, for the year ended July 31, 2015, of which $406,244 and $942,275, respectively, were U.S. government securities. The amount of
purchase and sale activity impacts the portfolio turnover rate reported in the Financial Highlights.
Note 6. Affiliated Money Market Fund
The Fund invests in Columbia Short-Term Cash Fund, an affiliated money market fund established for the exclusive use by the Fund and other affiliated funds. The income earned by the Fund from such investments is included as Dividends — affiliated issuers in the Statement of Operations. As an investing fund, the Fund indirectly bears its proportionate share of the expenses of Columbia Short-Term Cash Fund.
Note 7. Shareholder Concentration
At July 31, 2015, affiliated shareholders of record owned 100.0% of the outstanding shares of the Fund in one or more accounts. Subscription and redemption activity by concentrated accounts may have a significant effect on the operations of the Fund.
Note 8. Line of Credit
The Fund has entered into a revolving credit facility with a syndicate of banks led by JPMorgan Chase Bank, N.A. whereby the Fund may borrow for the temporary funding of shareholder redemptions or for other temporary or emergency purposes. Pursuant to a December 9, 2014 amendment, the credit facility agreement, which is a collective agreement between the Fund and certain other funds managed by the Investment Manager, severally and not jointly, permits collective borrowings up to $550 million. Interest is charged to each participating fund based on its borrowings at a rate equal to the higher of (i) the overnight federal funds rate plus 1.00% or (ii) the one-month LIBOR rate plus 1.00%. Each borrowing under the credit facility matures no later than 60 days after the date of borrowing. The Fund also pays a commitment fee equal to its pro rata share of the amount of the credit facility at a rate of 0.075% per annum. The commitment fee is included in other expenses in the Statement of Operations. Prior to the December 9, 2014 amendment, the credit facility agreement permitted borrowings up to $500 million under the same terms and interest rates as described above.
The Fund had no borrowings during the year ended July 31, 2015.
Note 9. Significant Risks
Credit Risk
Credit risk is the risk that the value of debt securities in the Fund's portfolio may decline because the issuer may
Annual Report 2015
30
COLUMBIA GLOBAL INFLATION-LINKED BOND PLUS FUND
NOTES TO FINANCIAL STATEMENTS (continued)
July 31, 2015
default and fail to pay interest or repay principal when due. Rating agencies assign credit ratings to debt securities to indicate their credit risk. Lower rated or unrated debt securities held by the Fund may present increased credit risk as compared to higher-rated debt securities.
Interest Rate Risk
Interest rate risk is the risk of losses attributable to changes in interest rates. In general, if prevailing interest rates rise, the values of debt securities tend to fall, and if interest rates fall, the values of debt securities tend to rise. Actions by governments and central banking authorities can result in increases in interest rates. Increasing interest rates may negatively affect the value of debt securities held by the Fund, resulting in a negative impact on the Fund's performance and net asset value per share. In general, the longer the maturity or duration of a debt security, the greater its sensitivity to changes in interest rates.
Liquidity Risk
Liquidity risk is the risk associated with a lack of marketability of investments which may make it difficult to sell the investment at a desirable time or price. Changing regulatory, market or other conditions or environments (for example, the interest rate or credit environments) may adversely affect the liquidity of the Fund's investments. The Fund may have to accept a lower selling price for the holding, sell other investments, or forego another, more appealing investment opportunity. Generally, the less liquid the market at the time the Fund sells a portfolio investment, the greater the risk of loss or decline of value to the Fund. A less liquid market can lead to an increase in Fund redemptions, which may negatively impact Fund performance and net asset value per share, including, for example, if the Fund is forced to sell securities in a down market.
High-Yield Securities Risk
Securities rated below investment grade (commonly called "high-yield" or "junk" bonds) and unrated securities of comparable quality expose the Fund to a greater risk of loss of principal and income than a fund that invests solely or primarily in investment grade securities. In addition, these investments have greater price fluctuations, are less liquid and are more likely to experience a default than higher-rated securities. High-yield securities are considered to be predominantly
speculative with respect to the issuer's capacity to pay interest and repay principal.
Foreign Securities and Emerging Market Countries Risk
Investing in foreign securities may include certain risks and considerations not typically associated with investing in U.S. securities, such as fluctuating currency values and changing local and regional economic, political and social conditions, which may result in greater market volatility. In addition, certain foreign securities may not be as liquid as U.S. securities. Investing in emerging markets may accentuate these risks. These countries are also more likely to experience high levels of inflation, deflation or currency devaluation which could hurt their economies and securities markets. To the extent that the Fund concentrates its investment exposure to any one or a few specific countries, the Fund will be particularly susceptible to the various conditions, events or other factors impacting those countries and may, therefore, have a greater risk than that of a fund which is more geographically diversified.
Inflation-Protected Securities Risk
Inflation-protected debt securities tend to react to changes in real interest rates (i.e., nominal interest rates minus the expected impact of inflation). In general, the price of such securities falls when real interest rates rise, and rises when real interest rates fall. Interest payments on these securities will vary and may be more volatile than interest paid on ordinary bonds. In periods of deflation, the Fund may have no income at all from such investments.
Non-Diversification Risk
A non-diversified fund is permitted to invest a greater percentage of its total assets in fewer issuers than a diversified fund. The Fund may, therefore, have a greater risk of loss from a few issuers than a similar fund that invests more broadly.
Note 10. Subsequent Events
Management has evaluated the events and transactions that have occurred through the date the financial statements were issued and noted no items requiring adjustment of the financial statements or additional disclosure.
Annual Report 2015
31
COLUMBIA GLOBAL INFLATION-LINKED BOND PLUS FUND
NOTES TO FINANCIAL STATEMENTS (continued)
July 31, 2015
Note 11. Information Regarding Pending and Settled Legal Proceedings
In December 2005, without admitting or denying the allegations, American Express Financial Corporation (AEFC, which is now known as Ameriprise Financial, Inc. (Ameriprise Financial)) entered into settlement agreements with the Securities and Exchange Commission (SEC) and Minnesota Department of Commerce (MDOC) related to market timing activities. As a result, AEFC was censured and ordered to cease and desist from committing or causing any violations of certain provisions of the Investment Advisers Act of 1940, the Investment Company Act of 1940, and various Minnesota laws. AEFC agreed to pay disgorgement of $10 million and civil money penalties of $7 million. AEFC also agreed to retain an independent distribution consultant to assist in developing a plan for distribution of all disgorgement and civil penalties ordered by the SEC in accordance with various undertakings detailed at http://www.sec.gov/litigation/admin/ia-2451.pdf. Ameriprise Financial and its affiliates have cooperated with the SEC and the MDOC in these legal proceedings, and have made regular reports to the Funds' Boards of Trustees.
Ameriprise Financial and certain of its affiliates have historically been involved in a number of legal, arbitration and regulatory proceedings, including routine litigation, class actions, and governmental actions, concerning matters arising in connection with the conduct of their business activities. Ameriprise Financial believes that the Funds are not currently the subject of, and that neither Ameriprise Financial nor any of its affiliates are the subject of, any pending legal, arbitration or regulatory proceedings that are likely to have a material adverse effect on the Funds or the ability of Ameriprise Financial or its affiliates to perform under their contracts with the Funds. Ameriprise Financial is required to make quarterly (10-Q), annual (10-K) and, as necessary, 8-K filings with the SEC on legal and regulatory matters that relate to Ameriprise Financial and its affiliates. Copies of these filings may be obtained by accessing the SEC website at www.sec.gov.
There can be no assurance that these matters, or the adverse publicity associated with them, will not result in increased fund redemptions, reduced sale of fund shares or other adverse consequences to the Funds. Further, although we believe proceedings are not likely to have a material adverse effect on the Funds or the ability of Ameriprise Financial or its affiliates to perform under their contracts with the Funds, these proceedings are subject to uncertainties and, as such, we are unable to estimate
the possible loss or range of loss that may result. An adverse outcome in one or more of these proceedings could result in adverse judgments, settlements, fines, penalties or other relief that could have a material adverse effect on the consolidated financial condition or results of operations of Ameriprise Financial.
Annual Report 2015
32
COLUMBIA GLOBAL INFLATION-LINKED BOND PLUS FUND
REPORT OF INDEPENDENT REGISTERED PUBLIC ACCOUNTING FIRM
To the Trustees of Columbia Funds Series Trust I and the Shareholders of
Columbia Global Inflation-Linked Bond Plus Fund
In our opinion, the accompanying statement of assets and liabilities, including the portfolio of investments, and the related statements of operations and of changes in net assets and the financial highlights present fairly, in all material respects, the financial position of Columbia Global Inflation-Linked Bond Plus Fund (the "Fund," a series of Columbia Funds Series Trust I) at July 31, 2015, and the results of its operations, the changes in its net assets and the financial highlights for each of the periods indicated, in conformity with accounting principles generally accepted in the United States of America. These financial statements and financial highlights (hereafter referred to as "financial statements") are the responsibility of the Fund's management. Our responsibility is to express an opinion on these financial statements based on our audits. We conducted our audits of these financial statements in accordance with the standards of the Public Company Accounting Oversight Board (United States). Those standards require that we plan and perform the audit to obtain reasonable assurance about whether the financial statements are free of material misstatement. An audit includes examining, on a test basis, evidence supporting the amounts and disclosures in the financial statements, assessing the accounting principles used and significant estimates made by management, and evaluating the overall financial statement presentation. We believe that our audits, which included confirmation of securities at July 31, 2015 by correspondence with the custodian, brokers and transfer agent, provide a reasonable basis for our opinion.
PricewaterhouseCoopers LLP
Minneapolis, MN
September 21, 2015
Annual Report 2015
33
COLUMBIA GLOBAL INFLATION-LINKED BOND PLUS FUND
The Trustees serve terms of indefinite duration. The names and birth years of the Trustees and Officers of the Funds in Columbia Funds Series Trust I, the year each was first elected or appointed to office, their principal business occupations during at least the last five years, the number of Funds overseen by each Trustee and other directorships they hold are shown below. Each officer listed below serves as an officer of each Fund in Columbia Funds Series Trust I. The mailing address of each Trustee is: c/o Columbia Management Investment Advisers, LLC, 225 Franklin Street, Mail Drop BX32 05228, Boston, MA 02110.
Independent Trustees
Name, Year of Birth
and Position Held
with the Trust | | Year First
Appointed or
Elected as
Trustee to any
Fund Currently
in the Columbia
Funds Complex
or a Predecessor
Thereof | | Principal Occupation(s)
during the Past Five Years | | Number
of Funds
in the
Columbia
Funds
Complex
Overseen | | Other Directorships
Held by Trustee During
the Past Five Years | |
Janet Langford Carrig
(Born 1957)
Trustee | | | 1996 | | | Senior Vice President, General Counsel and Corporate Secretary, ConocoPhillips (integrated energy company) since September 2007; Deputy General Counsel — Corporate Legal Services, ConocoPhillips from August 2006 to August 2007; Partner, Zelle, Hofmann, Voelbel, Mason & Gette LLP (law firm) from March 2005 to July 2006; Adjunct Professor of Law, Northwestern University from September 2004 to June 2006; Director, UAL Corporation (airline) from February 2006 to July 2006; Chief Administrative Officer and Senior Vice President, Kmart Holding Corporation (consumer goods) from September 2003 to March 2004 | | | 60 | | | None | |
Douglas A. Hacker
(Born 1955)
Trustee and Chairman
of the Board | | | 1996 | | | Independent business executive since May 2006; Executive Vice President — Strategy of United Airlines from December 2002 to May 2006; President of UAL Loyalty Services (airline marketing company) from September 2001 to December 2002; Executive Vice President and Chief Financial Officer of United Airlines from July 1999 to September 2001 | | | 60 | | | Spartan Nash Company, (food distributor); Nash Finch Company (food distributor) from 2005 to 2013; Aircastle Limited (aircraft leasing); SeaCube Container Leasing Ltd. (container leasing) from 2010 to 2013; and Travelport Worldwide Limited (travel information technology) | |
Nancy T. Lukitsh
(Born 1956)
Trustee | | | 2011 | | | Senior Vice President, Partner and Director of Marketing, Wellington Management Company, LLP (investment adviser) from 1997 to 2010; Chair, Wellington Management Investment Portfolios (commingled non-U.S. investment pools) from 2007 to 2010; Director, Wellington Trust Company, NA and other Wellington affiliates from 1997 to 2010 | | | 60 | | | None | |
William E. Mayer
(Born 1940)
Trustee | | | 1991 | | | Partner, Park Avenue Equity Partners (private equity) since February 1999 | | | 60 | | | DynaVox Inc. (speech creation); Lee Enterprises (print media); WR Hambrecht + Co. (financial service provider) from 2000 to 2012; BlackRock Kelso Capital Corporation (investment company); and Premier, Inc. (healthcare) | |
Annual Report 2015
34
COLUMBIA GLOBAL INFLATION-LINKED BOND PLUS FUND
TRUSTEES AND OFFICERS (continued)
Independent Trustees (continued)
Name, Year of Birth
and Position Held
with the Trust | | Year First
Appointed or
Elected as
Trustee to any
Fund Currently
in the Columbia
Funds Complex
or a Predecessor
Thereof | | Principal Occupation(s)
during the Past Five Years | | Number
of Funds
in the
Columbia
Funds
Complex
Overseen | | Other Directorships
Held by Trustee During
the Past Five Years | |
David M. Moffett
(Born 1952)
Trustee | | | 2011 | | | Retired. Consultant to Bridgewater and Associates; Chief Executive Officer, Federal Home Loan Mortgage Corporation, from 2008 to 2009; Senior Adviser, Global Financial Services Group, Carlyle Group, Inc., from 2007 to 2008; Vice Chairman and Chief Financial Officer, U.S. Bancorp, from 1993 to 2007 | | | 60 | | | Building Materials Holding Corp. (building materials and construction services); CIT Group Inc. (commercial and consumer finance); eBay Inc. (online trading community); E.W. Scripps Co. (print and television media); Genworth Financial, Inc. (financial and insurance products and services); MBIA Inc. (financial service provider); Paypal Holdings Inc. (payment and data processing services); and University of Oklahoma Foundation | |
Charles R. Nelson
(Born 1942)
Trustee | | | 1981 | | | Retired. Professor Emeritus, University of Washington since 2011; Professor of Economics, University of Washington from 1976 to 2011; Ford and Louisa Van Voorhis Professor of Political Economy, University of Washington from 1993 to 2011; Adjunct Professor of Statistics, University of Washington from 1980 to 2011; Associate Editor, Journal of Money, Credit and Banking from September 1993 to 2008; consultant on econometric and statistical matters | | | 60 | | | None | |
John J. Neuhauser
(Born 1943)
Trustee | | | 1984 | | | President, Saint Michael's College since August 2007; Director or Trustee of several non-profit organizations, including Fletcher Allen Health Care, Inc.; Academic Vice President and Dean of Faculties, Boston College from August 1999 to October 2005; University Professor, Boston College from November 2005 to August 2007 | | | 60 | | | Liberty All-Star Equity Fund and Liberty All-Star Growth Fund (closed-end funds) | |
Patrick J. Simpson
(Born 1944)
Trustee | | | 2000 | | | Partner, Perkins Coie LLP (law firm) | | | 60 | | | None | |
Anne-Lee Verville
(Born 1945)
Trustee | | | 1998 | | | Retired. General Manager, Global Education Industry from 1994 to 1997, President — Application Systems Division from 1991 to 1994, Chief Financial Officer — US Marketing & Services from 1988 to 1991, and Chief Information Officer from 1987 to 1988, IBM Corporation (computer and technology) | | | 60 | | | Enesco Group, Inc. (producer of giftware and home and garden decor products) from 2001 to 2006 | |
Annual Report 2015
35
COLUMBIA GLOBAL INFLATION-LINKED BOND PLUS FUND
TRUSTEES AND OFFICERS (continued)
Interested Trustee Affiliate with Investment Manager*
Name, Year of Birth
and Position Held
with the Trust | | Year First
Appointed or
Elected as
Trustee to any
Fund Currently
in the Columbia
Funds Complex
or a Predecessor
Thereof | | Principal Occupation(s)
during the Past Five Years | | Number
of Funds
in the
Columbia
Funds
Complex
Overseen | | Other Directorships
Held by Trustee During
the Past Five Years | |
William F. Truscott
(Born 1960)
Trustee | | | 2012 | | | Chairman of the Board and President, Columbia Management Investment Advisers, LLC since May 2010 and February 2012, respectively (previously President and Chief Investment Officer, 2001-April 2010); Chief Executive Officer, Global Asset Management, Ameriprise Financial, Inc. since September 2012 (previously Chief Executive Officer, U.S. Asset Management & President, Annuities, May 2010-September 2012 and President — U.S. Asset Management and Chief Investment Officer, 2005-April 2010); Director and Chief Executive Officer, Columbia Management Investment Distributors, Inc. since May 2010 and February 2012, respectively (previously Chairman of the Board and Chief Executive Officer, 2006-April 2010); Chairman of the Board and Chief Executive Officer, RiverSource Distributors, Inc. since 2006; Director, Threadneedle Asset Management Holdings, SARL since 2014; President and Chief Executive Officer, Ameriprise Certificate Company, 2006-August 2012 | | | 187 | | | Chairman of the Board, Columbia Management Investment Advisers, LLC since May 2010; Director, Columbia Management Investment Distributors, Inc. since May 2010; Director, Ameriprise Certificate Company, 2006 to January 2013 | |
* Interested person (as defined under the 1940 Act) by reason of being an officer, director, security holder and/or employee of the Investment Manager or Ameriprise Financial.
The Statement of Additional Information has additional information about the Fund's Board members and is available, without charge, upon request by calling 800.345.6611; contacting your financial intermediary; or visiting columbiathreadneedle.com/us.
The Board has appointed officers who are responsible for day-to-day business decisions based on policies it has established. The officers serve at the pleasure of the Board. In addition to Mr. Truscott, who is Senior Vice President, the Funds' other officers are:
Fund Officers
Name,
Address and
Year of Birth | | Position and Year
First Appointed to
Position for any Fund
in the Columbia
Funds Complex or a
Predecessor Thereof | | Principal Occupation(s) During Past Five Years | |
Christopher O. Petersen
5228 Ameriprise
Financial Center
Minneapolis, MN 55474
Born 1970 | | President and Principal Executive Officer (2015) | | Vice President and Lead Chief Counsel, Ameriprise Financial, Inc. since January 2015 (previously, Vice President and Chief Counsel January 2010-December 2014; and Vice President and Group Counsel or Counsel 2004- January 2010); officer of Columbia Funds and affiliated funds since 2007. | |
Michael G. Clarke
225 Franklin Street
Boston, MA 02110
Born 1969 | | Treasurer (2011) and Chief Financial Officer (2009) | | Vice President — Mutual Fund Administration, Columbia Management Investment Advisers, LLC, since May 2010; Managing Director of Fund Administration, Columbia Management Advisors, LLC, September 2004-April 2010; senior officer of Columbia Funds and affiliated funds since 2002. | |
Annual Report 2015
36
COLUMBIA GLOBAL INFLATION-LINKED BOND PLUS FUND
TRUSTEES AND OFFICERS (continued)
Fund Officers (continued)
Name,
Address and
Year of Birth | | Position and Year
First Appointed to
Position for any Fund
in the Columbia
Funds Complex or a
Predecessor Thereof | | Principal Occupation(s) During Past Five Years | |
Paul B. Goucher
100 Park Avenue
New York, NY 10017
Born 1968 | | Senior Vice President (2011), Chief Legal Officer (2015) and Assistant Secretary (2008) | | Vice President and Lead Chief Counsel, Ameriprise Financial, Inc. since November 2008 and January 2013, respectively (previously Chief Counsel, January 2010-January 2013 and Group Counsel, November 2008-January 2010). | |
Thomas P. McGuire
225 Franklin Street
Boston, MA 02110
Born 1972 | | Vice President and Chief Compliance Officer (2012) | | Vice President — Asset Management Compliance, Ameriprise Financial, Inc., since May 2010; Chief Compliance Officer, Ameriprise Certificate Company since September 2010; Compliance Executive, Bank of America, 2005-April 2010. | |
Colin Moore
225 Franklin Street
Boston, MA 02110
Born 1958 | | Senior Vice President (2010) | | Executive Vice President and Global Chief Investment Officer, Ameriprise Financial, Inc., since July 2013; Director and Global Chief Investment Officer, Columbia Management Investment Advisers, LLC since May 2010; Manager, Managing Director and Chief Investment Officer, Columbia Management Advisors, LLC, 2007-April 2010. | |
Michael E. DeFao
225 Franklin Street
Boston, MA 02110
Born 1968 | | Vice President (2011) and Assistant Secretary (2010) | | Vice President and Chief Counsel, Ameriprise Financial, Inc. since May 2010; Associate General Counsel, Bank of America, 2005-April 2010. | |
Joseph F. DiMaria
225 Franklin Street
Boston, MA 02110
Born 1968 | | Vice President (2011), Assistant Treasurer (2012) and Chief Accounting Officer (2008) | | Vice President — Mutual Fund Treasurer, Columbia Management Investment Advisers, LLC since May 2010; Director of Fund Administration, Columbia Management Advisors, LLC, 2006-April 2010. | |
Amy Johnson
5228 Ameriprise
Financial Center
Minneapolis, MN 55474
Born 1965 | | Vice President (2006) | | Managing Director and Chief Operating Officer, Columbia Management Investment Advisers, LLC since May 2010 (previously Chief Administrative Officer, 2009-April 2010, and Vice President — Asset Management and Trust Company Services, 2006-2009). | |
Lyn Kephart-Strong
5228 Ameriprise
Financial Center
Minneapolis, MN 55474
Born 1960 | | Vice President (2015) | | President, Columbia Management Investment Services Corp. since October 2014; Vice President & Resolution Officer, Ameriprise Trust Company since August 2009; President, RiverSource Service Corporation 2004-2010. | |
Ryan C. Larrenaga
225 Franklin Street
Boston, MA 02110
Born 1970 | | Vice President and Secretary (2015) | | Vice President and Group Counsel, Ameriprise Financial, Inc. since August 2011 (previously, Counsel from May 2010 to August 2011); Assistant General Counsel, Bank of America, 2005-April 2010; officer of Columbia Funds and affiliated funds since 2005. | |
Annual Report 2015
37
COLUMBIA GLOBAL INFLATION-LINKED BOND PLUS FUND
BOARD CONSIDERATION AND APPROVAL OF ADVISORY AGREEMENT AND SUBADVISORY AGREEMENT
On June 10, 2015, the Board of Trustees (the Board) and the Trustees who are not interested persons (as defined in the Investment Company Act of 1940) (the Independent Trustees) of Columbia Funds Series Trust I (the Trust) unanimously approved the continuation of the Investment Management Services Agreement (the Advisory Agreement) with Columbia Management Investment Advisers, LLC (the Investment Manager) and the Subadvisory Agreement (the Subadvisory Agreement) between the Investment Manager and Threadneedle International Limited (the Subadviser) with respect to Columbia Global Inflation-Linked Bond Plus Fund (the Fund), a series of the Trust. The Board and the Independent Trustees also unanimously approved an agreement (the Management Agreement) combining the Advisory Agreement and the Fund's existing administrative services agreement (the Administrative Services Agreement) in a single agreement. The Board and the Independent Trustees approved the restatement of the Advisory Agreement with the Management Agreement to be effective for the Fund on December 1, 2015, the Fund's next annual prospectus update. As detailed below, the Board's Advisory Fees and Expenses Committee (the Committee) and the Board met on multiple occasions to review and discuss, both among themselves and with the management team of the Investment Manager, materials provided by the Investment Manager and others before determining to approve the Management Agreement and the continuation of the Advisory Agreement and the Subadvisory Agreement (collectively, the Agreements).
In connection with their deliberations regarding the approval of the Management Agreement and the continuation of the Advisory Agreement and the Subadvisory Agreement, the Committee and the Board evaluated materials requested from the Investment Manager regarding the Fund and the Agreements, and discussed these materials with representatives of the Investment Manager at Committee meetings held on March 3, 2015, April 29, 2015 and June 9, 2015 and at Board meetings held on March 4, 2015 and June 10, 2015. In addition, the Board considers matters bearing on the Agreements at most of its other meetings throughout the year and meets regularly with senior management of the Trust and the Investment Manager. Through the Board's Investment Oversight Committees, Trustees also meet with selected portfolio managers of the funds the Trustees oversee and other investment personnel at various times throughout the year. The Committee and the Board also consulted with its independent fee consultant, Fund counsel and with the Independent Trustees' independent legal counsel, who advised on various matters with respect to the Committee's and the Board's considerations and otherwise assisted the Committee and the Board in their deliberations. On June 9, 2015, the Committee recommended that the Board approve the Management Agreement and the continuation of the Advisory Agreement and the Subadvisory Agreement. On June 10, 2015, the Board, including the Independent Trustees, voting separately, unanimously approved the Management Agreement and the continuation of the Advisory Agreement and the Subadvisory Agreement for the Fund.
The Committee and the Board considered all information that they, their legal counsel or the Investment Manager believed reasonably necessary to evaluate and to determine whether to approve the Management Agreement and the continuation of the Advisory Agreement and the Subadvisory Agreement. The information and factors considered by the Committee and the Board in recommending for approval or approving the Management Agreement and the continuation of the Advisory Agreement and the Subadvisory Agreement for the Fund included the following:
• Information on the investment performance of the Fund relative to the performance of a group of mutual funds determined to be comparable to the Fund by an independent third-party data provider, as well as performance relative to benchmarks;
• Information on the Fund's advisory fees and total expenses, including information comparing the Fund's expenses to those of a group of comparable mutual funds, as determined by the independent third-party data provider;
• The Investment Manager's agreement to contractually limit or cap total operating expenses for the Fund so that total operating expenses (excluding certain fees and expenses, such as portfolio transaction costs and certain other investment related expenses, interest, taxes, acquired fund fees and expenses, and extraordinary expenses) would not exceed a specified percentage of the Fund's average annual net assets from December 1, 2015 through November 30, 2016;
• The terms and conditions of the Agreements;
Annual Report 2015
38
COLUMBIA GLOBAL INFLATION-LINKED BOND PLUS FUND
BOARD CONSIDERATION AND APPROVAL OF ADVISORY AGREEMENT AND SUBADVISORY AGREEMENT (continued)
• The current and proposed terms and conditions of other agreements and arrangements with affiliates of the Investment Manager relating to the operations of the Fund, including the Administrative Services Agreement(1) and agreements with respect to the provision of distribution and transfer agency services to the Fund;
• Descriptions of various functions performed by the Investment Manager and the Subadviser under the Agreements, including portfolio management and portfolio trading practices;
• Information regarding the management fees and investment performance of similarly-managed portfolios of other clients of the Investment Manager, including institutional separate accounts;
• Information regarding the reputation, regulatory history and resources of the Investment Manager, including information regarding senior management, portfolio managers and other personnel;
• Information regarding the capabilities of the Investment Manager with respect to compliance monitoring services, including an assessment of the Investment Manager's and the Subadviser's compliance system by the Fund's Chief Compliance Officer; and
• The profitability to the Investment Manager and its affiliates from their relationships with the Fund.
Nature, Extent and Quality of Services Provided under the Agreements
The Committee and the Board considered the nature, extent and quality of services provided to the Fund by the Investment Manager, the Subadviser and the Investment Manager's affiliates under the Agreements and under separate agreements for the provision of transfer agency and administrative services, and the resources dedicated to the Fund and the other Columbia Funds by the Investment Manager, the Subadviser and the Investment Manager's affiliates. The Committee and the Board also determined that the nature and level of the services to be provided under the Management Agreement would not decrease relative to the services provided under the Advisory Agreement and the Administrative Services Agreement. The Committee and the Board considered, among other things, the Investment Manager's ability to attract, motivate and retain highly qualified research, advisory and supervisory investment professionals (including personnel and other resources, compensation programs for personnel involved in fund management, reputation and other attributes), the portfolio management services provided by those investment professionals, and the quality of the Investment Manager's investment research capabilities and trade execution services. The Committee and the Board also considered the potential benefits to shareholders of investing in a mutual fund that is part of a fund complex offering exposure to a variety of asset classes and investment disciplines and providing a variety of fund and shareholder services.
The Committee and the Board also considered the professional experience and qualifications of the senior personnel of the Investment Manager and the Subadviser, which included consideration of the Investment Manager's and the Subadviser's experience with similarly-structured funds. The Committee and the Board noted the compliance programs of and the compliance-related resources provided to the Fund by the Investment Manager and its affiliates, and considered the Investment Manager's ability to provide administrative services to the Fund and coordinate the activities of the Fund's other service providers. The Committee and the Board also noted that the Board had approved the Subadviser's code of ethics and compliance program, and that the Chief Compliance Officer of the Funds reports to the Trustees on the Subadviser's compliance program. In evaluating the nature, extent and quality of services provided under the Agreements, the Committee and the Board considered that these services were provided to the Fund, rather than directly to Fund shareholders. The Committee and the Board accordingly affirmed, after considering various other matters, including the potential benefits to the Fund and its shareholders of the Independent Trustees' important role as pre-suit gatekeepers with respect to claims that they may determine are meritless or contrary to the Fund's best interests, that it was not the intention of the Board or the Investment Manager that there be any third-party beneficiaries of the Agreements.
(1) Like the Advisory Agreement, the Administrative Services Agreement will terminate with respect to the Fund once the Management Agreement is effective for the Fund.
Annual Report 2015
39
COLUMBIA GLOBAL INFLATION-LINKED BOND PLUS FUND
BOARD CONSIDERATION AND APPROVAL OF ADVISORY AGREEMENT AND SUBADVISORY AGREEMENT (continued)
The Committee and the Board considered the diligence and selection process undertaken by the Investment Manager to select the Subadviser, including the Investment Manager's rationale for recommending the continuation of the Subadvisory Agreement, and the process for monitoring the Subadviser's ongoing performance of services for the Fund. As part of these deliberations, the Committee and the Board considered the ability of the Investment Manager, subject to the approval of the Board, to modify or enter into new subadvisory agreements without a shareholder vote pursuant to an exemptive order of the Securities and Exchange Commission. The Committee and the Board also considered the scope of services provided to the Fund by the Investment Manager that are distinct from and in addition to those provided by the Subadviser, including cash flow management, treasury services, risk oversight, investment oversight and Subadviser selection, oversight and transition management. After reviewing these and related factors, the Committee and the Board concluded, within the context of their overall conclusions, that the nature, extent and quality of the services provided to the Fund under the Agreements supported the approval of the Management Agreement and the continuation of the Advisory Agreement and the Subadvisory Agreement.
Investment Performance
The Committee and the Board reviewed information about the performance of the Fund over various time periods, including performance information relative to benchmarks and information based on reports of the independent third-party data provider that compared the performance of the Fund to the performance of a group of comparable mutual funds, and data provided by the independent fee consultant. The Committee and the Board also reviewed a description of the third party's methodology for identifying the Fund's peer groups for purposes of performance and expense comparisons.
The Committee and the Board noted that, through December 31, 2014, the Fund's performance was in the third percentile (where the best performance would be in the first percentile) of its category selected by the independent third-party data provider for the purposes of performance comparisons since inception.
The Committee and the Board also considered the Investment Manager's performance and reputation generally, the Investment Manager's historical responsiveness to Board concerns about performance, and the Investment Manager's willingness to take steps intended to improve performance. After reviewing these and related factors, the Committee and the Board concluded, within the context of their overall conclusions, that the performance of the Fund, the Investment Manager and the Subadviser were sufficient, in light of other considerations, to warrant the continuation of the Advisory Agreement and the Subadvisory Agreement and the approval of the Management Agreement.
Investment Advisory Fee Rates and Other Expenses
The Committee and the Board considered the advisory fees charged to the Fund under the Advisory Agreement and the Subadvisory Agreement, as well as the total expenses incurred by the Fund. In assessing the reasonableness of the fees under the Advisory Agreement, the Committee and the Board considered, among other information, the Fund's advisory fee and its total expense ratio as a percentage of average daily net assets. The Committee and the Board also considered that the proposed management fee would not exceed the sum of the fee rates payable under the Advisory Agreement and the Administrative Services Agreement. The Committee and the Board considered data provided by the independent fee consultant. The Committee and the Board noted that, as of December 31, 2014, the Fund's actual management fee and net expense ratio are ranked in the first and fifth quintiles, respectively, (where the lowest fees and expenses would be in the first quintile) against the Fund's expense universe as determined by the independent third-party data provider for purposes of expense comparison. The Committee and the Board also considered the fees that the Subadviser charges to its other clients, and noted that the Investment Manager pays the fees of the Subadviser. The Committee and the Board also took into account the fee waiver and expense limitation arrangements agreed to by the Investment Manager, as noted above.
The Committee and the Board also received and considered information about the advisory fees charged by the Investment Manager to institutional separate accounts. In considering the fees charged to those accounts, the
Annual Report 2015
40
COLUMBIA GLOBAL INFLATION-LINKED BOND PLUS FUND
BOARD CONSIDERATION AND APPROVAL OF ADVISORY AGREEMENT AND SUBADVISORY AGREEMENT (continued)
Committee and the Board took into account, among other things, the Investment Manager's representations about the differences between managing mutual funds as compared to other types of accounts, including differences in the services provided, differences in the risk profile of such business for the Investment Manager and the additional resources required to manage mutual funds effectively. The Committee and the Board received and considered information about the fees charged by the Investment Manager for sub-advisory services provided to comparable unaffiliated funds. In evaluating the Fund's advisory fees, the Committee and the Board also took into account the demands, complexity and quality of the investment management of the Fund.
After reviewing these and related factors, the Committee and the Board concluded, within the context of their overall conclusions, that the advisory/management fee rates and expenses of the Fund were sufficient, in light of other considerations, to warrant the approval of the Management Agreement and continuation of the Advisory Agreement and the Subadvisory Agreement.
Costs of Services Provided and Profitability
The Committee and the Board also took note of the costs the Investment Manager and its affiliates incur in connection with the services provided (both on an absolute and relative basis) and the profitability to the Investment Manager and its affiliates in connection with their relationships with the Fund.
The Committee and the Board also considered the compensation directly or indirectly received by the Investment Manager's affiliates in connection with their relationships with the Fund. The Committee and the Board reviewed information provided by management as to the profitability to the Investment Manager and its affiliates of their relationships with the Fund, information about the allocation of expenses used to calculate profitability, and comparisons of profitability levels realized in 2014 to profitability levels realized in 2013. When reviewing profitability, the Committee and the Board also considered court cases in which adviser profitability was an issue in whole or in part, the performance of similarly managed funds, the performance of the Fund, and the expense ratio of the Fund. The Committee and the Board also considered information provided by the Investment Manager regarding its financial condition and comparing its profitability to that of other asset management firms that are, or are subsidiaries of, publicly traded companies. Because the Subadvisory Agreement was negotiated at arms-length by the Investment Manager, which is responsible for payments to the Subadviser thereunder, the Committee and the Board did not consider the profitability to the Subadviser of its relationship with the Fund.
After reviewing these and related factors, the Committee and the Board concluded, within the context of their overall conclusions, that the costs of services provided and the profitability to the Investment Manager and its affiliates from their relationships with the Fund supported the approval of the Management Agreement and the continuation of the Advisory Agreement and the Subadvisory Agreement.
Economies of Scale
The Committee and the Board considered the potential existence of economies of scale in the provision by the Investment Manager of services to the Fund, to groups of related funds, and to the Investment Manager's investment advisory clients as a whole, and whether those economies of scale were shared with the Fund through breakpoints in investment advisory fees or other means, such as expense limitation arrangements and additional investments by the Investment Manager in investment, trading and compliance resources.
The Committee and the Board noted that the Subadvisory Agreement did not contain breakpoints. The Committee and the Board noted that absent a shareholder vote, the Investment Manager would bear any increase in fees payable under the Subadvisory Agreement. The Committee and the Board also noted the effect that capacity constraints on a subadviser's ability to manage assets could potentially have on the ability of the Investment Manager to achieve economies of scale, as new subadvisers may need to be added as the Fund grows, increasing the Investment Manager's cost of compensating and overseeing the Fund's subadvisers.
In considering these matters, the Committee and the Board also considered the costs of the services provided and the profitability to the Investment Manager and its affiliates from their relationships with the Fund, as discussed above. After reviewing these and related factors, the Committee and the Board concluded, within the context of their overall conclusions, that the extent to which any economies of scale were expected to be shared
Annual Report 2015
41
COLUMBIA GLOBAL INFLATION-LINKED BOND PLUS FUND
BOARD CONSIDERATION AND APPROVAL OF ADVISORY AGREEMENT AND SUBADVISORY AGREEMENT (continued)
with the Fund supported the approval of the Management Agreement and the continuation of the Advisory Agreement and the Subadvisory Agreement.
Other Benefits to the Investment Manager
The Committee and the Board received and considered information regarding "fall-out" or ancillary benefits received by the Investment Manager and its affiliates as a result of their relationships with the Fund, such as the engagement of the Investment Manager to provide administrative services to the Fund and the engagement of the Investment Manager's affiliates to provide distribution and transfer agency services to the Fund. In this regard, among other matters, the Committee and the Board considered that the Fund's distributor retains a portion of the distribution fees from the Fund. The Committee and the Board also considered the benefits of research made available to the Investment Manager by reason of brokerage commissions generated by the Fund's securities transactions, and reviewed information about the Investment Manager's practices with respect to allocating portfolio transactions for brokerage and research services. The Committee and the Board considered the possible conflicts of interest associated with certain fall-out or other ancillary benefits and the reporting, disclosure and other processes that are in place to address such possible conflicts of interest. The Committee and the Board recognized that the Investment Manager's profitability would be somewhat lower without these benefits.
Conclusion
The Committee and the Board reviewed all of the above considerations in reaching their decisions to recommend or approve the Management Agreement and the continuation of the Advisory Agreement and the Subadvisory Agreement. In their deliberations, the Trustees did not identify any particular information that was all-important or controlling, and individual Trustees may have attributed different weights to the various factors. Based on their evaluation of all factors that they deemed to be material, including those factors described above, and assisted by the advice of independent legal counsel, the Board, including the Independent Trustees, voting separately, unanimously approved the Management Agreement and the continuation of the Advisory Agreement and the Subadvisory Agreement.
Annual Report 2015
42
COLUMBIA GLOBAL INFLATION-LINKED BOND PLUS FUND
IMPORTANT INFORMATION ABOUT THIS REPORT
Each fund mails one shareholder report to each shareholder address. If you would like more than one report, please call shareholder services at 800.345.6611 and additional reports will be sent to you.
The policy of the Board is to vote the proxies of the companies in which each fund holds investments consistent with the procedures as stated in the Statement of Additional Information (SAI). You may obtain a copy of the SAI without charge by calling 800.345.6611; contacting your financial intermediary; visiting columbiathreadneedle.com/us; or searching the website of the Securities and Exchange Commission (SEC) at sec.gov. Information regarding how each fund voted proxies relating to portfolio securities is filed with the SEC by August 31st for the most recent 12-month period ending June 30th of that year, and is available without charge by visiting columbiathreadneedle.com/us, or searching the website of the SEC at sec.gov.
Each fund files a complete schedule of portfolio holdings with the SEC for the first and third quarters of each fiscal year on Form N-Q. Each fund's Form N-Q is available on the SEC's website at sec.gov and may be reviewed and copied at the SEC's Public Reference Room in Washington, D.C. Information on the operation of the Public Reference Room may be obtained by calling 800.SEC.0330. Each fund's complete schedule of portfolio holdings, as filed on Form N-Q, can also be obtained without charge, upon request, by calling 800.345.6611.
Annual Report 2015
43
Columbia Global Inflation-Linked Bond Plus Fund
P.O. Box 8081
Boston, MA 02266-8081

This information is for use with concurrent or prior delivery of a fund prospectus. Please read and consider the investment objectives, risks, charges and expenses for any fund carefully before investing. For a prospectus and summary prospectus, which contains this and other important information about the Fund, go to columbiathreadneedle.com/us. The Fund is distributed by Columbia Management Investment Distributors, Inc., member FINRA, and managed by Columbia Management Investment Advisers, LLC.
Columbia Threadneedle Investments (Columbia Threadneedle) is the global brand name of the Columbia and Threadneedle group of companies.
All rights reserved. Columbia Management Investment Distributors, Inc., 225 Franklin Street, Boston, MA 02110-2804
© 2015 Columbia Management Investment Advisers, LLC.
columbiathreadneedle.com/us
ANN250_07_E01_(09/15)
Item 2. Code of Ethics.
(a) The registrant has adopted a code of ethics that applies to the registrant’s principal executive officer, principal financial officer, principal accounting officer or controller, or persons performing similar functions, regardless of whether these individuals are employed by the registrant or a third party.
(b) During the period covered by this report, there were not any amendments to a provision of the code of ethics adopted in 2(a) above.
(c) During the period covered by this report, there were no waivers, including any implicit waivers, from a provision of the code of ethics described in 2(a) above that relates to one or more of the items set forth in paragraph (b) of this item’s instructions.
Item 3. Audit Committee Financial Expert.
The registrant’s Board of Trustees has determined that Douglas A. Hacker, David M. Moffett and Anne-Lee Verville, each of whom are members of the registrant’s Board of Trustees and Audit Committee, each qualify as an audit committee financial expert. Mr. Hacker, Mr. Moffett and Ms. Verville are each independent trustees, as defined in paragraph (a)(2) of this item’s instructions.
Item 4. Principal Accountant Fees and Services.
Fee information below is disclosed for the six series of the registrant whose reports to stockholders are included in this annual filing. Fiscal year 2015 includes fees for a fund that commenced operations on March 26, 2015.
(a) Audit Fees. Aggregate Audit Fees billed by the principal accountant for professional services rendered during the fiscal years ended July 31, 2015 and July 31, 2014 are approximately as follows:
2015 | | 2014 | |
$ | 145,100 | | $ | 121,400 | |
| | | | | |
Audit Fees include amounts related to the audit of the registrant’s annual financial statements or services that are normally provided by the accountant in connection with statutory and regulatory filings or engagements for those fiscal years.
(b) Audit-Related Fees. Aggregate Audit-Related Fees billed to the registrant by the principal accountant for professional services rendered during the fiscal years ended July 31, 2015 and July 31, 2014 are approximately as follows:
Audit-Related Fees include amounts for assurance and related services by the principal accountant that are reasonably related to the performance of the audit of the registrant’s financial statements and are not reported in Audit Fees above. In both fiscal years 2015 and 2014, Audit-Related Fees consist of agreed-upon procedures performed for semi-annual shareholder reports.
During the fiscal years ended July 31, 2015 and July 31, 2014, there were no Audit-Related Fees billed by the registrant’s principal accountant to the registrant’s investment adviser (not including any sub-adviser whose role is primarily portfolio management and is subcontracted with or overseen by another investment adviser) and any entity controlling, controlled by, or under common control with the adviser that provides ongoing services to the registrant for an engagement that related directly to the operations and financial reporting of the registrant.
(c) Tax Fees. Aggregate Tax Fees billed by the principal accountant to the registrant for professional services rendered during the fiscal years ended July 31, 2015 and July 31, 2014 are approximately as follows:
Tax Fees include amounts for the review of annual tax returns, the review of required shareholder distribution calculations and typically include amounts for professional services by the principal accountant for tax compliance, tax advice and tax planning.
During the fiscal years ended July 31, 2015 and July 31, 2014, there were no Tax Fees billed by the registrant’s principal accountant to the registrant’s investment adviser (not including any sub-adviser whose role is primarily portfolio management and is subcontracted with or overseen by another investment adviser) and any entity controlling, controlled by, or under common control with the adviser that provides ongoing services to the registrant for an engagement that related directly to the operations and financial reporting of the registrant.
(d) All Other Fees. Aggregate All Other Fees billed by the principal accountant to the registrant for professional services rendered during the fiscal years ended July 31, 2015 and July 31, 2014 are approximately as follows:
All Other Fees include amounts for products and services provided by the principal accountant, other than the services reported in paragraphs (a) through (c) above.
Aggregate All Other Fees billed by the registrant’s principal accountant to the registrant’s investment adviser (not including any sub-adviser whose role is primarily portfolio management and is subcontracted with or overseen by another investment adviser) and any entity controlling, controlled by, or under common control with the adviser that provides ongoing services to the registrant for an engagement that related directly to the operations and financial reporting of the registrant during the fiscal years ended July 31, 2015 and July 31, 2014 are approximately as follows:
2015 | | 2014 |
$ | 225,000 | | $ | 325,000 |
| | | | |
In fiscal years 2015 and 2014, All Other Fees primarily consists of fees billed for internal control examinations of the registrant’s transfer agent and investment adviser.
(e)(1) Audit Committee Pre-Approval Policies and Procedures
The registrant’s Audit Committee is required to pre-approve the engagement of the registrant’s independent auditors to provide audit and non-audit services to the registrant and non-audit services to its investment adviser (excluding any sub-adviser whose role is primarily portfolio management and is sub-contracted or overseen by another investment adviser (the “Adviser”) or any entity controlling, controlled by or under common control with the Adviser that provides ongoing services to the Fund (a “Control Affiliate”) if the engagement relates directly to the operations and financial reporting of the registrant.
The Audit Committee has adopted a Policy for Engagement of Independent Auditors for Audit and Non-Audit Services (the “Policy”). The Policy sets forth the understanding of the Audit Committee regarding the engagement of the registrant’s independent accountants to provide (i) audit and permissible audit-related, tax and other services to the registrant (“Fund Services”); (ii) non-audit services to the registrant’s Adviser and any Control Affiliates, that relates directly to the operations and financial reporting of a Fund (“Fund-related Adviser Services”); and (iii) certain other audit and non-audit services to the registrant’s Adviser and its Control Affiliates. A service will require specific pre-approval by the Audit Committee if it is to be provided by the Fund’s independent auditor; provided, however, that pre-approval of non-audit services to the Fund, the Adviser or Control Affiliates may be waived if certain de minimis requirements set forth in the SEC’s rules are met.
Under the Policy, the Audit Committee may delegate pre-approval authority to any pre-designated member or members who are independent board members. The member(s) to whom such authority is delegated must report, for informational purposes only, any pre-approval decisions to the Audit Committee at its next regular meeting. The Audit Committee’s responsibilities with respect to the pre-approval of services performed by the independent auditor may not be delegated to management.
On an annual basis, at a regularly scheduled Audit Committee meeting, the Fund’s Treasurer or other Fund officer shall submit to the Audit Committee a schedule of the types of Fund Services and Fund-related Adviser Services that are subject to specific pre-
approval. This schedule will provide a description of each type of service that is subject to specific pre-approval, along with total projected fees for each service. The pre-approval will generally cover a one-year period. The Audit Committee will review and approve the types of services and the projected fees for the next one-year period and may add to, or subtract from, the list of pre-approved services from time to time, based on subsequent determinations. This specific approval acknowledges that the Audit Committee is in agreement with the specific types of services that the independent auditor will be permitted to perform and the projected fees for each service.
The Fund’s Treasurer or other Fund officer shall report to the Audit Committee at each of its regular meetings regarding all Fund Services or Fund-related Adviser Services provided since the last such report was rendered, including a description of the services, by category, with forecasted fees for the annual reporting period, proposed changes requiring specific pre-approval and a description of services provided by the independent auditor, by category, with actual fees during the current reporting period.
*****
(e)(2) 100% of the services performed for items (b) through (d) above during 2015 and 2014 were pre-approved by the registrant’s Audit Committee.
(f) Not applicable.
(g) The aggregate non-audit fees billed by the registrant’s accountant for services rendered to the registrant, and rendered to the registrant’s investment adviser (not including any sub-adviser whose role is primarily portfolio management and is subcontracted with or overseen by another investment adviser), and any entity controlling, controlled by, or under common control with the adviser that provides ongoing services to the registrant during the fiscal years ended July 31, 2015 and July 31, 2014 are approximately as follows:
2015 | | 2014 |
$ | 251,400 | | $ | 340,900 |
| | | | |
(h) The registrant’s Audit Committee of the Board of Directors has considered whether the provision of non-audit services that were rendered to the registrant’s adviser (not including any sub-adviser whose role is primarily portfolio management and is subcontracted with or overseen by another investment adviser), and any entity controlling, controlled by, or under common control with the investment adviser that provides ongoing services to the registrant that were not pre-approved pursuant to paragraph (c)(7)(ii) of Rule 2-01 of Regulation S-X, is compatible with maintaining the principal accountant’s independence.
Item 5. Audit Committee of Listed Registrants.
Not applicable.
Item 6. Investments
(a) The registrant’s “Schedule I — Investments in securities of unaffiliated issuers” (as set forth in 17 CFR 210.12-12) is included in Item 1 of this Form N-CSR.
(b) Not applicable.
Item 7. Disclosure of Proxy Voting Policies and Procedures for Closed-End Management Investment Companies.
Not applicable.
Item 8. Portfolio Managers of Closed-End Management Investment Companies.
Not applicable.
Item 9. Purchases of Equity Securities by Closed-End Management Investment Company and Affiliated Purchasers.
Not applicable.
Item 10. Submission of Matters to a Vote of Security Holders.
There were no material changes to the procedures by which shareholders may recommend nominees to the registrant’s board of directors.
Item 11. Controls and Procedures.
(a) The registrant’s principal executive officer and principal financial officers, based on their evaluation of the registrant’s disclosure controls and procedures as of a date within 90 days of the filing of this report, have concluded that such controls and procedures are adequately designed to ensure that material information required to be disclosed by the registrant in Form N-CSR is accumulated and communicated to the registrant’s management, including the principal executive officer and principal financial officer, or persons performing similar functions, as appropriate to allow timely decisions regarding required disclosure.
(b) There was no change in the registrant’s internal control over financial reporting that occurred during the registrant’s second fiscal quarter of the period covered by this report that has materially affected, or is reasonably likely to materially affect, the registrant’s internal control over financial reporting.
Item 12. Exhibits.
(a)(1) Code of ethics required to be disclosed under Item 2 of Form N-CSR attached hereto as Exhibit 99.CODE ETH.
(a)(2) Certifications pursuant to Rule 30a-2(a) under the Investment Company Act of 1940 (17 CFR 270.30a-2(a)) attached hereto as Exhibit 99.CERT.
(a)(3) Not applicable.
(b) Certification pursuant to Rule 30a-2(b) under the Investment Company Act of 1940 (17 CFR 270.30a-2(b)) attached hereto as Exhibit 99.906CERT.
SIGNATURES
Pursuant to the requirements of the Securities Exchange Act of 1934 and the Investment Company Act of 1940, the registrant has duly caused this report to be signed on its behalf by the undersigned, thereunto duly authorized.
(registrant) | | | Columbia Funds Series Trust I |
|
|
By (Signature and Title) | | | /s/ Christopher O. Petersen |
| Christopher O. Petersen, President and Principal Executive Officer |
|
|
Date | | | | September 21, 2015 |
| | | | | | | | | | |
Pursuant to the requirements of the Securities Exchange Act of 1934 and the Investment Company Act of 1940, this report has been signed below by the following persons on behalf of the registrant and in the capacities and on the dates indicated.
By (Signature and Title) | | | /s/ Christopher O. Petersen |
| Christopher O. Petersen, President and Principal Executive Officer |
|
|
Date | | | | September 21, 2015 |
|
|
By (Signature and Title) | | | /s/ Michael G. Clarke |
| | Michael G. Clarke, Treasurer and Chief Financial Officer |
|
|
Date | | | | September 21, 2015 |
| | | | | |