UNITED STATES
SECURITIES AND EXCHANGE COMMISSION
Washington, D.C. 20549
FORM N-CSR
CERTIFIED SHAREHOLDER REPORT OF REGISTERED
MANAGEMENT INVESTMENT COMPANIES
Investment Company Act file number | 811-04367 |
|
Columbia Funds Series Trust I |
(Exact name of registrant as specified in charter) |
|
225 Franklin Street, Boston, MA | | 02110 |
(Address of principal executive offices) | | (Zip code) |
|
Ryan Larrenaga c/o Columbia Management Investment Advisers, LLC 225 Franklin Street Boston, MA 02110 |
(Name and address of agent for service) |
|
Registrant’s telephone number, including area code: | (800) 345-6611 | |
|
Date of fiscal year end: | May 31 | |
|
Date of reporting period: | May 31, 2015 | |
| | | | | | | | |
Form N-CSR is to be used by management investment companies to file reports with the Commission not later than 10 days after the transmission to stockholders of any report that is required to be transmitted to stockholders under Rule 30e-1 under the Investment Company Act of 1940 (17 CFR 270.30e-1). The Commission may use the information provided on Form N-CSR in its regulatory, disclosure review, inspection, and policymaking roles.
A registrant is required to disclose the information specified by Form N-CSR, and the Commission will make this information public. A registrant is not required to respond to the collection of information contained in Form N-CSR unless the Form displays a currently valid Office of Management and Budget ("OMB") control number. Please direct comments concerning the accuracy of the information collection burden estimate and any suggestions for reducing the burden to Secretary, Securities and Exchange Commission, 450 Fifth Street, NW, Washington, DC 20549-0609. The OMB has reviewed this collection of information under the clearance requirements of 44 U.S.C. § 3507.
Item 1. Reports to Stockholders.

ANNUAL REPORT
May 31, 2015

COLUMBIA ADAPTIVE ALTERNATIVES FUND


ABOUT COLUMBIA THREADNEEDLE INVESTMENTS
Columbia Threadneedle Investments is a leading global asset management group that provides a broad range of actively managed investment strategies and solutions for individual, institutional and corporate clients around the world.
With more than 2,000 people, including over 450 investment professionals based in North America, Europe and Asia, we manage $506 billion* of assets across developed and emerging market equities, fixed income, asset allocation solutions and alternatives. We are the 12th largest manager of long-term mutual fund assets in the U.S.** and the 5th largest manager of retail funds in the U.K.***
Our priority is the investment success of our clients. We aim to deliver the investment outcomes they expect through an investment approach that is team-based, performance-driven and risk-aware. Our culture is dynamic and interactive. By sharing our insights across asset classes and geographies, we generate richer perspectives on global, regional and local investment landscapes. The ability to exchange and debate investment ideas in a collaborative environment enriches our teams' investment processes. More importantly, it results in better informed investment decisions for our clients.
Columbia funds are distributed by Columbia Management Investment Distributors, Inc., member FINRA, and managed by Columbia Management Investment Advisers, LLC.
Columbia Threadneedle Investments (Columbia Threadneedle) is the global brand name of the Columbia and Threadneedle group of companies.
* In U.S. dollars as of March 31, 2015. Source: Ameriprise Q1 Earnings Release. Includes all assets managed by entities in the Columbia and Threadneedle groups of companies. Contact us for more current data.
** Source: ICI as of March 31, 2015 for Columbia Management Investment Advisers, LLC.
*** Source: Investment Association as of March 2015 for Threadneedle Asset Management Limited.
© 2015 Columbia Management Investment Advisers, LLC. All rights reserved.
Not part of the shareholder report
 Dear Shareholder,
In a world that is changing faster than ever before, investors want asset managers who offer a global perspective while generating strong and sustainable returns. To that end, Columbia Management, in conjunction with its U.K.-based affiliate, Threadneedle Investments, has rebranded to Columbia Threadneedle Investments. The new global brand represents the combined capabilities, resources and reach of the global group, offering investors access to the best of both firms.
With a presence in 18 countries and more than 450 investment professionals*, our collective perspective and world view as Columbia Threadneedle Investments gives us deeper insight into what might affect the real-life financial outcomes clients are seeking. Putting our views into a global context enables us to build richer perspectives and create the right solutions, and provides us with enhanced capabilities to deliver consistent investment performance, which may ultimately lead to better investor outcomes.
As a result of the rebrand, you will begin to see our new logo and colors reflected in printed materials, such as this shareholder report, as well as on our new website — columbiathreadneedle.com/us. We encourage you to visit us online and view a new video on the "About Us" tab that speaks to the strength of the firm.
While we are introducing a new brand, in many ways, the investment company you know well has not changed. The following remain in effect:
n Fund and strategy names
n Established investment teams, philosophies and processes
n Account services, features, servicing phone numbers and mailing addresses
n Columbia Management Investment Distributors as distributor and Columbia Management Investment Advisers as investment adviser
We recognize that the money we manage represents the hard work and savings of people like you, and that everyone has different ambitions and different definitions of success. Investors have varying goals — funding their children's education, enjoying their retirement, putting money aside for unexpected events, and more. Whatever your ambitions, we believe our wide range of investment products and solutions can help give you confidence that you will reach your goals.
The world is constantly changing, but our priority remains the same: to help you secure your finances, meet your goals and achieve success. Thank you for your continued investment with us. Our service representatives are available at 800.345.6611 to help with any questions.
Sincerely,

Christopher O. Petersen
President, Columbia Funds
Investors should consider the investment objectives, risks, charges and expenses of a mutual fund carefully before investing. For a free prospectus and summary prospectus, which contains this and other important information about a fund, visit columbiathreadneedle.com/us. The prospectus should be read carefully before investing.
* Source: Ameriprise as of December 1, 2014
Columbia Funds are distributed by Columbia Management Investment Distributors, Inc., member FINRA, and managed by Columbia Management Investment Advisers, LLC.
© 2015 Columbia Management Investment Advisers, LLC. All rights reserved.
COLUMBIA ADAPTIVE ALTERNATIVES FUND
Fund Investment Manager
Columbia Management Investment
Advisers, LLC
225 Franklin Street
Boston, MA 02110
Fund Distributor
Columbia Management Investment
Distributors, Inc.
225 Franklin Street
Boston, MA 02110
Fund Transfer Agent
Columbia Management Investment
Services Corp.
P.O. Box 8081
Boston, MA 02266-8081
For more information about any of the funds, please visit columbiathreadneedle.com/us or call 800.345.6611. Customer Service Representatives are available to answer your questions Monday through Friday from 8 a.m. to 7 p.m. Eastern time.
The views expressed in this report reflect the current views of the respective parties. These views are not guarantees of future performance and involve certain risks, uncertainties and assumptions that are difficult to predict, so actual outcomes and results may differ significantly from the views expressed. These views are subject to change at any time based upon economic, market or other conditions and the respective parties disclaim any responsibility to update such views. These views may not be relied on as investment advice and, because investment decisions for a Columbia fund are based on numerous factors, may not be relied on as an indication of trading intent on behalf of any particular Columbia fund. References to specific securities should not be construed as a recommendation or investment advice.
Portfolio Overview | | | 3 | | |
Understanding Your Fund's Expenses | | | 4 | | |
Consolidated Portfolio of Investments | | | 5 | | |
Consolidated Statement of Assets and Liabilities | | | 11 | | |
Consolidated Statement of Operations | | | 13 | | |
Consolidated Statement of Changes in Net Assets | | | 14 | | |
Consolidated Financial Highlights | | | 16 | | |
Notes to Consolidated Financial Statements | | | 25 | | |
Report of Independent Registered
Public Accounting Firm | | | 36 | | |
Trustees and Officers | | | 37 | | |
Board Consideration and Approval of Advisory Agreement and Subadvisory Agreement | | | 41 | | |
Important Information About This Report | | | 45 | | |
COLUMBIA CONTRARIAN CORE FUND
COLUMBIA ADAPTIVE ALTERNATIVES FUND
PORTFOLIO OVERVIEW
(Unaudited)
Market Exposure By Strategies (%)(a)
(at May 31, 2015) | |
Alternative Beta Strategies | | | 143.1 | | |
Hedge Fund Strategies | | | 51.4 | | |
Non-Traditional Asset Classes | | | 19.8 | | |
(a) Percentages are based upon net assets. The percentages do not equal 100% due to the effects of leverage within the Fund's portfolio. Leverage exists when the Fund purchases or sells an instrument or enters into a transaction without investing cash in an amount equal to the full economic exposure of the instrument or transaction. The Fund's portfolio composition and its market exposure are subject to change. At period end, Hedge Fund Strategies included indirect investment exposure to the Blackstone Alternative Multi-Strategy Fund (an unaffiliated mutual fund); Alternative Beta Strategies included investment in futures and total return swap contracts; and Non-Traditional Asset Classes included investment in affiliated and/or unaffiliated funds, including exchange-traded funds (ETFs).
Portfolio Breakdown (%)
(at May 31, 2015) | |
Alternative Investment Funds | | | 55.2 | | |
Equity Funds | | | 3.0 | | |
Exchange-Traded Funds | | | 7.9 | | |
Exchange-Traded Notes | | | 3.0 | | |
Fixed-Income Funds | | | 3.1 | | |
Money Market Funds | | | 27.8 | | |
Total | | | 100.0 | | |
Percentages indicated are based upon total investments. The Fund's portfolio composition is subject to change.
Portfolio Management
Jeffrey Knight, CFA
William Landes, Ph.D.
Marc Khalamayzer, CFA
Annual Report 2015
3
COLUMBIA ADAPTIVE ALTERNATIVES FUND
UNDERSTANDING YOUR FUND'S EXPENSES
(Unaudited)
As an investor, you incur two types of costs. There are transaction costs, which generally include sales charges on purchases and may include redemption fees. There are also ongoing costs, which generally include management fees, distribution and/or service fees, and other fund expenses. The following information is intended to help you understand your ongoing costs (in dollars) of investing in the Fund and to help you compare these costs with the ongoing costs of investing in other mutual funds.
Analyzing Your Fund's Expenses
To illustrate these ongoing costs, we have provided examples and calculated the expenses paid by investors in each share class of the Fund during the period. The actual and hypothetical information in the table is based on an initial investment of $1,000 at the beginning of the period indicated and held for the entire period. Expense information is calculated two ways and each method provides you with different information. The amount listed in the "Actual" column is calculated using the Fund's actual operating expenses and total return for the period. You may use the Actual information, together with the amount invested, to estimate the expenses that you paid over the period. Simply divide your account value by $1,000 (for example, an $8,600 account value divided by $1,000 = 8.6), then multiply the results by the expenses paid during the period under the "Actual" column. The amount listed in the "Hypothetical" column assumes a 5% annual rate of return before expenses (which is not the Fund's actual return) and then applies the Fund's actual expense ratio for the period to the hypothetical return. You should not use the hypothetical account values and expenses to estimate either your actual account balance at the end of the period or the expenses you paid during the period. See "Compare With Other Funds" below for details on how to use the hypothetical data.
Compare With Other Funds
Since all mutual funds are required to include the same hypothetical calculations about expenses in shareholder reports, you can use this information to compare the ongoing cost of investing in the Fund with other funds. To do so, compare the hypothetical example with the 5% hypothetical examples that appear in the shareholder reports of other funds. As you compare hypothetical examples of other funds, it is important to note that hypothetical examples are meant to highlight the ongoing costs of investing in a fund only and do not reflect any transaction costs, such as sales charges, or redemption or exchange fees. Therefore, the hypothetical calculations are useful in comparing ongoing costs only, and will not help you determine the relative total costs of owning different funds. If transaction costs were included in these calculations, your costs would be higher.
December 1, 2014 – May 31, 2015
| | | Account Value at the Beginning
of the Period ($) | | Account Value at the End of the
Period ($) | | Expenses Paid During the
Period ($) | | Fund's Annualized
Expense Ratio (%) | |
| | | Actual | | Hypothetical | | Actual | | Hypothetical | | Actual | | Hypothetical | | Actual | |
Class A | | | 1,000.00 | | | | 1,000.00 | | | | 985.00 | (a) | | | 1,017.45 | | | | 4.98 | (a) | | | 7.54 | | | | 1.50 | (a) | |
Class C | | | 1,000.00 | | | | 1,000.00 | | | | 983.00 | (a) | | | 1,013.71 | | | | 7.46 | (a) | | | 11.30 | | | | 2.25 | (a) | |
Class I | | | 1,000.00 | | | | 1,000.00 | | | | 986.00 | (a) | | | 1,019.40 | | | | 3.68 | (a) | | | 5.59 | | | | 1.11 | (a) | |
Class R | | | 1,000.00 | | | | 1,000.00 | | | | 984.00 | (a) | | | 1,016.31 | | | | 5.74 | (a) | | | 8.70 | | | | 1.73 | (a) | |
Class R4 | | | 1,000.00 | | | | 1,000.00 | | | | 986.00 | (a) | | | 1,018.80 | | | | 4.08 | (a) | | | 6.19 | | | | 1.23 | (a) | |
Class R5 | | | 1,000.00 | | | | 1,000.00 | | | | 986.00 | (a) | | | 1,019.10 | | | | 3.88 | (a) | | | 5.89 | | | | 1.17 | (a) | |
Class W | | | 1,000.00 | | | | 1,000.00 | | | | 984.00 | (a) | | | 1,017.55 | | | | 4.91 | (a) | | | 7.44 | | | | 1.48 | (a) | |
Class Y | | | 1,000.00 | | | | 1,000.00 | | | | 986.00 | (a) | | | 1,019.35 | | | | 3.72 | (a) | | | 5.64 | | | | 1.12 | (a) | |
Class Z | | | 1,000.00 | | | | 1,000.00 | | | | 986.00 | (a) | | | 1,018.80 | | | | 4.08 | (a) | | | 6.19 | | | | 1.23 | (a) | |
(a) Based on operations from January 28, 2015 (commencement of operations) through the stated period end.
Expenses paid during the period are equal to the annualized expense ratio for each class as indicated above, multiplied by the average account value over the period and then multiplied by the number of days in the Fund's most recent fiscal half year and divided by 365.
Expenses do not include fees and expenses incurred indirectly by the Fund from its investment in underlying funds, including affiliated and non-affiliated pooled investment vehicles, such as mutual funds and exchange-traded funds.
Had Columbia Management Investment Advisers, LLC and/or certain of its affiliates not waived/reimbursed certain fees and expenses, account value at the end of the period would have been reduced.
Annual Report 2015
4
COLUMBIA ADAPTIVE ALTERNATIVES FUND
CONSOLIDATED PORTFOLIO OF INVESTMENTS
May 31, 2015
(Percentages represent value of investments compared to net assets)
Equity Funds 2.9%
| | | Shares | | Value ($) | |
REAL ESTATE 2.9% | |
Columbia Real Estate Equity Fund,
Class I Shares(a) | | | 332,167 | | | | 5,198,411 | | |
Total Equity Funds
(Cost: $5,643,007) | | | | | 5,198,411 | | |
Fixed-Income Funds 3.1%
INFLATION PROTECTED SECURITIES 3.1% | |
Columbia Inflation Protected
Securities Fund, Class I Shares(a) | | | 599,186 | | | | 5,416,640 | | |
Total Fixed-Income Funds
(Cost: $5,512,793) | | | | | 5,416,640 | | |
Alternative Investment Funds 54.5%
Blackstone Alternative Multi-Strategy
Fund, Class Y Shares(a)(b)(c) | | | 8,748,728 | | | | 90,811,797 | | |
Columbia Commodity Strategy Fund,
Class I Shares(a)(b) | | | 831,859 | | | | 5,340,538 | | |
Total Alternative Investment Funds
(Cost: $93,265,176) | | | | | 96,152,335 | | |
Exchange-Traded Funds 7.8%
| | | Shares | | Value ($) | |
PowerShares Global Listed Private
Equity Portfolio | | | 406,126 | | | | 4,975,044 | | |
iShares TIPS Bond ETF | | | 48,184 | | | | 5,455,392 | | |
iShares US Real Estate ETF | | | 43,975 | | | | 3,308,239 | | |
Total Exchange-Traded Funds
(Cost: $13,870,105) | | | | | 13,738,675 | | |
Exchange-Traded Notes 3.0%
Issuer | | Shares | | Value ($) | |
CONSUMER DISCRETIONARY 3.0% | |
iPath Bloomberg Commodity Index
Total Return ETN(b) | | | 185,995 | | | | 5,313,877 | | |
Total Consumer Discretionary | | | | | 5,313,877 | | |
Total Exchange-Traded Notes
(Cost: $5,387,596) | | | | | 5,313,877 | | |
Money Market Funds 27.4%
Columbia Short-Term Cash Fund,
0.114%(a)(d) | | | 48,352,793 | | | | 48,352,793 | | |
Total Money Market Funds
(Cost: $48,352,793) | | | | | 48,352,793 | | |
Total Investments
(Cost: $172,031,470) | | | | | 174,172,731 | | |
Other Assets & Liabilities, Net | | | | | 2,342,963 | | |
Net Assets | | | | | 176,515,694 | | |
At May 31, 2015, cash totaling $938,000 was pledged as collateral.
Investments in Derivatives
Futures Contracts Outstanding at May 31, 2015
Short Futures Contracts Outstanding
Contract Description | | Number of
Contracts | | Trading
Currency | | Notional
Market
Value ($) | | Expiration
Date | | Unrealized
Appreciation ($) | | Unrealized
Depreciation ($) | |
S&P500 EMINI | | | (40 | ) | | USD | | | | | (4,212,000 | ) | | 06/2015 | | | — | | | | (116,613 | ) | |
The accompanying Notes to Consolidated Financial Statements are an integral part of this statement.
Annual Report 2015
5
COLUMBIA ADAPTIVE ALTERNATIVES FUND
CONSOLIDATED PORTFOLIO OF INVESTMENTS (continued)
May 31, 2015
Total Return Swap Contracts Outstanding at May 31, 2015
Counterparty | | Fund Receives | | Fund Pays | | Expiration
Date | | Notional
Currency | | Notional
Amount ($) | | Unamortized
Premium
(Paid)
Received ($) | | Unrealized
Appreciation ($) | | Unrealized
Depreciation ($) | |
Barclays
| | Total return on Atlantic High
Yield Investment Grade
Spread (HYIGS) BetaBarclays
Credit Index(a) | | Fixed rate of
0.60%
| | 1/29/16
| | USD |
| | | | 251,861
| | | | 254
| | | | 360
| | | | —
| | |
Barclays
| | Total return on Atlantic HYIGS
BetaBarclays Credit Index(a) | | Fixed rate of
0.60% | | 1/30/16
| | USD |
| | | | 4,147,100
| | | | 4,268
| | | | 5,845
| | | | —
| | |
Barclays
| | Total return on Atlantic HYIGS
BetaBarclays Credit Index(a) | | Fixed rate of
0.60% | | 1/30/16
| | USD |
| | | | 6,051,308
| | | | 6,987
| | | | 7,770
| | | | —
| | |
Barclays
| | Total return on Atlantic HYIGS
BetaBarclays Credit Index(a) | | Fixed rate of
0.60% | | 1/30/16
| | USD |
| | | | 6,800,074
| | | | 9,325
| | | | 13,222
| | | | —
| | |
Barclays
| | Total return on Atlantic HYIGS
BetaBarclays Credit Index(a) | | Fixed rate of
0.60% | | 1/30/16
| | USD |
| | | | 5,550,015
| | | | 8,325
| | | | —
| | | | (8,325
| ) | |
Barclays
| | Total return on Barclays
TrendStar+ Alt Roll 2 Index(b) | | Fixed rate of
0.70% | | 1/30/16
| | USD |
| | | | 8,822,414
| | | | —
| | | | —
| | | | (40,021
| ) | |
Deutsche Bank
| | Total return on Deutsche
Bank (DB) Equity Risk-Adjusted
Momentum Factor Index — USD
Excess Return(c) | | Fixed rate of
0.00%
| | 1/29/16
| | USD |
| | | | 461,900
| | | | —
| | | | 9,329
| | | | —
| | |
Deutsche Bank
| | Total return on DB Equity
Sector Neutral Quality Factor
Index — USD Excess Return(d) | | Fixed rate of
0.00%
| | 1/29/16
| | USD |
| | | | 1,314,745
| | | | —
| | | | —
| | | | (34,726
| ) | |
Deutsche Bank
| | Total return on DB Equity Low
Beta Turnover Control Factor
Index — USD Excess Return(d) | | Fixed rate of
0.00%
| | 1/29/16
| | USD |
| | | | 470,377
| | | | —
| | | | 6,216
| | | | —
| | |
Deutsche Bank
| | Total return on DB Equity Risk-
Adjusted Momentum Factor
Index — USD Excess Return(c) | | Fixed rate of
0.00%
| | 1/30/16
| | USD |
| | | | 1,563,027
| | | | —
| | | | 31,570
| | | | —
| | |
Deutsche Bank
| | Total return on DB Equity Risk-
Adjusted Momentum Factor
Index — USD Excess Return(c) | | Fixed rate of
0.00%
| | 1/30/16
| | USD |
| | | | 6,807,935
| | | | —
| | | | 137,505
| | | | —
| | |
Deutsche Bank
| | Total return on DB Equity Risk-
Adjusted Momentum Factor
Index — USD Excess Return(c) | | Fixed rate of
0.00%
| | 1/30/16
| | USD |
| | | | 1,502,026
| | | | —
| | | | 30,338
| | | | —
| | |
Deutsche Bank
| | Total return on DB Equity
Sector Neutral Value Factor
Index — USD Excess Return(c) | | Fixed rate of
0.00%
| | 1/30/16
| | USD |
| | | | 8,520,572
| | | | —
| | | | —
| | | | (225,049
| ) | |
Deutsche Bank
| | Total return on DB Equity
Sector Neutral Quality Factor
Index — USD Excess Return(c) | | Fixed rate of
0.00%
| | 1/30/16
| | USD |
| | | | 6,689,995
| | | | —
| | | | —
| | | | (146,723
| ) | |
Deutsche Bank
| | Total return on DB Haven
Plus — USD Excess Return(e) | | Fixed rate of
0.00% | | 1/30/16
| | USD |
| | | | 5,282,912
| | | | —
| | | | —
| | | | (22,691
| ) | |
Deutsche Bank
| | Total return on DB Equity Low
Beta Turnover Control Factor
Index — USD Excess Return(d) | | Fixed rate of
0.00%
| | 1/30/16
| | USD |
| | | | 7,326,137
| | | | —
| | | | 96,824
| | | | —
| | |
Deutsche Bank
| | Total return on DB Currency
Valuation — USD Excess
Return(e) | | Fixed rate of
0.00%
| | 1/30/16
| | USD |
| | | | 7,023,183
| | | | —
| | | | 23,332
| | | | —
| | |
Goldman Sachs
| | Total return on Goldman Sachs
10-Year Treasury Note (TY)
futures contract Volatility
Carry Index(f) | | Fixed rate of
0.35%
| | 2/19/16
| | USD |
| | | | 8,029,729
| | | | —
| | | | —
| | | | (72,996
| ) | |
The accompanying Notes to Consolidated Financial Statements are an integral part of this statement.
Annual Report 2015
6
COLUMBIA ADAPTIVE ALTERNATIVES FUND
CONSOLIDATED PORTFOLIO OF INVESTMENTS (continued)
May 31, 2015
Total Return Swap Contracts Outstanding at May 31, 2015 (continued)
| Counterparty | | Fund Receives | | Fund Pays | | Expiration
Date | | Notional
Currency | | Notional
Amount ($) | | Unamortized
Premium
(Paid)
Received ($) | | Unrealized
Appreciation ($) | | Unrealized
Depreciation ($) | |
Goldman Sachs
| | Total return on Goldman Sachs
Risk Premia Basket Series 27
Excess Return(g) | | Fixed rate of
0.35%
| | 2/26/16
| | USD |
| | | | 3,424,798
| | | | —
| | | | 101,393
| | | | —
| | |
Goldman Sachs
| | Total return on Goldman Sachs
Risk Premia Basket Series 27
Excess Return(g) | | Fixed rate of
0.35%
| | 2/26/16
| | USD |
| | | | 7,899,998
| | | | —
| | | | —
| | | | (47,117
| ) | |
Goldman Sachs
| | Total return on Goldman Sachs
Commodity Momentum Risk
Premium Strategy Index(h) | | Fixed rate of
0.35%
| | 3/17/16
| | USD |
| | | | 3,486,532
| | | | —
| | | | 5,915
| | | | —
| | |
Goldman Sachs
| | Total return on Goldman Sachs
Commodity Carry Risk
Premium Strategy Index(h) | | Fixed rate of
0.35%
| | 3/17/16
| | USD |
| | | | 8,832,799
| | | | —
| | | | 50,341
| | | | —
| | |
Goldman Sachs
| | Total return on Goldman Sachs
Commodity Curve Risk
Premium Index(h) | | Fixed rate of
0.35%
| | 3/17/16
| | USD |
| | | | 4,500,108
| | | | —
| | | | —
| | | | (2,249
| ) | |
Goldman Sachs
| | Total return on Goldman Sachs
Commodity Curve Risk
Premium Index(h) | | Fixed rate of
0.35%
| | 3/17/16
| | USD |
| | | | 20,607,083
| | | | —
| | | | —
| | | | (64,325
| ) | |
Goldman Sachs
| | Total return on Goldman Sachs
Commodity Momentum Risk
Premium Strategy Index(h) | | Fixed rate of
0.35%
| | 3/17/16
| | USD |
| | | | 4,449,913
| | | | —
| | | | —
| | | | (2,224
| ) | |
Goldman Sachs
| | Total return on Goldman Sachs
Macro Index C0042(i) | | Fixed rate of
0.35% | | 3/17/16
| | USD |
| | | | 8,855,754
| | | | —
| | | | —
| | | | (28,306
| ) | |
Goldman Sachs
| | Total return on Goldman Sachs
Macro Index C003(j) | | Fixed rate of
0.35% | | 3/21/16
| | USD |
| | | | 11,968,685
| | | | —
| | | | 101,487
| | | | —
| | |
Goldman Sachs
| | Total return on Goldman Sachs
Risk Premium (RP) Equity World
Long Short Series 22 Excess
Return(d) | | Fixed rate of
0.35%
| | 5/31/16
| | USD |
| | | | 30,750,004
| | | | —
| | | | —
| | | | (15,367
| ) | |
Goldman Sachs
| | Total return on Goldman Sachs
Macro Index C0015(j) | | Fixed rate of
0.35% | | 5/31/16
| | USD |
| | | | 3,499,997
| | | | —
| | | | —
| | | | (2,795
| ) | |
Goldman Sachs
| | Total return on Goldman Sachs
Macro Index C0014(j) | | Fixed rate of
0.35% | | 5/31/16
| | USD |
| | | | 11,599,996
| | | | —
| | | | —
| | | | (9,271
| ) | |
Goldman Sachs
| | Total return on Goldman Sachs
Macro Index C0046(i) | | Fixed rate of
0.35% | | 5/31/16
| | USD |
| | | | 19,330,002
| | | | —
| | | | —
| | | | (24,614
| ) | |
Morgan Stanley
| | Total return on Morgan Stanley
SmartInvest Alpha Index(k) | | Fixed Rate of
0.76% | | 1/30/16
| | USD |
| | | | 6,869,825
| | | | —
| | | | 48,588
| | | | —
| | |
Morgan Stanley
| | Total return on Morgan Stanley
VolNet PremiumPlus2 Index(l) | | Fixed rate of
0.80% | | 1/30/16
| | USD |
| | | | 10,348,848
| | | | —
| | | | 58,316
| | | | —
| | |
Morgan Stanley
| | Total return on Morgan Stanley
FX VolNet Premium Strategy
Series 2(m) | | Fixed rate of
0.80%
| | 3/3/16
| | USD |
| | | | 13,800,000
| | | | —
| | | | —
| | | | (90,865
| ) | |
Total | | | | | | | | | | | | | 29,159 | | | | 728,351 | | | | (837,664 | ) | |
(a) Underlying assets of this index include credit default swaps on high yield, investment grade, and foreign indices.
(b) Underlying assets of this index include interest rate swaps of 2 year and 10 year durations.
(c) Underlying assets of this index include long foreign and domestic equities and a short domestic ETF.
(d) Underlying assets of this index include long/short foreign and domestic equities.
(e) Underlying assets of this index include USD and long/short foreign currencies.
(f) Underlying assets of this index long/short domestic commodity futures and options on short commodity futures.
The accompanying Notes to Consolidated Financial Statements are an integral part of this statement.
Annual Report 2015
7
COLUMBIA ADAPTIVE ALTERNATIVES FUND
CONSOLIDATED PORTFOLIO OF INVESTMENTS (continued)
May 31, 2015
Total Return Swap Contracts Outstanding at May 31, 2015 (continued)
(g) Underlying assets of this index include forward foreign currency exchange contracts, long/short commodity futures, options on short commodity futures, options on domestic and foreign indices, and long/short domestic and foreign equities.
(h) Underlying assets of this index include long/short domestic commodity futures.
(i) Underlying assets of this index include long/short foreign and domestic commodity futures.
(j) Underlying assets of this index include forward foreign currency exchange contracts.
(k) Underlying assets of this index include long domestic equities and a short domestic index.
(l) Underlying assets of this index include long/short puts and calls on a domestic index.
(m) Underlying assets of this index include capped variance swaps on currencies.
Notes to Consolidated Portfolio of Investments
(a) As defined in the Investment Company Act of 1940, an affiliated company is one in which the Fund owns 5% or more of the company's outstanding voting securities, or a company which is under common ownership or control with the Fund. Holdings and transactions in these affiliated companies during the year ended May 31, 2015 are as follows:
Issuer | | Beginning
Cost ($) | | Purchase
Cost ($) | | Proceeds
From Sales ($) | | Realized
Gain (Loss) ($) | | Ending
Cost ($) | | Dividends —
Affiliated
Issuers ($) | | Value ($) | |
Columbia Commodity
Strategy Fund,
Class I Shares | | | — | | | | 6,600,000 | | | | (1,110,000 | ) | | | (24,824 | ) | | | 5,465,176 | | | | — | | | | 5,340,538 | | |
Columbia Inflation
Protected Securities
Fund, Class I Shares | | | — | | | | 13,225,000 | | | | (7,585,000 | ) | | | (127,207 | ) | | | 5,512,793 | | | | — | | | | 5,416,640 | | |
Columbia Real Estate
Equity Fund, Class I Shares | | | — | | | | 6,738,412 | | | | (1,025,000 | ) | | | (70,405 | ) | | | 5,643,007 | | | | 25,913 | | | | 5,198,411 | | |
Columbia Short-Term
Cash Fund | | | 35,010,000 | | | | 206,155,747 | | | | (192,812,954 | ) | | | — | | | | 48,352,793 | | | | 16,436 | | | | 48,352,793 | | |
Blackstone Alternative
Multi-Strategy Fund,
Class Y Shares | | | — | | | | 87,800,000 | | | | — | | | | — | | | | 87,800,000 | | | | — | | | | 90,811,797 | | |
Total | | | 35,010,000 | | | | 320,519,159 | | | | (202,532,954 | ) | | | (222,436 | ) | | | 152,773,769 | | | | 42,349 | | | | 155,120,179 | | |
(b) Non-income producing investment.
(c) Indirect holding through investment in Columbia Intermediary Alternatives Fund, which invests directly in the Blackstone Alternative Multi-Strategy Fund.
(d) The rate shown is the seven-day current annualized yield at May 31, 2015.
Abbreviation Legend
USD US Dollar
Fair Value Measurements
The Fund categorizes its fair value measurements according to a three-level hierarchy that maximizes the use of observable inputs and minimizes the use of unobservable inputs by prioritizing that the most observable input be used when available. Observable inputs are those that market participants would use in pricing an investment based on market data obtained from sources independent of the reporting entity. Unobservable inputs are those that reflect the Fund's assumptions about the information market participants would use in pricing an investment. An investment's level within the fair value hierarchy is based on the lowest level of any input that is deemed significant to the asset or liability's fair value measurement. The input levels are not necessarily an indication of the risk or liquidity associated with
The accompanying Notes to Consolidated Financial Statements are an integral part of this statement.
Annual Report 2015
8
COLUMBIA ADAPTIVE ALTERNATIVES FUND
CONSOLIDATED PORTFOLIO OF INVESTMENTS (continued)
May 31, 2015
Fair Value Measurements (continued)
investments at that level. For example, certain U.S. government securities are generally high quality and liquid, however, they are reflected as Level 2 because the inputs used to determine fair value may not always be quoted prices in an active market.
Fair value inputs are summarized in the three broad levels listed below:
> Level 1 — Valuations based on quoted prices for investments in active markets that the Fund has the ability to access at the measurement date (including NAV for open-end mutual funds). Valuation adjustments are not applied to Level 1 investments.
> Level 2 — Valuations based on other significant observable inputs (including quoted prices for similar securities, interest rates, prepayment speeds, credit risks, etc.).
> Level 3 — Valuations based on significant unobservable inputs (including the Fund's own assumptions and judgment in determining the fair value of investments).
Inputs that are used in determining fair value of an investment may include price information, credit data, volatility statistics, and other factors. These inputs can be either observable or unobservable. The availability of observable inputs can vary between investments, and is affected by various factors such as the type of investment, and the volume and level of activity for that investment or similar investments in the marketplace. The inputs will be considered by the Investment Manager, along with any other relevant factors in the calculation of an investment's fair value. The Fund uses prices and inputs that are current as of the measurement date, which may include periods of market dislocations. During these periods, the availability of prices and inputs may be reduced for many investments. This condition could cause an investment to be reclassified between the various levels within the hierarchy.
Investments falling into the Level 3 category are primarily supported by quoted prices from brokers and dealers participating in the market for those investments. However, these may be classified as Level 3 investments due to lack of market transparency and corroboration to support these quoted prices. Additionally, valuation models may be used as the pricing source for any remaining investments classified as Level 3. These models may rely on one or more significant unobservable inputs and/or significant assumptions by the Investment Manager. Inputs used in valuations may include, but are not limited to, financial statement analysis, capital account balances, discount rates and estimated cash flows, and comparable company data.
Under the direction of the Fund's Board of Trustees (the Board), the Investment Manager's Valuation Committee (the Committee) is responsible for overseeing the valuation procedures approved by the Board. The Committee consists of voting and non-voting members from various groups within the Investment Manager's organization, including operations and accounting, trading and investments, compliance, risk management and legal.
The Committee meets at least monthly to review and approve valuation matters, which may include a description of specific valuation determinations, data regarding pricing information received from approved pricing vendors and brokers and the results of Board-approved valuation control policies and procedures (the Policies). The Policies address, among other things, instances when market quotations are or are not readily available, including recommendations of third party pricing vendors and a determination of appropriate pricing methodologies; events that require specific valuation determinations and assessment of fair value techniques; securities with a potential for stale pricing, including those that are illiquid, restricted, or in default; and the effectiveness of third party pricing vendors, including periodic reviews of vendors. The Committee meets more frequently, as needed, to discuss additional valuation matters, which may include the need to review back-testing results, review time-sensitive information or approve related valuation actions. The Committee reports to the Board, with members of the Committee meeting with the Board at each of its regularly scheduled meetings to discuss valuation matters and actions during the period, similar to those described earlier.
For investments categorized as Level 3, the Committee monitors information similar to that described above, which may include: (i) data specific to the issuer or comparable issuers, (ii) general market or specific sector news and (iii) quoted prices and specific or similar security transactions. The Committee considers this data and any changes from prior periods in order to assess the reasonableness of observable and unobservable inputs, any assumptions or internal models used to value those securities and changes in fair value. This data is also used to corroborate, when available, information received from approved pricing vendors and brokers. Various factors impact the frequency of monitoring this information (which may occur as often as daily). However, the Committee may determine that changes to inputs, assumptions and models are not required as a result of the monitoring procedures performed.
The accompanying Notes to Consolidated Financial Statements are an integral part of this statement.
Annual Report 2015
9
COLUMBIA ADAPTIVE ALTERNATIVES FUND
CONSOLIDATED PORTFOLIO OF INVESTMENTS (continued)
May 31, 2015
Fair Value Measurements (continued)
The following table is a summary of the inputs used to value the Fund's investments at May 31, 2015:
| | | Level 1
Quoted Prices in Active
Markets for Identical
Assets ($) | | Level 2
Other Significant
Observable Inputs ($) | | Level 3
Significant
Unobservable Inputs ($) | | Total ($) | |
Investments | |
Equity Funds | | | 5,198,411 | | | | — | | | | — | | | | 5,198,411 | | |
Fixed-Income Funds | | | 5,416,640 | | | | — | | | | — | | | | 5,416,640 | | |
Alternative Investment Funds | | | 96,152,335 | | | | — | | | | — | | | | 96,152,335 | | |
Exchange-Traded Funds | | | 13,738,675 | | | | — | | | | — | | | | 13,738,675 | | |
Exchange-Traded Notes | | | 5,313,877 | | | | — | | | | — | | | | 5,313,877 | | |
Money Market Funds | | | 48,352,793 | | | | — | | | | — | | | | 48,352,793 | | |
Total Investments | | | 174,172,731 | | | | — | | | | — | | | | 174,172,731 | | |
Derivatives | |
Assets | |
Swap Contracts | | | — | | | | — | | | | 728,351 | | | | 728,351 | | |
Liabilities | |
Futures Contracts | | | (116,613 | ) | | | — | | | | — | | | | (116,613 | ) | |
Swap Contracts | | | — | | | | — | | | | (837,664 | ) | | | (837,664 | ) | |
Total | | | 174,056,118 | | | | — | | | | (109,313 | ) | | | 173,946,805 | | |
See the Consolidated Portfolio of Investments for all investment classifications not indicated in the table.
There were no transfers of financial assets between levels during the period.
Derivative instruments are valued at unrealized appreciation (depreciation).
The Fund does not hold any significant investments (greater than one percent of net assets) categorized as Level 3.
The Fund's assets assigned to the Level 3 category are valued utilizing the valuation technique deemed the most appropriate in the circumstances. Certain swap contracts classified as Level 3 securities are valued using the market approach and utilize single market quotations from broker dealers. The appropriateness of fair values for these securities is monitored on an ongoing basis which may include results of back testing and other control procedures.
The accompanying Notes to Consolidated Financial Statements are an integral part of this statement.
Annual Report 2015
10
COLUMBIA ADAPTIVE ALTERNATIVES FUND
CONSOLIDATED STATEMENT OF ASSETS AND LIABILITIES
May 31, 2015
Assets | |
Investments, at value | |
Unaffiliated issuers (identified cost $19,257,701) | | $ | 19,052,552 | | |
Affiliated issuers (identified cost $152,773,769) | | | 155,120,179 | | |
Total investments (identified cost $172,031,470) | | | 174,172,731 | | |
Cash collateral held at broker | | | 754,000 | | |
Margin deposits | | | 184,000 | | |
Unrealized appreciation on swap contracts | | | 728,351 | | |
Premiums paid on outstanding swap contracts | | | 29,159 | | |
Receivable for: | |
Investments sold | | | 1,672,625 | | |
Capital shares sold | | | 320,034 | | |
Dividends | | | 4,212 | | |
Interest | | | 66,123 | | |
Variation margin | | | 31,400 | | |
Expense reimbursement due from Investment Manager | | | 4,095 | | |
Trustees' deferred compensation plan | | | 868 | | |
Other assets | | | 99,001 | | |
Total assets | | | 178,066,599 | | |
Liabilities | |
Unrealized depreciation on swap contracts | | | 837,664 | | |
Payable for: | |
Investments purchased | | | 340,094 | | |
Capital shares purchased | | | 236,631 | | |
Investment management fees | | | 5,563 | | |
Distribution and/or service fees | | | 838 | | |
Transfer agent fees | | | 26,547 | | |
Administration fees | | | 387 | | |
Chief compliance officer expenses | | | 20 | | |
Other expenses | | | 89,496 | | |
Trustees' deferred compensation plan | | | 868 | | |
Other liabilities | | | 12,797 | | |
Total liabilities | | | 1,550,905 | | |
Net assets applicable to outstanding capital stock | | $ | 176,515,694 | | |
Represented by | |
Paid-in capital | | $ | 176,182,213 | | |
Undistributed net investment income | | | 10,908 | | |
Accumulated net realized loss | | | (1,592,762 | ) | |
Unrealized appreciation (depreciation) on: | |
Investments — unaffiliated issuers | | | (205,149 | ) | |
Investments — affiliated issuers | | | 2,346,410 | | |
Futures contracts | | | (116,613 | ) | |
Swap contracts | | | (109,313 | ) | |
Total — representing net assets applicable to outstanding capital stock | | $ | 176,515,694 | | |
The accompanying Notes to Consolidated Financial Statements are an integral part of this statement.
Annual Report 2015
11
COLUMBIA ADAPTIVE ALTERNATIVES FUND
CONSOLIDATED STATEMENT OF ASSETS AND LIABILITIES (continued)
May 31, 2015
Class A | |
Net assets | | $ | 4,470,038 | | |
Shares outstanding | | | 453,896 | | |
Net asset value per share | | $ | 9.85 | | |
Maximum offering price per share(a) | | $ | 10.45 | | |
Class C | |
Net assets | | $ | 932,443 | | |
Shares outstanding | | | 94,835 | | |
Net asset value per share | | $ | 9.83 | | |
Class I | |
Net assets | | $ | 22,263,251 | | |
Shares outstanding | | | 2,257,770 | | |
Net asset value per share | | $ | 9.86 | | |
Class R | |
Net assets | | $ | 9,839 | | |
Shares outstanding | | | 1,000 | | |
Net asset value per share | | $ | 9.84 | | |
Class R4 | |
Net assets | | $ | 9,855 | | |
Shares outstanding | | | 1,000 | | |
Net asset value per share | | $ | 9.86 | | |
Class R5 | |
Net assets | | $ | 9,857 | | |
Shares outstanding | | | 1,000 | | |
Net asset value per share | | $ | 9.86 | | |
Class W | |
Net assets | | $ | 114,125,002 | | |
Shares outstanding | | | 11,595,846 | | |
Net asset value per share | | $ | 9.84 | | |
Class Y | |
Net assets | | $ | 9,859 | | |
Shares outstanding | | | 1,000 | | |
Net asset value per share | | $ | 9.86 | | |
Class Z | |
Net assets | | $ | 34,685,550 | | |
Shares outstanding | | | 3,519,500 | | |
Net asset value per share | | $ | 9.86 | | |
(a) The maximum offering price per share is calculated by dividing the net asset value per share by 1.0 minus the maximum sales charge of 5.75%.
The accompanying Notes to Consolidated Financial Statements are an integral part of this statement.
Annual Report 2015
12
COLUMBIA ADAPTIVE ALTERNATIVES FUND
CONSOLIDATED STATEMENT OF OPERATIONS
Year Ended May 31, 2015(a)
Net investment income | |
Income: | |
Dividends — unaffiliated issuers | | $ | 28,963 | | |
Dividends — affiliated issuers | | | 42,349 | | |
Total income | | | 71,312 | | |
Expenses: | |
Investment management fees | | | 642,780 | | |
Distribution and/or service fees | |
Class A | | | 889 | | |
Class C | | | 560 | | |
Class R | | | 17 | | |
Class W | | | 90,158 | | |
Transfer agent fees | |
Class A | | | 1,411 | | |
Class C | | | 254 | | |
Class R | | | 8 | | |
Class R4 | | | 8 | | |
Class R5 | | | 2 | | |
Class W | | | 90,117 | | |
Class Z | | | 27,287 | | |
Administration fees | | | 43,808 | | |
Compensation of board members | | | 6,756 | | |
Custodian fees | | | 26,087 | | |
Printing and postage fees | | | 18,243 | | |
Registration fees | | | 82,247 | | |
Professional fees | | | 50,398 | | |
Chief compliance officer expenses | | | 49 | | |
Other | | | 51,483 | | |
Total expenses | | | 1,132,562 | | |
Fees waived or expenses reimbursed by Investment Manager and its affiliates | | | (363,998 | ) | |
Total net expenses | | | 768,564 | | |
Net investment loss | | | (697,252 | ) | |
Realized and unrealized gain (loss) — net | |
Net realized gain (loss) on: | |
Investments — unaffiliated issuers | | | (144,215 | ) | |
Investments — affiliated issuers | | | (222,436 | ) | |
Foreign currency translations | | | 3,458 | | |
Futures contracts | | | (236,318 | ) | |
Swap contracts | | | (3,240,423 | ) | |
Net realized loss | | | (3,839,934 | ) | |
Net change in unrealized appreciation (depreciation) on: | |
Investments — unaffiliated issuers | | | (205,149 | ) | |
Investments — affiliated issuers | | | 2,346,410 | | |
Futures contracts | | | (116,613 | ) | |
Swap contracts | | | (109,313 | ) | |
Net change in unrealized appreciation | | | 1,915,335 | | |
Net realized and unrealized loss | | | (1,924,599 | ) | |
Net decrease in net assets from operations | | $ | (2,621,851 | ) | |
(a) Based on operations from January 28, 2015 (commencement of operations) through the stated period end.
The accompanying Notes to Consolidated Financial Statements are an integral part of this statement.
Annual Report 2015
13
COLUMBIA ADAPTIVE ALTERNATIVES FUND
CONSOLIDATED STATEMENT OF CHANGES IN NET ASSETS
| | | Year Ended
May 31,
2015(a) | |
Operations | |
Net investment loss | | $ | (697,252 | ) | |
Net realized loss | | | (3,839,934 | ) | |
Net change in unrealized appreciation | | | 1,915,335 | | |
Net decrease in net assets resulting from operations | | | (2,621,851 | ) | |
Increase in net assets from capital stock activity | | | 144,137,435 | | |
Total increase in net assets | | | 141,515,584 | | |
Net assets at beginning of year | | | 35,000,110 | | |
Net assets at end of year | | $ | 176,515,694 | | |
Undistributed net investment income | | $ | 10,908 | | |
(a) Based on operations from January 28, 2015 (commencement of operations) through the stated period end.
The accompanying Notes to Consolidated Financial Statements are an integral part of this statement.
Annual Report 2015
14
COLUMBIA ADAPTIVE ALTERNATIVES FUND
CONSOLIDATED STATEMENT OF CHANGES IN NET ASSETS (continued)
| | | Year Ended May 31, 2015(a) | |
| | | Shares | | Dollars ($) | |
Capital stock activity | |
Class A shares | |
Subscriptions | | | 460,028 | | | | 4,541,390 | | |
Redemptions | | | (7,132 | ) | | | (69,903 | ) | |
Net increase | | | 452,896 | | | | 4,471,487 | | |
Class C shares | |
Subscriptions | | | 93,835 | | | | 924,788 | | |
Net increase | | | 93,835 | | | | 924,788 | | |
Class I shares | |
Subscriptions | | | 2,256,770 | | | | 22,500,000 | | |
Net increase | | | 2,256,770 | | | | 22,500,000 | | |
Class W shares | |
Subscriptions | | | 12,324,400 | | | | 123,209,339 | | |
Redemptions | | | (729,554 | ) | | | (7,243,204 | ) | |
Net increase | | | 11,594,846 | | | | 115,966,135 | | |
Class Z shares | |
Subscriptions | | | 27,500 | | | | 275,025 | | |
Net increase | | | 27,500 | | | | 275,025 | | |
Total net increase | | | 14,425,847 | | | | 144,137,435 | | |
(a) Based on operations from January 28, 2015 (commencement of operations) through the stated period end.
The accompanying Notes to Consolidated Financial Statements are an integral part of this statement.
Annual Report 2015
15
COLUMBIA ADAPTIVE ALTERNATIVES FUND
CONSOLIDATED FINANCIAL HIGHLIGHTS
The following tables are intended to help you understand the Fund's financial performance. Certain information reflects financial results for a single share of a class held for the periods shown. Per share net investment income (loss) amounts are calculated based on average shares outstanding during the period. Total return assumes reinvestment of all dividends and distributions, if any. Total return does not reflect payment of sales charges, if any. Total return and portfolio turnover are not annualized for periods of less than one year. The portfolio turnover rate is calculated without regard to purchase and sales transactions of short-term instruments and certain derivatives, if any. If such transactions were included, the Fund's portfolio turnover rate may be higher.
Class A | | Year Ended
May 31,
2015(a) | |
Per share data | |
Net asset value, beginning of period | | $ | 10.00 | | |
Income from investment operations: | |
Net investment loss | | | (0.05 | ) | |
Net realized and unrealized loss | | | (0.10 | ) | |
Total from investment operations | | | (0.15 | ) | |
Net asset value, end of period | | $ | 9.85 | | |
Total return | | | (1.50 | %) | |
Ratios to average net assets(b) | |
Total gross expenses | | | 2.08 | %(c) | |
Total net expenses(d) | | | 1.50 | %(c) | |
Net investment loss | | | (1.42 | %)(c) | |
Supplemental data | |
Net assets, end of period (in thousands) | | $ | 4,470 | | |
Portfolio turnover | | | 28 | % | |
Notes to Consolidated Financial Highlights
(a) Based on operations from January 28, 2015 (commencement of operations) through the stated period end.
(b) In addition to the fees and expenses that the Fund bears directly, the Fund indirectly bears a pro rata share of the fees and expenses of any other funds in which it invests. Such indirect expenses are not included in the Fund's reported expense ratios.
(c) Annualized.
(d) Total net expenses include the impact of certain fee waivers/expense reimbursements made by the Investment Manager and certain of its affiliates, if applicable.
The accompanying Notes to Consolidated Financial Statements are an integral part of this statement.
Annual Report 2015
16
COLUMBIA ADAPTIVE ALTERNATIVES FUND
CONSOLIDATED FINANCIAL HIGHLIGHTS (continued)
Class C | | Year Ended
May 31,
2015(a) | |
Per share data | |
Net asset value, beginning of period | | $ | 10.00 | | |
Income from investment operations: | |
Net investment loss | | | (0.07 | ) | |
Net realized and unrealized loss | | | (0.10 | ) | |
Total from investment operations | | | (0.17 | ) | |
Net asset value, end of period | | $ | 9.83 | | |
Total return | | | (1.70 | %) | |
Ratios to average net assets(b) | |
Total gross expenses | | | 2.83 | %(c) | |
Total net expenses(d) | | | 2.25 | %(c) | |
Net investment loss | | | (2.18 | %)(c) | |
Supplemental data | |
Net assets, end of period (in thousands) | | $ | 932 | | |
Portfolio turnover | | | 28 | % | |
Notes to Consolidated Financial Highlights
(a) Based on operations from January 28, 2015 (commencement of operations) through the stated period end.
(b) In addition to the fees and expenses that the Fund bears directly, the Fund indirectly bears a pro rata share of the fees and expenses of any other funds in which it invests. Such indirect expenses are not included in the Fund's reported expense ratios.
(c) Annualized.
(d) Total net expenses include the impact of certain fee waivers/expense reimbursements made by the Investment Manager and certain of its affiliates, if applicable.
The accompanying Notes to Consolidated Financial Statements are an integral part of this statement.
Annual Report 2015
17
COLUMBIA ADAPTIVE ALTERNATIVES FUND
CONSOLIDATED FINANCIAL HIGHLIGHTS (continued)
Class I | | Year Ended
May 31,
2015(a) | |
Per share data | |
Net asset value, beginning of period | | $ | 10.00 | | |
Income from investment operations: | |
Net investment loss | | | (0.03 | ) | |
Net realized and unrealized loss | | | (0.11 | ) | |
Total from investment operations | | | (0.14 | ) | |
Net asset value, end of period | | $ | 9.86 | | |
Total return | | | (1.40 | %) | |
Ratios to average net assets(b) | |
Total gross expenses | | | 1.58 | %(c) | |
Total net expenses(d) | | | 1.11 | %(c) | |
Net investment loss | | | (0.98 | %)(c) | |
Supplemental data | |
Net assets, end of period (in thousands) | | $ | 22,263 | | |
Portfolio turnover | | | 28 | % | |
Notes to Consolidated Financial Highlights
(a) Based on operations from January 28, 2015 (commencement of operations) through the stated period end.
(b) In addition to the fees and expenses that the Fund bears directly, the Fund indirectly bears a pro rata share of the fees and expenses of any other funds in which it invests. Such indirect expenses are not included in the Fund's reported expense ratios.
(c) Annualized.
(d) Total net expenses include the impact of certain fee waivers/expense reimbursements made by the Investment Manager and certain of its affiliates, if applicable.
The accompanying Notes to Consolidated Financial Statements are an integral part of this statement.
Annual Report 2015
18
COLUMBIA ADAPTIVE ALTERNATIVES FUND
CONSOLIDATED FINANCIAL HIGHLIGHTS (continued)
Class R | | Year Ended
May 31,
2015(a) | |
Per share data | |
Net asset value, beginning of period | | $ | 10.00 | | |
Income from investment operations: | |
Net investment loss | | | (0.05 | ) | |
Net realized and unrealized loss | | | (0.11 | ) | |
Total from investment operations | | | (0.16 | ) | |
Net asset value, end of period | | $ | 9.84 | | |
Total return | | | (1.60 | %) | |
Ratios to average net assets(b) | |
Total gross expenses | | | 2.33 | %(c) | |
Total net expenses(d) | | | 1.73 | %(c) | |
Net investment loss | | | (1.59 | %)(c) | |
Supplemental data | |
Net assets, end of period (in thousands) | | $ | 10 | | |
Portfolio turnover | | | 28 | % | |
Notes to Consolidated Financial Highlights
(a) Based on operations from January 28, 2015 (commencement of operations) through the stated period end.
(b) In addition to the fees and expenses that the Fund bears directly, the Fund indirectly bears a pro rata share of the fees and expenses of any other funds in which it invests. Such indirect expenses are not included in the Fund's reported expense ratios.
(c) Annualized.
(d) Total net expenses include the impact of certain fee waivers/expense reimbursements made by the Investment Manager and certain of its affiliates, if applicable.
The accompanying Notes to Consolidated Financial Statements are an integral part of this statement.
Annual Report 2015
19
COLUMBIA ADAPTIVE ALTERNATIVES FUND
CONSOLIDATED FINANCIAL HIGHLIGHTS (continued)
Class R4 | | Year Ended
May 31,
2015(a) | |
Per share data | |
Net asset value, beginning of period | | $ | 10.00 | | |
Income from investment operations: | |
Net investment loss | | | (0.04 | ) | |
Net realized and unrealized loss | | | (0.10 | ) | |
Total from investment operations | | | (0.14 | ) | |
Net asset value, end of period | | $ | 9.86 | | |
Total return | | | (1.40 | %) | |
Ratios to average net assets(b) | |
Total gross expenses | | | 1.80 | %(c) | |
Total net expenses(d) | | | 1.23 | %(c) | |
Net investment loss | | | (1.09 | %)(c) | |
Supplemental data | |
Net assets, end of period (in thousands) | | $ | 10 | | |
Portfolio turnover | | | 28 | % | |
Notes to Consolidated Financial Highlights
(a) Based on operations from January 28, 2015 (commencement of operations) through the stated period end.
(b) In addition to the fees and expenses that the Fund bears directly, the Fund indirectly bears a pro rata share of the fees and expenses of any other funds in which it invests. Such indirect expenses are not included in the Fund's reported expense ratios.
(c) Annualized.
(d) Total net expenses include the impact of certain fee waivers/expense reimbursements made by the Investment Manager and certain of its affiliates, if applicable.
The accompanying Notes to Consolidated Financial Statements are an integral part of this statement.
Annual Report 2015
20
COLUMBIA ADAPTIVE ALTERNATIVES FUND
CONSOLIDATED FINANCIAL HIGHLIGHTS (continued)
Class R5 | | Year Ended
May 31,
2015(a) | |
Per share data | |
Net asset value, beginning of period | | $ | 10.00 | | |
Income from investment operations: | |
Net investment loss | | | (0.03 | ) | |
Net realized and unrealized loss | | | (0.11 | ) | |
Total from investment operations | | | (0.14 | ) | |
Net asset value, end of period | | $ | 9.86 | | |
Total return | | | (1.40 | %) | |
Ratios to average net assets(b) | |
Total gross expenses | | | 1.63 | %(c) | |
Total net expenses(d) | | | 1.17 | %(c) | |
Net investment loss | | | (1.03 | %)(c) | |
Supplemental data | |
Net assets, end of period (in thousands) | | $ | 10 | | |
Portfolio turnover | | | 28 | % | |
Notes to Consolidated Financial Highlights
(a) Based on operations from January 28, 2015 (commencement of operations) through the stated period end.
(b) In addition to the fees and expenses that the Fund bears directly, the Fund indirectly bears a pro rata share of the fees and expenses of any other funds in which it invests. Such indirect expenses are not included in the Fund's reported expense ratios.
(c) Annualized.
(d) Total net expenses include the impact of certain fee waivers/expense reimbursements made by the Investment Manager and certain of its affiliates, if applicable.
The accompanying Notes to Consolidated Financial Statements are an integral part of this statement.
Annual Report 2015
21
COLUMBIA ADAPTIVE ALTERNATIVES FUND
CONSOLIDATED FINANCIAL HIGHLIGHTS (continued)
Class W | | Year Ended
May 31,
2015(a) | |
Per share data | |
Net asset value, beginning of period | | $ | 10.00 | | |
Income from investment operations: | |
Net investment loss | | | (0.05 | ) | |
Net realized and unrealized loss | | | (0.11 | ) | |
Total from investment operations | | | (0.16 | ) | |
Net asset value, end of period | | $ | 9.84 | | |
Total return | | | (1.60 | %) | |
Ratios to average net assets(b) | |
Total gross expenses | | | 2.07 | %(c) | |
Total net expenses(d) | | | 1.48 | %(c) | |
Net investment loss | | | (1.35 | %)(c) | |
Supplemental data | |
Net assets, end of period (in thousands) | | $ | 114,125 | | |
Portfolio turnover | | | 28 | % | |
Notes to Consolidated Financial Highlights
(a) Based on operations from January 28, 2015 (commencement of operations) through the stated period end.
(b) In addition to the fees and expenses that the Fund bears directly, the Fund indirectly bears a pro rata share of the fees and expenses of any other funds in which it invests. Such indirect expenses are not included in the Fund's reported expense ratios.
(c) Annualized.
(d) Total net expenses include the impact of certain fee waivers/expense reimbursements made by the Investment Manager and certain of its affiliates, if applicable.
The accompanying Notes to Consolidated Financial Statements are an integral part of this statement.
Annual Report 2015
22
COLUMBIA ADAPTIVE ALTERNATIVES FUND
CONSOLIDATED FINANCIAL HIGHLIGHTS (continued)
Class Y | | Year Ended
May 31,
2015(a) | |
Per share data | |
Net asset value, beginning of period | | $ | 10.00 | | |
Income from investment operations: | |
Net investment loss | | | (0.03 | ) | |
Net realized and unrealized loss | | | (0.11 | ) | |
Total from investment operations | | | (0.14 | ) | |
Net asset value, end of period | | $ | 9.86 | | |
Total return | | | (1.40 | %) | |
Ratios to average net assets(b) | |
Total gross expenses | | | 1.58 | %(c) | |
Total net expenses(d) | | | 1.12 | %(c) | |
Net investment loss | | | (0.98 | %)(c) | |
Supplemental data | |
Net assets, end of period (in thousands) | | $ | 10 | | |
Portfolio turnover | | | 28 | % | |
Notes to Consolidated Financial Highlights
(a) Based on operations from January 28, 2015 (commencement of operations) through the stated period end.
(b) In addition to the fees and expenses that the Fund bears directly, the Fund indirectly bears a pro rata share of the fees and expenses of any other funds in which it invests. Such indirect expenses are not included in the Fund's reported expense ratios.
(c) Annualized.
(d) Total net expenses include the impact of certain fee waivers/expense reimbursements made by the Investment Manager and certain of its affiliates, if applicable.
The accompanying Notes to Consolidated Financial Statements are an integral part of this statement.
Annual Report 2015
23
COLUMBIA ADAPTIVE ALTERNATIVES FUND
CONSOLIDATED FINANCIAL HIGHLIGHTS (continued)
Class Z | | Year Ended
May 31,
2015(a) | |
Per share data | |
Net asset value, beginning of period | | $ | 10.00 | | |
Income from investment operations: | |
Net investment loss | | | (0.04 | ) | |
Net realized and unrealized loss | | | (0.10 | ) | |
Total from investment operations | | | (0.14 | ) | |
Net asset value, end of period | | $ | 9.86 | | |
Total return | | | (1.40 | %) | |
Ratios to average net assets(b) | |
Total gross expenses | | | 1.83 | %(c) | |
Total net expenses(d) | | | 1.23 | %(c) | |
Net investment loss | | | (1.09 | %)(c) | |
Supplemental data | |
Net assets, end of period (in thousands) | | $ | 34,686 | | |
Portfolio turnover | | | 28 | % | |
Notes to Consolidated Financial Highlights
(a) Based on operations from January 28, 2015 (commencement of operations) through the stated period end.
(b) In addition to the fees and expenses that the Fund bears directly, the Fund indirectly bears a pro rata share of the fees and expenses of any other funds in which it invests. Such indirect expenses are not included in the Fund's reported expense ratios.
(c) Annualized.
(d) Total net expenses include the impact of certain fee waivers/expense reimbursements made by the Investment Manager and certain of its affiliates, if applicable.
The accompanying Notes to Consolidated Financial Statements are an integral part of this statement.
Annual Report 2015
24
COLUMBIA ADAPTIVE ALTERNATIVES FUND
NOTES TO CONSOLIDATED FINANCIAL STATEMENTS
May 31, 2015
Note 1. Organization
Columbia Adaptive Alternatives Fund (the Fund), a series of Columbia Funds Series Trust I (the Trust), is a non-diversified fund. The Trust is registered under the Investment Company Act of 1940, as amended (the 1940 Act), as an open-end management investment company organized as a Massachusetts business trust.
The Fund invests significantly in Class I shares of affiliated funds managed by Columbia Management Investment Advisers, LLC (the Investment Manager), a wholly-owned subsidiary of Ameriprise Financial, Inc. (Ameriprise Financial), or its affiliates (affiliated underlying funds) as well as third-party advised (unaffiliated) funds, including exchange-traded funds (ETFs) (Underlying Funds). The Fund invests significantly in, among other Underlying Funds, Columbia Intermediary Alternatives Fund, an affiliated fund that invests all or substantially all of its assets in Class Y shares of the Blackstone Alternative Multi-Strategy Fund, an unaffiliated fund.
For information on the Underlying Funds, please refer to the Fund's current prospectus and the prospectuses of the Underlying Funds.
On January 26, 2015, the Investment Manager invested $35,000,000 in the Fund (1,000 shares for Class A, 1,000 shares for Class C, 1,000 shares for Class I, 1,000 shares for Class R, 1,000 shares for Class R4, 1,000 shares for Class R5, 1,000 shares for Class W, 1,000 shares for Class Y and 3,492,000 shares for Class Z), which represented the initial capital for each class at $10.00 per share. Shares of the Fund were first offered to the public on January 28, 2015.
These consolidated financial statements (financial statements) cover the period from January 28, 2015 (commencement of operations) through May 31, 2015.
Basis for Consolidation
CAAF Offshore Fund, Ltd. (the Subsidiary) is a Cayman Islands exempted company and wholly-owned subsidiary of the Fund. The Subsidiary operates as an investment vehicle to provide the Fund with exposure to the commodities markets consistent with the Fund's investment objective and policies as stated in its current prospectus and statement of additional information. In accordance with the Memorandum and Articles of Association of the Subsidiary (the Articles), the Fund owns the sole issued share of the Subsidiary and retains all rights associated with such share, including the right
to receive notice of, attend and vote at general meetings of the Subsidiary, rights in a winding-up or repayment of capital and the right to participate in the profits or assets of the Subsidiary. At May 31, 2015, the net assets of the Subsidiary were $21,808,483 or 12.35% of the Fund's consolidated net assets. All intercompany transactions and balances have been eliminated in the consolidation process.
For the period ended May 31, 2015, the Fund owned 100% of the outstanding shares of Columbia Intermediary Alternatives Fund.
The financial statements present the portfolio holdings, financial position and results of operations of the Fund and the Subsidiary and Columbia Intermediary Alternatives Fund on a consolidated basis. All intercompany transactions and balances have been eliminated in the consolidation process.
Fund Shares
The Trust may issue an unlimited number of shares (without par value). The Fund offers Class A, Class C, Class I, Class R, Class R4, Class R5, Class W, Class Y and Class Z shares. Although all share classes generally have identical voting, dividend and liquidation rights, each share class votes separately when required by the Trust's organizational documents or by law. Different share classes pay different distribution amounts to the extent the expenses of such share classes differ, and distributions in liquidation will be proportional to the net asset value of each share class. Each share class has its own expense and sales charge structure.
Class A shares are subject to a maximum front-end sales charge of 5.75% based on the initial investment amount. Class A shares purchased without an initial sales charge in accounts aggregating $1 million to $50 million at the time of purchase are subject to a contingent deferred sales charge (CDSC) if the shares are sold within 18 months after purchase, charged as follows: 1.00% CDSC if redeemed within 12 months after purchase, and 0.50% CDSC if redeemed more than 12, but less than 18, months after purchase.
Class C shares are subject to a 1.00% CDSC on shares redeemed within one year after purchase.
Class I shares are not subject to sales charges and are available only to the Columbia Family of Funds.
Class R shares are not subject to sales charges and are generally available only to certain retirement plans and other investors as described in the Fund's prospectus.
Annual Report 2015
25
COLUMBIA ADAPTIVE ALTERNATIVES FUND
NOTES TO CONSOLIDATED FINANCIAL STATEMENTS (continued)
May 31, 2015
Class R4 shares are not subject to sales charges and are generally available only to omnibus retirement plans and certain investors as described in the Fund's prospectus.
Class R5 shares are not subject to sales charges and are generally available only to investors purchasing through authorized investment professionals and omnibus retirement plans.
Class W shares are not subject to sales charges and are available only to investors purchasing through authorized investment programs managed by investment professionals, including discretionary managed account programs.
Class Y shares are not subject to sales charges and are generally available only to certain retirement plans as described in the Fund's prospectus.
Class Z shares are not subject to sales charges and are available only to eligible investors, which are subject to different investment minimums as described in the Fund's prospectus.
Note 2. Summary of Significant Accounting Policies
Basis of Preparation
The Fund is an investment company that applies the accounting and reporting guidance in the Financial Accounting Standards Board (FASB) Accounting Standards Codification Topic 946, Financial Services — Investment Companies (ASC 946). The financial statements are prepared in accordance with U.S. generally accepted accounting principles (GAAP), which requires management to make certain estimates and assumptions that affect the reported amounts of assets and liabilities, the disclosure of contingent assets and liabilities at the date of the financial statements and the reported amounts of income and expenses during the reporting period. Actual results could differ from those estimates.
The following is a summary of significant accounting policies followed by the Fund in the preparation of its financial statements.
Security Valuation
Investments in the Underlying Funds are valued at the net asset value of the applicable class of the Underlying Fund determined as of the close of the New York Stock Exchange (NYSE) on the valuation date.
All equity securities and ETFs are valued at the close of business of the NYSE. Equity securities and ETFs are valued at the last quoted sales price on the principal
exchange or market on which they trade, except for securities traded on the NASDAQ Stock Market, which are valued at the NASDAQ official close price. Unlisted securities or listed securities for which there were no sales during the day are valued at the mean of the latest quoted bid and ask prices on such exchanges or markets.
Futures and options on futures contracts are valued based upon the settlement price at the close of regular trading on their principal exchanges or, in the absence of transactions, at the mean of the latest quoted bid and ask prices.
Swap transactions are valued through an independent pricing service or broker, or if neither is available, through an internal model based upon observable inputs.
Investments for which market quotations are not readily available, or that have quotations which management believes are not reflective of market value or reliable, are valued at fair value as determined in good faith under procedures approved by and under the general supervision of the Board of Trustees (the Board). If a security or class of securities (such as foreign securities) is valued at fair value, such value is likely to be different from the quoted or published price for the security.
The determination of fair value often requires significant judgment. To determine fair value, management may use assumptions including but not limited to future cash flows and estimated risk premiums. Multiple inputs from various sources may be used to determine fair value.
GAAP requires disclosure regarding the inputs and valuation techniques used to measure fair value and any changes in valuation inputs or techniques. In addition, investments shall be disclosed by major category. This information is disclosed following the Fund's Consolidated Portfolio of Investments.
Derivative Instruments
The Fund invests in certain derivative instruments, as detailed below, to meet its investment objectives. Derivatives are instruments whose values depend on, or are derived from, in whole or in part, the value of one or more securities, currencies, commodities, indices, or other assets or instruments. Derivatives may be used to increase investment flexibility (including to maintain cash reserves while maintaining desired exposures), for risk management (hedging) purposes, to facilitate trading, to reduce transaction costs and to pursue higher investment returns. The Fund may also use derivative instruments to mitigate certain investment risks, such as
Annual Report 2015
26
COLUMBIA ADAPTIVE ALTERNATIVES FUND
NOTES TO CONSOLIDATED FINANCIAL STATEMENTS (continued)
May 31, 2015
foreign currency exchange rate risk, interest rate risk and credit risk. Derivatives may involve various risks, including the potential inability of the counterparty to fulfill its obligation under the terms of the contract, the potential for an illiquid secondary market (making it difficult for the Fund to sell, including at favorable prices) and the potential for market movements which may expose the Fund to gains or losses in excess of the amount shown in the Consolidated Statement of Assets and Liabilities. The notional amounts of derivative instruments, if applicable, are not recorded in the financial statements.
A derivative instrument may suffer a marked-to-market loss if the value of the contract decreases due to an unfavorable change in the market rates or values of the underlying instrument. Losses can also occur if the counterparty does not perform under the contract. The Fund's risk of loss from counterparty credit risk on over-the-counter derivatives is generally limited to the aggregate unrealized gain netted against any collateral held by the Fund and the amount of any variation margin held by the counterparty. With exchange-traded or centrally cleared derivatives, there is reduced counterparty credit risk to the Fund since the exchange's clearinghouse, as counterparty to such instruments, guarantees against a possible default. The clearinghouse stands between the buyer and the seller of the contract; therefore, the counterparty credit risk is failure of the clearinghouse. However, credit risk still exists in exchange-traded or centrally cleared derivatives with respect to initial and variation margin that is held in a broker's customer account. While brokers are required to segregate customer margin from their own assets, in the event that a broker becomes insolvent or goes into bankruptcy and at that time there is a shortfall in the aggregate amount of margin held by the broker for all its clients, U.S. bankruptcy laws will typically allocate that shortfall on a pro-rata basis across all the broker's customers (including the Fund), potentially resulting in losses to the Fund.
In order to better define its contractual rights and to secure rights that will help the Fund mitigate its counterparty risk, the Fund may enter into an International Swaps and Derivatives Association, Inc. Master Agreement (ISDA Master Agreement) or similar agreement with its derivative contract counterparties. An ISDA Master Agreement is an agreement between the Fund and a counterparty that governs over-the-counter derivatives and forward foreign currency exchange contracts and typically contains, among other things,
collateral posting terms and netting provisions in the event of a default and/or termination event. Under an ISDA Master Agreement, the Fund may, under certain circumstances, offset with the counterparty certain derivative instrument's payables and/or receivables with collateral held and/or posted and create one single net payment. The provisions of the ISDA Master Agreement typically permit a single net payment in the event of default (close-out netting) including the bankruptcy or insolvency of the counterparty. Note, however, that bankruptcy or insolvency laws of a particular jurisdiction may impose restrictions on or prohibitions against the right of offset in bankruptcy, insolvency or other events.
Collateral (margin) requirements differ by type of derivative. Margin requirements are established by the exchange or clearinghouse for exchange-traded and centrally cleared derivatives. Brokers can ask for margin in excess of the minimum in certain circumstances. Collateral terms are contract specific for over-the-counter derivatives. For over-the-counter derivatives traded under an ISDA Master Agreement, the collateral requirements are typically calculated by netting the marked-to-market amount for each transaction under such agreement and comparing that amount to the value of any variation margin currently pledged by the Fund and/or the counterparty. Generally, the amount of collateral due from or to a party has to exceed a minimum transfer amount threshold (e.g., $500,000) before a transfer has to be made. To the extent amounts due to the Fund from its counterparties are not fully collateralized, contractually or otherwise, the Fund bears the risk of loss from counterparty nonperformance. The Fund attempts to mitigate counterparty risk by only entering into agreements with counterparties that it believes have the financial resources to honor their obligations and by monitoring the financial stability of those counterparties.
Certain ISDA Master Agreements allow counterparties to over-the-counter derivatives transactions to terminate derivatives contracts prior to maturity in the event the Fund's net assets decline by a stated percentage over a specified time period or if the Fund fails to meet certain terms of the ISDA Master Agreement, which would cause the Fund to accelerate payment of any net liability owed to the counterparty. The Fund also has termination rights if the counterparty fails to meet certain terms of the ISDA Master Agreement. In addition to considering counterparty credit risk, the Fund would consider terminating the derivatives contracts based on whether termination would result in a net liability owed from the counterparty.
Annual Report 2015
27
COLUMBIA ADAPTIVE ALTERNATIVES FUND
NOTES TO CONSOLIDATED FINANCIAL STATEMENTS (continued)
May 31, 2015
For financial reporting purposes, the Fund does not offset derivative assets and derivative liabilities that are subject to netting arrangements in the Consolidated Statement of Assets and Liabilities.
Futures Contracts
Futures contracts are exchange traded and represent commitments for the future purchase or sale of an asset at a specified price on a specified date. The Fund bought and sold futures contracts to manage exposure to movements in interest rates and to manage exposure to the securities market. These instruments may be used for other purposes in future periods. Upon entering into futures contracts, the Fund bears risks that it may not achieve the anticipated benefits of the futures contracts and may realize a loss. Additional risks include counterparty credit risk, the possibility of an illiquid market, and that a change in the value of the contract or option may not correlate with changes in the value of the underlying asset.
Upon entering into a futures contract, the Fund pledges cash or securities with the broker in an amount sufficient to meet the initial margin requirement. The initial margin deposit must be maintained at an established level over the life of the contract. Cash deposited as initial margin is recorded in the Consolidated Statement of Assets and Liabilities as margin deposits. Securities deposited as initial margin are designated in the Consolidated Portfolio of Investments. Subsequent payments (variation margin) are made or received by the Fund each day. The variation margin payments are equal to the daily change in the contract value and are recorded as variation margin receivable or payable and are offset in unrealized gains or losses. The Fund recognizes a realized gain or loss when the contract is closed or expires. Futures contracts involve, to varying degrees, risk of loss in excess of the variation margin disclosed in the Consolidated Statement of Assets and Liabilities.
Swap Contracts
Swap contracts are negotiated in the over-the-counter market and may be entered into as a bilateral contract or centrally cleared (centrally cleared swap contract). In a centrally cleared swap contract, immediately following execution of the swap contract with a broker, the swap contract is novated to a central counterparty (the CCP) and the CCP becomes the Fund's counterparty to the centrally cleared swap contract. The Fund is required to deposit initial margin with the broker in the form of cash or securities in an amount that varies depending on the size and risk profile of the particular swap contract. Securities
deposited as initial margin are designated in the Consolidated Portfolio of Investments and cash deposited is recorded in the Consolidated Statement of Assets and Liabilities as margin deposits. Unlike a bilateral swap contract, for centrally cleared swap contracts, the Fund has minimal credit exposure to the counterparty because the CCP stands between the Fund and the counterparty. Swap contracts are marked-to-market daily and changes in value are recorded as unrealized appreciation (depreciation). The daily change in valuation of centrally cleared swap contracts, if any, is recorded as a receivable or payable for variation margin in the Consolidated Statement of Assets and Liabilities.
Total Return Swap Contracts
The Fund entered into total return swap contracts to manage long or short exposure to the total return on a specified reference security in return for periodic payments based on a fixed or variable interest rate, to manage long or short exposure to the total return on a basket of reference securities in return for periodic payments based on a fixed or variable interest rate, to manage long or short exposure to the total return on a reference security index in return for periodic payments based on a fixed or variable interest rate and to manage long or short exposure to a commodities index. These instruments may be used for other purposes in future periods. Total return swap contracts may be used to obtain exposure to an underlying reference security, instrument, or other asset or index or market without owning, taking physical custody of, or short selling any such security, instrument or asset in a market.
Total return swap contracts are valued daily, and the change in value is recorded as unrealized appreciation (depreciation) until the termination of the swap, at which time the Fund will realize a gain (loss). Periodic payments received (or made) by the Fund over the term of the contract are recorded as realized gains (losses).
Total return swap contracts may be subject to liquidity risk, which exists when a particular swap contract is difficult to purchase or sell. It may not be possible for the Fund to initiate a transaction or liquidate a position at an advantageous time or price, which may result in significant losses. Total return swap contracts are subject to the risk associated with the investment in the underlying reference security, instrument or asset. The risk in the case of short total return swap contracts is unlimited based on the potential for unlimited increases in the market value of the underlying reference security, instrument or asset. This risk may be offset if the Fund
Annual Report 2015
28
COLUMBIA ADAPTIVE ALTERNATIVES FUND
NOTES TO CONSOLIDATED FINANCIAL STATEMENTS (continued)
May 31, 2015
holds any of the underlying reference security, instrument or asset. The risk in the case of long total return swap contracts is limited to the current notional amount of the total return swap contract.
Total return swap contracts are also subject to the risk of the counterparty not fulfilling its obligations under the contract (counterparty credit risk). The Fund attempts to mitigate counterparty credit risk by entering into total return swap contracts only with counterparties that meet prescribed levels of creditworthiness, as determined by the Investment Manager.
Effects of Derivative Transactions in the Financial Statements
The following tables are intended to provide additional information about the effect of derivatives on the financial statements of the Fund, including: the fair value of derivatives by risk category and the location of those fair values in the Consolidated Statement of Assets and Liabilities; and the impact of derivative transactions over the period in the Consolidated Statement of Operations, including realized and unrealized gains (losses). The derivative instrument schedules following the Consolidated Portfolio of Investments present additional information regarding derivative instruments outstanding at the end of the period, if any.
The following table provides a summary of the fair value of derivative instruments (not considered to be hedging instruments for accounting disclosure purposes) at May 31, 2015:
Asset Derivatives | |
Risk Exposure
Category | | Consolidated Statement of
Assets and Liabilities Location | | Fair Value ($) | |
Equity risk | | Net assets — unrealized
appreciation on swap contracts | | | 728,351
| * | |
Liability Derivatives | |
Risk Exposure
Category | | Consolidated Statement of
Assets and Liabilities Location | | Fair Value ($) | |
Equity risk | | Net assets — unrealized
depreciation on futures contracts | | | 116,613
| * | |
Equity risk | | Net assets — unrealized
depreciation on swap contracts | | | 837,664 | * | |
Total | | | | | 954,277 | | |
*Includes cumulative appreciation (depreciation) as reported in the tables following the Consolidated Portfolio of Investments. Only the current day's variation margin is reported in receivables or payables in the Consolidated Statement of Assets and Liabilities.
The following table indicates the effect of derivative instruments (not considered to be hedging instruments for accounting disclosure purposes) in the Consolidated Statement of Operations for the period ended May 31, 2015:
Amount of Realized Gain (Loss) on Derivatives Recognized in Income | |
Risk Exposure
Category | | Futures
Contracts ($) | | Swap
Contracts ($) | | Total ($) | |
Equity risk | | | (146,456 | ) | | | (3,240,423 | ) | | | (3,386,879 | ) | |
Interest rate risk | | | (89,862 | ) | | | — | | | | (89,862 | ) | |
Total | | | (236,318 | ) | | | (3,240,423 | ) | | | (3,476,741 | ) | |
Change in Unrealized Appreciation (Depreciation) on Derivatives Recognized in Income | |
Risk Exposure
Category | | Futures
Contracts ($) | | Swap
Contracts ($) | | Total ($) | |
Equity risk | | | (116,613 | ) | | | (109,313 | ) | | | (225,926 | ) | |
The following table provides a summary of the average outstanding volume by derivative instrument for the period ended May 31, 2015:
Derivative Instrument | | Average Notional
Amounts ($)* | |
Futures contracts — Long | | | 7,139,368 | | |
Futures contracts — Short | | | 3,162,140 | | |
Derivative Instrument | | Average Unrealized
Appreciation ($)* | | Average Unrealized
Depreciation ($)* | |
Total return swap contracts | | | 761,139 | | | | (1,302,643 | ) | |
*Based on the ending monthly outstanding amounts for the period ended May 31, 2015.
Annual Report 2015
29
COLUMBIA ADAPTIVE ALTERNATIVES FUND
NOTES TO CONSOLIDATED FINANCIAL STATEMENTS (continued)
May 31, 2015
Offsetting of Assets and Liabilities
The following table presents the Fund's gross and net amount of assets and liabilities available for offset under netting arrangements as well as any related collateral received or pledged by the Fund as of May 31, 2015:
| Goldman Goldman Morgan Morgan | | Barclays ($) | | Securities Inc. ($) | | Deutsche Bank
($)(a) | | Sachs
($)(a) | | Sachs
($)(a) | | Stanley
($)(a) | | Stanley
Total ($) | |
Assets | |
OTC total return swap contracts(b) | | | 48,031 | | | | 335,114 | | | | 101,487 | | | | 157,649 | | | | 48,588 | | | | 58,316 | | | | 749,185 | | |
Liabilities | |
OTC total return swap contracts(b) | | | 40,021 | | | | 429,189 | | | | 153,349 | | | | 115,915 | | | | — | | | | 90,865 | | | | 829,339 | | |
Total Financial and
Derivative Net Assets | | | 8,010 | | | | (94,075) | | | | (51,862) | | | | 41,734 | | | | 48,588 | | | | (32,549) | | | | (80,154) | | |
Total collateral received (pledged)(c) | | | — | | | | (94,075 | ) | | | (51,862 | ) | | | — | | | | 28,000 | | | | (32,549 | ) | | | (150,486 | ) | |
Net Amount(d) | | | 8,010 | | | | — | | | | — | | | | 41,734 | | | | 20,588 | | | | — | | | | 70,332 | | |
(a) Exposure can only be netted across transactions governed under the same master agreement with the same legal entity.
(b) Over-the-Counter Swap Contracts are presented at market value plus periodic payments receivable (payable), which is comprised of unrealized appreciation, unrealized depreciation, premiums paid and premiums received.
(c) In some instances, the actual collateral received and/or pledged may be more than the amount shown due to overcollateralization.
(d) Represents the net amount due from/ (to) counterparties in the event of default.
Security Transactions
Security transactions are accounted for on the trade date. Cost is determined and gains (losses) are based upon the specific identification method for both financial statement and federal income tax purposes.
Income Recognition
Income and capital gain distributions from the Underlying Funds, if any, are recorded on the ex-dividend date.
The Fund may receive distributions from holdings in equity securities, business development companies (BDCs), ETFs, other regulated investment companies (RICs), and real estate investment trusts (REITs), which report information on the tax character of their distributions annually. These distributions are allocated to dividend income, capital gain and return of capital based on actual information reported. Return of capital is recorded as a reduction of the cost basis of securities held. If the Fund no longer owns the applicable securities, return of capital is recorded as a realized gain. With respect to REITs, to the extent actual information has not yet been reported, estimates for return of capital are made by the Fund's management. Management's estimates are subsequently adjusted when the actual character of the distributions is disclosed by the REITs, which could result in a proportionate change in return of capital to shareholders.
Corporate actions and dividend income are recorded on the ex-dividend date.
Expenses
General expenses of the Trust are allocated to the Fund and other funds of the Trust based upon relative net assets or other expense allocation methodologies determined by the nature of the expense. Expenses directly attributable to the Fund are charged to the Fund. Expenses directly attributable to a specific class of shares are charged to that share class.
Determination of Class Net Asset Value
All income, expenses (other than class-specific expenses, which are charged to that share class, as shown in the Consolidated Statement of Operations) and realized and unrealized gains (losses) are allocated to each class of the Fund on a daily basis, based on the relative net assets of each class, for purposes of determining the net asset value of each class.
Federal Income Tax Status
The Fund intends to qualify each year as a regulated investment company under Subchapter M of the Internal Revenue Code, as amended, and will distribute substantially all of its taxable income (including net short-term capital gains), if any, for its tax year, and as such will not be subject to federal income taxes. In addition, the Fund intends to distribute in each calendar year substantially all of its net investment income,
Annual Report 2015
30
COLUMBIA ADAPTIVE ALTERNATIVES FUND
NOTES TO CONSOLIDATED FINANCIAL STATEMENTS (continued)
May 31, 2015
capital gains and certain other amounts, if any, such that the Fund should not be subject to federal excise tax. Therefore, no federal income or excise tax provision is recorded.
Distributions to Shareholders
Distributions from net investment income, if any, are declared and paid annually. Net realized capital gains, if any, are distributed along with the income distribution. Income distributions and capital gain distributions are determined in accordance with federal income tax regulations, which may differ from GAAP.
Guarantees and Indemnifications
Under the Trust's organizational documents and, in some cases, by contract, its officers and trustees are indemnified against certain liabilities arising out of the performance of their duties to the Trust or its funds. In addition, certain of the Fund's contracts with its service providers contain general indemnification clauses. The Fund's maximum exposure under these arrangements is unknown since the amount of any future claims that may be made against the Fund cannot be determined, and the Fund has no historical basis for predicting the likelihood of any such claims.
Note 3. Fees and Compensation Paid to Affiliates
Investment Management Fees
Under an Investment Management Services Agreement, the Investment Manager determines which securities will be purchased, held or sold. The investment management fee is an annual fee that is equal to 1.25% of the Fund's average daily net assets, including assets invested in affiliated pooled investment vehicles (including mutual funds and exchange-traded funds); however, with respect to Fund assets invested in the affiliated underlying funds, the Investment Manager will waive the amount equal to the net management fees (investment management and administrative service fees, less reimbursements/waivers) of the affiliated underlying funds.
Effective March 4, 2015, the Investment Manager has contractually agreed to waive 0.10% of the investment management fee through March 4, 2017.
The annualized effective investment management fee rate net of fee waivers for the period ended May 31, 2015 was 1.12% of the Fund's average daily net assets.
In addition to the fees and expenses which the Fund bears directly, the Fund indirectly bears a pro rata share
of the fees and expenses of the Underlying Funds (also referred to as "acquired funds") in which the Fund invests. Because the Underlying Funds have varied expense and fee levels and the Fund may own different proportions of Underlying Funds at different times, the amount of fees and expenses incurred indirectly by the Fund will vary.
Subadvisory Agreement
The Fund's Board has approved a subadvisory agreement between the Investment Manager and Threadneedle International Limited (Threadneedle), an affiliate of the Investment Manager and wholly-owned subsidiary of Ameriprise Financial. As of May 31, 2015, Threadneedle is not providing services to the Fund pursuant to the subadvisory agreement.
Administration Fees
Under an Administrative Services Agreement, the Investment Manager also serves as the Fund Administrator. The Fund pays the Fund Administrator an annual fee for administration and accounting services equal to a percentage of the Fund's average daily net assets that declines from 0.08% to 0.05% as the Fund's net assets increase. The annualized effective administration fee rate for the period ended May 31, 2015 was 0.08% of the Fund's average daily net assets.
Other Expenses
Other expenses include offering costs which were incurred prior to the shares of the Fund being offered. Offering costs include, among other things, state registration filing fees and printing costs. The Fund amortizes offering costs over a period of 12 months from the commencement of operations.
Compensation of Board Members
Board members are compensated for their services to the Fund as disclosed in the Consolidated Statement of Operations. The Trust's independent Trustees may participate in a Deferred Compensation Plan (the Plan) which may be terminated at any time. Obligations of the Plan will be paid solely out of the Fund's assets.
Compensation of Chief Compliance Officer
The Board has appointed a Chief Compliance Officer to the Fund in accordance with federal securities regulations. The Fund is allocated a portion of the expenses associated with the Chief Compliance Officer based on relative net assets of the Trust.
Annual Report 2015
31
COLUMBIA ADAPTIVE ALTERNATIVES FUND
NOTES TO CONSOLIDATED FINANCIAL STATEMENTS (continued)
May 31, 2015
Transfer Agency Fees
Under a Transfer and Dividend Disbursing Agent Agreement, Columbia Management Investment Services Corp. (the Transfer Agent), an affiliate of the Investment Manager and a wholly-owned subsidiary of Ameriprise Financial, is responsible for providing transfer agency services to the Fund. The Transfer Agent has contracted with Boston Financial Data Services (BFDS) to serve as sub-transfer agent.
The Transfer Agent receives a monthly transfer agency fee based on the number or the average value of accounts, depending on the type of account. In addition, the Transfer Agent also receives sub-transfer agency fees based on a percentage of the average aggregate value of the Fund's shares maintained in omnibus accounts (other than omnibus accounts for which American Enterprise Investment Services Inc. is the broker of record or accounts where the beneficial shareholder is a customer of Ameriprise Financial Services, Inc., for which the Transfer Agent receives a per account fee). The Transfer Agent pays the fees of BFDS for services as sub-transfer agent and is not entitled to reimbursement for such fees from the Fund (with the exception of out-of-pocket fees).
The Transfer Agent also receives compensation from the Fund for various shareholder services and reimbursements for certain out-of-pocket fees. Total transfer agency fees for Class R5 shares are subject to an annual limitation of not more than 0.05% of the average daily net assets attributable Class R5 shares. Class I and Class Y shares do not pay transfer agency fees.
For the period ended May 31, 2015, the Fund's annualized effective transfer agency fee rates as a percentage of average daily net assets of each class were as follows:
Class A | | | 0.25 | % | |
Class C | | | 0.25 | | |
Class R | | | 0.25 | | |
Class R4 | | | 0.23 | | |
Class R5 | | | 0.05 | | |
Class W | | | 0.25 | | |
Class Z | | | 0.23 | | |
An annual minimum account balance fee of $20 may apply to certain accounts with a value below the applicable share class's initial minimum investment requirements to reduce the impact of small accounts on transfer agency fees. These minimum account balance fees are remitted to the Fund and recorded as part of expense reductions in
the Consolidated Statement of Operations. For the period ended May 31, 2015, no minimum account balance fees were charged by the Fund.
Distribution and Service Fees
The Fund has an agreement with Columbia Management Investment Distributors, Inc. (the Distributor), an affiliate of the Investment Manager and a wholly-owned subsidiary of Ameriprise Financial, for distribution and shareholder services. The Board has approved, and the Fund has adopted, distribution and shareholder service plans (the Plans) applicable to certain share classes, which set the distribution and service fees for the Fund. These fees are calculated daily and are intended to compensate the Distributor and/or eligible selling and/or servicing agents for selling shares of the Fund and providing services to investors.
Under the Plans, the Fund pays a monthly service fee to the Distributor at the maximum annual rate of 0.25% of the average daily net assets attributable to Class A, Class C and Class W shares of the Fund. Also under the Plans, the Fund pays a monthly distribution fee to the Distributor at the maximum annual rates of 0.75%, 0.50% and 0.25% of the average daily net assets attributable to Class C, Class R and Class W shares, respectively.
Although the Fund may pay a distribution fee up to 0.25% of the Fund's average daily net assets attributable to Class W shares and a service fee of up to 0.25% of the Fund's average daily net assets attributable to Class W shares, the aggregate fee shall not exceed 0.25% of the Fund's average daily net assets attributable to Class W shares.
Sales Charges
Sales charges, including front-end charges and CDSCs, received by the Distributor for distributing Fund shares were $9,733 for Class A shares for the period ended May 31, 2015.
Expenses Waived/Reimbursed by the Investment Manager and its Affiliates
The Investment Manager and certain of its affiliates have contractually agreed to waive fees and/or reimburse expenses (excluding certain fees and expenses described below) for the periods disclosed below, unless sooner terminated at the sole discretion of the Board, so that the Fund's net operating expenses, including indirect expenses of the Underlying Funds and after giving effect to fees waived/expenses reimbursed and any balance credits and/or overdraft charges from the Fund's
Annual Report 2015
32
COLUMBIA ADAPTIVE ALTERNATIVES FUND
NOTES TO CONSOLIDATED FINANCIAL STATEMENTS (continued)
May 31, 2015
custodian, do not exceed the following annual rates as a percentage of the class' average daily net assets:
| | | March 4, 2015
through
September 30, 2016 | | Prior to
March 4, 2015 | |
Class A | | | 2.85 | % | | | 2.95 | % | |
Class C | | | 3.60 | | | | 3.70 | | |
Class I | | | 2.45 | | | | 2.55 | | |
Class R | | | 3.10 | | | | 3.20 | | |
Class R4 | | | 2.60 | | | | 2.70 | | |
Class R5 | | | 2.50 | | | | 2.60 | | |
Class W | | | 2.85 | | | | 2.95 | | |
Class Y | | | 2.45 | | | | 2.55 | | |
Class Z | | | 2.60 | | | | 2.70 | | |
Under the agreement governing these fee waivers and/or expense reimbursement arrangements, the following fees and expenses are excluded from the waiver/reimbursement commitment, and therefore will be paid by the Fund, if applicable: taxes (including foreign transaction taxes), transaction costs and brokerage commissions, costs related to any securities lending program, dividend and interest expenses associated with securities sold short by the Fund and Blackstone Alternative Multi-Strategy Fund (an unaffiliated mutual fund indirectly invested in by the Fund), inverse floater program fees and expenses, transaction charges and interest on borrowed money, interest, extraordinary expenses and any other expenses the exclusion of which is specifically approved by the Board. This agreement may be modified or amended only with approval from all parties. Any fees waived and/or expenses reimbursed under the expense reimbursement arrangements described above are not recoverable by the Investment Manager or its affiliates in future periods. The annual rates in the table above include the contractual waiver of 0.10% of the investment management fee through September 30, 2016, as described above.
Note 4. Federal Tax Information
The timing and character of income and capital gain distributions are determined in accordance with income tax regulations, which may differ from GAAP because of temporary or permanent book to tax differences.
At May 31, 2015, these differences are primarily due to differing treatment for capital loss carryforwards, deferral/reversal of wash sale losses, Trustees' deferred compensation, foreign currency transactions, net operating loss reclassification, non-deductible expenses, derivative investments, investments in commodity
subsidiary and swap investments. To the extent these differences are permanent, reclassifications are made among the components of the Fund's net assets in the Consolidated Statement of Assets and Liabilities. Temporary differences do not require reclassifications. In the Consolidated Statement of Assets and Liabilities the following reclassifications were made:
Undistributed net investment income | | $ | 708,050 | | |
Accumulated net realized loss | | | 2,247,172 | | |
Paid-in capital | | | (2,955,222 | ) | |
Net investment income (loss) and net realized gains (losses), as disclosed in the Consolidated Statement of Operations, and net assets were not affected by this reclassification.
For the period ended May 31, 2015, there were no distributions.
At May 31, 2015, the components of distributable earnings on a tax basis were as follows:
Capital loss carryforwards | | $ | (1,159,101 | ) | |
Net unrealized appreciation | | | 1,527,749 | | |
At May 31, 2015, the cost of investments for federal income tax purposes was $174,313,813 and the aggregate gross unrealized appreciation and depreciation based on that cost was:
Unrealized appreciation | | $ | 1,929,106 | | |
Unrealized depreciation | | | (401,357 | ) | |
Net unrealized appreciation | | | 1,527,749 | | |
The following capital loss carryforwards, determined at May 31, 2015, may be available to reduce taxable income arising from future net realized gains on investments, if any, to the extent permitted by the Internal Revenue Code:
Year of Expiration | | Amount ($) | |
No expiration — short-term | | | 964,482 | | |
No expiration — long-term | | | 194,619 | | |
Total | | | 1,159,101 | | |
Management of the Fund has concluded that there are no significant uncertain tax positions in the Fund that would require recognition in the financial statements. However, management's conclusion may be subject to review and adjustment at a later date based on factors including, but not limited to, new tax laws, regulations, and administrative interpretations (including relevant court decisions). Generally, the Fund's federal tax returns
Annual Report 2015
33
COLUMBIA ADAPTIVE ALTERNATIVES FUND
NOTES TO CONSOLIDATED FINANCIAL STATEMENTS (continued)
May 31, 2015
for the prior three fiscal years remain subject to examination by the Internal Revenue Service.
Note 5. Portfolio Information
The cost of purchases and proceeds from sales of securities, excluding short-term investments and derivatives, if any, aggregated to $154,695,242 and $30,649,914, respectively, for the period ended May 31, 2015. The amount of purchase and sale activity impacts the portfolio turnover rate reported in the Consolidated Financial Highlights.
Note 6. Affiliated Money Market Fund
The Fund invests in Columbia Short-Term Cash Fund, an affiliated money market fund established for the exclusive use by the Fund and other affiliated funds. The income earned by the Fund from such investments is included as Dividends — affiliated issuers in the Consolidated Statement of Operations. As an investing fund, the Fund indirectly bears its proportionate share of the expenses of Columbia Short-Term Cash Fund.
Note 7. Shareholder Concentration
At May 31, 2015, affiliated shareholders of record owned 99.5% of the outstanding shares of the Fund in one or more accounts. Subscription and redemption activity by concentrated accounts may have a significant effect on the operations of the Fund.
Note 8. Line of Credit
The Fund has entered into a revolving credit facility with a syndicate of banks led by JPMorgan Chase Bank, N.A. whereby the Fund may borrow for the temporary funding of shareholder redemptions or for other temporary or emergency purposes. The credit facility agreement, which is a collective agreement between the Fund and certain other funds managed by the Investment Manager, severally and not jointly, permits collective borrowings up to $550 million. Interest is charged to each participating fund based on its borrowings at a rate equal to the higher of (i) the overnight federal funds rate plus 1.00% or (ii) the one-month LIBOR rate plus 1.00%. Each borrowing under the credit facility matures no later than 60 days after the date of borrowing. The Fund also pays a commitment fee equal to its pro rata share of the amount of the credit facility at a rate of 0.075% per annum. The commitment fee is included in other expenses in the Consolidated Statement of Operations.
The Fund had no borrowings during the period ended May 31, 2015.
Note 9. Significant Risks
Non-Diversification Risk
A non-diversified fund is permitted to invest a greater percentage of its total assets in fewer issuers than a diversified fund. The Fund may, therefore, have a greater risk of loss from a few issuers than a similar fund that invests more broadly.
Derivatives Risk
Losses involving derivative instruments may be substantial, because a relatively small price movement in the underlying security(ies) commodity, currency or index or other instrument or asset may result in a substantial loss for the Fund. In addition to the potential for increased losses, the use of derivative instruments may lead to increased volatility within the Fund. Derivatives will typically increase the Fund's exposure to principal risks to which it is otherwise exposed, and may expose the Fund to additional risks, including correlation risk, counterparty risk, hedging risk, leverage risk and liquidity risk.
Note 10. Subsequent Events
Management has evaluated the events and transactions that have occurred through the date the financial statements were issued and noted no items requiring adjustment of the financial statements or additional disclosure.
Note 11. Information Regarding Pending and Settled Legal Proceedings
In December 2005, without admitting or denying the allegations, American Express Financial Corporation (AEFC, which is now known as Ameriprise Financial, Inc. (Ameriprise Financial)) entered into settlement agreements with the Securities and Exchange Commission (SEC) and Minnesota Department of Commerce (MDOC) related to market timing activities. As a result, AEFC was censured and ordered to cease and desist from committing or causing any violations of certain provisions of the Investment Advisers Act of 1940, the Investment Company Act of 1940, and various Minnesota laws. AEFC agreed to pay disgorgement of $10 million and civil money penalties of $7 million. AEFC also agreed to retain an independent distribution consultant to assist in developing a plan for distribution of all disgorgement and civil penalties ordered by the SEC in accordance with various undertakings detailed at www.sec.gov/litigation/admin/ia-2451.pdf. Ameriprise Financial and its affiliates have cooperated with the SEC
Annual Report 2015
34
COLUMBIA ADAPTIVE ALTERNATIVES FUND
NOTES TO CONSOLIDATED FINANCIAL STATEMENTS (continued)
May 31, 2015
and the MDOC in these legal proceedings, and have made regular reports to the Funds' Boards of Trustees.
Ameriprise Financial and certain of its affiliates have historically been involved in a number of legal, arbitration and regulatory proceedings, including routine litigation, class actions, and governmental actions, concerning matters arising in connection with the conduct of their business activities. Ameriprise Financial believes that the Funds are not currently the subject of, and that neither Ameriprise Financial nor any of its affiliates are the subject of, any pending legal, arbitration or regulatory proceedings that are likely to have a material adverse effect on the Funds or the ability of Ameriprise Financial or its affiliates to perform under their contracts with the Funds. Ameriprise Financial is required to make quarterly (10-Q), annual (10-K) and, as necessary, 8-K filings with the SEC on legal and regulatory matters that relate to Ameriprise Financial and its affiliates. Copies of these filings may be obtained by accessing the SEC website at www.sec.gov.
There can be no assurance that these matters, or the adverse publicity associated with them, will not result in increased fund redemptions, reduced sale of fund shares or other adverse consequences to the Funds. Further, although we believe proceedings are not likely to have a material adverse effect on the Funds or the ability of Ameriprise Financial or its affiliates to perform under their contracts with the Funds, these proceedings are subject to uncertainties and, as such, we are unable to estimate the possible loss or range of loss that may result. An adverse outcome in one or more of these proceedings could result in adverse judgments, settlements, fines, penalties or other relief that could have a material adverse effect on the consolidated financial condition or results of operations of Ameriprise Financial.
Annual Report 2015
35
COLUMBIA ADAPTIVE ALTERNATIVES FUND
REPORT OF INDEPENDENT REGISTERED PUBLIC ACCOUNTING FIRM
To the Trustees of Columbia Funds Series Trust I and the Shareholders of
Columbia Adaptive Alternatives Fund
In our opinion, the accompanying consolidated statement of assets and liabilities, including the consolidated portfolio of investments, and the related consolidated statements of operations and of changes in net assets and the consolidated financial highlights present fairly, in all material respects, the financial position of Columbia Adaptive Alternatives Fund (the "Fund," a series of Columbia Funds Series Trust I) at May 31, 2015, and the results of its operations, the changes in its net assets and the financial highlights for the period January 28, 2015 (commencement of operations) through May 31, 2015, in conformity with accounting principles generally accepted in the United States of America. These financial statements and financial highlights (hereafter referred to as "financial statements") are the responsibility of the Fund's management. Our responsibility is to express an opinion on these financial statements based on our audit. We conducted our audit of these financial statements in accordance with the standards of the Public Company Accounting Oversight Board (United States). Those standards require that we plan and perform the audit to obtain reasonable assurance about whether the financial statements are free of material misstatement. An audit includes examining, on a test basis, evidence supporting the amounts and disclosures in the financial statements, assessing the accounting principles used and significant estimates made by management, and evaluating the overall financial statement presentation. We believe that our audit, which included confirmation of securities at May 31, 2015 by correspondence with the custodian, brokers and transfer agent, and the application of alternative auditing procedures where such confirmations had not been received, provides a reasonable basis for our opinion.
PricewaterhouseCoopers LLP
Minneapolis, MN
July 30, 2015
Annual Report 2015
36
COLUMBIA ADAPTIVE ALTERNATIVES FUND
The Trustees serve terms of indefinite duration. The names and birth years of the Trustees and Officers of the Funds in Columbia Funds Series Trust I, the year each was first elected or appointed to office, their principal business occupations during at least the last five years, the number of Funds overseen by each Trustee and other directorships they hold are shown below. Each officer listed below serves as an officer of each Fund in Columbia Funds Series Trust I. The mailing address of each Trustee is: c/o Columbia Management Investment Advisers, LLC, 225 Franklin Street, Mail Drop BX32 05288, Boston, MA 02110.
Independent Trustees
Name, Year of Birth
and Position Held
with the Trust | | Year First
Appointed or
Elected as
Trustee to any
Fund Currently
in the Columbia
Funds Complex
or a Predecessor
Thereof | | Principal Occupation(s)
during the Past Five Years | | Number
of Funds
in the
Columbia
Funds
Complex
Overseen | | Other Directorships
Held by Trustee During
the Past Five Years | |
Douglas A. Hacker
(Born 1955)
Trustee and Chairman
of the Board | | | 1996 | | | Independent business executive since May 2006; Executive Vice President — Strategy of United Airlines from December 2002 to May 2006; President of UAL Loyalty Services (airline marketing company) from September 2001 to December 2002; Executive Vice President and Chief Financial Officer of United Airlines from July 1999 to September 2001 | | | 60 | | | Spartan Nash Company, (food distributor); Nash Finch Company (food distributor) from 2005 to 2013; Aircastle Limited (aircraft leasing); SeaCube Container Leasing Ltd. (container leasing) from 2010 to 2013; and Travelport Worldwide Limited (travel information technology) | |
Janet Langford Carrig
(Born 1957)
Trustee | | | 1996 | | | Senior Vice President, General Counsel and Corporate Secretary, ConocoPhillips (integrated energy company) since September 2007; Deputy General Counsel — Corporate Legal Services, ConocoPhillips from August 2006 to August 2007; Partner, Zelle, Hofmann, Voelbel, Mason & Gette LLP (law firm) from March 2005 to July 2006; Adjunct Professor of Law, Northwestern University from September 2004 to June 2006; Director, UAL Corporation (airline) from February 2006 to July 2006; Chief Administrative Officer and Senior Vice President, Kmart Holding Corporation (consumer goods) from September 2003 to March 2004 | | | 60 | | | None | |
Nancy T. Lukitsh
(Born 1956)
Trustee | | | 2011 | | | Senior Vice President, Partner and Director of Marketing, Wellington Management Company, LLP (investment adviser) from 1997 to 2010; Chair, Wellington Management Investment Portfolios (commingled non-U.S. investment pools) from 2007 to 2010; Director, Wellington Trust Company, NA and other Wellington affiliates from 1997 to 2010 | | | 60 | | | None | |
William E. Mayer
(Born 1940)
Trustee | | | 1991 | | | Partner, Park Avenue Equity Partners (private equity) since February 1999 | | | 60 | | | DynaVox Inc. (speech creation); Lee Enterprises (print media); WR Hambrecht + Co. (financial service provider) from 2000 to 2012; BlackRock Kelso Capital Corporation (investment company); and Premier, Inc. (healthcare) | |
Annual Report 2015
37
COLUMBIA ADAPTIVE ALTERNATIVES FUND
TRUSTEES AND OFFICERS (continued)
Independent Trustees (continued)
Name, Year of Birth
and Position Held
with the Trust | | Year First
Appointed or
Elected as
Trustee to any
Fund Currently
in the Columbia
Funds Complex
or a Predecessor
Thereof | | Principal Occupation(s)
during the Past Five Years | | Number
of Funds
in the
Columbia
Funds
Complex
Overseen | | Other Directorships
Held by Trustee During
the Past Five Years | |
David M. Moffett
(Born 1952)
Trustee | | | 2011 | | | Retired. Consultant to Bridgewater and Associates; Chief Executive Officer, Federal Home Loan Mortgage Corporation, from 2008 to 2009; Senior Adviser, Global Financial Services Group, Carlyle Group, Inc., from 2007 to 2008; Vice Chairman and Chief Financial Officer, U.S. Bancorp, from 1993 to 2007 | | | 60 | | | CIT Group Inc. (commercial and consumer finance); eBay Inc. (online trading community); MBIA Inc. (financial service provider); E.W. Scripps Co. (print and television media); Building Materials Holding Corp. (building materials and construction services); Genworth Financial, Inc. (financial and insurance products and services); and University of Oklahoma Foundation | |
Charles R. Nelson
(Born 1942)
Trustee | | | 1981 | | | Retired. Professor Emeritus, University of Washington since 2011; Professor of Economics, University of Washington from 1976 to 2011; Ford and Louisa Van Voorhis Professor of Political Economy, University of Washington from 1993 to 2011; Adjunct Professor of Statistics, University of Washington from 1980 to 2011; Associate Editor, Journal of Money, Credit and Banking from September 1993 to 2008; consultant on econometric and statistical matters | | | 60 | | | None | |
John J. Neuhauser
(Born 1943)
Trustee | | | 1984 | | | President, Saint Michael's College since August 2007; Director or Trustee of several non-profit organizations, including Fletcher Allen Health Care, Inc.; Academic Vice President and Dean of Faculties, Boston College from August 1999 to October 2005; University Professor, Boston College from November 2005 to August 2007 | | | 60 | | | Liberty All-Star Equity Fund and Liberty All-Star Growth Fund (closed-end funds) | |
Patrick J. Simpson
(Born 1944)
Trustee | | | 2000 | | | Partner, Perkins Coie LLP (law firm) | | | 60 | | | None | |
Anne-Lee Verville
(Born 1945)
Trustee | | | 1998 | | | Retired. General Manager, Global Education Industry from 1994 to 1997, President — Application Systems Division from 1991 to 1994, Chief Financial Officer — US Marketing & Services from 1988 to 1991, and Chief Information Officer from 1987 to 1988, IBM Corporation (computer and technology) | | | 60 | | | Enesco Group, Inc. (producer of giftware and home and garden decor products) from 2001 to 2006 | |
Annual Report 2015
38
COLUMBIA ADAPTIVE ALTERNATIVES FUND
TRUSTEES AND OFFICERS (continued)
Interested Trustee Affiliate with Investment Manager*
Name, Year of Birth
and Position Held
with the Trust | | Year First
Appointed or
Elected as
Trustee to any
Fund Currently
in the Columbia
Funds Complex
or a Predecessor
Thereof | | Principal Occupation(s)
during the Past Five Years | | Number
of Funds
in the
Columbia
Funds
Complex
Overseen | | Other Directorships
Held by Trustee During
the Past Five Years | |
William F. Truscott
(Born 1960)
Trustee | | | 2012 | | | Chairman of the Board and President, Columbia Management Investment Advisers, LLC since May 2010 and February 2012, respectively (previously President and Chief Investment Officer, 2001-April 2010); Chief Executive Officer, Global Asset Management, Ameriprise Financial, Inc. since September 2012 (previously Chief Executive Officer, U.S. Asset Management & President, Annuities, May 2010-September 2012 and President — U.S. Asset Management and Chief Investment Officer, 2005-April 2010); Director and Chief Executive Officer, Columbia Management Investment Distributors, Inc. since May 2010 and February 2012, respectively (previously Chairman of the Board and Chief Executive Officer, 2006-April 2010); Chairman of the Board and Chief Executive Officer, RiverSource Distributors, Inc. since 2006; Director, Threadneedle Asset Management Holdings, SARL since 2014; President and Chief Executive Officer, Ameriprise Certificate Company, 2006-August 2012 | | | 187 | | | Chairman of the Board, Columbia Management Investment Advisers, LLC since May 2010; Director, Columbia Management Investment Distributors, Inc. since May 2010; Director, Ameriprise Certificate Company, 2006 to January 2013 | |
* Interested person (as defined under the 1940 Act) by reason of being an officer, director, security holder and/or employee of the Investment Manager or Ameriprise Financial.
The Statement of Additional Information has additional information about the Fund's Board members and is available, without charge, upon request by calling 800.345.6611; contacting your financial intermediary; or visiting columbiathreadneedle.com/us.
The Board has appointed officers who are responsible for day-to-day business decisions based on policies it has established. The officers serve at the pleasure of the Board. In addition to Mr. Truscott, who is Senior Vice President, the Funds' other officers are:
Fund Officers
Name,
Address and
Year of Birth | | Position and Year
First Appointed to
Position for any Fund
in the Columbia
Funds Complex or a
Predecessor Thereof | | Principal Occupation(s) During Past Five Years | |
Christopher O. Petersen
5228 Ameriprise
Financial Center
Minneapolis, MN 55474
Born 1970 | | President and Principal Executive Officer (2015) | | Vice President and Lead Chief Counsel, Ameriprise Financial, Inc. since January 2015 (previously, Vice President and Chief Counsel January 2010-December 2014; and Vice President and Group Counsel or Counsel 2004- January 2010); officer of Columbia Funds and affiliated funds since 2007. | |
Michael G. Clarke
225 Franklin Street
Boston, MA 02110
Born 1969 | | Treasurer (2011) and Chief Financial Officer (2009) | | Vice President — Mutual Fund Administration, Columbia Management Investment Advisers, LLC, since May 2010; Managing Director of Fund Administration, Columbia Management Advisors, LLC, September 2004-April 2010; senior officer of Columbia Funds and affiliated funds since 2002. | |
Annual Report 2015
39
COLUMBIA ADAPTIVE ALTERNATIVES FUND
TRUSTEES AND OFFICERS (continued)
Fund Officers (continued)
Name,
Address and
Year of Birth | | Position and Year
First Appointed to
Position for any Fund
in the Columbia
Funds Complex or a
Predecessor Thereof | | Principal Occupation(s) During Past Five Years | |
Paul B. Goucher
100 Park Avenue
New York, NY 10017
Born 1968 | | Senior Vice President (2011), Chief Legal Officer (2015) and Assistant Secretary (2008) | | Vice President and Lead Chief Counsel, Ameriprise Financial, Inc. since November 2008 and January 2013, respectively (previously Chief Counsel, January 2010-January 2013 and Group Counsel, November 2008-January 2010). | |
Thomas P. McGuire
225 Franklin Street
Boston, MA 02110
Born 1972 | | Vice President and Chief Compliance Officer (2012) | | Vice President — Asset Management Compliance, Ameriprise Financial, Inc., since May 2010; Chief Compliance Officer, Ameriprise Certificate Company since September 2010; Compliance Executive, Bank of America, 2005-April 2010. | |
Colin Moore
225 Franklin Street
Boston, MA 02110
Born 1958 | | Senior Vice President (2010) | | Executive Vice President and Global Chief Investment Officer, Ameriprise Financial, Inc., since July 2013; Director and Global Chief Investment Officer, Columbia Management Investment Advisers, LLC since May 2010; Manager, Managing Director and Chief Investment Officer, Columbia Management Advisors, LLC, 2007-April 2010. | |
Michael E. DeFao
225 Franklin Street
Boston, MA 02110
Born 1968 | | Vice President (2011) and Assistant Secretary (2010) | | Vice President and Chief Counsel, Ameriprise Financial, Inc. since May 2010; Associate General Counsel, Bank of America, 2005-April 2010. | |
Joseph F. DiMaria
225 Franklin Street
Boston, MA 02110
Born 1968 | | Vice President (2011), Assistant Treasurer (2012) and Chief Accounting Officer (2008) | | Vice President — Mutual Fund Treasurer, Columbia Management Investment Advisers, LLC since May 2010; Director of Fund Administration, Columbia Management Advisors, LLC, 2006-April 2010. | |
Amy Johnson
5228 Ameriprise
Financial Center
Minneapolis, MN 55474
Born 1965 | | Vice President (2006) | | Managing Director and Chief Operating Officer, Columbia Management Investment Advisers, LLC since May 2010 (previously Chief Administrative Officer, 2009-April 2010, and Vice President — Asset Management and Trust Company Services, 2006-2009). | |
Lyn Kephart-Strong
5228 Ameriprise
Financial Center
Minneapolis, MN 55474
Born 1960 | | Vice President (2015) | | President, Columbia Management Investment Services Corp. since October 2014; Vice President & Resolution Officer, Ameriprise Trust Company since August 2009; President, RiverSource Service Corporation 2004-2010. | |
Ryan C. Larrenaga
225 Franklin Street
Boston, MA 02110
Born 1970 | | Vice President and Secretary (2015) | | Vice President and Group Counsel, Ameriprise Financial, Inc. since August 2011 (previously, Counsel from May 2010 to August 2011); Assistant General Counsel, Bank of America, 2005-April 2010; officer of Columbia Funds and affiliated funds since 2005. | |
Annual Report 2015
40
COLUMBIA ADAPTIVE ALTERNATIVES FUND
BOARD CONSIDERATION AND APPROVAL OF ADVISORY AGREEMENT AND SUBADVISORY AGREEMENT
On December 19, 2014, the Board of Trustees (the "Board") and the Trustees who are not interested persons (as defined in the Investment Company Act of 1940) of the Trust (the "Independent Trustees") unanimously approved the Investment Management Services Agreement (the "Advisory Agreement") with Columbia Management Investment Advisers, LLC (the "Investment Manager") and the Subadvisory Agreement (the "Subadvisory Agreement") between the Investment Manager and Threadneedle International Limited (the "Subadviser") with respect to Columbia Adaptive Alternatives Fund (the "Fund"), a series of the Trust. As detailed below, the Advisory Fees and Expenses Committee (the "Committee") and the Board met to review and discuss, both among themselves and with the management team of the Investment Manager, materials provided by the Investment Manager before determining to approve the Advisory Agreement and the Subadvisory Agreement (collectively, the "Agreements").
In connection with their deliberations regarding the proposed Agreements, the Committee and the Board evaluated materials requested from the Investment Manager regarding the Fund and the Agreements, and discussed these materials, as well as other materials provided by the Investment Manager and others, including materials provided in connection with its most recent and its upcoming annual approval of the continuation of the advisory agreements with respect to other series of the Trust, with representatives of the Investment Manager at the Committee meeting held on December 18, 2014, and at the Board meetings held on October 21, 2014 and December 19, 2014. The Committee and the Board also consulted with Fund counsel and with the Independent Trustees' independent legal counsel, who advised on various matters with respect to the Committee's and the Board's considerations and otherwise assisted the Committee and the Board in their deliberations. On December 19, 2014, the Board, including the Independent Trustees, voting separately, approved the Agreements for the Fund.
The Committee and the Board considered all information that they, their legal counsel, or the Investment Manager believed reasonably necessary to evaluate and to determine whether to approve the Agreements. The information and factors considered by the Committee and the Board in recommending for approval or approving the Agreements for the Fund included the following:
• Information regarding the reputation, financial strength, regulatory history and resources of the Investment Manager and the Subadviser, including information regarding senior management, portfolio managers and other personnel proposed to provide investment management, administrative and other services to the Fund;
• Information regarding the capabilities of the Investment Manager and the Subadviser with respect to compliance monitoring services, including an assessment of the Investment Manager's and the Subadviser's compliance system by the Fund's Chief Compliance Officer;
• The terms and conditions of the Agreements;
• The terms and conditions of other agreements and arrangements with affiliates of the Investment Manager relating to the operations of the Fund, including the Administrative Services Agreement, the Distribution Agreement and the Transfer and Dividend Disbursing Agent Agreement;
• The Investment Manager's agreement to contractually limit or cap total operating expenses for the Fund through September 30, 2016 so that total operating expenses (excluding certain fees and expenses, such as transaction costs and certain other investment related expenses, interest, taxes, acquired fund fees and expenses representing dividend and/or interest expenses associated with securities sold short by the Fund and any fund in which the Fund invests indirectly, and extraordinary expenses) would not exceed an annual rate of 2.95% for Class A, 3.70% for Class C, 2.55% for Class I, 3.20% for Class R, 2.70% for Class R4, 2.60% for Class R5, 2.95% for Class W, 2.55% for Class Y and 2.70% for Class Z;*
*On March 4, 2015, the Investment Manager agreed to lower the contractual expense limitation of the Fund by an additional 0.10% for each class (e.g. the limitation would be 2.85% for Class A shares).
• Descriptions of various functions performed by the Investment Manager and the Subadviser under the Agreements, including portfolio management and portfolio trading practices; and
Annual Report 2015
41
COLUMBIA ADAPTIVE ALTERNATIVES FUND
BOARD CONSIDERATION AND APPROVAL OF ADVISORY AGREEMENT AND SUBADVISORY AGREEMENT (continued)
• Information regarding the investment management fees and other expenses of the Fund relative to those of comparable funds both as determined by the Investment Manager and as determined by the independent third-party data provider to be in the same peer group or universe of funds.
Nature, Extent and Quality of Services to be Provided under the Agreements
The Committee and the Board considered the nature, extent and quality of services to be provided to the Fund by the Investment Manager and the Subadviser and the Investment Manager's affiliates under the Agreements and under separate agreements for the provision of transfer agency and administrative services, and the similar type of services currently provided by the Investment Manager to other funds in the fund complex, and the resources dedicated to the Fund and the other Columbia Funds by the Investment Manager and the Subadviser and the Investment Manager's affiliates. The Committee and the Board considered, among other things, the Investment Manager's ability to attract, motivate and retain highly qualified research, advisory and supervisory investment professionals (including personnel and other resources, compensation programs for personnel involved in fund management, reputation and other attributes), the portfolio management services provided by those investment professionals, and the quality of the Investment Manager's investment research capabilities and trade execution services. The Committee and the Board also considered the potential benefits to shareholders of investing in a mutual fund that is part of a fund complex offering exposure to a variety of asset classes and investment disciplines and providing a variety of fund and shareholder services.
The Committee and the Board also considered the professional experience and qualifications of the senior personnel of the Investment Manager, including the proposed portfolio managers for the Fund, which included consideration of the Investment Manager's experience with similarly-structured funds. The Committee and the Board noted the compliance programs of and the compliance-related resources provided to the Fund by the Investment Manager and its affiliates, and considered the Investment Manager's ability to provide administrative services to the Fund pursuant to a separate Administrative Services Agreement, including the Investment Manager's ability to coordinate the activities of the Fund's other service providers. The Committee and the Board also noted that the Board had approved the Subadviser's code of ethics and compliance program, and that the Chief Compliance Officer of the Funds monitors the code of ethics and compliance program.
After reviewing these and related factors, the Committee and the Board concluded, within the context of its overall conclusions, that the expected nature, extent and quality of the services to be provided to the Fund under the Agreements supported the approval of the Agreements.
Investment Advisory Fee Rates and Other Expenses
The Committee and the Board considered the advisory fees to be charged to the Fund under the Agreements as well as the total expenses expected to be incurred by the Fund. In assessing the reasonableness of the proposed fees under the Agreements, the Committee and the Board considered, among other information, the Fund's proposed advisory fee and its expected total expense ratio as a percentage of average daily net assets. The Board also took into account the proposed fee waiver and expense limitation arrangements that the Investment Manager would observe during the Fund's first year, and the advisory fees and total expense ratios of comparable funds identified by the independent third-party data provider for purposes of expense comparison.
After reviewing these and related factors, the Committee and the Board concluded, within the context of its overall conclusions, that the advisory fee rates and expenses of the Fund supported the approval of the Agreements.
Costs of Services to be Provided and Profitability
The Committee and the Board considered information provided by the Investment Manager with respect to estimated costs of services and profitability, and expected to consider the costs of services and the profitability of the Investment Manager and its affiliates in connection with the Committee's and the Board's next review and consideration of the continuation of the Agreements. The Committee and the Board also considered court cases in which adviser profitability was an issue in whole or in part, the expected expense ratio of the Fund, and the
Annual Report 2015
42
COLUMBIA ADAPTIVE ALTERNATIVES FUND
BOARD CONSIDERATION AND APPROVAL OF ADVISORY AGREEMENT AND SUBADVISORY AGREEMENT (continued)
implementation of expense limitations with respect to the Fund. The Committee and the Board also considered information provided by the Investment Manager regarding its financial condition.
After reviewing these and related factors, the Committee and the Board concluded, within the context of its overall conclusions, that the anticipated costs of services to be provided and the expected profitability to the Investment Manager and its affiliates from their relationships with the Fund supported the approval of the Agreements.
Investment Performance
Because the Fund had not yet commenced operations, the Committee and the Board did not have investment performance to compare to the returns of a group of comparable mutual funds. However, the Committee and the Board expected to consider, in connection with their next review and consideration of the continuation of the Agreements, the investment performance of the Fund in relation to the annualized return for various time periods of both a group of comparable funds, as determined by the independent third-party data provider, and a benchmark.
The Committee and the Board also considered the Investment Manager's performance and reputation generally, the Investment Manager's historical responsiveness to Board concerns about performance, and the Investment Manager's willingness to take steps intended to improve performance. After reviewing these and related factors, the Committee and the Board concluded, within the context of its overall conclusions, that the performance of the Investment Manager and the Subadviser supported approval of the Agreements.
Economies of Scale
The Committee and the Board considered the potential existence of economies of scale in the provision by the Investment Manager of services to the Fund, to groups of related funds, and to the Investment Manager's investment advisory clients as a whole, and whether those economies of scale were expected to be shared with the Fund through breakpoints in the proposed administrative services fees or other means, such as expense limitation arrangements and additional investments by the Investment Manager in investment, trading and compliance resources.
After reviewing these and related factors, the Board concluded, within the context of its overall conclusions, that the extent to which any economies of scale were expected to be shared with the Fund supported the approval of the Agreements.
Other Benefits to the Investment Manager
The Committee and the Board received and considered information regarding "fall-out" or ancillary benefits to be received by the Investment Manager and its affiliates as a result of their relationships with the Fund, such as the engagement of the Investment Manager to provide administrative services to the Fund and the engagement of the Investment Manager's affiliates to provide distribution and transfer agency services to the Fund. The Committee and the Board considered that the Fund's distributor retains a portion of the distribution fees from the Fund. The Committee and the Board also considered the benefits of research made available to the Investment Manager by reason of brokerage commissions to be generated by the Fund's securities transactions, and reviewed information about the Investment Manager's practices with respect to allocating portfolio transactions for brokerage and research services. The Committee and the Board considered the possible conflicts of interest associated with certain fall-out or other ancillary benefits and the reporting, disclosure and other processes that are in place to address such possible conflicts of interest. The Committee and the Board recognized that the Investment Manager's profitability would be somewhat lower without these benefits.
Conclusion
The Committee and the Board reviewed all of the above considerations in reaching its decision to recommend or approve the proposed Agreements. In their deliberations, the Trustees did not identify any particular information that was all-important or controlling, and individual Trustees may have attributed different weights to the various factors. Based on its evaluation of all factors that they deemed to be material, including those factors described
Annual Report 2015
43
COLUMBIA ADAPTIVE ALTERNATIVES FUND
BOARD CONSIDERATION AND APPROVAL OF ADVISORY AGREEMENT AND SUBADVISORY AGREEMENT (continued)
above, and assisted by the advice of independent legal counsel, the Board, including the Independent Trustees, voting separately, approved the Agreements.
Annual Report 2015
44
COLUMBIA ADAPTIVE ALTERNATIVES FUND
IMPORTANT INFORMATION ABOUT THIS REPORT
Each fund mails one shareholder report to each shareholder address. If you would like more than one report, please call shareholder services at 800.345.6611 and additional reports will be sent to you.
The policy of the Board is to vote the proxies of the companies in which each fund holds investments consistent with the procedures as stated in the Statement of Additional Information (SAI). You may obtain a copy of the SAI without charge by calling 800.345.6611; contacting your financial intermediary; visiting columbiathreadneedle.com/us; or searching the website of the Securities and Exchange Commission (SEC) at sec.gov. Information regarding how each fund voted proxies relating to portfolio securities is filed with the SEC by August 31st for the most recent 12-month period ending June 30th of that year, and is available without charge by visiting columbiathreadneedle.com/us, or searching the website of the SEC at sec.gov.
Each fund files a complete schedule of portfolio holdings with the SEC for the first and third quarters of each fiscal year on Form N-Q. Each fund's Form N-Q is available on the SEC's website at sec.gov and may be reviewed and copied at the SEC's Public Reference Room in Washington, D.C. Information on the operation of the Public Reference Room may be obtained by calling 800.SEC.0330. Each fund's complete schedule of portfolio holdings, as filed on Form N-Q, can also be obtained without charge, upon request, by calling 800.345.6611.
You may obtain the current net asset value (NAV) of Fund shares at no cost by calling 800.345.6611 or by sending an e-mail to serviceinquiries@columbiathreadneedle.com.
Annual Report 2015
45
Columbia Adaptive Alternatives Fund
P.O. Box 8081
Boston, MA 02266-8081

This information is for use with concurrent or prior delivery of a fund prospectus. Please read and consider the investment objectives, risks, charges and expenses for any fund carefully before investing. For a prospectus and summary prospectus, which contains this and other important information about the Fund, go to columbiathreadneedle.com/us. The Fund is distributed by Columbia Management Investment Distributors, Inc., member FINRA, and managed by Columbia Management Investment Advisers, LLC.
Columbia Threadneedle Investments (Columbia Threadneedle) is the global brand name of the Columbia and Threadneedle group of companies.
All rights reserved. Columbia Management Investment Distributors, Inc., 225 Franklin Street, Boston, MA 02110-2804
© 2015 Columbia Management Investment Advisers, LLC.
columbiathreadneedle.com/us
ANN259_05_E01_(07/15)

ANNUAL REPORT
May 31, 2015

COLUMBIA ADAPTIVE RISK ALLOCATION FUND

 Dear Shareholder,
In a world that is changing faster than ever before, investors want asset managers who offer a global perspective while generating strong and sustainable returns. To that end, Columbia Management, in conjunction with its U.K.-based affiliate, Threadneedle Investments, has rebranded to Columbia Threadneedle Investments. The new global brand represents the combined capabilities, resources and reach of the global group, offering investors access to the best of both firms.
With a presence in 18 countries and more than 450 investment professionals*, our collective perspective and world view as Columbia Threadneedle Investments gives us deeper insight into what might affect the real-life financial outcomes clients are seeking. Putting our views into a global context enables us to build richer perspectives and create the right solutions, and provides us with enhanced capabilities to deliver consistent investment performance, which may ultimately lead to better investor outcomes.
As a result of the rebrand, you will begin to see our new logo and colors reflected in printed materials, such as this shareholder report, as well as on our new website — columbiathreadneedle.com/us. We encourage you to visit us online and view a new video on the "About Us" tab that speaks to the strength of the firm.
While we are introducing a new brand, in many ways, the investment company you know well has not changed. The following remain in effect:
n Fund and strategy names
n Established investment teams, philosophies and processes
n Account services, features, servicing phone numbers and mailing addresses
n Columbia Management Investment Distributors as distributor and Columbia Management Investment Advisers as investment adviser
We recognize that the money we manage represents the hard work and savings of people like you, and that everyone has different ambitions and different definitions of success. Investors have varying goals — funding their children's education, enjoying their retirement, putting money aside for unexpected events, and more. Whatever your ambitions, we believe our wide range of investment products and solutions can help give you confidence that you will reach your goals.
The world is constantly changing, but our priority remains the same: to help you secure your finances, meet your goals and achieve success. Thank you for your continued investment with us. Our service representatives are available at 800.345.6611 to help with any questions.
Sincerely,

Christopher O. Petersen
President, Columbia Funds
Investors should consider the investment objectives, risks, charges and expenses of a mutual fund carefully before investing. For a free prospectus and summary prospectus, which contains this and other important information about a fund, visit columbiathreadneedle.com/us. The prospectus should be read carefully before investing.
* Source: Ameriprise as of December 1, 2014
Columbia Funds are distributed by Columbia Management Investment Distributors, Inc., member FINRA, and managed by Columbia Management Investment Advisers, LLC.
© 2015 Columbia Management Investment Advisers, LLC. All rights reserved.
COLUMBIA ADAPTIVE RISK ALLOCATION FUND
Performance Overview | | | 2 | | |
Manager Discussion of Fund Performance | | | 4 | | |
Understanding Your Fund's Expenses | | | 7 | | |
Portfolio of Investments | | | 8 | | |
Statement of Assets and Liabilities | | | 17 | | |
Statement of Operations | | | 19 | | |
Statement of Changes in Net Assets | | | 20 | | |
Financial Highlights | | | 22 | | |
Notes to Financial Statements | | | 31 | | |
Report of Independent Registered
Public Accounting Firm | | | 47 | | |
Federal Income Tax Information | | | 48 | | |
Trustees and Officers | | | 49 | | |
Important Information About This Report | | | 53 | | |
Fund Investment Manager
Columbia Management Investment
Advisers, LLC
225 Franklin Street
Boston, MA 02110
Fund Distributor
Columbia Management Investment
Distributors, Inc.
225 Franklin Street
Boston, MA 02110
Fund Transfer Agent
Columbia Management Investment
Services Corp.
P.O. Box 8081
Boston, MA 02266-8081
For more information about any of the funds, please visit columbiathreadneedle.com/us or call 800.345.6611. Customer Service Representatives are available to answer your questions Monday through Friday from 8 a.m. to 7 p.m. Eastern time.
The views expressed in this report reflect the current views of the respective parties. These views are not guarantees of future performance and involve certain risks, uncertainties and assumptions that are difficult to predict, so actual outcomes and results may differ significantly from the views expressed. These views are subject to change at any time based upon economic, market or other conditions and the respective parties disclaim any responsibility to update such views. These views may not be relied on as investment advice and, because investment decisions for a Columbia fund are based on numerous factors, may not be relied on as an indication of trading intent on behalf of any particular Columbia fund. References to specific securities should not be construed as a recommendation or investment advice.
COLUMBIA ADAPTIVE RISK ALLOCATION FUND
Performance Summary
n Columbia Adaptive Risk Allocation Fund (the Fund) Class A shares returned 1.13% excluding sales charges for the 12-month period that ended May 31, 2015.
n The Fund outperformed its New Blended Benchmark, which returned 0.68% over the same time period.
n The Citi Three-Month U.S. Treasury Bill Index returned 0.02% during the same 12 months.
n The Fund takes a risk-based approach to allocating assets across four primary segments of global capital markets: equities, interest rates, inflation hedging and spread assets.
Average Annual Total Returns (%) (for period ended May 31, 2015)
| | | Inception | | 1 Year | | Life | |
Class A | | 06/19/12 | | | | | | | | | |
Excluding sales charges | | | | | | | 1.13 | | | | 4.16 | | |
Including sales charges | | | | | | | -4.64 | | | | 2.09 | | |
Class C | | 06/19/12 | | | | | | | | | |
Excluding sales charges | | | | | | | 0.48 | | | | 3.36 | | |
Including sales charges | | | | | | | -0.51 | | | | 3.36 | | |
Class K | | 06/19/12 | | | 1.25 | | | | 4.23 | | |
Class R | | 06/19/12 | | | 0.87 | | | | 3.89 | | |
Class R4* | | 10/01/14 | | | 1.26 | | | | 4.21 | | |
Class R5 | | 06/19/12 | | | 1.48 | | | | 4.49 | | |
Class W | | 06/19/12 | | | 1.13 | | | | 4.20 | | |
Class Y* | | 10/01/14 | | | 1.37 | | | | 4.24 | | |
Class Z | | 06/19/12 | | | 1.37 | | | | 4.42 | | |
New Blended Benchmark | | | | | | | 0.68 | | | | 8.38 | | |
Citi Three-Month U.S. Treasury Bill Index | | | | | | | 0.02 | | | | 0.05 | | |
Returns for Class A are shown with and without the maximum initial sales charge of 5.75%. Returns for Class C are shown with and without the 1.00% CDSC for the first year only. The Fund's other classes are not subject to sales charges and have limited eligibility. Please see the Fund's prospectus for details. Performance for different share classes will vary based on differences in sales charges and fees associated with each class. All results shown assume reinvestment of distributions during the period. Returns do not reflect the deduction of taxes that a shareholder may pay on Fund distributions or on the redemption of Fund shares. Performance results reflect the effect of any fee waivers or reimbursements of Fund expenses by Columbia Management Investment Advisers, LLC and/or any of its affiliates. Absent these fee waivers or expense reimbursement arrangements, performance results would have been lower.
The performance information shown represents past performance and is not a guarantee of future results. The investment return and principal value of your investment will fluctuate so that your shares, when redeemed, may be worth more or less than their original cost. Current performance may be lower or higher than the performance information shown. You may obtain performance information current to the most recent month-end by contacting your financial intermediary, visiting columbiathreadneedle.com/us or calling 800.345.6611.
*The returns shown for periods prior to the share class inception date (including returns for the Life of the Fund, if shown, which are since Fund inception) include the returns of the Fund's oldest share class. These returns are adjusted to reflect any higher class-related operating expenses of the newer share classes, as applicable. Please visit columbiathreadneedle.com/us/investment-products/mutual-funds/appendedperformance for more information.
The New Blended Benchmark, a weighted custom composite established by the Investment Manager, consists of a 60% weighting of the MSCI ACWI All Cap Index (Net) and a 40% weighting of the Barclays Global Aggregate Bond Index.
The Old Blended Benchmark, a weighted custom composite established by the Investment Manager, consists of a 60% weighting of the S&P 500 Index and a 40% weighting of the Barclays U.S. Aggregate Bond Index. The S&P 500 Index tracks the performance of 500 widely held, large capitalization U.S. stocks, and the Barclays U.S. Aggregate Bond Index is a market value-weighted index that tracks the daily price, coupon, pay-downs and total return performance of fixed-rate, publicly placed, dollar-denominated and non-convertible investment grade debt issues with at least $250 million par amount outstanding and with at least one year to final maturity.
Effective October 1, 2014, the Fund compares its performance to that of the New Blended Index. The investment manager believes that the New Blended Index provides a more appropriate basis for comparing the Fund's performance because it is more reflective of the global positioning of the portfolio. Information on both Blended benchmarks will be included for a one-year transition period. Thereafter, only the New Blended Index will be included.
The Citi Three-Month U.S. Treasury Bill Index is an unmanaged index that represents the performance of three-month Treasury bills and reflects reinvestment of all distributions and changes in market prices.
Indices are not available for investment, are not professionally managed and do not reflect sales charges, fees, brokerage commissions, taxes or other expenses of investing. Securities in the Fund may not match those in an index.
Annual Report 2015
2
COLUMBIA ADAPTIVE RISK ALLOCATION FUND
PERFORMANCE OVERVIEW (continued)
Performance of a Hypothetical $10,000 Investment (June 19, 2012 – May 31, 2015)
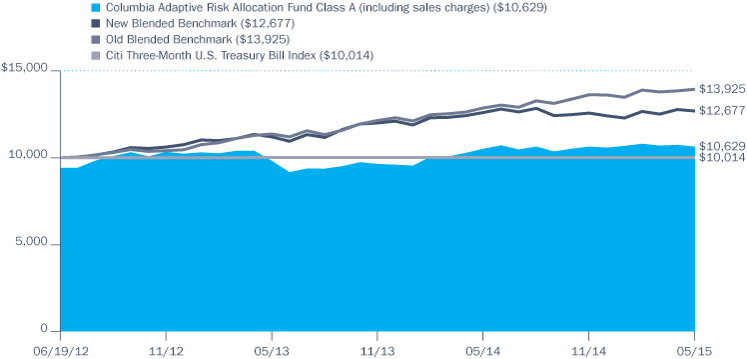
The chart above shows the change in value of a hypothetical $10,000 investment in Class A shares of Columbia Adaptive Risk Allocation Fund during the stated time period, and does not reflect the deduction of taxes that a shareholder may pay on Fund distributions or on the redemption of Fund shares.
Annual Report 2015
3
COLUMBIA ADAPTIVE RISK ALLOCATION FUND
MANAGER DISCUSSION OF FUND PERFORMANCE
Portfolio Management
Jeffrey Knight, CFA
Orhan Imer, Ph.D., CFA
Toby Nangle
Beth Vanney, CFA
Portfolio Breakdown (%)
(at May 31, 2015) | |
Alternative Investment Funds | | | 7.0 | | |
Equity Funds | | | 8.0 | | |
Exchange-Traded Funds | | | 4.1 | | |
Exchange-Traded Notes | | | 3.5 | | |
Foreign Government
Obligations | | | 1.9 | | |
Inflation-Indexed Bonds | | | 29.3 | | |
Money Market Funds(a) | | | 35.4 | | |
Residential Mortgage-Backed
Securities — Agency | | | 8.4 | | |
U.S. Treasury Obligations | | | 2.4 | | |
Total | | | 100.0 | | |
Percentages indicated are based upon total investments. The Fund's portfolio composition is subject to change.
(a) Includes investments in Money Market Funds (amounting to $160.9 million) which have been segregated to cover obligations related to the Fund's investment in derivatives which provides exposure to multiple markets. For a description of the Fund's investments in derivatives, see Investments in Derivatives following the Portfolio of Investments, and Note 2 to the financial statements.
For the 12-month period that ended May 31, 2015, the Fund's Class A shares returned 1.13% excluding sales charges. The Fund outperformed its New Blended Benchmark, which returned 0.68% over the same period. The Citi Three-Month U.S. Treasury Bill Index returned 0.02% during the annual period. The Fund takes a risk-based approach to allocating assets across four primary segments of global capital markets.
Market State Policy Implementation Contributed Most Positively
The 12-month period ended May 31, 2015 was the first full year of managing the Fund under its revised strategy that went into effect on March 17, 2014. The Fund uses a global allocation strategy and takes a flexible risk-based approach by allocating to four broad global asset classes: equities, interest rates, inflation hedging and spread assets. The Fund employs a market state classification process, based on multiple market-based indicators, to identify four distinct market environments where a policy or benchmark portfolio has been designed to optimize the risk/return profile of that environment. In most market environments, a global risk-balanced approach may be the best choice of allocation. However, other market states represent conditions when risk balancing may be less than ideal, and the corresponding policy portfolios can deviate from a risk-balanced state to maximize risk-adjusted return potential for that environment. This could be to protect capital in a weakening market or to more fully participate when market conditions are considered favorable. Once a policy is established, the Fund then employs a tactical overlay process driven by the Columbia Global Asset Allocation Team's Investment Strategy Outlook.
During the annual period, the determination of the market state and subsequent allocation to the specific policy portfolio was the principal driver of the Fund's outperformance. The ability to change the policy portfolio was particularly helpful in September and December 2014, months in which many asset classes simultaneously declined. The Fund's market state going into these months was "capital preservation," a state in which exposure to risk assets is significantly reduced. This reduction in overall portfolio risk proved beneficial. Additionally, for much of the annual period, the Fund benefited from a tactical overweight to U.S. equities, driven by our view that domestic stocks would likely outperform international stocks. The Fund was also able to add value through currency management, specifically by hedging foreign currency exposure. Partially offsetting these positive contributors were positions in commodities. Commodity prices were hit hard during the annual period, and the Fund's exposure to this asset class detracted from its relative performance.
New Benchmark Reflects Global Positioning
As indicated above, the Fund changed its positioning as market states shifted during the annual period in an effort to seek favorable risk-adjusted returns. Also, effective October 1, 2014, the Fund changed its Blended Benchmark to be more reflective of the global positioning of the portfolio. With these changes, the Fund's portfolio turnover rate for the 12-month period was 256%.
Annual Report 2015
4
COLUMBIA ADAPTIVE RISK ALLOCATION FUND
MANAGER DISCUSSION OF FUND PERFORMANCE (continued)
Derivative Positions
During the annual period, the Fund used futures (including bond, currency, equity, index and interest rate futures), currency forwards, options and swaps (including credit default, credit default swap index, interest rate and total return swaps). The Fund used derivatives for both hedging and non-hedging purposes, including, for example, seeking to enhance returns or as a substitute for a position in an underlying asset. The Fund also used derivatives in an effort to manage its overall risk exposure and to obtain leverage (market exposure in excess of the Fund's assets) within certain asset classes and during certain market environments in seeking to maintain attractive expected risk-adjusted returns while adhering to the Fund's risk allocation framework. While the Fund's use of forward foreign currency exchange contracts and options had a negative effect, this was more than offset by the significant contribution from the Fund's futures and swap contracts.
Looking Ahead
During the annual period, the unanimity of central bank policy gave way to a desynchronized reality. This decoupling of global monetary policy became a prominent influence on asset class outcomes, with the effects on currencies and equity markets particularly dramatic. For example, the euro fell more than 20% vs. the U.S. dollar during the annual period. In turn, international equities rose in local currency terms but posted a negative return in U.S. dollar terms, making the outperformance by U.S. equity markets particularly notable to U.S. investors. Within fixed income, areas considered to have the safest of return streams, such as U.S. Treasuries, performed best, while corporate credit generated positive but more modest returns. In all, whereas in 2014 it paid to largely skew one's investment portfolio heavily toward the strongly performing U.S. equity markets, a more balanced and globally diversified portfolio rewarded investors during the first months of 2015.
At the end of the annual period, we continued to favor equities over bonds. Within the equity asset class, we favored developed market equities. Looking ahead to the balance of 2015, we currently expect the collective guess by investors regarding the timing of the Federal Reserve's (Fed's) first interest rate hike to be a driving force of market behavior. The Fed, by its own description, embraces no clear plan for timing. Rather, the Fed seems to be watching the breadth of economic data to discern the moment when a hike can be undertaken with confidence. With some reprieve for U.S. dollar-sensitive investments toward the end of the annual period, including commodities and emerging market assets, we continue to believe at this time that a balanced portfolio that includes global diversification should fare better than it otherwise did in calendar year 2014. Government bond yields remain quite low in much of the developed world, and we currently intend to maintain an underweight position in fixed income. While conditions at the end of the annual period made an imminent bear market in bonds unlikely, we continue to find the risk vs. return trade-off in longer-term U.S. Treasuries to be poor at this time, as we believe only a modest rise in rates would be required to generate negative total returns.
Maintaining a long-term perspective, we believe the Fund's adaptive approach to improving upon the challenges of a traditional 60/40 balanced portfolio makes it an attractive diversifier within portfolios maintaining a traditional allocation to both stocks and bonds.
Market Exposure By Asset Class
Categories (%)(a)
(at May 31, 2015) | |
Equity Assets | | | 50.3 | | |
Inflation-Hedging Assets | | | 44.6 | | |
Spread Assets | | | 59.2 | | |
Interest Rate Assets | | | 11.5 | | |
(a) Percentages are based upon net assets. The percentages do not equal 100% due to the effects of leverage within the Fund's portfolio. Leverage exists when the Fund purchases or sells an instrument or enters into a transaction without investing cash in an amount equal to the full economic exposure of the instrument or transaction. The Fund's portfolio composition and its market exposure are subject to change. Inflation-Hedging Assets may include, but are not limited to, direct or indirect investments in commodity-related investments, including certain types of commodities-linked derivatives and notes, and U.S. and non-U.S. inflation-linked bonds. Interest Rate Assets generally include fixed-income securities issued by U.S. and non-U.S. governments. Spread Assets generally include any other fixed-income securities.
Annual Report 2015
5
COLUMBIA ADAPTIVE RISK ALLOCATION FUND
MANAGER DISCUSSION OF FUND PERFORMANCE (continued)
Investment Risks
Market risk may affect a single issuer, sector of the economy, industry or the market as a whole. The Fund's investment in other funds subjects it to the investment performance (positive or negative), risks and expenses of these underlying funds. Asset allocation does not assure a profit or protect against loss. Investing in derivatives is a specialized activity that involves special risks that subject the fund to significant loss potential, including when used as leverage, and may result in greater fluctuation in fund value. Commodity investments may be affected by the overall market and industry- and commodity-specific factors, and may be more volatile and less liquid than other investments. Short positions (where the underlying asset is not owned) can create unlimited risk. International investing involves certain risks and volatility due to potential political, economic or currency instabilities and different financial and accounting standards. Risks are enhanced for emerging market issuers. Investment in or exposure to foreign currencies subjects the fund to currency fluctuation and risk of loss. Investments in small- and mid-cap companies involve risks and volatility greater than investments in larger, more established companies. Fixed-income securities present issuer default risk. A rise in interest rates may result in a price decline of fixed-income instruments held by the Fund, negatively impacting its performance and NAV. Falling rates may result in the Fund investing in lower-yielding debt instruments, lowering the Fund's income and yield. These risks may be heightened for longer maturity and duration securities. Interest payments on inflation-protected securities may be more volatile than interest paid on ordinary bonds. In periods of deflation, these securities provide no income. As a non-diversified fund, fewer investments could have a greater affect on performance. Investments selected using quantitative methods may perform differently from the market as a whole and may not enable the Fund to achieve its objective. Market or other (e.g., interest rate) environments may adversely affect the liquidity of fund investments, negatively impacting their price. Generally, the less liquid the market at the time the fund sells a holding, the greater the risk of loss or decline of value to the Fund. See the Fund's prospectus for information on these and other risks.
Annual Report 2015
6
COLUMBIA ADAPTIVE RISK ALLOCATION FUND
UNDERSTANDING YOUR FUND'S EXPENSES
(Unaudited)
As an investor, you incur two types of costs. There are transaction costs, which generally include sales charges on purchases and may include redemption fees. There are also ongoing costs, which generally include management fees, distribution and/or service fees, and other fund expenses. The following information is intended to help you understand your ongoing costs (in dollars) of investing in the Fund and to help you compare these costs with the ongoing costs of investing in other mutual funds.
Analyzing Your Fund's Expenses
To illustrate these ongoing costs, we have provided examples and calculated the expenses paid by investors in each share class of the Fund during the period. The actual and hypothetical information in the table is based on an initial investment of $1,000 at the beginning of the period indicated and held for the entire period. Expense information is calculated two ways and each method provides you with different information. The amount listed in the "Actual" column is calculated using the Fund's actual operating expenses and total return for the period. You may use the Actual information, together with the amount invested, to estimate the expenses that you paid over the period. Simply divide your account value by $1,000 (for example, an $8,600 account value divided by $1,000 = 8.6), then multiply the results by the expenses paid during the period under the "Actual" column. The amount listed in the "Hypothetical" column assumes a 5% annual rate of return before expenses (which is not the Fund's actual return) and then applies the Fund's actual expense ratio for the period to the hypothetical return. You should not use the hypothetical account values and expenses to estimate either your actual account balance at the end of the period or the expenses you paid during the period. See "Compare With Other Funds" below for details on how to use the hypothetical data.
Compare With Other Funds
Since all mutual funds are required to include the same hypothetical calculations about expenses in shareholder reports, you can use this information to compare the ongoing cost of investing in the Fund with other funds. To do so, compare the hypothetical example with the 5% hypothetical examples that appear in the shareholder reports of other funds. As you compare hypothetical examples of other funds, it is important to note that hypothetical examples are meant to highlight the ongoing costs of investing in a fund only and do not reflect any transaction costs, such as sales charges, or redemption or exchange fees. Therefore, the hypothetical calculations are useful in comparing ongoing costs only, and will not help you determine the relative total costs of owning different funds. If transaction costs were included in these calculations, your costs would be higher.
December 1, 2014 – May 31, 2015
| | | Account Value at the Beginning
of the Period ($) | | Account Value at the End of the
Period ($) | | Expenses Paid During the
Period ($) | | Fund's Annualized
Expense Ratio (%) | |
| | | Actual | | Hypothetical | | Actual | | Hypothetical | | Actual | | Hypothetical | | Actual | |
Class A | | | 1,000.00 | | | | 1,000.00 | | | | 999.60 | | | | 1,019.60 | | | | 5.33 | | | | 5.39 | | | | 1.07 | | |
Class C | | | 1,000.00 | | | | 1,000.00 | | | | 995.90 | | | | 1,015.86 | | | | 9.06 | | | | 9.15 | | | | 1.82 | | |
Class K | | | 1,000.00 | | | | 1,000.00 | | | | 999.80 | | | | 1,020.09 | | | | 4.84 | | | | 4.89 | | | | 0.97 | | |
Class R | | | 1,000.00 | | | | 1,000.00 | | | | 998.00 | | | | 1,018.35 | | | | 6.58 | | | | 6.64 | | | | 1.32 | | |
Class R4 | | | 1,000.00 | | | | 1,000.00 | | | | 1,001.00 | | | | 1,020.84 | | | | 4.09 | | | | 4.13 | | | | 0.82 | | |
Class R5 | | | 1,000.00 | | | | 1,000.00 | | | | 1,001.20 | | | | 1,021.44 | | | | 3.49 | | | | 3.53 | | | | 0.70 | | |
Class W | | | 1,000.00 | | | | 1,000.00 | | | | 999.60 | | | | 1,019.55 | | | | 5.38 | | | | 5.44 | | | | 1.08 | | |
Class Y | | | 1,000.00 | | | | 1,000.00 | | | | 1,001.20 | | | | 1,021.64 | | | | 3.29 | | | | 3.33 | | | | 0.66 | | |
Class Z | | | 1,000.00 | | | | 1,000.00 | | | | 1,001.00 | | | | 1,020.84 | | | | 4.09 | | | | 4.13 | | | | 0.82 | | |
Expenses paid during the period are equal to the annualized expense ratio for each class as indicated above, multiplied by the average account value over the period and then multiplied by the number of days in the Fund's most recent fiscal half year and divided by 365.
Expenses do not include fees and expenses incurred indirectly by the Fund from its investment in underlying funds, including affiliated and non-affiliated pooled investment vehicles, such as mutual funds and exchange-traded funds.
Had Columbia Management Investment Advisers, LLC and/or certain of its affiliates not waived/reimbursed certain fees and expenses, account value at the end of the period would have been reduced.
Annual Report 2015
7
COLUMBIA ADAPTIVE RISK ALLOCATION FUND
PORTFOLIO OF INVESTMENTS
May 31, 2015
(Percentages represent value of investments compared to net assets)
Equity Funds 8.4%
| | | Shares | | Value ($) | |
REAL ESTATE 8.4% | |
Columbia Real Estate Equity Fund,
Class I Shares(a) | | | 2,312,361 | | | | 36,188,453 | | |
Total Equity Funds
(Cost: $37,009,010) | | | | | 36,188,453 | | |
Alternative Investment Funds 7.4%
Columbia Commodity Strategy Fund,
Class I Shares(a)(b) | | | 4,981,629 | | | | 31,982,061 | | |
Total Alternative Investment Funds
(Cost: $31,846,778) | | | | | 31,982,061 | | |
Residential Mortgage-Backed Securities —
Agency 8.9%
Issuer | | Coupon
Rate | | Principal
Amount ($) | | Value ($) | |
Federal National Mortgage Association(c)
06/16/30 | | | 2.500 | % | | | 6,250,000 | | | | 6,388,875 | | |
06/11/45 | | | 3.500 | % | | | 6,250,000 | | | | 6,532,714 | | |
06/11/45 | | | 4.000 | % | | | 5,000,000 | | | | 5,339,357 | | |
06/11/45 | | | 5.000 | % | | | 8,250,000 | | | | 9,176,836 | | |
Government National Mortgage Association(c)
06/18/45 | | | 3.500 | % | | | 10,250,000 | | | | 10,752,457 | | |
Total Residential Mortgage-Backed
Securities — Agency
(Cost: $38,129,883) | | | | | | | 38,190,239 | | |
U.S. Treasury Obligations 2.5%
U.S. Treasury
04/30/16 | | | 0.375 | % | | | 2,400,000 | | | | 2,402,061 | | |
10/31/18 | | | 1.750 | % | | | 1,460,000 | | | | 1,492,508 | | |
12/31/19 | | | 1.125 | % | | | 2,185,000 | | | | 2,157,347 | | |
01/31/20 | | | 1.375 | % | | | 720,000 | | | | 718,594 | | |
02/15/21 | | | 3.625 | % | | | 720,000 | | | | 797,962 | | |
02/28/21 | | | 2.000 | % | | | 350,000 | | | | 356,699 | | |
08/15/23 | | | 2.500 | % | | | 150,000 | | | | 156,176 | | |
08/15/26 | | | 6.750 | % | | | 350,000 | | | | 509,606 | | |
08/15/27 | | | 6.375 | % | | | 300,000 | | | | 432,187 | | |
11/15/40 | | | 4.250 | % | | | 350,000 | | | | 441,766 | | |
02/15/42 | | | 3.125 | % | | | 700,000 | | | | 736,805 | | |
08/15/43 | | | 3.625 | % | | | 550,000 | | | | 633,059 | | |
Total U.S. Treasury Obligations
(Cost: $10,654,374) | | | | | | | 10,834,770 | | |
Foreign Government Obligations(d) 1.9%
Issuer | | Coupon
Rate | | Principal
Amount ($) | | Value ($) | |
BELGIUM 0.3% | |
Belgium Government Bond(e)
06/22/24 | | | 2.600 | % | | EUR | 1,000,000 | | | | 1,281,936 | | |
JAPAN 0.6% | |
Japan Government 30-Year Bond
09/20/44 | | | 1.700 | % | | JPY | 300,000,000 | | | | 2,545,773 | | |
MEXICO 0.3% | |
Mexican Bonos
06/10/21 | | | 6.500 | % | | MXN | 15,000,000 | | | | 1,015,304 | | |
SPAIN 0.8% | |
Spain Government Bond(e)
01/31/22 | | | 5.850 | % | | EUR | 2,500,000 | | | | 3,540,425 | | |
Total Foreign Government Obligations
(Cost: $8,767,263) | | | | | | | 8,383,438 | | |
Inflation-Indexed Bonds(d) 30.9%
FRANCE 3.9% | |
France Government Bond OAT
07/25/24 | | | 0.250 | % | | EUR | 12,678,750 | | | | 15,127,275 | | |
France Government Bond OAT
07/25/40 | | | 1.800 | % | | EUR | 1,143,530 | | | | 1,855,744 | | |
Total | | | | | | | 16,983,019 | | |
GERMANY 1.4% | |
Bundesrepublik Deutschland Bundesobligation
Inflation-Linked Bond
04/15/18 | | | 0.750 | % | | EUR | 4,244,600 | | | | 4,848,427 | | |
Deutsche Bundesrepublik Inflation-Linked Bond
04/15/23 | | | 0.100 | % | | EUR | 1,033,870 | | | | 1,221,910 | | |
Total | | | | | | | 6,070,337 | | |
ITALY 1.4% | |
Italy Buoni Poliennali Del Tesoro
09/15/19 | | | 2.350 | % | | EUR | 1,050,044 | | | | 1,268,237 | | |
09/15/21 | | | 2.100 | % | | EUR | 1,011,455 | | | | 1,228,338 | | |
09/15/26 | | | 3.100 | % | | EUR | 508,272 | | | | 687,969 | | |
09/15/41 | | | 2.550 | % | | EUR | 2,142,559 | | | | 2,865,120 | | |
Total | | | | | | | 6,049,664 | | |
NEW ZEALAND 0.6% | |
New Zealand Government Bond
09/20/25 | | | 2.000 | % | | NZD | 3,610,280 | | | | 2,543,587 | | |
The accompanying Notes to Financial Statements are an integral part of this statement.
Annual Report 2015
8
COLUMBIA ADAPTIVE RISK ALLOCATION FUND
PORTFOLIO OF INVESTMENTS (continued)
May 31, 2015
Inflation-Indexed Bonds(d) (continued)
Issuer | | Coupon
Rate | | Principal
Amount ($) | | Value ($) | |
SWEDEN 0.2% | |
Sweden Inflation-Linked Bond
06/01/25 | | | 1.000 | % | | SEK | 4,734,469 | | | | 652,492 | | |
UNITED KINGDOM 6.5% | |
United Kingdom Gilt Inflation-Linked Bond
03/22/29 | | | 0.125 | % | | GBP | 4,330,920 | | | | 7,539,195 | | |
03/22/34 | | | 0.750 | % | | GBP | 1,494,356 | | | | 3,027,163 | | |
03/22/44 | | | 0.125 | % | | GBP | 6,892,535 | | | | 13,831,609 | | |
03/22/52 | | | 0.250 | % | | GBP | 1,593,030 | | | | 3,606,925 | | |
Total | | | | | | | 28,004,892 | | |
UNITED STATES 16.9% | |
U.S. Treasury Inflation-Indexed Bond
04/15/19 | | | 0.125 | % | | | 14,102,060 | | | | 14,333,418 | | |
01/15/21 | | | 1.125 | % | | | 12,408,270 | | | | 13,208,991 | | |
01/15/22 | | | 0.125 | % | | | 11,992,545 | | | | 11,998,170 | | |
01/15/24 | | | 0.625 | % | | | 9,104,040 | | | | 9,389,961 | | |
01/15/25 | | | 2.375 | % | | | 4,382,560 | | | | 5,247,774 | | |
01/15/27 | | | 2.375 | % | | | 3,745,280 | | | | 4,561,343 | | |
01/15/29 | | | 2.500 | % | | | 659,604 | | | | 829,246 | | |
02/15/43 | | | 0.625 | % | | | 6,159,660 | | | | 5,707,794 | | |
02/15/45 | | | 0.750 | % | | | 8,018,560 | | | | 7,671,509 | | |
Total | | | | | | | 72,948,206 | | |
Total Inflation-Indexed Bonds
(Cost: $135,466,513) | | | | | | | 133,252,197 | | |
Exchange-Traded Funds 4.4%
| | | Shares | | Value ($) | |
iShares MSCI Canada ETF | | | 262,970 | | | | 7,305,307 | | |
iShares US Real Estate ETF | | | 153,136 | | | | 11,520,421 | | |
Total Exchange-Traded Funds
(Cost: $19,292,551) | | | | | 18,825,728 | | |
Exchange-Traded Notes 3.7% | |
iPath Bloomberg Commodity Index
Total Return ETN(b) | | | 554,595 | | | | 15,844,779 | | |
Total Exchange-Traded Notes
(Cost: $16,263,625) | | | | | 15,844,779 | | |
Money Market Funds 37.3% | |
Columbia Short-Term Cash Fund,
0.114%(a)(f) | | | 160,877,769 | | | | 160,877,769 | | |
Total Money Market Funds
(Cost: $160,877,769) | | | | | 160,877,769 | | |
Total Investments
(Cost: $458,307,766) | | | | | 454,379,434 | | |
Other Assets & Liabilities, Net | | | | | (23,173,868 | ) | |
Net Assets | | | | | 431,205,566 | | |
At May 31, 2015, cash totaling $18,104,464 was pledged as collateral.
Investments in Derivatives
Forward Foreign Currency Exchange Contracts Open at May 31, 2015
Counterparty | | Exchange Date | | Currency to
be Delivered | | Currency to
be Received | | Unrealized
Appreciation ($) | | Unrealized
Depreciation ($) | |
Barclays Bank PLC
| | 6/5/2015
| | | 1,500,000
EUR | | | | 1,686,495
USD | | | | 38,983
| | | | —
| | |
Barclays Bank PLC
| | 6/5/2015
| | | 250,000
EUR | | | | 280,600
USD | | | | 6,014
| | | | —
| | |
Barclays Bank PLC
| | 6/5/2015
| | | 4,126,000
EUR | | | | 4,521,704
USD | | | | —
| | | | (10,061
| ) | |
Barclays Bank PLC
| | 6/5/2015
| | | 6,386,918
USD | | | | 5,876,000
EUR | | | | 66,945
| | | | —
| | |
Barclays Bank PLC
| | 7/9/2015
| | | 7,500,000
EUR | | | | 8,232,000
USD | | | | —
| | | | (9,366
| ) | |
Barclays Bank PLC
| | 7/9/2015
| | | 14,045,000
EUR | | | | 15,415,792
USD | | | | —
| | | | (17,540
| ) | |
Barclays Bank PLC
| | 7/9/2015
| | | 4,523,870
USD | | | | 4,126,000
EUR | | | | 9,980
| | | | —
| | |
Citigroup Global Markets Inc.
| | 6/5/2015
| | | 200,000
AUD | | | | 157,880
USD | | | | 4,994
| | | | —
| | |
The accompanying Notes to Financial Statements are an integral part of this statement.
Annual Report 2015
9
COLUMBIA ADAPTIVE RISK ALLOCATION FUND
PORTFOLIO OF INVESTMENTS (continued)
May 31, 2015
Forward Foreign Currency Exchange Contracts Open at May 31, 2015 (continued)
Counterparty | | Exchange Date | | Currency to
be Delivered | | Currency to
be Received | | Unrealized
Appreciation ($) | | Unrealized
Depreciation ($) | |
Citigroup Global Markets Inc.
| | 6/5/2015
| | | 500,000
AUD | | | | 382,187
USD | | | | —
| | | | (27
| ) | |
Citigroup Global Markets Inc.
| | 6/5/2015
| | | 547,236
USD | | | | 700,000
AUD | | | | —
| | | | (12,136
| ) | |
Citigroup Global Markets Inc.
| | 7/9/2015
| | | 381,509
USD | | | | 500,000
AUD | | | | —
| | | | (3
| ) | |
HSBC Securities (USA), Inc.
| | 6/5/2015
| | | 500,000
CAD | | | | 414,170
USD | | | | 12,132
| | | | —
| | |
HSBC Securities (USA), Inc.
| | 6/5/2015
| | | 500,000
CAD | | | | 399,944
USD | | | | —
| | | | (2,095
| ) | |
HSBC Securities (USA), Inc.
| | 6/5/2015
| | | 1,800,000
CAD | | | | 1,439,798
USD | | | | —
| | | | (7,540
| ) | |
HSBC Securities (USA), Inc.
| | 6/5/2015
| | | 300,000,000
JPY | | | | 2,512,860
USD | | | | 95,642
| | | | —
| | |
HSBC Securities (USA), Inc.
| | 6/5/2015
| | | 250,651,000
JPY | | | | 2,020,559
USD | | | | 966
| | | | —
| | |
HSBC Securities (USA), Inc.
| | 6/5/2015
| | | 143,500,000
JPY | | | | 1,156,789
USD | | | | 553
| | | | —
| | |
HSBC Securities (USA), Inc.
| | 6/5/2015
| | | 825,201
USD | | | | 1,000,000
CAD | | | | —
| | | | (21,124
| ) | |
HSBC Securities (USA), Inc.
| | 6/5/2015
| | | 660,161
USD | | | | 800,000
CAD | | | | —
| | | | (16,899
| ) | |
HSBC Securities (USA), Inc.
| | 6/5/2015
| | | 825,611
USD | | | | 1,000,000
CAD | | | | —
| | | | (21,534
| ) | |
HSBC Securities (USA), Inc.
| | 6/5/2015
| | | 4,611,922
USD | | | | 550,651,000
JPY | | | | —
| | | | (175,111
| ) | |
HSBC Securities (USA), Inc.
| | 6/5/2015
| | | 418,770
USD | | | | 50,000,000
JPY | | | | —
| | | | (15,900
| ) | |
HSBC Securities (USA), Inc.
| | 6/5/2015
| | | 238,560
USD | | | | 28,500,000
JPY | | | | —
| | | | (8,924
| ) | |
HSBC Securities (USA), Inc.
| | 6/5/2015
| | | 541,201
USD | | | | 65,000,000
JPY | | | | —
| | | | (17,471
| ) | |
HSBC Securities (USA), Inc.
| | 7/9/2015
| | | 1,439,069
USD | | | | 1,800,000
CAD | | | | 7,458
| | | | —
| | |
HSBC Securities (USA), Inc.
| | 7/9/2015
| | | 399,741
USD | | | | 500,000
CAD | | | | 2,072
| | | | —
| | |
HSBC Securities (USA), Inc.
| | 7/9/2015
| | | 2,021,567
USD | | | | 250,651,000
JPY | | | | —
| | | | (1,024
| ) | |
HSBC Securities (USA), Inc.
| | 7/9/2015
| | | 1,157,365
USD | | | | 143,500,000
JPY | | | | —
| | | | (586
| ) | |
J.P. Morgan Securities, Inc.
| | 6/4/2015
| | | 1,000,000
DKK | | | | 150,478
USD | | | | 3,254
| | | | —
| | |
J.P. Morgan Securities, Inc.
| | 6/4/2015
| | | 750,000
DKK | | | | 110,327
USD | | | | —
| | | | (91
| ) | |
J.P. Morgan Securities, Inc.
| | 6/4/2015
| | | 255,269
USD | | | | 1,750,000
DKK | | | | 2,373
| | | | —
| | |
J.P. Morgan Securities, Inc.
| | 6/5/2015
| | | 500,000
PLN | | | | 133,426
USD | | | | —
| | | | (154
| ) | |
The accompanying Notes to Financial Statements are an integral part of this statement.
Annual Report 2015
10
COLUMBIA ADAPTIVE RISK ALLOCATION FUND
PORTFOLIO OF INVESTMENTS (continued)
May 31, 2015
Forward Foreign Currency Exchange Contracts Open at May 31, 2015 (continued)
Counterparty | | Exchange Date | | Currency to
be Delivered | | Currency to
be Received | | Unrealized
Appreciation ($) | | Unrealized
Depreciation ($) | |
J.P. Morgan Securities, Inc.
| | 6/5/2015
| | | 136,062
USD | | | | 500,000
PLN | | | | —
| | | | (2,482
| ) | |
J.P. Morgan Securities, Inc.
| | 7/9/2015
| | | 110,450
USD | | | | 750,000
DKK | | | | 80
| | | | —
| | |
J.P. Morgan Securities, Inc.
| | 7/9/2015
| | | 133,291
USD | | | | 500,000
PLN | | | | 155
| | | | —
| | |
Standard Chartered Bank
| | 6/5/2015
| | | 768,000
GBP | | | | 1,213,054
USD | | | | 39,269
| | | | —
| | |
Standard Chartered Bank
| | 6/5/2015
| | | 525,700
GBP | | | | 826,925
USD | | | | 23,463
| | | | —
| | |
Standard Chartered Bank
| | 6/5/2015
| | | 400,000
GBP | | | | 613,947
USD | | | | 2,600
| | | | —
| | |
Standard Chartered Bank
| | 6/5/2015
| | | 1,350,000
GBP | | | | 2,061,536
USD | | | | —
| | | | (1,758
| ) | |
Standard Chartered Bank
| | 6/5/2015
| | | 1,206,300
GBP | | | | 1,829,456
USD | | | | —
| | | | (14,211
| ) | |
Standard Chartered Bank
| | 6/5/2015
| | | 5,000,000
MXN | | | | 325,179
USD | | | | 553
| | | | —
| | |
Standard Chartered Bank
| | 6/5/2015
| | | 5,000,000
MXN | | | | 324,687
USD | | | | 61
| | | | —
| | |
Standard Chartered Bank
| | 6/5/2015
| | | 24,000,000
MXN | | | | 1,557,835
USD | | | | —
| | | | (370
| ) | |
Standard Chartered Bank
| | 6/5/2015
| | | 3,783,750
USD | | | | 2,500,000
GBP | | | | 37,165
| | | | —
| | |
Standard Chartered Bank
| | 6/5/2015
| | | 2,687,020
USD | | | | 1,750,000
GBP | | | | —
| | | | (12,380
| ) | |
Standard Chartered Bank
| | 6/5/2015
| | | 1,560,671
USD | | | | 24,000,000
MXN | | | | —
| | | | (2,466
| ) | |
Standard Chartered Bank
| | 6/5/2015
| | | 650,280
USD | | | | 10,000,000
MXN | | | | —
| | | | (1,027
| ) | |
Standard Chartered Bank
| | 7/9/2015
| | | 5,500,000
GBP | | | | 8,396,812
USD | | | | —
| | | | (7,079
| ) | |
Standard Chartered Bank
| | 7/9/2015
| | | 1,294,700
GBP | | | | 1,976,609
USD | | | | —
| | | | (1,666
| ) | |
Standard Chartered Bank
| | 7/9/2015
| | | 2,000,000
SEK | | | | 234,254
USD | | | | —
| | | | (480
| ) | |
Standard Chartered Bank
| | 7/9/2015
| | | 2,061,036
USD | | | | 1,350,000
GBP | | | | 1,737
| | | | —
| | |
Standard Chartered Bank
| | 7/9/2015
| | | 323,895
USD | | | | 5,000,000
MXN | | | | —
| | | | (93
| ) | |
State Street Bank & Trust Company
| | 6/5/2015
| | | 3,000,000
BRL | | | | 985,869
USD | | | | 45,348
| | | | —
| | |
State Street Bank & Trust Company
| | 6/5/2015
| | | 550,000
NOK | | | | 70,509
USD | | | | —
| | | | (259
| ) | |
State Street Bank & Trust Company
| | 6/5/2015
| | | 1,011,463
USD | | | | 3,000,000
BRL | | | | —
| | | | (70,942
| ) | |
State Street Bank & Trust Company
| | 6/5/2015
| | | 71,126
USD | | | | 550,000
NOK | | | | —
| | | | (358
| ) | |
The accompanying Notes to Financial Statements are an integral part of this statement.
Annual Report 2015
11
COLUMBIA ADAPTIVE RISK ALLOCATION FUND
PORTFOLIO OF INVESTMENTS (continued)
May 31, 2015
Forward Foreign Currency Exchange Contracts Open at May 31, 2015 (continued)
Counterparty | | Exchange Date | | Currency to
be Delivered | | Currency to
be Received | | Unrealized
Appreciation ($) | | Unrealized
Depreciation ($) | |
State Street Bank & Trust Company
| | 7/9/2015
| | | 2,750,000
GBP | | | | 4,197,848
USD | | | | —
| | | | (4,097
| ) | |
State Street Bank & Trust Company
| | 7/9/2015
| | | 70,445
USD | | | | 550,000
NOK | | | | 256
| | | | —
| | |
UBS Securities
| | 6/5/2015
| | | 50,000
CHF | | | | 53,628
USD | | | | 422
| | | | —
| | |
UBS Securities
| | 6/5/2015
| | | 50,000
CHF | | | | 53,015
USD | | | | —
| | | | (190
| ) | |
UBS Securities
| | 6/5/2015
| | | 104,871
USD | | | | 100,000
CHF | | | | 1,540
| | | | —
| | |
UBS Securities
| | 7/9/2015
| | | 2,031,000
NZD | | | | 1,437,712
USD | | | | 1,809
| | | | —
| | |
UBS Securities
| | 7/9/2015
| | | 53,083
USD | | | | 50,000
CHF | | | | 188
| | | | —
| | |
Total | | | | | | | | | 406,012 | | | | (457,444 | ) | |
Futures Contracts Outstanding at May 31, 2015
Long Futures Contracts Outstanding
Contract Description | | Number of
Contracts | | Trading
Currency | | Notional
Market
Value ($) | | Expiration
Date | | Unrealized
Appreciation ($) | | Unrealized
Depreciation ($) | |
AUST 3YR BOND FUT | | | 28 | | | AUD | | | | | 2,395,513 | | | 06/2015 | | | — | | | | (13,478 | ) | |
CAN 10YR BOND FUT | | | 4 | | | CAD | | | | | 453,200 | | | 09/2015 | | | 7,101 | | | | — | | |
| EURO BUXL 30Y BND | | | 6 | | | EUR | | | | | 1,067,679 | | | 06/2015 | | | — | | | | (53,473 | ) | |
Euro-BTP Future | | | 33 | | | EUR | | | | | 4,890,752 | | | 06/2015 | | | — | | | | (187,001 | ) | |
| EURO-BUND FUTURE | | | 1 | | | EUR | | | | | 170,709 | | | 06/2015 | | | — | | | | (1,755 | ) | |
Euro-OAT Future | | | 9 | | | EUR | | | | | 1,507,516 | | | 06/2015 | | | — | | | | (53,007 | ) | |
LONG GILT FUTURE | | | 25 | | | GBP | | | | | 4,501,138 | | | 09/2015 | | | 64,508 | | | | — | | |
mini MSCI EAFE | | | 798 | | | USD | | | | | 75,810,000 | | | 06/2015 | | | 2,278,361 | | | | — | | |
mini MSCI Emg Mkt | | | 455 | | | USD | | | | | 22,679,475 | | | 06/2015 | | | 161,289 | | | | — | | |
S&P500 EMINI FUT | | | 1,057 | | | USD | | | | | 111,302,100 | | | 06/2015 | | | 2,145,976 | | | | — | | |
Short Euro-BTP Fut | | | 8 | | | EUR | | | | | 987,152 | | | 06/2015 | | | 2,379 | | | | — | | |
US 10YR NOTE (CBT) | | | 261 | | | USD | | | | | 33,326,438 | | | 09/2015 | | | 195,202 | | | | — | | |
US 10YR NOTE (CBT) | | | 79 | | | USD | | | | | 10,087,313 | | | 09/2015 | | | 59,084 | | | | — | | |
US LONG BOND(CBT) | | | 5 | | | USD | | | | | 778,125 | | | 09/2015 | | | 7,607 | | | | — | | |
US ULTRA BOND(CBT) | | | 30 | | | USD | | | | | 4,808,438 | | | 09/2015 | | | 45,640 | | | | — | | |
US ULTRA BOND(CBT) | | | 23 | | | USD | | | | | 3,686,469 | | | 09/2015 | | | 34,991 | | | | — | | |
Total | | | | | | | 278,452,017 | | | | | | 5,002,138 | | | | (308,714 | ) | |
The accompanying Notes to Financial Statements are an integral part of this statement.
Annual Report 2015
12
COLUMBIA ADAPTIVE RISK ALLOCATION FUND
PORTFOLIO OF INVESTMENTS (continued)
May 31, 2015
Short Futures Contracts Outstanding
Contract Description | | Number of
Contracts | | Trading
Currency | | Notional
Market
Value ($) | | Expiration
Date | | Unrealized
Appreciation ($) | | Unrealized
Depreciation ($) | |
| EURO-BOBL FUTURE | | | (25 | ) | | EUR | | | | | (3,537,899 | ) | | 06/2015 | | | 6,600 | | | | — | | |
| EURO-BUND FUTURE | | | (32 | ) | | EUR | | | | | (5,462,681 | ) | | 06/2015 | | | 94,349 | | | | — | | |
LONG GILT FUTURE | | | (30 | ) | | GBP | | | | | (5,401,365 | ) | | 09/2015 | | | — | | | | (77,512 | ) | |
US 10YR NOTE (CBT) | | | (74 | ) | | USD | | | | | (9,448,875 | ) | | 09/2015 | | | — | | | | (55,655 | ) | |
US 5YR NOTE (CBT) | | | (60 | ) | | USD | | | | | (7,183,594 | ) | | 09/2015 | | | — | | | | (29,657 | ) | |
US ULTRA BOND(CBT) | | | (34 | ) | | USD | | | | | (5,449,563 | ) | | 09/2015 | | | — | | | | (51,868 | ) | |
Total | | | | | | | (36,483,977 | ) | | | | | 100,949 | | | | (214,692 | ) | |
Credit Default Swap Contracts Outstanding at May 31, 2015
Sell Protection
Counterparty | | Reference
Entity | | Expiration
Date | | Receive
Fixed
Rate (%) | | Implied
Credit
Spread (%)** | | Notional
Amount ($) | | Market
Value ($) | | Unamortized
Premium
(Paid)
Received ($) | | Periodic
Payments
Receivable
(Payable)
($) | | Unrealized
Appreciation
($) | | Unrealized
Depreciation
($) | |
Citibank
| | CDX Emerging
Markets
Index 23-V1 | | 6/20/2020
| | | 1.000
| | | | 2.914
| | | | 45,000,000
| | | | (3,905,501
| ) | | | 3,965,274
| | | | 88,750
| | | | 148,523
| | | | —
| | |
Morgan
Stanley*
| | CDX North
America
Investment
Grade 24-V1 | | 6/20/2020
| | | 1.000
| | | | 0.640
| | | | 55,000,000
| | | | (1,925
| ) | | | —
| | | | 108,472
| | | | 106,547
| | | | —
| | |
Morgan
Stanley*
| | CDX North
America
High Yield 24-V1 | | 6/20/2020
| | | 5.000
| | | | 3.400
| | | | 65,000,000
| | | | 61,047
| | | | —
| | | | 640,972
| | | | 702,019
| | | | —
| | |
Total | | | | | | | | | | | | | | | | | | | 957,089 | | | | — | | |
* Centrally cleared swap contract
**Implied credit spreads, represented in absolute terms, utilized in determining the market value of credit default swap agreements on corporate or sovereign issues as of period end serve as an indicator of the current status of the payment/performance risk and represent the likelihood or risk of default for the credit derivative. The implied credit spread of a particular referenced entity reflects the cost of buying/selling protection and may include upfront payments required to be made to enter into the agreement. Wider credit spreads represent a deterioration of the referenced entity's credit soundness and a greater likelihood or risk of default or other credit event occurring as defined under the terms of the agreement.
The accompanying Notes to Financial Statements are an integral part of this statement.
Annual Report 2015
13
COLUMBIA ADAPTIVE RISK ALLOCATION FUND
PORTFOLIO OF INVESTMENTS (continued)
May 31, 2015
Interest Rate Swap Contracts Outstanding at May 31, 2015
Counterparty | | Floating Rate
Index | | Fund
Pay/Receive
Floating Rate | | Fixed
Rate (%) | | Expiration
Date | | Notional
Currency | | Notional
Amount ($) | | Unamortized
Premium
(Paid)
Received ($) | | Unrealized
Appreciation ($) | | Unrealized
Depreciation ($) | |
Morgan Stanley*
| | 3-Month
USD LIBOR-BBA | | Pay
| | | 2.287
| | | 5/2/2021
| | USD |
| | | | 11,000,000
| | | | (56
| ) | | | 345,101
| | | | —
| | |
Morgan Stanley*
| | 3-Month
USD LIBOR-BBA | | Pay
| | | 3.159
| | | 5/2/2029
| | USD |
| | | | 3,000,000
| | | | (28
| ) | | | 291,856
| | | | —
| | |
Total | | | | | | | | | | | | | | | | | 636,957 | | | | — | | |
*Centrally cleared swap contract
Notes to Portfolio of Investments
(a) As defined in the Investment Company Act of 1940, an affiliated company is one in which the Fund owns 5% or more of the company's outstanding voting securities, or a company which is under common ownership or control with the Fund. Holdings and transactions in these affiliated companies during the year ended May 31, 2015 are as follows:
Issuer | | Beginning
Cost ($) | | Purchase
Cost ($) | | Proceeds
From
Sales ($) | | Realized
Gain
(Loss) ($) | | Ending
Cost ($) | | Capital Gain
Distributions ($) | | Dividends —
Affiliated
Issuers ($) | | Value ($) | |
Columbia Commodity
Strategy Fund,
Class I Shares | | | 22,898,470 | | | | 31,846,778 | | | | (20,641,862 | ) | | | (2,256,608 | ) | | | 31,846,778 | | | | — | | | | — | | | | 31,982,061 | | |
Columbia Real Estate
Equity Fund,
Class I Shares | | | 27,191,544 | | | | 41,043,065 | | | | (32,117,692 | ) | | | 892,093 | | | | 37,009,010 | | | | 195,491 | | | | 266,925 | | | | 36,188,452 | | |
Columbia Short-Term
Cash Fund | | | 68,867,224 | | | | 575,459,992 | | | | (483,449,447 | ) | | | — | | | | 160,877,769 | | | | — | | | | 127,356 | | | | 160,877,769 | | |
Total | | | 118,957,238 | | | | 648,349,835 | | | | (536,209,001 | ) | | | (1,364,515 | ) | | | 229,733,557 | | | | 195,491 | | | | 394,281 | | | | 229,048,282 | | |
(b) Non-income producing investment.
(c) Security, or a portion thereof, has been purchased on a when-issued or delayed delivery basis.
(d) Principal amounts are denominated in United States Dollars unless otherwise noted.
(e) Security exempt from registration pursuant to Rule 144A under the Securities Act of 1933. This security may be resold in transactions exempt from registration, normally to qualified institutional buyers. At May 31, 2015, the value of these securities amounted to $4,822,361 or 1.12% of net assets.
(f) The rate shown is the seven-day current annualized yield at May 31, 2015.
Currency Legend
AUD Australian Dollar
BRL Brazilian Real
CAD Canadian Dollar
CHF Swiss Franc
DKK Danish Krone
EUR Euro
GBP British Pound
JPY Japanese Yen
MXN Mexican Peso
NOK Norwegian Krone
The accompanying Notes to Financial Statements are an integral part of this statement.
Annual Report 2015
14
COLUMBIA ADAPTIVE RISK ALLOCATION FUND
PORTFOLIO OF INVESTMENTS (continued)
May 31, 2015
NZD New Zealand Dollar
PLN Polish Zloty
SEK Swedish Krona
USD US Dollar
The Fund categorizes its fair value measurements according to a three-level hierarchy that maximizes the use of observable inputs and minimizes the use of unobservable inputs by prioritizing that the most observable input be used when available. Observable inputs are those that market participants would use in pricing an investment based on market data obtained from sources independent of the reporting entity. Unobservable inputs are those that reflect the Fund's assumptions about the information market participants would use in pricing an investment. An investment's level within the fair value hierarchy is based on the lowest level of any input that is deemed significant to the asset or liability's fair value measurement. The input levels are not necessarily an indication of the risk or liquidity associated with investments at that level. For example, certain U.S. government securities are generally high quality and liquid, however, they are reflected as Level 2 because the inputs used to determine fair value may not always be quoted prices in an active market.
Fair value inputs are summarized in the three broad levels listed below:
> Level 1 — Valuations based on quoted prices for investments in active markets that the Fund has the ability to access at the measurement date (including NAV for open-end mutual funds). Valuation adjustments are not applied to Level 1 investments.
> Level 2 — Valuations based on other significant observable inputs (including quoted prices for similar securities, interest rates, prepayment speeds, credit risks, etc.).
> Level 3 — Valuations based on significant unobservable inputs (including the Fund's own assumptions and judgment in determining the fair value of investments).
Inputs that are used in determining fair value of an investment may include price information, credit data, volatility statistics, and other factors. These inputs can be either observable or unobservable. The availability of observable inputs can vary between investments, and is affected by various factors such as the type of investment, and the volume and level of activity for that investment or similar investments in the marketplace. The inputs will be considered by the Investment Manager, along with any other relevant factors in the calculation of an investment's fair value. The Fund uses prices and inputs that are current as of the measurement date, which may include periods of market dislocations. During these periods, the availability of prices and inputs may be reduced for many investments. This condition could cause an investment to be reclassified between the various levels within the hierarchy.
Investments falling into the Level 3 category are primarily supported by quoted prices from brokers and dealers participating in the market for those investments. However, these may be classified as Level 3 investments due to lack of market transparency and corroboration to support these quoted prices. Additionally, valuation models may be used as the pricing source for any remaining investments classified as Level 3. These models may rely on one or more significant unobservable inputs and/or significant assumptions by the Investment Manager. Inputs used in valuations may include, but are not limited to, financial statement analysis, capital account balances, discount rates and estimated cash flows, and comparable company data.
Under the direction of the Fund's Board of Trustees (the Board), the Investment Manager's Valuation Committee (the Committee) is responsible for overseeing the valuation procedures approved by the Board. The Committee consists of voting and non-voting members from various groups within the Investment Manager's organization, including operations and accounting, trading and investments, compliance, risk management and legal.
The Committee meets at least monthly to review and approve valuation matters, which may include a description of specific valuation determinations, data regarding pricing information received from approved pricing vendors and brokers and the results of Board-approved valuation control policies and procedures (the Policies). The Policies address, among other things, instances when market quotations are or are not readily available, including recommendations of third party pricing vendors and a determination of appropriate pricing methodologies; events that require specific valuation determinations and assessment of fair value techniques; securities with a potential for stale pricing, including those that are illiquid, restricted, or in default; and the effectiveness of third party pricing vendors, including periodic reviews of vendors. The Committee meets more frequently, as needed, to discuss additional valuation matters, which may include the need to review back-testing results, review time-sensitive information or approve related valuation actions. The Committee reports to the Board, with members of the Committee meeting with the Board at each of its regularly scheduled meetings to discuss valuation matters and actions during the period, similar to those described earlier.
For investments categorized as Level 3, the Committee monitors information similar to that described above, which may include: (i) data specific to the issuer or comparable issuers, (ii) general market or specific sector news and (iii) quoted prices and specific or similar security transactions. The Committee considers this data and any changes from prior periods in order to assess the reasonableness of observable and unobservable inputs, any assumptions or internal models used to value those securities and changes in fair value. This data is also used to corroborate, when available, information received from approved pricing vendors and brokers. Various factors impact the frequency of monitoring this information (which may occur as often as daily). However, the Committee may determine that changes to inputs, assumptions and models are not required as a result of the monitoring procedures performed.
The accompanying Notes to Financial Statements are an integral part of this statement.
Annual Report 2015
15
COLUMBIA ADAPTIVE RISK ALLOCATION FUND
PORTFOLIO OF INVESTMENTS (continued)
May 31, 2015
Fair Value Measurements (continued)
The following table is a summary of the inputs used to value the Fund's investments at May 31, 2015:
| | | Level 1
Quoted Prices in Active
Markets for Identical
Assets ($) | | Level 2
Other Significant
Observable Inputs ($) | | Level 3
Significant
Unobservable Inputs ($) | | Total ($) | |
Investments | |
Equity Funds | | | 36,188,453 | | | | — | | | | — | | | | 36,188,453 | | |
Alternative Investment Funds | | | 31,982,061 | | | | — | | | | — | | | | 31,982,061 | | |
Residential Mortgage-Backed
Securities — Agency | | | — | | | | 38,190,239 | | | | — | | | | 38,190,239 | | |
U.S. Treasury Obligations | | | 10,834,770 | | | | — | | | | — | | | | 10,834,770 | | |
Foreign Government Obligations | | | — | | | | 8,383,438 | | | | — | | | | 8,383,438 | | |
Inflation-Indexed Bonds | | | — | | | | 133,252,197 | | | | — | | | | 133,252,197 | | |
Exchange-Traded Funds | | | 18,825,728 | | | | — | | | | — | | | | 18,825,728 | | |
Exchange-Traded Notes | | | 15,844,779 | | | | — | | | | — | | | | 15,844,779 | | |
Money Market Funds | | | 160,877,769 | | | | — | | | | — | | | | 160,877,769 | | |
Total Investments | | | 274,553,560 | | | | 179,825,874 | | | | — | | | | 454,379,434 | | |
Derivatives | |
Assets | |
Forward Foreign Currency Exchange
Contracts | | | — | | | | 406,012 | | | | — | | | | 406,012 | | |
Futures Contracts | | | 5,103,087 | | | | — | | | | — | | | | 5,103,087 | | |
Swap Contracts | | | — | | | | 1,594,046 | | | | — | | | | 1,594,046 | | |
Liabilities | |
Forward Foreign Currency Exchange
Contracts | | | — | | | | (457,444 | ) | | | — | | | | (457,444 | ) | |
Futures Contracts | | | (523,406 | ) | | | — | | | | — | | | | (523,406 | ) | |
Total | | | 279,133,241 | | | | 181,368,488 | | | | — | | | | 460,501,729 | | |
See the Portfolio of Investments for all investment classifications not indicated in the table.
The Fund's assets assigned to the Level 2 input category are generally valued using the market approach, in which a security's value is determined through reference to prices and information from market transactions for similar or identical assets.
There were no transfers of financial assets between levels during the period.
Derivative instruments are valued at unrealized appreciation (depreciation).
The accompanying Notes to Financial Statements are an integral part of this statement.
Annual Report 2015
16
COLUMBIA ADAPTIVE RISK ALLOCATION FUND
STATEMENT OF ASSETS AND LIABILITIES
May 31, 2015
Assets | |
Investments, at value | |
Unaffiliated issuers (identified cost $228,574,209) | | $ | 225,331,152 | | |
Affiliated issuers (identified cost $229,733,557) | | | 229,048,282 | | |
Total investments (identified cost $458,307,766) | | | 454,379,434 | | |
Foreign currency (identified cost $3,248,152) | | | 3,133,073 | | |
Cash collateral held at broker | | | 3,945,000 | | |
Margin deposits | | | 14,159,464 | | |
Unrealized appreciation on forward foreign currency exchange contracts | | | 406,012 | | |
Unrealized appreciation on swap contracts | | | 148,523 | | |
Premiums paid on outstanding swap contracts | | | 84 | | |
Receivable for: | |
Investments sold | | | 939,572 | | |
Capital shares sold | | | 2,799,020 | | |
Dividends | | | 13,864 | | |
Interest | | | 498,221 | | |
Foreign tax reclaims | | | 5,189 | | |
Variation margin | | | 257,457 | | |
Expense reimbursement due from Investment Manager | | | 1,416 | | |
Prepaid expenses | | | 232 | | |
Trustees' deferred compensation plan | | | 6,644 | | |
Other assets | | | 8,792 | | |
Total assets | | | 480,701,997 | | |
Liabilities | |
Due to custodian | | | 141 | | |
Unrealized depreciation on forward foreign currency exchange contracts | | | 457,444 | | |
Premiums received on outstanding swap contracts | | | 3,965,274 | | |
Payable for: | |
Investments purchased | | | 7,773,658 | | |
Investments purchased on a delayed delivery basis | | | 34,763,724 | | |
Capital shares purchased | | | 504,731 | | |
Variation margin | | | 1,897,373 | | |
Investment management fees | | | 6,409 | | |
Distribution and/or service fees | | | 3,780 | | |
Transfer agent fees | | | 45,931 | | |
Administration fees | | | 707 | | |
Plan administration fees | | | 1 | | |
Chief compliance officer expenses | | | 23 | | |
Other expenses | | | 70,591 | | |
Trustees' deferred compensation plan | | | 6,644 | | |
Total liabilities | | | 49,496,431 | | |
Net assets applicable to outstanding capital stock | | $ | 431,205,566 | | |
Represented by | |
Paid-in capital | | $ | 430,300,156 | | |
Excess of distributions over net investment income | | | (297,284 | ) | |
Accumulated net realized loss | | | (843,810 | ) | |
Unrealized appreciation (depreciation) on: | |
Investments — unaffiliated issuers | | | (3,243,057 | ) | |
Investments — affiliated issuers | | | (685,275 | ) | |
Foreign currency translations | | | (147,459 | ) | |
Forward foreign currency exchange contracts | | | (51,432 | ) | |
Futures contracts | | | 4,579,681 | | |
Swap contracts | | | 1,594,046 | | |
Total — representing net assets applicable to outstanding capital stock | | $ | 431,205,566 | | |
The accompanying Notes to Financial Statements are an integral part of this statement.
Annual Report 2015
17
COLUMBIA ADAPTIVE RISK ALLOCATION FUND
STATEMENT OF ASSETS AND LIABILITIES (continued)
May 31, 2015
Class A | |
Net assets | | $ | 169,978,201 | | |
Shares outstanding | | | 16,715,390 | | |
Net asset value per share | | $ | 10.17 | | |
Maximum offering price per share(a) | | $ | 10.79 | | |
Class C | |
Net assets | | $ | 52,406,004 | | |
Shares outstanding | | | 5,251,740 | | |
Net asset value per share | | $ | 9.98 | | |
Class K | |
Net assets | | $ | 2,753 | | |
Shares outstanding | | | 270 | | |
Net asset value per share(b) | | $ | 10.18 | | |
Class R | |
Net assets | | $ | 146,236 | | |
Shares outstanding | | | 14,462 | | |
Net asset value per share | | $ | 10.11 | | |
Class R4 | |
Net assets | | $ | 11,110,253 | | |
Shares outstanding | | | 1,087,746 | | |
Net asset value per share | | $ | 10.21 | | |
Class R5 | |
Net assets | | $ | 1,646,801 | | |
Shares outstanding | | | 161,100 | | |
Net asset value per share | | $ | 10.22 | | |
Class W | |
Net assets | | $ | 174,418,481 | | |
Shares outstanding | | | 17,131,135 | | |
Net asset value per share | | $ | 10.18 | | |
Class Y | |
Net assets | | $ | 2,520 | | |
Shares outstanding | | | 246 | | |
Net asset value per share(b) | | $ | 10.23 | | |
Class Z | |
Net assets | | $ | 21,494,317 | | |
Shares outstanding | | | 2,105,260 | | |
Net asset value per share | | $ | 10.21 | | |
(a) The maximum offering price per share is calculated by dividing the net asset value per share by 1.0 minus the maximum sales charge of 5.75%.
(b) Net asset value per share rounds to this amount due to fractional shares outstanding.
The accompanying Notes to Financial Statements are an integral part of this statement.
Annual Report 2015
18
COLUMBIA ADAPTIVE RISK ALLOCATION FUND
STATEMENT OF OPERATIONS
Year Ended May 31, 2015
Net investment income | |
Income: | |
Dividends — unaffiliated issuers | | $ | 82,361 | | |
Dividends — affiliated issuers | | | 394,281 | | |
Interest | | | 1,063,868 | | |
Foreign taxes withheld | | | (11,221 | ) | |
Total income | | | 1,529,289 | | |
Expenses: | |
Investment management fees | | | 1,474,567 | | |
Distribution and/or service fees | |
Class A | | | 108,173 | | |
Class C | | | 129,231 | | |
Class R | | | 553 | | |
Class W | | | 448,612 | | |
Transfer agent fees | |
Class A | | | 74,043 | | |
Class C | | | 21,841 | | |
Class K | | | 1 | | |
Class R | | | 187 | | |
Class R4(a) | | | 6,574 | | |
Class R5 | | | 270 | | |
Class W | | | 339,722 | | |
Class Z | | | 14,590 | | |
Administration fees | | | 149,017 | | |
Plan administration fees | |
Class K | | | 7 | | |
Compensation of board members | | | 19,985 | | |
Custodian fees | | | 52,523 | | |
Printing and postage fees | | | 90,738 | | |
Registration fees | | | 166,093 | | |
Professional fees | | | 45,869 | | |
Dividends and interest on securities sold short | | | 17 | | |
Chief compliance officer expenses | | | 122 | | |
Other | | | 8,612 | | |
Total expenses | | | 3,151,347 | | |
Fees waived or expenses reimbursed by Investment Manager and its affiliates | | | (633,805 | ) | |
Total net expenses | | | 2,517,542 | | |
Net investment loss | | | (988,253 | ) | |
Realized and unrealized gain (loss) — net | |
Net realized gain (loss) on: | |
Investments — unaffiliated issuers | | | (306,845 | ) | |
Investments — affiliated issuers | | | (1,364,515 | ) | |
Capital gain distributions from underlying affiliated funds | | | 195,491 | | |
Foreign currency translations | | | (98,929 | ) | |
Forward foreign currency exchange contracts | | | (1,284,175 | ) | |
Futures contracts | | | 5,155,164 | | |
Options purchased | | | (123,098 | ) | |
Swap contracts | | | 850,238 | | |
Increase from payment by affiliate (Note 6) | | | 131,751 | | |
Net realized gain | | | 3,155,082 | | |
Net change in unrealized appreciation (depreciation) on: | |
Investments — unaffiliated issuers | | | (3,603,317 | ) | |
Investments — affiliated issuers | | | (906,578 | ) | |
Foreign currency translations | | | (144,837 | ) | |
Forward foreign currency exchange contracts | | | (85,923 | ) | |
Futures contracts | | | 2,348,994 | | |
Swap contracts | | | 779,705 | | |
Net change in unrealized depreciation | | | (1,611,956 | ) | |
Net realized and unrealized gain | | | 1,543,126 | | |
Net increase in net assets resulting from operations | | $ | 554,873 | | |
(a) Based on operations from October 1, 2014 (commencement of operations) through the stated period end.
The accompanying Notes to Financial Statements are an integral part of this statement.
Annual Report 2015
19
COLUMBIA ADAPTIVE RISK ALLOCATION FUND
STATEMENT OF CHANGES IN NET ASSETS
| | | Year Ended
May 31,
2015(a) | | Year Ended
May 31,
2014 | |
Operations | |
Net investment income (loss) | | $ | (988,253 | ) | | $ | 92,958 | | |
Net realized gain | | | 3,155,082 | | | | 875,909 | | |
Net change in unrealized appreciation (depreciation) | | | (1,611,956 | ) | | | 4,119,379 | | |
Net increase in net assets resulting from operations | | | 554,873 | | | | 5,088,246 | | |
Distributions to shareholders | |
Net investment income | |
Class A | | | (15,795 | ) | | | — | | |
Class K | | | (5 | ) | | | — | | |
Class R4 | | | (19,603 | ) | | | — | | |
Class R5 | | | (1,192 | ) | | | — | | |
Class W | | | (115,976 | ) | | | — | | |
Class Y | | | (11 | ) | | | — | | |
Class Z | | | (17,288 | ) | | | — | | |
Net realized gains | |
Class A | | | (420,284 | ) | | | (325,536 | ) | |
Class C | | | (122,589 | ) | | | (25,110 | ) | |
Class K | | | (48 | ) | | | (120 | ) | |
Class R | | | (1,570 | ) | | | (120 | ) | |
Class R4 | | | (112,812 | ) | | | — | | |
Class R5 | | | (4,985 | ) | | | (120 | ) | |
Class W | | | (3,086,005 | ) | | | (120 | ) | |
Class Y | | | (44 | ) | | | — | | |
Class Z | | | (99,486 | ) | | | (244,580 | ) | |
Total distributions to shareholders | | | (4,017,693 | ) | | | (595,706 | ) | |
Increase in net assets from capital stock activity | | | 237,224,074 | | | | 178,259,541 | | |
Total increase in net assets | | | 233,761,254 | | | | 182,752,081 | | |
Net assets at beginning of year | | | 197,444,312 | | | | 14,692,231 | | |
Net assets at end of year | | $ | 431,205,566 | | | $ | 197,444,312 | | |
Undistributed (excess of distributions over) net investment income | | $ | (297,284 | ) | | $ | 90,652 | | |
(a) Class R4 and Class Y shares are based on operations from October 1, 2014 (commencement of operations) through the stated period end.
The accompanying Notes to Financial Statements are an integral part of this statement.
Annual Report 2015
20
COLUMBIA ADAPTIVE RISK ALLOCATION FUND
STATEMENT OF CHANGES IN NET ASSETS (continued)
| | | Year Ended May 31, 2015(a) | | Year Ended May 31, 2014 | |
| | | Shares | | Dollars ($) | | Shares | | Dollars ($) | |
Capital stock activity | |
Class A shares | |
Subscriptions | | | 17,144,145 | | | | 175,750,190 | | | | 107,221 | | | | 1,054,840 | | |
Distributions reinvested | | | 41,129 | | | | 415,816 | | | | 9,337 | | | | 86,275 | | |
Redemptions | | | (1,180,923 | ) | | | (12,081,431 | ) | | | (214,690 | ) | | | (2,070,228 | ) | |
Net increase (decrease) | | | 16,004,351 | | | | 164,084,575 | | | | (98,132 | ) | | | (929,113 | ) | |
Class C shares | |
Subscriptions | | | 5,276,583 | | | | 53,187,065 | | | | 9,144 | | | | 87,700 | | |
Distributions reinvested | | | 12,303 | | | | 122,541 | | | | 2,728 | | | | 24,991 | | |
Redemptions | | | (78,314 | ) | | | (790,418 | ) | | | (109,050 | ) | | | (1,051,933 | ) | |
Net increase (decrease) | | | 5,210,572 | | | | 52,519,188 | | | | (97,178 | ) | | | (939,242 | ) | |
Class K shares | |
Subscriptions | | | — | | | | — | | | | 20 | | | | 200 | | |
Net increase | | | — | | | | — | | | | 20 | | | | 200 | | |
Class R shares | |
Subscriptions | | | 28,912 | | | | 295,000 | | | | 20 | | | | 200 | | |
Distributions reinvested | | | 151 | | | | 1,522 | | | | — | | | | — | | |
Redemptions | | | (14,871 | ) | | | (150,755 | ) | | | — | | | | — | | |
Net increase | | | 14,192 | | | | 145,767 | | | | 20 | | | | 200 | | |
Class R4 shares | |
Subscriptions | | | 1,173,638 | | | | 12,174,146 | | | | — | | | | — | | |
Distributions reinvested | | | 13,041 | | | | 132,364 | | | | — | | | | — | | |
Redemptions | | | (98,933 | ) | | | (1,019,360 | ) | | | — | | | | — | | |
Net increase | | | 1,087,746 | | | | 11,287,150 | | | | — | | | | — | | |
Class R5 shares | |
Subscriptions | | | 167,304 | | | | 1,715,426 | | | | 2,278 | | | | 22,730 | | |
Distributions reinvested | | | 603 | | | | 6,117 | | | | — | | | | — | | |
Redemptions | | | (9,335 | ) | | | (95,898 | ) | | | — | | | | — | | |
Net increase | | | 158,572 | | | | 1,625,645 | | | | 2,278 | | | | 22,730 | | |
Class W shares | |
Subscriptions | | | 2,225,843 | | | | 22,852,770 | | | | 18,117,939 | | | | 181,441,953 | | |
Distributions reinvested | | | 316,084 | | | | 3,201,931 | | | | — | | | | — | | |
Redemptions | | | (3,283,557 | ) | | | (33,716,457 | ) | | | (245,424 | ) | | | (2,482,059 | ) | |
Net increase (decrease) | | | (741,630 | ) | | | (7,661,756 | ) | | | 17,872,515 | | | | 178,959,894 | | |
Class Y shares | |
Subscriptions | | | 246 | | | | 2,500 | | | | — | | | | — | | |
Net increase | | | 246 | | | | 2,500 | | | | — | | | | — | | |
Class Z shares | |
Subscriptions | | | 2,095,595 | | | | 21,567,975 | | | | 121,008 | | | | 1,181,488 | | |
Distributions reinvested | | | 11,499 | | | | 116,597 | | | | 574 | | | | 5,319 | | |
Redemptions | | | (631,221 | ) | | | (6,463,567 | ) | | | (4,283 | ) | | | (41,935 | ) | |
Net increase | | | 1,475,873 | | | | 15,221,005 | | | | 117,299 | | | | 1,144,872 | | |
Total net increase | | | 23,209,922 | | | | 237,224,074 | | | | 17,796,822 | | | | 178,259,541 | | |
(a) Class R4 and Class Y shares are based on operations from October 1, 2014 (commencement of operations) through the stated period end.
The accompanying Notes to Financial Statements are an integral part of this statement.
Annual Report 2015
21
COLUMBIA ADAPTIVE RISK ALLOCATION FUND
The following tables are intended to help you understand the Fund's financial performance. Certain information reflects financial results for a single share of a class held for the periods shown. Per share net investment income (loss) amounts are calculated based on average shares outstanding during the period. Total return assumes reinvestment of all dividends and distributions, if any. Total return does not reflect payment of sales charges, if any. Total return and portfolio turnover are not annualized for periods of less than one year. The portfolio turnover rate is calculated without regard to purchase and sales transactions of short-term instruments and certain derivatives, if any. If such transactions were included, the Fund's portfolio turnover rate may be higher.
| | | Year Ended May 31, | |
Class A | | 2015 | | 2014 | | 2013(a) | |
Per share data | |
Net asset value, beginning of period | | $ | 10.24 | | | $ | 10.06 | | | $ | 10.00 | | |
Income from investment operations: | |
Net investment income (loss) | | | (0.04 | ) | | | 0.01 | | | | (0.04 | ) | |
Net realized and unrealized gain | | | 0.14 | | | | 0.65 | | | | 0.47 | | |
Increase from payment by affiliate | | | 0.01 | | | | — | | | | — | | |
Total from investment operations | | | 0.11 | | | | 0.66 | | | | 0.43 | | |
Less distributions to shareholders: | |
Net investment income | | | (0.00 | )(b) | | | — | | | | (0.14 | ) | |
Net realized gains | | | (0.18 | ) | | | (0.48 | ) | | | (0.23 | ) | |
Total distributions to shareholders | | | (0.18 | ) | | | (0.48 | ) | | | (0.37 | ) | |
Net asset value, end of period | | $ | 10.17 | | | $ | 10.24 | | | $ | 10.06 | | |
Total return | | | 1.13 | %(c) | | | 7.07 | % | | | 4.15 | % | |
Ratios to average net assets(d) | |
Total gross expenses | | | 1.23 | % | | | 2.01 | % | | | 2.97 | %(e) | |
Total net expenses(f) | | | 1.06 | % | | | 0.75 | % | | | 0.60 | %(e) | |
Net investment income (loss) | | | (0.35 | %) | | | 0.14 | % | | | (0.42 | %)(e) | |
Supplemental data | |
Net assets, end of period (in thousands) | | $ | 169,978 | | | $ | 7,281 | | | $ | 8,139 | | |
Portfolio turnover | | | 256 | % | | | 303 | % | | | 76 | % | |
Notes to Financial Highlights
(a) Based on operations from June 19, 2012 (commencement of operations) through the stated period end.
(b) Rounds to zero.
(c) The Fund received a payment from an affiliate. Had the Fund not received this payment, the total return would have been lower by 0.07%.
(d) In addition to the fees and expenses that the Fund bears directly, the Fund indirectly bears a pro rata share of the fees and expenses of any other funds in which it invests. Such indirect expenses are not included in the Fund's reported expense ratios.
(e) Annualized.
(f) Total net expenses include the impact of certain fee waivers/expense reimbursements made by the Investment Manager and certain of its affiliates, if applicable.
The accompanying Notes to Financial Statements are an integral part of this statement.
Annual Report 2015
22
COLUMBIA ADAPTIVE RISK ALLOCATION FUND
FINANCIAL HIGHLIGHTS (continued)
| | | Year Ended May 31, | |
Class C | | 2015 | | 2014 | | 2013(a) | |
Per share data | |
Net asset value, beginning of period | | $ | 10.11 | | | $ | 10.03 | | | $ | 10.00 | | |
Income from investment operations: | |
Net investment loss | | | (0.11 | ) | | | (0.06 | ) | | | (0.12 | ) | |
Net realized and unrealized gain | | | 0.15 | | | | 0.62 | | | | 0.48 | | |
Increase from payment by affiliate | | | 0.01 | | | | — | | | | — | | |
Total from investment operations | | | 0.05 | | | | 0.56 | | | | 0.36 | | |
Less distributions to shareholders: | |
Net investment income | | | — | | | | — | | | | (0.10 | ) | |
Net realized gains | | | (0.18 | ) | | | (0.48 | ) | | | (0.23 | ) | |
Total distributions to shareholders | | | (0.18 | ) | | | (0.48 | ) | | | (0.33 | ) | |
Net asset value, end of period | | $ | 9.98 | | | $ | 10.11 | | | $ | 10.03 | | |
Total return | | | 0.48 | %(b) | | | 6.07 | % | | | 3.43 | % | |
Ratios to average net assets(c) | |
Total gross expenses | | | 1.98 | % | | | 2.76 | % | | | 3.69 | %(d) | |
Total net expenses(e) | | | 1.81 | % | | | 1.50 | % | | | 1.33 | %(d) | |
Net investment loss | | | (1.11 | %) | | | (0.65 | %) | | | (1.19 | %)(d) | |
Supplemental data | |
Net assets, end of period (in thousands) | | $ | 52,406 | | | $ | 416 | | | $ | 1,387 | | |
Portfolio turnover | | | 256 | % | | | 303 | % | | | 76 | % | |
Notes to Financial Highlights
(a) Based on operations from June 19, 2012 (commencement of operations) through the stated period end.
(b) The Fund received a payment from an affiliate. Had the Fund not received this payment, the total return would have been lower by 0.07%.
(c) In addition to the fees and expenses that the Fund bears directly, the Fund indirectly bears a pro rata share of the fees and expenses of any other funds in which it invests. Such indirect expenses are not included in the Fund's reported expense ratios.
(d) Annualized.
(e) Total net expenses include the impact of certain fee waivers/expense reimbursements made by the Investment Manager and certain of its affiliates, if applicable.
The accompanying Notes to Financial Statements are an integral part of this statement.
Annual Report 2015
23
COLUMBIA ADAPTIVE RISK ALLOCATION FUND
FINANCIAL HIGHLIGHTS (continued)
| | | Year Ended May 31, | |
Class K | | 2015 | | 2014 | | 2013(a) | |
Per share data | |
Net asset value, beginning of period | | $ | 10.25 | | | $ | 10.06 | | | $ | 10.00 | | |
Income from investment operations: | |
Net investment income (loss) | | | (0.03 | ) | | | 0.03 | | | | (0.04 | ) | |
Net realized and unrealized gain | | | 0.15 | | | | 0.64 | | | | 0.47 | | |
Increase from payment by affiliate | | | 0.01 | | | | — | | | | — | | |
Total from investment operations | | | 0.13 | | | | 0.67 | | | | 0.43 | | |
Less distributions to shareholders: | |
Net investment income | | | (0.02 | ) | | | — | | | | (0.14 | ) | |
Net realized gains | | | (0.18 | ) | | | (0.48 | ) | | | (0.23 | ) | |
Total distributions to shareholders | | | (0.20 | ) | | | (0.48 | ) | | | (0.37 | ) | |
Net asset value, end of period | | $ | 10.18 | | | $ | 10.25 | | | $ | 10.06 | | |
Total return | | | 1.25 | %(b) | | | 7.18 | % | | | 4.13 | % | |
Ratios to average net assets(c) | |
Total gross expenses | | | 1.10 | % | | | 1.79 | % | | | 2.90 | %(d) | |
Total net expenses(e) | | | 0.84 | % | | | 0.63 | % | | | 0.63 | %(d) | |
Net investment income (loss) | | | (0.27 | %) | | | 0.35 | % | | | (0.37 | %)(d) | |
Supplemental data | |
Net assets, end of period (in thousands) | | $ | 3 | | | $ | 3 | | | $ | 3 | | |
Portfolio turnover | | | 256 | % | | | 303 | % | | | 76 | % | |
Notes to Financial Highlights
(a) Based on operations from June 19, 2012 (commencement of operations) through the stated period end.
(b) The Fund received a payment from an affiliate. Had the Fund not received this payment, the total return would have been lower by 0.07%.
(c) In addition to the fees and expenses that the Fund bears directly, the Fund indirectly bears a pro rata share of the fees and expenses of any other funds in which it invests. Such indirect expenses are not included in the Fund's reported expense ratios.
(d) Annualized.
(e) Total net expenses include the impact of certain fee waivers/expense reimbursements made by the Investment Manager and certain of its affiliates, if applicable.
The accompanying Notes to Financial Statements are an integral part of this statement.
Annual Report 2015
24
COLUMBIA ADAPTIVE RISK ALLOCATION FUND
FINANCIAL HIGHLIGHTS (continued)
| | | Year Ended May 31, | |
Class R | | 2015 | | 2014 | | 2013(a) | |
Per share data | |
Net asset value, beginning of period | | $ | 10.20 | | | $ | 10.05 | | | $ | 10.00 | | |
Income from investment operations: | |
Net investment loss | | | (0.08 | ) | | | (0.01 | ) | | | (0.07 | ) | |
Net realized and unrealized gain | | | 0.16 | | | | 0.64 | | | | 0.47 | | |
Increase from payment by affiliate | | | 0.01 | | | | — | | | | — | | |
Total from investment operations | | | 0.09 | | | | 0.63 | | | | 0.40 | | |
Less distributions to shareholders: | |
Net investment income | | | — | | | | — | | | | (0.12 | ) | |
Net realized gains | | | (0.18 | ) | | | (0.48 | ) | | | (0.23 | ) | |
Total distributions to shareholders | | | (0.18 | ) | | | (0.48 | ) | | | (0.35 | ) | |
Net asset value, end of period | | $ | 10.11 | | | $ | 10.20 | | | $ | 10.05 | | |
Total return | | | 0.87 | %(b) | | | 6.77 | % | | | 3.90 | % | |
Ratios to average net assets(c) | |
Total gross expenses | | | 1.48 | % | | | 2.26 | % | | | 3.14 | %(d) | |
Total net expenses(e) | | | 1.32 | % | | | 1.00 | % | | | 0.87 | %(d) | |
Net investment loss | | | (0.83 | %) | | | (0.14 | %) | | | (0.74 | %)(d) | |
Supplemental data | |
Net assets, end of period (in thousands) | | $ | 146 | | | $ | 3 | | | $ | 3 | | |
Portfolio turnover | | | 256 | % | | | 303 | % | | | 76 | % | |
Notes to Financial Highlights
(a) Based on operations from June 19, 2012 (commencement of operations) through the stated period end.
(b) The Fund received a payment from an affiliate. Had the Fund not received this payment, the total return would have been lower by 0.07%.
(c) In addition to the fees and expenses that the Fund bears directly, the Fund indirectly bears a pro rata share of the fees and expenses of any other funds in which it invests. Such indirect expenses are not included in the Fund's reported expense ratios.
(d) Annualized.
(e) Total net expenses include the impact of certain fee waivers/expense reimbursements made by the Investment Manager and certain of its affiliates, if applicable.
The accompanying Notes to Financial Statements are an integral part of this statement.
Annual Report 2015
25
COLUMBIA ADAPTIVE RISK ALLOCATION FUND
FINANCIAL HIGHLIGHTS (continued)
Class R4 | | Year Ended
May 31,
2015(a) | |
Per share data | |
Net asset value, beginning of period | | $ | 10.13 | | |
Income from investment operations: | |
Net investment loss | | | (0.02 | ) | |
Net realized and unrealized gain | | | 0.31 | | |
Total from investment operations | | | 0.29 | | |
Less distributions to shareholders: | |
Net investment income | | | (0.03 | ) | |
Net realized gains | | | (0.18 | ) | |
Total distributions to shareholders | | | (0.21 | ) | |
Net asset value, end of period | | $ | 10.21 | | |
Total return | | | 2.87 | % | |
Ratios to average net assets(b) | |
Total gross expenses | | | 0.99 | %(c) | |
Total net expenses(d) | | | 0.82 | %(c) | |
Net investment loss | | | (0.30 | %)(c) | |
Supplemental data | |
Net assets, end of period (in thousands) | | $ | 11,110 | | |
Portfolio turnover | | | 256 | % | |
Notes to Financial Highlights
(a) Based on operations from October 1, 2014 (commencement of operations) through the stated period end.
(b) In addition to the fees and expenses that the Fund bears directly, the Fund indirectly bears a pro rata share of the fees and expenses of any other funds in which it invests. Such indirect expenses are not included in the Fund's reported expense ratios.
(c) Annualized.
(d) Total net expenses include the impact of certain fee waivers/expense reimbursements made by the Investment Manager and certain of its affiliates, if applicable.
The accompanying Notes to Financial Statements are an integral part of this statement.
Annual Report 2015
26
COLUMBIA ADAPTIVE RISK ALLOCATION FUND
FINANCIAL HIGHLIGHTS (continued)
| | | Year Ended May 31, | |
Class R5 | | 2015 | | 2014 | | 2013(a) | |
Per share data | |
Net asset value, beginning of period | | $ | 10.29 | | | $ | 10.07 | | | $ | 10.00 | | |
Income from investment operations: | |
Net investment income (loss) | | | (0.01 | ) | | | 0.07 | | | | (0.03 | ) | |
Net realized and unrealized gain | | | 0.15 | | | | 0.63 | | | | 0.48 | | |
Increase from payment by affiliate | | | 0.01 | | | | — | | | | — | | |
Total from investment operations | | | 0.15 | | | | 0.70 | | | | 0.45 | | |
Less distributions to shareholders: | |
Net investment income | | | (0.04 | ) | | | — | | | | (0.15 | ) | |
Net realized gains | | | (0.18 | ) | | | (0.48 | ) | | | (0.23 | ) | |
Total distributions to shareholders | | | (0.22 | ) | | | (0.48 | ) | | | (0.38 | ) | |
Net asset value, end of period | | $ | 10.22 | | | $ | 10.29 | | | $ | 10.07 | | |
Total return | | | 1.48 | %(b) | | | 7.47 | % | | | 4.37 | % | |
Ratios to average net assets(c) | |
Total gross expenses | | | 0.86 | % | | | 1.54 | % | | | 2.66 | %(d) | |
Total net expenses(e) | | | 0.69 | % | | | 0.38 | % | | | 0.38 | %(d) | |
Net investment income (loss) | | | (0.14 | %) | | | 0.68 | % | | | (0.25 | %)(d) | |
Supplemental data | |
Net assets, end of period (in thousands) | | $ | 1,647 | | | $ | 26 | | | $ | 3 | | |
Portfolio turnover | | | 256 | % | | | 303 | % | | | 76 | % | |
Notes to Financial Highlights
(a) Based on operations from June 19, 2012 (commencement of operations) through the stated period end.
(b) The Fund received a payment from an affiliate. Had the Fund not received this payment, the total return would have been lower by 0.07%.
(c) In addition to the fees and expenses that the Fund bears directly, the Fund indirectly bears a pro rata share of the fees and expenses of any other funds in which it invests. Such indirect expenses are not included in the Fund's reported expense ratios.
(d) Annualized.
(e) Total net expenses include the impact of certain fee waivers/expense reimbursements made by the Investment Manager and certain of its affiliates, if applicable.
The accompanying Notes to Financial Statements are an integral part of this statement.
Annual Report 2015
27
COLUMBIA ADAPTIVE RISK ALLOCATION FUND
FINANCIAL HIGHLIGHTS (continued)
| | | Year Ended May 31, | |
Class W | | 2015 | | 2014 | | 2013(a) | |
Per share data | |
Net asset value, beginning of period | | $ | 10.25 | | | $ | 10.06 | | | $ | 10.00 | | |
Income from investment operations: | |
Net investment income (loss) | | | (0.04 | ) | | | 0.05 | | | | (0.04 | ) | |
Net realized and unrealized gain | | | 0.14 | | | | 0.62 | | | | 0.47 | | |
Increase from payment by affiliate | | | 0.01 | | | | — | | | | — | | |
Total from investment operations | | | 0.11 | | | | 0.67 | | | | 0.43 | | |
Less distributions to shareholders: | |
Net investment income | | | (0.00 | )(b) | | | — | | | | (0.14 | ) | |
Net realized gains | | | (0.18 | ) | | | (0.48 | ) | | | (0.23 | ) | |
Total distributions to shareholders | | | (0.18 | ) | | | (0.48 | ) | | | (0.37 | ) | |
Net asset value, end of period | | $ | 10.18 | | | $ | 10.25 | | | $ | 10.06 | | |
Total return | | | 1.13 | %(c) | | | 7.18 | % | | | 4.15 | % | |
Ratios to average net assets(d) | |
Total gross expenses | | | 1.25 | % | | | 2.01 | % | | | 2.90 | %(e) | |
Total net expenses(f) | | | 0.96 | % | | | 0.75 | % | | | 0.62 | %(e) | |
Net investment income (loss) | | | (0.37 | %) | | | 0.62 | % | | | (0.42 | %)(e) | |
Supplemental data | |
Net assets, end of period (in thousands) | | $ | 174,418 | | | $ | 183,246 | | | $ | 3 | | |
Portfolio turnover | | | 256 | % | | | 303 | % | | | 76 | % | |
Notes to Financial Highlights
(a) Based on operations from June 19, 2012 (commencement of operations) through the stated period end.
(b) Rounds to zero.
(c) The Fund received a payment from an affiliate. Had the Fund not received this payment, the total return would have been lower by 0.07%.
(d) In addition to the fees and expenses that the Fund bears directly, the Fund indirectly bears a pro rata share of the fees and expenses of any other funds in which it invests. Such indirect expenses are not included in the Fund's reported expense ratios.
(e) Annualized.
(f) Total net expenses include the impact of certain fee waivers/expense reimbursements made by the Investment Manager and certain of its affiliates, if applicable.
The accompanying Notes to Financial Statements are an integral part of this statement.
Annual Report 2015
28
COLUMBIA ADAPTIVE RISK ALLOCATION FUND
FINANCIAL HIGHLIGHTS (continued)
Class Y | | Year Ended
May 31,
2015(a) | |
Per share data | |
Net asset value, beginning of period | | $ | 10.15 | | |
Income from investment operations: | |
Net investment loss | | | (0.02 | ) | |
Net realized and unrealized gain | | | 0.32 | | |
Total from investment operations | | | 0.30 | | |
Less distributions to shareholders: | |
Net investment income | | | (0.04 | ) | |
Net realized gains | | | (0.18 | ) | |
Total distributions to shareholders | | | (0.22 | ) | |
Net asset value, end of period | | $ | 10.23 | | |
Total return | | | 2.98 | % | |
Ratios to average net assets(b) | |
Total gross expenses | | | 0.85 | %(c) | |
Total net expenses(d) | | | 0.65 | %(c) | |
Net investment loss | | | (0.28 | %)(c) | |
Supplemental data | |
Net assets, end of period (in thousands) | | $ | 3 | | |
Portfolio turnover | | | 256 | % | |
Notes to Financial Highlights
(a) Based on operations from October 1, 2014 (commencement of operations) through the stated period end.
(b) In addition to the fees and expenses that the Fund bears directly, the Fund indirectly bears a pro rata share of the fees and expenses of any other funds in which it invests. Such indirect expenses are not included in the Fund's reported expense ratios.
(c) Annualized.
(d) Total net expenses include the impact of certain fee waivers/expense reimbursements made by the Investment Manager and certain of its affiliates, if applicable.
The accompanying Notes to Financial Statements are an integral part of this statement.
Annual Report 2015
29
COLUMBIA ADAPTIVE RISK ALLOCATION FUND
FINANCIAL HIGHLIGHTS (continued)
| | | Year Ended May 31, | |
Class Z | | 2015 | | 2014 | | 2013(a) | |
Per share data | |
Net asset value, beginning of period | | $ | 10.28 | | | $ | 10.07 | | | $ | 10.00 | | |
Income from investment operations: | |
Net investment income (loss) | | | (0.02 | ) | | | 0.04 | | | | (0.02 | ) | |
Net realized and unrealized gain | | | 0.15 | | | | 0.65 | | | | 0.47 | | |
Increase from payment by affiliate | | | 0.01 | | | | — | | | | — | | |
Total from investment operations | | | 0.14 | | | | 0.69 | | | | 0.45 | | |
Less distributions to shareholders: | |
Net investment income | | | (0.03 | ) | | | — | | | | (0.15 | ) | |
Net realized gains | | | (0.18 | ) | | | (0.48 | ) | | | (0.23 | ) | |
Total distributions to shareholders | | | (0.21 | ) | | | (0.48 | ) | | | (0.38 | ) | |
Net asset value, end of period | | $ | 10.21 | | | $ | 10.28 | | | $ | 10.07 | | |
Total return | | | 1.37 | %(b) | | | 7.37 | % | | | 4.39 | % | |
Ratios to average net assets(c) | |
Total gross expenses | | | 0.99 | % | | | 1.76 | % | | | 2.66 | %(d) | |
Total net expenses(e) | | | 0.78 | % | | | 0.50 | % | | | 0.35 | %(d) | |
Net investment income (loss) | | | (0.17 | %) | | | 0.41 | % | | | (0.17 | %)(d) | |
Supplemental data | |
Net assets, end of period (in thousands) | | $ | 21,494 | | | $ | 6,470 | | | $ | 5,156 | | |
Portfolio turnover | | | 256 | % | | | 303 | % | | | 76 | % | |
Notes to Financial Highlights
(a) Based on operations from June 19, 2012 (commencement of operations) through the stated period end.
(b) The Fund received a payment from an affiliate. Had the Fund not received this payment, the total return would have been lower by 0.07%.
(c) In addition to the fees and expenses that the Fund bears directly, the Fund indirectly bears a pro rata share of the fees and expenses of any other funds in which it invests. Such indirect expenses are not included in the Fund's reported expense ratios.
(d) Annualized.
(e) Total net expenses include the impact of certain fee waivers/expense reimbursements made by the Investment Manager and certain of its affiliates, if applicable.
The accompanying Notes to Financial Statements are an integral part of this statement.
Annual Report 2015
30
COLUMBIA ADAPTIVE RISK ALLOCATION FUND
NOTES TO FINANCIAL STATEMENTS
May 31, 2015
Note 1. Organization
Columbia Adaptive Risk Allocation Fund (formerly known as Columbia Risk Allocation Fund) (the Fund), a series of Columbia Funds Series Trust I (the Trust), is a non-diversified fund. The Trust is registered under the Investment Company Act of 1940, as amended (the 1940 Act), as an open-end management investment company organized as a Massachusetts business trust. Effective October 1, 2014, Columbia Risk Allocation Fund was renamed Columbia Adaptive Risk Allocation Fund.
The Fund invests significantly in Class I shares of affiliated funds managed by Columbia Management Investment Advisers, LLC (the Investment Manager), a wholly-owned subsidiary of Ameriprise Financial, Inc. (Ameriprise Financial), or its affiliates (affiliated underlying funds) as well as third-party advised (unaffiliated) funds, including exchange-traded funds (ETFs) (Underlying Funds).
For information on the Underlying Funds, please refer to the Fund's current prospectus and the prospectuses of the Underlying Funds.
Fund Shares
The Trust may issue an unlimited number of shares (without par value). The Fund offers Class A, Class C, Class K, Class R, Class R4, Class R5, Class W, Class Y and Class Z shares. Although all share classes generally have identical voting, dividend and liquidation rights, each share class votes separately when required by the Trust's organizational documents or by law. Different share classes pay different distribution amounts to the extent the expenses of such share classes differ, and distributions in liquidation will be proportional to the net asset value of each share class. Each share class has its own expense and sales charge structure.
Class A shares are subject to a maximum front-end sales charge of 5.75% based on the initial investment amount. Class A shares purchased without an initial sales charge in accounts aggregating $1 million to $50 million at the time of purchase are subject to a contingent deferred sales charge (CDSC) if the shares are sold within 18 months after purchase, charged as follows: 1.00% CDSC if redeemed within 12 months after purchase, and 0.50% CDSC if redeemed more than 12, but less than 18, months after purchase.
Class C shares are subject to a 1.00% CDSC on shares redeemed within one year after purchase.
Class K shares are not subject to sales charges, however this share class is closed to new investors.
Class R shares are not subject to sales charges and are generally available only to certain retirement plans and other investors as described in the Fund's prospectus.
Class R4 shares are not subject to sales charges and are generally available only to omnibus retirement plans and certain investors as described in the Fund's prospectus. Class R4 shares commenced operations on October 1, 2014.
Class R5 shares are not subject to sales charges and are generally available only to investors purchasing through authorized investment professionals and omnibus retirement plans.
Class W shares are not subject to sales charges and are available only to investors purchasing through authorized investment programs managed by investment professionals, including discretionary managed account programs.
Class Y shares are not subject to sales charges and are generally available only to certain retirement plans as described in the Fund's prospectus. Class Y shares commenced operations on October 1, 2014.
Class Z shares are not subject to sales charges and are available only to eligible investors, which are subject to different investment minimums as described in the Fund's prospectus.
Note 2. Summary of Significant Accounting Policies
Basis of Preparation
The Fund is an investment company that applies the accounting and reporting guidance in the Financial Accounting Standards Board (FASB) Accounting Standards Codification Topic 946, Financial Services — Investment Companies (ASC 946). The financial statements are prepared in accordance with U.S. generally accepted accounting principles (GAAP), which requires management to make certain estimates and assumptions that affect the reported amounts of assets and liabilities, the disclosure of contingent assets and liabilities at the date of the financial statements and the reported amounts of income and expenses during the reporting period. Actual results could differ from those estimates.
Annual Report 2015
31
COLUMBIA ADAPTIVE RISK ALLOCATION FUND
NOTES TO FINANCIAL STATEMENTS (continued)
May 31, 2015
The following is a summary of significant accounting policies followed by the Fund in the preparation of its financial statements.
Security Valuation
All equity securities and exchange-traded funds (ETFs) are valued at the close of business of the New York Stock Exchange (NYSE). Equity securities and ETFs are valued at the last quoted sales price on the principal exchange or market on which they trade, except for securities traded on the NASDAQ Stock Market, which are valued at the NASDAQ official close price. Unlisted securities or listed securities for which there were no sales during the day are valued at the mean of the latest quoted bid and ask prices on such exchanges or markets.
Debt securities generally are valued by pricing services approved by the Board of Trustees (the Board) based upon market transactions for normal, institutional-size trading units of similar securities. The services may use various pricing techniques that take into account, as applicable, factors such as yield, quality, coupon rate, maturity, type of issue, trading characteristics and other data, as well as broker quotes. Debt securities for which quotations are not readily available or not believed to be reflective of market value may also be valued based upon a bid quote from an approved independent broker-dealer.
Asset and mortgage-backed securities are generally valued by pricing services, which utilize pricing models that incorporate the securities' cash flow and loan performance data. These models also take into account available market data, including trades, market quotations, and benchmark yield curves for identical or similar securities. Factors used to identify similar securities may include, but are not limited to, issuer, collateral type, vintage, prepayment speeds, collateral performance, credit ratings, credit enhancement and expected life. Asset-backed securities for which quotations are readily available may also be valued based upon an over-the-counter or exchange bid quote from an approved independent broker-dealer.
Investments in the Underlying Funds are valued at the net asset value of the applicable class of the Underlying Fund determined as of the close of the NYSE on the valuation date.
Forward foreign currency exchange contracts are marked-to-market based upon foreign currency exchange rates provided by a pricing service.
Futures and options on futures contracts are valued based upon the settlement price at the close of regular trading on their principal exchanges or, in the absence of transactions, at the mean of the latest quoted bid and ask prices.
Option contracts are valued at the mean of the latest quoted bid and asked prices on their primary exchanges. Option contracts, including over-the-counter option contracts, with no readily available market quotations are valued using quotes obtained from independent brokers as of the close of the NYSE.
Swap transactions are valued through an independent pricing service or broker, or if neither is available, through an internal model based upon observable inputs.
Investments for which market quotations are not readily available, or that have quotations which management believes are not reflective of market value or reliable, are valued at fair value as determined in good faith under procedures approved by and under the general supervision of the Board. If a security or class of securities (such as foreign securities) is valued at fair value, such value is likely to be different from the quoted or published price for the security.
The determination of fair value often requires significant judgment. To determine fair value, management may use assumptions including but not limited to future cash flows and estimated risk premiums. Multiple inputs from various sources may be used to determine fair value.
GAAP requires disclosure regarding the inputs and valuation techniques used to measure fair value and any changes in valuation inputs or techniques. In addition, investments shall be disclosed by major category. This information is disclosed following the Fund's Portfolio of Investments.
Foreign Currency Transactions and Translations
The values of all assets and liabilities denominated in foreign currencies are generally translated into U.S. dollars at exchange rates determined at the close of the NYSE. Net realized and unrealized gains (losses) on foreign currency transactions and translations include gains (losses) arising from the fluctuation in exchange rates between trade and settlement dates on securities transactions, gains (losses) arising from the disposition of foreign currency and currency gains (losses) between the accrual and payment dates on dividends, interest income and foreign withholding taxes.
Annual Report 2015
32
COLUMBIA ADAPTIVE RISK ALLOCATION FUND
NOTES TO FINANCIAL STATEMENTS (continued)
May 31, 2015
For financial statement purposes, the Fund does not distinguish that portion of gains (losses) on investments which is due to changes in foreign exchange rates from that which is due to changes in market prices of the investments. Such fluctuations are included with the net realized and unrealized gains (losses) on investments in the Statement of Operations.
Derivative Instruments
The Fund invests in certain derivative instruments, as detailed below, to meet its investment objectives. Derivatives are instruments whose values depend on, or are derived from, in whole or in part, the value of one or more securities, currencies, commodities, indices, or other assets or instruments. Derivatives may be used to increase investment flexibility (including to maintain cash reserves while maintaining desired exposures), for risk management (hedging) purposes, to facilitate trading, to reduce transaction costs and to pursue higher investment returns. The Fund may also use derivative instruments to mitigate certain investment risks, such as foreign currency exchange rate risk, interest rate risk and credit risk. Derivatives may involve various risks, including the potential inability of the counterparty to fulfill its obligation under the terms of the contract, the potential for an illiquid secondary market (making it difficult for the Fund to sell, including at favorable prices) and the potential for market movements which may expose the Fund to gains or losses in excess of the amount shown in the Statement of Assets and Liabilities. The notional amounts of derivative instruments, if applicable, are not recorded in the financial statements.
A derivative instrument may suffer a marked-to-market loss if the value of the contract decreases due to an unfavorable change in the market rates or values of the underlying instrument. Losses can also occur if the counterparty does not perform under the contract. The Fund's risk of loss from counterparty credit risk on over-the-counter derivatives is generally limited to the aggregate unrealized gain netted against any collateral held by the Fund and the amount of any variation margin held by the counterparty. With exchange-traded or centrally cleared derivatives, there is reduced counterparty credit risk to the Fund since the exchange's clearinghouse, as counterparty to such instruments, guarantees against a possible default. The clearinghouse stands between the buyer and the seller of the contract; therefore, the counterparty credit risk is failure of the clearinghouse. However, credit risk still exists in exchange-traded or centrally cleared derivatives with
respect to initial and variation margin that is held in a broker's customer account. While brokers are required to segregate customer margin from their own assets, in the event that a broker becomes insolvent or goes into bankruptcy and at that time there is a shortfall in the aggregate amount of margin held by the broker for all its clients, U.S. bankruptcy laws will typically allocate that shortfall on a pro-rata basis across all the broker's customers (including the Fund), potentially resulting in losses to the Fund.
In order to better define its contractual rights and to secure rights that will help the Fund mitigate its counterparty risk, the Fund may enter into an International Swaps and Derivatives Association, Inc. Master Agreement (ISDA Master Agreement) or similar agreement with its derivative contract counterparties. An ISDA Master Agreement is an agreement between the Fund and a counterparty that governs over-the-counter derivatives and forward foreign currency exchange contracts and typically contains, among other things, collateral posting terms and netting provisions in the event of a default and/or termination event. Under an ISDA Master Agreement, the Fund may, under certain circumstances, offset with the counterparty certain derivative instrument's payables and/or receivables with collateral held and/or posted and create one single net payment. The provisions of the ISDA Master Agreement typically permit a single net payment in the event of default (close-out netting) including the bankruptcy or insolvency of the counterparty. Note, however, that bankruptcy or insolvency laws of a particular jurisdiction may impose restrictions on or prohibitions against the right of offset in bankruptcy, insolvency or other events.
Collateral (margin) requirements differ by type of derivative. Margin requirements are established by the exchange or clearinghouse for exchange-traded and centrally cleared derivatives. Brokers can ask for margin in excess of the minimum in certain circumstances. Collateral terms are contract specific for over-the-counter derivatives. For over-the-counter derivatives traded under an ISDA Master Agreement, the collateral requirements are typically calculated by netting the marked-to-market amount for each transaction under such agreement and comparing that amount to the value of any variation margin currently pledged by the Fund and/or the counterparty. Generally, the amount of collateral due from or to a party has to exceed a minimum transfer amount threshold (e.g., $500,000) before a transfer has to be made. To the extent amounts due to the Fund from its
Annual Report 2015
33
COLUMBIA ADAPTIVE RISK ALLOCATION FUND
NOTES TO FINANCIAL STATEMENTS (continued)
May 31, 2015
counterparties are not fully collateralized, contractually or otherwise, the Fund bears the risk of loss from counterparty nonperformance. The Fund attempts to mitigate counterparty risk by only entering into agreements with counterparties that it believes have the financial resources to honor their obligations and by monitoring the financial stability of those counterparties.
Certain ISDA Master Agreements allow counterparties to over-the-counter derivatives transactions to terminate derivatives contracts prior to maturity in the event the Fund's net assets decline by a stated percentage over a specified time period or if the Fund fails to meet certain terms of the ISDA Master Agreement, which would cause the Fund to accelerate payment of any net liability owed to the counterparty. The Fund also has termination rights if the counterparty fails to meet certain terms of the ISDA Master Agreement. In addition to considering counterparty credit risk, the Fund would consider terminating the derivatives contracts based on whether termination would result in a net liability owed from the counterparty.
For financial reporting purposes, the Fund does not offset derivative assets and derivative liabilities that are subject to netting arrangements in the Statement of Assets and Liabilities.
Forward Foreign Currency Exchange Contracts
Forward foreign currency exchange contracts are over-the-counter agreements between two parties to buy and sell a currency at a set price on a future date. The Fund utilized forward foreign currency exchange contracts to hedge the currency exposure associated with some or all of the Fund's securities, to shift foreign currency exposure back to U.S. dollars, to shift U.S. dollar exposure to achieve a representative weighted mix of major currencies in its benchmark, to generate total return through long and short currency positions versus the U.S. dollar and/or to recover an underweight country exposure in its portfolio. These instruments may be used for other purposes in future periods.
The values of forward foreign currency exchange contracts fluctuate daily with changes in foreign currency exchange rates. Changes in the value of these contracts are recorded as unrealized appreciation or depreciation until the contract is exercised or has expired. The Fund will realize a gain or loss when the forward foreign currency exchange contract is closed or expires.
The use of forward foreign currency exchange contracts does not eliminate fluctuations in the prices of the Fund's
portfolio securities. The risks of forward foreign currency exchange contracts include movement in the values of the foreign currencies relative to the U.S. dollar (or other foreign currencies) and the possibility that counterparties will not complete their contractual obligations, which may be in excess of the amount reflected, if any, in the Statement of Assets and Liabilities.
Futures Contracts
Futures contracts are exchange traded and represent commitments for the future purchase or sale of an asset at a specified price on a specified date. The Fund bought and sold futures contracts to produce incremental earnings, manage the duration and yield curve exposure of the Fund versus the benchmark, manage exposure to movements in interest rates, manage exposure to the securities market and maintain appropriate equity market exposure while keeping sufficient cash to accommodate daily redemptions. These instruments may be used for other purposes in future periods. Upon entering into futures contracts, the Fund bears risks that it may not achieve the anticipated benefits of the futures contracts and may realize a loss. Additional risks include counterparty credit risk, the possibility of an illiquid market, and that a change in the value of the contract or option may not correlate with changes in the value of the underlying asset.
Upon entering into a futures contract, the Fund pledges cash or securities with the broker in an amount sufficient to meet the initial margin requirement. The initial margin deposit must be maintained at an established level over the life of the contract. Cash deposited as initial margin is recorded in the Statement of Assets and Liabilities as margin deposits. Securities deposited as initial margin are designated in the Portfolio of Investments. Subsequent payments (variation margin) are made or received by the Fund each day. The variation margin payments are equal to the daily change in the contract value and are recorded as variation margin receivable or payable and are offset in unrealized gains or losses. The Fund recognizes a realized gain or loss when the contract is closed or expires. Futures contracts involve, to varying degrees, risk of loss in excess of the variation margin disclosed in the Statement of Assets and Liabilities.
Options Contracts
Options are contracts which entitle the holder to purchase or sell securities or other identified assets at a specified price, or in the case of index option contracts, to receive or pay the difference between the index value and the
Annual Report 2015
34
COLUMBIA ADAPTIVE RISK ALLOCATION FUND
NOTES TO FINANCIAL STATEMENTS (continued)
May 31, 2015
strike price of the index option contract. Option contracts can be either exchange-traded or over-the-counter. The Fund purchased and wrote option contracts to protect gains and decrease the Fund's exposure to equity risk and to increase return on investments. These instruments may be used for other purposes in future periods. Completion of transactions for option contracts traded in the over-the-counter market depends upon the performance of the other party. Cash collateral may be collected or posted by the Fund to secure certain over-the-counter option contract trades. Cash collateral held or posted by the Fund for such option contract trades must be returned to the counterparty or the Fund upon closure, exercise or expiration of the contract.
Options contracts purchased are recorded as investments. When the Fund writes an options contract, the premium received is recorded as an asset and an amount equivalent to the premium is recorded as a liability in the Statement of Assets and Liabilities and is subsequently adjusted to reflect the current fair value of the option written. Changes in the fair value of the written option are recorded as unrealized appreciation or depreciation until the contract is exercised or has expired. The Fund will realize a gain or loss when the option contract is closed or expires. When option contracts are exercised, the proceeds on sales for a written call or purchased put option contract, or the purchase cost for a written put or purchased call option contract, is adjusted by the amount of premium received or paid.
For over-the-counter options purchased, the Fund bears the risk of loss of the amount of the premiums paid plus the positive change in market values net of any collateral held by the Fund should the counterparty fail to perform under the contracts. Option contracts written by the Fund do not typically give rise to counterparty credit risk, as options written generally obligate the Fund and not the counterparty to perform. The risk in writing a call option contract is that the Fund gives up the opportunity for profit if the market price of the security increases above the strike price and the option contract is exercised. The risk in writing a put option contract is that the Fund may incur a loss if the market price of the security decreases below the strike price and the option contract is exercised. Exercise of a written option could result in the Fund purchasing or selling a security or foreign currency when it otherwise would not, or at a price different from the current market value. In purchasing and writing options, the Fund bears the risk of an unfavorable
change in the value of the underlying instrument or the risk that the Fund may not be able to enter into a closing transaction due to an illiquid market.
Swap Contracts
Swap contracts are negotiated in the over-the-counter market and may be entered into as a bilateral contract or centrally cleared (centrally cleared swap contract). In a centrally cleared swap contract, immediately following execution of the swap contract with a broker, the swap contract is novated to a central counterparty (the CCP) and the CCP becomes the Fund's counterparty to the centrally cleared swap contract. The Fund is required to deposit initial margin with the broker in the form of cash or securities in an amount that varies depending on the size and risk profile of the particular swap contract. Securities deposited as initial margin are designated in the Portfolio of Investments and cash deposited is recorded in the Statement of Assets and Liabilities as margin deposits. Unlike a bilateral swap contract, for centrally cleared swap contracts, the Fund has minimal credit exposure to the counterparty because the CCP stands between the Fund and the counterparty. Swap contracts are marked-to-market daily and changes in value are recorded as unrealized appreciation (depreciation). The daily change in valuation of centrally cleared swap contracts, if any, is recorded as a receivable or payable for variation margin in the Statement of Assets and Liabilities.
Credit Default Swap Contracts
The Fund entered into credit default swap contracts to increase or decrease its credit exposure to an index. These instruments may be used for other purposes in future periods. Credit default swap contracts are agreements in which one party pays fixed periodic payments to a counterparty in consideration for a guarantee from the counterparty to make a specific payment should a specified credit event(s) take place. Although specified credit events are contract specific, credit events are generally defined as bankruptcy, failure to pay, restructuring, obligation acceleration, obligation default, or repudiation/moratorium.
As the purchaser of a credit default swap contract, the Fund purchases protection by paying a periodic interest rate on the notional amount to the counterparty. The interest amount is accrued daily as a component of unrealized appreciation (depreciation) and is recorded as a realized loss upon payment. If a credit event as specified in the contract occurs, the Fund may have the
Annual Report 2015
35
COLUMBIA ADAPTIVE RISK ALLOCATION FUND
NOTES TO FINANCIAL STATEMENTS (continued)
May 31, 2015
option either to deliver the reference obligation to the seller in exchange for a cash payment of its par amount, or to receive a net cash settlement equal to the par amount less an agreed-upon value of the reference obligation as of the date of the credit event. The difference between the value of the obligation or cash delivered and the notional amount received will be recorded as a realized gain (loss).
As the seller of a credit default swap contract, the Fund sells protection to a buyer and will generally receive a periodic interest rate on the notional amount. The interest amount is accrued daily as a component of unrealized appreciation (depreciation) and is recorded as a realized gain upon receipt of the payment. If a credit event as specified in the contract with the counterparty occurs, the Fund may either be required to accept the reference obligation from the buyer in exchange for a cash payment of its notional amount, or to pay the buyer a net cash settlement equal to the notional amount less an agreed-upon value of the reference obligation (recovery value) as of the date of the credit event. The difference between the value of the obligation or cash received and the notional amount paid will be recorded as a realized gain (loss). The maximum potential amount of undiscounted future payments the Fund could be required to make as the seller of protection under a credit default swap contract is equal to the notional amount of the reference obligation. These potential amounts may be partially offset by any recovery values of the respective reference obligations or premiums received upon entering into the agreement. The notional amounts and market values of all credit default swap contracts in which the Fund is the seller of protection, if any, are disclosed in the Credit Default Swap Contracts Outstanding schedule following the Portfolio of Investments.
As a protection seller, the Fund bears the risk of loss from the credit events specified in the contract with the counterparty. For credit default swap contracts on credit indices, quoted market prices and resulting market values serve as an indicator of the current status of the payment/performance risk. Increasing market values, in absolute terms when compared to the notional amount of the swap, represent a deterioration of the reference entity's credit soundness and a greater likelihood or risk of default or other credit event occurring as defined under the terms of the contract.
Any premium paid or received by the Fund upon entering into a credit default swap contract is recorded as an asset or liability, respectively, and amortized daily as a component of realized gain (loss) in the Statement of Operations. Credit default swap contracts are valued daily, and the change in value is recorded as unrealized appreciation (depreciation) until the termination of the swap, at which time a realized gain (loss) is recorded.
Credit default swap contracts can involve greater risks than if a fund had invested in the reference obligation directly since, in addition to general market risks, credit default swaps are subject to counterparty credit risk, leverage risk, hedging risk, correlation risk and liquidity risk. The Fund will enter into credit default swap transactions only with counterparties that meet certain standards of creditworthiness, as determined by the Investment Manager.
Interest Rate Swap Contracts
The Fund entered into interest rate swap transactions to manage interest rate market risk exposure to produce incremental earnings, to gain exposure to or protect itself from market rate changes and to synthetically add or subtract principal exposure to a market. These instruments may be used for other purposes in future periods. Interest rate swaps are agreements between two parties that involve the exchange of one type of interest rate for another type of interest rate cash flow on specified dates in the future, based on a predetermined, specified notional amount. Certain interest rate swaps are considered forward-starting, whereby the accrual for the exchange of cash flows does not begin until a specified date in the future (the effective date). The net cash flow for a standard interest rate swap transaction is generally the difference between a floating market interest rate versus a fixed interest rate.
Interest rate swaps are valued daily and unrealized appreciation (depreciation) is recorded. Certain interest rate swaps may accrue periodic interest on a daily basis as a component of unrealized appreciation (depreciation); the Fund will realize a gain or loss upon the payment or receipt of accrued interest. The Fund will realize a gain or a loss when the interest rate swap is terminated.
Risks of entering into interest rate swaps include a lack of correlation between the swaps and the portfolio of bonds the swaps are designed to hedge or replicate. A lack of correlation may cause the interest rate swaps to experience adverse changes in value relative to
Annual Report 2015
36
COLUMBIA ADAPTIVE RISK ALLOCATION FUND
NOTES TO FINANCIAL STATEMENTS (continued)
May 31, 2015
expectations. In addition, interest rate swaps are subject to the risk of default of a counterparty, and the risk of adverse movements in market interest rates relative to the interest rate swap positions taken. The Fund's maximum risk of loss from counterparty credit risk is the discounted net value of the cash flows to be received from/paid to the counterparty over the contract's remaining life to the extent that such amount is positive, plus the cost of entering into a similar transaction with another counterparty.
The Fund attempts to mitigate counterparty credit risk by entering into interest rate swap transactions only with counterparties that meet prescribed levels of creditworthiness, as determined by the Investment Manager. The Fund and any counterparty are required to maintain an agreement that requires the Fund and that counterparty to monitor (on a daily basis) the net market value of all derivative transactions entered into pursuant to the agreement between the Fund and such counterparty. If the net market value of such derivatives transactions between the Fund and that counterparty exceeds a certain threshold (as defined in the agreement), the Fund or the counterparty is required to post cash and/or securities as collateral. Market values of derivatives transactions presented in the financial statements are not netted with the market values of other derivatives transactions or with any collateral amounts posted by the Fund or any counterparty.
Effects of Derivative Transactions in the Financial Statements
The following tables are intended to provide additional information about the effect of derivatives on the financial statements of the Fund, including: the fair value of derivatives by risk category and the location of those fair values in the Statement of Assets and Liabilities; and the impact of derivative transactions over the period in the Statement of Operations, including realized and unrealized gains (losses). The derivative instrument schedules following the Portfolio of Investments present additional information regarding derivative instruments outstanding at the end of the period, if any.
The following table provides a summary of the fair value of derivative instruments (not considered to be hedging
instruments for accounting disclosure purposes) at May 31, 2015:
Asset Derivatives | |
Risk Exposure
Category | | Statement of Assets and
Liabilities Location | | Fair Value ($) | |
Credit risk
| | Net assets — unrealized
appreciation on swap
contracts | | | 957,089
| * | |
Equity risk
| | Net assets — unrealized
appreciation on futures
contracts | | | 4,585,627
| * | |
Foreign exchange risk
| | Unrealized appreciation
on forward foreign
currency exchange
contracts | | | 406,012
| | |
Interest rate risk
| | Net assets — unrealized
appreciation on futures
contracts | | | 517,460
| * | |
Interest rate risk
| | Net assets — unrealized
appreciation on swap
contracts | | | 636,957
| * | |
Interest rate risk
| | Premiums paid on
outstanding swap
contracts | | | 84
| | |
Total | | | | | 7,103,229 | | |
Liability Derivatives | |
Risk Exposure
Category | | Statement of Assets and
Liabilities Location | | Fair Value ($) | |
Credit risk
| | Premiums received on
outstanding swap
contracts | | | 3,965,274
| | |
Foreign exchange risk
| | Unrealized depreciation
on forward foreign
currency exchange
contracts | | | 457,444
| | |
Interest rate risk
| | Net assets — unrealized
depreciation on futures
contracts | | | 523,406
| * | |
Total | | | | | 4,946,124 | | |
*Includes cumulative appreciation (depreciation) as reported in the tables following the Portfolio of Investments. Only the current day's variation margin is reported in receivables or payables in the Statement of Assets and Liabilities.
Annual Report 2015
37
COLUMBIA ADAPTIVE RISK ALLOCATION FUND
NOTES TO FINANCIAL STATEMENTS (continued)
May 31, 2015
The following table indicates the effect of derivative instruments (not considered to be hedging instruments for accounting disclosure purposes) in the Statement of Operations for the year ended May 31, 2015:
Amount of Realized Gain (Loss) on Derivatives Recognized in Income | |
Risk Exposure Category | | Forward Foreign
Currency Exchange
Contracts ($) | | Futures
Contracts ($) | | Options Contracts
Written and
Purchased ($) | | Swap
Contracts ($) | | Total ($) | |
Credit risk | | | — | | | | — | | | | — | | | | 534,981 | | | | 534,981 | | |
Equity risk | | | — | | | | 3,576,531 | | | | (123,098 | ) | | | — | | | | 3,453,433 | | |
Foreign exchange risk | | | (1,284,175 | ) | | | — | | | | — | | | | — | | | | (1,284,175 | ) | |
Interest rate risk | | | — | | | | 1,578,633 | | | | — | | | | 315,257 | | | | 1,893,890 | | |
Total | | | (1,284,175 | ) | | | 5,155,164 | | | | (123,098 | ) | | | 850,238 | | | | 4,598,129 | | |
Change in Unrealized Appreciation (Depreciation) on Derivatives Recognized in Income | |
Risk Exposure Category | | Forward Foreign
Currency Exchange
Contracts ($) | | Futures
Contracts ($) | | Swap
Contracts ($) | | Total ($) | |
Credit risk | | | — | | | | — | | | | 388,030 | | | | 388,030 | | |
Equity risk | | | — | | | | 2,412,535 | | | | — | | | | 2,412,535 | | |
Foreign exchange risk | | | (85,923 | ) | | | — | | | | — | | | | (85,923 | ) | |
Interest rate risk | | | — | | | | (63,541 | ) | | | 391,675 | | | | 328,134 | | |
Total | | | (85,923 | ) | | | 2,348,994 | | | | 779,705 | | | | 3,042,776 | | |
The following table provides a summary of the average outstanding volume by derivative instrument for the year ended May 31, 2015:
Derivative Instrument | | Average Notional
Amounts ($)* | |
Futures contracts — Long | | | 142,940,692 | | |
Futures contracts — Short | | | 13,480,716 | | |
Credit default swap
contracts — sell protection | | | 76,531,250
| | |
Derivative Instrument | | Average Unrealized
Appreciation ($)* | | Average Unrealized
Depreciation ($)* | |
Forward foreign currency
exchange contracts | | | 279,611 | | | | (294,665
| ) | |
Interest rate swap contracts | | | 563,915 | | | | — | | |
*Based on the ending quarterly outstanding amounts for the year ended May 31, 2015.
Asset- and Mortgage-Backed Securities
The Fund may invest in asset-backed and mortgage-backed securities. The maturity dates shown represent the original maturity of the underlying obligation. Actual maturity may vary based upon prepayment activity on these obligations. All, or a portion, of the obligation may be prepaid at any time because the underlying asset may
be prepaid. As a result, decreasing market interest rates could result in an increased level of prepayment. An increased prepayment rate will have the effect of shortening the maturity of the security. Unless otherwise noted, the coupon rates presented are fixed rates.
Delayed Delivery Securities
The Fund may trade securities on other than normal settlement terms, including securities purchased or sold on a "when-issued" basis. This may increase risk to the Fund since the other party to the transaction may fail to deliver which could cause the Fund to subsequently invest at less advantageous prices. The Fund designates cash or liquid securities in an amount equal to the delayed delivery commitment.
Treasury Inflation Protected Securities
The Fund may invest in treasury inflation protected securities (TIPS). The principal amount of TIPS is adjusted periodically and is increased for inflation or decreased for deflation based on a monthly published index. These adjustments are recorded as interest income in the Statement of Operations. Coupon payments are based on the adjusted principal at the time the interest is paid.
Annual Report 2015
38
COLUMBIA ADAPTIVE RISK ALLOCATION FUND
NOTES TO FINANCIAL STATEMENTS (continued)
May 31, 2015
Offsetting of Assets and Liabilities
The following tables present the Fund's gross and net amount of assets and liabilities available for offset under netting arrangements as well as any related collateral received or pledged by the Fund as of May 31, 2015:
| | Barclays
($) | | Citibank
($) | | Citigroup
Global
Markets
($) | | HSBC
Securities
(USA), Inc.
($) | | J.P.
Morgan
Securities,
Inc.
($) | | Morgan
Stanley
($) | | Standard
Chartered
Bank
($) | | State
Street
Bank &
Trust
Company
($) | | UBS
Securities
($) | | Total
($) | |
Assets | |
Centrally cleared
credit default
swap contracts(a) | | | — | | | | — | | | | — | | | | — | | | | — | | | | 30,093 | | | | — | | | | — | | | | — | | | | 30,093 | | |
Centrally cleared
interest rate
swap contracts(a) | | | — | | | | — | | | | — | | | | — | | | | — | | | | 31,963 | | | | — | | | | — | | | | — | | | | 31,963 | | |
Forward foreign
currency exchange
contracts | | | 121,922 | | | | — | | | | 4,994 | | | | 118,823 | | | | 5,862 | | | | — | | | | 104,848 | | | | 45,604 | | | | 3,959 | | | | 406,012 | | |
OTC credit default
swap contracts(b) | | | — | | | | — | | | | — | | | | — | | | | — | | | | — | | | | — | | | | — | | | | — | | | | — | | |
Total Assets | | | 121,922 | | | | — | | | | 4,994 | | | | 118,823 | | | | 5,862 | | | | 62,056 | | | | 104,848 | | | | 45,604 | | | | 3,959 | | | | 468,068 | | |
Liabilities | |
Centrally cleared
credit default
swap contracts(a) | | | — | | | | — | | | | — | | | | — | | | | — | | | | — | | | | — | | | | — | | | | — | | | | — | | |
Centrally cleared
interest rate
swap contracts(a) | | | — | | | | — | | | | — | | | | — | | | | — | | | | — | | | | — | | | | — | | | | — | | | | — | | |
Forward foreign
currency exchange
contracts | | | 36,967 | | | | — | | | | 12,166 | | | | 288,208 | | | | 2,727 | | | | — | | | | 41,530 | | | | 75,656 | | | | 190 | | | | 457,444 | | |
OTC credit default
swap contracts(b) | | | — | | | | 3,816,751 | | | | — | | | | — | | | | — | | | | — | | | | — | | | | — | | | | — | | | | 3,816,751 | | |
Total Liabilities | | | 36,967 | | | | 3,816,751 | | | | 12,166 | | | | 288,208 | | | | 2,727 | | | | — | | | | 41,530 | | | | 75,656 | | | | 190 | | | | 4,274,195 | | |
Total Financial
and Derivative
Net Assets | | | 84,955 | | | | (3,816,751 | ) | | | (7,172 | ) | | | (169,385 | ) | | | 3,135 | | | | 62,056 | | | | 63,318 | | | | (30,052 | ) | | | 3,769 | | | | (3,806,127 | ) | |
Total collateral
received (pledged)(c) | | | — | | | | (3,816,751 | ) | | | — | | | | — | | | | — | | | | — | | | | — | | | | — | | | | — | | | | (3,816,751 | ) | |
Net Amount(d) | | | 84,955 | | | | — | | | | (7,172 | ) | | | (169,385 | ) | | | 3,135 | | | | 62,056 | | | | 63,318 | | | | (30,052 | ) | | | 3,769 | | | | 10,624 | | |
(a) Centrally cleared swaps are included within payable/receivable for variation margin on the Statement of Assets and Liabilities.
(b) Over-the-Counter Swap Contracts are presented at market value plus periodic payments receivable (payable), which is comprised of unrealized appreciation, unrealized depreciation, premiums paid and premiums received.
(c) In some instances, the actual collateral received and/or pledged may be more than the amount shown due to overcollateralization.
(d) Represents the net amount due from/(to) counterparties in the event of default.
Security Transactions
Security transactions are accounted for on the trade date. Cost is determined and gains (losses) are based upon the specific identification method for both financial statement and federal income tax purposes.
Income Recognition
Interest income is recorded on an accrual basis. Market premiums and discounts, including original issue discounts, are amortized and accreted, respectively, over the expected life of the security on all debt securities, unless otherwise noted. The Fund classifies gains and
Annual Report 2015
39
COLUMBIA ADAPTIVE RISK ALLOCATION FUND
NOTES TO FINANCIAL STATEMENTS (continued)
May 31, 2015
losses realized on prepayments received on mortgage-backed securities as adjustments to interest income.
The Fund may place a debt security on non-accrual status and reduce related interest income when it becomes probable that the interest will not be collected and the amount of uncollectible interest can be reasonably estimated. A defaulted debt security is removed from non-accrual status when the issuer resumes interest payments or when collectibility of interest is reasonably assured.
Income and capital gain distributions from the Underlying Funds, if any, are recorded on the ex-dividend date.
Expenses
General expenses of the Trust are allocated to the Fund and other funds of the Trust based upon relative net assets or other expense allocation methodologies determined by the nature of the expense. Expenses directly attributable to the Fund are charged to the Fund. Expenses directly attributable to a specific class of shares are charged to that share class.
Determination of Class Net Asset Value
All income, expenses (other than class-specific expenses, which are charged to that share class, as shown in the Statement of Operations) and realized and unrealized gains (losses) are allocated to each class of the Fund on a daily basis, based on the relative net assets of each class, for purposes of determining the net asset value of each class.
Federal Income Tax Status
The Fund intends to qualify each year as a regulated investment company under Subchapter M of the Internal Revenue Code, as amended, and will distribute substantially all of its taxable income (including net short-term capital gains), if any, for its tax year, and as such will not be subject to federal income taxes. In addition, the Fund intends to distribute in each calendar year substantially all of its net investment income, capital gains and certain other amounts, if any, such that the Fund should not be subject to federal excise tax. Therefore, no federal income or excise tax provision is recorded.
Foreign Taxes
The Fund may be subject to foreign taxes on income, gains on investments or currency repatriation, a portion of which may be recoverable. The Fund will accrue such
taxes and recoveries, as applicable, based upon its current interpretation of tax rules and regulations that exist in the markets in which it invests.
Realized gains in certain countries may be subject to foreign taxes at the Fund level, based on statutory rates. The Fund accrues for such foreign taxes on realized and unrealized gains at the appropriate rate for each jurisdiction, as applicable. The amount, if any, is disclosed as a liability on the Statement of Assets and Liabilities.
Distributions to Shareholders
Distributions from net investment income, if any, are declared and paid annually. Net realized capital gains, if any, are distributed along with the income distribution. Income distributions and capital gain distributions are determined in accordance with federal income tax regulations, which may differ from GAAP.
Guarantees and Indemnifications
Under the Trust's organizational documents and, in some cases, by contract, its officers and trustees are indemnified against certain liabilities arising out of the performance of their duties to the Trust or its funds. In addition, certain of the Fund's contracts with its service providers contain general indemnification clauses. The Fund's maximum exposure under these arrangements is unknown since the amount of any future claims that may be made against the Fund cannot be determined, and the Fund has no historical basis for predicting the likelihood of any such claims.
Recent Accounting Pronouncement
Transfers and Servicing (Topic 860), Repurchase-to-Maturity Transactions, Repurchase Financings, and Disclosures
In June 2014, the Financial Accounting Standards Board (FASB) issued Accounting Standards Update (ASU) No. 2014-11, Transfers and Servicing (Topic 860), Repurchase-to-Maturity Transactions, Repurchase Financings, and Disclosures. ASU No. 2014-11 changes the disclosure requirements for certain reverse repurchase agreements and similar transactions accounted for as secured borrowings. The disclosure requirements are effective for annual periods beginning after December 15, 2014, and for interim periods beginning after March 15, 2015. At this time, management is evaluating the implications of this guidance and the impact it will have on the financial statement amounts and footnote disclosures, if any.
Annual Report 2015
40
COLUMBIA ADAPTIVE RISK ALLOCATION FUND
NOTES TO FINANCIAL STATEMENTS (continued)
May 31, 2015
Note 3. Fees and Compensation Paid to Affiliates
Investment Management Fees and Underlying Fund Fees
Under an Investment Management Services Agreement, the Investment Manager determines which securities will be purchased, held or sold. The investment management fee is an annual fee that is a blend of (i) 0.00% on assets invested in affiliated mutual funds, ETFs and closed-end funds that pay an investment advisory fee to the Investment Manager, (ii) 0.10% on assets invested in ETFs and mutual funds that are not managed by the Investment Manager or its affiliates and (iii) an advisory fee that declines from 0.70% to 0.60%, depending on asset levels, on assets invested in securities, instruments and other assets not described above, including affiliated mutual funds, ETFs and closed-end funds advised by the Investment Manager that do not pay an investment advisory fee, ETFs, third party closed-end funds, derivatives and individual securities. The effective investment management fee rate for the year ended May 31, 2015 was 0.59% of the Fund's average daily net assets.
In addition to the fees and expenses which the Fund bears directly, the Fund indirectly bears a pro rata share of the fees and expenses of the Underlying Funds (also referred to as "acquired funds") in which the Fund invests. Because the Underlying Funds have varied expense and fee levels and the Fund may own different proportions of Underlying Funds at different times, the amount of fees and expenses incurred indirectly by the Fund will vary.
Participating Affiliates
The Investment Manager and its investment advisory affiliates (Participating Affiliates) around the world may coordinate in providing services to their clients. Such coordination may include functional leadership of the business (the "Global" business). From time to time the Investment Manager (or any affiliated investment subadviser to the Fund, as the case may be) may engage its Participating Affiliates to provide a variety of services such as investment research, investment monitoring, trading and discretionary investment management (including portfolio management) to certain accounts managed by the Investment Manager, including the Fund. These Participating Affiliates will provide services to the Investment Manager (or any affiliated investment subadviser to the Fund as the case may be) either pursuant to subadvisory agreements, personnel-sharing agreements or similar inter-company arrangements and
the Fund will pay no additional fees and expenses as a result of any such arrangements.
These Participating Affiliates, like the Investment Manager, are direct or indirect subsidiaries of Ameriprise Financial and are registered with appropriate respective regulators in their home jurisdictions and, where required, the Securities and Exchange Commission and the Commodity Futures Trading Commission in the United States.
Pursuant to some of these arrangements, certain employees of these Participating Affiliates may serve as "associated persons" of the Investment Manager and, in this capacity, subject to the oversight and supervision of the Investment Manager and consistent with the investment objectives, policies and limitations set forth in the Fund's prospectus and Statement of Additional Information (SAI), may provide such services to the Fund on behalf of the Investment Manager.
Administration Fees
Under an Administrative Services Agreement, the Investment Manager also serves as the Fund Administrator. The Fund pays the Fund Administrator an annual fee for administration and accounting services equal to a percentage of the Fund's average daily net assets that declines from 0.06% to 0.03% as the Fund's net assets increase. The effective administration fee rate for the year ended May 31, 2015 was 0.06% of the Fund's average daily net assets.
Other Expenses
Other expenses are for, among other things, miscellaneous expenses of the Fund or the Board, including payments to Board Services Corp., a company providing limited administrative services to the Fund and the Board. That company's expenses include boardroom and office expense, employee compensation, employee health and retirement benefits, and certain other expenses. For the year ended May 31, 2015, there were no expenses incurred for these particular items.
Compensation of Board Members
Board members are compensated for their services to the Fund as disclosed in the Statement of Operations. The Trust's independent Trustees may participate in a Deferred Compensation Plan (the Plan) which may be terminated at any time. Obligations of the Plan will be paid solely out of the Fund's assets.
Compensation of Chief Compliance Officer
The Board has appointed a Chief Compliance Officer to the Fund in accordance with federal securities regulations. The Fund is allocated a portion of the
Annual Report 2015
41
COLUMBIA ADAPTIVE RISK ALLOCATION FUND
NOTES TO FINANCIAL STATEMENTS (continued)
May 31, 2015
expenses associated with the Chief Compliance Officer based on relative net assets of the Trust.
Transfer Agency Fees
Under a Transfer and Dividend Disbursing Agent Agreement, Columbia Management Investment Services Corp. (the Transfer Agent), an affiliate of the Investment Manager and a wholly-owned subsidiary of Ameriprise Financial, is responsible for providing transfer agency services to the Fund. The Transfer Agent has contracted with Boston Financial Data Services (BFDS) to serve as sub-transfer agent.
Effective November 1, 2014, the Transfer Agent receives a monthly transfer agency fee based on the number or the average value of accounts, depending on the type of account. Prior to November 1, 2014, the Transfer Agent received a monthly account-based service fee based on the number of open accounts. In addition, the Transfer Agent also receives sub-transfer agency fees based on a percentage of the average aggregate value of the Fund's shares maintained in omnibus accounts (other than omnibus accounts for which American Enterprise Investment Services Inc. is the broker of record or accounts where the beneficial shareholder is a customer of Ameriprise Financial Services, Inc., for which the Transfer Agent receives a per account fee). The Transfer Agent pays the fees of BFDS for services as sub-transfer agent and is not entitled to reimbursement for such fees from the Fund (with the exception of out-of-pocket fees).
The Transfer Agent also receives compensation from the Fund for various shareholder services and reimbursements for certain out-of-pocket fees. Total transfer agency fees for Class K and Class R5 shares are subject to an annual limitation of not more than 0.05% of the average daily net assets attributable to each share class. Class Y shares do not pay transfer agency fees.
For the year ended May 31, 2015, the Fund's effective transfer agency fee rates as a percentage of average daily net assets of each class were as follows:
Class A | | | 0.17 | % | |
Class C | | | 0.17 | | |
Class K | | | 0.05 | | |
Class R | | | 0.17 | | |
Class R4* | | | 0.17 | | |
Class R5 | | | 0.05 | | |
Class W | | | 0.19 | | |
Class Z | | | 0.18 | | |
*Annualized.
An annual minimum account balance fee of $20 may apply to certain accounts with a value below the applicable share class's initial minimum investment requirements to reduce the impact of small accounts on transfer agency fees. These minimum account balance fees are remitted to the Fund and recorded as part of expense reductions in the Statement of Operations. For the year ended May 31, 2015, no minimum account balance fees were charged by the Fund.
Plan Administration Fees
Under a Plan Administration Services Agreement with the Transfer Agent, the Fund pays an annual fee at a rate of 0.25% of the Fund's average daily net assets attributable to Class K shares for the provision of various administrative, recordkeeping, communication and educational services.
Distribution and Service Fees
The Fund has an agreement with Columbia Management Investment Distributors, Inc. (the Distributor), an affiliate of the Investment Manager and a wholly-owned subsidiary of Ameriprise Financial, for distribution and shareholder services. The Board has approved, and the Fund has adopted, distribution and shareholder service plans (the Plans) applicable to certain share classes, which set the distribution and service fees for the Fund. These fees are calculated daily and are intended to compensate the Distributor and/or eligible selling and/or servicing agents for selling shares of the Fund and providing services to investors.
Under the Plans, the Fund pays a monthly service fee to the Distributor at the maximum annual rate of 0.25% of the average daily net assets attributable to Class A, Class C and Class W shares of the Fund. Also under the Plans, the Fund pays a monthly distribution fee to the Distributor at the maximum annual rates of 0.10%, 0.75%, 0.50% and 0.25% of the average daily net assets attributable to Class A, Class C, Class R and Class W shares, respectively.
Although the Fund may pay distribution and service fees up to a maximum annual rate of 0.35% of the Fund's average daily net assets attributable to Class A shares (comprised of up to 0.10% for distribution services and up to 0.25% for shareholder liaison services), the Fund currently limits such fees to an aggregate fee of not more than 0.25% of the Fund's average daily net assets attributable to Class A shares.
Although the Fund may pay a distribution fee up to 0.25% of the Fund's average daily net assets attributable to Class W shares and a service fee of up to 0.25% of the Fund's average daily net assets attributable to Class W
Annual Report 2015
42
COLUMBIA ADAPTIVE RISK ALLOCATION FUND
NOTES TO FINANCIAL STATEMENTS (continued)
May 31, 2015
shares, the aggregate fee shall not exceed 0.25% of the Fund's average daily net assets attributable to Class W shares.
Sales Charges
Sales charges, including front-end charges and CDSCs, received by the Distributor for distributing Fund shares were $614,944 for Class A and $1,823 for Class C shares for the year ended May 31, 2015.
Expenses Waived/Reimbursed by the Investment Manager and its Affiliates
The Investment Manager and certain of its affiliates have contractually agreed to waive fees and/or reimburse expenses (excluding certain fees and expenses described below) for the periods disclosed below, unless sooner terminated at the sole discretion of the Board, so that the Fund's net operating expenses, including indirect expenses of the Underlying Funds and after giving effect to fees waived/expenses reimbursed and any balance credits and/or overdraft charges from the Fund's custodian, do not exceed the following annual rates as a percentage of the class' average daily net assets:
| | | October 1, 2014
through
September 30, 2015 | | Prior to
October 1, 2014 | |
Class A | | | 1.16 | % | | | 0.75 | % | |
Class C | | | 1.91 | | | | 1.50 | | |
Class K | | | 1.04 | | | | 0.63 | | |
Class R | | | 1.41 | | | | 1.00 | | |
Class R4 | | | 0.91 | * | | | — | | |
Class R5 | | | 0.79 | | | | 0.38 | | |
Class W | | | 1.16 | | | | 0.75 | | |
Class Y | | | 0.74 | * | | | — | | |
Class Z | | | 0.91 | | | | 0.50 | | |
*Expense cap rate is contractual from October 1, 2014 (the commencement of operations of each share class) through September 30, 2015.
Under the agreement governing these fee waivers and/or expense reimbursement arrangements, the following fees and expenses are excluded from the waiver/ reimbursement commitment, and therefore will be paid by the Fund, if applicable: taxes (including foreign transaction taxes), transaction costs and brokerage commissions, costs related to any securities lending program, dividend and interest expenses associated with securities sold short, inverse floater program fees and expenses, transaction charges and interest on borrowed money, interest, extraordinary expenses and any other expenses the exclusion of which is specifically approved
by the Board. This agreement may be modified or amended only with approval from all parties. Any fees waived and/or expenses reimbursed under the expense reimbursement arrangements described above are not recoverable by the Investment Manager or its affiliates in future periods.
Note 4. Federal Tax Information
The timing and character of income and capital gain distributions are determined in accordance with income tax regulations, which may differ from GAAP because of temporary or permanent book to tax differences.
At May 31, 2015, these differences are primarily due to differing treatment for deferral/reversal of wash sale losses, Trustees' deferred compensation, distribution reclassifications, foreign currency transactions, net operating loss reclassification, re-characterization of distributions for investments, derivative investments and tax straddles. To the extent these differences are permanent, reclassifications are made among the components of the Fund's net assets in the Statement of Assets and Liabilities. Temporary differences do not require reclassifications. In the Statement of Assets and Liabilities the following reclassifications were made:
Excess of distributions over net investment income | | $ | 770,187 | | |
Accumulated net realized loss | | | (744,808 | ) | |
Paid-in capital | | | (25,379 | ) | |
Net investment income (loss) and net realized gains (losses), as disclosed in the Statement of Operations, and net assets were not affected by this reclassification.
The tax character of distributions paid during the years indicated was as follows:
Year Ended May 31, | | 2015 | | 2014 | |
Ordinary income | | $ | 1,918,527 | | | $ | 389,922 | | |
Long-term capital gains | | | 2,099,166 | | | | 205,784 | | |
Total | | | 4,017,693 | | | | 595,706 | | |
Short-term capital gain distributions, if any, are considered ordinary income distributions for tax purposes.
At May 31, 2015, the components of distributable earnings on a tax basis were as follows:
Undistributed ordinary income | | | 570,544 | | |
Undistributed long-term capital gains | | | 3,670,921 | | |
Net unrealized depreciation | | | (4,464,770 | ) | |
At May 31, 2015, the cost of investments for federal income tax purposes was $458,844,204 and the
Annual Report 2015
43
COLUMBIA ADAPTIVE RISK ALLOCATION FUND
NOTES TO FINANCIAL STATEMENTS (continued)
May 31, 2015
aggregate gross unrealized appreciation and depreciation based on that cost was:
Unrealized appreciation | | $ | 1,273,439 | | |
Unrealized depreciation | | | (5,738,209 | ) | |
Net unrealized depreciation | | | (4,464,770 | ) | |
Management of the Fund has concluded that there are no significant uncertain tax positions in the Fund that would require recognition in the financial statements. However, management's conclusion may be subject to review and adjustment at a later date based on factors including, but not limited to, new tax laws, regulations, and administrative interpretations (including relevant court decisions). Generally, the Fund's federal tax returns for the prior three fiscal years remain subject to examination by the Internal Revenue Service.
Note 5. Portfolio Information
The cost of purchases and proceeds from sales of securities, excluding short-term investments and derivatives, if any, aggregated to $523,749,083 and $364,181,351, respectively, for the year ended May 31, 2015, of which $307,768,733 and $227,631,196, respectively, were U.S. government securities. The amount of purchase and sale activity impacts the portfolio turnover rate reported in the Financial Highlights.
Note 6. Payments by Affiliates
During the year ended May 31, 2015, the Investment Manager reimbursed the Fund $131,751 for a loss on a trading error.
Note 7. Affiliated Money Market Fund
The Fund significantly invests in Columbia Short-Term Cash Fund, an affiliated money market fund established for the exclusive use by the Fund and other affiliated funds. The income earned by the Fund from such investments is included as Dividends — affiliated issuers in the Statement of Operations. As an investing fund, the Fund indirectly bears its proportionate share of the expenses of Columbia Short-Term Cash Fund.
Note 8. Shareholder Concentration
At May 31, 2015, affiliated shareholders of record owned 81.2% of the outstanding shares of the Fund in one or more accounts. Subscription and redemption activity by concentrated accounts may have a significant effect on the operations of the Fund.
Note 9. Line of Credit
The Fund has entered into a revolving credit facility with a syndicate of banks led by JPMorgan Chase Bank, N.A. whereby the Fund may borrow for the temporary funding of shareholder redemptions or for other temporary or emergency purposes. Pursuant to a December 9, 2014 amendment, the credit facility agreement, which is a collective agreement between the Fund and certain other funds managed by the Investment Manager, severally and not jointly, permits collective borrowings up to $550 million. Interest is charged to each participating fund based on its borrowings at a rate equal to the higher of (i) the overnight federal funds rate plus 1.00% or (ii) the one-month LIBOR rate plus 1.00%. Each borrowing under the credit facility matures no later than 60 days after the date of borrowing. The Fund also pays a commitment fee equal to its pro rata share of the amount of the credit facility at a rate of 0.075% per annum. The commitment fee is included in other expenses in the Statement of Operations. Prior to the December 9, 2014 amendment, the credit facility agreement permitted borrowings up to $500 million under the same terms and interest rates as described above.
The Fund had no borrowings during the year ended May 31, 2015.
Note 10. Significant Risks
Commodity-Related Investment Risk
The value of commodities investments will generally be affected by overall market movements and factors specific to a particular industry or commodity, which may include demand for the commodity, weather, embargoes, tariffs, and economic health, political, international, regulatory and other developments. Exposure to commodities and commodities markets may subject the value of the Fund's investments to greater volatility than other types of investments. Commodities investments may also subject the Fund to counterparty risk and liquidity risk. The Fund may make commodity-related investments through one or more wholly-owned subsidiaries organized outside the U.S. that are generally not subject to U.S. laws (including securities laws) and their protections.
Derivatives Risk
Losses involving derivative instruments may be substantial, because a relatively small price movement in the underlying security(ies) commodity, currency or index
Annual Report 2015
44
COLUMBIA ADAPTIVE RISK ALLOCATION FUND
NOTES TO FINANCIAL STATEMENTS (continued)
May 31, 2015
or other instrument or asset may result in a substantial loss for the Fund. In addition to the potential for increased losses, the use of derivative instruments may lead to increased volatility within the Fund. Derivatives will typically increase the Fund's exposure to principal risks to which it is otherwise exposed, and may expose the Fund to additional risks, including correlation risk, counterparty risk, hedging risk, leverage risk and liquidity risk.
Credit Risk
Credit risk is the risk that the value of debt securities in the Fund's portfolio may decline because the issuer may default and fail to pay interest or repay principal when due. Rating agencies assign credit ratings to debt securities to indicate their credit risk. Lower rated or unrated debt securities held by the Fund may present increased credit risk as compared to higher-rated debt securities.
Interest Rate Risk
Interest rate risk is the risk of losses attributable to changes in interest rates. In general, if prevailing interest rates rise, the values of debt securities tend to fall, and if interest rates fall, the values of debt securities tend to rise. Actions by governments and central banking authorities can result in increases in interest rates. Increasing interest rates may negatively affect the value of debt securities held by the Fund, resulting in a negative impact on the Fund's performance and net asset value per share. In general, the longer the maturity or duration of a debt security, the greater its sensitivity to changes in interest rates.
Liquidity Risk
Liquidity risk is the risk associated with a lack of marketability of investments which may make it difficult to sell the investment at a desirable time or price. Changing regulatory, market or other conditions or environments (for example, the interest rate or credit environments) may adversely affect the liquidity of the Fund's investments. The Fund may have to accept a lower selling price for the holding, sell other investments, or forego another, more appealing investment opportunity. Generally, the less liquid the market at the time the Fund sells a portfolio investment, the greater the risk of loss or decline of value to the Fund. A less liquid market can lead to an increase in Fund redemptions, which may negatively impact Fund performance and net asset value per share, including, for
example, if the Fund is forced to sell securities in a down market.
Leverage Risk
Leverage occurs when the Fund increases its assets available for investment using borrowings, short sales, derivatives, or similar instruments or techniques. The use of leverage may make any change in the Fund's net asset value even greater and thus result in increased volatility of returns. Because short sales involve borrowing securities and then selling them, the Fund's short sales effectively leverage the Fund's assets. The Fund's assets that are used as collateral to secure the Fund's obligations to return the securities sold short may decrease in value while the short positions are outstanding, which may force the Fund to use its other assets to increase the collateral. Leverage can create an interest expense that may lower the Fund's overall returns. Leverage presents the opportunity for increased net income and capital gains, but also exaggerates the Fund's risk of loss. There can be no guarantee that a leveraging strategy will be successful.
Non-Diversification Risk
A non-diversified fund is permitted to invest a greater percentage of its total assets in fewer issuers than a diversified fund. The Fund may, therefore, have a greater risk of loss from a few issuers than a similar fund that invests more broadly.
Note 11. Subsequent Events
Management has evaluated the events and transactions that have occurred through the date the financial statements were issued and noted no items requiring adjustment of the financial statements or additional disclosure.
Note 12. Information Regarding Pending and Settled Legal Proceedings
In December 2005, without admitting or denying the allegations, American Express Financial Corporation (AEFC, which is now known as Ameriprise Financial, Inc. (Ameriprise Financial)) entered into settlement agreements with the Securities and Exchange Commission (SEC) and Minnesota Department of Commerce (MDOC) related to market timing activities. As a result, AEFC was censured and ordered to cease and desist from committing or causing any violations of certain provisions of the Investment Advisers Act of 1940, the Investment Company Act of 1940, and various Minnesota laws. AEFC agreed to pay disgorgement of
Annual Report 2015
45
COLUMBIA ADAPTIVE RISK ALLOCATION FUND
NOTES TO FINANCIAL STATEMENTS (continued)
May 31, 2015
$10 million and civil money penalties of $7 million. AEFC also agreed to retain an independent distribution consultant to assist in developing a plan for distribution of all disgorgement and civil penalties ordered by the SEC in accordance with various undertakings detailed at www.sec.gov/litigation/admin/ia-2451.pdf. Ameriprise Financial and its affiliates have cooperated with the SEC and the MDOC in these legal proceedings, and have made regular reports to the Funds' Boards of Trustees.
Ameriprise Financial and certain of its affiliates have historically been involved in a number of legal, arbitration and regulatory proceedings, including routine litigation, class actions, and governmental actions, concerning matters arising in connection with the conduct of their business activities. Ameriprise Financial believes that the Funds are not currently the subject of, and that neither Ameriprise Financial nor any of its affiliates are the subject of, any pending legal, arbitration or regulatory proceedings that are likely to have a material adverse effect on the Funds or the ability of Ameriprise Financial or its affiliates to perform under their contracts with the Funds. Ameriprise Financial is required to make quarterly (10-Q), annual (10-K) and, as necessary, 8-K filings with the SEC on legal and regulatory matters that relate to Ameriprise Financial and its affiliates. Copies of these filings may be obtained by accessing the SEC website at www.sec.gov.
There can be no assurance that these matters, or the adverse publicity associated with them, will not result in increased fund redemptions, reduced sale of fund shares or other adverse consequences to the Funds. Further, although we believe proceedings are not likely to have a material adverse effect on the Funds or the ability of Ameriprise Financial or its affiliates to perform under their contracts with the Funds, these proceedings are subject to uncertainties and, as such, we are unable to estimate the possible loss or range of loss that may result. An adverse outcome in one or more of these proceedings could result in adverse judgments, settlements, fines, penalties or other relief that could have a material adverse effect on the consolidated financial condition or results of operations of Ameriprise Financial.
Annual Report 2015
46
COLUMBIA ADAPTIVE RISK ALLOCATION FUND
REPORT OF INDEPENDENT REGISTERED PUBLIC ACCOUNTING FIRM
To the Trustees of Columbia Funds Series Trust I and the Shareholders of
Columbia Adaptive Risk Allocation Fund (formerly known as Columbia Risk Allocation Fund)
In our opinion, the accompanying statement of assets and liabilities, including the portfolio of investments, and the related statements of operations and of changes in net assets and the financial highlights present fairly, in all material respects, the financial position of Columbia Adaptive Risk Allocation Fund (formerly known as Columbia Risk Allocation Fund) (the "Fund," a series of Columbia Funds Series Trust I) at May 31, 2015, and the results of its operations, the changes in its net assets and the financial highlights for each of the periods indicated, in conformity with accounting principles generally accepted in the United States of America. These financial statements and financial highlights (hereafter referred to as "financial statements") are the responsibility of the Fund's management. Our responsibility is to express an opinion on these financial statements based on our audits. We conducted our audits of these financial statements in accordance with the standards of the Public Company Accounting Oversight Board (United States). Those standards require that we plan and perform the audit to obtain reasonable assurance about whether the financial statements are free of material misstatement. An audit includes examining, on a test basis, evidence supporting the amounts and disclosures in the financial statements, assessing the accounting principles used and significant estimates made by management, and evaluating the overall financial statement presentation. We believe that our audits, which included confirmation of securities at May 31, 2015, by correspondence with the custodian, brokers and transfer agent, and the application of alternative auditing procedures where such confirmations had not been received, provide a reasonable basis for our opinion.
PricewaterhouseCoopers LLP
Minneapolis, MN
July 23, 2015
Annual Report 2015
47
COLUMBIA ADAPTIVE RISK ALLOCATION FUND
FEDERAL INCOME TAX INFORMATION
(Unaudited)
The Fund hereby designates the following tax attributes for the fiscal year ended May 31, 2015. Shareholders will be notified in early 2016 of the amounts for use in preparing 2015 income tax returns.
Tax Designations:
Capital Gain Dividend | | $ | 4,883,152 | | |
Capital Gain Dividend. The Fund designates as a capital gain dividend the amount reflected above, or if subsequently determined to be different, the net capital gain of such fiscal period.
Annual Report 2015
48
COLUMBIA ADAPTIVE RISK ALLOCATION FUND
The Trustees serve terms of indefinite duration. The names and birth years of the Trustees and Officers of the Funds in Columbia Funds Series Trust I, the year each was first elected or appointed to office, their principal business occupations during at least the last five years, the number of Funds overseen by each Trustee and other directorships they hold are shown below. Each officer listed below serves as an officer of each Fund in Columbia Funds Series Trust I. The mailing address of each Trustee is: c/o Columbia Management Investment Advisers, LLC, 225 Franklin Street, Mail Drop BX32 05228, Boston, MA 02110.
Independent Trustees
Name, Year of Birth
and Position Held
with the Trust | | Year First
Appointed or
Elected as
Trustee to any
Fund Currently
in the Columbia
Funds Complex
or a Predecessor
Thereof | | Principal Occupation(s)
during the Past Five Years | | Number
of Funds
in the
Columbia
Funds
Complex
Overseen | | Other Directorships
Held by Trustee During
the Past Five Years | |
Douglas A. Hacker
(Born 1955)
Trustee and Chairman
of the Board | | | 1996 | | | Independent business executive since May 2006; Executive Vice President — Strategy of United Airlines from December 2002 to May 2006; President of UAL Loyalty Services (airline marketing company) from September 2001 to December 2002; Executive Vice President and Chief Financial Officer of United Airlines from July 1999 to September 2001 | | | 60 | | | Spartan Nash Company, (food distributor); Nash Finch Company (food distributor) from 2005 to 2013; Aircastle Limited (aircraft leasing); SeaCube Container Leasing Ltd. (container leasing) from 2010 to 2013; and Travelport Worldwide Limited (travel information technology) | |
Janet Langford Carrig
(Born 1957)
Trustee | | | 1996 | | | Senior Vice President, General Counsel and Corporate Secretary, ConocoPhillips (integrated energy company) since September 2007; Deputy General Counsel — Corporate Legal Services, ConocoPhillips from August 2006 to August 2007; Partner, Zelle, Hofmann, Voelbel, Mason & Gette LLP (law firm) from March 2005 to July 2006; Adjunct Professor of Law, Northwestern University from September 2004 to June 2006; Director, UAL Corporation (airline) from February 2006 to July 2006; Chief Administrative Officer and Senior Vice President, Kmart Holding Corporation (consumer goods) from September 2003 to March 2004 | | | 60 | | | None | |
Nancy T. Lukitsh
(Born 1956)
Trustee | | | 2011 | | | Senior Vice President, Partner and Director of Marketing, Wellington Management Company, LLP (investment adviser) from 1997 to 2010; Chair, Wellington Management Investment Portfolios (commingled non-U.S. investment pools) from 2007 to 2010; Director, Wellington Trust Company, NA and other Wellington affiliates from 1997 to 2010 | | | 60 | | | None | |
William E. Mayer
(Born 1940)
Trustee | | | 1991 | | | Partner, Park Avenue Equity Partners (private equity) since February 1999 | | | 60 | | | DynaVox Inc. (speech creation); Lee Enterprises (print media); WR Hambrecht + Co. (financial service provider) from 2000 to 2012; BlackRock Kelso Capital Corporation (investment company); and Premier, Inc. (healthcare) | |
Annual Report 2015
49
COLUMBIA ADAPTIVE RISK ALLOCATION FUND
TRUSTEES AND OFFICERS (continued)
Independent Trustees (continued)
Name, Year of Birth
and Position Held
with the Trust | | Year First
Appointed or
Elected as
Trustee to any
Fund Currently
in the Columbia
Funds Complex
or a Predecessor
Thereof | | Principal Occupation(s)
during the Past Five Years | | Number
of Funds
in the
Columbia
Funds
Complex
Overseen | | Other Directorships
Held by Trustee During
the Past Five Years | |
David M. Moffett
(Born 1952)
Trustee | | | 2011 | | | Retired. Consultant to Bridgewater and Associates; Chief Executive Officer, Federal Home Loan Mortgage Corporation, from 2008 to 2009; Senior Adviser, Global Financial Services Group, Carlyle Group, Inc., from 2007 to 2008; Vice Chairman and Chief Financial Officer, U.S. Bancorp, from 1993 to 2007 | | | 60 | | | CIT Group Inc. (commercial and consumer finance); eBay Inc. (online trading community); MBIA Inc. (financial service provider); E.W. Scripps Co. (print and television media); Building Materials Holding Corp. (building materials and construction services); Genworth Financial, Inc. (financial and insurance products and services); and University of Oklahoma Foundation | |
Charles R. Nelson
(Born 1942)
Trustee | | | 1981 | | | Retired. Professor Emeritus, University of Washington since 2011; Professor of Economics, University of Washington from 1976 to 2011; Ford and Louisa Van Voorhis Professor of Political Economy, University of Washington from 1993 to 2011; Adjunct Professor of Statistics, University of Washington from 1980 to 2011; Associate Editor, Journal of Money, Credit and Banking from September 1993 to 2008; consultant on econometric and statistical matters | | | 60 | | | None | |
John J. Neuhauser
(Born 1943)
Trustee | | | 1984 | | | President, Saint Michael's College since August 2007; Director or Trustee of several non-profit organizations, including Fletcher Allen Health Care, Inc.; Academic Vice President and Dean of Faculties, Boston College from August 1999 to October 2005; University Professor, Boston College from November 2005 to August 2007 | | | 60 | | | Liberty All-Star Equity Fund and Liberty All-Star Growth Fund (closed-end funds) | |
Patrick J. Simpson
(Born 1944)
Trustee | | | 2000 | | | Partner, Perkins Coie LLP (law firm) | | | 60 | | | None | |
Anne-Lee Verville
(Born 1945)
Trustee | | | 1998 | | | Retired. General Manager, Global Education Industry from 1994 to 1997, President — Application Systems Division from 1991 to 1994, Chief Financial Officer — US Marketing & Services from 1988 to 1991, and Chief Information Officer from 1987 to 1988, IBM Corporation (computer and technology) | | | 60 | | | Enesco Group, Inc. (producer of giftware and home and garden decor products) from 2001 to 2006 | |
Annual Report 2015
50
COLUMBIA ADAPTIVE RISK ALLOCATION FUND
TRUSTEES AND OFFICERS (continued)
Interested Trustee Affiliate with Investment Manager*
Name, Year of Birth
and Position Held
with the Trust | | Year First
Appointed or
Elected as
Trustee to any
Fund Currently
in the Columbia
Funds Complex
or a Predecessor
Thereof | | Principal Occupation(s)
during the Past Five Years | | Number
of Funds
in the
Columbia
Funds
Complex
Overseen | | Other Directorships
Held by Trustee During
the Past Five Years | |
William F. Truscott
(Born 1960)
Trustee | | | 2012 | | | Chairman of the Board and President, Columbia Management Investment Advisers, LLC since May 2010 and February 2012, respectively (previously President and Chief Investment Officer, 2001-April 2010); Chief Executive Officer, Global Asset Management, Ameriprise Financial, Inc. since September 2012 (previously Chief Executive Officer, U.S. Asset Management & President, Annuities, May 2010-September 2012 and President — U.S. Asset Management and Chief Investment Officer, 2005-April 2010); Director and Chief Executive Officer, Columbia Management Investment Distributors, Inc. since May 2010 and February 2012, respectively (previously Chairman of the Board and Chief Executive Officer, 2006-April 2010); Chairman of the Board and Chief Executive Officer, RiverSource Distributors, Inc. since 2006; Director, Threadneedle Asset Management Holdings, SARL since 2014; President and Chief Executive Officer, Ameriprise Certificate Company, 2006-August 2012 | | | 187 | | | Chairman of the Board, Columbia Management Investment Advisers, LLC since May 2010; Director, Columbia Management Investment Distributors, Inc. since May 2010; Director, Ameriprise Certificate Company, 2006 to January 2013 | |
* Interested person (as defined under the 1940 Act) by reason of being an officer, director, security holder and/or employee of the Investment Manager or Ameriprise Financial.
The Statement of Additional Information has additional information about the Fund's Board members and is available, without charge, upon request by calling 800.345.6611; contacting your financial intermediary; or visiting columbiathreadneedle.com/us.
The Board has appointed officers who are responsible for day-to-day business decisions based on policies it has established. The officers serve at the pleasure of the Board. In addition to Mr. Truscott, who is Senior Vice President, the Funds' other officers are:
Fund Officers
Name,
Address and
Year of Birth | | Position and Year
First Appointed to
Position for any Fund
in the Columbia
Funds Complex or a
Predecessor Thereof | | Principal Occupation(s) During Past Five Years | |
Christopher O. Petersen
5228 Ameriprise
Financial Center
Minneapolis, MN 55474
Born 1970 | | President and Principal Executive Officer (2015) | | Vice President and Lead Chief Counsel, Ameriprise Financial, Inc. since January 2015 (previously, Vice President and Chief Counsel January 2010-December 2014; and Vice President and Group Counsel or Counsel 2004- January 2010); officer of Columbia Funds and affiliated funds since 2007. | |
Michael G. Clarke
225 Franklin Street
Boston, MA 02110
Born 1969 | | Treasurer (2011) and Chief Financial Officer (2009) | | Vice President — Mutual Fund Administration, Columbia Management Investment Advisers, LLC, since May 2010; Managing Director of Fund Administration, Columbia Management Advisors, LLC, September 2004-April 2010; senior officer of Columbia Funds and affiliated funds since 2002. | |
Annual Report 2015
51
COLUMBIA ADAPTIVE RISK ALLOCATION FUND
TRUSTEES AND OFFICERS (continued)
Fund Officers (continued)
Name,
Address and
Year of Birth | | Position and Year
First Appointed to
Position for any Fund
in the Columbia
Funds Complex or a
Predecessor Thereof | | Principal Occupation(s) During Past Five Years | |
Paul B. Goucher
100 Park Avenue
New York, NY 10017
Born 1968 | | Senior Vice President (2011), Chief Legal Officer (2015) and Assistant Secretary (2008) | | Vice President and Lead Chief Counsel, Ameriprise Financial, Inc. since November 2008 and January 2013, respectively (previously Chief Counsel, January 2010-January 2013 and Group Counsel, November 2008-January 2010). | |
Thomas P. McGuire
225 Franklin Street
Boston, MA 02110
Born 1972 | | Vice President and Chief Compliance Officer (2012) | | Vice President — Asset Management Compliance, Ameriprise Financial, Inc., since May 2010; Chief Compliance Officer, Ameriprise Certificate Company since September 2010; Compliance Executive, Bank of America, 2005-April 2010. | |
Colin Moore
225 Franklin Street
Boston, MA 02110
Born 1958 | | Senior Vice President (2010) | | Executive Vice President and Global Chief Investment Officer, Ameriprise Financial, Inc., since July 2013; Director and Global Chief Investment Officer, Columbia Management Investment Advisers, LLC since May 2010; Manager, Managing Director and Chief Investment Officer, Columbia Management Advisors, LLC, 2007-April 2010. | |
Michael E. DeFao
225 Franklin Street
Boston, MA 02110
Born 1968 | | Vice President (2011) and Assistant Secretary (2010) | | Vice President and Chief Counsel, Ameriprise Financial, Inc. since May 2010; Associate General Counsel, Bank of America, 2005-April 2010. | |
Joseph F. DiMaria
225 Franklin Street
Boston, MA 02110
Born 1968 | | Vice President (2011), Assistant Treasurer (2012) and Chief Accounting Officer (2008) | | Vice President — Mutual Fund Treasurer, Columbia Management Investment Advisers, LLC since May 2010; Director of Fund Administration, Columbia Management Advisors, LLC, 2006-April 2010. | |
Amy Johnson
5228 Ameriprise
Financial Center
Minneapolis, MN 55474
Born 1965 | | Vice President (2006) | | Managing Director and Chief Operating Officer, Columbia Management Investment Advisers, LLC since May 2010 (previously Chief Administrative Officer, 2009-April 2010, and Vice President — Asset Management and Trust Company Services, 2006-2009). | |
Lyn Kephart-Strong
5228 Ameriprise
Financial Center
Minneapolis, MN 55474
Born 1960 | | Vice President (2015) | | President, Columbia Management Investment Services Corp. since October 2014; Vice President & Resolution Officer, Ameriprise Trust Company since August 2009; President, RiverSource Service Corporation 2004-2010. | |
Ryan C. Larrenaga
225 Franklin Street
Boston, MA 02110
Born 1970 | | Vice President and Secretary (2015) | | Vice President and Group Counsel, Ameriprise Financial, Inc. since August 2011 (previously, Counsel from May 2010 to August 2011); Assistant General Counsel, Bank of America, 2005-April 2010; officer of Columbia Funds and affiliated funds since 2005. | |
Annual Report 2015
52
COLUMBIA ADAPTIVE RISK ALLOCATION FUND
IMPORTANT INFORMATION ABOUT THIS REPORT
Each fund mails one shareholder report to each shareholder address. If you would like more than one report, please call shareholder services at 800.345.6611 and additional reports will be sent to you.
The policy of the Board is to vote the proxies of the companies in which each fund holds investments consistent with the procedures as stated in the Statement of Additional Information (SAI). You may obtain a copy of the SAI without charge by calling 800.345.6611; contacting your financial intermediary; visiting columbiathreadneedle.com/us; or searching the website of the Securities and Exchange Commission (SEC) at sec.gov. Information regarding how each fund voted proxies relating to portfolio securities is filed with the SEC by August 31st for the most recent 12-month period ending June 30th of that year, and is available without charge by visiting columbiathreadneedle.com/us, or searching the website of the SEC at sec.gov.
Each fund files a complete schedule of portfolio holdings with the SEC for the first and third quarters of each fiscal year on Form N-Q. Each fund's Form N-Q is available on the SEC's website at sec.gov and may be reviewed and copied at the SEC's Public Reference Room in Washington, D.C. Information on the operation of the Public Reference Room may be obtained by calling 800.SEC.0330. Each fund's complete schedule of portfolio holdings, as filed on Form N-Q, can also be obtained without charge, upon request, by calling 800.345.6611.
You may obtain the current net asset value (NAV) of Fund shares at no cost by calling 800.345.6611 or by sending an e-mail to serviceinquiries@columbiathreadneedle.com.
Annual Report 2015
53
Columbia Adaptive Risk Allocation Fund
P.O. Box 8081
Boston, MA 02266-8081

This information is for use with concurrent or prior delivery of a fund prospectus. Please read and consider the investment objectives, risks, charges and expenses for any fund carefully before investing. For a prospectus and summary prospectus, which contains this and other important information about the Fund, go to columbiathreadneedle.com/us. The Fund is distributed by Columbia Management Investment Distributors, Inc., member FINRA, and managed by Columbia Management Investment Advisers, LLC.
Columbia Threadneedle Investments (Columbia Threadneedle) is the global brand name of the Columbia and Threadneedle group of companies.
All rights reserved. Columbia Management Investment Distributors, Inc., 225 Franklin Street, Boston, MA 02110-2804
© 2015 Columbia Management Investment Advisers, LLC.
columbiathreadneedle.com/us
ANN214_05_E01_(07/15)

ANNUAL REPORT
May 31, 2015

COLUMBIA DIVERSIFIED ABSOLUTE RETURN FUND

ABOUT COLUMBIA THREADNEEDLE INVESTMENTS
Columbia Threadneedle Investments is a leading global asset management group that provides a broad range of actively managed investment strategies and solutions for individual, institutional and corporate clients around the world.
With more than 2,000 people, including over 450 investment professionals based in North America, Europe and Asia, we manage $506 billion* of assets across developed and emerging market equities, fixed income, asset allocation solutions and alternatives. We are the 12th largest manager of long-term mutual fund assets in the U.S.** and the 5th largest manager of retail funds in the U.K.***
Our priority is the investment success of our clients. We aim to deliver the investment outcomes they expect through an investment approach that is team-based, performance-driven and risk-aware. Our culture is dynamic and interactive. By sharing our insights across asset classes and geographies, we generate richer perspectives on global, regional and local investment landscapes. The ability to exchange and debate investment ideas in a collaborative environment enriches our teams' investment processes. More importantly, it results in better informed investment decisions for our clients.
Columbia funds are distributed by Columbia Management Investment Distributors, Inc., member FINRA, and managed by Columbia Management Investment Advisers, LLC.
Columbia Threadneedle Investments (Columbia Threadneedle) is the global brand name of the Columbia and Threadneedle group of companies.
* In U.S. dollars as of March 31, 2015. Source: Ameriprise Q1 Earnings Release. Includes all assets managed by entities in the Columbia and Threadneedle groups of companies. Contact us for more current data.
** Source: ICI as of March 31, 2015 for Columbia Management Investment Advisers, LLC.
*** Source: Investment Association as of March 2015 for Threadneedle Asset Management Limited.
© 2015 Columbia Management Investment Advisers, LLC. All rights reserved.
Not part of the shareholder report
Get the market insight you need from our investment experts
Connect with Columbia Threadneedle Investments
Investor insight
Find economic and market commentary, investment videos, white papers, mutual fund commentary and more at columbiathreadneedle.com/us.
 Columbia Threadneedle Investor Newsletter (e-newsletter)
Read our award-winning* shareholder newsletter. Our quarterly newsletter is available online and provides timely and relevant content about economic trends, fund news, service enhancements and changes. Sign up to receive the newsletter electronically at columbiathreadneedle.com/
us/newsletter.

 Investment videos
Get analysis of current events and trends that may affect your investments. Visit our online video library to watch and discover what our thought leaders are saying about the financial markets and economy.
 Social media
We offer you multiple ways to access our market commentary and investment insights.
n Perspectives blog at columbiathreadneedle.com/us
Read timely posts by our investment team, including our chief investment officer, chief economist and portfolio managers.
n twitter.com/CTinvest_US
Follow us on Twitter for quick, up-to-the-minute comments on market news and more.
n youtube.com/CTinvestUS
View our commentaries on the economy, markets and current investment opportunities.
n linkedin.com/company/columbia-threadneedle-investments-us
Connect with us on LinkedIn for updates from our thought leaders.
*Columbia Threadneedle Investor Newsletter was awarded top honors in the Mutual Fund Education Alliance STAR Awards competition for excellence in mutual fund marketing and communications in 2011, 2012 and 2013. Materials in the competition were evaluated on educational value, message comprehension, effective design and objectives.
Not part of the shareholder report
Stay informed
Become a subscriber to receive the latest investment publications and mutual fund commentaries
Subscribe to Columbia Threadneedle Investments
Email subscription center
Subscribe to the latest information from Columbia Threadneedle. Visit our email subscription center at columbiathreadneedle.com/us/subscribe to register for economic and market commentary, product and service updates, white papers and more.
n Columbia Threadneedle Investor Newsletter
Quarterly newsletter featuring the latest macro- and micro-economic trends, investment themes, products, service changes and other items of interest to our investors
n Investment Strategy Outlook
Quarterly publication featuring the Columbia Threadneedle Asset Allocation Team's perspective on global economic investment conditions and markets
n MarketTrack
Quarterly publication featuring more than 40 charts and graphs that highlight the current state of the economy and the markets; includes straightforward insight on current investment opportunities
n White papers
Frequent articles that delve deep into a variety of investment topics
n Mutual fund updates
Quarterly portfolio manager commentary and fund fact sheets available for Columbia funds. (Not all funds have a commentary.)
Register your information online at columbiathreadneedle.com/us/subscribe and select the publications you would like to receive. Update your subscriptions at any time by accessing the email subscription center.

 Dear Shareholder,
In a world that is changing faster than ever before, investors want asset managers who offer a global perspective while generating strong and sustainable returns. To that end, Columbia Management, in conjunction with its U.K.-based affiliate, Threadneedle Investments, has rebranded to Columbia Threadneedle Investments. The new global brand represents the combined capabilities, resources and reach of the global group, offering investors access to the best of both firms.
With a presence in 18 countries and more than 450 investment professionals*, our collective perspective and world view as Columbia Threadneedle Investments gives us deeper insight into what might affect the real-life financial outcomes clients are seeking. Putting our views into a global context enables us to build richer perspectives and create the right solutions, and provides us with enhanced capabilities to deliver consistent investment performance, which may ultimately lead to better investor outcomes.
As a result of the rebrand, you will begin to see our new logo and colors reflected in printed materials, such as this shareholder report, as well as on our new website — columbiathreadneedle.com/us. We encourage you to visit us online and view a new video on the "About Us" tab that speaks to the strength of the firm.
While we are introducing a new brand, in many ways, the investment company you know well has not changed. The following remain in effect:
n Fund and strategy names
n Established investment teams, philosophies and processes
n Account services, features, servicing phone numbers and mailing addresses
n Columbia Management Investment Distributors as distributor and Columbia Management Investment Advisers as investment adviser
We recognize that the money we manage represents the hard work and savings of people like you, and that everyone has different ambitions and different definitions of success. Investors have varying goals — funding their children's education, enjoying their retirement, putting money aside for unexpected events, and more. Whatever your ambitions, we believe our wide range of investment products and solutions can help give you confidence that you will reach your goals.
The world is constantly changing, but our priority remains the same: to help you secure your finances, meet your goals and achieve success. Thank you for your continued investment with us. Our service representatives are available at 800.345.6611 to help with any questions.
Sincerely,

Christopher O. Petersen
President, Columbia Funds
Investors should consider the investment objectives, risks, charges and expenses of a mutual fund carefully before investing. For a free prospectus and summary prospectus, which contains this and other important information about a fund, visit columbiathreadneedle.com/us. The prospectus should be read carefully before investing.
* Source: Ameriprise as of December 1, 2014
Columbia Funds are distributed by Columbia Management Investment Distributors, Inc., member FINRA, and managed by Columbia Management Investment Advisers, LLC.
© 2015 Columbia Management Investment Advisers, LLC. All rights reserved.
COLUMBIA DIVERSIFIED ABSOLUTE RETURN FUND
Fund Investment Manager
Columbia Management Investment
Advisers, LLC
225 Franklin Street
Boston, MA 02110
Fund Distributor
Columbia Management Investment
Distributors, Inc.
225 Franklin Street
Boston, MA 02110
Fund Transfer Agent
Columbia Management Investment
Services Corp.
P.O. Box 8081
Boston, MA 02266-8081
For more information about any of the funds, please visit columbiathreadneedle.com/us or call 800.345.6611. Customer Service Representatives are available to answer your questions Monday through Friday from 8 a.m. to 7 p.m. Eastern time.
The views expressed in this report reflect the current views of the respective parties. These views are not guarantees of future performance and involve certain risks, uncertainties and assumptions that are difficult to predict, so actual outcomes and results may differ significantly from the views expressed. These views are subject to change at any time based upon economic, market or other conditions and the respective parties disclaim any responsibility to update such views. These views may not be relied on as investment advice and, because investment decisions for a Columbia fund are based on numerous factors, may not be relied on as an indication of trading intent on behalf of any particular Columbia fund. References to specific securities should not be construed as a recommendation or investment advice.
Portfolio Overview | | | 3 | | |
Understanding Your Fund's Expenses | | | 4 | | |
Consolidated Portfolio of Investments | | | 5 | | |
Consolidated Statement of Assets and Liabilities | | | 31 | | |
Consolidated Statement of Operations | | | 33 | | |
Consolidated Statement of Changes in Net Assets | | | 34 | | |
Consolidated Financial Highlights | | | 36 | | |
Notes to Consolidated Financial Statements | | | 43 | | |
Report of Independent Registered
Public Accounting Firm | | | 58 | | |
Federal Income Tax Information | | | 59 | | |
Trustees and Officers | | | 60 | | |
Board Consideration and Approval of Advisory Agreement
and Subadvisory Agreement | | | 64 | | |
Important Information About This Report | | | 67 | | |
COLUMBIA DIVERSIFIED ABSOLUTE RETURN FUND
PORTFOLIO OVERVIEW
(Unaudited)
Portfolio Breakdown — Long Positions (%)
(at May 31, 2015) | |
Asset-Backed Securities — Non-Agency | | | 0.6 | | |
Commercial Mortgage-Backed Securities — Non-Agency | | | 1.0 | | |
Common Stocks | | | 24.8 | | |
Exchange-Traded Funds | | | 11.1 | | |
Exchange-Traded Notes | | | 1.5 | | |
Foreign Government Obligations | | | 6.8 | | |
Inflation-Indexed Bonds | | | 5.5 | | |
Residential Mortgage-Backed Securities — Agency | | | 0.0 | (a) | |
Residential Mortgage-Backed Securities — Non-Agency | | | 0.8 | | |
U.S. Treasury Obligations | | | 3.4 | | |
Short-Term Investments Segregated in Connection
with Open Derivatives Contracts(b) | | | 62.3 | | |
Total | | | 117.8 | | |
Percentages indicated are based upon total investments. The Fund's portfolio composition is subject to change.
(a) Rounds to zero.
(b) Includes investments in Money Market Funds (amounting to $58.7 million) which have been segregated to cover obligations relating to the Fund's investment in derivatives which provide exposure to multiple markets. For a description of the Fund's investments in derivatives, see Investments in Derivatives following the Consolidated Portfolio of Investments and Note 2 to the Notes to Consolidated Financial Statements.
Portfolio Breakdown — Short Positions (%)
(at May 31, 2015) | |
Common Stocks | | | (17.8 | ) | |
Total | | | (17.8 | ) | |
Percentages indicated are based upon total investments. The Fund's portfolio composition is subject to change.
Portfolio Management
Jeffrey Knight, CFA
Kent Peterson, Ph.D.
Brian Virginia
William Landes, Ph.D.
Annual Report 2015
3
COLUMBIA DIVERSIFIED ABSOLUTE RETURN FUND
UNDERSTANDING YOUR FUND'S EXPENSES
(Unaudited)
As an investor, you incur two types of costs. There are transaction costs, which generally include sales charges on purchases and may include redemption fees. There are also ongoing costs, which generally include management fees, distribution and/or service fees, and other fund expenses. The following information is intended to help you understand your ongoing costs (in dollars) of investing in the Fund and to help you compare these costs with the ongoing costs of investing in other mutual funds.
Analyzing Your Fund's Expenses
To illustrate these ongoing costs, we have provided examples and calculated the expenses paid by investors in each share class of the Fund during the period. The actual and hypothetical information in the table is based on an initial investment of $1,000 at the beginning of the period indicated and held for the entire period. Expense information is calculated two ways and each method provides you with different information. The amount listed in the "Actual" column is calculated using the Fund's actual operating expenses and total return for the period. You may use the Actual information, together with the amount invested, to estimate the expenses that you paid over the period. Simply divide your account value by $1,000 (for example, an $8,600 account value divided by $1,000 = 8.6), then multiply the results by the expenses paid during the period under the "Actual" column. The amount listed in the "Hypothetical" column assumes a 5% annual rate of return before expenses (which is not the Fund's actual return) and then applies the Fund's actual expense ratio for the period to the hypothetical return. You should not use the hypothetical account values and expenses to estimate either your actual account balance at the end of the period or the expenses you paid during the period. See "Compare With Other Funds" below for details on how to use the hypothetical data.
Compare With Other Funds
Since all mutual funds are required to include the same hypothetical calculations about expenses in shareholder reports, you can use this information to compare the ongoing cost of investing in the Fund with other funds. To do so, compare the hypothetical example with the 5% hypothetical examples that appear in the shareholder reports of other funds. As you compare hypothetical examples of other funds, it is important to note that hypothetical examples are meant to highlight the ongoing costs of investing in a fund only and do not reflect any transaction costs, such as sales charges, or redemption or exchange fees. Therefore, the hypothetical calculations are useful in comparing ongoing costs only, and will not help you determine the relative total costs of owning different funds. If transaction costs were included in these calculations, your costs would be higher.
December 1, 2014 – May 31, 2015
| | | Account Value at the Beginning
of the Period ($) | | Account Value at the End of the
Period ($) | | Expenses Paid During the
Period ($) | | Fund's Annualized
Expense Ratio (%) | |
| | | Actual | | Hypothetical | | Actual | | Hypothetical | | Actual | | Hypothetical | | Actual | |
Class A | | | 1,000.00 | | | | 1,000.00 | | | | 1,010.00 | (a) | | | 1,015.01 | | | | 5.48 | (a) | | | 10.00 | | | | 1.99 | (a) | |
Class C | | | 1,000.00 | | | | 1,000.00 | | | | 1,008.00 | (a) | | | 1,011.22 | | | | 7.56 | (a) | | | 13.79 | | | | 2.75 | (a) | |
Class I | | | 1,000.00 | | | | 1,000.00 | | | | 1,011.00 | (a) | | | 1,016.50 | | | | 4.66 | (a) | | | 8.50 | | | | 1.69 | (a) | |
Class R4 | | | 1,000.00 | | | | 1,000.00 | | | | 1,011.00 | (a) | | | 1,016.26 | | | | 4.79 | (a) | | | 8.75 | | | | 1.74 | (a) | |
Class R5 | | | 1,000.00 | | | | 1,000.00 | | | | 1,011.00 | (a) | | | 1,016.26 | | | | 4.79 | (a) | | | 8.75 | | | | 1.74 | (a) | |
Class W | | | 1,000.00 | | | | 1,000.00 | | | | 1,010.00 | (a) | | | 1,014.96 | | | | 5.51 | (a) | | | 10.05 | | | | 2.00 | (a) | |
Class Z | | | 1,000.00 | | | | 1,000.00 | | | | 1,011.00 | (a) | | | 1,016.21 | | | | 4.82 | (a) | | | 8.80 | | | | 1.75 | (a) | |
(a) Based on operations from February 19, 2015 (commencement of operations) through the stated period end.
Expenses paid during the period are equal to the annualized expense ratio for each class as indicated above, multiplied by the average account value over the period and then multiplied by the number of days in the Fund's most recent fiscal half year and divided by 365.
Expenses do not include fees and expenses incurred indirectly by the Fund from its investment in underlying funds, including affiliated and non-affiliated pooled investment vehicles, such as mutual funds and exchange-traded funds.
Had Columbia Management Investment Advisers, LLC and/or certain of its affiliates not waived/reimbursed certain fees and expenses, account value at the end of the period would have been reduced.
Annual Report 2015
4
COLUMBIA DIVERSIFIED ABSOLUTE RETURN FUND
CONSOLIDATED PORTFOLIO OF INVESTMENTS
May 31, 2015
(Percentages represent value of investments compared to net assets)
Common Stocks 21.6%
Issuer | | Shares | | Value ($) | |
CONSUMER DISCRETIONARY 2.8% | |
Auto Components 0.1% | |
Delphi Automotive PLC(a) | | | 916 | | | | 79,674 | | |
Visteon Corp.(a)(b) | | | 471 | | | | 51,584 | | |
Total | | | | | 131,258 | | |
Hotels, Restaurants & Leisure 0.2% | |
Darden Restaurants, Inc.(a) | | | 2,217 | | | | 145,302 | | |
Starwood Hotels & Resorts Worldwide, Inc.(a) | | | 650 | | | | 53,794 | | |
Total | | | | | 199,096 | | |
Household Durables 0.3% | |
Jarden Corp.(a)(b) | | | 1,691 | | | | 89,724 | | |
Newell Rubbermaid, Inc. | | | 5,090 | | | | 201,208 | | |
Total | | | | | 290,932 | | |
Internet & Catalog Retail 0.4% | |
Amazon.com, Inc.(a)(b) | | | 100 | | | | 42,923 | | |
Ctrip.com International Ltd., ADR(a)(b) | | | 926 | | | | 73,960 | | |
Expedia, Inc.(a) | | | 940 | | | | 100,824 | | |
Liberty Ventures, Inc., Class A(a)(b) | | | 1,899 | | | | 78,808 | | |
Priceline Group, Inc. (The)(b) | | | 90 | | | | 105,484 | | |
Total | | | | | 401,999 | | |
Media 0.9% | |
Cinemark Holdings, Inc.(a) | | | 7,570 | | | | 306,812 | | |
Comcast Corp., Class A(a) | | | 5,922 | | | | 346,200 | | |
DISH Network Corp., Class A(a)(b) | | | 4,639 | | | | 328,395 | | |
Liberty Global PLC, Class A(a)(b) | | | 835 | | | | 48,038 | | |
Total | | | | | 1,029,445 | | |
Multiline Retail 0.3% | |
Big Lots, Inc.(a) | | | 2,011 | | | | 88,283 | | |
Burlington Stores, Inc.(a)(b) | | | 1,774 | | | | 93,614 | | |
Dillard's, Inc., Class A(a) | | | 232 | | | | 26,914 | | |
Hudson's Bay Co. | | | 3,365 | | | | 68,918 | | |
Total | | | | | 277,729 | | |
Specialty Retail 0.4% | |
Cabela's, Inc.(a)(b) | | | 3,460 | | | | 176,460 | | |
Foot Locker, Inc.(a) | | | 1,146 | | | | 72,427 | | |
Home Depot, Inc. (The)(a) | | | 1,566 | | | | 174,484 | | |
Total | | | | | 423,371 | | |
Common Stocks (continued)
Issuer | | Shares | | Value ($) | |
Textiles, Apparel & Luxury Goods 0.2% | |
Hanesbrands, Inc. | | | 2,483 | | | | 79,108 | | |
Nike, Inc., Class B(a) | | | 889 | | | | 90,385 | | |
Sequential Brands Group, Inc.(a)(b) | | | 5,519 | | | | 77,100 | | |
Total | | | | | 246,593 | | |
Total Consumer Discretionary | | | | | 3,000,423 | | |
CONSUMER STAPLES 1.0% | |
Beverages 0.2% | |
Coca-Cola Enterprises, Inc.(a) | | | 716 | | | | 31,669 | | |
Constellation Brands, Inc., Class A(a) | | | 293 | | | | 34,542 | | |
Dr. Pepper Snapple Group, Inc.(a) | | | 296 | | | | 22,685 | | |
PepsiCo, Inc.(a) | | | 984 | | | | 94,887 | | |
Total | | | | | 183,783 | | |
Food & Staples Retailing 0.2% | |
CVS Health Corp.(a) | | | 1,597 | | | | 163,501 | | |
Kroger Co. (The)(a) | | | 458 | | | | 33,342 | | |
Total | | | | | 196,843 | | |
Food Products 0.4% | |
Archer-Daniels-Midland Co. | | | 2,719 | | | | 143,699 | | |
Hershey Co. (The)(a) | | | 177 | | | | 16,436 | | |
Mead Johnson Nutrition Co.(a) | | | 233 | | | | 22,671 | | |
Mondelez International, Inc., Class A(a) | | | 1,635 | | | | 68,000 | | |
Pilgrim's Pride Corp.(a) | | | 6,404 | | | | 163,815 | | |
Tyson Foods, Inc., Class A(a) | | | 834 | | | | 35,403 | | |
Total | | | | | 450,024 | | |
Household Products —% | |
Energizer Holdings, Inc.(a) | | | 308 | | | | 43,641 | | |
Personal Products 0.1% | |
Avon Products, Inc.(a) | | | 15,945 | | | | 107,150 | | |
Nu Skin Enterprises, Inc., Class A(a) | | | 448 | | | | 22,669 | | |
Total | | | | | 129,819 | | |
Tobacco 0.1% | |
Altria Group, Inc.(a) | | | 997 | | | | 51,046 | | |
Philip Morris International, Inc.(a) | | | 785 | | | | 65,210 | | |
Total | | | | | 116,256 | | |
Total Consumer Staples | | | | | 1,120,366 | | |
The accompanying Notes to Consolidated Financial Statements are an integral part of this statement.
Annual Report 2015
5
COLUMBIA DIVERSIFIED ABSOLUTE RETURN FUND
CONSOLIDATED PORTFOLIO OF INVESTMENTS (continued)
May 31, 2015
Common Stocks (continued)
Issuer | | Shares | | Value ($) | |
ENERGY 1.8% | |
Energy Equipment & Services 0.4% | |
Halliburton Co.(a) | | | 4,262 | | | | 193,495 | | |
National Oilwell Varco, Inc.(a) | | | 725 | | | | 35,663 | | |
Weatherford International PLC(a)(b) | | | 15,850 | | | | 219,047 | | |
Total | | | | | 448,205 | | |
Oil, Gas & Consumable Fuels 1.4% | |
Anadarko Petroleum Corp.(a) | | | 2,628 | | | | 219,727 | | |
| BP PLC, ADR | | | 2,969 | | | | 123,095 | | |
Canadian Natural Resources Ltd.(a) | | | 673 | | | | 20,755 | | |
Cimarex Energy Co.(a) | | | 1,155 | | | | 133,414 | | |
Devon Energy Corp.(a) | | | 640 | | | | 41,741 | | |
Exxon Mobil Corp.(a) | | | 3,291 | | | | 280,393 | | |
HollyFrontier Corp. | | | 1,660 | | | | 69,139 | | |
Kinder Morgan, Inc.(a) | | | 1,908 | | | | 79,163 | | |
Marathon Petroleum Corp. | | | 616 | | | | 63,731 | | |
Occidental Petroleum Corp.(a) | | | 532 | | | | 41,597 | | |
Royal Dutch Shell PLC, ADR, Class A | | | 2,025 | | | | 120,933 | | |
Suncor Energy, Inc.(a) | | | 1,337 | | | | 39,081 | | |
Valero Energy Corp.(a) | | | 1,060 | | | | 62,794 | | |
Williams Companies, Inc. (The)(a) | | | 565 | | | | 28,871 | | |
WPX Energy, Inc.(b) | | | 11,277 | | | | 145,361 | | |
Total | | | | | 1,469,795 | | |
Total Energy | | | | | 1,918,000 | | |
FINANCIALS 3.3% | |
Banks 1.0% | |
CIT Group, Inc.(a) | | | 2,723 | | | | 125,966 | | |
Citigroup, Inc.(a) | | | 4,010 | | | | 216,861 | | |
Fifth Third Bancorp(a) | | | 6,770 | | | | 137,025 | | |
TCF Financial Corp.(a) | | | 9,343 | | | | 147,059 | | |
Umpqua Holdings Corp. | | | 9,003 | | | | 158,362 | | |
Wells Fargo & Co.(a) | | | 5,724 | | | | 320,315 | | |
Total | | | | | 1,105,588 | | |
Capital Markets 0.6% | |
Goldman Sachs Group, Inc. (The)(a) | | | 2,117 | | | | 436,504 | | |
Invesco Ltd.(a) | | | 4,853 | | | | 193,295 | | |
Total | | | | | 629,799 | | |
Common Stocks (continued)
Issuer | | Shares | | Value ($) | |
Consumer Finance 0.3% | |
American Express Co.(a) | | | 2,515 | | | | 200,496 | | |
Navient Corp.(a) | | | 6,576 | | | | 126,719 | | |
Total | | | | | 327,215 | | |
Diversified Financial Services 0.3% | |
Berkshire Hathaway, Inc., Class B(a)(b) | | | 1,394 | | | | 199,342 | | |
Moody's Corp.(a) | | | 1,005 | | | | 108,641 | | |
Total | | | | | 307,983 | | |
Insurance 0.5% | |
ACE Ltd.(a) | | | 1,797 | | | | 191,345 | | |
Assured Guaranty Ltd.(a) | | | 4,854 | | | | 138,776 | | |
MetLife, Inc. | | | 1,427 | | | | 74,575 | | |
XL Group PLC | | | 4,033 | | | | 151,963 | | |
Total | | | | | 556,659 | | |
Real Estate Investment Trusts (REITs) 0.4% | |
Alexandria Real Estate Equities, Inc.(a) | | | 3,185 | | | | 295,345 | | |
CBL & Associates Properties, Inc.(a) | | | 6,383 | | | | 112,660 | | |
Total | | | | | 408,005 | | |
Real Estate Management & Development 0.2% | |
St. Joe Co. (The)(b) | | | 12,795 | | | | 203,825 | | |
Total Financials | | | | | 3,539,074 | | |
HEALTH CARE 4.5% | |
Biotechnology 2.0% | |
Alexion Pharmaceuticals, Inc.(b) | | | 747 | | | | 122,389 | | |
Alkermes PLC(a)(b) | | | 1,371 | | | | 83,768 | | |
Arrowhead Research Corp.(a)(b) | | | 20,780 | | | | 130,914 | | |
BioMarin Pharmaceutical, Inc.(a)(b) | | | 349 | | | | 43,824 | | |
Bluebird Bio, Inc.(a)(b) | | | 1,044 | | | | 202,797 | | |
Blueprint Medicines Corp.(a)(b) | | | 7,031 | | | | 201,719 | | |
Clovis Oncology, Inc.(a)(b) | | | 2,663 | | | | 246,168 | | |
Curis, Inc.(b) | | | 51,190 | | | | 172,510 | | |
Dynavax Technologies Corp.(a)(b) | | | 9,909 | | | | 225,628 | | |
Incyte Corp.(a)(b) | | | 386 | | | | 42,518 | | |
Juno Therapeutics, Inc.(a)(b) | | | 1,138 | | | | 59,904 | | |
Merrimack Pharmaceuticals, Inc.(b) | | | 2,172 | | | | 25,630 | | |
Novavax, Inc.(b) | | | 18,605 | | | | 167,445 | | |
Regulus Therapeutics, Inc.(a)(b) | | | 13,115 | | | | 185,184 | | |
Vertex Pharmaceuticals, Inc.(a)(b) | | | 2,104 | | | | 269,922 | | |
Total | | | | | 2,180,320 | | |
The accompanying Notes to Consolidated Financial Statements are an integral part of this statement.
Annual Report 2015
6
COLUMBIA DIVERSIFIED ABSOLUTE RETURN FUND
CONSOLIDATED PORTFOLIO OF INVESTMENTS (continued)
May 31, 2015
Common Stocks (continued)
Issuer | | Shares | | Value ($) | |
Health Care Equipment & Supplies 0.7% | |
Align Technology, Inc.(a)(b) | | | 4,156 | | | | 252,144 | | |
HeartWare International, Inc.(a)(b) | | | 1,765 | | | | 130,204 | | |
Medtronic PLC(a) | | | 4,805 | | | | 366,718 | | |
Total | | | | | 749,066 | | |
Health Care Providers & Services 1.1% | |
Aetna, Inc.(a) | | | 1,875 | | | | 221,194 | | |
AmerisourceBergen Corp.(a) | | | 1,358 | | | | 152,857 | | |
Cardinal Health, Inc.(a) | | | 1,711 | | | | 150,859 | | |
Centene Corp.(b) | | | 3,483 | | | | 262,409 | | |
CIGNA Corp.(a) | | | 1,087 | | | | 153,082 | | |
Express Scripts Holding Co.(b) | | | 1,146 | | | | 99,862 | | |
Health Net, Inc.(a)(b) | | | 1,818 | | | | 113,152 | | |
Laboratory Corp. of America Holdings(a)(b) | | | 934 | | | | 110,165 | | |
Total | | | | | 1,263,580 | | |
Life Sciences Tools & Services 0.1% | |
Thermo Fisher Scientific, Inc.(a) | | | 635 | | | | 82,315 | | |
Pharmaceuticals 0.6% | |
Actavis PLC(a)(b) | | | 719 | | | | 220,597 | | |
Impax Laboratories, Inc.(a)(b) | | | 1,512 | | | | 71,079 | | |
Merck & Co., Inc.(a) | | | 1,863 | | | | 113,438 | | |
Pernix Therapeutics Holdings, Inc.(b) | | | 15,025 | | | | 95,709 | | |
Pfizer, Inc.(a) | | | 3,628 | | | | 126,073 | | |
Total | | | | | 626,896 | | |
Total Health Care | | | | | 4,902,177 | | |
INDUSTRIALS 2.6% | |
Aerospace & Defense 0.5% | |
Honeywell International, Inc.(a) | | | 1,210 | | | | 126,082 | | |
Lockheed Martin Corp.(a) | | | 1,845 | | | | 347,229 | | |
Northrop Grumman Corp.(a) | | | 369 | | | | 58,738 | | |
Total | | | | | 532,049 | | |
Airlines 0.3% | |
Alaska Air Group, Inc.(a) | | | 1,620 | | | | 104,717 | | |
Copa Holdings SA, Class A(a) | | | 1,365 | | | | 116,421 | | |
Southwest Airlines Co.(a) | | | 1,886 | | | | 69,876 | | |
Total | | | | | 291,014 | | |
Building Products —% | |
USG Corp.(a)(b) | | | 1,607 | | | | 46,346 | | |
Common Stocks (continued)
Issuer | | Shares | | Value ($) | |
Electrical Equipment 0.2% | |
Rockwell Automation, Inc. | | | 1,600 | | | | 196,624 | | |
Industrial Conglomerates 0.1% | |
Carlisle Companies, Inc.(a) | | | 755 | | | | 74,858 | | |
Machinery 1.0% | |
FANUC Corp., ADR | | | 7,010 | | | | 264,277 | | |
IDEX Corp.(a) | | | 2,695 | | | | 208,216 | | |
Ingersoll-Rand PLC(a) | | | 4,635 | | | | 318,795 | | |
Lincoln Electric Holdings, Inc.(a) | | | 1,960 | | | | 131,732 | | |
Navistar International Corp.(a)(b) | | | 952 | | | | 25,209 | | |
Snap-On, Inc.(a) | | | 653 | | | | 101,476 | | |
Terex Corp. | | | 2,580 | | | | 63,803 | | |
Total | | | | | 1,113,508 | | |
Professional Services 0.1% | |
Dun & Bradstreet Corp. (The)(a) | | | 801 | | | | 102,472 | | |
Road & Rail 0.3% | |
JB Hunt Transport Services, Inc.(a) | | | 1,069 | | | | 89,817 | | |
Kansas City Southern(a) | | | 940 | | | | 85,070 | | |
Union Pacific Corp. | | | 1,790 | | | | 180,629 | | |
Total | | | | | 355,516 | | |
Trading Companies & Distributors 0.1% | |
WESCO International, Inc.(a)(b) | | | 1,294 | | | | 92,987 | | |
Total Industrials | | | | | 2,805,374 | | |
INFORMATION TECHNOLOGY 4.3% | |
Communications Equipment 0.4% | |
Cisco Systems, Inc. | | | 4,256 | | | | 124,743 | | |
F5 Networks, Inc.(a)(b) | | | 1,056 | | | | 132,729 | | |
Palo Alto Networks, Inc.(a)(b) | | | 1,001 | | | | 169,659 | | |
Total | | | | | 427,131 | | |
Internet Software & Services 0.9% | |
eBay, Inc.(b) | | | 2,643 | | | | 162,175 | | |
Google, Inc., Class A(a)(b) | | | 507 | | | | 276,477 | | |
Google, Inc., Class C(a)(b) | | | 466 | | | | 247,963 | | |
HomeAway, Inc.(a)(b) | | | 4,250 | | | | 119,298 | | |
Rackspace Hosting, Inc.(a)(b) | | | 2,351 | | | | 94,252 | | |
VeriSign, Inc.(a)(b) | | | 2,355 | | | | 148,812 | | |
Total | | | | | 1,048,977 | | |
The accompanying Notes to Consolidated Financial Statements are an integral part of this statement.
Annual Report 2015
7
COLUMBIA DIVERSIFIED ABSOLUTE RETURN FUND
CONSOLIDATED PORTFOLIO OF INVESTMENTS (continued)
May 31, 2015
Common Stocks (continued)
Issuer | | Shares | | Value ($) | |
IT Services 0.4% | |
EPAM Systems, Inc.(a)(b) | | | 3,060 | | | | 220,045 | | |
Visa, Inc., Class A | | | 2,808 | | | | 192,853 | | |
Total | | | | | 412,898 | | |
Semiconductors & Semiconductor Equipment 0.7% | |
Altera Corp. | | | 790 | | | | 38,592 | | |
Avago Technologies Ltd. | | | 890 | | | | 131,782 | | |
Cypress Semiconductor Corp. | | | 5,411 | | | | 74,293 | | |
Lam Research Corp.(a) | | | 1,588 | | | | 130,613 | | |
Micron Technology, Inc.(a)(b) | | | 3,133 | | | | 87,505 | | |
Qorvo, Inc.(b) | | | 1,485 | | | | 121,993 | | |
Skyworks Solutions, Inc.(a) | | | 1,359 | | | | 148,620 | | |
Total | | | | | 733,398 | | |
Software 1.3% | |
Activision Blizzard, Inc.(a) | | | 9,775 | | | | 246,917 | | |
Electronic Arts, Inc.(a)(b) | | | 5,598 | | | | 351,302 | | |
Fortinet, Inc.(a)(b) | | | 2,570 | | | | 102,954 | | |
salesforce.com, inc.(a)(b) | | | 1,725 | | | | 125,494 | | |
SolarWinds, Inc.(a)(b) | | | 2,322 | | | | 110,179 | | |
Tableau Software, Inc., Class A(b) | | | 1,065 | | | | 120,569 | | |
VMware, Inc., Class A(b) | | | 3,094 | | | | 270,168 | | |
Workday, Inc., Class A(a)(b) | | | 882 | | | | 69,607 | | |
Total | | | | | 1,397,190 | | |
Technology Hardware, Storage & Peripherals 0.6% | |
Apple, Inc.(a) | | | 3,167 | | | | 412,597 | | |
Electronics for Imaging, Inc.(a)(b) | | | 2,801 | | | | 121,087 | | |
EMC Corp.(a) | | | 3,745 | | | | 98,643 | | |
Total | | | | | 632,327 | | |
Total Information Technology | | | | | 4,651,921 | | |
MATERIALS 0.8% | |
Chemicals 0.3% | |
Dow Chemical Co. (The)(a) | | | 1,113 | | | | 57,954 | | |
Eastman Chemical Co.(a) | | | 599 | | | | 45,985 | | |
EI du Pont de Nemours & Co.(a) | | | 505 | | | | 35,860 | | |
Monsanto Co.(a) | | | 1,307 | | | | 152,893 | | |
PPG Industries, Inc. | | | 260 | | | | 59,512 | | |
Total | | | | | 352,204 | | |
Common Stocks (continued)
Issuer | | Shares | | Value ($) | |
Containers & Packaging —% | |
Sonoco Products Co.(a) | | | 763 | | | | 34,350 | | |
Metals & Mining 0.3% | |
Alcoa, Inc. | | | 2,221 | | | | 27,762 | | |
Freeport-McMoRan, Inc.(a) | | | 6,468 | | | | 127,096 | | |
Nucor Corp.(a) | | | 436 | | | | 20,623 | | |
Rio Tinto PLC, ADR(a) | | | 418 | | | | 18,296 | | |
Steel Dynamics, Inc. | | | 975 | | | | 21,265 | | |
United States Steel Corp.(a) | | | 5,703 | | | | 139,153 | | |
Total | | | | | 354,195 | | |
Paper & Forest Products 0.2% | |
Domtar Corp.(a) | | | 1,444 | | | | 62,410 | | |
International Paper Co. | | | 1,782 | | | | 92,361 | | |
Total | | | | | 154,771 | | |
Total Materials | | | | | 895,520 | | |
TELECOMMUNICATION SERVICES 0.1% | |
Diversified Telecommunication Services 0.1% | |
CenturyLink, Inc.(a) | | | 3,660 | | | | 121,658 | | |
Total Telecommunication Services | | | | | 121,658 | | |
UTILITIES 0.4% | |
Electric Utilities 0.3% | |
American Electric Power Co., Inc.(a) | | | 566 | | | | 31,860 | | |
Entergy Corp.(a) | | | 1,817 | | | | 138,946 | | |
ITC Holdings Corp.(a) | | | 940 | | | | 33,173 | | |
Pinnacle West Capital Corp.(a) | | | 1,344 | | | | 81,877 | | |
Xcel Energy, Inc.(a) | | | 868 | | | | 29,555 | | |
Total | | | | | 315,411 | | |
Multi-Utilities 0.1% | |
Ameren Corp.(a) | | | 765 | | | | 30,776 | | |
DTE Energy Co.(a) | | | 464 | | | | 36,763 | | |
PG&E Corp.(a) | | | 561 | | | | 29,996 | | |
Total | | | | | 97,535 | | |
Total Utilities | | | | | 412,946 | | |
Total Common Stocks
(Cost: $22,868,212) | | | | | 23,367,459 | | |
The accompanying Notes to Consolidated Financial Statements are an integral part of this statement.
Annual Report 2015
8
COLUMBIA DIVERSIFIED ABSOLUTE RETURN FUND
CONSOLIDATED PORTFOLIO OF INVESTMENTS (continued)
May 31, 2015
Residential Mortgage-Backed Securities —
Agency —%
Issuer | | Coupon
Rate | | Principal
Amount ($) | | Value ($) | |
Federal Home Loan Mortgage Corp.
CMO IO Series 326 Class S2(c)(d)
03/15/44 | | | 5.764 | % | | | | | | | 92,582 | | | | 22,677 | | |
Total Residential Mortgage-Backed
Securities — Agency
(Cost: $23,106) | | | | | | | | | 22,677 | | |
Residential Mortgage-Backed Securities —
Non-Agency 0.7%
Credit Suisse Mortgage Capital Certificates(c)(e)
CMO Series 2014-RPL4 Class A1
08/25/62 | | | 3.625 | % | | | | | | | 240,779 | | | | 239,913 | | |
CMO Series 2014-RPL4 Class A2
08/25/62 | | | 4.322 | % | | | | | | | 500,000 | | | | 476,366 | | |
Total Residential Mortgage-Backed
Securities — Non-Agency
(Cost: $716,138) | | | | | | | | | 716,279 | | |
Commercial Mortgage-Backed Securities —
Non-Agency 0.9%
American Homes 4 Rent
Series 2015-SFR1 Class A(e)
04/17/52 | | | 3.467 | % | | | | | | | 249,626 | | | | 254,043 | | |
Banc of America Merrill Lynch Re-Remic Trust
Series 2014-FRR7 Class A(c)(e)
10/26/44 | | | 2.431 | % | | | | | | | 500,000 | | | | 492,626 | | |
VFC LLC
Series 2015-3 Class A(e)
12/20/31 | | | 2.750 | % | | | | | | | 227,478 | | | | 226,955 | | |
Total Commercial Mortgage-Backed
Securities — Non-Agency
(Cost: $971,785) | | | | | | | | | 973,624 | | |
Asset-Backed Securities — Non-Agency 0.5%
Oak Hill Advisors Residential Loan Trust
Series 2015-NPL1 Class A1(c)(e)
01/25/55 | | | 3.475 | % | | | | | | | 385,758 | | | | 386,010 | | |
Westgate Resorts LLC
Series 2013-1A Class B(e)
08/20/25 | | | 3.750 | % | | | | | | | 219,698 | | | | 220,970 | | |
Total Asset-Backed Securities — Non-Agency
(Cost: $607,828) | | | | | | | | | 606,980 | | |
Inflation-Indexed Bonds(f) 4.8%
Issuer | | Coupon
Rate | | Principal
Amount ($) | | Value ($) | |
FRANCE 0.1% | |
France Government Bond OAT
07/25/24 | | | 0.250 | % | | EUR | 101,430 | | | | 121,018 | | |
GERMANY 0.5% | |
Bundesrepublik Deutschland
Bundesobligation Inflation-Linked Bond
04/15/18 | | | 0.750 | % | | EUR | 424,460 | | | | 484,843 | | |
ITALY 0.4% | |
Italy Buoni Poliennali Del Tesoro
09/15/19 | | | 2.350 | % | | EUR | 66,319 | | | | 80,099 | | |
09/15/21 | | | 2.100 | % | | EUR | 64,906 | | | | 78,824 | | |
09/15/26 | | | 3.100 | % | | EUR | 31,767 | | | | 42,998 | | |
09/15/41 | | | 2.550 | % | | EUR | 135,605 | | | | 181,337 | | |
Total | | | | | | | 383,258 | | |
NEW ZEALAND 0.1% | |
New Zealand Government Bond
09/20/25 | | | 2.000 | % | | NZD | 154,726 | | | | 109,011 | | |
SWEDEN —% | |
Sweden Inflation-Linked Bond
06/01/25 | | | 1.000 | % | | SEK | 284,068 | | | | 39,149 | | |
UNITED KINGDOM 0.4% | |
United Kingdom Gilt Inflation-Linked Bond
03/22/34 | | | 0.750 | % | | GBP | 94,089 | | | | 190,599 | | |
03/22/44 | | | 0.125 | % | | GBP | 143,153 | | | | 287,272 | | |
Total | | | | | | | 477,871 | | |
UNITED STATES 3.3% | |
U.S. Treasury Inflation-Indexed Bond
04/15/19 | | | 0.125 | % | | | 251,823 | | | | 255,954 | | |
01/15/21 | | | 1.125 | % | | | 798,445 | | | | 849,970 | | |
01/15/22 | | | 0.125 | % | | | 782,122 | | | | 782,489 | | |
01/15/24 | | | 0.625 | % | | | 136,561 | | | | 140,850 | | |
01/15/25 | | | 2.375 | % | | | 75,130 | | | | 89,962 | | |
01/15/27 | | | 2.375 | % | | | 257,488 | | | | 313,592 | | |
01/15/29 | | | 2.500 | % | | | 450,729 | | | | 566,652 | | |
02/15/40 | | | 2.125 | % | | | 218,404 | | | | 278,806 | | |
02/15/44 | | | 1.375 | % | | | 237,994 | | | | 265,047 | | |
Total | | | | | | | 3,543,322 | | |
Total Inflation-Indexed Bonds
(Cost: $5,177,943) | | | | | | | 5,158,472 | | |
The accompanying Notes to Consolidated Financial Statements are an integral part of this statement.
Annual Report 2015
9
COLUMBIA DIVERSIFIED ABSOLUTE RETURN FUND
CONSOLIDATED PORTFOLIO OF INVESTMENTS (continued)
May 31, 2015
U.S. Treasury Obligations 3.0%
Issuer | | Coupon
Rate | | Principal
Amount ($) | | Value ($) | |
U.S. Treasury
02/28/21 | | | 2.000 | % | | | | | | | 90,000 | | | | 91,723 | | |
04/30/16 | | | 0.375 | % | | | | | | | 600,000 | | | | 600,515 | | |
03/31/20 | | | 1.375 | % | | | | | | | 526,900 | | | | 525,089 | | |
08/15/26 | | | 6.750 | % | | | | | | | 90,000 | | | | 131,041 | | |
08/15/27 | | | 6.375 | % | | | | | | | 70,000 | | | | 100,844 | | |
11/15/40 | | | 4.250 | % | | | | | | | 90,000 | | | | 113,597 | | |
02/15/42 | | | 3.125 | % | | | | | | | 180,000 | | | | 189,464 | | |
02/15/21 | | | 3.625 | % | | | | | | | 180,000 | | | | 199,491 | | |
10/31/18 | | | 1.750 | % | | | | | | | 365,000 | | | | 373,127 | | |
12/31/19 | | | 1.125 | % | | | | | | | 545,000 | | | | 538,103 | | |
01/31/20 | | | 1.375 | % | | | | | | | 180,000 | | | | 179,648 | | |
08/15/23 | | | 2.500 | % | | | | | | | 35,000 | | | | 36,441 | | |
08/15/43 | | | 3.625 | % | | | | | | | 140,000 | | | | 161,142 | | |
Total U.S. Treasury Obligations
(Cost: $3,251,337) | | | | | | | | | 3,240,225 | | |
Foreign Government Obligations(f)(g) 5.9%
AUSTRALIA 0.9% | |
Australia Government Bond
10/21/19 | | | 2.750 | % | | AUD | 170,000 | | | | 133,791 | | |
04/21/25 | | | 3.250 | % | | AUD | 1,005,000 | | | | 802,327 | | |
Total | | | | | | | 936,118 | | |
BELGIUM 0.2% | |
Belgium Government Bond(e)
06/22/24 | | | 2.600 | % | | EUR | 140,000 | | | | 179,471 | | |
BRAZIL 1.7% | |
Brazil Notas do Tesouro Nacional Series F
01/01/25 | | | 10.000 | % | | BRL | 2,000,000 | | | | 578,618 | | |
Brazil Notas do Tesouro Nacional
01/01/17 | | | 10.000 | % | | BRL | 4,000,000 | | | | 1,250,192 | | |
Total | | | | | | | 1,828,810 | | |
COLOMBIA 0.1% | |
Colombia Government International Bond
03/21/23 | | | 4.375 | % | | COP | 280,000,000 | | | | 100,218 | | |
GERMANY 0.4% | |
Bundesrepublik Deutschland
02/15/25 | | | 0.500 | % | | EUR | 437,858 | | | | 481,096 | | |
ITALY 0.5% | |
Italy Buoni Poliennali Del Tesoro
11/01/26 | | | 7.250 | % | | EUR | 350,000 | | | | 586,110 | | |
MEXICO 0.9% | |
Mexican Bonos
06/10/21 | | | 6.500 | % | | MXN | 2,000,000 | | | | 135,374 | | |
12/07/23 | | | 8.000 | % | | MXN | 5,000,000 | | | | 368,162 | | |
11/23/34 | | | 7.750 | % | | MXN | 6,870,000 | | | | 502,957 | | |
Total | | | | | | | 1,006,493 | | |
Foreign Government Obligations(f)(g) (continued)
Issuer | | Coupon
Rate | | Principal
Amount ($) | | Value ($) | |
ROMANIA 0.2% | |
Romania Government Bond
02/24/25 | | | 4.750 | % | | RON | 1,000,000 | | | | 272,491 | | |
SPAIN 0.2% | |
Spain Government Bond(e)
01/31/22 | | | 5.850 | % | | EUR | 125,000 | | | | 177,021 | | |
TURKEY 0.2% | |
Turkey Government Bond
07/10/19 | | | 8.500 | % | | TRY | 300,000 | | | | 110,143 | | |
02/05/20 | | | 7.400 | % | | TRY | 300,000 | | | | 105,100 | | |
Total | | | | | | | 215,243 | | |
UNITED KINGDOM 0.6% | |
United Kingdom Gilt
03/07/25 | | | 5.000 | % | | GBP | 335,000 | | | | 657,821 | | |
Total Foreign Government Obligations
(Cost: $6,559,273) | | | | | | | 6,440,892 | | |
Exchange-Traded Funds 9.7%
| | | Shares | | Value ($) | |
iShares JP Morgan USD Emerging
Markets Bond ETF | | | 14,933 | | | | 1,678,021 | | |
iShares MBS ETF | | | 11,382 | | | | 1,250,085 | | |
iShares MSCI Canada ETF | | | 14,082 | | | | 391,198 | | |
iShares US Real Estate ETF | | | 24,233 | | | | 1,823,049 | | |
iShares iBoxx $ High Yield
Corporate Bond ETF | | | 36,485 | | | | 3,316,851 | | |
iShares iBoxx $ Investment Grade
Corporate Bond ETF | | | 17,209 | | | | 2,035,309 | | |
Total Exchange-Traded Funds
(Cost: $10,657,806) | | | | | 10,494,513 | | |
Exchange-Traded Notes 1.2%
Issuer | | Shares | | Value ($) | |
CONSUMER DISCRETIONARY 1.2% | |
iPath Bloomberg Commodity Index
Total Return ETN(b) | | | 47,746 | | | | 1,364,103 | | |
Total Consumer Discretionary | | | | | 1,364,103 | | |
Total Exchange-Traded Notes
(Cost: $1,393,629) | | | | | 1,364,103 | | |
The accompanying Notes to Consolidated Financial Statements are an integral part of this statement.
Annual Report 2015
10
COLUMBIA DIVERSIFIED ABSOLUTE RETURN FUND
CONSOLIDATED PORTFOLIO OF INVESTMENTS (continued)
May 31, 2015
Money Market Funds 54.2%
| | | Shares | | Value ($) | |
Columbia Short-Term Cash Fund,
0.114%(h)(i) | | | 58,711,963 | | | | 58,711,963 | | |
Total Money Market Funds
(Cost: $58,711,963) | | | | | 58,711,963 | | |
Total Investments
(Cost: $110,939,020) | | | | | 111,097,187 | | |
Investments Sold Short (15.5)%
Common Stocks (15.5)%
Issuer | | Shares | | Value ($) | |
CONSUMER DISCRETIONARY (1.8)% | |
Hotels, Restaurants & Leisure (0.6)% | |
Cheesecake Factory, Inc. (The) | | | (3,235 | ) | | | (166,829 | ) | |
Chipotle Mexican Grill, Inc.(b) | | | (155 | ) | | | (95,405 | ) | |
Choice Hotels International, Inc. | | | (1,880 | ) | | | (106,352 | ) | |
Dunkin' Brands Group, Inc. | | | (905 | ) | | | (48,291 | ) | |
Marriott International, Inc., Class A | | | (608 | ) | | | (47,418 | ) | |
McDonald's Corp. | | | (449 | ) | | | (43,072 | ) | |
Panera Bread Co., Class A(b) | | | (625 | ) | | | (113,750 | ) | |
Total | | | | | (621,117 | ) | |
Internet & Catalog Retail (0.1)% | |
Groupon, Inc.(b) | | | (13,125 | ) | | | (83,738 | ) | |
Media (0.4)% | |
DreamWorks Animation SKG, Inc.,
Class A(b) | | | (3,476 | ) | | | (93,678 | ) | |
Meredith Corp. | | | (478 | ) | | | (25,238 | ) | |
Omnicom Group, Inc. | | | (761 | ) | | | (56,717 | ) | |
Regal Entertainment Group, Class A | | | (8,456 | ) | | | (177,238 | ) | |
Thomson Reuters Corp. | | | (812 | ) | | | (32,448 | ) | |
WPP PLC, ADR | | | (325 | ) | | | (38,535 | ) | |
Total | | | | | (423,854 | ) | |
Multiline Retail (0.1)% | |
Kohl's Corp. | | | (433 | ) | | | (28,357 | ) | |
Macy's, Inc. | | | (626 | ) | | | (41,911 | ) | |
Total | | | | | (70,268 | ) | |
Investments Sold Short (continued)
Common Stocks (continued)
Issuer | | Shares | | Value ($) | |
Specialty Retail (0.5)% | |
AutoZone, Inc.(b) | | | (240 | ) | | | (161,669 | ) | |
Bed Bath & Beyond, Inc.(b) | | | (642 | ) | | | (45,787 | ) | |
Cabela's, Inc.(b) | | | (1,578 | ) | | | (80,478 | ) | |
Carmax, Inc.(b) | | | (1,387 | ) | | | (98,532 | ) | |
Dick's Sporting Goods, Inc. | | | (3,540 | ) | | | (190,169 | ) | |
O'Reilly Automotive, Inc.(b) | | | (152 | ) | | | (33,369 | ) | |
Total | | | | | (610,004 | ) | |
Textiles, Apparel & Luxury Goods (0.1)% | |
Fossil Group, Inc.(b) | | | (557 | ) | | | (39,553 | ) | |
Michael Kors Holdings Ltd.(b) | | | (860 | ) | | | (39,990 | ) | |
Ralph Lauren Corp. | | | (310 | ) | | | (40,424 | ) | |
Total | | | | | (119,967 | ) | |
Total Consumer Discretionary | | | | | (1,928,948 | ) | |
CONSUMER STAPLES (0.6)% | |
Food & Staples Retailing (0.4)% | |
Costco Wholesale Corp. | | | (292 | ) | | | (41,636 | ) | |
Sprouts Farmers Market, Inc.(b) | | | (6,955 | ) | | | (208,581 | ) | |
Wal-Mart Stores, Inc. | | | (644 | ) | | | (47,830 | ) | |
Walgreens Boots Alliance, Inc. | | | (827 | ) | | | (70,990 | ) | |
Total | | | | | (369,037 | ) | |
Food Products (0.1)% | |
Hain Celestial Group, Inc.(b) | | | (729 | ) | | | (46,124 | ) | |
Hormel Foods Corp. | | | (613 | ) | | | (35,076 | ) | |
Kraft Foods Group, Inc. | | | (389 | ) | | | (32,851 | ) | |
McCormick & Co., Inc. | | | (465 | ) | | | (36,502 | ) | |
Total | | | | | (150,553 | ) | |
Household Products (0.1)% | |
Colgate-Palmolive Co. | | | (501 | ) | | | (33,462 | ) | |
Kimberly-Clark Corp. | | | (324 | ) | | | (35,271 | ) | |
Procter & Gamble Co. (The) | | | (432 | ) | | | (33,864 | ) | |
Total | | | | | (102,597 | ) | |
Total Consumer Staples | | | | | (622,187 | ) | |
The accompanying Notes to Consolidated Financial Statements are an integral part of this statement.
Annual Report 2015
11
COLUMBIA DIVERSIFIED ABSOLUTE RETURN FUND
CONSOLIDATED PORTFOLIO OF INVESTMENTS (continued)
May 31, 2015
Investments Sold Short (continued)
Common Stocks (continued)
Issuer | | Shares | | Value ($) | |
ENERGY (1.3)% | |
Energy Equipment & Services (0.5)% | |
Core Laboratories NV | | | (159 | ) | | | (18,679 | ) | |
Ensco PLC, Class A | | | (501 | ) | | | (11,774 | ) | |
Noble Corp. PLC | | | (799 | ) | | | (13,383 | ) | |
Rowan Companies PLC, Class A | | | (9,470 | ) | | | (203,416 | ) | |
SEACOR Holdings, Inc.(b) | | | (1,659 | ) | | | (116,329 | ) | |
Seadrill Ltd. | | | (10,620 | ) | | | (126,484 | ) | |
Tidewater, Inc. | | | (513 | ) | | | (12,589 | ) | |
Total | | | | | (502,654 | ) | |
Oil, Gas & Consumable Fuels (0.8)% | |
Apache Corp. | | | (583 | ) | | | (34,887 | ) | |
Cheniere Energy, Inc.(b) | | | (892 | ) | | | (67,640 | ) | |
Chevron Corp. | | | (820 | ) | | | (84,460 | ) | |
Cobalt International Energy(b) | | | (8,356 | ) | | | (84,897 | ) | |
ConocoPhillips | | | (593 | ) | | | (37,762 | ) | |
Encana Corp. | | | (2,766 | ) | | | (35,018 | ) | |
EOG Resources, Inc. | | | (388 | ) | | | (34,412 | ) | |
Marathon Oil Corp. | | | (1,314 | ) | | | (35,728 | ) | |
Pioneer Natural Resources Co. | | | (1,638 | ) | | | (242,145 | ) | |
Total SA, ADR | | | (5,176 | ) | | | (261,336 | ) | |
Total | | | | | (918,285 | ) | |
Total Energy | | | | | (1,420,939 | ) | |
FINANCIALS (2.3)% | |
Banks (0.7)% | |
First Horizon National Corp. | | | (10,540 | ) | | | (155,570 | ) | |
KeyCorp | | | (10,663 | ) | | | (155,467 | ) | |
Pacwest Bancorp | | | (1,670 | ) | | | (74,966 | ) | |
Synovus Financial Corp. | | | (13,439 | ) | | | (390,000 | ) | |
Total | | | | | (776,003 | ) | |
Capital Markets (0.4)% | |
Artisan Partners Asset
Management, Inc., Class A | | | (1,674 | ) | | | (73,840 | ) | |
Bank of New York Mellon Corp. (The) | | | (1,929 | ) | | | (83,641 | ) | |
Federated Investors, Inc., Class B | | | (1,890 | ) | | | (65,772 | ) | |
Janus Capital Group, Inc. | | | (3,627 | ) | | | (65,830 | ) | |
Legg Mason, Inc. | | | (1,161 | ) | | | (61,951 | ) | |
TD Ameritrade Holding Corp. | | | (1,731 | ) | | | (64,307 | ) | |
Total | | | | | (415,341 | ) | |
Investments Sold Short (continued)
Common Stocks (continued)
Issuer | | Shares | | Value ($) | |
Diversified Financial Services (0.1)% | |
McGraw Hill Financial, Inc. | | | (974 | ) | | | (101,053 | ) | |
Insurance (0.6)% | |
Arch Capital Group Ltd.(b) | | | (1,844 | ) | | | (117,813 | ) | |
Markel Corp.(b) | | | (39 | ) | | | (30,137 | ) | |
Mercury General Corp. | | | (1,338 | ) | | | (74,500 | ) | |
Old Republic International Corp. | | | (2,519 | ) | | | (38,944 | ) | |
ProAssurance Corp. | | | (601 | ) | | | (27,153 | ) | |
Travelers Companies, Inc. (The) | | | (2,639 | ) | | | (266,856 | ) | |
WR Berkley Corp. | | | (2,414 | ) | | | (118,286 | ) | |
Total | | | | | (673,689 | ) | |
Real Estate Investment Trusts (REITs) (0.5)% | |
American Campus Communities, Inc. | | | (5,035 | ) | | | (196,415 | ) | |
American Homes 4 Rent, Class A | | | (11,910 | ) | | | (198,778 | ) | |
Healthcare Realty Trust, Inc. | | | (7,305 | ) | | | (174,005 | ) | |
Total | | | | | (569,198 | ) | |
Total Financials | | | | | (2,535,284 | ) | |
HEALTH CARE (3.5)% | |
Biotechnology (1.5)% | |
Acorda Therapeutics, Inc.(b) | | | (1,054 | ) | | | (32,126 | ) | |
Agios Pharmaceuticals, Inc.(b) | | | (1,710 | ) | | | (208,654 | ) | |
Alexion Pharmaceuticals, Inc.(b) | | | (1,130 | ) | | | (185,139 | ) | |
Alnylam Pharmaceuticals, Inc.(b) | | | (179 | ) | | | (23,465 | ) | |
Amgen, Inc. | | | (1,213 | ) | | | (189,543 | ) | |
Avalanche Biotechnologies, Inc.(b) | | | (403 | ) | | | (15,024 | ) | |
Chimerix, Inc.(b) | | | (376 | ) | | | (15,736 | ) | |
Epizyme, Inc.(b) | | | (2,357 | ) | | | (44,712 | ) | |
Ironwood Pharmaceuticals, Inc.(b) | | | (15,255 | ) | | | (215,248 | ) | |
Isis Pharmaceuticals, Inc.(b) | | | (642 | ) | | | (43,220 | ) | |
Neurocrine Biosciences, Inc.(b) | | | (2,465 | ) | | | (108,115 | ) | |
Newlink Genetics Corp.(b) | | | (389 | ) | | | (16,785 | ) | |
Regeneron Pharmaceuticals, Inc.(b) | | | (526 | ) | | | (269,607 | ) | |
Seattle Genetics, Inc.(b) | | | (1,358 | ) | | | (58,516 | ) | |
Synageva Biopharma Corp.(b) | | | (700 | ) | | | (149,387 | ) | |
Total | | | | | (1,575,277 | ) | |
The accompanying Notes to Consolidated Financial Statements are an integral part of this statement.
Annual Report 2015
12
COLUMBIA DIVERSIFIED ABSOLUTE RETURN FUND
CONSOLIDATED PORTFOLIO OF INVESTMENTS (continued)
May 31, 2015
Investments Sold Short (continued)
Common Stocks (continued)
Issuer | | Shares | | Value ($) | |
Health Care Equipment & Supplies (0.4)% | |
Baxter International, Inc. | | | (2,913 | ) | | | (194,035 | ) | |
CR Bard, Inc. | | | (131 | ) | | | (22,312 | ) | |
Hill-Rom Holdings, Inc. | | | (622 | ) | | | (32,070 | ) | |
Hologic, Inc.(b) | | | (283 | ) | | | (10,123 | ) | |
Idexx Laboratories, Inc.(b) | | | (86 | ) | | | (11,661 | ) | |
Resmed, Inc. | | | (88 | ) | | | (5,176 | ) | |
Varian Medical Systems, Inc.(b) | | | (2,391 | ) | | | (207,061 | ) | |
Total | | | | | (482,438 | ) | |
Health Care Providers & Services (0.3)% | |
Brookdale Senior Living, Inc.(b) | | | (2,683 | ) | | | (101,122 | ) | |
Davita Healthcare Partners, Inc.(b) | | | (377 | ) | | | (31,585 | ) | |
Henry Schein, Inc.(b) | | | (129 | ) | | | (18,276 | ) | |
WellCare Health Plans, Inc.(b) | | | (1,625 | ) | | | (139,214 | ) | |
Total | | | | | (290,197 | ) | |
Health Care Technology (0.2)% | |
athenahealth, Inc.(b) | | | (1,799 | ) | | | (209,763 | ) | |
Cerner Corp.(b) | | | (130 | ) | | | (8,748 | ) | |
Total | | | | | (218,511 | ) | |
Life Sciences Tools & Services (0.1)% | |
Bruker Corp.(b) | | | (965 | ) | | | (19,146 | ) | |
Illumina, Inc.(b) | | | (522 | ) | | | (107,574 | ) | |
Mettler-Toledo International, Inc.(b) | | | (15 | ) | | | (4,870 | ) | |
Total | | | | | (131,590 | ) | |
Pharmaceuticals (1.0)% | |
AbbVie, Inc. | | | (4,575 | ) | | | (304,649 | ) | |
Eli Lilly & Co. | | | (3,730 | ) | | | (294,297 | ) | |
Endo Health Solutions, Inc.(b) | | | (1,039 | ) | | | (87,027 | ) | |
Mallinckrodt PLC(b) | | | (598 | ) | | | (77,405 | ) | |
Novo Nordisk A/S, ADR | | | (1,432 | ) | | | (80,879 | ) | |
Roche Holding AG, ADR | | | (1,101 | ) | | | (42,345 | ) | |
Shire PLC, ADR | | | (269 | ) | | | (69,980 | ) | |
Zoetis, Inc. | | | (3,365 | ) | | | (167,476 | ) | |
Total | | | | | (1,124,058 | ) | |
Total Health Care | | | | | (3,822,071 | ) | |
Investments Sold Short (continued)
Common Stocks (continued)
Issuer | | Shares | | Value ($) | |
INDUSTRIALS (2.0)% | |
Aerospace & Defense (0.1)% | |
Hexcel Corp. | | | (206 | ) | | | (10,143 | ) | |
Precision Castparts Corp. | | | (347 | ) | | | (73,436 | ) | |
Raytheon Company | | | (650 | ) | | | (67,119 | ) | |
Total | | | | | (150,698 | ) | |
Air Freight & Logistics (0.2)% | |
Expeditors International of
Washington, Inc. | | | (5,412 | ) | | | (248,086 | ) | |
Airlines (0.1)% | |
Delta Air Lines, Inc. | | | (1,115 | ) | | | (47,856 | ) | |
United Continental Holdings, Inc.(b) | | | (1,835 | ) | | | (100,173 | ) | |
Total | | | | | (148,029 | ) | |
Building Products (0.3)% | |
Armstrong World Industries, Inc.(b) | | | (5,183 | ) | | | (284,650 | ) | |
Commercial Services & Supplies —% | |
Pitney Bowes, Inc. | �� | | (1,568 | ) | | | (34,261 | ) | |
Construction & Engineering (0.2)% | |
Fluor Corp. | | | (4,219 | ) | | | (237,192 | ) | |
Electrical Equipment (0.1)% | |
Emerson Electric Co. | | | (734 | ) | | | (44,268 | ) | |
Industrial Conglomerates (0.1)% | |
3M Co. | | | (470 | ) | | | (74,768 | ) | |
Machinery (0.3)% | |
Cummins, Inc. | | | (308 | ) | | | (41,749 | ) | |
Deere & Co. | | | (436 | ) | | | (40,845 | ) | |
PACCAR, Inc. | | | (4,240 | ) | | | (269,494 | ) | |
Total | | | | | (352,088 | ) | |
Professional Services —% | |
Manpowergroup, Inc. | | | (228 | ) | | | (19,300 | ) | |
Road & Rail (0.1)% | |
Avis Budget Group, Inc.(b) | | | (513 | ) | | | (26,163 | ) | |
Con-way, Inc. | | | (1,373 | ) | | | (55,565 | ) | |
Total | | | | | (81,728 | ) | |
The accompanying Notes to Consolidated Financial Statements are an integral part of this statement.
Annual Report 2015
13
COLUMBIA DIVERSIFIED ABSOLUTE RETURN FUND
CONSOLIDATED PORTFOLIO OF INVESTMENTS (continued)
May 31, 2015
Investments Sold Short (continued)
Common Stocks (continued)
Issuer | | Shares | | Value ($) | |
Trading Companies & Distributors (0.5)% | |
Air Lease Corp. | | | (1,464 | ) | | | (55,090 | ) | |
Fastenal Co. | | | (4,612 | ) | | | (191,444 | ) | |
MRC Global, Inc.(b) | | | (2,380 | ) | | | (36,438 | ) | |
MSC Industrial Direct Co., Inc., Class A | | | (3,280 | ) | | | (227,534 | ) | |
Total | | | | | (510,506 | ) | |
Total Industrials | | | | | (2,185,574 | ) | |
INFORMATION TECHNOLOGY (3.1)% | |
Communications Equipment (0.1)% | |
Juniper Networks, Inc. | | | (4,752 | ) | | | (132,106 | ) | |
Electronic Equipment, Instruments & Components (0.5)% | |
Corning, Inc. | | | (5,290 | ) | | | (110,667 | ) | |
Dolby Laboratories, Inc., Class A | | | (5,423 | ) | | | (212,311 | ) | |
Ingram Micro, Inc., Class A(b) | | | (3,119 | ) | | | (83,620 | ) | |
IPG Photonics Corp.(b) | | | (1,385 | ) | | | (131,353 | ) | |
Total | | | | | (537,951 | ) | |
IT Services (0.3)% | |
Accenture PLC, Class A | | | (1,467 | ) | | | (140,890 | ) | |
Xerox Corp. | | | (15,985 | ) | | | (182,549 | ) | |
Total | | | | | (323,439 | ) | |
Semiconductors & Semiconductor Equipment (0.5)% | |
Analog Devices, Inc. | | | (1,640 | ) | | | (111,454 | ) | |
| ASML Holding NV | | | (358 | ) | | | (40,203 | ) | |
Atmel Corp. | | | (5,896 | ) | | | (52,298 | ) | |
Cree, Inc.(b) | | | (816 | ) | | | (24,709 | ) | |
Intel Corp. | | | (1,117 | ) | | | (38,492 | ) | |
Linear Technology Corp. | | | (1,275 | ) | | | (61,009 | ) | |
Microchip Technology, Inc. | | | (2,070 | ) | | | (101,699 | ) | |
Teradyne, Inc. | | | (2,868 | ) | | | (60,658 | ) | |
Xilinx, Inc. | | | (948 | ) | | | (44,954 | ) | |
Total | | | | | (535,476 | ) | |
Investments Sold Short (continued)
Common Stocks (continued)
Issuer | | Shares | | Value ($) | |
Software (0.7)% | |
FireEye, Inc.(b) | | | (2,137 | ) | | | (99,520 | ) | |
Netsuite, Inc.(b) | | | (1,073 | ) | | | (100,240 | ) | |
QLIK Technologies, Inc.(b) | | | (4,590 | ) | | | (166,020 | ) | |
SAP SE, ADR | | | (1,535 | ) | | | (113,436 | ) | |
Symantec Corp. | | | (3,709 | ) | | | (91,334 | ) | |
Zynga, Inc., Class A(b) | | | (64,425 | ) | | | (190,054 | ) | |
Total | | | | | (760,604 | ) | |
Technology Hardware, Storage & Peripherals (1.0)% | |
Diebold, Inc. | | | (6,866 | ) | | | (234,680 | ) | |
Hewlett-Packard Co. | | | (3,140 | ) | | | (104,876 | ) | |
Lexmark International, Inc., Class A | | | (6,203 | ) | | | (285,214 | ) | |
NCR Corp.(b) | | | (8,496 | ) | | | (255,305 | ) | |
NetApp, Inc. | | | (3,229 | ) | | | (107,849 | ) | |
Sandisk Corp. | | | (883 | ) | | | (60,379 | ) | |
Total | | | | | (1,048,303 | ) | |
Total Information Technology | | | | | (3,337,879 | ) | |
MATERIALS (0.6)% | |
Chemicals (0.3)% | |
Air Products & Chemicals, Inc. | | | (333 | ) | | | (48,871 | ) | |
Airgas, Inc. | | | (226 | ) | | | (23,039 | ) | |
Ecolab, Inc. | | | (1,349 | ) | | | (154,663 | ) | |
International Flavors & Fragrances, Inc. | | | (232 | ) | | | (27,617 | ) | |
WR Grace & Co.(b) | | | (1,053 | ) | | | (103,120 | ) | |
Total | | | | | (357,310 | ) | |
Construction Materials (0.1)% | |
Vulcan Materials Co. | | | (1,209 | ) | | | (108,725 | ) | |
Containers & Packaging (0.2)% | |
MeadWestvaco Corp. | | | (2,484 | ) | | | (125,541 | ) | |
Owens-Illinois, Inc.(b) | | | (733 | ) | | | (17,519 | ) | |
Packaging Corp. of America | | | (318 | ) | | | (21,999 | ) | |
Total | | | | | (165,059 | ) | |
Metals & Mining —% | |
Allegheny Technologies, Inc. | | | (855 | ) | | | (27,788 | ) | |
Total Materials | | | | | (658,882 | ) | |
The accompanying Notes to Consolidated Financial Statements are an integral part of this statement.
Annual Report 2015
14
COLUMBIA DIVERSIFIED ABSOLUTE RETURN FUND
CONSOLIDATED PORTFOLIO OF INVESTMENTS (continued)
May 31, 2015
Investments Sold Short (continued)
Common Stocks (continued)
Issuer | | Shares | | Value ($) | |
TELECOMMUNICATION SERVICES (0.1)% | |
Diversified Telecommunication Services (0.1)% | |
Verizon Communications, Inc. | | | (1,020 | ) | | | (50,429 | ) | |
Wireless Telecommunication Services —% | |
America Movil SAB de CV, Class L, ADR | | | (1,008 | ) | | | (21,168 | ) | |
T-Mobile USA, Inc.(b) | | | (337 | ) | | | (13,102 | ) | |
Total | | | | | (34,270 | ) | |
Total Telecommunication Services | | | | | (84,699 | ) | |
UTILITIES (0.2)% | |
Electric Utilities —% | |
Southern Co. (The) | | | (511 | ) | | | (22,326 | ) | |
Gas Utilities —% | |
Questar Corp. | | | (311 | ) | | | (7,060 | ) | |
Investments Sold Short (continued)
Common Stocks (continued)
Issuer | | Shares | | Value ($) | |
Independent Power and Renewable Electricity Producers (0.1)% | |
NRG Energy, Inc. | | | (3,092 | ) | | | (77,918 | ) | |
Multi-Utilities (0.1)% | |
Consolidated Edison, Inc. | | | (245 | ) | | | (15,151 | ) | |
Integrys Energy Group, Inc. | | | (117 | ) | | | (8,413 | ) | |
Sempra Energy | | | (613 | ) | | | (65,879 | ) | |
Wisconsin Energy Corp. | | | (240 | ) | | | (11,587 | ) | |
Total | | | | | (101,030 | ) | |
Total Utilities | | | | | (208,334 | ) | |
Total Common Stocks
(Proceeds: $16,679,887) | | | | | (16,804,797 | ) | |
Total Investments Sold Short
(Proceeds: $16,679,887) | | | | | (16,804,797 | ) | |
Total Investments, Net of Investments Sold Short | | | | | 94,292,390 | | |
Other Assets & Liabilities, Net | | | | | 14,042,716 | | |
Net Assets | | | | | 108,335,106 | | |
The accompanying Notes to Consolidated Financial Statements are an integral part of this statement.
Annual Report 2015
15
COLUMBIA DIVERSIFIED ABSOLUTE RETURN FUND
CONSOLIDATED PORTFOLIO OF INVESTMENTS (continued)
May 31, 2015
At May 31, 2015, securities and cash totaling $30,784,098 were pledged as collateral.
Investments in Derivatives
Forward Foreign Currency Exchange Contracts Open at May 31, 2015
Counterparty | | Exchange Date | | Currency to
be Delivered | | Currency to
be Received | | Unrealized
Appreciation ($) | | Unrealized
Depreciation ($) | |
Barclays Bank PLC | | 06/24/2015 | | | 4,124,000 | | | NZD | | | 3,036,295 | | | USD | | | 116,541 | | | | — | | |
Barclays Bank PLC | | 06/24/2015 | | | 1,623,304 | | | USD | | | 1,488,000 | | | EUR | | | 11,435 | | | | — | | |
Barclays Bank PLC | | 06/24/2015 | | | 2,996,583 | | | USD | | | 2,638,000 | | | EUR | | | — | | | | (98,437 | ) | |
Deutsche Bank Securities Inc. | | 06/12/2015 | | | 1,000,000 | | | AUD | | | 796,660 | | | USD | | | 32,517 | | | | — | | |
Deutsche Bank Securities Inc. | | 06/12/2015 | | | 1,700,000 | | | AUD | | | 1,326,595 | | | USD | | | 27,551 | | | | — | | |
Deutsche Bank Securities Inc. | | 06/12/2015 | | | 500,000 | | | AUD | | | 385,830 | | | USD | | | 3,758 | | | | — | | |
Deutsche Bank Securities Inc. | | 06/12/2015 | | | 1,000,000 | | | AUD | | | 755,362 | | | USD | | | — | | | | (8,781 | ) | |
Deutsche Bank Securities Inc. | | 06/12/2015 | | | 300,000 | | | AUD | | | 226,609 | | | USD | | | — | | | | (2,634 | ) | |
Deutsche Bank Securities Inc. | | 06/12/2015 | | | 300,000 | | | CAD | | | 246,481 | | | USD | | | 5,286 | | | | — | | |
Deutsche Bank Securities Inc. | | 06/12/2015 | | | 100,000 | | | CAD | | | 83,358 | | | USD | | | 2,960 | | | | — | | |
Deutsche Bank Securities Inc. | | 06/12/2015 | | | 874,351 | | | CAD | | | 699,582 | | | USD | | | — | | | | (3,382 | ) | |
Deutsche Bank Securities Inc. | | 06/12/2015 | | | 219,746 | | | EUR | | | 246,115 | | | USD | | | 4,736 | | | | — | | |
Deutsche Bank Securities Inc. | | 06/12/2015 | | | 300,000 | | | EUR | | | 323,561 | | | USD | | | — | | | | (5,972 | ) | |
Deutsche Bank Securities Inc. | | 06/12/2015 | | | 200,000 | | | EUR | | | 217,960 | | | USD | | | — | | | | (1,729 | ) | |
Deutsche Bank Securities Inc. | | 06/12/2015 | | | 967,382 | | | GBP | | | 1,469,545 | | | USD | | | — | | | | (8,892 | ) | |
Deutsche Bank Securities Inc. | | 06/12/2015 | | | 70,400,000 | | | JPY | | | 591,815 | | | USD | | | 24,518 | | | | — | | |
Deutsche Bank Securities Inc. | | 06/12/2015 | | | 95,500,000 | | | JPY | | | 788,680 | | | USD | | | 19,122 | | | | — | | |
Deutsche Bank Securities Inc. | | 06/12/2015 | | | 76,700,000 | | | JPY | | | 635,644 | | | USD | | | 17,580 | | | | — | | |
Deutsche Bank Securities Inc. | | 06/12/2015 | | | 2,700,000 | | | NOK | | | 357,399 | | | USD | | | 10,062 | | | | — | | |
Deutsche Bank Securities Inc. | | 06/12/2015 | | | 1,800,000 | | | NOK | | | 237,417 | | | USD | | | 5,859 | | | | — | | |
Deutsche Bank Securities Inc. | | 06/12/2015 | | | 200,000 | | | NOK | | | 27,301 | | | USD | | | 1,572 | | | | — | | |
Deutsche Bank Securities Inc. | | 06/12/2015 | | | 400,000 | | | NOK | | | 51,639 | | | USD | | | 182 | | | | — | | |
Deutsche Bank Securities Inc. | | 06/12/2015 | | | 5,600,000 | | | NOK | | | 691,495 | | | USD | | | — | | | | (28,909 | ) | |
Deutsche Bank Securities Inc. | | 06/12/2015 | | | 1,400,000 | | | NOK | | | 178,346 | | | USD | | | — | | | | (1,755 | ) | |
Deutsche Bank Securities Inc. | | 06/12/2015 | | | 800,000 | | | NOK | | | 102,546 | | | USD | | | — | | | | (368 | ) | |
Deutsche Bank Securities Inc. | | 06/12/2015 | | | 2,004,127 | | | NZD | | | 1,514,669 | | | USD | | | 94,171 | | | | — | | |
Deutsche Bank Securities Inc. | | 06/12/2015 | | | 900,000 | | | NZD | | | 667,170 | | | USD | | | 29,262 | | | | — | | |
Deutsche Bank Securities Inc. | | 06/12/2015 | | | 700,000 | | | NZD | | | 523,775 | | | USD | | | 27,624 | | | | — | | |
Deutsche Bank Securities Inc. | | 06/12/2015 | | | 100,000 | | | SEK | | | 12,147 | | | USD | | | 416 | | | | — | | |
Deutsche Bank Securities Inc. | | 06/12/2015 | | | 14,700,000 | | | SEK | | | 1,671,091 | | | USD | | | — | | | | (53,273 | ) | |
Deutsche Bank Securities Inc. | | 06/12/2015 | | | 1,200,000 | | | SEK | | | 139,012 | | | USD | | | — | | | | (1,752 | ) | |
Deutsche Bank Securities Inc. | | 06/12/2015 | | | 900,000 | | | SEK | | | 105,250 | | | USD | | | — | | | | (323 | ) | |
Deutsche Bank Securities Inc. | | 06/12/2015 | | | 1,900,000 | | | SGD | | | 1,440,662 | | | USD | | | 31,581 | | | | — | | |
Deutsche Bank Securities Inc. | | 06/12/2015 | | | 700,000 | | | SGD | | | 523,588 | | | USD | | | 4,453 | | | | — | | |
Deutsche Bank Securities Inc. | | 06/12/2015 | | | 400,000 | | | SGD | | | 299,141 | | | USD | | | 2,493 | | | | — | | |
Deutsche Bank Securities Inc. | | 06/12/2015 | | | 300,000 | | | SGD | | | 222,408 | | | USD | | | — | | | | (79 | ) | |
The accompanying Notes to Consolidated Financial Statements are an integral part of this statement.
Annual Report 2015
16
COLUMBIA DIVERSIFIED ABSOLUTE RETURN FUND
CONSOLIDATED PORTFOLIO OF INVESTMENTS (continued)
May 31, 2015
Forward Foreign Currency Exchange Contracts Open at May 31, 2015 (continued)
Counterparty | | Exchange Date | | Currency to
be Delivered | | Currency to
be Received | | Unrealized
Appreciation ($) | | Unrealized
Depreciation ($) | |
Deutsche Bank Securities Inc. | | 06/12/2015 | | | 500,000 | | | SGD | | | 370,626 | | | USD | | | — | | | | (185 | ) | |
Deutsche Bank Securities Inc. | | 06/12/2015 | | | 774,693 | | | USD | | | 1,000,000 | | | AUD | | | — | | | | (10,550 | ) | |
Deutsche Bank Securities Inc. | | 06/12/2015 | | | 959,224 | | | USD | | | 1,200,000 | | | AUD | | | — | | | | (42,252 | ) | |
Deutsche Bank Securities Inc. | | 06/12/2015 | | | 793,700 | | | USD | | | 1,000,000 | | | AUD | | | — | | | | (29,557 | ) | |
Deutsche Bank Securities Inc. | | 06/12/2015 | | | 1,449,180 | | | USD | | | 1,800,000 | | | AUD | | | — | | | | (73,722 | ) | |
Deutsche Bank Securities Inc. | | 06/12/2015 | | | 237,150 | | | USD | | | 300,000 | | | AUD | | | — | | | | (7,907 | ) | |
Deutsche Bank Securities Inc. | | 06/12/2015 | | | 476,190 | | | USD | | | 600,000 | | | CAD | | | 6,200 | | | | — | | |
Deutsche Bank Securities Inc. | | 06/12/2015 | | | 522,120 | | | USD | | | 631,452 | | | CAD | | | — | | | | (14,443 | ) | |
Deutsche Bank Securities Inc. | | 06/12/2015 | | | 670,325 | | | USD | | | 832,008 | | | CAD | | | — | | | | (1,405 | ) | |
Deutsche Bank Securities Inc. | | 06/12/2015 | | | 922,604 | | | USD | | | 900,000 | | | CHF | | | 35,336 | | | | — | | |
Deutsche Bank Securities Inc. | | 06/12/2015 | | | 429,498 | | | USD | | | 400,000 | | | CHF | | | — | | | | (3,747 | ) | |
Deutsche Bank Securities Inc. | | 06/12/2015 | | | 757,664 | | | USD | | | 700,000 | | | CHF | | | — | | | | (12,599 | ) | |
Deutsche Bank Securities Inc. | | 06/12/2015 | | | 215,986 | | | USD | | | 200,000 | | | CHF | | | — | | | | (3,111 | ) | |
Deutsche Bank Securities Inc. | | 06/12/2015 | | | 317,838 | | | USD | | | 300,000 | | | EUR | | | 11,695 | | | | — | | |
Deutsche Bank Securities Inc. | | 06/12/2015 | | | 431,734 | | | USD | | | 384,505 | | | EUR | | | — | | | | (9,377 | ) | |
Deutsche Bank Securities Inc. | | 06/12/2015 | | | 586,152 | | | USD | | | 400,000 | | | GBP | | | 25,163 | | | | — | | |
Deutsche Bank Securities Inc. | | 06/12/2015 | | | 459,705 | | | USD | | | 300,000 | | | GBP | | | — | | | | (1,219 | ) | |
Deutsche Bank Securities Inc. | | 06/12/2015 | | | 2,025,356 | | | USD | | | 1,291,047 | | | GBP | | | — | | | | (52,266 | ) | |
Deutsche Bank Securities Inc. | | 06/12/2015 | | | 155,055 | | | USD | | | 100,000 | | | GBP | | | — | | | | (2,226 | ) | |
Deutsche Bank Securities Inc. | | 06/12/2015 | | | 154,133 | | | USD | | | 100,000 | | | GBP | | | — | | | | (1,304 | ) | |
Deutsche Bank Securities Inc. | | 06/12/2015 | | | 4,233,607 | | | USD | | | 509,146,319 | | | JPY | | | — | | | | (130,804 | ) | |
Deutsche Bank Securities Inc. | | 06/12/2015 | | | 1,401,364 | | | USD | | | 167,100,000 | | | JPY | | | — | | | | (54,838 | ) | |
Deutsche Bank Securities Inc. | | 06/12/2015 | | | 304,020 | | | USD | | | 36,300,000 | | | JPY | | | — | | | | (11,508 | ) | |
Deutsche Bank Securities Inc. | | 06/12/2015 | | | 1,509,282 | | | USD | | | 12,000,000 | | | NOK | | | 34,440 | | | | — | | |
Deutsche Bank Securities Inc. | | 06/12/2015 | | | 777,355 | | | USD | | | 5,800,000 | | | NOK | | | — | | | | (31,223 | ) | |
Deutsche Bank Securities Inc. | | 06/12/2015 | | | 214,553 | | | USD | | | 1,600,000 | | | NOK | | | — | | | | (8,724 | ) | |
Deutsche Bank Securities Inc. | | 06/12/2015 | | | 213,165 | | | USD | | | 300,000 | | | NZD | | | — | | | | (529 | ) | |
Deutsche Bank Securities Inc. | | 06/12/2015 | | | 937,754 | | | USD | | | 8,200,000 | | | SEK | | | 24,136 | | | | — | | |
Deutsche Bank Securities Inc. | | 06/12/2015 | | | 261,463 | | | USD | | | 2,300,000 | | | SEK | | | 8,335 | | | | — | | |
Deutsche Bank Securities Inc. | | 06/12/2015 | | | 23,450 | | | USD | | | 200,000 | | | SEK | | | 10 | | | | — | | |
Deutsche Bank Securities Inc. | | 06/12/2015 | | | 1,076,366 | | | USD | | | 9,000,000 | | | SEK | | | — | | | | (20,633 | ) | |
Deutsche Bank Securities Inc. | | 06/12/2015 | | | 487,033 | | | USD | | | 4,000,000 | | | SEK | | | — | | | | (17,818 | ) | |
Deutsche Bank Securities Inc. | | 06/12/2015 | | | 263,499 | | | USD | | | 2,200,000 | | | SEK | | | — | | | | (5,431 | ) | |
Deutsche Bank Securities Inc. | | 06/12/2015 | | | 314,674 | | | USD | | | 2,600,000 | | | SEK | | | — | | | | (9,685 | ) | |
Deutsche Bank Securities Inc. | | 06/12/2015 | | | 2,909,408 | | | USD | | | 4,000,000 | | | SGD | | | 57,078 | | | | — | | |
Deutsche Bank Securities Inc. | | 06/12/2015 | | | 436,411 | | | USD | | | 600,000 | | | SGD | | | 8,562 | | | | — | | |
Deutsche Bank Securities Inc. | | 06/12/2015 | | | 888,560 | | | USD | | | 1,200,000 | | | SGD | | | 1,386 | | | | — | | |
Deutsche Bank Securities Inc. | | 06/12/2015 | | | 752,103 | | | USD | | | 1,000,000 | | | SGD | | | — | | | | (10,481 | ) | |
Deutsche Bank Securities Inc. | | 06/12/2015 | | | 606,198 | | | USD | | | 800,000 | | | SGD | | | — | | | | (12,901 | ) | |
The accompanying Notes to Consolidated Financial Statements are an integral part of this statement.
Annual Report 2015
17
COLUMBIA DIVERSIFIED ABSOLUTE RETURN FUND
CONSOLIDATED PORTFOLIO OF INVESTMENTS (continued)
May 31, 2015
Forward Foreign Currency Exchange Contracts Open at May 31, 2015 (continued)
Counterparty | | Exchange Date | | Currency to
be Delivered | | Currency to
be Received | | Unrealized
Appreciation ($) | | Unrealized
Depreciation ($) | |
Deutsche Bank Securities Inc. | | 06/12/2015 | | | 148,362 | | | USD | | | 200,000 | | | SGD | | | — | | | | (38 | ) | |
Deutsche Bank Securities Inc. | | 06/12/2015 | | | 75,415 | | | USD | | | 100,000 | | | SGD | | | — | | | | (1,253 | ) | |
Deutsche Bank Securities Inc. | | 06/22/2015 | | | 1,132,000 | | | RON | | | 289,811 | | | USD | | | 10,032 | | | | — | | |
Deutsche Bank Securities Inc. | | 06/24/2015 | | | 2,761,000 | | | CHF | | | 2,998,154 | | | USD | | | 58,157 | | | | — | | |
Deutsche Bank Securities Inc. | | 06/24/2015 | | | 1,508,000 | | | CHF | | | 1,588,204 | | | USD | | | — | | | | (17,560 | ) | |
Deutsche Bank Securities Inc. | | 06/24/2015 | | | 7,495,618 | | | USD | | | 898,125,000 | | | JPY | | | — | | | | (257,100 | ) | |
Deutsche Bank Securities Inc. | | 06/24/2015 | | | 196,773 | | | USD | | | 24,225,000 | | | JPY | | | — | | | | (1,530 | ) | |
HSBC Securities (USA), Inc. | | 06/12/2015 | | | 500,000 | | | AUD | | | 394,031 | | | USD | | | 11,959 | | | | — | | |
HSBC Securities (USA), Inc. | | 06/12/2015 | | | 200,000 | | | AUD | | | 157,774 | | | USD | | | 4,945 | | | | — | | |
HSBC Securities (USA), Inc. | | 06/12/2015 | | | 400,000 | | | AUD | | | 305,876 | | | USD | | | 218 | | | | — | | |
HSBC Securities (USA), Inc. | | 06/12/2015 | | | 826,296 | | | CHF | | | 884,388 | | | USD | | | 4,897 | | | | — | | |
HSBC Securities (USA), Inc. | | 06/12/2015 | | | 200,000 | | | CHF | | | 215,408 | | | USD | | | 2,533 | | | | — | | |
HSBC Securities (USA), Inc. | | 06/12/2015 | | | 200,000 | | | GBP | | | 293,094 | | | USD | | | — | | | | (12,563 | ) | |
HSBC Securities (USA), Inc. | | 06/12/2015 | | | 64,600,000 | | | JPY | | | 537,686 | | | USD | | | 17,127 | | | | — | | |
HSBC Securities (USA), Inc. | | 06/12/2015 | | | 2,300,000 | | | JPY | | | 19,210 | | | USD | | | 676 | | | | — | | |
HSBC Securities (USA), Inc. | | 06/12/2015 | | | 1,600,000 | | | NOK | | | 197,603 | | | USD | | | — | | | | (8,227 | ) | |
HSBC Securities (USA), Inc. | | 06/12/2015 | | | 200,000 | | | NZD | | | 148,213 | | | USD | | | 6,456 | | | | — | | |
HSBC Securities (USA), Inc. | | 06/12/2015 | | | 7,900,000 | | | SEK | | | 950,081 | | | USD | | | 23,382 | | | | — | | |
HSBC Securities (USA), Inc. | | 06/12/2015 | | | 1,000,000 | | | SEK | | | 115,686 | | | USD | | | — | | | | (1,618 | ) | |
HSBC Securities (USA), Inc. | | 06/12/2015 | | | 503,743 | | | USD | | | 617,128 | | | CAD | | | — | | | | (7,582 | ) | |
HSBC Securities (USA), Inc. | | 06/12/2015 | | | 63,360 | | | USD | | | 77,269 | | | CAD | | | — | | | | (1,237 | ) | |
HSBC Securities (USA), Inc. | | 06/12/2015 | | | 525,078 | | | USD | | | 500,000 | | | CHF | | | 7,110 | | | | — | | |
HSBC Securities (USA), Inc. | | 06/12/2015 | | | 105,470 | | | USD | | | 100,000 | | | CHF | | | 968 | | | | — | | |
HSBC Securities (USA), Inc. | | 06/12/2015 | | | 211,929 | | | USD | | | 200,000 | | | EUR | | | 7,760 | | | | — | | |
HSBC Securities (USA), Inc. | | 06/12/2015 | | | 435,285 | | | USD | | | 400,000 | | | EUR | | | 4,092 | | | | — | | |
HSBC Securities (USA), Inc. | | 06/12/2015 | | | 109,853 | | | USD | | | 100,000 | | | EUR | | | — | | | | (9 | ) | |
HSBC Securities (USA), Inc. | | 06/12/2015 | | | 304,484 | | | USD | | | 200,000 | | | GBP | | | 1,173 | | | | — | | |
HSBC Securities (USA), Inc. | | 06/12/2015 | | | 340,526 | | | USD | | | 40,500,000 | | | JPY | | | — | | | | (14,168 | ) | |
HSBC Securities (USA), Inc. | | 06/12/2015 | | | 1,047,848 | | | USD | | | 128,900,000 | | | JPY | | | — | | | | (9,146 | ) | |
HSBC Securities (USA), Inc. | | 06/12/2015 | | | 2,283,153 | | | USD | | | 283,300,000 | | | JPY | | | — | | | | (265 | ) | |
HSBC Securities (USA), Inc. | | 06/12/2015 | | | 182,424 | | | USD | | | 1,400,000 | | | NOK | | | — | | | | (2,323 | ) | |
HSBC Securities (USA), Inc. | | 06/12/2015 | | | 840,268 | | | USD | | | 1,100,000 | | | NZD | | | — | | | | (60,603 | ) | |
HSBC Securities (USA), Inc. | | 06/12/2015 | | | 257,315 | | | USD | | | 334,041 | | | NZD | | | — | | | | (20,551 | ) | |
HSBC Securities (USA), Inc. | | 06/12/2015 | | | 977,080 | | | USD | | | 1,300,000 | | | NZD | | | — | | | | (55,657 | ) | |
HSBC Securities (USA), Inc. | | 06/12/2015 | | | 148,464 | | | USD | | | 200,000 | | | NZD | | | — | | | | (6,707 | ) | |
HSBC Securities (USA), Inc. | | 06/12/2015 | | | 524,726 | | | USD | | | 700,000 | | | SGD | | | — | | | | (5,591 | ) | |
HSBC Securities (USA), Inc. | | 06/24/2015 | | | 4,785,000 | | | GBP | | | 7,502,258 | | | USD | | | 190,061 | | | | — | | |
HSBC Securities (USA), Inc. | | 06/24/2015 | | | 89,000 | | | GBP | | | 136,826 | | | USD | | | 821 | | | | — | | |
State Street Bank & Trust Company | | 06/12/2015 | | | 100,000 | | | CAD | | | 83,158 | | | USD | | | 2,759 | | | | — | | |
The accompanying Notes to Consolidated Financial Statements are an integral part of this statement.
Annual Report 2015
18
COLUMBIA DIVERSIFIED ABSOLUTE RETURN FUND
CONSOLIDATED PORTFOLIO OF INVESTMENTS (continued)
May 31, 2015
Forward Foreign Currency Exchange Contracts Open at May 31, 2015 (continued)
Counterparty | | Exchange Date | | Currency to
be Delivered | | Currency to
be Received | | Unrealized
Appreciation ($) | | Unrealized
Depreciation ($) | |
State Street Bank & Trust Company | | 06/12/2015 | | | 893,354 | | | CAD | | | 714,252 | | | USD | | | — | | | | (3,990 | ) | |
State Street Bank & Trust Company | | 06/12/2015 | | | 200,000 | | | CAD | | | 158,711 | | | USD | | | — | | | | (2,086 | ) | |
State Street Bank & Trust Company | | 06/12/2015 | | | 200,000 | | | EUR | | | 222,862 | | | USD | | | 3,173 | | | | — | | |
State Street Bank & Trust Company | | 06/12/2015 | | | 1,300,000 | | | EUR | | | 1,377,557 | | | USD | | | — | | | | (50,420 | ) | |
State Street Bank & Trust Company | | 06/12/2015 | | | 300,000 | | | GBP | | | 439,663 | | | USD | | | — | | | | (18,823 | ) | |
State Street Bank & Trust Company | | 06/12/2015 | | | 207,400,000 | | | JPY | | | 1,724,787 | | | USD | | | 53,517 | | | | — | | |
State Street Bank & Trust Company | | 06/12/2015 | | | 9,900,000 | | | JPY | | | 82,981 | | | USD | | | 3,205 | | | | — | | |
State Street Bank & Trust Company | | 06/12/2015 | | | 1,900,000 | | | NOK | | | 253,801 | | | USD | | | 9,378 | | | | — | | |
State Street Bank & Trust Company | | 06/12/2015 | | | 200,000 | | | NOK | | | 26,531 | | | USD | | | 803 | | | | — | | |
State Street Bank & Trust Company | | 06/12/2015 | | | 14,300,000 | | | NOK | | | 1,764,588 | | | USD | | | — | | | | (75,014 | ) | |
State Street Bank & Trust Company | | 06/12/2015 | | | 300,000 | | | NZD | | | 229,765 | | | USD | | | 17,129 | | | | — | | |
State Street Bank & Trust Company | | 06/12/2015 | | | 300,000 | | | NZD | | | 223,876 | | | USD | | | 11,240 | | | | — | | |
State Street Bank & Trust Company | | 06/12/2015 | | | 1,600,000 | | | SEK | | | 192,677 | | | USD | | | 4,991 | | | | — | | |
State Street Bank & Trust Company | | 06/12/2015 | | | 2,100,000 | | | SEK | | | 238,625 | | | USD | | | — | | | | (7,713 | ) | |
State Street Bank & Trust Company | | 06/12/2015 | | | 2,100,000 | | | SEK | | | 243,627 | | | USD | | | — | | | | (2,710 | ) | |
State Street Bank & Trust Company | | 06/12/2015 | | | 2,800,000 | | | SGD | | | 2,036,220 | | | USD | | | — | | | | (40,321 | ) | |
State Street Bank & Trust Company | | 06/12/2015 | | | 692,266 | | | USD | | | 872,360 | | | CAD | | | 9,097 | | | | — | | |
State Street Bank & Trust Company | | 06/12/2015 | | | 325,999 | | | USD | | | 400,000 | | | CAD | | | — | | | | (4,406 | ) | |
State Street Bank & Trust Company | | 06/12/2015 | | | 102,537 | | | USD | | | 100,000 | | | CHF | | | 3,901 | | | | — | | |
State Street Bank & Trust Company | | 06/12/2015 | | | 568,475 | | | USD | | | 532,500 | | | CHF | | | — | | | | (1,694 | ) | |
State Street Bank & Trust Company | | 06/12/2015 | | | 213,442 | | | USD | | | 200,000 | | | EUR | | | 6,247 | | | | — | | |
State Street Bank & Trust Company | | 06/12/2015 | | | 226,202 | | | USD | | | 27,200,000 | | | JPY | | | — | | | | (7,019 | ) | |
State Street Bank & Trust Company | | 06/24/2015 | | | 2,997,985 | | | USD | | | 3,719,000 | | | CAD | | | — | | | | (8,566 | ) | |
UBS Securities LLC | | 06/04/2015 | | | 175,000 | | | DKK | | | 25,720 | | | USD | | | — | | | | (44 | ) | |
UBS Securities LLC | | 06/04/2015 | | | 25,528 | | | USD | | | 175,000 | | | DKK | | | 236 | | | | — | | |
UBS Securities LLC | | 06/05/2015 | | | 70,000 | | | AUD | | | 53,530 | | | USD | | | 20 | | | | — | | |
UBS Securities LLC | | 06/05/2015 | | | 180,000 | | | CAD | | | 144,031 | | | USD | | | — | | | | (703 | ) | |
UBS Securities LLC | | 06/05/2015 | | | 700,000 | | | EUR | | | 768,152 | | | USD | | | — | | | | (688 | ) | |
UBS Securities LLC | | 06/05/2015 | | | 500,000 | | | GBP | | | 763,606 | | | USD | | | — | | | | (577 | ) | |
UBS Securities LLC | | 06/05/2015 | | | 110,000,000 | | | JPY | | | 886,729 | | | USD | | | 416 | | | | — | | |
UBS Securities LLC | | 06/05/2015 | | | 1,000,000 | | | MXN | | | 64,926 | | | USD | | | 1 | | | | — | | |
UBS Securities LLC | | 06/05/2015 | | | 54,723 | | | USD | | | 70,000 | | | AUD | | | — | | | | (1,213 | ) | |
UBS Securities LLC | | 06/05/2015 | | | 148,507 | | | USD | | | 180,000 | | | CAD | | | — | | | | (3,774 | ) | |
UBS Securities LLC | | 06/05/2015 | | | 761,163 | | | USD | | | 700,000 | | | EUR | | | 7,678 | | | | — | | |
UBS Securities LLC | | 06/05/2015 | | | 767,976 | | | USD | | | 500,000 | | | GBP | | | — | | | | (3,793 | ) | |
UBS Securities LLC | | 06/05/2015 | | | 921,923 | | | USD | | | 110,000,000 | | | JPY | | | — | | | | (35,610 | ) | |
UBS Securities LLC | | 06/05/2015 | | | 65,016 | | | USD | | | 1,000,000 | | | MXN | | | — | | | | (91 | ) | |
UBS Securities LLC | | 06/12/2015 | | | 1,200,000 | | | AUD | | | 948,408 | | | USD | | | 31,436 | | | | — | | |
UBS Securities LLC | | 06/12/2015 | | | 1,300,000 | | | AUD | | | 987,805 | | | USD | | | — | | | | (5,581 | ) | |
The accompanying Notes to Consolidated Financial Statements are an integral part of this statement.
Annual Report 2015
19
COLUMBIA DIVERSIFIED ABSOLUTE RETURN FUND
CONSOLIDATED PORTFOLIO OF INVESTMENTS (continued)
May 31, 2015
Forward Foreign Currency Exchange Contracts Open at May 31, 2015 (continued)
Counterparty | | Exchange Date | | Currency to
be Delivered | | Currency to
be Received | | Unrealized
Appreciation ($) | | Unrealized
Depreciation ($) | |
UBS Securities LLC | | 06/12/2015 | | | 785,488 | | | CAD | | | 641,246 | | | USD | | | 9,727 | | | | — | | |
UBS Securities LLC | | 06/12/2015 | | | 300,000 | | | CAD | | | 249,160 | | | USD | | | 7,964 | | | | — | | |
UBS Securities LLC | | 06/12/2015 | | | 187,780 | | | CAD | | | 155,918 | | | USD | | | 4,946 | | | | — | | |
UBS Securities LLC | | 06/12/2015 | | | 1,000,000 | | | CAD | | | 793,699 | | | USD | | | — | | | | (10,285 | ) | |
UBS Securities LLC | | 06/12/2015 | | | 2,400,000 | | | CHF | | | 2,460,796 | | | USD | | | — | | | | (93,709 | ) | |
UBS Securities LLC | | 06/12/2015 | | | 100,000 | | | CHF | | | 105,104 | | | USD | | | — | | | | (1,333 | ) | |
UBS Securities LLC | | 06/12/2015 | | | 600,000 | | | CHF | | | 631,692 | | | USD | | | — | | | | (6,934 | ) | |
UBS Securities LLC | | 06/12/2015 | | | 200,000 | | | CHF | | | 210,407 | | | USD | | | — | | | | (2,468 | ) | |
UBS Securities LLC | | 06/12/2015 | | | 200,000 | | | CHF | | | 211,964 | | | USD | | | — | | | | (911 | ) | |
UBS Securities LLC | | 06/12/2015 | | | 300,000 | | | CHF | | | 307,600 | | | USD | | | — | | | | (11,714 | ) | |
UBS Securities LLC | | 06/12/2015 | | | 500,000 | | | EUR | | | 529,897 | | | USD | | | — | | | | (19,325 | ) | |
UBS Securities LLC | | 06/12/2015 | | | 400,000 | | | GBP | | | 631,004 | | | USD | | | 19,690 | | | | — | | |
UBS Securities LLC | | 06/12/2015 | | | 202,071 | | | GBP | | | 296,148 | | | USD | | | — | | | | (12,674 | ) | |
UBS Securities LLC | | 06/12/2015 | | | 200,000 | | | GBP | | | 299,076 | | | USD | | | — | | | | (6,581 | ) | |
UBS Securities LLC | | 06/12/2015 | | | 532,336,786 | | | JPY | | | 4,427,101 | | | USD | | | 137,424 | | | | — | | |
UBS Securities LLC | | 06/12/2015 | | | 220,300,000 | | | JPY | | | 1,853,987 | | | USD | | | 78,765 | | | | — | | |
UBS Securities LLC | | 06/12/2015 | | | 70,300,000 | | | JPY | | | 586,640 | | | USD | | | 20,148 | | | | — | | |
UBS Securities LLC | | 06/12/2015 | | | 55,700,000 | | | JPY | | | 463,221 | | | USD | | | 14,379 | | | | — | | |
UBS Securities LLC | | 06/12/2015 | | | 600,000 | | | NOK | | | 74,065 | | | USD | | | — | | | | (3,121 | ) | |
UBS Securities LLC | | 06/12/2015 | | | 2,800,000 | | | NOK | | | 360,173 | | | USD | | | — | | | | (29 | ) | |
UBS Securities LLC | | 06/12/2015 | | | 800,000 | | | NZD | | | 596,504 | | | USD | | | 29,475 | | | | — | | |
UBS Securities LLC | | 06/12/2015 | | | 1,079,274 | | | NZD | | | 793,299 | | | USD | | | 28,324 | | | | — | | |
UBS Securities LLC | | 06/12/2015 | | | 573,963 | | | NZD | | | 414,878 | | | USD | | | 8,060 | | | | — | | |
UBS Securities LLC | | 06/12/2015 | | | 200,000 | | | NZD | | | 146,141 | | | USD | | | 4,384 | | | | — | | |
UBS Securities LLC | | 06/12/2015 | | | 2,500,000 | | | SEK | | | 299,243 | | | USD | | | 5,984 | | | | — | | |
UBS Securities LLC | | 06/12/2015 | | | 20,000,000 | | | SEK | | | 2,273,383 | | | USD | | | — | | | | (72,690 | ) | |
UBS Securities LLC | | 06/12/2015 | | | 4,900,000 | | | SEK | | | 556,979 | | | USD | | | — | | | | (17,809 | ) | |
UBS Securities LLC | | 06/12/2015 | | | 1,500,000 | | | SGD | | | 1,124,193 | | | USD | | | 11,761 | | | | — | | |
UBS Securities LLC | | 06/12/2015 | | | 800,000 | | | SGD | | | 600,002 | | | USD | | | 6,705 | | | | — | | |
UBS Securities LLC | | 06/12/2015 | | | 100,000 | | | SGD | | | 74,998 | | | USD | | | 835 | | | | — | | |
UBS Securities LLC | | 06/12/2015 | | | 1,400,000 | | | SGD | | | 1,018,470 | | | USD | | | — | | | | (19,800 | ) | |
UBS Securities LLC | | 06/12/2015 | | | 453,214 | | | USD | | | 600,000 | | | AUD | | | 5,272 | | | | — | | |
UBS Securities LLC | | 06/12/2015 | | | 464,520 | | | USD | | | 600,000 | | | AUD | | | — | | | | (6,034 | ) | |
UBS Securities LLC | | 06/12/2015 | | | 327,774 | | | USD | | | 400,000 | | | CAD | | | — | | | | (6,181 | ) | |
UBS Securities LLC | | 06/12/2015 | | | 164,693 | | | USD | | | 200,000 | | | CAD | | | — | | | | (3,896 | ) | |
UBS Securities LLC | | 06/12/2015 | | | 412,499 | | | USD | | | 400,000 | | | CHF | | | 13,252 | | | | — | | |
UBS Securities LLC | | 06/12/2015 | | | 217,782 | | | USD | | | 200,000 | | | CHF | | | — | | | | (4,907 | ) | |
UBS Securities LLC | | 06/12/2015 | | | 431,004 | | | USD | | | 400,000 | | | EUR | | | 8,374 | | | | — | | |
UBS Securities LLC | | 06/12/2015 | | | 109,661 | | | USD | | | 100,000 | | | EUR | | | 184 | | | | — | | |
The accompanying Notes to Consolidated Financial Statements are an integral part of this statement.
Annual Report 2015
20
COLUMBIA DIVERSIFIED ABSOLUTE RETURN FUND
CONSOLIDATED PORTFOLIO OF INVESTMENTS (continued)
May 31, 2015
Forward Foreign Currency Exchange Contracts Open at May 31, 2015 (continued)
Counterparty | | Exchange Date | | Currency to
be Delivered | | Currency to
be Received | | Unrealized
Appreciation ($) | | Unrealized
Depreciation ($) | |
UBS Securities LLC | | 06/12/2015 | | | 613,483 | | | USD | | | 546,362 | | | EUR | | | — | | | | (13,335 | ) | |
UBS Securities LLC | | 06/12/2015 | | | 343,088 | | | USD | | | 300,000 | | | EUR | | | — | | | | (13,555 | ) | |
UBS Securities LLC | | 06/12/2015 | | | 111,301 | | | USD | | | 100,000 | | | EUR | | | — | | | | (1,456 | ) | |
UBS Securities LLC | | 06/12/2015 | | | 225,801 | | | USD | | | 200,000 | | | EUR | | | — | | | | (6,113 | ) | |
UBS Securities LLC | | 06/12/2015 | | | 673,386 | | | USD | | | 450,891 | | | GBP | | | 15,704 | | | | — | | |
UBS Securities LLC | | 06/12/2015 | | | 303,405 | | | USD | | | 200,000 | | | GBP | | | 2,252 | | | | — | | |
UBS Securities LLC | | 06/12/2015 | | | 152,589 | | | USD | | | 100,000 | | | GBP | | | 240 | | | | — | | |
UBS Securities LLC | | 06/12/2015 | | | 154,362 | | | USD | | | 100,000 | | | GBP | | | — | | | | (1,533 | ) | |
UBS Securities LLC | | 06/12/2015 | | | 179,472 | | | USD | | | 21,500,000 | | | JPY | | | — | | | | (6,220 | ) | |
UBS Securities LLC | | 06/12/2015 | | | 238,140 | | | USD | | | 28,500,000 | | | JPY | | | — | | | | (8,481 | ) | |
UBS Securities LLC | | 06/12/2015 | | | 101,879 | | | USD | | | 800,000 | | | NOK | | | 1,036 | | | | — | | |
UBS Securities LLC | | 06/12/2015 | | | 645,459 | | | USD | | | 4,900,000 | | | NOK | | | — | | | | (15,106 | ) | |
UBS Securities LLC | | 06/12/2015 | | | 2,043,166 | | | USD | | | 2,757,048 | | | NZD | | | — | | | | (89,007 | ) | |
UBS Securities LLC | | 06/12/2015 | | | 150,869 | | | USD | | | 200,000 | | | NZD | | | — | | | | (9,111 | ) | |
UBS Securities LLC | | 06/12/2015 | | | 452,392 | | | USD | | | 617,078 | | | NZD | | | — | | | | (15,016 | ) | |
UBS Securities LLC | | 06/12/2015 | | | 674,492 | | | USD | | | 5,700,000 | | | SEK | | | — | | | | (5,861 | ) | |
UBS Securities LLC | | 06/12/2015 | | | 1,818,696 | | | USD | | | 2,500,000 | | | SGD | | | 35,358 | | | | — | | |
UBS Securities LLC | | 06/12/2015 | | | 73,508 | | | USD | | | 100,000 | | | SGD | | | 654 | | | | — | | |
UBS Securities LLC | | 06/12/2015 | | | 225,768 | | | USD | | | 300,000 | | | SGD | | | — | | | | (3,281 | ) | |
UBS Securities LLC | | 06/22/2015 | | | 1,246,000 | | | AUD | | | 995,776 | | | USD | | | 44,160 | | | | — | | |
UBS Securities LLC | | 06/22/2015 | | | 5,690,000 | | | BRL | | | 1,883,171 | | | USD | | | 110,171 | | | | — | | |
UBS Securities LLC | | 06/22/2015 | | | 412,000 | | | BRL | | | 129,694 | | | USD | | | 1,315 | | | | — | | |
UBS Securities LLC | | 06/22/2015 | | | 269,000,000 | | | COP | | | 110,825 | | | USD | | | 4,745 | | | | — | | |
UBS Securities LLC | | 06/22/2015 | | | 996,100 | | | EUR | | | 1,134,346 | | | USD | | | 40,044 | | | | — | | |
UBS Securities LLC | | 06/22/2015 | | | 433,600 | | | GBP | | | 682,502 | | | USD | | | 19,886 | | | | — | | |
UBS Securities LLC | | 06/22/2015 | | | 12,004,000 | | | MXN | | | 796,282 | | | USD | | | 17,906 | | | | — | | |
UBS Securities LLC | | 06/22/2015 | | | 2,035,000 | | | MXN | | | 135,193 | | | USD | | | 3,238 | | | | — | | |
UBS Securities LLC | | 06/22/2015 | | | 593,000 | | | TRY | | | 226,432 | | | USD | | | 4,981 | | | | — | | |
UBS Securities LLC | | 06/30/2015 | | | 1,748,000 | | | AUD | | | 1,335,035 | | | USD | | | 592 | | | | — | | |
UBS Securities LLC | | 06/30/2015 | | | 2,465,000 | | | CNY | | | 402,613 | | | USD | | | 639 | | | | — | | |
UBS Securities LLC | | 06/30/2015 | | | 1,637,000 | | | EUR | | | 1,804,483 | | | USD | | | 5,910 | | | | — | | |
UBS Securities LLC | | 06/30/2015 | | | 346,000 | | | EUR | | | 378,272 | | | USD | | | — | | | | (1,878 | ) | |
UBS Securities LLC | | 06/30/2015 | | | 6,506,000 | | | NOK | | | 834,880 | | | USD | | | — | | | | (1,653 | ) | |
UBS Securities LLC | | 06/30/2015 | | | 449,000 | | | NZD | | | 327,325 | | | USD | | | 9,616 | | | | — | | |
UBS Securities LLC | | 06/30/2015 | | | 490,202 | | | USD | | | 299,347,000 | | | CLP | | | — | | | | (7,256 | ) | |
UBS Securities LLC | | 06/30/2015 | | | 1,334,014 | | | USD | | | 1,877,000 | | | NZD | | | — | | | | (5,862 | ) | |
UBS Securities LLC | | 07/09/2015 | | | 53,435 | | | USD | | | 70,000 | | | AUD | | | — | | | | (24 | ) | |
UBS Securities LLC | | 07/09/2015 | | | 143,959 | | | USD | | | 180,000 | | | CAD | | | 693 | | | | — | | |
UBS Securities LLC | | 07/09/2015 | | | 25,748 | | | USD | | | 175,000 | | | DKK | | | 42 | | | | — | | |
The accompanying Notes to Consolidated Financial Statements are an integral part of this statement.
Annual Report 2015
21
COLUMBIA DIVERSIFIED ABSOLUTE RETURN FUND
CONSOLIDATED PORTFOLIO OF INVESTMENTS (continued)
May 31, 2015
Forward Foreign Currency Exchange Contracts Open at May 31, 2015 (continued)
Counterparty | | Exchange Date | | Currency to
be Delivered | | Currency to
be Received | | Unrealized
Appreciation ($) | | Unrealized
Depreciation ($) | |
UBS Securities LLC | | 07/09/2015 | | | 768,488 | | | USD | | | 700,000 | | | EUR | | | 706 | | | | — | | |
UBS Securities LLC | | 07/09/2015 | | | 763,424 | | | USD | | | 500,000 | | | GBP | | | 566 | | | | — | | |
UBS Securities LLC | | 07/09/2015 | | | 887,175 | | | USD | | | 110,000,000 | | | JPY | | | — | | | | (445 | ) | |
UBS Securities LLC | | 07/09/2015 | | | 64,768 | | | USD | | | 1,000,000 | | | MXN | | | — | | | | (7 | ) | |
Total | | | | | | | | | | | | | 1,939,721 | | | | (2,060,896 | ) | |
The accompanying Notes to Consolidated Financial Statements are an integral part of this statement.
Annual Report 2015
22
COLUMBIA DIVERSIFIED ABSOLUTE RETURN FUND
CONSOLIDATED PORTFOLIO OF INVESTMENTS (continued)
May 31, 2015
Futures Contracts Outstanding at May 31, 2015
Long Futures Contracts Outstanding
Contract Description | | Number of
Contracts | | Trading
Currency | | Notional
Market
Value ($) | | Expiration
Date | | Unrealized
Appreciation ($) | | Unrealized
Depreciation ($) | |
| 10YR MINI JGB FUT | | | 40 | | | JPY | | | | | 4,757,523 | | | 06/2015 | | | 26,003 | | | | — | | |
| 3MO EURO EURIBOR | | | 8 | | | EUR | | | | | 2,196,271 | | | 12/2015 | | | — | | | | (462 | ) | |
| 90DAY EURO$ FUTR | | | 9 | | | USD | | | | | 2,237,288 | | | 12/2015 | | | 4,815 | | | | — | | |
AUST 10Y BOND FUT | | | 4 | | | AUD | | | | | 392,974 | | | 06/2015 | | | 6,774 | | | | — | | |
AUST 3YR BOND FUT | | | 2 | | | AUD | | | | | 171,108 | | | 06/2015 | | | — | | | | (100 | ) | |
CAC40 10 EURO FUT | | | 2 | | | EUR | | | | | 109,490 | | | 06/2015 | | | — | | | | (641 | ) | |
CAC40 10 EURO FUT | | | 3 | | | EUR | | | | | 164,234 | | | 06/2015 | | | 2,021 | | | | — | | |
CAN 10YR BOND FUT | | | 1 | | | CAD | | | | | 113,300 | | | 09/2015 | | | 1,775 | | | | — | | |
CBOE VIX FUTURE | | | 3 | | | USD | | | | | 43,875 | | | 06/2015 | | | — | | | | (333 | ) | |
CBOE VIX FUTURE | | | 29 | | | USD | | | | | 508,225 | | | 10/2015 | | | 150 | | | | — | | |
DAX INDEX FUTURE | | | 1 | | | EUR | | | | | 313,386 | | | 06/2015 | | | — | | | | (927 | ) | |
| EURO BUXL 30Y BND | | | 2 | | | EUR | | | | | 355,893 | | | 06/2015 | | | — | | | | (6,737 | ) | |
Euro CHF 3MO ICE | | | 31 | | | CHF | | | | | 8,321,860 | | | 12/2015 | | | 3,475 | | | | |
| EURO STOXX 50 | | | 9 | | | EUR | | | | | 352,093 | | | 06/2015 | | | — | | | | (3,180 | ) | |
Euro-BTP Future | | | 7 | | | EUR | | | | | 1,037,432 | | | 06/2015 | | | — | | | | (34,400 | ) | |
| EURO-BUND FUTURE | | | 2 | | | EUR | | | | | 340,671 | | | 09/2015 | | | 19 | | | | — | | |
Euro-OAT Future | | | 1 | | | EUR | | | | | 167,502 | | | 06/2015 | | | — | | | | (1,634 | ) | |
FTSE 100 IDX FUT | | | 9 | | | GBP | | | | | 958,009 | | | 06/2015 | | | 1,420 | | | | — | | |
FTSE 100 IDX FUT | | | 3 | | | GBP | | | | | 319,336 | | | 06/2015 | | | 4,883 | | | | — | | |
FTSE/MIB IDX FUT | | | 7 | | | EUR | | | | | 904,236 | | | 06/2015 | | | 12,053 | | | | — | | |
HANG SENG IDX FUT | | | 1 | | | HKD | | | | | 175,169 | | | 06/2015 | | | — | | | | (6,039 | ) | |
LONG GILT FUTURE | | | 4 | | | GBP | | | | | 720,182 | | | 09/2015 | | | 10,321 | | | | — | | |
mini MSCI EAFE | | | 38 | | | USD | | | | | 3,610,000 | | | 06/2015 | | | 86,364 | | | | — | | |
mini MSCI Emg Mkt | | | 23 | | | USD | | | | | 1,146,435 | | | 06/2015 | | | 30,193 | | | | — | | |
MSCI SING IX ETS | | | 52 | | | SGD | | | | | 2,913,018 | | | 06/2015 | | | — | | | | (63,325 | ) | |
MSCI SING IX ETS | | | 6 | | | SGD | | | | | 336,118 | | | 06/2015 | | | — | | | | (7,307 | ) | |
OMXS30 IND FUTURE | | | 52 | | | SEK | | | | | 1,002,158 | | | 06/2015 | | | 1,567 | | | | — | | |
S&P/TSX 60 IX FUT | | | 2 | | | CAD | | | | | 280,991 | | | 06/2015 | | | — | | | | (510 | ) | |
S&P500 EMINI FUT | | | 2 | | | USD | | | | | 210,600 | | | 06/2015 | | | — | | | | (255 | ) | |
S&P500 EMINI FUT | | | 45 | | | USD | | | | | 4,738,500 | | | 06/2015 | | | 31,727 | | | | — | | |
Short Euro-BTP | | | 2 | | | EUR | | | | | 246,788 | | | 06/2015 | | | 595 | | | | — | | |
SPI 200 FUTURES | | | 1 | | | AUD | | | | | 110,439 | | | 06/2015 | | | 715 | | | | — | | |
TOPIX INDX FUTR | | | 11 | | | JPY | | | | | 1,480,965 | | | 06/2015 | | | 49,419 | | | | — | | |
TOPIX INDX FUTR | | | 2 | | | JPY | | | | | 269,266 | | | 06/2015 | | | 23,064 | | | | — | | |
US 10YR NOTE (CBT) | | | 10 | | | USD | | | | | 1,276,875 | | | 09/2015 | | | 7,479 | | | | — | | |
US LONG BOND(CBT) | | | 17 | | | USD | | | | | 2,645,625 | | | 09/2015 | | | 13,175 | | | | — | | |
US LONG BOND(CBT) | | | 2 | | | USD | | | | | 311,250 | | | 09/2015 | | | 3,043 | | | | — | | |
US ULTRA BOND(CBT) | | | 1 | | | USD | | | | | 160,281 | | | 09/2015 | | | 1,521 | | | | — | | |
Total | | | | | | | 45,399,366 | | | | | | 322,571 | | | | (125,850 | ) | |
The accompanying Notes to Consolidated Financial Statements are an integral part of this statement.
Annual Report 2015
23
COLUMBIA DIVERSIFIED ABSOLUTE RETURN FUND
CONSOLIDATED PORTFOLIO OF INVESTMENTS (continued)
May 31, 2015
Futures Contracts Outstanding at May 31, 2015 (continued)
Short Futures Contracts Outstanding
Contract Description | | Number of
Contracts | | Trading
Currency | | Notional
Market
Value ($) | | Expiration
Date | | Unrealized
Appreciation ($) | | Unrealized
Depreciation ($) | |
| 10YR MINI JGB FUT | | | (57 | ) | | JPY | | | | | (6,779,471 | ) | | 06/2015 | | | — | | | | (14,366 | ) | |
| 10YR MINI JGB FUT | | | (17 | ) | | JPY | | | | | (2,021,947 | ) | | 06/2015 | | | — | | | | (6,033 | ) | |
| 3MO EURO EURIBOR | | | (32 | ) | | EUR | | | | | (8,785,083 | ) | | 12/2015 | | | 1,535 | | | | — | | |
| 3MO EUROYEN TFX | | | (9 | ) | | JPY | | | | | (1,810,116 | ) | | 12/2015 | | | — | | | | (26 | ) | |
| 90DAY EURO$ FUTR | | | (15 | ) | | USD | | | | | (3,728,813 | ) | | 12/2015 | | | 62 | | | | — | | |
| 90DAY STERLING | | | (63 | ) | | GBP | | | | | (11,954,305 | ) | | 12/2015 | | | — | | | | (3,804 | ) | |
AUST 10Y BOND FUT | | | (3 | ) | | AUD | | | | | (294,730 | ) | | 06/2015 | | | — | | | | (2,431 | ) | |
BANK ACCEPT FUTR | | | (1 | ) | | CAD | | | | | (199,220 | ) | | 12/2015 | | | — | | | | (184 | ) | |
CAN 10YR BOND FUT | | | (18 | ) | | CAD | | | | | (2,039,402 | ) | | 09/2015 | | | — | | | | (25,457 | ) | |
CBOE VIX FUTURE | | | (5 | ) | | USD | | | | | (79,125 | ) | | 07/2015 | | | — | | | | (1,138 | ) | |
CBOE VIX FUTURE | | | (26 | ) | | USD | | | | | (427,050 | ) | | 08/2015 | | | 1,151 | | | | — | | |
CBOE VIX FUTURE | | | (8 | ) | | USD | | | | | (136,200 | ) | | 09/2015 | | | 179 | | | | — | | |
| EURO BUXL 30Y BND | | | (1 | ) | | EUR | | | | | (177,947 | ) | | 06/2015 | | | — | | | | (4,121 | ) | |
| EURO STOXX 50 | | | (6 | ) | | EUR | | | | | (234,729 | ) | | 06/2015 | | | 7,487 | | | | — | | |
| EURO-BOBL FUTURE | | | (2 | ) | | EUR | | | | | (283,032 | ) | | 06/2015 | | | 843 | | | | — | | |
Euro-BTP Future | | | (4 | ) | | EUR | | | | | (592,818 | ) | | 06/2015 | | | 1,116 | | | | — | | |
| EURO-BUND FUTURE | | | (22 | ) | | EUR | | | | | (3,755,593 | ) | | 06/2015 | | | — | | | | (19,883 | ) | |
| EURO-BUND FUTURE | | | (4 | ) | | EUR | | | | | (682,835 | ) | | 06/2015 | | | 5,515 | | | | — | | |
IBEX 35 INDX FUTR | | | (5 | ) | | EUR | | | | | (613,521 | ) | | 06/2015 | | | 2,416 | | | | — | | |
LONG GILT FUTURE | | | (2 | ) | | GBP | | | | | (360,091 | ) | | 09/2015 | | | — | | | | (2,205 | ) | |
S&P/TSX 60 IX FUT | | | (21 | ) | | CAD | | | | | (2,950,402 | ) | | 06/2015 | | | 30,497 | | | | — | | |
S&P500 EMINI FUT | | | (6 | ) | | USD | | | | | (631,800 | ) | | 06/2015 | | | 5,460 | | | | — | | |
US 10YR NOTE (CBT) | | | (25 | ) | | USD | | | | | (3,192,188 | ) | | 09/2015 | | | — | | | | (14,883 | ) | |
US 5YR NOTE (CBT) | | | (19 | ) | | USD | | | | | (2,274,805 | ) | | 09/2015 | | | — | | | | (8,936 | ) | |
Total | | | | | | | (54,005,223 | ) | | | | | 56,261 | | | | (103,467 | ) | |
The accompanying Notes to Consolidated Financial Statements are an integral part of this statement.
Annual Report 2015
24
COLUMBIA DIVERSIFIED ABSOLUTE RETURN FUND
CONSOLIDATED PORTFOLIO OF INVESTMENTS (continued)
May 31, 2015
Credit Default Swap Contracts Outstanding at May 31, 2015
Buy Protection
Counterparty | | Reference
Entity | | Expiration
Date | | Pay Fixed
Rate (%) | | Notional
Amount ($) | | Market
Value ($) | | Unamortized
Premium
(Paid)
Received ($) | | Periodic
Payments
Receivable
(Payable) ($) | | Unrealized
Appreciation
($) | | Unrealized
Depreciation
($)0 | |
Morgan Stanley*
| | CDX North America
Investment Grade 24-V1 | | 06/20/2020
| | | 1.000
| | | | 850,000
| | | | 613
| | | | —
| | | | (1,676
| ) | | | —
| | | | (1,063
| ) | |
Morgan Stanley* | | Markit iTraxx XO.23.V1 | | 06/20/2020 | | | 5.000 | | | | 1,000,000 | | | | 13,022 | | | | — | | | | (10,830 | ) | | | 2,192 | | | | — | | |
Total | | | | | | | | | | | | | | | | | 2,192 | | | | (1,063 | ) | |
* Centrally cleared swap contract
Sell Protection
Counterparty | | Reference
Entity | | Expiration
Date | | Receive
Fixed
Rate (%) | | Implied
Credit
Spread (%)** | | Notional
Amount ($) | | Market
Value ($) | | Unamortized
Premium
(Paid)
Received ($) | | Periodic
Payments
Receivable
(Payable)
($) | | Unrealized
Appreciation
($) | | Unrealized
Depreciation
($) | |
Barclays
| | CDX Emerging
Markets
Index 23-V1 | | 06/20/2020
| | | 1.000
| | | | 2.914
| | | | 1,500,000
| | | | (130,182
| ) | | | 142,581
| | | | 2,958
| | | | 15,357
| | | | —
| | |
Morgan
Stanley*
| | CDX North
America
High Yield 24-V1 | | 06/20/2020
| | | 5.000
| | | | 3.400
| | | | 2,300,000
| | | | 8,647
| | | | —
| | | | 22,680
| | | | 31,327
| | | | —
| | |
Total | | | | | | | | | | | | | | | | | | | 46,684 | | | | — | | |
* Centrally cleared swap contract
**Implied credit spreads, represented in absolute terms, utilized in determining the market value of credit default swap agreements on corporate or sovereign issues as of period end serve as an indicator of the current status of the payment/performance risk and represent the likelihood or risk of default for the credit derivative. The implied credit spread of a particular referenced entity reflects the cost of buying/selling protection and may include upfront payments required to be made to enter into the agreement. Wider credit spreads represent a deterioration of the referenced entity's credit soundness and a greater likelihood or risk of default or other credit event occurring as defined under the terms of the agreement.
Interest Rate Swap Contracts Outstanding at May 31, 2015
Counterparty | | Floating Rate
Index | | Fund
Pay/Receive
Floating Rate | | Fixed
Rate (%) | | Expiration
Date | | Notional
Currency | | Notional
Amount | | Unamortized
Premium
(Paid)
Received ($) | | Unrealized
Appreciation
($) | | Unrealized
Depreciation
($) | |
Barclays
| | 28-Day MXN
TIIE-Banxico | | Receive
| | | 5.500
| | | 03/05/2020
| | MXN |
| | | | 16,700,000
| | | | —
| | | | —
| | | | (11,312
| ) | |
Barclays
| | 6-Month
PLN-WIBOR | | Receive
| | | 1.923
| | | 03/23/2020
| | PLN |
| | | | 2,000,000
| | | | —
| | | | 7,833
| | | | —
| | |
Barclays
| | 6-Month
PLN-WIBOR | | Receive
| | | 2.225
| | | 05/22/2020
| | PLN |
| | | | 2,500,000
| | | | —
| | | | 1,750
| | | | —
| | |
Morgan Stanley*
| | 6-Month
HUF-BUBOR | | Receive
| | | 2.219
| | | 06/02/2020
| | HUF |
| | | | 170,000,000
| | | | (3
| ) | | | —
| | | | (3
| ) | |
Total | | | | | | | | | | | | | | | | | 9,583 | | | | (11,315 | ) | |
* Centrally cleared swap contract
The accompanying Notes to Consolidated Financial Statements are an integral part of this statement.
Annual Report 2015
25
COLUMBIA DIVERSIFIED ABSOLUTE RETURN FUND
CONSOLIDATED PORTFOLIO OF INVESTMENTS (continued)
May 31, 2015
Total Return Swap Contracts Outstanding at May 31, 2015
Counterparty | | Fund Receives | | Fund Pays | | Expiration
Date | | Notional
Currency | | Notional
Amount ($) | | Unrealized
Appreciation ($) | | Unrealized
Depreciation ($) | |
Goldman Sachs
| | Total return on
Goldman Sachs
Premia Basket Series
27 Excess Return(a) | | Fixed rate of 0.35%
| | 02/26/2016
| | USD |
| | | | 10,135,706
| | | | 300,073
| | | | —
| | |
Goldman Sachs
| | Total return on
Goldman Sachs Risk
Premia Basket
Series 27 Excess
Return(a) | | Fixed rate of 0.35%
| | 02/26/2016
| | USD |
| | | | 8,105,448
| | | | 239,966
| | | | —
| | |
Total | | | | | | | | | | | | | 540,039 | | | | — | | |
(a) Underlying assets of this index include forward foreign currency exchange contracts, long/short commodity futures, options on short commodity futures, options on domestic and foreign indices, and long/short domestic and foreign equities.
Notes to Consolidated Portfolio of Investments
(a) This security or a portion of this security has been pledged as collateral in connection with securities sold short.
(b) Non-income producing investment.
(c) Variable rate security.
(d) Interest Only (IO) represents the right to receive the monthly interest payments on an underlying pool of mortgage loans.
(e) Security exempt from registration pursuant to Rule 144A under the Securities Act of 1933. This security may be resold in transactions exempt from registration, normally to qualified institutional buyers. At May 31, 2015, the value of these securities amounted to $2,653,375 or 2.45% of net assets.
(f) Principal amounts are denominated in United States Dollars unless otherwise noted.
(g) Principal and interest may not be guaranteed by the government.
(h) The rate shown is the seven-day current annualized yield at May 31, 2015.
(i) As defined in the Investment Company Act of 1940, an affiliated company is one in which the Fund owns 5% or more of the company's outstanding voting securities, or a company which is under common ownership or control with the Fund. Holdings and transactions in these affiliated companies during the year ended May 31, 2015 are as follows:
Issuer | | Beginning
Cost ($) | | Purchase
Cost ($) | | Proceeds
From Sales ($) | | Ending
Cost ($) | | Dividends —
Affiliated
Issuers ($) | | Value ($) | |
Columbia Short-Term Cash Fund | | | 70,000 | | | | 98,161,906 | | | | (39,519,943 | ) | | | 58,711,963 | | | | 19,166 | | | | 58,711,963 | | |
Abbreviation Legend
ADR American Depositary Receipt
CMO Collateralized Mortgage Obligation
Currency Legend
AUD Australian Dollar
BRL Brazilian Real
CAD Canadian Dollar
CHF Swiss Franc
CLP Chilean Peso
CNY China, Yuan Renminbi
COP Colombian Peso
The accompanying Notes to Consolidated Financial Statements are an integral part of this statement.
Annual Report 2015
26
COLUMBIA DIVERSIFIED ABSOLUTE RETURN FUND
CONSOLIDATED PORTFOLIO OF INVESTMENTS (continued)
May 31, 2015
Currency Legend (continued)
DKK Danish Krone
EUR Euro
GBP British Pound
HKD Hong Kong Dollar
HUF Hungarian Forint
JPY Japanese Yen
MXN Mexican Peso
NOK Norwegian Krone
NZD New Zealand Dollar
PLN Polish Zloty
RON Romania, New Lei
SEK Swedish Krona
SGD Singapore Dollar
TRY Turkish Lira
USD US Dollar
Fair Value Measurements
The Fund categorizes its fair value measurements according to a three-level hierarchy that maximizes the use of observable inputs and minimizes the use of unobservable inputs by prioritizing that the most observable input be used when available. Observable inputs are those that market participants would use in pricing an investment based on market data obtained from sources independent of the reporting entity. Unobservable inputs are those that reflect the Fund's assumptions about the information market participants would use in pricing an investment. An investment's level within the fair value hierarchy is based on the lowest level of any input that is deemed significant to the asset or liability's fair value measurement. The input levels are not necessarily an indication of the risk or liquidity associated with investments at that level. For example, certain U.S. government securities are generally high quality and liquid, however, they are reflected as Level 2 because the inputs used to determine fair value may not always be quoted prices in an active market.
Fair value inputs are summarized in the three broad levels listed below:
> Level 1 — Valuations based on quoted prices for investments in active markets that the Fund has the ability to access at the measurement date (including NAV for open-end mutual funds). Valuation adjustments are not applied to Level 1 investments.
> Level 2 — Valuations based on other significant observable inputs (including quoted prices for similar securities, interest rates, prepayment speeds, credit risks, etc.).
> Level 3 — Valuations based on significant unobservable inputs (including the Fund's own assumptions and judgment in determining the fair value of investments).
Inputs that are used in determining fair value of an investment may include price information, credit data, volatility statistics, and other factors. These inputs can be either observable or unobservable. The availability of observable inputs can vary between investments, and is affected by various factors such as the type of investment, and the volume and level of activity for that investment or similar investments in the marketplace. The inputs will be considered by the Investment Manager, along with any other relevant factors in the calculation of an investment's fair value. The Fund uses prices and inputs that are current as of the measurement date, which may include periods of market dislocations. During these periods, the availability of prices and inputs may be reduced for many investments. This condition could cause an investment to be reclassified between the various levels within the hierarchy.
Investments falling into the Level 3 category are primarily supported by quoted prices from brokers and dealers participating in the market for those investments. However, these may be classified as Level 3 investments due to lack of market transparency and corroboration to support these quoted prices. Additionally, valuation models may be used as the pricing source for any remaining investments classified as Level 3. These models may rely on one or more significant unobservable inputs and/or significant assumptions by the Investment Manager. Inputs used in valuations may include, but are not limited to, financial statement analysis, capital account balances, discount rates and estimated cash flows, and comparable company data.
Under the direction of the Fund's Board of Trustees (the Board), the Investment Manager's Valuation Committee (the Committee) is responsible for overseeing the valuation procedures approved by the Board. The Committee consists of voting and non-voting members from various groups within the Investment Manager's organization, including operations and accounting, trading and investments, compliance, risk management and legal.
The accompanying Notes to Consolidated Financial Statements are an integral part of this statement.
Annual Report 2015
27
COLUMBIA DIVERSIFIED ABSOLUTE RETURN FUND
CONSOLIDATED PORTFOLIO OF INVESTMENTS (continued)
May 31, 2015
Fair Value Measurements (continued)
The Committee meets at least monthly to review and approve valuation matters, which may include a description of specific valuation determinations, data regarding pricing information received from approved pricing vendors and brokers and the results of Board-approved valuation control policies and procedures (the Policies). The Policies address, among other things, instances when market quotations are or are not readily available, including recommendations of third party pricing vendors and a determination of appropriate pricing methodologies; events that require specific valuation determinations and assessment of fair value techniques; securities with a potential for stale pricing, including those that are illiquid, restricted, or in default; and the effectiveness of third party pricing vendors, including periodic reviews of vendors. The Committee meets more frequently, as needed, to discuss additional valuation matters, which may include the need to review back-testing results, review time-sensitive information or approve related valuation actions. The Committee reports to the Board, with members of the Committee meeting with the Board at each of its regularly scheduled meetings to discuss valuation matters and actions during the period, similar to those described earlier.
For investments categorized as Level 3, the Committee monitors information similar to that described above, which may include: (i) data specific to the issuer or comparable issuers, (ii) general market or specific sector news and (iii) quoted prices and specific or similar security transactions. The Committee considers this data and any changes from prior periods in order to assess the reasonableness of observable and unobservable inputs, any assumptions or internal models used to value those securities and changes in fair value. This data is also used to corroborate, when available, information received from approved pricing vendors and brokers. Various factors impact the frequency of monitoring this information (which may occur as often as daily). However, the Committee may determine that changes to inputs, assumptions and models are not required as a result of the monitoring procedures performed.
The following table is a summary of the inputs used to value the Fund's investments at May 31, 2015:
| | | Level 1
Quoted Prices in Active
Markets for Identical
Assets ($) | | Level 2
Other Significant
Observable Inputs ($) | | Level 3
Significant
Unobservable Inputs ($) | | Total ($) | |
Investments | |
Common Stocks | |
Consumer Discretionary | | | 3,000,423 | | | | — | | | | — | | | | 3,000,423 | | |
Consumer Staples | | | 1,120,366 | | | | — | | | | — | | | | 1,120,366 | | |
Energy | | | 1,918,000 | | | | — | | | | — | | | | 1,918,000 | | |
Financials | | | 3,539,074 | | | | — | | | | — | | | | 3,539,074 | | |
Health Care | | | 4,902,177 | | | | — | | | | — | | | | 4,902,177 | | |
Industrials | | | 2,805,374 | | | | — | | | | — | | | | 2,805,374 | | |
Information Technology | | | 4,651,921 | | | | — | | | | — | | | | 4,651,921 | | |
Materials | | | 895,520 | | | | — | | | | — | | | | 895,520 | | |
Telecommunication Services | | | 121,658 | | | | — | | | | — | | | | 121,658 | | |
Utilities | | | 412,946 | | | | — | | | | — | | | | 412,946 | | |
Total Common Stocks | | | 23,367,459 | | | | — | | | | — | | | | 23,367,459 | | |
The accompanying Notes to Consolidated Financial Statements are an integral part of this statement.
Annual Report 2015
28
COLUMBIA DIVERSIFIED ABSOLUTE RETURN FUND
CONSOLIDATED PORTFOLIO OF INVESTMENTS (continued)
May 31, 2015
Fair Value Measurements (continued)
| | | Level 1
Quoted Prices in Active
Markets for Identical
Assets ($) | | Level 2
Other Significant
Observable Inputs ($) | | Level 3
Significant
Unobservable Inputs ($) | | Total ($) | |
Residential Mortgage-Backed
Securities — Agency | | | — | | | | 22,677 | | | | — | | | | 22,677 | | |
Residential Mortgage-Backed
Securities — Non-Agency | | | — | | | | 716,279 | | | | — | | | | 716,279 | | |
Commercial Mortgage-Backed
Securities — Non-Agency | | | — | | | | 973,624 | | | | — | | | | 973,624 | | |
Asset-Backed Securities — Non-Agency | | | — | | | | 606,980 | | | | — | | | | 606,980 | | |
Inflation-Indexed Bonds | | | — | | | | 5,158,472 | | | | — | | | | 5,158,472 | | |
U.S. Treasury Obligations | | | 3,240,225 | | | | — | | | | — | | | | 3,240,225 | | |
Foreign Government Obligations | | | — | | | | 6,440,892 | | | | — | | | | 6,440,892 | | |
Exchange-Traded Funds | | | 10,494,513 | | | | — | | | | — | | | | 10,494,513 | | |
Exchange-Traded Notes | | | 1,364,103 | | | | — | | | | — | | | | 1,364,103 | | |
Money Market Funds | | | 58,711,963 | | | | — | | | | — | | | | 58,711,963 | | |
Total Investments | | | 97,178,263 | | | | 13,918,924 | | | | — | | | | 111,097,187 | | |
Investments Sold Short | |
Common Stocks | |
Consumer Discretionary | | | (1,928,948 | ) | | | — | | | | — | | | | (1,928,948 | ) | |
Consumer Staples | | | (622,187 | ) | | | — | | | | — | | | | (622,187 | ) | |
Energy | | | (1,420,939 | ) | | | — | | | | — | | | | (1,420,939 | ) | |
Financials | | | (2,535,284 | ) | | | — | | | | — | | | | (2,535,284 | ) | |
Health Care | | | (3,822,071 | ) | | | — | | | | — | | | | (3,822,071 | ) | |
Industrials | | | (2,185,574 | ) | | | — | | | | — | | | | (2,185,574 | ) | |
Information Technology | | | (3,337,879 | ) | | | — | | | | — | | | | (3,337,879 | ) | |
Materials | | | (658,882 | ) | | | — | | | | — | | | | (658,882 | ) | |
Telecommunication Services | | | (84,699 | ) | | | — | | | | — | | | | (84,699 | ) | |
Utilities | | | (208,334 | ) | | | — | | | | — | | | | (208,334 | ) | |
Total Common Stocks | | | (16,804,797 | ) | | | — | | | | — | | | | (16,804,797 | ) | |
Total Investments Sold Short | | | (16,804,797 | ) | | | — | | | | — | | | | (16,804,797 | ) | |
Total Investments, Net of Investments
Sold Short | | | 80,373,466 | | | | 13,918,924 | | | | — | | | | 94,292,390 | | |
The accompanying Notes to Consolidated Financial Statements are an integral part of this statement.
Annual Report 2015
29
COLUMBIA DIVERSIFIED ABSOLUTE RETURN FUND
CONSOLIDATED PORTFOLIO OF INVESTMENTS (continued)
May 31, 2015
Fair Value Measurements (continued)
| | | Level 1
Quoted Prices in Active
Markets for Identical
Assets ($) | | Level 2
Other Significant
Observable Inputs ($) | | Level 3
Significant
Unobservable Inputs ($) | | Total ($) | |
Derivatives | |
Assets | |
Forward Foreign Currency
Exchange Contracts | | | — | | | | 1,939,721 | | | | — | | | | 1,939,721 | | |
Futures Contracts | | | 378,832 | | | | — | | | | — | | | | 378,832 | | |
Swap Contracts | | | — | | | | 58,459 | | | | 540,039 | | | | 598,498 | | |
Liabilities | |
Forward Foreign Currency
Exchange Contracts | | | — | | | | (2,060,896 | ) | | | — | | | | (2,060,896 | ) | |
Futures Contracts | | | (229,317 | ) | | | — | | | | — | | | | (229,317 | ) | |
Swap Contracts | | | — | | | | (12,378 | ) | | | — | | | | (12,378 | ) | |
Total | | | 80,522,981 | | | | 13,843,830 | | | | 540,039 | | | | 94,906,850 | | |
See the Consolidated Portfolio of Investments for all investment classifications not indicated in the table.
The Fund's assets assigned to the Level 2 input category are generally valued using the market approach, in which a security's value is determined through reference to prices and information from market transactions for similar or identical assets.
There were no transfers of financial assets between levels during the period.
Derivative instruments are valued at unrealized appreciation (depreciation).
The Fund does not hold any significant investments (greater than one percent of net assets) categorized as Level 3.
The Fund's assets assigned to the Level 3 category are valued utilizing the valuation technique deemed the most appropriate in the circumstances. Certain swap contracts classified as Level 3 securities are valued using the market approach and utilize single market quotations from broker dealers. The appropriateness of fair values for these securities is monitored on an ongoing basis which may include results of back testing and other control procedures.
The accompanying Notes to Consolidated Financial Statements are an integral part of this statement.
Annual Report 2015
30
COLUMBIA DIVERSIFIED ABSOLUTE RETURN FUND
CONSOLIDATED STATEMENT OF ASSETS AND LIABILITIES
May 31, 2015
Assets | |
Investments, at value | |
Unaffiliated issuers (identified cost $52,227,057) | | $ | 52,385,224 | | |
Affiliated issuers (identified cost $58,711,963) | | | 58,711,963 | | |
Total investments (identified cost $110,939,020) | | | 111,097,187 | | |
Cash | | | 1,637 | | |
Foreign currency (identified cost $8,906) | | | 9,079 | | |
Cash collateral held at broker | | | 12,293,020 | | |
Margin deposits | | | 1,630,086 | | |
Unrealized appreciation on forward foreign currency exchange contracts | | | 1,939,721 | | |
Unrealized appreciation on swap contracts | | | 564,979 | | |
Premiums paid on outstanding swap contracts | | | 3 | | |
Receivable for: | |
Investments sold | | | 286,711 | | |
Capital shares sold | | | 1,592 | | |
Dividends | | | 39,099 | | |
Interest | | | 92,640 | | |
Foreign tax reclaims | | | 2,819 | | |
Variation margin | | | 105,739 | | |
Expense reimbursement due from Investment Manager | | | 751 | | |
Trustees' deferred compensation plan | | | 428 | | |
Other assets | | | 74,956 | | |
Total assets | | | 128,140,447 | | |
Liabilities | |
Securities sold short, at value (proceeds $16,679,887) | | | 16,804,797 | | |
Unrealized depreciation on forward foreign currency exchange contracts | | | 2,060,896 | | |
Unrealized depreciation on swap contracts | | | 11,312 | | |
Premiums received on outstanding swap contracts | | | 142,581 | | |
Payable for: | |
Investments purchased | | | 427,029 | | |
Capital shares purchased | | | 37,472 | | |
Dividends and interest on securities sold short | | | 37,172 | | |
Variation margin | | | 214,020 | | |
Investment management fees | | | 3,264 | | |
Transfer agent fees | | | 12 | | |
Administration fees | | | 237 | | |
Chief compliance officer expenses | | | 9 | | |
Other expenses | | | 66,112 | | |
Trustees' deferred compensation plan | | | 428 | | |
Total liabilities | | | 19,805,341 | | |
Net assets applicable to outstanding capital stock | | $ | 108,335,106 | | |
The accompanying Notes to Consolidated Financial Statements are an integral part of this statement.
Annual Report 2015
31
COLUMBIA DIVERSIFIED ABSOLUTE RETURN FUND
CONSOLIDATED STATEMENT OF ASSETS AND LIABILITIES (continued)
May 31, 2015
Represented by | |
Paid-in capital | | $ | 107,725,186 | | |
Undistributed net investment income | | | 40,247 | | |
Accumulated net realized loss | | | (63,072 | ) | |
Unrealized appreciation (depreciation) on: | |
Investments | | | 158,167 | | |
Foreign currency translations | | | (14,972 | ) | |
Forward foreign currency exchange contracts | | | (121,175 | ) | |
Futures contracts | | | 149,515 | | |
Securities sold short | | | (124,910 | ) | |
Swap contracts | | | 586,120 | | |
Total — representing net assets applicable to outstanding capital stock | | $ | 108,335,106 | | |
Class A | |
Net assets | | $ | 11,301 | | |
Shares outstanding | | | 1,119 | | |
Net asset value per share | | $ | 10.10 | | |
Maximum offering price per share(a) | | $ | 10.72 | | |
Class C | |
Net assets | | $ | 10,080 | | |
Shares outstanding | | | 1,000 | | |
Net asset value per share | | $ | 10.08 | | |
Class I | |
Net assets | | $ | 107,511,194 | | |
Shares outstanding | | | 10,635,064 | | |
Net asset value per share | | $ | 10.11 | | |
Class R4 | |
Net assets | | $ | 10,108 | | |
Shares outstanding | | | 1,000 | | |
Net asset value per share | | $ | 10.11 | | |
Class R5 | |
Net assets | | $ | 10,108 | | |
Shares outstanding | | | 1,000 | | |
Net asset value per share | | $ | 10.11 | | |
Class W | |
Net assets | | $ | 10,101 | | |
Shares outstanding | | | 1,000 | | |
Net asset value per share | | $ | 10.10 | | |
Class Z | |
Net assets | | $ | 772,214 | | |
Shares outstanding | | | 76,396 | | |
Net asset value per share | | $ | 10.11 | | |
(a) The maximum offering price per share is calculated by dividing the net asset value per share by 1.0 minus the maximum sales charge of 5.75%.
The accompanying Notes to Consolidated Financial Statements are an integral part of this statement.
Annual Report 2015
32
COLUMBIA DIVERSIFIED ABSOLUTE RETURN FUND
CONSOLIDATED STATEMENT OF OPERATIONS
Year Ended May 31, 2015(a)
Net investment income | |
Income: | |
Dividends — unaffiliated issuers | | $ | 189,565 | | |
Dividends — affiliated issuers | | | 19,166 | | |
Interest | | | 69,935 | | |
Foreign taxes withheld | | | (391 | ) | |
Total income | | | 278,275 | | |
Expenses: | |
Investment management fees | | | 320,186 | | |
Distribution and/or service fees | |
Class A | | | 8 | | |
Class C | | | 28 | | |
Class W | | | 7 | | |
Transfer agent fees | |
Class A | | | 2 | | |
Class C | | | 2 | | |
Class R4 | | | 2 | | |
Class R5 | | | 1 | | |
Class W | | | 2 | | |
Class Z | | | 73 | | |
Administration fees | | | 23,286 | | |
Compensation of board members | | | 3,319 | | |
Custodian fees | | | 17,763 | | |
Printing and postage fees | | | 14,000 | | |
Registration fees | | | 9,387 | | |
Professional fees | | | 39,970 | | |
Dividends and interest on securities sold short | | | 122,521 | | |
Offering costs | | | 29,415 | | |
Chief compliance officer expenses | | | 22 | | |
Other | | | 2,327 | | |
Total expenses | | | 582,321 | | |
Fees waived or expenses reimbursed by Investment Manager and its affiliates | | | (90,008 | ) | |
Total net expenses | | | 492,313 | | |
Net investment loss | | | (214,038 | ) | |
Realized and unrealized gain (loss) — net | |
Net realized gain (loss) on: | |
Investments | | | 373,788 | | |
Foreign currency translations | | | 11,113 | | |
Forward foreign currency exchange contracts | | | 933,750 | | |
Futures contracts | | | 277,372 | | |
Securities sold short | | | (93,592 | ) | |
Swap contracts | | | (769,289 | ) | |
Net realized gain | | | 733,142 | | |
Net change in unrealized appreciation (depreciation) on: | |
Investments | | | 158,167 | | |
Foreign currency translations | | | (14,972 | ) | |
Forward foreign currency exchange contracts | | | (121,175 | ) | |
Futures contracts | | | 149,515 | | |
Securities sold short | | | (124,910 | ) | |
Swap contracts | | | 586,120 | | |
Net change in unrealized appreciation | | | 632,745 | | |
Net realized and unrealized gain | | | 1,365,887 | | |
Net increase in net assets resulting from operations | | $ | 1,151,849 | | |
(a) Based on operations from February 19, 2015 (commencement of operations) through the stated period end.
The accompanying Notes to Consolidated Financial Statements are an integral part of this statement.
Annual Report 2015
33
COLUMBIA DIVERSIFIED ABSOLUTE RETURN FUND
CONSOLIDATED STATEMENT OF CHANGES IN NET ASSETS
| | | Year Ended
May 31,
2015(a) | |
Operations | |
Net investment loss | | $ | (214,038 | ) | |
Net realized gain | | | 733,142 | | |
Net change in unrealized appreciation | | | 632,745 | | |
Net increase in net assets resulting from operations | | | 1,151,849 | | |
Increase in net assets from capital stock activity | | | 107,113,257 | | |
Total increase in net assets | | | 108,265,106 | | |
Net assets at beginning of year | | | 70,000 | | |
Net assets at end of year | | $ | 108,335,106 | | |
Undistributed net investment income | | $ | 40,247 | | |
(a) Based on operations from February 19, 2015 (commencement of operations) through the stated period end.
The accompanying Notes to Consolidated Financial Statements are an integral part of this statement.
Annual Report 2015
34
COLUMBIA DIVERSIFIED ABSOLUTE RETURN FUND
CONSOLIDATED STATEMENT OF CHANGES IN NET ASSETS (continued)
| | | Year Ended May 31, 2015(a) | |
| | | Shares | | Dollars ($) | |
Capital stock activity | |
Class A shares | |
Subscriptions | | | 119 | | | | 1,195 | | |
Net increase | | | 119 | | | | 1,195 | | |
Class I shares | |
Subscriptions | | | 10,690,962 | | | | 106,932,653 | | |
Redemptions | | | (56,898 | ) | | | (576,466 | ) | |
Net increase | | | 10,634,064 | | | | 106,356,187 | | |
Class Z shares | |
Subscriptions | | | 75,396 | | | | 755,875 | | |
Net increase | | | 75,396 | | | | 755,875 | | |
Total net increase | | | 10,709,579 | | | | 107,113,257 | | |
(a) Based on operations from February 19, 2015 (commencement of operations) through the stated period end.
The accompanying Notes to Consolidated Financial Statements are an integral part of this statement.
Annual Report 2015
35
COLUMBIA DIVERSIFIED ABSOLUTE RETURN FUND
CONSOLIDATED FINANCIAL HIGHLIGHTS
The following tables are intended to help you understand the Fund's financial performance. Certain information reflects financial results for a single share of a class held for the periods shown. Per share net investment income (loss) amounts are calculated based on average shares outstanding during the period. Total return assumes reinvestment of all dividends and distributions, if any. Total return does not reflect payment of sales charges, if any. Total return and portfolio turnover are not annualized for periods of less than one year. The portfolio turnover rate is calculated without regard to purchase and sales transactions of short-term instruments and certain derivatives, if any. If such transactions were included, the Fund's portfolio turnover rate may be higher.
Class A | | Year Ended
May 31,
2015(a) | |
Per share data | |
Net asset value, beginning of period | | $ | 10.00 | | |
Income from investment operations: | |
Net investment loss | | | (0.03 | ) | |
Net realized and unrealized gain | | | 0.13 | | |
Total from investment operations | | | 0.10 | | |
Net asset value, end of period | | $ | 10.10 | | |
Total return | | | 1.00 | % | |
Ratios to average net assets(b) | |
Total gross expenses | | | 2.11 | %(c)(d) | |
Total net expenses(e) | | | 1.99 | %(c)(d) | |
Net investment loss | | | (1.04 | %)(d) | |
Supplemental data | |
Net assets, end of period (in thousands) | | $ | 11 | | |
Portfolio turnover | | | 60 | % | |
Notes to Consolidated Financial Highlights
(a) Based on operations from February 19, 2015 (commencement of operations) through the stated period end.
(b) In addition to the fees and expenses that the Fund bears directly, the Fund indirectly bears a pro rata share of the fees and expenses of any other funds in which it invests. Such indirect expenses are not included in the Fund's reported expense ratios.
(c) Ratios include dividends and interest on securities sold short. If dividends and interest on securities sold short had been excluded, expenses would have been lower by 0.41% for the year ended May 31, 2015.
(d) Annualized.
(e) Total net expenses include the impact of certain fee waivers/expense reimbursements made by the Investment Manager and certain of its affiliates, if applicable.
The accompanying Notes to Consolidated Financial Statements are an integral part of this statement.
Annual Report 2015
36
COLUMBIA DIVERSIFIED ABSOLUTE RETURN FUND
CONSOLIDATED FINANCIAL HIGHLIGHTS (continued)
Class C | | Year Ended
May 31,
2015(a) | |
Per share data | |
Net asset value, beginning of period | | $ | 10.00 | | |
Income from investment operations: | |
Net investment loss | | | (0.05 | ) | |
Net realized and unrealized gain | | | 0.13 | | |
Total from investment operations | | | 0.08 | | |
Net asset value, end of period | | $ | 10.08 | | |
Total return | | | 0.80 | % | |
Ratios to average net assets(b) | |
Total gross expenses | | | 2.89 | %(c)(d) | |
Total net expenses(e) | | | 2.75 | %(c)(d) | |
Net investment loss | | | (1.80 | %)(d) | |
Supplemental data | |
Net assets, end of period (in thousands) | | $ | 10 | | |
Portfolio turnover | | | 60 | % | |
Notes to Consolidated Financial Highlights
(a) Based on operations from February 19, 2015 (commencement of operations) through the stated period end.
(b) In addition to the fees and expenses that the Fund bears directly, the Fund indirectly bears a pro rata share of the fees and expenses of any other funds in which it invests. Such indirect expenses are not included in the Fund's reported expense ratios.
(c) Ratios include dividends and interest on securities sold short. If dividends and interest on securities sold short had been excluded, expenses would have been lower by 0.42% for the year ended May 31, 2015.
(d) Annualized.
(e) Total net expenses include the impact of certain fee waivers/expense reimbursements made by the Investment Manager and certain of its affiliates, if applicable.
The accompanying Notes to Consolidated Financial Statements are an integral part of this statement.
Annual Report 2015
37
COLUMBIA DIVERSIFIED ABSOLUTE RETURN FUND
CONSOLIDATED FINANCIAL HIGHLIGHTS (continued)
Class I | | Year Ended
May 31,
2015(a) | |
Per share data | |
Net asset value, beginning of period | | $ | 10.00 | | |
Income from investment operations: | |
Net investment loss | | | (0.02 | ) | |
Net realized and unrealized gain | | | 0.13 | | |
Total from investment operations | | | 0.11 | | |
Net asset value, end of period | | $ | 10.11 | | |
Total return | | | 1.10 | % | |
Ratios to average net assets(b) | |
Total gross expenses | | | 1.84 | %(c)(d) | |
Total net expenses(e) | | | 1.69 | %(c)(d) | |
Net investment loss | | | (0.74 | %)(d) | |
Supplemental data | |
Net assets, end of period (in thousands) | | $ | 107,511 | | |
Portfolio turnover | | | 60 | % | |
Notes to Consolidated Financial Highlights
(a) Based on operations from February 19, 2015 (commencement of operations) through the stated period end.
(b) In addition to the fees and expenses that the Fund bears directly, the Fund indirectly bears a pro rata share of the fees and expenses of any other funds in which it invests. Such indirect expenses are not included in the Fund's reported expense ratios.
(c) Ratios include dividends and interest on securities sold short. If dividends and interest on securities sold short had been excluded, expenses would have been lower by 0.42% for the year ended May 31, 2015.
(d) Annualized.
(e) Total net expenses include the impact of certain fee waivers/expense reimbursements made by the Investment Manager and certain of its affiliates, if applicable.
The accompanying Notes to Consolidated Financial Statements are an integral part of this statement.
Annual Report 2015
38
COLUMBIA DIVERSIFIED ABSOLUTE RETURN FUND
CONSOLIDATED FINANCIAL HIGHLIGHTS (continued)
Class R4 | | Year Ended
May 31,
2015(a) | |
Per share data | |
Net asset value, beginning of period | | $ | 10.00 | | |
Income from investment operations: | |
Net investment loss | | | (0.02 | ) | |
Net realized and unrealized gain | | | 0.13 | | |
Total from investment operations | | | 0.11 | | |
Net asset value, end of period | | $ | 10.11 | | |
Total return | | | 1.10 | % | |
Ratios to average net assets(b) | |
Total gross expenses | | | 1.89 | %(c)(d) | |
Total net expenses(e) | | | 1.74 | %(c)(d) | |
Net investment loss | | | (0.79 | %)(d) | |
Supplemental data | |
Net assets, end of period (in thousands) | | $ | 10 | | |
Portfolio turnover | | | 60 | % | |
Notes to Consolidated Financial Highlights
(a) Based on operations from February 19, 2015 (commencement of operations) through the stated period end.
(b) In addition to the fees and expenses that the Fund bears directly, the Fund indirectly bears a pro rata share of the fees and expenses of any other funds in which it invests. Such indirect expenses are not included in the Fund's reported expense ratios.
(c) Ratios include dividends and interest on securities sold short. If dividends and interest on securities sold short had been excluded, expenses would have been lower by 0.42% for the year ended May 31, 2015.
(d) Annualized.
(e) Total net expenses include the impact of certain fee waivers/expense reimbursements made by the Investment Manager and certain of its affiliates, if applicable.
The accompanying Notes to Consolidated Financial Statements are an integral part of this statement.
Annual Report 2015
39
COLUMBIA DIVERSIFIED ABSOLUTE RETURN FUND
CONSOLIDATED FINANCIAL HIGHLIGHTS (continued)
Class R5 | | Year Ended
May 31,
2015(a) | |
Per share data | |
Net asset value, beginning of period | | $ | 10.00 | | |
Income from investment operations: | |
Net investment loss | | | (0.02 | ) | |
Net realized and unrealized gain | | | 0.13 | | |
Total from investment operations | | | 0.11 | | |
Net asset value, end of period | | $ | 10.11 | | |
Total return | | | 1.10 | % | |
Ratios to average net assets(b) | |
Total gross expenses | | | 1.89 | %(c)(d) | |
Total net expenses(e) | | | 1.74 | %(c)(d) | |
Net investment loss | | | (0.80 | %)(d) | |
Supplemental data | |
Net assets, end of period (in thousands) | | $ | 10 | | |
Portfolio turnover | | | 60 | % | |
Notes to Consolidated Financial Highlights
(a) Based on operations from February 19, 2015 (commencement of operations) through the stated period end.
(b) In addition to the fees and expenses that the Fund bears directly, the Fund indirectly bears a pro rata share of the fees and expenses of any other funds in which it invests. Such indirect expenses are not included in the Fund's reported expense ratios.
(c) Ratios include dividends and interest on securities sold short. If dividends and interest on securities sold short had been excluded, expenses would have been lower by 0.42% for the year ended May 31, 2015.
(d) Annualized.
(e) Total net expenses include the impact of certain fee waivers/expense reimbursements made by the Investment Manager and certain of its affiliates, if applicable.
The accompanying Notes to Consolidated Financial Statements are an integral part of this statement.
Annual Report 2015
40
COLUMBIA DIVERSIFIED ABSOLUTE RETURN FUND
CONSOLIDATED FINANCIAL HIGHLIGHTS (continued)
Class W | | Year Ended
May 31,
2015(a) | |
Per share data | |
Net asset value, beginning of period | | $ | 10.00 | | |
Income from investment operations: | |
Net investment loss | | | (0.03 | ) | |
Net realized and unrealized gain | | | 0.13 | | |
Total from investment operations | | | 0.10 | | |
Net asset value, end of period | | $ | 10.10 | | |
Total return | | | 1.00 | % | |
Ratios to average net assets(b) | |
Total gross expenses | | | 2.14 | %(c)(d) | |
Total net expenses(e) | | | 2.00 | %(c)(d) | |
Net investment loss | | | (1.05 | %)(d) | |
Supplemental data | |
Net assets, end of period (in thousands) | | $ | 10 | | |
Portfolio turnover | | | 60 | % | |
Notes to Consolidated Financial Highlights
(a) Based on operations from February 19, 2015 (commencement of operations) through the stated period end.
(b) In addition to the fees and expenses that the Fund bears directly, the Fund indirectly bears a pro rata share of the fees and expenses of any other funds in which it invests. Such indirect expenses are not included in the Fund's reported expense ratios.
(c) Ratios include dividends and interest on securities sold short. If dividends and interest on securities sold short had been excluded, expenses would have been lower by 0.42% for the year ended May 31, 2015.
(d) Annualized.
(e) Total net expenses include the impact of certain fee waivers/expense reimbursements made by the Investment Manager and certain of its affiliates, if applicable.
The accompanying Notes to Consolidated Financial Statements are an integral part of this statement.
Annual Report 2015
41
COLUMBIA DIVERSIFIED ABSOLUTE RETURN FUND
CONSOLIDATED FINANCIAL HIGHLIGHTS (continued)
Class Z | | Year Ended
May 31,
2015(a) | |
Per share data | |
Net asset value, beginning of period | | $ | 10.00 | | |
Income from investment operations: | |
Net investment loss | | | (0.02 | ) | |
Net realized and unrealized gain | | | 0.13 | | |
Total from investment operations | | | 0.11 | | |
Net asset value, end of period | | $ | 10.11 | | |
Total return | | | 1.10 | % | |
Ratios to average net assets(b) | |
Total gross expenses | | | 1.91 | %(c)(d) | |
Total net expenses(e) | | | 1.75 | %(c)(d) | |
Net investment loss | | | (0.74 | %)(d) | |
Supplemental data | |
Net assets, end of period (in thousands) | | $ | 772 | | |
Portfolio turnover | | | 60 | % | |
Notes to Consolidated Financial Highlights
(a) Based on operations from February 19, 2015 (commencement of operations) through the stated period end.
(b) In addition to the fees and expenses that the Fund bears directly, the Fund indirectly bears a pro rata share of the fees and expenses of any other funds in which it invests. Such indirect expenses are not included in the Fund's reported expense ratios.
(c) Ratios include dividends and interest on securities sold short. If dividends and interest on securities sold short had been excluded, expenses would have been lower by 0.44% for the year ended May 31, 2015.
(d) Annualized.
(e) Total net expenses include the impact of certain fee waivers/expense reimbursements made by the Investment Manager and certain of its affiliates, if applicable.
The accompanying Notes to Consolidated Financial Statements are an integral part of this statement.
Annual Report 2015
42
COLUMBIA DIVERSIFIED ABSOLUTE RETURN FUND
NOTES TO CONSOLIDATED FINANCIAL STATEMENTS
May 31, 2015
Note 1. Organization
Columbia Diversified Absolute Return Fund (the Fund), a series of Columbia Funds Series Trust I (the Trust), is a diversified fund. The Trust is registered under the Investment Company Act of 1940, as amended (the 1940 Act), as an open-end management investment company organized as a Massachusetts business trust.
On February 17, 2015, Columbia Management Investment Advisers, LLC (the Investment Manager), a wholly-owned subsidiary of Ameriprise Financial, Inc. (Ameriprise Financial), invested $70,000 in the Fund (1,000 shares for Class A, 1,000 shares for Class C, 1,000 shares for Class I, 1,000 shares for Class R4, 1,000 shares for Class R5, 1,000 shares for Class W and 1,000 shares for Class Z), which represented the initial capital for each class at $10.00 per share. Shares of the Fund were first offered to the public on February 19, 2015.
These financial statements cover the period from February 19, 2015 (commencement of operations) through May 31, 2015.
Basis for Consolidation
CDARF1 Offshore Fund, Ltd., CDARF2 Offshore Fund, Ltd. and CDARF3 Offshore Fund, Ltd. (each, a Subsidiary) are each a Cayman Islands exempted company and wholly-owned subsidiary of the Fund. Each Subsidiary operates as an investment vehicle to provide the Fund with exposure to the commodities markets consistent with the Fund's investment objective and policies as stated in its current prospectus and statement of additional information. In accordance with the Memorandum and Articles of Association of the Subsidiary (the Articles), the Fund owns the sole issued share of each Subsidiary and retains all rights associated with such share, including the right to receive notice of, attend and vote at general meetings of the Subsidiaries, rights in a winding-up or repayment of capital and the right to participate in the profits or assets of the Subsidiaries. At May 31, 2015, the net assets of CDARF1 Offshore Fund, Ltd. were $2,996,670 or 2.77% of the Fund's consolidated net assets, the net assets of CDARF2 Offshore Fund, Ltd. were $1,959,643 or 1.81% of the Fund's consolidated net assets and the net assets of CDARF3 Offshore Fund, Ltd. were $5,008,153 or 4.62% of the Fund's consolidated net assets. All intercompany transactions and balances have been eliminated in the consolidation process.
The consolidated financial statements (financial statements) present the portfolio holdings, financial
position and results of operations of the Fund and the Subsidiaries on a consolidated basis.
Fund Shares
The Trust may issue an unlimited number of shares (without par value). The Fund offers Class A, Class C, Class I, Class R4, Class R5, Class W and Class Z shares. Although all share classes generally have identical voting, dividend and liquidation rights, each share class votes separately when required by the Trust's organizational documents or by law. Different share classes pay different distribution amounts to the extent the expenses of such share classes differ, and distributions in liquidation will be proportional to the net asset value of each share class. Each share class has its own expense and sales charge structure.
Class A shares are subject to a maximum front-end sales charge of 5.75% based on the initial investment amount. Class A shares purchased without an initial sales charge in accounts aggregating $1 million to $50 million at the time of purchase are subject to a contingent deferred sales charge (CDSC) if the shares are sold within 18 months after purchase, charged as follows: 1.00% CDSC if redeemed within 12 months after purchase, and 0.50% CDSC if redeemed more than 12, but less than 18, months after purchase.
Class C shares are subject to a 1.00% CDSC on shares redeemed within one year after purchase.
Class I shares are not subject to sales charges and are available only to the Columbia Family of Funds.
Class R4 shares are not subject to sales charges and are generally available only to omnibus retirement plans and certain investors as described in the Fund's prospectus.
Class R5 shares are not subject to sales charges and are generally available only to investors purchasing through authorized investment professionals and omnibus retirement plans.
Class W shares are not subject to sales charges and are available only to investors purchasing through authorized investment programs managed by investment professionals, including discretionary managed account programs.
Class Z shares are not subject to sales charges and are available only to eligible investors, which are subject to different investment minimums as described in the Fund's prospectus.
Annual Report 2015
43
COLUMBIA DIVERSIFIED ABSOLUTE RETURN FUND
NOTES TO CONSOLIDATED FINANCIAL STATEMENTS (continued)
May 31, 2015
Note 2. Summary of Significant Accounting Policies
Basis of Preparation
The Fund is an investment company that applies the accounting and reporting guidance in the Financial Accounting Standards Board (FASB) Accounting Standards Codification Topic 946, Financial Services — Investment Companies (ASC 946). The financial statements are prepared in accordance with U.S. generally accepted accounting principles (GAAP), which requires management to make certain estimates and assumptions that affect the reported amounts of assets and liabilities, the disclosure of contingent assets and liabilities at the date of the financial statements and the reported amounts of income and expenses during the reporting period. Actual results could differ from those estimates.
The following is a summary of significant accounting policies followed by the Fund in the preparation of its financial statements.
Security Valuation
All equity securities and exchange-traded funds (ETFs) are valued at the close of business of the New York Stock Exchange (NYSE). Equity securities and ETFs are valued at the last quoted sales price on the principal exchange or market on which they trade, except for securities traded on the NASDAQ Stock Market, which are valued at the NASDAQ official close price. Unlisted securities or listed securities for which there were no sales during the day are valued at the mean of the latest quoted bid and ask prices on such exchanges or markets.
Debt securities generally are valued by pricing services approved by the Board of Trustees (the Board) based upon market transactions for normal, institutional-size trading units of similar securities. The services may use various pricing techniques that take into account, as applicable, factors such as yield, quality, coupon rate, maturity, type of issue, trading characteristics and other data, as well as broker quotes. Debt securities for which quotations are not readily available or not believed to be reflective of market value may also be valued based upon a bid quote from an approved independent broker-dealer.
Foreign equity securities are valued based on the closing price on the foreign exchange in which such securities are primarily traded. If any foreign equity security closing prices are not readily available, the securities are valued
at the mean of the latest quoted bid and ask prices on such exchanges or markets. Foreign currency exchange rates are generally determined at 4:00 p.m. Eastern (U.S.) time. Many securities markets and exchanges outside the U.S. close prior to the close of the NYSE; therefore, the closing prices for securities in such markets or on such exchanges may not fully reflect events that occur after such close but before the close of the NYSE. In those situations, foreign securities will be fair valued pursuant to a policy adopted by the Board, including, if available, utilizing a third party pricing service to determine these fair values. The third party pricing service takes into account multiple factors, including, but not limited to, movements in the U.S. securities markets, certain depositary receipts, futures contracts and foreign exchange rates that have occurred subsequent to the close of the foreign exchange or market, to determine a good faith estimate that reasonably reflects the current market conditions as of the close of the NYSE. The fair value of a security is likely to be different from the quoted or published price, if available.
Asset and mortgage-backed securities are generally valued by pricing services, which utilize pricing models that incorporate the securities' cash flow and loan performance data. These models also take into account available market data, including trades, market quotations, and benchmark yield curves for identical or similar securities. Factors used to identify similar securities may include, but are not limited to, issuer, collateral type, vintage, prepayment speeds, collateral performance, credit ratings, credit enhancement and expected life. Asset-backed securities for which quotations are readily available may also be valued based upon an over-the-counter or exchange bid quote from an approved independent broker-dealer.
Investments in open-end investment companies, including money market funds, are valued at their latest net asset value.
Forward foreign currency exchange contracts are marked-to-market based upon foreign currency exchange rates provided by a pricing service.
Futures and options on futures contracts are valued based upon the settlement price at the close of regular trading on their principal exchanges or, in the absence of transactions, at the mean of the latest quoted bid and ask prices.
Swap transactions are valued through an independent pricing service or broker, or if neither is available, through an internal model based upon observable inputs.
Annual Report 2015
44
COLUMBIA DIVERSIFIED ABSOLUTE RETURN FUND
NOTES TO CONSOLIDATED FINANCIAL STATEMENTS (continued)
May 31, 2015
Investments for which market quotations are not readily available, or that have quotations which management believes are not reflective of market value or reliable, are valued at fair value as determined in good faith under procedures approved by and under the general supervision of the Board. If a security or class of securities (such as foreign securities) is valued at fair value, such value is likely to be different from the quoted or published price for the security.
The determination of fair value often requires significant judgment. To determine fair value, management may use assumptions including but not limited to future cash flows and estimated risk premiums. Multiple inputs from various sources may be used to determine fair value.
GAAP requires disclosure regarding the inputs and valuation techniques used to measure fair value and any changes in valuation inputs or techniques. In addition, investments shall be disclosed by major category. This information is disclosed following the Fund's Consolidated Portfolio of Investments.
Foreign Currency Transactions and Translations
The values of all assets and liabilities denominated in foreign currencies are generally translated into U.S. dollars at exchange rates determined at the close of the NYSE. Net realized and unrealized gains (losses) on foreign currency transactions and translations include gains (losses) arising from the fluctuation in exchange rates between trade and settlement dates on securities transactions, gains (losses) arising from the disposition of foreign currency and currency gains (losses) between the accrual and payment dates on dividends, interest income and foreign withholding taxes.
For financial statement purposes, the Fund does not distinguish that portion of gains (losses) on investments which is due to changes in foreign exchange rates from that which is due to changes in market prices of the investments. Such fluctuations are included with the net realized and unrealized gains (losses) on investments in the Consolidated Statement of Operations.
Derivative Instruments
The Fund invests in certain derivative instruments, as detailed below, to meet its investment objectives. Derivatives are instruments whose values depend on, or are derived from, in whole or in part, the value of one or more securities, currencies, commodities, indices, or other assets or instruments. Derivatives may be used to increase investment flexibility (including to maintain cash reserves while maintaining desired exposures), for risk management (hedging) purposes, to facilitate trading, to
reduce transaction costs and to pursue higher investment returns. The Fund may also use derivative instruments to mitigate certain investment risks, such as foreign currency exchange rate risk, interest rate risk and credit risk. Derivatives may involve various risks, including the potential inability of the counterparty to fulfill its obligation under the terms of the contract, the potential for an illiquid secondary market (making it difficult for the Fund to sell, including at favorable prices) and the potential for market movements which may expose the Fund to gains or losses in excess of the amount shown in the Consolidated Statement of Assets and Liabilities. The notional amounts of derivative instruments, if applicable, are not recorded in the financial statements.
A derivative instrument may suffer a marked-to-market loss if the value of the contract decreases due to an unfavorable change in the market rates or values of the underlying instrument. Losses can also occur if the counterparty does not perform under the contract. The Fund's risk of loss from counterparty credit risk on over-the-counter derivatives is generally limited to the aggregate unrealized gain netted against any collateral held by the Fund and the amount of any variation margin held by the counterparty. With exchange-traded or centrally cleared derivatives, there is reduced counterparty credit risk to the Fund since the exchange's clearinghouse, as counterparty to such instruments, guarantees against a possible default. The clearinghouse stands between the buyer and the seller of the contract; therefore, the counterparty credit risk is failure of the clearinghouse. However, credit risk still exists in exchange-traded or centrally cleared derivatives with respect to initial and variation margin that is held in a broker's customer account. While brokers are required to segregate customer margin from their own assets, in the event that a broker becomes insolvent or goes into bankruptcy and at that time there is a shortfall in the aggregate amount of margin held by the broker for all its clients, U.S. bankruptcy laws will typically allocate that shortfall on a pro-rata basis across all the broker's customers (including the Fund), potentially resulting in losses to the Fund.
In order to better define its contractual rights and to secure rights that will help the Fund mitigate its counterparty risk, the Fund may enter into an International Swaps and Derivatives Association, Inc. Master Agreement (ISDA Master Agreement) or similar agreement with its derivative contract counterparties. An ISDA Master Agreement is an agreement between the Fund and a counterparty that governs over-the-counter
Annual Report 2015
45
COLUMBIA DIVERSIFIED ABSOLUTE RETURN FUND
NOTES TO CONSOLIDATED FINANCIAL STATEMENTS (continued)
May 31, 2015
derivatives and forward foreign currency exchange contracts and typically contains, among other things, collateral posting terms and netting provisions in the event of a default and/or termination event. Under an ISDA Master Agreement, the Fund may, under certain circumstances, offset with the counterparty certain derivative instrument's payables and/or receivables with collateral held and/or posted and create one single net payment. The provisions of the ISDA Master Agreement typically permit a single net payment in the event of default (close-out netting) including the bankruptcy or insolvency of the counterparty. Note, however, that bankruptcy or insolvency laws of a particular jurisdiction may impose restrictions on or prohibitions against the right of offset in bankruptcy, insolvency or other events.
Collateral (margin) requirements differ by type of derivative. Margin requirements are established by the exchange or clearinghouse for exchange-traded and centrally cleared derivatives. Brokers can ask for margin in excess of the minimum in certain circumstances. Collateral terms are contract specific for over-the-counter derivatives. For over-the-counter derivatives traded under an ISDA Master Agreement, the collateral requirements are typically calculated by netting the marked-to-market amount for each transaction under such agreement and comparing that amount to the value of any variation margin currently pledged by the Fund and/or the counterparty. Generally, the amount of collateral due from or to a party has to exceed a minimum transfer amount threshold (e.g., $500,000) before a transfer has to be made. To the extent amounts due to the Fund from its counterparties are not fully collateralized, contractually or otherwise, the Fund bears the risk of loss from counterparty nonperformance. The Fund attempts to mitigate counterparty risk by only entering into agreements with counterparties that it believes have the financial resources to honor their obligations and by monitoring the financial stability of those counterparties.
Certain ISDA Master Agreements allow counterparties to over-the-counter derivatives transactions to terminate derivatives contracts prior to maturity in the event the Fund's net assets decline by a stated percentage over a specified time period or if the Fund fails to meet certain terms of the ISDA Master Agreement, which would cause the Fund to accelerate payment of any net liability owed to the counterparty. The Fund also has termination rights if the counterparty fails to meet certain terms of the ISDA Master Agreement. In addition to considering counterparty credit risk, the Fund would consider terminating the derivatives contracts based on whether
termination would result in a net liability owed from the counterparty.
For financial reporting purposes, the Fund does not offset derivative assets and derivative liabilities that are subject to netting arrangements in the Consolidated Statement of Assets and Liabilities.
Forward Foreign Currency Exchange Contracts
Forward foreign currency exchange contracts are over-the-counter agreements between two parties to buy and sell a currency at a set price on a future date. The Fund utilized forward foreign currency exchange contracts to gain market exposure to various foreign currencies. These instruments may be used for other purposes in future periods.
The values of forward foreign currency exchange contracts fluctuate daily with changes in foreign currency exchange rates. Changes in the value of these contracts are recorded as unrealized appreciation or depreciation until the contract is exercised or has expired. The Fund will realize a gain or loss when the forward foreign currency exchange contract is closed or expires.
The use of forward foreign currency exchange contracts does not eliminate fluctuations in the prices of the Fund's portfolio securities. The risks of forward foreign currency exchange contracts include movement in the values of the foreign currencies relative to the U.S. dollar (or other foreign currencies) and the possibility that counterparties will not complete their contractual obligations, which may be in excess of the amount reflected, if any, in the Consolidated Statement of Assets and Liabilities.
Futures Contracts
Futures contracts are exchange traded and represent commitments for the future purchase or sale of an asset at a specified price on a specified date. The Fund bought and sold futures contracts to produce incremental earnings, manage exposure to movements in interest rates, manage exposure to the securities market and gain market exposure to various currencies. These instruments may be used for other purposes in future periods. Upon entering into futures contracts, the Fund bears risks that it may not achieve the anticipated benefits of the futures contracts and may realize a loss. Additional risks include counterparty credit risk, the possibility of an illiquid market, and that a change in the value of the contract or option may not correlate with changes in the value of the underlying asset.
Annual Report 2015
46
COLUMBIA DIVERSIFIED ABSOLUTE RETURN FUND
NOTES TO CONSOLIDATED FINANCIAL STATEMENTS (continued)
May 31, 2015
Upon entering into a futures contract, the Fund pledges cash or securities with the broker in an amount sufficient to meet the initial margin requirement. The initial margin deposit must be maintained at an established level over the life of the contract. Cash deposited as initial margin is recorded in the Consolidated Statement of Assets and Liabilities as margin deposits. Securities deposited as initial margin are designated in the Consolidated Portfolio of Investments. Subsequent payments (variation margin) are made or received by the Fund each day. The variation margin payments are equal to the daily change in the contract value and are recorded as variation margin receivable or payable and are offset in unrealized gains or losses. The Fund recognizes a realized gain or loss when the contract is closed or expires. Futures contracts involve, to varying degrees, risk of loss in excess of the variation margin disclosed in the Consolidated Statement of Assets and Liabilities.
Swap Contracts
Swap contracts are negotiated in the over-the-counter market and may be entered into as a bilateral contract or centrally cleared (centrally cleared swap contract). In a centrally cleared swap contract, immediately following execution of the swap contract with a broker, the swap contract is novated to a central counterparty (the CCP) and the CCP becomes the Fund's counterparty to the centrally cleared swap contract. The Fund is required to deposit initial margin with the broker in the form of cash or securities in an amount that varies depending on the size and risk profile of the particular swap contract. Securities deposited as initial margin are designated in the Consolidated Portfolio of Investments and cash deposited is recorded in the Consolidated Statement of Assets and Liabilities as margin deposits. Unlike a bilateral swap contract, for centrally cleared swap contracts, the Fund has minimal credit exposure to the counterparty because the CCP stands between the Fund and the counterparty. Swap contracts are marked-to-market daily and changes in value are recorded as unrealized appreciation (depreciation). The daily change in valuation of centrally cleared swap contracts, if any, is recorded as a receivable or payable for variation margin in the Consolidated Statement of Assets and Liabilities.
Credit Default Swap Contracts
The Fund entered into credit default swap contracts to increase or decrease its credit exposure to an index and to increase or decrease its credit exposure to a specific debt security or a basket of debt securities. These instruments may be used for other purposes in future periods. Credit default swap contracts are agreements in
which one party pays fixed periodic payments to a counterparty in consideration for a guarantee from the counterparty to make a specific payment should a specified credit event(s) take place. Although specified credit events are contract specific, credit events are generally defined as bankruptcy, failure to pay, restructuring, obligation acceleration, obligation default, or repudiation/moratorium.
As the purchaser of a credit default swap contract, the Fund purchases protection by paying a periodic interest rate on the notional amount to the counterparty. The interest amount is accrued daily as a component of unrealized appreciation (depreciation) and is recorded as a realized loss upon payment. If a credit event as specified in the contract occurs, the Fund may have the option either to deliver the reference obligation to the seller in exchange for a cash payment of its par amount, or to receive a net cash settlement equal to the par amount less an agreed-upon value of the reference obligation as of the date of the credit event. The difference between the value of the obligation or cash delivered and the notional amount received will be recorded as a realized gain (loss).
As the seller of a credit default swap contract, the Fund sells protection to a buyer and will generally receive a periodic interest rate on the notional amount. The interest amount is accrued daily as a component of unrealized appreciation (depreciation) and is recorded as a realized gain upon receipt of the payment. If a credit event as specified in the contract with the counterparty occurs, the Fund may either be required to accept the reference obligation from the buyer in exchange for a cash payment of its notional amount, or to pay the buyer a net cash settlement equal to the notional amount less an agreed-upon value of the reference obligation (recovery value) as of the date of the credit event. The difference between the value of the obligation or cash received and the notional amount paid will be recorded as a realized gain (loss). The maximum potential amount of undiscounted future payments the Fund could be required to make as the seller of protection under a credit default swap contract is equal to the notional amount of the reference obligation. These potential amounts may be partially offset by any recovery values of the respective reference obligations or premiums received upon entering into the agreement. The notional amounts and market values of all credit default swap contracts in which the Fund is the seller of protection, if any, are disclosed in the Credit Default Swap Contracts Outstanding schedule following the Consolidated Portfolio of Investments.
Annual Report 2015
47
COLUMBIA DIVERSIFIED ABSOLUTE RETURN FUND
NOTES TO CONSOLIDATED FINANCIAL STATEMENTS (continued)
May 31, 2015
As a protection seller, the Fund bears the risk of loss from the credit events specified in the contract with the counterparty. For credit default swap contracts on credit indices, quoted market prices and resulting market values serve as an indicator of the current status of the payment/performance risk. Increasing market values, in absolute terms when compared to the notional amount of the swap, represent a deterioration of the reference entity's credit soundness and a greater likelihood or risk of default or other credit event occurring as defined under the terms of the contract.
Any premium paid or received by the Fund upon entering into a credit default swap contract is recorded as an asset or liability, respectively, and amortized daily as a component of realized gain (loss) in the Consolidated Statement of Operations. Credit default swap contracts are valued daily, and the change in value is recorded as unrealized appreciation (depreciation) until the termination of the swap, at which time a realized gain (loss) is recorded.
Credit default swap contracts can involve greater risks than if a fund had invested in the reference obligation directly since, in addition to general market risks, credit default swaps are subject to counterparty credit risk, leverage risk, hedging risk, correlation risk and liquidity risk. The Fund will enter into credit default swap transactions only with counterparties that meet certain standards of creditworthiness, as determined by the Investment Manager.
Interest Rate Swap Contracts
The Fund entered into interest rate swap transactions to manage interest rate market risk exposure to produce incremental earnings, to gain exposure to or protect itself from market rate changes and to synthetically add or subtract principal exposure to a market. These instruments may be used for other purposes in future periods. Interest rate swaps are agreements between two parties that involve the exchange of one type of interest rate for another type of interest rate cash flow on specified dates in the future, based on a predetermined, specified notional amount. Certain interest rate swaps are considered forward-starting, whereby the accrual for the exchange of cash flows does not begin until a specified date in the future (the effective date). The net cash flow for a standard interest rate swap transaction is generally the difference between a floating market interest rate versus a fixed interest rate.
Interest rate swaps are valued daily and unrealized appreciation (depreciation) is recorded. Certain interest rate swaps may accrue periodic interest on a daily basis
as a component of unrealized appreciation (depreciation); the Fund will realize a gain or loss upon the payment or receipt of accrued interest. The Fund will realize a gain or a loss when the interest rate swap is terminated.
Risks of entering into interest rate swaps include a lack of correlation between the swaps and the portfolio of bonds the swaps are designed to hedge or replicate. A lack of correlation may cause the interest rate swaps to experience adverse changes in value relative to expectations. In addition, interest rate swaps are subject to the risk of default of a counterparty, and the risk of adverse movements in market interest rates relative to the interest rate swap positions taken. The Fund's maximum risk of loss from counterparty credit risk is the discounted net value of the cash flows to be received from/paid to the counterparty over the contract's remaining life to the extent that such amount is positive, plus the cost of entering into a similar transaction with another counterparty.
The Fund attempts to mitigate counterparty credit risk by entering into interest rate swap transactions only with counterparties that meet prescribed levels of creditworthiness, as determined by the Investment Manager. The Fund and any counterparty are required to maintain an agreement that requires the Fund and that counterparty to monitor (on a daily basis) the net market value of all derivative transactions entered into pursuant to the agreement between the Fund and such counterparty. If the net market value of such derivatives transactions between the Fund and that counterparty exceeds a certain threshold (as defined in the agreement), the Fund or the counterparty is required to post cash and/or securities as collateral. Market values of derivatives transactions presented in the financial statements are not netted with the market values of other derivatives transactions or with any collateral amounts posted by the Fund or any counterparty.
Total Return Swap Contracts
The Fund entered into total return swap contracts to manage long or short exposure to the total return on a specified reference security in return for periodic payments based on a fixed or variable interest rate, to manage long or short exposure to the total return on a basket of reference securities in return for periodic payments based on a fixed or variable interest rate, to manage long or short exposure to the total return on a reference security index in return for periodic payments based on a fixed or variable interest rate and to manage long or short exposure to a commodities index. These
Annual Report 2015
48
COLUMBIA DIVERSIFIED ABSOLUTE RETURN FUND
NOTES TO CONSOLIDATED FINANCIAL STATEMENTS (continued)
May 31, 2015
instruments may be used for other purposes in future periods. Total return swap contracts may be used to obtain exposure to an underlying reference security, instrument, or other asset or index or market without owning, taking physical custody of, or short selling any such security, instrument or asset in a market.
Total return swap contracts are valued daily, and the change in value is recorded as unrealized appreciation (depreciation) until the termination of the swap, at which time the Fund will realize a gain (loss). Periodic payments received (or made) by the Fund over the term of the contract are recorded as realized gains (losses).
Total return swap contracts may be subject to liquidity risk, which exists when a particular swap contract is difficult to purchase or sell. It may not be possible for the Fund to initiate a transaction or liquidate a position at an advantageous time or price, which may result in significant losses. Total return swap contracts are subject to the risk associated with the investment in the underlying reference security, instrument or asset. The risk in the case of short total return swap contracts is unlimited based on the potential for unlimited increases in the market value of the underlying reference security, instrument or asset. This risk may be offset if the Fund holds any of the underlying reference security, instrument or asset. The risk in the case of long total return swap contracts is limited to the current notional amount of the total return swap contract.
Total return swap contracts are also subject to the risk of the counterparty not fulfilling its obligations under the contract (counterparty credit risk). The Fund attempts to mitigate counterparty credit risk by entering into total return swap contracts only with counterparties that meet prescribed levels of creditworthiness, as determined by the Investment Manager.
Effects of Derivative Transactions in the Financial Statements
The following tables are intended to provide additional information about the effect of derivatives on the financial statements of the Fund, including: the fair value of derivatives by risk category and the location of those fair values in the Consolidated Statement of Assets and Liabilities; and the impact of derivative transactions over the period in the Consolidated Statement of Operations, including realized and unrealized gains (losses). The derivative instrument schedules following the Consolidated Portfolio of Investments present additional information regarding derivative instruments outstanding at the end of the period, if any.
The following table provides a summary of the fair value of derivative instruments (not considered to be hedging instruments for accounting disclosure purposes) at May 31,2015:
Asset Derivatives | |
Risk Exposure
Category | | Consolidated
Statement of Assets and
Liabilities Location | | Fair Value ($) | |
Credit risk
| | Net assets — unrealized
appreciation on swap
contracts | | | 48,876
| * | |
Equity risk
| | Net assets — unrealized
appreciation on futures
contracts | | | 290,767
| * | |
Equity risk
| | Net assets — unrealized
appreciation on swap
contracts | | | 540,039
| * | |
Foreign exchange
risk
| | Unrealized appreciation on
forward foreign currency
exchange contracts | | | 1,939,721
| | |
Interest rate risk
| | Net assets — unrealized
appreciation on futures
contracts | | | 88,065
| * | |
Interest rate risk
| | Net assets — unrealized
appreciation on swap
contracts | | | 9,583
| * | |
Interest rate risk
| | Premiums paid on
outstanding swap
contracts | | | 3
| | |
Total | | | | | 2,917,054 | | |
Liability Derivatives | |
Risk Exposure
Category | | Consolidated
Statement of Assets and
Liabilities Location | | Fair Value ($) | |
Credit risk
| | Net assets — unrealized
depreciation on swap
contracts | | | 1,063
| * | |
Credit risk
| | Premiums received on
outstanding swap
contracts | | | 142,581
| | |
Equity risk
| | Net assets — unrealized
depreciation on futures
contracts | | | 83,655
| * | |
Foreign exchange
risk
| | Unrealized depreciation on
forward foreign currency
exchange contracts | | | 2,060,896
| | |
Interest rate risk
| | Net assets — unrealized
depreciation on futures
contracts | | | 145,662
| * | |
Interest rate risk
| | Net assets — unrealized
depreciation on swap
contracts | | | 11,315
| * | |
Total | | | | | 2,445,172 | | |
*Includes cumulative appreciation (depreciation) as reported in the tables following the Consolidated Portfolio of Investments. Only the current day's variation margin is reported in receivables or payables in the Consolidated Statement of Assets and Liabilities.
Annual Report 2015
49
COLUMBIA DIVERSIFIED ABSOLUTE RETURN FUND
NOTES TO CONSOLIDATED FINANCIAL STATEMENTS (continued)
May 31, 2015
The following table indicates the effect of derivative instruments (not considered to be hedging instruments for accounting disclosure purposes) in the Consolidated Statement of Operations for the period ended May 31, 2015:
Amount of Realized Gain (Loss) on Derivatives Recognized in Income | |
Risk Exposure Category | | Forward Foreign
Currency Exchange
Contracts ($) | | Futures
Contracts ($) | | Swap
Contracts ($) | | Total ($) | |
Credit risk | | | — | | | | — | | | | 2,044 | | | | 2,044 | | |
Equity risk | | | — | | | | 339,211 | | | | (767,576 | ) | | | (428,365 | ) | |
Foreign exchange risk | | | 933,750 | | | | — | | | | — | | | | 933,750 | | |
Interest rate risk | | | — | | | | (61,839 | ) | | | (3,757 | ) | | | (65,596 | ) | |
Total | | | 933,750 | | | | 277,372 | | | | (769,289 | ) | | | 441,833 | | |
Change in Unrealized Appreciation (Depreciation) on Derivatives Recognized in Income | |
Risk Exposure Category | | Forward Foreign
Currency Exchange
Contracts ($) | | Futures
Contracts ($) | | Swap
Contracts ($) | | Total ($) | |
Credit risk | | | — | | | | — | | | | 47,813 | | | | 47,813 | | |
Equity risk | | | — | | | | 207,112 | | | | 540,039 | | | | 747,151 | | |
Foreign exchange risk | | | (121,175 | ) | | | — | | | | — | | | | (121,175 | ) | |
Interest rate risk | | | — | | | | (57,597 | ) | | | (1,732 | ) | | | (59,329 | ) | |
Total | | | (121,175 | ) | | | 149,515 | | | | 586,120 | | | | 614,460 | | |
The following table provides a summary of the average outstanding volume by derivative instrument for the period ended May 31, 2015:
Derivative Instrument | | Average notional
amounts ($)* | |
Futures contracts — Long | | | 52,459,614 | | |
Futures contracts — Short | | | 58,097,398 | | |
Credit default swap contracts — buy protection | | | 1,475,000 | | |
Credit default swap contracts — sell protection | | | 4,541,750 | | |
Derivative Instrument | | Average unrealized
appreciation ($)* | | Average unrealized
depreciation ($)* | |
Forward foreign currency
exchange contracts | | | 1,113,128 | | | | (1,092,860 | ) | |
Interest rate swap contracts | | | 3,673 | | | | (8,823 | ) | |
Total return swap contracts | | | 153,345 | | | | (239,268 | ) | |
*Based on the monthly outstanding amounts for the period ended May 31, 2015.
Asset- and Mortgage-Backed Securities
The Fund may invest in asset-backed and mortgage-backed securities. The maturity dates shown represent the original maturity of the underlying obligation. Actual maturity may vary based upon prepayment activity on these obligations. All, or a portion, of the obligation may be prepaid at any time because the underlying asset may be prepaid. As a result, decreasing market interest rates could result in an increased level of prepayment. An increased prepayment rate will have the effect of
shortening the maturity of the security. Unless otherwise noted, the coupon rates presented are fixed rates.
Treasury Inflation Protected Securities
The Fund may invest in treasury inflation protected securities (TIPS). The principal amount of TIPS is adjusted periodically and is increased for inflation or decreased for deflation based on a monthly published index. These adjustments are recorded as interest income in the Consolidated Statement of Operations. Coupon payments are based on the adjusted principal at the time the interest is paid.
Interest Only and Principal Only Securities
The Fund may invest in Interest Only (IO) or Principal Only (PO) securities. IOs are stripped securities entitled to receive all of the security's interest, but none of its principal. IOs are particularly sensitive to changes in interest rates and therefore subject to greater fluctuations in price than typical interest bearing debt securities. IOs are also subject to credit risk because the Fund may not receive all or part of the interest payments if the issuer, obligor, guarantor or counterparty defaults on its obligation. Payments received for IOs are included in interest income on the Consolidated Statement of Operations. Because no principal will be received at the maturity of an IO, adjustments are made to the cost of the security on a monthly basis until maturity. POs are stripped securities entitled to receive the principal from the underlying obligation, but not the interest. POs are
Annual Report 2015
50
COLUMBIA DIVERSIFIED ABSOLUTE RETURN FUND
NOTES TO CONSOLIDATED FINANCIAL STATEMENTS (continued)
May 31, 2015
particularly sensitive to changes in interest rates and therefore are subject to fluctuations in price. POs are also subject to credit risk because the Fund may not receive all or part of its principal if the issuer, obligor, guarantor or counterparty defaults on its obligation. The Fund may also invest in IO or PO stripped mortgage-backed securities. Payments received for POs are treated as reductions to the cost and par value of the securities.
Short Sales
The Fund may sell a security it does not own in anticipation of a decline in the fair value of the security. When the Fund sells a security short, it must borrow the security sold short and deliver it to the broker-dealer through which it made the short sale. The Fund is required to maintain a margin account with the broker and to pledge assets to the broker as collateral for the borrowed security. Securities pledged as collateral are designated in the Consolidated Portfolio of Investments. In addition, cash collateral is recorded as cash collateral held at broker in the Consolidated Statement of Assets and Liabilities. The Fund can purchase the same security at the current market price and deliver it to the broker to
close out the short sale. The Fund is obligated to pay the broker a fee for borrowing the security. The fee is included in "Dividends and interest on securities sold short" in the Consolidated Statement of Operations and a short position is reported as a liability at fair value in the Consolidated Statement of Assets and Liabilities. The Fund must also pay the broker for any dividends accrued (recognized on ex-date) on the borrowed security. This amount is recorded as an expense in the Consolidated Statement of Operations. The Fund will record a gain if the security declines in value, and will realize a loss if the security appreciates. Such gain, limited to the price at which the Fund sold the security short, or such loss, potentially unlimited in size because the short position loses value as the market price of the security sold short increases, will be recognized upon the termination of a short sale.
Offsetting of Assets and Liabilities
The following tables present the Fund's gross and net amount of assets and liabilities available for offset under netting arrangements as well as any related collateral received or pledged by the Fund as of May 31, 2015:
| | Barclays ($) | | Deutsche
Bank
Securities
Inc. ($) | | Goldman
Sachs &
Co. ($) | | HSBC
Securities
(USA),
Inc. ($) | | J.P. Morgan
Securities,
Inc. ($) | | Morgan
Stanley ($) | | State Street
Bank &
Trust
Company ($) | | UBS
Securities
LLC ($) | | Total ($) | |
Assets | |
Centrally
cleared credit
default swap
contracts(a) | | | — | | | | — | | | | — | | | | — | | | | — | | | | 7,787 | | | | — | | | | — | | | | 7,787 | | |
Forward foreign
currency
exchange
contracts | | | 127,976 | | | | 626,233 | | | | — | | | | 284,178 | | | | — | | | | — | | | | 125,440 | | | | 775,894 | | | | 1,939,721 | | |
OTC interest
rate swap
contracts(b) | | | 9,583 | | | | — | | | | — | | | | — | | | | — | | | | — | | | | — | | | | — | | | | 9,583 | | |
OTC total
return swap
contracts(b) | | | — | | | | — | | | | 540,039 | | | | — | | | | — | | | | — | | | | — | | | | — | | | | 540,039 | | |
Total Assets | | | 137,559 | | | | 626,233 | | | | 540,039 | | | | 284,178 | | | | — | | | | 7,787 | | | | 125,440 | | | | 775,894 | | | | 2,497,130 | | |
Annual Report 2015
51
COLUMBIA DIVERSIFIED ABSOLUTE RETURN FUND
NOTES TO CONSOLIDATED FINANCIAL STATEMENTS (continued)
May 31, 2015
| | Barclays ($) | | Deutsche
Bank
Securities
Inc. ($) | | Goldman
Sachs &
Co. ($) | | HSBC
Securities
(USA),
Inc. ($) | | J.P. Morgan
Securities,
Inc. ($) | | Morgan
Stanley ($) | | State Street
Bank &
Trust
Company ($) | | UBS
Securities
LLC ($) | | Total ($) | |
Liabilities | |
Centrally
cleared credit
default swap
contracts(a) | | | — | | | | — | | | | — | | | | — | | | | — | | | | 200 | | | | — | | | | — | | | | 200 | | |
Forward foreign
currency
exchange
contracts | | | 98,437 | | | | 975,775 | | | | — | | | | 206,247 | | | | — | | | | — | | | | 222,762 | | | | 557,675 | | | | 2,060,896 | | |
OTC credit
default swap
contracts(b) | | | 127,224 | | | | — | | | | — | | | | — | | | | — | | | | — | | | | — | | | | — | | | | 127,224 | | |
OTC interest
rate swap
contracts(b) | | | 11,312 | | | | — | | | | — | | | | — | | | | — | | | | — | | | | — | | | | — | | | | 11,312 | | |
Securities
borrowed | | | — | | | | — | | | | — | | | | — | | | | 16,804,797 | | | | — | | | | — | | | | — | | | | 16,804,797 | | |
Total Liabilities | | | 236,973 | | | | 975,775 | | | | — | | | | 206,247 | | | | 16,804,797 | | | | 200 | | | | 222,762 | | | | 557,675 | | | | 19,004,429 | | |
Total Financial
and Derivative
Net Assets | | | (99,414 | ) | | | (349,542 | ) | | | 540,039 | | | | 77,931 | | | | (16,804,797 | ) | | | 7,587 | | | | (97,322 | ) | | | 218,219 | | | | (16,507,299 | ) | |
Total collateral
received
(pledged)(c) | | | — | | | | — | | | | 540,039 | | | | — | | | | (16,804,797 | ) | | | — | | | | — | | | | — | | | | (16,264,758 | ) | |
Net Amount(d) | | | (99,414 | ) | | | (349,542 | ) | | | — | | | | 77,931 | | | | — | | | | 7,587 | | | | (97,322 | ) | | | 218,219 | | | | (242,541 | ) | |
(a) Centrally cleared swaps are included within payable/receivable for variation margin on the Consolidated Statement of Assets and Liabilities.
(b) Over-the-Counter Swap Contracts are presented at market value plus periodic payments receivable (payable), which is comprised of unrealized appreciation, unrealized depreciation, premiums paid and premiums received.
(c) In some instances, the actual collateral received and/or pledged may be more than the amount shown due to overcollateralization.
(d) Represents the net amount due from/ (to) counterparties in the event of default.
Security Transactions
Security transactions are accounted for on the trade date. Cost is determined and gains (losses) are based upon the specific identification method for both financial statement and federal income tax purposes.
Income Recognition
Corporate actions and dividend income are generally recorded net of any non-reclaimable tax withholdings, on the ex-dividend date or upon receipt of ex-dividend notification in the case of certain foreign securities.
Interest income is recorded on an accrual basis. Market premiums and discounts, including original issue discounts, are amortized and accreted, respectively, over the expected life of the security on all debt securities, unless otherwise noted. The Fund classifies gains and
losses realized on prepayments received on mortgage-backed securities as adjustments to interest income.
The Fund may place a debt security on non-accrual status and reduce related interest income when it becomes probable that the interest will not be collected and the amount of uncollectible interest can be reasonably estimated. A defaulted debt security is removed from non-accrual status when the issuer resumes interest payments or when collectibility of interest is reasonably assured.
The Fund may receive distributions from holdings in equity securities, business development companies (BDCs), exchange-traded funds (ETFs), other regulated investment companies (RICs), and real estate investment trusts (REITs), which report information on the tax character of their distributions annually. These
Annual Report 2015
52
COLUMBIA DIVERSIFIED ABSOLUTE RETURN FUND
NOTES TO CONSOLIDATED FINANCIAL STATEMENTS (continued)
May 31, 2015
distributions are allocated to dividend income, capital gain and return of capital based on actual information reported. Return of capital is recorded as a reduction of the cost basis of securities held. If the Fund no longer owns the applicable securities, return of capital is recorded as a realized gain. With respect to REITs, to the extent actual information has not yet been reported, estimates for return of capital are made by the Fund's management. Management's estimates are subsequently adjusted when the actual character of the distributions is disclosed by the REITs, which could result in a proportionate change in return of capital to shareholders.
Awards from class action litigation are recorded as a reduction of cost basis if the Fund still owns the applicable securities on the payment date. If the Fund no longer owns the applicable securities, the proceeds are recorded as realized gains.
Expenses
General expenses of the Trust are allocated to the Fund and other funds of the Trust based upon relative net assets or other expense allocation methodologies determined by the nature of the expense. Expenses directly attributable to the Fund are charged to the Fund. Expenses directly attributable to a specific class of shares are charged to that share class.
Determination of Class Net Asset Value
All income, expenses (other than class-specific expenses, which are charged to that share class, as shown in the Consolidated Statement of Operations) and realized and unrealized gains (losses) are allocated to each class of the Fund on a daily basis, based on the relative net assets of each class, for purposes of determining the net asset value of each class.
Federal Income Tax Status
The Fund intends to qualify each year as a regulated investment company under Subchapter M of the Internal Revenue Code, as amended, and will distribute substantially all of its taxable income (including net short-term capital gains), if any, for its tax year, and as such will not be subject to federal income taxes. In addition, the Fund intends to distribute in each calendar year substantially all of its net investment income, capital gains and certain other amounts, if any, such that the Fund should not be subject to federal excise tax. Therefore, no federal income or excise tax provision is recorded.
Foreign Taxes
The Fund may be subject to foreign taxes on income, gains on investments or currency repatriation, a portion of which may be recoverable. The Fund will accrue such taxes and recoveries, as applicable, based upon its current interpretation of tax rules and regulations that exist in the markets in which it invests.
Realized gains in certain countries may be subject to foreign taxes at the Fund level, based on statutory rates. The Fund accrues for such foreign taxes on realized and unrealized gains at the appropriate rate for each jurisdiction, as applicable. The amount, if any, is disclosed as a liability on the Consolidated Statement of Assets and Liabilities.
Distributions to Shareholders
Distributions from net investment income, if any, are declared and paid annually. Net realized capital gains, if any, are distributed along with the income distribution. Income distributions and capital gain distributions are determined in accordance with federal income tax regulations, which may differ from GAAP.
Guarantees and Indemnifications
Under the Trust's organizational documents and, in some cases, by contract, its officers and trustees are indemnified against certain liabilities arising out of the performance of their duties to the Trust or its funds. In addition, certain of the Fund's contracts with its service providers contain general indemnification clauses. The Fund's maximum exposure under these arrangements is unknown since the amount of any future claims that may be made against the Fund cannot be determined, and the Fund has no historical basis for predicting the likelihood of any such claims.
Recent Accounting Pronouncement
Transfers and Servicing (Topic 860), Repurchase-to-Maturity Transactions, Repurchase Financings, and Disclosures
In June 2014, the Financial Accounting Standards Board (FASB) issued Accounting Standards Update (ASU) No. 2014-11, Transfers and Servicing (Topic 860), Repurchase-to-Maturity Transactions, Repurchase Financings, and Disclosures. ASU No. 2014-11 changes the disclosure requirements for certain reverse repurchase agreements and similar transactions accounted for as secured borrowings. The disclosure requirements are effective for annual periods beginning after December 15, 2014, and for interim periods beginning after March 15, 2015. At this time,
Annual Report 2015
53
COLUMBIA DIVERSIFIED ABSOLUTE RETURN FUND
NOTES TO CONSOLIDATED FINANCIAL STATEMENTS (continued)
May 31, 2015
management is evaluating the implications of this guidance and the impact it will have on the financial statement amounts and footnote disclosures, if any.
Note 3. Fees and Compensation Paid to Affiliates
Investment Management Fees
Under an Investment Management Services Agreement, Columbia Management Investment Advisers, LLC (the Investment Manager), a wholly-owned subsidiary of Ameriprise Financial, determines which securities will be purchased, held or sold. The investment management fee is an annual fee that is equal to a percentage of the Fund's average daily net assets that declines from 1.10% to 0.98% as the Fund's net assets increase. The annualized effective investment management fee rate for the period ended May 31, 2015 was 1.10% of the Fund's average daily net assets.
Subadvisory Agreement
The Fund's Board has approved a subadvisory agreement between the Investment Manager and Threadneedle International Limited (Threadneedle), an affiliate of the Investment Manager and wholly-owned subsidiary of Ameriprise Financial. As of May 31, 2015, Threadneedle is not providing services to the Fund pursuant to the subadvisory agreement.
Administration Fees
Under an Administrative Services Agreement, the Investment Manager also serves as the Fund Administrator. The Fund pays the Fund Administrator an annual fee for administration and accounting services equal to a percentage of the Fund's average daily net assets that declines from 0.08% to 0.05% as the Fund's net assets increase. The annualized effective administration fee rate for the period ended May 31, 2015 was 0.08% of the Fund's average daily net assets.
Offering Costs
Offering costs were incurred prior to the shares of the Fund being offered. Offering costs include, among other things, state registration filing fees and printing costs. The Fund amortizes offering costs over a period of 12 months from the commencement of operations.
Compensation of Board Members
Board members are compensated for their services to the Fund as disclosed in the Consolidated Statement of Operations. The Trust's independent Trustees may participate in a Deferred Compensation Plan (the Plan)
which may be terminated at any time. Obligations of the Plan will be paid solely out of the Fund's assets.
Compensation of Chief Compliance Officer
The Board has appointed a Chief Compliance Officer to the Fund in accordance with federal securities regulations. The Fund is allocated a portion of the expenses associated with the Chief Compliance Officer based on relative net assets of the Trust.
Transfer Agency Fees
Under a Transfer and Dividend Disbursing Agent Agreement, Columbia Management Investment Services Corp. (the Transfer Agent), an affiliate of the Investment Manager and a wholly-owned subsidiary of Ameriprise Financial, is responsible for providing transfer agency services to the Fund. The Transfer Agent has contracted with Boston Financial Data Services (BFDS) to serve as sub-transfer agent.
The Transfer Agent receives a monthly transfer agency fee based on the number or the average value of accounts, depending on the type of account. In addition, the Transfer Agent also receives sub-transfer agency fees based on a percentage of the average aggregate value of the Fund's shares maintained in omnibus accounts (other than omnibus accounts for which American Enterprise Investment Services Inc. is the broker of record or accounts where the beneficial shareholder is a customer of Ameriprise Financial Services, Inc., for which the Transfer Agent receives a per account fee). The Transfer Agent pays the fees of BFDS for services as sub-transfer agent and is not entitled to reimbursement for such fees from the Fund (with the exception of out-of-pocket fees).
The Transfer Agent also receives compensation from the Fund for various shareholder services and reimbursements for certain out-of-pocket fees. Class I shares do not pay transfer agency fees. Total transfer agency fees for Class R5 shares are subject to an annual limitation of not more than 0.05% of the average daily net assets attributable to Class R5 shares.
For the period ended May 31, 2015, the Fund's annualized effective transfer agency fee rates as a percentage of average daily net assets of each class were as follows:
Class A | | | 0.05 | % | |
Class C | | | 0.06 | | |
Class R4 | | | 0.05 | | |
Class R5 | | | 0.05 | | |
Class W | | | 0.05 | | |
Class Z | | | 0.04 | | |
Annual Report 2015
54
COLUMBIA DIVERSIFIED ABSOLUTE RETURN FUND
NOTES TO CONSOLIDATED FINANCIAL STATEMENTS (continued)
May 31, 2015
An annual minimum account balance fee of $20 may apply to certain accounts with a value below the applicable share class's initial minimum investment requirements to reduce the impact of small accounts on transfer agency fees. These minimum account balance fees are remitted to the Fund and recorded as part of expense reductions in the Consolidated Statement of Operations. For the period ended May 31, 2015, no minimum account balance fees were charged by the Fund.
Distribution and Service Fees
The Fund has an agreement with Columbia Management Investment Distributors, Inc. (the Distributor), an affiliate of the Investment Manager and a wholly-owned subsidiary of Ameriprise Financial, for distribution and shareholder services. The Board has approved, and the Fund has adopted, distribution and shareholder service plans (the Plans) applicable to certain share classes, which set the distribution and service fees for the Fund. These fees are calculated daily and are intended to compensate the Distributor and/or eligible selling and/or servicing agents for selling shares of the Fund and providing services to investors.
Under the Plans, the Fund pays a monthly service fee to the Distributor at the maximum annual rate of 0.25% of the average daily net assets attributable to Class A, Class C and Class W shares of the Fund. Also under the Plans, the Fund pays a monthly distribution fee to the Distributor at the maximum annual rates of 0.75% and 0.25% of the average daily net assets attributable to Class C and Class W shares, respectively.
Although the Fund may pay a distribution fee up to 0.25% of the Fund's average daily net assets attributable to Class W shares and a service fee of up to 0.25% of the Fund's average daily net assets attributable to Class W shares, the aggregate fee shall not exceed 0.25% of the Fund's average daily net assets attributable to Class W shares.
Sales Charges
Sales charges, including front-end charges and CDSCs, received by the Distributor for distributing Fund shares were $0 for Class A and $0 for Class C shares for the period ended May 31, 2015.
Expenses Waived/Reimbursed by the Investment Manager and its Affiliates
The Investment Manager and certain of its affiliates have contractually agreed to waive fees and/or reimburse expenses (excluding certain fees and expenses described below) for the period disclosed below, unless
sooner terminated at the sole discretion of the Board, so that the Fund's net operating expenses, including indirect expenses of the Underlying Funds, after giving effect to fees waived/expenses reimbursed and any balance credits and/or overdraft charges from the Fund's custodian, do not exceed the following annual rates as a percentage of the class' average daily net assets:
| | | Fee Rates Contractual
through
September 30, 2016 | |
Class A | | | 1.71 | % | |
Class C | | | 2.46 | | |
Class I | | | 1.31 | | |
Class R4 | | | 1.46 | | |
Class R5 | | | 1.36 | | |
Class W | | | 1.71 | | |
Class Z | | | 1.46 | | |
Under the agreement governing these fee waivers and/or expense reimbursement arrangements, the following fees and expenses are excluded from the waiver/reimbursement commitment, and therefore will be paid by the Fund, if applicable: taxes (including foreign transaction taxes), transaction costs and brokerage commissions, costs related to any securities lending program, dividend and interest expenses associated with securities sold short, inverse floater program fees and expenses, transaction charges and interest on borrowed money, interest, extraordinary expenses and any other expenses the exclusion of which is specifically approved by the Board. This agreement may be modified or amended only with approval from all parties. Any fees waived and/or expenses reimbursed under the expense reimbursement arrangements described above are not recoverable by the Investment Manager or its affiliates in future periods.
Note 4. Federal Tax Information
The timing and character of income and capital gain distributions are determined in accordance with income tax regulations, which may differ from GAAP because of temporary or permanent book to tax differences.
At May 31, 2015, these differences are primarily due to differing treatment for principal and/or interest from fixed income securities, deferral/reversal of wash sale losses, Trustees' deferred compensation, foreign currency transactions, non-deductible expenses, derivative investments, tax straddles, investments in commodity subsidiaries, swap investments, swap reclassifications, and constructive sales of appreciated financial positions. To the extent these differences are permanent,
Annual Report 2015
55
COLUMBIA DIVERSIFIED ABSOLUTE RETURN FUND
NOTES TO CONSOLIDATED FINANCIAL STATEMENTS (continued)
May 31, 2015
reclassifications are made among the components of the Fund's net assets in the Consolidated Statement of Assets and Liabilities. Temporary differences do not require reclassifications. In the Consolidated Statement of Assets and Liabilities the following reclassifications were made:
Undistributed net investment income | | $ | 254,285 | | |
Accumulated net realized loss | | | (796,214 | ) | |
Paid-in capital | | | 541,929 | | |
Net investment income (loss) and net realized gains (losses), as disclosed in the Consolidated Statement of Operations, and net assets were not affected by this reclassification.
For the period ended May 31, 2015, there were no distributions.
At May 31, 2015, the components of distributable earnings on a tax basis were as follows:
Undistributed ordinary income | | $ | 1,298,608 | | |
Undistributed long-term capital gains | | | 160,589 | | |
Net unrealized depreciation | | | (146,187 | ) | |
At May 31, 2015, the cost of investments for federal income tax purposes was $111,827,395 and the aggregate gross unrealized appreciation and depreciation based on that cost was:
Unrealized appreciation | | $ | 1,836,143 | | |
Unrealized depreciation | | | (1,982,330 | ) | |
Net unrealized depreciation | | $ | (146,187 | ) | |
Management of the Fund has concluded that there are no significant uncertain tax positions in the Fund that would require recognition in the financial statements. However, management's conclusion may be subject to review and adjustment at a later date based on factors including, but not limited to, new tax laws, regulations, and administrative interpretations (including relevant court decisions). Generally, the Fund's federal tax returns for the prior three fiscal years remain subject to examination by the Internal Revenue Service.
Note 5. Portfolio Information
The cost of purchases and proceeds from sales of securities, excluding short-term investments and derivatives, if any, aggregated to $75,321,929 and $40,040,466, respectively, for the period ended May 31, 2015, of which $6,783,705 in purchases were U.S. government securities. The amount of purchase and sale activity impacts the portfolio turnover rate reported in the Consolidated Financial Highlights.
Note 6. Affiliated Money Market Fund
The Fund invests in Columbia Short-Term Cash Fund, an affiliated money market fund established for the exclusive use by the Fund and other affiliated funds. The income earned by the Fund from such investments is included as Dividends — affiliated issuers in the Consolidated Statement of Operations. As an investing fund, the Fund indirectly bears its proportionate share of the expenses of Columbia Short-Term Cash Fund.
Note 7. Shareholder Concentration
At May 31, 2015, affiliated shareholders of record owned 99.3% of the outstanding shares of the Fund in one or more accounts. Subscription and redemption activity by concentrated accounts may have a significant effect on the operations of the Fund.
Note 8. Line of Credit
The Fund has entered into a revolving credit facility with a syndicate of banks led by JPMorgan Chase Bank, N.A. whereby the Fund may borrow for the temporary funding of shareholder redemptions or for other temporary or emergency purposes. The credit facility agreement, which is a collective agreement between the Fund and certain other funds managed by the Investment Manager, severally and not jointly, permits collective borrowings up to $550 million. Interest is charged to each participating fund based on its borrowings at a rate equal to the higher of (i) the overnight federal funds rate plus 1.00% or (ii) the one-month LIBOR rate plus 1.00%. Each borrowing under the credit facility matures no later than 60 days after the date of borrowing. The Fund also pays a commitment fee equal to its pro rata share of the amount of the credit facility at a rate of 0.075% per annum. The commitment fee is included in other expenses in the Consolidated Statement of Operations.
The Fund had no borrowings during the period ended May 31, 2015.
Note 9. Significant Risks
Derivatives Risk
Losses involving derivative instruments may be substantial, because a relatively small price movement in the underlying security(ies) commodity, currency or index or other instrument or asset may result in a substantial loss for the Fund. In addition to the potential for increased losses, the use of derivative instruments may lead to increased volatility within the Fund. Derivatives will typically increase the Fund's exposure to principal risks to which it is otherwise exposed, and may expose
Annual Report 2015
56
COLUMBIA DIVERSIFIED ABSOLUTE RETURN FUND
NOTES TO CONSOLIDATED FINANCIAL STATEMENTS (continued)
May 31, 2015
the Fund to additional risks, including correlation risk, counterparty risk, hedging risk, leverage risk and liquidity risk.
Short Selling Risk
Leverage occurs when the Fund increases its assets available for investment using borrowings, short sales, derivatives, or similar instruments or techniques. Because short sales involve borrowing securities and then selling them, the Fund's short sales effectively leverage the Fund's assets. The Fund's assets that are used as collateral to secure the Fund's obligations to return the securities sold short may decrease in value while the short positions are outstanding, which may force the Fund to use its other assets to increase the collateral. Leverage can create an interest expense that may lower the Fund's overall returns. Leverage presents the opportunity for increased net income and capital gains, but may also exaggerate the Fund's volatility and risk of loss. There can be no guarantee that a leveraging strategy will be successful.
Note 10. Subsequent Events
Management has evaluated the events and transactions that have occurred through the date the financial statements were issued and noted no items requiring adjustment of the financial statements or additional disclosure.
Note 11. Information Regarding Pending and Settled Legal Proceedings
In December 2005, without admitting or denying the allegations, American Express Financial Corporation (AEFC, which is now known as Ameriprise Financial, Inc. (Ameriprise Financial)) entered into settlement agreements with the Securities and Exchange Commission (SEC) and Minnesota Department of Commerce (MDOC) related to market timing activities. As a result, AEFC was censured and ordered to cease and desist from committing or causing any violations of certain provisions of the Investment Advisers Act of 1940, the Investment Company Act of 1940, and various Minnesota laws. AEFC agreed to pay disgorgement of $10 million and civil money penalties of $7 million. AEFC also agreed to retain an independent distribution consultant to assist in developing a plan for distribution of all disgorgement and civil penalties ordered by the SEC in accordance with various undertakings detailed at www.sec.gov/litigation/admin/ia-2451.pdf. Ameriprise Financial and its affiliates have cooperated with the SEC
and the MDOC in these legal proceedings, and have made regular reports to the Funds' Boards of Trustees.
Ameriprise Financial and certain of its affiliates have historically been involved in a number of legal, arbitration and regulatory proceedings, including routine litigation, class actions, and governmental actions, concerning matters arising in connection with the conduct of their business activities. Ameriprise Financial believes that the Funds are not currently the subject of, and that neither Ameriprise Financial nor any of its affiliates are the subject of, any pending legal, arbitration or regulatory proceedings that are likely to have a material adverse effect on the Funds or the ability of Ameriprise Financial or its affiliates to perform under their contracts with the Funds. Ameriprise Financial is required to make quarterly (10-Q), annual (10-K) and, as necessary, 8-K filings with the SEC on legal and regulatory matters that relate to Ameriprise Financial and its affiliates. Copies of these filings may be obtained by accessing the SEC website at www.sec.gov.
There can be no assurance that these matters, or the adverse publicity associated with them, will not result in increased fund redemptions, reduced sale of fund shares or other adverse consequences to the Funds. Further, although we believe proceedings are not likely to have a material adverse effect on the Funds or the ability of Ameriprise Financial or its affiliates to perform under their contracts with the Funds, these proceedings are subject to uncertainties and, as such, we are unable to estimate the possible loss or range of loss that may result. An adverse outcome in one or more of these proceedings could result in adverse judgments, settlements, fines, penalties or other relief that could have a material adverse effect on the consolidated financial condition or results of operations of Ameriprise Financial.
Annual Report 2015
57
COLUMBIA DIVERSIFIED ABSOLUTE RETURN FUND
REPORT OF INDEPENDENT REGISTERED PUBLIC ACCOUNTING FIRM
To the Trustees of Columbia Funds Series Trust I and the Shareholders of
Columbia Diversified Absolute Return Fund
In our opinion, the accompanying consolidated statement of assets and liabilities, including the consolidated portfolio of investments, and the related consolidated statements of operations and of changes in net assets and the consolidated financial highlights present fairly, in all material respects, the financial position of Columbia Diversified Absolute Return Fund (the "Fund," a series of Columbia Funds Series Trust I) at May 31, 2015, and the results of its operations, the changes in its net assets and the financial highlights for the period February 19, 2015 (commencement of operations) through May 31, 2015, in conformity with accounting principles generally accepted in the United States of America. These financial statements and financial highlights (hereafter referred to as "financial statements") are the responsibility of the Fund's management. Our responsibility is to express an opinion on these financial statements based on our audit. We conducted our audit of these financial statements in accordance with the standards of the Public Company Accounting Oversight Board (United States). Those standards require that we plan and perform the audit to obtain reasonable assurance about whether the financial statements are free of material misstatement. An audit includes examining, on a test basis, evidence supporting the amounts and disclosures in the financial statements, assessing the accounting principles used and significant estimates made by management, and evaluating the overall financial statement presentation. We believe that our audit, which included confirmation of securities at May 31, 2015 by correspondence with the custodian, brokers and transfer agent, and the application of alternative auditing procedures where such confirmations had not been received, provides a reasonable basis for our opinion.
PricewaterhouseCoopers LLP
Minneapolis, MN
July 23, 2015
Annual Report 2015
58
COLUMBIA DIVERSIFIED ABSOLUTE RETURN FUND
FEDERAL INCOME TAX INFORMATION
(Unaudited)
The Fund hereby designates the following tax attributes for the period ended May 31, 2015. Shareholders will be notified in early 2016 of the amounts for use in preparing 2015 income tax returns.
Tax Designations:
Capital Gain Dividend | | $ | 168,618 | | |
Capital Gain Dividend. The Fund designates as a capital gain dividend the amount reflected above, or if subsequently determined to be different, the net capital gain of such fiscal period.
Annual Report 2015
59
COLUMBIA DIVERSIFIED ABSOLUTE RETURN FUND
The Trustees serve terms of indefinite duration. The names and birth years of the Trustees and Officers of the Funds in Columbia Funds Series Trust I, the year each was first elected or appointed to office, their principal business occupations during at least the last five years, the number of Funds overseen by each Trustee and other directorships they hold are shown below. Each officer listed below serves as an officer of each Fund in Columbia Funds Series Trust I. The mailing address of each Trustee is: c/o Columbia Management Investment Advisers, LLC, 225 Franklin Street, Mail Drop BX32 05228, Boston, MA 02110.
Independent Trustees
Name, Year of Birth
and Position Held
with the Trust | | Year First
Appointed or
Elected as
Trustee to any
Fund Currently
in the Columbia
Funds Complex
or a Predecessor
Thereof | | Principal Occupation(s)
during the Past Five Years | | Number
of Funds
in the
Columbia
Funds
Complex
Overseen | | Other Directorships
Held by Trustee During
the Past Five Years | |
Douglas A. Hacker
(Born 1955)
Trustee and Chairman
of the Board | | | 1996 | | | Independent business executive since May 2006; Executive Vice President — Strategy of United Airlines from December 2002 to May 2006; President of UAL Loyalty Services (airline marketing company) from September 2001 to December 2002; Executive Vice President and Chief Financial Officer of United Airlines from July 1999 to September 2001 | | | 60 | | | Spartan Nash Company, (food distributor); Nash Finch Company (food distributor) from 2005 to 2013; Aircastle Limited (aircraft leasing); SeaCube Container Leasing Ltd. (container leasing) from 2010 to 2013; and Travelport Worldwide Limited (travel information technology) | |
Janet Langford Carrig
(Born 1957)
Trustee | | | 1996 | | | Senior Vice President, General Counsel and Corporate Secretary, ConocoPhillips (integrated energy company) since September 2007; Deputy General Counsel — Corporate Legal Services, ConocoPhillips from August 2006 to August 2007; Partner, Zelle, Hofmann, Voelbel, Mason & Gette LLP (law firm) from March 2005 to July 2006; Adjunct Professor of Law, Northwestern University from September 2004 to June 2006; Director, UAL Corporation (airline) from February 2006 to July 2006; Chief Administrative Officer and Senior Vice President, Kmart Holding Corporation (consumer goods) from September 2003 to March 2004 | | | 60 | | | None | |
Nancy T. Lukitsh
(Born 1956)
Trustee | | | 2011 | | | Senior Vice President, Partner and Director of Marketing, Wellington Management Company, LLP (investment adviser) from 1997 to 2010; Chair, Wellington Management Investment Portfolios (commingled non-U.S. investment pools) from 2007 to 2010; Director, Wellington Trust Company, NA and other Wellington affiliates from 1997 to 2010 | | | 60 | | | None | |
William E. Mayer
(Born 1940)
Trustee | | | 1991 | | | Partner, Park Avenue Equity Partners (private equity) since February 1999 | | | 60 | | | DynaVox Inc. (speech creation); Lee Enterprises (print media); WR Hambrecht + Co. (financial service provider) from 2000 to 2012; BlackRock Kelso Capital Corporation (investment company); and Premier, Inc. (healthcare) | |
Annual Report 2015
60
COLUMBIA DIVERSIFIED ABSOLUTE RETURN FUND
TRUSTEES AND OFFICERS (continued)
Independent Trustees (continued)
Name, Year of Birth
and Position Held
with the Trust | | Year First
Appointed or
Elected as
Trustee to any
Fund Currently
in the Columbia
Funds Complex
or a Predecessor
Thereof | | Principal Occupation(s)
during the Past Five Years | | Number
of Funds
in the
Columbia
Funds
Complex
Overseen | | Other Directorships
Held by Trustee During
the Past Five Years | |
David M. Moffett
(Born 1952)
Trustee | | | 2011 | | | Retired. Consultant to Bridgewater and Associates; Chief Executive Officer, Federal Home Loan Mortgage Corporation, from 2008 to 2009; Senior Adviser, Global Financial Services Group, Carlyle Group, Inc., from 2007 to 2008; Vice Chairman and Chief Financial Officer, U.S. Bancorp, from 1993 to 2007 | | | 60 | | | CIT Group Inc. (commercial and consumer finance); eBay Inc. (online trading community); MBIA Inc. (financial service provider); E.W. Scripps Co. (print and television media); Building Materials Holding Corp. (building materials and construction services); Genworth Financial, Inc. (financial and insurance products and services); and University of Oklahoma Foundation | |
Charles R. Nelson
(Born 1942)
Trustee | | | 1981 | | | Retired. Professor Emeritus, University of Washington since 2011; Professor of Economics, University of Washington from 1976 to 2011; Ford and Louisa Van Voorhis Professor of Political Economy, University of Washington from 1993 to 2011; Adjunct Professor of Statistics, University of Washington from 1980 to 2011; Associate Editor, Journal of Money, Credit and Banking from September 1993 to 2008; consultant on econometric and statistical matters | | | 60 | | | None | |
John J. Neuhauser
(Born 1943)
Trustee | | | 1984 | | | President, Saint Michael's College since August 2007; Director or Trustee of several non-profit organizations, including Fletcher Allen Health Care, Inc.; Academic Vice President and Dean of Faculties, Boston College from August 1999 to October 2005; University Professor, Boston College from November 2005 to August 2007 | | | 60 | | | Liberty All-Star Equity Fund and Liberty All-Star Growth Fund (closed-end funds) | |
Patrick J. Simpson
(Born 1944)
Trustee | | | 2000 | | | Partner, Perkins Coie LLP (law firm) | | | 60 | | | None | |
Anne-Lee Verville
(Born 1945)
Trustee | | | 1998 | | | Retired. General Manager, Global Education Industry from 1994 to 1997, President — Application Systems Division from 1991 to 1994, Chief Financial Officer — US Marketing & Services from 1988 to 1991, and Chief Information Officer from 1987 to 1988, IBM Corporation (computer and technology) | | | 60 | | | Enesco Group, Inc. (producer of giftware and home and garden decor products) from 2001 to 2006 | |
Annual Report 2015
61
COLUMBIA DIVERSIFIED ABSOLUTE RETURN FUND
TRUSTEES AND OFFICERS (continued)
Interested Trustee Affiliate with Investment Manager*
Name, Year of Birth
and Position Held
with the Trust | | Year First
Appointed or
Elected as
Trustee to any
Fund Currently
in the Columbia
Funds Complex
or a Predecessor
Thereof | | Principal Occupation(s)
during the Past Five Years | | Number
of Funds
in the
Columbia
Funds
Complex
Overseen | | Other Directorships
Held by Trustee During
the Past Five Years | |
William F. Truscott
(Born 1960)
Trustee | | | 2012 | | | Chairman of the Board and President, Columbia Management Investment Advisers, LLC since May 2010 and February 2012, respectively (previously President and Chief Investment Officer, 2001-April 2010); Chief Executive Officer, Global Asset Management, Ameriprise Financial, Inc. since September 2012 (previously Chief Executive Officer, U.S. Asset Management & President, Annuities, May 2010-September 2012 and President — U.S. Asset Management and Chief Investment Officer, 2005-April 2010); Director and Chief Executive Officer, Columbia Management Investment Distributors, Inc. since May 2010 and February 2012, respectively (previously Chairman of the Board and Chief Executive Officer, 2006-April 2010); Chairman of the Board and Chief Executive Officer, RiverSource Distributors, Inc. since 2006; Director, Threadneedle Asset Management Holdings, SARL since 2014; President and Chief Executive Officer, Ameriprise Certificate Company, 2006-August 2012 | | | 187 | | | Chairman of the Board, Columbia Management Investment Advisers, LLC since May 2010; Director, Columbia Management Investment Distributors, Inc. since May 2010; Director, Ameriprise Certificate Company, 2006 to January 2013 | |
* Interested person (as defined under the 1940 Act) by reason of being an officer, director, security holder and/or employee of the Investment Manager or Ameriprise Financial.
The Statement of Additional Information has additional information about the Fund's Board members and is available, without charge, upon request by calling 800.345.6611; contacting your financial intermediary; or visiting columbiathreadneedle.com/us.
The Board has appointed officers who are responsible for day-to-day business decisions based on policies it has established. The officers serve at the pleasure of the Board. In addition to Mr. Truscott, who is Senior Vice President, the Funds' other officers are:
Fund Officers
Name,
Address and
Year of Birth | | Position and Year
First Appointed to
Position for any Fund
in the Columbia
Funds Complex or a
Predecessor Thereof | | Principal Occupation(s) During Past Five Years | |
Christopher O. Petersen
5228 Ameriprise
Financial Center
Minneapolis, MN 55474
Born 1970 | | President and Principal Executive Officer (2015) | | Vice President and Lead Chief Counsel, Ameriprise Financial, Inc. since January 2015 (previously, Vice President and Chief Counsel January 2010-December 2014; and Vice President and Group Counsel or Counsel 2004- January 2010); officer of Columbia Funds and affiliated funds since 2007. | |
Michael G. Clarke
225 Franklin Street
Boston, MA 02110
Born 1969 | | Treasurer (2011) and Chief Financial Officer (2009) | | Vice President — Mutual Fund Administration, Columbia Management Investment Advisers, LLC, since May 2010; Managing Director of Fund Administration, Columbia Management Advisors, LLC, September 2004-April 2010; senior officer of Columbia Funds and affiliated funds since 2002. | |
Annual Report 2015
62
COLUMBIA DIVERSIFIED ABSOLUTE RETURN FUND
TRUSTEES AND OFFICERS (continued)
Fund Officers (continued)
Name,
Address and
Year of Birth | | Position and Year
First Appointed to
Position for any Fund
in the Columbia
Funds Complex or a
Predecessor Thereof | | Principal Occupation(s) During Past Five Years | |
Paul B. Goucher
100 Park Avenue
New York, NY 10017
Born 1968 | | Senior Vice President (2011), Chief Legal Officer (2015) and Assistant Secretary (2008) | | Vice President and Lead Chief Counsel, Ameriprise Financial, Inc. since November 2008 and January 2013, respectively (previously Chief Counsel, January 2010-January 2013 and Group Counsel, November 2008-January 2010). | |
Thomas P. McGuire
225 Franklin Street
Boston, MA 02110
Born 1972 | | Vice President and Chief Compliance Officer (2012) | | Vice President — Asset Management Compliance, Ameriprise Financial, Inc., since May 2010; Chief Compliance Officer, Ameriprise Certificate Company since September 2010; Compliance Executive, Bank of America, 2005-April 2010. | |
Colin Moore
225 Franklin Street
Boston, MA 02110
Born 1958 | | Senior Vice President (2010) | | Executive Vice President and Global Chief Investment Officer, Ameriprise Financial, Inc., since July 2013; Director and Global Chief Investment Officer, Columbia Management Investment Advisers, LLC since May 2010; Manager, Managing Director and Chief Investment Officer, Columbia Management Advisors, LLC, 2007-April 2010. | |
Michael E. DeFao
225 Franklin Street
Boston, MA 02110
Born 1968 | | Vice President (2011) and Assistant Secretary (2010) | | Vice President and Chief Counsel, Ameriprise Financial, Inc. since May 2010; Associate General Counsel, Bank of America, 2005-April 2010. | |
Joseph F. DiMaria
225 Franklin Street
Boston, MA 02110
Born 1968 | | Vice President (2011), Assistant Treasurer (2012) and Chief Accounting Officer (2008) | | Vice President — Mutual Fund Treasurer, Columbia Management Investment Advisers, LLC since May 2010; Director of Fund Administration, Columbia Management Advisors, LLC, 2006-April 2010. | |
Amy Johnson
5228 Ameriprise
Financial Center
Minneapolis, MN 55474
Born 1965 | | Vice President (2006) | | Managing Director and Chief Operating Officer, Columbia Management Investment Advisers, LLC since May 2010 (previously Chief Administrative Officer, 2009-April 2010, and Vice President — Asset Management and Trust Company Services, 2006-2009). | |
Lyn Kephart-Strong
5228 Ameriprise
Financial Center
Minneapolis, MN 55474
Born 1960 | | Vice President (2015) | | President, Columbia Management Investment Services Corp. since October 2014; Vice President & Resolution Officer, Ameriprise Trust Company since August 2009; President, RiverSource Service Corporation 2004-2010. | |
Ryan C. Larrenaga
225 Franklin Street
Boston, MA 02110
Born 1970 | | Vice President and Secretary (2015) | | Vice President and Group Counsel, Ameriprise Financial, Inc. since August 2011 (previously, Counsel from May 2010 to August 2011); Assistant General Counsel, Bank of America, 2005-April 2010; officer of Columbia Funds and affiliated funds since 2005. | |
Annual Report 2015
63
COLUMBIA DIVERSIFIED ABSOLUTE RETURN FUND
BOARD CONSIDERATION AND APPROVAL OF ADVISORY AGREEMENT
AND SUBADVISORY AGREEMENT
On December 19, 2014, the Board of Trustees (the "Board") and the Trustees who are not interested persons (as defined in the Investment Company Act of 1940) of the Trust (the "Independent Trustees") unanimously approved the Investment Management Services Agreement (the "Advisory Agreement") with Columbia Management Investment Advisers, LLC (the "Investment Manager") and the Subadvisory Agreement (the "Subadvisory Agreement") between the Investment Manager and Threadneedle International Limited (the "Subadviser") with respect to Columbia Diversified Absolute Return Fund (the "Fund"), a series of the Trust. As detailed below, the Advisory Fees and Expenses Committee (the "Committee") and the Board met to review and discuss, both among themselves and with the management team of the Investment Manager, materials provided by the Investment Manager before determining to approve the Advisory Agreement and the Subadvisory Agreement (collectively, the "Agreements").
In connection with their deliberations regarding the proposed Agreements, the Committee and the Board evaluated materials requested from the Investment Manager regarding the Fund and the Agreements, and discussed these materials, as well as other materials provided by the Investment Manager and others, including materials provided in connection with its most recent and its upcoming annual approval of the continuation of the advisory agreements with respect to other series of the Trust, with representatives of the Investment Manager at the Committee meeting held on December 18, 2014, and at the Board meetings held on October 21, 2014, and December 19, 2014. The Committee and the Board also consulted with Fund counsel and with the Independent Trustees' independent legal counsel, who advised on various matters with respect to the Committee's and the Board's considerations and otherwise assisted the Committee and the Board in their deliberations. On December 19, 2014, the Board, including the Independent Trustees, voting separately, approved the Agreements for the Fund.
The Committee and the Board considered all information that they, their legal counsel, or the Investment Manager believed reasonably necessary to evaluate and to determine whether to approve the Agreements. The information and factors considered by the Committee and the Board in recommending for approval or approving the Agreements for the Fund included the following:
• Information regarding the reputation, financial strength, regulatory history and resources of the Investment Manager and the Subadviser, including information regarding senior management, portfolio managers and other personnel proposed to provide investment management, administrative and other services to the Fund;
• Information regarding the capabilities of the Investment Manager and the Subadviser with respect to compliance monitoring services, including an assessment of the Investment Manager's and the Subadviser's compliance system by the Fund's Chief Compliance Officer;
• The terms and conditions of the Agreements;
• The terms and conditions of other agreements and arrangements with affiliates of the Investment Manager relating to the operations of the Fund, including the Administrative Services Agreement, the Distribution Agreement and the Transfer and Dividend Disbursing Agent Agreement;
• The Investment Manager's agreement to contractually limit or cap total operating expenses for the Fund through September 30, 2016, so that total operating expenses (excluding certain fees and expenses, such as transaction costs and certain other investment related expenses, interest, taxes, acquired fund fees and expenses, and extraordinary expenses) would not exceed an annual rate of 1.71% for Class A, 2.46% for Class C, 1.31% for Class I, 1.46% for Class R4, 1.36% for Class R5, 1.71% for Class W and 1.46% for Class Z;
• Descriptions of various functions performed by the Investment Manager and the Subadviser under the Agreements, including portfolio management and portfolio trading practices; and
• Information regarding the investment management fees and other expenses of the Fund relative to those of funds determined by the Investment Manager to be comparable to the Fund.
Annual Report 2015
64
COLUMBIA DIVERSIFIED ABSOLUTE RETURN FUND
BOARD CONSIDERATION AND APPROVAL OF ADVISORY AGREEMENT
AND SUBADVISORY AGREEMENT (continued)
Nature, Extent and Quality of Services to be Provided under the Agreements
The Committee and the Board considered the nature, extent and quality of services to be provided to the Fund by the Investment Manager and the Subadviser and the Investment Manager's affiliates under the Agreements and under separate agreements for the provision of transfer agency and administrative services, and the similar type of services currently provided by the Investment Manager to other funds in the fund complex, and the resources dedicated to the Fund and the other Columbia Funds by the Investment Manager and the Subadviser and the Investment Manager's affiliates. The Committee and the Board considered, among other things, the Investment Manager's ability to attract, motivate and retain highly qualified research, advisory and supervisory investment professionals (including personnel and other resources, compensation programs for personnel involved in fund management, reputation and other attributes), the portfolio management services provided by those investment professionals, and the quality of the Investment Manager's investment research capabilities and trade execution services. The Committee and the Board also considered the potential benefits to shareholders of investing in a mutual fund that is part of a fund complex offering exposure to a variety of asset classes and investment disciplines and providing a variety of fund and shareholder services.
The Committee and the Board also considered the professional experience and qualifications of the senior personnel of the Investment Manager, including the proposed portfolio managers for the Fund, which included consideration of the Investment Manager's experience with similarly-structured funds. The Committee and the Board noted the compliance programs of and the compliance-related resources provided to the Fund by the Investment Manager and its affiliates, and considered the Investment Manager's ability to provide administrative services to the Fund pursuant to a separate Administrative Services Agreement, including the Investment Manager's ability to coordinate the activities of the Fund's other service providers. The Committee and the Board also noted that the Board had approved the Subadviser's code of ethics and compliance program, and that the Chief Compliance Officer of the Funds monitors the code of ethics and compliance program.
After reviewing these and related factors, the Committee and the Board concluded, within the context of its overall conclusions, that the expected nature, extent and quality of the services to be provided to the Fund under the Agreements supported the approval of the Agreements.
Investment Advisory Fee Rates and Other Expenses
The Committee and the Board considered the advisory fees to be charged to the Fund under the Agreements as well as the total expenses expected to be incurred by the Fund. In assessing the reasonableness of the proposed fees under the Agreements, the Committee and the Board considered, among other information, the Fund's proposed advisory fee and its expected total expense ratio as a percentage of average daily net assets. The Board also took into account the proposed fee waiver and expense limitation arrangements that the Investment Manager would observe during the Fund's first year, and the advisory fees and total expense ratios of comparable funds identified for purposes of expense comparison.
After reviewing these and related factors, the Committee and the Board concluded, within the context of its overall conclusions, that the advisory fee rates and expenses of the Fund supported the approval of the Agreements.
Costs of Services to be Provided and Profitability
The Committee and the Board considered information provided by the Investment Manager with respect to estimated costs of services and profitability, and expected to consider the costs of services and the profitability of the Investment Manager and its affiliates in connection with the Committee's and the Board's next review and consideration of the continuation of the Agreements. The Committee and the Board also considered court cases in which adviser profitability was an issue in whole or in part, the expected expense ratio of the Fund, and the implementation of expense limitations with respect to the Fund. The Committee and the Board also considered information provided by the Investment Manager regarding its financial condition.
After reviewing these and related factors, the Committee and the Board concluded, within the context of its overall conclusions, that the anticipated costs of services to be provided and the expected profitability to the
Annual Report 2015
65
COLUMBIA DIVERSIFIED ABSOLUTE RETURN FUND
BOARD CONSIDERATION AND APPROVAL OF ADVISORY AGREEMENT
AND SUBADVISORY AGREEMENT (continued)
Investment Manager and its affiliates from their relationships with the Fund supported the approval of the Agreements.
Investment Performance
Because the Fund had not yet commenced operations, the Committee and the Board did not have investment performance to compare to the returns of a group of comparable mutual funds. However, the Committee and the Board expected to consider, in connection with their next review and consideration of the continuation of the Agreements, the investment performance of the Fund in relation to the annualized return for various time periods of both a group of comparable funds and a benchmark.
The Committee and the Board also considered the Investment Manager's performance and reputation generally, the Investment Manager's historical responsiveness to Board concerns about performance, and the Investment Manager's willingness to take steps intended to improve performance. After reviewing these and related factors, the Committee and the Board concluded, within the context of its overall conclusions, that the performance of the Investment Manager and the Subadviser supported approval of the Agreements.
Economies of Scale
The Committee and the Board considered the potential existence of economies of scale in the provision by the Investment Manager of services to the Fund, to groups of related funds, and to the Investment Manager's investment advisory clients as a whole, and whether those economies of scale were expected to be shared with the Fund through breakpoints in the proposed investment advisory fees or other means, such as expense limitation arrangements and additional investments by the Investment Manager in investment, trading and compliance resources. The Committee and the Board noted that the investment advisory fee schedules for the Fund contained breakpoints that would reduce the fee rate on assets above specified threshold levels.
After reviewing these and related factors, the Board concluded, within the context of its overall conclusions, that the extent to which any economies of scale were expected to be shared with the Fund supported the approval of the Agreements.
Other Benefits to the Investment Manager
The Committee and the Board received and considered information regarding "fall-out" or ancillary benefits to be received by the Investment Manager and its affiliates as a result of their relationships with the Fund, such as the engagement of the Investment Manager to provide administrative services to the Fund and the engagement of the Investment Manager's affiliates to provide distribution and transfer agency services to the Fund. The Committee and the Board considered that the Fund's distributor retains a portion of the distribution fees from the Fund. The Committee and the Board also considered the benefits of research made available to the Investment Manager by reason of brokerage commissions to be generated by the Fund's securities transactions, and reviewed information about the Investment Manager's practices with respect to allocating portfolio transactions for brokerage and research services. The Committee and the Board considered the possible conflicts of interest associated with certain fall-out or other ancillary benefits and the reporting, disclosure and other processes that are in place to address such possible conflicts of interest. The Committee and the Board recognized that the Investment Manager's profitability would be somewhat lower without these benefits.
Conclusion
The Committee and the Board reviewed all of the above considerations in reaching its decision to recommend or approve the proposed Agreements. In their deliberations, the Trustees did not identify any particular information that was all-important or controlling, and individual Trustees may have attributed different weights to the various factors. Based on its evaluation of all factors that they deemed to be material, including those factors described above, and assisted by the advice of independent legal counsel, the Board, including the Independent Trustees, voting separately, approved the Agreements.
Annual Report 2015
66
COLUMBIA DIVERSIFIED ABSOLUTE RETURN FUND
IMPORTANT INFORMATION ABOUT THIS REPORT
Each fund mails one shareholder report to each shareholder address. If you would like more than one report, please call shareholder services at 800.345.6611 and additional reports will be sent to you.
The policy of the Board is to vote the proxies of the companies in which each fund holds investments consistent with the procedures as stated in the Statement of Additional Information (SAI). You may obtain a copy of the SAI without charge by calling 800.345.6611; contacting your financial intermediary; visiting columbiathreadneedle.com/us; or searching the website of the Securities and Exchange Commission (SEC) at sec.gov. Information regarding how each fund voted proxies relating to portfolio securities is filed with the SEC by August 31st for the most recent 12-month period ending June 30th of that year, and is available without charge by visiting columbiathreadneedle.com/us, or searching the website of the SEC at sec.gov.
Each fund files a complete schedule of portfolio holdings with the SEC for the first and third quarters of each fiscal year on Form N-Q. Each fund's Form N-Q is available on the SEC's website at sec.gov and may be reviewed and copied at the SEC's Public Reference Room in Washington, D.C. Information on the operation of the Public Reference Room may be obtained by calling 800.SEC.0330. Each fund's complete schedule of portfolio holdings, as filed on Form N-Q, can also be obtained without charge, upon request, by calling 800.345.6611.
You may obtain the current net asset value (NAV) of Fund shares at no cost by calling 800.345.6611 or by sending an e-mail to serviceinquiries@columbiathreadneedle.com.
Annual Report 2015
67
Columbia Diversified Absolute Return Fund
P.O. Box 8081
Boston, MA 02266-8081

This information is for use with concurrent or prior delivery of a fund prospectus. Please read and consider the investment objectives, risks, charges and expenses for any fund carefully before investing. For a prospectus and summary prospectus, which contains this and other important information about the Fund, go to columbiathreadneedle.com/us. The Fund is distributed by Columbia Management Investment Distributors, Inc., member FINRA, and managed by Columbia Management Investment Advisers, LLC.
Columbia Threadneedle Investments (Columbia Threadneedle) is the global brand name of the Columbia and Threadneedle group of companies.
All rights reserved. Columbia Management Investment Distributors, Inc., 225 Franklin Street, Boston, MA 02110-2804
© 2015 Columbia Management Investment Advisers, LLC.
columbiathreadneedle.com/us
ANN258_05_E01_(07/15)

ANNUAL REPORT
May 31, 2015

COLUMBIA DIVIDEND INCOME FUND

ABOUT COLUMBIA THREADNEEDLE INVESTMENTS
Columbia Threadneedle Investments is a leading global asset management group that provides a broad range of actively managed investment strategies and solutions for individual, institutional and corporate clients around the world.
With more than 2,000 people, including over 450 investment professionals based in North America, Europe and Asia, we manage $506 billion* of assets across developed and emerging market equities, fixed income, asset allocation solutions and alternatives. We are the 12th largest manager of long-term mutual fund assets in the U.S.** and the 5th largest manager of retail funds in the U.K.***
Our priority is the investment success of our clients. We aim to deliver the investment outcomes they expect through an investment approach that is team-based, performance-driven and risk-aware. Our culture is dynamic and interactive. By sharing our insights across asset classes and geographies, we generate richer perspectives on global, regional and local investment landscapes. The ability to exchange and debate investment ideas in a collaborative environment enriches our teams' investment processes. More importantly, it results in better informed investment decisions for our clients.
Columbia funds are distributed by Columbia Management Investment Distributors, Inc., member FINRA, and managed by Columbia Management Investment Advisers, LLC.
Columbia Threadneedle Investments (Columbia Threadneedle) is the global brand name of the Columbia and Threadneedle group of companies.
* In U.S. dollars as of March 31, 2015. Source: Ameriprise Q1 Earnings Release. Includes all assets managed by entities in the Columbia and Threadneedle groups of companies. Contact us for more current data.
** Source: ICI as of March 31, 2015 for Columbia Management Investment Advisers, LLC.
*** Source: Investment Association as of March 2015 for Threadneedle Asset Management Limited.
© 2015 Columbia Management Investment Advisers, LLC. All rights reserved.
Not part of the shareholder report
 Dear Shareholder,
In a world that is changing faster than ever before, investors want asset managers who offer a global perspective while generating strong and sustainable returns. To that end, Columbia Management, in conjunction with its U.K.-based affiliate, Threadneedle Investments, has rebranded to Columbia Threadneedle Investments. The new global brand represents the combined capabilities, resources and reach of the global group, offering investors access to the best of both firms.
With a presence in 18 countries and more than 450 investment professionals*, our collective perspective and world view as Columbia Threadneedle Investments gives us deeper insight into what might affect the real-life financial outcomes clients are seeking. Putting our views into a global context enables us to build richer perspectives and create the right solutions, and provides us with enhanced capabilities to deliver consistent investment performance, which may ultimately lead to better investor outcomes.
As a result of the rebrand, you will begin to see our new logo and colors reflected in printed materials, such as this shareholder report, as well as on our new website — columbiathreadneedle.com/us. We encourage you to visit us online and view a new video on the "About Us" tab that speaks to the strength of the firm.
While we are introducing a new brand, in many ways, the investment company you know well has not changed. The following remain in effect:
n Fund and strategy names
n Established investment teams, philosophies and processes
n Account services, features, servicing phone numbers and mailing addresses
n Columbia Management Investment Distributors as distributor and Columbia Management Investment Advisers as investment adviser
We recognize that the money we manage represents the hard work and savings of people like you, and that everyone has different ambitions and different definitions of success. Investors have varying goals — funding their children's education, enjoying their retirement, putting money aside for unexpected events, and more. Whatever your ambitions, we believe our wide range of investment products and solutions can help give you confidence that you will reach your goals.
The world is constantly changing, but our priority remains the same: to help you secure your finances, meet your goals and achieve success. Thank you for your continued investment with us. Our service representatives are available at 800.345.6611 to help with any questions.
Sincerely,

Christopher O. Petersen
President, Columbia Funds
Investors should consider the investment objectives, risks, charges and expenses of a mutual fund carefully before investing. For a free prospectus and summary prospectus, which contains this and other important information about a fund, visit columbiathreadneedle.com/us. The prospectus should be read carefully before investing.
* Source: Ameriprise as of December 1, 2014
Columbia Funds are distributed by Columbia Management Investment Distributors, Inc., member FINRA, and managed by Columbia Management Investment Advisers, LLC.
© 2015 Columbia Management Investment Advisers, LLC. All rights reserved.
COLUMBIA DIVIDEND INCOME FUND
Fund Investment Manager
Columbia Management Investment
Advisers, LLC
225 Franklin Street
Boston, MA 02110
Fund Distributor
Columbia Management Investment
Distributors, Inc.
225 Franklin Street
Boston, MA 02110
Fund Transfer Agent
Columbia Management Investment
Services Corp.
P.O. Box 8081
Boston, MA 02266-8081
For more information about any of the funds, please visit columbiathreadneedle.com/us or call 800.345.6611. Customer Service Representatives are available to answer your questions Monday through Friday from 8 a.m. to 7 p.m. Eastern time.
The views expressed in this report reflect the current views of the respective parties. These views are not guarantees of future performance and involve certain risks, uncertainties and assumptions that are difficult to predict, so actual outcomes and results may differ significantly from the views expressed. These views are subject to change at any time based upon economic, market or other conditions and the respective parties disclaim any responsibility to update such views. These views may not be relied on as investment advice and, because investment decisions for a Columbia fund are based on numerous factors, may not be relied on as an indication of trading intent on behalf of any particular Columbia fund. References to specific securities should not be construed as a recommendation or investment advice.
Performance Overview | | | 3 | | |
Manager Discussion of Fund Performance | | | 5 | | |
Understanding Your Fund's Expenses | | | 8 | | |
Portfolio of Investments | | | 9 | | |
Statement of Assets and Liabilities | | | 14 | | |
Statement of Operations | | | 17 | | |
Statement of Changes in Net Assets | | | 18 | | |
Financial Highlights | | | 21 | | |
Notes to Financial Statements | | | 32 | | |
Report of Independent Registered
Public Accounting Firm | | | 39 | | |
Federal Income Tax Information | | | 40 | | |
Trustees and Officers | | | 41 | | |
Important Information About This Report | | | 45 | | |
COLUMBIA DIVIDEND INCOME FUND
Performance Summary
n Columbia Dividend Income Fund (the Fund) Class A shares returned 9.08% excluding sales charges for the 12-month period ended May 31, 2015.
n The Fund underperformed its benchmark, the Russell 1000 Index, which returned 11.91% for the same time period.
n Despite solid gains from the materials, consumer discretionary and financials sectors, stock selection in the health care and consumer staples sectors detracted from results and generally accounted for the Fund's shortfall relative to the benchmark.
Average Annual Total Returns (%) (for period ended May 31, 2015)
| | | Inception | | 1 Year | | 5 Years | | 10 Years | |
Class A | | 11/25/02 | | | | | | | | | | | | | |
Excluding sales charges | | | | | | | 9.08 | | | | 14.72 | | | | 8.33 | | |
Including sales charges | | | | | | | 2.81 | | | | 13.38 | | | | 7.69 | | |
Class B | | 11/25/02 | | | | | | | | | | | | | |
Excluding sales charges | | | | | | | 8.26 | | | | 13.86 | | | | 7.52 | | |
Including sales charges | | | | | | | 3.26 | | | | 13.62 | | | | 7.52 | | |
Class C | | 11/25/02 | | | | | | | | | | | | | |
Excluding sales charges | | | | | | | 8.26 | | | | 13.87 | | | | 7.52 | | |
Including sales charges | | | | | | | 7.26 | | | | 13.87 | | | | 7.52 | | |
Class I* | | 09/27/10 | | | 9.54 | | | | 15.19 | | | | 8.69 | | |
Class R* | | 03/28/08 | | | 8.80 | | | | 14.43 | | | | 8.07 | | |
Class R4* | | 11/08/12 | | | 9.33 | | | | 15.00 | | | | 8.60 | | |
Class R5* | | 11/08/12 | | | 9.48 | | | | 15.08 | | | | 8.64 | | |
Class T | | 03/04/98 | | | | | | | | | | | | | |
Excluding sales charges | | | | | | | 9.03 | | | | 14.66 | | | | 8.28 | | |
Including sales charges | | | | | | | 2.77 | | | | 13.32 | | | | 7.64 | | |
Class W* | | 09/27/10 | | | 9.09 | | | | 14.73 | | | | 8.36 | | |
Class Y* | | 11/08/12 | | | 9.59 | | | | 15.11 | | | | 8.66 | | |
Class Z | | 03/04/98 | | | 9.40 | | | | 15.00 | | | | 8.61 | | |
Russell 1000 Index | | | | | | | 11.91 | | | | 16.68 | | | | 8.38 | | |
Returns for Class A and Class T are shown with and without the maximum initial sales charge of 5.75%. Returns for Class B are shown with and without the applicable contingent deferred sales charge (CDSC) of 5.00% in the first year, declining to 1.00% in the sixth year and eliminated thereafter. Returns for Class C are shown with and without the 1.00% CDSC for the first year only. The Fund's other classes are not subject to sales charges and have limited eligibility. Please see the Fund's prospectus for details. Performance for different share classes will vary based on differences in sales charges and fees associated with each class. All results shown assume reinvestment of distributions during the period. Returns do not reflect the deduction of taxes that a shareholder may pay on Fund distributions or on the redemption of Fund shares. Performance results reflect the effect of any fee waivers or reimbursements of Fund expenses by Columbia Management Investment Advisers, LLC and/or any of its affiliates. Absent these fee waivers or expense reimbursement arrangements, performance results would have been lower.
The performance information shown represents past performance and is not a guarantee of future results. The investment return and principal value of your investment will fluctuate so that your shares, when redeemed, may be worth more or less than their original cost. Current performance may be lower or higher than the performance information shown. You may obtain performance information current to the most recent month-end by contacting your financial intermediary, visiting columbiathreadneedle.com/us or calling 800.345.6611.
*The returns shown for periods prior to the share class inception date (including returns for the Life of the Fund, if shown, which are since Fund inception) include the returns of the Fund's oldest share class. Since the Fund launched more than one share class at its inception, Class Z shares were used. These returns are adjusted to reflect any higher class-related operating expenses of the newer share classes, as applicable. Please visit columbiathreadneedle.com/us/investment-products/mutual-funds/appended-performance for more information.
The Russell 1000 Index measures the performance of the large-cap segment of the U.S. equity universe. It is a subset of the Russell 3000 Index and includes approximately 1000 of the largest securities based on a combination of their market cap and current index membership. The Russell 1000 Index represents approximately 92% of the U.S. market.
Indices are not available for investment, are not professionally managed and do not reflect sales charges, fees, brokerage commissions, taxes or other expenses of investing. Securities in the Fund may not match those in an index.
Annual Report 2015
3
COLUMBIA DIVIDEND INCOME FUND
PERFORMANCE OVERVIEW (continued)
Performance of a Hypothetical $10,000 Investment (June 1, 2005 – May 31, 2015)
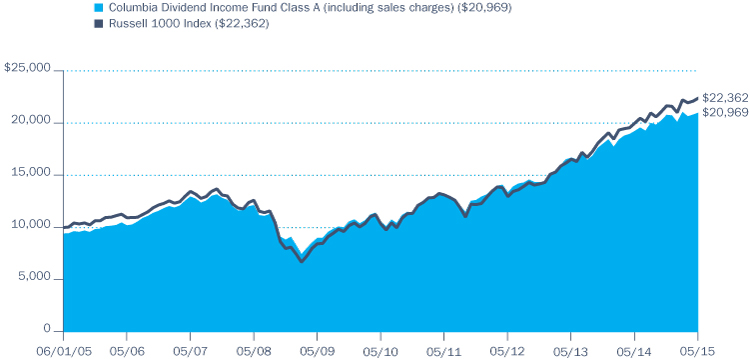
The chart above shows the change in value of a hypothetical $10,000 investment in Class A shares of Columbia Dividend Income Fund during the stated time period, and does not reflect the deduction of taxes that a shareholder may pay on Fund distributions or on the redemption of Fund shares.
Annual Report 2015
4
COLUMBIA DIVIDEND INCOME FUND
MANAGER DISCUSSION OF FUND PERFORMANCE
For the 12-month period that ended May 31, 2015, the Fund's Class A shares returned 9.08% excluding sales charges. The Fund underperformed its benchmark, the Russell 1000 Index, which returned 11.91% over the same period. Despite solid gains from the materials, consumer discretionary and financials sectors, stock selection in the health care and consumer staples sectors detracted from results and generally accounted for the Fund's shortfall relative to the benchmark.
Stocks Advanced in Volatile Market
After a strong start, the pace of U.S. economic growth weakened during the 12-month period that ended May 31, 2015. A combination of factors whittled away at gross domestic product: another stormy winter in the Northeast and Midwest, a strong U.S. dollar, a widening trade deficit and sharply declining oil prices. Manufacturing activity weakened somewhat, consumer confidence slipped late in the period and business investment declined, the latter mostly due to falling commodity prices. However, most of these setbacks appeared to be temporary, given the monthly addition of on average 255,000 new jobs to the U.S. workforce and positive home sales trends.
Against this backdrop, stock prices improved, with most of the gains coming in the first nine months of the period. Mounting concern about global tensions and uncertainty about the timing of a Federal Reserve (Fed) interest rate hike led to increased volatility later in the period. For the year, large- and mid-cap stocks outperformed small-cap stocks, while growth stocks outperformed value stocks.
Contributors and Detractors
Materials, consumer discretionary and financials were the top-performing sectors for the Fund relative to the benchmark. In the materials sector, we did well to avoid the metals and mining segment, which fared poorly in an environment of declining prices and weakened demand from China. An overweight in domestic paint giant Sherwin-Williams also aided relative results. The company, which is bigger than its next eight competitors combined, distributes its products mostly through its own retail stores but also has some product distribution through Home Depot. Sherwin-Williams shares posted strong returns as the housing sector recovered. Within the consumer discretionary sector, overweights in Time Warner, Home Depot and Hanesbrands aided relative results as shares of all three companies moved solidly higher during the period. Performance for media giant Time Warner was driven by its HBO affiliate. Home Depot benefited from a recovering housing market. Hanesbrands improved on basic cotton underwear by adding technology and functionality, which has resulted in higher selling prices, revenues, earnings and a rising share price. In the financials sector, we did well to underweight money-center banks, which have come under significant regulatory pressure, and to focus instead on regional banks, which we believe tend to have simpler business models and are generally less pressured by regulation. The one money-center bank in the portfolio, JPMorgan Chase, was a solid performer and an overweight in the stock relative to the benchmark amplified the impact of its double-digit gains. Elsewhere in the portfolio, Apple was the single
Portfolio Management
Scott Davis
Michael Barclay, CFA
Peter Santoro, CFA
Morningstar Style BoxTM

The Morningstar Style BoxTM is based on a fund's portfolio holdings. For equity funds, the vertical axis shows the market capitalization of the stocks owned, and the horizontal axis shows investment style (value, blend, or growth). Information shown is based on the most recent data provided by Morningstar.
© 2015 Morningstar, Inc. All rights reserved. The Morningstar information contained herein: (1) is proprietary to Morningstar and/or its content providers; (2) may not be copied or distributed; and (3) is not warranted to be accurate, complete or timely. Neither Morningstar nor its content providers are responsible for any damages or losses arising from any use of this information.
Annual Report 2015
5
COLUMBIA DIVIDEND INCOME FUND
MANAGER DISCUSSION OF FUND PERFORMANCE (continued)
Top Ten Holdings (%)
(at May 31, 2015) | |
Apple, Inc. | | | 3.6 | | |
Microsoft Corp. | | | 3.2 | | |
JPMorgan Chase & Co. | | | 2.8 | | |
Wells Fargo & Co. | | | 2.7 | | |
Johnson & Johnson | | | 2.7 | | |
Merck & Co., Inc. | | | 2.6 | | |
Pfizer, Inc. | | | 2.3 | | |
Verizon Communications, Inc. | | | 2.3 | | |
Exxon Mobil Corp. | | | 2.3 | | |
Comcast Corp., Class A | | | 2.2 | | |
Percentages indicated are based upon total investments (excluding Money Market Funds).
For further detail about these holdings, please refer to the section entitled "Portfolio of Investments."
Fund holdings are as of the date given, are subject to change at any time, and are not recommendations to buy or sell any security.
Portfolio Breakdown (%)
(at May 31, 2015) | |
Common Stocks | | | 96.4 | | |
Exchange-Traded Funds | | | 1.7 | | |
Money Market Funds | | | 1.9 | | |
Total | | | 100.0 | | |
Percentages indicated are based upon total investments. The Fund's portfolio composition is subject to change.
largest individual contributor to results as investors continued to respond favorably to new products.
Stock selection in the health care and consumer staples sectors detracted from results and generally accounted for the Fund's modest shortfall relative to the benchmark. Within health care, the Fund was constrained from owning some of the sector's best performers, in the biotechnology and insurers and managed care providers industries, because they fall outside of the dividend-paying universe that is our focus. An out-of-benchmark position in Roche Holdings, a Switzerland-based global health care company, also reduced returns. The stock lost ground after the release of a study that contained disappointing results for Roche's breast cancer drugs. The impact of the decoupling of the Swiss franc from the euro also weighed on the stock. These disappointments aside, some of the Fund's best individual performers were in the health care sector, including Amgen, Pfizer and AbbVie. Within the consumer staples sector, disappointing results from Wal-Mart and Philip Morris hampered relative returns, as the Fund was overweight in both stocks. We expected a robust labor market and declining gasoline prices to have a favorable impact on Wal-Mart. However, stagnant consumer spending and execution problems further restrained Wal-Mart's performance. Philip Morris was hurt by a declining ruble. A significant portion of its revenues come from Russia. We held onto both stocks but reduced the Fund's positions somewhat. Four of the Fund's biggest disappointments were energy stocks, including Exxon Mobil and Schlumberger. A position in IBM was the only non-energy detractor in the bottom five individual performers for the period. The company is in transition from hardware and PC-based to cloud-based technology. We reduced the Fund's exposure to IBM to a modest position.
Portfolio Changes
We reduced the Fund's exposure to the telecommunications sector during the fiscal year, as free cash flow declined in both AT&T, which was sold in 2014, and also in Verizon. The Fund's exposure to energy and industrials also declined over the year. We used the proceeds of these sales to add to industrials holdings, including Lockheed Martin and General Electric.
Looking Ahead
Interest rates figure into our current outlook for the dividend income universe. However, we have sought to remain interest-rate agnostic in positioning the portfolio for the period ahead. We have not made any bets around either the timing or the size of the next interest move by the Fed, because we believe that would introduce unwarranted risk. Despite the potential for rising rates, we currently believe that the environment is favorable at this time for dividend growth going forward while earnings growth is likely to be relatively modest. With an excess of capacity in many sectors, we believe that corporate management teams have an incentive to deploy cash through dividend payments.
Annual Report 2015
6
COLUMBIA DIVIDEND INCOME FUND
MANAGER DISCUSSION OF FUND PERFORMANCE (continued)
Equity Sector Breakdown (%)
(at May 31, 2015) | |
Consumer Discretionary | | | 9.2 | | |
Consumer Staples | | | 12.6 | | |
Energy | | | 8.8 | | |
Financials | | | 19.1 | | |
Health Care | | | 13.4 | | |
Industrials | | | 12.9 | | |
Information Technology | | | 13.9 | | |
Materials | | | 3.2 | | |
Telecommunication Services | | | 2.3 | | |
Utilities | | | 4.6 | | |
Total | | | 100.0 | | |
Percentages indicated are based upon total equity investments. The Fund's portfolio composition is subject to change.
Investment Risks
Market risk may affect a single issuer, sector of the economy, industry or the market as a whole. Value securities may be unprofitable if the market fails to recognize their intrinsic worth or the portfolio manager misgauged that worth. Foreign investments subject the Fund to risks, including political, economic, market, social and others within a particular country, as well as to currency instabilities and less stringent financial and accounting standards generally applicable to U.S. issuers. Dividend payments are not guaranteed and the amount, if any, can vary over time. A rise in interest rates may result in a price decline of fixed-income instruments held by the Fund, negatively impacting its performance and NAV. Falling rates may result in the Fund investing in lower yielding debt instruments, lowering the Fund's income and yield. These risks may be heightened for longer maturity and duration securities. The Fund may invest significantly in issuers within a particular sector, which may be negatively affected by market, economic or other conditions, making the Fund more vulnerable to unfavorable developments in the sector. See the Fund's prospectus for more information on these and other risks.
Annual Report 2015
7
COLUMBIA DIVIDEND INCOME FUND
UNDERSTANDING YOUR FUND'S EXPENSES
(Unaudited)
As an investor, you incur two types of costs. There are transaction costs, which generally include sales charges on purchases and may include redemption fees. There are also ongoing costs, which generally include management fees, distribution and/or service fees, and other fund expenses. The following information is intended to help you understand your ongoing costs (in dollars) of investing in the Fund and to help you compare these costs with the ongoing costs of investing in other mutual funds.
Analyzing Your Fund's Expenses
To illustrate these ongoing costs, we have provided examples and calculated the expenses paid by investors in each share class of the Fund during the period. The actual and hypothetical information in the table is based on an initial investment of $1,000 at the beginning of the period indicated and held for the entire period. Expense information is calculated two ways and each method provides you with different information. The amount listed in the "Actual" column is calculated using the Fund's actual operating expenses and total return for the period. You may use the Actual information, together with the amount invested, to estimate the expenses that you paid over the period. Simply divide your account value by $1,000 (for example, an $8,600 account value divided by $1,000 = 8.6), then multiply the results by the expenses paid during the period under the "Actual" column. The amount listed in the "Hypothetical" column assumes a 5% annual rate of return before expenses (which is not the Fund's actual return) and then applies the Fund's actual expense ratio for the period to the hypothetical return. You should not use the hypothetical account values and expenses to estimate either your actual account balance at the end of the period or the expenses you paid during the period. See "Compare With Other Funds" below for details on how to use the hypothetical data.
Compare With Other Funds
Since all mutual funds are required to include the same hypothetical calculations about expenses in shareholder reports, you can use this information to compare the ongoing cost of investing in the Fund with other funds. To do so, compare the hypothetical example with the 5% hypothetical examples that appear in the shareholder reports of other funds. As you compare hypothetical examples of other funds, it is important to note that hypothetical examples are meant to highlight the ongoing costs of investing in a fund only and do not reflect any transaction costs, such as sales charges, or redemption or exchange fees. Therefore, the hypothetical calculations are useful in comparing ongoing costs only, and will not help you determine the relative total costs of owning different funds. If transaction costs were included in these calculations, your costs would be higher.
December 1, 2014 – May 31, 2015
| | | Account Value at the Beginning
of the Period ($) | | Account Value at the End of the
Period ($) | | Expenses Paid During the
Period ($) | | Fund's Annualized
Expense Ratio (%) | |
| | | Actual | | Hypothetical | | Actual | | Hypothetical | | Actual | | Hypothetical | | Actual | |
Class A | | | 1,000.00 | | | | 1,000.00 | | | | 1,010.20 | | | | 1,019.80 | | | | 5.16 | | | | 5.19 | | | | 1.03 | | |
Class B | | | 1,000.00 | | | | 1,000.00 | | | | 1,006.00 | | | | 1,016.06 | | | | 8.90 | | | | 8.95 | | | | 1.78 | | |
Class C | | | 1,000.00 | | | | 1,000.00 | | | | 1,006.00 | | | | 1,016.06 | | | | 8.90 | | | | 8.95 | | | | 1.78 | | |
Class I | | | 1,000.00 | | | | 1,000.00 | | | | 1,012.50 | | | | 1,022.04 | | | | 2.91 | | | | 2.92 | | | | 0.58 | | |
Class R | | | 1,000.00 | | | | 1,000.00 | | | | 1,008.90 | | | | 1,018.55 | | | | 6.41 | | | | 6.44 | | | | 1.28 | | |
Class R4 | | | 1,000.00 | | | | 1,000.00 | | | | 1,011.40 | | | | 1,021.04 | | | | 3.91 | | | | 3.93 | | | | 0.78 | | |
Class R5 | | | 1,000.00 | | | | 1,000.00 | | | | 1,011.60 | | | | 1,021.79 | | | | 3.16 | | | | 3.18 | | | | 0.63 | | |
Class T | | | 1,000.00 | | | | 1,000.00 | | | | 1,010.10 | | | | 1,019.80 | | | | 5.16 | | | | 5.19 | | | | 1.03 | | |
Class W | | | 1,000.00 | | | | 1,000.00 | | | | 1,010.20 | | | | 1,019.80 | | | | 5.16 | | | | 5.19 | | | | 1.03 | | |
Class Y | | | 1,000.00 | | | | 1,000.00 | | | | 1,012.30 | | | | 1,021.99 | | | | 2.96 | | | | 2.97 | | | | 0.59 | | |
Class Z | | | 1,000.00 | | | | 1,000.00 | | | | 1,011.50 | | | | 1,021.04 | | | | 3.91 | | | | 3.93 | | | | 0.78 | | |
Expenses paid during the period are equal to the annualized expense ratio for each class as indicated above, multiplied by the average account value over the period and then multiplied by the number of days in the Fund's most recent fiscal half year and divided by 365.
Expenses do not include fees and expenses incurred indirectly by the Fund from its investment in underlying funds, including affiliated and non-affiliated pooled investment vehicles, such as mutual funds and exchange-traded funds.
Annual Report 2015
8
COLUMBIA DIVIDEND INCOME FUND
PORTFOLIO OF INVESTMENTS
May 31, 2015
(Percentages represent value of investments compared to net assets)
Common Stocks 95.8%
Issuer | | Shares | | Value ($) | |
CONSUMER DISCRETIONARY 8.8% | |
Hotels, Restaurants & Leisure 0.7% | |
McDonald's Corp. | | | 682,550 | | | | 65,477,022 | | |
Media 3.4% | |
Comcast Corp., Class A | | | 3,300,000 | | | | 192,918,000 | | |
Time Warner, Inc. | | | 1,388,900 | | | | 117,334,272 | | |
Total | | | | | 310,252,272 | | |
Multiline Retail 0.9% | |
Macy's, Inc. | | | 1,265,825 | | | | 84,746,984 | | |
Specialty Retail 2.4% | |
Home Depot, Inc. (The) | | | 1,691,400 | | | | 188,455,788 | | |
TJX Companies, Inc. (The) | | | 401,110 | | | | 25,823,462 | | |
Total | | | | | 214,279,250 | | |
Textiles, Apparel & Luxury Goods 1.4% | |
Hanesbrands, Inc. | | | 1,658,425 | | | | 52,837,420 | | |
VF Corp. | | | 987,400 | | | | 69,542,582 | | |
Total | | | | | 122,380,002 | | |
Total Consumer Discretionary | | | | | 797,135,530 | | |
CONSUMER STAPLES 12.1% | |
Beverages 2.6% | |
Anheuser-Busch InBev NV, ADR | | | 393,650 | | | | 47,458,444 | | |
Coca-Cola Enterprises, Inc. | | | 1,453,700 | | | | 64,297,151 | | |
PepsiCo, Inc. | | | 1,336,000 | | | | 128,830,480 | | |
Total | | | | | 240,586,075 | | |
Food & Staples Retailing 2.5% | |
CVS Health Corp. | | | 1,470,100 | | | | 150,508,838 | | |
Wal-Mart Stores, Inc. | | | 1,000,000 | | | | 74,270,000 | | |
Total | | | | | 224,778,838 | | |
Food Products 0.8% | |
General Mills, Inc. | | | 1,285,500 | | | | 72,180,825 | | |
Household Products 2.5% | |
Kimberly-Clark Corp. | | | 941,950 | | | | 102,540,677 | | |
Procter & Gamble Co. (The) | | | 1,595,250 | | | | 125,051,647 | | |
Total | | | | | 227,592,324 | | |
Tobacco 3.7% | |
Altria Group, Inc. | | | 2,879,100 | | | | 147,409,920 | | |
Philip Morris International, Inc. | | | 2,220,600 | | | | 184,465,242 | | |
Total | | | | | 331,875,162 | | |
Total Consumer Staples | | | | | 1,097,013,224 | | |
Common Stocks (continued)
Issuer | | Shares | | Value ($) | |
ENERGY 8.4% | |
Energy Equipment & Services 1.0% | |
Schlumberger Ltd. | | | 1,045,890 | | | | 94,935,435 | | |
Oil, Gas & Consumable Fuels 7.4% | |
| BP PLC, ADR | | | 955,200 | | | | 39,602,592 | | |
Chevron Corp. | | | 1,544,500 | | | | 159,083,500 | | |
ConocoPhillips | | | 588,750 | | | | 37,491,600 | | |
Exxon Mobil Corp. | | | 2,344,044 | | | | 199,712,549 | | |
Kinder Morgan, Inc. | | | 1,660,000 | | | | 68,873,400 | | |
Occidental Petroleum Corp. | | | 1,083,300 | | | | 84,703,227 | | |
Royal Dutch Shell PLC, ADR, Class A | | | 1,282,200 | | | | 76,572,984 | | |
Total | | | | | 666,039,852 | | |
Total Energy | | | | | 760,975,287 | | |
FINANCIALS 18.3% | |
Banks 8.0% | |
Fifth Third Bancorp | | | 2,220,000 | | | | 44,932,800 | | |
JPMorgan Chase & Co. | | | 3,824,500 | | | | 251,575,610 | | |
PNC Financial Services Group, Inc. (The) | | | 1,053,400 | | | | 100,799,846 | | |
U.S. Bancorp | | | 2,152,710 | | | | 92,803,328 | | |
Wells Fargo & Co. | | | 4,277,000 | | | | 239,340,920 | | |
Total | | | | | 729,452,504 | | |
Capital Markets 3.1% | |
BlackRock, Inc. | | | 398,675 | | | | 145,827,342 | | |
Northern Trust Corp. | | | 1,026,300 | | | | 76,510,665 | | |
T. Rowe Price Group, Inc. | | | 707,315 | | | | 57,073,247 | | |
Total | | | | | 279,411,254 | | |
Diversified Financial Services 1.0% | |
CME Group, Inc. | | | 987,224 | | | | 92,996,501 | | |
Insurance 3.1% | |
ACE Ltd. | | | 785,000 | | | | 83,586,800 | | |
Chubb Corp. (The) | | | 707,207 | | | | 68,952,682 | | |
Marsh & McLennan Companies, Inc. | | | 2,175,000 | | | | 126,650,250 | | |
Total | | | | | 279,189,732 | | |
Real Estate Investment Trusts (REITs) 3.1% | |
Alexandria Real Estate Equities, Inc. | | | 285,000 | | | | 26,428,050 | | |
AvalonBay Communities, Inc. | | | 111,797 | | | | 18,614,201 | | |
Crown Castle International Corp. | | | 270,000 | | | | 22,018,500 | | |
Duke Realty Corp. | | | 1,205,600 | | | | 23,581,536 | | |
Essex Property Trust, Inc. | | | 145,000 | | | | 32,279,900 | | |
The accompanying Notes to Financial Statements are an integral part of this statement.
Annual Report 2015
9
COLUMBIA DIVIDEND INCOME FUND
PORTFOLIO OF INVESTMENTS (continued)
May 31, 2015
Common Stocks (continued)
Issuer | | Shares | | Value ($) | |
Public Storage | | | 525,000 | | | | 101,608,500 | | |
Simon Property Group, Inc. | | | 299,800 | | | | 54,383,720 | | |
Total | | | | | 278,914,407 | | |
Total Financials | | | | | 1,659,964,398 | | |
HEALTH CARE 12.8% | |
Biotechnology 2.9% | |
Amgen, Inc. | | | 900,600 | | | | 140,727,756 | | |
Gilead Sciences, Inc.(a) | | | 1,079,100 | | | | 121,150,557 | | |
Total | | | | | 261,878,313 | | |
Health Care Equipment & Supplies 1.2% | |
Medtronic PLC | | | 1,459,875 | | | | 111,417,660 | | |
Pharmaceuticals 8.7% | |
Bristol-Myers Squibb Co. | | | 720,740 | | | | 46,559,804 | | |
Johnson & Johnson | | | 2,378,500 | | | | 238,182,990 | | |
Merck & Co., Inc. | �� | | 3,821,500 | | | | 232,691,135 | | |
Pfizer, Inc. | | | 5,768,000 | | | | 200,438,000 | | |
Roche Holding AG, ADR | | | 1,887,050 | | | | 72,575,943 | | |
Total | | | | | 790,447,872 | | |
Total Health Care | | | | | 1,163,743,845 | | |
INDUSTRIALS 12.4% | |
Aerospace & Defense 7.2% | |
Boeing Co. (The) | | | 597,175 | | | | 83,915,031 | | |
Honeywell International, Inc. | | | 1,618,500 | | | | 168,647,700 | | |
Lockheed Martin Corp. | | | 481,800 | | | | 90,674,760 | | |
Raytheon Co. | | | 1,586,950 | | | | 163,868,457 | | |
United Technologies Corp. | | | 1,196,800 | | | | 140,229,056 | | |
Total | | | | | 647,335,004 | | |
Air Freight & Logistics 1.1% | |
United Parcel Service, Inc., Class B | | | 979,625 | | | | 97,198,393 | | |
Commercial Services & Supplies 0.7% | |
Waste Management, Inc. | | | 1,347,100 | | | | 66,883,515 | | |
Industrial Conglomerates 0.8% | |
General Electric Co. | | | 2,786,625 | | | | 75,991,264 | | |
Machinery 2.0% | |
Dover Corp. | | | 750,000 | | | | 56,550,000 | | |
Illinois Tool Works, Inc. | | | 570,150 | | | | 53,497,174 | | |
Parker-Hannifin Corp. | | | 595,100 | | | | 71,667,893 | | |
Total | | | | | 181,715,067 | | |
Common Stocks (continued)
Issuer | | Shares | | Value ($) | |
Road & Rail 0.6% | |
Union Pacific Corp. | | | 520,000 | | | | 52,473,200 | | |
Total Industrials | | | | | 1,121,596,443 | | |
INFORMATION TECHNOLOGY 13.3% | |
Communications Equipment 1.4% | |
Cisco Systems, Inc. | | | 4,365,000 | | | | 127,938,150 | | |
IT Services 1.7% | |
Automatic Data Processing, Inc. | | | 1,230,500 | | | | 105,220,055 | | |
International Business Machines Corp. | | | 294,250 | | | | 49,919,513 | | |
Total | | | | | 155,139,568 | | |
Semiconductors & Semiconductor Equipment 2.6% | |
Avago Technologies Ltd. | | | 175,050 | | | | 25,919,653 | | |
Intel Corp. | | | 2,785,000 | | | | 95,971,100 | | |
Microchip Technology, Inc. | | | 506,400 | | | | 24,879,432 | | |
Texas Instruments, Inc. | | | 1,615,500 | | | | 90,338,760 | | |
Total | | | | | 237,108,945 | | |
Software 3.4% | |
Activision Blizzard, Inc. | | | 972,500 | | | | 24,565,350 | | |
Microsoft Corp. | | | 6,080,820 | | | | 284,947,225 | | |
Total | | | | | 309,512,575 | | |
Technology Hardware, Storage & Peripherals 4.2% | |
Apple, Inc. | | | 2,428,000 | | | | 316,319,840 | | |
EMC Corp. | | | 2,377,000 | | | | 62,610,180 | | |
Total | | | | | 378,930,020 | | |
Total Information Technology | | | | | 1,208,629,258 | | |
MATERIALS 3.1% | |
Chemicals 2.5% | |
Eastman Chemical Co. | | | 599,270 | | | | 46,005,958 | | |
EI du Pont de Nemours & Co. | | | 549,790 | | | | 39,040,588 | | |
LyondellBasell Industries NV, Class A | | | 312,200 | | | | 31,563,420 | | |
Sherwin-Williams Co. (The) | | | 384,175 | | | | 110,711,551 | | |
Total | | | | | 227,321,517 | | |
Containers & Packaging 0.6% | |
Sonoco Products Co. | | | 1,140,000 | | | | 51,322,800 | | |
Total Materials | | | | | 278,644,317 | | |
The accompanying Notes to Financial Statements are an integral part of this statement.
Annual Report 2015
10
COLUMBIA DIVIDEND INCOME FUND
PORTFOLIO OF INVESTMENTS (continued)
May 31, 2015
Common Stocks (continued)
Issuer | | Shares | | Value ($) | |
TELECOMMUNICATION SERVICES 2.2% | |
Diversified Telecommunication Services 2.2% | |
Verizon Communications, Inc. | | | 4,050,000 | | | | 200,232,000 | | |
Total Telecommunication Services | | | | | 200,232,000 | | |
UTILITIES 4.4% | |
Electric Utilities 1.7% | |
American Electric Power Co., Inc. | | | 884,100 | | | | 49,765,989 | | |
Eversource Energy | | | 1,044,300 | | | | 51,431,775 | | |
NextEra Energy, Inc. | | | 519,125 | | | | 53,127,253 | | |
Total | | | | | 154,325,017 | | |
Multi-Utilities 2.7% | |
CMS Energy Corp. | | | 1,587,500 | | | | 54,197,250 | | |
Dominion Resources, Inc. | | | 704,075 | | | | 49,651,369 | | |
PG&E Corp. | | | 836,900 | | | | 44,749,043 | | |
Sempra Energy | | | 430,050 | | | | 46,217,473 | | |
Wisconsin Energy Corp. | | | 1,034,000 | | | | 49,921,520 | | |
Total | | | | | 244,736,655 | | |
Total Utilities | | | | | 399,061,672 | | |
Total Common Stocks
(Cost: $6,044,741,795) | | | | | 8,686,995,974 | | |
Exchange-Traded Funds 1.7%
| | | Shares | | Value ($) | |
SPDR S&P 500 ETF Trust | | | 720,000 | | | | 152,013,600 | | |
Total Exchange-Traded Funds
(Cost: $146,194,388) | | | | | 152,013,600 | | |
Money Market Funds 1.9%
| | | Shares | | Value | |
Columbia Short-Term Cash Fund,
0.114%(b)(c) | | | 173,397,626 | | | | 173,397,626 | | |
Total Money Market Funds
(Cost: $173,397,626) | | | | | 173,397,626 | | |
Total Investments
(Cost: $6,364,333,809) | | | | | 9,012,407,200 | | |
Other Assets & Liabilities, Net | | | | | 50,060,675 | | |
Net Assets | | | | | 9,062,467,875 | | |
Notes to Portfolio of Investments
(a) Non-income producing investment.
(b) The rate shown is the seven-day current annualized yield at May 31, 2015.
(c) As defined in the Investment Company Act of 1940, an affiliated company is one in which the Fund owns 5% or more of the company's outstanding voting securities, or a company which is under common ownership or control with the Fund. Holdings and transactions in these affiliated companies during the year ended May 31, 2015 are as follows:
Issuer | | Beginning
Cost ($) | | Purchase
Cost ($) | | Proceeds
From Sales ($) | | Ending
Cost ($) | | Dividends —
Affiliated
Issuers ($) | | Value ($) | |
Columbia Short-Term Cash Fund | | | 97,058,448 | | | | 1,684,802,439 | | | | (1,608,463,261 | ) | | | 173,397,626 | | | | 215,126 | | | | 173,397,626 | | |
Abbreviation Legend
ADR American Depositary Receipt
Fair Value Measurements
The Fund categorizes its fair value measurements according to a three-level hierarchy that maximizes the use of observable inputs and minimizes the use of unobservable inputs by prioritizing that the most observable input be used when available. Observable inputs are those that market participants would use in pricing an investment based on market data obtained from sources independent of the reporting entity. Unobservable inputs are those that reflect the Fund's assumptions about the information market participants would use in pricing an
The accompanying Notes to Financial Statements are an integral part of this statement.
Annual Report 2015
11
COLUMBIA DIVIDEND INCOME FUND
PORTFOLIO OF INVESTMENTS (continued)
May 31, 2015
Fair Value Measurements (continued)
investment. An investment's level within the fair value hierarchy is based on the lowest level of any input that is deemed significant to the asset or liability's fair value measurement. The input levels are not necessarily an indication of the risk or liquidity associated with investments at that level. For example, certain U.S. government securities are generally high quality and liquid, however, they are reflected as Level 2 because the inputs used to determine fair value may not always be quoted prices in an active market.
Fair value inputs are summarized in the three broad levels listed below:
> Level 1 — Valuations based on quoted prices for investments in active markets that the Fund has the ability to access at the measurement date (including NAV for open-end mutual funds). Valuation adjustments are not applied to Level 1 investments.
> Level 2 — Valuations based on other significant observable inputs (including quoted prices for similar securities, interest rates, prepayment speeds, credit risks, etc.).
> Level 3 — Valuations based on significant unobservable inputs (including the Fund's own assumptions and judgment in determining the fair value of investments).
Inputs that are used in determining fair value of an investment may include price information, credit data, volatility statistics, and other factors. These inputs can be either observable or unobservable. The availability of observable inputs can vary between investments, and is affected by various factors such as the type of investment, and the volume and level of activity for that investment or similar investments in the marketplace. The inputs will be considered by the Investment Manager, along with any other relevant factors in the calculation of an investment's fair value. The Fund uses prices and inputs that are current as of the measurement date, which may include periods of market dislocations. During these periods, the availability of prices and inputs may be reduced for many investments. This condition could cause an investment to be reclassified between the various levels within the hierarchy.
Investments falling into the Level 3 category are primarily supported by quoted prices from brokers and dealers participating in the market for those investments. However, these may be classified as Level 3 investments due to lack of market transparency and corroboration to support these quoted prices. Additionally, valuation models may be used as the pricing source for any remaining investments classified as Level 3. These models may rely on one or more significant unobservable inputs and/or significant assumptions by the Investment Manager. Inputs used in valuations may include, but are not limited to, financial statement analysis, capital account balances, discount rates and estimated cash flows, and comparable company data.
Under the direction of the Fund's Board of Trustees (the Board), the Investment Manager's Valuation Committee (the Committee) is responsible for overseeing the valuation procedures approved by the Board. The Committee consists of voting and non-voting members from various groups within the Investment Manager's organization, including operations and accounting, trading and investments, compliance, risk management and legal.
The Committee meets at least monthly to review and approve valuation matters, which may include a description of specific valuation determinations, data regarding pricing information received from approved pricing vendors and brokers and the results of Board-approved valuation control policies and procedures (the Policies). The Policies address, among other things, instances when market quotations are or are not readily available, including recommendations of third party pricing vendors and a determination of appropriate pricing methodologies; events that require specific valuation determinations and assessment of fair value techniques; securities with a potential for stale pricing, including those that are illiquid, restricted, or in default; and the effectiveness of third party pricing vendors, including periodic reviews of vendors. The Committee meets more frequently, as needed, to discuss additional valuation matters, which may include the need to review back-testing results, review time-sensitive information or approve related valuation actions. The Committee reports to the Board, with members of the Committee meeting with the Board at each of its regularly scheduled meetings to discuss valuation matters and actions during the period, similar to those described earlier.
For investments categorized as Level 3, the Committee monitors information similar to that described above, which may include: (i) data specific to the issuer or comparable issuers, (ii) general market or specific sector news and (iii) quoted prices and specific or similar security transactions. The Committee considers this data and any changes from prior periods in order to assess the reasonableness of observable and unobservable inputs, any assumptions or internal models used to value those securities and changes in fair value. This data is also used to corroborate, when available, information received from approved pricing vendors and brokers. Various factors impact the frequency of monitoring this information (which may occur as often as daily). However, the Committee may determine that changes to inputs, assumptions and models are not required as a result of the monitoring procedures performed.
The accompanying Notes to Financial Statements are an integral part of this statement.
Annual Report 2015
12
COLUMBIA DIVIDEND INCOME FUND
PORTFOLIO OF INVESTMENTS (continued)
May 31, 2015
Fair Value Measurements (continued)
The following table is a summary of the inputs used to value the Fund's investments at May 31, 2015:
| | | Level 1
Quoted Prices in Active
Markets for Identical
Assets ($) | | Level 2
Other Significant
Observable Inputs ($) | | Level 3
Significant
Unobservable Inputs ($) | | Total ($) | |
Investments | |
Common Stocks | |
Consumer Discretionary | | | 797,135,530 | | | | — | | | | — | | | | 797,135,530 | | |
Consumer Staples | | | 1,097,013,224 | | | | — | | | | — | | | | 1,097,013,224 | | |
Energy | | | 760,975,287 | | | | — | | | | — | | | | 760,975,287 | | |
Financials | | | 1,659,964,398 | | | | — | | | | — | | | | 1,659,964,398 | | |
Health Care | | | 1,163,743,845 | | | | — | | | | — | | | | 1,163,743,845 | | |
Industrials | | | 1,121,596,443 | | | | — | | | | — | | | | 1,121,596,443 | | |
Information Technology | | | 1,208,629,258 | | | | — | | | | — | | | | 1,208,629,258 | | |
Materials | | | 278,644,317 | | | | — | | | | — | | | | 278,644,317 | | |
Telecommunication Services | | | 200,232,000 | | | | — | | | | — | | | | 200,232,000 | | |
Utilities | | | 399,061,672 | | | | — | | | | — | | | | 399,061,672 | | |
Total Common Stocks | | | 8,686,995,974 | | | | — | | | | — | | | | 8,686,995,974 | | |
Exchange-Traded Funds | | | 152,013,600 | | | | — | | | | — | | | | 152,013,600 | | |
Money Market Funds | | | 173,397,626 | | | | — | | | | — | | | | 173,397,626 | | |
Total Investments | | | 9,012,407,200 | | | | — | | | | — | | | | 9,012,407,200 | | |
See the Portfolio of Investments for all investment classifications not indicated in the table.
There were no transfers of financial assets between levels during the period.
The accompanying Notes to Financial Statements are an integral part of this statement.
Annual Report 2015
13
COLUMBIA DIVIDEND INCOME FUND
STATEMENT OF ASSETS AND LIABILITIES
May 31, 2015
Assets | |
Investments, at value | |
Unaffiliated issuers (identified cost $6,190,936,183) | | $ | 8,839,009,574 | | |
Affiliated issuers (identified cost $173,397,626) | | | 173,397,626 | | |
Total investments (identified cost $6,364,333,809) | | | 9,012,407,200 | | |
Receivable for: | |
Investments sold | | | 31,702,173 | | |
Capital shares sold | | | 5,243,578 | | |
Dividends | | | 24,163,712 | | |
Foreign tax reclaims | | | 587,760 | | |
Prepaid expenses | | | 10,052 | | |
Trustees' deferred compensation plan | | | 201,842 | | |
Total assets | | | 9,074,316,317 | | |
Liabilities | |
Payable for: | |
Capital shares purchased | | | 9,467,126 | | |
Investment management fees | | | 130,464 | | |
Distribution and/or service fees | | | 37,749 | | |
Transfer agent fees | | | 1,785,274 | | |
Administration fees | | | 11,023 | | |
Compensation of board members | | | 10,383 | | |
Chief compliance officer expenses | | | 757 | | |
Other expenses | | | 203,824 | | |
Trustees' deferred compensation plan | | | 201,842 | | |
Total liabilities | | | 11,848,442 | | |
Net assets applicable to outstanding capital stock | | $ | 9,062,467,875 | | |
Represented by | |
Paid-in capital | | $ | 5,970,346,715 | | |
Undistributed net investment income | | | 83,763,862 | | |
Accumulated net realized gain | | | 360,283,907 | | |
Unrealized appreciation (depreciation) on: | |
Investments | | | 2,648,073,391 | | |
Total — representing net assets applicable to outstanding capital stock | | $ | 9,062,467,875 | | |
The accompanying Notes to Financial Statements are an integral part of this statement.
Annual Report 2015
14
COLUMBIA DIVIDEND INCOME FUND
STATEMENT OF ASSETS AND LIABILITIES (continued)
May 31, 2015
Class A | |
Net assets | | $ | 2,514,421,528 | | |
Shares outstanding | | | 131,870,801 | | |
Net asset value per share | | $ | 19.07 | | |
Maximum offering price per share(a) | | $ | 20.23 | | |
Class B | |
Net assets | | $ | 8,423,356 | | |
Shares outstanding | | | 454,048 | | |
Net asset value per share | | $ | 18.55 | | |
Class C | |
Net assets | | $ | 667,299,637 | | |
Shares outstanding | | | 35,990,201 | | |
Net asset value per share | | $ | 18.54 | | |
Class I | |
Net assets | | $ | 238,825,064 | | |
Shares outstanding | | | 12,497,330 | | |
Net asset value per share | | $ | 19.11 | | |
Class R | |
Net assets | | $ | 87,646,139 | | |
Shares outstanding | | | 4,595,895 | | |
Net asset value per share | | $ | 19.07 | | |
Class R4 | |
Net assets | | $ | 179,306,102 | | |
Shares outstanding | | | 9,270,541 | | |
Net asset value per share | | $ | 19.34 | | |
Class R5 | |
Net assets | | $ | 313,051,319 | | |
Shares outstanding | | | 16,191,672 | | |
Net asset value per share | | $ | 19.33 | | |
Class T | |
Net assets | | $ | 81,205,945 | | |
Shares outstanding | | | 4,257,606 | | |
Net asset value per share | | $ | 19.07 | | |
Maximum offering price per share(a) | | $ | 20.23 | | |
Class W | |
Net assets | | $ | 163,947 | | |
Shares outstanding | | | 8,602 | | |
Net asset value per share | | $ | 19.06 | | |
Class Y | |
Net assets | | $ | 171,392,250 | | |
Shares outstanding | | | 8,857,487 | | |
Net asset value per share | | $ | 19.35 | | |
The accompanying Notes to Financial Statements are an integral part of this statement.
Annual Report 2015
15
COLUMBIA DIVIDEND INCOME FUND
STATEMENT OF ASSETS AND LIABILITIES (continued)
May 31, 2015
Class Z | |
Net assets | | $ | 4,800,732,588 | | |
Shares outstanding | | | 251,528,956 | | |
Net asset value per share | | $ | 19.09 | | |
(a) The maximum offering price per share is calculated by dividing the net asset value per share by 1.0 minus the maximum sales charge of 5.75%.
The accompanying Notes to Financial Statements are an integral part of this statement.
Annual Report 2015
16
COLUMBIA DIVIDEND INCOME FUND
STATEMENT OF OPERATIONS
Year Ended May 31, 2015
Net investment income | |
Income: | |
Dividends — unaffiliated issuers | | $ | 323,575,708 | | |
Dividends — affiliated issuers | | | 215,126 | | |
Foreign taxes withheld | | | (1,463,037 | ) | |
Total income | | | 322,327,797 | | |
Expenses: | |
Investment management fees | | | 47,320,865 | | |
Distribution and/or service fees | |
Class A | | | 6,386,663 | | |
Class B | | | 109,824 | | |
Class C | | | 6,345,249 | | |
Class R | | | 442,376 | | |
Class T | | | 225,282 | | |
Class W | | | 443 | | |
Transfer agent fees | |
Class A | | | 4,835,828 | | |
Class B | | | 20,725 | | |
Class C | | | 1,202,548 | | |
Class R | | | 167,499 | | |
Class R4 | | | 292,639 | | |
Class R5 | | | 118,015 | | |
Class T | | | 159,603 | | |
Class W | | | 336 | | |
Class Z | | | 9,399,289 | | |
Administration fees | | | 3,998,779 | | |
Compensation of board members | | | 216,383 | | |
Custodian fees | | | 53,465 | | |
Printing and postage fees | | | 346,618 | | |
Registration fees | | | 256,929 | | |
Professional fees | | | 281,118 | | |
Chief compliance officer expenses | | | 4,586 | | |
Other | | | 319,874 | | |
Total expenses | | | 82,504,936 | | |
Expense reductions | | | (5,416 | ) | |
Total net expenses | | | 82,499,520 | | |
Net investment income | | | 239,828,277 | | |
Realized and unrealized gain (loss) — net | |
Net realized gain (loss) on: | |
Investments | | | 651,310,209 | | |
Net realized gain | | | 651,310,209 | | |
Net change in unrealized appreciation (depreciation) on: | |
Investments | | | (90,555,502 | ) | |
Net change in unrealized depreciation | | | (90,555,502 | ) | |
Net realized and unrealized gain | | | 560,754,707 | | |
Net increase in net assets resulting from operations | | $ | 800,582,984 | | |
The accompanying Notes to Financial Statements are an integral part of this statement.
Annual Report 2015
17
COLUMBIA DIVIDEND INCOME FUND
STATEMENT OF CHANGES IN NET ASSETS
| | | Year Ended
May 31, 2015 | | Year Ended
May 31, 2014 | |
Operations | |
Net investment income | | $ | 239,828,277 | | | $ | 182,344,261 | | |
Net realized gain | | | 651,310,209 | | | | 380,405,883 | | |
Net change in unrealized appreciation (depreciation) | | | (90,555,502 | ) | | | 701,650,579 | | |
Net increase in net assets resulting from operations | | | 800,582,984 | | | | 1,264,400,723 | | |
Distributions to shareholders | |
Net investment income | |
Class A | | | (52,103,253 | ) | | | (48,774,426 | ) | |
Class B | | | (146,007 | ) | | | (163,709 | ) | |
Class C | | | (8,413,803 | ) | | | (6,162,553 | ) | |
Class I | | | (5,374,544 | ) | | | (6,727,718 | ) | |
Class R | | | (1,578,399 | ) | | | (1,296,709 | ) | |
Class R4 | | | (3,402,520 | ) | | | (1,589,980 | ) | |
Class R5 | | | (5,457,400 | ) | | | (2,521,637 | ) | |
Class T | | | (1,686,034 | ) | | | (1,525,087 | ) | |
Class W | | | (3,667 | ) | | | (60,409 | ) | |
Class Y | | | (2,567,649 | ) | | | (918,221 | ) | |
Class Z | | | (113,681,632 | ) | | | (104,137,594 | ) | |
Net realized gains | |
Class A | | | (154,661,995 | ) | | | (36,631,156 | ) | |
Class B | | | (666,882 | ) | | | (197,597 | ) | |
Class C | | | (39,573,416 | ) | | | (7,635,089 | ) | |
Class I | | | (14,365,670 | ) | | | (4,234,144 | ) | |
Class R | | | (5,290,557 | ) | | | (1,091,386 | ) | |
Class R4 | | | (9,059,406 | ) | | | (1,296,331 | ) | |
Class R5 | | | (14,959,685 | ) | | | (1,582,324 | ) | |
Class T | | | (5,112,385 | ) | | | (1,131,873 | ) | |
Class W | | | (10,578 | ) | | | (4,208 | ) | |
Class Y | | | (6,207,198 | ) | | | (870,609 | ) | |
Class Z | | | (304,390,865 | ) | | | (67,557,777 | ) | |
Total distributions to shareholders | | | (748,713,545 | ) | | | (296,110,537 | ) | |
Increase (decrease) in net assets from capital stock activity | | | 11,393,180 | | | | (399,830,870 | ) | |
Total increase in net assets | | | 63,262,619 | | | | 568,459,316 | | |
Net assets at beginning of year | | | 8,999,205,256 | | | | 8,430,745,940 | | |
Net assets at end of year | | $ | 9,062,467,875 | | | $ | 8,999,205,256 | | |
Undistributed net investment income | | $ | 83,763,862 | | | $ | 38,551,721 | | |
The accompanying Notes to Financial Statements are an integral part of this statement.
Annual Report 2015
18
COLUMBIA DIVIDEND INCOME FUND
STATEMENT OF CHANGES IN NET ASSETS (continued)
| | | Year Ended May 31, 2015 | | Year Ended May 31, 2014 | |
| | | Shares | | Dollars ($) | | Shares | | Dollars ($) | |
Capital stock activity | |
Class A shares | |
Subscriptions(a) | | | 26,269,621 | | | | 505,942,202 | | | | 36,055,778 | | | | 636,504,270 | | |
Distributions reinvested | | | 10,331,773 | | | | 190,253,019 | | | | 4,496,666 | | | | 78,829,571 | | |
Redemptions | | | (39,187,240 | ) | | | (752,695,905 | ) | | | (53,787,698 | ) | | | (962,833,781 | ) | |
Net decrease | | | (2,585,846 | ) | | | (56,500,684 | ) | | | (13,235,254 | ) | | | (247,499,940 | ) | |
Class B shares | |
Subscriptions | | | 21,032 | | | | 387,751 | | | | 89,255 | | | | 1,522,927 | | |
Distributions reinvested | | | 36,713 | | | | 657,089 | | | | 16,521 | | | | 283,289 | | |
Redemptions(a) | | | (299,285 | ) | | | (5,597,532 | ) | | | (313,940 | ) | | | (5,463,321 | ) | |
Net decrease | | | (241,540 | ) | | | (4,552,692 | ) | | | (208,164 | ) | | | (3,657,105 | ) | |
Class C shares | |
Subscriptions | | | 6,002,211 | | | | 111,952,235 | | | | 8,354,924 | | | | 143,831,392 | | |
Distributions reinvested | | | 2,170,132 | | | | 38,808,347 | | | | 641,692 | | | | 11,021,164 | | |
Redemptions | | | (4,643,608 | ) | | | (86,713,441 | ) | | | (4,202,097 | ) | | | (73,154,169 | ) | |
Net increase | | | 3,528,735 | | | | 64,047,141 | | | | 4,794,519 | | | | 81,698,387 | | |
Class I shares | |
Subscriptions | | | 5,594,689 | | | | 106,474,361 | | | | 9,631,223 | | | | 169,505,506 | | |
Distributions reinvested | | | 1,070,164 | | | | 19,739,985 | | | | 628,117 | | | | 10,961,728 | | |
Redemptions | | | (6,427,941 | ) | | | (125,559,466 | ) | | | (16,758,388 | ) | | | (298,440,368 | ) | |
Net increase (decrease) | | | 236,912 | | | | 654,880 | | | | (6,499,048 | ) | | | (117,973,134 | ) | |
Class R shares | |
Subscriptions | | | 1,140,625 | | | | 21,963,890 | | | | 1,436,715 | | | | 25,425,514 | | |
Distributions reinvested | | | 330,558 | | | | 6,085,152 | | | | 116,051 | | | | 2,041,163 | | |
Redemptions | | | (1,471,139 | ) | | | (28,422,039 | ) | | | (1,236,288 | ) | | | (22,071,238 | ) | |
Net increase | | | 44 | | | | (372,997 | ) | | | 316,478 | | | | 5,395,439 | | |
Class R4 shares | |
Subscriptions | | | 5,530,539 | | | | 107,109,793 | | | | 5,872,195 | | | | 106,859,442 | | |
Distributions reinvested | | | 613,952 | | | | 11,465,118 | | | | 158,177 | | | | 2,829,629 | | |
Redemptions | | | (3,272,567 | ) | | | (63,374,156 | ) | | | (1,795,401 | ) | | | (32,248,824 | ) | |
Net increase | | | 2,871,924 | | | | 55,200,755 | | | | 4,234,971 | | | | 77,440,247 | | |
Class R5 shares | |
Subscriptions | | | 10,412,190 | | | | 200,727,748 | | | | 5,721,692 | | | | 102,523,878 | | |
Distributions reinvested | | | 1,070,135 | | | | 19,961,094 | | | | 219,606 | | | | 3,916,104 | | |
Redemptions | | | (3,417,656 | ) | | | (65,975,002 | ) | | | (1,578,647 | ) | | | (28,835,154 | ) | |
Net increase | | | 8,064,669 | | | | 154,713,840 | | | | 4,362,651 | | | | 77,604,828 | | |
The accompanying Notes to Financial Statements are an integral part of this statement.
Annual Report 2015
19
COLUMBIA DIVIDEND INCOME FUND
STATEMENT OF CHANGES IN NET ASSETS (continued)
| | | Year Ended May 31, 2015 | | Year Ended May 31, 2014 | |
| | | Shares | | Dollars ($) | | Shares | | Dollars ($) | |
Capital stock activity (continued) | |
Class T shares | |
Subscriptions | | | 66,333 | | | | 1,232,587 | | | | 45,786 | | | | 809,219 | | |
Distributions reinvested | | | 301,380 | | | | 5,551,683 | | | | 124,591 | | | | 2,185,641 | | |
Redemptions | | | (606,677 | ) | | | (11,668,345 | ) | | | (619,844 | ) | | | (11,017,024 | ) | |
Net decrease | | | (238,964 | ) | | | (4,884,075 | ) | | | (449,467 | ) | | | (8,022,164 | ) | |
Class W shares | |
Subscriptions | | | — | | | | — | | | | 113,460 | | | | 1,959,011 | | |
Distributions reinvested | | | 762 | | | | 14,026 | | | | 3,839 | | | | 64,498 | | |
Redemptions | | | (2,314 | ) | | | (44,286 | ) | | | (656,856 | ) | | | (11,525,403 | ) | |
Net decrease | | | (1,552 | ) | | | (30,260 | ) | | | (539,557 | ) | | | (9,501,894 | ) | |
Class Y shares | |
Subscriptions | | | 7,596,631 | | | | 146,686,169 | | | | 4,491,964 | | | | 80,781,456 | | |
Distributions reinvested | | | 469,395 | | | | 8,774,622 | | | | 99,355 | | | | 1,788,719 | | |
Redemptions | | | (3,290,753 | ) | | | (63,347,250 | ) | | | (578,024 | ) | | | (10,515,348 | ) | |
Net increase | | | 4,775,273 | | | | 92,113,541 | | | | 4,013,295 | | | | 72,054,827 | | |
Class Z shares | |
Subscriptions | | | 38,193,664 | | | | 733,215,171 | | | | 46,759,781 | | | | 827,016,801 | | |
Distributions reinvested | | | 11,487,818 | | | | 211,842,271 | | | | 5,022,547 | | | | 88,070,335 | | |
Redemptions | | | (64,156,290 | ) | | | (1,234,053,711 | ) | | | (69,756,764 | ) | | | (1,242,457,497 | ) | |
Net decrease | | | (14,474,808 | ) | | | (288,996,269 | ) | | | (17,974,436 | ) | | | (327,370,361 | ) | |
Total net increase (decrease) | | | 1,934,847 | | | | 11,393,180 | | | | (21,184,012 | ) | | | (399,830,870 | ) | |
(a) Includes conversions of Class B shares to Class A shares, if any.
The accompanying Notes to Financial Statements are an integral part of this statement.
Annual Report 2015
20
COLUMBIA DIVIDEND INCOME FUND
The following tables are intended to help you understand the Fund's financial performance. Certain information reflects financial results for a single share of a class held for the periods shown. Per share net investment income (loss) amounts are calculated based on average shares outstanding during the period. Total return assumes reinvestment of all dividends and distributions, if any. Total return does not reflect payment of sales charges, if any. Total return and portfolio turnover are not annualized for periods of less than one year. The portfolio turnover rate is calculated without regard to purchase and sales transactions of short-term instruments and certain derivatives, if any. If such transactions were included, the Fund's portfolio turnover rate may be higher.
| | | Year Ended May 31, | | Year Ended
September 30, | |
Class A | | 2015 | | 2014 | | 2013 | | 2012(a) | | 2011 | | 2010 | |
Per share data | |
Net asset value, beginning of period | | $ | 19.02 | | | $ | 17.05 | | | $ | 13.96 | | | $ | 12.16 | | | $ | 12.12 | | | $ | 11.18 | | |
Income from investment operations: | |
Net investment income | | | 0.48 | | | | 0.35 | | | | 0.34 | | | | 0.25 | | | | 0.29 | | | | 0.28 | | |
Net realized and unrealized gain | | | 1.17 | | | | 2.20 | | | | 3.09 | | | | 1.73 | | | | 0.03 | (b) | | | 0.94 | | |
Total from investment operations | | | 1.65 | | | | 2.55 | | | | 3.43 | | | | 1.98 | | | | 0.32 | | | | 1.22 | | |
Less distributions to shareholders: | |
Net investment income | | | (0.40 | ) | | | (0.34 | ) | | | (0.34 | ) | | | (0.18 | ) | | | (0.28 | ) | | | (0.28 | ) | |
Net realized gains | | | (1.20 | ) | | | (0.24 | ) | | | — | | | | — | | | | — | | | | — | | |
Total distributions to shareholders | | | (1.60 | ) | | | (0.58 | ) | | | (0.34 | ) | | | (0.18 | ) | | | (0.28 | ) | | | (0.28 | ) | |
Net asset value, end of period | | $ | 19.07 | | | $ | 19.02 | | | $ | 17.05 | | | $ | 13.96 | | | $ | 12.16 | | | $ | 12.12 | | |
Total return | | | 9.08 | % | | | 15.25 | % | | | 24.91 | % | | | 16.26 | % | | | 2.56 | % | | | 11.02 | % | |
Ratios to average net assets(c) | |
Total gross expenses | | | 1.02 | % | | | 1.02 | % | | | 1.04 | % | | | 1.06 | %(d) | | | 1.09 | % | | | 1.07 | % | |
Total net expenses(e) | | | 1.02 | %(f) | | | 1.02 | %(f) | | | 1.03 | %(f) | | | 1.00 | %(d) | | | 1.03 | %(f) | | | 1.05 | %(f) | |
Net investment income | | | 2.52 | % | | | 1.96 | % | | | 2.20 | % | | | 2.71 | %(d) | | | 2.23 | % | | | 2.41 | % | |
Supplemental data | |
Net assets, end of period (in thousands) | | $ | 2,514,422 | | | $ | 2,556,782 | | | $ | 2,518,406 | | | $ | 1,729,495 | | | $ | 1,103,389 | | | $ | 728,219 | | |
Portfolio turnover | | | 27 | % | | | 19 | % | | | 24 | % | | | 23 | % | | | 20 | % | | | 17 | % | |
Notes to Financial Highlights
(a) For the period from October 1, 2011 to May 31, 2012. During the period, the Fund's fiscal year end was changed from September 30 to May 31.
(b) Calculation of the net gain (loss) per share (both realized and unrealized) does not correlate to the aggregate realized and unrealized gain (loss) presented in the Statement of Operations due to the timing of subscriptions and redemptions of Fund shares in relation to fluctuations in the market value of the portfolio.
(c) In addition to the fees and expenses that the Fund bears directly, the Fund indirectly bears a pro rata share of the fees and expenses of any other funds in which it invests. Such indirect expenses are not included in the Fund's reported expense ratios.
(d) Annualized.
(e) Total net expenses include the impact of certain fee waivers/expense reimbursements made by the Investment Manager and certain of its affiliates, if applicable.
(f) The benefits derived from expense reductions had an impact of less than 0.01%.
The accompanying Notes to Financial Statements are an integral part of this statement.
Annual Report 2015
21
COLUMBIA DIVIDEND INCOME FUND
FINANCIAL HIGHLIGHTS (continued)
| | | Year Ended May 31, | | Year Ended
September 30, | |
Class B | | 2015 | | 2014 | | 2013 | | 2012(a) | | 2011 | | 2010 | |
Per share data | |
Net asset value, beginning of period | | $ | 18.54 | | | $ | 16.64 | | | $ | 13.63 | | | $ | 11.89 | | | $ | 11.86 | | | $ | 10.94 | | |
Income from investment operations: | |
Net investment income | | | 0.30 | | | | 0.21 | | | | 0.22 | | | | 0.18 | | | | 0.19 | | | | 0.19 | | |
Net realized and unrealized gain | | | 1.16 | | | | 2.14 | | | | 3.02 | | | | 1.69 | | | | 0.03 | (b) | | | 0.93 | | |
Total from investment operations | | | 1.46 | | | | 2.35 | | | | 3.24 | | | | 1.87 | | | | 0.22 | | | | 1.12 | | |
Less distributions to shareholders: | |
Net investment income | | | (0.25 | ) | | | (0.21 | ) | | | (0.23 | ) | | | (0.13 | ) | | | (0.19 | ) | | | (0.20 | ) | |
Net realized gains | | | (1.20 | ) | | | (0.24 | ) | | | — | | | | — | | | | — | | | | — | | |
Total distributions to shareholders | | | (1.45 | ) | | | (0.45 | ) | | | (0.23 | ) | | | (0.13 | ) | | | (0.19 | ) | | | (0.20 | ) | |
Net asset value, end of period | | $ | 18.55 | | | $ | 18.54 | | | $ | 16.64 | | | $ | 13.63 | | | $ | 11.89 | | | $ | 11.86 | | |
Total return | | | 8.26 | % | | | 14.33 | % | | | 23.99 | % | | | 15.69 | % | | | 1.74 | % | | | 10.24 | % | |
Ratios to average net assets(c) | |
Total gross expenses | | | 1.77 | % | | | 1.77 | % | | | 1.79 | % | | | 1.81 | %(d) | | | 1.85 | % | | | 1.82 | % | |
Total net expenses(e) | | | 1.77 | %(f) | | | 1.77 | %(f) | | | 1.77 | %(f) | | | 1.75 | %(d) | | | 1.79 | %(f) | | | 1.80 | %(f) | |
Net investment income | | | 1.60 | % | | | 1.22 | % | | | 1.47 | % | | | 1.96 | %(d) | | | 1.48 | % | | | 1.67 | % | |
Supplemental data | |
Net assets, end of period (in thousands) | | $ | 8,423 | | | $ | 12,896 | | | $ | 15,034 | | | $ | 15,095 | | | $ | 15,659 | | | $ | 21,126 | | |
Portfolio turnover | | | 27 | % | | | 19 | % | | | 24 | % | | | 23 | % | | | 20 | % | | | 17 | % | |
Notes to Financial Highlights
(a) For the period from October 1, 2011 to May 31, 2012. During the period, the Fund's fiscal year end was changed from September 30 to May 31.
(b) Calculation of the net gain (loss) per share (both realized and unrealized) does not correlate to the aggregate realized and unrealized gain (loss) presented in the Statement of Operations due to the timing of subscriptions and redemptions of Fund shares in relation to fluctuations in the market value of the portfolio.
(c) In addition to the fees and expenses that the Fund bears directly, the Fund indirectly bears a pro rata share of the fees and expenses of any other funds in which it invests. Such indirect expenses are not included in the Fund's reported expense ratios.
(d) Annualized.
(e) Total net expenses include the impact of certain fee waivers/expense reimbursements made by the Investment Manager and certain of its affiliates, if applicable.
(f) The benefits derived from expense reductions had an impact of less than 0.01%.
The accompanying Notes to Financial Statements are an integral part of this statement.
Annual Report 2015
22
COLUMBIA DIVIDEND INCOME FUND
FINANCIAL HIGHLIGHTS (continued)
| | | Year Ended May 31, | | Year Ended
September 30, | |
Class C | | 2015 | | 2014 | | 2013 | | 2012(a) | | 2011 | | 2010 | |
Per share data | |
Net asset value, beginning of period | | $ | 18.53 | | | $ | 16.63 | | | $ | 13.62 | | | $ | 11.88 | | | $ | 11.85 | | | $ | 10.93 | | |
Income from investment operations: | |
Net investment income | | | 0.34 | | | | 0.21 | | | | 0.22 | | | | 0.18 | | | | 0.19 | | | | 0.19 | | |
Net realized and unrealized gain | | | 1.12 | | | | 2.13 | | | | 3.02 | | | | 1.69 | | | | 0.03 | (b) | | | 0.93 | | |
Total from investment operations | | | 1.46 | | | | 2.34 | | | | 3.24 | | | | 1.87 | | | | 0.22 | | | | 1.12 | | |
Less distributions to shareholders: | |
Net investment income | | | (0.25 | ) | | | (0.20 | ) | | | (0.23 | ) | | | (0.13 | ) | | | (0.19 | ) | | | (0.20 | ) | |
Net realized gains | | | (1.20 | ) | | | (0.24 | ) | | | — | | | | — | | | | — | | | | — | | |
Total distributions to shareholders | | | (1.45 | ) | | | (0.44 | ) | | | (0.23 | ) | | | (0.13 | ) | | | (0.19 | ) | | | (0.20 | ) | |
Net asset value, end of period | | $ | 18.54 | | | $ | 18.53 | | | $ | 16.63 | | | $ | 13.62 | | | $ | 11.88 | | | $ | 11.85 | | |
Total return | | | 8.26 | % | | | 14.33 | % | | | 24.00 | % | | | 15.71 | % | | | 1.74 | % | | | 10.25 | % | |
Ratios to average net assets(c) | |
Total gross expenses | | | 1.77 | % | | | 1.77 | % | | | 1.79 | % | | | 1.81 | %(d) | | | 1.84 | % | | | 1.82 | % | |
Total net expenses(e) | | | 1.77 | %(f) | | | 1.77 | %(f) | | | 1.78 | %(f) | | | 1.75 | %(d) | | | 1.78 | %(f) | | | 1.80 | %(f) | |
Net investment income | | | 1.83 | % | | | 1.24 | % | | | 1.45 | % | | | 1.96 | %(d) | | | 1.49 | % | | | 1.66 | % | |
Supplemental data | |
Net assets, end of period (in thousands) | | $ | 667,300 | | | $ | 601,468 | | | $ | 459,966 | | | $ | 279,093 | | | $ | 181,875 | | | $ | 94,091 | | |
Portfolio turnover | | | 27 | % | | | 19 | % | | | 24 | % | | | 23 | % | | | 20 | % | | | 17 | % | |
Notes to Financial Highlights
(a) For the period from October 1, 2011 to May 31, 2012. During the period, the Fund's fiscal year end was changed from September 30 to May 31.
(b) Calculation of the net gain (loss) per share (both realized and unrealized) does not correlate to the aggregate realized and unrealized gain (loss) presented in the Statement of Operations due to the timing of subscriptions and redemptions of Fund shares in relation to fluctuations in the market value of the portfolio.
(c) In addition to the fees and expenses that the Fund bears directly, the Fund indirectly bears a pro rata share of the fees and expenses of any other funds in which it invests. Such indirect expenses are not included in the Fund's reported expense ratios.
(d) Annualized.
(e) Total net expenses include the impact of certain fee waivers/expense reimbursements made by the Investment Manager and certain of its affiliates, if applicable.
(f) The benefits derived from expense reductions had an impact of less than 0.01%.
The accompanying Notes to Financial Statements are an integral part of this statement.
Annual Report 2015
23
COLUMBIA DIVIDEND INCOME FUND
FINANCIAL HIGHLIGHTS (continued)
| | | Year Ended May 31, | | Year Ended
September 30, | |
Class I | | 2015 | | 2014 | | 2013 | | 2012(a) | | 2011 | | 2010(b) | |
Per share data | |
Net asset value, beginning of period | | $ | 19.06 | | | $ | 17.09 | | | $ | 13.99 | | | $ | 12.18 | | | $ | 12.13 | | | $ | 12.14 | | |
Income from investment operations: | |
Net investment income | | | 0.58 | | | | 0.42 | | | | 0.41 | | | | 0.28 | | | | 0.35 | | | | 0.01 | | |
Net realized and unrealized gain (loss) | | | 1.15 | | | | 2.20 | | | | 3.09 | | | | 1.73 | | | | 0.03 | (c) | | | (0.02 | ) | |
Total from investment operations | | | 1.73 | | | | 2.62 | | | | 3.50 | | | | 2.01 | | | | 0.38 | | | | (0.01 | ) | |
Less distributions to shareholders: | |
Net investment income | | | (0.48 | ) | | | (0.41 | ) | | | (0.40 | ) | | | (0.20 | ) | | | (0.33 | ) | | | — | | |
Net realized gains | | | (1.20 | ) | | | (0.24 | ) | | | — | | | | — | | | | — | | | | — | | |
Total distributions to shareholders | | | (1.68 | ) | | | (0.65 | ) | | | (0.40 | ) | | | (0.20 | ) | | | (0.33 | ) | | | — | | |
Net asset value, end of period | | $ | 19.11 | | | $ | 19.06 | | | $ | 17.09 | | | $ | 13.99 | | | $ | 12.18 | | | $ | 12.13 | | |
Total return | | | 9.54 | % | | | 15.72 | % | | | 25.42 | % | | | 16.53 | % | | | 3.02 | % | | | (0.08 | %) | |
Ratios to average net assets(d) | |
Total gross expenses | | | 0.58 | % | | | 0.58 | % | | | 0.60 | % | | | 0.63 | %(e) | | | 0.67 | % | | | 0.71 | %(e) | |
Total net expenses(f) | | | 0.58 | % | | | 0.58 | % | | | 0.60 | % | | | 0.63 | %(e) | | | 0.67 | %(g) | | | 0.71 | %(e)(g) | |
Net investment income | | | 3.04 | % | | | 2.35 | % | | | 2.64 | % | | | 3.08 | %(e) | | | 2.62 | % | | | 8.17 | %(e) | |
Supplemental data | |
Net assets, end of period (in thousands) | | $ | 238,825 | | | $ | 233,626 | | | $ | 320,524 | | | $ | 271,694 | | | $ | 249,778 | | | $ | 2 | | |
Portfolio turnover | | | 27 | % | | | 19 | % | | | 24 | % | | | 23 | % | | | 20 | % | | | 17 | % | |
Notes to Financial Highlights
(a) For the period from October 1, 2011 to May 31, 2012. During the period, the Fund's fiscal year end was changed from September 30 to May 31.
(b) Based on operations from September 27, 2010 (commencement of operations) through the stated period end.
(c) Calculation of the net gain (loss) per share (both realized and unrealized) does not correlate to the aggregate realized and unrealized gain (loss) presented in the Statement of Operations due to the timing of subscriptions and redemptions of Fund shares in relation to fluctuations in the market value of the portfolio.
(d) In addition to the fees and expenses that the Fund bears directly, the Fund indirectly bears a pro rata share of the fees and expenses of any other funds in which it invests. Such indirect expenses are not included in the Fund's reported expense ratios.
(e) Annualized.
(f) Total net expenses include the impact of certain fee waivers/expense reimbursements made by the Investment Manager and certain of its affiliates, if applicable.
(g) The benefits derived from expense reductions had an impact of less than 0.01%.
The accompanying Notes to Financial Statements are an integral part of this statement.
Annual Report 2015
24
COLUMBIA DIVIDEND INCOME FUND
FINANCIAL HIGHLIGHTS (continued)
| | | Year Ended May 31, | | Year Ended
September 30, | |
Class R | | 2015 | | 2014 | | 2013 | | 2012(a) | | 2011 | | 2010 | |
Per share data | |
Net asset value, beginning of period | | $ | 19.02 | | | $ | 17.05 | | | $ | 13.96 | | | $ | 12.17 | | | $ | 12.13 | | | $ | 11.18 | | |
Income from investment operations: | |
Net investment income | | | 0.44 | | | | 0.31 | | | | 0.30 | | | | 0.23 | | | | 0.26 | | | | 0.27 | | |
Net realized and unrealized gain | | | 1.16 | | | | 2.19 | | | | 3.09 | | | | 1.72 | | | | 0.03 | (b) | | | 0.93 | | |
Total from investment operations | | | 1.60 | | | | 2.50 | | | | 3.39 | | | | 1.95 | | | | 0.29 | | | | 1.20 | | |
Less distributions to shareholders: | |
Net investment income | | | (0.35 | ) | | | (0.29 | ) | | | (0.30 | ) | | | (0.16 | ) | | | (0.25 | ) | | | (0.25 | ) | |
Net realized gains | | | (1.20 | ) | | | (0.24 | ) | | | — | | | | — | | | | — | | | | — | | |
Total distributions to shareholders | | | (1.55 | ) | | | (0.53 | ) | | | (0.30 | ) | | | (0.16 | ) | | | (0.25 | ) | | | (0.25 | ) | |
Net asset value, end of period | | $ | 19.07 | | | $ | 19.02 | | | $ | 17.05 | | | $ | 13.96 | | | $ | 12.17 | | | $ | 12.13 | | |
Total return | | | 8.80 | % | | | 14.96 | % | | | 24.60 | % | | | 16.03 | % | | | 2.30 | % | | | 10.84 | % | |
Ratios to average net assets(c) | |
Total gross expenses | | | 1.27 | % | | | 1.27 | % | | | 1.29 | % | | | 1.31 | %(d) | | | 1.34 | % | | | 1.32 | % | |
Total net expenses(e) | | | 1.27 | %(f) | | | 1.27 | %(f) | | | 1.28 | %(f) | | | 1.25 | %(d) | | | 1.28 | %(f) | | | 1.30 | %(f) | |
Net investment income | | | 2.28 | % | | | 1.73 | % | | | 1.95 | % | | | 2.46 | %(d) | | | 1.98 | % | | | 2.27 | % | |
Supplemental data | |
Net assets, end of period (in thousands) | | $ | 87,646 | | | $ | 87,406 | | | $ | 72,979 | | | $ | 32,183 | | | $ | 13,101 | | | $ | 8,577 | | |
Portfolio turnover | | | 27 | % | | | 19 | % | | | 24 | % | | | 23 | % | | | 20 | % | | | 17 | % | |
Notes to Financial Highlights
(a) For the period from October 1, 2011 to May 31, 2012. During the period, the Fund's fiscal year end was changed from September 30 to May 31.
(b) Calculation of the net gain (loss) per share (both realized and unrealized) does not correlate to the aggregate realized and unrealized gain (loss) presented in the Statement of Operations due to the timing of subscriptions and redemptions of Fund shares in relation to fluctuations in the market value of the portfolio.
(c) In addition to the fees and expenses that the Fund bears directly, the Fund indirectly bears a pro rata share of the fees and expenses of any other funds in which it invests. Such indirect expenses are not included in the Fund's reported expense ratios.
(d) Annualized.
(e) Total net expenses include the impact of certain fee waivers/expense reimbursements made by the Investment Manager and certain of its affiliates, if applicable.
(f) The benefits derived from expense reductions had an impact of less than 0.01%.
The accompanying Notes to Financial Statements are an integral part of this statement.
Annual Report 2015
25
COLUMBIA DIVIDEND INCOME FUND
FINANCIAL HIGHLIGHTS (continued)
| | | Year Ended May 31, | |
Class R4 | | 2015 | | 2014 | | 2013(a) | |
Per share data | |
Net asset value, beginning of period | | $ | 19.27 | | | $ | 17.27 | | | $ | 14.65 | | |
Income from investment operations: | |
Net investment income | | | 0.57 | | | | 0.42 | | | | 0.20 | | |
Net realized and unrealized gain | | | 1.14 | | | | 2.20 | | | | 2.60 | | |
Total from investment operations | | | 1.71 | | | | 2.62 | | | | 2.80 | | |
Less distributions to shareholders: | |
Net investment income | | | (0.44 | ) | | | (0.38 | ) | | | (0.18 | ) | |
Net realized gains | | | (1.20 | ) | | | (0.24 | ) | | | — | | |
Total distributions to shareholders | | | (1.64 | ) | | | (0.62 | ) | | | (0.18 | ) | |
Net asset value, end of period | | $ | 19.34 | | | $ | 19.27 | | | $ | 17.27 | | |
Total return | | | 9.33 | % | | | 15.51 | % | | | 19.22 | % | |
Ratios to average net assets(b) | |
Total gross expenses | | | 0.77 | % | | | 0.77 | % | | | 0.82 | %(c) | |
Total net expenses(d) | | | 0.77 | %(e) | | | 0.77 | %(e) | | | 0.82 | %(c) | |
Net investment income | | | 2.93 | % | | | 2.29 | % | | | 2.17 | %(c) | |
Supplemental data | |
Net assets, end of period (in thousands) | | $ | 179,306 | | | $ | 123,274 | | | $ | 37,359 | | |
Portfolio turnover | | | 27 | % | | | 19 | % | | | 24 | % | |
Notes to Financial Highlights
(a) Based on operations from November 8, 2012 (commencement of operations) through the stated period end.
(b) In addition to the fees and expenses that the Fund bears directly, the Fund indirectly bears a pro rata share of the fees and expenses of any other funds in which it invests. Such indirect expenses are not included in the Fund's reported expense ratios.
(c) Annualized.
(d) Total net expenses include the impact of certain fee waivers/expense reimbursements made by the Investment Manager and certain of its affiliates, if applicable.
(e) The benefits derived from expense reductions had an impact of less than 0.01%.
The accompanying Notes to Financial Statements are an integral part of this statement.
Annual Report 2015
26
COLUMBIA DIVIDEND INCOME FUND
FINANCIAL HIGHLIGHTS (continued)
| | | Year Ended May 31, | |
Class R5 | | 2015 | | 2014 | | 2013(a) | |
Per share data | |
Net asset value, beginning of period | | $ | 19.26 | | | $ | 17.26 | | | $ | 14.65 | | |
Income from investment operations: | |
Net investment income | | | 0.62 | | | | 0.43 | | | | 0.22 | | |
Net realized and unrealized gain | | | 1.12 | | | | 2.21 | | | | 2.58 | | |
Total from investment operations | | | 1.74 | | | | 2.64 | | | | 2.80 | | |
Less distributions to shareholders: | |
Net investment income | | | (0.47 | ) | | | (0.40 | ) | | | (0.19 | ) | |
Net realized gains | | | (1.20 | ) | | | (0.24 | ) | | | — | | |
Total distributions to shareholders | | | (1.67 | ) | | | (0.64 | ) | | | (0.19 | ) | |
Net asset value, end of period | | $ | 19.33 | | | $ | 19.26 | | | $ | 17.26 | | |
Total return | | | 9.48 | % | | | 15.68 | % | | | 19.27 | % | |
Ratios to average net assets(b) | |
Total gross expenses | | | 0.63 | % | | | 0.64 | % | | | 0.65 | %(c) | |
Total net expenses(d) | | | 0.63 | % | | | 0.64 | % | | | 0.65 | %(c) | |
Net investment income | | | 3.19 | % | | | 2.41 | % | | | 2.41 | %(c) | |
Supplemental data | |
Net assets, end of period (in thousands) | | $ | 313,051 | | | $ | 156,525 | | | $ | 64,986 | | |
Portfolio turnover | | | 27 | % | | | 19 | % | | | 24 | % | |
Notes to Financial Highlights
(a) Based on operations from November 8, 2012 (commencement of operations) through the stated period end.
(b) In addition to the fees and expenses that the Fund bears directly, the Fund indirectly bears a pro rata share of the fees and expenses of any other funds in which it invests. Such indirect expenses are not included in the Fund's reported expense ratios.
(c) Annualized.
(d) Total net expenses include the impact of certain fee waivers/expense reimbursements made by the Investment Manager and certain of its affiliates, if applicable.
The accompanying Notes to Financial Statements are an integral part of this statement.
Annual Report 2015
27
COLUMBIA DIVIDEND INCOME FUND
FINANCIAL HIGHLIGHTS (continued)
| | | Year Ended May 31, | | Year Ended
September 30, | |
Class T | | 2015 | | 2014 | | 2013 | | 2012(a) | | 2011 | | 2010 | |
Per share data | |
Net asset value, beginning of period | | $ | 19.02 | | | $ | 17.05 | | | $ | 13.96 | | | $ | 12.17 | | | $ | 12.13 | | | $ | 11.18 | | |
Income from investment operations: | |
Net investment income | | | 0.48 | | | | 0.34 | | | | 0.33 | | | | 0.24 | | | | 0.29 | | | | 0.28 | | |
Net realized and unrealized gain | | | 1.16 | | | | 2.20 | | | | 3.09 | | | | 1.72 | | | | 0.03 | (b) | | | 0.95 | | |
Total from investment operations | | | 1.64 | | | | 2.54 | | | | 3.42 | | | | 1.96 | | | | 0.32 | | | | 1.23 | | |
Less distributions to shareholders: | |
Net investment income | | | (0.39 | ) | | | (0.33 | ) | | | (0.33 | ) | | | (0.17 | ) | | | (0.28 | ) | | | (0.28 | ) | |
Net realized gains | | | (1.20 | ) | | | (0.24 | ) | | | — | | | | — | | | | — | | | | — | | |
Total distributions to shareholders | | | (1.59 | ) | | | (0.57 | ) | | | (0.33 | ) | | | (0.17 | ) | | | (0.28 | ) | | | (0.28 | ) | |
Net asset value, end of period | | $ | 19.07 | | | $ | 19.02 | | | $ | 17.05 | | | $ | 13.96 | | | $ | 12.17 | | | $ | 12.13 | | |
Total return | | | 9.03 | % | | | 15.19 | % | | | 24.85 | % | | | 16.14 | % | | | 2.51 | % | | | 11.06 | % | |
Ratios to average net assets(c) | |
Total gross expenses | | | 1.04 | % | | | 1.07 | % | | | 1.09 | % | | | 1.11 | %(d) | | | 1.15 | % | | | 1.12 | % | |
Total net expenses(e) | | | 1.04 | %(f) | | | 1.07 | %(f) | | | 1.08 | %(f) | | | 1.05 | %(d) | | | 1.09 | %(f) | | | 1.10 | %(f) | |
Net investment income | | | 2.49 | % | | | 1.92 | % | | | 2.16 | % | | | 2.65 | %(d) | | | 2.18 | % | | | 2.36 | % | |
Supplemental data | |
Net assets, end of period (in thousands) | | $ | 81,206 | | | $ | 85,511 | | | $ | 84,342 | | | $ | 77,344 | | | $ | 72,421 | | | $ | 80,405 | | |
Portfolio turnover | | | 27 | % | | | 19 | % | | | 24 | % | | | 23 | % | | | 20 | % | | | 17 | % | |
Notes to Financial Highlights
(a) For the period from October 1, 2011 to May 31, 2012. During the period, the Fund's fiscal year end was changed from September 30 to May 31.
(b) Calculation of the net gain (loss) per share (both realized and unrealized) does not correlate to the aggregate realized and unrealized gain (loss) presented in the Statement of Operations due to the timing of subscriptions and redemptions of Fund shares in relation to fluctuations in the market value of the portfolio.
(c) In addition to the fees and expenses that the Fund bears directly, the Fund indirectly bears a pro rata share of the fees and expenses of any other funds in which it invests. Such indirect expenses are not included in the Fund's reported expense ratios.
(d) Annualized.
(e) Total net expenses include the impact of certain fee waivers/expense reimbursements made by the Investment Manager and certain of its affiliates, if applicable.
(f) The benefits derived from expense reductions had an impact of less than 0.01%.
The accompanying Notes to Financial Statements are an integral part of this statement.
Annual Report 2015
28
COLUMBIA DIVIDEND INCOME FUND
FINANCIAL HIGHLIGHTS (continued)
| | | Year Ended May 31, | | Year Ended
September 30, | |
Class W | | 2015 | | 2014 | | 2013 | | 2012(a) | | 2011 | | 2010(b) | |
Per share data | |
Net asset value, beginning of period | | $ | 19.01 | | | $ | 17.05 | | | $ | 13.96 | | | $ | 12.16 | | | $ | 12.12 | | | $ | 12.13 | | |
Income from investment operations: | |
Net investment income | | | 0.47 | | | | 0.31 | | | | 0.33 | | | | 0.25 | | | | 0.30 | | | | 0.01 | | |
Net realized and unrealized gain (loss) | | | 1.18 | | | | 2.23 | | | | 3.10 | | | | 1.73 | | | | 0.02 | (c) | | | (0.02 | ) | |
Total from investment operations | | | 1.65 | | | | 2.54 | | | | 3.43 | | | | 1.98 | | | | 0.32 | | | | (0.01 | ) | |
Less distributions to shareholders: | |
Net investment income | | | (0.40 | ) | | | (0.34 | ) | | | (0.34 | ) | | | (0.18 | ) | | | (0.28 | ) | | | — | | |
Net realized gains | | | (1.20 | ) | | | (0.24 | ) | | | — | | | | — | | | | — | | | | — | | |
Total distributions to shareholders | | | (1.60 | ) | | | (0.58 | ) | | | (0.34 | ) | | | (0.18 | ) | | | (0.28 | ) | | | — | | |
Net asset value, end of period | | $ | 19.06 | | | $ | 19.01 | | | $ | 17.05 | | | $ | 13.96 | | | $ | 12.16 | | | $ | 12.12 | | |
Total return | | | 9.09 | % | | | 15.21 | % | | | 24.91 | % | | | 16.27 | % | | | 2.57 | % | | | (0.08 | %) | |
Ratios to average net assets(d) | |
Total gross expenses | | | 1.02 | % | | | 1.00 | % | | | 1.04 | % | | | 1.05 | %(e) | | | 1.08 | % | | | 1.06 | %(e) | |
Total net expenses(f) | | | 1.02 | %(g) | | | 1.00 | %(g) | | | 1.02 | %(g) | | | 1.00 | %(e) | | | 1.00 | %(g) | | | 1.05 | %(e)(g) | |
Net investment income | | | 2.47 | % | | | 1.75 | % | | | 2.20 | % | | | 2.71 | %(e) | | | 2.28 | % | | | 7.83 | %(e) | |
Supplemental data | |
Net assets, end of period (in thousands) | | $ | 164 | | | $ | 193 | | | $ | 9,373 | | | $ | 47,647 | | | $ | 43,525 | | | $ | 2 | | |
Portfolio turnover | | | 27 | % | | | 19 | % | | | 24 | % | | | 23 | % | | | 20 | % | | | 17 | % | |
Notes to Financial Highlights
(a) For the period from October 1, 2011 to May 31, 2012. During the period, the Fund's fiscal year end was changed from September 30 to May 31.
(b) Based on operations from September 27, 2010 (commencement of operations) through the stated period end.
(c) Calculation of the net gain (loss) per share (both realized and unrealized) does not correlate to the aggregate realized and unrealized gain (loss) presented in the Statement of Operations due to the timing of subscriptions and redemptions of Fund shares in relation to fluctuations in the market value of the portfolio.
(d) In addition to the fees and expenses that the Fund bears directly, the Fund indirectly bears a pro rata share of the fees and expenses of any other funds in which it invests. Such indirect expenses are not included in the Fund's reported expense ratios.
(e) Annualized.
(f) Total net expenses include the impact of certain fee waivers/expense reimbursements made by the Investment Manager and certain of its affiliates, if applicable.
(g) The benefits derived from expense reductions had an impact of less than 0.01%.
The accompanying Notes to Financial Statements are an integral part of this statement.
Annual Report 2015
29
COLUMBIA DIVIDEND INCOME FUND
FINANCIAL HIGHLIGHTS (continued)
| | | Year Ended May 31, | |
Class Y | | 2015 | | 2014 | | 2013(a) | |
Per share data | |
Net asset value, beginning of period | | $ | 19.27 | | | $ | 17.27 | | | $ | 14.66 | | |
Income from investment operations: | |
Net investment income | | | 0.66 | | | | 0.47 | | | | 0.23 | | |
Net realized and unrealized gain | | | 1.10 | | | | 2.18 | | | | 2.58 | | |
Total from investment operations | | | 1.76 | | | | 2.65 | | | | 2.81 | | |
Less distributions to shareholders: | |
Net investment income | | | (0.48 | ) | | | (0.41 | ) | | | (0.20 | ) | |
Net realized gains | | | (1.20 | ) | | | (0.24 | ) | | | — | | |
Total distributions to shareholders | | | (1.68 | ) | | | (0.65 | ) | | | (0.20 | ) | |
Net asset value, end of period | | $ | 19.35 | | | $ | 19.27 | | | $ | 17.27 | | |
Total return | | | 9.59 | % | | | 15.72 | % | | | 19.29 | % | |
Ratios to average net assets(b) | |
Total gross expenses | | | 0.59 | % | | | 0.59 | % | | | 0.60 | %(c) | |
Total net expenses(d) | | | 0.59 | % | | | 0.59 | % | | | 0.60 | %(c) | |
Net investment income | | | 3.41 | % | | | 2.58 | % | | | 2.49 | %(c) | |
Supplemental data | |
Net assets, end of period (in thousands) | | $ | 171,392 | | | $ | 78,674 | | | $ | 1,190 | | |
Portfolio turnover | | | 27 | % | | | 19 | % | | | 24 | % | |
Notes to Financial Highlights
(a) Based on operations from November 8, 2012 (commencement of operations) through the stated period end.
(b) In addition to the fees and expenses that the Fund bears directly, the Fund indirectly bears a pro rata share of the fees and expenses of any other funds in which it invests. Such indirect expenses are not included in the Fund's reported expense ratios.
(c) Annualized.
(d) Total net expenses include the impact of certain fee waivers/expense reimbursements made by the Investment Manager and certain of its affiliates, if applicable.
The accompanying Notes to Financial Statements are an integral part of this statement.
Annual Report 2015
30
COLUMBIA DIVIDEND INCOME FUND
FINANCIAL HIGHLIGHTS (continued)
| | | Year Ended May 31, | | Year Ended
September 30, | |
Class Z | | 2015 | | 2014 | | 2013 | | 2012(a) | | 2011 | | 2010 | |
Per share data | |
Net asset value, beginning of period | | $ | 19.03 | | | $ | 17.07 | | | $ | 13.97 | | | $ | 12.17 | | | $ | 12.13 | | | $ | 11.18 | | |
Income from investment operations: | |
Net investment income | | | 0.53 | | | | 0.39 | | | | 0.38 | | | | 0.27 | | | | 0.33 | | | | 0.31 | | |
Net realized and unrealized gain | | | 1.18 | | | | 2.19 | | | | 3.10 | | | | 1.72 | | | | 0.03 | (b) | | | 0.95 | | |
Total from investment operations | | | 1.71 | | | | 2.58 | | | | 3.48 | | | | 1.99 | | | | 0.36 | | | | 1.26 | | |
Less distributions to shareholders: | |
Net investment income | | | (0.45 | ) | | | (0.38 | ) | | | (0.38 | ) | | | (0.19 | ) | �� | | (0.32 | ) | | | (0.31 | ) | |
Net realized gains | | | (1.20 | ) | | | (0.24 | ) | | | — | | | | — | | | | — | | | | — | | |
Total distributions to shareholders | | | (1.65 | ) | | | (0.62 | ) | | | (0.38 | ) | | | (0.19 | ) | | | (0.32 | ) | | | (0.31 | ) | |
Net asset value, end of period | | $ | 19.09 | | | $ | 19.03 | | | $ | 17.07 | | | $ | 13.97 | | | $ | 12.17 | | | $ | 12.13 | | |
Total return | | | 9.40 | % | | | 15.46 | % | | | 25.27 | % | | | 16.39 | % | | | 2.82 | % | | | 11.38 | % | |
Ratios to average net assets(c) | |
Total gross expenses | | | 0.77 | % | | | 0.77 | % | | | 0.79 | % | | | 0.80 | %(d) | | | 0.84 | % | | | 0.82 | % | |
Total net expenses(e) | | | 0.77 | %(f) | | | 0.77 | %(f) | | | 0.78 | %(f) | | | 0.75 | %(d) | | | 0.79 | %(f) | | | 0.80 | %(f) | |
Net investment income | | | 2.76 | % | | | 2.22 | % | | | 2.46 | % | | | 2.96 | %(d) | | | 2.48 | % | | | 2.66 | % | |
Supplemental data | |
Net assets, end of period (in thousands) | | $ | 4,800,733 | | | $ | 5,062,852 | | | $ | 4,846,586 | | | $ | 3,396,290 | | | $ | 2,227,757 | | | $ | 1,591,420 | | |
Portfolio turnover | | | 27 | % | | | 19 | % | | | 24 | % | | | 23 | % | | | 20 | % | | | 17 | % | |
Notes to Financial Highlights
(a) For the period from October 1, 2011 to May 31, 2012. During the period, the Fund's fiscal year end was changed from September 30 to May 31.
(b) Calculation of the net gain (loss) per share (both realized and unrealized) does not correlate to the aggregate realized and unrealized gain (loss) presented in the Statement of Operations due to the timing of subscriptions and redemptions of Fund shares in relation to fluctuations in the market value of the portfolio.
(c) In addition to the fees and expenses that the Fund bears directly, the Fund indirectly bears a pro rata share of the fees and expenses of any other funds in which it invests. Such indirect expenses are not included in the Fund's reported expense ratios.
(d) Annualized.
(e) Total net expenses include the impact of certain fee waivers/expense reimbursements made by the Investment Manager and certain of its affiliates, if applicable.
(f) The benefits derived from expense reductions had an impact of less than 0.01%.
The accompanying Notes to Financial Statements are an integral part of this statement.
Annual Report 2015
31
COLUMBIA DIVIDEND INCOME FUND
NOTES TO FINANCIAL STATEMENTS
May 31, 2015
Note 1. Organization
Columbia Dividend Income Fund (the Fund), a series of Columbia Funds Series Trust I (the Trust), is a diversified fund. The Trust is registered under the Investment Company Act of 1940, as amended (the 1940 Act), as an open-end management investment company organized as a Massachusetts business trust.
Fund Shares
The Trust may issue an unlimited number of shares (without par value). The Fund offers Class A, Class B, Class C, Class I, Class R, Class R4, Class R5, Class T, Class W, Class Y and Class Z shares. Although all share classes generally have identical voting, dividend and liquidation rights, each share class votes separately when required by the Trust's organizational documents or by law. Different share classes pay different distribution amounts to the extent the expenses of such share classes differ, and distributions in liquidation will be proportional to the net asset value of each share class. Each share class has its own expense and sales charge structure.
Class A shares are subject to a maximum front-end sales charge of 5.75% based on the initial investment amount. Class A shares purchased without an initial sales charge in accounts aggregating $1 million to $50 million at the time of purchase are subject to a contingent deferred sales charge (CDSC) if the shares are sold within 18 months after purchase, charged as follows: 1.00% CDSC if redeemed within 12 months after purchase, and 0.50% CDSC if redeemed more than 12, but less than 18, months after purchase.
Class B shares may be subject to a maximum CDSC of 5.00% based upon the holding period after purchase. Class B shares will generally convert to Class A shares eight years after purchase. The Fund no longer accepts investments by new or existing investors in the Fund's Class B shares, except in connection with the reinvestment of any dividend and/or capital gain distributions in Class B shares of the Fund and exchanges by existing Class B shareholders of certain other funds within the Columbia Family of Funds.
Class C shares are subject to a 1.00% CDSC on shares redeemed within one year after purchase.
Class I shares are not subject to sales charges and are available only to the Columbia Family of Funds.
Class R shares are not subject to sales charges and are generally available only to certain retirement plans and other investors as described in the Fund's prospectus.
Class R4 shares are not subject to sales charges and are generally available only to omnibus retirement plans and certain investors as described in the Fund's prospectus.
Class R5 shares are not subject to sales charges and are generally available only to investors purchasing through authorized investment professionals and omnibus retirement plans.
Class T shares are subject to a maximum front-end sales charge of 5.75% based on the investment amount. Class T shares purchased without an initial sales charge in accounts aggregating $1 million to $50 million at the time of purchase are subject to a CDSC if the shares are sold within 18 months after purchase, charged as follows: 1.00% CDSC if redeemed within 12 months after purchase, and 0.50% CDSC if redeemed more than 12, but less than 18, months after purchase. Class T shares are available only to investors who received (and who have continuously held) Class T shares in connection with previous fund reorganizations.
Class W shares are not subject to sales charges and are available only to investors purchasing through authorized investment programs managed by investment professionals, including discretionary managed account programs.
Class Y shares are not subject to sales charges and are generally available only to certain retirement plans as described in the Fund's prospectus.
Class Z shares are not subject to sales charges and are available only to eligible investors, which are subject to different investment minimums as described in the Fund's prospectus.
Note 2. Summary of Significant Accounting Policies
Basis of Preparation
The Fund is an investment company that applies the accounting and reporting guidance in the Financial Accounting Standards Board (FASB) Accounting Standards Codification Topic 946, Financial Services — Investment Companies (ASC 946). The financial statements are prepared in accordance with U.S. generally accepted accounting principles (GAAP), which requires management to make certain estimates and assumptions that affect the reported amounts of assets
Annual Report 2015
32
COLUMBIA DIVIDEND INCOME FUND
NOTES TO FINANCIAL STATEMENTS (continued)
May 31, 2015
and liabilities, the disclosure of contingent assets and liabilities at the date of the financial statements and the reported amounts of income and expenses during the reporting period. Actual results could differ from those estimates.
The following is a summary of significant accounting policies followed by the Fund in the preparation of its financial statements.
Security Valuation
All equity securities and exchange-traded funds (ETFs) are valued at the close of business of the New York Stock Exchange (NYSE). Equity securities and ETFs are valued at the last quoted sales price on the principal exchange or market on which they trade, except for securities traded on the NASDAQ Stock Market, which are valued at the NASDAQ official close price. Unlisted securities or listed securities for which there were no sales during the day are valued at the mean of the latest quoted bid and ask prices on such exchanges or markets.
Foreign equity securities are valued based on the closing price on the foreign exchange in which such securities are primarily traded. If any foreign equity security closing prices are not readily available, the securities are valued at the mean of the latest quoted bid and ask prices on such exchanges or markets. Foreign currency exchange rates are generally determined at 4:00 p.m. Eastern (U.S.) time. Many securities markets and exchanges outside the U.S. close prior to the close of the NYSE; therefore, the closing prices for securities in such markets or on such exchanges may not fully reflect events that occur after such close but before the close of the NYSE. In those situations, foreign securities will be fair valued pursuant to a policy adopted by the Board of Trustees (the Board), including, if available, utilizing a third party pricing service to determine these fair values. The third party pricing service takes into account multiple factors, including, but not limited to, movements in the U.S. securities markets, certain depositary receipts, futures contracts and foreign exchange rates that have occurred subsequent to the close of the foreign exchange or market, to determine a good faith estimate that reasonably reflects the current market conditions as of the close of the NYSE. The fair value of a security is likely to be different from the quoted or published price, if available.
Investments in open-end investment companies, including money market funds, are valued at their latest net asset value.
Investments for which market quotations are not readily available, or that have quotations which management believes are not reflective of market value or reliable, are valued at fair value as determined in good faith under procedures approved by and under the general supervision of the Board. If a security or class of securities (such as foreign securities) is valued at fair value, such value is likely to be different from the quoted or published price for the security.
The determination of fair value often requires significant judgment. To determine fair value, management may use assumptions including but not limited to future cash flows and estimated risk premiums. Multiple inputs from various sources may be used to determine fair value.
GAAP requires disclosure regarding the inputs and valuation techniques used to measure fair value and any changes in valuation inputs or techniques. In addition, investments shall be disclosed by major category. This information is disclosed following the Fund's Portfolio of Investments.
Security Transactions
Security transactions are accounted for on the trade date. Cost is determined and gains (losses) are based upon the specific identification method for both financial statement and federal income tax purposes.
Income Recognition
Corporate actions and dividend income are generally recorded net of any non-reclaimable tax withholdings, on the ex-dividend date or upon receipt of ex-dividend notification in the case of certain foreign securities.
The Fund may receive distributions from holdings in equity securities, business development companies (BDCs), exchange-traded funds (ETFs), other regulated investment companies (RICs), and real estate investment trusts (REITs), which report information on the tax character of their distributions annually. These distributions are allocated to dividend income, capital gain and return of capital based on actual information reported. Return of capital is recorded as a reduction of the cost basis of securities held. If the Fund no longer owns the applicable securities, return of capital is recorded as a realized gain. With respect to REITs, to the extent actual information has not yet been reported, estimates for return of capital are made by the Fund's management. Management's estimates are subsequently adjusted when the actual character of the distributions is disclosed by the REITs, which could result in a proportionate change in return of capital to shareholders.
Annual Report 2015
33
COLUMBIA DIVIDEND INCOME FUND
NOTES TO FINANCIAL STATEMENTS (continued)
May 31, 2015
Awards from class action litigation are recorded as a reduction of cost basis if the Fund still owns the applicable securities on the payment date. If the Fund no longer owns the applicable securities, the proceeds are recorded as realized gains.
Expenses
General expenses of the Trust are allocated to the Fund and other funds of the Trust based upon relative net assets or other expense allocation methodologies determined by the nature of the expense. Expenses directly attributable to the Fund are charged to the Fund. Expenses directly attributable to a specific class of shares are charged to that share class.
Determination of Class Net Asset Value
All income, expenses (other than class-specific expenses, which are charged to that share class, as shown in the Statement of Operations) and realized and unrealized gains (losses) are allocated to each class of the Fund on a daily basis, based on the relative net assets of each class, for purposes of determining the net asset value of each class.
Federal Income Tax Status
The Fund intends to qualify each year as a regulated investment company under Subchapter M of the Internal Revenue Code, as amended, and will distribute substantially all of its taxable income (including net short-term capital gains), if any, for its tax year, and as such will not be subject to federal income taxes. In addition, the Fund intends to distribute in each calendar year substantially all of its net investment income, capital gains and certain other amounts, if any, such that the Fund should not be subject to federal excise tax. Therefore, no federal income or excise tax provision is recorded.
Foreign Taxes
The Fund may be subject to foreign taxes on income, gains on investments or currency repatriation, a portion of which may be recoverable. The Fund will accrue such taxes and recoveries, as applicable, based upon its current interpretation of tax rules and regulations that exist in the markets in which it invests.
Realized gains in certain countries may be subject to foreign taxes at the Fund level, based on statutory rates. The Fund accrues for such foreign taxes on realized and unrealized gains at the appropriate rate for each jurisdiction, as applicable. The amount, if any, is
disclosed as a liability on the Statement of Assets and Liabilities.
Distributions to Shareholders
Distributions from net investment income, if any, are declared and paid each calendar quarter. Net realized capital gains, if any, are distributed at least annually. Income distributions and capital gain distributions are determined in accordance with federal income tax regulations, which may differ from GAAP.
Guarantees and Indemnifications
Under the Trust's organizational documents and, in some cases, by contract, its officers and trustees are indemnified against certain liabilities arising out of the performance of their duties to the Trust or its funds. In addition, certain of the Fund's contracts with its service providers contain general indemnification clauses. The Fund's maximum exposure under these arrangements is unknown since the amount of any future claims that may be made against the Fund cannot be determined, and the Fund has no historical basis for predicting the likelihood of any such claims.
Note 3. Fees and Compensation Paid to Affiliates
Investment Management Fees
Under an Investment Management Services Agreement, Columbia Management Investment Advisers, LLC (the Investment Manager), a wholly-owned subsidiary of Ameriprise Financial, Inc. (Ameriprise Financial), determines which securities will be purchased, held or sold. The investment management fee is an annual fee that is equal to a percentage of the Fund's average daily net assets that declines from 0.66% to 0.49% as the Fund's net assets increase. The effective investment management fee rate for the year ended May 31, 2015 was 0.52% of the Fund's average daily net assets.
Administration Fees
Under an Administrative Services Agreement, the Investment Manager also serves as the Fund Administrator. The Fund pays the Fund Administrator an annual fee for administration and accounting services equal to a percentage of the Fund's average daily net assets that declines from 0.06% to 0.03% as the Fund's net assets increase. The effective administration fee rate for the year ended May 31, 2015 was 0.04% of the Fund's average daily net assets.
Annual Report 2015
34
COLUMBIA DIVIDEND INCOME FUND
NOTES TO FINANCIAL STATEMENTS (continued)
May 31, 2015
Compensation of Board Members
Board members are compensated for their services to the Fund as disclosed in the Statement of Operations. The Trust's independent Trustees may participate in a Deferred Compensation Plan (the Plan) which may be terminated at any time. Obligations of the Plan will be paid solely out of the Fund's assets.
Compensation of Chief Compliance Officer
The Board has appointed a Chief Compliance Officer to the Fund in accordance with federal securities regulations. The Fund is allocated a portion of the expenses associated with the Chief Compliance Officer based on relative net assets of the Trust.
Transfer Agency Fees
Under a Transfer and Dividend Disbursing Agent Agreement, Columbia Management Investment Services Corp. (the Transfer Agent), an affiliate of the Investment Manager and a wholly-owned subsidiary of Ameriprise Financial, is responsible for providing transfer agency services to the Fund. The Transfer Agent has contracted with Boston Financial Data Services (BFDS) to serve as sub-transfer agent.
Effective November 1, 2014, the Transfer Agent receives a monthly transfer agency fee based on the number or the average value of accounts, depending on the type of account. Prior to November 1, 2014, the Transfer Agent received a monthly account-based service fee based on the number of open accounts. In addition, the Transfer Agent also receives sub-transfer agency fees based on a percentage of the average aggregate value of the Fund's shares maintained in omnibus accounts (other than omnibus accounts for which American Enterprise Investment Services Inc. is the broker of record or accounts where the beneficial shareholder is a customer of Ameriprise Financial Services, Inc., for which the Transfer Agent receives a per account fee). The Transfer Agent pays the fees of BFDS for services as sub-transfer agent and is not entitled to reimbursement for such fees from the Fund (with the exception of out-of-pocket fees).
The Transfer Agent also receives compensation from the Fund for various shareholder services and reimbursements for certain out-of-pocket fees. Total transfer agency fees for Class R5 shares are subject to an annual limitation of not more than 0.05% of the average daily net assets attributable to Class R5 shares. Class I and Class Y shares do not pay transfer agency fees.
For the year ended May 31, 2015, the Fund's effective transfer agency fee rates as a percentage of average daily net assets of each class were as follows:
Class A | | | 0.19 | % | |
Class B | | | 0.19 | | |
Class C | | | 0.19 | | |
Class R | | | 0.19 | | |
Class R4 | | | 0.19 | | |
Class R5 | | | 0.05 | | |
Class T | | | 0.19 | | |
Class W | | | 0.19 | | |
Class Z | | | 0.19 | | |
An annual minimum account balance fee of $20 may apply to certain accounts with a value below the applicable share class's initial minimum investment requirements to reduce the impact of small accounts on transfer agency fees. These minimum account balance fees are remitted to the Fund and recorded as part of expense reductions in the Statement of Operations. For the year ended May 31, 2015, these minimum account balance fees reduced total expenses of the Fund by $5,416.
Distribution and Service Fees
The Fund has an agreement with Columbia Management Investment Distributors, Inc. (the Distributor), an affiliate of the Investment Manager and a wholly-owned subsidiary of Ameriprise Financial, for distribution and shareholder services. The Board has approved, and the Fund has adopted, distribution and shareholder service plans (the Plans) applicable to certain share classes, which set the distribution and service fees for the Fund. These fees are calculated daily and are intended to compensate the Distributor and/or eligible selling and/or servicing agents for selling shares of the Fund and providing services to investors.
Under the Plans, the Fund pays a monthly service fee to the Distributor at the maximum annual rate of 0.25% of the average daily net assets attributable to Class A, Class B, Class C and Class W shares of the Fund. Also under the Plans, the Fund pays a monthly distribution fee to the Distributor at the maximum annual rates of 0.10%, 0.75%, 0.75%, 0.50% and 0.25% of the average daily net assets attributable to Class A, Class B, Class C, Class R and Class W shares, respectively.
Although the Fund may pay distribution and service fees up to a maximum annual rate of 0.35% of the Fund's average daily net assets attributable to Class A shares
Annual Report 2015
35
COLUMBIA DIVIDEND INCOME FUND
NOTES TO FINANCIAL STATEMENTS (continued)
May 31, 2015
(comprised of up to 0.10% for distribution services and up to 0.25% for shareholder liaison services), the Fund currently limits such fees to an aggregate fee of not more than 0.25% of the Fund's average daily net assets attributable to Class A shares.
Although the Fund may pay a distribution fee up to 0.25% of the Fund's average daily net assets attributable to Class W shares and a service fee of up to 0.25% of the Fund's average daily net assets attributable to Class W shares, the aggregate fee shall not exceed 0.25% of the Fund's average daily net assets attributable to Class W shares.
Shareholder Services Fees
The Fund has adopted a shareholder services plan that permits it to pay for certain services provided to Class T shareholders by their selling and/or servicing agents. The Fund may pay shareholder servicing fees up to an aggregate annual rate of 0.50% of the Fund's average daily net assets attributable to Class T shares (comprised of up to 0.25% for shareholder liaison services and up to 0.25% for administrative support services). Effective October 1, 2014, these fees are currently limited to an aggregate annual rate of not more than 0.25% of the Fund's average daily net assets attributable to Class T shares. Prior to October 1, 2014, these fees were limited to 0.30% of the Fund's average daily net assets attributable to Class T shares. In addition, if the Fund declares dividends on a daily basis, the servicing fee for Class T shares will be waived by selling and/or servicing agents to the extent necessary to prevent the net investment income for Class T shares from falling below 0.00% on a daily basis. The effective shareholder services fee rate for the year ended May 31, 2015 was 0.27% of the Fund's average daily net assets attributable to Class T shares.
Sales Charges
Sales charges, including front-end charges and CDSCs, received by the Distributor for distributing Fund shares were $1,558,849 for Class A, $2,211 for Class B, $37,671 for Class C and $4,334 for Class T shares for the year ended May 31, 2015.
Expenses Waived/Reimbursed by the Investment Manager and its Affiliates
The Fund's expense ratio is subject to an expense reimbursement arrangement pursuant to which fees will be waived and/or expenses reimbursed (excluding certain fees and expenses described below), so that the Fund's net operating expenses, after giving effect to fees
waived/expenses reimbursed and any balance credits and/or overdraft charges from the Fund's custodian, do not exceed the annual rates of:
| | | Voluntary
Expense Cap
Effective
October 1, 2014 | | Contractual
Expense Cap
Prior to
October 1, 2014 | |
Class A | | | 1.13 | % | | | 1.16 | % | |
Class B | | | 1.88 | | | | 1.91 | | |
Class C | | | 1.88 | | | | 1.91 | | |
Class I | | | 0.75 | | | | 0.78 | | |
Class R | | | 1.38 | | | | 1.41 | | |
Class R4 | | | 0.88 | | | | 0.91 | | |
Class R5 | | | 0.80 | | | | 0.83 | | |
Class T | | | 1.13 | | | | 1.21 | | |
Class W | | | 1.13 | | | | 1.16 | | |
Class Y | | | 0.75 | | | | 0.78 | | |
Class Z | | | 0.88 | | | | 0.91 | | |
The voluntary expense cap arrangement may be revised or discontinued at any time. Under the arrangements, the following fees and expenses are excluded from the waiver/reimbursement commitment, and therefore will be paid by the Fund, if applicable: taxes (including foreign transaction taxes), expenses associated with investments in affiliated and non-affiliated pooled investment vehicles (including mutual funds and exchange-traded funds), transaction costs and brokerage commissions, costs related to any securities lending program, dividend and interest expenses associated with securities sold short, inverse floater program fees and expenses, transaction charges and interest on borrowed money, interest and extraordinary expenses. Any fees waived and/or expenses reimbursed under the expense reimbursement arrangements described above are not recoverable by the Investment Manager or its affiliates in future periods.
Note 4. Federal Tax Information
The timing and character of income and capital gain distributions are determined in accordance with income tax regulations, which may differ from GAAP because of temporary or permanent book to tax differences.
At May 31, 2015, these differences are primarily due to differing treatment for deferral/reversal of wash sale losses, Trustees' deferred compensation and re-characterization of distributions for investments. To the extent these differences are permanent, reclassifications are made among the components of the Fund's net assets in the Statement of Assets and Liabilities.
Annual Report 2015
36
COLUMBIA DIVIDEND INCOME FUND
NOTES TO FINANCIAL STATEMENTS (continued)
May 31, 2015
Temporary differences do not require reclassifications. In the Statement of Assets and Liabilities the following reclassifications were made:
Undistributed net investment income | | $ | (201,228 | ) | |
Accumulated net realized gain | | | 201,228 | | |
Net investment income (loss) and net realized gains (losses), as disclosed in the Statement of Operations, and net assets were not affected by this reclassification.
The tax character of distributions paid during the years indicated was as follows:
Year Ended May 31, | | 2015 | | 2014 | |
Ordinary income | | $ | 194,414,908 | | | $ | 173,878,043 | | |
Long-term capital gains | | | 554,298,637 | | | | 122,232,494 | | |
Total | | | 748,713,545 | | | | 296,110,537 | | |
Short-term capital gain distributions, if any, are considered ordinary income distributions for tax purposes.
At May 31, 2015, the components of distributable earnings on a tax basis were as follows:
Undistributed ordinary income | | | 89,152,757 | | |
Undistributed long-term capital gains | | | 359,978,873 | | |
Net unrealized appreciation | | | 2,643,191,372 | | |
At May 31, 2015, the cost of investments for federal income tax purposes was $6,369,215,828 and the aggregate gross unrealized appreciation and depreciation based on that cost was:
Unrealized appreciation | | $ | 2,719,340,692 | | |
Unrealized depreciation | | | (76,149,320 | ) | |
Net unrealized appreciation | | | 2,643,191,372 | | |
Management of the Fund has concluded that there are no significant uncertain tax positions in the Fund that would require recognition in the financial statements. However, management's conclusion may be subject to review and adjustment at a later date based on factors including, but not limited to, new tax laws, regulations, and administrative interpretations (including relevant court decisions). Generally, the Fund's federal tax returns for the prior three fiscal years remain subject to examination by the Internal Revenue Service.
Note 5. Portfolio Information
The cost of purchases and proceeds from sales of securities, excluding short-term investments and derivatives, if any, aggregated to $2,415,820,460 and $3,011,215,649, respectively, for the year ended
May 31, 2015. The amount of purchase and sale activity impacts the portfolio turnover rate reported in the Financial Highlights.
Note 6. Affiliated Money Market Fund
The Fund invests in Columbia Short-Term Cash Fund, an affiliated money market fund established for the exclusive use by the Fund and other affiliated funds. The income earned by the Fund from such investments is included as Dividends — affiliated issuers in the Statement of Operations. As an investing fund, the Fund indirectly bears its proportionate share of the expenses of Columbia Short-Term Cash Fund.
Note 7. Shareholder Concentration
At May 31, 2015, two unaffiliated shareholders of record owned 44.4% of the outstanding shares of the Fund in one or more accounts. The Fund has no knowledge about whether any portion of those shares was owned beneficially. Affiliated shareholders of record owned 13.8% of the outstanding shares of the Fund in one or more accounts. Subscription and redemption activity by concentrated accounts may have a significant effect on the operations of the Fund.
Note 8. Line of Credit
The Fund has entered into a revolving credit facility with a syndicate of banks led by JPMorgan Chase Bank, N.A. whereby the Fund may borrow for the temporary funding of shareholder redemptions or for other temporary or emergency purposes. Pursuant to a December 9, 2014 amendment, the credit facility agreement, which is a collective agreement between the Fund and certain other funds managed by the Investment Manager, severally and not jointly, permits collective borrowings up to $550 million. Interest is charged to each participating fund based on its borrowings at a rate equal to the higher of (i) the overnight federal funds rate plus 1.00% or (ii) the one-month LIBOR rate plus 1.00%. Each borrowing under the credit facility matures no later than 60 days after the date of borrowing. The Fund also pays a commitment fee equal to its pro rata share of the amount of the credit facility at a rate of 0.075% per annum. The commitment fee is included in other expenses in the Statement of Operations. Prior to the December 9, 2014 amendment, the credit facility agreement permitted borrowings up to $500 million under the same terms and interest rates as described above.
The Fund had no borrowings during the year ended May 31, 2015.
Annual Report 2015
37
COLUMBIA DIVIDEND INCOME FUND
NOTES TO FINANCIAL STATEMENTS (continued)
May 31, 2015
Note 9. Subsequent Events
Management has evaluated the events and transactions that have occurred through the date the financial statements were issued and noted no items requiring adjustment of the financial statements or additional disclosure.
Note 10. Information Regarding Pending and Settled Legal Proceedings
In December 2005, without admitting or denying the allegations, American Express Financial Corporation (AEFC, which is now known as Ameriprise Financial, Inc. (Ameriprise Financial)) entered into settlement agreements with the Securities and Exchange Commission (SEC) and Minnesota Department of Commerce (MDOC) related to market timing activities. As a result, AEFC was censured and ordered to cease and desist from committing or causing any violations of certain provisions of the Investment Advisers Act of 1940, the Investment Company Act of 1940, and various Minnesota laws. AEFC agreed to pay disgorgement of $10 million and civil money penalties of $7 million. AEFC also agreed to retain an independent distribution consultant to assist in developing a plan for distribution of all disgorgement and civil penalties ordered by the SEC in accordance with various undertakings detailed at www.sec.gov/litigation/admin/ia-2451.pdf. Ameriprise Financial and its affiliates have cooperated with the SEC and the MDOC in these legal proceedings, and have made regular reports to the Funds' Boards of Trustees.
Ameriprise Financial and certain of its affiliates have historically been involved in a number of legal, arbitration and regulatory proceedings, including routine litigation, class actions, and governmental actions, concerning matters arising in connection with the conduct of their business activities. Ameriprise Financial believes that the Funds are not currently the subject of, and that neither Ameriprise Financial nor any of its affiliates are the subject of, any pending legal, arbitration or regulatory proceedings that are likely to have a material adverse effect on the Funds or the ability of Ameriprise Financial or its affiliates to perform under their contracts with the Funds. Ameriprise Financial is required to make quarterly (10-Q), annual (10-K) and, as necessary, 8-K filings with the SEC on legal and regulatory matters that relate to Ameriprise Financial and its affiliates. Copies of these filings may be obtained by accessing the SEC website at www.sec.gov.
There can be no assurance that these matters, or the adverse publicity associated with them, will not result in increased fund redemptions, reduced sale of fund shares or other adverse consequences to the Funds. Further, although we believe proceedings are not likely to have a material adverse effect on the Funds or the ability of Ameriprise Financial or its affiliates to perform under their contracts with the Funds, these proceedings are subject to uncertainties and, as such, we are unable to estimate the possible loss or range of loss that may result. An adverse outcome in one or more of these proceedings could result in adverse judgments, settlements, fines, penalties or other relief that could have a material adverse effect on the consolidated financial condition or results of operations of Ameriprise Financial.
Annual Report 2015
38
COLUMBIA DIVIDEND INCOME FUND
REPORT OF INDEPENDENT REGISTERED PUBLIC ACCOUNTING FIRM
To the Trustees of Columbia Funds Series Trust I and the Shareholders of
Columbia Dividend Income Fund
In our opinion, the accompanying statement of assets and liabilities, including the portfolio of investments, and the related statements of operations and of changes in net assets and the financial highlights present fairly, in all material respects, the financial position of Columbia Dividend Income Fund (the "Fund," a series of Columbia Funds Series Trust I) at May 31, 2015, and the results of its operations, the changes in its net assets and the financial highlights for each of the periods indicated, in conformity with accounting principles generally accepted in the United States of America. These financial statements and financial highlights (hereafter referred to as "financial statements") are the responsibility of the Fund's management. Our responsibility is to express an opinion on these financial statements based on our audits. We conducted our audits of these financial statements in accordance with the standards of the Public Company Accounting Oversight Board (United States). Those standards require that we plan and perform the audit to obtain reasonable assurance about whether the financial statements are free of material misstatement. An audit includes examining, on a test basis, evidence supporting the amounts and disclosures in the financial statements, assessing the accounting principles used and significant estimates made by management, and evaluating the overall financial statement presentation. We believe that our audits, which included confirmation of securities at May 31, 2015 by correspondence with the custodian and transfer agent, and the application of alternative auditing procedures where such confirmations had not been received, provide a reasonable basis for our opinion.
PricewaterhouseCoopers LLP
Minneapolis, MN
July 23, 2015
Annual Report 2015
39
COLUMBIA DIVIDEND INCOME FUND
FEDERAL INCOME TAX INFORMATION
(Unaudited)
The Fund hereby designates the following tax attributes for the fiscal year ended May 31, 2015. Shareholders will be notified in early 2016 of the amounts for use in preparing 2015 income tax returns.
Tax Designations
| Qualified Dividend Income | | | 100.00 | % | |
| Dividends Received Deduction | | | 99.09 | % | |
Capital Gain Dividend | | $ | 676,380,197 | | |
Qualified Dividend Income. For taxable, non-corporate shareholders, the percentage of ordinary income distributed during the fiscal year that represents qualified dividend income subject to reduced tax rates.
Dividends Received Deduction. The percentage of ordinary income distributed during the fiscal year that qualifies for the corporate dividends received deduction.
Capital Gain Dividend. The Fund designates as a capital gain dividend the amount reflected above, or if subsequently determined to be different, the net capital gain of such fiscal period.
Annual Report 2015
40
COLUMBIA DIVIDEND INCOME FUND
The Trustees serve terms of indefinite duration. The names and birth years of the Trustees and Officers of the Funds in Columbia Funds Series Trust I, the year each was first elected or appointed to office, their principal business occupations during at least the last five years, the number of Funds overseen by each Trustee and other directorships they hold are shown below. Each officer listed below serves as an officer of each Fund in Columbia Funds Series Trust I. The mailing address of each Trustee is: c/o Columbia Management Investment Advisers, LLC, 225 Franklin Street, Mail Drop BX32 05228, Boston, MA 02110.
Independent Trustees
Name, Year of Birth
and Position Held
with the Trust | | Year First
Appointed or
Elected as
Trustee to any
Fund Currently
in the Columbia
Funds Complex
or a Predecessor
Thereof | | Principal Occupation(s)
during the Past Five Years | | Number
of Funds
in the
Columbia
Funds
Complex
Overseen | | Other Directorships
Held by Trustee During
the Past Five Years | |
Douglas A. Hacker
(Born 1955)
Trustee and Chairman
of the Board | | | 1996 | | | Independent business executive since May 2006; Executive Vice President — Strategy of United Airlines from December 2002 to May 2006; President of UAL Loyalty Services (airline marketing company) from September 2001 to December 2002; Executive Vice President and Chief Financial Officer of United Airlines from July 1999 to September 2001 | | | 60 | | | Spartan Nash Company, (food distributor); Nash Finch Company (food distributor) from 2005 to 2013; Aircastle Limited (aircraft leasing); SeaCube Container Leasing Ltd. (container leasing) from 2010 to 2013; and Travelport Worldwide Limited (travel information technology) | |
Janet Langford Carrig
(Born 1957)
Trustee | | | 1996 | | | Senior Vice President, General Counsel and Corporate Secretary, ConocoPhillips (integrated energy company) since September 2007; Deputy General Counsel — Corporate Legal Services, ConocoPhillips from August 2006 to August 2007; Partner, Zelle, Hofmann, Voelbel, Mason & Gette LLP (law firm) from March 2005 to July 2006; Adjunct Professor of Law, Northwestern University from September 2004 to June 2006; Director, UAL Corporation (airline) from February 2006 to July 2006; Chief Administrative Officer and Senior Vice President, Kmart Holding Corporation (consumer goods) from September 2003 to March 2004 | | | 60 | | | None | |
Nancy T. Lukitsh
(Born 1956)
Trustee | | | 2011 | | | Senior Vice President, Partner and Director of Marketing, Wellington Management Company, LLP (investment adviser) from 1997 to 2010; Chair, Wellington Management Investment Portfolios (commingled non-U.S. investment pools) from 2007 to 2010; Director, Wellington Trust Company, NA and other Wellington affiliates from 1997 to 2010 | | | 60 | | | None | |
William E. Mayer
(Born 1940)
Trustee | | | 1991 | | | Partner, Park Avenue Equity Partners (private equity) since February 1999 | | | 60 | | | DynaVox Inc. (speech creation); Lee Enterprises (print media); WR Hambrecht + Co. (financial service provider) from 2000 to 2012; BlackRock Kelso Capital Corporation (investment company); and Premier, Inc. (healthcare) | |
Annual Report 2015
41
COLUMBIA DIVIDEND INCOME FUND
TRUSTEES AND OFFICERS (continued)
Independent Trustees (continued)
Name, Year of Birth
and Position Held
with the Trust | | Year First
Appointed or
Elected as
Trustee to any
Fund Currently
in the Columbia
Funds Complex
or a Predecessor
Thereof | | Principal Occupation(s)
during the Past Five Years | | Number
of Funds
in the
Columbia
Funds
Complex
Overseen | | Other Directorships
Held by Trustee During
the Past Five Years | |
David M. Moffett
(Born 1952)
Trustee | | | 2011 | | | Retired. Consultant to Bridgewater and Associates; Chief Executive Officer, Federal Home Loan Mortgage Corporation, from 2008 to 2009; Senior Adviser, Global Financial Services Group, Carlyle Group, Inc., from 2007 to 2008; Vice Chairman and Chief Financial Officer, U.S. Bancorp, from 1993 to 2007 | | | 60 | | | CIT Group Inc. (commercial and consumer finance); eBay Inc. (online trading community); MBIA Inc. (financial service provider); E.W. Scripps Co. (print and television media); Building Materials Holding Corp. (building materials and construction services); Genworth Financial, Inc. (financial and insurance products and services); and University of Oklahoma Foundation | |
Charles R. Nelson
(Born 1942)
Trustee | | | 1981 | | | Retired. Professor Emeritus, University of Washington since 2011; Professor of Economics, University of Washington from 1976 to 2011; Ford and Louisa Van Voorhis Professor of Political Economy, University of Washington from 1993 to 2011; Adjunct Professor of Statistics, University of Washington from 1980 to 2011; Associate Editor, Journal of Money, Credit and Banking from September 1993 to 2008; consultant on econometric and statistical matters | | | 60 | | | None | |
John J. Neuhauser
(Born 1943)
Trustee | | | 1984 | | | President, Saint Michael's College since August 2007; Director or Trustee of several non-profit organizations, including Fletcher Allen Health Care, Inc.; Academic Vice President and Dean of Faculties, Boston College from August 1999 to October 2005; University Professor, Boston College from November 2005 to August 2007 | | | 60 | | | Liberty All-Star Equity Fund and Liberty All-Star Growth Fund (closed-end funds) | |
Patrick J. Simpson
(Born 1944)
Trustee | | | 2000 | | | Partner, Perkins Coie LLP (law firm) | | | 60 | | | None | |
Anne-Lee Verville
(Born 1945)
Trustee | | | 1998 | | | Retired. General Manager, Global Education Industry from 1994 to 1997, President — Application Systems Division from 1991 to 1994, Chief Financial Officer — US Marketing & Services from 1988 to 1991, and Chief Information Officer from 1987 to 1988, IBM Corporation (computer and technology) | | | 60 | | | Enesco Group, Inc. (producer of giftware and home and garden decor products) from 2001 to 2006 | |
Annual Report 2015
42
COLUMBIA DIVIDEND INCOME FUND
TRUSTEES AND OFFICERS (continued)
Interested Trustee Affiliate with Investment Manager*
Name, Year of Birth
and Position Held
with the Trust | | Year First
Appointed or
Elected as
Trustee to any
Fund Currently
in the Columbia
Funds Complex
or a Predecessor
Thereof | | Principal Occupation(s)
during the Past Five Years | | Number
of Funds
in the
Columbia
Funds
Complex
Overseen | | Other Directorships
Held by Trustee During
the Past Five Years | |
William F. Truscott
(Born 1960)
Trustee | | | 2012 | | | Chairman of the Board and President, Columbia Management Investment Advisers, LLC since May 2010 and February 2012, respectively (previously President and Chief Investment Officer, 2001-April 2010); Chief Executive Officer, Global Asset Management, Ameriprise Financial, Inc. since September 2012 (previously Chief Executive Officer, U.S. Asset Management & President, Annuities, May 2010-September 2012 and President — U.S. Asset Management and Chief Investment Officer, 2005-April 2010); Director and Chief Executive Officer, Columbia Management Investment Distributors, Inc. since May 2010 and February 2012, respectively (previously Chairman of the Board and Chief Executive Officer, 2006-April 2010); Chairman of the Board and Chief Executive Officer, RiverSource Distributors, Inc. since 2006; Director, Threadneedle Asset Management Holdings, SARL since 2014; President and Chief Executive Officer, Ameriprise Certificate Company, 2006-August 2012 | | | 187 | | | Chairman of the Board, Columbia Management Investment Advisers, LLC since May 2010; Director, Columbia Management Investment Distributors, Inc. since May 2010; Director, Ameriprise Certificate Company, 2006 to January 2013 | |
* Interested person (as defined under the 1940 Act) by reason of being an officer, director, security holder and/or employee of the Investment Manager or Ameriprise Financial.
The Statement of Additional Information has additional information about the Fund's Board members and is available, without charge, upon request by calling 800.345.6611; contacting your financial intermediary; or visiting columbiathreadneedle.com/us.
The Board has appointed officers who are responsible for day-to-day business decisions based on policies it has established. The officers serve at the pleasure of the Board. In addition to Mr. Truscott, who is Senior Vice President, the Funds' other officers are:
Fund Officers
Name,
Address and
Year of Birth | | Position and Year
First Appointed to
Position for any Fund
in the Columbia
Funds Complex or a
Predecessor Thereof | | Principal Occupation(s) During Past Five Years | |
Christopher O. Petersen
5228 Ameriprise
Financial Center
Minneapolis, MN 55474
Born 1970 | | President and Principal Executive Officer (2015) | | Vice President and Lead Chief Counsel, Ameriprise Financial, Inc. since January 2015 (previously, Vice President and Chief Counsel January 2010-December 2014; and Vice President and Group Counsel or Counsel 2004- January 2010); officer of Columbia Funds and affiliated funds since 2007. | |
Michael G. Clarke
225 Franklin Street
Boston, MA 02110
Born 1969 | | Treasurer (2011) and Chief Financial Officer (2009) | | Vice President — Mutual Fund Administration, Columbia Management Investment Advisers, LLC, since May 2010; Managing Director of Fund Administration, Columbia Management Advisors, LLC, September 2004-April 2010; senior officer of Columbia Funds and affiliated funds since 2002. | |
Annual Report 2015
43
COLUMBIA DIVIDEND INCOME FUND
TRUSTEES AND OFFICERS (continued)
Fund Officers (continued)
Name,
Address and
Year of Birth | | Position and Year
First Appointed to
Position for any Fund
in the Columbia
Funds Complex or a
Predecessor Thereof | | Principal Occupation(s) During Past Five Years | |
Paul B. Goucher
100 Park Avenue
New York, NY 10017
Born 1968 | | Senior Vice President (2011), Chief Legal Officer (2015) and Assistant Secretary (2008) | | Vice President and Lead Chief Counsel, Ameriprise Financial, Inc. since November 2008 and January 2013, respectively (previously Chief Counsel, January 2010-January 2013 and Group Counsel, November 2008-January 2010). | |
Thomas P. McGuire
225 Franklin Street
Boston, MA 02110
Born 1972 | | Vice President and Chief Compliance Officer (2012) | | Vice President — Asset Management Compliance, Ameriprise Financial, Inc., since May 2010; Chief Compliance Officer, Ameriprise Certificate Company since September 2010; Compliance Executive, Bank of America, 2005-April 2010. | |
Colin Moore
225 Franklin Street
Boston, MA 02110
Born 1958 | | Senior Vice President (2010) | | Executive Vice President and Global Chief Investment Officer, Ameriprise Financial, Inc., since July 2013; Director and Global Chief Investment Officer, Columbia Management Investment Advisers, LLC since May 2010; Manager, Managing Director and Chief Investment Officer, Columbia Management Advisors, LLC, 2007-April 2010. | |
Michael E. DeFao
225 Franklin Street
Boston, MA 02110
Born 1968 | | Vice President (2011) and Assistant Secretary (2010) | | Vice President and Chief Counsel, Ameriprise Financial, Inc. since May 2010; Associate General Counsel, Bank of America, 2005-April 2010. | |
Joseph F. DiMaria
225 Franklin Street
Boston, MA 02110
Born 1968 | | Vice President (2011), Assistant Treasurer (2012) and Chief Accounting Officer (2008) | | Vice President — Mutual Fund Treasurer, Columbia Management Investment Advisers, LLC since May 2010; Director of Fund Administration, Columbia Management Advisors, LLC, 2006-April 2010. | |
Amy Johnson
5228 Ameriprise
Financial Center
Minneapolis, MN 55474
Born 1965 | | Vice President (2006) | | Managing Director and Chief Operating Officer, Columbia Management Investment Advisers, LLC since May 2010 (previously Chief Administrative Officer, 2009-April 2010, and Vice President — Asset Management and Trust Company Services, 2006-2009). | |
Lyn Kephart-Strong
5228 Ameriprise
Financial Center
Minneapolis, MN 55474
Born 1960 | | Vice President (2015) | | President, Columbia Management Investment Services Corp. since October 2014; Vice President & Resolution Officer, Ameriprise Trust Company since August 2009; President, RiverSource Service Corporation 2004-2010. | |
Ryan C. Larrenaga
225 Franklin Street
Boston, MA 02110
Born 1970 | | Vice President and Secretary (2015) | | Vice President and Group Counsel, Ameriprise Financial, Inc. since August 2011 (previously, Counsel from May 2010 to August 2011); Assistant General Counsel, Bank of America, 2005-April 2010; officer of Columbia Funds and affiliated funds since 2005. | |
Annual Report 2015
44
COLUMBIA DIVIDEND INCOME FUND
IMPORTANT INFORMATION ABOUT THIS REPORT
Each fund mails one shareholder report to each shareholder address. If you would like more than one report, please call shareholder services at 800.345.6611 and additional reports will be sent to you.
The policy of the Board is to vote the proxies of the companies in which each fund holds investments consistent with the procedures as stated in the Statement of Additional Information (SAI). You may obtain a copy of the SAI without charge by calling 800.345.6611; contacting your financial intermediary; visiting columbiathreadneedle.com/us; or searching the website of the Securities and Exchange Commission (SEC) at sec.gov. Information regarding how each fund voted proxies relating to portfolio securities is filed with the SEC by August 31st for the most recent 12-month period ending June 30th of that year, and is available without charge by visiting columbiathreadneedle.com/us, or searching the website of the SEC at sec.gov.
Each fund files a complete schedule of portfolio holdings with the SEC for the first and third quarters of each fiscal year on Form N-Q. Each fund's Form N-Q is available on the SEC's website at sec.gov and may be reviewed and copied at the SEC's Public Reference Room in Washington, D.C. Information on the operation of the Public Reference Room may be obtained by calling 800.SEC.0330. Each fund's complete schedule of portfolio holdings, as filed on Form N-Q, can also be obtained without charge, upon request, by calling 800.345.6611.
Annual Report 2015
45
Columbia Dividend Income Fund
P.O. Box 8081
Boston, MA 02266-8081

This information is for use with concurrent or prior delivery of a fund prospectus. Please read and consider the investment objectives, risks, charges and expenses for any fund carefully before investing. For a prospectus and summary prospectus, which contains this and other important information about the Fund, go to columbiathreadneedle.com/us. The Fund is distributed by Columbia Management Investment Distributors, Inc., member FINRA, and managed by Columbia Management Investment Advisers, LLC.
Columbia Threadneedle Investments (Columbia Threadneedle) is the global brand name of the Columbia and Threadneedle group of companies.
All rights reserved. Columbia Management Investment Distributors, Inc., 225 Franklin Street, Boston, MA 02110-2804
© 2015 Columbia Management Investment Advisers, LLC.
columbiathreadneedle.com/us
ANN139_05_E01_(07/15)

ANNUAL REPORT
May 31, 2015

COLUMBIA HIGH YIELD MUNICIPAL FUND

 Dear Shareholder,
In a world that is changing faster than ever before, investors want asset managers who offer a global perspective while generating strong and sustainable returns. To that end, Columbia Management, in conjunction with its U.K.-based affiliate, Threadneedle Investments, has rebranded to Columbia Threadneedle Investments. The new global brand represents the combined capabilities, resources and reach of the global group, offering investors access to the best of both firms.
With a presence in 18 countries and more than 450 investment professionals*, our collective perspective and world view as Columbia Threadneedle Investments gives us deeper insight into what might affect the real-life financial outcomes clients are seeking. Putting our views into a global context enables us to build richer perspectives and create the right solutions, and provides us with enhanced capabilities to deliver consistent investment performance, which may ultimately lead to better investor outcomes.
As a result of the rebrand, you will begin to see our new logo and colors reflected in printed materials, such as this shareholder report, as well as on our new website — columbiathreadneedle.com/us. We encourage you to visit us online and view a new video on the "About Us" tab that speaks to the strength of the firm.
While we are introducing a new brand, in many ways, the investment company you know well has not changed. The following remain in effect:
n Fund and strategy names
n Established investment teams, philosophies and processes
n Account services, features, servicing phone numbers and mailing addresses
n Columbia Management Investment Distributors as distributor and Columbia Management Investment Advisers as investment adviser
We recognize that the money we manage represents the hard work and savings of people like you, and that everyone has different ambitions and different definitions of success. Investors have varying goals — funding their children's education, enjoying their retirement, putting money aside for unexpected events, and more. Whatever your ambitions, we believe our wide range of investment products and solutions can help give you confidence that you will reach your goals.
The world is constantly changing, but our priority remains the same: to help you secure your finances, meet your goals and achieve success. Thank you for your continued investment with us. Our service representatives are available at 800.345.6611 to help with any questions.
Sincerely,

Christopher O. Petersen
President, Columbia Funds
Investors should consider the investment objectives, risks, charges and expenses of a mutual fund carefully before investing. For a free prospectus and summary prospectus, which contains this and other important information about a fund, visit columbiathreadneedle.com/us. The prospectus should be read carefully before investing.
* Source: Ameriprise as of December 1, 2014
Columbia Funds are distributed by Columbia Management Investment Distributors, Inc., member FINRA, and managed by Columbia Management Investment Advisers, LLC.
© 2015 Columbia Management Investment Advisers, LLC. All rights reserved.
COLUMBIA HIGH YIELD MUNICIPAL FUND
Performance Overview | | | 2 | | |
Manager Discussion of Fund Performance | | | 4 | | |
Understanding Your Fund's Expenses | | | 7 | | |
Portfolio of Investments | | | 8 | | |
Statement of Assets and Liabilities | | | 25 | | |
Statement of Operations | | | 27 | | |
Statement of Changes in Net Assets | | | 28 | | |
Financial Highlights | | | 30 | | |
Notes to Financial Statements | | | 36 | | |
Report of Independent Registered
Public Accounting Firm | | | 43 | | |
Federal Income Tax Information | | | 44 | | |
Trustees and Officers | | | 45 | | |
Important Information About This Report | | | 49 | | |
Fund Investment Manager
Columbia Management Investment
Advisers, LLC
225 Franklin Street
Boston, MA 02110
Fund Distributor
Columbia Management Investment
Distributors, Inc.
225 Franklin Street
Boston, MA 02110
Fund Transfer Agent
Columbia Management Investment
Services Corp.
P.O. Box 8081
Boston, MA 02266-8081
For more information about any of the funds, please visit columbiathreadneedle.com/us or call 800.345.6611. Customer Service Representatives are available to answer your questions Monday through Friday from 8 a.m. to 7 p.m. Eastern time.
The views expressed in this report reflect the current views of the respective parties. These views are not guarantees of future performance and involve certain risks, uncertainties and assumptions that are difficult to predict, so actual outcomes and results may differ significantly from the views expressed. These views are subject to change at any time based upon economic, market or other conditions and the respective parties disclaim any responsibility to update such views. These views may not be relied on as investment advice and, because investment decisions for a Columbia fund are based on numerous factors, may not be relied on as an indication of trading intent on behalf of any particular Columbia fund. References to specific securities should not be construed as a recommendation or investment advice.
COLUMBIA HIGH YIELD MUNICIPAL FUND
Performance Summary
n Columbia High Yield Municipal Fund (the Fund) Class A shares returned 5.97% excluding sales charges for the 12-month period ended May 31, 2015. Class Z shares returned 6.19% for the same period.
n The Fund's Blended Benchmark and the Barclays High Yield Municipal Bond Index returned 4.81% and 5.89%, respectively, during the same 12-month period.
n The Fund's relative performance was helped by its underweight in Puerto Rico and its overweight in longer maturity issues.
Average Annual Total Returns (%) (for period ended May 31, 2015)
| | | Inception | | 1 Year | | 5 Years | | 10 Years | |
Class A | | 07/31/00 | | | | | | | | | | | | | |
Excluding sales charges | | | | | | | 5.97 | | | | 6.70 | | | | 4.35 | | |
Including sales charges | | | | | | | 2.76 | | | | 6.05 | | | | 4.03 | | |
Class B | | 07/15/02 | | | | | | | | | | | | | |
Excluding sales charges | | | | | | | 5.19 | | | | 5.90 | | | | 3.57 | | |
Including sales charges | | | | | | | 0.19 | | | | 5.59 | | | | 3.57 | | |
Class C | | 07/15/02 | | | | | | | | | | | | | |
Excluding sales charges | | | | | | | 5.31 | | | | 6.05 | | | | 3.72 | | |
Including sales charges | | | | | | | 4.31 | | | | 6.05 | | | | 3.72 | | |
Class R4* | | 03/19/13 | | | 6.18 | | | | 6.92 | | | | 4.56 | | |
Class R5* | | 11/08/12 | | | 6.27 | | | | 6.97 | | | | 4.59 | | |
Class Z | | 03/05/84 | | | 6.19 | | | | 6.91 | | | | 4.56 | | |
Blended Benchmark | | | | | | | 4.81 | | | | 6.24 | | | | 4.94 | | |
Barclays High Yield Municipal Bond Index | | 05/30/03 | | | 5.89 | | | | 7.37 | | | | 5.13 | | |
Returns for Class A are shown with and without the maximum initial sales charge of 3.00%. The maximum applicable sales charge was reduced from 4.75% to 3.00% on Class A share purchases made on or after February 19, 2015. Class A returns (including sales charges) for all periods reflect the current maximum applicable sales charge of 3.00%. Returns for Class B are shown with and without the applicable contingent deferred sales charge (CDSC) of 5.00% in the first year, declining to 1.00% in the sixth year and eliminated thereafter. Returns for Class C are shown with and without the 1.00% CDSC for the first year only. The Fund's other classes are not subject to sales charges and have limited eligibility. Please see the Fund's prospectus for details. Performance for different share classes will vary based on differences in sales charges and fees associated with each class. All results shown assume reinvestment of distributions during the period. Returns do not reflect the deduction of taxes that a shareholder may pay on Fund distributions or on the redemption of Fund shares. Performance results reflect the effect of any fee waivers or reimbursements of Fund expenses by Columbia Management Investment Advisers, LLC and/or any of its affiliates. Absent these fee waivers or expense reimbursement arrangements, performance results would have been lower.
The performance information shown represents past performance and is not a guarantee of future results. The investment return and principal value of your investment will fluctuate so that your shares, when redeemed, may be worth more or less than their original cost. Current performance may be lower or higher than the performance information shown. You may obtain performance information current to the most recent month-end by contacting your financial intermediary, visiting columbiathreadneedle.com/us or calling 800.345.6611.
*The returns shown for periods prior to the share class inception date (including returns for the Life of the Fund, if shown, which are since Fund inception) include the returns of the Fund's oldest share class. These returns are adjusted to reflect any higher class-related operating expenses of the newer share classes, as applicable. Please visit columbiathreadneedle.com/us/investment-products/mutual-funds/appended-performance for more information.
The Blended Benchmark, established by the Investment Manager, consists of a 60% weighting of the Barclays High Yield Municipal Bond Index and a 40% weighting of the Barclays Municipal Bond Index. The Barclays Municipal Bond Index is considered representative of the broad market for investment-grade, tax-exempt bonds with a maturity of at least one year.
The Barclays High Yield Municipal Bond Index is comprised of bonds with maturities greater than one-year, having a par value of at least $3 million issued as part of a transaction size greater than $20 million, and rated no higher than "BB+" or equivalent by any of the three principal rating agencies.
Indices are not available for investment, are not professionally managed and do not reflect sales charges, fees, brokerage commissions, taxes or other expenses of investing. Securities in the Fund may not match those in an index.
Annual Report 2015
2
COLUMBIA HIGH YIELD MUNICIPAL FUND
PERFORMANCE OVERVIEW (continued)
Performance of a Hypothetical $10,000 Investment (June 1, 2005 – May 31, 2015)
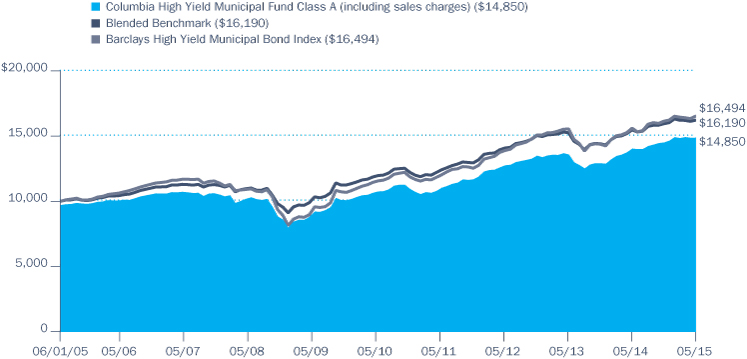
The chart above shows the change in value of a hypothetical $10,000 investment in Class A shares of Columbia High Yield Municipal Fund during the stated time period, and does not reflect the deduction of taxes that a shareholder may pay on Fund distributions or on the redemption of Fund shares.
Annual Report 2015
3
COLUMBIA HIGH YIELD MUNICIPAL FUND
MANAGER DISCUSSION OF FUND PERFORMANCE
Portfolio Management
Chad Farrington, CFA
Top Ten States/Territories (%)
(at May 31, 2015) | |
California | | | 10.7 | | |
Illinois | | | 8.5 | | |
Texas | | | 8.4 | | |
Florida | | | 7.9 | | |
Pennsylvania | | | 4.4 | | |
New York | | | 4.2 | | |
New Jersey | | | 3.9 | | |
Puerto Rico | | | 3.8 | | |
Michigan | | | 3.7 | | |
Louisiana | | | 3.6 | | |
Percentages indicated are based upon total investments (excluding Money Market Funds).
For further detail about these holdings, please refer to the section entitled "Portfolio of Investments."
Fund holdings are as of the date given, are subject to change at any time, and are not recommendations to buy or sell any security.
For the 12-month period that ended May 31, 2015, Class A shares of the Fund returned 5.97%, excluding sales charges, and Class Z shares returned 6.19%. During the same time period, the Fund's Blended Benchmark returned 4.81%, and the Barclays High Yield Municipal Bond Index returned 5.89%. The Fund outperformed its benchmark due largely to its underweight in Puerto Rico-related debt and its overweight in bonds with longer maturities. Puerto Rico's bonds underperformed the Blended Benchmark, and the Fund was helped by being significantly underweight in the issuer. The Fund was also overweight in longer maturity bonds, which aided its 12-month results. The yields on bonds maturing longer than 20 years declined during the period (as prices rose), while yields increased for bonds with maturities of 10 years and less (as prices declined).
High-Yield Municipal Bonds Rallied
High-yield municipal bonds enjoyed another year of strong performance at a time of stable credit conditions and continued investor demand for higher yielding investments. Since the new-issue supply of high-yield debt remained fairly low, the strong demand for both higher yielding securities and tax-exempt investments caused credit spreads (the yield advantage of lower quality issues vs. higher quality issues) to decline. In addition, the backdrop of low inflation, modest economic growth, and the apparent likelihood that the U.S. Federal Reserve (Fed) will take an incremental approach to raising rates fueled a broader decline in prevailing yields. These conditions helped support positive returns throughout the bond market, particularly for longer term issues. Puerto Rico was the most volatile issue in the municipal bond market during the period, with most Puerto Rico related bonds falling in price due to continued concerns about the territory's ability to pay its outstanding debts.
Contributors and Detractors
Outside of the Fund's underweight in Puerto Rico and its overweight in longer maturity bonds, the largest contribution to returns came from an overweight position in continuing care retirement communities (CRCCs), the strongest performing sector in the benchmark. The sector's higher yields and stable credit performance boosted its return during the 12-month period and led to robust relative performance for the Fund's holdings in Altavita (California) and Mirabella Seattle (Washington State), among other issuers. However, three of the Fund's holdings in individual CRCC issuers — Sears Tyler Methodist (Texas), Glenmoor (Florida), Deerfield Retirement Community (Iowa) — defaulted or moved to distressed levels during the period. The underperformance of these holdings offset some of the positive impact of being overweight in the group.
The Fund's performance was helped by its positions in longer maturity zero-coupon bonds. This market segment, which tends to have an above-average sensitivity to movements in prevailing rates, performed very well at a time of falling yields. Among individual securities, two of the Fund's top performers were Renaissance Charter School (Florida), which was helped by its high coupon and stable credit performance, and Silver Cross Medical Center (Illinois), which rose in price after the issuer initiated an
Annual Report 2015
4
COLUMBIA HIGH YIELD MUNICIPAL FUND
MANAGER DISCUSSION OF FUND PERFORMANCE (continued)
advanced refunding, through which it paid off existing debt by issuing new bonds at a lower yield. In addition, certain lower rated credits with high coupons experienced strong appreciation during the period due to favorable credit conditions and the strength in investor demand for higher yielding securities.
An underweight in tobacco bonds detracted from performance, but we made up some of the shortfall by holding positions in individual tobacco issuers that outperformed. Tobacco is one of the largest sector weightings in the Barclays High Yield Municipal Bond Index, but we normally maintain an underweight in the group due to its high volatility. As a result, strong relative performance for the sector typically acts as a headwind to the Fund.
Portfolio Activity
We maintained our buying discipline as the bond market rallied and yield spreads declined throughout most of the period. Since there were fewer attractive buying opportunities at times, we maintained an above-average cash position. The Fund's overall credit quality increased, while its duration (or interest-rate sensitivity) declined relative to the Blended Benchmark.
Looking Ahead
Valuations in the high-yield market improved near the end of the period, as Moody's Investor Service downgraded Chicago's credit rating to below investment grade in mid-May. In addition, investors began to position for the growing likelihood that the Fed will raise interest rates before the end of 2015. These developments introduced some volatility and caused yield spreads to widen somewhat.
In this environment, we believe that the Fund's somewhat more cautious current positioning provides us with the ability to take advantage of potential buying opportunities at higher yields, while seeking to maintain sufficient liquidity to meet any possible outflows that typically accompany periods in which rates are rising.
Quality Breakdown (%)
(at May 31, 2015) | |
AAA rating | | | 0.1 | | |
AA rating | | | 8.3 | | |
A rating | | | 17.4 | | |
BBB rating | | | 24.3 | | |
BB rating | | | 8.6 | | |
B rating | | | 5.1 | | |
CCC rating | | | 3.0 | | |
CC rating | | | 0.8 | | |
Not rated | | | 32.4 | | |
Total | | | 100.0 | | |
Percentages indicated are based upon total fixed income investments (excluding Money Market Funds).
Bond ratings apply to the underlying holdings of the Fund and not the Fund itself and are divided into categories ranging from highest to lowest credit quality, determined by using the middle rating of Moody's, S&P and Fitch, after dropping the highest and lowest available ratings. When ratings are available from only two rating agencies, the lower rating is used. When a rating is available from only one rating agency, that rating is used. When a bond is not rated by any rating agency, it is designated as "Not rated." Credit quality ratings assigned by a rating agency are subjective opinions, not statements of fact, and are subject to change, including daily. The ratings assigned by credit rating agencies are but one of the considerations that the Investment Manager and/or Fund's subadviser incorporates into its credit analysis process, along with such other issuer-specific factors as cash flows, capital structure and leverage ratios, ability to de-leverage (repay) through free cash flow, quality of management, market positioning and access to capital, as well as such security-specific factors as the terms of the security (e.g., interest rate and time to maturity) and the amount and type of any collateral.
Annual Report 2015
5
COLUMBIA HIGH YIELD MUNICIPAL FUND
MANAGER DISCUSSION OF FUND PERFORMANCE (continued)
Investment Risks
Fixed-income securities present issuer default risk. The Fund invests substantially in municipal securities and will be affected by tax, legislative, regulatory, demographic or political changes, as well as changes impacting a state's financial, economic or other conditions. A relatively small number of tax-exempt issuers may necessitate the Fund investing more heavily in a single issuer and, therefore, be more exposed to the risk of loss than a fund that invests more broadly. Prepayment and extension risk exists as a loan, bond or other investment may be called, prepaid or redeemed before maturity and that similar yielding investments may not be available for purchase. A rise in interest rates may result in a price decline of fixed-income instruments held by the fund, negatively impacting its performance and NAV. Falling rates may result in the Fund investing in lower yielding debt instruments, lowering the Fund's income and yield. These risks may be heightened for longer maturity and duration securities. Non-investment-grade (high-yield or junk) securities present greater price volatility and more risk to principal and income than higher rated securities. Market risk may affect a single issuer, sector of the economy, industry or the market as a whole. Federal and state tax rules apply to capital gain distributions and any gains or losses on sales. Income may be subject to state, local or alternative minimum taxes. Market or other (e.g., interest rate) environments may adversely affect the liquidity of Fund investments, negatively impacting their price. Generally, the less liquid the market at the time the Fund sells a holding, the greater the risk of loss or decline of value to the Fund. See the Fund's prospectus for more information on these and other risks.
Annual Report 2015
6
COLUMBIA HIGH YIELD MUNICIPAL FUND
UNDERSTANDING YOUR FUND'S EXPENSES
(Unaudited)
As an investor, you incur two types of costs. There are transaction costs, which generally include sales charges on purchases and may include redemption fees. There are also ongoing costs, which generally include management fees, distribution and/or service fees, and other fund expenses. The following information is intended to help you understand your ongoing costs (in dollars) of investing in the Fund and to help you compare these costs with the ongoing costs of investing in other mutual funds.
Analyzing Your Fund's Expenses
To illustrate these ongoing costs, we have provided examples and calculated the expenses paid by investors in each share class of the Fund during the period. The actual and hypothetical information in the table is based on an initial investment of $1,000 at the beginning of the period indicated and held for the entire period. Expense information is calculated two ways and each method provides you with different information. The amount listed in the "Actual" column is calculated using the Fund's actual operating expenses and total return for the period. You may use the Actual information, together with the amount invested, to estimate the expenses that you paid over the period. Simply divide your account value by $1,000 (for example, an $8,600 account value divided by $1,000 = 8.6), then multiply the results by the expenses paid during the period under the "Actual" column. The amount listed in the "Hypothetical" column assumes a 5% annual rate of return before expenses (which is not the Fund's actual return) and then applies the Fund's actual expense ratio for the period to the hypothetical return. You should not use the hypothetical account values and expenses to estimate either your actual account balance at the end of the period or the expenses you paid during the period. See "Compare With Other Funds" below for details on how to use the hypothetical data.
Compare With Other Funds
Since all mutual funds are required to include the same hypothetical calculations about expenses in shareholder reports, you can use this information to compare the ongoing cost of investing in the Fund with other funds. To do so, compare the hypothetical example with the 5% hypothetical examples that appear in the shareholder reports of other funds. As you compare hypothetical examples of other funds, it is important to note that hypothetical examples are meant to highlight the ongoing costs of investing in a fund only and do not reflect any transaction costs, such as sales charges, or redemption or exchange fees. Therefore, the hypothetical calculations are useful in comparing ongoing costs only, and will not help you determine the relative total costs of owning different funds. If transaction costs were included in these calculations, your costs would be higher.
December 1, 2014 – May 31, 2015
| | | Account Value at the Beginning
of the Period ($) | | Account Value at the End of the
Period ($) | | Expenses Paid During the
Period ($) | | Fund's Annualized
Expense Ratio (%) | |
| | | Actual | | Hypothetical | | Actual | | Hypothetical | | Actual | | Hypothetical | | Actual | |
Class A | | | 1,000.00 | | | | 1,000.00 | | | | 1,025.50 | | | | 1,020.64 | | | | 4.34 | | | | 4.33 | | | | 0.86 | | |
Class B | | | 1,000.00 | | | | 1,000.00 | | | | 1,021.60 | | | | 1,016.90 | | | | 8.11 | | | | 8.10 | | | | 1.61 | | |
Class C | | | 1,000.00 | | | | 1,000.00 | | | | 1,022.20 | | | | 1,017.40 | | | | 7.61 | | | | 7.59 | | | | 1.51 | | |
Class R4 | | | 1,000.00 | | | | 1,000.00 | | | | 1,026.50 | | | | 1,021.64 | | | | 3.33 | | | | 3.33 | | | | 0.66 | | |
Class R5 | | | 1,000.00 | | | | 1,000.00 | | | | 1,026.90 | | | | 1,022.04 | | | | 2.93 | | | | 2.92 | | | | 0.58 | | |
Class Z | | | 1,000.00 | | | | 1,000.00 | | | | 1,026.50 | | | | 1,021.64 | | | | 3.33 | | | | 3.33 | | | | 0.66 | | |
Expenses paid during the period are equal to the annualized expense ratio for each class as indicated above, multiplied by the average account value over the period and then multiplied by the number of days in the Fund's most recent fiscal half year and divided by 365.
Expenses do not include fees and expenses incurred indirectly by the Fund from its investment in underlying funds, including affiliated and non-affiliated pooled investment vehicles, such as mutual funds and exchange-traded funds.
Had Columbia Management Investment Advisers, LLC and/or certain of its affiliates not waived/reimbursed certain fees and expenses, account value at the end of the period would have been reduced.
Annual Report 2015
7
COLUMBIA HIGH YIELD MUNICIPAL FUND
PORTFOLIO OF INVESTMENTS
May 31, 2015
(Percentages represent value of investments compared to net assets)
Municipal Bonds 93.1%
Issue
Description | | Coupon
Rate | | Principal
Amount ($) | | Value ($) | |
ALASKA 0.7% | |
City of Koyukuk
Revenue Bonds
Tanana Chiefs Conference Health Care
Series 2011
10/01/41 | | | 7.750 | % | | | 5,000,000 | | | | 5,696,950 | | |
ARIZONA 2.6% | |
City of Glendale Water & Sewer
Refunding Revenue Bonds
Senior Lien
Series 2015
07/01/27 | | | 5.000 | % | | | 2,500,000 | | | | 2,951,550 | | |
Industrial Development Authority of the County of Pima (The)
Refunding Revenue Bonds
Facility-Edkey Charter Schools Project
Series 2013
07/01/33 | | | 6.000 | % | | | 2,000,000 | | | | 2,005,780 | | |
07/01/43 | | | 6.000 | % | | | 2,500,000 | | | | 2,446,625 | | |
07/01/48 | | | 6.000 | % | | | 1,500,000 | | | | 1,445,595 | | |
Revenue Bonds
American Charter Schools Foundation
Series 2007A
07/01/38 | | | 5.625 | % | | | 3,840,000 | | | | 3,619,930 | | |
Maricopa County Pollution Control Corp.
Revenue Bonds
El Paso Electric Co. Project
Series 2009B
04/01/40 | | | 7.250 | % | | | 3,600,000 | | | | 4,178,016 | | |
Surprise Municipal Property Corp.
Revenue Bonds
Series 2007
04/01/32 | | | 4.900 | % | | | 2,000,000 | | | | 2,034,340 | | |
Yavapai County Industrial Development Authority
Revenue Bonds
Yavapai Regional Medical Center
Series 2008B
08/01/37 | | | 5.625 | % | | | 3,500,000 | | | | 3,695,440 | | |
Total | | | | | | | 22,377,276 | | |
CALIFORNIA 10.1% | |
Agua Caliente Band of Cahuilla Indians
Revenue Bonds
Series 2003(a)(b)
07/01/18 | | | 6.000 | % | | | 1,660,000 | | | | 1,644,280 | | |
Cabazon Band Mission Indians(a)(b)(c)(d)
Revenue Bonds
Mortgage Notes
Series 2004
10/01/11 | | | 13.000 | % | | | 405,000 | | | | 202,277 | | |
10/01/15 | | | 8.375 | % | | | 560,000 | | | | 188,692 | | |
10/01/19 | | | 8.750 | % | | | 2,785,000 | | | | 938,127 | | |
Series 2010
10/01/20 | | | 8.375 | % | | | 1,420,000 | | | | 538,677 | | |
Municipal Bonds (continued)
Issue
Description | | Coupon
Rate | | Principal
Amount ($) | | Value ($) | |
California Health Facilities Financing Authority
Refunding Revenue Bonds
Northern California Presbyterian
Series 2015
07/01/39 | | | 5.000 | % | | | 900,000 | | | | 1,001,745 | | |
California Housing Finance Agency(e)
Revenue Bonds
Home Mortgage
Series 2006K AMT
08/01/26 | | | 4.625 | % | | | 4,865,000 | | | | 4,908,055 | | |
Series 2008K AMT
08/01/33 | | | 5.550 | % | | | 2,545,000 | | | | 2,568,923 | | |
California Municipal Finance Authority
Revenue Bonds
UTS Renewable Energy-Waste Water Facilities
Series 2011 AMT(a)(c)(e)
12/01/32 | | | 7.500 | % | | | 1,835,000 | | | | 2,087,643 | | |
California State Public Works Board
Refunding Revenue Bonds
Various Capital Projects
Series 2012G
11/01/37 | | | 5.000 | % | | | 1,250,000 | | | | 1,391,463 | | |
California Statewide Communities Development Authority
Refunding Revenue Bonds
899 Charleston Project
Series 2014A
11/01/44 | | | 5.250 | % | | | 1,500,000 | | | | 1,522,770 | | |
Revenue Bonds
American Baptist Homes West
Series 2010
10/01/39 | | | 6.250 | % | | | 2,750,000 | | | | 3,051,813 | | |
Aspire Public Schools
Series 2010
07/01/46 | | | 6.125 | % | | | 2,990,000 | | | | 3,192,094 | | |
Loma Linda University Medical Center
Series 2014
12/01/44 | | | 5.250 | % | | | 500,000 | | | | 536,340 | | |
Chino Public Financing Authority
Refunding Special Tax Bonds
Series 2012
09/01/34 | | | 5.000 | % | | | 1,775,000 | | | | 1,912,367 | | |
City of Carson
Special Assessment Bonds
Assessment District No. 92-1
Series 1992
09/02/22 | | | 7.375 | % | | | 80,000 | | | | 80,627 | | |
City of Long Beach
Revenue Bonds
Series 2015(f)
05/15/45 | | | 5.000 | % | | | 500,000 | | | | 532,280 | | |
City of Los Angeles Department of Airports
Revenue Bonds
Senior Series 2015A AMT(e)
05/15/27 | | | 5.000 | % | | | 1,250,000 | | | | 1,460,425 | | |
The accompanying Notes to Financial Statements are an integral part of this statement.
Annual Report 2015
8
COLUMBIA HIGH YIELD MUNICIPAL FUND
PORTFOLIO OF INVESTMENTS (continued)
May 31, 2015
Municipal Bonds (continued)
Issue
Description | | Coupon
Rate | | Principal
Amount ($) | | Value ($) | |
City of Santa Maria Water & Wastewater
Refunding Revenue Bonds
Series 2012A(g)
02/01/25 | | | 0.000 | % | | | 3,100,000 | | | | 2,038,343 | | |
City of Upland
Certificate of Participation
San Antonio Community Hospital
Series 2011
01/01/41 | | | 6.500 | % | | | 5,000,000 | | | | 5,779,950 | | |
Compton Unified School District
Unlimited General Obligation Bonds
Election of 2002 - Capital Appreciation
Series 2006C(g)
06/01/25 | | | 0.000 | % | | | 2,310,000 | | | | 1,534,163 | | |
County of Sacramento Airport System
Revenue Bonds
Subordinated Series 2009D
07/01/35 | | | 6.000 | % | | | 2,500,000 | | | | 2,824,975 | | |
Empire Union School District
Special Tax Bonds
Communities Facilities District No. 1987-1
Series 2002A (AMBAC)(g)
10/01/21 | | | 0.000 | % | | | 1,665,000 | | | | 1,346,302 | | |
Foothill-Eastern Transportation Corridor Agency
Refunding Revenue Bonds
Junior Lien
Series 2014C
01/15/43 | | | 6.500 | % | | | 5,000,000 | | | | 5,932,300 | | |
Golden State Tobacco Securitization Corp.
Asset-Backed Revenue Bonds
Senior Series 2007A-1
06/01/47 | | | 5.125 | % | | | 3,000,000 | | | | 2,341,560 | | |
Hesperia Public Financing Authority
Tax Allocation Bonds
Redevelopment & Housing Projects
Series 2007A
09/01/27 | | | 5.500 | % | | | 5,430,000 | | | | 5,604,412 | | |
M-S-R Energy Authority
Revenue Bonds
Series 2009B
11/01/39 | | | 6.500 | % | | | 5,000,000 | | | | 6,561,800 | | |
Oakdale Public Financing Authority
Tax Allocation Bonds
Central City Redevelopment Project
Series 2004
06/01/33 | | | 5.375 | % | | | 2,000,000 | | | | 2,000,920 | | |
Palomar Health
Certificate of Participation
Series 2010
11/01/41 | | | 6.000 | % | | | 2,500,000 | | | | 2,660,000 | | |
Municipal Bonds (continued)
Issue
Description | | Coupon
Rate | | Principal
Amount ($) | | Value ($) | |
Riverside County Public Financing Authority
Certificate of Participation
Series 1999
05/15/29 | | | 5.800 | % | | | 5,650,000 | | | | 4,772,329 | | |
San Francisco City & County Redevelopment Agency
Tax Allocation Bonds
Mission Bay South Redevelopment
Series 2009D
08/01/39 | | | 6.625 | % | | | 1,500,000 | | | | 1,724,325 | | |
State of California Department of Veterans Affairs
Revenue Bonds
Series 2012A
12/01/25 | | | 3.500 | % | | | 5,000,000 | | | | 5,235,450 | | |
State of California
Unlimited General Obligation Bonds
Various Purpose
Series 2012
04/01/42 | | | 5.000 | % | | | 3,000,000 | | | | 3,340,890 | | |
University of California
Refunding Revenue Bonds
Series 2015AO
05/15/27 | | | 5.000 | % | | | 2,000,000 | | | | 2,410,620 | | |
Series 2015I
05/15/27 | | | 5.000 | % | | | 2,000,000 | | | | 2,402,860 | | |
Total | | | | | | | 86,269,797 | | |
COLORADO 1.4% | |
Foothills Metropolitan District
Special Assessment Bonds
Series 2014
12/01/38 | | | 6.000 | % | | | 4,250,000 | | | | 4,508,357 | | |
Regional Transportation District
Certificate of Participation
Series 2014A
06/01/39 | | | 5.000 | % | | | 7,000,000 | | | | 7,768,810 | | |
Total | | | | | | | 12,277,167 | | |
CONNECTICUT 1.3% | |
Connecticut State Development Authority
Revenue Bonds
Alzheimers Resource Center, Inc. Project
Series 2007
08/15/27 | | | 5.500 | % | | | 500,000 | | | | 513,980 | | |
Harbor Point Infrastructure Improvement District
Tax Allocation Bonds
Harbor Point Project
Series 2010A
04/01/39 | | | 7.875 | % | | | 4,000,000 | | | | 4,780,360 | | |
The accompanying Notes to Financial Statements are an integral part of this statement.
Annual Report 2015
9
COLUMBIA HIGH YIELD MUNICIPAL FUND
PORTFOLIO OF INVESTMENTS (continued)
May 31, 2015
Municipal Bonds (continued)
Issue
Description | | Coupon
Rate | | Principal
Amount ($) | | Value ($) | |
Mohegan Tribe of Indians of Connecticut(a)(b)
Revenue Bonds
Public Improvement-Priority Distribution
Series 2001
01/01/31 | | | 6.250 | % | | | 4,475,000 | | | | 4,474,597 | | |
Series 2003
01/01/33 | | | 5.250 | % | | | 1,000,000 | | �� | | 935,210 | | |
Total | | | | | | | 10,704,147 | | |
DELAWARE 0.2% | |
Centerline Equity Issuer Trust
Secured AMT(a)(e)
05/15/19 | | | 6.300 | % | | | 1,000,000 | | | | 1,140,550 | | |
City of Wilmington
Revenue Bonds
Housing-Electra Arms Senior Associates Project
Series 1998 AMT(c)(e)
06/01/28 | | | 6.250 | % | | | 670,000 | | | | 670,255 | | |
Total | | | | | | | 1,810,805 | | |
DISTRICT OF COLUMBIA 0.8% | |
Metropolitan Washington Airports Authority(e)
Refunding Revenue Bonds
Series 2014A AMT
10/01/23 | | | 5.000 | % | | | 2,000,000 | | | | 2,372,540 | | |
Revenue Bonds
Airport System
Series 2012A AMT
10/01/24 | | | 5.000 | % | | | 4,000,000 | | | | 4,633,120 | | |
Total | | | | | | | 7,005,660 | | |
FLORIDA 7.4% | |
Capital Trust Agency, Inc.
Revenue Bonds
Atlantic Housing Foundation
Subordinated Series 2008B(c)
07/15/32 | | | 7.000 | % | | | 1,370,000 | | | | 547,959 | | |
City of Lakeland
Refunding Revenue Bonds
1st Mortgage-Carpenters Home Estates
Series 2008
01/01/28 | | | 6.250 | % | | | 675,000 | | | | 724,113 | | |
01/01/43 | | | 6.375 | % | | | 2,250,000 | | | | 2,388,262 | | |
County of Miami-Dade
Refunding Revenue Bonds
Subordinated Series 2012B
10/01/37 | | | 5.000 | % | | | 1,530,000 | | | | 1,687,743 | | |
County of Miami-Dade(g)
Revenue Bonds
Capital Appreciation
Subordinated Series 2009B
10/01/41 | | | 0.000 | % | | | 20,000,000 | | | | 5,665,400 | | |
Municipal Bonds (continued)
Issue
Description | | Coupon
Rate | | Principal
Amount ($) | | Value ($) | |
Florida Development Finance Corp.
Revenue Bonds
Renaissance Charter School
Series 2010A
09/15/40 | | | 6.000 | % | | | 3,750,000 | | | | 3,899,250 | | |
Series 2012A
06/15/43 | | | 6.125 | % | | | 5,500,000 | | | | 5,595,645 | | |
Renaissance Charter School Projects
Series 2013A
06/15/44 | | | 8.500 | % | | | 5,000,000 | | | | 5,819,450 | | |
Florida Development Finance Corp.(a)
Revenue Bonds
Miami Arts Charter School Project
Series 2014A
06/15/44 | | | 6.000 | % | | | 4,350,000 | | | | 4,401,243 | | |
Mid-Bay Bridge Authority
Prerefunded 10/01/21 Revenue Bonds
Series 2011A
10/01/40 | | | 7.250 | % | | | 4,000,000 | | | | 5,224,800 | | |
Middle Village Community Development District
Special Assessment Bonds
Series 2004A(c)
05/01/35 | | | 6.000 | % | | | 1,855,000 | | | | 1,573,838 | | |
Orange County Health Facilities Authority
Refunding Revenue Bonds
Health Care-Orlando Lutheran Towers
Series 2005
07/01/26 | | | 5.700 | % | | | 2,000,000 | | | | 2,003,780 | | |
Mayflower Retirement Center
Series 2012
06/01/42 5.125% 750,000 794,235
Revenue Bonds
1st Mortgage-Orlando Lutheran Towers
Series 2007
07/01/32 5.500% 350,000 360,409
07/01/38 | | | 5.500 | % | | | 1,750,000 | | | | 1,798,492 | | |
Orange County Industrial Development Authority
Revenue Bonds
VITAG Florida LLC Project
Series 2014 AMT(a)(e)
07/01/36 | | | 8.000 | % | | | 5,000,000 | | | | 5,040,450 | | |
Palm Beach County Health Facilities Authority
Revenue Bonds
Sinai Residences Boca Raton
Series 2014
06/01/49 | | | 7.500 | % | | | 1,250,000 | | | | 1,441,638 | | |
Sarasota County Health Facilities Authority
Refunding Revenue Bonds
Village on the Isle Project
Series 2007
01/01/32 | | | 5.500 | % | | | 4,000,000 | | | | 4,178,080 | | |
The accompanying Notes to Financial Statements are an integral part of this statement.
Annual Report 2015
10
COLUMBIA HIGH YIELD MUNICIPAL FUND
PORTFOLIO OF INVESTMENTS (continued)
May 31, 2015
Municipal Bonds (continued)
Issue
Description | | Coupon
Rate | | Principal
Amount ($) | | Value ($) | |
Seven Oaks Community Development District II
Special Assessment Bonds
Series 2004A
05/01/35 | | | 5.875 | % | | | 380,000 | | | | 357,162 | | |
Series 2004B
05/01/16 | | | 7.500 | % | | | 625,000 | | | | 628,163 | | |
South Lake County Hospital District
Revenue Bonds
South Lake Hospital, Inc.
Series 2010A
04/01/39 | | | 6.250 | % | | | 2,000,000 | | | | 2,207,200 | | |
St. Johns County Industrial Development Authority
Refunding Revenue Bonds
Bayview Project
Series 2007A
10/01/41 | | | 5.250 | % | | | 3,725,000 | | | | 3,251,254 | | |
St. Johns County Industrial Development Authority(c)
Refunding Revenue Bonds
Glenmoor Project
Subordinated Series 2014B
01/01/49 | | | 2.500 | % | | | 1,186,427 | | | | 12 | | |
St. Johns County Industrial Development Authority(h)
Refunding Revenue Bonds
Glenmoor Project
Series 2014A
01/01/49 | | | 1.344 | % | | | 3,206,250 | | | | 1,110,741 | | |
Waterset North Community Development District
Special Assessment Bonds
Series 2007A
05/01/39 | | | 6.600 | % | | | 1,840,000 | | | | 1,804,120 | | |
Westridge Community Development District
Special Assessment Bonds
Series 2005(c)(d)
05/01/37 | | | 5.800 | % | | | 2,650,000 | | | | 998,467 | | |
Total | | | | | | | 63,501,906 | | |
GEORGIA 2.6% | |
DeKalb County Hospital Authority
Revenue Bonds
DeKalb Medical Center, Inc. Project
Series 2010
09/01/40 | | | 6.125 | % | | | 4,500,000 | | | | 4,883,040 | | |
Fulton County Residential Care Facilities for the Elderly Authority
Revenue Bonds
1st Mortgage-Lenbrook Project
Series 2006A
07/01/29 | | | 5.000 | % | | | 3,000,000 | | | | 3,036,030 | | |
Georgia State Road & Tollway Authority
Revenue Bonds
Convertible Cabs I-75 S Expressway
Series 2014S(a)(h)
06/01/49 | | | 0.000 | % | | | 9,100,000 | | | | 4,963,049 | | |
Municipal Bonds (continued)
Issue
Description | | Coupon
Rate | | Principal
Amount ($) | | Value ($) | |
Municipal Electric Authority of Georgia
Revenue Bonds
Series 1991V Escrowed to Maturity
01/01/18 | | | 6.600 | % | | | 530,000 | | | | 577,700 | | |
Rockdale County Development Authority
Revenue Bonds
Visy Paper Project
Series 2007A AMT(e)
01/01/34 | | | 6.125 | % | | | 5,000,000 | | | | 5,137,850 | | |
Savannah Economic Development Authority
Refunding Revenue Bonds
Marshes Skidaway Island Project
Series 2013
01/01/49 | | | 7.250 | % | | | 3,500,000 | | | | 4,018,525 | | |
Total | | | | | | | 22,616,194 | | |
GUAM 0.6% | |
Guam Department of Education
Certificate of Participation
John F. Kennedy High School
Series 2010A(b)
12/01/40 | | | 6.875 | % | | | 4,750,000 | | | | 5,294,730 | | |
HAWAII 0.7% | |
State of Hawaii Department of Budget & Finance
Revenue Bonds
15 Craigside Project
Series 2009A
11/15/44 | | | 9.000 | % | | | 2,375,000 | | | | 3,014,516 | | |
Hawaii Pacific University
Series 2013A
07/01/43 | | | 6.875 | % | | | 2,800,000 | | | | 3,171,000 | | |
Total | | | | | | | 6,185,516 | | |
IDAHO 0.5% | |
Idaho Health Facilities Authority
Revenue Bonds
Terraces of Boise Project
Series 2014A
10/01/49 | | | 8.125 | % | | | 4,000,000 | | | | 4,284,320 | | |
ILLINOIS 8.0% | |
Chicago Park District
Limited General Obligation Refunding Bonds
Limited Tax
Series 2014B
01/01/26 | | | 5.000 | % | | | 1,500,000 | | | | 1,584,615 | | |
City of Chicago
Unlimited General Obligation Bonds
Project
Series 2011A
01/01/40 | | | 5.000 | % | | | 1,000,000 | | | | 941,970 | | |
Series 2009C
01/01/40 | | | 5.000 | % | | | 2,500,000 | | | | 2,354,925 | | |
The accompanying Notes to Financial Statements are an integral part of this statement.
Annual Report 2015
11
COLUMBIA HIGH YIELD MUNICIPAL FUND
PORTFOLIO OF INVESTMENTS (continued)
May 31, 2015
Municipal Bonds (continued)
Issue
Description | | Coupon
Rate | | Principal
Amount ($) | | Value ($) | |
Unlimited General Obligation Refunding Bonds
Series 2014A
01/01/33 | | | 5.250 | % | | | 1,000,000 | | | | 983,050 | | |
01/01/36 | | | 5.000 | % | | | 3,000,000 | | | | 2,844,690 | | |
City of Chicago(f)
Unlimited General Obligation Refunding Bonds
Series 2007F
01/01/42 | | | 5.500 | % | | | 1,000,000 | | | | 990,290 | | |
Du Page County Special Service Area No. 31
Special Tax Bonds
Monarch Landing Project
Series 2006
03/01/36 | | | 5.625 | % | | | 750,000 | | | | 753,818 | | |
Illinois Finance Authority
Prerefunded 08/15/19 Revenue Bonds
Silver Cross & Medical Centers
Series 2009
08/15/44 | | | 7.000 | % | | | 5,000,000 | | | | 6,133,050 | | |
Refunding Revenue Bonds
Chicago Charter School Project
Series 2007
12/01/36 | | | 5.000 | % | | | 1,750,000 | | | | 1,759,818 | | |
Revenue Bonds
CHF-Normal LLC-Illinois State University
Series 2011
04/01/43 | | | 7.000 | % | | | 3,450,000 | | | | 3,995,617 | | |
Columbia College
Series 2007 (NPFGC)
12/01/37 | | | 5.000 | % | | | 5,000,000 | | | | 5,131,250 | | |
Provena Health
Series 2009A
08/15/34 | | | 7.750 | % | | | 4,000,000 | | | | 4,875,400 | | |
Riverside Health System
Series 2009
11/15/35 | | | 6.250 | % | | | 3,000,000 | | | | 3,481,710 | | |
Smith Village Project
Series 2005A
11/15/35 | | | 6.250 | % | | | 2,750,000 | | | | 2,765,867 | | |
Illinois Finance Authority(c)(d)
Revenue Bonds
Leafs Hockey Club Project
Series 2007A
03/01/37 | | | 6.000 | % | | | 1,000,000 | | | | 149,810 | | |
Illinois State Toll Highway Authority
Refunding Revenue Bonds
Series 2014-A
12/01/21 | | | 5.000 | % | | | 1,525,000 | | | | 1,788,627 | | |
Metropolitan Pier & Exposition Authority
Refunding Revenue Bonds
McCormick Place Project
Series 2010B-2
06/15/50 | | | 5.000 | % | | | 5,000,000 | | | | 5,104,800 | | |
Municipal Bonds (continued)
Issue
Description | | Coupon
Rate | | Principal
Amount ($) | | Value ($) | |
Railsplitter Tobacco Settlement Authority
Revenue Bonds
Series 2010
06/01/28 | | | 6.000 | % | | | 5,000,000 | | | | 5,902,750 | | |
Southwestern Illinois Development Authority
Revenue Bonds
Anderson Hospital
Series 2006
08/15/26 | | | 5.125 | % | | | 1,245,000 | | | | 1,259,567 | | |
State of Illinois
Unlimited General Obligation Bonds
Series 2014
05/01/29 | | | 5.000 | % | | | 3,500,000 | | | | 3,616,900 | | |
Village of Annawan
Tax Allocation Bonds
Patriot Renewable Fuels LLC Project
Series 2007
01/01/18 | | | 5.625 | % | | | 2,175,000 | | | | 2,167,910 | | |
Village of Hillside
Tax Allocation Bonds
Senior Lien-Mannheim Redevelopment Project
Series 2008
01/01/28 | | | 7.000 | % | | | 5,240,000 | | | | 5,639,078 | | |
Village of Lincolnshire
Special Tax Bonds
Sedgebrook Project
Series 2004
03/01/34 | | | 6.250 | % | | | 673,000 | | | | 684,279 | | |
Volo Village Special Service Area No. 3
Special Tax Bonds
Symphony Meadows Project
Series 2006-1
03/01/36 | | | 6.000 | % | | | 3,489,000 | | | | 3,507,038 | | |
Total | | | | | | | 68,416,829 | | |
INDIANA 0.4% | |
City of Portage
Tax Allocation Bonds
Ameriplex Project
Series 2006
07/15/23 | | | 5.000 | % | | | 700,000 | | | | 715,386 | | |
Indiana Health & Educational Facilities Financing Authority
Prerefunded 11/15/15 Revenue Bonds
Baptist Homes of Indiana
Series 2005
11/15/35 | | | 5.250 | % | | | 2,750,000 | | | | 2,812,013 | | |
Total | | | | | | | 3,527,399 | | |
The accompanying Notes to Financial Statements are an integral part of this statement.
Annual Report 2015
12
COLUMBIA HIGH YIELD MUNICIPAL FUND
PORTFOLIO OF INVESTMENTS (continued)
May 31, 2015
Municipal Bonds (continued)
Issue
Description | | Coupon
Rate | | Principal
Amount ($) | | Value ($) | |
IOWA 1.0% | |
Iowa Finance Authority
Revenue Bonds
Iowa Fertilizer Co. Project
Series 2013
12/01/25 | | | 5.250 | % | | | 5,000,000 | | | | 5,553,400 | | |
Iowa Finance Authority(c)(h)
Refunding Revenue Bonds
Deerfield Retirement Community
Series 2014
05/15/56 | | | 0.000 | % | | | 401,062 | | | | 401 | | |
Iowa Finance Authority(h)
Refunding Revenue Bonds
Deerfield Retirement Community
Series 2014
11/15/46 | | | 2.700 | % | | | 2,138,019 | | | | 883,130 | | |
Iowa Student Loan Liquidity Corp.
Revenue Bonds
Senior Series 2011A-2 AMT(e)
12/01/30 | | | 5.850 | % | | | 1,800,000 | | | | 1,931,058 | | |
Total | | | | | | | 8,367,989 | | |
KANSAS 1.9% | |
City of Lenexa
Revenue Bonds
Lakeview Village, Inc. Project
Series 2009
05/15/29 | | | 7.125 | % | | | 500,000 | | | | 561,765 | | |
05/15/39 | | | 7.250 | % | | | 1,500,000 | | | | 1,680,120 | | |
City of Manhattan
Revenue Bonds
Meadowlark Hills Retirement Foundation
Series 2007A
05/15/29 | | | 5.000 | % | | | 2,680,000 | | | | 2,702,324 | | |
City of Overland Park
Revenue Bonds
Prairiefire-Lionsgate Project
Series 2012
12/15/32 | | | 6.000 | % | | | 6,000,000 | | | | 5,961,240 | | |
Wyandotte County-Kansas City Unified Government
Revenue Bonds
Legends Village West Project
Series 2006
10/01/28 | | | 4.875 | % | | | 5,245,000 | | | | 5,251,714 | | |
Total | | | | | | | 16,157,163 | | |
KENTUCKY 0.1% | |
Kentucky Economic Development Finance Authority
Revenue Bonds
Louisville Arena
Subordinated Series 2008A-1 (AGM)
12/01/38 | | | 6.000 | % | | | 1,150,000 | | | | 1,227,959 | | |
Municipal Bonds (continued)
Issue
Description | | Coupon
Rate | | Principal
Amount ($) | | Value ($) | |
LOUISIANA 3.4% | |
Juban Crossing Economic Development District
Refunding Revenue Bonds
Drainage Projects
Series 2015B
09/15/44 | | | 7.000 | % | | | 750,000 | | | | 758,415 | | |
General Infrastructure Projects
Series 2015C
09/15/44 | | | 7.000 | % | | | 3,665,000 | | | | 3,706,121 | | |
Road Projects
Series 2015A
09/15/44 | | | 7.000 | % | | | 1,335,000 | | | | 1,349,979 | | |
Louisiana Local Government Environmental Facilities & Community Development Authority
Revenue Bonds
Westlake Chemical Corp.
Series 2010A-2
11/01/35 | | | 6.500 | % | | | 5,000,000 | | | | 5,999,750 | | |
Louisiana Public Facilities Authority(e)
Revenue Bonds
Impala Warehousing LLC Project
Series 2013 AMT
07/01/36 | | | 6.500 | % | | | 5,000,000 | | | | 5,774,150 | | |
Louisiana Pellets, Inc. Project
Series 2013 AMT
07/01/39 | | | 10.500 | % | | | 5,000,000 | | | | 5,463,850 | | |
New Orleans Aviation Board
Revenue Bonds
Consolidated Rental Car
Series 2009A
01/01/40 | | | 6.500 | % | | | 5,000,000 | | | | 5,693,350 | | |
Total | | | | | | | 28,745,615 | | |
MARYLAND 0.7% | |
Maryland Economic Development Corp.
Revenue Bonds
University of Maryland-College Park Projects
Series 2008
06/01/43 | | | 5.875 | % | | | 2,590,000 | | | | 2,820,847 | | |
Maryland Health & Higher Educational Facilities Authority
Refunding Revenue Bonds
University of Maryland Medical System
Series 2015
07/01/34 | | | 5.000 | % | | | 2,750,000 | | | | 3,024,312 | | |
Resolution Trust Corp.
Pass-Through Certificates
Series 1993A(c)
12/01/16 | | | 8.500 | % | | | 455,481 | | | | 455,131 | | |
Total | | | | | | | 6,300,290 | | |
The accompanying Notes to Financial Statements are an integral part of this statement.
Annual Report 2015
13
COLUMBIA HIGH YIELD MUNICIPAL FUND
PORTFOLIO OF INVESTMENTS (continued)
May 31, 2015
Municipal Bonds (continued)
Issue
Description | | Coupon
Rate | | Principal
Amount ($) | | Value ($) | |
MASSACHUSETTS 2.3% | |
Massachusetts Development Finance Agency
Refunding Revenue Bonds
1st Mortgage-VOA Concord
Series 2007
11/01/41 | | | 5.200 | % | | | 1,000,000 | | | | 976,380 | | |
Revenue Bonds
Foxborough Regional Charter School
Series 2010A
07/01/42 | | | 7.000 | % | | | 4,200,000 | | | | 4,735,626 | | |
Linden Ponds, Inc. Facility
Series 2011A-2
11/15/46 | | | 5.500 | % | | | 279,667 | | | | 238,766 | | |
Massachusetts Development Finance Agency(c)(g)
Revenue Bonds
Linden Ponds, Inc. Facility
Series 2011B
11/15/56 | | | 0.000 | % | | | 1,391,019 | | | | 8,443 | | |
Massachusetts Educational Financing Authority(e)
Revenue Bonds
Education Loan
Series 2014-I AMT
01/01/21 | | | 5.000 | % | | | 1,885,000 | | | | 2,097,100 | | |
Series 2008H (AGM) AMT
01/01/30 | | | 6.350 | % | | | 1,960,000 | | | | 2,066,448 | | |
Series 2012J AMT
07/01/21 | | | 5.000 | % | | | 3,000,000 | | | | 3,350,220 | | |
Massachusetts Health & Educational Facilities Authority
Prerefunded 07/01/18 Revenue Bonds
Boston Medical Center
Series 2008
07/01/38 | | | 5.250 | % | | | 525,000 | | | | 590,132 | | |
Revenue Bonds
Milford Regional Medical Center
Series 2007E
07/15/32 | | | 5.000 | % | | | 1,250,000 | | | | 1,269,837 | | |
Unrefunded Revenue Bonds
Boston Medical Center
Series 2008
07/01/38 | | | 5.250 | % | | | 4,475,000 | | | | 4,690,203 | | |
Total | | | | | | | 20,023,155 | | |
MICHIGAN 3.4% | |
Allen Academy
Refunding Revenue Bonds
Public School Academy
Series 2013
06/01/33 | | | 6.000 | % | | | 5,750,000 | | | | 5,808,132 | | |
City of Detroit Sewage Disposal System
Refunding Revenue Bonds
Senior Lien
Series 2012A
07/01/23 | | | 5.000 | % | | | 3,025,000 | | | | 3,384,128 | | |
07/01/39 | | | 5.250 | % | | | 1,375,000 | | | | 1,469,628 | | |
Municipal Bonds (continued)
Issue
Description | | Coupon
Rate | | Principal
Amount ($) | | Value ($) | |
City of Detroit Water Supply System
Revenue Bonds
Senior Lien
Series 2011A
07/01/41 | | | 5.250 | % | | | 1,445,000 | | | | 1,529,691 | | |
Series 2011C
07/01/41 | | | 5.000 | % | | | 1,025,000 | | | | 1,071,412 | | |
Michigan Finance Authority
Refunding Revenue Bonds
Series 2014H1
10/01/22 | | | 5.000 | % | | | 1,075,000 | | | | 1,234,498 | | |
Revenue Bonds
School District of the City of Detroit
Series 2012
06/01/20 | | | 5.000 | % | | | 1,000,000 | | | | 1,094,590 | | |
Michigan State Hospital Finance Authority
Refunding Revenue Bonds
Henry Ford Health System
Series 2006A
11/15/46 | | | 5.250 | % | | | 3,000,000 | | | | 3,131,520 | | |
Michigan Tobacco Settlement Finance Authority
Revenue Bonds
Senior Series 2007A
06/01/34 | | | 6.000 | % | | | 1,000,000 | | | | 877,250 | | |
06/01/48 | | | 6.000 | % | | | 11,000,000 | | | | 9,195,340 | | |
Summit Academy North
Refunding Revenue Bonds
Series 2005
11/01/35 | | | 5.500 | % | | | 750,000 | | | | 732,885 | | |
Total | | | | | | | 29,529,074 | | |
MINNESOTA 1.4% | |
City of Anoka
Revenue Bonds
Homestead Anoka, Inc. Project
Series 2011A
11/01/46 | | | 7.000 | % | | | 4,070,000 | | | | 4,370,000 | | |
City of Eveleth
Refunding Revenue Bonds
Arrowhead Senior Living Community
Series 2007
10/01/27 | | | 5.200 | % | | | 2,375,000 | | | | 2,348,020 | | |
Minneapolis/St. Paul Housing Finance Board
Revenue Bonds
Mortgage-Backed Securities Program-Cityliving
Series 2006A-2 (GNMA/FNMA) AMT(e)
12/01/38 | | | 5.000 | % | | | 9,452 | | | | 9,462 | | |
The accompanying Notes to Financial Statements are an integral part of this statement.
Annual Report 2015
14
COLUMBIA HIGH YIELD MUNICIPAL FUND
PORTFOLIO OF INVESTMENTS (continued)
May 31, 2015
Municipal Bonds (continued)
Issue
Description | | Coupon
Rate | | Principal
Amount ($) | | Value ($) | |
St. Paul Housing & Redevelopment Authority
Revenue Bonds
Healtheast Project
Series 2005
11/15/30 | | | 6.000 | % | | | 3,000,000 | | | | 3,061,770 | | |
11/15/35 | | | 6.000 | % | | | 2,000,000 | | | | 2,041,000 | | |
Total | | | | | | | 11,830,252 | | |
MISSISSIPPI 0.4% | |
County of Lowndes
Refunding Revenue Bonds
Weyerhaeuser Co. Project
Series 1992A
04/01/22 | | | 6.800 | % | | | 1,995,000 | | | | 2,509,670 | | |
County of Lowndes(h)
Refunding Revenue Bonds
Weyerhaeuser Co. Project
Series 1992B
04/01/22 | | | 6.700 | % | | | 230,000 | | | | 286,681 | | |
Rankin County Five Lakes Utility District
Series 1994(c)
07/15/37 | | | 7.000 | % | | | 240,000 | | | | 240,166 | | |
Total | | | | | | | 3,036,517 | | |
MISSOURI 3.1% | |
City of Kansas City
Tax Allocation Bonds
Kansas City-Maincor Project
Series 2007A Escrowed to Maturity
03/01/18 | | | 5.250 | % | | | 700,000 | | | | 750,995 | | |
Shoal Creek Parkway Project
Series 2011
06/01/25 | | | 6.500 | % | | | 2,900,000 | | | | 2,930,537 | | |
City of Manchester
Refunding Tax Allocation Bonds
Highway 141/Manchester Road Project
Series 2010
11/01/39 | | | 6.875 | % | | | 5,000,000 | | | | 5,290,650 | | |
Grundy County Industrial Development Authority
Revenue Bonds
Wright Memorial Hospital
Series 2009
09/01/34 | | | 6.750 | % | | | 2,250,000 | | | | 2,422,237 | | |
Kirkwood Industrial Development Authority
Revenue Bonds
Aberdeen Heights
Series 2010A
05/15/45 | | | 8.250 | % | | | 4,500,000 | | | | 5,127,615 | | |
Saline County Industrial Development Authority
Revenue Bonds
John Fitzgibbon Memorial Hospital, Inc.
Series 2005
12/01/35 | | | 5.625 | % | | | 5,485,000 | | | | 5,529,977 | | |
Municipal Bonds (continued)
Issue
Description | | Coupon
Rate | | Principal
Amount ($) | | Value ($) | |
St. Louis County Industrial Development Authority
Refunding Revenue Bonds
Ranken Jordan Project
Series 2007
11/15/35 | | | 5.000 | % | | | 1,300,000 | | | | 1,291,745 | | |
Revenue Bonds
St. Andrews Residence for Seniors
Series 2007A
12/01/41 | | | 6.375 | % | | | 3,000,000 | | | | 3,106,350 | | |
Total | | | | | | | 26,450,106 | | |
MONTANA 0.1% | |
Montana Facility Finance Authority
Revenue Bonds
Senior Living-St. John's Lutheran Ministry
Series 2006A
05/15/36 | | | 6.125 | % | | | 1,000,000 | | | | 1,021,910 | | |
NEBRASKA 1.7% | |
Central Plains Energy Project
Revenue Bonds
Project #3
Series 2012
09/01/42 | | | 5.000 | % | | | 5,000,000 | | | | 5,350,900 | | |
Public Power Generation Agency
Refunding Revenue Bonds
Whelan Energy Center Unit
Series 2015
01/01/28 | | | 5.000 | % | | | 8,000,000 | | | | 9,102,880 | | |
Total | | | | | | | 14,453,780 | | |
NEVADA 0.9% | |
City of Sparks
Tax Anticipation Revenue Bonds
Senior Sales
Series 2008A(a)
06/15/28 | | | 6.750 | % | | | 5,000,000 | | | | 5,369,100 | | |
State of Nevada Department of Business & Industry
Revenue Bonds
Somerset Academy
Series 2015A(a)
12/15/45 | | | 5.125 | % | | | 2,515,000 | | | | 2,499,558 | | |
Total | | | | | | | 7,868,658 | | |
NEW HAMPSHIRE —% | |
New Hampshire Business Finance Authority
Revenue Bonds
Pennichuck Water Works, Inc. Project
Series 1988 Escrowed to Maturity AMT(e)(h)
07/01/18 | | | 7.500 | % | | | 125,000 | | | | 136,730 | | |
The accompanying Notes to Financial Statements are an integral part of this statement.
Annual Report 2015
15
COLUMBIA HIGH YIELD MUNICIPAL FUND
PORTFOLIO OF INVESTMENTS (continued)
May 31, 2015
Municipal Bonds (continued)
Issue
Description | | Coupon
Rate | | Principal
Amount ($) | | Value ($) | |
NEW JERSEY 3.2% | |
Middlesex County Improvement Authority(c)(d)
Revenue Bonds
Heldrich Center Hotel
Series 2005C
01/01/37 | | | 8.750 | % | | | 1,250,000 | | | | 61,938 | | |
Subordinated Revenue Bonds
Heldrich Center Hotel
Series 2005B
01/01/25 | | | 6.125 | % | | | 2,750,000 | | | | 137,088 | | |
01/01/37 | | | 6.250 | % | | | 6,450,000 | | | | 316,050 | | |
New Jersey Economic Development Authority
Refunding Revenue Bonds
Seabrook Village, Inc. Facility
Series 2006
11/15/36 | | | 5.250 | % | | | 2,250,000 | | | | 2,288,857 | | |
Revenue Bonds
Provident Group-Rowan Properties LLC
Series 2015
01/01/48 | | | 5.000 | % | | | 960,000 | | | | 1,010,774 | | |
New Jersey Economic Development Authority(e)
Refunding Revenue Bonds
Series 2006B AMT
01/01/37 | | | 6.875 | % | | | 3,990,000 | | | | 4,011,666 | | |
Revenue Bonds
UMM Energy Partners LLC
Series 2012A AMT
06/15/43 | | | 5.125 | % | | | 2,000,000 | | | | 2,106,160 | | |
New Jersey Health Care Facilities Financing Authority
Revenue Bonds
St. Josephs Healthcare Systems
Series 2008
07/01/38 | | | 6.625 | % | | | 3,000,000 | | | | 3,323,130 | | |
New Jersey Higher Education Student Assistance Authority(e)
Revenue Bonds
Senior Series 2013-1A AMT
12/01/21 | | | 5.000 | % | | | 1,500,000 | | | | 1,681,905 | | |
Senior Series 2014-1A-1 AMT
12/01/22 | | | 5.000 | % | | | 1,000,000 | | | | 1,121,020 | | |
Subordinated Series 2013-1B AMT
12/01/43 | | | 4.750 | % | | | 5,000,000 | | | | 5,044,000 | | |
New Jersey Transportation Trust Fund Authority
Revenue Bonds
Capital Appreciation Transportation System
Series 2006C(g)
12/15/32 | | | 0.000 | % | | | 10,000,000 | | | | 4,365,900 | | |
Tobacco Settlement Financing Corp.
Revenue Bonds
Capital Appreciation
Series 2007-1C(g)
06/01/41 | | | 0.000 | % | | | 7,500,000 | | | | 1,800,450 | | |
Total | | | | | | | 27,268,938 | | |
Municipal Bonds (continued)
Issue
Description | | Coupon
Rate | | Principal
Amount ($) | | Value ($) | |
NEW YORK 4.0% | |
Build NYC Resource Corp.
Revenue Bonds
International Leadership Charter School
Series 2013
07/01/43 | | | 6.000 | % | | | 4,330,000 | | | | 4,187,240 | | |
City of New York
Unlimited General Obligation Refunding Bonds
Series 2014J
08/01/23 | | | 5.000 | % | | | 3,000,000 | | | | 3,602,910 | | |
Series 2015C
08/01/27 | | | 5.000 | % | | | 4,000,000 | | | | 4,730,760 | | |
Jefferson County Industrial Development Agency
Revenue Bonds
Green Bonds
Series 2014 AMT(e)
01/01/24 | | | 5.250 | % | | | 1,900,000 | | | | 1,812,676 | | |
Nassau County Tobacco Settlement Corp.
Asset-Backed Revenue Bonds
Capital Appreciation
Third Series 2006D(g)
06/01/60 | | | 0.000 | % | | | 25,000,000 | | | | 110,500 | | |
New York City Water & Sewer System
Refunding Revenue Bonds
2nd General Resolution
Series 2015FF
06/15/27 | | | 5.000 | % | | | 2,645,000 | | | | 3,172,862 | | |
New York State Dormitory Authority
Prerefunded 07/01/17 Revenue Bonds
New York University Hospital Center
Series 2007B
07/01/37 | | | 5.625 | % | | | 2,000,000 | | | | 2,204,340 | | |
Revenue Bonds
NYU Hospitals Center
Series 2011A
07/01/40 | | | 6.000 | % | | | 1,000,000 | | | | 1,147,700 | | |
Port Authority of New York & New Jersey(e)
Refunding Revenue Bonds
Consolidated 186th
Series 2014-186 AMT
10/15/22 | | | 5.000 | % | | | 5,000,000 | | | | 5,882,100 | | |
Revenue Bonds
5th Installment-Special Project
Series 1996-4 AMT
10/01/19 | | | 6.750 | % | | | 120,000 | | | | 119,983 | | |
Triborough Bridge & Tunnel Authority
Refunding Revenue Bonds
General
Series 2012B(g)
11/15/32 | | | 0.000 | % | | | 13,185,000 | | | | 7,120,164 | | |
Total | | | | | | | 34,091,235 | | |
The accompanying Notes to Financial Statements are an integral part of this statement.
Annual Report 2015
16
COLUMBIA HIGH YIELD MUNICIPAL FUND
PORTFOLIO OF INVESTMENTS (continued)
May 31, 2015
Municipal Bonds (continued)
Issue
Description | | Coupon
Rate | | Principal
Amount ($) | | Value ($) | |
NORTH CAROLINA 0.8% | |
Durham Housing Authority
Revenue Bonds
Magnolia Pointe Apartments
Series 2005 AMT(c)(e)
02/01/38 | | | 5.650 | % | | | 3,108,315 | | | | 3,157,706 | | |
North Carolina Eastern Municipal Power Agency
Revenue Bonds
Series 1991A Escrowed to Maturity
01/01/18 | | | 6.500 | % | | | 3,320,000 | | | | 3,790,079 | | |
Total | | | | | | | 6,947,785 | | |
NORTH DAKOTA 0.4% | |
City of Fargo
Revenue Bonds
Sanford Obligation Group
Series 2011
11/01/31 | | | 6.250 | % | | | 2,500,000 | | | | 3,029,875 | | |
OHIO 1.2% | |
County of Lucas
Improvement Refunding Revenue Bonds
Lutheran Homes
Series 2010A
11/01/45 | | | 7.000 | % | | | 5,000,000 | | | | 5,509,400 | | |
State of Ohio
Revenue Bonds
Portsmouth Bypass Project
Series 2015 AMT(e)
12/31/39 | | | 5.000 | % | | | 4,100,000 | | | | 4,395,159 | | |
Summit County Port Authority
Revenue Bonds
Seville Project
Series 2005A
05/15/25 | | | 5.100 | % | | | 375,000 | | | | 375,217 | | |
Total | | | | | | | 10,279,776 | | |
OKLAHOMA 0.2% | |
Oklahoma Development Finance Authority
Refunding Revenue Bonds
Inverness Village Community
Series 2012
01/01/32 | | | 6.000 | % | | | 2,000,000 | | | | 2,101,840 | | |
OREGON 1.3% | |
City of Forest Grove
Revenue Bonds
Oak Tree Foundation Project
Series 2007
03/01/37 | | | 5.500 | % | | | 2,830,000 | | | | 2,921,013 | | |
Municipal Bonds (continued)
Issue
Description | | Coupon
Rate | | Principal
Amount ($) | | Value ($) | |
Cow Creek Band of Umpqua Tribe of Indians
Revenue Bonds
Series 2006C(a)(b)
10/01/26 | | | 5.625 | % | | | 1,700,000 | | | | 1,730,940 | | |
Hospital Facilities Authority of Multnomah County
Refunding Revenue Bonds
Mirabella at South Waterfront
Series 2014A
10/01/49 | | | 5.500 | % | | | 3,115,000 | | | | 3,437,122 | | |
Warm Springs Reservation Confederated Tribe
Revenue Bonds
Pelton Round Butte Tribal
Series 2009B(b)
11/01/33 | | | 6.375 | % | | | 2,410,000 | | | | 2,661,363 | | |
Total | | | | | | | 10,750,438 | | |
PENNSYLVANIA 4.2% | |
Dauphin County Industrial Development Authority
Revenue Bonds
Dauphin Consolidated Water Supply
Series 1992A AMT(e)
06/01/24 | | | 6.900 | % | | | 3,200,000 | | | | 3,994,912 | | |
Montgomery County Industrial Development Authority
Refunding Revenue Bonds
Albert Einstein Healthcare
Series 2015(f)
01/15/46 | | | 5.250 | % | | | 1,250,000 | | | | 1,306,612 | | |
Pennsylvania Economic Development Financing Authority
Revenue Bonds
Philadelphia Biosolids Facility
Series 2009
01/01/32 | | | 6.250 | % | | | 3,375,000 | | | | 3,763,665 | | |
Pennsylvania Economic Development Financing Authority(e)
Revenue Bonds
PA Bridges Finco LP
Series 2015 AMT
06/30/42 | | | 5.000 | % | | | 1,050,000 | | | | 1,123,804 | | |
Pennsylvania Higher Educational Facilities Authority
Revenue Bonds
Edinboro University Foundation
Series 2010
07/01/30 | | | 5.800 | % | | | 2,500,000 | | | | 2,698,075 | | |
Shippensburg University
Series 2011
10/01/43 | | | 6.250 | % | | | 2,000,000 | | | | 2,222,440 | | |
Pennsylvania Housing Finance Agency
Revenue Bonds
Series 2013-115A AMT(e)
10/01/33 | | | 4.200 | % | | | 5,000,000 | | | | 5,165,050 | | |
The accompanying Notes to Financial Statements are an integral part of this statement.
Annual Report 2015
17
COLUMBIA HIGH YIELD MUNICIPAL FUND
PORTFOLIO OF INVESTMENTS (continued)
May 31, 2015
Municipal Bonds (continued)
Issue
Description | | Coupon
Rate | | Principal
Amount ($) | | Value ($) | |
Pennsylvania Industrial Development Authority
Prerefunded 07/01/18 Revenue Bonds
Economic Development
Series 2008
07/01/23 | | | 5.500 | % | | | 295,000 | | | | 333,734 | | |
Pennsylvania Turnpike Commission
Subordinated Refunding Revenue Bonds
Series 2015A-1
12/01/28 | | | 5.000 | % | | | 3,300,000 | | | | 3,736,887 | | |
Philadelphia Authority for Industrial Development
Revenue Bonds
1st Philadelphia Preparatory Charter School
Series 2014
06/15/33 | | | 7.000 | % | | | 1,870,000 | | | | 2,093,166 | | |
State Public School Building Authority
Refunding Revenue Bonds
Philadelphia School District
Series 2015
06/01/25 | | | 5.000 | % | | | 8,000,000 | | | | 9,163,280 | | |
Total | | | | | | | 35,601,625 | | |
PUERTO RICO 3.5% | |
Commonwealth of Puerto Rico(b)
Refunding Unlimited General Obligation Bonds
Public Improvement
Series 2012A
07/01/41 | | | 5.000 | % | | | 2,000,000 | | | | 1,395,060 | | |
Unlimited General Obligation Bonds
Series 2014A
07/01/35 | | | 8.000 | % | | | 13,000,000 | | | | 10,935,990 | | |
Puerto Rico Commonwealth Aqueduct & Sewer Authority
Revenue Bonds
Senior Lien
Series 2012A(b)
07/01/42 | | | 5.250 | % | | | 2,525,000 | | | | 1,811,738 | | |
Puerto Rico Electric Power Authority(b)
Refunding Revenue Bonds
Series 2010ZZ
07/01/25 | | | 5.250 | % | | | 2,000,000 | | | | 1,188,660 | | |
Revenue Bonds
Series 2013A
07/01/36 | | | 6.750 | % | | | 1,000,000 | | | | 590,040 | | |
07/01/43 | | | 7.000 | % | | | 6,570,000 | | | | 3,859,875 | | |
Puerto Rico Highways & Transportation Authority
Refunding Revenue Bonds
Series 2007N(b)
07/01/21 | | | 5.500 | % | | | 760,000 | | | | 473,670 | | |
Puerto Rico Industrial Tourist Educational, Medical & Environmental Control Facilities Financing Authority
Revenue Bonds
Cogen Facilities AES Puerto Rico Project
Series 2000 AMT(b)(e)
06/01/26 | | | 6.625 | % | | | 5,820,000 | | | | 5,504,847 | | |
Municipal Bonds (continued)
Issue
Description | | Coupon
Rate | | Principal
Amount ($) | | Value ($) | |
Puerto Rico Sales Tax Financing Corp.(b)
Revenue Bonds
1st Subordinated Series 2009B
08/01/44 | | | 6.500 | % | | | 1,000,000 | | | | 652,560 | | |
1st Subordinated Series 2010A
08/01/39 | | | 5.375 | % | | | 5,155,000 | | | | 3,176,923 | | |
1st Subordinated Series 2010C
08/01/41 | | | 5.250 | % | | | 1,000,000 | | | | 605,050 | | |
Total | | | | | | | 30,194,413 | | |
SOUTH CAROLINA 2.3% | |
Laurens County School District No. 055
Revenue Bonds
Series 2005
12/01/30 | | | 5.250 | % | | | 1,300,000 | | | | 1,323,296 | | |
South Carolina Jobs-Economic Development Authority
Refunding Revenue Bonds
1st Mortgage-Lutheran Homes
Series 2007
05/01/28 | | | 5.500 | % | | | 2,300,000 | | | | 2,356,718 | | |
1st Mortgage-Wesley Commons
Series 2006
10/01/36 | | | 5.300 | % | | | 4,000,000 | | | | 4,009,840 | | |
Revenue Bonds
Kershaw County Medical Center Project
Series 2008
09/15/38 | | | 6.000 | % | | | 5,050,000 | | | | 5,529,901 | | |
Lutheran Homes of South Carolina, Inc. Obligation Group
Series 2013
05/01/43 | | | 5.000 | % | | | 750,000 | | | | 767,753 | | |
05/01/48 | | | 5.125 | % | | | 1,500,000 | | | | 1,536,315 | | |
York Preparatory Academy Project
Series 2014A
11/01/45 | | | 7.250 | % | | | 4,000,000 | | | | 4,407,080 | | |
Total | | | | | | | 19,930,903 | | |
TENNESSEE 0.1% | |
Shelby County Health Educational & Housing Facilities Board
Prerefunded 12/01/16 Revenue Bonds
Village at Germantown, Inc.
Series 2006
12/01/34 | | | 6.250 | % | | | 450,000 | | | | 485,199 | | |
TEXAS 7.8% | |
Capital Area Cultural Education Facilities Finance Corp.
Revenue Bonds
Roman Catholic Diocese
Series 2005B(h)
04/01/45 | | | 6.125 | % | | | 5,000,000 | | | | 5,747,000 | | |
Central Texas Regional Mobility Authority
Revenue Bonds
Subordinated Lien
Series 2011
01/01/41 | | | 6.750 | % | | | 5,000,000 | | | | 6,048,150 | | |
The accompanying Notes to Financial Statements are an integral part of this statement.
Annual Report 2015
18
COLUMBIA HIGH YIELD MUNICIPAL FUND
PORTFOLIO OF INVESTMENTS (continued)
May 31, 2015
Municipal Bonds (continued)
Issue
Description | | Coupon
Rate | | Principal
Amount ($) | | Value ($) | |
Central Texas Turnpike System
Refunding Revenue Bonds
Series 2015B
08/15/37 | | | 5.000 | % | | | 5,000,000 | | | | 5,527,850 | | |
City of Dallas Waterworks & Sewer System
Refunding Revenue Bonds
Series 2015A
10/01/27 | | | 5.000 | % | | | 3,000,000 | | | | 3,626,280 | | |
City of Houston Airport System
Refunding Revenue Bonds
Special Facilities Continental
Series 2011A AMT(e)
07/15/38 | | | 6.625 | % | | | 4,000,000 | | | | 4,644,360 | | |
Dallas County Flood Control District No. 1
Unlimited General Obligation Refunding Bonds
Series 2002
04/01/32 | | | 7.250 | % | | | 1,000,000 | | | | 1,003,110 | | |
Deaf Smith County Hospital District
Limited General Obligation Bonds
Series 2010A
03/01/40 | | | 6.500 | % | | | 4,000,000 | | | | 4,445,320 | | |
Gulf Coast Industrial Development Authority
Revenue Bonds
Citgo Petroleum Project
Series 1998 AMT(e)(h)
04/01/28 | | | 8.000 | % | | | 875,000 | | | | 876,566 | | |
HFDC of Central Texas, Inc.
Revenue Bonds
Series 2006A
11/01/36 | | | 5.750 | % | | | 5,000,000 | | | | 5,052,350 | | |
La Vernia Higher Education Finance Corp.
Prerefunded 08/15/19 Revenue Bonds
Kipp, Inc.
Series 2009A
08/15/29 | | | 6.000 | % | | | 1,000,000 | | | | 1,180,050 | | |
08/15/39 | | | 6.250 | % | | | 1,500,000 | | | | 1,785,300 | | |
Mission Economic Development Corp
Revenue Bonds
Dallas Clean Energy McCommas
Series 2011 AMT(e)
12/01/24 | | | 6.875 | % | | | 5,000,000 | | | | 5,240,150 | | |
Pharr Higher Education Finance Authority
Revenue Bonds
Idea Public Schools
Series 2009A
08/15/39 | | | 6.500 | % | | | 3,000,000 | | | | 3,404,670 | | |
Red River Health Facilities Development Corp.
Revenue Bonds
MRC Crossings Project
Series 2014A
11/15/49 | | | 8.000 | % | | | 2,000,000 | | | | 2,374,680 | | |
Municipal Bonds (continued)
Issue
Description | | Coupon
Rate | | Principal
Amount ($) | | Value ($) | |
Sanger Industrial Development Corp.
Revenue Bonds
Texas Pellets Project
Series 2012B AMT(e)
07/01/38 | | | 8.000 | % | | | 5,000,000 | | | | 5,616,150 | | |
Tarrant County Cultural Education Facilities Finance Corp.
Revenue Bonds
Air Force Villages, Inc. Obligation
Series 2009
11/15/44 | | | 6.375 | % | | | 4,250,000 | | | | 4,624,213 | | |
CC Young Memorial Home
Series 2009A
02/15/38 | | | 8.000 | % | | | 4,000,000 | | | | 4,542,560 | | |
Texas Municipal Gas Acquisition & Supply Corp. III
Revenue Bonds
Series 2012
12/15/32 | | | 5.000 | % | | | 1,250,000 | | | | 1,349,275 | | |
Total | | | | | | | 67,088,034 | | |
VIRGIN ISLANDS 0.8% | |
Virgin Islands Public Finance Authority
Revenue Bonds
Matching Fund Loan Notes-Senior Lien
Series 2012-A(b)
10/01/32 | | | 5.000 | % | | | 3,785,000 | | | | 4,093,478 | | |
Virgin Islands Water & Power Authority — Electric System
Refunding Revenue Bonds
Series 2012A(b)
07/01/21 | | | 4.000 | % | | | 3,000,000 | | | | 3,068,370 | | |
Total | | | | | | | 7,161,848 | | |
VIRGINIA 3.2% | |
Alexandria Industrial Development Authority
Refunding Revenue Bonds
Goodwin House, Inc.
Series 2015
10/01/45 | | | 5.000 | % | | | 5,725,000 | | | | 6,007,529 | | |
10/01/50 | | | 5.000 | % | | | 2,275,000 | | | | 2,385,360 | | |
Bristol Industrial Development Authority
Revenue Bonds
Falls at Bristol Project
Series 2014B
11/01/44 | | | 6.350 | % | | | 4,250,000 | | | | 4,258,670 | | |
City of Chesapeake Expressway Toll Road
Refunding Revenue Bonds
Convertible Cabs Transportation System
Series 2012(h)
07/15/40 | | | 0.000 | % | | | 7,530,000 | | | | 5,240,428 | | |
Mosaic District Community Development Authority
Special Assessment Bonds
Series 2011A
03/01/36 | | | 6.875 | % | | | 2,500,000 | | | | 2,858,450 | | |
The accompanying Notes to Financial Statements are an integral part of this statement.
Annual Report 2015
19
COLUMBIA HIGH YIELD MUNICIPAL FUND
PORTFOLIO OF INVESTMENTS (continued)
May 31, 2015
Municipal Bonds (continued)
Issue
Description | | Coupon
Rate | | Principal
Amount ($) | | Value ($) | |
Tobacco Settlement Financing Corp.
Revenue Bonds
Senior Series 2007-B1
06/01/47 | | | 5.000 | % | | | 10,000,000 | | | | 7,046,100 | | |
Total | | | | | | | 27,796,537 | | |
WASHINGTON 1.5% | |
Greater Wenatchee Regional Events Center Public Facilities District
Revenue Bonds
Series 2012A
09/01/42 | | | 5.500 | % | | | 2,150,000 | | | | 2,251,179 | | |
Port of Seattle Industrial Development Corp.
Refunding Revenue Bonds
Special Facilities Delta Air Lines, Inc.
Series 2012 AMT(e)
04/01/30 | | | 5.000 | % | | | 2,500,000 | | | | 2,599,225 | | |
Tacoma Consolidated Local Improvement Districts
Special Assessment Bonds
No. 65
Series 2013
04/01/43 | | | 5.750 | % | | | 2,270,000 | | | | 2,288,569 | | |
Washington State Housing Finance Commission
Refunding Revenue Bonds
Nonprofit Housing-Mirabella
Series 2012
10/01/47 | | | 6.750 | % | | | 5,000,000 | | | | 5,429,500 | | |
Total | | | | | | | 12,568,473 | | |
WISCONSIN 0.9% | |
Wisconsin Health & Educational Facilities Authority
Revenue Bonds
Medical College of Wisconsin
Series 2008A
12/01/35 | | | 5.250 | % | | | 5,000,000 | | | | 5,506,600 | | |
St. John's Community, Inc.
Series 2009A
09/15/39 | | | 7.625 | % | | | 1,750,000 | | | | 2,057,528 | | |
Total | | | | | | | 7,564,128 | | |
Total Municipal Bonds
(Cost: $754,391,818) | | | | | | | 797,978,941 | | |
Municipal Preferred Stocks 0.1% | |
MARYLAND 0.1% | |
Munimae TE Bond Subsidiary LLC
AMT(a)(c)(e)
06/30/49 | | | 5.800 | % | | | 1,000,000 | | | | 945,020 | | |
Total Municipal Preferred Stocks
(Cost: $1,000,000) | | | | | | | 945,020 | | |
Municipal Short Term 0.5%
Issue
Description | | Effective
Yield | | Principal
Amount ($) | | Value ($) | |
NEW JERSEY 0.5% | |
City of Paterson
Unlimited General Obligation Notes
BAN Series 2015
12/15/15 | | | 3.630 | % | | | 4,396,000 | | | | 4,426,288 | | |
Total Municipal Short Term
(Cost: $4,418,947) | | | | | | | 4,426,288 | | |
Money Market Funds 5.9%
| | | Shares | | Value ($) | |
Dreyfus Tax-Exempt Cash Management Fund,
0.000%(i) | | | 20,185,709 | | | | 20,185,709 | | |
JPMorgan Municipal Money Market Fund,
0.010%(i) | | | 30,083,296 | | | | 30,083,296 | | |
Total Money Market Funds
(Cost: $50,269,005) | | | | | 50,269,005 | | |
Total Investments
(Cost: $810,079,770) | | | | | 853,619,254 | | |
Other Assets & Liabilities, Net | | | | | 3,537,730 | | |
Net Assets | | | | | 857,156,984 | | |
Notes to Portfolio of Investments
(a) Security exempt from registration pursuant to Rule 144A under the Securities Act of 1933. This security may be resold in transactions exempt from registration, normally to qualified institutional buyers. At May 31, 2015, the value of these securities amounted to $37,099,413 or 4.33% of net assets.
(b) Municipal obligations include debt obligations issued by or on behalf of territories, possessions, or sovereign nations within the territorial boundaries of the United States. At May 31, 2015, the value of these securities amounted to $55,965,154 or 6.53% of net assets.
The accompanying Notes to Financial Statements are an integral part of this statement.
Annual Report 2015
20
COLUMBIA HIGH YIELD MUNICIPAL FUND
PORTFOLIO OF INVESTMENTS (continued)
May 31, 2015
Notes to Portfolio of Investments (continued)
(c) Identifies securities considered by the Investment Manager to be illiquid and may be difficult to sell. The aggregate value of such securities at May 31, 2015 was $13,217,700, which represents 1.54% of net assets. Information concerning such security holdings at May 31, 2015 is as follows:
Security Description | | Acquisition Dates | | Cost ($) | |
Cabazon Band Mission Indians
Revenue Bonds
Mortgage Notes
Series 2004
10/01/11 13.000% | | 05/14/2010 | | | 370,523 | | |
Cabazon Band Mission Indians
Revenue Bonds
Mortgage Notes
Series 2004
10/01/15 8.375% | | 10/04/2004 - 05/14/2010 | | | 510,005 | | |
Cabazon Band Mission Indians
Revenue Bonds
Mortgage Notes
Series 2004
10/01/19 8.750% | | 10/04/2004 - 05/14/2010 | | | 2,498,267 | | |
Cabazon Band Mission Indians
Revenue Bonds
Mortgage Notes
Series 2010
10/01/20 8.375% | | 05/14/2010 | | | 1,420,000 | | |
California Municipal Finance Authority
Revenue Bonds
UTS Renewable Energy-Waste Water Facilities
Series 2011 AMT
12/01/32 7.500% | | 12/22/2011 | | | 1,835,000 | | |
Capital Trust Agency, Inc.
Revenue Bonds
Atlantic Housing Foundation
Subordinated Series 2008B
07/15/32 7.000% | | 07/23/2008 | | | 1,370,000 | | |
City of Wilmington
Revenue Bonds
Housing-Electra Arms Senior Associates Project
Series 1998 AMT
06/01/28 6.250% | | 10/08/1998 | | | 661,180 | | |
Durham Housing Authority
Revenue Bonds
Magnolia Pointe Apartments
Series 2005 AMT
02/01/38 5.650% | | 12/18/2006 | | | 3,108,315 | | |
Illinois Finance Authority
Revenue Bonds
Leafs Hockey Club Project
Series 2007A
03/01/37 6.000% | | 02/14/2007 | | | 972,870 | | |
Iowa Finance Authority
Refunding Revenue Bonds
Deerfield Retirement Community
Series 2014
05/15/56 0.000% | | 03/17/2014 | | | — | | |
The accompanying Notes to Financial Statements are an integral part of this statement.
Annual Report 2015
21
COLUMBIA HIGH YIELD MUNICIPAL FUND
PORTFOLIO OF INVESTMENTS (continued)
May 31, 2015
Notes to Portfolio of Investments (continued)
Security Description | | Acquisition Dates | | Cost ($) | |
Massachusetts Development Finance Agency
Revenue Bonds
Linden Ponds, Inc. Facility
Series 2011B
11/15/56 0.000% | | 12/10/2007 - 02/24/2010 | | | 20,202 | | |
Middle Village Community Development District
Special Assessment Bonds
Series 2004A
05/01/35 6.000% | | 01/21/2004 | | | 1,849,087 | | |
Middlesex County Improvement Authority
Revenue Bonds
Heldrich Center Hotel
Series 2005C
01/01/37 8.750% | | 06/28/2006 | | | 1,228,125 | | |
Middlesex County Improvement Authority
Subordinated Revenue Bonds
Heldrich Center Hotel
Series 2005B
01/01/25 6.125% | | 10/01/2009 | | | 508,750 | | |
Middlesex County Improvement Authority
Subordinated Revenue Bonds
Heldrich Center Hotel
Series 2005B
01/01/37 6.250% | | 03/18/2005 - 10/01/2009 | | | 4,614,875 | | |
Munimae TE Bond Subsidiary LLC
AMT
06/30/49 5.800% | | 10/14/2004 | | | 1,000,000 | | |
Rankin County Five Lakes Utility District
Series 1994
07/15/37 7.000% | | 10/02/2007 | | | 240,000 | | |
Resolution Trust Corp.
Pass-Through Certificates
Series 1993A
12/01/16 8.500% | | 11/12/1993 | | | 456,907 | | |
St. Johns County Industrial Development Authority
Refunding Revenue Bonds
Glenmoor Project
Subordinated Series 2014B
01/01/49 2.500% | | 04/17/2014 | | | — | | |
Westridge Community Development District
Special Assessment Bonds
Series 2005
05/01/37 5.800% | | 12/22/2005 | | | 2,650,000 | | |
(d) Represents securities that have defaulted on payment of interest. The Fund has stopped accruing interest on these securities. At May 31, 2015, the value of these securities amounted to $3,531,126, which represents 0.41% of net assets.
(e) Income from this security may be subject to alternative minimum tax.
(f) Security, or a portion thereof, has been purchased on a when-issued or delayed delivery basis.
(g) Zero coupon bond.
(h) Variable rate security.
(i) The rate shown is the seven-day current annualized yield at May 31, 2015.
The accompanying Notes to Financial Statements are an integral part of this statement.
Annual Report 2015
22
COLUMBIA HIGH YIELD MUNICIPAL FUND
PORTFOLIO OF INVESTMENTS (continued)
May 31, 2015
AGM Assured Guaranty Municipal Corporation
AMBAC Ambac Assurance Corporation
AMT Alternative Minimum Tax
BAN Bond Anticipation Note
FNMA Federal National Mortgage Association
GNMA Government National Mortgage Association
NPFGC National Public Finance Guarantee Corporation
Fair Value Measurements
The Fund categorizes its fair value measurements according to a three-level hierarchy that maximizes the use of observable inputs and minimizes the use of unobservable inputs by prioritizing that the most observable input be used when available. Observable inputs are those that market participants would use in pricing an investment based on market data obtained from sources independent of the reporting entity. Unobservable inputs are those that reflect the Fund's assumptions about the information market participants would use in pricing an investment. An investment's level within the fair value hierarchy is based on the lowest level of any input that is deemed significant to the asset or liability's fair value measurement. The input levels are not necessarily an indication of the risk or liquidity associated with investments at that level. For example, certain U.S. government securities are generally high quality and liquid, however, they are reflected as Level 2 because the inputs used to determine fair value may not always be quoted prices in an active market.
Fair value inputs are summarized in the three broad levels listed below:
> Level 1 — Valuations based on quoted prices for investments in active markets that the Fund has the ability to access at the measurement date (including NAV for open-end mutual funds). Valuation adjustments are not applied to Level 1 investments.
> Level 2 — Valuations based on other significant observable inputs (including quoted prices for similar securities, interest rates, prepayment speeds, credit risks, etc.).
> Level 3 — Valuations based on significant unobservable inputs (including the Fund's own assumptions and judgment in determining the fair value of investments).
Inputs that are used in determining fair value of an investment may include price information, credit data, volatility statistics, and other factors. These inputs can be either observable or unobservable. The availability of observable inputs can vary between investments, and is affected by various factors such as the type of investment, and the volume and level of activity for that investment or similar investments in the marketplace. The inputs will be considered by the Investment Manager, along with any other relevant factors in the calculation of an investment's fair value. The Fund uses prices and inputs that are current as of the measurement date, which may include periods of market dislocations. During these periods, the availability of prices and inputs may be reduced for many investments. This condition could cause an investment to be reclassified between the various levels within the hierarchy.
Investments falling into the Level 3 category are primarily supported by quoted prices from brokers and dealers participating in the market for those investments. However, these may be classified as Level 3 investments due to lack of market transparency and corroboration to support these quoted prices. Additionally, valuation models may be used as the pricing source for any remaining investments classified as Level 3. These models may rely on one or more significant unobservable inputs and/or significant assumptions by the Investment Manager. Inputs used in valuations may include, but are not limited to, financial statement analysis, capital account balances, discount rates and estimated cash flows, and comparable company data.
Under the direction of the Fund's Board of Trustees (the Board), the Investment Manager's Valuation Committee (the Committee) is responsible for overseeing the valuation procedures approved by the Board. The Committee consists of voting and non-voting members from various groups within the Investment Manager's organization, including operations and accounting, trading and investments, compliance, risk management and legal.
The Committee meets at least monthly to review and approve valuation matters, which may include a description of specific valuation determinations, data regarding pricing information received from approved pricing vendors and brokers and the results of Board-approved valuation control policies and procedures (the Policies). The Policies address, among other things, instances when market quotations are or are not readily available, including recommendations of third party pricing vendors and a determination of appropriate pricing methodologies; events that require specific valuation determinations and assessment of fair value techniques; securities with a potential for stale pricing, including those that are illiquid, restricted, or in default; and the effectiveness of third party pricing vendors, including periodic reviews of vendors. The Committee meets more frequently, as needed, to discuss additional valuation matters, which may include the need to review back-testing results, review time-sensitive information or approve related valuation actions. The Committee reports to the Board, with members of the Committee meeting with the Board at each of its regularly scheduled meetings to discuss valuation matters and actions during the period, similar to those described earlier.
The accompanying Notes to Financial Statements are an integral part of this statement.
Annual Report 2015
23
COLUMBIA HIGH YIELD MUNICIPAL FUND
PORTFOLIO OF INVESTMENTS (continued)
May 31, 2015
Fair Value Measurements (continued)
For investments categorized as Level 3, the Committee monitors information similar to that described above, which may include: (i) data specific to the issuer or comparable issuers, (ii) general market or specific sector news and (iii) quoted prices and specific or similar security transactions. The Committee considers this data and any changes from prior periods in order to assess the reasonableness of observable and unobservable inputs, any assumptions or internal models used to value those securities and changes in fair value. This data is also used to corroborate, when available, information received from approved pricing vendors and brokers. Various factors impact the frequency of monitoring this information (which may occur as often as daily). However, the Committee may determine that changes to inputs, assumptions and models are not required as a result of the monitoring procedures performed.
The following table is a summary of the inputs used to value the Fund's investments at May 31, 2015:
| | | Level 1
Quoted Prices in Active
Markets for Identical
Assets ($) | |
Level 2
Other Significant
Observable Inputs ($) | |
Level 3
Significant
Unobservable Inputs ($) | |
Total ($) | |
Investments | |
Municipal Bonds | | | — | | | | 797,978,941 | | | | — | | | | 797,978,941 | | |
Municipal Preferred Stocks | | | — | | | | 945,020 | | | | — | | | | 945,020 | | |
Municipal Short Term | | | — | | | | 4,426,288 | | | | — | | | | 4,426,288 | | |
Money Market Funds | | | 50,269,005 | | | | — | | | | — | | | | 50,269,005 | | |
Total Investments | | | 50,269,005 | | | | 803,350,249 | | | | — | | | | 853,619,254 | | |
See the Portfolio of Investments for all investment classifications not indicated in the table.
The Fund's assets assigned to the Level 2 input category are generally valued using the market approach, in which a security's value is determined through reference to prices and information from market transactions for similar or identical assets.
There were no transfers of financial assets between levels during the period.
The accompanying Notes to Financial Statements are an integral part of this statement.
Annual Report 2015
24
COLUMBIA HIGH YIELD MUNICIPAL FUND
STATEMENT OF ASSETS AND LIABILITIES
May 31, 2015
Assets | |
Investments, at value | |
(identified cost $810,079,770) | | $ | 853,619,254 | | |
Receivable for: | |
Investments sold | | | 297,181 | | |
Capital shares sold | | | 1,854,859 | | |
Dividends | | | 1 | | |
Interest | | | 13,105,665 | | |
Expense reimbursement due from Investment Manager | | | 2,719 | | |
Prepaid expenses | | | 822 | | |
Trustees' deferred compensation plan | | | 76,758 | | |
Total assets | | | 868,957,259 | | |
Liabilities | |
Due to custodian | | | 14,500 | | |
Payable for: | |
Investments purchased | | | 4,667,352 | | |
Investments purchased on a delayed delivery basis | | | 2,527,010 | | |
Capital shares purchased | | | 1,156,505 | | |
Dividend distributions to shareholders | | | 3,173,206 | | |
Investment management fees | | | 11,008 | | |
Distribution and/or service fees | | | 1,589 | | |
Transfer agent fees | | | 130,155 | | |
Administration fees | | | 1,591 | | |
Chief compliance officer expenses | | | 68 | | |
Other expenses | | | 40,533 | | |
Trustees' deferred compensation plan | | | 76,758 | | |
Total liabilities | | | 11,800,275 | | |
Net assets applicable to outstanding capital stock | | $ | 857,156,984 | | |
Represented by | |
Paid-in capital | | $ | 893,587,004 | | |
Undistributed net investment income | | | 5,741,369 | | |
Accumulated net realized loss | | | (85,710,873 | ) | |
Unrealized appreciation (depreciation) on: | |
Investments | | | 43,539,484 | | |
Total — representing net assets applicable to outstanding capital stock | | $ | 857,156,984 | | |
The accompanying Notes to Financial Statements are an integral part of this statement.
Annual Report 2015
25
COLUMBIA HIGH YIELD MUNICIPAL FUND
STATEMENT OF ASSETS AND LIABILITIES (continued)
May 31, 2015
Class A | |
Net assets | | $ | 150,482,608 | | |
Shares outstanding | | | 14,048,688 | | |
Net asset value per share | | $ | 10.71 | | |
Maximum offering price per share(a) | | $ | 11.04 | | |
Class B | |
Net assets | | $ | 546,633 | | |
Shares outstanding | | | 51,039 | | |
Net asset value per share | | $ | 10.71 | | |
Class C | |
Net assets | | $ | 32,575,036 | | |
Shares outstanding | | | 3,041,580 | | |
Net asset value per share | | $ | 10.71 | | |
Class R4 | |
Net assets | | $ | 4,217,597 | | |
Shares outstanding | | | 393,400 | | |
Net asset value per share | | $ | 10.72 | | |
Class R5 | |
Net assets | | $ | 3,893,040 | | |
Shares outstanding | | | 363,700 | | |
Net asset value per share | | $ | 10.70 | | |
Class Z | |
Net assets | | $ | 665,442,070 | | |
Shares outstanding | | | 62,124,414 | | |
Net asset value per share | | $ | 10.71 | | |
(a) The maximum offering price per share is calculated by dividing the net asset value per share by 1.0 minus the maximum sales charge of 3.00%.
The accompanying Notes to Financial Statements are an integral part of this statement.
Annual Report 2015
26
COLUMBIA HIGH YIELD MUNICIPAL FUND
STATEMENT OF OPERATIONS
Year Ended May 31, 2015
Net investment income | |
Income: | |
Dividends | | $ | 5,154 | | |
Interest | | | 42,178,513 | | |
Total income | | | 42,183,667 | | |
Expenses: | |
Investment management fees | | | 3,742,648 | | |
Distribution and/or service fees | |
Class A | | | 253,157 | | |
Class B | | | 6,257 | | |
Class C | | | 253,489 | | |
Transfer agent fees | |
Class A | | | 233,072 | | |
Class B | | | 1,204 | | |
Class C | | | 49,391 | | |
Class R4 | | | 8,010 | | |
Class R5 | | | 3,612 | | |
Class Z | | | 1,161,408 | | |
Administration fees | | | 542,532 | | |
Compensation of board members | | | 31,450 | | |
Custodian fees | | | 6,519 | | |
Printing and postage fees | | | 43,152 | | |
Registration fees | | | 105,974 | | |
Professional fees | | | 46,644 | | |
Chief compliance officer expenses | | | 404 | | |
Other | | | 19,326 | | |
Total expenses | | | 6,508,249 | | |
Fees waived or expenses reimbursed by Investment Manager and its affiliates | | | (770,550 | ) | |
Fees waived by Distributor — Class C | | | (30,431 | ) | |
Expense reductions | | | (720 | ) | |
Total net expenses | | | 5,706,548 | | |
Net investment income | | | 36,477,119 | | |
Realized and unrealized gain (loss) — net | |
Net realized gain (loss) on: | |
Investments | | | (623,291 | ) | |
Net realized loss | | | (623,291 | ) | |
Net change in unrealized appreciation (depreciation) on: | |
Investments | | | 10,594,016 | | |
Net change in unrealized appreciation | | | 10,594,016 | | |
Net realized and unrealized gain | | | 9,970,725 | | |
Net increase in net assets resulting from operations | | $ | 46,447,844 | | |
The accompanying Notes to Financial Statements are an integral part of this statement.
Annual Report 2015
27
COLUMBIA HIGH YIELD MUNICIPAL FUND
STATEMENT OF CHANGES IN NET ASSETS
| | | Year Ended
May 31, 2015 | | Year Ended
May 31, 2014 | |
Operations | |
Net investment income | | $ | 36,477,119 | | | $ | 37,883,562 | | |
Net realized loss | | | (623,291 | ) | | | (2,477,285 | ) | |
Net change in unrealized appreciation (depreciation) | | | 10,594,016 | | | | (23,241,220 | ) | |
Net increase in net assets resulting from operations | | | 46,447,844 | | | | 12,165,057 | | |
Distributions to shareholders | |
Net investment income | |
Class A | | | (5,592,712 | ) | | | (4,171,006 | ) | |
Class B | | | (24,142 | ) | | | (36,685 | ) | |
Class C | | | (1,007,374 | ) | | | (563,275 | ) | |
Class R4 | | | (200,006 | ) | | | (29,622 | ) | |
Class R5 | | | (334,876 | ) | | | (156,782 | ) | |
Class Z | | | (29,144,371 | ) | | | (32,518,163 | ) | |
Total distributions to shareholders | | | (36,303,481 | ) | | | (37,475,533 | ) | |
Increase (decrease) in net assets from capital stock activity | | | 86,188,876 | | | | (171,033,114 | ) | |
Total increase (decrease) in net assets | | | 96,333,239 | | | | (196,343,590 | ) | |
Net assets at beginning of year | | | 760,823,745 | | | | 957,167,335 | | |
Net assets at end of year | | $ | 857,156,984 | | | $ | 760,823,745 | | |
Undistributed net investment income | | $ | 5,741,369 | | | $ | 5,650,445 | | |
The accompanying Notes to Financial Statements are an integral part of this statement.
Annual Report 2015
28
COLUMBIA HIGH YIELD MUNICIPAL FUND
STATEMENT OF CHANGES IN NET ASSETS (continued)
| | | Year Ended May 31, 2015 | | Year Ended May 31, 2014 | |
| | | Shares | | Dollars ($) | | Shares | | Dollars ($) | |
Capital stock activity | |
Class A shares | |
Subscriptions(a) | | | 8,525,197 | | | | 91,272,394 | | | | 6,654,787 | | | | 67,814,519 | | |
Distributions reinvested | | | 465,860 | | | | 4,975,636 | | | | 351,338 | | | | 3,562,259 | | |
Redemptions | | | (6,672,098 | ) | | | (70,992,894 | ) | | | (3,802,902 | ) | | | (38,367,717 | ) | |
Net increase | | | 2,318,959 | | | | 25,255,136 | | | | 3,203,223 | | | | 33,009,061 | | |
Class B shares | |
Subscriptions | | | 5,531 | | | | 59,009 | | | | 18,382 | | | | 190,540 | | |
Distributions reinvested | | | 1,076 | | | | 11,474 | | | | 1,777 | | | | 17,952 | | |
Redemptions(a) | | | (28,839 | ) | | | (307,153 | ) | | | (60,422 | ) | | | (613,729 | ) | |
Net decrease | | | (22,232 | ) | | | (236,670 | ) | | | (40,263 | ) | | | (405,237 | ) | |
Class C shares | |
Subscriptions | | | 1,450,137 | | | | 15,484,440 | | | | 1,038,864 | | | | 10,653,232 | | |
Distributions reinvested | | | 73,813 | | | | 789,337 | | | | 42,477 | | | | 430,416 | | |
Redemptions | | | (371,078 | ) | | | (3,969,373 | ) | | | (562,243 | ) | | | (5,652,430 | ) | |
Net increase | | | 1,152,872 | | | | 12,304,404 | | | | 519,098 | | | | 5,431,218 | | |
Class R4 shares | |
Subscriptions | | | 814,813 | | | | 8,693,911 | | | | 238,941 | | | | 2,450,088 | | |
Distributions reinvested | | | 18,603 | | | | 199,523 | | | | 2,847 | | | | 29,436 | | |
Redemptions | | | (674,164 | ) | | | (7,278,745 | ) | | | (7,873 | ) | | | (81,197 | ) | |
Net increase | | | 159,252 | | | | 1,614,689 | | | | 233,915 | | | | 2,398,327 | | |
Class R5 shares | |
Subscriptions | | | 1,256,786 | | | | 13,496,976 | | | | 820,602 | | | | 8,314,135 | | |
Distributions reinvested | | | 31,259 | | | | 334,376 | | | | 15,290 | | | | 156,314 | | |
Redemptions | | | (1,664,359 | ) | | | (17,750,931 | ) | | | (143,418 | ) | | | (1,458,967 | ) | |
Net increase (decrease) | | | (376,314 | ) | | | (3,919,579 | ) | | | 692,474 | | | | 7,011,482 | | |
Class Z shares | |
Subscriptions | | | 13,827,878 | | | | 147,622,599 | | | | 9,591,736 | | | | 97,338,786 | | |
Distributions reinvested | | | 547,977 | | | | 5,858,071 | | | | 472,218 | | | | 4,776,139 | | |
Redemptions | | | (9,617,465 | ) | | | (102,309,774 | ) | | | (31,901,761 | ) | | | (320,592,890 | ) | |
Net increase (decrease) | | | 4,758,390 | | | | 51,170,896 | | | | (21,837,807 | ) | | | (218,477,965 | ) | |
Total net increase (decrease) | | | 7,990,927 | | | | 86,188,876 | | | | (17,229,360 | ) | | | (171,033,114 | ) | |
(a) Includes conversions of Class B shares to Class A shares, if any.
The accompanying Notes to Financial Statements are an integral part of this statement.
Annual Report 2015
29
COLUMBIA HIGH YIELD MUNICIPAL FUND
The following tables are intended to help you understand the Fund's financial performance. Certain information reflects financial results for a single share of a class held for the periods shown. Per share net investment income (loss) amounts are calculated based on average shares outstanding during the period. Total return assumes reinvestment of all dividends and distributions, if any. Total return does not reflect payment of sales charges, if any. Total return and portfolio turnover are not annualized for periods of less than one year. The portfolio turnover rate is calculated without regard to purchase and sales transactions of short-term instruments and certain derivatives, if any. If such transactions were included, the Fund's portfolio turnover rate may be higher.
| | | Year Ended May 31, | | Year Ended June 30, | |
Class A | | 2015 | | 2014 | | 2013 | | 2012(a) | | 2011 | | 2010 | |
Per share data | |
Net asset value, beginning of period | | $ | 10.56 | | | $ | 10.72 | | | $ | 10.49 | | | $ | 9.60 | | | $ | 9.77 | | | $ | 8.79 | | |
Income from investment operations: | |
Net investment income | | | 0.47 | | | | 0.49 | | | | 0.45 | | | | 0.45 | | | | 0.53 | | | | 0.52 | | |
Net realized and unrealized gain (loss) | | | 0.15 | | | | (0.16 | ) | | | 0.22 | | | | 0.88 | | | | (0.19 | ) | | | 0.97 | | |
Total from investment operations | | | 0.62 | | | | 0.33 | | | | 0.67 | | | | 1.33 | | | | 0.34 | | | | 1.49 | | |
Less distributions to shareholders: | |
Net investment income | | | (0.47 | ) | | | (0.49 | ) | | | (0.44 | ) | | | (0.44 | ) | | | (0.51 | ) | | | (0.51 | ) | |
Total distributions to shareholders | | | (0.47 | ) | | | (0.49 | ) | | | (0.44 | ) | | | (0.44 | ) | | | (0.51 | ) | | | (0.51 | ) | |
Net asset value, end of period | | $ | 10.71 | | | $ | 10.56 | | | $ | 10.72 | | | $ | 10.49 | | | $ | 9.60 | | | $ | 9.77 | | |
Total return | | | 5.97 | % | | | 3.35 | % | | | 6.44 | % | | | 14.19 | % | | | 3.63 | % | | | 17.25 | % | |
Ratios to average net assets(b) | |
Total gross expenses | | | 0.95 | % | | | 0.95 | % | | | 0.96 | % | | | 0.96 | %(c) | | | 0.91 | % | | | 0.85 | % | |
Total net expenses(d) | | | 0.86 | %(e) | | | 0.86 | %(e) | | | 0.85 | %(e) | | | 0.80 | %(c)(e) | | | 0.85 | %(e) | | | 0.85 | %(e) | |
Net investment income | | | 4.44 | % | | | 4.87 | % | | | 4.17 | % | | | 4.92 | %(c) | | | 5.46 | % | | | 5.44 | % | |
Supplemental data | |
Net assets, end of period (in thousands) | | $ | 150,483 | | | $ | 123,890 | | | $ | 91,422 | | | $ | 93,456 | | | $ | 63,669 | | | $ | 80,691 | | |
Portfolio turnover | | | 7 | % | | | 12 | % | | | 9 | % | | | 9 | % | | | 23 | % | | | 18 | % | |
Notes to Financial Highlights
(a) For the period from July 1, 2011 to May 31, 2012. During the period, the Fund's fiscal year end was changed from June 30 to May 31.
(b) In addition to the fees and expenses that the Fund bears directly, the Fund indirectly bears a pro rata share of the fees and expenses of any other funds in which it invests. Such indirect expenses are not included in the Fund's reported expense ratios.
(c) Annualized.
(d) Total net expenses include the impact of certain fee waivers/expense reimbursements made by the Investment Manager and certain of its affiliates, if applicable.
(e) The benefits derived from expense reductions had an impact of less than 0.01%.
The accompanying Notes to Financial Statements are an integral part of this statement.
Annual Report 2015
30
COLUMBIA HIGH YIELD MUNICIPAL FUND
FINANCIAL HIGHLIGHTS (continued)
| | | Year Ended May 31, | | Year Ended June 30, | |
Class B | | 2015 | | 2014 | | 2013 | | 2012(a) | | 2011 | | 2010 | |
Per share data | |
Net asset value, beginning of period | | $ | 10.56 | | | $ | 10.72 | | | $ | 10.49 | | | $ | 9.60 | | | $ | 9.77 | | | $ | 8.79 | | |
Income from investment operations: | |
Net investment income | | | 0.39 | | | | 0.42 | | | | 0.37 | | | | 0.39 | | | | 0.46 | | | | 0.45 | | |
Net realized and unrealized gain (loss) | | | 0.15 | | | | (0.17 | ) | | | 0.22 | | | | 0.87 | | | | (0.19 | ) | | | 0.97 | | |
Total from investment operations | | | 0.54 | | | | 0.25 | | | | 0.59 | | | | 1.26 | | | | 0.27 | | | | 1.42 | | |
Less distributions to shareholders: | |
Net investment income | | | (0.39 | ) | | | (0.41 | ) | | | (0.36 | ) | | | (0.37 | ) | | | (0.44 | ) | | | (0.44 | ) | |
Total distributions to shareholders | | | (0.39 | ) | | | (0.41 | ) | | | (0.36 | ) | | | (0.37 | ) | | | (0.44 | ) | | | (0.44 | ) | |
Net asset value, end of period | | $ | 10.71 | | | $ | 10.56 | | | $ | 10.72 | | | $ | 10.49 | | | $ | 9.60 | | | $ | 9.77 | | |
Total return | | | 5.19 | % | | | 2.59 | % | | | 5.65 | % | | | 13.41 | % | | | 2.85 | % | | | 16.39 | % | |
Ratios to average net assets(b) | |
Total gross expenses | | | 1.70 | % | | | 1.71 | % | | | 1.70 | % | | | 1.72 | %(c) | | | 1.65 | % | | | 1.60 | % | |
Total net expenses(d) | | | 1.61 | %(e) | | | 1.62 | %(e) | | | 1.60 | %(e) | | | 1.55 | %(c)(e) | | | 1.60 | %(e) | | | 1.60 | %(e) | |
Net investment income | | | 3.70 | % | | | 4.13 | % | | | 3.41 | % | | | 4.24 | %(c) | | | 4.69 | % | | | 4.72 | % | |
Supplemental data | |
Net assets, end of period (in thousands) | | $ | 547 | | | $ | 774 | | | $ | 1,217 | | | $ | 2,142 | | | $ | 3,052 | | | $ | 5,995 | | |
Portfolio turnover | | | 7 | % | | | 12 | % | | | 9 | % | | | 9 | % | | | 23 | % | | | 18 | % | |
Notes to Financial Highlights
(a) For the period from July 1, 2011 to May 31, 2012. During the period, the Fund's fiscal year end was changed from June 30 to May 31.
(b) In addition to the fees and expenses that the Fund bears directly, the Fund indirectly bears a pro rata share of the fees and expenses of any other funds in which it invests. Such indirect expenses are not included in the Fund's reported expense ratios.
(c) Annualized.
(d) Total net expenses include the impact of certain fee waivers/expense reimbursements made by the Investment Manager and certain of its affiliates, if applicable.
(e) The benefits derived from expense reductions had an impact of less than 0.01%.
The accompanying Notes to Financial Statements are an integral part of this statement.
Annual Report 2015
31
COLUMBIA HIGH YIELD MUNICIPAL FUND
FINANCIAL HIGHLIGHTS (continued)
| | | Year Ended May 31, | | Year Ended June 30, | |
Class C | | 2015 | | 2014 | | 2013 | | 2012(a) | | 2011 | | 2010 | |
Per share data | |
Net asset value, beginning of period | | $ | 10.56 | | | $ | 10.72 | | | $ | 10.49 | | | $ | 9.60 | | | $ | 9.77 | | | $ | 8.79 | | |
Income from investment operations: | |
Net investment income | | | 0.40 | | | | 0.43 | | | | 0.38 | | | | 0.40 | | | | 0.48 | | | | 0.46 | | |
Net realized and unrealized gain (loss) | | | 0.15 | | | | (0.16 | ) | | | 0.22 | | | | 0.88 | | | | (0.20 | ) | | | 0.97 | | |
Total from investment operations | | | 0.55 | | | | 0.27 | | | | 0.60 | | | | 1.28 | | | | 0.28 | | | | 1.43 | | |
Less distributions to shareholders: | |
Net investment income | | | (0.40 | ) | | | (0.43 | ) | | | (0.37 | ) | | | (0.39 | ) | | | (0.45 | ) | | | (0.45 | ) | |
Total distributions to shareholders | | | (0.40 | ) | | | (0.43 | ) | | | (0.37 | ) | | | (0.39 | ) | | | (0.45 | ) | | | (0.45 | ) | |
Net asset value, end of period | | $ | 10.71 | | | $ | 10.56 | | | $ | 10.72 | | | $ | 10.49 | | | $ | 9.60 | | | $ | 9.77 | | |
Total return | | | 5.31 | % | | | 2.73 | % | | | 5.81 | % | | | 13.56 | % | | | 3.01 | % | | | 16.55 | % | |
Ratios to average net assets(b) | |
Total gross expenses | | | 1.70 | % | | | 1.70 | % | | | 1.71 | % | | | 1.71 | %(c) | | | 1.66 | % | | | 1.60 | % | |
Total net expenses(d) | | | 1.49 | %(e) | | | 1.46 | %(e) | | | 1.45 | %(e) | | | 1.40 | %(c)(e) | | | 1.45 | %(e) | | | 1.45 | %(e) | |
Net investment income | | | 3.79 | % | | | 4.26 | % | | | 3.57 | % | | | 4.30 | %(c) | | | 4.88 | % | | | 4.85 | % | |
Supplemental data | |
Net assets, end of period (in thousands) | | $ | 32,575 | | | $ | 19,946 | | | $ | 14,684 | | | $ | 12,525 | | | $ | 8,509 | | | $ | 9,288 | | |
Portfolio turnover | | | 7 | % | | | 12 | % | | | 9 | % | | | 9 | % | | | 23 | % | | | 18 | % | |
Notes to Financial Highlights
(a) For the period from July 1, 2011 to May 31, 2012. During the period, the Fund's fiscal year end was changed from June 30 to May 31.
(b) In addition to the fees and expenses that the Fund bears directly, the Fund indirectly bears a pro rata share of the fees and expenses of any other funds in which it invests. Such indirect expenses are not included in the Fund's reported expense ratios.
(c) Annualized.
(d) Total net expenses include the impact of certain fee waivers/expense reimbursements made by the Investment Manager and certain of its affiliates, if applicable.
(e) The benefits derived from expense reductions had an impact of less than 0.01%.
The accompanying Notes to Financial Statements are an integral part of this statement.
Annual Report 2015
32
COLUMBIA HIGH YIELD MUNICIPAL FUND
FINANCIAL HIGHLIGHTS (continued)
| | | Year Ended May 31, | |
Class R4 | | 2015 | | 2014 | | 2013(a) | |
Per share data | |
Net asset value, beginning of period | | $ | 10.57 | | | $ | 10.73 | | | $ | 10.77 | | |
Income from investment operations: | |
Net investment income | | | 0.49 | | | | 0.52 | | | | 0.10 | | |
Net realized and unrealized gain (loss) | | | 0.15 | | | | (0.18 | ) | | | (0.05 | )(b) | |
Total from investment operations | | | 0.64 | | | | 0.34 | | | | 0.05 | | |
Less distributions to shareholders: | |
Net investment income | | | (0.49 | ) | | | (0.50 | ) | | | (0.09 | ) | |
Total distributions to shareholders | | | (0.49 | ) | | | (0.50 | ) | | | (0.09 | ) | |
Net asset value, end of period | | $ | 10.72 | | | $ | 10.57 | | | $ | 10.73 | | |
Total return | | | 6.18 | % | | | 3.53 | % | | | 0.50 | % | |
Ratios to average net assets(c) | |
Total gross expenses | | | 0.76 | % | | | 0.76 | % | | | 0.71 | %(d) | |
Total net expenses(e) | | | 0.66 | %(f) | | | 0.65 | %(f) | | | 0.68 | %(d) | |
Net investment income | | | 4.65 | % | | | 5.09 | % | | | 4.54 | %(d) | |
Supplemental data | |
Net assets, end of period (in thousands) | | $ | 4,218 | | | $ | 2,476 | | | $ | 3 | | |
Portfolio turnover | | | 7 | % | | | 12 | % | | | 9 | % | |
Notes to Financial Highlights
(a) Based on operations from March 19, 2013 (commencement of operations) through the stated period end.
(b) Calculation of the net gain (loss) per share (both realized and unrealized) does not correlate to the aggregate realized and unrealized gain (loss) presented in the Statement of Operations due to the timing of subscriptions and redemptions of Fund shares in relation to fluctuations in the market value of the portfolio.
(c) In addition to the fees and expenses that the Fund bears directly, the Fund indirectly bears a pro rata share of the fees and expenses of any other funds in which it invests. Such indirect expenses are not included in the Fund's reported expense ratios.
(d) Annualized.
(e) Total net expenses include the impact of certain fee waivers/expense reimbursements made by the Investment Manager and certain of its affiliates, if applicable.
(f) The benefits derived from expense reductions had an impact of less than 0.01%.
The accompanying Notes to Financial Statements are an integral part of this statement.
Annual Report 2015
33
COLUMBIA HIGH YIELD MUNICIPAL FUND
FINANCIAL HIGHLIGHTS (continued)
| | | Year Ended May 31, | |
Class R5 | | 2015 | | 2014 | | 2013(a) | |
Per share data | |
Net asset value, beginning of period | | $ | 10.55 | | | $ | 10.71 | | | $ | 10.75 | | |
Income from investment operations: | |
Net investment income | | | 0.50 | | | | 0.52 | | | | 0.28 | | |
Net realized and unrealized gain (loss) | | | 0.15 | | | | (0.17 | ) | | | (0.06 | )(b) | |
Total from investment operations | | | 0.65 | | | | 0.35 | | | | 0.22 | | |
Less distributions to shareholders: | |
Net investment income | | | (0.50 | ) | | | (0.51 | ) | | | (0.26 | ) | |
Total distributions to shareholders | | | (0.50 | ) | | | (0.51 | ) | | | (0.26 | ) | |
Net asset value, end of period | | $ | 10.70 | | | $ | 10.55 | | | $ | 10.71 | | |
Total return | | | 6.27 | % | | | 3.64 | % | | | 2.05 | % | |
Ratios to average net assets(c) | |
Total gross expenses | | | 0.61 | % | | | 0.63 | % | | | 0.61 | %(d) | |
Total net expenses(e) | | | 0.58 | % | | | 0.57 | % | | | 0.61 | %(d) | |
Net investment income | | | 4.67 | % | | | 5.21 | % | | | 4.76 | %(d) | |
Supplemental data | |
Net assets, end of period (in thousands) | | $ | 3,893 | | | $ | 7,807 | | | $ | 509 | | |
Portfolio turnover | | | 7 | % | | | 12 | % | | | 9 | % | |
Notes to Financial Highlights
(a) Based on operations from November 8, 2012 (commencement of operations) through the stated period end.
(b) Calculation of the net gain (loss) per share (both realized and unrealized) does not correlate to the aggregate realized and unrealized gain (loss) presented in the Statement of Operations due to the timing of subscriptions and redemptions of Fund shares in relation to fluctuations in the market value of the portfolio.
(c) In addition to the fees and expenses that the Fund bears directly, the Fund indirectly bears a pro rata share of the fees and expenses of any other funds in which it invests. Such indirect expenses are not included in the Fund's reported expense ratios.
(d) Annualized.
(e) Total net expenses include the impact of certain fee waivers/expense reimbursements made by the Investment Manager and certain of its affiliates, if applicable.
The accompanying Notes to Financial Statements are an integral part of this statement.
Annual Report 2015
34
COLUMBIA HIGH YIELD MUNICIPAL FUND
FINANCIAL HIGHLIGHTS (continued)
| | | Year Ended May 31, | | Year Ended June 30, | |
Class Z | | 2015 | | 2014 | | 2013 | | 2012(a) | | 2011 | | 2010 | |
Per share data | |
Net asset value, beginning of period | | $ | 10.56 | | | $ | 10.72 | | | $ | 10.49 | | | $ | 9.60 | | | $ | 9.77 | | | $ | 8.79 | | |
Income from investment operations: | |
Net investment income | | | 0.49 | | | | 0.51 | | | | 0.47 | | | | 0.47 | | | | 0.55 | | | | 0.54 | | |
Net realized and unrealized gain (loss) | | | 0.15 | | | | (0.16 | ) | | | 0.22 | | | | 0.88 | | | | (0.19 | ) | | | 0.97 | | |
Total from investment operations | | | 0.64 | | | | 0.35 | | | | 0.69 | | | | 1.35 | | | | 0.36 | | | | 1.51 | | |
Less distributions to shareholders: | |
Net investment income | | | (0.49 | ) | | | (0.51 | ) | | | (0.46 | ) | | | (0.46 | ) | | | (0.53 | ) | | | (0.53 | ) | |
Total distributions to shareholders | | | (0.49 | ) | | | (0.51 | ) | | | (0.46 | ) | | | (0.46 | ) | | | (0.53 | ) | | | (0.53 | ) | |
Net asset value, end of period | | $ | 10.71 | | | $ | 10.56 | | | $ | 10.72 | | | $ | 10.49 | | | $ | 9.60 | | | $ | 9.77 | | |
Total return | | | 6.19 | % | | | 3.56 | % | | | 6.65 | % | | | 14.39 | % | | | 3.82 | % | | | 17.48 | % | |
Ratios to average net assets(b) | |
Total gross expenses | | | 0.75 | % | | | 0.75 | % | | | 0.76 | % | | | 0.76 | %(c) | | | 0.71 | % | | | 0.65 | % | |
Total net expenses(d) | | | 0.66 | %(e) | | | 0.67 | %(e) | | | 0.65 | %(e) | | | 0.60 | %(c)(e) | | | 0.65 | %(e) | | | 0.65 | %(e) | |
Net investment income | | | 4.64 | % | | | 5.07 | % | | | 4.37 | % | | | 5.12 | %(c) | | | 5.68 | % | | | 5.64 | % | |
Supplemental data | |
Net assets, end of period (in thousands) | | $ | 665,442 | | | $ | 605,931 | | | $ | 849,332 | | | $ | 830,124 | | | $ | 641,387 | | | $ | 668,875 | | |
Portfolio turnover | | | 7 | % | | | 12 | % | | | 9 | % | | | 9 | % | | | 23 | % | | | 18 | % | |
Notes to Financial Highlights
(a) For the period from July 1, 2011 to May 31, 2012. During the period, the Fund's fiscal year end was changed from June 30 to May 31.
(b) In addition to the fees and expenses that the Fund bears directly, the Fund indirectly bears a pro rata share of the fees and expenses of any other funds in which it invests. Such indirect expenses are not included in the Fund's reported expense ratios.
(c) Annualized.
(d) Total net expenses include the impact of certain fee waivers/expense reimbursements made by the Investment Manager and certain of its affiliates, if applicable.
(e) The benefits derived from expense reductions had an impact of less than 0.01%.
The accompanying Notes to Financial Statements are an integral part of this statement.
Annual Report 2015
35
COLUMBIA HIGH YIELD MUNICIPAL FUND
NOTES TO FINANCIAL STATEMENTS
May 31, 2015
Note 1. Organization
Columbia High Yield Municipal Fund (the Fund), a series of Columbia Funds Series Trust I (the Trust), is a diversified fund. The Trust is registered under the Investment Company Act of 1940, as amended (the 1940 Act), as an open-end management investment company organized as a Massachusetts business trust.
Fund Shares
The Trust may issue an unlimited number of shares (without par value). The Fund offers Class A, Class B, Class C, Class R4, Class R5 and Class Z shares. Although all share classes generally have identical voting, dividend and liquidation rights, each share class votes separately when required by the Trust's organizational documents or by law. Different share classes pay different distribution amounts to the extent the expenses of such share classes differ, and distributions in liquidation will be proportional to the net asset value of each share class. Each share class has its own expense and sales charge structure.
Class A shares are subject to a maximum front-end sales charge of 3.00% based on the initial investment amount. Class A shares purchased without an initial sales charge in accounts aggregating $1 million to $50 million at the time of purchase are subject to a contingent deferred sales charge (CDSC) if the shares are sold within 18 months after purchase, charged as follows: 1.00% CDSC if redeemed within 12 months after purchase, and 0.50% CDSC if redeemed more than 12, but less than 18, months after purchase.
Class B shares may be subject to a maximum CDSC of 5.00% based upon the holding period after purchase. Class B shares will generally convert to Class A shares eight years after purchase. The Fund no longer accepts investments by new or existing investors in the Fund's Class B shares, except in connection with the reinvestment of any dividend and/or capital gain distributions in Class B shares of the Fund and exchanges by existing Class B shareholders of certain other funds within the Columbia Family of Funds.
Class C shares are subject to a 1.00% CDSC on shares redeemed within one year after purchase.
Class R4 shares are not subject to sales charges and are generally available only to omnibus retirement plans and certain investors as described in the Fund's prospectus.
Class R5 shares are not subject to sales charges and are generally available only to investors purchasing through authorized investment professionals and omnibus retirement plans.
Class Z shares are not subject to sales charges and are available only to eligible investors, which are subject to different investment minimums as described in the Fund's prospectus.
Note 2. Summary of Significant Accounting Policies
Basis of Preparation
The Fund is an investment company that applies the accounting and reporting guidance in the Financial Accounting Standards Board (FASB) Accounting Standards Codification Topic 946, Financial Services — Investment Companies (ASC 946). The financial statements are prepared in accordance with U.S. generally accepted accounting principles (GAAP), which requires management to make certain estimates and assumptions that affect the reported amounts of assets and liabilities, the disclosure of contingent assets and liabilities at the date of the financial statements and the reported amounts of income and expenses during the reporting period. Actual results could differ from those estimates.
The following is a summary of significant accounting policies followed by the Fund in the preparation of its financial statements.
Security Valuation
Debt securities generally are valued by pricing services approved by the Board of Trustees (the Board) based upon market transactions for normal, institutional-size trading units of similar securities. The services may use various pricing techniques that take into account, as applicable, factors such as yield, quality, coupon rate, maturity, type of issue, trading characteristics and other data, as well as broker quotes. Debt securities for which quotations are not readily available or not believed to be reflective of market value may also be valued based upon a bid quote from an approved independent broker-dealer.
All equity securities are valued at the close of business of the New York Stock Exchange (NYSE). Equity securities are valued at the last quoted sales price on the principal exchange or market on which they trade, except for securities traded on the NASDAQ Stock Market, which are valued at the NASDAQ official close price. Unlisted securities or listed securities for which there were no
Annual Report 2015
36
COLUMBIA HIGH YIELD MUNICIPAL FUND
NOTES TO FINANCIAL STATEMENTS (continued)
May 31, 2015
sales during the day are valued at the mean of the latest quoted bid and ask prices on such exchanges or markets.
Investments in open-end investment companies, including money market funds, are valued at their latest net asset value.
Debt securities maturing in 60 days or less are valued primarily at amortized cost value, unless this method results in a valuation that does not approximate market value.
Investments for which market quotations are not readily available, or that have quotations which management believes are not reflective of market value or reliable, are valued at fair value as determined in good faith under procedures approved by and under the general supervision of the Board. If a security or class of securities (such as foreign securities) is valued at fair value, such value is likely to be different from the quoted or published price for the security.
The determination of fair value often requires significant judgment. To determine fair value, management may use assumptions including but not limited to future cash flows and estimated risk premiums. Multiple inputs from various sources may be used to determine fair value.
GAAP requires disclosure regarding the inputs and valuation techniques used to measure fair value and any changes in valuation inputs or techniques. In addition, investments shall be disclosed by major category. This information is disclosed following the Fund's Portfolio of Investments.
Delayed Delivery Securities
The Fund may trade securities on other than normal settlement terms, including securities purchased or sold on a "when-issued" basis. This may increase risk to the Fund since the other party to the transaction may fail to deliver which could cause the Fund to subsequently invest at less advantageous prices. The Fund designates cash or liquid securities in an amount equal to the delayed delivery commitment.
Security Transactions
Security transactions are accounted for on the trade date. Cost is determined and gains (losses) are based upon the specific identification method for both financial statement and federal income tax purposes.
Income Recognition
Interest income is recorded on an accrual basis. Market premiums and discounts, including original issue discounts, are amortized and accreted, respectively, over the expected life of the security on all debt securities, unless otherwise noted.
The Fund may place a debt security on non-accrual status and reduce related interest income when it becomes probable that the interest will not be collected and the amount of uncollectible interest can be reasonably estimated. A defaulted debt security is removed from non-accrual status when the issuer resumes interest payments or when collectibility of interest is reasonably assured.
Dividend income is recorded on the ex-dividend date.
Awards from class action litigation are recorded as a reduction of cost basis if the Fund still owns the applicable securities on the payment date. If the Fund no longer owns the applicable securities, the proceeds are recorded as realized gains.
Expenses
General expenses of the Trust are allocated to the Fund and other funds of the Trust based upon relative net assets or other expense allocation methodologies determined by the nature of the expense. Expenses directly attributable to the Fund are charged to the Fund. Expenses directly attributable to a specific class of shares are charged to that share class.
Determination of Class Net Asset Value
All income, expenses (other than class-specific expenses, which are charged to that share class, as shown in the Statement of Operations) and realized and unrealized gains (losses) are allocated to each class of the Fund on a daily basis, based on the relative net assets of each class, for purposes of determining the net asset value of each class.
Federal Income Tax Status
The Fund intends to qualify each year as a regulated investment company under Subchapter M of the Internal Revenue Code, as amended, and will distribute substantially all of its tax exempt and taxable income (including net short-term capital gains), if any, for its tax year, and as such will not be subject to federal income taxes. In addition, the Fund intends to distribute in each calendar year substantially all of its net investment income, capital gains and certain other amounts, if any, such that the Fund should not be subject to federal
Annual Report 2015
37
COLUMBIA HIGH YIELD MUNICIPAL FUND
NOTES TO FINANCIAL STATEMENTS (continued)
May 31, 2015
excise tax. Therefore, no federal income or excise tax provision is recorded.
Distributions to Shareholders
Distributions from net investment income, if any, are declared daily and paid monthly. Net realized capital gains, if any, are distributed at least annually. Income distributions and capital gain distributions are determined in accordance with federal income tax regulations, which may differ from GAAP.
Guarantees and Indemnifications
Under the Trust's organizational documents and, in some cases, by contract, its officers and trustees are indemnified against certain liabilities arising out of the performance of their duties to the Trust or its funds. In addition, certain of the Fund's contracts with its service providers contain general indemnification clauses. The Fund's maximum exposure under these arrangements is unknown since the amount of any future claims that may be made against the Fund cannot be determined, and the Fund has no historical basis for predicting the likelihood of any such claims.
Note 3. Fees and Compensation Paid to Affiliates
Investment Management Fees
Under an Investment Management Services Agreement, Columbia Management Investment Advisers, LLC (the Investment Manager), a wholly-owned subsidiary of Ameriprise Financial, Inc. (Ameriprise Financial), determines which securities will be purchased, held or sold. The investment management fee is an annual fee that is equal to a percentage of the Fund's average daily net assets that declines from 0.47% to 0.30% as the Fund's net assets increase. The effective investment management fee rate for the year ended May 31, 2015 was 0.47% of the Fund's average daily net assets.
Administration Fees
Under an Administrative Services Agreement, the Investment Manager also serves as the Fund Administrator. The Fund pays the Fund Administrator an annual fee for administration and accounting services equal to a percentage of the Fund's average daily net assets that declines from 0.07% to 0.04% as the Fund's net assets increase. The effective administration fee rate for the year ended May 31, 2015 was 0.07% of the Fund's average daily net assets.
Compensation of Board Members
Board members are compensated for their services to the Fund as disclosed in the Statement of Operations. The Trust's independent Trustees may participate in a Deferred Compensation Plan (the Plan) which may be terminated at any time. Obligations of the Plan will be paid solely out of the Fund's assets.
Compensation of Chief Compliance Officer
The Board has appointed a Chief Compliance Officer to the Fund in accordance with federal securities regulations. The Fund is allocated a portion of the expenses associated with the Chief Compliance Officer based on relative net assets of the Trust.
Transfer Agency Fees
Under a Transfer and Dividend Disbursing Agent Agreement, Columbia Management Investment Services Corp. (the Transfer Agent), an affiliate of the Investment Manager and a wholly-owned subsidiary of Ameriprise Financial, is responsible for providing transfer agency services to the Fund. The Transfer Agent has contracted with Boston Financial Data Services (BFDS) to serve as sub-transfer agent.
Effective November 1, 2014, the Transfer Agent receives a monthly transfer agency fee based on the number or the average value of accounts, depending on the type of account. Prior to November 1, 2014, the Transfer Agent received a monthly account-based service fee based on the number of open accounts. In addition, the Transfer Agent also receives sub-transfer agency fees based on a percentage of the average aggregate value of the Fund's shares maintained in omnibus accounts (other than omnibus accounts for which American Enterprise Investment Services Inc. is the broker of record or accounts where the beneficial shareholder is a customer of Ameriprise Financial Services, Inc., for which the Transfer Agent receives a per account fee). The Transfer Agent pays the fees of BFDS for services as sub-transfer agent and is not entitled to reimbursement for such fees from the Fund (with the exception of out-of-pocket fees).
The Transfer Agent also receives compensation from the Fund for various shareholder services and reimbursements for certain out-of-pocket fees. Total transfer agency fees for Class R5 shares are subject to an annual limitation of not more than 0.05% of the average daily net assets attributable to Class R5 shares.
Annual Report 2015
38
COLUMBIA HIGH YIELD MUNICIPAL FUND
NOTES TO FINANCIAL STATEMENTS (continued)
May 31, 2015
For the year ended May 31, 2015, the Fund's effective transfer agency fee rates as a percentage of average daily net assets of each class were as follows:
Class A | | | 0.18 | % | |
Class B | | | 0.18 | | |
Class C | | | 0.19 | | |
Class R4 | | | 0.19 | | |
Class R5 | | | 0.05 | | |
Class Z | | | 0.18 | | |
An annual minimum account balance fee of $20 may apply to certain accounts with a value below the applicable share class's initial minimum investment requirements to reduce the impact of small accounts on transfer agency fees. These minimum account balance fees are remitted to the Fund and recorded as part of expense reductions in the Statement of Operations. For the year ended May 31, 2015, these minimum account balance fees reduced total expenses of the Fund by $720.
Distribution and Service Fees
The Fund has an agreement with Columbia Management Investment Distributors, Inc. (the Distributor), an affiliate of the Investment Manager and a wholly-owned subsidiary of Ameriprise Financial, for distribution and shareholder services. The Board has approved, and the Fund has adopted, distribution and shareholder service plans (the Plans) applicable to certain share classes, which set the distribution and service fees for the Fund. These fees are calculated daily and are intended to compensate the Distributor and/or eligible selling and/or servicing agents for selling shares of the Fund and providing services to investors.
Under the Plans, the Fund pays a monthly service fee to the Distributor at the maximum annual rate of 0.20% of the average daily net assets attributable to Class A, Class B and Class C shares of the Fund. Also under the Plans, the Fund pays a monthly distribution fee to the Distributor at the maximum annual rates of 0.75% of the average daily net assets attributable to Class B and Class C shares, respectively.
Effective October 1, 2014, the Distributor has voluntarily agreed to waive a portion of the distribution fee for Class C shares so that the distribution fee does not exceed 0.65% annually of the average daily net assets attributable to Class C shares. This arrangement may be modified or terminated by the Distributor at any time. Prior to October 1, 2014, the Distributor voluntarily waived a portion of the distribution fee for Class C
shares so that the distribution fee did not exceed 0.60% annually.
Sales Charges
Sales charges, including front-end charges and CDSCs, received by the Distributor for distributing Fund shares were $357,742 for Class A, $401 for Class B, and $2,912 for Class C shares for the year ended May 31, 2015.
Expenses Waived/Reimbursed by the Investment Manager and its Affiliates
The Investment Manager and certain of its affiliates have contractually agreed to waive fees and/or reimburse expenses (excluding certain fees and expenses described below) for the periods disclosed below, unless sooner terminated at the sole discretion of the Board, so that the Fund's net operating expenses, after giving effect to fees waived/expenses reimbursed and any balance credits and/or overdraft charges from the Fund's custodian, do not exceed the following annual rates as a percentage of the class' average daily net assets:
| | | October 1, 2014
through
September 30, 2015 | | Prior to
October 1, 2014 | |
Class A | | | 0.88 | % | | | 0.85 | % | |
Class B | | | 1.63 | | | | 1.60 | | |
Class C | | | 1.63 | | | | 1.60 | | |
Class R4 | | | 0.68 | | | | 0.65 | | |
Class R5 | | | 0.60 | | | | 0.56 | | |
Class Z | | | 0.68 | | | | 0.65 | | |
Under the agreement governing these fee waivers and/or expense reimbursement arrangements, the following fees and expenses are excluded from the waiver/reimbursement commitment, and therefore will be paid by the Fund, if applicable: taxes (including foreign transaction taxes), expenses associated with investments in affiliated and non-affiliated pooled investment vehicles (including mutual funds and exchange-traded funds), transaction costs and brokerage commissions, costs related to any securities lending program, dividend and interest expenses associated with securities sold short, inverse floater program fees and expenses, transaction charges and interest on borrowed money, interest, extraordinary expenses and any other expenses the exclusion of which is specifically approved by the Board. This agreement may be modified or amended only with approval from all parties.
Annual Report 2015
39
COLUMBIA HIGH YIELD MUNICIPAL FUND
NOTES TO FINANCIAL STATEMENTS (continued)
May 31, 2015
In addition, effective October 1, 2014, the Fund's expense ratio is subject to a voluntary expense reimbursement arrangement pursuant to which fees will be waived and/or expenses reimbursed (excluding certain fees and expenses immediately described above), so that the Fund's net operating expenses, after giving effect to fees waived/expenses reimbursed and any balance credits and/or overdraft charges from the Fund's custodian, do not exceed the annual rates of 0.86% for Class A, 1.61% for Class B, 1.61% for Class C, 0.66% for Class R4, 0.58% for Class R5 and 0.66% for Class Z. This arrangement may be revised or discontinued at any time.
Any fees waived and/or expenses reimbursed under the expense reimbursement arrangements described above are not recoverable by the Investment Manager or its affiliates in future periods. Class C distribution fees waived by the Distributor, as discussed above, are in addition to the waiver/reimbursement under these fee waivers and/or expense reimbursement arrangements.
Note 4. Federal Tax Information
The timing and character of income and capital gain distributions are determined in accordance with income tax regulations, which may differ from GAAP because of temporary or permanent book to tax differences.
At May 31, 2015, these differences are primarily due to differing treatment for capital loss carryforwards, principal and/or interest from fixed income securities, deferral/reversal of wash sale losses, Trustees' deferred compensation, distributions, investments in partnerships, post-October capital losses and tax straddles. To the extent these differences are permanent, reclassifications are made among the components of the Fund's net assets in the Statement of Assets and Liabilities. Temporary differences do not require reclassifications. In the Statement of Assets and Liabilities the following reclassifications were made:
Undistributed net investment income | | $ | (82,714 | ) | |
Accumulated net realized loss | | | 1,554,413 | | |
Paid-in capital | | | (1,471,699 | ) | |
Net investment income (loss) and net realized gains (losses), as disclosed in the Statement of Operations, and net assets were not affected by this reclassification.
The tax character of distributions paid during the years indicated was as follows:
Year Ended May 31, | | 2015 | | 2014 | |
Ordinary income | | $ | 161,721 | | | $ | 856,322 | | |
Tax-exempt income | | | 36,141,760 | | | | 36,619,211 | | |
Total | | | 36,303,481 | | | | 37,475,533 | | |
Short-term capital gain distributions, if any, are considered ordinary income distributions for tax purposes.
At May 31, 2015, the components of distributable earnings on a tax basis were as follows:
Undistributed tax-exempt income | | | 12,273,273 | | |
Capital loss carryforwards | | | (80,326,815 | ) | |
Net unrealized appreciation | | | 44,871,674 | | |
At May 31, 2015, the cost of investments for federal income tax purposes was $808,747,580 and the aggregate gross unrealized appreciation and depreciation based on that cost was:
Unrealized appreciation | | $ | 66,733,698 | | |
Unrealized depreciation | | | (21,862,024 | ) | |
Net unrealized appreciation | | | 44,871,674 | | |
The following capital loss carryforwards, determined at May 31, 2015, may be available to reduce taxable income arising from future net realized gains on investments, if any, to the extent permitted by the Internal Revenue Code:
Year of Expiration | | Amount ($) | |
2016 | | | 5,694,295 | | |
2017 | | | 17,741,445 | | |
2018 | | | 35,721,468 | | |
2019 | | | 4,244,605 | | |
No expiration — short-term | | | 1,742,150 | | |
No expiration — long-term | | | 15,182,852 | | |
Total | | | 80,326,815 | | |
Capital loss carryforwards with no expiration are required to be utilized prior to any capital losses which carry an expiration date. As a result of this ordering rule, capital loss carryforwards which carry an expiration date may be more likely to expire unused.
For the year ended May 31, 2015, $308,620 of capital loss carryforward was utilized and $1,471,699 expired unused.
Under current tax rules, regulated investment companies can elect to treat certain late-year ordinary losses
Annual Report 2015
40
COLUMBIA HIGH YIELD MUNICIPAL FUND
NOTES TO FINANCIAL STATEMENTS (continued)
May 31, 2015
incurred and post-October capital losses (capital losses realized after October 31) as arising on the first day of the following taxable year. As of May 31, 2015, the Fund will elect to treat post-October capital losses of $4,149,803 as arising on June 1, 2015.
Management of the Fund has concluded that there are no significant uncertain tax positions in the Fund that would require recognition in the financial statements. However, management's conclusion may be subject to review and adjustment at a later date based on factors including, but not limited to, new tax laws, regulations, and administrative interpretations (including relevant court decisions). Generally, the Fund's federal tax returns for the prior three fiscal years remain subject to examination by the Internal Revenue Service.
Note 5. Portfolio Information
The cost of purchases and proceeds from sales of securities, excluding short-term investments and derivatives, if any, aggregated to $148,770,266 and $49,608,382, respectively, for the year ended May 31, 2015. The amount of purchase and sale activity impacts the portfolio turnover rate reported in the Financial Highlights.
For the year ended May 31, 2015, there were no purchases or proceeds from the sale of securities other than short-term investment transactions and derivative activity, if any. Only the amount of long-term security purchases and sales activity, excluding derivatives, impacts the portfolio turnover reported in the Financial Highlights.
Note 6. Shareholder Concentration
At May 31, 2015, one unaffiliated shareholder of record owned 61.0% of the outstanding shares of the Fund in one or more accounts. The Fund has no knowledge about whether any portion of those shares was owned beneficially. Subscription and redemption activity by concentrated accounts may have a significant effect on the operations of the Fund.
Note 7. Line of Credit
The Fund has entered into a revolving credit facility with a syndicate of banks led by JPMorgan Chase Bank, N.A. whereby the Fund may borrow for the temporary funding of shareholder redemptions or for other temporary or emergency purposes. Pursuant to a December 9, 2014 amendment, the credit facility agreement, which is a collective agreement between the Fund and certain other funds managed by the Investment Manager, severally and
not jointly, permits collective borrowings up to $550 million. Interest is charged to each participating fund based on its borrowings at a rate equal to the higher of (i) the overnight federal funds rate plus 1.00% or (ii) the one-month LIBOR rate plus 1.00%. Each borrowing under the credit facility matures no later than 60 days after the date of borrowing. The Fund also pays a commitment fee equal to its pro rata share of the amount of the credit facility at a rate of 0.075% per annum. The commitment fee is included in other expenses in the Statement of Operations. Prior to the December 9, 2014 amendment, the credit facility agreement permitted borrowings up to $500 million under the same terms and interest rates as described above.
The Fund had no borrowings during the year ended May 31, 2015.
Note 8. Significant Risks
Credit Risk
Credit risk is the risk that the value of debt securities in the Fund's portfolio may decline because the issuer may default and fail to pay interest or repay principal when due. Rating agencies assign credit ratings to debt securities to indicate their credit risk. Lower rated or unrated debt securities held by the Fund may present increased credit risk as compared to higher-rated debt securities.
Interest Rate Risk
Interest rate risk is the risk of losses attributable to changes in interest rates. In general, if prevailing interest rates rise, the values of debt securities tend to fall, and if interest rates fall, the values of debt securities tend to rise. Actions by governments and central banking authorities can result in increases in interest rates. Increasing interest rates may negatively affect the value of debt securities held by the Fund, resulting in a negative impact on the Fund's performance and net asset value per share. In general, the longer the maturity or duration of a debt security, the greater its sensitivity to changes in interest rates.
Liquidity Risk
Liquidity risk is the risk associated with a lack of marketability of investments which may make it difficult to sell the investment at a desirable time or price. Changing regulatory, market or other conditions or environments (for example, the interest rate or credit environments) may adversely affect the liquidity of the Fund's investments. The Fund may have to accept a
Annual Report 2015
41
COLUMBIA HIGH YIELD MUNICIPAL FUND
NOTES TO FINANCIAL STATEMENTS (continued)
May 31, 2015
lower selling price for the holding, sell other investments, or forego another, more appealing investment opportunity. Generally, the less liquid the market at the time the Fund sells a portfolio investment, the greater the risk of loss or decline of value to the Fund. A less liquid market can lead to an increase in Fund redemptions, which may negatively impact Fund performance and net asset value per share, including, for example, if the Fund is forced to sell securities in a down market.
High-Yield Securities Risk
Securities rated below investment grade (commonly called "high-yield" or "junk" bonds) and unrated securities of comparable quality expose the Fund to a greater risk of loss of principal and income than a fund that invests solely or primarily in investment grade securities. In addition, these investments have greater price fluctuations, are less liquid and are more likely to experience a default than higher-rated securities. High-yield securities are considered to be predominantly speculative with respect to the issuer's capacity to pay interest and repay principal.
Note 9. Subsequent Events
Management has evaluated the events and transactions that have occurred through the date the financial statements were issued and noted no items requiring adjustment of the financial statements or additional disclosure.
Note 10. Information Regarding Pending and Settled Legal Proceedings
In December 2005, without admitting or denying the allegations, American Express Financial Corporation (AEFC, which is now known as Ameriprise Financial, Inc. (Ameriprise Financial)) entered into settlement agreements with the Securities and Exchange Commission (SEC) and Minnesota Department of Commerce (MDOC) related to market timing activities. As a result, AEFC was censured and ordered to cease and desist from committing or causing any violations of certain provisions of the Investment Advisers Act of 1940, the Investment Company Act of 1940, and various Minnesota laws. AEFC agreed to pay disgorgement of $10 million and civil money penalties of $7 million. AEFC also agreed to retain an independent distribution consultant to assist in developing a plan for distribution of all disgorgement and civil penalties ordered by the SEC in accordance with various undertakings detailed at www.sec.gov/litigation/admin/ia-2451.pdf. Ameriprise
Financial and its affiliates have cooperated with the SEC and the MDOC in these legal proceedings, and have made regular reports to the Funds' Boards of Trustees.
Ameriprise Financial and certain of its affiliates have historically been involved in a number of legal, arbitration and regulatory proceedings, including routine litigation, class actions, and governmental actions, concerning matters arising in connection with the conduct of their business activities. Ameriprise Financial believes that the Funds are not currently the subject of, and that neither Ameriprise Financial nor any of its affiliates are the subject of, any pending legal, arbitration or regulatory proceedings that are likely to have a material adverse effect on the Funds or the ability of Ameriprise Financial or its affiliates to perform under their contracts with the Funds. Ameriprise Financial is required to make quarterly (10-Q), annual (10-K) and, as necessary, 8-K filings with the SEC on legal and regulatory matters that relate to Ameriprise Financial and its affiliates. Copies of these filings may be obtained by accessing the SEC website at www.sec.gov.
There can be no assurance that these matters, or the adverse publicity associated with them, will not result in increased fund redemptions, reduced sale of fund shares or other adverse consequences to the Funds. Further, although we believe proceedings are not likely to have a material adverse effect on the Funds or the ability of Ameriprise Financial or its affiliates to perform under their contracts with the Funds, these proceedings are subject to uncertainties and, as such, we are unable to estimate the possible loss or range of loss that may result. An adverse outcome in one or more of these proceedings could result in adverse judgments, settlements, fines, penalties or other relief that could have a material adverse effect on the consolidated financial condition or results of operations of Ameriprise Financial.
Annual Report 2015
42
COLUMBIA HIGH YIELD MUNICIPAL FUND
REPORT OF INDEPENDENT REGISTERED PUBLIC ACCOUNTING FIRM
To the Trustees of Columbia Funds Series Trust I and the Shareholders of
Columbia High Yield Municipal Fund
In our opinion, the accompanying statement of assets and liabilities, including the portfolio of investments, and the related statements of operations and of changes in net assets and the financial highlights present fairly, in all material respects, the financial position of Columbia High Yield Municipal Fund (the "Fund," a series of Columbia Funds Series Trust I) at May 31, 2015, and the results of its operations, the changes in its net assets and the financial highlights for each of the periods indicated, in conformity with accounting principles generally accepted in the United States of America. These financial statements and financial highlights (hereafter referred to as "financial statements") are the responsibility of the Fund's management. Our responsibility is to express an opinion on these financial statements based on our audits. We conducted our audits of these financial statements in accordance with the standards of the Public Company Accounting Oversight Board (United States). Those standards require that we plan and perform the audit to obtain reasonable assurance about whether the financial statements are free of material misstatement. An audit includes examining, on a test basis, evidence supporting the amounts and disclosures in the financial statements, assessing the accounting principles used and significant estimates made by management, and evaluating the overall financial statement presentation. We believe that our audits, which included confirmation of securities at May 31, 2015 by correspondence with the custodian, brokers and transfer agent, and the application of alternative auditing procedures where such confirmations had not been received, provide a reasonable basis for our opinion.
PricewaterhouseCoopers LLP
Minneapolis, MN
July 23, 2015
Annual Report 2015
43
COLUMBIA HIGH YIELD MUNICIPAL FUND
FEDERAL INCOME TAX INFORMATION
(Unaudited)
The Fund hereby designates the following tax attributes for the fiscal year ended May 31, 2015. Shareholders will be notified in early 2016 of the amounts for use in preparing 2015 income tax returns.
Tax Designations
| Exempt-Interest Dividends | | | 99.55 | % | |
Exempt-Interest Dividends. The percentage of net investment income distributed during the fiscal year that qualifies as exempt-interest dividends for federal tax purposes. A portion of the income may be subject to federal alternative minimum tax.
Annual Report 2015
44
COLUMBIA HIGH YIELD MUNICIPAL FUND
The Trustees serve terms of indefinite duration. The names and birth years of the Trustees and Officers of the Funds in Columbia Funds Series Trust I, the year each was first elected or appointed to office, their principal business occupations during at least the last five years, the number of Funds overseen by each Trustee and other directorships they hold are shown below. Each officer listed below serves as an officer of each Fund in Columbia Funds Series Trust I. The mailing address of each Trustee is: c/o Columbia Management Investment Advisers, LLC, 225 Franklin Street, Mail Drop BX32 05228, Boston, MA 02110.
Independent Trustees
Name, Year of Birth
and Position Held
with the Trust | | Year First
Appointed or
Elected as
Trustee to any
Fund Currently
in the Columbia
Funds Complex
or a Predecessor
Thereof | | Principal Occupation(s)
during the Past Five Years | | Number
of Funds
in the
Columbia
Funds
Complex
Overseen | | Other Directorships
Held by Trustee During
the Past Five Years | |
Douglas A. Hacker
(Born 1955)
Trustee and Chairman
of the Board | | | 1996 | | | Independent business executive since May 2006; Executive Vice President — Strategy of United Airlines from December 2002 to May 2006; President of UAL Loyalty Services (airline marketing company) from September 2001 to December 2002; Executive Vice President and Chief Financial Officer of United Airlines from July 1999 to September 2001 | | | 60 | | | Spartan Nash Company, (food distributor); Nash Finch Company (food distributor) from 2005 to 2013; Aircastle Limited (aircraft leasing); SeaCube Container Leasing Ltd. (container leasing) from 2010 to 2013; and Travelport Worldwide Limited (travel information technology) | |
Janet Langford Carrig
(Born 1957)
Trustee | | | 1996 | | | Senior Vice President, General Counsel and Corporate Secretary, ConocoPhillips (integrated energy company) since September 2007; Deputy General Counsel — Corporate Legal Services, ConocoPhillips from August 2006 to August 2007; Partner, Zelle, Hofmann, Voelbel, Mason & Gette LLP (law firm) from March 2005 to July 2006; Adjunct Professor of Law, Northwestern University from September 2004 to June 2006; Director, UAL Corporation (airline) from February 2006 to July 2006; Chief Administrative Officer and Senior Vice President, Kmart Holding Corporation (consumer goods) from September 2003 to March 2004 | | | 60 | | | None | |
Nancy T. Lukitsh
(Born 1956)
Trustee | | | 2011 | | | Senior Vice President, Partner and Director of Marketing, Wellington Management Company, LLP (investment adviser) from 1997 to 2010; Chair, Wellington Management Investment Portfolios (commingled non-U.S. investment pools) from 2007 to 2010; Director, Wellington Trust Company, NA and other Wellington affiliates from 1997 to 2010 | | | 60 | | | None | |
William E. Mayer
(Born 1940)
Trustee | | | 1991 | | | Partner, Park Avenue Equity Partners (private equity) since February 1999 | | | 60 | | | DynaVox Inc. (speech creation); Lee Enterprises (print media); WR Hambrecht + Co. (financial service provider) from 2000 to 2012; BlackRock Kelso Capital Corporation (investment company); and Premier, Inc. (healthcare) | |
Annual Report 2015
45
COLUMBIA HIGH YIELD MUNICIPAL FUND
TRUSTEES AND OFFICERS (continued)
Independent Trustees (continued)
Name, Year of Birth
and Position Held
with the Trust | | Year First
Appointed or
Elected as
Trustee to any
Fund Currently
in the Columbia
Funds Complex
or a Predecessor
Thereof | | Principal Occupation(s)
during the Past Five Years | | Number
of Funds
in the
Columbia
Funds
Complex
Overseen | | Other Directorships
Held by Trustee During
the Past Five Years | |
David M. Moffett
(Born 1952)
Trustee | | | 2011 | | | Retired. Consultant to Bridgewater and Associates; Chief Executive Officer, Federal Home Loan Mortgage Corporation, from 2008 to 2009; Senior Adviser, Global Financial Services Group, Carlyle Group, Inc., from 2007 to 2008; Vice Chairman and Chief Financial Officer, U.S. Bancorp, from 1993 to 2007 | | | 60 | | | CIT Group Inc. (commercial and consumer finance); eBay Inc. (online trading community); MBIA Inc. (financial service provider); E.W. Scripps Co. (print and television media); Building Materials Holding Corp. (building materials and construction services); Genworth Financial, Inc. (financial and insurance products and services); and University of Oklahoma Foundation | |
Charles R. Nelson
(Born 1942)
Trustee | | | 1981 | | | Retired. Professor Emeritus, University of Washington since 2011; Professor of Economics, University of Washington from 1976 to 2011; Ford and Louisa Van Voorhis Professor of Political Economy, University of Washington from 1993 to 2011; Adjunct Professor of Statistics, University of Washington from 1980 to 2011; Associate Editor, Journal of Money, Credit and Banking from September 1993 to 2008; consultant on econometric and statistical matters | | | 60 | | | None | |
John J. Neuhauser
(Born 1943)
Trustee | | | 1984 | | | President, Saint Michael's College since August 2007; Director or Trustee of several non-profit organizations, including Fletcher Allen Health Care, Inc.; Academic Vice President and Dean of Faculties, Boston College from August 1999 to October 2005; University Professor, Boston College from November 2005 to August 2007 | | | 60 | | | Liberty All-Star Equity Fund and Liberty All-Star Growth Fund (closed-end funds) | |
Patrick J. Simpson
(Born 1944)
Trustee | | | 2000 | | | Partner, Perkins Coie LLP (law firm) | | | 60 | | | None | |
Anne-Lee Verville
(Born 1945)
Trustee | | | 1998 | | | Retired. General Manager, Global Education Industry from 1994 to 1997, President — Application Systems Division from 1991 to 1994, Chief Financial Officer — US Marketing & Services from 1988 to 1991, and Chief Information Officer from 1987 to 1988, IBM Corporation (computer and technology) | | | 60 | | | Enesco Group, Inc. (producer of giftware and home and garden decor products) from 2001 to 2006 | |
Annual Report 2015
46
COLUMBIA HIGH YIELD MUNICIPAL FUND
TRUSTEES AND OFFICERS (continued)
Interested Trustee Affiliate with Investment Manager*
Name, Year of Birth
and Position Held
with the Trust | | Year First
Appointed or
Elected as
Trustee to any
Fund Currently
in the Columbia
Funds Complex
or a Predecessor
Thereof | | Principal Occupation(s)
during the Past Five Years | | Number
of Funds
in the
Columbia
Funds
Complex
Overseen | | Other Directorships
Held by Trustee During
the Past Five Years | |
William F. Truscott
(Born 1960)
Trustee | | | 2012 | | | Chairman of the Board and President, Columbia Management Investment Advisers, LLC since May 2010 and February 2012, respectively (previously President and Chief Investment Officer, 2001-April 2010); Chief Executive Officer, Global Asset Management, Ameriprise Financial, Inc. since September 2012 (previously Chief Executive Officer, U.S. Asset Management & President, Annuities, May 2010-September 2012 and President — U.S. Asset Management and Chief Investment Officer, 2005-April 2010); Director and Chief Executive Officer, Columbia Management Investment Distributors, Inc. since May 2010 and February 2012, respectively (previously Chairman of the Board and Chief Executive Officer, 2006-April 2010); Chairman of the Board and Chief Executive Officer, RiverSource Distributors, Inc. since 2006; Director, Threadneedle Asset Management Holdings, SARL since 2014; President and Chief Executive Officer, Ameriprise Certificate Company, 2006-August 2012 | | | 187 | | | Chairman of the Board, Columbia Management Investment Advisers, LLC since May 2010; Director, Columbia Management Investment Distributors, Inc. since May 2010; Director, Ameriprise Certificate Company, 2006 to January 2013 | |
* Interested person (as defined under the 1940 Act) by reason of being an officer, director, security holder and/or employee of the Investment Manager or Ameriprise Financial.
The Statement of Additional Information has additional information about the Fund's Board members and is available, without charge, upon request by calling 800.345.6611; contacting your financial intermediary; or visiting columbiathreadneedle.com/us.
The Board has appointed officers who are responsible for day-to-day business decisions based on policies it has established. The officers serve at the pleasure of the Board. In addition to Mr. Truscott, who is Senior Vice President, the Funds' other officers are:
Fund Officers
Name,
Address and
Year of Birth | | Position and Year
First Appointed to
Position for any Fund
in the Columbia
Funds Complex or a
Predecessor Thereof | | Principal Occupation(s) During Past Five Years | |
Christopher O. Petersen
5228 Ameriprise
Financial Center
Minneapolis, MN 55474
Born 1970 | | President and Principal Executive Officer (2015) | | Vice President and Lead Chief Counsel, Ameriprise Financial, Inc. since January 2015 (previously, Vice President and Chief Counsel January 2010-December 2014; and Vice President and Group Counsel or Counsel 2004- January 2010); officer of Columbia Funds and affiliated funds since 2007. | |
Michael G. Clarke
225 Franklin Street
Boston, MA 02110
Born 1969 | | Treasurer (2011) and Chief Financial Officer (2009) | | Vice President — Mutual Fund Administration, Columbia Management Investment Advisers, LLC, since May 2010; Managing Director of Fund Administration, Columbia Management Advisors, LLC, September 2004-April 2010; senior officer of Columbia Funds and affiliated funds since 2002. | |
Annual Report 2015
47
COLUMBIA HIGH YIELD MUNICIPAL FUND
TRUSTEES AND OFFICERS (continued)
Fund Officers (continued)
Name,
Address and
Year of Birth | | Position and Year
First Appointed to
Position for any Fund
in the Columbia
Funds Complex or a
Predecessor Thereof | | Principal Occupation(s) During Past Five Years | |
Paul B. Goucher
100 Park Avenue
New York, NY 10017
Born 1968 | | Senior Vice President (2011), Chief Legal Officer (2015) and Assistant Secretary (2008) | | Vice President and Lead Chief Counsel, Ameriprise Financial, Inc. since November 2008 and January 2013, respectively (previously Chief Counsel, January 2010-January 2013 and Group Counsel, November 2008-January 2010). | |
Thomas P. McGuire
225 Franklin Street
Boston, MA 02110
Born 1972 | | Vice President and Chief Compliance Officer (2012) | | Vice President — Asset Management Compliance, Ameriprise Financial, Inc., since May 2010; Chief Compliance Officer, Ameriprise Certificate Company since September 2010; Compliance Executive, Bank of America, 2005-April 2010. | |
Colin Moore
225 Franklin Street
Boston, MA 02110
Born 1958 | | Senior Vice President (2010) | | Executive Vice President and Global Chief Investment Officer, Ameriprise Financial, Inc., since July 2013; Director and Global Chief Investment Officer, Columbia Management Investment Advisers, LLC since May 2010; Manager, Managing Director and Chief Investment Officer, Columbia Management Advisors, LLC, 2007-April 2010. | |
Michael E. DeFao
225 Franklin Street
Boston, MA 02110
Born 1968 | | Vice President (2011) and Assistant Secretary (2010) | | Vice President and Chief Counsel, Ameriprise Financial, Inc. since May 2010; Associate General Counsel, Bank of America, 2005-April 2010. | |
Joseph F. DiMaria
225 Franklin Street
Boston, MA 02110
Born 1968 | | Vice President (2011), Assistant Treasurer (2012) and Chief Accounting Officer (2008) | | Vice President — Mutual Fund Treasurer, Columbia Management Investment Advisers, LLC since May 2010; Director of Fund Administration, Columbia Management Advisors, LLC, 2006-April 2010. | |
Amy Johnson
5228 Ameriprise
Financial Center
Minneapolis, MN 55474
Born 1965 | | Vice President (2006) | | Managing Director and Chief Operating Officer, Columbia Management Investment Advisers, LLC since May 2010 (previously Chief Administrative Officer, 2009-April 2010, and Vice President — Asset Management and Trust Company Services, 2006-2009). | |
Lyn Kephart-Strong
5228 Ameriprise
Financial Center
Minneapolis, MN 55474
Born 1960 | | Vice President (2015) | | President, Columbia Management Investment Services Corp. since October 2014; Vice President & Resolution Officer, Ameriprise Trust Company since August 2009; President, RiverSource Service Corporation 2004-2010. | |
Ryan C. Larrenaga
225 Franklin Street
Boston, MA 02110
Born 1970 | | Vice President and Secretary (2015) | | Vice President and Group Counsel, Ameriprise Financial, Inc. since August 2011 (previously, Counsel from May 2010 to August 2011); Assistant General Counsel, Bank of America, 2005-April 2010; officer of Columbia Funds and affiliated funds since 2005. | |
Annual Report 2015
48
COLUMBIA HIGH YIELD MUNICIPAL FUND
IMPORTANT INFORMATION ABOUT THIS REPORT
Each fund mails one shareholder report to each shareholder address. If you would like more than one report, please call shareholder services at 800.345.6611 and additional reports will be sent to you.
The policy of the Board is to vote the proxies of the companies in which each fund holds investments consistent with the procedures as stated in the Statement of Additional Information (SAI). You may obtain a copy of the SAI without charge by calling 800.345.6611; contacting your financial intermediary; visiting columbiathreadneedle.com/us; or searching the website of the Securities and Exchange Commission (SEC) at sec.gov. Information regarding how each fund voted proxies relating to portfolio securities is filed with the SEC by August 31st for the most recent 12-month period ending June 30th of that year, and is available without charge by visiting columbiathreadneedle.com/us, or searching the website of the SEC at sec.gov.
Each fund files a complete schedule of portfolio holdings with the SEC for the first and third quarters of each fiscal year on Form N-Q. Each fund's Form N-Q is available on the SEC's website at sec.gov and may be reviewed and copied at the SEC's Public Reference Room in Washington, D.C. Information on the operation of the Public Reference Room may be obtained by calling 800.SEC.0330. Each fund's complete schedule of portfolio holdings, as filed on Form N-Q, can also be obtained without charge, upon request, by calling 800.345.6611.
Annual Report 2015
49
Columbia High Yield Municipal Fund
P.O. Box 8081
Boston, MA 02266-8081

This information is for use with concurrent or prior delivery of a fund prospectus. Please read and consider the investment objectives, risks, charges and expenses for any fund carefully before investing. For a prospectus and summary prospectus, which contains this and other important information about the Fund, go to columbiathreadneedle.com/us. The Fund is distributed by Columbia Management Investment Distributors, Inc., member FINRA, and managed by Columbia Management Investment Advisers, LLC.
Columbia Threadneedle Investments (Columbia Threadneedle) is the global brand name of the Columbia and Threadneedle group of companies.
All rights reserved. Columbia Management Investment Distributors, Inc., 225 Franklin Street, Boston, MA 02110-2804
© 2015 Columbia Management Investment Advisers, LLC.
columbiathreadneedle.com/us
ANN161_05_E01_(07/15)

ANNUAL REPORT
May 31, 2015

COLUMBIA INTERMEDIARY ALTERNATIVES FUND
Shares of Columbia Intermediary Alternatives Fund (the Fund) are issued solely in private placement transactions that do not involve any public offering within the meaning of Section 4(a)(2) of the Securities Act of 1933, as amended (the 1933 Act). Investments in the Fund may be made only by investment companies, common or commingled trust funds or similar organizations or persons that are accredited investors within the meaning of the 1933 Act.

COLUMBIA INTERMEDIARY ALTERNATIVES FUND
Portfolio Overview | | | 2 | | |
Understanding Your Fund's Expenses | | | 3 | | |
Portfolio of Investments | | | 4 | | |
Statement of Assets and Liabilities | | | 6 | | |
Statement of Operations | | | 7 | | |
Statement of Changes in Net Assets | | | 8 | | |
Financial Highlights | | | 10 | | |
Notes to Financial Statements | | | 11 | | |
Report of Independent Registered
Public Accounting Firm | | | 15 | | |
Trustees and Officers | | | 16 | | |
Board Consideration and Approval of Advisory Agreement and Subadvisory Agreement | | | 20 | | |
Important Information About This Report | | | 25 | | |
Fund Investment Manager
Columbia Management Investment
Advisers, LLC
225 Franklin Street
Boston, MA 02110
Fund Distributor
Columbia Management Investment
Distributors, Inc.
225 Franklin Street
Boston, MA 02110
Fund Transfer Agent
Columbia Management Investment
Services Corp.
P.O. Box 8081
Boston, MA 02266-8081
For more information about any of the funds, please visit columbiathreadneedle.com/us or call 800.345.6611. Customer Service Representatives are available to answer your questions Monday through Friday from 8 a.m. to 7 p.m. Eastern time.
The views expressed in this report reflect the current views of the respective parties. These views are not guarantees of future performance and involve certain risks, uncertainties and assumptions that are difficult to predict, so actual outcomes and results may differ significantly from the views expressed. These views are subject to change at any time based upon economic, market or other conditions and the respective parties disclaim any responsibility to update such views. These views may not be relied on as investment advice and, because investment decisions for a Columbia fund are based on numerous factors, may not be relied on as an indication of trading intent on behalf of any particular Columbia fund. References to specific securities should not be construed as a recommendation or investment advice.
COLUMBIA CONTRARIAN CORE FUND
COLUMBIA INTERMEDIARY ALTERNATIVES FUND
PORTFOLIO OVERVIEW
(Unaudited)
Portfolio Management
Jeffrey Knight, CFA
William Landes, Ph.D.
Marc Khalamayzer, CFA
Portfolio Breakdown (%)
(at May 31, 2015) | |
Alternative Investment Funds | | | 100.0 | | |
Money Market Funds | | | 0.0 | (a) | |
Total | | | 100.0 | | |
Percentages indicated are based upon total investments. The Fund's portfolio composition is subject to change.
(a) Rounds to zero.
Annual Report 2015
2
COLUMBIA INTERMEDIARY ALTERNATIVES FUND
UNDERSTANDING YOUR FUND'S EXPENSES
(Unaudited)
As an investor, you incur two types of costs. There are transaction costs, which generally include sales charges on purchases and may include redemption fees. There are also ongoing costs, which generally include management fees, distribution and/or service fees, and other fund expenses. The following information is intended to help you understand your ongoing costs (in dollars) of investing in the Fund and to help you compare these costs with the ongoing costs of investing in other mutual funds.
Analyzing Your Fund's Expenses
To illustrate these ongoing costs, we have provided examples and calculated the expenses paid by investors in the Fund during the period. The actual and hypothetical information in the table is based on an initial investment of $1,000 at the beginning of the period indicated and held for the entire period. Expense information is calculated two ways and each method provides you with different information. The amount listed in the "Actual" column is calculated using the Fund's actual operating expenses and total return for the period. You may use the Actual information, together with the amount invested, to estimate the expenses that you paid over the period. Simply divide your account value by $1,000 (for example, an $8,600 account value divided by $1,000 = 8.6), then multiply the results by the expenses paid during the period under the "Actual" column. The amount listed in the "Hypothetical" column assumes a 5% annual rate of return before expenses (which is not the Fund's actual return) and then applies the Fund's actual expense ratio for the period to the hypothetical return. You should not use the hypothetical account values and expenses to estimate either your actual account balance at the end of the period or the expenses you paid during the period. See "Compare With Other Funds" below for details on how to use the hypothetical data.
In addition to the ongoing expenses which the Fund bears directly, the Fund's shareholders indirectly bear the Fund's allocable share of the costs and expenses of each underlying fund in which the Fund invests. You can also estimate the effective expenses paid during the period, which includes the indirect fees associated with investing in the underlying funds, by using the amounts listed in the "Effective Expenses Paid During the Period" column.
Compare With Other Funds
Since all mutual funds are required to include the same hypothetical calculations about expenses in shareholder reports, you can use this information to compare the ongoing cost of investing in the Fund with other funds. To do so, compare the hypothetical example with the 5% hypothetical examples that appear in the shareholder reports of other funds. As you compare hypothetical examples of other funds, it is important to note that hypothetical examples are meant to highlight the ongoing costs of investing in a fund only and do not reflect any transaction costs, such as sales charges, or redemption or exchange fees. Therefore, the hypothetical calculations are useful in comparing ongoing costs only, and will not help you determine the relative total costs of owning different funds. If transaction costs were included in these calculations, your costs would be higher.
December 1, 2014 – May 31, 2015
Account Value at
the Beginning of
the Period ($) | | Account Value at
the End of
the Period ($) | | Expenses Paid
During the
Period ($) | | Fund's Annualized
Expense Ratio (%) | | Effective Expenses
Paid During the
Period ($) | | Fund's Effective
Annualized
Expense Ratio (%) | |
| Actual | | Hypothetical | | Actual | | Hypothetical | | Actual | | Hypothetical | | Actual | | Actual | | Hypothetical | | Actual | |
| | 1,000.00 | | | | 1,000.00 | | | | 1,037.80 | (a) | | | 1,024.63 | | | | 0.20 | (a) | | | 0.30 | | | | 0.06 | (a) | | | 11.17 | (a) | | | 16.56 | | | | 3.28 | (a) | |
(a) Based on operations from January 28, 2015 (commencement of operations) through the stated period end.
Expenses paid during the period are equal to the annualized expense ratio as indicated above, multiplied by the average account value over the period and then multiplied by the number of days in the Fund's most recent fiscal half year and divided by 365.
Effective expenses paid during the period and the Fund's effective annualized expense ratio include expenses borne directly by the Fund plus the Fund's pro rata portion of the ongoing expenses charged by the underlying funds using the expense ratio of each class of the underlying funds as of the underlying fund's most recent shareholder report.
Annual Report 2015
3
COLUMBIA INTERMEDIARY ALTERNATIVES FUND
PORTFOLIO OF INVESTMENTS
May 31, 2015
(Percentages represent value of investments compared to net assets)
Alternative Investment Funds 100.0%
| | | Shares | | Value ($) | |
Blackstone Alternative Multi-Strategy
Fund, Class Y Shares(a)(b) | | | 8,748,728 | | | | 90,811,797 | | |
Total Alternative Investment Funds
(Cost: $87,800,000) | | | | | 90,811,797 | | |
Money Market Funds —%
| | | Shares | | Value ($) | |
Columbia Short-Term Cash Fund,
0.114%(a)(c) | | | 44,652 | | | | 44,652 | | |
Total Money Market Funds
(Cost: $44,652) | | | | | 44,652 | | |
Total Investments
(Cost: $87,844,652) | | | | | 90,856,449 | | |
Other Assets & Liabilities, Net | | | | | (8,515 | ) | |
Net Assets | | | | | 90,847,934 | | |
Notes to Portfolio of Investments
(a) As defined in the Investment Company Act of 1940, an affiliated company is one in which the Fund owns 5% or more of the company's outstanding voting securities, or a company which is under common ownership or control with the Fund. Holdings and transactions in these affiliated companies during the year ended May 31, 2015 are as follows:
| Issuer | | Beginning
Cost ($) | | Purchase
Cost ($) | | Proceeds
From Sales ($) | | Ending
Cost ($) | | Dividends —
Affiliated
Issuers ($) | | Value ($) | |
Blackstone Alternative Multi-Strategy
Fund, Class Y Shares | | | — | | | | 87,800,000 | | | | — | | | | 87,800,000 | | | | — | | | | 90,811,797 | | |
Columbia Short-Term Cash Fund | | | 10,000 | | | | 53,687 | | | | (19,035 | ) | | | 44,652 | | | | 4 | | | | 44,652 | | |
Total | | | 10,000 | | | | 87,853,687 | | | | (19,035 | ) | | | 87,844,652 | | | | 4 | | | | 90,856,449 | | |
(b) Non-income producing investment.
(c) The rate shown is the seven-day current annualized yield at May 31, 2015.
Fair Value Measurements
The Fund categorizes its fair value measurements according to a three-level hierarchy that maximizes the use of observable inputs and minimizes the use of unobservable inputs by prioritizing that the most observable input be used when available. Observable inputs are those that market participants would use in pricing an investment based on market data obtained from sources independent of the reporting entity. Unobservable inputs are those that reflect the Fund's assumptions about the information market participants would use in pricing an investment. An investment's level within the fair value hierarchy is based on the lowest level of any input that is deemed significant to the asset or liability's fair value measurement. The input levels are not necessarily an indication of the risk or liquidity associated with investments at that level. For example, certain U.S. government securities are generally high quality and liquid, however, they are reflected as Level 2 because the inputs used to determine fair value may not always be quoted prices in an active market.
Fair value inputs are summarized in the three broad levels listed below:
> Level 1 — Valuations based on quoted prices for investments in active markets that the Fund has the ability to access at the measurement date (including NAV for open-end mutual funds). Valuation adjustments are not applied to Level 1 investments.
> Level 2 — Valuations based on other significant observable inputs (including quoted prices for similar securities, interest rates, prepayment speeds, credit risks, etc.).
> Level 3 — Valuations based on significant unobservable inputs (including the Fund's own assumptions and judgment in determining the fair value of investments).
Inputs that are used in determining fair value of an investment may include price information, credit data, volatility statistics, and other factors. These inputs can be either observable or unobservable. The availability of observable inputs can vary between investments, and is affected by various factors such as the type of investment, and the volume and level of activity for that investment or similar investments in the marketplace. The inputs will be considered by the Investment Manager, along with any other relevant factors in the calculation of an investment's fair value. The Fund uses prices and inputs that are current as of the measurement date, which may include periods of market
The accompanying Notes to Financial Statements are an integral part of this statement.
Annual Report 2015
4
COLUMBIA INTERMEDIARY ALTERNATIVES FUND
PORTFOLIO OF INVESTMENTS (continued)
May 31, 2015
Fair Value Measurements (continued)
dislocations. During these periods, the availability of prices and inputs may be reduced for many investments. This condition could cause an investment to be reclassified between the various levels within the hierarchy.
Investments falling into the Level 3 category are primarily supported by quoted prices from brokers and dealers participating in the market for those investments. However, these may be classified as Level 3 investments due to lack of market transparency and corroboration to support these quoted prices. Additionally, valuation models may be used as the pricing source for any remaining investments classified as Level 3. These models may rely on one or more significant unobservable inputs and/or significant assumptions by the Investment Manager. Inputs used in valuations may include, but are not limited to, financial statement analysis, capital account balances, discount rates and estimated cash flows, and comparable company data.
Under the direction of the Fund's Board of Trustees (the Board), the Investment Manager's Valuation Committee (the Committee) is responsible for overseeing the valuation procedures approved by the Board. The Committee consists of voting and non-voting members from various groups within the Investment Manager's organization, including operations and accounting, trading and investments, compliance, risk management and legal.
The Committee meets at least monthly to review and approve valuation matters, which may include a description of specific valuation determinations, data regarding pricing information received from approved pricing vendors and brokers and the results of Board-approved valuation control policies and procedures (the Policies). The Policies address, among other things, instances when market quotations are or are not readily available, including recommendations of third party pricing vendors and a determination of appropriate pricing methodologies; events that require specific valuation determinations and assessment of fair value techniques; securities with a potential for stale pricing, including those that are illiquid, restricted, or in default; and the effectiveness of third party pricing vendors, including periodic reviews of vendors. The Committee meets more frequently, as needed, to discuss additional valuation matters, which may include the need to review back-testing results, review time-sensitive information or approve related valuation actions. The Committee reports to the Board, with members of the Committee meeting with the Board at each of its regularly scheduled meetings to discuss valuation matters and actions during the period, similar to those described earlier.
For investments categorized as Level 3, the Committee monitors information similar to that described above, which may include: (i) data specific to the issuer or comparable issuers, (ii) general market or specific sector news and (iii) quoted prices and specific or similar security transactions. The Committee considers this data and any changes from prior periods in order to assess the reasonableness of observable and unobservable inputs, any assumptions or internal models used to value those securities and changes in fair value. This data is also used to corroborate, when available, information received from approved pricing vendors and brokers. Various factors impact the frequency of monitoring this information (which may occur as often as daily). However, the Committee may determine that changes to inputs, assumptions and models are not required as a result of the monitoring procedures performed.
The following table is a summary of the inputs used to value the Fund's investments at May 31, 2015:
| | | Level 1
Quoted Prices in Active
Markets for Identical
Assets ($) | | Level 2
Other Significant
Observable Inputs ($) | | Level 3
Significant
Unobservable Inputs ($) | | Total ($) | |
Investments | |
Alternative Investment Funds | | | 90,811,797 | | | | — | | | | — | | | | 90,811,797 | | |
Money Market Funds | | | 44,652 | | | | — | | | | — | | | | 44,652 | | |
Total Investments | | | 90,856,449 | | | | — | | | | — | | | | 90,856,449 | | |
See the Portfolio of Investments for all investment classifications not indicated in the table.
There were no transfers of financial assets between levels during the period.
The accompanying Notes to Financial Statements are an integral part of this statement.
Annual Report 2015
5
COLUMBIA INTERMEDIARY ALTERNATIVES FUND
STATEMENT OF ASSETS AND LIABILITIES
May 31, 2015
Assets | |
Investments, at value | |
Affiliated issuers (identified cost $87,844,652) | | $ | 90,856,449 | | |
Receivable for: | |
Dividends | | | 2 | | |
Trustees' deferred compensation plan | | | 414 | | |
Other assets | | | 8,672 | | |
Total assets | | | 90,865,537 | | |
Liabilities | |
Payable for: | |
Chief compliance officer expenses | | | 7 | | |
Custodian fees | | | 4,677 | | |
Printing and postage fees | | | 3,500 | | |
Accounting fees | | | 8,515 | | |
Other expenses | | | 490 | | |
Trustees' deferred compensation plan | | | 414 | | |
Total liabilities | | | 17,603 | | |
Net assets applicable to outstanding capital stock | | $ | 90,847,934 | | |
Represented by | |
Paid-in capital | | $ | 87,861,850 | | |
Excess of distributions over net investment income | | | (25,713 | ) | |
Unrealized appreciation (depreciation) on: | |
Investments — affiliated issuers | | | 3,011,797 | | |
Total — representing net assets applicable to outstanding capital stock | | $ | 90,847,934 | | |
Shares outstanding | | | 8,950,968 | | |
Net asset value per share | | $ | 10.15 | | |
The accompanying Notes to Financial Statements are an integral part of this statement.
Annual Report 2015
6
COLUMBIA INTERMEDIARY ALTERNATIVES FUND
STATEMENT OF OPERATIONS
Year Ended May 31, 2015(a)
Net investment income | |
Income: | |
Dividends — affiliated issuers | | $ | 4 | | |
Total income | | | 4 | | |
Expenses: | |
Compensation of board members | | | 3,256 | | |
Custodian fees | | | 4,677 | | |
Shareholder reports and communication | | | 4,243 | | |
Professional fees | | | 9,486 | | |
Offering costs | | | 3,930 | | |
Chief compliance officer expenses | | | 16 | | |
Other | | | 109 | | |
Total expenses | | | 25,717 | | |
Net investment loss | | | (25,713 | ) | |
Realized and unrealized gain (loss) — net | |
Net change in unrealized appreciation (depreciation) on: | |
Investments — affiliated issuers | | | 3,011,797 | | |
Net change in unrealized appreciation | | | 3,011,797 | | |
Net realized and unrealized gain | | | 3,011,797 | | |
Net increase in net assets resulting from operations | | $ | 2,986,084 | | |
(a) Based on operations from January 28, 2015 (commencement of operations) through the stated period end.
The accompanying Notes to Financial Statements are an integral part of this statement.
Annual Report 2015
7
COLUMBIA INTERMEDIARY ALTERNATIVES FUND
STATEMENT OF CHANGES IN NET ASSETS
| | | Year Ended
May 31, 2015(a) | |
Operations | |
Net investment loss | | $ | (25,713 | ) | |
Net change in unrealized appreciation | | | 3,011,797 | | |
Net increase in net assets resulting from operations | | | 2,986,084 | | |
Increase in net assets from capital stock activity | | | 87,851,850 | | |
Total increase in net assets | | | 90,837,934 | | |
Net assets at beginning of year | | | 10,000 | | |
Net assets at end of year | | $ | 90,847,934 | | |
Excess of distributions over net investment income | | $ | (25,713 | ) | |
(a) Based on operations from January 28, 2015 (commencement of operations) through the stated period end.
The accompanying Notes to Financial Statements are an integral part of this statement.
Annual Report 2015
8
COLUMBIA INTERMEDIARY ALTERNATIVES FUND
STATEMENT OF CHANGES IN NET ASSETS (continued)
| | | Year Ended May 31, 2015(a) | |
| | | Shares | | Dollars ($) | |
Capital stock activity | |
Subscriptions | | | 8,950,968 | | | | 87,861,900 | | |
Redemptions | | | (1,000 | ) | | | (10,050 | ) | |
Total increase | | | 8,949,968 | | | | 87,851,850 | | |
Total net increase | | | 8,949,968 | | | | 87,851,850 | | |
(a) Based on operations from January 28, 2015 (commencement of operations) through the stated period end.
The accompanying Notes to Financial Statements are an integral part of this statement.
Annual Report 2015
9
COLUMBIA INTERMEDIARY ALTERNATIVES FUND
The following table is intended to help you understand the Fund's financial performance. Certain information reflects financial results for a single share held for the periods shown. Per share net investment income (loss) amounts are calculated based on average shares outstanding during the period. Total return assumes reinvestment of all dividends and distributions, if any. Total return does not reflect payment of sales charges, if any. Total return and portfolio turnover are not annualized for periods of less than one year. The portfolio turnover rate is calculated without regard to purchase and sales transactions of short-term instruments and certain derivatives, if any. If such transactions were included, the Fund's portfolio turnover rate may be higher.
| | | Year Ended
May 31,
2015(a) | |
Per share data | |
Net asset value, beginning of period | | $ | 9.78 | | |
Income from investment operations: | |
Net investment income | | | (0.00 | )(b) | |
Net realized and unrealized gain | | | 0.37 | | |
Total from investment operations | | | 0.37 | | |
Net asset value, end of period | | $ | 10.15 | | |
Total return | | | 3.78 | % | |
Ratios to average net assets(c) | |
Total gross expenses | | | 0.06 | %(d) | |
Total net expenses | | | 0.06 | %(d) | |
Net investment loss | | | (0.06 | %)(d) | |
Supplemental data | |
Net assets, end of period (in thousands) | | $ | 90,848 | | |
Portfolio turnover | | | 0 | % | |
Notes to Financial Highlights
(a) Based on operations from January 28, 2015 (commencement of operations) through the stated period end.
(b) Rounds to zero.
(c) In addition to the fees and expenses that the Fund bears directly, the Fund indirectly bears a pro rata share of the fees and expenses of underlying funds in which the Fund invests. Such indirect expenses are not included in the Fund's reported expense ratios.
(d) Annualized.
The accompanying Notes to Financial Statements are an integral part of this statement.
Annual Report 2015
10
COLUMBIA INTERMEDIARY ALTERNATIVES FUND
NOTES TO FINANCIAL STATEMENTS
May 31, 2015
Note 1. Organization
Columbia Intermediary Alternatives Fund (the Fund), a series of Columbia Funds Series Trust I (the Trust), is a non-diversified fund. The Trust is registered under the Investment Company Act of 1940, as amended (the 1940 Act), as an open-end management investment company organized as a Massachusetts business trust.
The Fund may invest in any securities or other instruments or assets that Columbia Management Investment Advisers, LLC (the Investment Manager), a wholly-owned subsidiary of Ameriprise Financial, Inc. (Ameriprise Financial), determines would be appropriate for the Fund. At May 31, 2015, substantially all of the Fund's assets were invested in Class Y shares of Blackstone Alternative Multi-Strategy Fund (the Blackstone Fund), a third-party (unaffiliated) mutual fund (and registered commodity pool) managed by Blackstone Alternative Investment Advisors LLC.
Because the Fund invests substantially all of its assets in the Blackstone Fund, and substantially all of the Fund's income will result from distributions from and gains on the disposition of shares of the Blackstone Fund, the U.S. federal income tax treatment of the Fund, including the assets owned and the income earned by the Fund, will be deemed to or will include such treatment of the Blackstone Fund, and, as applicable, the assets owned and the income earned by the Blackstone Fund.
For information on the Blackstone Fund, please refer to the Fund's current prospectus and the prospectus of the Blackstone Fund.
On January 26, 2015, the Investment Manager invested $10,000 in the Fund, which represented the initial capital for the Fund at $10.00 per share.
These financial statements cover the period from January 28, 2015 (commencement of operations) through May 31, 2015.
Fund Shares
The Trust may issue an unlimited number of shares (without par value). Shares of the Fund may be purchased at net asset value without a sales charge. Shares of the Fund are issued solely in private placement transactions that do not involve any public offering within the meaning of Section 4(a)(2) of the 1933 Act. Investments in the Fund may be made only by investment companies, common or commingled trust funds, or similar organizations or persons that are
accredited investors within the meaning of Regulation D under the 1933 Act.
Note 2. Summary of Significant Accounting Policies
Basis of Preparation
The Fund is an investment company that applies the accounting and reporting guidance in the Financial Accounting Standards Board (FASB) Accounting Standards Codification Topic 946, Financial Services — Investment Companies (ASC 946). The financial statements are prepared in accordance with U.S. generally accepted accounting principles (GAAP), which requires management to make certain estimates and assumptions that affect the reported amounts of assets and liabilities, the disclosure of contingent assets and liabilities at the date of the financial statements and the reported amounts of income and expenses during the reporting period. Actual results could differ from those estimates.
The following is a summary of significant accounting policies followed by the Fund in the preparation of its financial statements.
Security Valuation
Investments in open-end investment companies, including money market funds, are valued at their latest net asset value.
Investments for which market quotations are not readily available, or that have quotations which management believes are not reflective of market value or reliable, are valued at fair value as determined in good faith under procedures approved by and under the general supervision of the Board of Trustees (the Board). If a security or class of securities (such as foreign securities) is valued at fair value, such value is likely to be different from the quoted or published price for the security.
The determination of fair value often requires significant judgment. To determine fair value, management may use assumptions including but not limited to future cash flows and estimated risk premiums. Multiple inputs from various sources may be used to determine fair value.
GAAP requires disclosure regarding the inputs and valuation techniques used to measure fair value and any changes in valuation inputs or techniques. In addition, investments shall be disclosed by major category. This information is disclosed following the Fund's Portfolio of Investments.
Annual Report 2015
11
COLUMBIA INTERMEDIARY ALTERNATIVES FUND
NOTES TO FINANCIAL STATEMENTS (continued)
May 31, 2015
Security Transactions
Security transactions are accounted for on the trade date. Cost is determined and gains (losses) are based upon the specific identification method for both financial statement and federal income tax purposes.
Income Recognition
Income and capital gain distributions from the Blackstone Fund, if any, are recorded on the ex-dividend date.
Expenses
General expenses of the Trust are allocated to the Fund and other funds of the Trust based upon relative net assets or other expense allocation methodologies determined by the nature of the expense. Expenses directly attributable to the Fund are charged to the Fund.
Federal Income Tax Status
The Fund is a disregarded entity for federal income tax purposes and does not expect to make regular distributions to shareholders. The Fund will not be subject to federal income tax, and therefore, there is no provision for federal income taxes. The shareholder is subject to tax on its distributive share of the Fund's income and losses. The components of the Fund's net assets are reported at the shareholder level for tax purposes, and therefore, are not presented in the Statement of Assets and Liabilities.
Management of the Fund has concluded that there are no significant uncertain tax positions in the Fund that would require recognition in the financial statements. However, management's conclusion may be subject to review and adjustment at a later date based on factors including, but not limited to, new tax laws, regulations, and administrative interpretations (including relevant court decisions). Generally, the Fund's federal tax returns for the prior three fiscal years remain subject to examination by the Internal Revenue Service.
Distributions to Shareholders
The Fund intends to declare and pay distributions to its sole shareholder, Columbia Adaptive Alternatives Fund, at the discretion of the Fund's Board. Each time a distribution is made, the net asset value per share is reduced by the amount of the distribution.
Guarantees and Indemnifications
Under the Trust's organizational documents and, in some cases, by contract, its officers and trustees are indemnified against certain liabilities arising out of the
performance of their duties to the Trust or its funds. In addition, certain of the Fund's contracts with its service providers contain general indemnification clauses. The Fund's maximum exposure under these arrangements is unknown since the amount of any future claims that may be made against the Fund cannot be determined, and the Fund has no historical basis for predicting the likelihood of any such claims.
Note 3. Fees and Compensation Paid to Affiliates
Investment Management Fees
Under an Investment Management Services Agreement, the Investment Manager determines which securities will be purchased, held or sold. The Fund does not pay the Investment Manager a direct management fee for managing its assets. Under the Investment Management Services Agreement, however, the Fund pays taxes, brokerage commissions and nonadvisory expenses.
Subadvisory Agreement
The Fund's Board has approved a subadvisory agreement between the Investment Manager and Threadneedle International Limited (Threadneedle), an affiliate of the Investment Manager and wholly-owned subsidiary of Ameriprise Financial. As of May 31, 2015, Threadneedle is not providing services to the Fund pursuant to the subadvisory agreement.
Administration Fees
Under an Administrative Services Agreement, the Investment Manager also serves as the Fund Administrator. The Fund does not pay the Administrator a fee for the administration and accounting services it provides to the Fund.
Offering Costs
Offering costs were incurred prior to the shares of the Fund being offered. Offering costs include shareholder reports and communication, among other things. The Fund amortizes offering costs over a period of 12 months from the commencement of operations.
Compensation of Board Members
Board members are compensated for their services to the Fund as disclosed in the Statement of Operations. The Trust's independent Trustees may participate in a Deferred Compensation Plan (the Plan) which may be terminated at any time. Obligations of the Plan will be paid solely out of the Fund's assets.
Annual Report 2015
12
COLUMBIA INTERMEDIARY ALTERNATIVES FUND
NOTES TO FINANCIAL STATEMENTS (continued)
May 31, 2015
Compensation of Chief Compliance Officer
The Board has appointed a Chief Compliance Officer to the Fund in accordance with federal securities regulations. The Fund is allocated a portion of the expenses associated with the Chief Compliance Officer based on relative net assets of the Trust.
Transfer Agent Fees
Under a Transfer and Dividend Disbursing Agent Agreement, Columbia Management Investment Services Corp. (the Transfer Agent), an affiliate of the Investment Manager and a wholly-owned subsidiary of Ameriprise Financial, is responsible for providing transfer agency services to the Fund. The Transfer Agent has contracted with Boston Financial Data Services (BFDS) to serve as sub-transfer agent. The Fund does not pay the Transfer Agent a fee for the transfer agency services it provides to the Fund.
Distribution and Service Fees
The Fund has an agreement with Columbia Management Investment Distributors, Inc. (the Distributor), an affiliate of the Investment Manager and a wholly-owned subsidiary of Ameriprise Financial, for distribution and shareholder services. As of May 31, 2015, the Fund has not engaged the Distributor to provide distribution services.
Note 4. Portfolio Information
The cost of purchases and proceeds from sales of securities, excluding short-term investments and derivatives, if any, aggregated to $87,800,000 and $0, respectively, for the period ended May 31, 2015. The amount of purchase and sale activity impacts the portfolio turnover rate reported in the Financial Highlights.
Note 5. Affiliated Money Market Fund
The Fund invests in Columbia Short-Term Cash Fund, an affiliated money market fund established for the exclusive use by the Fund and other affiliated funds. The income earned by the Fund from such investments is included as Dividends — affiliated issuers in the Statement of Operations. As an investing fund, the Fund indirectly bears its proportionate share of the expenses of Columbia Short-Term Cash Fund.
Note 6. Shareholder Concentration
At May 31, 2015, Columbia Adaptive Alternatives Fund, an affiliate of the Fund, owned 100% of the Fund's shares. Subscription and redemption activity of this
account may have a significant effect on the operations of the Fund.
Note 7. Significant Risks
Non-Diversification Risk
A non-diversified fund is permitted to invest a greater percentage of its total assets in fewer issuers than a diversified fund. The Fund may, therefore, have a greater risk of loss from a few issuers than a similar fund that invests more broadly.
Alternative Strategies Investment Risk
An investment in alternative investment strategies (Alternative Strategies) involves risks, which may be significant. Alternative Strategies may include strategies, instruments or other assets, such as derivatives, that seek investment returns uncorrelated with the broad equity and fixed income/debt markets, as well as those providing exposure to other markets (such as commodity markets), including but not limited to absolute (positive) return strategies. Alternative Strategies may fail to achieve their desired performance, market or other exposure, or their returns (or lack thereof) may be more correlated with the broad equity and/or fixed income/debt markets than was anticipated, and the Fund may lose money.
To the extent that an underlying fund is charged a performance (or incentive) fee (which would indirectly be borne by the Fund's shareholders), such fees may create incentives for the underlying fund's manager to make investments that are riskier or more speculative than in the absence of these fees. Because these fees are often based on both realized as well as unrealized appreciation, the fee may be greater than if it were based only on realized gains. In addition, underlying fund managers may receive compensation for positive relative performance of the underlying fund even if the underlying fund's overall returns are negative.
Investing in Other Funds Risk
The Fund's investment in another fund subjects the Fund to the investment performance (positive or negative) and risks of the underlying fund in direct proportion to the Fund's investment therein. The performance of the underlying fund could be adversely affected if other investors in the same underlying fund make relatively large investments or redemptions in such underlying fund. The Fund, and its shareholders, indirectly bear a portion of the expenses of any funds in which the Fund invests. Because the expenses and costs of a fund are shared by its
Annual Report 2015
13
COLUMBIA INTERMEDIARY ALTERNATIVES FUND
NOTES TO FINANCIAL STATEMENTS (continued)
May 31, 2015
investors, redemptions by other investors in the underlying fund could result in decreased economies of scale and increased operating expenses for such fund. These transactions might also result in higher brokerage, tax or other costs for the underlying fund. This risk may be particularly important when one investor owns a substantial portion of the underlying fund. Also, to the extent that the Fund is constrained/restricted from investing (or investing further) in a particular underlying fund for one or more reasons (e.g., underlying fund capacity constraints or regulatory restrictions) or if the Fund chooses to sell its investment in an underlying fund because of poor investment performance or for other reasons, the Fund may have to invest in one or more other underlying funds, including less desirable funds — from a strategy or investment performance standpoint — which could have a negative impact on Fund performance. In addition, Fund performance could be negatively impacted if one or more appropriate alternate underlying funds are not identified or available for investment timely or at all.
Note 8. Subsequent Events
Management has evaluated the events and transactions that have occurred through the date the financial statements were issued and noted no items requiring adjustment of the financial statements or additional disclosure.
Note 9. Information Regarding Pending and Settled Legal Proceedings
In December 2005, without admitting or denying the allegations, American Express Financial Corporation (AEFC, which is now known as Ameriprise Financial, Inc. (Ameriprise Financial)) entered into settlement agreements with the Securities and Exchange Commission (SEC) and Minnesota Department of Commerce (MDOC) related to market timing activities. As a result, AEFC was censured and ordered to cease and desist from committing or causing any violations of certain provisions of the Investment Advisers Act of 1940, the Investment Company Act of 1940, and various Minnesota laws. AEFC agreed to pay disgorgement of $10 million and civil money penalties of $7 million. AEFC also agreed to retain an independent distribution consultant to assist in developing a plan for distribution of all disgorgement and civil penalties ordered by the SEC in accordance with various undertakings detailed at www.sec.gov/litigation/admin/ia-2451.pdf. Ameriprise Financial and its affiliates have cooperated with the SEC
and the MDOC in these legal proceedings, and have made regular reports to the Funds' Boards of Trustees.
Ameriprise Financial and certain of its affiliates have historically been involved in a number of legal, arbitration and regulatory proceedings, including routine litigation, class actions, and governmental actions, concerning matters arising in connection with the conduct of their business activities. Ameriprise Financial believes that the Funds are not currently the subject of, and that neither Ameriprise Financial nor any of its affiliates are the subject of, any pending legal, arbitration or regulatory proceedings that are likely to have a material adverse effect on the Funds or the ability of Ameriprise Financial or its affiliates to perform under their contracts with the Funds. Ameriprise Financial is required to make quarterly (10-Q), annual (10-K) and, as necessary, 8-K filings with the SEC on legal and regulatory matters that relate to Ameriprise Financial and its affiliates. Copies of these filings may be obtained by accessing the SEC website at www.sec.gov.
There can be no assurance that these matters, or the adverse publicity associated with them, will not result in increased fund redemptions, reduced sale of fund shares or other adverse consequences to the Funds. Further, although we believe proceedings are not likely to have a material adverse effect on the Funds or the ability of Ameriprise Financial or its affiliates to perform under their contracts with the Funds, these proceedings are subject to uncertainties and, as such, we are unable to estimate the possible loss or range of loss that may result. An adverse outcome in one or more of these proceedings could result in adverse judgments, settlements, fines, penalties or other relief that could have a material adverse effect on the consolidated financial condition or results of operations of Ameriprise Financial.
Annual Report 2015
14
COLUMBIA INTERMEDIARY ALTERNATIVES FUND
REPORT OF INDEPENDENT REGISTERED PUBLIC ACCOUNTING FIRM
To the Trustees of Columbia Funds Series Trust I and the Shareholders of
Columbia Intermediary Alternatives Fund
In our opinion, the accompanying statement of assets and liabilities, including the portfolio of investments, and the related statements of operations and of changes in net assets and the financial highlights present fairly, in all material respects, the financial position of Columbia Intermediary Alternatives Fund (the "Fund," a series of Columbia Funds Series Trust I) at May 31, 2015, and the results of its operations, the changes in its net assets and the financial highlights for the period January 28, 2015 (commencement of operations) through May 31, 2015, in conformity with accounting principles generally accepted in the United States of America. These financial statements and financial highlights (hereafter referred to as "financial statements") are the responsibility of the Fund's management. Our responsibility is to express an opinion on these financial statements based on our audit. We conducted our audit of these financial statements in accordance with the standards of the Public Company Accounting Oversight Board (United States). Those standards require that we plan and perform the audit to obtain reasonable assurance about whether the financial statements are free of material misstatement. An audit includes examining, on a test basis, evidence supporting the amounts and disclosures in the financial statements, assessing the accounting principles used and significant estimates made by management, and evaluating the overall financial statement presentation. We believe that our audit, which included confirmation of securities at May 31, 2015 by correspondence with the transfer agent and brokers, provides a reasonable basis for our opinion.
PricewaterhouseCoopers LLP
Minneapolis, MN
July 30, 2015
Annual Report 2015
15
COLUMBIA INTERMEDIARY ALTERNATIVES FUND
The Trustees serve terms of indefinite duration. The names and birth years of the Trustees and Officers of the Funds in Columbia Funds Series Trust I, the year each was first elected or appointed to office, their principal business occupations during at least the last five years, the number of Funds overseen by each Trustee and other directorships they hold are shown below. Each officer listed below serves as an officer of each Fund in Columbia Funds Series Trust I. The mailing address of each Trustee is: c/o Columbia Management Investment Advisers, LLC, 225 Franklin Street, Mail Drop BX32 05228, Boston, MA 02110.
Independent Trustees
Name, Year of Birth
and Position Held
with the Trust | | Year First
Appointed or
Elected as
Trustee to any
Fund Currently
in the Columbia
Funds Complex
or a Predecessor
Thereof | | Principal Occupation(s)
during the Past Five Years | | Number
of Funds
in the
Columbia
Funds
Complex
Overseen | | Other Directorships
Held by Trustee During
the Past Five Years | |
Douglas A. Hacker
(Born 1955)
Trustee and Chairman
of the Board | | | 1996 | | | Independent business executive since May 2006; Executive Vice President — Strategy of United Airlines from December 2002 to May 2006; President of UAL Loyalty Services (airline marketing company) from September 2001 to December 2002; Executive Vice President and Chief Financial Officer of United Airlines from July 1999 to September 2001 | | | 60 | | | Spartan Nash Company, (food distributor); Nash Finch Company (food distributor) from 2005 to 2013; Aircastle Limited (aircraft leasing); SeaCube Container Leasing Ltd. (container leasing) from 2010 to 2013; and Travelport Worldwide Limited (travel information technology) | |
Janet Langford Carrig
(Born 1957)
Trustee | | | 1996 | | | Senior Vice President, General Counsel and Corporate Secretary, ConocoPhillips (integrated energy company) since September 2007; Deputy General Counsel — Corporate Legal Services, ConocoPhillips from August 2006 to August 2007; Partner, Zelle, Hofmann, Voelbel, Mason & Gette LLP (law firm) from March 2005 to July 2006; Adjunct Professor of Law, Northwestern University from September 2004 to June 2006; Director, UAL Corporation (airline) from February 2006 to July 2006; Chief Administrative Officer and Senior Vice President, Kmart Holding Corporation (consumer goods) from September 2003 to March 2004 | | | 60 | | | None | |
Nancy T. Lukitsh
(Born 1956)
Trustee | | | 2011 | | | Senior Vice President, Partner and Director of Marketing, Wellington Management Company, LLP (investment adviser) from 1997 to 2010; Chair, Wellington Management Investment Portfolios (commingled non-U.S. investment pools) from 2007 to 2010; Director, Wellington Trust Company, NA and other Wellington affiliates from 1997 to 2010 | | | 60 | | | None | |
William E. Mayer
(Born 1940)
Trustee | | | 1991 | | | Partner, Park Avenue Equity Partners (private equity) since February 1999 | | | 60 | | | DynaVox Inc. (speech creation); Lee Enterprises (print media); WR Hambrecht + Co. (financial service provider) from 2000 to 2012; BlackRock Kelso Capital Corporation (investment company); and Premier, Inc. (healthcare) | |
Annual Report 2015
16
COLUMBIA INTERMEDIARY ALTERNATIVES FUND
TRUSTEES AND OFFICERS (continued)
Independent Trustees (continued)
Name, Year of Birth
and Position Held
with the Trust | | Year First
Appointed or
Elected as
Trustee to any
Fund Currently
in the Columbia
Funds Complex
or a Predecessor
Thereof | | Principal Occupation(s)
during the Past Five Years | | Number
of Funds
in the
Columbia
Funds
Complex
Overseen | | Other Directorships
Held by Trustee During
the Past Five Years | |
David M. Moffett
(Born 1952)
Trustee | | | 2011 | | | Retired. Consultant to Bridgewater and Associates; Chief Executive Officer, Federal Home Loan Mortgage Corporation, from 2008 to 2009; Senior Adviser, Global Financial Services Group, Carlyle Group, Inc., from 2007 to 2008; Vice Chairman and Chief Financial Officer, U.S. Bancorp, from 1993 to 2007 | | | 60 | | | CIT Group Inc. (commercial and consumer finance); eBay Inc. (online trading community); MBIA Inc. (financial service provider); E.W. Scripps Co. (print and television media); Building Materials Holding Corp. (building materials and construction services); Genworth Financial, Inc. (financial and insurance products and services); and University of Oklahoma Foundation | |
Charles R. Nelson
(Born 1942)
Trustee | | | 1981 | | | Retired. Professor Emeritus, University of Washington since 2011; Professor of Economics, University of Washington from 1976 to 2011; Ford and Louisa Van Voorhis Professor of Political Economy, University of Washington from 1993 to 2011; Adjunct Professor of Statistics, University of Washington from 1980 to 2011; Associate Editor, Journal of Money, Credit and Banking from September 1993 to 2008; consultant on econometric and statistical matters | | | 60 | | | None | |
John J. Neuhauser
(Born 1943)
Trustee | | | 1984 | | | President, Saint Michael's College since August 2007; Director or Trustee of several non-profit organizations, including Fletcher Allen Health Care, Inc.; Academic Vice President and Dean of Faculties, Boston College from August 1999 to October 2005; University Professor, Boston College from November 2005 to August 2007 | | | 60 | | | Liberty All-Star Equity Fund and Liberty All-Star Growth Fund (closed-end funds) | |
Patrick J. Simpson
(Born 1944)
Trustee | | | 2000 | | | Partner, Perkins Coie LLP (law firm) | | | 60 | | | None | |
Anne-Lee Verville
(Born 1945)
Trustee | | | 1998 | | | Retired. General Manager, Global Education Industry from 1994 to 1997, President — Application Systems Division from 1991 to 1994, Chief Financial Officer — US Marketing & Services from 1988 to 1991, and Chief Information Officer from 1987 to 1988, IBM Corporation (computer and technology) | | | 60 | | | Enesco Group, Inc. (producer of giftware and home and garden decor products) from 2001 to 2006 | |
Annual Report 2015
17
COLUMBIA INTERMEDIARY ALTERNATIVES FUND
TRUSTEES AND OFFICERS (continued)
Interested Trustee Affiliate with Investment Manager*
Name, Year of Birth
and Position Held
with the Trust | | Year First
Appointed or
Elected as
Trustee to any
Fund Currently
in the Columbia
Funds Complex
or a Predecessor
Thereof | | Principal Occupation(s)
during the Past Five Years | | Number
of Funds
in the
Columbia
Funds
Complex
Overseen | | Other Directorships
Held by Trustee During
the Past Five Years | |
William F. Truscott
(Born 1960)
Trustee | | | 2012 | | | Chairman of the Board and President, Columbia Management Investment Advisers, LLC since May 2010 and February 2012, respectively (previously President and Chief Investment Officer, 2001-April 2010); Chief Executive Officer, Global Asset Management, Ameriprise Financial, Inc. since September 2012 (previously Chief Executive Officer, U.S. Asset Management & President, Annuities, May 2010-September 2012 and President — U.S. Asset Management and Chief Investment Officer, 2005-April 2010); Director and Chief Executive Officer, Columbia Management Investment Distributors, Inc. since May 2010 and February 2012, respectively (previously Chairman of the Board and Chief Executive Officer, 2006-April 2010); Chairman of the Board and Chief Executive Officer, RiverSource Distributors, Inc. since 2006; Director, Threadneedle Asset Management Holdings, SARL since 2014; President and Chief Executive Officer, Ameriprise Certificate Company, 2006-August 2012 | | | 187 | | | Chairman of the Board, Columbia Management Investment Advisers, LLC since May 2010; Director, Columbia Management Investment Distributors, Inc. since May 2010; Director, Ameriprise Certificate Company, 2006 to January 2013 | |
* Interested person (as defined under the 1940 Act) by reason of being an officer, director, security holder and/or employee of the Investment Manager or Ameriprise Financial.
The Statement of Additional Information has additional information about the Fund's Board members and is available, without charge, upon request by calling 800.345.6611; or contacting your financial intermediary.
The Board has appointed officers who are responsible for day-to-day business decisions based on policies it has established. The officers serve at the pleasure of the Board. In addition to Mr. Truscott, who is Senior Vice President, the Funds' other officers are:
Fund Officers
Name,
Address and
Year of Birth | | Position and Year
First Appointed to
Position for any Fund
in the Columbia
Funds Complex or a
Predecessor Thereof | | Principal Occupation(s) During Past Five Years | |
Christopher O. Petersen
5228 Ameriprise
Financial Center
Minneapolis, MN 55474
Born 1970 | | President and Principal Executive Officer (2015) | | Vice President and Lead Chief Counsel, Ameriprise Financial, Inc. since January 2015 (previously, Vice President and Chief Counsel January 2010-December 2014; and Vice President and Group Counsel or Counsel 2004- January 2010); officer of Columbia Funds and affiliated funds since 2007. | |
Michael G. Clarke
225 Franklin Street
Boston, MA 02110
Born 1969 | | Treasurer (2011) and Chief Financial Officer (2009) | | Vice President — Mutual Fund Administration, Columbia Management Investment Advisers, LLC, since May 2010; Managing Director of Fund Administration, Columbia Management Advisors, LLC, September 2004-April 2010; senior officer of Columbia Funds and affiliated funds since 2002. | |
Annual Report 2015
18
COLUMBIA INTERMEDIARY ALTERNATIVES FUND
TRUSTEES AND OFFICERS (continued)
Fund Officers (continued)
Name,
Address and
Year of Birth | | Position and Year
First Appointed to
Position for any Fund
in the Columbia
Funds Complex or a
Predecessor Thereof | | Principal Occupation(s) During Past Five Years | |
Paul B. Goucher
100 Park Avenue
New York, NY 10017
Born 1968 | | Senior Vice President (2011), Chief Legal Officer (2015) and Assistant Secretary (2008) | | Vice President and Lead Chief Counsel, Ameriprise Financial, Inc. since November 2008 and January 2013, respectively (previously Chief Counsel, January 2010-January 2013 and Group Counsel, November 2008-January 2010). | |
Thomas P. McGuire
225 Franklin Street
Boston, MA 02110
Born 1972 | | Vice President and Chief Compliance Officer (2012) | | Vice President — Asset Management Compliance, Ameriprise Financial, Inc., since May 2010; Chief Compliance Officer, Ameriprise Certificate Company since September 2010; Compliance Executive, Bank of America, 2005-April 2010. | |
Colin Moore
225 Franklin Street
Boston, MA 02110
Born 1958 | | Senior Vice President (2010) | | Executive Vice President and Global Chief Investment Officer, Ameriprise Financial, Inc., since July 2013; Director and Global Chief Investment Officer, Columbia Management Investment Advisers, LLC since May 2010; Manager, Managing Director and Chief Investment Officer, Columbia Management Advisors, LLC, 2007-April 2010. | |
Michael E. DeFao
225 Franklin Street
Boston, MA 02110
Born 1968 | | Vice President (2011) and Assistant Secretary (2010) | | Vice President and Chief Counsel, Ameriprise Financial, Inc. since May 2010; Associate General Counsel, Bank of America, 2005-April 2010. | |
Joseph F. DiMaria
225 Franklin Street
Boston, MA 02110
Born 1968 | | Vice President (2011), Assistant Treasurer (2012) and Chief Accounting Officer (2008) | | Vice President — Mutual Fund Treasurer, Columbia Management Investment Advisers, LLC since May 2010; Director of Fund Administration, Columbia Management Advisors, LLC, 2006-April 2010. | |
Amy Johnson
5228 Ameriprise
Financial Center
Minneapolis, MN 55474
Born 1965 | | Vice President (2006) | | Managing Director and Chief Operating Officer, Columbia Management Investment Advisers, LLC since May 2010 (previously Chief Administrative Officer, 2009-April 2010, and Vice President — Asset Management and Trust Company Services, 2006-2009). | |
Lyn Kephart-Strong
5228 Ameriprise
Financial Center
Minneapolis, MN 55474
Born 1960 | | Vice President (2015) | | President, Columbia Management Investment Services Corp. since October 2014; Vice President & Resolution Officer, Ameriprise Trust Company since August 2009; President, RiverSource Service Corporation 2004-2010. | |
Ryan C. Larrenaga
225 Franklin Street
Boston, MA 02110
Born 1970 | | Vice President and Secretary (2015) | | Vice President and Group Counsel, Ameriprise Financial, Inc. since August 2011 (previously, Counsel from May 2010 to August 2011); Assistant General Counsel, Bank of America, 2005-April 2010; officer of Columbia Funds and affiliated funds since 2005. | |
Annual Report 2015
19
COLUMBIA INTERMEDIARY ALTERNATIVES FUND
BOARD CONSIDERATION AND APPROVAL OF ADVISORY AGREEMENT AND SUBADVISORY AGREEMENT
On December 19, 2014, the Board of Trustees (the "Board") and the Trustees who are not interested persons (as defined in the Investment Company Act of 1940) of the Trust (the "Independent Trustees") unanimously approved the Investment Management Services Agreement (the "Advisory Agreement") with Columbia Management Investment Advisers, LLC (the "Investment Manager") and the Subadvisory Agreement (the "Subadvisory Agreement") between the Investment Manager and Threadneedle International Limited (the "Subadviser") with respect to Columbia Intermediary Alternatives Fund (the "Fund"), a series of the Trust. As detailed below, the Advisory Fees and Expenses Committee (the "Committee") and the Board met to review and discuss, both among themselves and with the management team of the Investment Manager, materials provided by the Investment Manager before determining to approve the Advisory Agreement and the Subadvisory Agreement (collectively, the "Agreements").
In connection with their deliberations regarding the proposed Agreements, the Committee and the Board evaluated materials requested from the Investment Manager regarding the Fund and the Agreements, and discussed these materials, as well as other materials provided by the Investment Manager and others, including materials provided in connection with its most recent and its upcoming annual approval of the continuation of the advisory agreements with respect to other series of the Trust, with representatives of the Investment Manager at the Committee meeting held on December 18, 2014, and at the Board meetings held on October 21, 2014 and December 19, 2014. The Committee and the Board also consulted with Fund counsel and with the Independent Trustees' independent legal counsel, who advised on various matters with respect to the Committee's and the Board's considerations and otherwise assisted the Committee and the Board in their deliberations. On December 19, 2014, the Board, including the Independent Trustees, voting separately, approved the Agreements for the Fund.
The Committee and the Board considered all information that they, their legal counsel, or the Investment Manager believed reasonably necessary to evaluate and to determine whether to approve the Agreements. The information and factors considered by the Committee and the Board in recommending for approval or approving the Agreements for the Fund included the following:
• Information regarding the reputation, financial strength, regulatory history and resources of the Investment Manager and the Subadviser, including information regarding senior management, portfolio managers and other personnel proposed to provide investment management, administrative and other services to the Fund;
• Information regarding the capabilities of the Investment Manager and the Subadviser with respect to compliance monitoring services, including an assessment of the Investment Manager's and the Subadviser's compliance system by the Fund's Chief Compliance Officer;
• The terms and conditions of the Agreements;
• The terms and conditions of other agreements and arrangements with affiliates of the Investment Manager relating to the operations of the Fund, including the Administrative Services Agreement, the Distribution Agreement and the Transfer and Dividend Disbursing Agent Agreement; and
• Descriptions of various functions performed by the Investment Manager and the Subadviser under the Agreements, including portfolio management and portfolio trading practices.
Nature, Extent and Quality of Services to be Provided under the Agreements
The Committee and the Board considered the nature, extent and quality of services to be provided to the Fund by the Investment Manager and the Subadviser and the Investment Manager's affiliates under the Agreements and under separate agreements for the provision of transfer agency and administrative services, and the similar type of services currently provided by the Investment Manager to other funds in the fund complex, and the resources dedicated to the Fund and the other Columbia Funds by the Investment Manager and the Subadviser and the Investment Manager's affiliates. The Committee and the Board considered, among other things, the Investment Manager's ability to attract, motivate and retain highly qualified research, advisory and supervisory investment professionals (including personnel and other resources, compensation programs for personnel involved in fund management, reputation and other attributes), the portfolio management services provided by those investment
Annual Report 2015
20
COLUMBIA INTERMEDIARY ALTERNATIVES FUND
BOARD CONSIDERATION AND APPROVAL OF ADVISORY AGREEMENT AND SUBADVISORY AGREEMENT (continued)
professionals, and the quality of the Investment Manager's investment research capabilities and trade execution services. The Committee and the Board also considered the potential benefits to shareholders of investing in a mutual fund that is part of a fund complex offering exposure to a variety of asset classes and investment disciplines and providing a variety of fund and shareholder services.
The Committee and the Board also considered the professional experience and qualifications of the senior personnel of the Investment Manager, including the proposed portfolio managers for the Fund, which included consideration of the Investment Manager's experience with similarly-structured funds. The Committee and the Board noted the compliance programs of and the compliance-related resources provided to the Fund by the Investment Manager and its affiliates, and considered the Investment Manager's ability to provide administrative services to the Fund pursuant to a separate Administrative Services Agreement, including the Investment Manager's ability to coordinate the activities of the Fund's other service providers. The Committee and the Board also noted that the Board had approved the Subadviser's code of ethics and compliance program, and that the Chief Compliance Officer of the Funds monitors the code of ethics and compliance program.
After reviewing these and related factors, the Committee and the Board concluded, within the context of its overall conclusions, that the expected nature, extent and quality of the services to be provided to the Fund under the Agreements supported the approval of the Agreements.
Investment Advisory Fee Rates and Other Expenses
The Committee and the Board considered that the Fund would not be charged advisory fees under the Agreements. The Committee and the Board also considered the total expenses expected to be incurred by the Fund. The Committee and the Board noted that, because the Fund would not be charged advisory fees under the Agreement, the Committee and the Board had not been provided with information on the advisory fees and total expense ratios of comparable funds identified by the independent third-party data provider for purposes of expense comparison.
After reviewing these and related factors, the Committee and the Board concluded, within the context of its overall conclusions, that the expenses of the Fund, including the lack of advisory fees, supported the approval of the Agreements.
Costs of Services to be Provided and Profitability
The Committee and the Board considered information provided by the Investment Manager with respect to estimated costs of services, including the lack of advisory fees, and expected to consider the costs of services and the profitability of the Investment Manager and its affiliates in connection with the Committee's and the Board's next review and consideration of the continuation of the Agreements. The Committee and the Board also considered court cases in which adviser profitability was an issue in whole or in part. The Committee and the Board also considered information provided by the Investment Manager regarding its financial condition.
After reviewing these and related factors, the Committee and the Board concluded, within the context of its overall conclusions, that the anticipated costs of services to be provided and the expected profitability to the Investment Manager and its affiliates from their relationships with the Fund supported the approval of the Agreements.
Investment Performance
Because the Fund had not yet commenced operations, the Committee and the Board did not have investment performance to compare to the returns of a group of comparable mutual funds. However, the Committee and the Board expected to consider, in connection with their next review and consideration of the continuation of the Agreements, the investment performance of the Fund in relation to the annualized return for various time periods of both a group of funds determined by the Investment Manager to be comparable and a benchmark.
The Committee and the Board also considered the Investment Manager's performance and reputation generally, the Investment Manager's historical responsiveness to Board concerns about performance, and the Investment Manager's willingness to take steps intended to improve performance. After reviewing these and related factors,
Annual Report 2015
21
COLUMBIA INTERMEDIARY ALTERNATIVES FUND
BOARD CONSIDERATION AND APPROVAL OF ADVISORY AGREEMENT AND SUBADVISORY AGREEMENT (continued)
the Committee and the Board concluded, within the context of its overall conclusions, that the performance of the Investment Manager and the Subadviser supported approval of the Agreements.
Economies of Scale
The Committee and the Board considered the potential existence of economies of scale in the provision by the Investment Manager of services to the Fund, to groups of related funds, and to the Investment Manager's investment advisory clients as a whole, and whether those economies of scale were expected to be shared with the Fund.
After reviewing these and related factors, the Board concluded, within the context of its overall conclusions, that the extent to which any economies of scale were expected to be shared with the Fund supported the approval of the Agreements.
Other Benefits to the Investment Manager
The Committee and the Board received and considered information regarding "fall-out" or ancillary benefits to be received by the Investment Manager and its affiliates as a result of their relationships with the Fund, such as the engagement of the Investment Manager to provide administrative services to the Fund and the engagement of the Investment Manager's affiliates to provide distribution and transfer agency services to the Fund. The Committee and the Board considered the possible conflicts of interest associated with certain fall-out or other ancillary benefits and the reporting, disclosure and other processes that are in place to address such possible conflicts of interest. The Committee and the Board recognized that the Investment Manager's profitability would be somewhat lower without these benefits.
Conclusion
The Committee and the Board reviewed all of the above considerations in reaching its decision to recommend or approve the proposed Agreements. In their deliberations, the Trustees did not identify any particular information that was all-important or controlling, and individual Trustees may have attributed different weights to the various factors. Based on its evaluation of all factors that they deemed to be material, including those factors described above, and assisted by the advice of independent legal counsel, the Board, including the Independent Trustees, voting separately, approved the Agreements.
Annual Report 2015
22
This page intentionally left blank.
Annual Report 2015
23
This page intentionally left blank.
Annual Report 2015
24
COLUMBIA INTERMEDIARY ALTERNATIVES FUND
IMPORTANT INFORMATION ABOUT THIS REPORT
The policy of the Board is to vote the proxies of the companies in which each fund holds investments consistent with the procedures as stated in the Statement of Additional Information (SAI). You may obtain a copy of the SAI without charge by calling 800.345.6611; contacting your financial intermediary; or searching the website of the Securities and Exchange Commission (SEC) at sec.gov. Information regarding how each fund voted proxies relating to portfolio securities is filed with the SEC by August 31st for the most recent 12-month period ending June 30th of that year, and is available without charge by visiting columbiathreadneedle.com/us, or searching the website of the SEC at sec.gov.
Each fund files a complete schedule of portfolio holdings with the SEC for the first and third quarters of each fiscal year on Form N-Q. Each fund's Form N-Q is available on the SEC's website at sec.gov and may be reviewed and copied at the SEC's Public Reference Room in Washington, D.C. Information on the operation of the Public Reference Room may be obtained by calling 800.SEC.0330. Each fund's complete schedule of portfolio holdings, as filed on Form N-Q, can also be obtained without charge, upon request, by calling 800.345.6611.
You may obtain the current net asset value (NAV) of Fund shares at no cost by calling 800.345.6611 or by sending an e-mail to serviceinquiries@columbiathreadneedle.com.
Annual Report 2015
25
Columbia Intermediary Alternatives Fund
P.O. Box 8081
Boston, MA 02266-8081

This information is for use with concurrent or prior delivery of a fund prospectus. Please read and consider the investment objectives, risks, charges and expenses for any fund carefully before investing. The Fund is distributed by Columbia Management Investment Distributors, Inc., member FINRA, and managed by Columbia Management Investment Advisers, LLC.
Columbia Threadneedle Investments (Columbia Threadneedle) is the global brand name of the Columbia and Threadneedle group of companies.
All rights reserved. Columbia Management Investment Distributors, Inc., 225 Franklin Street, Boston, MA 02110-2804
© 2015 Columbia Management Investment Advisers, LLC.
ANN257_05_E01_(07/15)
Item 2. Code of Ethics.
(a) The registrant has adopted a code of ethics that applies to the registrant’s principal executive officer, principal financial officer, principal accounting officer or controller, or persons performing similar functions, regardless of whether these individuals are employed by the registrant or a third party.
(b) During the period covered by this report, there were not any amendments to a provision of the code of ethics adopted in 2(a) above.
(c) During the period covered by this report, there were no waivers, including any implicit waivers, from a provision of the code of ethics described in 2(a) above that relates to one or more of the items set forth in paragraph (b) of this item’s instructions.
Item 3. Audit Committee Financial Expert.
The registrant’s Board of Trustees has determined that Douglas A. Hacker, David M. Moffett and Anne-Lee Verville, each of whom are members of the registrant’s Board of Trustees and Audit Committee, each qualify as an audit committee financial expert. Mr. Hacker, Mr. Moffett and Ms. Verville are each independent trustees, as defined in paragraph (a)(2) of this item’s instructions.
Item 4. Principal Accountant Fees and Services.
Fee information below is disclosed for the six series of the registrant whose reports to stockholders are included in this annual filing. Two series commenced operations on January 28, 2015 and one series commenced operations on February 19, 2015.
(a) Audit Fees. Aggregate Audit Fees billed by the principal accountant for professional services rendered during the fiscal years ended May 31, 2015 and May 31, 2014 are approximately as follows:
2015 | | 2014 | |
$ | 151,000 | | $ | 73,300 | |
| | | | | |
Audit Fees include amounts related to the audit of the registrant’s annual financial statements or services that are normally provided by the accountant in connection with statutory and regulatory filings or engagements for those fiscal years.
(b) Audit-Related Fees. Aggregate Audit-Related Fees billed to the registrant by the principal accountant for professional services rendered during the fiscal years ended May 31, 2015 and May 31, 2014 are approximately as follows:
Audit-Related Fees include amounts for assurance and related services by the principal accountant that are reasonably related to the performance of the audit of the registrant’s financial statements and are not reported in Audit Fees above. In fiscal years 2015 and 2014, Audit-Related Fees consist of agreed-upon procedures performed for semi-annual shareholder reports.
During the fiscal years ended May 31, 2015 and May 31, 2014, there were no Audit-Related Fees billed by the registrant’s principal accountant to the registrant’s investment adviser (not including any sub-adviser whose role is primarily portfolio management and is subcontracted with or overseen by another investment adviser) and any entity controlling, controlled by, or under common control with the adviser that provides ongoing services to the registrant for an engagement that related directly to the operations and financial reporting of the registrant.
(c) Tax Fees. Aggregate Tax Fees billed by the principal accountant to the registrant for professional services rendered during the fiscal years ended May 31, 2015 and May 31, 2014 are approximately as follows:
Tax Fees include amounts for the review of annual tax returns, the review of required shareholder distribution calculations and typically include amounts for professional services by the principal accountant for tax compliance, tax advice and tax planning.
During the fiscal years ended May 31, 2015 and May 31, 2014, there were no Tax Fees billed by the registrant’s principal accountant to the registrant’s investment adviser (not including any sub-adviser whose role is primarily portfolio management and is subcontracted with or overseen by another investment adviser) and any entity controlling, controlled by, or under common control with the adviser that provides ongoing services to the registrant for an engagement that related directly to the operations and financial reporting of the registrant.
(d) All Other Fees. Aggregate All Other Fees billed by the principal accountant to the registrant for professional services rendered during the fiscal years ended May 31, 2015 and May 31, 2014 are approximately as follows:
All Other Fees include amounts for products and services provided by the principal accountant, other than the services reported in paragraphs (a) through (c) above.
Aggregate All Other Fees billed by the registrant’s principal accountant to the registrant’s investment adviser (not including any sub-adviser whose role is primarily portfolio management and is subcontracted with or overseen by another investment adviser) and any entity controlling, controlled by, or under common control with the adviser that provides ongoing services to the registrant for an engagement that related directly to the operations and financial reporting of the registrant during the fiscal years ended May 31, 2015 and May 31, 2014 are approximately as follows:
2015 | | 2014 |
$ | 115,000 | | $ | 325,000 |
| | | | |
In fiscal year 2015, All Other Fees consists of fees billed for internal control examinations of the registrant’s transfer agent. In fiscal year 2014, All Other Fees primarily consists of fees billed for internal control examinations of the registrant’s transfer agent and investment adviser.
(e)(1) Audit Committee Pre-Approval Policies and Procedures
The registrant’s Audit Committee is required to pre-approve the engagement of the registrant’s independent auditors to provide audit and non-audit services to the registrant and non-audit services to its investment adviser (excluding any sub-adviser whose role is primarily portfolio management and is sub-contracted or overseen by another investment adviser (the “Adviser”) or any entity controlling, controlled by or under common control with the Adviser that provides ongoing services to the Fund (a “Control Affiliate”) if the engagement relates directly to the operations and financial reporting of the registrant.
The Audit Committee has adopted a Policy for Engagement of Independent Auditors for Audit and Non-Audit Services (the “Policy”). The Policy sets forth the understanding of the Audit Committee regarding the engagement of the registrant’s independent accountants to provide (i) audit and permissible audit-related, tax and other services to the registrant (“Fund Services”); (ii) non-audit services to the registrant’s Adviser and any Control Affiliates, that relates directly to the operations and financial reporting of a Fund (“Fund-related Adviser Services”); and (iii) certain other audit and non-audit services to the registrant’s Adviser and its Control Affiliates. A service will require specific pre-approval by the Audit Committee if it is to be provided by the Fund’s independent auditor; provided, however, that pre-approval of non-audit services to the
Fund, the Adviser or Control Affiliates may be waived if certain de minimis requirements set forth in the SEC’s rules are met.
Under the Policy, the Audit Committee may delegate pre-approval authority to any pre-designated member or members who are independent board members. The member(s) to whom such authority is delegated must report, for informational purposes only, any pre-approval decisions to the Audit Committee at its next regular meeting. The Audit Committee’s responsibilities with respect to the pre-approval of services performed by the independent auditor may not be delegated to management.
On an annual basis, at a regularly scheduled Audit Committee meeting, the Fund’s Treasurer or other Fund officer shall submit to the Audit Committee a schedule of the types of Fund Services and Fund-related Adviser Services that are subject to specific pre-approval. This schedule will provide a description of each type of service that is subject to specific pre-approval, along with total projected fees for each service. The pre-approval will generally cover a one-year period. The Audit Committee will review and approve the types of services and the projected fees for the next one-year period and may add to, or subtract from, the list of pre-approved services from time to time, based on subsequent determinations. This specific approval acknowledges that the Audit Committee is in agreement with the specific types of services that the independent auditor will be permitted to perform and the projected fees for each service.
The Fund’s Treasurer or other Fund officer shall report to the Audit Committee at each of its regular meetings regarding all Fund Services or Fund-related Adviser Services provided since the last such report was rendered, including a description of the services, by category, with forecasted fees for the annual reporting period, proposed changes requiring specific pre-approval and a description of services provided by the independent auditor, by category, with actual fees during the current reporting period.
*****
(e)(2) 100% of the services performed for items (b) through (d) above during 2015 and 2014 were pre-approved by the registrant’s Audit Committee.
(f) Not applicable.
(g) The aggregate non-audit fees billed by the registrant’s accountant for services rendered to the registrant, and rendered to the registrant’s investment adviser (not including any sub-adviser whose role is primarily portfolio management and is subcontracted with or overseen by another investment adviser), and any entity controlling, controlled by, or under common control with the adviser that provides ongoing services to the registrant during the fiscal years ended May 31, 2015 and May 31, 2014 are approximately as follows:
2015 | | 2014 |
$ | 130,500 | | $ | 340,500 |
| | | | |
(h) The registrant’s Audit Committee of the Board of Directors has considered whether the provision of non-audit services that were rendered to the registrant’s adviser (not including any sub-adviser whose role is primarily portfolio management and is subcontracted with or overseen by another investment adviser), and any entity controlling, controlled by, or under common control with the investment adviser that provides ongoing services to the registrant that were not pre-approved pursuant to paragraph (c)(7)(ii) of Rule 2-01 of Regulation S-X, is compatible with maintaining the principal accountant’s independence.
Item 5. Audit Committee of Listed Registrants.
Not applicable.
Item 6. Investments
(a) The registrant’s “Schedule I — Investments in securities of unaffiliated issuers” (as set forth in 17 CFR 210.12-12) is included in Item 1 of this Form N-CSR.
(b) Not applicable.
Item 7. Disclosure of Proxy Voting Policies and Procedures for Closed-End Management Investment Companies.
Not applicable.
Item 8. Portfolio Managers of Closed-End Management Investment Companies.
Not applicable.
Item 9. Purchases of Equity Securities by Closed-End Management Investment Company and Affiliated Purchasers.
Not applicable.
Item 10. Submission of Matters to a Vote of Security Holders.
There were no material changes to the procedures by which shareholders may recommend nominees to the registrant’s board of directors.
Item 11. Controls and Procedures.
(a) The registrant’s principal executive officer and principal financial officers, based on their evaluation of the registrant’s disclosure controls and procedures as of a date within 90 days of the filing of this report, have concluded that such controls and procedures are adequately designed to ensure that material information required to be disclosed by the registrant in Form N-CSR is accumulated and
communicated to the registrant’s management, including the principal executive officer and principal financial officer, or persons performing similar functions, as appropriate to allow timely decisions regarding required disclosure.
(b) There was no change in the registrant’s internal control over financial reporting that occurred during the registrant’s second fiscal quarter of the period covered by this report that has materially affected, or is reasonably likely to materially affect, the registrant’s internal control over financial reporting.
Item 12. Exhibits.
(a)(1) Code of ethics required to be disclosed under Item 2 of Form N-CSR attached hereto as Exhibit 99.CODE ETH.
(a)(2) Certifications pursuant to Rule 30a-2(a) under the Investment Company Act of 1940 (17 CFR 270.30a-2(a)) attached hereto as Exhibit 99.CERT.
(a)(3) Not applicable.
(b) Certification pursuant to Rule 30a-2(b) under the Investment Company Act of 1940 (17 CFR 270.30a-2(b)) attached hereto as Exhibit 99.906CERT.
SIGNATURES
Pursuant to the requirements of the Securities Exchange Act of 1934 and the Investment Company Act of 1940, the registrant has duly caused this report to be signed on its behalf by the undersigned, thereunto duly authorized.
(registrant) | | | Columbia Funds Series Trust I |
|
|
By (Signature and Title) | | | /s/ Christopher O. Petersen |
| Christopher O. Petersen, President and Principal Executive Officer |
|
|
Date | | | | July 30, 2015 |
| | | | | | | | | | |
Pursuant to the requirements of the Securities Exchange Act of 1934 and the Investment Company Act of 1940, this report has been signed below by the following persons on behalf of the registrant and in the capacities and on the dates indicated.
By (Signature and Title) | | | /s/ Christopher O. Petersen |
| Christopher O. Petersen, President and Principal Executive Officer |
|
|
Date | | | | July 30, 2015 |
|
|
By (Signature and Title) | | | /s/ Michael G. Clarke |
| | Michael G. Clarke, Treasurer and Chief Financial Officer |
|
|
Date | | | | July 30, 2015 |
| | | | | |