UNITED STATES
SECURITIES AND EXCHANGE COMMISSION
Washington, D.C. 20549
FORM N-CSR
CERTIFIED SHAREHOLDER REPORT OF REGISTERED
MANAGEMENT INVESTMENT COMPANIES
Investment Company Act file number | 811-04367 |
|
Columbia Funds Series Trust I |
(Exact name of registrant as specified in charter) |
|
225 Franklin Street, Boston, Massachusetts | | 02110 |
(Address of principal executive offices) | | (Zip code) |
|
Ryan Larrenaga c/o Columbia Management Investment Advisers, LLC 225 Franklin Street Boston, MA 02110 |
(Name and address of agent for service) |
|
Registrant’s telephone number, including area code: | (800) 345-6611 | |
|
Date of fiscal year end: | August 31 | |
|
Date of reporting period: | August 31, 2015 | |
| | | | | | | | |
Form N-CSR is to be used by management investment companies to file reports with the Commission not later than 10 days after the transmission to stockholders of any report that is required to be transmitted to stockholders under Rule 30e-1 under the Investment Company Act of 1940 (17 CFR 270.30e-1). The Commission may use the information provided on Form N-CSR in its regulatory, disclosure review, inspection, and policymaking roles.
A registrant is required to disclose the information specified by Form N-CSR, and the Commission will make this information public. A registrant is not required to respond to the collection of information contained in Form N-CSR unless the Form displays a currently valid Office of Management and Budget (“OMB”) control number. Please direct comments concerning the accuracy of the information collection burden estimate and any suggestions for reducing the burden to Secretary, Securities and Exchange Commission, 450 Fifth Street, NW, Washington, DC 20549-0609. The OMB has reviewed this collection of information under the clearance requirements of 44 U.S.C. § 3507.
Item 1. Reports to Stockholders.

ANNUAL REPORT
August 31, 2015

COLUMBIA CONTRARIAN CORE FUND

 Dear Shareholder,
Today's investors are typically focused on outcomes, like living a certain retirement lifestyle, paying for college education or building a legacy. But in today's complex global investment landscape, even simple goals are not easily achieved.
At Columbia Threadneedle Investments, we aspire to help satisfy five core needs of today's investors:
n Generate an appropriate stream of income in retirement
Traditional approaches to generating income may not provide the diversification benefits they once did, and they may actually introduce unwanted risk in today's market. To seek to improve your potential to live comfortably long term, we endeavor to pursue investments that explore less traveled paths to income.
n Navigate a changing interest rate environment
Today's uncertain market environment includes the prospect of a rise in interest rates. Blending traditional investments with non-traditional or alternative products may help protect your wealth during periods of volatility. We can attempt to help strengthen your portfolio with agile products designed to take on the market's ups and downs.
n Maximize after-tax returns
In an environment where what you keep may be more important than what you earn, municipal bonds can help mitigate high tax burdens while providing potentially attractive yields. Our state and federal tax-exempt products are aimed at helping investors manage risk, minimize the fluctuation of capital and grow wealth on a more tax-efficient basis.
n Grow assets to achieve financial goals
We believe that finding and protecting growth comes from a disciplined security selection process designed to create excess return. Our goal is to provide investment solutions built to help you face today's market challenges and grow your assets at each crossroad of your journey.
n Ease the impact of volatile markets
Despite a bull market run that has benefited many investors over the past several years, it's important to remember the lessons of 2008 and the value that a well-diversified portfolio may provide through times of market volatility. We are here to help you hold onto the savings you have worked tirelessly to amass, and to provide you the best opportunity to maintain your standard of living regardless of market conditions.
Find out today how we can help you confidently invest to realize your dreams. Please visit us at blog.columbiathreadneedleus.com/our-best-ideas to learn more about our unique investment solutions.
The world is constantly changing, but our priority remains the same: to help you secure your finances, meet your goals and achieve success. Thank you for your continued investment with us.
Sincerely,

Christopher O. Petersen
President, Columbia Funds
Investors should consider the investment objectives, risks, charges and expenses of a mutual fund carefully before investing. For a free prospectus and summary prospectus, which contains this and other important information about a fund, visit columbiathreadneedle.com/us. The prospectus should be read carefully before investing.
Columbia Funds are distributed by Columbia Management Investment Distributors, Inc., member FINRA, and managed by Columbia Management Investment Advisers, LLC.
© 2015 Columbia Management Investment Advisers, LLC. All rights reserved.
COLUMBIA CONTRARIAN CORE FUND
Performance Overview | | | 2 | | |
Manager Discussion of Fund Performance | | | 4 | | |
Understanding Your Fund's Expenses | | | 6 | | |
Portfolio of Investments | | | 7 | | |
Statement of Assets and Liabilities | | | 12 | | |
Statement of Operations | | | 15 | | |
Statement of Changes in Net Assets | | | 16 | | |
Financial Highlights | | | 19 | | |
Notes to Financial Statements | | | 31 | | |
Report of Independent Registered Public Accounting Firm | | | 39 | | |
Federal Income Tax Information | | | 40 | | |
Trustees and Officers | | | 41 | | |
Board Consideration and Approval of Advisory Agreement | | | 45 | | |
Important Information About This Report | | | 49 | | |
Fund Investment Manager
Columbia Management Investment
Advisers, LLC
225 Franklin Street
Boston, MA 02110
Fund Distributor
Columbia Management Investment
Distributors, Inc.
225 Franklin Street
Boston, MA 02110
Fund Transfer Agent
Columbia Management Investment
Services Corp.
P.O. Box 8081
Boston, MA 02266-8081
For more information about any of the funds, please visit columbiathreadneedle.com/us or call 800.345.6611. Customer Service Representatives are available to answer your questions Monday through Friday from 8 a.m. to 7 p.m. Eastern time.
The views expressed in this report reflect the current views of the respective parties. These views are not guarantees of future performance and involve certain risks, uncertainties and assumptions that are difficult to predict, so actual outcomes and results may differ significantly from the views expressed. These views are subject to change at any time based upon economic, market or other conditions and the respective parties disclaim any responsibility to update such views. These views may not be relied on as investment advice and, because investment decisions for a Columbia fund are based on numerous factors, may not be relied on as an indication of trading intent on behalf of any particular Columbia fund. References to specific securities should not be construed as a recommendation or investment advice.
COLUMBIA CONTRARIAN CORE FUND
Performance Summary
n Columbia Contrarian Core Fund (the Fund) Class A shares returned 1.99% excluding sales charges for the 12-month period that ended August 31, 2015.
n The Fund outperformed its benchmark, the Russell 1000 Index, which returned 0.40% for the same period.
n Sector allocation decisions and individual stock selection contributed to the Fund's performance advantage over its benchmark.
Average Annual Total Returns (%) (for period ended August 31, 2015)
| | | Inception | | 1 Year | | 5 Years | | 10 Years | |
Class A | | 11/01/98 | | | | | | | | | | | | | |
Excluding sales charges | | | | | | | 1.99 | | | | 16.99 | | | | 9.20 | | |
Including sales charges | | | | | | | -3.85 | | | | 15.62 | | | | 8.56 | | |
Class B | | 11/01/98 | | | | | | | | | | | | | |
Excluding sales charges | | | | | | | 1.22 | | | | 16.12 | | | | 8.37 | | |
Including sales charges | | | | | | | -3.49 | | | | 15.90 | | | | 8.37 | | |
Class C | | 12/09/02 | | | | | | | | | | | | | |
Excluding sales charges | | | | | | | 1.17 | | | | 16.13 | | | | 8.39 | | |
Including sales charges | | | | | | | 0.23 | | | | 16.13 | | | | 8.39 | | |
Class I* | | 09/27/10 | | | 2.42 | | | | 17.51 | | | | 9.58 | | |
Class K* | | 03/07/11 | | | 2.12 | | | | 17.15 | | | | 9.33 | | |
Class R* | | 09/27/10 | | | 1.69 | | | | 16.73 | | | | 8.95 | | |
Class R4* | | 11/08/12 | | | 2.25 | | | | 17.31 | | | | 9.48 | | |
Class R5* | | 11/08/12 | | | 2.34 | | | | 17.39 | | | | 9.52 | | |
Class T | | 02/12/93 | | | | | | | | | | | | | |
Excluding sales charges | | | | | | | 1.92 | | | | 16.94 | | | | 9.14 | | |
Including sales charges | | | | | | | -3.92 | | | | 15.56 | | | | 8.50 | | |
Class W* | | 09/27/10 | | | 1.95 | | | | 17.01 | | | | 9.21 | | |
Class Y* | | 11/08/12 | | | 2.44 | | | | 17.44 | | | | 9.54 | | |
Class Z | | 12/14/92 | | | 2.24 | | | | 17.30 | | | | 9.48 | | |
Russell 1000 Index | | | | | | | 0.40 | | | | 16.07 | | | | 7.35 | | |
Returns for Class A and Class T are shown with and without the maximum initial sales charge of 5.75%. Returns for Class B are shown with and without the applicable contingent deferred sales charge (CDSC) of 5.00% in the first year, declining to 1.00% in the sixth year and eliminated thereafter. Returns for Class C are shown with and without the 1.00% CDSC for the first year only. The Fund's other classes are not subject to sales charges and have limited eligibility. Please see the Fund's prospectus for details. Performance for different share classes will vary based on differences in sales charges and fees associated with each class. All results shown assume reinvestment of distributions during the period. Returns do not reflect the deduction of taxes that a shareholder may pay on Fund distributions or on the redemption of Fund shares. Performance results reflect the effect of any fee waivers or reimbursements of Fund expenses by Columbia Management Investment Advisers, LLC and/or any of its affiliates. Absent these fee waivers or expense reimbursement arrangements, performance results would have been lower.
The performance information shown represents past performance and is not a guarantee of future results. The investment return and principal value of your investment will fluctuate so that your shares, when redeemed, may be worth more or less than their original cost. Current performance may be lower or higher than the performance information shown. You may obtain performance information current to the most recent month-end by contacting your financial intermediary, visiting columbiathreadneedle.com/us or calling 800.345.6611.
*The returns shown for periods prior to the share class inception date (including returns for the Life of the Fund, if shown, which are since Fund inception) include the returns of the Fund's oldest share class. These returns are adjusted to reflect any higher class-related operating expenses of the newer share classes, as applicable. Please visit columbiathreadneedle.com/us/investment-products/mutual-funds/appended-performance for more information.
The Russell 1000 Index tracks the performance of 1,000 of the largest U.S. companies, based on market capitalization.
Indices are not available for investment, are not professionally managed and do not reflect sales charges, fees, brokerage commissions, taxes or other expenses of investing. Securities in the Fund may not match those in an index.
Annual Report 2015
2
COLUMBIA CONTRARIAN CORE FUND
PERFORMANCE OVERVIEW (continued)
Performance of a Hypothetical $10,000 Investment (September 1, 2005 – August 31, 2015)

The chart above shows the change in value of a hypothetical $10,000 investment in Class A shares of Columbia Contrarian Core Fund during the stated time period, and does not reflect the deduction of taxes that a shareholder may pay on Fund distributions or on the redemption of Fund shares.
Annual Report 2015
3
COLUMBIA CONTRARIAN CORE FUND
MANAGER DISCUSSION OF FUND PERFORMANCE
Portfolio Management
Guy Pope, CFA
Morningstar Style BoxTM
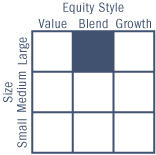
The Morningstar Style BoxTM is based on a fund's portfolio holdings. For equity funds, the vertical axis shows the market capitalization of the stocks owned, and the horizontal axis shows investment style (value, blend, or growth). Information shown is based on the most recent data provided by Morningstar.
© 2015 Morningstar, Inc. All rights reserved. The Morningstar information contained herein: (1) is proprietary to Morningstar and/or its content providers; (2) may not be copied or distributed; and (3) is not warranted to be accurate, complete or timely. Neither Morningstar nor its content providers are responsible for any damages or losses arising from any use of this information.
Top Ten Holdings (%)
(at August 31, 2015) | |
Apple, Inc. | | | 4.2 | | |
JPMorgan Chase & Co. | | | 3.0 | | |
CVS Health Corp. | | | 2.9 | | |
Medtronic PLC | | | 2.9 | | |
Berkshire Hathaway, Inc.,
Class B | | | 2.9 | | |
Verizon Communications, Inc. | | | 2.8 | | |
American Express Co. | | | 2.8 | | |
Google, Inc., Class C | | | 2.6 | | |
Comcast Corp., Class A | | | 2.4 | | |
Johnson & Johnson | | | 2.4 | | |
Percentages indicated are based upon total investments (excluding Money Market Funds).
For further detail about these holdings, please refer to the section entitled "Portfolio of Investments."
Fund holdings are as of the date given, are subject to change at any time, and are not recommendations to buy or sell any security.
For the 12-month period that ended August 31, 2015, the Fund's Class A shares returned 1.99% excluding sales charges. The Fund outperformed its benchmark, the Russell 1000 Index, which returned 0.40% during the same time period. Stock selection within the information technology and health care sectors and a timely underweight of the energy sector aided performance relative to the benchmark.
Markets Turned Volatile As Pressures Mounted
The pace of U.S. economic growth fluctuated during the 12-month period that ended August 31, 2015. Another stormy winter in the Northeast and Midwest whittled away at gross domestic product (GDP) early in 2015. A strong dollar, a widening trade deficit and declining oil prices also negatively affected growth. Yet most of these setbacks proved to be temporary, and the U.S. economy rebounded as temperatures thawed. An average of 243,000 new jobs were added monthly to the U.S. workforce, driving the unemployment rate down to 5.1% and bolstering consumer confidence. Manufacturing activity was solid even though the pace of manufacturing growth slowed over the year. Home sales were robust. However, stubbornly low inventory levels and rising prices have kept many first-time buyers out of the market.
As concerns mounted about a sluggish global economy, weakening growth in China and the timing of a Federal Reserve (Fed) interest rate hike, the financial markets turned volatile. Solid stock market gains in the first half of the 12-month period were all but wiped out in the second half. Large-cap stocks edged out mid-cap and small-cap stocks, while growth stocks significantly outperformed value stocks.
Contributors and Detractors
Within the information technology sector, the Fund did well with video game companies Activision and Electronic Arts, both of which benefited from a new game console cycle as well as from a secular shift away from video discs in favor of digital platforms, where profit margins are higher. In the semiconductor subsector, Skyworks Solutions and Broadcom were also solid performers. Skyworks is a leading supplier of radio frequency integrated circuits (RFICs) and other semiconductors for the wireless handset market, especially Apple iPhones. After handily beating earnings estimates for several quarters in a row, Skyworks rallied on strong demand for the iPhone 6, which released in September 2015. Broadcom was acquired at a premium by Avago Technologies, which benefited from strong handset demand and increased content within Apple products. Merger and acquisition activity also improved the Fund's performance in the health care sector. Long-time holding Covidien became part of Medtronic, and shares of Cigna and Perrigo were boosted by buyout offers received during the period.
Within the consumer staples sector, the Fund enjoyed favorable returns from drug-store chains CVS and Walgreen's. CVS achieved double-digit earnings growth through a combination of increased revenues and share repurchases, while Walgreen's new management team undertook an extensive cost-cutting campaign. In addition, the domestic emphasis of
Annual Report 2015
4
COLUMBIA CONTRARIAN CORE FUND
MANAGER DISCUSSION OF FUND PERFORMANCE (continued)
both companies insulated them from a rising dollar, unlike many of the multinational companies within the consumer staples sector.
Another key decision for the Fund was to maintain an underweight position in the energy sector. This stance proved especially important as oil prices experienced a sharp decline through much of the period. However, stock selection within energy was less favorable and offset some of the advantage of the sector's underweight. We added to the Fund's energy exposure toward the end of the period, finishing with only a modest underweight.
Stock selection within the gaming industry also detracted from overall performance. China was the major source of the industry's woes, because of a steeper-than-expected economic slowdown and also because of the government's anti-corruption campaign, which hit the gaming industry extremely hard. Fund holdings Wynn Resorts and Las Vegas Sands, each of which has historically enjoyed strong profits from their Macao operations, were both hurt by the anti-corruption campaign.
Looking Ahead
After a number of good years, we believe the short-term market backdrop is currently less forgiving than it has been given higher valuations, decelerating earnings growth and less accommodative monetary policy. Yet, we continue to regard equities as an attractive long-term asset class. In our view, the past year has demonstrated that U.S. markets are by no means insulated from weaknesses in overseas economies. We expect the performance of global economies will be closely watched in the year ahead and could bring an extra measure of volatility to the market. Domestically, all eyes will be on the Federal Reserve, which has thus far delayed its long-anticipated move to push short-term interest rates higher. In addition, we believe that investors will further focus in on company fundamentals, which have clearly weakened over the last 12 months.
Portfolio Breakdown (%)
(at August 31, 2015) | |
Common Stocks | | | 96.9 | | |
Money Market Funds | | | 3.1 | | |
Total | | | 100.0 | | |
Percentages indicated are based upon total investments. The Fund's portfolio composition is subject to change.
Equity Sector Breakdown (%)
(at August 31, 2015) | |
Consumer Discretionary | | | 11.1 | | |
Consumer Staples | | | 8.0 | | |
Energy | | | 7.0 | | |
Financials | | | 18.5 | | |
Health Care | | | 16.1 | | |
Industrials | | | 11.7 | | |
Information Technology | | | 22.3 | | |
Materials | | | 0.6 | | |
Telecommunication Services | | | 2.8 | | |
Utilities | | | 1.9 | | |
Total | | | 100.0 | | |
Percentages indicated are based upon total equity investments. The Fund's portfolio composition is subject to change.
Investment Risks
Market risk may affect a single issuer, sector of the economy, industry or the market as a whole. Foreign investments subject the Fund to risks, including political, economic, market, social and others within a particular country, as well as to currency instabilities and less stringent financial and accounting standards generally applicable to U.S. issuers. Growth securities, at times, may not perform as well as value securities or the stock market in general and may be out of favor with investors. Value securities may be unprofitable if the market fails to recognize their intrinsic worth or the portfolio manager misgauged that worth. The Fund may invest significantly in issuers within a particular sector, which may be negatively affected by market, economic or other conditions, making the Fund more vulnerable to unfavorable developments in the sector. See the Fund's prospectus for information on these and other risks.
Annual Report 2015
5
COLUMBIA CONTRARIAN CORE FUND
UNDERSTANDING YOUR FUND'S EXPENSES
(Unaudited)
As an investor, you incur two types of costs. There are transaction costs, which generally include sales charges on purchases and may include redemption fees. There are also ongoing costs, which generally include management fees, distribution and/or service fees, and other fund expenses. The following information is intended to help you understand your ongoing costs (in dollars) of investing in the Fund and to help you compare these costs with the ongoing costs of investing in other mutual funds.
Analyzing Your Fund's Expenses
To illustrate these ongoing costs, we have provided examples and calculated the expenses paid by investors in each share class of the Fund during the period. The actual and hypothetical information in the table is based on an initial investment of $1,000 at the beginning of the period indicated and held for the entire period. Expense information is calculated two ways and each method provides you with different information. The amount listed in the "Actual" column is calculated using the Fund's actual operating expenses and total return for the period. You may use the Actual information, together with the amount invested, to estimate the expenses that you paid over the period. Simply divide your account value by $1,000 (for example, an $8,600 account value divided by $1,000 = 8.6), then multiply the results by the expenses paid during the period under the "Actual" column. The amount listed in the "Hypothetical" column assumes a 5% annual rate of return before expenses (which is not the Fund's actual return) and then applies the Fund's actual expense ratio for the period to the hypothetical return. You should not use the hypothetical account values and expenses to estimate either your actual account balance at the end of the period or the expenses you paid during the period. See "Compare With Other Funds" below for details on how to use the hypothetical data.
Compare With Other Funds
Since all mutual funds are required to include the same hypothetical calculations about expenses in shareholder reports, you can use this information to compare the ongoing cost of investing in the Fund with other funds. To do so, compare the hypothetical example with the 5% hypothetical examples that appear in the shareholder reports of other funds. As you compare hypothetical examples of other funds, it is important to note that hypothetical examples are meant to highlight the ongoing costs of investing in a fund only and do not reflect any transaction costs, such as sales charges, or redemption or exchange fees. Therefore, the hypothetical calculations are useful in comparing ongoing costs only, and will not help you determine the relative total costs of owning different funds. If transaction costs were included in these calculations, your costs would be higher.
March 1, 2015 – August 31, 2015
| | | Account Value at the Beginning
of the Period ($) | | Account Value at the End of the
Period ($) | | Expenses Paid During the
Period ($) | | Fund's Annualized
Expense Ratio (%) | |
| | | Actual | | Hypothetical | | Actual | | Hypothetical | | Actual | | Hypothetical | | Actual | |
Class A | | | 1,000.00 | | | | 1,000.00 | | | | 959.40 | | | | 1,019.82 | | | | 5.41 | | | | 5.58 | | | | 1.09 | | |
Class B | | | 1,000.00 | | | | 1,000.00 | | | | 955.70 | | | | 1,016.02 | | | | 9.12 | | | | 9.40 | | | | 1.84 | | |
Class C | | | 1,000.00 | | | | 1,000.00 | | | | 955.30 | | | | 1,016.02 | | | | 9.12 | | | | 9.40 | | | | 1.84 | | |
Class I | | | 1,000.00 | | | | 1,000.00 | | | | 961.40 | | | | 1,022.05 | | | | 3.23 | | | | 3.33 | | | | 0.65 | | |
Class K | | | 1,000.00 | | | | 1,000.00 | | | | 960.10 | | | | 1,020.53 | | | | 4.72 | | | | 4.86 | | | | 0.95 | | |
Class R | | | 1,000.00 | | | | 1,000.00 | | | | 958.10 | | | | 1,018.55 | | | | 6.65 | | | | 6.85 | | | | 1.34 | | |
Class R4 | | | 1,000.00 | | | | 1,000.00 | | | | 960.70 | | | | 1,021.08 | | | | 4.17 | | | | 4.30 | | | | 0.84 | | |
Class R5 | | | 1,000.00 | | | | 1,000.00 | | | | 961.10 | | | | 1,021.74 | | | | 3.53 | | | | 3.64 | | | | 0.71 | | |
Class T | | | 1,000.00 | | | | 1,000.00 | | | | 959.10 | | | | 1,019.82 | | | | 5.41 | | | | 5.58 | | | | 1.09 | | |
Class W | | | 1,000.00 | | | | 1,000.00 | | | | 959.40 | | | | 1,019.82 | | | | 5.41 | | | | 5.58 | | | | 1.09 | | |
Class Y | | | 1,000.00 | | | | 1,000.00 | | | | 961.50 | | | | 1,022.00 | | | | 3.28 | | | | 3.38 | | | | 0.66 | | |
Class Z | | | 1,000.00 | | | | 1,000.00 | | | | 960.50 | | | | 1,021.08 | | | | 4.17 | | | | 4.30 | | | | 0.84 | | |
Expenses paid during the period are equal to the annualized expense ratio for each class as indicated above, multiplied by the average account value over the period and then multiplied by the number of days in the Fund's most recent fiscal half year and divided by 365.
Expenses do not include fees and expenses incurred indirectly by the Fund from its investment in underlying funds, including affiliated and non-affiliated pooled investment vehicles, such as mutual funds and exchange-traded funds.
Annual Report 2015
6
COLUMBIA CONTRARIAN CORE FUND
PORTFOLIO OF INVESTMENTS
August 31, 2015
(Percentages represent value of investments compared to net assets)
Common Stocks 96.1%
Issuer | | Shares | | Value ($) | |
CONSUMER DISCRETIONARY 10.7% | |
Auto Components 1.4% | |
Delphi Automotive PLC | | | 1,153,448 | | | | 87,108,393 | | |
Hotels, Restaurants & Leisure 1.2% | |
Aramark | | | 1,105,963 | | | | 34,660,881 | | |
McDonald's Corp. | | | 412,920 | | | | 39,235,658 | | |
Total | | | | | 73,896,539 | | |
Household Durables 0.4% | |
Mohawk Industries, Inc.(a) | | | 132,283 | | | | 26,055,782 | | |
Internet & Catalog Retail 1.4% | |
Priceline Group, Inc. (The)(a) | | | 68,740 | | | | 85,831,514 | | |
Media 3.4% | |
CBS Corp., Class B Non Voting | | | 1,357,760 | | | | 61,425,062 | | |
Comcast Corp., Class A | | | 2,565,468 | | | | 144,512,813 | | |
Total | | | | | 205,937,875 | | |
Specialty Retail 2.3% | |
Lowe's Companies, Inc. | | | 1,561,194 | | | | 107,987,789 | | |
Michaels Companies, Inc. (The)(a) | | | 1,363,685 | | | | 35,742,184 | | |
Total | | | | | 143,729,973 | | |
Textiles, Apparel & Luxury Goods 0.6% | |
PVH Corp. | | | 321,983 | | | | 38,309,537 | | |
Total Consumer Discretionary | | | | | 660,869,613 | | |
CONSUMER STAPLES 7.7% | |
Beverages 3.0% | |
Diageo PLC, ADR | | | 657,072 | | | | 69,892,748 | | |
PepsiCo, Inc. | | | 1,249,175 | | | | 116,085,833 | | |
Total | | | | | 185,978,581 | | |
Food & Staples Retailing 3.5% | |
CVS Health Corp. | | | 1,713,207 | | | | 175,432,397 | | |
Walgreens Boots Alliance, Inc. | | | 464,839 | | | | 40,231,815 | | |
Total | | | | | 215,664,212 | | |
Tobacco 1.2% | |
Philip Morris International, Inc. | | | 924,880 | | | | 73,805,424 | | |
Total Consumer Staples | | | | | 475,448,217 | | |
ENERGY 6.7% | |
Energy Equipment & Services 0.9% | |
Schlumberger Ltd. | | | 755,410 | | | | 58,446,072 | | |
Common Stocks (continued)
Issuer | | Shares | | Value ($) | |
Oil, Gas & Consumable Fuels 5.8% | |
Canadian Natural Resources Ltd. | | | 1,801,940 | | | | 40,489,592 | | |
Chevron Corp. | | | 1,007,823 | | | | 81,623,585 | | |
ConocoPhillips | | | 769,351 | | | | 37,813,601 | | |
Exxon Mobil Corp. | | | 1,068,815 | | | | 80,417,640 | | |
Noble Energy, Inc. | | | 473,797 | | | | 15,829,558 | | |
Range Resources Corp. | | | 1,039,090 | | | | 40,129,656 | | |
Williams Companies, Inc. (The) | | | 1,304,754 | | | | 62,889,143 | | |
Total | | | | | 359,192,775 | | |
Total Energy | | | | | 417,638,847 | | |
FINANCIALS 17.8% | |
Banks 7.9% | |
Bank of America Corp. | | | 5,847,169 | | | | 95,542,742 | | |
Citigroup, Inc. | | | 2,426,821 | | | | 129,786,387 | | |
JPMorgan Chase & Co. | | | 2,775,888 | | | | 177,934,421 | | |
Wells Fargo & Co. | | | 1,655,498 | | | | 88,287,708 | | |
Total | | | | | 491,551,258 | | |
Capital Markets 2.9% | |
BlackRock, Inc. | | | 307,894 | | | | 93,128,698 | | |
Goldman Sachs Group, Inc. (The) | | | 464,260 | | | | 87,559,436 | | |
Total | | | | | 180,688,134 | | |
Consumer Finance 2.7% | |
American Express Co. | | | 2,133,475 | | | | 163,680,202 | | |
Diversified Financial Services 2.8% | |
Berkshire Hathaway, Inc., Class B(a) | | | 1,288,938 | | | | 172,769,249 | | |
Insurance 1.3% | |
Aon PLC | | | 849,672 | | | | 79,393,352 | | |
Real Estate Investment Trusts (REITs) 0.2% | |
Rayonier, Inc. | | | 595,440 | | | | 13,695,120 | | |
Total Financials | | | | | 1,101,777,315 | | |
HEALTH CARE 15.4% | |
Biotechnology 4.3% | |
Baxalta, Inc. | | | 1,123,065 | | | | 39,475,735 | | |
Biogen, Inc.(a) | | | 305,180 | | | | 90,730,014 | | |
Celgene Corp.(a) | | | 796,648 | | | | 94,068,196 | | |
Vertex Pharmaceuticals, Inc.(a) | | | 310,160 | | | | 39,551,603 | | |
Total | | | | | 263,825,548 | | |
The accompanying Notes to Financial Statements are an integral part of this statement.
Annual Report 2015
7
COLUMBIA CONTRARIAN CORE FUND
PORTFOLIO OF INVESTMENTS (continued)
August 31, 2015
Common Stocks (continued)
Issuer | | Shares | | Value ($) | |
Health Care Equipment & Supplies 5.4% | |
Abbott Laboratories | | | 2,208,969 | | | | 100,044,206 | | |
Medtronic PLC | | | 2,395,539 | | | | 173,173,514 | | |
St. Jude Medical, Inc. | | | 877,027 | | | | 62,102,282 | | |
Total | | | | | 335,320,002 | | |
Health Care Providers & Services 3.1% | |
Cardinal Health, Inc. | | | 1,386,441 | | | | 114,062,501 | | |
CIGNA Corp. | | | 561,080 | | | | 78,994,453 | | |
Total | | | | | 193,056,954 | | |
Pharmaceuticals 2.6% | |
Johnson & Johnson | | | 1,533,406 | | | | 144,109,496 | | |
Perrigo Co. PLC | | | 102,865 | | | | 18,821,209 | | |
Total | | | | | 162,930,705 | | |
Total Health Care | | | | | 955,133,209 | | |
INDUSTRIALS 11.3% | |
Aerospace & Defense 3.0% | |
Honeywell International, Inc. | | | 1,194,784 | | | | 118,606,208 | | |
United Technologies Corp. | | | 718,382 | | | | 65,810,975 | | |
Total | | | | | 184,417,183 | | |
Air Freight & Logistics 1.1% | |
FedEx Corp. | | | 469,011 | | | | 70,637,747 | | |
Building Products 0.5% | |
Fortune Brands Home & Security, Inc. | | | 651,513 | | | | 31,174,897 | | |
Commercial Services & Supplies 1.2% | |
Tyco International PLC | | | 1,978,869 | | | | 71,813,156 | | |
Industrial Conglomerates 1.8% | |
General Electric Co. | | | 4,451,685 | | | | 110,490,822 | | |
Professional Services 3.3% | |
Dun & Bradstreet Corp. (The) | | | 378,760 | | | | 40,137,197 | | |
IHS, Inc., Class A(a) | | | 286,084 | | | | 33,191,465 | | |
Nielsen Holdings PLC | | | 2,911,090 | | | | 131,668,601 | | |
Total | | | | | 204,997,263 | | |
Road & Rail 0.4% | |
Kansas City Southern | | | 261,481 | | | | 24,249,748 | | |
Total Industrials | | | | | 697,780,816 | | |
INFORMATION TECHNOLOGY 21.5% | |
Communications Equipment 0.3% | |
QUALCOMM, Inc. | | | 374,498 | | | | 21,189,097 | | |
Common Stocks (continued)
Issuer | | Shares | | Value ($) | |
Internet Software & Services 5.6% | |
Alibaba Group Holding Ltd., ADR(a) | | | 204,590 | | | | 13,527,491 | | |
Facebook, Inc., Class A(a) | | | 1,089,370 | | | | 97,422,359 | | |
Google, Inc., Class A(a) | | | 124,868 | | | | 80,891,988 | | |
Google, Inc., Class C(a) | | | 247,375 | | | | 152,939,593 | | |
Total | | | | | 344,781,431 | | |
IT Services 1.9% | |
MasterCard, Inc., Class A | | | 1,299,370 | | | | 120,022,807 | | |
Semiconductors & Semiconductor Equipment 2.3% | |
Broadcom Corp., Class A | | | 1,665,654 | | | | 86,064,342 | | |
Qorvo, Inc.(a) | | | 271,655 | | | | 15,079,569 | | |
Skyworks Solutions, Inc. | | | 431,803 | | | | 37,717,992 | | |
Total | | | | | 138,861,903 | | |
Software 5.3% | |
Activision Blizzard, Inc. | | | 3,228,645 | | | | 92,436,106 | | |
Electronic Arts, Inc.(a) | | | 713,576 | | | | 47,203,052 | | |
Intuit, Inc. | | | 611,834 | | | | 52,464,766 | | |
Microsoft Corp. | | | 3,131,722 | | | | 136,292,542 | | |
Total | | | | | 328,396,466 | | |
Technology Hardware, Storage & Peripherals 6.1% | |
Apple, Inc. | | | 2,200,181 | | | | 248,092,410 | | |
EMC Corp. | | | 3,133,865 | | | | 77,939,222 | | |
Hewlett-Packard Co. | | | 1,780,227 | | | | 49,953,170 | | |
Total | | | | | 375,984,802 | | |
Total Information Technology | | | | | 1,329,236,506 | | |
MATERIALS 0.5% | |
Chemicals 0.5% | |
LyondellBasell Industries NV, Class A | | | 147,770 | | | | 12,616,603 | | |
Monsanto Co. | | | 216,365 | | | | 21,128,042 | | |
Total | | | | | 33,744,645 | | |
Total Materials | | | | | 33,744,645 | | |
TELECOMMUNICATION SERVICES 2.6% | |
Diversified Telecommunication Services 2.6% | |
Verizon Communications, Inc. | | | 3,576,778 | | | | 164,567,556 | | |
Total Telecommunication Services | | | | | 164,567,556 | | |
The accompanying Notes to Financial Statements are an integral part of this statement.
Annual Report 2015
8
COLUMBIA CONTRARIAN CORE FUND
PORTFOLIO OF INVESTMENTS (continued)
August 31, 2015
Common Stocks (continued)
Issuer | | Shares | | Value ($) | |
UTILITIES 1.9% | |
Electric Utilities 1.3% | |
Duke Energy Corp. | | | 519,030 | | | | 36,804,417 | | |
Edison International | | | 707,745 | | | | 41,388,928 | | |
Total | | | | | 78,193,345 | | |
Multi-Utilities 0.6% | |
DTE Energy Co. | | | 476,790 | | | | 37,218,227 | | |
Total Utilities | | | | | 115,411,572 | | |
Total Common Stocks
(Cost: $5,061,508,425) | | | | | 5,951,608,296 | | |
Money Market Funds 3.1%
| | | Shares | | Value ($) | |
Columbia Short-Term Cash Fund,
0.150%(b)(c) | | | 189,205,745 | | | | 189,205,745 | | |
Total Money Market Funds
(Cost: $189,205,745) | | | | | 189,205,745 | | |
Total Investments
(Cost: $5,250,714,170) | | | | | 6,140,814,041 | | |
Other Assets & Liabilities, Net | | | | | 49,869,736 | | |
Net Assets | | | | | 6,190,683,777 | | |
Notes to Portfolio of Investments
(a) Non-income producing investment.
(b) The rate shown is the seven-day current annualized yield at August 31, 2015.
(c) As defined in the Investment Company Act of 1940, an affiliated company is one in which the Fund owns 5% or more of the company's outstanding voting securities, or a company which is under common ownership or control with the Fund. Holdings and transactions in these affiliated companies during the year ended August 31, 2015 are as follows:
Issuer | | Beginning
Cost ($) | | Purchase
Cost ($) | | Proceeds
From Sales ($) | | Ending
Cost ($) | | Dividends —
Affiliated
Issuers ($) | | Value ($) | |
Columbia Short-Term Cash Fund | | | 109,912,819 | | | | 1,884,206,430 | | | | (1,804,913,504 | ) | | | 189,205,745 | | | | 206,383 | | | | 189,205,745 | | |
Abbreviation Legend
ADR American Depositary Receipt
Fair Value Measurements
The Fund categorizes its fair value measurements according to a three-level hierarchy that maximizes the use of observable inputs and minimizes the use of unobservable inputs by prioritizing that the most observable input be used when available. Observable inputs are those that market participants would use in pricing an investment based on market data obtained from sources independent of the reporting entity. Unobservable inputs are those that reflect the Fund's assumptions about the information market participants would use in pricing an investment. An investment's level within the fair value hierarchy is based on the lowest level of any input that is deemed significant to the asset's or liability's fair value measurement. The input levels are not necessarily an indication of the risk or liquidity associated with investments at that level. For example, certain U.S. government securities are generally high quality and liquid, however, they are reflected as Level 2 because the inputs used to determine fair value may not always be quoted prices in an active market.
Fair value inputs are summarized in the three broad levels listed below:
> Level 1 — Valuations based on quoted prices for investments in active markets that the Fund has the ability to access at the measurement date (including NAV for open-end mutual funds). Valuation adjustments are not applied to Level 1 investments.
> Level 2 — Valuations based on other significant observable inputs (including quoted prices for similar securities, interest rates, prepayment speeds, credit risks, etc.).
> Level 3 — Valuations based on significant unobservable inputs (including the Fund's own assumptions and judgment in determining the fair value of investments).
The accompanying Notes to Financial Statements are an integral part of this statement.
Annual Report 2015
9
COLUMBIA CONTRARIAN CORE FUND
PORTFOLIO OF INVESTMENTS (continued)
August 31, 2015
Fair Value Measurements (continued)
Inputs that are used in determining fair value of an investment may include price information, credit data, volatility statistics, and other factors. These inputs can be either observable or unobservable. The availability of observable inputs can vary between investments, and is affected by various factors such as the type of investment, and the volume and level of activity for that investment or similar investments in the marketplace. The inputs will be considered by the Investment Manager, along with any other relevant factors in the calculation of an investment's fair value. The Fund uses prices and inputs that are current as of the measurement date, which may include periods of market dislocations. During these periods, the availability of prices and inputs may be reduced for many investments. This condition could cause an investment to be reclassified between the various levels within the hierarchy.
Investments falling into the Level 3 category are primarily supported by quoted prices from brokers and dealers participating in the market for those investments. However, these may be classified as Level 3 investments due to lack of market transparency and corroboration to support these quoted prices. Additionally, valuation models may be used as the pricing source for any remaining investments classified as Level 3. These models may rely on one or more significant unobservable inputs and/or significant assumptions by the Investment Manager. Inputs used in valuations may include, but are not limited to, financial statement analysis, capital account balances, discount rates and estimated cash flows, and comparable company data.
Under the direction of the Fund's Board of Trustees (the Board), the Investment Manager's Valuation Committee (the Committee) is responsible for overseeing the valuation procedures approved by the Board. The Committee consists of voting and non-voting members from various groups within the Investment Manager's organization, including operations and accounting, trading and investments, compliance, risk management and legal.
The Committee meets at least monthly to review and approve valuation matters, which may include a description of specific valuation determinations, data regarding pricing information received from approved pricing vendors and brokers and the results of Board-approved valuation control policies and procedures (the Policies). The Policies address, among other things, instances when market quotations are or are not readily available, including recommendations of third party pricing vendors and a determination of appropriate pricing methodologies; events that require specific valuation determinations and assessment of fair value techniques; securities with a potential for stale pricing, including those that are illiquid, restricted, or in default; and the effectiveness of third party pricing vendors, including periodic reviews of vendors. The Committee meets more frequently, as needed, to discuss additional valuation matters, which may include the need to review back-testing results, review time-sensitive information or approve related valuation actions. The Committee reports to the Board, with members of the Committee meeting with the Board at each of its regularly scheduled meetings to discuss valuation matters and actions during the period, similar to those described earlier.
For investments categorized as Level 3, the Committee monitors information similar to that described above, which may include: (i) data specific to the issuer or comparable issuers, (ii) general market or specific sector news and (iii) quoted prices and specific or similar security transactions. The Committee considers this data and any changes from prior periods in order to assess the reasonableness of observable and unobservable inputs, any assumptions or internal models used to value those securities and changes in fair value. This data is also used to corroborate, when available, information received from approved pricing vendors and brokers. Various factors impact the frequency of monitoring this information (which may occur as often as daily). However, the Committee may determine that changes to inputs, assumptions and models are not required as a result of the monitoring procedures performed.
The accompanying Notes to Financial Statements are an integral part of this statement.
Annual Report 2015
10
COLUMBIA CONTRARIAN CORE FUND
PORTFOLIO OF INVESTMENTS (continued)
August 31, 2015
Fair Value Measurements (continued)
The following table is a summary of the inputs used to value the Fund's investments at August 31, 2015:
| | | Level 1
Quoted Prices in Active
Markets for Identical
Assets ($) | | Level 2
Other Significant
Observable Inputs ($) | | Level 3
Significant
Unobservable Inputs ($) | | Total ($) | |
Investments | |
Common Stocks | |
Consumer Discretionary | | | 660,869,613 | | | | — | | | | — | | | | 660,869,613 | | |
Consumer Staples | | | 475,448,217 | | | | — | | | | — | | | | 475,448,217 | | |
Energy | | | 417,638,847 | | | | — | | | | — | | | | 417,638,847 | | |
Financials | | | 1,101,777,315 | | | | — | | | | — | | | | 1,101,777,315 | | |
Health Care | | | 955,133,209 | | | | — | | | | — | | | | 955,133,209 | | |
Industrials | | | 697,780,816 | | | | — | | | | — | | | | 697,780,816 | | |
Information Technology | | | 1,329,236,506 | | | | — | | | | — | | | | 1,329,236,506 | | |
Materials | | | 33,744,645 | | | | — | | | | — | | | | 33,744,645 | | |
Telecommunication Services | | | 164,567,556 | | | | — | | | | — | | | | 164,567,556 | | |
Utilities | | | 115,411,572 | | | | — | | | | — | | | | 115,411,572 | | |
Total Common Stocks | | | 5,951,608,296 | | | | — | | | | — | | | | 5,951,608,296 | | |
Money Market Funds | | | — | | | | 189,205,745 | | | | — | | | | 189,205,745 | | |
Total Investments | | | 5,951,608,296 | | | | 189,205,745 | | | | — | | | | 6,140,814,041 | | |
See the Portfolio of Investments for all investment classifications not indicated in the table.
The Fund's assets assigned to the Level 2 input category are generally valued using the market approach, in which a security's value is determined through reference to prices and information from market transactions for similar or identical assets.
Financial assets were transferred from Level 1 to Level 2 as the market for these assets is not considered publicly available. Fund per share market values were obtained using observable market inputs.
The following table shows transfers between Level 1 and Level 2 of the fair value hierarchy:
Transfers In | | Transfers Out | |
| Level 1 ($) | | Level 2 ($) | | Level 1 ($) | | Level 2 ($) | |
| | — | | | | 109,912,819 | | | | 109,912,819 | | | | — | | |
Transfers between Level 1 and Level 2 are determined based on the fair value at the beginning of the period for security positions held throughout the period.
There were no transfers of financial assets between Level 2 and 3 during the period.
The accompanying Notes to Financial Statements are an integral part of this statement.
Annual Report 2015
11
COLUMBIA CONTRARIAN CORE FUND
STATEMENT OF ASSETS AND LIABILITIES
August 31, 2015
Assets | |
Investments, at value | |
Unaffiliated issuers (identified cost $5,061,508,425) | | $ | 5,951,608,296 | | |
Affiliated issuers (identified cost $189,205,745) | | | 189,205,745 | | |
Total investments (identified cost $5,250,714,170) | | | 6,140,814,041 | | |
Receivable for: | |
Investments sold | | | 54,433,625 | | |
Capital shares sold | | | 41,615,058 | | |
Dividends | | | 10,586,047 | | |
Foreign tax reclaims | | | 2,562 | | |
Prepaid expenses | | | 63,182 | | |
Trustees' deferred compensation plan | | | 96,131 | | |
Total assets | | | 6,247,610,646 | | |
Liabilities | |
Payable for: | |
Investments purchased | | | 43,070,729 | | |
Capital shares purchased | | | 12,184,997 | | |
Investment management fees | | | 299,483 | | |
Distribution and/or service fees | | | 89,644 | | |
Transfer agent fees | | | 953,310 | | |
Administration fees | | | 23,485 | | |
Plan administration fees | | | 26 | | |
Compensation of board members | | | 3,588 | | |
Chief compliance officer expenses | | | 495 | | |
Other expenses | | | 204,981 | | |
Trustees' deferred compensation plan | | | 96,131 | | |
Total liabilities | | | 56,926,869 | | |
Net assets applicable to outstanding capital stock | | $ | 6,190,683,777 | | |
Represented by | |
Paid-in capital | | $ | 4,962,718,106 | | |
Undistributed net investment income | | | 159,226,713 | | |
Accumulated net realized gain | | | 178,639,087 | | |
Unrealized appreciation (depreciation) on: | |
Investments | | | 890,099,871 | | |
Total — representing net assets applicable to outstanding capital stock | | $ | 6,190,683,777 | | |
The accompanying Notes to Financial Statements are an integral part of this statement.
Annual Report 2015
12
COLUMBIA CONTRARIAN CORE FUND
STATEMENT OF ASSETS AND LIABILITIES (continued)
August 31, 2015
Class A | |
Net assets | | $ | 2,297,175,615 | | |
Shares outstanding | | | 108,012,045 | | |
Net asset value per share | | $ | 21.27 | | |
Maximum offering price per share(a) | | $ | 22.57 | | |
Class B | |
Net assets | | $ | 9,551,323 | | |
Shares outstanding | | | 492,390 | | |
Net asset value per share | | $ | 19.40 | | |
Class C | |
Net assets | | $ | 409,798,122 | | |
Shares outstanding | | | 21,086,724 | | |
Net asset value per share | | $ | 19.43 | | |
Class I | |
Net assets | | $ | 425,920,745 | | |
Shares outstanding | | | 19,878,651 | | |
Net asset value per share | | $ | 21.43 | | |
Class K | |
Net assets | | $ | 115,149 | | |
Shares outstanding | | | 5,380 | | |
Net asset value per share | | $ | 21.40 | | |
Class R | |
Net assets | | $ | 50,047,986 | | |
Shares outstanding | | | 2,353,728 | | |
Net asset value per share | | $ | 21.26 | | |
Class R4 | |
Net assets | | $ | 227,941,150 | | |
Shares outstanding | | | 10,486,234 | | |
Net asset value per share | | $ | 21.74 | | |
Class R5 | |
Net assets | | $ | 336,042,780 | | |
Shares outstanding | | | 15,461,189 | | |
Net asset value per share | | $ | 21.73 | | |
Class T | |
Net assets | | $ | 143,303,896 | | |
Shares outstanding | | | 6,796,973 | | |
Net asset value per share | | $ | 21.08 | | |
Maximum offering price per share(a) | | $ | 22.37 | | |
Class W | |
Net assets | | $ | 118,262,234 | | |
Shares outstanding | | | 5,560,213 | | |
Net asset value per share | | $ | 21.27 | | |
The accompanying Notes to Financial Statements are an integral part of this statement.
Annual Report 2015
13
COLUMBIA CONTRARIAN CORE FUND
STATEMENT OF ASSETS AND LIABILITIES (continued)
August 31, 2015
Class Y | |
Net assets | | $ | 53,246,409 | | |
Shares outstanding | | | 2,448,637 | | |
Net asset value per share | | $ | 21.75 | | |
Class Z | |
Net assets | | $ | 2,119,278,368 | | |
Shares outstanding | | | 98,945,158 | | |
Net asset value per share | | $ | 21.42 | | |
(a) The maximum offering price per share is calculated by dividing the net asset value per share by 1.0 minus the maximum sales charge of 5.75%.
The accompanying Notes to Financial Statements are an integral part of this statement.
Annual Report 2015
14
COLUMBIA CONTRARIAN CORE FUND
STATEMENT OF OPERATIONS
Year Ended August 31, 2015
Net investment income | |
Income: | |
Dividends — unaffiliated issuers | | $ | 224,001,082 | | |
Dividends — affiliated issuers | | | 206,383 | | |
Foreign taxes withheld | | | (456,353 | ) | |
Total income | | | 223,751,112 | | |
Expenses: | |
Investment management fees | | | 33,944,896 | | |
Distribution and/or service fees | |
Class A | | | 5,070,822 | | |
Class B | | | 122,180 | | |
Class C | | | 3,238,321 | | |
Class R | | | 200,394 | | |
Class T | | | 406,232 | | |
Class W | | | 354,495 | | |
Transfer agent fees | |
Class A | | | 3,810,149 | | |
Class B | | | 22,930 | | |
Class C | | | 608,753 | | |
Class K | | | 59 | | |
Class R | | | 75,277 | | |
Class R4 | | | 341,475 | | |
Class R5 | | | 140,269 | | |
Class T | | | 285,871 | | |
Class W | | | 266,017 | | |
Class Z | | | 3,821,055 | | |
Administration fees | | | 2,679,269 | | |
Plan administration fees | |
Class K | | | 295 | | |
Compensation of board members | | | 118,617 | | |
Custodian fees | | | 41,316 | | |
Printing and postage fees | | | 354,511 | | |
Registration fees | | | 327,484 | | |
Professional fees | | | 207,947 | | |
Chief compliance officer expenses | | | 2,828 | | |
Other | | | 114,227 | | |
Total expenses | | | 56,555,689 | | |
Expense reductions | | | (4,700 | ) | |
Total net expenses | | | 56,550,989 | | |
Net investment income | | | 167,200,123 | | |
Realized and unrealized gain (loss) — net | |
Net realized gain (loss) on: | |
Investments | | | 226,554,360 | | |
Foreign currency translations | | | (15,092 | ) | |
Net realized gain | | | 226,539,268 | | |
Net change in unrealized appreciation (depreciation) on: | |
Investments | | | (305,101,185 | ) | |
Net change in unrealized depreciation | | | (305,101,185 | ) | |
Net realized and unrealized loss | | | (78,561,917 | ) | |
Net increase in net assets resulting from operations | | $ | 88,638,206 | | |
The accompanying Notes to Financial Statements are an integral part of this statement.
Annual Report 2015
15
COLUMBIA CONTRARIAN CORE FUND
STATEMENT OF CHANGES IN NET ASSETS
| | | Year Ended
August 31,
2015 | | Year Ended
August 31,
2014 | |
Operations | |
Net investment income | | $ | 167,200,123 | | | $ | 32,493,864 | | |
Net realized gain | | | 226,539,268 | | | | 363,405,181 | | |
Net change in unrealized appreciation (depreciation) | | | (305,101,185 | ) | | | 463,596,188 | | |
Net increase in net assets resulting from operations | | | 88,638,206 | | | | 859,495,233 | | |
Distributions to shareholders | |
Net investment income | | | | | |
Class A | | | (8,507,483 | ) | | | (5,842,007 | ) | |
Class I | | | (4,798,155 | ) | | | (3,983,330 | ) | |
Class K | | | (674 | ) | | | (903 | ) | |
Class R | | | (78,264 | ) | | | (50,750 | ) | |
Class R4 | | | (816,168 | ) | | | (446,866 | ) | |
Class R5 | | | (1,922,616 | ) | | | (838,869 | ) | |
Class T | | | (642,160 | ) | | | (668,500 | ) | |
Class W | | | (758,782 | ) | | | (988,184 | ) | |
Class Y | | | (173,175 | ) | | | (2,201 | ) | |
Class Z | | | (13,614,092 | ) | | | (10,086,011 | ) | |
Net realized gains | | | | | |
Class A | | | (115,352,574 | ) | | | (61,235,547 | ) | |
Class B | | | (893,272 | ) | | | (956,604 | ) | |
Class C | | | (18,521,704 | ) | | | (8,411,180 | ) | |
Class I | | | (34,264,726 | ) | | | (23,837,970 | ) | |
Class K | | | (7,110 | ) | | | (7,717 | ) | |
Class R | | | (2,167,951 | ) | | | (944,794 | ) | |
Class R4 | | | (7,325,441 | ) | | | (3,259,693 | ) | |
Class R5 | | | (14,509,724 | ) | | | (5,283,994 | ) | |
Class T | | | (9,478,836 | ) | | | (7,678,933 | ) | |
Class W | | | (10,286,956 | ) | | | (10,180,158 | ) | |
Class Y | | | (1,236,681 | ) | | | (13,169 | ) | |
Class Z | | | (120,565,017 | ) | | | (73,572,489 | ) | |
Total distributions to shareholders | | | (365,921,561 | ) | | | (218,289,869 | ) | |
Increase in net assets from capital stock activity | | | 1,626,379,501 | | | | 900,230,117 | | |
Total increase in net assets | | | 1,349,096,146 | | | | 1,541,435,481 | | |
Net assets at beginning of year | | | 4,841,587,631 | | | | 3,300,152,150 | | |
Net assets at end of year | | $ | 6,190,683,777 | | | $ | 4,841,587,631 | | |
Undistributed net investment income | | $ | 159,226,713 | | | $ | 23,603,155 | | |
The accompanying Notes to Financial Statements are an integral part of this statement.
Annual Report 2015
16
COLUMBIA CONTRARIAN CORE FUND
STATEMENT OF CHANGES IN NET ASSETS (continued)
| | | Year Ended August 31, 2015 | | Year Ended August 31, 2014 | |
| | | Shares | | Dollars ($) | | Shares | | Dollars ($) | |
Capital stock activity | |
Class A shares | |
Subscriptions(a) | | | 45,567,965 | | | | 1,005,475,133 | | | | 36,058,634 | | | | 747,458,899 | | |
Distributions reinvested | | | 5,695,290 | | | | 119,202,421 | | | | 3,249,504 | | | | 64,047,715 | | |
Redemptions | | | (17,440,479 | ) | | | (384,215,880 | ) | | | (12,795,905 | ) | | | (266,997,147 | ) | |
Net increase | | | 33,822,776 | | | | 740,461,674 | | | | 26,512,233 | | | | 544,509,467 | | |
Class B shares | |
Subscriptions | | | 88,496 | | | | 1,787,513 | | | | 91,766 | | | | 1,745,506 | | |
Distributions reinvested | | | 45,319 | | | | 869,677 | | | | 51,496 | | | | 938,770 | | |
Redemptions(a) | | | (322,718 | ) | | | (6,500,704 | ) | | | (386,227 | ) | | | (7,355,296 | ) | |
Net decrease | | | (188,903 | ) | | | (3,843,514 | ) | | | (242,965 | ) | | | (4,671,020 | ) | |
Class C shares | |
Subscriptions | | | 11,677,531 | | | | 236,079,207 | | | | 5,234,942 | | | | 100,323,251 | | |
Distributions reinvested | | | 776,999 | | | | 14,941,695 | | | | 365,486 | | | | 6,673,770 | | |
Redemptions | | | (2,175,882 | ) | | | (43,913,211 | ) | | | (1,317,481 | ) | | | (25,125,999 | ) | |
Net increase | | | 10,278,648 | | | | 207,107,691 | | | | 4,282,947 | | | | 81,871,022 | | |
Class I shares | |
Subscriptions | | | 8,920,645 | | | | 198,518,571 | | | | 4,294,379 | | | | 87,531,205 | | |
Distributions reinvested | | | 1,858,358 | | | | 39,062,676 | | | | 1,406,501 | | | | 27,820,597 | | |
Redemptions | | | (12,672,345 | ) | | | (284,995,676 | ) | | | (5,948,198 | ) | | | (124,792,601 | ) | |
Net decrease | | | (1,893,342 | ) | | | (47,414,429 | ) | | | (247,318 | ) | | | (9,440,799 | ) | |
Class K shares | |
Distributions reinvested | | | 360 | | | | 7,576 | | | | 380 | | | | 7,523 | | |
Redemptions | | | — | | | | — | | | | (2,838 | ) | | | (59,644 | ) | |
Net increase (decrease) | | | 360 | | | | 7,576 | | | | (2,458 | ) | | | (52,121 | ) | |
Class R shares | |
Subscriptions | | | 1,525,966 | | | | 33,723,333 | | | | 993,295 | | | | 20,515,169 | | |
Distributions reinvested | | | 69,759 | | | | 1,462,150 | | | | 35,568 | | | | 702,110 | | |
Redemptions | | | (596,145 | ) | | | (13,163,703 | ) | | | (358,743 | ) | | | (7,405,308 | ) | |
Net increase | | | 999,580 | | | | 22,021,780 | | | | 670,120 | | | | 13,811,971 | | |
Class R4 shares | |
Subscriptions | | | 7,603,669 | | | | 167,657,282 | | | | 2,995,138 | | | | 62,699,057 | | |
Distributions reinvested | | | 379,661 | | | | 8,105,769 | | | | 184,580 | | | | 3,706,357 | | |
Redemptions | | | (2,116,266 | ) | | | (47,395,372 | ) | | | (927,958 | ) | | | (19,717,655 | ) | |
Net increase | | | 5,867,064 | | | | 128,367,679 | | | | 2,251,760 | | | | 46,687,759 | | |
Class R5 shares | |
Subscriptions | | | 8,767,116 | | | | 197,169,255 | | | | 6,678,168 | | | | 140,752,475 | | |
Distributions reinvested | | | 761,574 | | | | 16,244,381 | | | | 298,379 | | | | 5,982,494 | | |
Redemptions | | | (3,244,261 | ) | | | (72,265,852 | ) | | | (1,320,470 | ) | | | (27,713,522 | ) | |
Net increase | | | 6,284,429 | | | | 141,147,784 | | | | 5,656,077 | | | | 119,021,447 | | |
The accompanying Notes to Financial Statements are an integral part of this statement.
Annual Report 2015
17
COLUMBIA CONTRARIAN CORE FUND
STATEMENT OF CHANGES IN NET ASSETS (continued)
| | | Year Ended August 31, 2015 | | Year Ended August 31, 2014 | |
| | | Shares | | Dollars ($) | | Shares | | Dollars ($) | |
Capital stock activity (continued) | |
Class T shares | |
Subscriptions | | | 143,425 | | | | 3,011,870 | | | | 133,142 | | | | 2,628,259 | | |
Distributions reinvested | | | 338,177 | | | | 7,017,172 | | | | 294,510 | | | | 5,757,673 | | |
Redemptions | | | (509,561 | ) | | | (11,173,172 | ) | | | (533,838 | ) | | | (11,044,582 | ) | |
Net decrease | | | (27,959 | ) | | | (1,144,130 | ) | | | (106,186 | ) | | | (2,658,650 | ) | |
Class W shares | |
Subscriptions | | | 4,495,889 | | | | 100,570,978 | | | | 2,652,118 | | | | 53,805,477 | | |
Distributions reinvested | | | 527,738 | | | | 11,045,553 | | | | 566,621 | | | | 11,168,097 | | |
Redemptions | | | (5,005,755 | ) | | | (109,077,232 | ) | | | (10,951,818 | ) | | | (227,845,735 | ) | |
Net increase (decrease) | | | 17,872 | | | | 2,539,299 | | | | (7,733,079 | ) | | | (162,872,161 | ) | |
Class Y shares | |
Subscriptions | | | 2,447,484 | | | | 55,829,769 | | | | 116,035 | | | | 2,460,284 | | |
Distributions reinvested | | | 14,348 | | | | 306,053 | | | | 756 | | | | 15,161 | | |
Redemptions | | | (123,265 | ) | | | (2,790,813 | ) | | | (10,756 | ) | | | (225,098 | ) | |
Net increase | | | 2,338,567 | | | | 53,345,009 | | | | 106,035 | | | | 2,250,347 | | |
Class Z shares | |
Subscriptions | | | 31,332,502 | | | | 691,476,272 | | | | 29,720,665 | | | | 618,238,458 | | |
Distributions reinvested | | | 3,893,061 | | | | 81,910,017 | | | | 2,505,393 | | | | 49,606,774 | | |
Redemptions | | | (17,581,024 | ) | | | (389,603,207 | ) | | | (19,203,531 | ) | | | (396,072,377 | ) | |
Net increase | | | 17,644,539 | | | | 383,783,082 | | | | 13,022,527 | | | | 271,772,855 | | |
Total net increase | | | 75,143,631 | | | | 1,626,379,501 | | | | 44,169,693 | | | | 900,230,117 | | |
(a) Includes conversions of Class B shares to Class A shares, if any.
The accompanying Notes to Financial Statements are an integral part of this statement.
Annual Report 2015
18
COLUMBIA CONTRARIAN CORE FUND
The following tables are intended to help you understand the Fund's financial performance. Certain information reflects financial results for a single share of a class held for the periods shown. Per share net investment income (loss) amounts are calculated based on average shares outstanding during the period. Total return assumes reinvestment of all dividends and distributions, if any. Total return does not reflect payment of sales charges, if any. Total return and portfolio turnover are not annualized for periods of less than one year. The portfolio turnover rate is calculated without regard to purchase and sales transactions of short-term instruments and certain derivatives, if any. If such transactions were included, the Fund's portfolio turnover rate may be higher.
| | | Year Ended August 31, | | Year Ended
September 30, | |
Class A | | 2015 | | 2014 | | 2013 | | 2012(a) | | 2011 | | 2010 | |
Per share data | |
Net asset value, beginning of period | | $ | 22.37 | | | $ | 19.15 | | | $ | 15.68 | | | $ | 12.63 | | | $ | 12.61 | | | $ | 11.76 | | |
Income from investment operations: | |
Net investment income | | | 0.65 | (g) | | | 0.14 | | | | 0.13 | | | | 0.11 | | | | 0.08 | | | | 0.04 | | |
Net realized and unrealized gain (loss) | | | (0.23 | ) | | | 4.32 | | | | 3.48 | | | | 3.32 | | | | (0.03 | ) | | | 0.87 | | |
Total from investment operations | | | 0.42 | | | | 4.46 | | | | 3.61 | | | | 3.43 | | | | 0.05 | | | | 0.91 | | |
Less distributions to shareholders: | |
Net investment income | | | (0.10 | ) | | | (0.11 | ) | | | (0.12 | ) | | | (0.07 | ) | | | (0.03 | ) | | | (0.06 | ) | |
Net realized gains | | | (1.42 | ) | | | (1.13 | ) | | | (0.02 | ) | | | (0.31 | ) | | | — | | | | — | | |
Total distributions to shareholders | | | (1.52 | ) | | | (1.24 | ) | | | (0.14 | ) | | | (0.38 | ) | | | (0.03 | ) | | | (0.06 | ) | |
Net asset value, end of period | | $ | 21.27 | | | $ | 22.37 | | | $ | 19.15 | | | $ | 15.68 | | | $ | 12.63 | | | $ | 12.61 | | |
Total return | | | 1.99 | % | | | 24.15 | % | | | 23.23 | % | | | 27.59 | % | | | 0.39 | % | | | 7.75 | % | |
Ratios to average net assets(b) | |
Total gross expenses | | | 1.09 | % | | | 1.11 | % | | | 1.15 | % | | | 1.19 | %(c) | | | 1.19 | %(d) | | | 1.25 | % | |
Total net expenses(e) | | | 1.09 | %(f) | | | 1.11 | %(f) | | | 1.14 | %(f) | | | 1.16 | %(c)(f) | | | 1.16 | %(d)(f) | | | 1.19 | %(f) | |
Net investment income | | | 2.93 | % | | | 0.69 | % | | | 0.73 | % | | | 0.82 | %(c) | | | 0.56 | % | | | 0.32 | % | |
Supplemental data | |
Net assets, end of period (in thousands) | | $ | 2,297,176 | | | $ | 1,659,841 | | | $ | 913,212 | | | $ | 588,182 | | | $ | 427,039 | | | $ | 111,182 | | |
Portfolio turnover | | | 60 | % | | | 65 | % | | | 47 | % | | | 62 | % | | | 78 | % | | | 94 | % | |
Notes to Financial Highlights
(a) For the period from October 1, 2011 to August 31, 2012. During the period, the Fund's fiscal year end was changed from September 30 to August 31.
(b) In addition to the fees and expenses that the Fund bears directly, the Fund indirectly bears a pro rata share of the fees and expenses of any other funds in which it invests. Such indirect expenses are not included in the Fund's reported expense ratios.
(c) Annualized.
(d) Ratios include line of credit interest expense which is less than 0.01%.
(e) Total net expenses include the impact of certain fee waivers/expense reimbursements made by the Investment Manager and certain of its affiliates, if applicable.
(f) The benefits derived from expense reductions had an impact of less than 0.01%.
(g) Net investment income per share includes special dividends. The effect of these dividends amounted to $0.54 per share.
The accompanying Notes to Financial Statements are an integral part of this statement.
Annual Report 2015
19
COLUMBIA CONTRARIAN CORE FUND
FINANCIAL HIGHLIGHTS (continued)
| | | Year Ended August 31, | | Year Ended
September 30, | |
Class B | | 2015 | | 2014 | | 2013 | | 2012(a) | | 2011 | | 2010 | |
Per share data | |
Net asset value, beginning of period | | $ | 20.58 | | | $ | 17.74 | | | $ | 14.53 | | | $ | 11.74 | | | $ | 11.78 | | | $ | 11.02 | | |
Income from investment operations: | |
Net investment income (loss) | | | 0.29 | (h) | | | (0.01 | ) | | | (0.00 | )(b) | | | 0.01 | | | | (0.03 | ) | | | (0.05 | ) | |
Net realized and unrealized gain (loss) | | | (0.05 | ) | | | 3.98 | | | | 3.24 | | | | 3.09 | | | | (0.01 | ) | | | 0.81 | | |
Total from investment operations | | | 0.24 | | | | 3.97 | | | | 3.24 | | | | 3.10 | | | | (0.04 | ) | | | 0.76 | | |
Less distributions to shareholders: | |
Net investment income | | | — | | | | — | | | | (0.01 | ) | | | — | | | | — | | | | — | | |
Net realized gains | | | (1.42 | ) | | | (1.13 | ) | | | (0.02 | ) | | | (0.31 | ) | | | — | | | | — | | |
Total distributions to shareholders | | | (1.42 | ) | | | (1.13 | ) | | | (0.03 | ) | | | (0.31 | ) | | | — | | | | — | | |
Net asset value, end of period | | $ | 19.40 | | | $ | 20.58 | | | $ | 17.74 | | | $ | 14.53 | | | $ | 11.74 | | | $ | 11.78 | | |
Total return | | | 1.22 | % | | | 23.20 | % | | | 22.32 | % | | | 26.72 | % | | | (0.34 | %) | | | 6.90 | % | |
Ratios to average net assets(c) | |
Total gross expenses | | | 1.84 | % | | | 1.86 | % | | | 1.90 | % | | | 1.94 | %(d) | | | 1.92 | %(e) | | | 2.00 | % | |
Total net expenses(f) | | | 1.84 | %(g) | | | 1.86 | %(g) | | | 1.89 | %(g) | | | 1.91 | %(d)(g) | | | 1.90 | %(e)(g) | | | 1.94 | %(g) | |
Net investment income (loss) | | | 1.40 | % | | | (0.08 | %) | | | (0.02 | %) | | | 0.05 | %(d) | | | (0.19 | %) | | | (0.46 | %) | |
Supplemental data | |
Net assets, end of period (in thousands) | | $ | 9,551 | | | $ | 14,023 | | | $ | 16,396 | | | $ | 17,292 | | | $ | 21,560 | | | $ | 3,991 | | |
Portfolio turnover | | | 60 | % | | | 65 | % | | | 47 | % | | | 62 | % | | | 78 | % | | | 94 | % | |
Notes to Financial Highlights
(a) For the period from October 1, 2011 to August 31, 2012. During the period, the Fund's fiscal year end was changed from September 30 to August 31.
(b) Rounds to zero.
(c) In addition to the fees and expenses that the Fund bears directly, the Fund indirectly bears a pro rata share of the fees and expenses of any other funds in which it invests. Such indirect expenses are not included in the Fund's reported expense ratios.
(d) Annualized.
(e) Ratios include line of credit interest expense which is less than 0.01%.
(f) Total net expenses include the impact of certain fee waivers/expense reimbursements made by the Investment Manager and certain of its affiliates, if applicable.
(g) The benefits derived from expense reductions had an impact of less than 0.01%.
(h) Net investment income per share includes special dividends. The effect of these dividends amounted to $0.35 per share.
The accompanying Notes to Financial Statements are an integral part of this statement.
Annual Report 2015
20
COLUMBIA CONTRARIAN CORE FUND
FINANCIAL HIGHLIGHTS (continued)
| | | Year Ended August 31, | | Year Ended
September 30, | |
Class C | | 2015 | | 2014 | | 2013 | | 2012(a) | | 2011 | | 2010 | |
Per share data | |
Net asset value, beginning of period | | $ | 20.62 | | | $ | 17.77 | | | $ | 14.55 | | | $ | 11.76 | | | $ | 11.80 | | | $ | 11.03 | | |
Income from investment operations: | |
Net investment income (loss) | | | 0.50 | (h) | | | (0.01 | ) | | | (0.00 | )(b) | | | 0.01 | | | | (0.03 | ) | | | (0.05 | ) | |
Net realized and unrealized gain (loss) | | | (0.27 | ) | | | 3.99 | | | | 3.25 | | | | 3.09 | | | | (0.01 | ) | | | 0.82 | | |
Total from investment operations | | | 0.23 | | | | 3.98 | | | | 3.25 | | | | 3.10 | | | | (0.04 | ) | | | 0.77 | | |
Less distributions to shareholders: | |
Net investment income | | | — | | | | — | | | | (0.01 | ) | | | — | | | | — | | | | — | | |
Net realized gains | | | (1.42 | ) | | | (1.13 | ) | | | (0.02 | ) | | | (0.31 | ) | | | — | | | | — | | |
Total distributions to shareholders | | | (1.42 | ) | | | (1.13 | ) | | | (0.03 | ) | | | (0.31 | ) | | | — | | | | — | | |
Net asset value, end of period | | $ | 19.43 | | | $ | 20.62 | | | $ | 17.77 | | | $ | 14.55 | | | $ | 11.76 | | | $ | 11.80 | | |
Total return | | | 1.17 | % | | | 23.22 | % | | | 22.36 | % | | | 26.68 | % | | | (0.34 | %) | | | 6.98 | % | |
Ratios to average net assets(c) | |
Total gross expenses | | | 1.85 | % | | | 1.86 | % | | | 1.90 | % | | | 1.94 | %(d) | | | 1.95 | %(e) | | | 2.00 | % | |
Total net expenses(f) | | | 1.85 | %(g) | | | 1.86 | %(g) | | | 1.89 | %(g) | | | 1.91 | %(d)(g) | | | 1.92 | %(e)(g) | | | 1.94 | %(g) | |
Net investment income (loss) | | | 2.46 | % | | | (0.06 | %) | | | (0.02 | %) | | | 0.07 | %(d) | | | (0.22 | %) | | | (0.44 | %) | |
Supplemental data | |
Net assets, end of period (in thousands) | | $ | 409,798 | | | $ | 222,834 | | | $ | 115,940 | | | $ | 58,257 | | | $ | 36,559 | | | $ | 18,368 | | |
Portfolio turnover | | | 60 | % | | | 65 | % | | | 47 | % | | | 62 | % | | | 78 | % | | | 94 | % | |
Notes to Financial Highlights
(a) For the period from October 1, 2011 to August 31, 2012. During the period, the Fund's fiscal year end was changed from September 30 to August 31.
(b) Rounds to zero.
(c) In addition to the fees and expenses that the Fund bears directly, the Fund indirectly bears a pro rata share of the fees and expenses of any other funds in which it invests. Such indirect expenses are not included in the Fund's reported expense ratios.
(d) Annualized.
(e) Ratios include line of credit interest expense which is less than 0.01%.
(f) Total net expenses include the impact of certain fee waivers/expense reimbursements made by the Investment Manager and certain of its affiliates, if applicable.
(g) The benefits derived from expense reductions had an impact of less than 0.01%.
(h) Net investment income per share includes special dividends. The effect of these dividends amounted to $0.55 per share.
The accompanying Notes to Financial Statements are an integral part of this statement.
Annual Report 2015
21
COLUMBIA CONTRARIAN CORE FUND
FINANCIAL HIGHLIGHTS (continued)
| | | Year Ended August 31, | | Year Ended
September 30, | |
Class I | | 2015 | | 2014 | | 2013 | | 2012(a) | | 2011 | | 2010(b) | |
Per share data | |
Net asset value, beginning of period | | $ | 22.53 | | | $ | 19.27 | | | $ | 15.78 | | | $ | 12.71 | | | $ | 12.69 | | | $ | 12.70 | | |
Income from investment operations: | |
Net investment income | | | 0.57 | (h) | | | 0.23 | | | | 0.21 | | | | 0.17 | | | | 0.14 | | | | 0.01 | | |
Net realized and unrealized gain (loss) | | | (0.06 | ) | | | 4.35 | | | | 3.49 | | | | 3.34 | | | | (0.03 | ) | | | (0.02 | ) | |
Total from investment operations | | | 0.51 | | | | 4.58 | | | | 3.70 | | | | 3.51 | | | | 0.11 | | | | (0.01 | ) | |
Less distributions to shareholders: | |
Net investment income | | | (0.19 | ) | | | (0.19 | ) | | | (0.19 | ) | | | (0.13 | ) | | | (0.09 | ) | | | — | | |
Net realized gains | | | (1.42 | ) | | | (1.13 | ) | | | (0.02 | ) | | | (0.31 | ) | | | — | | | | — | | |
Total distributions to shareholders | | | (1.61 | ) | | | (1.32 | ) | | | (0.21 | ) | | | (0.44 | ) | | | (0.09 | ) | | | — | | |
Net asset value, end of period | | $ | 21.43 | | | $ | 22.53 | | | $ | 19.27 | | | $ | 15.78 | | | $ | 12.71 | | | $ | 12.69 | | |
Total return | | | 2.42 | % | | | 24.71 | % | | | 23.73 | % | | | 28.12 | % | | | 0.81 | % | | | (0.08 | %) | |
Ratios to average net assets(c) | |
Total gross expenses | | | 0.65 | % | | | 0.68 | % | | | 0.70 | % | | | 0.75 | %(d) | | | 0.76 | %(e) | | | 0.85 | %(d) | |
Total net expenses(f) | | | 0.65 | % | | | 0.68 | % | | | 0.70 | % | | | 0.75 | %(d) | | | 0.76 | %(e)(g) | | | 0.85 | %(d)(g) | |
Net investment income | | | 2.55 | % | | | 1.12 | % | | | 1.17 | % | | | 1.24 | %(d) | | | 0.99 | % | | | 4.99 | %(d) | |
Supplemental data | |
Net assets, end of period (in thousands) | | $ | 425,921 | | | $ | 490,451 | | | $ | 424,376 | | | $ | 385,802 | | | $ | 280,304 | | | $ | 2 | | |
Portfolio turnover | | | 60 | % | | | 65 | % | | | 47 | % | | | 62 | % | | | 78 | % | | | 94 | % | |
Notes to Financial Highlights
(a) For the period from October 1, 2011 to August 31, 2012. During the period, the Fund's fiscal year end was changed from September 30 to August 31.
(b) Based on operations from September 27, 2010 (commencement of operations) through the stated period end.
(c) In addition to the fees and expenses that the Fund bears directly, the Fund indirectly bears a pro rata share of the fees and expenses of any other funds in which it invests. Such indirect expenses are not included in the Fund's reported expense ratios.
(d) Annualized.
(e) Ratios include line of credit interest expense which is less than 0.01%.
(f) Total net expenses include the impact of certain fee waivers/expense reimbursements made by the Investment Manager and certain of its affiliates, if applicable.
(g) The benefits derived from expense reductions had an impact of less than 0.01%.
(h) Net investment income per share includes special dividends. The effect of these dividends amounted to $0.37 per share.
The accompanying Notes to Financial Statements are an integral part of this statement.
Annual Report 2015
22
COLUMBIA CONTRARIAN CORE FUND
FINANCIAL HIGHLIGHTS (continued)
| | | Year Ended August 31, | | Year Ended
September 30, | |
Class K | | 2015 | | 2014 | | 2013 | | 2012(a) | | 2011(b) | |
Per share data | |
Net asset value, beginning of period | | $ | 22.50 | | | $ | 19.26 | | | $ | 15.77 | | | $ | 12.70 | | | $ | 14.93 | | |
Income from investment operations: | |
Net investment income | | | 0.61 | (h) | | | 0.17 | | | | 0.15 | | | | 0.13 | | | | 0.06 | | |
Net realized and unrealized gain (loss) | | | (0.16 | ) | | | 4.33 | | | | 3.51 | | | | 3.34 | | | | (2.29 | ) | |
Total from investment operations | | | 0.45 | | | | 4.50 | | | | 3.66 | | | | 3.47 | | | | (2.23 | ) | |
Less distributions to shareholders: | |
Net investment income | | | (0.13 | ) | | | (0.13 | ) | | | (0.15 | ) | | | (0.09 | ) | | | — | | |
Net realized gains | | | (1.42 | ) | | | (1.13 | ) | | | (0.02 | ) | | | (0.31 | ) | | | — | | |
Total distributions to shareholders | | | (1.55 | ) | | | (1.26 | ) | | | (0.17 | ) | | | (0.40 | ) | | | — | | |
Net asset value, end of period | | $ | 21.40 | | | $ | 22.50 | | | $ | 19.26 | | | $ | 15.77 | | | $ | 12.70 | | |
Total return | | | 2.12 | % | | | 24.27 | % | | | 23.40 | % | | | 27.74 | % | | | (14.94 | %) | |
Ratios to average net assets(c) | |
Total gross expenses | | | 0.96 | % | | | 0.97 | % | | | 1.00 | % | | | 1.05 | %(d) | | | 1.05 | %(d)(e) | |
Total net expenses(f) | | | 0.96 | % | | | 0.97 | % | | | 1.00 | % | | | 1.05 | %(d) | | | 1.05 | %(d)(e)(g) | |
Net investment income | | | 2.73 | % | | | 0.81 | % | | | 0.87 | % | | | 0.93 | %(d) | | | 0.72 | %(d) | |
Supplemental data | |
Net assets, end of period (in thousands) | | $ | 115 | | | $ | 113 | | | $ | 144 | | | $ | 117 | | | $ | 100 | | |
Portfolio turnover | | | 60 | % | | | 65 | % | | | 47 | % | | | 62 | % | | | 78 | % | |
Notes to Financial Highlights
(a) For the period from October 1, 2011 to August 31, 2012. During the period, the Fund's fiscal year end was changed from September 30 to August 31.
(b) Based on operations from March 7, 2011 (commencement of operations) through the stated period end.
(c) In addition to the fees and expenses that the Fund bears directly, the Fund indirectly bears a pro rata share of the fees and expenses of any other funds in which it invests. Such indirect expenses are not included in the Fund's reported expense ratios.
(d) Annualized.
(e) Ratios include line of credit interest expense which is less than 0.01%.
(f) Total net expenses include the impact of certain fee waivers/expense reimbursements made by the Investment Manager and certain of its affiliates, if applicable.
(g) The benefits derived from expense reductions had an impact of less than 0.01%.
(h) Net investment income per share includes special dividends. The effect of these dividends amounted to $0.47 per share.
The accompanying Notes to Financial Statements are an integral part of this statement.
Annual Report 2015
23
COLUMBIA CONTRARIAN CORE FUND
FINANCIAL HIGHLIGHTS (continued)
| | | Year Ended August 31, | | Year Ended
September 30, | |
Class R | | 2015 | | 2014 | | 2013 | | 2012(a) | | 2011 | | 2010(b) | |
Per share data | |
Net asset value, beginning of period | | $ | 22.37 | | | $ | 19.15 | | | $ | 15.68 | | | $ | 12.63 | | | $ | 12.61 | | | $ | 12.62 | | |
Income from investment operations: | |
Net investment income | | | 0.65 | (i) | | | 0.09 | | | | 0.08 | | | | 0.08 | | | | 0.05 | | | | 0.00 | (c) | |
Net realized and unrealized gain (loss) | | | (0.29 | ) | | | 4.32 | | | | 3.49 | | | | 3.32 | | | | (0.03 | ) | | | (0.01 | ) | |
Total from investment operations | | | 0.36 | | | | 4.41 | | | | 3.57 | | | | 3.40 | | | | 0.02 | | | | (0.01 | ) | |
Less distributions to shareholders: | |
Net investment income | | | (0.05 | ) | | | (0.06 | ) | | | (0.08 | ) | | | (0.04 | ) | | | — | | | | — | | |
Net realized gains | | | (1.42 | ) | | | (1.13 | ) | | | (0.02 | ) | | | (0.31 | ) | | | — | | | | — | | |
Total distributions to shareholders | | | (1.47 | ) | | | (1.19 | ) | | | (0.10 | ) | | | (0.35 | ) | | | — | | | | — | | |
Net asset value, end of period | | $ | 21.26 | | | $ | 22.37 | | | $ | 19.15 | | | $ | 15.68 | | | $ | 12.63 | | | $ | 12.61 | | |
Total return | | | 1.69 | % | | | 23.86 | % | | | 22.93 | % | | | 27.34 | % | | | 0.16 | % | | | (0.08 | %) | |
Ratios to average net assets(d) | |
Total gross expenses | | | 1.34 | % | | | 1.36 | % | | | 1.39 | % | | | 1.42 | %(e) | | | 1.44 | %(f) | | | 1.44 | %(e) | |
Total net expenses(g) | | | 1.34 | %(h) | | | 1.36 | %(h) | | | 1.39 | %(h) | | | 1.41 | %(e)(h) | | | 1.39 | %(f)(h) | | | 1.44 | %(e)(h) | |
Net investment income | | | 2.93 | % | | | 0.44 | % | | | 0.46 | % | | | 0.59 | %(e) | | | 0.32 | % | | | 4.34 | %(e) | |
Supplemental data | |
Net assets, end of period (in thousands) | | $ | 50,048 | | | $ | 30,291 | | | $ | 13,102 | | | $ | 4,489 | | | $ | 6 | | | $ | 2 | | |
Portfolio turnover | | | 60 | % | | | 65 | % | | | 47 | % | | | 62 | % | | | 78 | % | | | 94 | % | |
Notes to Financial Highlights
(a) For the period from October 1, 2011 to August 31, 2012. During the period, the Fund's fiscal year end was changed from September 30 to August 31.
(b) Based on operations from September 27, 2010 (commencement of operations) through the stated period end.
(c) Rounds to zero.
(d) In addition to the fees and expenses that the Fund bears directly, the Fund indirectly bears a pro rata share of the fees and expenses of any other funds in which it invests. Such indirect expenses are not included in the Fund's reported expense ratios.
(e) Annualized.
(f) Ratios include line of credit interest expense which is less than 0.01%.
(g) Total net expenses include the impact of certain fee waivers/expense reimbursements made by the Investment Manager and certain of its affiliates, if applicable.
(h) The benefits derived from expense reductions had an impact of less than 0.01%.
(i) Net investment income per share includes special dividends. The effect of these dividends amounted to $0.60 per share.
The accompanying Notes to Financial Statements are an integral part of this statement.
Annual Report 2015
24
COLUMBIA CONTRARIAN CORE FUND
FINANCIAL HIGHLIGHTS (continued)
| | | Year Ended August 31, | |
Class R4 | | 2015 | | 2014 | | 2013(a) | |
Per share data | |
Net asset value, beginning of period | | $ | 22.83 | | | $ | 19.52 | | | $ | 15.84 | | |
Income from investment operations: | |
Net investment income | | | 0.80 | (f) | | | 0.20 | | | | 0.16 | | |
Net realized and unrealized gain (loss) | | | (0.32 | ) | | | 4.40 | | | | 3.70 | | |
Total from investment operations | | | 0.48 | | | | 4.60 | | | | 3.86 | | |
Less distributions to shareholders: | |
Net investment income | | | (0.15 | ) | | | (0.16 | ) | | | (0.16 | ) | |
Net realized gains | | | (1.42 | ) | | | (1.13 | ) | | | (0.02 | ) | |
Total distributions to shareholders | | | (1.57 | ) | | | (1.29 | ) | | | (0.18 | ) | |
Net asset value, end of period | | $ | 21.74 | | | $ | 22.83 | | | $ | 19.52 | | |
Total return | | | 2.25 | % | | | 24.44 | % | | | 24.61 | % | |
Ratios to average net assets(b) | |
Total gross expenses | | | 0.85 | % | | | 0.86 | % | | | 0.89 | %(c) | |
Total net expenses(d) | | | 0.85 | %(e) | | | 0.86 | %(e) | | | 0.89 | %(c)(e) | |
Net investment income | | | 3.53 | % | | | 0.94 | % | | | 1.04 | %(c) | |
Supplemental data | |
Net assets, end of period (in thousands) | | $ | 227,941 | | | $ | 105,458 | | | $ | 46,212 | | |
Portfolio turnover | | | 60 | % | | | 65 | % | | | 47 | % | |
Notes to Financial Highlights
(a) Based on operations from November 8, 2012 (commencement of operations) through the stated period end.
(b) In addition to the fees and expenses that the Fund bears directly, the Fund indirectly bears a pro rata share of the fees and expenses of any other funds in which it invests. Such indirect expenses are not included in the Fund's reported expense ratios.
(c) Annualized.
(d) Total net expenses include the impact of certain fee waivers/expense reimbursements made by the Investment Manager and certain of its affiliates, if applicable.
(e) The benefits derived from expense reductions had an impact of less than 0.01%.
(f) Net investment income per share includes special dividends. The effect of these dividends amounted to $0.63 per share.
The accompanying Notes to Financial Statements are an integral part of this statement.
Annual Report 2015
25
COLUMBIA CONTRARIAN CORE FUND
FINANCIAL HIGHLIGHTS (continued)
| | | Year Ended August 31, | |
Class R5 | | 2015 | | 2014 | | 2013(a) | |
Per share data | |
Net asset value, beginning of period | | $ | 22.83 | | | $ | 19.52 | | | $ | 15.84 | | |
Income from investment operations: | |
Net investment income | | | 0.78 | (e) | | | 0.23 | | | | 0.15 | | |
Net realized and unrealized gain (loss) | | | (0.28 | ) | | | 4.39 | | | | 3.73 | | |
Total from investment operations | | | 0.50 | | | | 4.62 | | | | 3.88 | | |
Less distributions to shareholders: | |
Net investment income | | | (0.18 | ) | | | (0.18 | ) | | | (0.18 | ) | |
Net realized gains | | | (1.42 | ) | | | (1.13 | ) | | | (0.02 | ) | |
Total distributions to shareholders | | | (1.60 | ) | | | (1.31 | ) | | | (0.20 | ) | |
Net asset value, end of period | | $ | 21.73 | | | $ | 22.83 | | | $ | 19.52 | | |
Total return | | | 2.34 | % | | | 24.60 | % | | | 24.75 | % | |
Ratios to average net assets(b) | |
Total gross expenses | | | 0.71 | % | | | 0.73 | % | | | 0.75 | %(c) | |
Total net expenses(d) | | | 0.71 | % | | | 0.73 | % | | | 0.75 | %(c) | |
Net investment income | | | 3.45 | % | | | 1.08 | % | | | 1.01 | %(c) | |
Supplemental data | |
Net assets, end of period (in thousands) | | $ | 336,043 | | | $ | 209,498 | | | $ | 68,709 | | |
Portfolio turnover | | | 60 | % | | | 65 | % | | | 47 | % | |
Notes to Financial Highlights
(a) Based on operations from November 8, 2012 (commencement of operations) through the stated period end.
(b) In addition to the fees and expenses that the Fund bears directly, the Fund indirectly bears a pro rata share of the fees and expenses of any other funds in which it invests. Such indirect expenses are not included in the Fund's reported expense ratios.
(c) Annualized.
(d) Total net expenses include the impact of certain fee waivers/expense reimbursements made by the Investment Manager and certain of its affiliates, if applicable.
(e) Net investment income per share includes special dividends. The effect of these dividends amounted to $0.58 per share.
The accompanying Notes to Financial Statements are an integral part of this statement.
Annual Report 2015
26
COLUMBIA CONTRARIAN CORE FUND
FINANCIAL HIGHLIGHTS (continued)
| | | Year Ended August 31, | | Year Ended
September 30, | |
Class T | | 2015 | | 2014 | | 2013 | | 2012(a) | | 2011 | | 2010 | |
Per share data | |
Net asset value, beginning of period | | $ | 22.19 | | | $ | 19.01 | | | $ | 15.56 | | | $ | 12.54 | | | $ | 12.51 | | | $ | 11.67 | | |
Income from investment operations: | |
Net investment income | | | 0.55 | (g) | | | 0.13 | | | | 0.12 | | | | 0.10 | | | | 0.06 | | | | 0.03 | | |
Net realized and unrealized gain (loss) | | | (0.15 | ) | | | 4.28 | | | | 3.47 | | | | 3.29 | | | | — | | | | 0.86 | | |
Total from investment operations | | | 0.40 | | | | 4.41 | | | | 3.59 | | | | 3.39 | | | | 0.06 | | | | 0.89 | | |
Less distributions to shareholders: | |
Net investment income | | | (0.09 | ) | | | (0.10 | ) | | | (0.12 | ) | | | (0.06 | ) | | | (0.03 | ) | | | (0.05 | ) | |
Net realized gains | | | (1.42 | ) | | | (1.13 | ) | | | (0.02 | ) | | | (0.31 | ) | | | — | | | | — | | |
Total distributions to shareholders | | | (1.51 | ) | | | (1.23 | ) | | | (0.14 | ) | | | (0.37 | ) | | | (0.03 | ) | | | (0.05 | ) | |
Net asset value, end of period | | $ | 21.08 | | | $ | 22.19 | | | $ | 19.01 | | | $ | 15.56 | | | $ | 12.54 | | | $ | 12.51 | | |
Total return | | | 1.92 | % | | | 24.06 | % | | | 23.22 | % | | | 27.49 | % | | | 0.43 | % | | | 7.68 | % | |
Ratios to average net assets(b) | |
Total gross expenses | | | 1.11 | % | | | 1.16 | % | | | 1.20 | % | | | 1.24 | %(c) | | | 1.26 | %(d) | | | 1.30 | % | |
Total net expenses(e) | | | 1.11 | %(f) | | | 1.16 | %(f) | | | 1.19 | %(f) | | | 1.21 | %(c)(f) | | | 1.21 | %(d)(f) | | | 1.24 | %(f) | |
Net investment income | | | 2.49 | % | | | 0.63 | % | | | 0.68 | % | | | 0.77 | %(c) | | | 0.44 | % | | | 0.24 | % | |
Supplemental data | |
Net assets, end of period (in thousands) | | $ | 143,304 | | | $ | 151,430 | | | $ | 131,732 | | | $ | 117,457 | | | $ | 100,805 | | | $ | 112,862 | | |
Portfolio turnover | | | 60 | % | | | 65 | % | | | 47 | % | | | 62 | % | | | 78 | % | | | 94 | % | |
Notes to Financial Highlights
(a) For the period from October 1, 2011 to August 31, 2012. During the period, the Fund's fiscal year end was changed from September 30 to August 31.
(b) In addition to the fees and expenses that the Fund bears directly, the Fund indirectly bears a pro rata share of the fees and expenses of any other funds in which it invests. Such indirect expenses are not included in the Fund's reported expense ratios.
(c) Annualized.
(d) Ratios include line of credit interest expense which is less than 0.01%.
(e) Total net expenses include the impact of certain fee waivers/expense reimbursements made by the Investment Manager and certain of its affiliates, if applicable.
(f) The benefits derived from expense reductions had an impact of less than 0.01%.
(g) Net investment income per share includes special dividends. The effect of these dividends amounted to $0.45 per share.
The accompanying Notes to Financial Statements are an integral part of this statement.
Annual Report 2015
27
COLUMBIA CONTRARIAN CORE FUND
FINANCIAL HIGHLIGHTS (continued)
| | | Year Ended August 31, | | Year Ended
September 30, | |
Class W | | 2015 | | 2014 | | 2013 | | 2012(a) | | 2011 | | 2010(b) | |
Per share data | |
Net asset value, beginning of period | | $ | 22.38 | | | $ | 19.16 | | | $ | 15.69 | | | $ | 12.64 | | | $ | 12.61 | | | $ | 12.62 | | |
Income from investment operations: | |
Net investment income | | | 0.50 | (i) | | | 0.14 | | | | 0.13 | | | | 0.11 | | | | 0.08 | | | | 0.00 | (c) | |
Net realized and unrealized gain (loss) | | | (0.09 | ) | | | 4.32 | | | | 3.48 | | | | 3.32 | | | | (0.02 | ) | | | (0.01 | ) | |
Total from investment operations | | | 0.41 | | | | 4.46 | | | | 3.61 | | | | 3.43 | | | | 0.06 | | | | (0.01 | ) | |
Less distributions to shareholders: | |
Net investment income | | | (0.10 | ) | | | (0.11 | ) | | | (0.12 | ) | | | (0.07 | ) | | | (0.03 | ) | | | — | | |
Net realized gains | | | (1.42 | ) | | | (1.13 | ) | | | (0.02 | ) | | | (0.31 | ) | | | — | | | | — | | |
Total distributions to shareholders | | | (1.52 | ) | | | (1.24 | ) | | | (0.14 | ) | | | (0.38 | ) | | | (0.03 | ) | | | — | | |
Net asset value, end of period | | $ | 21.27 | | | $ | 22.38 | | | $ | 19.16 | | | $ | 15.69 | | | $ | 12.64 | | | $ | 12.61 | | |
Total return | | | 1.95 | % | | | 24.15 | % | | | 23.21 | % | | | 27.57 | % | | | 0.47 | % | | | (0.08 | %) | |
Ratios to average net assets(d) | |
Total gross expenses | | | 1.09 | % | | | 1.10 | % | | | 1.14 | % | | | 1.19 | %(e) | | | 1.20 | %(f) | | | 1.19 | %(e) | |
Total net expenses(g) | | | 1.09 | %(h) | | | 1.10 | %(h) | | | 1.14 | %(h) | | | 1.16 | %(e)(h) | | | 1.16 | %(f)(h) | | | 1.19 | %(e)(h) | |
Net investment income | | | 2.26 | % | | | 0.67 | % | | | 0.73 | % | | | 0.83 | %(e) | | | 0.54 | % | | | 4.64 | %(e) | |
Supplemental data | |
Net assets, end of period (in thousands) | | $ | 118,262 | | | $ | 124,021 | | | $ | 254,377 | | | $ | 106,075 | | | $ | 74,302 | | | $ | 2 | | |
Portfolio turnover | | | 60 | % | | | 65 | % | | | 47 | % | | | 62 | % | | | 78 | % | | | 94 | % | |
Notes to Financial Highlights
(a) For the period from October 1, 2011 to August 31, 2012. During the period, the Fund's fiscal year end was changed from September 30 to August 31.
(b) Based on operations from September 27, 2010 (commencement of operations) through the stated period end.
(c) Rounds to zero.
(d) In addition to the fees and expenses that the Fund bears directly, the Fund indirectly bears a pro rata share of the fees and expenses of any other funds in which it invests. Such indirect expenses are not included in the Fund's reported expense ratios.
(e) Annualized.
(f) Ratios include line of credit interest expense which is less than 0.01%.
(g) Total net expenses include the impact of certain fee waivers/expense reimbursements made by the Investment Manager and certain of its affiliates, if applicable.
(h) The benefits derived from expense reductions had an impact of less than 0.01%.
(i) Net investment income per share includes special dividends. The effect of these dividends amounted to $0.40 per share.
The accompanying Notes to Financial Statements are an integral part of this statement.
Annual Report 2015
28
COLUMBIA CONTRARIAN CORE FUND
FINANCIAL HIGHLIGHTS (continued)
| | | Year Ended August 31, | |
Class Y | | 2015 | | 2014 | | 2013(a) | |
Per share data | |
Net asset value, beginning of period | | $ | 22.84 | | | $ | 19.52 | | | $ | 15.84 | | |
Income from investment operations: | |
Net investment income | | | 1.19 | (e) | | | 0.24 | | | | 0.24 | | |
Net realized and unrealized gain (loss) | | | (0.67 | ) | | | 4.40 | | | | 3.64 | | |
Total from investment operations | | | 0.52 | | | | 4.64 | | | | 3.88 | | |
Less distributions to shareholders: | |
Net investment income | | | (0.19 | ) | | | (0.19 | ) | | | (0.18 | ) | |
Net realized gains | | | (1.42 | ) | | | (1.13 | ) | | | (0.02 | ) | |
Total distributions to shareholders | | | (1.61 | ) | | | (1.32 | ) | | | (0.20 | ) | |
Net asset value, end of period | | $ | 21.75 | | | $ | 22.84 | | | $ | 19.52 | | |
Total return | | | 2.44 | % | | | 24.71 | % | | | 24.79 | % | |
Ratios to average net assets(b) | |
Total gross expenses | | | 0.66 | % | | | 0.68 | % | | | 0.72 | %(c) | |
Total net expenses(d) | | | 0.66 | % | | | 0.68 | % | | | 0.72 | %(c) | |
Net investment income | | | 5.26 | % | | | 1.12 | % | | | 1.60 | %(c) | |
Supplemental data | |
Net assets, end of period (in thousands) | | $ | 53,246 | | | $ | 2,514 | | | $ | 79 | | |
Portfolio turnover | | | 60 | % | | | 65 | % | | | 47 | % | |
Notes to Financial Highlights
(a) Based on operations from November 8, 2012 (commencement of operations) through the stated period end.
(b) In addition to the fees and expenses that the Fund bears directly, the Fund indirectly bears a pro rata share of the fees and expenses of any other funds in which it invests. Such indirect expenses are not included in the Fund's reported expense ratios.
(c) Annualized.
(d) Total net expenses include the impact of certain fee waivers/expense reimbursements made by the Investment Manager and certain of its affiliates, if applicable.
(e) Net investment income per share includes special dividends. The effect of these dividends amounted to $0.96 per share.
The accompanying Notes to Financial Statements are an integral part of this statement.
Annual Report 2015
29
COLUMBIA CONTRARIAN CORE FUND
FINANCIAL HIGHLIGHTS (continued)
| | | Year Ended August 31, | | Year Ended
September 30, | |
Class Z | | 2015 | | 2014 | | 2013 | | 2012(a) | | 2011 | | 2010 | |
Per share data | |
Net asset value, beginning of period | | $ | 22.52 | | | $ | 19.27 | | | $ | 15.78 | | | $ | 12.71 | | | $ | 12.68 | | | $ | 11.83 | | |
Income from investment operations: | |
Net investment income | | | 0.66 | (g) | | | 0.19 | | | | 0.17 | | | | 0.15 | | | | 0.11 | | | | 0.07 | | |
Net realized and unrealized gain (loss) | | | (0.18 | ) | | | 4.35 | | | | 3.50 | | | | 3.34 | | | | (0.01 | ) | | | 0.86 | | |
Total from investment operations | | | 0.48 | | | | 4.54 | | | | 3.67 | | | | 3.49 | | | | 0.10 | | | | 0.93 | | |
Less distributions to shareholders: | |
Net investment income | | | (0.16 | ) | | | (0.16 | ) | | | (0.16 | ) | | | (0.11 | ) | | | (0.07 | ) | | | (0.08 | ) | |
Net realized gains | | | (1.42 | ) | | | (1.13 | ) | | | (0.02 | ) | | | (0.31 | ) | | | — | | | | — | | |
Total distributions to shareholders | | | (1.58 | ) | | | (1.29 | ) | | | (0.18 | ) | | | (0.42 | ) | | | (0.07 | ) | | | (0.08 | ) | |
Net asset value, end of period | | $ | 21.42 | | | $ | 22.52 | | | $ | 19.27 | | | $ | 15.78 | | | $ | 12.71 | | | $ | 12.68 | | |
Total return | | | 2.24 | % | | | 24.45 | % | | | 23.50 | % | | | 27.91 | % | | | 0.72 | % | | | 7.93 | % | |
Ratios to average net assets(b) | |
Total gross expenses | | | 0.84 | % | | | 0.86 | % | | | 0.90 | % | | | 0.94 | %(c) | | | 0.96 | %(d) | | | 1.00 | % | |
Total net expenses(e) | | | 0.84 | %(f) | | | 0.86 | %(f) | | | 0.89 | %(f) | | | 0.91 | %(c)(f) | | | 0.91 | %(d)(f) | | | 0.94 | %(f) | |
Net investment income | | | 2.97 | % | | | 0.93 | % | | | 0.98 | % | | | 1.08 | %(c) | | | 0.76 | % | | | 0.54 | % | |
Supplemental data | |
Net assets, end of period (in thousands) | | $ | 2,119,278 | | | $ | 1,831,114 | | | $ | 1,315,874 | | | $ | 819,630 | | | $ | 494,107 | | | $ | 344,081 | | |
Portfolio turnover | | | 60 | % | | | 65 | % | | | 47 | % | | | 62 | % | | | 78 | % | | | 94 | % | |
Notes to Financial Highlights
(a) For the period from October 1, 2011 to August 31, 2012. During the period, the Fund's fiscal year end was changed from September 30 to August 31.
(b) In addition to the fees and expenses that the Fund bears directly, the Fund indirectly bears a pro rata share of the fees and expenses of any other funds in which it invests. Such indirect expenses are not included in the Fund's reported expense ratios.
(c) Annualized.
(d) Ratios include line of credit interest expense which is less than 0.01%.
(e) Total net expenses include the impact of certain fee waivers/expense reimbursements made by the Investment Manager and certain of its affiliates, if applicable.
(f) The benefits derived from expense reductions had an impact of less than 0.01%.
(g) Net investment income per share includes special dividends. The effect of these dividends amounted to $0.50 per share.
The accompanying Notes to Financial Statements are an integral part of this statement.
Annual Report 2015
30
COLUMBIA CONTRARIAN CORE FUND
NOTES TO FINANCIAL STATEMENTS
August 31, 2015
Note 1. Organization
Columbia Contrarian Core Fund (the Fund), a series of Columbia Funds Series Trust I (the Trust), is a diversified fund. The Trust is registered under the Investment Company Act of 1940, as amended (the 1940 Act), as an open-end management investment company organized as a Massachusetts business trust.
Fund Shares
The Trust may issue an unlimited number of shares (without par value). The Fund offers Class A, Class B, Class C, Class I, Class K, Class R, Class R4, Class R5, Class T, Class W, Class Y and Class Z shares. Although all share classes generally have identical voting, dividend and liquidation rights, each share class votes separately when required by the Trust's organizational documents or by law. Different share classes pay different distribution amounts to the extent the expenses of such share classes differ, and distributions in liquidation will be proportional to the net asset value of each share class. Each share class has its own expense and sales charge structure.
Class A shares are subject to a maximum front-end sales charge of 5.75% based on the initial investment amount. Class A shares purchased without an initial sales charge in accounts aggregating $1 million to $50 million at the time of purchase are subject to a contingent deferred sales charge (CDSC) if the shares are sold within 18 months after purchase, charged as follows: 1.00% CDSC if redeemed within 12 months after purchase, and 0.50% CDSC if redeemed more than 12, but less than 18, months after purchase.
Class B shares may be subject to a maximum CDSC of 5.00% based upon the holding period after purchase. Class B shares will generally convert to Class A shares eight years after purchase. The Fund no longer accepts investments by new or existing investors in the Fund's Class B shares, except in connection with the reinvestment of any dividend and/or capital gain distributions in Class B shares of the Fund and exchanges by existing Class B shareholders of certain other funds within the Columbia Family of Funds.
Class C shares are subject to a 1.00% CDSC on shares redeemed within one year after purchase.
Class I shares are not subject to sales charges and are available only to the Columbia Family of Funds.
Class K shares are not subject to sales charges, however this share class is closed to new investors.
Class R shares are not subject to sales charges and are generally available only to certain retirement plans and other investors as described in the Fund's prospectus.
Class R4 shares are not subject to sales charges and are generally available only to omnibus retirement plans and certain investors as described in the Fund's prospectus.
Class R5 shares are not subject to sales charges and are generally available only to investors purchasing through authorized investment professionals and omnibus retirement plans.
Class T shares are subject to a maximum front-end sales charge of 5.75% based on the investment amount. Class T shares purchased without an initial sales charge in accounts aggregating $1 million to $50 million at the time of purchase are subject to a CDSC if the shares are sold within 18 months after purchase, charged as follows: 1.00% CDSC if redeemed within 12 months after purchase, and 0.50% CDSC if redeemed more than 12, but less than 18, months after purchase. Class T shares are available only to investors who received (and who have continuously held) Class T shares in connection with previous fund reorganizations.
Class W shares are not subject to sales charges and are available only to investors purchasing through authorized investment programs managed by investment professionals, including discretionary managed account programs.
Class Y shares are not subject to sales charges and are generally available only to certain retirement plans as described in the Fund's prospectus.
Class Z shares are not subject to sales charges and are available only to eligible investors, which are subject to different investment minimums as described in the Fund's prospectus.
Note 2. Summary of Significant Accounting Policies
Basis of Preparation
The Fund is an investment company that applies the accounting and reporting guidance in the Financial Accounting Standards Board (FASB) Accounting Standards Codification Topic 946, Financial Services — Investment Companies (ASC 946). The financial statements are prepared in accordance with U.S. generally accepted accounting principles (GAAP), which requires management to make certain estimates and assumptions that affect the reported amounts of assets
Annual Report 2015
31
COLUMBIA CONTRARIAN CORE FUND
NOTES TO FINANCIAL STATEMENTS (continued)
August 31, 2015
and liabilities, the disclosure of contingent assets and liabilities at the date of the financial statements and the reported amounts of income and expenses during the reporting period. Actual results could differ from those estimates.
The following is a summary of significant accounting policies followed by the Fund in the preparation of its financial statements.
Security Valuation
All equity securities are valued at the close of business of the New York Stock Exchange (NYSE). Equity securities are valued at the last quoted sales price on the principal exchange or market on which they trade, except for securities traded on the NASDAQ Stock Market, which are valued at the NASDAQ official close price. Unlisted securities or listed securities for which there were no sales during the day are valued at the mean of the latest quoted bid and ask prices on such exchanges or markets.
Foreign equity securities are valued based on the closing price on the foreign exchange in which such securities are primarily traded. If any foreign equity security closing prices are not readily available, the securities are valued at the mean of the latest quoted bid and ask prices on such exchanges or markets. Foreign currency exchange rates are generally determined at 4:00 p.m. Eastern (U.S.) time. Many securities markets and exchanges outside the U.S. close prior to the close of the NYSE; therefore, the closing prices for securities in such markets or on such exchanges may not fully reflect events that occur after such close but before the close of the NYSE. In those situations, foreign securities will be fair valued pursuant to a policy adopted by the Board of Trustees (the Board), including, if available, utilizing a third party pricing service to determine these fair values. The third party pricing service takes into account multiple factors, including, but not limited to, movements in the U.S. securities markets, certain depositary receipts, futures contracts and foreign exchange rates that have occurred subsequent to the close of the foreign exchange or market, to determine a good faith estimate that reasonably reflects the current market conditions as of the close of the NYSE. The fair value of a security is likely to be different from the quoted or published price, if available.
Investments in open-end investment companies, including money market funds, are valued at their latest net asset value.
Investments for which market quotations are not readily available, or that have quotations which management believes are not reflective of market value or reliable, are valued at fair value as determined in good faith under procedures approved by and under the general supervision of the Board. If a security or class of securities (such as foreign securities) is valued at fair value, such value is likely to be different from the quoted or published price for the security.
The determination of fair value often requires significant judgment. To determine fair value, management may use assumptions including but not limited to future cash flows and estimated risk premiums. Multiple inputs from various sources may be used to determine fair value.
GAAP requires disclosure regarding the inputs and valuation techniques used to measure fair value and any changes in valuation inputs or techniques. In addition, investments shall be disclosed by major category. This information is disclosed following the Fund's Portfolio of Investments.
Foreign Currency Transactions and Translations
The values of all assets and liabilities denominated in foreign currencies are generally translated into U.S. dollars at exchange rates determined at the close of the NYSE. Net realized and unrealized gains (losses) on foreign currency transactions and translations include gains (losses) arising from the fluctuation in exchange rates between trade and settlement dates on securities transactions, gains (losses) arising from the disposition of foreign currency and currency gains (losses) between the accrual and payment dates on dividends, interest income and foreign withholding taxes.
For financial statement purposes, the Fund does not distinguish that portion of gains (losses) on investments which is due to changes in foreign exchange rates from that which is due to changes in market prices of the investments. Such fluctuations are included with the net realized and unrealized gains (losses) on investments in the Statement of Operations.
Security Transactions
Security transactions are accounted for on the trade date. Cost is determined and gains (losses) are based upon the specific identification method for both financial statement and federal income tax purposes.
Income Recognition
Corporate actions and dividend income are generally recorded net of any non-reclaimable tax withholdings, on
Annual Report 2015
32
COLUMBIA CONTRARIAN CORE FUND
NOTES TO FINANCIAL STATEMENTS (continued)
August 31, 2015
the ex-dividend date or upon receipt of ex-dividend notification in the case of certain foreign securities.
The Fund may receive distributions from holdings in equity securities, business development companies (BDCs), exchange-traded funds, other regulated investment companies (RICs), and real estate investment trusts (REITs), which report information on the tax character of their distributions annually. These distributions are allocated to dividend income, capital gain and return of capital based on actual information reported. Return of capital is recorded as a reduction of the cost basis of securities held. If the Fund no longer owns the applicable securities, return of capital is recorded as a realized gain. With respect to REITs, to the extent actual information has not yet been reported, estimates for return of capital are made by the Fund's management. Management's estimates are subsequently adjusted when the actual character of the distributions is disclosed by the REITs, which could result in a proportionate change in return of capital to shareholders.
Awards from class action litigation are recorded as a reduction of cost basis if the Fund still owns the applicable securities on the payment date. If the Fund no longer owns the applicable securities, the proceeds are recorded as realized gains.
Expenses
General expenses of the Trust are allocated to the Fund and other funds of the Trust based upon relative net assets or other expense allocation methodologies determined by the nature of the expense. Expenses directly attributable to the Fund are charged to the Fund. Expenses directly attributable to a specific class of shares are charged to that share class.
Determination of Class Net Asset Value
All income, expenses (other than class-specific expenses, which are charged to that share class, as shown in the Statement of Operations) and realized and unrealized gains (losses) are allocated to each class of the Fund on a daily basis, based on the relative net assets of each class, for purposes of determining the net asset value of each class.
Federal Income Tax Status
The Fund intends to qualify each year as a regulated investment company under Subchapter M of the Internal Revenue Code, as amended, and will distribute substantially all of its taxable income (including net
short-term capital gains), if any, for its tax year, and as such will not be subject to federal income taxes. In addition, the Fund intends to distribute in each calendar year substantially all of its net investment income, capital gains and certain other amounts, if any, such that the Fund should not be subject to federal excise tax. Therefore, no federal income or excise tax provision is recorded.
Foreign Taxes
The Fund may be subject to foreign taxes on income, gains on investments or currency repatriation, a portion of which may be recoverable. The Fund will accrue such taxes and recoveries, as applicable, based upon its current interpretation of tax rules and regulations that exist in the markets in which it invests.
Realized gains in certain countries may be subject to foreign taxes at the Fund level, based on statutory rates. The Fund accrues for such foreign taxes on realized and unrealized gains at the appropriate rate for each jurisdiction, as applicable. The amount, if any, is disclosed as a liability on the Statement of Assets and Liabilities.
Distributions to Shareholders
Distributions from net investment income, if any, are declared and paid annually. Net realized capital gains, if any, are distributed along with the income distribution. Income distributions and capital gain distributions are determined in accordance with federal income tax regulations, which may differ from GAAP.
Guarantees and Indemnifications
Under the Trust's organizational documents and, in some cases, by contract, its officers and trustees are indemnified against certain liabilities arising out of the performance of their duties to the Trust or its funds. In addition, certain of the Fund's contracts with its service providers contain general indemnification clauses. The Fund's maximum exposure under these arrangements is unknown since the amount of any future claims that may be made against the Fund cannot be determined, and the Fund has no historical basis for predicting the likelihood of any such claims.
Annual Report 2015
33
COLUMBIA CONTRARIAN CORE FUND
NOTES TO FINANCIAL STATEMENTS (continued)
August 31, 2015
Recent Accounting Pronouncement
Fair Value Measurement (Topic 820), Disclosure for Investments in Certain Entities That Calculate Net Asset Value per Share (or Its Equivalent)
In May 2015, the Financial Accounting Standards Board (FASB) issued Accounting Standards Update (ASU) No. 2015-07, Fair Value Measurement (Topic 820), Disclosure for Investments in Certain Entities That Calculate Net Asset Value per Share (or Its Equivalent). ASU No. 2015-07 changes the disclosure requirements for investments for which fair value is measured using the net asset value per share practical expedient. The disclosure requirements are effective for annual periods beginning after December 15, 2015 and interim periods within those fiscal years. At this time, management is evaluating the implications of this guidance and the impact it will have on the financial statement amounts and footnote disclosures, if any.
Note 3. Fees and Other Transactions with Affiliates
Investment Management Fees
Under an Investment Management Services Agreement, Columbia Management Investment Advisers, LLC (the Investment Manager), a wholly-owned subsidiary of Ameriprise Financial, Inc. (Ameriprise Financial), determines which securities will be purchased, held or sold. The investment management fee is an annual fee that is equal to a percentage of the Fund's average daily net assets that declines from 0.71% to 0.54% as the Fund's net assets increase. The effective investment management fee rate for the year ended August 31, 2015 was 0.59% of the Fund's average daily net assets.
Administration Fees
Under an Administrative Services Agreement, the Investment Manager also serves as the Fund Administrator. The Fund pays the Fund Administrator an annual fee for administration and accounting services equal to a percentage of the Fund's average daily net assets that declines from 0.06% to 0.03% as the Fund's net assets increase. The effective administration fee rate for the year ended August 31, 2015 was 0.05% of the Fund's average daily net assets.
Compensation of Board Members
Board members, who are not officers or employees of the Investment Manager or Ameriprise Financial, are compensated for their services to the Fund as disclosed
in the Statement of Operations. These Board members may participate in a Deferred Compensation Plan (the Plan) which may be terminated at any time. Obligations of the Plan will be paid solely out of the Fund's assets, and all amounts payable under the Plan constitute a general unsecured obligation of the Fund.
Compensation of Chief Compliance Officer
The Board has appointed a Chief Compliance Officer to the Fund in accordance with federal securities regulations. The Fund is allocated a portion of the expenses associated with the Chief Compliance Officer based on relative net assets of the Trust.
Transfer Agency Fees
Under a Transfer and Dividend Disbursing Agent Agreement, Columbia Management Investment Services Corp. (the Transfer Agent), an affiliate of the Investment Manager and a wholly-owned subsidiary of Ameriprise Financial, is responsible for providing transfer agency services to the Fund. The Transfer Agent has contracted with Boston Financial Data Services (BFDS) to serve as sub-transfer agent.
Effective November 1, 2014, the Transfer Agent receives a monthly transfer agency fee based on the number or the average value of accounts, depending on the type of account. Prior to November 1, 2014, the Transfer Agent received a monthly account-based service fee based on the number of open accounts. In addition, the Transfer Agent also receives sub-transfer agency fees based on a percentage of the average aggregate value of the Fund's shares maintained in omnibus accounts (other than omnibus accounts for which American Enterprise Investment Services Inc. is the broker of record or accounts where the beneficial shareholder is a customer of Ameriprise Financial Services, Inc., for which the Transfer Agent receives a per account fee). The Transfer Agent pays the fees of BFDS for services as sub-transfer agent and is not entitled to reimbursement for such fees from the Fund (with the exception of out-of-pocket fees).
The Transfer Agent also receives compensation from the Fund for various shareholder services and reimbursements for certain out-of-pocket fees. Total transfer agency fees for Class K and Class R5 shares are subject to an annual limitation of not more than 0.05% of the average daily net assets attributable to each share class. Class I and Class Y shares do not pay transfer agency fees.
Annual Report 2015
34
COLUMBIA CONTRARIAN CORE FUND
NOTES TO FINANCIAL STATEMENTS (continued)
August 31, 2015
For the year ended August 31, 2015, the Fund's effective transfer agency fee rates as a percentage of average daily net assets of each class were as follows:
Class A | | | 0.19 | % | |
Class B | | | 0.19 | | |
Class C | | | 0.19 | | |
Class K | | | 0.05 | | |
Class R | | | 0.19 | | |
Class R4 | | | 0.19 | | |
Class R5 | | | 0.05 | | |
Class T | | | 0.19 | | |
Class W | | | 0.19 | | |
Class Z | | | 0.19 | | |
An annual minimum account balance fee of $20 may apply to certain accounts with a value below the applicable share class's initial minimum investment requirements to reduce the impact of small accounts on transfer agency fees. These minimum account balance fees are remitted to the Fund and recorded as part of expense reductions in the Statement of Operations. For the year ended August 31, 2015, these minimum account balance fees reduced total expenses of the Fund by $4,700.
Plan Administration Fees
Under a Plan Administration Services Agreement with the Transfer Agent, the Fund pays an annual fee at a rate of 0.25% of the Fund's average daily net assets attributable to Class K shares for the provision of various administrative, recordkeeping, communication and educational services.
Distribution and Service Fees
The Fund has an agreement with Columbia Management Investment Distributors, Inc. (the Distributor), an affiliate of the Investment Manager and a wholly-owned subsidiary of Ameriprise Financial, for distribution and shareholder services. The Board has approved, and the Fund has adopted, distribution and shareholder service plans (the Plans) applicable to certain share classes, which set the distribution and service fees for the Fund. These fees are calculated daily and are intended to compensate the Distributor and/or eligible selling and/or servicing agents for selling shares of the Fund and providing services to investors.
Under the Plans, the Fund pays a monthly service fee to the Distributor at the maximum annual rate of 0.25% of the average daily net assets attributable to Class A, Class B, Class C and Class W shares of the Fund. Also
under the Plans, the Fund pays a monthly distribution fee to the Distributor at the maximum annual rates of 0.10%, 0.75%, 0.75%, 0.50% and 0.25% of the average daily net assets attributable to Class A, Class B, Class C, Class R and Class W shares of the Fund, respectively.
Although the Fund may pay distribution and service fees up to a maximum annual rate of 0.35% of the Fund's average daily net assets attributable to Class A shares (comprised of up to 0.10% for distribution services and up to 0.25% for shareholder liaison services), the Fund currently limits such fees to an aggregate fee of not more than 0.25% of the Fund's average daily net assets attributable to Class A shares.
Although the Fund may pay a distribution fee up to 0.25% of the Fund's average daily net assets attributable to Class W shares and a service fee of up to 0.25% of the Fund's average daily net assets attributable to Class W shares, the aggregate fee shall not exceed 0.25% of the Fund's average daily net assets attributable to Class W shares.
Shareholder Services Fees
The Fund has adopted a shareholder services plan that permits it to pay for certain services provided to Class T shareholders by their selling and/or servicing agents. The Fund may pay shareholder servicing fees up to an aggregate annual rate of 0.50% of the Fund's average daily net assets attributable to Class T shares (comprised of up to 0.25% for shareholder liaison services and up to 0.25% for administrative support services). Effective January 1, 2015, these fees are currently limited to an aggregate annual rate of not more than 0.25% of the Fund's average daily net assets attributable to Class T shares. Prior to January 1, 2015, these fees were limited to 0.30% of the Fund's average daily net assets attributable to Class T shares. The annualized effective shareholder services fee rate for the year ended August 31, 2015 was 0.27% of the Fund's average daily net assets attributable to Class T shares.
Sales Charges
Sales charges, including front-end charges and CDSCs, received by the Distributor for distributing Fund shares were $4,143,921 for Class A, $1,065 for Class B, $35,022 for Class C and $10,655 for Class T shares for the year ended August 31, 2015.
Annual Report 2015
35
COLUMBIA CONTRARIAN CORE FUND
NOTES TO FINANCIAL STATEMENTS (continued)
August 31, 2015
Expenses Waived/Reimbursed by the Investment Manager and its Affiliates
The Fund's expense ratio is subject to an expense reimbursement arrangement pursuant to which fees will be waived and/or expenses reimbursed (excluding certain fees and expenses described below), so that the Fund's net operating expenses, after giving effect to fees waived/expenses reimbursed and any balance credits and/or overdraft charges from the Fund's custodian, do not exceed the annual rates of:
| | | Voluntary
Expense Cap
Effective
January 1, 2015 | | Contractual
Expense Cap
Prior to
January 1, 2015 | |
Class A | | | 1.18 | % | | | 1.18 | % | |
Class B | | | 1.93 | | | | 1.93 | | |
Class C | | | 1.93 | | | | 1.93 | | |
Class I | | | 0.79 | | | | 0.80 | | |
Class K | | | 1.09 | | | | 1.10 | | |
Class R | | | 1.43 | | | | 1.43 | | |
Class R4 | | | 0.93 | | | | 0.93 | | |
Class R5 | | | 0.84 | | | | 0.85 | | |
Class T | | | 1.18 | | | | 1.23 | | |
Class W | | | 1.18 | | | | 1.18 | | |
Class Y | | | 0.79 | | | | 0.80 | | |
Class Z | | | 0.93 | | | | 0.93 | | |
The voluntary expense cap arrangement may be revised or discontinued at any time. Under the arrangements, the following fees and expenses are excluded from the waiver/reimbursement commitment, and therefore will be paid by the Fund, if applicable: taxes (including foreign transaction taxes), expenses associated with investments in affiliated and non-affiliated pooled investment vehicles (including mutual funds and exchange-traded funds), transaction costs and brokerage commissions, costs related to any securities lending program, dividend and interest expenses associated with securities sold short, inverse floater program fees and expenses, transaction charges and interest on borrowed money, interest and extraordinary expenses. Any fees waived and/or expenses reimbursed under the expense reimbursement arrangements described above are not recoverable by the Investment Manager or its affiliates in future periods.
Note 4. Federal Tax Information
The timing and character of income and capital gain distributions are determined in accordance with income
tax regulations, which may differ from GAAP because of temporary or permanent book to tax differences.
At August 31, 2015, these differences are primarily due to differing treatment for deferral/reversal of wash sale losses, Trustees' deferred compensation, distribution reclassifications, foreign currency transactions and re-characterization of distributions for investments. To the extent these differences are permanent, reclassifications are made among the components of the Fund's net assets in the Statement of Assets and Liabilities. Temporary differences do not require reclassifications. In the Statement of Assets and Liabilities the following reclassifications were made:
Undistributed net investment income | | $ | (264,996 | ) | |
Accumulated net realized gain | | | 264,995 | | |
Paid-in capital | | | 1 | | |
Net investment income (loss) and net realized gains (losses), as disclosed in the Statement of Operations, and net assets were not affected by this reclassification.
The tax character of distributions paid during the years indicated was as follows:
Year Ended August 31, | | 2015 | | 2014 | |
Ordinary income | | $ | 69,622,372 | | | $ | 76,243,506 | | |
Long-term capital gains | | | 296,299,189 | | | | 142,046,363 | | |
Total | | $ | 365,921,561 | | | $ | 218,289,869 | | |
Short-term capital gain distributions, if any, are considered ordinary income distributions for tax purposes.
At August 31, 2015, the components of distributable earnings on a tax basis were as follows:
Undistributed ordinary income | | $ | 158,216,000 | | |
Undistributed long-term capital gains | | | 194,920,866 | | |
Net unrealized appreciation | | | 873,818,092 | | |
At August 31, 2015, the cost of investments for federal income tax purposes was $5,266,995,949 and the aggregate gross unrealized appreciation and depreciation based on that cost was:
Unrealized appreciation | | $ | 873,818,092 | | |
Unrealized depreciation | | | — | | |
Net unrealized appreciation | | $ | 873,818,092 | | |
Management of the Fund has concluded that there are no significant uncertain tax positions in the Fund that would require recognition in the financial statements. However, management's conclusion may be subject to
Annual Report 2015
36
COLUMBIA CONTRARIAN CORE FUND
NOTES TO FINANCIAL STATEMENTS (continued)
August 31, 2015
review and adjustment at a later date based on factors including, but not limited to, new tax laws, regulations, and administrative interpretations (including relevant court decisions). Generally, the Fund's federal tax returns for the prior three fiscal years remain subject to examination by the Internal Revenue Service.
Note 5. Portfolio Information
The cost of purchases and proceeds from sales of securities, excluding short-term investments and derivatives, if any, aggregated to $4,589,929,131 and $3,293,170,864, respectively, for the year ended August 31, 2015. The amount of purchase and sale activity impacts the portfolio turnover rate reported in the Financial Highlights.
Note 6. Affiliated Money Market Fund
The Fund invests in Columbia Short-Term Cash Fund, an affiliated money market fund established for the exclusive use by the Fund and other affiliated funds. The income earned by the Fund from such investments is included as Dividends — affiliated issuers in the Statement of Operations. As an investing fund, the Fund indirectly bears its proportionate share of the expenses of Columbia Short-Term Cash Fund.
Note 7. Line of Credit
The Fund has entered into a revolving credit facility with a syndicate of banks led by JPMorgan Chase Bank, N.A. whereby the Fund may borrow for the temporary funding of shareholder redemptions or for other temporary or emergency purposes. Pursuant to a December 9, 2014 amendment, the credit facility agreement, which is a collective agreement between the Fund and certain other funds managed by the Investment Manager, severally and not jointly, permits collective borrowings up to $550 million. Interest is charged to each participating fund based on its borrowings at a rate equal to the higher of (i) the overnight federal funds rate plus 1.00% or (ii) the one-month LIBOR rate plus 1.00%. Each borrowing under the credit facility matures no later than 60 days after the date of borrowing. The Fund also pays a commitment fee equal to its pro rata share of the amount of the credit facility at a rate of 0.075% per annum. The commitment fee is included in other expenses in the Statement of Operations. Prior to the December 9, 2014 amendment, the credit facility agreement permitted borrowings up to $500 million under the same terms and interest rates as described above.
The Fund had no borrowings during the year ended August 31, 2015.
Note 8. Significant Risks
Shareholder Concentration Risk
At August 31, 2015, one unaffiliated shareholder of record owned 15.4% of the outstanding shares of the Fund in one or more accounts. The Fund has no knowledge about whether any portion of those shares was owned beneficially. Affiliated shareholders of record owned 38.2% of the outstanding shares of the Fund in one or more accounts. Subscription and redemption activity by concentrated accounts may have a significant effect on the operations of the Fund. In the case of a large redemption, the Fund may be forced to sell investments at inopportune times, including its liquid or more liquid positions, resulting in Fund losses and the Fund holding a higher percentage of less liquid or illiquid securities. Large redemptions could result in decreased economies of scale and increased operating expenses for non-redeeming Fund shareholders.
Technology and Technology-related Investment Risk
The Fund may be more susceptible to the particular risks that may affect companies in the information technology sector, as well as other technology-related sectors (collectively, the technology sectors) than if it were invested in a wider variety of companies in unrelated sectors. Companies in the technology sectors are subject to certain risks, including the risk that new services, equipment or technologies will not be accepted by consumers and businesses or will become rapidly obsolete. Performance of such companies may be affected by factors including obtaining and protecting patents (or the failure to do so) and significant competitive pressures, including aggressive pricing of their products or services, new market entrants, competition for market share and short product cycles due to an accelerated rate of technological developments. Such competitive pressures may lead to limited earnings and/or falling profit margins. As a result, the value of their securities may fall or fail to rise. In addition, many technology sector companies have limited operating histories and prices of these companies' securities historically have been more volatile than other securities, especially over the short term.
Annual Report 2015
37
COLUMBIA CONTRARIAN CORE FUND
NOTES TO FINANCIAL STATEMENTS (continued)
August 31, 2015
Note 9. Subsequent Events
Management has evaluated the events and transactions that have occurred through the date the financial statements were issued and noted no items requiring adjustment of the financial statements or additional disclosure.
Note 10. Information Regarding Pending and Settled Legal Proceedings
In December 2005, without admitting or denying the allegations, American Express Financial Corporation (AEFC, which is now known as Ameriprise Financial, Inc. (Ameriprise Financial)) entered into settlement agreements with the Securities and Exchange Commission (SEC) and Minnesota Department of Commerce (MDOC) related to market timing activities. As a result, AEFC was censured and ordered to cease and desist from committing or causing any violations of certain provisions of the Investment Advisers Act of 1940, the Investment Company Act of 1940, and various Minnesota laws. AEFC agreed to pay disgorgement of $10 million and civil money penalties of $7 million. AEFC also agreed to retain an independent distribution consultant to assist in developing a plan for distribution of all disgorgement and civil penalties ordered by the SEC in accordance with various undertakings detailed at http://www.sec.gov/litigation/admin/ia-2451.pdf. Ameriprise Financial and its affiliates have cooperated with the SEC and the MDOC in these legal proceedings, and have made regular reports to the Funds' Boards of Trustees.
Ameriprise Financial and certain of its affiliates have historically been involved in a number of legal, arbitration and regulatory proceedings, including routine litigation, class actions, and governmental actions, concerning matters arising in connection with the conduct of their business activities. Ameriprise Financial believes that the Funds are not currently the subject of, and that neither Ameriprise Financial nor any of its affiliates are the subject of, any pending legal, arbitration or regulatory proceedings that are likely to have a material adverse effect on the Funds or the ability of Ameriprise Financial or its affiliates to perform under their contracts with the Funds. Ameriprise Financial is required to make quarterly (10-Q), annual (10-K) and, as necessary, 8-K filings with the SEC on legal and regulatory matters that relate to Ameriprise Financial and its affiliates. Copies of these filings may be obtained by accessing the SEC website at www.sec.gov.
There can be no assurance that these matters, or the adverse publicity associated with them, will not result in increased fund redemptions, reduced sale of fund shares or other adverse consequences to the Funds. Further, although we believe proceedings are not likely to have a material adverse effect on the Funds or the ability of Ameriprise Financial or its affiliates to perform under their contracts with the Funds, these proceedings are subject to uncertainties and, as such, we are unable to estimate the possible loss or range of loss that may result. An adverse outcome in one or more of these proceedings could result in adverse judgments, settlements, fines, penalties or other relief that could have a material adverse effect on the consolidated financial condition or results of operations of Ameriprise Financial.
Annual Report 2015
38
COLUMBIA CONTRARIAN CORE FUND
REPORT OF INDEPENDENT REGISTERED PUBLIC ACCOUNTING FIRM
To the Trustees of Columbia Funds Series Trust I and the Shareholders of
Columbia Contrarian Core Fund
In our opinion, the accompanying statement of assets and liabilities, including the portfolio of investments, and the related statements of operations and of changes in net assets and the financial highlights present fairly, in all material respects, the financial position of Columbia Contrarian Core Fund (the "Fund," a series of Columbia Funds Series Trust I) at August 31, 2015, and the results of its operations, the changes in its net assets and the financial highlights for each of the periods indicated, in conformity with accounting principles generally accepted in the United States of America. These financial statements and financial highlights (hereafter referred to as "financial statements") are the responsibility of the Fund's management. Our responsibility is to express an opinion on these financial statements based on our audits. We conducted our audits of these financial statements in accordance with the standards of the Public Company Accounting Oversight Board (United States). Those standards require that we plan and perform the audit to obtain reasonable assurance about whether the financial statements are free of material misstatement. An audit includes examining, on a test basis, evidence supporting the amounts and disclosures in the financial statements, assessing the accounting principles used and significant estimates made by management, and evaluating the overall financial statement presentation. We believe that our audits, which included confirmation of securities at August 31, 2015 by correspondence with the custodian, brokers and transfer agent, and the application of alternative auditing procedures where such confirmations had not been received, provide a reasonable basis for our opinion.
PricewaterhouseCoopers LLP
Minneapolis, MN
October 22, 2015
Annual Report 2015
39
COLUMBIA CONTRARIAN CORE FUND
FEDERAL INCOME TAX INFORMATION
(Unaudited)
The Fund hereby designates the following tax attributes for the fiscal year ended August 31, 2015. Shareholders will be notified in early 2016 of the amounts for use in preparing 2015 income tax returns.
Tax Designations:
| Qualified Dividend Income | | | 95.60 | % | |
| Dividends Received Deduction | | | 78.46 | % | |
Capital Gain Dividend | | $ | 248,480,720 | | |
Qualified Dividend Income. For taxable, non-corporate shareholders, the percentage of ordinary income distributed during the fiscal year that represents qualified dividend income subject to reduced tax rates.
Dividends Received Deduction. The percentage of ordinary income distributed during the fiscal year that qualifies for the corporate dividends received deduction.
Capital Gain Dividend. The Fund designates as a capital gain dividend the amount reflected above, or if subsequently determined to be different, the net capital gain of such fiscal period.
Annual Report 2015
40
COLUMBIA CONTRARIAN CORE FUND
The Trustees serve terms of indefinite duration. The names and birth years of the Trustees and Officers of the Funds in Columbia Funds Series Trust I, the year each was first elected or appointed to office, their principal business occupations during at least the last five years, the number of Funds overseen by each Trustee and other directorships they hold are shown below. Each officer listed below serves as an officer of each Fund in Columbia Funds Series Trust I. The mailing address of each Trustee is: c/o Columbia Management Investment Advisers, LLC, 225 Franklin Street, Mail Drop BX32 05228, Boston, MA 02110.
Independent Trustees
Name, Year of Birth
and Position Held
with the Trust | | Year First
Appointed or
Elected as
Trustee to any
Fund Currently
in the Columbia
Funds Complex
or a Predecessor
Thereof | | Principal Occupation(s)
during the Past Five Years | | Number
of Funds
in the
Columbia
Funds
Complex
Overseen | | Other Directorships
Held by Trustee During
the Past Five Years | |
Janet Langford Carrig
(Born 1957)
Trustee | | | 1996 | | | Senior Vice President, General Counsel and Corporate Secretary, ConocoPhillips (integrated energy company) since September 2007; Deputy General Counsel — Corporate Legal Services, ConocoPhillips from August 2006 to August 2007; Partner, Zelle, Hofmann, Voelbel, Mason & Gette LLP (law firm) from March 2005 to July 2006; Adjunct Professor of Law, Northwestern University from September 2004 to June 2006; Director, UAL Corporation (airline) from February 2006 to July 2006; Chief Administrative Officer and Senior Vice President, Kmart Holding Corporation (consumer goods) from September 2003 to March 2004 | | | 60 | | | None | |
Douglas A. Hacker
(Born 1955)
Trustee and Chairman
of the Board | | | 1996 | | | Independent business executive since May 2006; Executive Vice President — Strategy of United Airlines from December 2002 to May 2006; President of UAL Loyalty Services (airline marketing company) from September 2001 to December 2002; Executive Vice President and Chief Financial Officer of United Airlines from July 1999 to September 2001 | | | 60 | | | Spartan Nash Company, (food distributor); Nash Finch Company (food distributor) from 2005 to 2013; Aircastle Limited (aircraft leasing); SeaCube Container Leasing Ltd. (container leasing) from 2010 to 2013; and Travelport Worldwide Limited (travel information technology) | |
Nancy T. Lukitsh
(Born 1956)
Trustee | | | 2011 | | | Senior Vice President, Partner and Director of Marketing, Wellington Management Company, LLP (investment adviser) from 1997 to 2010; Chair, Wellington Management Investment Portfolios (commingled non-U.S. investment pools) from 2007 to 2010; Director, Wellington Trust Company, NA and other Wellington affiliates from 1997 to 2010 | | | 60 | | | None | |
William E. Mayer
(Born 1940)
Trustee | | | 1991 | | | Partner, Park Avenue Equity Partners (private equity) since February 1999 | | | 60 | | | DynaVox Inc. (speech creation); Lee Enterprises (print media); WR Hambrecht + Co. (financial service provider) from 2000 to 2012; BlackRock Kelso Capital Corporation (investment company); and Premier, Inc. (healthcare) | |
Annual Report 2015
41
COLUMBIA CONTRARIAN CORE FUND
TRUSTEES AND OFFICERS (continued)
Independent Trustees (continued)
Name, Year of Birth
and Position Held
with the Trust | | Year First
Appointed or
Elected as
Trustee to any
Fund Currently
in the Columbia
Funds Complex
or a Predecessor
Thereof | | Principal Occupation(s)
during the Past Five Years | | Number
of Funds
in the
Columbia
Funds
Complex
Overseen | | Other Directorships
Held by Trustee During
the Past Five Years | |
David M. Moffett
(Born 1952)
Trustee | | | 2011 | | | Retired. Consultant to Bridgewater and Associates; Chief Executive Officer, Federal Home Loan Mortgage Corporation, from 2008 to 2009; Senior Adviser, Global Financial Services Group, Carlyle Group, Inc., from 2007 to 2008; Vice Chairman and Chief Financial Officer, U.S. Bancorp, from 1993 to 2007 | | | 60 | | | Building Materials Holding Corp. (building materials and construction services); CIT Group Inc. (commercial and consumer finance); eBay Inc. (online trading community); E.W. Scripps Co. (print and television media); Genworth Financial, Inc. (financial and insurance products and services); MBIA Inc. (financial service provider); Paypal Holdings Inc. (payment and data processing services); and University of Oklahoma Foundation | |
Charles R. Nelson
(Born 1942)
Trustee | | | 1981 | | | Retired. Professor Emeritus, University of Washington since 2011; Professor of Economics, University of Washington from 1976 to 2011; Ford and Louisa Van Voorhis Professor of Political Economy, University of Washington from 1993 to 2011; Adjunct Professor of Statistics, University of Washington from 1980 to 2011; Associate Editor, Journal of Money, Credit and Banking from September 1993 to 2008; consultant on econometric and statistical matters | | | 60 | | | None | |
John J. Neuhauser
(Born 1943)
Trustee | | | 1984 | | | President, Saint Michael's College since August 2007; Director or Trustee of several non-profit organizations, including Fletcher Allen Health Care, Inc.; Academic Vice President and Dean of Faculties, Boston College from August 1999 to October 2005; University Professor, Boston College from November 2005 to August 2007 | | | 60 | | | Liberty All-Star Equity Fund and Liberty All-Star Growth Fund (closed-end funds) | |
Patrick J. Simpson
(Born 1944)
Trustee | | | 2000 | | | Partner, Perkins Coie LLP (law firm) | | | 60 | | | None | |
Anne-Lee Verville
(Born 1945)
Trustee | | | 1998 | | | Retired. General Manager, Global Education Industry from 1994 to 1997, President — Application Systems Division from 1991 to 1994, Chief Financial Officer — US Marketing & Services from 1988 to 1991, and Chief Information Officer from 1987 to 1988, IBM Corporation (computer and technology) | | | 60 | | | Enesco Group, Inc. (producer of giftware and home and garden decor products) from 2001 to 2006 | |
Annual Report 2015
42
COLUMBIA CONTRARIAN CORE FUND
TRUSTEES AND OFFICERS (continued)
Interested Trustee Affiliate with Investment Manager*
Name, Year of Birth
and Position Held
with the Trust | | Year First
Appointed or
Elected as
Trustee to any
Fund Currently
in the Columbia
Funds Complex
or a Predecessor
Thereof | | Principal Occupation(s)
during the Past Five Years | | Number
of Funds
in the
Columbia
Funds
Complex
Overseen | | Other Directorships
Held by Trustee During
the Past Five Years | |
William F. Truscott
(Born 1960)
Trustee | | | 2012 | | | Chairman of the Board and President, Columbia Management Investment Advisers, LLC since May 2010 and February 2012, respectively (previously President and Chief Investment Officer, 2001-April 2010); Chief Executive Officer, Global Asset Management, Ameriprise Financial, Inc. since September 2012 (previously Chief Executive Officer, U.S. Asset Management & President, Annuities, May 2010-September 2012 and President — U.S. Asset Management and Chief Investment Officer, 2005-April 2010); Director and Chief Executive Officer, Columbia Management Investment Distributors, Inc. since May 2010 and February 2012, respectively (previously Chairman of the Board and Chief Executive Officer, 2006-April 2010); Chairman of the Board and Chief Executive Officer, RiverSource Distributors, Inc. since 2006; Director, Threadneedle Asset Management Holdings, SARL since 2014; President and Chief Executive Officer, Ameriprise Certificate Company, 2006-August 2012 | | | 187 | | | Chairman of the Board, Columbia Management Investment Advisers, LLC since May 2010; Director, Columbia Management Investment Distributors, Inc. since May 2010; Director, Ameriprise Certificate Company, 2006 to January 2013 | |
* Interested person (as defined under the 1940 Act) by reason of being an officer, director, security holder and/or employee of the Investment Manager or Ameriprise Financial.
The Statement of Additional Information has additional information about the Fund's Board members and is available, without charge, upon request by calling 800.345.6611; contacting your financial intermediary; or visiting columbiathreadneedle.com/us.
The Board has appointed officers who are responsible for day-to-day business decisions based on policies it has established. The officers serve at the pleasure of the Board. In addition to Mr. Truscott, who is Senior Vice President, the Funds' other officers are:
Fund Officers
Name,
Address and
Year of Birth | | Position and Year
First Appointed to
Position for any Fund
in the Columbia
Funds Complex or a
Predecessor Thereof | | Principal Occupation(s) During Past Five Years | |
Christopher O. Petersen
5228 Ameriprise
Financial Center
Minneapolis, MN 55474
Born 1970 | | President and Principal Executive Officer (2015) | | Vice President and Lead Chief Counsel, Ameriprise Financial, Inc. since January 2015 (previously, Vice President and Chief Counsel January 2010-December 2014; and Vice President and Group Counsel or Counsel 2004- January 2010); officer of Columbia Funds and affiliated funds since 2007. | |
Michael G. Clarke
225 Franklin Street
Boston, MA 02110
Born 1969 | | Treasurer (2011) and Chief Financial Officer (2009) | | Vice President — Mutual Fund Administration, Columbia Management Investment Advisers, LLC, since May 2010; Managing Director of Fund Administration, Columbia Management Advisors, LLC, September 2004-April 2010; senior officer of Columbia Funds and affiliated funds since 2002. | |
Annual Report 2015
43
COLUMBIA CONTRARIAN CORE FUND
TRUSTEES AND OFFICERS (continued)
Fund Officers (continued)
Name,
Address and
Year of Birth | | Position and Year
First Appointed to
Position for any Fund
in the Columbia
Funds Complex or a
Predecessor Thereof | | Principal Occupation(s) During Past Five Years | |
Paul B. Goucher
100 Park Avenue
New York, NY 10017
Born 1968 | | Senior Vice President (2011), Chief Legal Officer (2015) and Assistant Secretary (2008) | | Vice President and Lead Chief Counsel, Ameriprise Financial, Inc. since November 2008 and January 2013, respectively (previously Chief Counsel, January 2010-January 2013 and Group Counsel, November 2008-January 2010). | |
Thomas P. McGuire
225 Franklin Street
Boston, MA 02110
Born 1972 | | Vice President and Chief Compliance Officer (2012) | | Vice President — Asset Management Compliance, Ameriprise Financial, Inc., since May 2010; Chief Compliance Officer, Ameriprise Certificate Company since September 2010; Compliance Executive, Bank of America, 2005-April 2010. | |
Colin Moore
225 Franklin Street
Boston, MA 02110
Born 1958 | | Senior Vice President (2010) | | Executive Vice President and Global Chief Investment Officer, Ameriprise Financial, Inc., since July 2013; Director and Global Chief Investment Officer, Columbia Management Investment Advisers, LLC since May 2010; Manager, Managing Director and Chief Investment Officer, Columbia Management Advisors, LLC, 2007-April 2010. | |
Michael E. DeFao
225 Franklin Street
Boston, MA 02110
Born 1968 | | Vice President (2011) and Assistant Secretary (2010) | | Vice President and Chief Counsel, Ameriprise Financial, Inc. since May 2010; Associate General Counsel, Bank of America, 2005-April 2010. | |
Joseph F. DiMaria
225 Franklin Street
Boston, MA 02110
Born 1968 | | Vice President (2011), Assistant Treasurer (2012) and Chief Accounting Officer (2008) | | Vice President — Mutual Fund Treasurer, Columbia Management Investment Advisers, LLC since May 2010; Director of Fund Administration, Columbia Management Advisors, LLC, 2006-April 2010. | |
Amy Johnson
5228 Ameriprise
Financial Center
Minneapolis, MN 55474
Born 1965 | | Vice President (2006) | | Managing Director and Chief Operating Officer, Columbia Management Investment Advisers, LLC since May 2010 (previously Chief Administrative Officer, 2009-April 2010, and Vice President — Asset Management and Trust Company Services, 2006-2009). | |
Lyn Kephart-Strong
5228 Ameriprise
Financial Center
Minneapolis, MN 55474
Born 1960 | | Vice President (2015) | | President, Columbia Management Investment Services Corp. since October 2014; Vice President & Resolution Officer, Ameriprise Trust Company since August 2009; President, RiverSource Service Corporation 2004-2010. | |
Ryan C. Larrenaga
225 Franklin Street
Boston, MA 02110
Born 1970 | | Vice President and Secretary (2015) | | Vice President and Group Counsel, Ameriprise Financial, Inc. since August 2011 (previously, Counsel from May 2010 to August 2011); Assistant General Counsel, Bank of America, 2005-April 2010; officer of Columbia Funds and affiliated funds since 2005. | |
Annual Report 2015
44
COLUMBIA CONTRARIAN CORE FUND
BOARD CONSIDERATION AND APPROVAL OF ADVISORY AGREEMENT
On June 10, 2015, the Board of Trustees (the Board) and the Trustees who are not interested persons (as defined in the Investment Company Act of 1940) (the Independent Trustees) of Columbia Funds Series Trust I (the Trust) unanimously approved the continuation of the Investment Management Services Agreement (the Advisory Agreement) with Columbia Management Investment Advisers, LLC (the Investment Manager) with respect to Columbia Contrarian Core Fund (the Fund), a series of the Trust. The Board and the Independent Trustees also unanimously approved an agreement (the Management Agreement and, together with the Advisory Agreement, the Agreements) combining the Advisory Agreement and the Fund's existing administrative services agreement (the Administrative Services Agreement) in a single agreement. The Board and the Independent Trustees approved the restatement of the Advisory Agreement with the Management Agreement to be effective for the Fund on January 1, 2016, the Fund's next annual prospectus update. As detailed below, the Board's Advisory Fees and Expenses Committee (the Committee) and the Board met on multiple occasions to review and discuss, both among themselves and with the management team of the Investment Manager, materials provided by the Investment Manager and others before determining to approve the Management Agreement and the continuation of the Advisory Agreement.
In connection with their deliberations regarding the approval of the Management Agreement and the continuation of the Advisory Agreement, the Committee and the Board evaluated materials requested from the Investment Manager regarding the Fund and the Agreements, and discussed these materials with representatives of the Investment Manager at Committee meetings held on March 3, 2015, April 29, 2015 and June 9, 2015 and at Board meetings held on March 4, 2015 and June 10, 2015. In addition, the Board considers matters bearing on the Agreements at most of its other meetings throughout the year and meets regularly with senior management of the Trust and the Investment Manager. Through the Board's Investment Oversight Committees, Trustees also meet with selected portfolio managers of the funds the Trustees oversee and other investment personnel at various times throughout the year. The Committee and the Board also consulted with its independent fee consultant, Fund counsel and with the Independent Trustees' independent legal counsel, who advised on various matters with respect to the Committee's and the Board's considerations and otherwise assisted the Committee and the Board in their deliberations. On June 9, 2015, the Committee recommended that the Board approve the Management Agreement and the continuation of the Advisory Agreement. On June 10, 2015, the Board, including the Independent Trustees, voting separately, unanimously approved the Management Agreement and the continuation of the Advisory Agreement for the Fund.
The Committee and the Board considered all information that they, their legal counsel or the Investment Manager believed reasonably necessary to evaluate and to determine whether to approve the Management Agreement and the continuation of the Advisory Agreement. The information and factors considered by the Committee and the Board in recommending for approval or approving the Management Agreement and the continuation of the Advisory Agreement for the Fund included the following:
• Information on the investment performance of the Fund relative to the performance of a group of mutual funds determined to be comparable to the Fund by an independent third-party data provider, as well as performance relative to benchmarks;
• Information on the Fund's advisory fees and total expenses, including information comparing the Fund's expenses to those of a group of comparable mutual funds, as determined by the independent third-party data provider;
• The Investment Manager's agreement to contractually limit or cap total operating expenses for the Fund so that total operating expenses (excluding certain fees and expenses, such as portfolio transaction costs and certain other investment related expenses, interest, taxes, acquired fund fees and expenses, and extraordinary expenses) would not exceed a specified percentage of the Fund's average annual net assets from January 1, 2016 through December 31, 2016;
• The terms and conditions of the Agreements;
Annual Report 2015
45
COLUMBIA CONTRARIAN CORE FUND
BOARD CONSIDERATION AND APPROVAL OF ADVISORY AGREEMENT (continued)
• The current and proposed terms and conditions of other agreements and arrangements with affiliates of the Investment Manager relating to the operations of the Fund, including the Administrative Services Agreement1 and agreements with respect to the provision of distribution and transfer agency services to the Fund;
• Descriptions of various functions performed by the Investment Manager under the Agreements, including portfolio management and portfolio trading practices;
• Information regarding the management fees and investment performance of similarly-managed portfolios of other clients of the Investment Manager, including institutional separate accounts;
• Information regarding the reputation, regulatory history and resources of the Investment Manager, including information regarding senior management, portfolio managers and other personnel;
• Information regarding the capabilities of the Investment Manager with respect to compliance monitoring services, including an assessment of the Investment Manager's compliance system by the Fund's Chief Compliance Officer; and
• The profitability to the Investment Manager and its affiliates from their relationships with the Fund.
Nature, Extent and Quality of Services Provided under the Agreements
The Committee and the Board considered the nature, extent and quality of services provided to the Fund by the Investment Manager and its affiliates under the Agreements and under separate agreements for the provision of transfer agency and administrative services, and the resources dedicated to the Fund and the other Columbia Funds by the Investment Manager and its affiliates. The Committee and the Board also determined that the nature and level of the services to be provided under the Management Agreement would not decrease relative to the services provided under the Advisory Agreement and the Administrative Services Agreement. The Committee and the Board considered, among other things, the Investment Manager's ability to attract, motivate and retain highly qualified research, advisory and supervisory investment professionals (including personnel and other resources, compensation programs for personnel involved in fund management, reputation and other attributes), the portfolio management services provided by those investment professionals, and the quality of the Investment Manager's investment research capabilities and trade execution services. The Committee and the Board also considered the potential benefits to shareholders of investing in a mutual fund that is part of a fund complex offering exposure to a variety of asset classes and investment disciplines and providing a variety of fund and shareholder services.
The Committee and the Board also considered the professional experience and qualifications of the senior personnel of the Investment Manager, which included consideration of the Investment Manager's experience with similarly-structured funds. The Committee and the Board noted the compliance programs of and the compliance-related resources provided to the Fund by the Investment Manager and its affiliates, and considered the Investment Manager's ability to provide administrative services to the Fund and coordinate the activities of the Fund's other service providers. In evaluating the nature, extent and quality of services provided under the Agreements, the Committee and the Board considered that these services were provided to the Fund, rather than directly to Fund shareholders. The Committee and the Board accordingly affirmed, after considering various other matters, including the potential benefits to the Fund and its shareholders of the Independent Trustees' important role as pre-suit gatekeepers with respect to claims that they may determine are meritless or contrary to the Fund's best interests, that it was not the intention of the Board or the Investment Manager that there be any third-party beneficiaries of the Agreements. After reviewing these and related factors, the Committee and the Board concluded, within the context of their overall conclusions, that the nature, extent and quality of the services provided to the Fund under the Agreements supported the approval of the Management Agreement and the continuation of the Advisory Agreement.
1 Like the Advisory Agreement, the Administrative Services Agreement will terminate with respect to the Fund once the Management Agreement is effective for the Fund.
Annual Report 2015
46
COLUMBIA CONTRARIAN CORE FUND
BOARD CONSIDERATION AND APPROVAL OF ADVISORY AGREEMENT (continued)
Investment Performance
The Committee and the Board reviewed information about the performance of the Fund over various time periods, including performance information relative to benchmarks and information based on reports of the independent third-party data provider that compared the performance of the Fund to the performance of a group of comparable mutual funds, and data provided by the independent fee consultant. The Committee and the Board also reviewed a description of the third party's methodology for identifying the Fund's peer groups for purposes of performance and expense comparisons.
The Committee and the Board noted that, through December 31, 2014, the Fund's performance was in the 30th, 10th and 13th percentile (where the best performance would be in the first percentile) of its category selected by the independent third-party data provider for the purposes of performance comparisons for the one-, three- and five- year periods, respectively.
The Committee and the Board also considered the Investment Manager's performance and reputation generally, the Investment Manager's historical responsiveness to Board concerns about performance, and the Investment Manager's willingness to take steps intended to improve performance. After reviewing these and related factors, the Committee and the Board concluded, within the context of their overall conclusions, that the performance of the Fund was sufficient, in light of other considerations, to warrant the continuation of the Advisory Agreement and the approval of the Management Agreement.
Investment Advisory Fee Rates and Other Expenses
The Committee and the Board considered the advisory fees charged to the Fund under the Advisory Agreement as well as the total expenses incurred by the Fund. In assessing the reasonableness of the fees under the Advisory Agreement, the Committee and the Board considered, among other information, the Fund's advisory fee and its total expense ratio as a percentage of average daily net assets. The Committee and the Board also considered that the proposed management fee would not exceed the sum of the fee rates payable under the Advisory Agreement and the Administrative Services Agreement. The Committee and the Board considered data provided by the independent fee consultant. The Committee and the Board noted that, as of December 31, 2014, the Fund's actual management fee and net expense ratio are ranked in the 4th and 3rd quintiles, respectively, (where the lowest fees and expenses would be in the first quintile) against the Fund's expense universe as determined by the independent third-party data provider for purposes of expense comparison. The Committee and the Board also took into account the fee waiver and expense limitation arrangements agreed to by the Investment Manager, as noted above.
The Committee and the Board also received and considered information about the advisory fees charged by the Investment Manager to institutional separate accounts. In considering the fees charged to those accounts, the Committee and the Board took into account, among other things, the Investment Manager's representations about the differences between managing mutual funds as compared to other types of accounts, including differences in the services provided, differences in the risk profile of such business for the Investment Manager and the additional resources required to manage mutual funds effectively. The Committee and the Board also received and considered information about the fees charged by the Investment Manager for sub-advisory services provided to comparable unaffiliated funds. In evaluating the Fund's advisory fees, the Committee and the Board also took into account the demands, complexity and quality of the investment management of the Fund.
After reviewing these and related factors, the Committee and the Board concluded, within the context of their overall conclusions, that the advisory/management fee rates and expenses of the Fund were sufficient, in light of other considerations, to warrant the approval of the Management Agreement and continuation of the Advisory Agreement.
Costs of Services Provided and Profitability
The Committee and the Board also took note of the costs the Investment Manager and its affiliates incur in connection with the services provided (both on an absolute and relative basis) and the profitability to the Investment Manager and its affiliates in connection with their relationships with the Fund.
Annual Report 2015
47
COLUMBIA CONTRARIAN CORE FUND
BOARD CONSIDERATION AND APPROVAL OF ADVISORY AGREEMENT (continued)
The Committee and the Board also considered the compensation directly or indirectly received by the Investment Manager's affiliates in connection with their relationships with the Fund. The Committee and the Board reviewed information provided by management as to the profitability to the Investment Manager and its affiliates of their relationships with the Fund, information about the allocation of expenses used to calculate profitability, and comparisons of profitability levels realized in 2014 to profitability levels realized in 2013. When reviewing profitability, the Committee and the Board also considered court cases in which adviser profitability was an issue in whole or in part, the performance of similarly managed funds, the performance of the Fund, and the expense ratio of the Fund. The Committee and the Board also considered information provided by the Investment Manager regarding the Investment Manager's financial condition and comparing its profitability to that of other asset management firms that are, or are subsidiaries of, publicly traded companies.
After reviewing these and related factors, the Committee and the Board concluded, within the context of their overall conclusions, that the costs of services provided and the profitability to the Investment Manager and its affiliates from their relationships with the Fund supported the approval of the Management Agreement and the continuation of the Advisory Agreement.
Economies of Scale
The Committee and the Board considered the potential existence of economies of scale in the provision by the Investment Manager of services to the Fund, to groups of related funds, and to the Investment Manager's investment advisory clients as a whole, and whether those economies of scale were shared with the Fund through breakpoints in investment advisory fees or other means, such as expense limitation arrangements and additional investments by the Investment Manager in investment, trading and compliance resources. The Committee and the Board noted that the investment advisory and management fee schedules for the Fund contained breakpoints that would reduce the fee rate on assets above specified threshold levels.
In considering these matters, the Committee and the Board also considered the costs of the services provided and the profitability to the Investment Manager and its affiliates from their relationships with the Fund, as discussed above. After reviewing these and related factors, the Committee and the Board concluded, within the context of their overall conclusions, that the extent to which any economies of scale were expected to be shared with the Fund supported the approval of the Management Agreement and the continuation of the Advisory Agreement.
Other Benefits to the Investment Manager
The Committee and the Board received and considered information regarding "fall-out" or ancillary benefits received by the Investment Manager and its affiliates as a result of their relationships with the Fund, such as the engagement of the Investment Manager to provide administrative services to the Fund and the engagement of the Investment Manager's affiliates to provide distribution and transfer agency services to the Fund. In this regard, among other matters, the Committee and the Board considered that the Fund's distributor retains a portion of the distribution fees from the Fund and receives a portion of the sales charges on sales or redemptions of certain classes of shares of the Fund. The Committee and the Board also considered the benefits of research made available to the Investment Manager by reason of brokerage commissions generated by the Fund's securities transactions, and reviewed information about the Investment Manager's practices with respect to allocating portfolio transactions for brokerage and research services. The Committee and the Board considered the possible conflicts of interest associated with certain fall-out or other ancillary benefits and the reporting, disclosure and other processes that are in place to address such possible conflicts of interest. The Committee and the Board recognized that the Investment Manager's profitability would be somewhat lower without these benefits.
Conclusion
The Committee and the Board reviewed all of the above considerations in reaching their decisions to recommend or approve the Management Agreement and the continuation of the Advisory Agreement. In their deliberations, the Trustees did not identify any particular information that was all-important or controlling, and individual Trustees may have attributed different weights to the various factors. Based on their evaluation of all factors that they deemed to be material, including those factors described above, and assisted by the advice of independent legal counsel, the Board, including the Independent Trustees, voting separately, unanimously approved the Management Agreement and the continuation of the Advisory Agreement.
Annual Report 2015
48
COLUMBIA CONTRARIAN CORE FUND
IMPORTANT INFORMATION ABOUT THIS REPORT
Each fund mails one shareholder report to each shareholder address. If you would like more than one report, please call shareholder services at 800.345.6611 and additional reports will be sent to you.
The policy of the Board is to vote the proxies of the companies in which each fund holds investments consistent with the procedures as stated in the Statement of Additional Information (SAI). You may obtain a copy of the SAI without charge by calling 800.345.6611; contacting your financial intermediary; visiting columbiathreadneedle.com/us; or searching the website of the Securities and Exchange Commission (SEC) at sec.gov. Information regarding how each fund voted proxies relating to portfolio securities is filed with the SEC by August 31st for the most recent 12-month period ending June 30th of that year, and is available without charge by visiting columbiathreadneedle.com/us, or searching the website of the SEC at sec.gov.
Each fund files a complete schedule of portfolio holdings with the SEC for the first and third quarters of each fiscal year on Form N-Q. Each fund's Form N-Q is available on the SEC's website at sec.gov and may be reviewed and copied at the SEC's Public Reference Room in Washington, D.C. Information on the operation of the Public Reference Room may be obtained by calling 800.SEC.0330. Each fund's complete schedule of portfolio holdings, as filed on Form N-Q, can also be obtained without charge, upon request, by calling 800.345.6611.
Annual Report 2015
49
Columbia Contrarian Core Fund
P.O. Box 8081
Boston, MA 02266-8081

This information is for use with concurrent or prior delivery of a fund prospectus. Please read and consider the investment objectives, risks, charges and expenses for any fund carefully before investing. For a prospectus and summary prospectus, which contains this and other important information about the Fund, go to columbiathreadneedle.com/us. The Fund is distributed by Columbia Management Investment Distributors, Inc., member FINRA, and managed by Columbia Management Investment Advisers, LLC.
Columbia Threadneedle Investments (Columbia Threadneedle) is the global brand name of the Columbia and Threadneedle group of companies.
All rights reserved. Columbia Management Investment Distributors, Inc., 225 Franklin Street, Boston, MA 02110-2804
© 2015 Columbia Management Investment Advisers, LLC.
columbiathreadneedle.com/us
ANN133_08_E01_(10/15)

ANNUAL REPORT
August 31, 2015

COLUMBIA GREATER CHINA FUND


ABOUT COLUMBIA THREADNEEDLE INVESTMENTS
Columbia Threadneedle Investments is a leading global asset management group that provides a broad range of actively managed investment strategies and solutions for individual, institutional and corporate clients around the world.
With more than 2,000 people, including over 450 investment professionals based in North America, Europe and Asia, we manage $503 billion* of assets across developed and emerging market equities, fixed income, asset allocation solutions and alternatives. We are the 13th largest manager of long-term mutual fund assets in the U.S.** and the 4th largest manager of retail funds in the U.K.***
Our priority is the investment success of our clients. We aim to deliver the investment outcomes they expect through an investment approach that is team-based, performance-driven and risk-aware. Our culture is dynamic and interactive. By sharing our insights across asset classes and geographies, we generate richer perspectives on global, regional and local investment landscapes. The ability to exchange and debate investment ideas in a collaborative environment enriches our teams' investment processes. More importantly, it results in better informed investment decisions for our clients.
Columbia funds are distributed by Columbia Management Investment Distributors, Inc., member FINRA, and managed by Columbia Management Investment Advisers, LLC.
Columbia Threadneedle Investments (Columbia Threadneedle) is the global brand name of the Columbia and Threadneedle group of companies.
* In U.S. dollars as of June 30, 2015. Source: Ameriprise Q2 Earnings Release. Includes all assets managed by entities in the Columbia and Threadneedle groups of companies. Contact us for more current data.
** Source: ICI as of June 30, 2015 for Columbia Management Investment Advisers, LLC.
*** Source: Investment Association as of June 2015 for Threadneedle Asset Management Limited.
© 2015 Columbia Management Investment Advisers, LLC. All rights reserved.
Not part of the shareholder report
Get the market insight you need from our investment experts
Connect with Columbia Threadneedle Investments
Investor insight
Find economic and market commentary, investment videos, white papers, mutual fund commentary and more at columbiathreadneedle.com/us.
 Columbia Threadneedle Investor Newsletter (e-newsletter)
Read our award-winning* shareholder newsletter. Our quarterly newsletter is available online and provides timely and relevant content about economic trends, fund news, service enhancements and changes. Sign up to receive the newsletter electronically at columbiathreadneedle.com/
us/newsletter.

 Investment videos
Get analysis of current events and trends that may affect your investments. Visit our online video library to watch and discover what our thought leaders are saying about the financial markets and economy.
 Social media
We offer you multiple ways to access our market commentary and investment insights.
n Perspectives blog at columbiathreadneedle.com/us
Read timely posts by our investment team, including our chief investment officer, chief economist and portfolio managers.
n twitter.com/CTinvest_US
Follow us on Twitter for quick, up-to-the-minute comments on market news and more.
n youtube.com/CTinvestUS
View our commentaries on the economy, markets and current investment opportunities.
n linkedin.com/company/columbia-threadneedle-investments-us
Connect with us on LinkedIn for updates from our thought leaders.
*Columbia Threadneedle Investor Newsletter was awarded top honors in the Mutual Fund Education Alliance STAR Awards competition for excellence in mutual fund marketing and communications in 2011, 2012 and 2013. Materials in the competition were evaluated on educational value, message comprehension, effective design and objectives.
Not part of the shareholder report
 Dear Shareholder,
Today's investors are typically focused on outcomes, like living a certain retirement lifestyle, paying for college education or building a legacy. But in today's complex global investment landscape, even simple goals are not easily achieved.
At Columbia Threadneedle Investments, we aspire to help satisfy five core needs of today's investors:
n Generate an appropriate stream of income in retirement
Traditional approaches to generating income may not provide the diversification benefits they once did, and they may actually introduce unwanted risk in today's market. To seek to improve your potential to live comfortably long term, we endeavor to pursue investments that explore less traveled paths to income.
n Navigate a changing interest rate environment
Today's uncertain market environment includes the prospect of a rise in interest rates. Blending traditional investments with non-traditional or alternative products may help protect your wealth during periods of volatility. We can attempt to help strengthen your portfolio with agile products designed to take on the market's ups and downs.
n Maximize after-tax returns
In an environment where what you keep may be more important than what you earn, municipal bonds can help mitigate high tax burdens while providing potentially attractive yields. Our state and federal tax-exempt products are aimed at helping investors manage risk, minimize the fluctuation of capital and grow wealth on a more tax-efficient basis.
n Grow assets to achieve financial goals
We believe that finding and protecting growth comes from a disciplined security selection process designed to create excess return. Our goal is to provide investment solutions built to help you face today's market challenges and grow your assets at each crossroad of your journey.
n Ease the impact of volatile markets
Despite a bull market run that has benefited many investors over the past several years, it's important to remember the lessons of 2008 and the value that a well-diversified portfolio may provide through times of market volatility. We are here to help you hold onto the savings you have worked tirelessly to amass, and to provide you the best opportunity to maintain your standard of living regardless of market conditions.
Find out today how we can help you confidently invest to realize your dreams. Please visit us at blog.columbiathreadneedleus.com/our-best-ideas to learn more about our unique investment solutions.
The world is constantly changing, but our priority remains the same: to help you secure your finances, meet your goals and achieve success. Thank you for your continued investment with us.
Sincerely,

Christopher O. Petersen
President, Columbia Funds
Investors should consider the investment objectives, risks, charges and expenses of a mutual fund carefully before investing. For a free prospectus and summary prospectus, which contains this and other important information about a fund, visit columbiathreadneedle.com/us. The prospectus should be read carefully before investing.
Columbia Funds are distributed by Columbia Management Investment Distributors, Inc., member FINRA, and managed by Columbia Management Investment Advisers, LLC.
© 2015 Columbia Management Investment Advisers, LLC. All rights reserved.
COLUMBIA GREATER CHINA FUND
Performance Overview | | | 2 | | |
Manager Discussion of Fund Performance | | | 4 | | |
Understanding Your Fund's Expenses | | | 7 | | |
Portfolio of Investments | | | 8 | | |
Statement of Assets and Liabilities | | | 12 | | |
Statement of Operations | | | 14 | | |
Statement of Changes in Net Assets | | | 15 | | |
Financial Highlights | | | 17 | | |
Notes to Financial Statements | | | 25 | | |
Report of Independent Registered
Public Accounting Firm | | | 33 | | |
Federal Income Tax Information | | | 34 | | |
Trustees and Officers | | | 35 | | |
Board Consideration and Approval of Advisory Agreement | | | 39 | | |
Important Information About This Report | | | 43 | | |
Fund Investment Manager
Columbia Management Investment
Advisers, LLC
225 Franklin Street
Boston, MA 02110
Fund Distributor
Columbia Management Investment
Distributors, Inc.
225 Franklin Street
Boston, MA 02110
Fund Transfer Agent
Columbia Management Investment
Services Corp.
P.O. Box 8081
Boston, MA 02266-8081
For more information about any of the funds, please visit columbiathreadneedle.com/us or call 800.345.6611. Customer Service Representatives are available to answer your questions Monday through Friday from 8 a.m. to 7 p.m. Eastern time.
The views expressed in this report reflect the current views of the respective parties. These views are not guarantees of future performance and involve certain risks, uncertainties and assumptions that are difficult to predict, so actual outcomes and results may differ significantly from the views expressed. These views are subject to change at any time based upon economic, market or other conditions and the respective parties disclaim any responsibility to update such views. These views may not be relied on as investment advice and, because investment decisions for a Columbia fund are based on numerous factors, may not be relied on as an indication of trading intent on behalf of any particular Columbia fund. References to specific securities should not be construed as a recommendation or investment advice.
Annual Report 2015
COLUMBIA GREATER CHINA FUND
Performance Summary
n Columbia Greater China Fund (the Fund) Class A shares returned -9.49% excluding sales charges for the 12-month period that ended August 31, 2015.
n During the same 12-month period, the Fund performed roughly in line with the MSCI China Index (Net) benchmark return of -9.34%, and exceeded the Hang Seng Index return of -12.41%.
n Security selection was the biggest positive contributor to the Fund's performance vs. the MSCI China Index (Net), with particularly strong returns in the financials and telecommunications services sectors. Selection within industrials and information technology lagged.
Average Annual Total Returns (%) (for period ended August 31, 2015)
| | | Inception | | 1 Year | | 5 Years | | 10 Years | |
Class A | | 05/16/97 | | | | | | | | | | | | | |
Excluding sales charges | | | | | | | -9.49 | | | | 2.88 | | | | 9.70 | | |
Including sales charges | | | | | | | -14.69 | | | | 1.67 | | | | 9.05 | | |
Class B | | 05/16/97 | | | | | | | | | | | | | |
Excluding sales charges | | | | | | | -10.16 | | | | 2.10 | | | | 8.88 | | |
Including sales charges | | | | | | | -13.73 | | | | 1.87 | | | | 8.88 | | |
Class C | | 05/16/97 | | | | | | | | | | | | | |
Excluding sales charges | | | | | | | -10.16 | | | | 2.11 | | | | 8.88 | | |
Including sales charges | | | | | | | -10.88 | | | | 2.11 | | | | 8.88 | | |
Class I* | | 08/02/11 | | | -9.07 | | | | 3.26 | | | | 9.90 | | |
Class R4* | | 03/19/13 | | | -9.26 | | | | 3.00 | | | | 9.76 | | |
Class R5* | | 11/08/12 | | | -9.11 | | | | 3.10 | | | | 9.82 | | |
Class W* | | 06/18/12 | | | -9.48 | | | | 2.91 | | | | 9.72 | | |
Class Z | | 05/16/97 | | | -9.24 | | | | 3.14 | | | | 9.98 | | |
MSCI China Index (Net) | | | | | | | -9.34 | | | | 2.14 | | | | 10.49 | | |
Hang Seng Index | | | | | | | -12.41 | | | | 1.15 | | | | 3.84 | | |
Returns for Class A are shown with and without the maximum initial sales charge of 5.75%. Returns for Class B are shown with and without the applicable contingent deferred sales charge (CDSC) of 5.00% in the first year, declining to 1.00% in the sixth year and eliminated thereafter. Returns for Class C are shown with and without the 1.00% CDSC for the first year only. The Fund's other classes are not subject to sales charges and have limited eligibility. Please see the Fund's prospectus for details. Performance for different share classes will vary based on differences in sales charges and fees associated with each class. All results shown assume reinvestment of distributions during the period. Returns do not reflect the deduction of taxes that a shareholder may pay on Fund distributions or on the redemption of Fund shares. Performance results reflect the effect of any fee waivers or reimbursements of Fund expenses by Columbia Management Investment Advisers, LLC and/or any of its affiliates. Absent these fee waivers or expense reimbursement arrangements, performance results would have been lower.
The performance information shown represents past performance and is not a guarantee of future results. The investment return and principal value of your investment will fluctuate so that your shares, when redeemed, may be worth more or less than their original cost. Current performance may be lower or higher than the performance information shown. You may obtain performance information current to the most recent month-end by contacting your financial intermediary, visiting columbiathreadneedle.com/us or calling 800.345.6611.
*The returns shown for periods prior to the share class inception date (including returns for the Life of the Fund, if shown, which are since Fund inception) include the returns of the Fund's oldest share class. Since the Fund launched more than one share class at its inception, Class A shares were used. These returns are adjusted to reflect any higher class-related operating expenses of the newer share classes, as applicable. Please visit columbiathreadneedle.com/us/investment-products/mutual-funds/appended-performance for more information.
The MSCI China Index (Net) is designed to broadly and fairly represent the full diversity of business activities in China. This index aims to capture 85% of the free float adjusted market capitalization in each industry group.
The Hang Seng Index tracks the performance of approximately 70% of the total market capitalization of the stock exchange of Hong Kong.
Indices are not available for investment, are not professionally managed and do not reflect sales charges, fees, brokerage commissions, taxes (except the MSCI China Index (Net) which reflects reinvested dividends net of withholding taxes) or other expenses of investing. Securities in the Fund may not match those in an index.
Annual Report 2015
2
COLUMBIA GREATER CHINA FUND
PERFORMANCE OVERVIEW (continued)
Performance of a Hypothetical $10,000 Investment (September 1, 2005 – August 31, 2015)

The chart above shows the change in value of a hypothetical $10,000 investment in Class A shares of Columbia Greater China Fund during the stated time period, and does not reflect the deduction of taxes that a shareholder may pay on Fund distributions or on the redemption of Fund shares.
Annual Report 2015
3
COLUMBIA GREATER CHINA FUND
MANAGER DISCUSSION OF FUND PERFORMANCE
Portfolio Management
Jasmine (Weili) Huang, CFA, CPA
(U.S. and China), CFM
Morningstar Style BoxTM
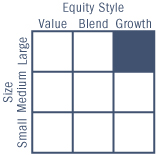
The Morningstar Style BoxTM is based on a fund's portfolio holdings. For equity funds, the vertical axis shows the market capitalization of the stocks owned, and the horizontal axis shows investment style (value, blend, or growth). Information shown is based on the most recent data provided by Morningstar.
© 2015 Morningstar, Inc. All rights reserved. The Morningstar information contained herein: (1) is proprietary to Morningstar and/or its content providers; (2) may not be copied or distributed; and (3) is not warranted to be accurate, complete or timely. Neither Morningstar nor its content providers are responsible for any damages or losses arising from any use of this information.
For the 12-month period that ended August 31, 2015, the Fund's Class A shares returned -9.49% excluding sales charges. The Fund's performance was roughly in line with the MSCI China Index (Net) benchmark return of -9.34%, and exceeded the Hang Seng Index return of -12.41%, for the same 12-month period. Security selection was the biggest positive contributor to performance vs. the MSCI China Index (Net), with particularly strong returns in the financials and telecommunications services sectors. Selection within industrials and information technology lagged.
Chinese Equities Were Volatile on Growth, Currency Concerns
The first several months of the Fund's fiscal period saw a strong upward trend in Chinese equities. Positive sentiment was driven in large part by a relaxation in monetary policy, as the government sought to maintain growth at acceptable levels while moving toward a more sustainable economic model. In this vein, the People's Bank of China cut its base reference rate, as well as the reserve requirement ratio for banks, multiple times throughout the period. In addition, investor sentiment benefited as the government engaged in targeted stimulus efforts with respect to infrastructure and other key sectors. Outsized returns in the domestic Chinese equity market were driven by a new mechanism to enable foreign financial institutions to invest onshore, and also added to performance of the offshore China equity markets in which the Fund principally invests.
However, Chinese equities experienced a sharp reversal over the last few months of the period. Domestically traded "A shares" in particular gave up much of their gains, in part over concerns that valuations had become extended. In addition, a government crackdown on margin financing in the wake of speculative domestic investors taking margin loans to pile into equities rattled the market. On a more fundamental level, a stream of weakening data led to concerns that the government's efforts at stimulus were in danger of failing to maintain growth at levels sufficient to support a smooth transition to a more consumer-driven economy.
Toward the end of the period, markets reacted with alarm as the Chinese government allowed the renminbi to depreciate. While the government stated that the goal was to move toward a more market-based regime, equity volatility spiked on fears that any competitive devaluation designed to stimulate Chinese exports could spark a global currency war. Ultimately, it was established that the renminbi's valuation would be maintained within a range tied to the U.S. dollar, helping to stabilize sentiment.
A Focus on Secular Growth Opportunities
Stock selection decisions in aggregate made the most significant positive contribution to the Fund's returns vs. the MSCI benchmark. In particular, selection was positive within the financials and telecommunications sectors. Conversely, picks within the industrials and information technology sectors lagged. With respect to sector allocations, an underweight to energy was the leading contributor, followed by overweight positions in health care and information technology. An above-benchmark
Annual Report 2015
4
COLUMBIA GREATER CHINA FUND
MANAGER DISCUSSION OF FUND PERFORMANCE (continued)
position in consumer discretionary and a below-benchmark position in financials both detracted from relative performance. The Fund's sector weights are driven by our long-term focus on areas of China's economy positioned to benefit from secular, as opposed to cyclical, growth trends.
With respect to individual stocks, leading contributors included underweight exposure to leading Chinese oil companies China Petroleum & Chemical Corp. (widely known as "Sinopec") and CNOOC Ltd, as the slide in oil prices took a toll on shares for both. The Fund's position in brokerage firm Haitong Securities Co. was a top contributor as well. We held the stock as it benefited from a surging equity market, and sold out of the position at a profit before period-end. China Biologic Products, Inc., a blood plasma-based pharmaceutical company, also performed well. The company has benefited from being in a high-barrier-to-entry niche within the expanding Chinese health care market, and has displayed consistently strong earnings growth. Finally, Zhuzhou CSR Times Electric Co. Ltd., a manufacturer of components for high speed trains, is well-positioned to benefit from accelerated railway construction in China, and saw its shares boosted in the period by the merger of China's two leading train manufacturers.
On the downside, search engine firm Baidu and online retailer Alibaba were leading detractors. After a period of strong outperformance, shares for both suffered as the market rotated toward other sectors, such as financials and industrials, which are viewed as positioned to benefit from an anticipated macro-level economic recovery. In addition, near-term results for internet-based companies have been hurt by the drive to invest in mobile-based platforms, as smartphones continue to gain penetration among Chinese consumers. A pair of casino stocks closely tied to the fortunes of the resort city of Macau were also among the leading detractors. Shares for both Galaxy Entertainment and Sands China fell in the wake of a governmental anti-corruption campaign that dampened gaming revenues.
Structural Slowdown as Chinese Economy Rebalances
While China is undergoing a structural slowing in overall activity, we do not currently anticipate a collapsing economy. More importantly, we continue to invest in China on the basis of long-term, secular growth ideas. This means overweighting areas of the Chinese economy with substantial room for further penetration, such as information technology, the internet, health care and consumer discretionary. We also have selective exposure at this time to export-driven companies with a strong position in the global supply chain. By contrast, we are currently underweighting financials, energy and materials.
The Chinese economy is undergoing a rebalancing, evidenced by increased divergence in growth rates among GDP components. Traditional indicators such as industrial production, power demand and freight volumes have been softening, even as consumer- and service-oriented "new economy" industries such as entertainment, travel and mobile technology have expanded significantly. The process of rebalancing will likely take several more years. The concern for financial markets is whether the growth underway in Chinese consumption will be sufficient to
Top Ten Holdings (%)
(at August 31, 2015) | |
Tencent Holdings Ltd. | | | 14.3 | | |
China Mobile Ltd. | | | 9.9 | | |
Ping An Insurance Group Co.
of China Ltd., Class H | | | 5.0 | | |
Industrial & Commercial Bank
of China Ltd., Class H | | | 4.6 | | |
China Construction Bank Corp.,
Class H | | | 4.4 | | |
Bank of China Ltd., Class H | | | 4.2 | | |
China Life Insurance Co., Ltd.,
Class H | | | 3.7 | | |
CSPC Pharmaceutical
Group Ltd. | | | 3.3 | | |
Zhuzhou CSR Times Electric
Co., Ltd., Class H | | | 3.3 | | |
Vipshop Holdings Ltd., ADR | | | 3.0 | | |
Percentages indicated are based upon total investments.
For further detail about these holdings, please refer to the section entitled "Portfolio of Investments."
Fund holdings are as of the date given, are subject to change at any time, and are not recommendations to buy or sell any security.
Country Breakdown (%)
(at August 31, 2015) | |
China | | | 96.0 | | |
Hong Kong | | | 3.4 | | |
Taiwan | | | 0.6 | | |
Total | | | 100.0 | | |
Country Breakdown is based primarily on issuer's place of organization/incorporation. Percentages indicated are based upon total investments. The Fund's portfolio composition is subject to change.
Annual Report 2015
5
COLUMBIA GREATER CHINA FUND
MANAGER DISCUSSION OF FUND PERFORMANCE (continued)
Equity Sector Breakdown (%)
(at August 31, 2015) | |
Consumer Discretionary | | | 10.7 | | |
Consumer Staples | | | 1.4 | | |
Energy | | | 1.8 | | |
Financials | | | 31.1 | | |
Health Care | | | 12.3 | | |
Industrials | | | 5.5 | | |
Information Technology | | | 24.0 | | |
Telecommunication Services | | | 9.9 | | |
Utilities | | | 3.3 | | |
Total | | | 100.0 | | |
Percentages indicated are based upon total equity investments. The Fund's portfolio composition is subject to change.
Investment Risks
Market risk may affect a single issuer, sector of the economy, industry or the market as a whole. International investing involves certain risks and volatility due to potential political, economic or currency instabilities and different financial and accounting standards. Risks are enhanced for emerging market issuers. Concentration in the Greater China region, where issuers tend to be less developed than U.S. issuers, presents increased risk of loss than a fund that does not concentrate its investments. Investments in small and mid-cap companies involve risks and volatility greater than investments in larger, more established companies. As a non-diversified fund, fewer investments could have a greater affect on performance. See the Fund's prospectus for information on these and other risks.
counter the slowdown in the old economy. The apparent strong services sector growth and under-levered Chinese household could cushion any gradual consumption slowdown.
The real estate sector, a major component of the Chinese economy, has been on an upward trend as gauged by sales volume and, more recently, prices. Finally, we do not view a competitive devaluation of the renminbi as a likely outcome of China's efforts to maintain economic stability through the current transition. The country's leaders are aware that a cheaper currency would be counter to the goal of realigning the economy away from low-end manufacturing and towards consumption and innovation to drive long-term growth. On balance, despite near-term challenges, we remain optimistic regarding the Chinese economy and the investment opportunities it presents.
Annual Report 2015
6
COLUMBIA GREATER CHINA FUND
UNDERSTANDING YOUR FUND'S EXPENSES
(Unaudited)
As an investor, you incur two types of costs. There are transaction costs, which generally include sales charges on purchases and may include redemption fees. There are also ongoing costs, which generally include management fees, distribution and/or service fees, and other fund expenses. The following information is intended to help you understand your ongoing costs (in dollars) of investing in the Fund and to help you compare these costs with the ongoing costs of investing in other mutual funds.
Analyzing Your Fund's Expenses
To illustrate these ongoing costs, we have provided examples and calculated the expenses paid by investors in each share class of the Fund during the period. The actual and hypothetical information in the table is based on an initial investment of $1,000 at the beginning of the period indicated and held for the entire period. Expense information is calculated two ways and each method provides you with different information. The amount listed in the "Actual" column is calculated using the Fund's actual operating expenses and total return for the period. You may use the Actual information, together with the amount invested, to estimate the expenses that you paid over the period. Simply divide your account value by $1,000 (for example, an $8,600 account value divided by $1,000 = 8.6), then multiply the results by the expenses paid during the period under the "Actual" column. The amount listed in the "Hypothetical" column assumes a 5% annual rate of return before expenses (which is not the Fund's actual return) and then applies the Fund's actual expense ratio for the period to the hypothetical return. You should not use the hypothetical account values and expenses to estimate either your actual account balance at the end of the period or the expenses you paid during the period. See "Compare With Other Funds" below for details on how to use the hypothetical data.
Compare With Other Funds
Since all mutual funds are required to include the same hypothetical calculations about expenses in shareholder reports, you can use this information to compare the ongoing cost of investing in the Fund with other funds. To do so, compare the hypothetical example with the 5% hypothetical examples that appear in the shareholder reports of other funds. As you compare hypothetical examples of other funds, it is important to note that hypothetical examples are meant to highlight the ongoing costs of investing in a fund only and do not reflect any transaction costs, such as sales charges, or redemption or exchange fees. Therefore, the hypothetical calculations are useful in comparing ongoing costs only, and will not help you determine the relative total costs of owning different funds. If transaction costs were included in these calculations, your costs would be higher.
March 1, 2015 – August 31, 2015
| | | Account Value at the Beginning
of the Period ($) | | Account Value at the End of the
Period ($) | | Expenses Paid During the
Period ($) | | Fund's Annualized
Expense Ratio (%) | |
| | | Actual | | Hypothetical | | Actual | | Hypothetical | | Actual | | Hypothetical | | Actual | |
Class A | | | 1,000.00 | | | | 1,000.00 | | | | 873.00 | | | | 1,017.49 | | | | 7.36 | | | | 7.92 | | | | 1.55 | | |
Class B | | | 1,000.00 | | | | 1,000.00 | | | | 869.70 | | | | 1,013.74 | | | | 10.85 | | | | 11.69 | | | | 2.29 | | |
Class C | | | 1,000.00 | | | | 1,000.00 | | | | 869.90 | | | | 1,013.68 | | | | 10.90 | | | | 11.74 | | | | 2.30 | | |
Class I | | | 1,000.00 | | | | 1,000.00 | | | | 875.00 | | | | 1,019.62 | | | | 5.37 | | | | 5.78 | | | | 1.13 | | |
Class R4 | | | 1,000.00 | | | | 1,000.00 | | | | 874.10 | | | | 1,018.80 | | | | 6.13 | | | | 6.60 | | | | 1.29 | | |
Class R5 | | | 1,000.00 | | | | 1,000.00 | | | | 874.70 | | | | 1,019.51 | | | | 5.46 | | | | 5.89 | | | | 1.15 | | |
Class W | | | 1,000.00 | | | | 1,000.00 | | | | 873.00 | | | | 1,017.38 | | | | 7.45 | | | | 8.03 | | | | 1.57 | | |
Class Z | | | 1,000.00 | | | | 1,000.00 | | | | 874.10 | | | | 1,018.80 | | | | 6.13 | | | | 6.60 | | | | 1.29 | | |
Expenses paid during the period are equal to the annualized expense ratio for each class as indicated above, multiplied by the average account value over the period and then multiplied by the number of days in the Fund's most recent fiscal half year and divided by 365.
Expenses do not include fees and expenses incurred indirectly by the Fund from its investment in underlying funds, including affiliated and non-affiliated pooled investment vehicles, such as mutual funds and exchange-traded funds.
Annual Report 2015
7
COLUMBIA GREATER CHINA FUND
PORTFOLIO OF INVESTMENTS
August 31, 2015
(Percentages represent value of investments compared to net assets)
Common Stocks 100.2%
Issuer | | Shares | | Value ($) | |
CONSUMER DISCRETIONARY 10.7% | |
Auto Components 1.0% | |
Fuyao Glass Industry Group Co., Ltd.
Class H(a) | | | 689,600 | | | | 1,271,795 | | |
Automobiles 2.1% | |
Brilliance China Automotive Holdings Ltd. | | | 524,000 | | | | 632,952 | | |
Chongqing Changan Automobile Co.,
Ltd., Class B | | | 1,345,500 | | | | 2,133,382 | | |
Total | | | | | 2,766,334 | | |
Hotels, Restaurants & Leisure 1.8% | |
Galaxy Entertainment Group Ltd. | | | 378,000 | | | | 1,211,008 | | |
Sands China Ltd. | | | 306,000 | | | | 1,063,600 | | |
Total | | | | | 2,274,608 | | |
Internet & Catalog Retail 3.8% | |
JD.com, Inc. ADR(a) | | | 41,244 | | | | 1,067,395 | | |
Vipshop Holdings Ltd., ADR(a) | | | 211,381 | | | | 3,802,744 | | |
Total | | | | | 4,870,139 | | |
Textiles, Apparel & Luxury Goods 2.0% | |
Shenzhou International Group
Holdings Ltd. | | | 505,000 | | | | 2,549,532 | | |
Total Consumer Discretionary | | | | | 13,732,408 | | |
CONSUMER STAPLES 1.4% | |
Food & Staples Retailing 0.7% | |
China Resources Enterprise Ltd. | | | 266,000 | | | | 835,146 | | |
Food Products 0.7% | |
China Mengniu Dairy Co., Ltd. | | | 273,000 | | | | 954,492 | | |
Total Consumer Staples | | | | | 1,789,638 | | |
ENERGY 1.9% | |
Oil, Gas & Consumable Fuels 1.9% | |
CNOOC Ltd. | | | 1,146,500 | | | | 1,437,099 | | |
PetroChina Co., Ltd., Class H | | | 1,132,000 | | | | 942,990 | | |
Total | | | | | 2,380,089 | | |
Total Energy | | | | | 2,380,089 | | |
FINANCIALS 31.1% | |
Banks 13.2% | |
Bank of China Ltd., Class H | | | 11,820,000 | | | | 5,383,618 | | |
Common Stocks (continued)
Issuer | | Shares | | Value ($) | |
China Construction Bank Corp.,
Class H | | | 7,987,340 | | | | 5,604,653 | | |
Industrial & Commercial Bank of
China Ltd., Class H | | | 10,120,000 | | | | 5,925,120 | | |
Total | | | | | 16,913,391 | | |
Insurance 12.2% | |
AIA Group Ltd. | | | 233,800 | | | | 1,291,768 | | |
China Life Insurance Co., Ltd.,
Class H | | | 1,384,000 | | | | 4,728,529 | | |
China Pacific Insurance Group Co., Ltd.,
Class H | | | 481,200 | | | | 1,745,497 | | |
PICC Property & Casualty Co., Ltd.,
Class H | | | 796,000 | | | | 1,509,877 | | |
Ping An Insurance Group Co. of
China Ltd., Class H | | | 1,321,000 | | | | 6,451,462 | | |
Total | | | | | 15,727,133 | | |
Real Estate Management & Development 5.7% | |
China Overseas Land & Investment Ltd. | | | 622,320 | | | | 1,822,787 | | |
China Vanke Co., Ltd., Class H | | | 1,054,410 | | | | 2,400,833 | | |
Dalian Wanda Commercial
Properties Co., Ltd., Class H | | | 501,300 | | | | 3,091,779 | | |
Total | | | | | 7,315,399 | | |
Total Financials | | | | | 39,955,923 | | |
HEALTH CARE 12.3% | |
Biotechnology 3.4% | |
3SBio, Inc.(a) | | | 723,000 | | | | 726,727 | | |
China Biologic Products, Inc.(a) | | | 37,850 | | | | 3,589,694 | | |
Total | | | | | 4,316,421 | | |
Health Care Providers & Services 0.6% | |
Harmonicare Medical Holdings Ltd.(a) | | | 1,238,000 | | | | 825,860 | | |
Pharmaceuticals 8.3% | |
China Animal Healthcare Ltd.(a)(b)(c) | | | 1,050,000 | | | | 326,514 | | |
China Medical System Holdings Ltd. | | | 2,230,000 | | | | 2,428,220 | | |
China Traditional Chinese
Medicine Co., Ltd.(a) | | | 4,492,000 | | | | 3,130,704 | | |
CSPC Pharmaceutical Group Ltd. | | | 4,590,000 | | | | 4,224,341 | | |
Sihuan Pharmaceutical
Holdings Group Ltd.(b)(c) | | | 2,697,000 | | | | 549,837 | | |
Total | | | | | 10,659,616 | | |
Total Health Care | | | | | 15,801,897 | | |
The accompanying Notes to Financial Statements are an integral part of this statement.
Annual Report 2015
8
COLUMBIA GREATER CHINA FUND
PORTFOLIO OF INVESTMENTS (continued)
August 31, 2015
Common Stocks (continued)
Issuer | | Shares | | Value ($) | |
INDUSTRIALS 5.5% | |
Commercial Services & Supplies 1.0% | |
Dongjiang Environmental Co. Ltd.
Class H | | | 843,500 | | | | 1,263,209 | | |
Construction & Engineering 1.3% | |
Beijing Urban Construction Design &
Development Group Co., Ltd. Class H | | | 3,315,000 | | | | 1,669,544 | | |
Electrical Equipment 3.2% | |
Zhuzhou CSR Times Electric Co., Ltd.,
Class H | | | 636,000 | | | | 4,183,472 | | |
Total Industrials | | | | | 7,116,225 | | |
INFORMATION TECHNOLOGY 24.0% | |
Electronic Equipment, Instruments & Components 1.4% | |
Pax Global Technology Ltd. | | | 1,926,000 | | | | 1,792,301 | | |
Internet Software & Services 22.1% | |
58.Com, Inc., ADR(a) | | | 46,955 | | | | 2,134,574 | | |
Alibaba Group Holding Ltd., ADR(a) | | | 53,388 | | | | 3,530,015 | | |
Baidu, Inc., ADR(a) | | | 25,061 | | | | 3,690,232 | | |
NetEase, Inc., ADR | | | 5,111 | | | | 568,241 | | |
Tencent Holdings Ltd. | | | 1,099,300 | | | | 18,410,006 | | |
Total | | | | | 28,333,068 | | |
Common Stocks (continued)
Issuer | | Shares | | Value ($) | |
Technology Hardware, Storage & Peripherals 0.5% | |
Catcher Technology Co., Ltd. | | | 71,000 | | | | 725,815 | | |
Total Information Technology | | | | | 30,851,184 | | |
TELECOMMUNICATION SERVICES 10.0% | |
Wireless Telecommunication Services 10.0% | |
China Mobile Ltd. | | | 1,061,500 | | | | 12,767,825 | | |
Total Telecommunication Services | | | | | 12,767,825 | | |
UTILITIES 3.3% | |
Gas Utilities 2.3% | |
China Gas Holdings Ltd. | | | 470,000 | | | | 688,063 | | |
ENN Energy Holdings Ltd. | | | 452,000 | | | | 2,308,947 | | |
Total | | | | | 2,997,010 | | |
Water Utilities 1.0% | |
CT Environmental Group Ltd. | | | 3,852,360 | | | | 1,263,224 | | |
Total Utilities | | | | | 4,260,234 | | |
Total Common Stocks
(Cost: $109,107,870) | | | | | 128,655,423 | | |
Total Investments
(Cost: $109,107,870) | | | | | 128,655,423 | (d) | |
Other Assets & Liabilities, Net | | | | | (283,137 | ) | |
Net Assets | | | | | 128,372,286 | | |
Notes to Portfolio of Investments
(a) Non-income producing investment.
(b) Identifies securities considered by the Investment Manager to be illiquid and may be difficult to sell. The aggregate value of such securities at August 31, 2015 was $876,351, which represents 0.68% of net assets. Information concerning such security holdings at August 31, 2015 is as follows:
Security Description | | Acquisition Dates | | Cost ($) | |
China Animal Healthcare Ltd. | | 05/23/2014 - 12/10/2014 | | | 677,129 | | |
Sihuan Pharmaceutical Holdings Group Ltd. | | 09/17/2013 - 03/05/2015 | | | 1,461,383 | | |
(c) Represents fair value as determined in good faith under procedures approved by the Board of Trustees. At August 31, 2015, the value of these securities amounted to $876,351, which represents 0.68% of net assets.
(d) As defined in the Investment Company Act of 1940, an affiliated company is one in which the Fund owns 5% or more of the company's outstanding voting securities, or a company which is under common ownership or control with the Fund. Holdings and transactions in these affiliated companies during the year ended August 31, 2015 are as follows:
Issuer | | Beginning
Cost ($) | | Purchase
Cost ($) | | Proceeds
From Sales ($) | | Ending
Cost ($) | | Dividends —
Affiliated
Issuers ($) | | Value ($) | |
Columbia Short-Term Cash Fund | | | 3,793,843 | | | | 91,270,448 | | | | (95,064,291 | ) | | | — | | | | 4,378 | | | | — | | |
The accompanying Notes to Financial Statements are an integral part of this statement.
Annual Report 2015
9
COLUMBIA GREATER CHINA FUND
PORTFOLIO OF INVESTMENTS (continued)
August 31, 2015
Abbreviation Legend
ADR American Depositary Receipt
Fair Value Measurements
The Fund categorizes its fair value measurements according to a three-level hierarchy that maximizes the use of observable inputs and minimizes the use of unobservable inputs by prioritizing that the most observable input be used when available. Observable inputs are those that market participants would use in pricing an investment based on market data obtained from sources independent of the reporting entity. Unobservable inputs are those that reflect the Fund's assumptions about the information market participants would use in pricing an investment. An investment's level within the fair value hierarchy is based on the lowest level of any input that is deemed significant to the asset's or liability's fair value measurement. The input levels are not necessarily an indication of the risk or liquidity associated with investments at that level. For example, certain U.S. government securities are generally high quality and liquid, however, they are reflected as Level 2 because the inputs used to determine fair value may not always be quoted prices in an active market.
Fair value inputs are summarized in the three broad levels listed below:
> Level 1 — Valuations based on quoted prices for investments in active markets that the Fund has the ability to access at the measurement date (including NAV for open-end mutual funds). Valuation adjustments are not applied to Level 1 investments.
> Level 2 — Valuations based on other significant observable inputs (including quoted prices for similar securities, interest rates, prepayment speeds, credit risks, etc.).
> Level 3 — Valuations based on significant unobservable inputs (including the Fund's own assumptions and judgment in determining the fair value of investments).
Inputs that are used in determining fair value of an investment may include price information, credit data, volatility statistics, and other factors. These inputs can be either observable or unobservable. The availability of observable inputs can vary between investments, and is affected by various factors such as the type of investment, and the volume and level of activity for that investment or similar investments in the marketplace. The inputs will be considered by the Investment Manager, along with any other relevant factors in the calculation of an investment's fair value. The Fund uses prices and inputs that are current as of the measurement date, which may include periods of market dislocations. During these periods, the availability of prices and inputs may be reduced for many investments. This condition could cause an investment to be reclassified between the various levels within the hierarchy.
Foreign equity securities actively traded in markets where there is a significant delay in the local close relative to the New York Stock Exchange (NYSE) are classified as Level 2. The values of these securities may include an adjustment to reflect the impact of significant market movements following the close of local trading, as described in Note 2 to the financial statements — Security Valuation.
Investments falling into the Level 3 category are primarily supported by quoted prices from brokers and dealers participating in the market for those investments. However, these may be classified as Level 3 investments due to lack of market transparency and corroboration to support these quoted prices. Additionally, valuation models may be used as the pricing source for any remaining investments classified as Level 3. These models may rely on one or more significant unobservable inputs and/or significant assumptions by the Investment Manager. Inputs used in valuations may include, but are not limited to, financial statement analysis, capital account balances, discount rates and estimated cash flows, and comparable company data.
Under the direction of the Fund's Board of Trustees (the Board), the Investment Manager's Valuation Committee (the Committee) is responsible for overseeing the valuation procedures approved by the Board. The Committee consists of voting and non-voting members from various groups within the Investment Manager's organization, including operations and accounting, trading and investments, compliance, risk management and legal.
The Committee meets at least monthly to review and approve valuation matters, which may include a description of specific valuation determinations, data regarding pricing information received from approved pricing vendors and brokers and the results of Board-approved valuation control policies and procedures (the Policies). The Policies address, among other things, instances when market quotations are or are not readily available, including recommendations of third party pricing vendors and a determination of appropriate pricing methodologies; events that require specific valuation determinations and assessment of fair value techniques; securities with a potential for stale pricing, including those that are illiquid, restricted, or in default; and the effectiveness of third party pricing vendors, including periodic reviews of vendors. The Committee meets more frequently, as needed, to discuss additional valuation matters, which may include the need to review back-testing results, review time-sensitive information or approve related valuation actions. The Committee reports to the Board, with members of the Committee meeting with the Board at each of its regularly scheduled meetings to discuss valuation matters and actions during the period, similar to those described earlier.
For investments categorized as Level 3, the Committee monitors information similar to that described above, which may include: (i) data specific to the issuer or comparable issuers, (ii) general market or specific sector news and (iii) quoted prices and specific or similar security transactions. The Committee considers this data and any changes from prior periods in order to assess the reasonableness of observable and unobservable inputs, any assumptions or internal models used to value those securities and changes in fair value. This data is also used to corroborate, when available, information received from approved pricing vendors and brokers. Various factors impact the frequency of monitoring this information (which may occur as often as daily). However, the Committee may determine that changes to inputs, assumptions and models are not required as a result of the monitoring procedures performed.
The accompanying Notes to Financial Statements are an integral part of this statement.
Annual Report 2015
10
COLUMBIA GREATER CHINA FUND
PORTFOLIO OF INVESTMENTS (continued)
August 31, 2015
Fair Value Measurements (continued)
The following table is a summary of the inputs used to value the Fund's investments at August 31, 2015:
| | | Level 1
Quoted Prices in Active
Markets for Identical
Assets ($) | | Level 2
Other Significant
Observable Inputs ($) | | Level 3
Significant
Unobservable Inputs ($) | | Total ($) | |
Investments | |
Common Stocks | |
Consumer Discretionary | | | 4,870,139 | | | | 8,862,269 | | | | — | | | | 13,732,408 | | |
Consumer Staples | | | — | | | | 1,789,638 | | | | — | | | | 1,789,638 | | |
Energy | | | — | | | | 2,380,089 | | | | — | | | | 2,380,089 | | |
Financials | | | — | | | | 39,955,923 | | | | — | | | | 39,955,923 | | |
Health Care | | | 3,589,694 | | | | 11,335,852 | | | | 876,351 | | | | 15,801,897 | | |
Industrials | | | — | | | | 7,116,225 | | | | — | | | | 7,116,225 | | |
Information Technology | | | 9,923,062 | | | | 20,928,122 | | | | — | | | | 30,851,184 | | |
Telecommunication Services | | | — | | | | 12,767,825 | | | | — | | | | 12,767,825 | | |
Utilities | | | — | | | | 4,260,234 | | | | — | | | | 4,260,234 | | |
Total Common Stocks | | | 18,382,895 | | | | 109,396,177 | | | | 876,351 | | | | 128,655,423 | | |
Total Investments | | | 18,382,895 | | | | 109,396,177 | | | | 876,351 | | | | 128,655,423 | | |
See the Portfolio of Investments for all investment classifications not indicated in the table.
The Fund's assets assigned to the Level 2 input category are generally valued using the market approach, in which a security's value is determined through reference to prices and information from market transactions for similar or identical assets. These assets include certain foreign securities for which a third party statistical pricing service may be employed for purposes of fair market valuation. The model utilized by such third party statistical pricing service takes into account a security's correlation to available market data including, but not limited to, intraday index, ADR, and exchange-traded fund movements.
The Fund does not hold any significant investments (greater than one percent of net assets) categorized as Level 3.
The Fund's assets assigned to the Level 3 category are valued utilizing the valuation technique deemed the most appropriate in the circumstances. Certain common stock classified as Level 3 securities are valued using the market approach. To determine fair value for these securities, management considered various factors which may have included, but were not limited to, the halt price of the security, discount rates observed in the market for similar assets as well as the movement in certain foreign or domestic market indices. Significant increases (decreases) to any of these inputs would result in a significantly lower (higher) fair value measurement. Generally, a change in observable yields on comparable securities would result in a directionally similar change to discount rates.
Financial assets were transferred from Level 2 to Level 3 due to unavailable market quotes. As a result, as of period end, management determined to fair value the securities under procedures established by and under the general supervision of the Board of Trustees.
Transfers In | | Transfers Out | |
Level 2 ($) | | Level 3 ($) | | Level 2 ($) | | Level 3 ($) | |
| | — | | | | 1,860,950 | | | | 1,860,950 | | | | — | | |
Transfers in and/or out of Level 3 are determined based on the fair value at the beginning of the period for security positions held throughout the period.
There were no transfers of financial assets between Levels 1 and 2 during the period.
The accompanying Notes to Financial Statements are an integral part of this statement.
Annual Report 2015
11
COLUMBIA GREATER CHINA FUND
STATEMENT OF ASSETS AND LIABILITIES
August 31, 2015
Assets | |
Investments, at value | |
(identified cost $109,107,870) | | $ | 128,655,423 | | |
Receivable for: | |
Investments sold | | | 146,940 | | |
Capital shares sold | | | 56,820 | | |
Dividends | | | 56,403 | | |
Prepaid expenses | | | 1,786 | | |
Trustees' deferred compensation plan | | | 39,003 | | |
Total assets | | | 128,956,375 | | |
Liabilities | |
Due to custodian | | | 166,413 | | |
Payable for: | |
Capital shares purchased | | | 286,429 | | |
Investment management fees | | | 9,320 | | |
Distribution and/or service fees | | | 2,415 | | |
Transfer agent fees | | | 27,469 | | |
Administration fees | | | 857 | | |
Compensation of board members | | | 353 | | |
Chief compliance officer expenses | | | 14 | | |
Accounting fees | | | 30,920 | | |
Other expenses | | | 20,896 | | |
Trustees' deferred compensation plan | | | 39,003 | | |
Total liabilities | | | 584,089 | | |
Net assets applicable to outstanding capital stock | | $ | 128,372,286 | | |
Represented by | |
Paid-in capital | | $ | 102,408,939 | | |
Undistributed net investment income | | | 270,962 | | |
Accumulated net realized gain | | | 6,144,839 | | |
Unrealized appreciation (depreciation) on: | |
Investments | | | 19,547,553 | | |
Foreign currency translations | | | (7 | ) | |
Total — representing net assets applicable to outstanding capital stock | | $ | 128,372,286 | | |
The accompanying Notes to Financial Statements are an integral part of this statement.
Annual Report 2015
12
COLUMBIA GREATER CHINA FUND
STATEMENT OF ASSETS AND LIABILITIES (continued)
August 31, 2015
Class A | |
Net assets | | $ | 63,284,140 | | |
Shares outstanding | | | 1,898,701 | | |
Net asset value per share | | $ | 33.33 | | |
Maximum offering price per share(a) | | $ | 35.36 | | |
Class B | |
Net assets | | $ | 1,023,355 | | |
Shares outstanding | | | 33,464 | | |
Net asset value per share | | $ | 30.58 | | |
Class C | |
Net assets | | $ | 12,102,568 | | |
Shares outstanding | | | 386,069 | | |
Net asset value per share | | $ | 31.35 | | |
Class I | |
Net assets | | $ | 1,958 | | |
Shares outstanding | | | 54 | | |
Net asset value per share(b) | | $ | 36.04 | | |
Class R4 | |
Net assets | | $ | 2,473,075 | | |
Shares outstanding | | | 67,693 | | |
Net asset value per share | | $ | 36.53 | | |
Class R5 | |
Net assets | | $ | 438,070 | | |
Shares outstanding | | | 11,975 | | |
Net asset value per share | | $ | 36.58 | | |
Class W | |
Net assets | | $ | 1,912 | | |
Shares outstanding | | | 57 | | |
Net asset value per share(b) | | $ | 33.33 | | |
Class Z | |
Net assets | | $ | 49,047,208 | | |
Shares outstanding | | | 1,365,945 | | |
Net asset value per share | | $ | 35.91 | | |
(a) The maximum offering price per share is calculated by dividing the net asset value per share by 1.0 minus the maximum sales charge of 5.75%.
(b) Net asset value per share rounds to this amount due to fractional shares outstanding.
The accompanying Notes to Financial Statements are an integral part of this statement.
Annual Report 2015
13
COLUMBIA GREATER CHINA FUND
STATEMENT OF OPERATIONS
Year Ended August 31, 2015
Net investment income | |
Income: | |
Dividends — unaffiliated issuers | | $ | 2,861,374 | | |
Dividends — affiliated issuers | | | 4,378 | | |
Foreign taxes withheld | | | (236,339 | ) | |
Total income | | | 2,629,413 | | |
Expenses: | |
Investment management fees | | | 1,277,028 | | |
Distribution and/or service fees | |
Class A | | | 208,326 | | |
Class B | | | 20,731 | | |
Class C | | | 153,438 | | |
Class W | | | 6 | | |
Transfer agent fees | |
Class A | | | 164,214 | | |
Class B | | | 4,109 | | |
Class C | | | 30,256 | | |
Class R4 | | | 1,699 | | |
Class R5 | | | 169 | | |
Class W | | | 4 | | |
Class Z | | | 87,399 | | |
Administration fees | | | 117,428 | | |
Compensation of board members | | | 18,821 | | |
Custodian fees | | | 44,432 | | |
Printing and postage fees | | | 35,211 | | |
Registration fees | | | 94,870 | | |
Professional fees | | | 32,830 | | |
Line of credit interest expense | | | 2,118 | | |
Chief compliance officer expenses | | | 74 | | |
Other | | | 16,370 | | |
Total expenses | | | 2,309,533 | | |
Expense reductions | | | (477 | ) | |
Total net expenses | | | 2,309,056 | | |
Net investment income | | | 320,357 | | |
Realized and unrealized gain (loss) — net | |
Net realized gain (loss) on: | |
Investments | | | 7,869,849 | | |
Foreign currency translations | | | (6,826 | ) | |
Increase from payment by affiliate (Note 6) | | | 534,561 | | |
Net realized gain | | | 8,397,584 | | |
Net change in unrealized appreciation (depreciation) on: | |
Investments | | | (28,431,086 | ) | |
Foreign currency translations | | | 165 | | |
Net change in unrealized depreciation | | | (28,430,921 | ) | |
Net realized and unrealized loss | | | (20,033,337 | ) | |
Net decrease in net assets from operations | | $ | (19,712,980 | ) | |
The accompanying Notes to Financial Statements are an integral part of this statement.
Annual Report 2015
14
COLUMBIA GREATER CHINA FUND
STATEMENT OF CHANGES IN NET ASSETS
| | | Year Ended
August 31,
2015 | | Year Ended
August 31,
2014 | |
Operations | |
Net investment income | | $ | 320,357 | | | $ | 962,259 | | |
Net realized gain | | | 8,397,584 | | | | 44,841,316 | | |
Net change in unrealized depreciation | | | (28,430,921 | ) | | | (16,607,029 | ) | |
Net increase (decrease) in net assets resulting from operations | | | (19,712,980 | ) | | | 29,196,546 | | |
Distributions to shareholders | |
Net investment income | |
Class A | | | (511,016 | ) | | | (1,230,481 | ) | |
Class B | | | — | | | | (37,419 | ) | |
Class C | | | — | | | | (152,563 | ) | |
Class I | | | (29 | ) | | | (16,732 | ) | |
Class R4 | | | (499 | ) | | | (286 | ) | |
Class R5 | | | (1,461 | ) | | | (1,520 | ) | |
Class W | | | (19 | ) | | | (48 | ) | |
Class Z | | | (243,129 | ) | | | (492,797 | ) | |
Net realized gains | |
Class A | | | (14,411,020 | ) | | | (17,360,587 | ) | |
Class B | | | (474,688 | ) | | | (947,992 | ) | |
Class C | | | (2,999,146 | ) | | | (3,865,143 | ) | |
Class I | | | (467 | ) | | | (186,486 | ) | |
Class R4 | | | (10,321 | ) | | | (3,571 | ) | |
Class R5 | | | (26,161 | ) | | | (17,515 | ) | |
Class W | | | (493 | ) | | | (652 | ) | |
Class Z | | | (4,974,533 | ) | | | (6,058,000 | ) | |
Total distributions to shareholders | | | (23,652,982 | ) | | | (30,371,792 | ) | |
Increase (decrease) in net assets from capital stock activity | | | 25,769,645 | | | | (34,206,883 | ) | |
Total decrease in net assets | | | (17,596,317 | ) | | | (35,382,129 | ) | |
Net assets at beginning of year | | | 145,968,603 | | | | 181,350,732 | | |
Net assets at end of year | | $ | 128,372,286 | | | $ | 145,968,603 | | |
Undistributed net investment income | | $ | 270,962 | | | $ | 704,902 | | |
The accompanying Notes to Financial Statements are an integral part of this statement.
Annual Report 2015
15
COLUMBIA GREATER CHINA FUND
STATEMENT OF CHANGES IN NET ASSETS (continued)
| | | Year Ended August 31, 2015 | | Year Ended August 31, 2014 | |
| | | Shares | | Dollars ($) | | Shares | | Dollars ($) | |
Capital stock activity | |
Class A shares | |
Subscriptions(a) | | | 620,550 | | | | 25,619,588 | | | | 581,825 | | | | 26,547,329 | | |
Distributions reinvested | | | 370,206 | | | | 13,323,734 | | | | 386,968 | | | | 16,353,257 | | |
Redemptions | | | (1,210,769 | ) | | | (51,029,538 | ) | | | (450,869 | ) | | | (20,857,788 | ) | |
Net increase (decrease) | | | (220,013 | ) | | | (12,086,216 | ) | | | 517,924 | | | | 22,042,798 | | |
Class B shares | |
Subscriptions | | | 2,591 | | | | 89,731 | | | | 5,029 | | | | 199,461 | | |
Distributions reinvested | | | 11,974 | | | | 397,537 | | | | 19,151 | | | | 759,128 | | |
Redemptions(a) | | | (50,053 | ) | | | (1,892,567 | ) | | | (47,467 | ) | | | (1,974,847 | ) | |
Net decrease | | | (35,488 | ) | | | (1,405,299 | ) | | | (23,287 | ) | | | (1,016,258 | ) | |
Class C shares | |
Subscriptions | | | 60,142 | | | | 2,258,476 | | | | 37,086 | | | | 1,559,293 | | |
Distributions reinvested | | | 65,744 | | | | 2,237,255 | | | | 73,147 | | | | 2,957,343 | | |
Redemptions | | | (102,497 | ) | | | (3,840,272 | ) | | | (110,868 | ) | | | (4,764,644 | ) | |
Net increase (decrease) | | | 23,389 | | | | 655,459 | | | | (635 | ) | | | (248,008 | ) | |
Class I shares | |
Subscriptions | | | — | | | | — | | | | 697 | | | | 37,545 | | |
Distributions reinvested | | | — | | | | — | | | | 4,513 | | | | 202,683 | | |
Redemptions | | | — | | | | — | | | | (1,037,186 | ) | | | (57,095,817 | ) | |
Net increase (decrease) | | | — | | | | — | | | | (1,031,976 | ) | | | (56,855,589 | ) | |
Class R4 shares | |
Subscriptions | | | 71,116 | | | | 3,376,084 | | | | 306 | | | | 15,101 | | |
Distributions reinvested | | | 263 | | | | 10,342 | | | | 71 | | | | 3,233 | | |
Redemptions | | | (3,846 | ) | | | (169,626 | ) | | | (445 | ) | | | (19,716 | ) | |
Net increase (decrease) | | | 67,533 | | | | 3,216,800 | | | | (68 | ) | | | (1,382 | ) | |
Class R5 shares | |
Subscriptions | | | 13,392 | | | | 600,758 | | | | 2,201 | | | | 119,736 | | |
Distributions reinvested | | | 689 | | | | 27,138 | | | | 405 | | | | 18,403 | | |
Redemptions | | | (4,463 | ) | | | (204,421 | ) | | | (300 | ) | | | (13,714 | ) | |
Net increase | | | 9,618 | | | | 423,475 | | | | 2,306 | | | | 124,425 | | |
Class Z shares | |
Subscriptions | | | 1,340,915 | | | | 60,775,022 | | | | 162,620 | | | | 8,085,186 | | |
Distributions reinvested | | | 102,646 | | | | 3,973,418 | | | | 106,852 | | | | 4,788,042 | | |
Redemptions | | | (687,067 | ) | | | (29,783,014 | ) | | | (225,893 | ) | | | (11,126,097 | ) | |
Net increase | | | 756,494 | | | | 34,965,426 | | | | 43,579 | | | | 1,747,131 | | |
Total net increase (decrease) | | | 601,533 | | | | 25,769,645 | | | | (492,157 | ) | | | (34,206,883 | ) | |
(a) Includes conversions of Class B shares to Class A shares, if any.
The accompanying Notes to Financial Statements are an integral part of this statement.
Annual Report 2015
16
COLUMBIA GREATER CHINA FUND
The following tables are intended to help you understand the Fund's financial performance. Certain information reflects financial results for a single share of a class held for the periods shown. Per share net investment income (loss) amounts are calculated based on average shares outstanding during the period. Total return assumes reinvestment of all dividends and distributions, if any. Total return does not reflect payment of sales charges, if any. Total return and portfolio turnover are not annualized for periods of less than one year. The portfolio turnover rate is calculated without regard to purchase and sales transactions of short-term instruments and certain derivatives, if any. If such transactions were included, the Fund's portfolio turnover rate may be higher.
| | | Year Ended August 31, | |
Class A | | 2015 | | 2014 | | 2013 | | 2012 | | 2011 | |
Per share data | |
Net asset value, beginning of period | | $ | 45.93 | | | $ | 48.80 | | | $ | 42.08 | | | $ | 51.02 | | | $ | 51.35 | | |
Income from investment operations: | |
Net investment income | | | 0.02 | | | | 0.33 | | | | 0.44 | | | | 0.50 | | | | 0.15 | | |
Net realized and unrealized gain (loss) | | | (3.87 | ) | | | 8.97 | | | | 6.81 | | | | (6.83 | ) | | | 1.05 | | |
Increase from payment by affiliate | | | 0.15 | | | | — | | | | — | | | | — | | | | — | | |
Total from investment operations | | | (3.70 | ) | | | 9.30 | | | | 7.25 | | | | (6.33 | ) | | | 1.20 | | |
Less distributions to shareholders: | |
Net investment income | | | (0.30 | ) | | | (0.81 | ) | | | (0.53 | ) | | | (0.05 | ) | | | (0.17 | ) | |
Net realized gains | | | (8.60 | ) | | | (11.36 | ) | | | — | | | | (2.56 | ) | | | (1.36 | ) | |
Total distributions to shareholders | | | (8.90 | ) | | | (12.17 | ) | | | (0.53 | ) | | | (2.61 | ) | | | (1.53 | ) | |
Redemption fees: | |
Net asset value, end of period | | $ | 33.33 | | | $ | 45.93 | | | $ | 48.80 | | | $ | 42.08 | | | $ | 51.02 | | |
Total return | | | (9.49 | %)(a) | | | 21.22 | % | | | 17.24 | % | | | (12.20 | %) | | | 2.03 | % | |
Ratios to average net assets(b) | |
Total gross expenses | | | 1.56 | %(c) | | | 1.57 | %(c) | | | 1.54 | % | | | 1.53 | % | | | 1.58 | %(c) | |
Total net expenses(d) | | | 1.56 | %(c)(e) | | | 1.57 | %(c)(e) | | | 1.54 | %(e) | | | 1.53 | %(e) | | | 1.58 | %(c)(e) | |
Net investment income | | | 0.04 | % | | | 0.73 | % | | | 0.94 | % | | | 1.11 | % | | | 0.26 | % | |
Supplemental data | |
Net assets, end of period (in thousands) | | $ | 63,284 | | | $ | 97,302 | | | $ | 78,119 | | | $ | 76,683 | | | $ | 101,344 | | |
Portfolio turnover | | | 74 | % | | | 61 | % | | | 39 | % | | | 38 | % | | | 36 | % | |
Notes to Financial Highlights
(a) The Fund received a payment from an affiliate. Had the Fund not received this payment, the total return would have been lower by 0.33%.
(b) In addition to the fees and expenses that the Fund bears directly, the Fund indirectly bears a pro rata share of the fees and expenses of any other funds in which it invests. Such indirect expenses are not included in the Fund's reported expense ratios.
(c) Ratios include line of credit interest expense which is less than 0.01%.
(d) Total net expenses include the impact of certain fee waivers/expense reimbursements made by the Investment Manager and certain of its affiliates, if applicable.
(e) The benefits derived from expense reductions had an impact of less than 0.01%.
The accompanying Notes to Financial Statements are an integral part of this statement.
Annual Report 2015
17
COLUMBIA GREATER CHINA FUND
FINANCIAL HIGHLIGHTS (continued)
| | | Year Ended August 31, | |
Class B | | 2015 | | 2014 | | 2013 | | 2012 | | 2011 | |
Per share data | |
Net asset value, beginning of period | | $ | 42.85 | | | $ | 46.24 | | | $ | 39.90 | | | $ | 48.83 | | | $ | 49.42 | | |
Income from investment operations: | |
Net investment income (loss) | | | (0.40 | ) | | | (0.09 | ) | | | 0.04 | | | | 0.10 | | | | (0.28 | ) | |
Net realized and unrealized gain (loss) | | | (3.41 | ) | | | 8.51 | | | | 6.49 | | | | (6.47 | ) | | | 1.05 | | |
Increase from payment by affiliate | | | 0.14 | | | | — | | | | — | | | | — | | | | — | | |
Total from investment operations | | | (3.67 | ) | | | 8.42 | | | | 6.53 | | | | (6.37 | ) | | | 0.77 | | |
Less distributions to shareholders: | |
Net investment income | | | — | | | | (0.45 | ) | | | (0.19 | ) | | | — | | | | — | | |
Net realized gains | | | (8.60 | ) | | | (11.36 | ) | | | — | | | | (2.56 | ) | | | (1.36 | ) | |
Total distributions to shareholders | | | (8.60 | ) | | | (11.81 | ) | | | (0.19 | ) | | | (2.56 | ) | | | (1.36 | ) | |
Redemption fees: | |
Net asset value, end of period | | $ | 30.58 | | | $ | 42.85 | | | $ | 46.24 | | | $ | 39.90 | | | $ | 48.83 | | |
Total return | | | (10.16 | %)(a) | | | 20.28 | % | | | 16.36 | % | | | (12.86 | %) | | | 1.27 | % | |
Ratios to average net assets(b) | |
Total gross expenses | | | 2.32 | %(c) | | | 2.32 | %(c) | | | 2.29 | % | | | 2.28 | % | | | 2.33 | %(c) | |
Total net expenses(d) | | | 2.32 | %(c)(e) | | | 2.32 | %(c)(e) | | | 2.29 | %(e) | | | 2.28 | %(e) | | | 2.33 | %(c)(e) | |
Net investment income (loss) | | | (1.02 | %) | | | (0.22 | %) | | | 0.09 | % | | | 0.22 | % | | | (0.50 | %) | |
Supplemental data | |
Net assets, end of period (in thousands) | | $ | 1,023 | | | $ | 2,955 | | | $ | 4,265 | | | $ | 5,769 | | | $ | 13,364 | | |
Portfolio turnover | | | 74 | % | | | 61 | % | | | 39 | % | | | 38 | % | | | 36 | % | |
Notes to Financial Highlights
(a) The Fund received a payment from an affiliate. Had the Fund not received this payment, the total return would have been lower by 0.33%.
(b) In addition to the fees and expenses that the Fund bears directly, the Fund indirectly bears a pro rata share of the fees and expenses of any other funds in which it invests. Such indirect expenses are not included in the Fund's reported expense ratios.
(c) Ratios include line of credit interest expense which is less than 0.01%.
(d) Total net expenses include the impact of certain fee waivers/expense reimbursements made by the Investment Manager and certain of its affiliates, if applicable.
(e) The benefits derived from expense reductions had an impact of less than 0.01%.
The accompanying Notes to Financial Statements are an integral part of this statement.
Annual Report 2015
18
COLUMBIA GREATER CHINA FUND
FINANCIAL HIGHLIGHTS (continued)
| | | Year Ended August 31, | |
Class C | | 2015 | | 2014 | | 2013 | | 2012 | | 2011 | |
Per share data | |
Net asset value, beginning of period | | $ | 43.71 | | | $ | 46.94 | | | $ | 40.51 | | | $ | 49.52 | | | $ | 50.10 | | |
Income from investment operations: | |
Net investment income (loss) | | | (0.28 | ) | | | (0.02 | ) | | | 0.07 | | | | 0.14 | | | | (0.28 | ) | |
Net realized and unrealized gain (loss) | | | (3.62 | ) | | | 8.60 | | | | 6.55 | | | | (6.59 | ) | | | 1.06 | | |
Increase from payment by affiliate | | | 0.14 | | | | — | | | | — | | | | — | | | | — | | |
Total from investment operations | | | (3.76 | ) | | | 8.58 | | | | 6.62 | | | | (6.45 | ) | | | 0.78 | | |
Less distributions to shareholders: | |
Net investment income | | | — | | | | (0.45 | ) | | | (0.19 | ) | | | — | | | | — | | |
Net realized gains | | | (8.60 | ) | | | (11.36 | ) | | | — | | | | (2.56 | ) | | | (1.36 | ) | |
Total distributions to shareholders | | | (8.60 | ) | | | (11.81 | ) | | | (0.19 | ) | | | (2.56 | ) | | | (1.36 | ) | |
Redemption fees: | |
Net asset value, end of period | | $ | 31.35 | | | $ | 43.71 | | | $ | 46.94 | | | $ | 40.51 | | | $ | 49.52 | | |
Total return | | | (10.16 | %)(a) | | | 20.32 | % | | | 16.33 | % | | | (12.84 | %) | | | 1.28 | % | |
Ratios to average net assets(b) | |
Total gross expenses | | | 2.32 | %(c) | | | 2.32 | %(c) | | | 2.29 | % | | | 2.28 | % | | | 2.33 | %(c) | |
Total net expenses(d) | | | 2.32 | %(c)(e) | | | 2.32 | %(c)(e) | | | 2.29 | %(e) | | | 2.28 | %(e) | | | 2.33 | %(c)(e) | |
Net investment income (loss) | | | (0.71 | %) | | | (0.05 | %) | | | 0.15 | % | | | 0.33 | % | | | (0.50 | %) | |
Supplemental data | |
Net assets, end of period (in thousands) | | $ | 12,103 | | | $ | 15,851 | | | $ | 17,056 | | | $ | 20,401 | | | $ | 30,461 | | |
Portfolio turnover | | | 74 | % | | | 61 | % | | | 39 | % | | | 38 | % | | | 36 | % | |
Notes to Financial Highlights
(a) The Fund received a payment from an affiliate. Had the Fund not received this payment, the total return would have been lower by 0.33%.
(b) In addition to the fees and expenses that the Fund bears directly, the Fund indirectly bears a pro rata share of the fees and expenses of any other funds in which it invests. Such indirect expenses are not included in the Fund's reported expense ratios.
(c) Ratios include line of credit interest expense which is less than 0.01%.
(d) Total net expenses include the impact of certain fee waivers/expense reimbursements made by the Investment Manager and certain of its affiliates, if applicable.
(e) The benefits derived from expense reductions had an impact of less than 0.01%.
The accompanying Notes to Financial Statements are an integral part of this statement.
Annual Report 2015
19
COLUMBIA GREATER CHINA FUND
FINANCIAL HIGHLIGHTS (continued)
| | | Year Ended August 31, | |
Class I | | 2015 | | 2014 | | 2013 | | 2012 | | 2011(a) | |
Per share data | |
Net asset value, beginning of period | | $ | 48.96 | | | $ | 51.30 | | | $ | 44.20 | | | $ | 53.36 | | | $ | 57.86 | | |
Income from investment operations: | |
Net investment income | | | 0.20 | | | | 0.90 | | | | 0.70 | | | | 0.73 | | | | 0.09 | | |
Net realized and unrealized gain (loss) | | | (4.15 | ) | | | 9.14 | | | | 7.13 | | | | (7.14 | ) | | | (4.59 | ) | |
Increase from payment by affiliate | | | 0.16 | | | | — | | | | — | | | | — | | | | — | | |
Total from investment operations | | | (3.79 | ) | | | 10.04 | | | | 7.83 | | | | (6.41 | ) | | | (4.50 | ) | |
Less distributions to shareholders: | |
Net investment income | | | (0.53 | ) | | | (1.02 | ) | | | (0.73 | ) | | | (0.19 | ) | | | — | | |
Net realized gains | | | (8.60 | ) | | | (11.36 | ) | | | — | | | | (2.56 | ) | | | — | | |
Total distributions to shareholders | | | (9.13 | ) | | | (12.38 | ) | | | (0.73 | ) | | | (2.75 | ) | | | — | | |
Net asset value, end of period | | $ | 36.04 | | | $ | 48.96 | | | $ | 51.30 | | | $ | 44.20 | | | $ | 53.36 | | |
Total return | | | (9.07 | %)(b) | | | 21.75 | % | | | 17.75 | % | | | (11.78 | %) | | | (7.78 | %) | |
Ratios to average net assets(c) | |
Total gross expenses | | | 1.13 | %(d) | | | 1.08 | %(d) | | | 1.09 | % | | | 1.08 | % | | | 3.00 | %(d)(e) | |
Total net expenses(f) | | | 1.13 | %(d) | | | 1.08 | %(d) | | | 1.09 | % | | | 1.08 | %(g) | | | 1.56 | %(d)(e)(g) | |
Net investment income | | | 0.45 | % | | | 1.61 | % | | | 1.41 | % | | | 1.57 | % | | | 2.28 | %(e) | |
Supplemental data | |
Net assets, end of period (in thousands) | | $ | 2 | | | $ | 3 | | | $ | 52,946 | | | $ | 69,532 | | | $ | 18,532 | | |
Portfolio turnover | | | 74 | % | | | 61 | % | | | 39 | % | | | 38 | % | | | 36 | % | |
Notes to Financial Highlights
(a) Based on operations from August 2, 2011 (commencement of operations) through the stated period end.
(b) The Fund received a payment from an affiliate. Had the Fund not received this payment, the total return would have been lower by 0.33%.
(c) In addition to the fees and expenses that the Fund bears directly, the Fund indirectly bears a pro rata share of the fees and expenses of any other funds in which it invests. Such indirect expenses are not included in the Fund's reported expense ratios.
(d) Ratios include line of credit interest expense which is less than 0.01%.
(e) Annualized.
(f) Total net expenses include the impact of certain fee waivers/expense reimbursements made by the Investment Manager and certain of its affiliates, if applicable.
(g) The benefits derived from expense reductions had an impact of less than 0.01%.
The accompanying Notes to Financial Statements are an integral part of this statement.
Annual Report 2015
20
COLUMBIA GREATER CHINA FUND
FINANCIAL HIGHLIGHTS (continued)
| | | Year Ended August 31, | |
Class R4 | | 2015 | | 2014 | | 2013(a) | |
Per share data | |
Net asset value, beginning of period | | $ | 49.47 | | | $ | 51.71 | | | $ | 49.17 | | |
Income from investment operations: | |
Net investment income (loss) | | | 1.09 | | | | (0.01 | ) | | | 0.88 | | |
Net realized and unrealized gain (loss) | | | (5.18 | ) | | | 10.04 | | | | 1.66 | | |
Increase from payment by affiliate | | | 0.16 | | | | — | | | | — | | |
Total from investment operations | | | (3.93 | ) | | | 10.03 | | | | 2.54 | | |
Less distributions to shareholders: | |
Net investment income | | | (0.41 | ) | | | (0.91 | ) | | | — | | |
Net realized gains | | | (8.60 | ) | | | (11.36 | ) | | | — | | |
Total distributions to shareholders | | | (9.01 | ) | | | (12.27 | ) | | | — | | |
Net asset value, end of period | | $ | 36.53 | | | $ | 49.47 | | | $ | 51.71 | | |
Total return | | | (9.26 | %)(b) | | | 21.50 | % | | | 5.17 | % | |
Ratios to average net assets(c) | |
Total gross expenses | | | 1.29 | %(d) | | | 1.33 | %(d) | | | 1.32 | %(e) | |
Total net expenses(f) | | | 1.29 | %(d)(g) | | | 1.33 | %(d)(g) | | | 1.32 | %(e)(g) | |
Net investment income (loss) | | | 2.47 | % | | | (0.03 | %) | | | 4.00 | %(e) | |
Supplemental data | |
Net assets, end of period (in thousands) | | $ | 2,473 | | | $ | 8 | | | $ | 12 | | |
Portfolio turnover | | | 74 | % | | | 61 | % | | | 39 | % | |
Notes to Financial Highlights
(a) Based on operations from March 19, 2013 (commencement of operations) through the stated period end.
(b) The Fund received a payment from an affiliate. Had the Fund not received this payment, the total return would have been lower by 0.33%.
(c) In addition to the fees and expenses that the Fund bears directly, the Fund indirectly bears a pro rata share of the fees and expenses of any other funds in which it invests. Such indirect expenses are not included in the Fund's reported expense ratios.
(d) Ratios include line of credit interest expense which is less than 0.01%.
(e) Annualized.
(f) Total net expenses include the impact of certain fee waivers/expense reimbursements made by the Investment Manager and certain of its affiliates, if applicable.
(g) The benefits derived from expense reductions had an impact of less than 0.01%.
The accompanying Notes to Financial Statements are an integral part of this statement.
Annual Report 2015
21
COLUMBIA GREATER CHINA FUND
FINANCIAL HIGHLIGHTS (continued)
| | | Year Ended August 31, | |
Class R5 | | 2015 | | 2014 | | 2013(a) | |
Per share data | |
Net asset value, beginning of period | | $ | 49.52 | | | $ | 51.76 | | | $ | 48.84 | | |
Income from investment operations: | |
Net investment income | | | 0.52 | | | | 0.73 | | | | 0.63 | | |
Net realized and unrealized gain (loss) | | | (4.54 | ) | | | 9.38 | | | | 2.97 | | |
Increase from payment by affiliate | | | 0.16 | | | | — | | | | — | | |
Total from investment operations | | | (3.86 | ) | | | 10.11 | | | | 3.60 | | |
Less distributions to shareholders: | |
Net investment income | | | (0.48 | ) | | | (0.99 | ) | | | (0.68 | ) | |
Net realized gains | | | (8.60 | ) | | | (11.36 | ) | | | — | | |
Total distributions to shareholders | | | (9.08 | ) | | | (12.35 | ) | | | (0.68 | ) | |
Net asset value, end of period | | $ | 36.58 | | | $ | 49.52 | | | $ | 51.76 | | |
Total return | | | (9.11 | %)(b) | | | 21.67 | % | | | 7.40 | % | |
Ratios to average net assets(c) | |
Total gross expenses | | | 1.16 | %(d) | | | 1.19 | %(d) | | | 1.16 | %(e) | |
Total net expenses(f) | | | 1.16 | %(d) | | | 1.19 | %(d) | | | 1.16 | %(e) | |
Net investment income | | | 1.17 | % | | | 1.58 | % | | | 1.53 | %(e) | |
Supplemental data | |
Net assets, end of period (in thousands) | | $ | 438 | | | $ | 117 | | | $ | 3 | | |
Portfolio turnover | | | 74 | % | | | 61 | % | | | 39 | % | |
Notes to Financial Highlights
(a) Based on operations from November 8, 2012 (commencement of operations) through the stated period end.
(b) The Fund received a payment from an affiliate. Had the Fund not received this payment, the total return would have been lower by 0.33%.
(c) In addition to the fees and expenses that the Fund bears directly, the Fund indirectly bears a pro rata share of the fees and expenses of any other funds in which it invests. Such indirect expenses are not included in the Fund's reported expense ratios.
(d) Ratios include line of credit interest expense which is less than 0.01%.
(e) Annualized.
(f) Total net expenses include the impact of certain fee waivers/expense reimbursements made by the Investment Manager and certain of its affiliates, if applicable.
The accompanying Notes to Financial Statements are an integral part of this statement.
Annual Report 2015
22
COLUMBIA GREATER CHINA FUND
FINANCIAL HIGHLIGHTS (continued)
| | | Year Ended August 31, | |
Class W | | 2015 | | 2014 | | 2013 | | 2012(a) | |
Per share data | |
Net asset value, beginning of period | | $ | 45.95 | | | $ | 48.82 | | | $ | 42.10 | | | $ | 43.58 | | |
Income from investment operations: | |
Net investment income (loss) | | | 0.01 | | | | 0.36 | | | | 0.51 | | | | (0.05 | ) | |
Net realized and unrealized gain (loss) | | | (3.86 | ) | | | 8.96 | | | | 6.77 | | | | (1.43 | ) | |
Increase from payment by affiliate | | | 0.15 | | | | — | | | | — | | | | — | | |
Total from investment operations | | | (3.70 | ) | | | 9.32 | | | | 7.28 | | | | (1.48 | ) | |
Less distributions to shareholders: | |
Net investment income | | | (0.32 | ) | | | (0.83 | ) | | | (0.56 | ) | | | — | | |
Net realized gains | | | (8.60 | ) | | | (11.36 | ) | | | — | | | | — | | |
Total distributions to shareholders | | | (8.92 | ) | | | (12.19 | ) | | | (0.56 | ) | | | — | | |
Net asset value, end of period | | $ | 33.33 | | | $ | 45.95 | | | $ | 48.82 | | | $ | 42.10 | | |
Total return | | | (9.48 | %)(b) | | | 21.27 | % | | | 17.30 | % | | | (3.40 | %) | |
Ratios to average net assets(c) | |
Total gross expenses | | | 1.56 | %(d) | | | 1.52 | %(d) | | | 1.49 | % | | | 1.47 | %(e) | |
Total net expenses(f) | | | 1.56 | %(d)(g) | | | 1.52 | %(d)(g) | | | 1.49 | %(g) | | | 1.47 | %(e) | |
Net investment income (loss) | | | 0.01 | % | | | 0.78 | % | | | 1.07 | % | | | (0.55 | %)(e) | |
Supplemental data | |
Net assets, end of period (in thousands) | | $ | 2 | | | $ | 3 | | | $ | 3 | | | $ | 2 | | |
Portfolio turnover | | | 74 | % | | | 61 | % | | | 39 | % | | | 38 | % | |
Notes to Financial Highlights
(a) Based on operations from June 18, 2012 (commencement of operations) through the stated period end.
(b) The Fund received a payment from an affiliate. Had the Fund not received this payment, the total return would have been lower by 0.33%.
(c) In addition to the fees and expenses that the Fund bears directly, the Fund indirectly bears a pro rata share of the fees and expenses of any other funds in which it invests. Such indirect expenses are not included in the Fund's reported expense ratios.
(d) Ratios include line of credit interest expense which is less than 0.01%.
(e) Annualized.
(f) Total net expenses include the impact of certain fee waivers/expense reimbursements made by the Investment Manager and certain of its affiliates, if applicable.
(g) The benefits derived from expense reductions had an impact of less than 0.01%.
The accompanying Notes to Financial Statements are an integral part of this statement.
Annual Report 2015
23
COLUMBIA GREATER CHINA FUND
FINANCIAL HIGHLIGHTS (continued)
| | | Year Ended August 31, | |
Class Z | | 2015 | | 2014 | | 2013 | | 2012 | | 2011 | |
Per share data | |
Net asset value, beginning of period | | $ | 48.78 | | | $ | 51.16 | | | $ | 44.08 | | | $ | 53.35 | | | $ | 53.60 | | |
Income from investment operations: | |
Net investment income | | | 0.38 | | | | 0.46 | | | | 0.59 | | | | 0.63 | | | | 0.53 | | |
Net realized and unrealized gain (loss) | | | (4.39 | ) | | | 9.45 | | | | 7.13 | | | | (7.14 | ) | | | 0.87 | | |
Increase from payment by affiliate | | | 0.16 | | | | — | | | | — | | | | — | | | | ��� | | |
Total from investment operations | | | (3.85 | ) | | | 9.91 | | | | 7.72 | | | | (6.51 | ) | | | 1.40 | | |
Less distributions to shareholders: | |
Net investment income | | | (0.42 | ) | | | (0.93 | ) | | | (0.64 | ) | | | (0.20 | ) | | | (0.29 | ) | |
Net realized gains | | | (8.60 | ) | | | (11.36 | ) | | | — | | | | (2.56 | ) | | | (1.36 | ) | |
Total distributions to shareholders | | | (9.02 | ) | | | (12.29 | ) | | | (0.64 | ) | | | (2.76 | ) | | | (1.65 | ) | |
Redemption fees: | |
Net asset value, end of period | | $ | 35.91 | | | $ | 48.78 | | | $ | 51.16 | | | $ | 44.08 | | | $ | 53.35 | | |
Total return | | | (9.24 | %)(a) | | | 21.49 | % | | | 17.54 | % | | | (11.98 | %) | | | 2.31 | % | |
Ratios to average net assets(b) | |
Total gross expenses | | | 1.31 | %(c) | | | 1.32 | %(c) | | | 1.29 | % | | | 1.28 | % | | | 1.31 | %(c) | |
Total net expenses(d) | | | 1.31 | %(c)(e) | | | 1.32 | %(c)(e) | | | 1.29 | %(e) | | | 1.28 | %(e) | | | 1.31 | %(c)(e) | |
Net investment income | | | 0.86 | % | | | 0.96 | % | | | 1.18 | % | | | 1.34 | % | | | 0.88 | % | |
Supplemental data | |
Net assets, end of period (in thousands) | | $ | 49,047 | | | $ | 29,730 | | | $ | 28,948 | | | $ | 29,165 | | | $ | 50,261 | | |
Portfolio turnover | | | 74 | % | | | 61 | % | | | 39 | % | | | 38 | % | | | 36 | % | |
Notes to Financial Highlights
(a) The Fund received a payment from an affiliate. Had the Fund not received this payment, the total return would have been lower by 0.33%.
(b) In addition to the fees and expenses that the Fund bears directly, the Fund indirectly bears a pro rata share of the fees and expenses of any other funds in which it invests. Such indirect expenses are not included in the Fund's reported expense ratios.
(c) Ratios include line of credit interest expense which is less than 0.01%.
(d) Total net expenses include the impact of certain fee waivers/expense reimbursements made by the Investment Manager and certain of its affiliates, if applicable.
(e) The benefits derived from expense reductions had an impact of less than 0.01%.
The accompanying Notes to Financial Statements are an integral part of this statement.
Annual Report 2015
24
COLUMBIA GREATER CHINA FUND
NOTES TO FINANCIAL STATEMENTS
August 31, 2015
Note 1. Organization
Columbia Greater China Fund (the Fund), a series of Columbia Funds Series Trust I (the Trust), is a non-diversified fund. The Trust is registered under the Investment Company Act of 1940, as amended (the 1940 Act), as an open-end management investment company organized as a Massachusetts business trust.
Fund Shares
The Trust may issue an unlimited number of shares (without par value). The Fund offers Class A, Class B, Class C, Class I, Class R4, Class R5, Class W and Class Z shares. Although all share classes generally have identical voting, dividend and liquidation rights, each share class votes separately when required by the Trust's organizational documents or by law. Different share classes pay different distribution amounts to the extent the expenses of such share classes differ, and distributions in liquidation will be proportional to the net asset value of each share class. Each share class has its own expense and sales charge structure.
Class A shares are subject to a maximum front-end sales charge of 5.75% based on the initial investment amount. Class A shares purchased without an initial sales charge in accounts aggregating $1 million to $50 million at the time of purchase are subject to a contingent deferred sales charge (CDSC) if the shares are sold within 18 months after purchase, charged as follows: 1.00% CDSC if redeemed within 12 months after purchase, and 0.50% CDSC if redeemed more than 12, but less than 18, months after purchase.
Class B shares may be subject to a maximum CDSC of 5.00% based upon the holding period after purchase. Class B shares will generally convert to Class A shares eight years after purchase. The Fund no longer accepts investments by new or existing investors in the Fund's Class B shares, except in connection with the reinvestment of any dividend and/or capital gain distributions in Class B shares of the Fund and exchanges by existing Class B shareholders of certain other funds within the Columbia Family of Funds.
Class C shares are subject to a 1.00% CDSC on shares redeemed within one year after purchase.
Class I shares are not subject to sales charges and are available only to the Columbia Family of Funds.
Class R4 shares are not subject to sales charges and are generally available only to omnibus retirement plans
and certain investors as described in the Fund's prospectus.
Class R5 shares are not subject to sales charges and are generally available only to investors purchasing through authorized investment professionals and omnibus retirement plans.
Class W shares are not subject to sales charges and are available only to investors purchasing through authorized investment programs managed by investment professionals, including discretionary managed account programs.
Class Z shares are not subject to sales charges and are available only to eligible investors, which are subject to different investment minimums as described in the Fund's prospectus.
Note 2. Summary of Significant Accounting Policies
Basis of Preparation
The Fund is an investment company that applies the accounting and reporting guidance in the Financial Accounting Standards Board (FASB) Accounting Standards Codification Topic 946, Financial Services — Investment Companies (ASC 946). The financial statements are prepared in accordance with U.S. generally accepted accounting principles (GAAP), which requires management to make certain estimates and assumptions that affect the reported amounts of assets and liabilities, the disclosure of contingent assets and liabilities at the date of the financial statements and the reported amounts of income and expenses during the reporting period. Actual results could differ from those estimates.
The following is a summary of significant accounting policies followed by the Fund in the preparation of its financial statements.
Security Valuation
All equity securities are valued at the close of business of the New York Stock Exchange (NYSE). Equity securities are valued at the last quoted sales price on the principal exchange or market on which they trade, except for securities traded on the NASDAQ Stock Market, which are valued at the NASDAQ official close price. Unlisted securities or listed securities for which there were no sales during the day are valued at the mean of the latest quoted bid and ask prices on such exchanges or markets.
Annual Report 2015
25
COLUMBIA GREATER CHINA FUND
NOTES TO FINANCIAL STATEMENTS (continued)
August 31, 2015
Foreign equity securities are valued based on the closing price on the foreign exchange in which such securities are primarily traded. If any foreign equity security closing prices are not readily available, the securities are valued at the mean of the latest quoted bid and ask prices on such exchanges or markets. Foreign currency exchange rates are generally determined at 4:00 p.m. Eastern (U.S.) time. Many securities markets and exchanges outside the U.S. close prior to the close of the NYSE; therefore, the closing prices for securities in such markets or on such exchanges may not fully reflect events that occur after such close but before the close of the NYSE. In those situations, foreign securities will be fair valued pursuant to a policy adopted by the Board of Trustees (the Board), including, if available, utilizing a third party pricing service to determine these fair values. The third party pricing service takes into account multiple factors, including, but not limited to, movements in the U.S. securities markets, certain depositary receipts, futures contracts and foreign exchange rates that have occurred subsequent to the close of the foreign exchange or market, to determine a good faith estimate that reasonably reflects the current market conditions as of the close of the NYSE. The fair value of a security is likely to be different from the quoted or published price, if available.
Investments for which market quotations are not readily available, or that have quotations which management believes are not reflective of market value or reliable, are valued at fair value as determined in good faith under procedures approved by and under the general supervision of the Board. If a security or class of securities (such as foreign securities) is valued at fair value, such value is likely to be different from the quoted or published price for the security.
The determination of fair value often requires significant judgment. To determine fair value, management may use assumptions including but not limited to future cash flows and estimated risk premiums. Multiple inputs from various sources may be used to determine fair value.
GAAP requires disclosure regarding the inputs and valuation techniques used to measure fair value and any changes in valuation inputs or techniques. In addition, investments shall be disclosed by major category. This information is disclosed following the Fund's Portfolio of Investments.
Foreign Currency Transactions and Translations
The values of all assets and liabilities denominated in foreign currencies are generally translated into U.S. dollars at exchange rates determined at the close of the NYSE. Net realized and unrealized gains (losses) on foreign currency transactions and translations include gains (losses) arising from the fluctuation in exchange rates between trade and settlement dates on securities transactions, gains (losses) arising from the disposition of foreign currency and currency gains (losses) between the accrual and payment dates on dividends, interest income and foreign withholding taxes.
For financial statement purposes, the Fund does not distinguish that portion of gains (losses) on investments which is due to changes in foreign exchange rates from that which is due to changes in market prices of the investments. Such fluctuations are included with the net realized and unrealized gains (losses) on investments in the Statement of Operations.
Security Transactions
Security transactions are accounted for on the trade date. Cost is determined and gains (losses) are based upon the specific identification method for both financial statement and federal income tax purposes.
Income Recognition
Corporate actions and dividend income are generally recorded net of any non-reclaimable tax withholdings, on the ex-dividend date or upon receipt of ex-dividend notification in the case of certain foreign securities.
Awards from class action litigation are recorded as a reduction of cost basis if the Fund still owns the applicable securities on the payment date. If the Fund no longer owns the applicable securities, the proceeds are recorded as realized gains.
Expenses
General expenses of the Trust are allocated to the Fund and other funds of the Trust based upon relative net assets or other expense allocation methodologies determined by the nature of the expense. Expenses directly attributable to the Fund are charged to the Fund. Expenses directly attributable to a specific class of shares are charged to that share class.
Determination of Class Net Asset Value
All income, expenses (other than class-specific expenses, which are charged to that share class, as shown in the Statement of Operations) and realized and
Annual Report 2015
26
COLUMBIA GREATER CHINA FUND
NOTES TO FINANCIAL STATEMENTS (continued)
August 31, 2015
unrealized gains (losses) are allocated to each class of the Fund on a daily basis, based on the relative net assets of each class, for purposes of determining the net asset value of each class.
Federal Income Tax Status
The Fund intends to qualify each year as a regulated investment company under Subchapter M of the Internal Revenue Code, as amended, and will distribute substantially all of its taxable income (including net short-term capital gains), if any, for its tax year, and as such will not be subject to federal income taxes. In addition, the Fund intends to distribute in each calendar year substantially all of its net investment income, capital gains and certain other amounts, if any, such that the Fund should not be subject to federal excise tax. Therefore, no federal income or excise tax provision is recorded.
Foreign Taxes
The Fund may be subject to foreign taxes on income, gains on investments or currency repatriation, a portion of which may be recoverable. The Fund will accrue such taxes and recoveries, as applicable, based upon its current interpretation of tax rules and regulations that exist in the markets in which it invests.
Realized gains in certain countries may be subject to foreign taxes at the Fund level, based on statutory rates. The Fund accrues for such foreign taxes on realized and unrealized gains at the appropriate rate for each jurisdiction, as applicable. The amount, if any, is disclosed as a liability on the Statement of Assets and Liabilities.
Distributions to Shareholders
Distributions from net investment income, if any, are declared and paid annually. Net realized capital gains, if any, are distributed along with the income distribution. Income distributions and capital gain distributions are determined in accordance with federal income tax regulations, which may differ from GAAP.
Guarantees and Indemnifications
Under the Trust's organizational documents and, in some cases, by contract, its officers and trustees are indemnified against certain liabilities arising out of the performance of their duties to the Trust or its funds. In addition, certain of the Fund's contracts with its service providers contain general indemnification clauses. The Fund's maximum exposure under these arrangements is unknown since the amount of any future claims that may
be made against the Fund cannot be determined, and the Fund has no historical basis for predicting the likelihood of any such claims.
Recent Accounting Pronouncement
Fair Value Measurement (Topic 820), Disclosure for Investments in Certain Entities That Calculate Net Asset Value per Share (or Its Equivalent)
In May 2015, the Financial Accounting Standards Board (FASB) issued Accounting Standards Update (ASU) No. 2015-07, Fair Value Measurement (Topic 820), Disclosure for Investments in Certain Entities That Calculate Net Asset Value per Share (or Its Equivalent). ASU No. 2015-07 changes the disclosure requirements for investments for which fair value is measured using the net asset value per share practical expedient. The disclosure requirements are effective for annual periods beginning after December 15, 2015 and interim periods within those fiscal years. At this time, management is evaluating the implications of this guidance and the impact it will have on the financial statement amounts and footnote disclosures, if any.
Note 3. Fees and Other Transactions with Affiliates
Investment Management Fees
Under an Investment Management Services Agreement, Columbia Management Investment Advisers, LLC (the Investment Manager), a wholly-owned subsidiary of Ameriprise Financial, Inc. (Ameriprise Financial), determines which securities will be purchased, held or sold. The investment management fee is an annual fee that is equal to a percentage of the Fund's average daily net assets that declines from 0.87% to 0.68% as the Fund's net assets increase. The effective investment management fee rate for the year ended August 31, 2015 was 0.87% of the Fund's average daily net assets.
Administration Fees
Under an Administrative Services Agreement, the Investment Manager also serves as the Fund Administrator. The Fund pays the Fund Administrator an annual fee for administration and accounting services equal to a percentage of the Fund's average daily net assets that declines from 0.08% to 0.04% as the Fund's net assets increase. The effective administration fee rate for the year ended August 31, 2015 was 0.08% of the Fund's average daily net assets.
Annual Report 2015
27
COLUMBIA GREATER CHINA FUND
NOTES TO FINANCIAL STATEMENTS (continued)
August 31, 2015
Compensation of Board Members
Board members, who are not officers or employees of the Investment Manager or Ameriprise Financial, are compensated for their services to the Fund as disclosed in the Statement of Operations. These Board members may participate in a Deferred Compensation Plan (the Plan) which may be terminated at any time. Obligations of the Plan will be paid solely out of the Fund's assets, and all amounts payable under the Plan constitute a general unsecured obligation of the Fund.
Compensation of Chief Compliance Officer
The Board has appointed a Chief Compliance Officer to the Fund in accordance with federal securities regulations. The Fund is allocated a portion of the expenses associated with the Chief Compliance Officer based on relative net assets of the Trust.
Transfer Agency Fees
Under a Transfer and Dividend Disbursing Agent Agreement, Columbia Management Investment Services Corp. (the Transfer Agent), an affiliate of the Investment Manager and a wholly-owned subsidiary of Ameriprise Financial, is responsible for providing transfer agency services to the Fund. The Transfer Agent has contracted with Boston Financial Data Services (BFDS) to serve as sub-transfer agent.
Effective November 1, 2014, the Transfer Agent receives a monthly transfer agency fee based on the number or the average value of accounts, depending on the type of account. Prior to November 1, 2014, the Transfer Agent received a monthly account-based service fee based on the number of open accounts. In addition, the Transfer Agent also receives sub-transfer agency fees based on a percentage of the average aggregate value of the Fund's shares maintained in omnibus accounts (other than omnibus accounts for which American Enterprise Investment Services Inc. is the broker of record or accounts where the beneficial shareholder is a customer of Ameriprise Financial Services, Inc., for which the Transfer Agent receives a per account fee). The Transfer Agent pays the fees of BFDS for services as sub-transfer agent and is not entitled to reimbursement for such fees from the Fund (with the exception of out-of-pocket fees).
The Transfer Agent also receives compensation from the Fund for various shareholder services and reimbursements for certain out-of-pocket fees. Class I shares do not pay transfer agency fees. Total transfer agency fees for Class R5 shares are subject to an annual limitation of not more than 0.05% of the average daily net assets attributable to Class R5 shares.
For the year ended August 31, 2015, the Fund's effective transfer agency fee rates as a percentage of average daily net assets of each class were as follows:
Class A | | | 0.20 | % | |
Class B | | | 0.20 | | |
Class C | | | 0.20 | | |
Class R4 | | | 0.19 | | |
Class R5 | | | 0.05 | | |
Class W | | | 0.18 | | |
Class Z | | | 0.20 | | |
An annual minimum account balance fee of $20 may apply to certain accounts with a value below the applicable share class's initial minimum investment requirements to reduce the impact of small accounts on transfer agency fees. These minimum account balance fees are remitted to the Fund and recorded as part of expense reductions in the Statement of Operations. For the year ended August 31, 2015, these minimum account balance fees reduced total expenses of the Fund by $477.
Distribution and Service Fees
The Fund has an agreement with Columbia Management Investment Distributors, Inc. (the Distributor), an affiliate of the Investment Manager and a wholly-owned subsidiary of Ameriprise Financial, for distribution and shareholder services. The Board has approved, and the Fund has adopted, distribution and shareholder service plans (the Plans) applicable to certain share classes, which set the distribution and service fees for the Fund. These fees are calculated daily and are intended to compensate the Distributor and/or eligible selling and/or servicing agents for selling shares of the Fund and providing services to investors.
Under the Plans, the Fund pays a monthly service fee to the Distributor at the maximum annual rate of 0.25% of the average daily net assets attributable to Class A, Class B, Class C and Class W shares of the Fund. Also under the Plans, the Fund pays a monthly distribution fee to the Distributor at the maximum annual rates of 0.75%, 0.75% and 0.25% of the average daily net assets attributable to Class B, Class C and Class W shares of the Fund, respectively.
Although the Fund may pay a distribution fee up to 0.25% of the Fund's average daily net assets attributable to Class W shares and a service fee of up to 0.25% of the Fund's average daily net assets attributable to Class W shares, the aggregate fee shall not exceed 0.25% of the
Annual Report 2015
28
COLUMBIA GREATER CHINA FUND
NOTES TO FINANCIAL STATEMENTS (continued)
August 31, 2015
Fund's average daily net assets attributable to Class W shares.
Sales Charges
Sales charges, including front-end charges and CDSCs, received by the Distributor for distributing Fund shares were $110,573 for Class A, $247 for Class B and $1,725 for Class C shares for the year ended August 31, 2015.
Expenses Waived/Reimbursed by the Investment Manager and its Affiliates
The Fund's expense ratio is subject to an expense reimbursement arrangement pursuant to which fees will be waived and/or expenses reimbursed (excluding certain fees and expenses described below), so that the Fund's net operating expenses, after giving effect to fees waived/expenses reimbursed and any balance credits and/or overdraft charges from the Fund's custodian, do not exceed the annual rates of:
| | | Voluntary
Expense Cap
Effective
January 1, 2015 | | Contractual
Expense Cap
Prior to
January 1, 2015 | |
Class A | | | 1.80 | % | | | 1.75 | % | |
Class B | | | 2.55 | | | | 2.50 | | |
Class C | | | 2.55 | | | | 2.50 | | |
Class I | | | 1.39 | | | | 1.35 | | |
Class R4 | | | 1.55 | | | | 1.50 | | |
Class R5 | | | 1.44 | | | | 1.40 | | |
Class W | | | 1.80 | | | | 1.75 | | |
Class Z | | | 1.55 | | | | 1.50 | | |
The voluntary expense cap arrangement may be revised or discontinued at any time. Under the arrangements, the following fees and expenses are excluded from the waiver/reimbursement commitment, and therefore will be paid by the Fund, if applicable: taxes (including foreign transaction taxes), expenses associated with investments in affiliated and non-affiliated pooled investment vehicles (including mutual funds and exchange-traded funds), transaction costs and brokerage commissions, costs related to any securities lending program, dividend and interest expenses associated with securities sold short, inverse floater program fees and expenses, transaction charges and interest on borrowed money, interest and extraordinary expenses. Any fees waived and/or expenses reimbursed under the expense reimbursement arrangements described above are not
recoverable by the Investment Manager or its affiliates in future periods.
Note 4. Federal Tax Information
The timing and character of income and capital gain distributions are determined in accordance with income tax regulations, which may differ from GAAP because of temporary or permanent book to tax differences.
At August 31, 2015, these differences are primarily due to differing treatment for deferral/reversal of wash sale losses, Trustees' deferred compensation, distribution reclassifications, foreign currency transactions, passive foreign investment company (PFIC) holdings, market timing regulatory settlement payment and earnings and profits distributed to shareholders on the redemption of shares. To the extent these differences are permanent, reclassifications are made among the components of the Fund's net assets in the Statement of Assets and Liabilities. Temporary differences do not require reclassifications. In the Statement of Assets and Liabilities the following reclassifications were made:
Undistributed net investment income | | $ | 1,856 | | |
Accumulated net realized gain | | | (2,017,453 | ) | |
Paid-in capital | | | 2,015,597 | | |
Net investment income (loss) and net realized gains (losses), as disclosed in the Statement of Operations, and net assets were not affected by this reclassification.
The tax character of distributions paid during the years indicated was as follows:
Year Ended August 31, | | 2015 | | 2014 | |
Ordinary income | | $ | 3,814,858 | | | $ | 4,406,498 | | |
Long-term capital gains | | | 19,838,124 | | | | 25,965,294 | | |
Total | | | 23,652,982 | | | | 30,371,792 | | |
Short-term capital gain distributions, if any, are considered ordinary income distributions for tax purposes.
At August 31, 2015, the components of distributable earnings on a tax basis were as follows:
Undistributed ordinary income | | | 308,422 | | |
Undistributed long-term capital gains | | | 6,807,565 | | |
Net unrealized appreciation | | | 18,884,827 | | |
At August 31, 2015, the cost of investments for federal income tax purposes was $109,770,596 and the
Annual Report 2015
29
COLUMBIA GREATER CHINA FUND
NOTES TO FINANCIAL STATEMENTS (continued)
August 31, 2015
aggregate gross unrealized appreciation and depreciation based on that cost was:
Unrealized appreciation | | $ | 28,350,878 | | |
Unrealized depreciation | | | (9,466,051 | ) | |
Net unrealized appreciation | | | 18,884,827 | | |
Management of the Fund has concluded that there are no significant uncertain tax positions in the Fund that would require recognition in the financial statements. However, management's conclusion may be subject to review and adjustment at a later date based on factors including, but not limited to, new tax laws, regulations, and administrative interpretations (including relevant court decisions). Generally, the Fund's federal tax returns for the prior three fiscal years remain subject to examination by the Internal Revenue Service.
Note 5. Portfolio Information
The cost of purchases and proceeds from sales of securities, excluding short-term investments and derivatives, if any, aggregated to $115,288,777 and $104,904,735, respectively, for the year ended August 31, 2015. The amount of purchase and sale activity impacts the portfolio turnover rate reported in the Financial Highlights.
Note 6. Payments by Affiliates
During the year ended August 31, 2015, the Investment Manager reimbursed the Fund $534,561 for a loss on a trading error.
Note 7. Line of Credit
The Fund has entered into a revolving credit facility with a syndicate of banks led by JPMorgan Chase Bank, N.A. whereby the Fund may borrow for the temporary funding of shareholder redemptions or for other temporary or emergency purposes. Pursuant to a December 9, 2014 amendment, the credit facility agreement, which is a collective agreement between the Fund and certain other funds managed by the Investment Manager, severally and not jointly, permits collective borrowings up to $550 million. Interest is charged to each participating fund based on its borrowings at a rate equal to the higher of (i) the overnight federal funds rate plus 1.00% or (ii) the one-month LIBOR rate plus 1.00%. Each borrowing under the credit facility matures no later than 60 days after the date of borrowing. The Fund also pays a commitment fee equal to its pro rata share of the amount of the credit facility at a rate of 0.075% per annum. The commitment fee is included in other expenses in the Statement of Operations. Prior to the
December 9, 2014 amendment, the credit facility agreement permitted borrowings up to $500 million under the same terms and interest rates as described above.
For the year ended August 31, 2015, the average daily loan balance outstanding on days when borrowing existed was $9,385,714 at a weighted average interest rate of 1.17%. Interest expense incurred by the Fund is recorded as a line of credit interest expense in the Statement of Operations.
Note 8. Significant Risks
Financial Sector Risk
The Fund may be more susceptible to the particular risks that may affect companies in the financial services sector than if it were invested in a wider variety of companies in unrelated sectors. Companies in the financial services sector are subject to certain risks, including the risk of regulatory change, decreased liquidity in credit markets and unstable interest rates. Such companies may have concentrated portfolios, such as a high level of loans to real estate developers, which makes them vulnerable to economic conditions that affect that industry. Performance of such companies may be affected by competitive pressures and exposure to investments or agreements that, under certain circumstances, may lead to losses (e.g., subprime loans). Companies in the financial services sector are subject to extensive governmental regulation that may limit the amount and types of loans and other financial commitments they can make, and interest rates and fees that they may charge. In addition, profitability of such companies is largely dependent upon the availability and the cost of capital.
Foreign Securities and Emerging Market Countries Risk
Investing in foreign securities may include certain risks and considerations not typically associated with investing in U.S. securities, such as fluctuating currency values and changing local and regional economic, political and social conditions, which may result in greater market volatility. In addition, certain foreign securities may not be as liquid as U.S. securities. Investing in emerging markets may accentuate these risks. These countries are also more likely to experience high levels of inflation, deflation or currency devaluation which could hurt their economies and securities markets. To the extent that the Fund concentrates its investment exposure to any one or a few specific countries, the Fund will be particularly susceptible to the various conditions, events or other
Annual Report 2015
30
COLUMBIA GREATER CHINA FUND
NOTES TO FINANCIAL STATEMENTS (continued)
August 31, 2015
factors impacting those countries and may, therefore, have a greater risk than that of a fund which is more geographically diversified.
Geographic Concentration Risk
The Fund may be particularly susceptible to economic, political, regulatory or other events or conditions affecting issuers and countries within the specific geographic regions in which the Fund invests. Currency devaluations could occur in countries that have not yet experienced currency devaluation to date, or could continue to occur in countries that have already experienced such devaluations. The Fund's NAV may be more volatile than the NAV of a more geographically diversified fund.
Shareholder Concentration Risk
At August 31, 2015, two unaffiliated shareholders of record owned 31.0% of the outstanding shares of the Fund in one or more accounts. The Fund has no knowledge about whether any portion of those shares was owned beneficially. Subscription and redemption activity by concentrated accounts may have a significant effect on the operations of the Fund. In the case of a large redemption, the Fund may be forced to sell investments at inopportune times, including its liquid or more liquid positions, resulting in Fund losses and the Fund holding a higher percentage of less liquid or illiquid securities. Large redemptions could result in decreased economies of scale and increased operating expenses for non-redeeming Fund shareholders.
Technology and Technology-related Investment Risk
The Fund may be more susceptible to the particular risks that may affect companies in the information technology sector, as well as other technology-related sectors (collectively, the technology sectors) than if it were invested in a wider variety of companies in unrelated sectors. Companies in the technology sectors are subject to certain risks, including the risk that new services, equipment or technologies will not be accepted by consumers and businesses or will become rapidly obsolete. Performance of such companies may be affected by factors including obtaining and protecting patents (or the failure to do so) and significant competitive pressures, including aggressive pricing of their products or services, new market entrants, competition for market share and short product cycles due to an accelerated rate of technological developments. Such competitive pressures may lead to limited earnings and/or falling profit margins. As a result,
the value of their securities may fall or fail to rise. In addition, many technology sector companies have limited operating histories and prices of these companies' securities historically have been more volatile than other securities, especially over the short term.
Non-Diversification Risk
A non-diversified fund is permitted to invest a greater percentage of its total assets in fewer issuers than a diversified fund. The Fund may, therefore, have a greater risk of loss from a few issuers than a similar fund that invests more broadly.
Note 9. Subsequent Events
Management has evaluated the events and transactions that have occurred through the date the financial statements were issued and noted no items requiring adjustment of the financial statements or additional disclosure.
Note 10. Information Regarding Pending and Settled Legal Proceedings
In December 2005, without admitting or denying the allegations, American Express Financial Corporation (AEFC, which is now known as Ameriprise Financial, Inc. (Ameriprise Financial)) entered into settlement agreements with the Securities and Exchange Commission (SEC) and Minnesota Department of Commerce (MDOC) related to market timing activities. As a result, AEFC was censured and ordered to cease and desist from committing or causing any violations of certain provisions of the Investment Advisers Act of 1940, the Investment Company Act of 1940, and various Minnesota laws. AEFC agreed to pay disgorgement of $10 million and civil money penalties of $7 million. AEFC also agreed to retain an independent distribution consultant to assist in developing a plan for distribution of all disgorgement and civil penalties ordered by the SEC in accordance with various undertakings detailed at http://www.sec.gov/litigation/admin/ia-2451.pdf. Ameriprise Financial and its affiliates have cooperated with the SEC and the MDOC in these legal proceedings, and have made regular reports to the Funds' Boards of Trustees.
Ameriprise Financial and certain of its affiliates have historically been involved in a number of legal, arbitration and regulatory proceedings, including routine litigation, class actions, and governmental actions, concerning matters arising in connection with the conduct of their business activities. Ameriprise Financial believes that
Annual Report 2015
31
COLUMBIA GREATER CHINA FUND
NOTES TO FINANCIAL STATEMENTS (continued)
August 31, 2015
the Funds are not currently the subject of, and that neither Ameriprise Financial nor any of its affiliates are the subject of, any pending legal, arbitration or regulatory proceedings that are likely to have a material adverse effect on the Funds or the ability of Ameriprise Financial or its affiliates to perform under their contracts with the Funds. Ameriprise Financial is required to make quarterly (10-Q), annual (10-K) and, as necessary, 8-K filings with the SEC on legal and regulatory matters that relate to Ameriprise Financial and its affiliates. Copies of these filings may be obtained by accessing the SEC website at www.sec.gov.
There can be no assurance that these matters, or the adverse publicity associated with them, will not result in increased fund redemptions, reduced sale of fund shares or other adverse consequences to the Funds. Further, although we believe proceedings are not likely to have a material adverse effect on the Funds or the ability of Ameriprise Financial or its affiliates to perform under their contracts with the Funds, these proceedings are subject to uncertainties and, as such, we are unable to estimate the possible loss or range of loss that may result. An adverse outcome in one or more of these proceedings could result in adverse judgments, settlements, fines, penalties or other relief that could have a material adverse effect on the consolidated financial condition or results of operations of Ameriprise Financial.
Annual Report 2015
32
COLUMBIA GREATER CHINA FUND
REPORT OF INDEPENDENT REGISTERED PUBLIC ACCOUNTING FIRM
To the Trustees of Columbia Funds Series Trust I and the Shareholders of
Columbia Greater China Fund
In our opinion, the accompanying statement of assets and liabilities, including the portfolio of investments, and the related statements of operations and of changes in net assets and the financial highlights present fairly, in all material respects, the financial position of Columbia Greater China Fund (the "Fund," a series of Columbia Funds Series Trust I) at August 31, 2015, and the results of its operations, the changes in its net assets and the financial highlights for each of the periods indicated, in conformity with accounting principles generally accepted in the United States of America. These financial statements and financial highlights (hereafter referred to as "financial statements") are the responsibility of the Fund's management. Our responsibility is to express an opinion on these financial statements based on our audits. We conducted our audits of these financial statements in accordance with the standards of the Public Company Accounting Oversight Board (United States). Those standards require that we plan and perform the audit to obtain reasonable assurance about whether the financial statements are free of material misstatement. An audit includes examining, on a test basis, evidence supporting the amounts and disclosures in the financial statements, assessing the accounting principles used and significant estimates made by management, and evaluating the overall financial statement presentation. We believe that our audits, which included confirmation of securities at August 31, 2015 by correspondence with the custodian and brokers, provide a reasonable basis for our opinion.
PricewaterhouseCoopers LLP
Minneapolis, MN
October 22, 2015
Annual Report 2015
33
COLUMBIA GREATER CHINA FUND
FEDERAL INCOME TAX INFORMATION
(Unaudited)
The Fund hereby designates the following tax attributes for the fiscal year ended August 31, 2015. Shareholders will be notified in early 2016 of the amounts for use in preparing 2015 income tax returns.
Tax Designations:
| Qualified Dividend Income | | | 26.58 | % | |
Capital Gain Dividend | | $ | 9,343,451 | | |
Foreign Taxes Paid | | $ | 236,339 | | |
Foreign Taxes Paid Per Share | | $ | 0.06 | | |
Foreign Source Income | | $ | 2,861,370 | | |
Foreign Source Income Per Share | | $ | 0.76 | | |
Qualified Dividend Income. For taxable, non-corporate shareholders, the percentage of ordinary income distributed during the fiscal year that represents qualified dividend income subject to reduced tax rates.
Capital Gain Dividend. The Fund designates as a capital gain dividend the amount reflected above, or if subsequently determined to be different, the net capital gain of such fiscal period.
Foreign Taxes. The Fund makes the election to pass through to shareholders the foreign taxes paid. Eligible shareholders may claim a foreign tax credit. These taxes, and the corresponding foreign source income, are provided.
Annual Report 2015
34
COLUMBIA GREATER CHINA FUND
The Trustees serve terms of indefinite duration. The names and birth years of the Trustees and Officers of the Funds in Columbia Funds Series Trust I, the year each was first elected or appointed to office, their principal business occupations during at least the last five years, the number of Funds overseen by each Trustee and other directorships they hold are shown below. Each officer listed below serves as an officer of each Fund in Columbia Funds Series Trust I. The mailing address of each Trustee is: c/o Columbia Management Investment Advisers, LLC, 225 Franklin Street, Mail Drop BX32 05228, Boston, MA 02110.
Independent Trustees
Name, Year of Birth
and Position Held
with the Trust | | Year First
Appointed or
Elected as
Trustee to any
Fund Currently
in the Columbia
Funds Complex
or a Predecessor
Thereof | | Principal Occupation(s)
during the Past Five Years | | Number
of Funds
in the
Columbia
Funds
Complex
Overseen | | Other Directorships
Held by Trustee During
the Past Five Years | |
Janet Langford Carrig
(Born 1957)
Trustee | | | 1996 | | | Senior Vice President, General Counsel and Corporate Secretary, ConocoPhillips (integrated energy company) since September 2007; Deputy General Counsel — Corporate Legal Services, ConocoPhillips from August 2006 to August 2007; Partner, Zelle, Hofmann, Voelbel, Mason & Gette LLP (law firm) from March 2005 to July 2006; Adjunct Professor of Law, Northwestern University from September 2004 to June 2006; Director, UAL Corporation (airline) from February 2006 to July 2006; Chief Administrative Officer and Senior Vice President, Kmart Holding Corporation (consumer goods) from September 2003 to March 2004 | | | 60 | | | None | |
Douglas A. Hacker
(Born 1955)
Trustee and Chairman
of the Board | | | 1996 | | | Independent business executive since May 2006; Executive Vice President — Strategy of United Airlines from December 2002 to May 2006; President of UAL Loyalty Services (airline marketing company) from September 2001 to December 2002; Executive Vice President and Chief Financial Officer of United Airlines from July 1999 to September 2001 | | | 60 | | | Spartan Nash Company, (food distributor); Nash Finch Company (food distributor) from 2005 to 2013; Aircastle Limited (aircraft leasing); SeaCube Container Leasing Ltd. (container leasing) from 2010 to 2013; and Travelport Worldwide Limited (travel information technology) | |
Nancy T. Lukitsh
(Born 1956)
Trustee | | | 2011 | | | Senior Vice President, Partner and Director of Marketing, Wellington Management Company, LLP (investment adviser) from 1997 to 2010; Chair, Wellington Management Investment Portfolios (commingled non-U.S. investment pools) from 2007 to 2010; Director, Wellington Trust Company, NA and other Wellington affiliates from 1997 to 2010 | | | 60 | | | None | |
William E. Mayer
(Born 1940)
Trustee | | | 1991 | | | Partner, Park Avenue Equity Partners (private equity) since February 1999 | | | 60 | | | DynaVox Inc. (speech creation); Lee Enterprises (print media); WR Hambrecht + Co. (financial service provider) from 2000 to 2012; BlackRock Kelso Capital Corporation (investment company); and Premier, Inc. (healthcare) | |
Annual Report 2015
35
COLUMBIA GREATER CHINA FUND
TRUSTEES AND OFFICERS (continued)
Independent Trustees (continued)
Name, Year of Birth
and Position Held
with the Trust | | Year First
Appointed or
Elected as
Trustee to any
Fund Currently
in the Columbia
Funds Complex
or a Predecessor
Thereof | | Principal Occupation(s)
during the Past Five Years | | Number
of Funds
in the
Columbia
Funds
Complex
Overseen | | Other Directorships
Held by Trustee During
the Past Five Years | |
David M. Moffett
(Born 1952)
Trustee | | | 2011 | | | Retired. Consultant to Bridgewater and Associates; Chief Executive Officer, Federal Home Loan Mortgage Corporation, from 2008 to 2009; Senior Adviser, Global Financial Services Group, Carlyle Group, Inc., from 2007 to 2008; Vice Chairman and Chief Financial Officer, U.S. Bancorp, from 1993 to 2007 | | | 60 | | | Building Materials Holding Corp. (building materials and construction services); CIT Group Inc. (commercial and consumer finance); eBay Inc. (online trading community); E.W. Scripps Co. (print and television media); Genworth Financial, Inc. (financial and insurance products and services); MBIA Inc. (financial service provider); Paypal Holdings Inc. (payment and data processing services); and University of Oklahoma Foundation | |
Charles R. Nelson
(Born 1942)
Trustee | | | 1981 | | | Retired. Professor Emeritus, University of Washington since 2011; Professor of Economics, University of Washington from 1976 to 2011; Ford and Louisa Van Voorhis Professor of Political Economy, University of Washington from 1993 to 2011; Adjunct Professor of Statistics, University of Washington from 1980 to 2011; Associate Editor, Journal of Money, Credit and Banking from September 1993 to 2008; consultant on econometric and statistical matters | | | 60 | | | None | |
John J. Neuhauser
(Born 1943)
Trustee | | | 1984 | | | President, Saint Michael's College since August 2007; Director or Trustee of several non-profit organizations, including Fletcher Allen Health Care, Inc.; Academic Vice President and Dean of Faculties, Boston College from August 1999 to October 2005; University Professor, Boston College from November 2005 to August 2007 | | | 60 | | | Liberty All-Star Equity Fund and Liberty All-Star Growth Fund (closed-end funds) | |
Patrick J. Simpson
(Born 1944)
Trustee | | | 2000 | | | Partner, Perkins Coie LLP (law firm) | | | 60 | | | None | |
Anne-Lee Verville
(Born 1945)
Trustee | | | 1998 | | | Retired. General Manager, Global Education Industry from 1994 to 1997, President — Application Systems Division from 1991 to 1994, Chief Financial Officer — US Marketing & Services from 1988 to 1991, and Chief Information Officer from 1987 to 1988, IBM Corporation (computer and technology) | | | 60 | | | Enesco Group, Inc. (producer of giftware and home and garden decor products) from 2001 to 2006 | |
Annual Report 2015
36
COLUMBIA GREATER CHINA FUND
TRUSTEES AND OFFICERS (continued)
Interested Trustee Affiliate with Investment Manager*
Name, Year of Birth
and Position Held
with the Trust | | Year First
Appointed or
Elected as
Trustee to any
Fund Currently
in the Columbia
Funds Complex
or a Predecessor
Thereof | | Principal Occupation(s)
during the Past Five Years | | Number
of Funds
in the
Columbia
Funds
Complex
Overseen | | Other Directorships
Held by Trustee During
the Past Five Years | |
William F. Truscott
(Born 1960)
Trustee | | | 2012 | | | Chairman of the Board and President, Columbia Management Investment Advisers, LLC since May 2010 and February 2012, respectively (previously President and Chief Investment Officer, 2001-April 2010); Chief Executive Officer, Global Asset Management, Ameriprise Financial, Inc. since September 2012 (previously Chief Executive Officer, U.S. Asset Management & President, Annuities, May 2010-September 2012 and President — U.S. Asset Management and Chief Investment Officer, 2005-April 2010); Director and Chief Executive Officer, Columbia Management Investment Distributors, Inc. since May 2010 and February 2012, respectively (previously Chairman of the Board and Chief Executive Officer, 2006-April 2010); Chairman of the Board and Chief Executive Officer, RiverSource Distributors, Inc. since 2006; Director, Threadneedle Asset Management Holdings, SARL since 2014; President and Chief Executive Officer, Ameriprise Certificate Company, 2006-August 2012 | | | 187 | | | Chairman of the Board, Columbia Management Investment Advisers, LLC since May 2010; Director, Columbia Management Investment Distributors, Inc. since May 2010; Director, Ameriprise Certificate Company, 2006 to January 2013 | |
* Interested person (as defined under the 1940 Act) by reason of being an officer, director, security holder and/or employee of the Investment Manager or Ameriprise Financial.
The Statement of Additional Information has additional information about the Fund's Board members and is available, without charge, upon request by calling 800.345.6611; contacting your financial intermediary; or visiting columbiathreadneedle.com/us.
The Board has appointed officers who are responsible for day-to-day business decisions based on policies it has established. The officers serve at the pleasure of the Board. In addition to Mr. Truscott, who is Senior Vice President, the Funds' other officers are:
Fund Officers
Name,
Address and
Year of Birth | | Position and Year
First Appointed to
Position for any Fund
in the Columbia
Funds Complex or a
Predecessor Thereof | | Principal Occupation(s) During Past Five Years | |
Christopher O. Petersen
5228 Ameriprise
Financial Center
Minneapolis, MN 55474
Born 1970 | | President and Principal Executive Officer (2015) | | Vice President and Lead Chief Counsel, Ameriprise Financial, Inc. since January 2015 (previously, Vice President and Chief Counsel January 2010-December 2014; and Vice President and Group Counsel or Counsel 2004- January 2010); officer of Columbia Funds and affiliated funds since 2007. | |
Michael G. Clarke
225 Franklin Street
Boston, MA 02110
Born 1969 | | Treasurer (2011) and Chief Financial Officer (2009) | | Vice President — Mutual Fund Administration, Columbia Management Investment Advisers, LLC, since May 2010; Managing Director of Fund Administration, Columbia Management Advisors, LLC, September 2004-April 2010; senior officer of Columbia Funds and affiliated funds since 2002. | |
Annual Report 2015
37
COLUMBIA GREATER CHINA FUND
TRUSTEES AND OFFICERS (continued)
Fund Officers (continued)
Name,
Address and
Year of Birth | | Position and Year
First Appointed to
Position for any Fund
in the Columbia
Funds Complex or a
Predecessor Thereof | | Principal Occupation(s) During Past Five Years | |
Paul B. Goucher
100 Park Avenue
New York, NY 10017
Born 1968 | | Senior Vice President (2011), Chief Legal Officer (2015) and Assistant Secretary (2008) | | Vice President and Lead Chief Counsel, Ameriprise Financial, Inc. since November 2008 and January 2013, respectively (previously Chief Counsel, January 2010-January 2013 and Group Counsel, November 2008-January 2010). | |
Thomas P. McGuire
225 Franklin Street
Boston, MA 02110
Born 1972 | | Vice President and Chief Compliance Officer (2012) | | Vice President — Asset Management Compliance, Ameriprise Financial, Inc., since May 2010; Chief Compliance Officer, Ameriprise Certificate Company since September 2010; Compliance Executive, Bank of America, 2005-April 2010. | |
Colin Moore
225 Franklin Street
Boston, MA 02110
Born 1958 | | Senior Vice President (2010) | | Executive Vice President and Global Chief Investment Officer, Ameriprise Financial, Inc., since July 2013; Director and Global Chief Investment Officer, Columbia Management Investment Advisers, LLC since May 2010; Manager, Managing Director and Chief Investment Officer, Columbia Management Advisors, LLC, 2007-April 2010. | |
Michael E. DeFao
225 Franklin Street
Boston, MA 02110
Born 1968 | | Vice President (2011) and Assistant Secretary (2010) | | Vice President and Chief Counsel, Ameriprise Financial, Inc. since May 2010; Associate General Counsel, Bank of America, 2005-April 2010. | |
Joseph F. DiMaria
225 Franklin Street
Boston, MA 02110
Born 1968 | | Vice President (2011), Assistant Treasurer (2012) and Chief Accounting Officer (2008) | | Vice President — Mutual Fund Treasurer, Columbia Management Investment Advisers, LLC since May 2010; Director of Fund Administration, Columbia Management Advisors, LLC, 2006-April 2010. | |
Amy Johnson
5228 Ameriprise
Financial Center
Minneapolis, MN 55474
Born 1965 | | Vice President (2006) | | Managing Director and Chief Operating Officer, Columbia Management Investment Advisers, LLC since May 2010 (previously Chief Administrative Officer, 2009-April 2010, and Vice President — Asset Management and Trust Company Services, 2006-2009). | |
Lyn Kephart-Strong
5228 Ameriprise
Financial Center
Minneapolis, MN 55474
Born 1960 | | Vice President (2015) | | President, Columbia Management Investment Services Corp. since October 2014; Vice President & Resolution Officer, Ameriprise Trust Company since August 2009; President, RiverSource Service Corporation 2004-2010. | |
Ryan C. Larrenaga
225 Franklin Street
Boston, MA 02110
Born 1970 | | Vice President and Secretary (2015) | | Vice President and Group Counsel, Ameriprise Financial, Inc. since August 2011 (previously, Counsel from May 2010 to August 2011); Assistant General Counsel, Bank of America, 2005-April 2010; officer of Columbia Funds and affiliated funds since 2005. | |
Annual Report 2015
38
COLUMBIA GREATER CHINA FUND
BOARD CONSIDERATION AND APPROVAL OF ADVISORY AGREEMENT
On June 10, 2015, the Board of Trustees (the "Board") and the Trustees who are not interested persons (as defined in the Investment Company Act of 1940) (the "Independent Trustees") of Columbia Funds Series Trust I (the "Trust") unanimously approved the continuation of the Investment Management Services Agreement (the "Advisory Agreement") with Columbia Management Investment Advisers, LLC (the "Investment Manager") with respect to Columbia Greater China Fund (the "Fund"), a series of the Trust. The Board and the Independent Trustees also unanimously approved an agreement (the "Management Agreement" and, together with the Advisory Agreement, the "Agreements") combining the Advisory Agreement and the Fund's existing administrative services agreement (the "Administrative Services Agreement") in a single agreement. The Board and the Independent Trustees approved the restatement of the Advisory Agreement with the Management Agreement to be effective for the Fund on January 1, 2016, the Fund's next annual prospectus update. As detailed below, the Board's Advisory Fees and Expenses Committee (the "Committee") and the Board met on multiple occasions to review and discuss, both among themselves and with the management team of the Investment Manager, materials provided by the Investment Manager and others before determining to approve the Management Agreement and the continuation of the Advisory Agreement.
In connection with their deliberations regarding the approval of the Management Agreement and the continuation of the Advisory Agreement, the Committee and the Board evaluated materials requested from the Investment Manager regarding the Fund and the Agreements, and discussed these materials with representatives of the Investment Manager at Committee meetings held on March 3, 2015, April 29, 2015 and June 9, 2015 and at Board meetings held on March 4, 2015 and June 10, 2015. In addition, the Board considers matters bearing on the Agreements at most of its other meetings throughout the year and meets regularly with senior management of the Trust and the Investment Manager. Through the Board's Investment Oversight Committees, Trustees also meet with selected portfolio managers of the funds the Trustees oversee and other investment personnel at various times throughout the year. The Committee and the Board also consulted with its independent fee consultant, Fund counsel and with the Independent Trustees' independent legal counsel, who advised on various matters with respect to the Committee's and the Board's considerations and otherwise assisted the Committee and the Board in their deliberations. On June 9, 2015, the Committee recommended that the Board approve the Management Agreement and the continuation of the Advisory Agreement. On June 10, 2015, the Board, including the Independent Trustees, voting separately, unanimously approved the Management Agreement and the continuation of the Advisory Agreement for the Fund.
The Committee and the Board considered all information that they, their legal counsel or the Investment Manager believed reasonably necessary to evaluate and to determine whether to approve the Management Agreement and the continuation of the Advisory Agreement. The information and factors considered by the Committee and the Board in recommending for approval or approving the Management Agreement and the continuation of the Advisory Agreement for the Fund included the following:
• Information on the investment performance of the Fund relative to the performance of a group of mutual funds determined to be comparable to the Fund by an independent third-party data provider, as well as performance relative to benchmarks;
• Information on the Fund's advisory fees and total expenses, including information comparing the Fund's expenses to those of a group of comparable mutual funds, as determined by the independent third-party data provider;
• The Investment Manager's agreement to contractually limit or cap total operating expenses for the Fund so that total operating expenses (excluding certain fees and expenses, such as portfolio transaction costs and certain other investment related expenses, interest, taxes, acquired fund fees and expenses, and extraordinary expenses) would not exceed a specified percentage of the Fund's average annual net assets from January 1, 2016 through December 31, 2016;
• The terms and conditions of the Agreements;
Annual Report 2015
39
COLUMBIA GREATER CHINA FUND
BOARD CONSIDERATION AND APPROVAL OF ADVISORY AGREEMENT (continued)
• The current and proposed terms and conditions of other agreements and arrangements with affiliates of the Investment Manager relating to the operations of the Fund, including the Administrative Services Agreement1 and agreements with respect to the provision of distribution and transfer agency services to the Fund;
• Descriptions of various functions performed by the Investment Manager under the Agreements, including portfolio management and portfolio trading practices;
• Information regarding the management fees and investment performance of similarly-managed portfolios of other clients of the Investment Manager, including institutional separate accounts;
• Information regarding the reputation, regulatory history and resources of the Investment Manager, including information regarding senior management, portfolio managers and other personnel;
• Information regarding the capabilities of the Investment Manager with respect to compliance monitoring services, including an assessment of the Investment Manager's compliance system by the Fund's Chief Compliance Officer; and
• The profitability to the Investment Manager and its affiliates from their relationships with the Fund.
Nature, Extent and Quality of Services Provided under the Agreements
The Committee and the Board considered the nature, extent and quality of services provided to the Fund by the Investment Manager and its affiliates under the Agreements and under separate agreements for the provision of transfer agency and administrative services, and the resources dedicated to the Fund and the other Columbia Funds by the Investment Manager and its affiliates. The Committee and the Board also determined that the nature and level of the services to be provided under the Management Agreement would not decrease relative to the services provided under the Advisory Agreement and the Administrative Services Agreement. The Committee and the Board considered, among other things, the Investment Manager's ability to attract, motivate and retain highly qualified research, advisory and supervisory investment professionals (including personnel and other resources, compensation programs for personnel involved in fund management, reputation and other attributes), the portfolio management services provided by those investment professionals, and the quality of the Investment Manager's investment research capabilities and trade execution services. The Committee and the Board also considered the potential benefits to shareholders of investing in a mutual fund that is part of a fund complex offering exposure to a variety of asset classes and investment disciplines and providing a variety of fund and shareholder services.
The Committee and the Board also considered the professional experience and qualifications of the senior personnel of the Investment Manager, which included consideration of the Investment Manager's experience with similarly-structured funds. The Committee and the Board noted the compliance programs of and the compliance-related resources provided to the Fund by the Investment Manager and its affiliates, and considered the Investment Manager's ability to provide administrative services to the Fund and coordinate the activities of the Fund's other service providers. In evaluating the nature, extent and quality of services provided under the Agreements, the Committee and the Board considered that these services were provided to the Fund, rather than directly to Fund shareholders. The Committee and the Board accordingly affirmed, after considering various other matters, including the potential benefits to the Fund and its shareholders of the Independent Trustees' important role as pre-suit gatekeepers with respect to claims that they may determine are meritless or contrary to the Fund's best interests, that it was not the intention of the Board or the Investment Manager that there be any third-party beneficiaries of the Agreements. After reviewing these and related factors, the Committee and the Board concluded, within the context of their overall conclusions, that the nature, extent and quality of the services provided to the Fund under the Agreements supported the approval of the Management Agreement and the continuation of the Advisory Agreement.
Investment Performance
The Committee and the Board reviewed information about the performance of the Fund over various time periods, including performance information relative to benchmarks and information based on reports of the independent
1 Like the Advisory Agreement, the Administrative Services Agreement will terminate with respect to the Fund once the Management
Agreement is effective for the Fund.
Annual Report 2015
40
COLUMBIA GREATER CHINA FUND
BOARD CONSIDERATION AND APPROVAL OF ADVISORY AGREEMENT (continued)
third-party data provider that compared the performance of the Fund to the performance of a group of comparable mutual funds, and data provided by the independent fee consultant. The Committee and the Board also reviewed a description of the third party's methodology for identifying the Fund's peer groups for purposes of performance and expense comparisons.
The Committee and the Board noted that, through December 31, 2014, the Fund's performance was in the 18th, 34th and 34th percentile (where the best performance would be in the first percentile) of its category selected by the independent third-party data provider for the purposes of performance comparisons for the one-, three- and five- year periods, respectively.
The Committee and the Board also considered the Investment Manager's performance and reputation generally, the Investment Manager's historical responsiveness to Board concerns about performance, and the Investment Manager's willingness to take steps intended to improve performance. After reviewing these and related factors, the Committee and the Board concluded, within the context of their overall conclusions, that the performance of the Fund was sufficient, in light of other considerations, to warrant the continuation of the Advisory Agreement and the approval of the Management Agreement.
Investment Advisory Fee Rates and Other Expenses
The Committee and the Board considered the advisory fees charged to the Fund under the Advisory Agreement as well as the total expenses incurred by the Fund. In assessing the reasonableness of the fees under the Advisory Agreement, the Committee and the Board considered, among other information, the Fund's advisory fee and its total expense ratio as a percentage of average daily net assets. The Committee and the Board also considered that the proposed management fee would not exceed the sum of the fee rates payable under the Advisory Agreement and the Administrative Services Agreement. The Committee and the Board considered data provided by the independent fee consultant. The Committee and the Board noted that, as of December 31, 2014, the Fund's actual management fee and net expense ratio are ranked in the 2nd and 1st quintiles, respectively, (where the lowest fees and expenses would be in the first quintile) against the Fund's expense universe as determined by the independent third-party data provider for purposes of expense comparison. The Committee and the Board also took into account the fee waiver and expense limitation arrangements agreed to by the Investment Manager, as noted above.
The Committee and the Board also received and considered information about the advisory fees charged by the Investment Manager to institutional separate accounts. In considering the fees charged to those accounts, the Committee and the Board took into account, among other things, the Investment Manager's representations about the differences between managing mutual funds as compared to other types of accounts, including differences in the services provided, differences in the risk profile of such business for the Investment Manager and the additional resources required to manage mutual funds effectively. The Committee and the Board also received and considered information about the fees charged by the Investment Manager for sub-advisory services provided to comparable unaffiliated funds. In evaluating the Fund's advisory fees, the Committee and the Board also took into account the demands, complexity and quality of the investment management of the Fund.
After reviewing these and related factors, the Committee and the Board concluded, within the context of their overall conclusions, that the advisory/management fee rates and expenses of the Fund were sufficient, in light of other considerations, to warrant the approval of the Management Agreement and continuation of the Advisory Agreement.
Costs of Services Provided and Profitability
The Committee and the Board also took note of the costs the Investment Manager and its affiliates incur in connection with the services provided (both on an absolute and relative basis) and the profitability to the Investment Manager and its affiliates in connection with their relationships with the Fund.
The Committee and the Board also considered the compensation directly or indirectly received by the Investment Manager's affiliates in connection with their relationships with the Fund. The Committee and the Board reviewed information provided by management as to the profitability to the Investment Manager and its affiliates of their
Annual Report 2015
41
COLUMBIA GREATER CHINA FUND
BOARD CONSIDERATION AND APPROVAL OF ADVISORY AGREEMENT (continued)
relationships with the Fund, information about the allocation of expenses used to calculate profitability, and comparisons of profitability levels realized in 2014 to profitability levels realized in 2013. When reviewing profitability, the Committee and the Board also considered court cases in which adviser profitability was an issue in whole or in part, the performance of similarly managed funds, the performance of the Fund, and the expense ratio of the Fund. The Committee and the Board also considered information provided by the Investment Manager regarding the Investment Manager's financial condition and comparing its profitability to that of other asset management firms that are, or are subsidiaries of, publicly traded companies.
After reviewing these and related factors, the Committee and the Board concluded, within the context of their overall conclusions, that the costs of services provided and the profitability to the Investment Manager and its affiliates from their relationships with the Fund supported the approval of the Management Agreement and the continuation of the Advisory Agreement.
Economies of Scale
The Committee and the Board considered the potential existence of economies of scale in the provision by the Investment Manager of services to the Fund, to groups of related funds, and to the Investment Manager's investment advisory clients as a whole, and whether those economies of scale were shared with the Fund through breakpoints in investment advisory fees or other means, such as expense limitation arrangements and additional investments by the Investment Manager in investment, trading and compliance resources. The Committee and the Board noted that the investment advisory and management fee schedules for the Fund contained breakpoints that would reduce the fee rate on assets above specified threshold levels.
In considering these matters, the Committee and the Board also considered the costs of the services provided and the profitability to the Investment Manager and its affiliates from their relationships with the Fund, as discussed above. After reviewing these and related factors, the Committee and the Board concluded, within the context of their overall conclusions, that the extent to which any economies of scale were expected to be shared with the Fund supported the approval of the Management Agreement and the continuation of the Advisory Agreement.
Other Benefits to the Investment Manager
The Committee and the Board received and considered information regarding "fall-out" or ancillary benefits received by the Investment Manager and its affiliates as a result of their relationships with the Fund, such as the engagement of the Investment Manager to provide administrative services to the Fund and the engagement of the Investment Manager's affiliates to provide distribution and transfer agency services to the Fund. In this regard, among other matters, the Committee and the Board considered that the Fund's distributor retains a portion of the distribution fees from the Fund and receives a portion of the sales charges on sales or redemptions of certain classes of shares of the Fund. The Committee and the Board also considered the benefits of research made available to the Investment Manager by reason of brokerage commissions generated by the Fund's securities transactions, and reviewed information about the Investment Manager's practices with respect to allocating portfolio transactions for brokerage and research services. The Committee and the Board considered the possible conflicts of interest associated with certain fall-out or other ancillary benefits and the reporting, disclosure and other processes that are in place to address such possible conflicts of interest. The Committee and the Board recognized that the Investment Manager's profitability would be somewhat lower without these benefits.
Conclusion
The Committee and the Board reviewed all of the above considerations in reaching their decisions to recommend or approve the Management Agreement and the continuation of the Advisory Agreement. In their deliberations, the Trustees did not identify any particular information that was all-important or controlling, and individual Trustees may have attributed different weights to the various factors. Based on their evaluation of all factors that they deemed to be material, including those factors described above, and assisted by the advice of independent legal counsel, the Board, including the Independent Trustees, voting separately, unanimously approved the Management Agreement and the continuation of the Advisory Agreement.
Annual Report 2015
42
COLUMBIA GREATER CHINA FUND
IMPORTANT INFORMATION ABOUT THIS REPORT
Each fund mails one shareholder report to each shareholder address. If you would like more than one report, please call shareholder services at 800.345.6611 and additional reports will be sent to you.
The policy of the Board is to vote the proxies of the companies in which each fund holds investments consistent with the procedures as stated in the Statement of Additional Information (SAI). You may obtain a copy of the SAI without charge by calling 800.345.6611; contacting your financial intermediary; visiting columbiathreadneedle.com/us; or searching the website of the Securities and Exchange Commission (SEC) at sec.gov. Information regarding how each fund voted proxies relating to portfolio securities is filed with the SEC by August 31st for the most recent 12-month period ending June 30th of that year, and is available without charge by visiting columbiathreadneedle.com/us, or searching the website of the SEC at sec.gov.
Each fund files a complete schedule of portfolio holdings with the SEC for the first and third quarters of each fiscal year on Form N-Q. Each fund's Form N-Q is available on the SEC's website at sec.gov and may be reviewed and copied at the SEC's Public Reference Room in Washington, D.C. Information on the operation of the Public Reference Room may be obtained by calling 800.SEC.0330. Each fund's complete schedule of portfolio holdings, as filed on Form N-Q, can also be obtained without charge, upon request, by calling 800.345.6611.
Annual Report 2015
43
Columbia Greater China Fund
P.O. Box 8081
Boston, MA 02266-8081

This information is for use with concurrent or prior delivery of a fund prospectus. Please read and consider the investment objectives, risks, charges and expenses for any fund carefully before investing. For a prospectus and summary prospectus, which contains this and other important information about the Fund, go to columbiathreadneedle.com/us. The Fund is distributed by Columbia Management Investment Distributors, Inc., member FINRA, and managed by Columbia Management Investment Advisers, LLC.
Columbia Threadneedle Investments (Columbia Threadneedle) is the global brand name of the Columbia and Threadneedle group of companies.
All rights reserved. Columbia Management Investment Distributors, Inc., 225 Franklin Street, Boston, MA 02110-2804
© 2015 Columbia Management Investment Advisers, LLC.
columbiathreadneedle.com/us
ANN158_08_E01_(10/15)

ANNUAL REPORT
August 31, 2015

COLUMBIA GLOBAL DIVIDEND OPPORTUNITY FUND

 Dear Shareholder,
Today's investors are typically focused on outcomes, like living a certain retirement lifestyle, paying for college education or building a legacy. But in today's complex global investment landscape, even simple goals are not easily achieved.
At Columbia Threadneedle Investments, we aspire to help satisfy five core needs of today's investors:
n Generate an appropriate stream of income in retirement
Traditional approaches to generating income may not provide the diversification benefits they once did, and they may actually introduce unwanted risk in today's market. To seek to improve your potential to live comfortably long term, we endeavor to pursue investments that explore less traveled paths to income.
n Navigate a changing interest rate environment
Today's uncertain market environment includes the prospect of a rise in interest rates. Blending traditional investments with non-traditional or alternative products may help protect your wealth during periods of volatility. We can attempt to help strengthen your portfolio with agile products designed to take on the market's ups and downs.
n Maximize after-tax returns
In an environment where what you keep may be more important than what you earn, municipal bonds can help mitigate high tax burdens while providing potentially attractive yields. Our state and federal tax-exempt products are aimed at helping investors manage risk, minimize the fluctuation of capital and grow wealth on a more tax-efficient basis.
n Grow assets to achieve financial goals
We believe that finding and protecting growth comes from a disciplined security selection process designed to create excess return. Our goal is to provide investment solutions built to help you face today's market challenges and grow your assets at each crossroad of your journey.
n Ease the impact of volatile markets
Despite a bull market run that has benefited many investors over the past several years, it's important to remember the lessons of 2008 and the value that a well-diversified portfolio may provide through times of market volatility. We are here to help you hold onto the savings you have worked tirelessly to amass, and to provide you the best opportunity to maintain your standard of living regardless of market conditions.
Find out today how we can help you confidently invest to realize your dreams. Please visit us at blog.columbiathreadneedleus.com/our-best-ideas to learn more about our unique investment solutions.
The world is constantly changing, but our priority remains the same: to help you secure your finances, meet your goals and achieve success. Thank you for your continued investment with us.
Sincerely,

Christopher O. Petersen
President, Columbia Funds
Investors should consider the investment objectives, risks, charges and expenses of a mutual fund carefully before investing. For a free prospectus and summary prospectus, which contains this and other important information about a fund, visit columbiathreadneedle.com/us. The prospectus should be read carefully before investing.
Columbia Funds are distributed by Columbia Management Investment Distributors, Inc., member FINRA, and managed by Columbia Management Investment Advisers, LLC.
© 2015 Columbia Management Investment Advisers, LLC. All rights reserved.
COLUMBIA GLOBAL DIVIDEND OPPORTUNITY FUND
Performance Overview | | | 2 | | |
Manager Discussion of Fund Performance | | | 4 | | |
Understanding Your Fund's Expenses | | | 8 | | |
Portfolio of Investments | | | 9 | | |
Statement of Assets and Liabilities | | | 14 | | |
Statement of Operations | | | 16 | | |
Statement of Changes in Net Assets | | | 17 | | |
Financial Highlights | | | 20 | | |
Notes to Financial Statements | | | 30 | | |
Report of Independent Registered
Public Accounting Firm | | | 38 | | |
Federal Income Tax Information | | | 39 | | |
Trustees and Officers | | | 40 | | |
Board Consideration and Approval of Advisory Agreement | | | 44 | | |
Important Information About This Report | | | 49 | | |
Fund Investment Manager
Columbia Management Investment
Advisers, LLC
225 Franklin Street
Boston, MA 02110
Fund Distributor
Columbia Management Investment
Distributors, Inc.
225 Franklin Street
Boston, MA 02110
Fund Transfer Agent
Columbia Management Investment
Services Corp.
P.O. Box 8081
Boston, MA 02266-8081
For more information about any of the funds, please visit columbiathreadneedle.com/us or call 800.345.6611. Customer Service Representatives are available to answer your questions Monday through Friday from 8 a.m. to 7 p.m. Eastern time.
The views expressed in this report reflect the current views of the respective parties. These views are not guarantees of future performance and involve certain risks, uncertainties and assumptions that are difficult to predict, so actual outcomes and results may differ significantly from the views expressed. These views are subject to change at any time based upon economic, market or other conditions and the respective parties disclaim any responsibility to update such views. These views may not be relied on as investment advice and, because investment decisions for a Columbia fund are based on numerous factors, may not be relied on as an indication of trading intent on behalf of any particular Columbia fund. References to specific securities should not be construed as a recommendation or investment advice.
COLUMBIA GLOBAL DIVIDEND OPPORTUNITY FUND
Performance Summary
n Columbia Global Dividend Opportunity Fund (the Fund) Class A shares returned -11.49% excluding sales charges for the 12-month period that ended August 31, 2015.
n During the same 12-month period, the Fund outperformed the MSCI All Country World High Dividend Yield Index (Net), which returned -11.55%, and underperformed the MSCI All Country World Index (Net), which returned -6.29%.
n While generating disappointing absolute returns, the Fund's results relative to the MSCI All Country World High Dividend Yield Index (Net) were helped by stock selection and country allocation overall. During the 12-month period, sector allocation had a rather neutral effect.
Average Annual Total Returns (%) (for period ended August 31, 2015)
| | | Inception | | 1 Year | | 5 Years | | 10 Years | |
Class A | | 11/01/02 | | | | | | | | | | | | | |
Excluding sales charges | | | | | | | -11.49 | | | | 8.30 | | | | 4.09 | | |
Including sales charges | | | | | | | -16.58 | | | | 7.03 | | | | 3.48 | | |
Class B | | 11/01/02 | | | | | | | | | | | | | |
Excluding sales charges | | | | | | | -12.18 | | | | 7.48 | | | | 3.31 | | |
Including sales charges | | | | | | | -15.98 | | | | 7.18 | | | | 3.31 | | |
Class C | | 10/13/03 | | | | | | | | | | | | | |
Excluding sales charges | | | | | | | -12.18 | | | | 7.49 | | | | 3.31 | | |
Including sales charges | | | | | | | -12.94 | | | | 7.49 | | | | 3.31 | | |
Class I* | | 09/27/10 | | | -11.08 | | | | 8.77 | | | | 4.45 | | |
Class R* | | 09/27/10 | | | -11.78 | | | | 8.01 | | | | 3.82 | | |
Class R4* | | 03/19/13 | | | -11.27 | | | | 8.57 | | | | 4.35 | | |
Class R5* | | 01/08/14 | | | -11.13 | | | | 8.64 | | | | 4.38 | | |
Class W* | | 09/27/10 | | | -11.41 | | | | 8.34 | | | | 4.16 | | |
Class Y* | | 07/15/09 | | | -11.04 | | | | 8.77 | | | | 4.46 | | |
Class Z | | 11/09/00 | | | -11.28 | | | | 8.56 | | | | 4.35 | | |
MSCI All Country World High Dividend Yield Index (Net) | | | | | | | -11.55 | | | | 7.69 | | | | 4.91 | | |
MSCI All Country World Index (Net) | | | | | | | -6.29 | | | | 9.60 | | | | 5.28 | | |
Returns for Class A are shown with and without the maximum initial sales charge of 5.75%. Returns for Class B are shown with and without the applicable contingent deferred sales charge (CDSC) of 5.00% in the first year, declining to 1.00% in the sixth year and eliminated thereafter. Returns for Class C are shown with and without the 1.00% CDSC for the first year only. The Fund's other classes are not subject to sales charges and have limited eligibility. Please see the Fund's prospectus for details. Performance for different share classes will vary based on differences in sales charges and fees associated with each class. All results shown assume reinvestment of distributions during the period. Returns do not reflect the deduction of taxes that a shareholder may pay on Fund distributions or on the redemption of Fund shares. Performance results reflect the effect of any fee waivers or reimbursements of Fund expenses by Columbia Management Investment Advisers, LLC and/or any of its affiliates. Absent these fee waivers or expense reimbursement arrangements, performance results would have been lower.
The performance information shown represents past performance and is not a guarantee of future results. The investment return and principal value of your investment will fluctuate so that your shares, when redeemed, may be worth more or less than their original cost. Current performance may be lower or higher than the performance information shown. You may obtain performance information current to the most recent month-end by contacting your financial intermediary, visiting columbiathreadneedle.com/us or calling 800.345.6611.
*The returns shown for periods prior to the share class inception date (including returns for the Life of the Fund, if shown, which are since Fund inception) include the returns of the Fund's oldest share class. These returns are adjusted to reflect any higher class-related operating expenses of the newer share classes, as applicable. Please visit columbiathreadneedle.com/us/investment-products/mutual-funds/appended-performance for more information.
The MSCI All Country World High Dividend Yield Index (Net) includes large and mid-cap stocks across 23 developed market countries. The index is designed to reflect the performance of equities selected from the MSCI World Index with higher than average dividend yields that are both sustainable and persistent.
The MSCI All Country World Index (Net) is a free float-adjusted market capitalization weighted index that is designed to measure the equity market performance of developed and emerging markets. The index consists of 45 country indices comprising 24 developed and 21 emerging market country indices.
Indices are not available for investment, are not professionally managed and do not reflect sales charges, fees, brokerage commissions, taxes (except the MSCI All Country World High Dividend Yield Index (Net) and the MSCI All Country World Index (Net) which reflects reinvested dividends net of withholding taxes) or other expenses of investing. Securities in the Fund may not match those in an index.
Annual Report 2015
2
COLUMBIA GLOBAL DIVIDEND OPPORTUNITY FUND
PERFORMANCE OVERVIEW (continued)
Performance of a Hypothetical $10,000 Investment (September 1, 2005 – August 31, 2015)
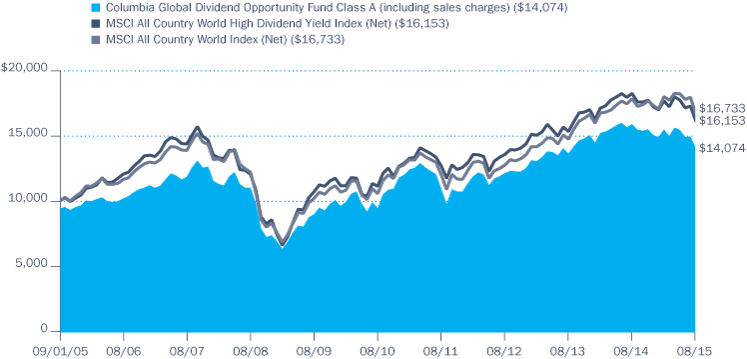
The chart above shows the change in value of a hypothetical $10,000 investment in Class A shares of Columbia Global Dividend Opportunity Fund during the stated time period, and does not reflect the deduction of taxes that a shareholder may pay on Fund distributions or on the redemption of Fund shares.
Annual Report 2015
3
COLUMBIA GLOBAL DIVIDEND OPPORTUNITY FUND
MANAGER DISCUSSION OF FUND PERFORMANCE
Portfolio Management
Paul Stocking
Steven Schroll
Dean Ramos, CFA
Morningstar Style BoxTM
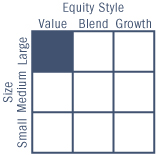
The Morningstar Style BoxTM is based on a fund's portfolio holdings. For equity funds, the vertical axis shows the market capitalization of the stocks owned, and the horizontal axis shows investment style (value, blend, or growth). Information shown is based on the most recent data provided by Morningstar.
© 2015 Morningstar, Inc. All rights reserved. The Morningstar information contained herein: (1) is proprietary to Morningstar and/or its content providers; (2) may not be copied or distributed; and (3) is not warranted to be accurate, complete or timely. Neither Morningstar nor its content providers are responsible for any damages or losses arising from any use of this information.
For the 12-month period that ended August 31, 2015, the Fund's Class A shares returned -11.49% excluding sales charge. During the same time period, the Fund outperformed the MSCI All Country World High Dividend Yield Index (Net), which returned -11.55%, and underperformed the MSCI All Country World Index (Net), which returned -6.29%. While generating disappointing absolute returns, the Fund's results relative to the MSCI All Country World High Dividend Yield Index (Net) were helped by stock selection and country allocation overall. During the 12-month period, sector allocation had a rather neutral effect.
Global Equity Markets Struggled Amid Heightened Volatility
Global equity markets struggled during the 12-month period that ended August 31, 2015, losing ground as central bank policy, currency movements and sharply falling oil prices each had great impact. Both the European Central Bank and the Bank of Japan employed easy monetary policy in an effort to stimulate economic growth. With interest rates near zero in both regions, their currencies fell against the U.S. dollar, which helped increase exports, an important source of revenue to companies in Europe and Japan. At the same time, however, the weak currencies reduced equity returns expressed in U.S. dollars. Meanwhile, U.S. equity markets focused on the timing of the first interest rate increase by the Federal Reserve (the Fed) since 2006. While early expectations had been for a June 2015 rate hike, significant market volatility and uncertainty in the global markets pushed expectations toward December 2015.
Global equity market volatility increased during the summer of 2015. Greece teetered on the brink of financial collapse, while the domestic Chinese equity market began a dramatic correction. Weakening Chinese economic data and the devaluation of the yuan weighed on global equity markets and also led to concerns regarding the demand for many commodities, including oil, which saw a precipitous drop in price.
Energy and Industrials Stock Selection Supported Fund Results
Stock selection in energy added the greatest relative value to the Fund's results, with an overweight to The Williams Cos., a U.S. energy infrastructure company, helping most. The Williams Cos. received a takeout offer from Energy Transfer Equity LP toward the end of the second quarter of 2015. While the premium bid was rebuffed, the company's stock rose. We sold the Fund's position on the day of the announcement, and the stock subsequently pulled back, boosting further its positive contribution to relative results. Having an underweight to integrated oil company Chevron, which saw its share price fall with the price of oil, contributed positively as well.
Stock selection in industrials supported Fund results, too. Positions in infrastructure builder and operator Ferro Vial and defense contractor Lockheed Martin were particularly strong performers. Elsewhere, a position in information technology's Cisco Systems added value. Positioning in telecommunication services and having a position in cash during a period when the global equity markets struggled also proved effective.
Annual Report 2015
4
COLUMBIA GLOBAL DIVIDEND OPPORTUNITY FUND
MANAGER DISCUSSION OF FUND PERFORMANCE (continued)
From a country perspective, stock selection in Canada was most beneficial to Fund results. Also contributing positively was having no exposure to Russia and South Africa, each of which significantly lagged the MSCI All Country World High Dividend Yield Index (Net) during the period.
Health Care Positioning Hampered Results Most
Having an underweight position in health care, the only sector in the MSCI All Country World High Dividend Yield Index (Net) to post a gain during the period, as well as stock selection within the sector, detracted most from the Fund's results. In particular, we maintained underweight positions in pharmaceuticals companies Eli Lily and Sanofi, based either on our analysis of their valuations or company-specific fundamentals. These underweights hurt relative Fund performance as the stock of both companies rose during the period.
The Fund's results were also hurt by stock selection in financials. A position in U.K. bank HSBC, whose share price declined on potential credit losses given its exposure to Hong Kong, concerns about China's slowing economy and a lack of normalization in U.S. interest rates, weighed on Fund performance. Stock selection in consumer staples further disappointed. A position in Procter & Gamble and exposure to Brazilian companies, which were impacted by significant currency weakness, particularly hampered Fund results.
From a country perspective, stock selection in the U.S. and positioning in China and the U.K. detracted most.
Various Factors Drove Country and Sector Weighting Changes
Based on fundamental, bottom-up stock selection, the Fund's allocations to the energy, financials and information technology sectors increased. The Fund's exposures to the health care and consumer staples sectors decreased. Among the most significant purchases for the Fund in the energy sector during the annual period were Statoil, Amec Foster Wheeler, Kinder Morgan, CNOOC and Anadarko Petroleum. In financials, we added to the Fund's positions in Chinese banks on our view that government policy would be accommodative in seeking to support its nation's economy and in European banks on our view that the ECB's quantitative easing would be a driver for its banks' performance. In information technology, we established a new Fund position in Wincor Nixdorf, a German manufacturer of ATM hardware and software. Among the most significant sales for the Fund during the period were Eli Lilly and Novartis in health care and Imperial Tobacco, Coca-Cola and Sysco in consumer staples.
As driven by material weighting changes in the MSCI All Country World High Dividend Yield Index (Net) and by some changes in our fundamental views at the country level, we increased the Fund's exposure to the U.S., Germany and France and reduced its exposure to the U.K., Australia and Switzerland.
Top Ten Holdings (%)
(at August 31, 2015) | |
Exxon Mobil Corp.
(United States) | | | 4.7 | | |
AT&T, Inc. (United States) | | | 3.5 | | |
Roche Holding AG, Genusschein
Shares (Switzerland) | | | 2.7 | | |
Pfizer, Inc. (United States) | | | 2.5 | | |
Royal Dutch Shell PLC, Class A
(United Kingdom) | | | 2.5 | | |
Philip Morris International, Inc.
(United States) | | | 2.4 | | |
Procter & Gamble Co. (The)
(United States) | | | 2.1 | | |
Johnson & Johnson
(United States) | | | 2.1 | | |
Occidental Petroleum Corp.
(United States) | | | 2.0 | | |
Nestlé SA, Registered Shares
(Switzerland) | | | 2.0 | | |
Percentages indicated are based upon total investments (excluding Money Market Funds).
For further detail about these holdings, please refer to the section entitled "Portfolio of Investments."
Fund holdings are as of the date given, are subject to change at any time, and are not recommendations to buy or sell any security.
Annual Report 2015
5
COLUMBIA GLOBAL DIVIDEND OPPORTUNITY FUND
MANAGER DISCUSSION OF FUND PERFORMANCE (continued)
Country Breakdown (%)
(at August 31, 2015) | |
Australia | | | 2.2 | | |
Canada | | | 5.8 | | |
China | | | 1.9 | | |
Denmark | | | 0.3 | | |
France | | | 6.5 | | |
Germany | | | 4.7 | | |
Israel | | | 0.3 | | |
Italy | | | 1.6 | | |
Japan | | | 4.1 | | |
Malaysia | | | 0.1 | | |
Mexico | | | 0.3 | | |
Netherlands | | | 1.6 | | |
Norway | | | 1.2 | | |
Poland | | | 0.8 | | |
South Korea | | | 0.5 | | |
Spain | | | 2.0 | | |
Sweden | | | 0.8 | | |
Switzerland | | | 8.5 | | |
United Kingdom | | | 13.0 | | |
United States(a) | | | 43.8 | | |
Total | | | 100.0 | | |
Country Breakdown is based primarily on issuer's place of organization/incorporation. Percentages indicated are based upon total investments. The Fund's portfolio composition is subject to change.
(a) Includes investments in Money Market Funds.
Equity Sector Breakdown (%)
(at August 31, 2015) | |
Consumer Discretionary | | | 3.5 | | |
Consumer Staples | | | 12.1 | | |
Energy | | | 19.4 | | |
Financials | | | 17.2 | | |
Health Care | | | 15.3 | | |
Industrials | | | 6.0 | | |
Information Technology | | | 4.8 | | |
Materials | | | 6.2 | | |
Telecommunication Services | | | 9.2 | | |
Utilities | | | 6.3 | | |
Total | | | 100.0 | | |
Percentages indicated are based upon total equity investments. The Fund's portfolio composition is subject to change.
Looking Ahead
At this time, several factors have led us to a somewhat neutral view on the equity markets as we look to the last months of 2015. First, the U.S. equity market struggled to achieve positive returns for the fiscal year ended August 31, 2015 and was in negative territory year-to-date through the same date. One of the concerns we currently have is that there is an expectation of both improved top-line and bottom-line growth going forward, which puts added importance on third quarter 2015 earnings reports, especially against a backdrop of mixed economic data. Second, there remains uncertainty as to when the Fed will begin tightening its monetary policy. We believe both the market and the Fed have become increasingly focused on data releases, with each looking for a clear signal of sustained economic acceleration that would either support earnings growth and/or support the Fed's first interest rate increase. Should such clarification materialize, we believe it may well be constructive for equity valuations. However, if we see a continuation of the first eight months of 2015 in terms of mixed economic activity, then we believe the Fed may opt to wait until late 2015 or even early 2016, and we may continue to see a somewhat sideways market for equities in the months ahead. A third factor we are carefully watching at this time, given the interconnected global economy that dominates, is the relative strength of the U.S. dollar and its potential impact on corporate earnings, on central bank policy here and abroad, and on expectations, or perceptions, of both.
At the same time, there are external non-U.S. macro issues that might serve as catalysts for the equity markets, both U.S. and international, during the last months of 2015. In Asia, the biggest factor continues to be China, where its government is seeking to find tools to increase its economic activity and support its equity markets. While not yet achieving success, should the Chinese government find a way to stabilize and return growth to its domestic economy, the anticipated resultant demand could serve as a catalyst for companies around the globe. It is also true that the devaluation of the yuan in August 2015 only served to heighten uncertainty about how the ripple effect of China could potentially impact other economies, other currencies and the commodities sector broadly. Another factor that we believe could drive the global equity markets in one direction or another is what happens after the nuclear deal with Iran is enacted and after the effect of the refugees flooding into Europe is felt. We believe the likelihood of regional conflict could increase rather than decrease as a result of these world-stage events. As is often the case, some companies and some countries could be the beneficiaries of such unrest; others will suffer.
To date, our view of macro issues has not led us to change the positioning within the Fund in any substantial way. We had already reduced the Fund's positioning in China and in the emerging markets before the volatility of August 2015 made headlines. Indeed, as prices for equities were lower at the end of August 2015 than they had been for some time, we currently see the last months of the calendar year as a time of opportunity. Thus, regardless of near-term market conditions, going forward, we intend to seek value opportunities in all sectors and markets of the global equity
Annual Report 2015
6
COLUMBIA GLOBAL DIVIDEND OPPORTUNITY FUND
MANAGER DISCUSSION OF FUND PERFORMANCE (continued)
universe, maintaining a disciplined focus on business fundamentals and company management philosophies as prudent stewards of capital. We believe such a bottom-up, fundamentally-focused strategy should ultimately reward investors maintaining a long-term perspective.
Investment Risks
Market risk may affect a single issuer, sector of the economy, industry or the market as a whole. International investing involves certain risks and volatility due to potential political, economic or currency instabilities and different financial and accounting standards. Risks are enhanced for emerging market issuers. Value securities may be unprofitable if the market fails to recognize their intrinsic worth or the portfolio manager misgauged that worth. See the Fund's prospectus for information on these and other risks.
Annual Report 2015
7
COLUMBIA GLOBAL DIVIDEND OPPORTUNITY FUND
UNDERSTANDING YOUR FUND'S EXPENSES
(Unaudited)
As an investor, you incur two types of costs. There are transaction costs, which generally include sales charges on purchases and may include redemption fees. There are also ongoing costs, which generally include management fees, distribution and/or service fees, and other fund expenses. The following information is intended to help you understand your ongoing costs (in dollars) of investing in the Fund and to help you compare these costs with the ongoing costs of investing in other mutual funds.
Analyzing Your Fund's Expenses
To illustrate these ongoing costs, we have provided examples and calculated the expenses paid by investors in each share class of the Fund during the period. The actual and hypothetical information in the table is based on an initial investment of $1,000 at the beginning of the period indicated and held for the entire period. Expense information is calculated two ways and each method provides you with different information. The amount listed in the "Actual" column is calculated using the Fund's actual operating expenses and total return for the period. You may use the Actual information, together with the amount invested, to estimate the expenses that you paid over the period. Simply divide your account value by $1,000 (for example, an $8,600 account value divided by $1,000 = 8.6), then multiply the results by the expenses paid during the period under the "Actual" column. The amount listed in the "Hypothetical" column assumes a 5% annual rate of return before expenses (which is not the Fund's actual return) and then applies the Fund's actual expense ratio for the period to the hypothetical return. You should not use the hypothetical account values and expenses to estimate either your actual account balance at the end of the period or the expenses you paid during the period. See "Compare With Other Funds" below for details on how to use the hypothetical data.
Compare With Other Funds
Since all mutual funds are required to include the same hypothetical calculations about expenses in shareholder reports, you can use this information to compare the ongoing cost of investing in the Fund with other funds. To do so, compare the hypothetical example with the 5% hypothetical examples that appear in the shareholder reports of other funds. As you compare hypothetical examples of other funds, it is important to note that hypothetical examples are meant to highlight the ongoing costs of investing in a fund only and do not reflect any transaction costs, such as sales charges, or redemption or exchange fees. Therefore, the hypothetical calculations are useful in comparing ongoing costs only, and will not help you determine the relative total costs of owning different funds. If transaction costs were included in these calculations, your costs would be higher.
March 1, 2015 – August 31, 2015
| | | Account Value at the Beginning
of the Period ($) | | Account Value at the End of the
Period ($) | | Expenses Paid During the
Period ($) | | Fund's Annualized
Expense Ratio (%) | |
| | | Actual | | Hypothetical | | Actual | | Hypothetical | | Actual | | Hypothetical | | Actual | |
Class A | | | 1,000.00 | | | | 1,000.00 | | | | 908.00 | | | | 1,018.75 | | | | 6.29 | | | | 6.65 | | | | 1.30 | | |
Class B | | | 1,000.00 | | | | 1,000.00 | | | | 904.30 | | | | 1,014.95 | | | | 9.89 | | | | 10.47 | | | | 2.05 | | |
Class C | | | 1,000.00 | | | | 1,000.00 | | | | 904.30 | | | | 1,014.95 | | | | 9.89 | | | | 10.47 | | | | 2.05 | | |
Class I | | | 1,000.00 | | | | 1,000.00 | | | | 910.40 | | | | 1,021.19 | | | | 3.97 | | | | 4.20 | | | | 0.82 | | |
Class R | | | 1,000.00 | | | | 1,000.00 | | | | 906.70 | | | | 1,017.49 | | | | 7.49 | | | | 7.92 | | | | 1.55 | | |
Class R4 | | | 1,000.00 | | | | 1,000.00 | | | | 909.30 | | | | 1,020.02 | | | | 5.08 | | | | 5.38 | | | | 1.05 | | |
Class R5 | | | 1,000.00 | | | | 1,000.00 | | | | 910.10 | | | | 1,020.93 | | | | 4.21 | | | | 4.46 | | | | 0.87 | | |
Class W | | | 1,000.00 | | | | 1,000.00 | | | | 908.20 | | | | 1,018.75 | | | | 6.29 | | | | 6.65 | | | | 1.30 | | |
Class Y | | | 1,000.00 | | | | 1,000.00 | | | | 910.10 | | | | 1,021.19 | | | | 3.97 | | | | 4.20 | | | | 0.82 | | |
Class Z | | | 1,000.00 | | | | 1,000.00 | | | | 908.90 | | | | 1,020.02 | | | | 5.08 | | | | 5.38 | | | | 1.05 | | |
Expenses paid during the period are equal to the annualized expense ratio for each class as indicated above, multiplied by the average account value over the period and then multiplied by the number of days in the Fund's most recent fiscal half year and divided by 365.
Expenses do not include fees and expenses incurred indirectly by the Fund from its investment in underlying funds, including affiliated and non-affiliated pooled investment vehicles, such as mutual funds and exchange-traded funds.
Had Columbia Management Investment Advisers, LLC and/or certain of its affiliates not waived/reimbursed certain fees and expenses, account value at the end of the period would have been reduced.
Annual Report 2015
8
COLUMBIA GLOBAL DIVIDEND OPPORTUNITY FUND
PORTFOLIO OF INVESTMENTS
August 31, 2015
(Percentages represent value of investments compared to net assets)
Common Stocks 96.7%
Issuer | | Shares | | Value ($) | |
AUSTRALIA 2.2% | |
AMP Ltd. | | | 898,359 | | | | 3,800,020 | | |
BHP Billiton Ltd. | | | 328,011 | | | | 6,008,405 | | |
Wesfarmers Ltd. | | | 148,267 | | | | 4,287,510 | | |
Woodside Petroleum Ltd. | | | 69,770 | | | | 1,605,810 | | |
Total | | | | | 15,701,745 | | |
CANADA 5.8% | |
Bank of Montreal | | | 102,530 | | | | 5,529,443 | | |
Bank of Nova Scotia (The) | | | 79,582 | | | | 3,642,770 | | |
BCE, Inc. | | | 94,072 | | | | 3,804,272 | | |
Canadian Imperial Bank of Commerce | | | 27,225 | | | | 2,000,901 | | |
Enbridge, Inc. | | | 44,231 | | | | 1,827,941 | | |
Royal Bank of Canada | | | 102,430 | | | | 5,710,106 | | |
Suncor Energy, Inc. | | | 372,962 | | | | 10,532,447 | | |
TELUS Corp. | | | 154,303 | | | | 5,048,040 | | |
Toronto-Dominion Bank (The) | | | 85,629 | | | | 3,415,787 | | |
Total | | | | | 41,511,707 | | |
CHINA 1.9% | |
Bank of China Ltd., Class H | | | 4,681,000 | | | | 2,132,040 | | |
China Construction Bank Corp., Class H | | | 6,816,000 | | | | 4,782,733 | | |
CNOOC Ltd. | | | 2,889,000 | | | | 3,621,263 | | |
Industrial & Commercial Bank of
China Ltd., Class H | | | 5,245,000 | | | | 3,070,875 | | |
Total | | | | | 13,606,911 | | |
DENMARK 0.3% | |
TDC A/S | | | 287,662 | | | | 1,820,336 | | |
FRANCE 6.5% | |
AXA SA | | | 476,033 | | | | 12,005,711 | | |
Cie Generale des Etablissements
Michelin | | | 37,272 | | | | 3,609,062 | | |
Engie | | | 164,353 | | | | 2,948,095 | | |
Orange SA | | | 224,806 | | | | 3,554,430 | | |
Sanofi | | | 52,924 | | | | 5,236,301 | | |
Schneider Electric SE | | | 31,787 | | | | 2,009,280 | | |
Suez Environnement Co. | | | 138,432 | | | | 2,498,669 | | |
Total SA | | | 253,596 | | | | 11,611,997 | | |
VINCI SA | | | 45,130 | | | | 2,907,395 | | |
Total | | | | | 46,380,940 | | |
Common Stocks (continued)
Issuer | | Shares | | Value ($) | |
GERMANY 4.7% | |
Allianz SE, Registered Shares | | | 59,413 | | | | 9,483,855 | | |
BASF SE | | | 73,764 | | | | 5,944,851 | | |
Deutsche Bank AG, Registered Shares | | | 197,626 | | | | 5,826,905 | | |
Deutsche Post AG | | | 89,751 | | | | 2,473,036 | | |
E.ON SE | | | 136,171 | | | | 1,544,088 | | |
Siemens AG, Registered Shares | | | 43,160 | | | | 4,284,296 | | |
Wincor Nixdorf AG | | | 87,129 | | | | 3,715,331 | | |
Total | | | | | 33,272,362 | | |
ISRAEL 0.3% | |
Bezeq Israeli Telecommunication Corp.
Ltd. (The), ADR | | | 206,175 | | | | 1,855,575 | | |
ITALY 1.6% | |
ENI SpA | | | 445,221 | | | | 7,309,221 | | |
Snam SpA | | | 429,552 | | | | 2,102,580 | | |
Terna Rete Elettrica Nazionale SpA | | | 462,001 | | | | 2,154,615 | | |
Total | | | | | 11,566,416 | | |
JAPAN 4.0% | |
Canon, Inc. | | | 113,700 | | | | 3,464,107 | | |
Japan Tobacco, Inc. | | | 142,000 | | | | 5,046,595 | | |
Mitsubishi UFJ Financial Group, Inc. | | | 268,100 | | | | 1,768,436 | | |
Mitsui & Co., Ltd. | | | 186,400 | | | | 2,423,898 | | |
Mizuho Financial Group, Inc. | | | 2,977,900 | | | | 6,098,647 | | |
NTT DoCoMo, Inc. | | | 243,800 | | | | 5,113,403 | | |
Sumitomo Mitsui Financial Group, Inc. | | | 121,100 | | | | 4,942,874 | | |
Total | | | | | 28,857,960 | | |
MALAYSIA 0.1% | |
Malayan Banking Bhd | | | 413,400 | | | | 862,514 | | |
MEXICO 0.3% | |
America Movil SAB de CV, Series L | | | 2,646,000 | | | | 2,421,471 | | |
NETHERLANDS 1.5% | |
LyondellBasell Industries NV, Class A | | | 55,604 | | | | 4,747,470 | | |
Unilever NV-CVA | | | 156,912 | | | | 6,292,179 | | |
Total | | | | | 11,039,649 | | |
NORWAY 1.2% | |
Statoil ASA | | | 347,698 | | | | 5,207,715 | | |
Telenor ASA | | | 173,830 | | | | 3,469,330 | | |
Total | | | | | 8,677,045 | | |
The accompanying Notes to Financial Statements are an integral part of this statement.
Annual Report 2015
9
COLUMBIA GLOBAL DIVIDEND OPPORTUNITY FUND
PORTFOLIO OF INVESTMENTS (continued)
August 31, 2015
Common Stocks (continued)
Issuer | | Shares | | Value ($) | |
POLAND 0.8% | |
Powszechny Zaklad Ubezpieczen SA | | | 52,285 | | | | 5,965,221 | | |
SOUTH KOREA 0.5% | |
SK Telecom Co., Ltd. | | | 15,886 | | | | 3,272,067 | | |
SPAIN 2.0% | |
Banco Santander SA | | | 534,155 | | | | 3,272,737 | | |
Ferrovial SA | | | 284,179 | | | | 6,798,769 | | |
Red Electrica Corp. SA | | | 54,184 | | | | 4,331,578 | | |
Total | | | | | 14,403,084 | | |
SWEDEN 0.8% | |
Atlas Copco AB, Class B | | | 62,491 | | | | 1,426,088 | | |
Skanska AB, Class B | | | 149,539 | | | | 2,932,138 | | |
Telefonaktiebolaget LM Ericsson, Class B | | | 170,615 | | | | 1,663,627 | | |
Total | | | | | 6,021,853 | | |
SWITZERLAND 8.4% | |
ACE Ltd. | | | 52,984 | | | | 5,412,846 | | |
Nestlé SA, Registered Shares | | | 185,281 | | | | 13,666,307 | | |
Novartis AG, ADR | | | 139,983 | | | | 13,609,147 | | |
Roche Holding AG, Genusschein Shares | | | 69,454 | | | | 18,968,454 | | |
Swiss Re AG | | | 100,085 | | | | 8,598,830 | | |
Total | | | | | 60,255,584 | | |
UNITED KINGDOM 12.9% | |
Amec Foster Wheeler PLC | | | 348,189 | | | | 4,274,432 | | |
AstraZeneca PLC | | | 103,549 | | | | 6,460,332 | | |
BAE Systems PLC | | | 721,798 | | | | 4,968,399 | | |
BAE Systems PLC, ADR | | | 66,814 | | | | 1,841,394 | | |
| BP PLC | | | 725,690 | | | | 4,022,329 | | |
British American Tobacco PLC | | | 187,030 | | | | 9,903,698 | | |
GlaxoSmithKline PLC | | | 259,735 | | | | 5,303,169 | | |
HSBC Holdings PLC | | | 925,794 | | | | 7,317,172 | | |
HSBC Holdings PLC, ADR | | | 269,902 | | | | 10,707,012 | | |
Marks & Spencer Group PLC | | | 444,199 | | | | 3,526,906 | | |
Rio Tinto PLC | | | 271,919 | | | | 9,927,939 | | |
Royal Dutch Shell PLC, Class A | | | 663,133 | | | | 17,276,129 | | |
Vodafone Group PLC | | | 2,092,290 | | | | 7,204,678 | | |
Total | | | | | 92,733,589 | | |
UNITED STATES 40.9% | |
AbbVie, Inc. | | | 139,749 | | | | 8,721,735 | | |
Common Stocks (continued)
Issuer | | Shares | | Value ($) | |
Altria Group, Inc. | | | 159,464 | | | | 8,544,081 | | |
Anadarko Petroleum Corp. | | | 46,224 | | | | 3,308,714 | | |
AT&T, Inc. | | | 728,431 | | | | 24,183,909 | | |
Bank of New York Mellon Corp. (The) | | | 72,316 | | | | 2,878,177 | | |
Bristol-Myers Squibb Co. | | | 47,922 | | | | 2,849,921 | | |
CenturyLink, Inc. | | | 64,507 | | | | 1,744,269 | | |
Cisco Systems, Inc. | | | 440,664 | | | | 11,404,384 | | |
CMS Energy Corp. | | | 97,233 | | | | 3,187,298 | | |
ConocoPhillips | | | 203,482 | | | | 10,001,140 | | |
Dow Chemical Co. (The) | | | 221,196 | | | | 9,679,537 | | |
DTE Energy Co. | | | 58,282 | | | | 4,549,493 | | |
Duke Energy Corp. | | | 88,113 | | | | 6,248,093 | | |
Exelon Corp. | | | 117,807 | | | | 3,623,743 | | |
Exxon Mobil Corp. | | | 436,624 | | | | 32,851,590 | | |
General Mills, Inc. | | | 47,098 | | | | 2,673,282 | | |
General Motors Co. | | | 98,695 | | | | 2,905,581 | | |
Intel Corp. | | | 269,883 | | | | 7,702,461 | | |
International Paper Co. | | | 80,217 | | | | 3,460,561 | | |
Johnson & Johnson | | | 154,558 | | | | 14,525,361 | | |
Kinder Morgan, Inc. | | | 131,401 | | | | 4,258,706 | | |
Lockheed Martin Corp. | | | 39,500 | | | | 7,946,610 | | |
Mattel, Inc. | | | 30,644 | | | | 717,989 | | |
McDonald's Corp. | | | 139,747 | | | | 13,278,760 | | |
Merck & Co., Inc. | | | 246,014 | | | | 13,247,854 | | |
NextEra Energy, Inc. | | | 21,245 | | | | 2,090,720 | | |
Nucor Corp. | | | 67,693 | | | | 2,930,430 | | |
Occidental Petroleum Corp. | | | 188,675 | | | | 13,775,162 | | |
Pfizer, Inc. | | | 536,376 | | | | 17,282,035 | | |
PG&E Corp. | | | 37,284 | | | | 1,848,541 | | |
Philip Morris International, Inc. | | | 207,429 | | | | 16,552,834 | | |
Phillips 66 | | | 38,038 | | | | 3,007,665 | | |
Procter & Gamble Co. (The) | | | 207,616 | | | | 14,672,223 | | |
RR Donnelley & Sons Co. | | | 119,058 | | | | 1,869,211 | | |
Seagate Technology PLC | | | 100,177 | | | | 5,149,098 | | |
Sempra Energy | | | 40,157 | | | | 3,808,891 | | |
Wal-Mart Stores, Inc. | | | 37,037 | | | | 2,397,405 | | |
Xcel Energy, Inc. | | | 90,537 | | | | 3,053,813 | | |
Total | | | | | 292,931,277 | | |
Total Common Stocks
(Cost: $709,717,655) | | | | | 693,157,306 | | |
The accompanying Notes to Financial Statements are an integral part of this statement.
Annual Report 2015
10
COLUMBIA GLOBAL DIVIDEND OPPORTUNITY FUND
PORTFOLIO OF INVESTMENTS (continued)
August 31, 2015
Money Market Funds 2.6%
| | | Shares | | Value ($) | |
Columbia Short-Term Cash Fund,
0.150%(a)(b) | | | 18,360,107 | | | | 18,360,107 | | |
Total Money Market Funds
(Cost: $18,360,107) | | | | | 18,360,107 | | |
Total Investments
(Cost: $728,077,762) | | | | | 711,517,413 | | |
Other Assets & Liabilities, Net | | | | | 4,910,317 | | |
Net Assets | | | | | 716,427,730 | | |
Notes to Portfolio of Investments
(a) The rate shown is the seven-day current annualized yield at August 31, 2015.
(b) As defined in the Investment Company Act of 1940, an affiliated company is one in which the Fund owns 5% or more of the company's outstanding voting securities, or a company which is under common ownership or control with the Fund. Holdings and transactions in these affiliated companies during the year ended August 31, 2015 are as follows:
Issuer | | Beginning
Cost ($) | | Purchase
Cost ($) | | Proceeds
From Sales ($) | | Ending
Cost ($) | | Dividends —
Affiliated
Issuers ($) | | Value ($) | |
Columbia Short-Term Cash Fund | | | 9,509,763 | | | | 338,620,732 | | | | (329,770,388 | ) | | | 18,360,107 | | | | 21,259 | | | | 18,360,107 | | |
Abbreviation Legend
ADR American Depositary Receipt
Fair Value Measurements
The Fund categorizes its fair value measurements according to a three-level hierarchy that maximizes the use of observable inputs and minimizes the use of unobservable inputs by prioritizing that the most observable input be used when available. Observable inputs are those that market participants would use in pricing an investment based on market data obtained from sources independent of the reporting entity. Unobservable inputs are those that reflect the Fund's assumptions about the information market participants would use in pricing an investment. An investment's level within the fair value hierarchy is based on the lowest level of any input that is deemed significant to the asset's or liability's fair value measurement. The input levels are not necessarily an indication of the risk or liquidity associated with investments at that level. For example, certain U.S. government securities are generally high quality and liquid, however, they are reflected as Level 2 because the inputs used to determine fair value may not always be quoted prices in an active market.
Fair value inputs are summarized in the three broad levels listed below:
> Level 1 — Valuations based on quoted prices for investments in active markets that the Fund has the ability to access at the measurement date (including NAV for open-end mutual funds). Valuation adjustments are not applied to Level 1 investments.
> Level 2 — Valuations based on other significant observable inputs (including quoted prices for similar securities, interest rates, prepayment speeds, credit risks, etc.).
> Level 3 — Valuations based on significant unobservable inputs (including the Fund's own assumptions and judgment in determining the fair value of investments).
Inputs that are used in determining fair value of an investment may include price information, credit data, volatility statistics, and other factors. These inputs can be either observable or unobservable. The availability of observable inputs can vary between investments, and is affected by various factors such as the type of investment, and the volume and level of activity for that investment or similar investments in the marketplace. The inputs will be considered by the Investment Manager, along with any other relevant factors in the calculation of an investment's fair value. The Fund uses prices and inputs that are current as of the measurement date, which may include periods of market dislocations. During these periods, the availability of prices and inputs may be reduced for many investments. This condition could cause an investment to be reclassified between the various levels within the hierarchy.
The accompanying Notes to Financial Statements are an integral part of this statement.
Annual Report 2015
11
COLUMBIA GLOBAL DIVIDEND OPPORTUNITY FUND
PORTFOLIO OF INVESTMENTS (continued)
August 31, 2015
Fair Value Measurements (continued)
Foreign equity securities actively traded in markets where there is a significant delay in the local close relative to the New York Stock Exchange (NYSE) are classified as Level 2. The values of these securities may include an adjustment to reflect the impact of significant market movements following the close of local trading, as described in Note 2 to the financial statements — Security Valuation.
Investments falling into the Level 3 category are primarily supported by quoted prices from brokers and dealers participating in the market for those investments. However, these may be classified as Level 3 investments due to lack of market transparency and corroboration to support these quoted prices. Additionally, valuation models may be used as the pricing source for any remaining investments classified as Level 3. These models may rely on one or more significant unobservable inputs and/or significant assumptions by the Investment Manager. Inputs used in valuations may include, but are not limited to, financial statement analysis, capital account balances, discount rates and estimated cash flows, and comparable company data.
Under the direction of the Fund's Board of Trustees (the Board), the Investment Manager's Valuation Committee (the Committee) is responsible for overseeing the valuation procedures approved by the Board. The Committee consists of voting and non-voting members from various groups within the Investment Manager's organization, including operations and accounting, trading and investments, compliance, risk management and legal.
The Committee meets at least monthly to review and approve valuation matters, which may include a description of specific valuation determinations, data regarding pricing information received from approved pricing vendors and brokers and the results of Board-approved valuation control policies and procedures (the Policies). The Policies address, among other things, instances when market quotations are or are not readily available, including recommendations of third party pricing vendors and a determination of appropriate pricing methodologies; events that require specific valuation determinations and assessment of fair value techniques; securities with a potential for stale pricing, including those that are illiquid, restricted, or in default; and the effectiveness of third party pricing vendors, including periodic reviews of vendors. The Committee meets more frequently, as needed, to discuss additional valuation matters, which may include the need to review back-testing results, review time-sensitive information or approve related valuation actions. The Committee reports to the Board, with members of the Committee meeting with the Board at each of its regularly scheduled meetings to discuss valuation matters and actions during the period, similar to those described earlier.
For investments categorized as Level 3, the Committee monitors information similar to that described above, which may include: (i) data specific to the issuer or comparable issuers, (ii) general market or specific sector news and (iii) quoted prices and specific or similar security transactions. The Committee considers this data and any changes from prior periods in order to assess the reasonableness of observable and unobservable inputs, any assumptions or internal models used to value those securities and changes in fair value. This data is also used to corroborate, when available, information received from approved pricing vendors and brokers. Various factors impact the frequency of monitoring this information (which may occur as often as daily). However, the Committee may determine that changes to inputs, assumptions and models are not required as a result of the monitoring procedures performed.
The accompanying Notes to Financial Statements are an integral part of this statement.
Annual Report 2015
12
COLUMBIA GLOBAL DIVIDEND OPPORTUNITY FUND
PORTFOLIO OF INVESTMENTS (continued)
August 31, 2015
Fair Value Measurements (continued)
The following table is a summary of the inputs used to value the Fund's investments at August 31, 2015:
| | | Level 1
Quoted Prices in Active
Markets for Identical
Assets ($) | | Level 2
Other Significant
Observable Inputs ($) | | Level 3
Significant
Unobservable Inputs ($) | | Total ($) | |
Investments | |
Common Stocks | |
Australia | | | — | | | | 15,701,745 | | | | — | | | | 15,701,745 | | |
Canada | | | 41,511,707 | | | | — | | | | — | | | | 41,511,707 | | |
China | | | — | | | | 13,606,911 | | | | — | | | | 13,606,911 | | |
Denmark | | | — | | | | 1,820,336 | | | | — | | | | 1,820,336 | | |
France | | | — | | | | 46,380,940 | | | | — | | | | 46,380,940 | | |
Germany | | | — | | | | 33,272,362 | | | | — | | | | 33,272,362 | | |
Israel | | | 1,855,575 | | | | — | | | | — | | | | 1,855,575 | | |
Italy | | | — | | | | 11,566,416 | | | | — | | | | 11,566,416 | | |
Japan | | | — | | | | 28,857,960 | | | | — | | | | 28,857,960 | | |
Malaysia | | | — | | | | 862,514 | | | | — | | | | 862,514 | | |
Mexico | | | 2,421,471 | | | | — | | | | — | | | | 2,421,471 | | |
Netherlands | | | 4,747,470 | | | | 6,292,179 | | | | — | | | | 11,039,649 | | |
Norway | | | — | | | | 8,677,045 | | | | — | | | | 8,677,045 | | |
Poland | | | — | | | | 5,965,221 | | | | — | | | | 5,965,221 | | |
South Korea | | | — | | | | 3,272,067 | | | | — | | | | 3,272,067 | | |
Spain | | | — | | | | 14,403,084 | | | | — | | | | 14,403,084 | | |
Sweden | | | — | | | | 6,021,853 | | | | — | | | | 6,021,853 | | |
Switzerland | | | 19,021,993 | | | | 41,233,591 | | | | — | | | | 60,255,584 | | |
United Kingdom | | | 12,548,406 | | | | 80,185,183 | | | | — | | | | 92,733,589 | | |
United States | | | 292,931,277 | | | | — | | | | — | | | | 292,931,277 | | |
Total Common Stocks | | | 375,037,899 | | | | 318,119,407 | | | | — | | | | 693,157,306 | | |
Money Market Funds | | | — | | | | 18,360,107 | | | | — | | | | 18,360,107 | | |
Total Investments | | | 375,037,899 | | | | 336,479,514 | | | | — | | | | 711,517,413 | | |
The Fund's assets assigned to the Level 2 input category are generally valued using the market approach, in which a security's value is determined through reference to prices and information from market transactions for similar or identical assets. These assets include certain foreign securities for which a third party statistical pricing service may be employed for purposes of fair market valuation. The model utilized by such third party statistical pricing service takes into account a security's correlation to available market data including, but not limited to, intraday index, ADR, and exchange-traded fund movements.
Financial assets were transferred from Level 1 to Level 2 as the market for these assets is not considered publicly available. Fund per share market values were obtained using observable market inputs.
The following table shows transfers between Level 1 and Level 2 of the fair value hierarchy:
Transfers In | | Transfers Out | |
| Level 1 ($) | | Level 2 ($) | | Level 1 ($) | | Level 2 ($) | |
| | — | | | | 9,509,763 | | | | 9,509,763 | | | | — | | |
Transfers between Level 1 and Level 2 are determined based on the fair value at the beginning of the period for security positions held throughout the period.
There were no transfers of financial assets between Levels 2 and 3 during the period.
The accompanying Notes to Financial Statements are an integral part of this statement.
Annual Report 2015
13
COLUMBIA GLOBAL DIVIDEND OPPORTUNITY FUND
STATEMENT OF ASSETS AND LIABILITIES
August 31, 2015
Assets | |
Investments, at value | |
Unaffiliated issuers (identified cost $709,717,655) | | $ | 693,157,306 | | |
Affiliated issuers (identified cost $18,360,107) | | | 18,360,107 | | |
Total investments (identified cost $728,077,762) | | | 711,517,413 | | |
Receivable for: | |
Investments sold | | | 2,855,508 | | |
Capital shares sold | | | 201,716 | | |
Dividends | | | 2,758,713 | | |
Foreign tax reclaims | | | 1,113,502 | | |
Expense reimbursement due from Investment Manager | | | 6,162 | | |
Prepaid expenses | | | 7,564 | | |
Trustees' deferred compensation plan | | | 139,156 | | |
Total assets | | | 718,599,734 | | |
Liabilities | |
Payable for: | |
Investments purchased | | | 1,440,129 | | |
Capital shares purchased | | | 375,071 | | |
Investment management fees | | | 41,190 | | |
Distribution and/or service fees | | | 3,572 | | |
Transfer agent fees | | | 62,564 | | |
Administration fees | | | 3,459 | | |
Compensation of board members | | | 692 | | |
Chief compliance officer expenses | | | 66 | | |
Other expenses | | | 106,105 | | |
Trustees' deferred compensation plan | | | 139,156 | | |
Total liabilities | | | 2,172,004 | | |
Net assets applicable to outstanding capital stock | | $ | 716,427,730 | | |
Represented by | |
Paid-in capital | | $ | 740,319,079 | | |
Undistributed net investment income | | | 3,421,335 | | |
Accumulated net realized loss | | | (10,677,923 | ) | |
Unrealized appreciation (depreciation) on: | |
Investments | | | (16,560,349 | ) | |
Foreign currency translations | | | (74,412 | ) | |
Total — representing net assets applicable to outstanding capital stock | | $ | 716,427,730 | | |
The accompanying Notes to Financial Statements are an integral part of this statement.
Annual Report 2015
14
COLUMBIA GLOBAL DIVIDEND OPPORTUNITY FUND
STATEMENT OF ASSETS AND LIABILITIES (continued)
August 31, 2015
Class A | |
Net assets | | $ | 118,275,421 | | |
Shares outstanding | | | 7,143,370 | | |
Net asset value per share | | $ | 16.56 | | |
Maximum offering price per share(a) | | $ | 17.57 | | |
Class B | |
Net assets | | $ | 900,321 | | |
Shares outstanding | | | 57,896 | | |
Net asset value per share | | $ | 15.55 | | |
Class C | |
Net assets | | $ | 12,440,122 | | |
Shares outstanding | | | 799,315 | | |
Net asset value per share | | $ | 15.56 | | |
Class I | |
Net assets | | $ | 124,389,950 | | |
Shares outstanding | | | 7,503,350 | | |
Net asset value per share | | $ | 16.58 | | |
Class R | |
Net assets | | $ | 671,254 | | |
Shares outstanding | | | 40,597 | | |
Net asset value per share | | $ | 16.53 | | |
Class R4 | |
Net assets | | $ | 781,609 | | |
Shares outstanding | | | 46,844 | | |
Net asset value per share | | $ | 16.69 | | |
Class R5 | |
Net assets | | $ | 178,069 | | |
Shares outstanding | | | 10,742 | | |
Net asset value per share | | $ | 16.58 | | |
Class W | |
Net assets | | $ | 1,968 | | |
Shares outstanding | | | 119 | | |
Net asset value per share(b) | | $ | 16.56 | | |
Class Y | |
Net assets | | $ | 1,148,661 | | |
Shares outstanding | | | 69,181 | | |
Net asset value per share | | $ | 16.60 | | |
Class Z | |
Net assets | | $ | 457,640,355 | | |
Shares outstanding | | | 27,550,481 | | |
Net asset value per share | | $ | 16.61 | | |
(a) The maximum offering price per share is calculated by dividing the net asset value per share by 1.0 minus the maximum sales charge of 5.75%.
(b) Net asset value per share rounds to this amount due to fractional shares outstanding.
The accompanying Notes to Financial Statements are an integral part of this statement.
Annual Report 2015
15
COLUMBIA GLOBAL DIVIDEND OPPORTUNITY FUND
STATEMENT OF OPERATIONS
Year Ended August 31, 2015
Net investment income | |
Income: | | | |
Dividends — unaffiliated issuers | | $ | 39,827,004 | | |
Dividends — affiliated issuers | | | 21,259 | | |
Interest | | | 133,263 | | |
Foreign taxes withheld | | | (3,117,362 | ) | |
Total income | | | 36,864,164 | | |
Expenses: | | | |
Investment management fees | | | 5,854,673 | | |
Distribution and/or service fees | |
Class A | | | 346,044 | | |
Class B | | | 15,037 | | |
Class C | | | 146,654 | | |
Class R | | | 4,155 | | |
Class W | | | 6 | | |
Transfer agent fees | | | |
Class A | | | 438,977 | | |
Class B | | | 4,674 | | |
Class C | | | 46,520 | | |
Class R | | | 2,580 | | |
Class R4 | | | 1,674 | | |
Class R5 | | | 56 | | |
Class W | | | 5 | | |
Class Z | | | 1,708,329 | | |
Administration fees | | | 490,647 | | |
Compensation of board members | | | 33,604 | | |
Custodian fees | | | 62,488 | | |
Printing and postage fees | | | 153,362 | | |
Registration fees | | | 143,127 | | |
Professional fees | | | 97,814 | | |
Chief compliance officer expenses | | | 419 | | |
Other | | | 70,792 | | |
Total expenses | | | 9,621,637 | | |
Fees waived or expenses reimbursed by Investment Manager and its affiliates | | | (446,626 | ) | |
Expense reductions | | | (93,167 | ) | |
Total net expenses | | | 9,081,844 | | |
Net investment income | | | 27,782,320 | | |
Realized and unrealized gain (loss) — net | |
Net realized gain (loss) on: | |
Investments | | | 2,705,305 | | |
Foreign currency translations | | | (803,510 | ) | |
Net realized gain | | | 1,901,795 | | |
Net change in unrealized appreciation (depreciation) on: | |
Investments | | | (126,450,702 | ) | |
Foreign currency translations | | | (69,905 | ) | |
Net change in unrealized depreciation | | | (126,520,607 | ) | |
Net realized and unrealized loss | | | (124,618,812 | ) | |
Net decrease in net assets from operations | | $ | (96,836,492 | ) | |
The accompanying Notes to Financial Statements are an integral part of this statement.
Annual Report 2015
16
COLUMBIA GLOBAL DIVIDEND OPPORTUNITY FUND
STATEMENT OF CHANGES IN NET ASSETS
| | | Year Ended
August 31,
2015 | | Year Ended
August 31,
2014(a) | |
Operations | |
Net investment income | | $ | 27,782,320 | | | $ | 28,755,470 | | |
Net realized gain | | | 1,901,795 | | | | 95,690,871 | | |
Net change in unrealized appreciation (depreciation) | | | (126,520,607 | ) | | | 15,968,681 | | |
Net increase (decrease) in net assets resulting from operations | | | (96,836,492 | ) | | | 140,415,022 | | |
Distributions to shareholders | |
Net investment income | |
Class A | | | (4,970,271 | ) | | | (3,881,727 | ) | |
Class B | | | (46,350 | ) | | | (58,995 | ) | |
Class C | | | (439,323 | ) | | | (292,070 | ) | |
Class I | | | (6,139,751 | ) | | | (4,449,146 | ) | |
Class R | | | (28,417 | ) | | | (32,859 | ) | |
Class R4 | | | (15,946 | ) | | | (1,933 | ) | |
Class R5 | | | (2,668 | ) | | | (38 | ) | |
Class W | | | (84 | ) | | | (77 | ) | |
Class Y | | | (11,182 | ) | | | (81 | ) | |
Class Z | | | (20,648,708 | ) | | | (16,698,727 | ) | |
Net realized gains | |
Class A | | | (14,020,410 | ) | | | (5,768,263 | ) | |
Class B | | | (177,028 | ) | | | (129,247 | ) | |
Class C | | | (1,575,567 | ) | | | (601,021 | ) | |
Class I | | | (16,210,226 | ) | | | (5,040,084 | ) | |
Class R | | | (75,626 | ) | | | (56,504 | ) | |
Class R4 | | | (7,552 | ) | | | (1,203 | ) | |
Class R5 | | | (3,124 | ) | | | — | | |
Class W | | | (240 | ) | | | (121 | ) | |
Class Y | | | (246 | ) | | | (103 | ) | |
Class Z | | | (54,231,843 | ) | | | (22,702,256 | ) | |
Total distributions to shareholders | | | (118,604,562 | ) | | | (59,714,455 | ) | |
Increase (decrease) in net assets from capital stock activity | | | (1,875,084 | ) | | | 3,165,764 | | |
Total increase (decrease) in net assets | | | (217,316,138 | ) | | | 83,866,331 | | |
Net assets at beginning of year | | | 933,743,868 | | | | 849,877,537 | | |
Net assets at end of year | | $ | 716,427,730 | | | $ | 933,743,868 | | |
Undistributed net investment income | | $ | 3,421,335 | | | $ | 8,745,225 | | |
(a) Class R5 shares are based on operations from January 8, 2014 (commencement of operations) through the stated period end.
The accompanying Notes to Financial Statements are an integral part of this statement.
Annual Report 2015
17
COLUMBIA GLOBAL DIVIDEND OPPORTUNITY FUND
STATEMENT OF CHANGES IN NET ASSETS (continued)
| | | Year Ended August 31, 2015 | | Year Ended August 31, 2014(a) | |
| | | Shares | | Dollars ($) | | Shares | | Dollars ($) | |
Capital stock activity | |
Class A shares | |
Subscriptions(b) | | | 464,348 | | | | 8,635,490 | | | | 608,135 | | | | 12,768,180 | | |
Distributions reinvested | | | 968,224 | | | | 17,213,076 | | | | 431,039 | | | | 8,752,303 | | |
Redemptions | | | (1,347,088 | ) | | | (24,990,323 | ) | | | (1,074,701 | ) | | | (22,610,747 | ) | |
Net increase (decrease) | | | 85,484 | | | | 858,243 | | | | (35,527 | ) | | | (1,090,264 | ) | |
Class B shares | |
Subscriptions | | | 3,097 | | | | 54,554 | | | | 2,864 | | | | 56,430 | | |
Distributions reinvested | | | 11,316 | | | | 188,932 | | | | 8,122 | | | | 155,817 | | |
Redemptions(b) | | | (59,941 | ) | | | (1,058,850 | ) | | | (118,038 | ) | | | (2,342,692 | ) | |
Net decrease | | | (45,528 | ) | | | (815,364 | ) | | | (107,052 | ) | | | (2,130,445 | ) | |
Class C shares | |
Subscriptions | | | 140,737 | | | | 2,450,212 | | | | 226,012 | | | | 4,469,181 | | |
Distributions reinvested | | | 100,662 | | | | 1,681,724 | | | | 37,419 | | | | 719,828 | | |
Redemptions | | | (229,437 | ) | | | (4,000,425 | ) | | | (188,489 | ) | | | (3,726,886 | ) | |
Net increase | | | 11,962 | | | | 131,511 | | | | 74,942 | | | | 1,462,123 | | |
Class I shares | |
Subscriptions | | | 1,229,832 | | | | 22,339,321 | | | | 1,439,964 | | | | 28,612,532 | | |
Distributions reinvested | | | 1,255,258 | | | | 22,349,630 | | | | 465,524 | | | | 9,489,020 | | |
Redemptions | | | (2,760,638 | ) | | | (49,916,676 | ) | | | (565,297 | ) | | | (12,071,543 | ) | |
Net increase (decrease) | | | (275,548 | ) | | | (5,227,725 | ) | | | 1,340,191 | | | | 26,030,009 | | |
Class R shares | |
Subscriptions | | | 6,735 | | | | 124,365 | | | | 39,036 | | | | 839,922 | | |
Distributions reinvested | | | 5,833 | | | | 104,043 | | | | 4,404 | | | | 89,191 | | |
Redemptions | | | (31,234 | ) | | | (607,989 | ) | | | (49,592 | ) | | | (1,070,644 | ) | |
Net decrease | | | (18,666 | ) | | | (379,581 | ) | | | (6,152 | ) | | | (141,531 | ) | |
Class R4 shares | |
Subscriptions | | | 45,499 | | | | 845,204 | | | | 3,633 | | | | 76,084 | | |
Distributions reinvested | | | 1,276 | | | | 23,159 | | | | 142 | | | | 2,958 | | |
Redemptions | | | (5,098 | ) | | | (97,298 | ) | | | (69 | ) | | | (1,469 | ) | |
Net increase | | | 41,677 | | | | 771,065 | | | | 3,706 | | | | 77,573 | | |
Class R5 shares | |
Subscriptions | | | 19,789 | | | | 354,536 | | | | 1,534 | | | | 33,497 | | |
Distributions reinvested | | | 304 | | | | 5,451 | | | | — | | | | — | | |
Redemptions | | | (10,885 | ) | | | (198,661 | ) | | | — | | | | — | | |
Net increase | | | 9,208 | | | | 161,326 | | | | 1,534 | | | | 33,497 | | |
Class W shares | |
Redemptions | | | — | | | | — | | | | (28 | ) | | | (600 | ) | |
Net increase (decrease) | | | — | | | | — | | | | (28 | ) | | | (600 | ) | |
The accompanying Notes to Financial Statements are an integral part of this statement.
Annual Report 2015
18
COLUMBIA GLOBAL DIVIDEND OPPORTUNITY FUND
STATEMENT OF CHANGES IN NET ASSETS (continued)
| | | Year Ended August 31, 2015 | | Year Ended August 31, 2014(a) | |
| | | Shares | | Dollars ($) | | Shares | | Dollars ($) | |
Capital stock activity (continued) | |
Class Y shares | |
Subscriptions | | | 72,656 | | | | 1,299,683 | | | | — | | | | — | | |
Distributions reinvested | | | 608 | | | | 11,085 | | | | — | | | | — | | |
Redemptions | | | (4,204 | ) | | | (77,235 | ) | | | (5 | ) | | | (100 | ) | |
Net increase (decrease) | | | 69,060 | | | | 1,233,533 | | | | (5 | ) | | | (100 | ) | |
Class Z shares | |
Subscriptions | | | 595,168 | | | | 11,272,270 | | | | 769,194 | | | | 16,186,905 | | |
Distributions reinvested | | | 4,086,912 | | | | 72,932,488 | | | | 1,886,471 | | | | 38,421,766 | | |
Redemptions | | | (4,462,744 | ) | | | (82,812,850 | ) | | | (3,582,816 | ) | | | (75,683,169 | ) | |
Net increase (decrease) | | | 219,336 | | | | 1,391,908 | | | | (927,151 | ) | | | (21,074,498 | ) | |
Total net increase (decrease) | | | 96,985 | | | | (1,875,084 | ) | | | 344,458 | | | | 3,165,764 | | |
(a) Class R5 shares are based on operations from January 8, 2014 (commencement of operations) through the stated period end.
(b) Includes conversions of Class B shares to Class A shares, if any.
The accompanying Notes to Financial Statements are an integral part of this statement.
Annual Report 2015
19
COLUMBIA GLOBAL DIVIDEND OPPORTUNITY FUND
The following tables are intended to help you understand the Fund's financial performance. Certain information reflects financial results for a single share of a class held for the periods shown. Per share net investment income (loss) amounts are calculated based on average shares outstanding during the period. Total return assumes reinvestment of all dividends and distributions, if any. Total return does not reflect payment of sales charges, if any. Total return and portfolio turnover are not annualized for periods of less than one year. The portfolio turnover rate is calculated without regard to purchase and sales transactions of short-term instruments and certain derivatives, if any. If such transactions were included, the Fund's portfolio turnover rate may be higher.
| | | Year Ended August 31, | |
Class A | | 2015 | | 2014 | | 2013 | | 2012 | | 2011 | |
Per share data | |
Net asset value, beginning of period | | $ | 21.63 | | | $ | 19.85 | | | $ | 19.59 | | | $ | 17.72 | | | $ | 15.28 | | |
Income from investment operations: | |
Net investment income | | | 0.58 | | | | 0.61 | | | | 0.51 | | | | 0.27 | | | | 0.01 | | |
Net realized and unrealized gain (loss) | | | (2.93 | ) | | | 2.53 | | | | 1.74 | | | | 1.65 | | | | 2.43 | | |
Total from investment operations | | | (2.35 | ) | | | 3.14 | | | | 2.25 | | | | 1.92 | | | | 2.44 | | |
Less distributions to shareholders: | |
Net investment income | | | (0.70 | ) | | | (0.54 | ) | | | (0.68 | ) | | | (0.05 | ) | | | — | | |
Net realized gains | | | (2.02 | ) | | | (0.82 | ) | | | (1.31 | ) | | | — | | | | — | | |
Total distributions to shareholders | | | (2.72 | ) | | | (1.36 | ) | | | (1.99 | ) | | | (0.05 | ) | | | — | | |
Proceeds from regulatory settlements | | | — | | | | — | | | | — | | | | 0.00 | (a) | | | — | | |
Net asset value, end of period | | $ | 16.56 | | | $ | 21.63 | | | $ | 19.85 | | | $ | 19.59 | | | $ | 17.72 | | |
Total return | | | (11.49 | %) | | | 16.40 | % | | | 12.48 | % | | | 10.88 | % | | | 15.97 | % | |
Ratios to average net assets(b) | |
Total gross expenses | | | 1.38 | % | | | 1.27 | % | | | 1.34 | % | | | 1.28 | % | | | 1.29 | % | |
Total net expenses(c) | | | 1.31 | %(d) | | | 1.25 | %(d) | | | 1.26 | %(d) | | | 1.21 | %(d) | | | 1.25 | %(e) | |
Net investment income | | | 3.05 | % | | | 2.92 | % | | | 2.59 | % | | | 1.49 | % | | | 0.07 | % | |
Supplemental data | |
Net assets, end of period (in thousands) | | $ | 118,275 | | | $ | 152,674 | | | $ | 140,796 | | | $ | 133,541 | | | $ | 142,349 | | |
Portfolio turnover | | | 63 | % | | | 75 | % | | | 60 | % | | | 97 | % | | | 62 | % | |
Notes to Financial Highlights
(a) Rounds to zero.
(b) In addition to the fees and expenses that the Fund bears directly, the Fund indirectly bears a pro rata share of the fees and expenses of any other funds in which it invests. Such indirect expenses are not included in the Fund's reported expense ratios.
(c) Total net expenses include the impact of certain fee waivers/expense reimbursements made by the Investment Manager and certain of its affiliates, if applicable.
(d) The benefits derived from expense reductions had an impact of 0.01%, 0.02%, 0.03% and 0.07% for the years ended 2015, 2014, 2013 and 2012, respectively.
(e) The benefits derived from expense reductions had an impact of less than 0.01%.
The accompanying Notes to Financial Statements are an integral part of this statement.
Annual Report 2015
20
COLUMBIA GLOBAL DIVIDEND OPPORTUNITY FUND
FINANCIAL HIGHLIGHTS (continued)
| | | Year Ended August 31, | |
Class B | | 2015 | | 2014 | | 2013 | | 2012 | | 2011 | |
Per share data | |
Net asset value, beginning of period | | $ | 20.48 | | | $ | 18.85 | | | $ | 18.63 | | | $ | 16.93 | | | $ | 14.71 | | |
Income from investment operations: | |
Net investment income (loss) | | | 0.41 | | | | 0.40 | | | | 0.34 | | | | 0.10 | | | | (0.12 | ) | |
Net realized and unrealized gain (loss) | | | (2.77 | ) | | | 2.44 | | | | 1.66 | | | | 1.60 | | | | 2.34 | | |
Total from investment operations | | | (2.36 | ) | | | 2.84 | | | | 2.00 | | | | 1.70 | | | | 2.22 | | |
Less distributions to shareholders: | |
Net investment income | | | (0.55 | ) | | | (0.39 | ) | | | (0.47 | ) | | | — | | | | — | | |
Net realized gains | | | (2.02 | ) | | | (0.82 | ) | | | (1.31 | ) | | | — | | | | — | | |
Total distributions to shareholders | | | (2.57 | ) | | | (1.21 | ) | | | (1.78 | ) | | | — | | | | — | | |
Proceeds from regulatory settlements | | | — | | | | — | | | | — | | | | 0.00 | (a) | | | — | | |
Net asset value, end of period | | $ | 15.55 | | | $ | 20.48 | | | $ | 18.85 | | | $ | 18.63 | | | $ | 16.93 | | |
Total return | | | (12.18 | %) | | | 15.56 | % | | | 11.61 | % | | | 10.04 | % | | | 15.09 | % | |
Ratios to average net assets(b) | |
Total gross expenses | | | 2.13 | % | | | 2.02 | % | | | 2.09 | % | | | 2.03 | % | | | 2.04 | % | |
Total net expenses(c) | | | 2.06 | %(d) | | | 2.00 | %(d) | | | 2.01 | %(d) | | | 1.95 | %(d) | | | 2.00 | %(e) | |
Net investment income (loss) | | | 2.28 | % | | | 2.03 | % | | | 1.83 | % | | | 0.59 | % | | | (0.70 | %) | |
Supplemental data | |
Net assets, end of period (in thousands) | | $ | 900 | | | $ | 2,118 | | | $ | 3,968 | | | $ | 9,414 | | | $ | 16,112 | | |
Portfolio turnover | | | 63 | % | | | 75 | % | | | 60 | % | | | 97 | % | | | 62 | % | |
Notes to Financial Highlights
(a) Rounds to zero.
(b) In addition to the fees and expenses that the Fund bears directly, the Fund indirectly bears a pro rata share of the fees and expenses of any other funds in which it invests. Such indirect expenses are not included in the Fund's reported expense ratios.
(c) Total net expenses include the impact of certain fee waivers/expense reimbursements made by the Investment Manager and certain of its affiliates, if applicable.
(d) The benefits derived from expense reductions had an impact of 0.01%, 0.01%, 0.02% and 0.08% for the years ended 2015, 2014, 2013 and 2012, respectively.
(e) The benefits derived from expense reductions had an impact of less than 0.01%.
The accompanying Notes to Financial Statements are an integral part of this statement.
Annual Report 2015
21
COLUMBIA GLOBAL DIVIDEND OPPORTUNITY FUND
FINANCIAL HIGHLIGHTS (continued)
| | | Year Ended August 31, | |
Class C | | 2015 | | 2014 | | 2013 | | 2012 | | 2011 | |
Per share data | |
Net asset value, beginning of period | | $ | 20.49 | | | $ | 18.86 | | | $ | 18.63 | | | $ | 16.93 | | | $ | 14.71 | | |
Income from investment operations: | |
Net investment income (loss) | | | 0.41 | | | | 0.43 | | | | 0.35 | | | | 0.12 | | | | (0.12 | ) | |
Net realized and unrealized gain (loss) | | | (2.77 | ) | | | 2.41 | | | | 1.66 | | | | 1.58 | | | | 2.34 | | |
Total from investment operations | | | (2.36 | ) | | | 2.84 | | | | 2.01 | | | | 1.70 | | | | 2.22 | | |
Less distributions to shareholders: | |
Net investment income | | | (0.55 | ) | | | (0.39 | ) | | | (0.47 | ) | | | — | | | | — | | |
Net realized gains | | | (2.02 | ) | | | (0.82 | ) | | | (1.31 | ) | | | — | | | | — | | |
Total distributions to shareholders | | | (2.57 | ) | | | (1.21 | ) | | | (1.78 | ) | | | — | | | | — | | |
Proceeds from regulatory settlements | | | — | | | | — | | | | — | | | | 0.00 | (a) | | | — | | |
Net asset value, end of period | | $ | 15.56 | | | $ | 20.49 | | | $ | 18.86 | | | $ | 18.63 | | | $ | 16.93 | | |
Total return | | | (12.18 | %) | | | 15.55 | % | | | 11.66 | % | | | 10.04 | % | | | 15.09 | % | |
Ratios to average net assets(b) | |
Total gross expenses | | | 2.13 | % | | | 2.02 | % | | | 2.09 | % | | | 2.04 | % | | | 2.04 | % | |
Total net expenses(c) | | | 2.06 | %(d) | | | 2.00 | %(d) | | | 2.01 | %(d) | | | 1.95 | %(d) | | | 2.00 | %(e) | |
Net investment income (loss) | | | 2.30 | % | | | 2.17 | % | | | 1.84 | % | | | 0.72 | % | | | (0.68 | %) | |
Supplemental data | |
Net assets, end of period (in thousands) | | $ | 12,440 | | | $ | 16,136 | | | $ | 13,439 | | | $ | 13,319 | | | $ | 15,251 | | |
Portfolio turnover | | | 63 | % | | | 75 | % | | | 60 | % | | | 97 | % | | | 62 | % | |
Notes to Financial Highlights
(a) Rounds to zero.
(b) In addition to the fees and expenses that the Fund bears directly, the Fund indirectly bears a pro rata share of the fees and expenses of any other funds in which it invests. Such indirect expenses are not included in the Fund's reported expense ratios.
(c) Total net expenses include the impact of certain fee waivers/expense reimbursements made by the Investment Manager and certain of its affiliates, if applicable.
(d) The benefits derived from expense reductions had an impact of 0.01%, 0.02%, 0.03% and 0.09% for the years ended 2015, 2014, 2013 and 2012, respectively.
(e) The benefits derived from expense reductions had an impact of less than 0.01%.
The accompanying Notes to Financial Statements are an integral part of this statement.
Annual Report 2015
22
COLUMBIA GLOBAL DIVIDEND OPPORTUNITY FUND
FINANCIAL HIGHLIGHTS (continued)
| | | Year Ended August 31 | |
Class I | | 2015 | | 2014 | | 2013 | | 2012 | | 2011(a) | |
Per share data | |
Net asset value, beginning of period | | $ | 21.66 | | | $ | 19.87 | | | $ | 19.64 | | | $ | 17.80 | | | $ | 17.01 | | |
Income from investment operations: | |
Net investment income | | | 0.67 | | | | 0.72 | | | | 0.58 | | | | 0.35 | | | | 0.09 | | |
Net realized and unrealized gain (loss) | | | (2.94 | ) | | | 2.53 | | | | 1.76 | | | | 1.64 | | | | 0.74 | | |
Total from investment operations | | | (2.27 | ) | | | 3.25 | | | | 2.34 | | | | 1.99 | | | | 0.83 | | |
Less distributions to shareholders: | |
Net investment income | | | (0.79 | ) | | | (0.64 | ) | | | (0.80 | ) | | | (0.15 | ) | | | (0.04 | ) | |
Net realized gains | | | (2.02 | ) | | | (0.82 | ) | | | (1.31 | ) | | | — | | | | — | | |
Total distributions to shareholders | | | (2.81 | ) | | | (1.46 | ) | | | (2.11 | ) | | | (0.15 | ) | | | (0.04 | ) | |
Proceeds from regulatory settlements | | | — | | | | — | | | | — | | | | 0.00 | (b) | | | — | | |
Net asset value, end of period | | $ | 16.58 | | | $ | 21.66 | | | $ | 19.87 | | | $ | 19.64 | | | $ | 17.80 | | |
Total return | | | (11.08 | %) | | | 16.95 | % | | | 12.98 | % | | | 11.27 | % | | | 4.90 | % | |
Ratios to average net assets(c) | |
Total gross expenses | | | 0.82 | % | | | 0.81 | % | | | 0.84 | % | | | 0.85 | % | | | 0.75 | %(d) | |
Total net expenses(e) | | | 0.82 | % | | | 0.81 | % | | | 0.83 | % | | | 0.83 | % | | | 0.75 | %(d)(f) | |
Net investment income | | | 3.55 | % | | | 3.45 | % | | | 2.94 | % | | | 1.91 | % | | | 0.57 | %(d) | |
Supplemental data | |
Net assets, end of period (in thousands) | | $ | 124,390 | | | $ | 168,474 | | | $ | 127,949 | | | $ | 3 | | | $ | 3 | | |
Portfolio turnover | | | 63 | % | | | 75 | % | | | 60 | % | | | 97 | % | | | 62 | % | |
Notes to Financial Highlights
(a) Based on operations from September 27, 2010 (commencement of operations) through the stated period end.
(b) Rounds to zero.
(c) In addition to the fees and expenses that the Fund bears directly, the Fund indirectly bears a pro rata share of the fees and expenses of any other funds in which it invests. Such indirect expenses are not included in the Fund's reported expense ratios.
(d) Annualized.
(e) Total net expenses include the impact of certain fee waivers/expense reimbursements made by the Investment Manager and certain of its affiliates, if applicable.
(f) The benefits derived from expense reductions had an impact of less than 0.01%.
The accompanying Notes to Financial Statements are an integral part of this statement.
Annual Report 2015
23
COLUMBIA GLOBAL DIVIDEND OPPORTUNITY FUND
FINANCIAL HIGHLIGHTS (continued)
| | | Year Ended August 31, | |
Class R | | 2015 | | 2014 | | 2013 | | 2012 | | 2011(a) | |
Per share data | |
Net asset value, beginning of period | | $ | 21.61 | | | $ | 19.83 | | | $ | 19.54 | | | $ | 17.67 | | | $ | 16.97 | | |
Income from investment operations: | |
Net investment income | | | 0.53 | | | | 0.57 | | | | 0.46 | | | | 0.23 | | | | 0.00 | (b) | |
Net realized and unrealized gain (loss) | | | (2.94 | ) | | | 2.52 | | | | 1.75 | | | | 1.64 | | | | 0.70 | | |
Total from investment operations | | | (2.41 | ) | | | 3.09 | | | | 2.21 | | | | 1.87 | | | | 0.70 | | |
Less distributions to shareholders: | |
Net investment income | | | (0.65 | ) | | | (0.49 | ) | | | (0.61 | ) | | | (0.00 | )(b) | | | — | | |
Net realized gains | | | (2.02 | ) | | | (0.82 | ) | | | (1.31 | ) | | | — | | | | — | | |
Total distributions to shareholders | | | (2.67 | ) | | | (1.31 | ) | | | (1.92 | ) | | | (0.00 | )(b) | | | — | | |
Proceeds from regulatory settlements | | | — | | | | — | | | | — | | | | 0.00 | (b) | | | — | | |
Net asset value, end of period | | $ | 16.53 | | | $ | 21.61 | | | $ | 19.83 | | | $ | 19.54 | | | $ | 17.67 | | |
Total return | | | (11.78 | %) | | | 16.13 | % | | | 12.25 | % | | | 10.61 | % | | | 4.12 | % | |
Ratios to average net assets(c) | |
Total gross expenses | | | 1.62 | % | | | 1.52 | % | | | 1.59 | % | | | 1.53 | % | | | 1.54 | %(d) | |
Total net expenses(e) | | | 1.55 | %(f) | | | 1.50 | %(f) | | | 1.51 | %(f) | | | 1.46 | %(f) | | | 1.50 | %(d)(g) | |
Net investment income | | | 2.77 | % | | | 2.72 | % | | | 2.33 | % | | | 1.24 | % | | | 0.02 | %(d) | |
Supplemental data | |
Net assets, end of period (in thousands) | | $ | 671 | | | $ | 1,280 | | | $ | 1,297 | | | $ | 1,082 | | | $ | 1,071 | | |
Portfolio turnover | | | 63 | % | | | 75 | % | | | 60 | % | | | 97 | % | | | 62 | % | |
Notes to Financial Highlights
(a) Based on operations from September 27, 2010 (commencement of operations) through the stated period end.
(b) Rounds to zero.
(c) In addition to the fees and expenses that the Fund bears directly, the Fund indirectly bears a pro rata share of the fees and expenses of any other funds in which it invests. Such indirect expenses are not included in the Fund's reported expense ratios.
(d) Annualized.
(e) Total net expenses include the impact of certain fee waivers/expense reimbursements made by the Investment Manager and certain of its affiliates, if applicable.
(f) The benefits derived from expense reductions had an impact of 0.01%, 0.02%, 0.03% and 0.07% for the years ended 2015, 2014, 2013 and 2012, respectively.
(g) The benefits derived from expense reductions had an impact of less than 0.01%.
The accompanying Notes to Financial Statements are an integral part of this statement.
Annual Report 2015
24
COLUMBIA GLOBAL DIVIDEND OPPORTUNITY FUND
FINANCIAL HIGHLIGHTS (continued)
| | | Year Ended August 31, | |
Class R4 | | 2015 | | 2014 | | 2013(a) | |
Per share data | |
Net asset value, beginning of period | | $ | 21.78 | | | $ | 19.97 | | | $ | 19.69 | | |
Income from investment operations: | |
Net investment income | | | 0.67 | | | | 0.76 | | | | 0.25 | | |
Net realized and unrealized gain (loss) | | | (2.99 | ) | | | 2.46 | | | | 0.33 | | |
Total from investment operations | | | (2.32 | ) | | | 3.22 | | | | 0.58 | | |
Less distributions to shareholders: | |
Net investment income | | | (0.75 | ) | | | (0.59 | ) | | | (0.30 | ) | |
Net realized gains | | | (2.02 | ) | | | (0.82 | ) | | | — | | |
Total distributions to shareholders | | | (2.77 | ) | | | (1.41 | ) | | | (0.30 | ) | |
Net asset value, end of period | | $ | 16.69 | | | $ | 21.78 | | | $ | 19.97 | | |
Total return | | | (11.27 | %) | | | 16.74 | % | | | 3.02 | % | |
Ratios to average net assets(b) | |
Total gross expenses | | | 1.16 | % | | | 1.03 | % | | | 1.07 | %(c) | |
Total net expenses(d) | | | 1.04 | %(e) | | | 0.99 | %(e) | | | 1.01 | %(c)(e) | |
Net investment income | | | 3.68 | % | | | 3.56 | % | | | 2.78 | %(c) | |
Supplemental data | |
Net assets, end of period (in thousands) | | $ | 782 | | | $ | 113 | | | $ | 29 | | |
Portfolio turnover | | | 63 | % | | | 75 | % | | | 60 | % | |
Notes to Financial Highlights
(a) Based on operations from March 19, 2013 (commencement of operations) through the stated period end.
(b) In addition to the fees and expenses that the Fund bears directly, the Fund indirectly bears a pro rata share of the fees and expenses of any other funds in which it invests. Such indirect expenses are not included in the Fund's reported expense ratios.
(c) Annualized.
(d) Total net expenses include the impact of certain fee waivers/expense reimbursements made by the Investment Manager and certain of its affiliates, if applicable.
(e) The benefits derived from expense reductions had an impact of 0.02%, 0.03% and 0.05% for the years ended 2015, 2014 and 2013, respectively.
The accompanying Notes to Financial Statements are an integral part of this statement.
Annual Report 2015
25
COLUMBIA GLOBAL DIVIDEND OPPORTUNITY FUND
FINANCIAL HIGHLIGHTS (continued)
| | | Year Ended August 31, | |
Class R5 | | 2015 | | 2014(a) | |
Per share data | |
Net asset value, beginning of period | | $ | 21.66 | | | $ | 20.57 | | |
Income from investment operations: | |
Net investment income | | | 0.64 | | | | 0.39 | | |
Net realized and unrealized gain (loss) | | | (2.92 | ) | | | 1.01 | | |
Total from investment operations | | | (2.28 | ) | | | 1.40 | | |
Less distributions to shareholders: | |
Net investment income | | | (0.78 | ) | | | (0.31 | ) | |
Net realized gains | | | (2.02 | ) | | | — | | |
Total distributions to shareholders | | | (2.80 | ) | | | (0.31 | ) | |
Net asset value, end of period | | $ | 16.58 | | | $ | 21.66 | | |
Total return | | | (11.13 | %) | | | 6.85 | % | |
Ratios to average net assets(b) | |
Total gross expenses | | | 0.87 | % | | | 0.88 | %(c) | |
Total net expenses(d) | | | 0.87 | % | | | 0.88 | %(c) | |
Net investment income | | | 3.52 | % | | | 2.98 | %(c) | |
Supplemental data | |
Net assets, end of period (in thousands) | | $ | 178 | | | $ | 33 | | |
Portfolio turnover | | | 63 | % | | | 75 | % | |
Notes to Financial Highlights
(a) Based on operations from January 8, 2014 (commencement of operations) through the stated period end.
(b) In addition to the fees and expenses that the Fund bears directly, the Fund indirectly bears a pro rata share of the fees and expenses of any other funds in which it invests. Such indirect expenses are not included in the Fund's reported expense ratios.
(c) Annualized.
(d) Total net expenses include the impact of certain fee waivers/expense reimbursements made by the Investment Manager and certain of its affiliates, if applicable.
The accompanying Notes to Financial Statements are an integral part of this statement.
Annual Report 2015
26
COLUMBIA GLOBAL DIVIDEND OPPORTUNITY FUND
FINANCIAL HIGHLIGHTS (continued)
| | | Year Ended August 31, | |
Class W | | 2015 | | 2014 | | 2013 | | 2012 | | 2011(a) | |
Per share data | |
Net asset value, beginning of period | | $ | 21.62 | | | $ | 19.83 | | | $ | 19.57 | | | $ | 17.73 | | | $ | 16.97 | | |
Income from investment operations: | |
Net investment income | | | 0.60 | | | | 0.61 | | | | 0.51 | | | | 0.28 | | | | 0.03 | | |
Net realized and unrealized gain (loss) | | | (2.93 | ) | | | 2.55 | | | | 1.74 | | | | 1.64 | | | | 0.73 | | |
Total from investment operations | | | (2.33 | ) | | | 3.16 | | | | 2.25 | | | | 1.92 | | | | 0.76 | | |
Less distributions to shareholders: | |
Net investment income | | | (0.71 | ) | | | (0.55 | ) | | | (0.68 | ) | | | (0.08 | ) | | | — | | |
Net realized gains | | | (2.02 | ) | | | (0.82 | ) | | | (1.31 | ) | | | — | | | | — | | |
Total distributions to shareholders | | | (2.73 | ) | | | (1.37 | ) | | | (1.99 | ) | | | (0.08 | ) | | | — | | |
Proceeds from regulatory settlements | | | — | | | | — | | | | — | | | | 0.00 | (b) | | | — | | |
Net asset value, end of period | | $ | 16.56 | | | $ | 21.62 | | | $ | 19.83 | | | $ | 19.57 | | | $ | 17.73 | | |
Total return | | | (11.41 | %) | | | 16.50 | % | | | 12.48 | % | | | 10.86 | % | | | 4.48 | % | |
Ratios to average net assets(c) | |
Total gross expenses | | | 1.38 | % | | | 1.28 | % | | | 1.33 | % | | | 1.33 | % | | | 1.21 | %(d) | |
Total net expenses(e) | | | 1.31 | %(f) | | | 1.26 | %(f) | | | 1.26 | %(f) | | | 1.23 | %(f) | | | 1.16 | %(d)(g) | |
Net investment income | | | 3.04 | % | | | 2.85 | % | | | 2.60 | % | | | 1.51 | % | | | 0.15 | %(d) | |
Supplemental data | |
Net assets, end of period (in thousands) | | $ | 2 | | | $ | 3 | | | $ | 3 | | | $ | 3 | | | $ | 3 | | |
Portfolio turnover | | | 63 | % | | | 75 | % | | | 60 | % | | | 97 | % | | | 62 | % | |
Notes to Financial Highlights
(a) Based on operations from September 27, 2010 (commencement of operations) through the stated period end.
(b) Rounds to zero.
(c) In addition to the fees and expenses that the Fund bears directly, the Fund indirectly bears a pro rata share of the fees and expenses of any other funds in which it invests. Such indirect expenses are not included in the Fund's reported expense ratios.
(d) Annualized.
(e) Total net expenses include the impact of certain fee waivers/expense reimbursements made by the Investment Manager and certain of its affiliates, if applicable.
(f) The benefits derived from expense reductions had an impact of 0.01%, 0.02%, 0.03% and 0.08% for the years ended 2015, 2014, 2013 and 2012, respectively.
(g) The benefits derived from expense reductions had an impact of less than 0.01%.
The accompanying Notes to Financial Statements are an integral part of this statement.
Annual Report 2015
27
COLUMBIA GLOBAL DIVIDEND OPPORTUNITY FUND
FINANCIAL HIGHLIGHTS (continued)
| | | Year Ended August 31, | |
Class Y | | 2015 | | 2014 | | 2013 | | 2012 | | 2011 | |
Per share data | |
Net asset value, beginning of period | | $ | 21.68 | | | $ | 19.89 | | | $ | 19.65 | | | $ | 17.79 | | | $ | 15.32 | | |
Income from investment operations: | |
Net investment income | | | 0.70 | | | | 0.72 | | | | 0.59 | | | | 0.31 | | | | 0.09 | | |
Net realized and unrealized gain (loss) | | | (2.96 | ) | | | 2.54 | | | | 1.74 | | | | 1.68 | | | | 2.42 | | |
Total from investment operations | | | (2.26 | ) | | | 3.26 | | | | 2.33 | | | | 1.99 | | | | 2.51 | | |
Less distributions to shareholders: | |
Net investment income | | | (0.80 | ) | | | (0.65 | ) | | | (0.78 | ) | | | (0.13 | ) | | | (0.04 | ) | |
Net realized gains | | | (2.02 | ) | | | (0.82 | ) | | | (1.31 | ) | | | — | | | | — | | |
Total distributions to shareholders | | | (2.82 | ) | | | (1.47 | ) | | | (2.09 | ) | | | (0.13 | ) | | | (0.04 | ) | |
Proceeds from regulatory settlements | | | — | | | | — | | | | — | | | | 0.00 | (a) | | | — | | |
Net asset value, end of period | | $ | 16.60 | | | $ | 21.68 | | | $ | 19.89 | | | $ | 19.65 | | | $ | 17.79 | | |
Total return | | | (11.04 | %) | | | 17.00 | % | | | 12.93 | % | | | 11.28 | % | | | 16.40 | % | |
Ratios to average net assets(b) | |
Total gross expenses | | | 0.82 | % | | | 0.81 | % | | | 0.96 | % | | | 0.82 | % | | | 0.83 | % | |
Total net expenses(c) | | | 0.82 | % | | | 0.81 | % | | | 0.88 | % | | | 0.82 | % | | | 0.83 | %(d) | |
Net investment income | | | 3.89 | % | | | 3.33 | % | | | 2.97 | % | | | 1.70 | % | | | 0.51 | % | |
Supplemental data | |
Net assets, end of period (in thousands) | | $ | 1,149 | | | $ | 3 | | | $ | 3 | | | $ | 2 | | | $ | 15,557 | | |
Portfolio turnover | | | 63 | % | | | 75 | % | | | 60 | % | | | 97 | % | | | 62 | % | |
Notes to Financial Highlights
(a) Rounds to zero.
(b) In addition to the fees and expenses that the Fund bears directly, the Fund indirectly bears a pro rata share of the fees and expenses of any other funds in which it invests. Such indirect expenses are not included in the Fund's reported expense ratios.
(c) Total net expenses include the impact of certain fee waivers/expense reimbursements made by the Investment Manager and certain of its affiliates, if applicable.
(d) The benefits derived from expense reductions had an impact of less than 0.01%.
The accompanying Notes to Financial Statements are an integral part of this statement.
Annual Report 2015
28
COLUMBIA GLOBAL DIVIDEND OPPORTUNITY FUND
FINANCIAL HIGHLIGHTS (continued)
| | | Year Ended August 31, | |
Class Z | | 2015 | | 2014 | | 2013 | | 2012 | | 2011 | |
Per share data | |
Net asset value, beginning of period | | $ | 21.69 | | | $ | 19.90 | | | $ | 19.66 | | | $ | 17.78 | | | $ | 15.32 | | |
Income from investment operations: | |
Net investment income | | | 0.63 | | | | 0.67 | | | | 0.56 | | | | 0.31 | | | | 0.06 | | |
Net realized and unrealized gain (loss) | | | (2.94 | ) | | | 2.53 | | | | 1.75 | | | | 1.67 | | | | 2.42 | | |
Total from investment operations | | | (2.31 | ) | | | 3.20 | | | | 2.31 | | | | 1.98 | | | | 2.48 | | |
Less distributions to shareholders: | |
Net investment income | | | (0.75 | ) | | | (0.59 | ) | | | (0.76 | ) | | | (0.10 | ) | | | (0.02 | ) | |
Net realized gains | | | (2.02 | ) | | | (0.82 | ) | | | (1.31 | ) | | | — | | | | — | | |
Total distributions to shareholders | | | (2.77 | ) | | | (1.41 | ) | | | (2.07 | ) | | | (0.10 | ) | | | (0.02 | ) | |
Proceeds from regulatory settlements | | | — | | | | — | | | | — | | | | 0.00 | (a) | | | — | | |
Net asset value, end of period | | $ | 16.61 | | | $ | 21.69 | | | $ | 19.90 | | | $ | 19.66 | | | $ | 17.78 | | |
Total return | | | (11.28 | %) | | | 16.70 | % | | | 12.76 | % | | | 11.20 | % | | | 16.17 | % | |
Ratios to average net assets(b) | |
Total gross expenses | | | 1.13 | % | | | 1.02 | % | | | 1.09 | % | | | 1.03 | % | | | 1.04 | % | |
Total net expenses(c) | | | 1.06 | %(d) | | | 1.00 | %(d) | | | 1.01 | %(d) | | | 0.95 | %(d) | | | 1.00 | %(e) | |
Net investment income | | | 3.30 | % | | | 3.16 | % | | | 2.84 | % | | | 1.72 | % | | | 0.34 | % | |
Supplemental data | |
Net assets, end of period (in thousands) | | $ | 457,640 | | | $ | 592,910 | | | $ | 562,394 | | | $ | 585,285 | | | $ | 670,362 | | |
Portfolio turnover | | | 63 | % | | | 75 | % | | | 60 | % | | | 97 | % | | | 62 | % | |
Notes to Financial Highlights
(a) Rounds to zero.
(b) In addition to the fees and expenses that the Fund bears directly, the Fund indirectly bears a pro rata share of the fees and expenses of any other funds in which it invests. Such indirect expenses are not included in the Fund's reported expense ratios.
(c) Total net expenses include the impact of certain fee waivers/expense reimbursements made by the Investment Manager and certain of its affiliates, if applicable.
(d) The benefits derived from expense reductions had an impact of 0.01%, 0.02%, 0.03% and 0.08% for the years ended 2015, 2014, 2013 and 2012, respectively.
(e) The benefits derived from expense reductions had an impact of less than 0.01%.
The accompanying Notes to Financial Statements are an integral part of this statement.
Annual Report 2015
29
COLUMBIA GLOBAL DIVIDEND OPPORTUNITY FUND
NOTES TO FINANCIAL STATEMENTS
August 31, 2015
Note 1. Organization
Columbia Global Dividend Opportunity Fund (the Fund), a series of Columbia Funds Series Trust I (the Trust), is a diversified fund. The Trust is registered under the Investment Company Act of 1940, as amended (the 1940 Act), as an open-end management investment company organized as a Massachusetts business trust.
Fund Shares
The Trust may issue an unlimited number of shares (without par value). The Fund offers Class A, Class B, Class C, Class I, Class R, Class R4, Class R5, Class W, Class Y and Class Z shares. Although all share classes generally have identical voting, dividend and liquidation rights, each share class votes separately when required by the Trust's organizational documents or by law. Different share classes pay different distribution amounts to the extent the expenses of such share classes differ, and distributions in liquidation will be proportional to the net asset value of each share class. Each share class has its own expense and sales charge structure.
Class A shares are subject to a maximum front-end sales charge of 5.75% based on the initial investment amount. Class A shares purchased without an initial sales charge in accounts aggregating $1 million to $50 million at the time of purchase are subject to a contingent deferred sales charge (CDSC) if the shares are sold within 18 months after purchase, charged as follows: 1.00% CDSC if redeemed within 12 months after purchase, and 0.50% CDSC if redeemed more than 12, but less than 18, months after purchase.
Class B shares may be subject to a maximum CDSC of 5.00% based upon the holding period after purchase. Class B shares will generally convert to Class A shares eight years after purchase. The Fund no longer accepts investments by new or existing investors in the Fund's Class B shares, except in connection with the reinvestment of any dividend and/or capital gain distributions in Class B shares of the Fund and exchanges by existing Class B shareholders of certain other funds within the Columbia Family of Funds.
Class C shares are subject to a 1.00% CDSC on shares redeemed within one year after purchase.
Class I shares are not subject to sales charges and are available only to the Columbia Family of Funds.
Class R shares are not subject to sales charges and are generally available only to certain retirement plans and other investors as described in the Fund's prospectus.
Class R4 shares are not subject to sales charges and are generally available only to omnibus retirement plans and certain investors as described in the Fund's prospectus.
Class R5 shares are not subject to sales charges and are generally available only to investors purchasing through authorized investment professionals and omnibus retirement plans.
Class W shares are not subject to sales charges and are available only to investors purchasing through authorized investment programs managed by investment professionals, including discretionary managed account programs.
Class Y shares are not subject to sales charges and are generally available only to certain retirement plans as described in the Fund's prospectus.
Class Z shares are not subject to sales charges and are available only to eligible investors, which are subject to different investment minimums as described in the Fund's prospectus.
Note 2. Summary of Significant Accounting Policies
Basis of Preparation
The Fund is an investment company that applies the accounting and reporting guidance in the Financial Accounting Standards Board (FASB) Accounting Standards Codification Topic 946, Financial Services — Investment Companies (ASC 946). The financial statements are prepared in accordance with U.S. generally accepted accounting principles (GAAP), which requires management to make certain estimates and assumptions that affect the reported amounts of assets and liabilities, the disclosure of contingent assets and liabilities at the date of the financial statements and the reported amounts of income and expenses during the reporting period. Actual results could differ from those estimates.
The following is a summary of significant accounting policies followed by the Fund in the preparation of its financial statements.
Security Valuation
All equity securities are valued at the close of business of the New York Stock Exchange (NYSE). Equity securities are valued at the last quoted sales price on the principal exchange or market on which they trade, except for securities traded on the NASDAQ Stock Market, which are valued at the NASDAQ official close price. Unlisted
Annual Report 2015
30
COLUMBIA GLOBAL DIVIDEND OPPORTUNITY FUND
NOTES TO FINANCIAL STATEMENTS (continued)
August 31, 2015
securities or listed securities for which there were no sales during the day are valued at the mean of the latest quoted bid and ask prices on such exchanges or markets.
Foreign equity securities are valued based on the closing price on the foreign exchange in which such securities are primarily traded. If any foreign equity security closing prices are not readily available, the securities are valued at the mean of the latest quoted bid and ask prices on such exchanges or markets. Foreign currency exchange rates are generally determined at 4:00 p.m. Eastern (U.S.) time. Many securities markets and exchanges outside the U.S. close prior to the close of the NYSE; therefore, the closing prices for securities in such markets or on such exchanges may not fully reflect events that occur after such close but before the close of the NYSE. In those situations, foreign securities will be fair valued pursuant to a policy adopted by Board of Trustees (the Board), including, if available, utilizing a third party pricing service to determine these fair values. The third party pricing service takes into account multiple factors, including, but not limited to, movements in the U.S. securities markets, certain depositary receipts, futures contracts and foreign exchange rates that have occurred subsequent to the close of the foreign exchange or market, to determine a good faith estimate that reasonably reflects the current market conditions as of the close of the NYSE. The fair value of a security is likely to be different from the quoted or published price, if available.
Investments in open-end investment companies, including money market funds, are valued at their latest net asset value.
Investments for which market quotations are not readily available, or that have quotations which management believes are not reflective of market value or reliable, are valued at fair value as determined in good faith under procedures approved by and under the general supervision of the Board. If a security or class of securities (such as foreign securities) is valued at fair value, such value is likely to be different from the quoted or published price for the security.
The determination of fair value often requires significant judgment. To determine fair value, management may use assumptions including but not limited to future cash flows and estimated risk premiums. Multiple inputs from various sources may be used to determine fair value.
GAAP requires disclosure regarding the inputs and valuation techniques used to measure fair value and any
changes in valuation inputs or techniques. In addition, investments shall be disclosed by major category. This information is disclosed following the Fund's Portfolio of Investments.
Foreign Currency Transactions and Translations
The values of all assets and liabilities denominated in foreign currencies are generally translated into U.S. dollars at exchange rates determined at the close of the NYSE. Net realized and unrealized gains (losses) on foreign currency transactions and translations include gains (losses) arising from the fluctuation in exchange rates between trade and settlement dates on securities transactions, gains (losses) arising from the disposition of foreign currency and currency gains (losses) between the accrual and payment dates on dividends, interest income and foreign withholding taxes.
For financial statement purposes, the Fund does not distinguish that portion of gains (losses) on investments which is due to changes in foreign exchange rates from that which is due to changes in market prices of the investments. Such fluctuations are included with the net realized and unrealized gains (losses) on investments in the Statement of Operations.
Security Transactions
Security transactions are accounted for on the trade date. Cost is determined and gains (losses) are based upon the specific identification method for both financial statement and federal income tax purposes.
Income Recognition
Corporate actions and dividend income are generally recorded net of any non-reclaimable tax withholdings, on the ex-dividend date or upon receipt of ex-dividend notification in the case of certain foreign securities.
Interest income is recorded on an accrual basis. Market premiums and discounts, including original issue discounts, are amortized and accreted, respectively, over the expected life of the security on all debt securities, unless otherwise noted.
The Fund may place a debt security on non-accrual status and reduce related interest income when it becomes probable that the interest will not be collected and the amount of uncollectible interest can be reasonably estimated. A defaulted debt security is removed from non-accrual status when the issuer resumes interest payments or when collectibility of interest is reasonably assured.
Annual Report 2015
31
COLUMBIA GLOBAL DIVIDEND OPPORTUNITY FUND
NOTES TO FINANCIAL STATEMENTS (continued)
August 31, 2015
The Fund may receive distributions from holdings in equity securities, business development companies (BDCs), exchange-traded funds, other regulated investment companies (RICs), and real estate investment trusts (REITs), which report information on the tax character of their distributions annually. These distributions are allocated to dividend income, capital gain and return of capital based on actual information reported. Return of capital is recorded as a reduction of the cost basis of securities held. If the Fund no longer owns the applicable securities, return of capital is recorded as a realized gain. With respect to REITs, to the extent actual information has not yet been reported, estimates for return of capital are made by the Fund's management. Management's estimates are subsequently adjusted when the actual character of the distributions is disclosed by the REITs, which could result in a proportionate change in return of capital to shareholders.
Awards from class action litigation are recorded as a reduction of cost basis if the Fund still owns the applicable securities on the payment date. If the Fund no longer owns the applicable securities, the proceeds are recorded as realized gains.
Expenses
General expenses of the Trust are allocated to the Fund and other funds of the Trust based upon relative net assets or other expense allocation methodologies determined by the nature of the expense. Expenses directly attributable to the Fund are charged to the Fund. Expenses directly attributable to a specific class of shares are charged to that share class.
Determination of Class Net Asset Value
All income, expenses (other than class-specific expenses, which are charged to that share class, as shown in the Statement of Operations) and realized and unrealized gains (losses) are allocated to each class of the Fund on a daily basis, based on the relative net assets of each class, for purposes of determining the net asset value of each class.
Federal Income Tax Status
The Fund intends to qualify each year as a regulated investment company under Subchapter M of the Internal Revenue Code, as amended, and will distribute substantially all of its taxable income (including net short-term capital gains), if any, for its tax year, and as such will not be subject to federal income taxes. In addition, the Fund intends to distribute in each calendar year substantially all of its net investment income, capital gains and certain other amounts, if any, such that
the Fund should not be subject to federal excise tax. Therefore, no federal income or excise tax provision is recorded.
Foreign Taxes
The Fund may be subject to foreign taxes on income, gains on investments or currency repatriation, a portion of which may be recoverable. The Fund will accrue such taxes and recoveries, as applicable, based upon its current interpretation of tax rules and regulations that exist in the markets in which it invests.
Realized gains in certain countries may be subject to foreign taxes at the Fund level, based on statutory rates. The Fund accrues for such foreign taxes on realized and unrealized gains at the appropriate rate for each jurisdiction, as applicable. The amount, if any, is disclosed as a liability on the Statement of Assets and Liabilities.
Distributions to Shareholders
Distributions from net investment income, if any, are declared and paid each calendar quarter. Net realized capital gains, if any, are distributed at least annually. Income distributions and capital gain distributions are determined in accordance with federal income tax regulations, which may differ from GAAP.
Guarantees and Indemnifications
Under the Trust's organizational documents and, in some cases, by contract, its officers and trustees are indemnified against certain liabilities arising out of the performance of their duties to the Trust or its funds. In addition, certain of the Fund's contracts with its service providers contain general indemnification clauses. The Fund's maximum exposure under these arrangements is unknown since the amount of any future claims that may be made against the Fund cannot be determined, and the Fund has no historical basis for predicting the likelihood of any such claims.
Recent Accounting Pronouncement
Fair Value Measurement (Topic 820), Disclosure for Investments in Certain Entities That Calculate Net Asset Value per Share (or Its Equivalent)
In May 2015, the Financial Accounting Standards Board (FASB) issued Accounting Standards Update (ASU) No. 2015-07, Fair Value Measurement (Topic 820), Disclosure for Investments in Certain Entities That Calculate Net Asset Value per Share (or Its Equivalent). ASU No. 2015-07 changes the disclosure requirements for investments for which fair value is measured using the net asset value per share practical expedient. The
Annual Report 2015
32
COLUMBIA GLOBAL DIVIDEND OPPORTUNITY FUND
NOTES TO FINANCIAL STATEMENTS (continued)
August 31, 2015
disclosure requirements are effective for annual periods beginning after December 15, 2015 and interim periods within those fiscal years. At this time, management is evaluating the implications of this guidance and the impact it will have on the financial statement amounts and footnote disclosures, if any.
Note 3. Fees and Other Transactions with Affiliates
Investment Management Fees
Under an Investment Management Services Agreement, Columbia Management Investment Advisers, LLC (the Investment Manager), a wholly-owned subsidiary of Ameriprise Financial, Inc. (Ameriprise Financial), determines which securities will be purchased, held or sold. The investment management fee is an annual fee that is equal to a percentage of the Fund's average daily net assets that declines from 0.71% to 0.54% as the Fund's net assets increase. The effective investment management fee rate for the year ended August 31, 2015 was 0.69% of the Fund's average daily net assets.
Administration Fees
Under an Administrative Services Agreement, the Investment Manager also serves as the Fund Administrator. The Fund pays the Fund Administrator an annual fee for administration and accounting services equal to a percentage of the Fund's average daily net assets that declines from 0.06% to 0.03% as the Fund's net assets increase. The effective administration fee rate for the year ended August 31, 2015 was 0.06% of the Fund's average daily net assets.
Compensation of Board Members
Board members, who are not officers or employees of the Investment Manager or Ameriprise Financial, are compensated for their services to the Fund as disclosed in the Statement of Operations. These Board members may participate in a Deferred Compensation Plan (the Plan) which may be terminated at any time. Obligations of the Plan will be paid solely out of the Fund's assets, and all amounts payable under the Plan constitute a general unsecured obligation of the Fund.
Compensation of Chief Compliance Officer
The Board has appointed a Chief Compliance Officer to the Fund in accordance with federal securities regulations. The Fund is allocated a portion of the expenses associated with the Chief Compliance Officer based on relative net assets of the Trust.
Transfer Agency Fees
Under a Transfer and Dividend Disbursing Agent Agreement, Columbia Management Investment Services Corp. (the Transfer Agent), an affiliate of the Investment Manager and a wholly-owned subsidiary of Ameriprise Financial, is responsible for providing transfer agency services to the Fund. The Transfer Agent has contracted with Boston Financial Data Services (BFDS) to serve as sub-transfer agent.
Effective November 1, 2014, the Transfer Agent receives a monthly transfer agency fee based on the number or the average value of accounts, depending on the type of account. Prior to November 1, 2014, the Transfer Agent received a monthly account-based service fee based on the number of open accounts. In addition, the Transfer Agent also receives sub-transfer agency fees based on a percentage of the average aggregate value of the Fund's shares maintained in omnibus accounts (other than omnibus accounts for which American Enterprise Investment Services Inc. is the broker of record or accounts where the beneficial shareholder is a customer of Ameriprise Financial Services, Inc., for which the Transfer Agent receives a per account fee). The Transfer Agent pays the fees of BFDS for services as sub-transfer agent and is not entitled to reimbursement for such fees from the Fund (with the exception of out-of-pocket fees).
The Transfer Agent also receives compensation from the Fund for various shareholder services and reimbursements for certain out-of-pocket fees. Total transfer agency fees for Class R5 shares are subject to an annual limitation of not more than 0.05% of the average daily net assets attributable to Class R5 shares. Class I and Class Y shares do not pay transfer agency fees.
For the year ended August 31, 2015, the Fund's effective transfer agency fee rates as a percentage of average daily net assets of each class were as follows:
Class A | | | 0.32 | % | |
Class B | | | 0.31 | | |
Class C | | | 0.32 | | |
Class R | | | 0.31 | | |
Class R4 | | | 0.34 | | |
Class R5 | | | 0.05 | | |
Class W | | | 0.32 | | |
Class Z | | | 0.32 | | |
An annual minimum account balance fee of $20 may apply to certain accounts with a value below the applicable share class's initial minimum investment requirements to reduce the impact of small accounts on
Annual Report 2015
33
COLUMBIA GLOBAL DIVIDEND OPPORTUNITY FUND
NOTES TO FINANCIAL STATEMENTS (continued)
August 31, 2015
transfer agency fees. These minimum account balance fees are remitted to the Fund and recorded as part of expense reductions in the Statement of Operations. For the year ended August 31, 2015, these minimum account balance fees reduced total expenses of the Fund by $93,167.
Distribution and Service Fees
The Fund has an agreement with Columbia Management Investment Distributors, Inc. (the Distributor), an affiliate of the Investment Manager and a wholly-owned subsidiary of Ameriprise Financial, for distribution and shareholder services. The Board has approved, and the Fund has adopted, distribution and shareholder service plans (the Plans) applicable to certain share classes, which set the distribution and service fees for the Fund. These fees are calculated daily and are intended to compensate the Distributor and/or eligible selling and/or servicing agents for selling shares of the Fund and providing services to investors.
Under the Plans, the Fund pays a monthly service fee to the Distributor at the maximum annual rate of 0.25% of the average daily net assets attributable to Class A, Class B, Class C and Class W shares of the Fund. Also under the Plans, the Fund pays a monthly distribution fee to the Distributor at the maximum annual rates of 0.75%, 0.75%, 0.50% and 0.25% of the average daily net assets attributable to Class B, Class C, Class R and Class W shares of the Fund, respectively.
Although the Fund may pay a distribution fee up to 0.25% of the Fund's average daily net assets attributable to Class W shares and a service fee of up to 0.25% of the Fund's average daily net assets attributable to Class W shares, the aggregate fee shall not exceed 0.25% of the Fund's average daily net assets attributable to Class W shares.
Sales Charges
Sales charges, including front-end charges and CDSCs, received by the Distributor for distributing Fund shares were $89,599 for Class A, $596 for Class B and $571 for Class C shares for the year ended August 31, 2015.
Expenses Waived/Reimbursed by the Investment Manager and its Affiliates
The Fund's expense ratio is subject to an expense reimbursement arrangement pursuant to which fees will be waived and/or expenses reimbursed (excluding certain fees and expenses described below), so that the Fund's net operating expenses, after giving effect to fees waived/expenses reimbursed and any balance credits
and/or overdraft charges from the Fund's custodian, do not exceed the annual rates of:
| | | Voluntary
Expense Cap
Effective
January 1, 2015 | | Contractual
Expense Cap
Prior to
January 1, 2015 | |
Class A | | | 1.30 | % | | | 1.33 | % | |
Class B | | | 2.05 | | | | 2.08 | | |
Class C | | | 2.05 | | | | 2.08 | | |
Class I | | | 0.85 | | | | 0.91 | | |
Class R | | | 1.55 | | | | 1.58 | | |
Class R4 | | | 1.05 | | | | 1.08 | | |
Class R5 | | | 0.90 | | | | 0.96 | | |
Class W | | | 1.30 | | | | 1.33 | | |
Class Y | | | 0.85 | | | | 0.91 | | |
Class Z | | | 1.05 | | | | 1.08 | | |
The voluntary expense cap arrangement may be revised or discontinued at any time. Under the arrangements, the following fees and expenses are excluded from the waiver/reimbursement commitment, and therefore will be paid by the Fund, if applicable: taxes (including foreign transaction taxes), expenses associated with investments in affiliated and non-affiliated pooled investment vehicles (including mutual funds and exchange-traded funds), transaction costs and brokerage commissions, costs related to any securities lending program, dividend and interest expenses associated with securities sold short, inverse floater program fees and expenses, transaction charges and interest on borrowed money, interest and extraordinary expenses. Any fees waived and/or expenses reimbursed under the expense reimbursement arrangements described above are not recoverable by the Investment Manager or its affiliates in future periods.
Note 4. Federal Tax Information
The timing and character of income and capital gain distributions are determined in accordance with income tax regulations, which may differ from GAAP because of temporary or permanent book to tax differences.
At August 31, 2015, these differences are primarily due to differing treatment for capital loss carryforwards, deferral/reversal of wash sale losses, Trustees' deferred compensation, foreign currency transactions, post-October capital losses and derivative investments. To the extent these differences are permanent, reclassifications are made among the components of the Fund's net assets in the Statement of Assets and Liabilities. Temporary differences do not require reclassifications. In
Annual Report 2015
34
COLUMBIA GLOBAL DIVIDEND OPPORTUNITY FUND
NOTES TO FINANCIAL STATEMENTS (continued)
August 31, 2015
the Statement of Assets and Liabilities the following reclassifications were made:
Undistributed net investment income | | $ | (803,510 | ) | |
Accumulated net realized loss | | | 922,866 | | |
Paid-in capital | | | (119,356 | ) | |
Net investment income (loss) and net realized gains (losses), as disclosed in the Statement of Operations, and net assets were not affected by this reclassification.
The tax character of distributions paid during the years indicated was as follows:
Year Ended August 31, | | 2015 | | 2014 | |
Ordinary income | | $ | 32,302,700 | | | $ | 32,803,337 | | |
Long-term capital gains | | | 86,301,862 | | | | 26,911,118 | | |
Total | | | 118,604,562 | | | | 59,714,455 | | |
Short-term capital gain distributions, if any, are considered ordinary income distributions for tax purposes.
At August 31, 2015, the components of distributable earnings on a tax basis were as follows:
Undistributed ordinary income | | | 3,557,181 | | |
Capital loss carryforwards | | | (8,531,694 | ) | |
Net unrealized depreciation | | | (18,440,515 | ) | |
At August 31, 2015, the cost of investments for federal income tax purposes was $729,957,928 and the aggregate gross unrealized appreciation and depreciation based on that cost was:
Unrealized appreciation | | $ | 47,728,931 | | |
Unrealized depreciation | | | (66,169,446 | ) | |
Net unrealized depreciation | | | (18,440,515 | ) | |
The following capital loss carryforwards, determined at August 31, 2015, may be available to reduce taxable income arising from future net realized gains on investments, if any, to the extent permitted by the Internal Revenue Code:
Year of Expiration | | Amount ($) | |
2017 | | | 8,531,694 | | |
For the year ended August 31, 2015, $4,553,534 of capital loss carryforward was utilized and $119,355 was permanently lost.
Under current tax rules, regulated investment companies can elect to treat certain late-year ordinary losses incurred and post-October capital losses (capital losses realized after October 31) as arising on the first day of the following taxable year. As of August 31, 2015, the
Fund will elect to treat post-October capital losses of $266,063 as arising on September 1, 2015.
Management of the Fund has concluded that there are no significant uncertain tax positions in the Fund that would require recognition in the financial statements. However, management's conclusion may be subject to review and adjustment at a later date based on factors including, but not limited to, new tax laws, regulations, and administrative interpretations (including relevant court decisions). Generally, the Fund's federal tax returns for the prior three fiscal years remain subject to examination by the Internal Revenue Service.
Note 5. Portfolio Information
The cost of purchases and proceeds from sales of securities, excluding short-term investments and derivatives, if any, aggregated to $518,526,863 and $615,787,901, respectively, for the year ended August 31, 2015. The amount of purchase and sale activity impacts the portfolio turnover rate reported in the Financial Highlights.
Note 6. Affiliated Money Market Fund
The Fund invests in Columbia Short-Term Cash Fund, an affiliated money market fund established for the exclusive use by the Fund and other affiliated funds. The income earned by the Fund from such investments is included as Dividends — affiliated issuers in the Statement of Operations. As an investing fund, the Fund indirectly bears its proportionate share of the expenses of Columbia Short-Term Cash Fund.
Note 7. Line of Credit
The Fund has entered into a revolving credit facility with a syndicate of banks led by JPMorgan Chase Bank, N.A. whereby the Fund may borrow for the temporary funding of shareholder redemptions or for other temporary or emergency purposes. Pursuant to a December 9, 2014 amendment, the credit facility agreement, which is a collective agreement between the Fund and certain other funds managed by the Investment Manager, severally and not jointly, permits collective borrowings up to $550 million. Interest is charged to each participating fund based on its borrowings at a rate equal to the higher of (i) the overnight federal funds rate plus 1.00% or (ii) the one-month LIBOR rate plus 1.00%. Each borrowing under the credit facility matures no later than 60 days after the date of borrowing. The Fund also pays a commitment fee equal to its pro rata share of the amount of the credit facility at a rate of 0.075% per annum. The commitment
Annual Report 2015
35
COLUMBIA GLOBAL DIVIDEND OPPORTUNITY FUND
NOTES TO FINANCIAL STATEMENTS (continued)
August 31, 2015
fee is included in other expenses in the Statement of Operations. Prior to the December 9, 2014 amendment, the credit facility agreement permitted borrowings up to $500 million under the same terms and interest rates as described above.
The Fund had no borrowings during the year ended August 31, 2015.
Note 8. Significant Risks
Foreign Securities and Emerging Market Countries Risk
Investing in foreign securities may include certain risks and considerations not typically associated with investing in U.S. securities, such as fluctuating currency values and changing local and regional economic, political and social conditions, which may result in greater market volatility. In addition, certain foreign securities may not be as liquid as U.S. securities. Investing in emerging markets may accentuate these risks. These countries are also more likely to experience high levels of inflation, deflation or currency devaluation which could hurt their economies and securities markets. To the extent that the Fund concentrates its investment exposure to any one or a few specific countries, the Fund will be particularly susceptible to the various conditions, events or other factors impacting those countries and may, therefore, have a greater risk than that of a fund which is more geographically diversified.
Shareholder Concentration Risk
At August 31, 2015, affiliated shareholders of record owned 19.6% of the outstanding shares of the Fund in one or more accounts. Subscription and redemption activity by concentrated accounts may have a significant effect on the operations of the Fund. In the case of a large redemption, the Fund may be forced to sell investments at inopportune times, including its liquid or more liquid positions, resulting in Fund losses and the Fund holding a higher percentage of less liquid or illiquid securities. Large redemptions could result in decreased economies of scale and increased operating expenses for non-redeeming Fund shareholders.
Note 9. Subsequent Events
Management has evaluated the events and transactions that have occurred through the date the financial statements were issued and noted no items requiring adjustment of the financial statements or additional disclosure.
Note 10. Information Regarding Pending and Settled Legal Proceedings
In December 2005, without admitting or denying the allegations, American Express Financial Corporation (AEFC, which is now known as Ameriprise Financial, Inc. (Ameriprise Financial)) entered into settlement agreements with the Securities and Exchange Commission (SEC) and Minnesota Department of Commerce (MDOC) related to market timing activities. As a result, AEFC was censured and ordered to cease and desist from committing or causing any violations of certain provisions of the Investment Advisers Act of 1940, the Investment Company Act of 1940, and various Minnesota laws. AEFC agreed to pay disgorgement of $10 million and civil money penalties of $7 million. AEFC also agreed to retain an independent distribution consultant to assist in developing a plan for distribution of all disgorgement and civil penalties ordered by the SEC in accordance with various undertakings detailed at http://www.sec.gov/litigation/admin/ia-2451.pdf. Ameriprise Financial and its affiliates have cooperated with the SEC and the MDOC in these legal proceedings, and have made regular reports to the Funds' Boards of Trustees.
Ameriprise Financial and certain of its affiliates have historically been involved in a number of legal, arbitration and regulatory proceedings, including routine litigation, class actions, and governmental actions, concerning matters arising in connection with the conduct of their business activities. Ameriprise Financial believes that the Funds are not currently the subject of, and that neither Ameriprise Financial nor any of its affiliates are the subject of, any pending legal, arbitration or regulatory proceedings that are likely to have a material adverse effect on the Funds or the ability of Ameriprise Financial or its affiliates to perform under their contracts with the Funds. Ameriprise Financial is required to make quarterly (10-Q), annual (10-K) and, as necessary, 8-K filings with the SEC on legal and regulatory matters that relate to Ameriprise Financial and its affiliates. Copies of these filings may be obtained by accessing the SEC website at www.sec.gov.
There can be no assurance that these matters, or the adverse publicity associated with them, will not result in increased fund redemptions, reduced sale of fund shares or other adverse consequences to the Funds. Further, although we believe proceedings are not likely to have a material adverse effect on the Funds or the ability of Ameriprise Financial or its affiliates to perform under
Annual Report 2015
36
COLUMBIA GLOBAL DIVIDEND OPPORTUNITY FUND
NOTES TO FINANCIAL STATEMENTS (continued)
August 31, 2015
their contracts with the Funds, these proceedings are subject to uncertainties and, as such, we are unable to estimate the possible loss or range of loss that may result. An adverse outcome in one or more of these proceedings could result in adverse judgments, settlements, fines, penalties or other relief that could have a material adverse effect on the consolidated financial condition or results of operations of Ameriprise Financial.
Annual Report 2015
37
COLUMBIA GLOBAL DIVIDEND OPPORTUNITY FUND
REPORT OF INDEPENDENT REGISTERED PUBLIC ACCOUNTING FIRM
To the Trustees of Columbia Funds Series Trust I and the Shareholders of
Columbia Global Dividend Opportunity Fund
In our opinion, the accompanying statement of assets and liabilities, including the portfolio of investments, and the related statements of operations and of changes in net assets and the financial highlights present fairly, in all material respects, the financial position of Columbia Global Dividend Opportunity Fund (the "Fund," a series of Columbia Funds Series Trust I) at August 31, 2015, and the results of its operations, the changes in its net assets and the financial highlights for each of the periods indicated, in conformity with accounting principles generally accepted in the United States of America. These financial statements and financial highlights (hereafter referred to as "financial statements") are the responsibility of the Fund's management. Our responsibility is to express an opinion on these financial statements based on our audits. We conducted our audits of these financial statements in accordance with the standards of the Public Company Accounting Oversight Board (United States). Those standards require that we plan and perform the audit to obtain reasonable assurance about whether the financial statements are free of material misstatement. An audit includes examining, on a test basis, evidence supporting the amounts and disclosures in the financial statements, assessing the accounting principles used and significant estimates made by management, and evaluating the overall financial statement presentation. We believe that our audits, which included confirmation of securities at August 31, 2015 by correspondence with the custodian, brokers and transfer agent, provide a reasonable basis for our opinion.
PricewaterhouseCoopers LLP
Minneapolis, MN
October 22, 2015
Annual Report 2015
38
COLUMBIA GLOBAL DIVIDEND OPPORTUNITY FUND
FEDERAL INCOME TAX INFORMATION
(Unaudited)
The Fund hereby designates the following tax attributes for the fiscal year ended August 31, 2015. Shareholders will be notified in early 2016 of the amounts for use in preparing 2015 income tax returns.
Tax Designations:
| Qualified Dividend Income | | | 98.54 | % | |
| Dividends Received Deduction | | | 36.67 | % | |
Capital Gain Dividend | | $ | 104,711 | | |
Foreign Taxes Paid | | $ | 2,404,937 | | |
Foreign Taxes Paid Per Share | | $ | 0.06 | | |
Foreign Source Income | | $ | 29,053,641 | | |
Foreign Source Income Per Share | | $ | 0.67 | | |
Qualified Dividend Income. For taxable, non-corporate shareholders, the percentage of ordinary income distributed during the fiscal year that represents qualified dividend income subject to reduced tax rates.
Dividends Received Deduction. The percentage of ordinary income distributed during the fiscal year that qualifies for the corporate dividends received deduction.
Capital Gain Dividend. The Fund designates as a capital gain dividend the amount reflected above, or if subsequently determined to be different, the net capital gain of such fiscal period.
Foreign Taxes. The Fund makes the election to pass through to shareholders the foreign taxes paid. Eligible shareholders may claim a foreign tax credit. These taxes, and the corresponding foreign source income, are provided.
Annual Report 2015
39
COLUMBIA GLOBAL DIVIDEND OPPORTUNITY FUND
The Trustees serve terms of indefinite duration. The names and birth years of the Trustees and Officers of the Funds in Columbia Funds Series Trust I, the year each was first elected or appointed to office, their principal business occupations during at least the last five years, the number of Funds overseen by each Trustee and other directorships they hold are shown below. Each officer listed below serves as an officer of each Fund in Columbia Funds Series Trust I. The mailing address of each Trustee is: c/o Columbia Management Investment Advisers, LLC, 225 Franklin Street, Mail Drop BX32 05228, Boston, MA 02110.
Independent Trustees
Name, Year of Birth
and Position Held
with the Trust | | Year First
Appointed or
Elected as
Trustee to any
Fund Currently
in the Columbia
Funds Complex
or a Predecessor
Thereof | | Principal Occupation(s)
during the Past Five Years | | Number
of Funds
in the
Columbia
Funds
Complex
Overseen | | Other Directorships
Held by Trustee During
the Past Five Years | |
Janet Langford Carrig
(Born 1957)
Trustee | | | 1996 | | | Senior Vice President, General Counsel and Corporate Secretary, ConocoPhillips (integrated energy company) since September 2007; Deputy General Counsel — Corporate Legal Services, ConocoPhillips from August 2006 to August 2007; Partner, Zelle, Hofmann, Voelbel, Mason & Gette LLP (law firm) from March 2005 to July 2006; Adjunct Professor of Law, Northwestern University from September 2004 to June 2006; Director, UAL Corporation (airline) from February 2006 to July 2006; Chief Administrative Officer and Senior Vice President, Kmart Holding Corporation (consumer goods) from September 2003 to March 2004 | | | 60 | | | None | |
Douglas A. Hacker
(Born 1955)
Trustee and Chairman
of the Board | | | 1996 | | | Independent business executive since May 2006; Executive Vice President — Strategy of United Airlines from December 2002 to May 2006; President of UAL Loyalty Services (airline marketing company) from September 2001 to December 2002; Executive Vice President and Chief Financial Officer of United Airlines from July 1999 to September 2001 | | | 60 | | | Spartan Nash Company, (food distributor); Nash Finch Company (food distributor) from 2005 to 2013; Aircastle Limited (aircraft leasing); SeaCube Container Leasing Ltd. (container leasing) from 2010 to 2013; and Travelport Worldwide Limited (travel information technology) | |
Nancy T. Lukitsh
(Born 1956)
Trustee | | | 2011 | | | Senior Vice President, Partner and Director of Marketing, Wellington Management Company, LLP (investment adviser) from 1997 to 2010; Chair, Wellington Management Investment Portfolios (commingled non-U.S. investment pools) from 2007 to 2010; Director, Wellington Trust Company, NA and other Wellington affiliates from 1997 to 2010 | | | 60 | | | None | |
William E. Mayer
(Born 1940)
Trustee | | | 1991 | | | Partner, Park Avenue Equity Partners (private equity) since February 1999 | | | 60 | | | DynaVox Inc. (speech creation); Lee Enterprises (print media); WR Hambrecht + Co. (financial service provider) from 2000 to 2012; BlackRock Kelso Capital Corporation (investment company); and Premier, Inc. (healthcare) | |
Annual Report 2015
40
COLUMBIA GLOBAL DIVIDEND OPPORTUNITY FUND
TRUSTEES AND OFFICERS (continued)
Independent Trustees (continued)
Name, Year of Birth
and Position Held
with the Trust | | Year First
Appointed or
Elected as
Trustee to any
Fund Currently
in the Columbia
Funds Complex
or a Predecessor
Thereof | | Principal Occupation(s)
during the Past Five Years | | Number
of Funds
in the
Columbia
Funds
Complex
Overseen | | Other Directorships
Held by Trustee During
the Past Five Years | |
David M. Moffett
(Born 1952)
Trustee | | | 2011 | | | Retired. Consultant to Bridgewater and Associates; Chief Executive Officer, Federal Home Loan Mortgage Corporation, from 2008 to 2009; Senior Adviser, Global Financial Services Group, Carlyle Group, Inc., from 2007 to 2008; Vice Chairman and Chief Financial Officer, U.S. Bancorp, from 1993 to 2007 | | | 60 | | | Building Materials Holding Corp. (building materials and construction services); CIT Group Inc. (commercial and consumer finance); eBay Inc. (online trading community); E.W. Scripps Co. (print and television media); Genworth Financial, Inc. (financial and insurance products and services); MBIA Inc. (financial service provider); Paypal Holdings Inc. (payment and data processing services); and University of Oklahoma Foundation | |
Charles R. Nelson
(Born 1942)
Trustee | | | 1981 | | | Retired. Professor Emeritus, University of Washington since 2011; Professor of Economics, University of Washington from 1976 to 2011; Ford and Louisa Van Voorhis Professor of Political Economy, University of Washington from 1993 to 2011; Adjunct Professor of Statistics, University of Washington from 1980 to 2011; Associate Editor, Journal of Money, Credit and Banking from September 1993 to 2008; consultant on econometric and statistical matters | | | 60 | | | None | |
John J. Neuhauser
(Born 1943)
Trustee | | | 1984 | | | President, Saint Michael's College since August 2007; Director or Trustee of several non-profit organizations, including Fletcher Allen Health Care, Inc.; Academic Vice President and Dean of Faculties, Boston College from August 1999 to October 2005; University Professor, Boston College from November 2005 to August 2007 | | | 60 | | | Liberty All-Star Equity Fund and Liberty All-Star Growth Fund (closed-end funds) | |
Patrick J. Simpson
(Born 1944)
Trustee | | | 2000 | | | Partner, Perkins Coie LLP (law firm) | | | 60 | | | None | |
Anne-Lee Verville
(Born 1945)
Trustee | | | 1998 | | | Retired. General Manager, Global Education Industry from 1994 to 1997, President — Application Systems Division from 1991 to 1994, Chief Financial Officer — US Marketing & Services from 1988 to 1991, and Chief Information Officer from 1987 to 1988, IBM Corporation (computer and technology) | | | 60 | | | Enesco Group, Inc. (producer of giftware and home and garden decor products) from 2001 to 2006 | |
Annual Report 2015
41
COLUMBIA GLOBAL DIVIDEND OPPORTUNITY FUND
TRUSTEES AND OFFICERS (continued)
Interested Trustee Affiliate with Investment Manager*
Name, Year of Birth
and Position Held
with the Trust | | Year First
Appointed or
Elected as
Trustee to any
Fund Currently
in the Columbia
Funds Complex
or a Predecessor
Thereof | | Principal Occupation(s)
during the Past Five Years | | Number
of Funds
in the
Columbia
Funds
Complex
Overseen | | Other Directorships
Held by Trustee During
the Past Five Years | |
William F. Truscott
(Born 1960)
Trustee | | | 2012 | | | Chairman of the Board and President, Columbia Management Investment Advisers, LLC since May 2010 and February 2012, respectively (previously President and Chief Investment Officer, 2001-April 2010); Chief Executive Officer, Global Asset Management, Ameriprise Financial, Inc. since September 2012 (previously Chief Executive Officer, U.S. Asset Management & President, Annuities, May 2010-September 2012 and President — U.S. Asset Management and Chief Investment Officer, 2005-April 2010); Director and Chief Executive Officer, Columbia Management Investment Distributors, Inc. since May 2010 and February 2012, respectively (previously Chairman of the Board and Chief Executive Officer, 2006-April 2010); Chairman of the Board and Chief Executive Officer, RiverSource Distributors, Inc. since 2006; Director, Threadneedle Asset Management Holdings, SARL since 2014; President and Chief Executive Officer, Ameriprise Certificate Company, 2006-August 2012 | | | 187 | | | Chairman of the Board, Columbia Management Investment Advisers, LLC since May 2010; Director, Columbia Management Investment Distributors, Inc. since May 2010; Director, Ameriprise Certificate Company, 2006 to January 2013 | |
* Interested person (as defined under the 1940 Act) by reason of being an officer, director, security holder and/or employee of the Investment Manager or Ameriprise Financial.
The Statement of Additional Information has additional information about the Fund's Board members and is available, without charge, upon request by calling 800.345.6611; contacting your financial intermediary; or visiting columbiathreadneedle.com/us.
The Board has appointed officers who are responsible for day-to-day business decisions based on policies it has established. The officers serve at the pleasure of the Board. In addition to Mr. Truscott, who is Senior Vice President, the Funds' other officers are:
Fund Officers
Name,
Address and
Year of Birth | | Position and Year
First Appointed to
Position for any Fund
in the Columbia
Funds Complex or a
Predecessor Thereof | | Principal Occupation(s) During Past Five Years | |
Christopher O. Petersen
5228 Ameriprise
Financial Center
Minneapolis, MN 55474
Born 1970 | | President and Principal Executive Officer (2015) | | Vice President and Lead Chief Counsel, Ameriprise Financial, Inc. since January 2015 (previously, Vice President and Chief Counsel January 2010-December 2014; and Vice President and Group Counsel or Counsel 2004- January 2010); officer of Columbia Funds and affiliated funds since 2007. | |
Michael G. Clarke
225 Franklin Street
Boston, MA 02110
Born 1969 | | Treasurer (2011) and Chief Financial Officer (2009) | | Vice President — Mutual Fund Administration, Columbia Management Investment Advisers, LLC, since May 2010; Managing Director of Fund Administration, Columbia Management Advisors, LLC, September 2004-April 2010; senior officer of Columbia Funds and affiliated funds since 2002. | |
Annual Report 2015
42
COLUMBIA GLOBAL DIVIDEND OPPORTUNITY FUND
TRUSTEES AND OFFICERS (continued)
Fund Officers (continued)
Name,
Address and
Year of Birth | | Position and Year
First Appointed to
Position for any Fund
in the Columbia
Funds Complex or a
Predecessor Thereof | | Principal Occupation(s) During Past Five Years | |
Paul B. Goucher
100 Park Avenue
New York, NY 10017
Born 1968 | | Senior Vice President (2011), Chief Legal Officer (2015) and Assistant Secretary (2008) | | Vice President and Lead Chief Counsel, Ameriprise Financial, Inc. since November 2008 and January 2013, respectively (previously Chief Counsel, January 2010-January 2013 and Group Counsel, November 2008-January 2010). | |
Thomas P. McGuire
225 Franklin Street
Boston, MA 02110
Born 1972 | | Vice President and Chief Compliance Officer (2012) | | Vice President — Asset Management Compliance, Ameriprise Financial, Inc., since May 2010; Chief Compliance Officer, Ameriprise Certificate Company since September 2010; Compliance Executive, Bank of America, 2005-April 2010. | |
Colin Moore
225 Franklin Street
Boston, MA 02110
Born 1958 | | Senior Vice President (2010) | | Executive Vice President and Global Chief Investment Officer, Ameriprise Financial, Inc., since July 2013; Director and Global Chief Investment Officer, Columbia Management Investment Advisers, LLC since May 2010; Manager, Managing Director and Chief Investment Officer, Columbia Management Advisors, LLC, 2007-April 2010. | |
Michael E. DeFao
225 Franklin Street
Boston, MA 02110
Born 1968 | | Vice President (2011) and Assistant Secretary (2010) | | Vice President and Chief Counsel, Ameriprise Financial, Inc. since May 2010; Associate General Counsel, Bank of America, 2005-April 2010. | |
Joseph F. DiMaria
225 Franklin Street
Boston, MA 02110
Born 1968 | | Vice President (2011), Assistant Treasurer (2012) and Chief Accounting Officer (2008) | | Vice President — Mutual Fund Treasurer, Columbia Management Investment Advisers, LLC since May 2010; Director of Fund Administration, Columbia Management Advisors, LLC, 2006-April 2010. | |
Amy Johnson
5228 Ameriprise
Financial Center
Minneapolis, MN 55474
Born 1965 | | Vice President (2006) | | Managing Director and Chief Operating Officer, Columbia Management Investment Advisers, LLC since May 2010 (previously Chief Administrative Officer, 2009-April 2010, and Vice President — Asset Management and Trust Company Services, 2006-2009). | |
Lyn Kephart-Strong
5228 Ameriprise
Financial Center
Minneapolis, MN 55474
Born 1960 | | Vice President (2015) | | President, Columbia Management Investment Services Corp. since October 2014; Vice President & Resolution Officer, Ameriprise Trust Company since August 2009; President, RiverSource Service Corporation 2004-2010. | |
Ryan C. Larrenaga
225 Franklin Street
Boston, MA 02110
Born 1970 | | Vice President and Secretary (2015) | | Vice President and Group Counsel, Ameriprise Financial, Inc. since August 2011 (previously, Counsel from May 2010 to August 2011); Assistant General Counsel, Bank of America, 2005-April 2010; officer of Columbia Funds and affiliated funds since 2005. | |
Annual Report 2015
43
COLUMBIA GLOBAL DIVIDEND OPPORTUNITY FUND
BOARD CONSIDERATION AND APPROVAL OF ADVISORY AGREEMENT
On June 10, 2015, the Board of Trustees (the Board) and the Trustees who are not interested persons (as defined in the Investment Company Act of 1940) (the Independent Trustees) of Columbia Funds Series Trust I (the Trust) unanimously approved the continuation of the Investment Management Services Agreement (the Advisory Agreement) with Columbia Management Investment Advisers, LLC (the Investment Manager) with respect to Columbia Global Dividend Opportunity Fund (the Fund), a series of the Trust. The Board and the Independent Trustees also unanimously approved an agreement (the Management Agreement and, together with the Advisory Agreement, the Agreements) combining the Advisory Agreement and the Fund's existing administrative services agreement (the Administrative Services Agreement) in a single agreement. The Board and the Independent Trustees approved the restatement of the Advisory Agreement with the Management Agreement to be effective for the Fund on January 1, 2016, the Fund's next annual prospectus update. As detailed below, the Board's Advisory Fees and Expenses Committee (the Committee) and the Board met on multiple occasions to review and discuss, both among themselves and with the management team of the Investment Manager, materials provided by the Investment Manager and others before determining to approve the Management Agreement and the continuation of the Advisory Agreement.
In connection with their deliberations regarding the approval of the Management Agreement and the continuation of the Advisory Agreement, the Committee and the Board evaluated materials requested from the Investment Manager regarding the Fund and the Agreements, and discussed these materials with representatives of the Investment Manager at Committee meetings held on March 3, 2015, April 29, 2015 and June 9, 2015 and at Board meetings held on March 4, 2015 and June 10, 2015. In addition, the Board considers matters bearing on the Agreements at most of its other meetings throughout the year and meets regularly with senior management of the Trust and the Investment Manager. Through the Board's Investment Oversight Committees, Trustees also meet with selected portfolio managers of the funds the Trustees oversee and other investment personnel at various times throughout the year. The Committee and the Board also consulted with its independent fee consultant, Fund counsel and with the Independent Trustees' independent legal counsel, who advised on various matters with respect to the Committee's and the Board's considerations and otherwise assisted the Committee and the Board in their deliberations. On June 9, 2015, the Committee recommended that the Board approve the Management Agreement and the continuation of the Advisory Agreement. On June 10, 2015, the Board, including the Independent Trustees, voting separately, unanimously approved the Management Agreement and the continuation of the Advisory Agreement for the Fund.
The Committee and the Board considered all information that they, their legal counsel or the Investment Manager believed reasonably necessary to evaluate and to determine whether to approve the Management Agreement and the continuation of the Advisory Agreement. The information and factors considered by the Committee and the Board in recommending for approval or approving the Management Agreement and the continuation of the Advisory Agreement for the Fund included the following:
• Information on the investment performance of the Fund relative to the performance of a group of mutual funds determined to be comparable to the Fund by an independent third-party data provider, as well as performance relative to benchmarks;
• Information on the Fund's advisory fees and total expenses, including information comparing the Fund's expenses to those of a group of comparable mutual funds, as determined by the independent third-party data provider;
• The Investment Manager's agreement to contractually limit or cap total operating expenses for the Fund so that total operating expenses (excluding certain fees and expenses, such as portfolio transaction costs and certain other investment related expenses, interest, taxes, acquired fund fees and expenses, and extraordinary expenses) would not exceed a specified percentage of the Fund's average annual net assets from January 1, 2016 through December 31, 2016;
• The terms and conditions of the Agreements;
Annual Report 2015
44
COLUMBIA GLOBAL DIVIDEND OPPORTUNITY FUND
BOARD CONSIDERATION AND APPROVAL OF ADVISORY AGREEMENT (continued)
• The current and proposed terms and conditions of other agreements and arrangements with affiliates of the Investment Manager relating to the operations of the Fund, including the Administrative Services Agreement1 and agreements with respect to the provision of distribution and transfer agency services to the Fund;
• Descriptions of various functions performed by the Investment Manager under the Agreements, including portfolio management and portfolio trading practices;
• Information regarding the management fees and investment performance of similarly-managed portfolios of other clients of the Investment Manager, including institutional separate accounts;
• Information regarding the reputation, regulatory history and resources of the Investment Manager, including information regarding senior management, portfolio managers and other personnel;
• Information regarding the capabilities of the Investment Manager with respect to compliance monitoring services, including an assessment of the Investment Manager's compliance system by the Fund's Chief Compliance Officer; and
• The profitability to the Investment Manager and its affiliates from their relationships with the Fund.
Nature, Extent and Quality of Services Provided under the Agreements
The Committee and the Board considered the nature, extent and quality of services provided to the Fund by the Investment Manager and its affiliates under the Agreements and under separate agreements for the provision of transfer agency and administrative services, and the resources dedicated to the Fund and the other Columbia Funds by the Investment Manager and its affiliates. The Committee and the Board also determined that the nature and level of the services to be provided under the Management Agreement would not decrease relative to the services provided under the Advisory Agreement and the Administrative Services Agreement. The Committee and the Board considered, among other things, the Investment Manager's ability to attract, motivate and retain highly qualified research, advisory and supervisory investment professionals (including personnel and other resources, compensation programs for personnel involved in fund management, reputation and other attributes), the portfolio management services provided by those investment professionals, and the quality of the Investment Manager's investment research capabilities and trade execution services. The Committee and the Board also considered the potential benefits to shareholders of investing in a mutual fund that is part of a fund complex offering exposure to a variety of asset classes and investment disciplines and providing a variety of fund and shareholder services.
The Committee and the Board also considered the professional experience and qualifications of the senior personnel of the Investment Manager, which included consideration of the Investment Manager's experience with similarly-structured funds. The Committee and the Board noted the compliance programs of and the compliance-related resources provided to the Fund by the Investment Manager and its affiliates, and considered the Investment Manager's ability to provide administrative services to the Fund and coordinate the activities of the Fund's other service providers. In evaluating the nature, extent and quality of services provided under the Agreements, the Committee and the Board considered that these services were provided to the Fund, rather than directly to Fund shareholders. The Committee and the Board accordingly affirmed, after considering various other matters, including the potential benefits to the Fund and its shareholders of the Independent Trustees' important role as pre-suit gatekeepers with respect to claims that they may determine are meritless or contrary to the Fund's best interests, that it was not the intention of the Board or the Investment Manager that there be any third-party beneficiaries of the Agreements. After reviewing these and related factors, the Committee and the Board concluded, within the context of their overall conclusions, that the nature, extent and quality of the services provided to the Fund under the Agreements supported the approval of the Management Agreement and the continuation of the Advisory Agreement.
1 Like the Advisory Agreement, the Administrative Services Agreement will terminate with respect to the Fund once the Management Agreement is effective for the Fund.
Annual Report 2015
45
COLUMBIA GLOBAL DIVIDEND OPPORTUNITY FUND
BOARD CONSIDERATION AND APPROVAL OF ADVISORY AGREEMENT (continued)
Investment Performance
The Committee and the Board reviewed information about the performance of the Fund over various time periods, including performance information relative to benchmarks and information based on reports of the independent third-party data provider that compared the performance of the Fund to the performance of a group of comparable mutual funds, and data provided by the independent fee consultant. The Committee and the Board also reviewed a description of the third party's methodology for identifying the Fund's peer groups for purposes of performance and expense comparisons. Although the Fund's performance lagged that of a relevant peer group for certain (although not necessarily all) periods, the Committee and the Board concluded that other factors relevant to performance were sufficient, in light of other considerations, to warrant continuation of the Advisory Agreement and approval of the Management Agreement. Those factors included one or more of the following: (i) that the Fund's performance, although lagging in certain recent periods, was stronger over the longer term; (ii) that the underperformance was attributable, to a significant extent, to investment decisions that were reasonable and consistent with the Fund's investment strategy and policies and that the Fund was performing within a reasonable range of expectations, given those investment decisions, market conditions and the Fund's investment strategy; (iii) that the Fund's performance was competitive when compared to other relevant performance benchmarks or peer groups; and (iv) that the Investment Manager had taken or was taking steps designed to help improve the Fund's investment performance, including, but not limited to, replacing portfolio managers, enhancing the resources supporting the portfolio managers, or modifying investment strategies.
The Committee and the Board noted that, through December 31, 2014, the Fund's performance was in the seventy-seventh, forty-sixth and fifty-third percentile (where the best performance would be in the first percentile) of its category selected by the independent third-party data provider for the purposes of performance comparisons for the one-, three- and five- year periods, respectively.
The Committee and the Board also considered the Investment Manager's performance and reputation generally, the Investment Manager's historical responsiveness to Board concerns about performance, and the Investment Manager's willingness to take steps intended to improve performance. After reviewing these and related factors, the Committee and the Board concluded, within the context of their overall conclusions, that the performance of the Fund was sufficient, in light of other considerations, to warrant the continuation of the Advisory Agreement and the approval of the Management Agreement.
Investment Advisory Fee Rates and Other Expenses
The Committee and the Board considered the advisory fees charged to the Fund under the Advisory Agreement as well as the total expenses incurred by the Fund. In assessing the reasonableness of the fees under the Advisory Agreement, the Committee and the Board considered, among other information, the Fund's advisory fee and its total expense ratio as a percentage of average daily net assets. The Committee and the Board also considered that the proposed management fee would not exceed the sum of the fee rates payable under the Advisory Agreement and the Administrative Services Agreement. The Committee and the Board considered data provided by the independent fee consultant. The Committee and the Board noted that, as of December 31, 2014, the Fund's actual management fee and net expense ratio are ranked in the first and third quintiles, respectively, (where the lowest fees and expenses would be in the first quintile) against the Fund's expense universe as determined by the independent third-party data provider for purposes of expense comparison. The Committee and the Board also took into account the fee waiver and expense limitation arrangements agreed to by the Investment Manager, as noted above.
The Committee and the Board also received and considered information about the advisory fees charged by the Investment Manager to institutional separate accounts. In considering the fees charged to those accounts, the Committee and the Board took into account, among other things, the Investment Manager's representations about the differences between managing mutual funds as compared to other types of accounts, including differences in the services provided, differences in the risk profile of such business for the Investment Manager and the additional resources required to manage mutual funds effectively. The Committee and the Board also received and considered information about the fees charged by the Investment Manager for sub-advisory services
Annual Report 2015
46
COLUMBIA GLOBAL DIVIDEND OPPORTUNITY FUND
BOARD CONSIDERATION AND APPROVAL OF ADVISORY AGREEMENT (continued)
provided to comparable unaffiliated funds. In evaluating the Fund's advisory fees, the Committee and the Board also took into account the demands, complexity and quality of the investment management of the Fund.
After reviewing these and related factors, the Committee and the Board concluded, within the context of their overall conclusions, that the advisory/management fee rates and expenses of the Fund were sufficient, in light of other considerations, to warrant the approval of the Management Agreement and continuation of the Advisory Agreement.
Costs of Services Provided and Profitability
The Committee and the Board also took note of the costs the Investment Manager and its affiliates incur in connection with the services provided (both on an absolute and relative basis) and the profitability to the Investment Manager and its affiliates in connection with their relationships with the Fund.
The Committee and the Board also considered the compensation directly or indirectly received by the Investment Manager's affiliates in connection with their relationships with the Fund. The Committee and the Board reviewed information provided by management as to the profitability to the Investment Manager and its affiliates of their relationships with the Fund, information about the allocation of expenses used to calculate profitability, and comparisons of profitability levels realized in 2014 to profitability levels realized in 2013. When reviewing profitability, the Committee and the Board also considered court cases in which adviser profitability was an issue in whole or in part, the performance of similarly managed funds, the performance of the Fund, and the expense ratio of the Fund. The Committee and the Board also considered information provided by the Investment Manager regarding the Investment Manager's financial condition and comparing its profitability to that of other asset management firms that are, or are subsidiaries of, publicly traded companies.
After reviewing these and related factors, the Committee and the Board concluded, within the context of their overall conclusions, that the costs of services provided and the profitability to the Investment Manager and its affiliates from their relationships with the Fund supported the approval of the Management Agreement and the continuation of the Advisory Agreement.
Economies of Scale
The Committee and the Board considered the potential existence of economies of scale in the provision by the Investment Manager of services to the Fund, to groups of related funds, and to the Investment Manager's investment advisory clients as a whole, and whether those economies of scale were shared with the Fund through breakpoints in investment advisory fees or other means, such as expense limitation arrangements and additional investments by the Investment Manager in investment, trading and compliance resources. The Committee and the Board noted that the investment advisory and management fee schedules for the Fund contained breakpoints that would reduce the fee rate on assets above specified threshold levels.
In considering these matters, the Committee and the Board also considered the costs of the services provided and the profitability to the Investment Manager and its affiliates from their relationships with the Fund, as discussed above. After reviewing these and related factors, the Committee and the Board concluded, within the context of their overall conclusions, that the extent to which any economies of scale were expected to be shared with the Fund supported the approval of the Management Agreement and the continuation of the Advisory Agreement.
Other Benefits to the Investment Manager
The Committee and the Board received and considered information regarding "fall-out" or ancillary benefits received by the Investment Manager and its affiliates as a result of their relationships with the Fund, such as the engagement of the Investment Manager to provide administrative services to the Fund and the engagement of the Investment Manager's affiliates to provide distribution and transfer agency services to the Fund. In this regard, among other matters, the Committee and the Board considered that the Fund's distributor retains a portion of the distribution fees from the Fund and receives a portion of the sales charges on sales or redemptions of certain classes of shares of the Fund. The Committee and the Board also considered the benefits of research made available to the Investment Manager by reason of brokerage commissions generated by the
Annual Report 2015
47
COLUMBIA GLOBAL DIVIDEND OPPORTUNITY FUND
BOARD CONSIDERATION AND APPROVAL OF ADVISORY AGREEMENT (continued)
Fund's securities transactions, and reviewed information about the Investment Manager's practices with respect to allocating portfolio transactions for brokerage and research services. The Committee and the Board considered the possible conflicts of interest associated with certain fall-out or other ancillary benefits and the reporting, disclosure and other processes that are in place to address such possible conflicts of interest. The Committee and the Board recognized that the Investment Manager's profitability would be somewhat lower without these benefits.
Conclusion
The Committee and the Board reviewed all of the above considerations in reaching their decisions to recommend or approve the Management Agreement and the continuation of the Advisory Agreement. In their deliberations, the Trustees did not identify any particular information that was all-important or controlling, and individual Trustees may have attributed different weights to the various factors. Based on their evaluation of all factors that they deemed to be material, including those factors described above, and assisted by the advice of independent legal counsel, the Board, including the Independent Trustees, voting separately, unanimously approved the Management Agreement and the continuation of the Advisory Agreement.
Annual Report 2015
48
COLUMBIA GLOBAL DIVIDEND OPPORTUNITY FUND
IMPORTANT INFORMATION ABOUT THIS REPORT
Each fund mails one shareholder report to each shareholder address. If you would like more than one report, please call shareholder services at 800.345.6611 and additional reports will be sent to you.
The policy of the Board is to vote the proxies of the companies in which each fund holds investments consistent with the procedures as stated in the Statement of Additional Information (SAI). You may obtain a copy of the SAI without charge by calling 800.345.6611; contacting your financial intermediary; visiting columbiathreadneedle.com/us; or searching the website of the Securities and Exchange Commission (SEC) at sec.gov. Information regarding how each fund voted proxies relating to portfolio securities is filed with the SEC by August 31st for the most recent 12-month period ending June 30th of that year, and is available without charge by visiting columbiathreadneedle.com/us, or searching the website of the SEC at sec.gov.
Each fund files a complete schedule of portfolio holdings with the SEC for the first and third quarters of each fiscal year on Form N-Q. Each fund's Form N-Q is available on the SEC's website at sec.gov and may be reviewed and copied at the SEC's Public Reference Room in Washington, D.C. Information on the operation of the Public Reference Room may be obtained by calling 800.SEC.0330. Each fund's complete schedule of portfolio holdings, as filed on Form N-Q, can also be obtained without charge, upon request, by calling 800.345.6611.
Annual Report 2015
49
Columbia Global Dividend Opportunity Fund
P.O. Box 8081
Boston, MA 02266-8081

This information is for use with concurrent or prior delivery of a fund prospectus. Please read and consider the investment objectives, risks, charges and expenses for any fund carefully before investing. For a prospectus and summary prospectus, which contains this and other important information about the Fund, go to columbiathreadneedle.com/us. The Fund is distributed by Columbia Management Investment Distributors, Inc., member FINRA, and managed by Columbia Management Investment Advisers, LLC.
Columbia Threadneedle Investments (Columbia Threadneedle) is the global brand name of the Columbia and Threadneedle group of companies.
All rights reserved. Columbia Management Investment Distributors, Inc., 225 Franklin Street, Boston, MA 02110-2804
© 2015 Columbia Management Investment Advisers, LLC.
columbiathreadneedle.com/us
ANN154_08_E01_(10/15)

ANNUAL REPORT
August 31, 2015

COLUMBIA MID CAP GROWTH FUND

ABOUT COLUMBIA THREADNEEDLE INVESTMENTS
Columbia Threadneedle Investments is a leading global asset management group that provides a broad range of actively managed investment strategies and solutions for individual, institutional and corporate clients around the world.
With more than 2,000 people, including over 450 investment professionals based in North America, Europe and Asia, we manage $503 billion* of assets across developed and emerging market equities, fixed income, asset allocation solutions and alternatives. We are the 13th largest manager of long-term mutual fund assets in the U.S.** and the 4th largest manager of retail funds in the U.K.***
Our priority is the investment success of our clients. We aim to deliver the investment outcomes they expect through an investment approach that is team-based, performance-driven and risk-aware. Our culture is dynamic and interactive. By sharing our insights across asset classes and geographies, we generate richer perspectives on global, regional and local investment landscapes. The ability to exchange and debate investment ideas in a collaborative environment enriches our teams' investment processes. More importantly, it results in better informed investment decisions for our clients.
Columbia funds are distributed by Columbia Management Investment Distributors, Inc., member FINRA, and managed by Columbia Management Investment Advisers, LLC.
Columbia Threadneedle Investments (Columbia Threadneedle) is the global brand name of the Columbia and Threadneedle group of companies.
* In U.S. dollars as of June 30, 2015. Source: Ameriprise Q2 Earnings Release. Includes all assets managed by entities in the Columbia and Threadneedle groups of companies. Contact us for more current data.
** Source: ICI as of June 30, 2015 for Columbia Management Investment Advisers, LLC.
*** Source: Investment Association as of June 2015 for Threadneedle Asset Management Limited.
© 2015 Columbia Management Investment Advisers, LLC. All rights reserved.
Not part of the shareholder report
Get the market insight you need from our investment experts
Connect with Columbia Threadneedle Investments
Investor insight
Find economic and market commentary, investment videos, white papers, mutual fund commentary and more at columbiathreadneedle.com/us.
Columbia Threadneedle Investor Newsletter (e-newsletter)
Read our award-winning* shareholder newsletter. Our quarterly newsletter is available online and provides timely and relevant content about economic trends, fund news, service enhancements and changes. Sign up to receive the newsletter electronically at columbiathreadneedle.com/
us/newsletter.
Investment videos
Get analysis of current events and trends that may affect your investments. Visit our online video library to watch and discover what our thought leaders are saying about the financial markets and economy.
Social media
We offer you multiple ways to access our market commentary and investment insights.
n Perspectives blog at columbiathreadneedle.com/us
Read timely posts by our investment team, including our chief investment officer, chief economist and portfolio managers.
n twitter.com/CTinvest_US
Follow us on Twitter for quick, up-to-the-minute comments on market news and more.
n youtube.com/CTinvestUS
View our commentaries on the economy, markets and current investment opportunities.
n linkedin.com/company/columbia-threadneedle-investments-us
Connect with us on LinkedIn for updates from our thought leaders.
*Columbia Threadneedle Investor Newsletter was awarded top honors in the Mutual Fund Education Alliance STAR Awards competition for excellence in mutual fund marketing and communications in 2011, 2012 and 2013. Materials in the competition were evaluated on educational value, message comprehension, effective design and objectives.
Not part of the shareholder report
Stay informed
Become a subscriber to receive the latest investment publications and mutual fund commentaries
Subscribe to Columbia Threadneedle Investments
Email subscription center
Subscribe to the latest information from Columbia Threadneedle. Visit our email subscription center at columbiathreadneedle.com/us/subscribe to register for economic and market commentary, product and service updates, white papers and more.
n Columbia Threadneedle Investor Newsletter
Quarterly newsletter featuring the latest macro- and micro-economic trends, investment themes, products, service changes and other items of interest to our investors
n Investment Strategy Outlook
Quarterly publication featuring the Columbia Threadneedle Asset Allocation Team's perspective on global economic investment conditions and markets
n MarketTrack
Quarterly publication featuring more than 40 charts and graphs that highlight the current state of the economy and the markets; includes straightforward insight on current investment opportunities
n White papers
Frequent articles that delve deep into a variety of investment topics
n Mutual fund updates
Quarterly portfolio manager commentary and fund fact sheets available for Columbia funds. (Not all funds have a commentary.)
Register your information online at columbiathreadneedle.com/us/subscribe and select the publications you would like to receive. Update your subscriptions at any time by accessing the email subscription center.
 Dear Shareholder,
Today's investors are typically focused on outcomes, like living a certain retirement lifestyle, paying for college education or building a legacy. But in today's complex global investment landscape, even simple goals are not easily achieved.
At Columbia Threadneedle Investments, we aspire to help satisfy five core needs of today's investors:
n Generate an appropriate stream of income in retirement
Traditional approaches to generating income may not provide the diversification benefits they once did, and they may actually introduce unwanted risk in today's market. To seek to improve your potential to live comfortably long term, we endeavor to pursue investments that explore less traveled paths to income.
n Navigate a changing interest rate environment
Today's uncertain market environment includes the prospect of a rise in interest rates. Blending traditional investments with non-traditional or alternative products may help protect your wealth during periods of volatility. We can attempt to help strengthen your portfolio with agile products designed to take on the market's ups and downs.
n Maximize after-tax returns
In an environment where what you keep may be more important than what you earn, municipal bonds can help mitigate high tax burdens while providing potentially attractive yields. Our state and federal tax-exempt products are aimed at helping investors manage risk, minimize the fluctuation of capital and grow wealth on a more tax-efficient basis.
n Grow assets to achieve financial goals
We believe that finding and protecting growth comes from a disciplined security selection process designed to create excess return. Our goal is to provide investment solutions built to help you face today's market challenges and grow your assets at each crossroad of your journey.
n Ease the impact of volatile markets
Despite a bull market run that has benefited many investors over the past several years, it's important to remember the lessons of 2008 and the value that a well-diversified portfolio may provide through times of market volatility. We are here to help you hold onto the savings you have worked tirelessly to amass, and to provide you the best opportunity to maintain your standard of living regardless of market conditions.
Find out today how we can help you confidently invest to realize your dreams. Please visit us at blog.columbiathreadneedleus.com/our-best-ideas to learn more about our unique investment solutions.
The world is constantly changing, but our priority remains the same: to help you secure your finances, meet your goals and achieve success. Thank you for your continued investment with us.
Sincerely,

Christopher O. Petersen
President, Columbia Funds
Investors should consider the investment objectives, risks, charges and expenses of a mutual fund carefully before investing. For a free prospectus and summary prospectus, which contains this and other important information about a fund, visit columbiathreadneedle.com/us. The prospectus should be read carefully before investing.
Columbia Funds are distributed by Columbia Management Investment Distributors, Inc., member FINRA, and managed by Columbia Management Investment Advisers, LLC.
© 2015 Columbia Management Investment Advisers, LLC. All rights reserved.
COLUMBIA MID CAP GROWTH FUND
Fund Investment Manager
Columbia Management Investment
Advisers, LLC
225 Franklin Street
Boston, MA 02110
Fund Distributor
Columbia Management Investment
Distributors, Inc.
225 Franklin Street
Boston, MA 02110
Fund Transfer Agent
Columbia Management Investment
Services Corp.
P.O. Box 8081
Boston, MA 02266-8081
For more information about any of the funds, please visit columbiathreadneedle.com/us or call 800.345.6611. Customer Service Representatives are available to answer your questions Monday through Friday from 8 a.m. to 7 p.m. Eastern time.
The views expressed in this report reflect the current views of the respective parties. These views are not guarantees of future performance and involve certain risks, uncertainties and assumptions that are difficult to predict, so actual outcomes and results may differ significantly from the views expressed. These views are subject to change at any time based upon economic, market or other conditions and the respective parties disclaim any responsibility to update such views. These views may not be relied on as investment advice and, because investment decisions for a Columbia fund are based on numerous factors, may not be relied on as an indication of trading intent on behalf of any particular Columbia fund. References to specific securities should not be construed as a recommendation or investment advice.
Performance Overview | | | 3 | | |
Manager Discussion of Fund Performance | | | 5 | | |
Understanding Your Fund's Expenses | | | 7 | | |
Portfolio of Investments | | | 8 | | |
Statement of Assets and Liabilities | | | 13 | | |
Statement of Operations | | | 16 | | |
Statement of Changes in Net Assets | | | 17 | | |
Financial Highlights | | | 20 | | |
Notes to Financial Statements | | | 32 | | |
Report of Independent Registered
Public Accounting Firm | | | 40 | | |
Federal Income Tax Information | | | 41 | | |
Trustees and Officers | | | 42 | | |
Board Consideration and Approval of Advisory Agreement | | | 46 | | |
Important Information About This Report | | | 51 | | |
COLUMBIA MID CAP GROWTH FUND
Performance Summary
n Columbia Mid Cap Growth Fund (the Fund) Class A shares returned 5.33% excluding sales charges for the 12-month period that ended August 31, 2015.
n The Fund outperformed its benchmarks, the Russell Midcap Growth Index and the Russell Midcap Index, which returned 2.46% and 0.02%, respectively.
n Stock selection in information technology and financials enhanced relative performance. Stock selection was positive across all sectors for the period.
Average Annual Total Returns (%) (for period ended August 31, 2015)
| | | Inception | | 1 Year | | 5 Years | | 10 Years | |
Class A | | 11/01/02 | | | | | | | | | | | | | |
Excluding sales charges | | | | | | | 5.33 | | | | 14.50 | | | | 8.62 | | |
Including sales charges | | | | | | | -0.73 | | | | 13.16 | | | | 7.98 | | |
Class B | | 11/01/02 | | | | | | | | | | | | | |
Excluding sales charges | | | | | | | 4.54 | | | | 13.64 | | | | 7.81 | | |
Including sales charges | | | | | | | 0.18 | | | | 13.40 | | | | 7.81 | | |
Class C | | 10/13/03 | | | | | | | | | | | | | |
Excluding sales charges | | | | | | | 4.56 | | | | 13.65 | | | | 7.81 | | |
Including sales charges | | | | | | | 3.69 | | | | 13.65 | | | | 7.81 | | |
Class I* | | 09/27/10 | | | 5.88 | | | | 15.02 | | | | 9.00 | | |
Class K* | | 02/28/13 | | | 5.45 | | | | 14.66 | | | | 8.77 | | |
Class R* | | 01/23/06 | | | 5.06 | | | | 14.21 | | | | 8.35 | | |
Class R4* | | 11/08/12 | | | 5.61 | | | | 14.77 | | | | 8.88 | | |
Class R5* | | 03/07/11 | | | 5.72 | | | | 14.93 | | | | 8.96 | | |
Class T | | 11/01/02 | | | | | | | | | | | | | |
Excluding sales charges | | | | | | | 5.34 | | | | 14.45 | | | | 8.57 | | |
Including sales charges | | | | | | | -0.73 | | | | 13.11 | | | | 7.93 | | |
Class W* | | 09/27/10 | | | 5.32 | | | | 14.50 | | | | 8.63 | | |
Class Y* | | 07/15/09 | | | 5.83 | | | | 14.95 | | | | 8.98 | | |
Class Z | | 11/20/85 | | | 5.58 | | | | 14.79 | | | | 8.89 | | |
Russell Midcap Growth Index | | | | | | | 2.46 | | | | 17.13 | | | | 8.66 | | |
Russell Midcap Index | | | | | | | 0.02 | | | | 16.56 | | | | 8.40 | | |
Returns for Class A and Class T are shown with and without the maximum initial sales charge of 5.75%. Returns for Class B are shown with and without the applicable contingent deferred sales charge (CDSC) of 5.00% in the first year, declining to 1.00% in the sixth year and eliminated thereafter. Returns for Class C are shown with and without the 1.00% CDSC for the first year only. The Fund's other classes are not subject to sales charges and have limited eligibility. Please see the Fund's prospectus for details. Performance for different share classes will vary based on differences in sales charges and fees associated with each class. All results shown assume reinvestment of distributions during the period. Returns do not reflect the deduction of taxes that a shareholder may pay on Fund distributions or on the redemption of Fund shares. Performance results reflect the effect of any fee waivers or reimbursements of Fund expenses by Columbia Management Investment Advisers, LLC and/or any of its affiliates. Absent these fee waivers or expense reimbursement arrangements, performance results would have been lower.
The performance information shown represents past performance and is not a guarantee of future results. The investment return and principal value of your investment will fluctuate so that your shares, when redeemed, may be worth more or less than their original cost. Current performance may be lower or higher than the performance information shown. You may obtain performance information current to the most recent month-end by contacting your financial intermediary, visiting columbiathreadneedle.com/us or calling 800.345.6611.
*The returns shown for periods prior to the share class inception date (including returns for the Life of the Fund, if shown, which are since Fund inception) include the returns of the Fund's oldest share class. These returns are adjusted to reflect any higher class-related operating expenses of the newer share classes, as applicable. Please visit columbiathreadneedle.com/us/investment-products/mutual-funds/appended-performance for more information.
The Russell Midcap Growth Index, an unmanaged index, measures the performance of those Russell Midcap Index companies with higher price-to-book ratios and forecasted growth values.
The Russell Midcap Index, an unmanaged index, measures the performance of the 800 smallest companies in the Russell 1000 Index, which represents approximately 25% of the total market capitalization of the Russell 1000 Index.
Indices are not available for investment, are not professionally managed and do not reflect sales charges, fees, brokerage commissions, taxes or other expenses of investing. Securities in the Fund may not match those in an index.
Annual Report 2015
3
COLUMBIA MID CAP GROWTH FUND
PERFORMANCE OVERVIEW (continued)
Performance of a Hypothetical $10,000 Investment (September 1, 2005 – August 31, 2015)

The chart above shows the change in value of a hypothetical $10,000 investment in Class A shares of Columbia Mid Cap Growth Fund during the stated time period, and does not reflect the deduction of taxes that a shareholder may pay on Fund distributions or on the redemption of Fund shares.
Annual Report 2015
4
COLUMBIA MID CAP GROWTH FUND
MANAGER DISCUSSION OF FUND PERFORMANCE
For the 12-month period that ended August 31, 2015, the Fund's Class A shares returned 5.33% excluding sales charges. The Fund outperformed both the Russell Midcap Growth Index and the Russell Midcap Index, which returned 2.46% and 0.02%, respectively. Stock selection in information technology and financials enhanced relative performance. Stock selection was positive across all sectors for the period.
Markets Turn Volatile as Pressures Mount
The pace of U.S. economic growth fluctuated during the 12-month period that ended August 31, 2015. Another stormy winter in the Northeast and Midwest whittled away at gross domestic product (GDP) early in 2015. A strong dollar, a widening trade deficit and declining oil prices also negatively affected growth. Yet most of these setbacks proved to be temporary and the U.S. economy rebounded as temperatures thawed. An average of 243,000 new jobs were added monthly to the U.S. workforce, driving the unemployment rate down to 5.1% and bolstering consumer confidence. Manufacturing activity was solid even though the pace of manufacturing growth slowed over the year and industrial production lost ground in August. Mining activity has shrunk in response to a downturn in oil drilling. Home sales were robust. However, stubbornly low inventory levels and rising prices have kept many first-time buyers out of the market.
As concerns mounted about a sluggish global economy, weakening growth in China and the timing of a Federal Reserve (Fed) interest rate hike, the financial markets turned volatile. Solid stock market gains in the first half of the 12-month period were all but wiped out in the second half. Large-cap stocks edged out mid-cap and small-cap stocks, while growth stocks significantly outperformed value stock.
Stock Selection Aided Fund Results
Stock selection in the information technology and financials sectors contributed most to the Fund's performance advantage relative to the Russell Midcap Growth Index. In information technology, video game makers Activision Blizzard and Electronic Arts were the top contributors. Both companies continued their surge of margin growth, strong earnings and improved outlooks for 2015. Holiday game sales were higher, and the major industry trend toward online gaming continued. Both game makers develop games that take advantage of that shift.
Also in the information technology sector, Concur Technologies and Skyworks Solutions were top contributors. Concur Technologies is a provider of cloud-based travel and expense management software. The stock rallied on news that enterprise software giant SAP SE planned to acquire Concur at a significant premium. Skyworks Solutions is a leading supplier of radio frequency integrated circuits (RFICs) and other semiconductors for the wireless handset market, especially Apple iPhones. After handily beating earnings estimates for several quarters in a row, Skyworks Solutions rallied on strong demand for the iPhone 6, which will be released in the fall of 2015.
Sherwin-Williams, in the materials sector, was another top contributor. The manufacturer and distributor of paint products provided updated earnings
Portfolio Management
George Myers, CFA
Brian Neigut
James King
William Chamberlain, CFA
Morningstar Style BoxTM
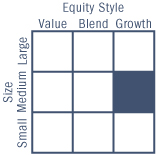
The Morningstar Style Box(TM) is based on a fund's portfolio holdings. For equity funds, the vertical axis shows the market capitalization of the stocks owned, and the horizontal axis shows investment style (value, blend, or growth). Information shown is based on the most recent data provided by Morningstar.
©2015 Morningstar, Inc. All rights reserved. The Morningstar information contained herein: (1) is proprietary to Morningstar and/or its content providers; (2) may not be copied or distributed; and (3) is not warranted to be accurate, complete or timely. Neither Morningstar nor its content providers are responsible for any damages or losses arising from any use of this information.
Top Ten Holdings (%)
(at August 31, 2015) | |
Activision Blizzard, Inc. | | | 2.5 | | |
Sherwin-Williams Co. (The) | | | 2.2 | | |
SBA Communications Corp., Class A | | | 2.0 | | |
Southwest Airlines Co. | | | 1.8 | | |
McGraw Hill Financial, Inc. | | | 1.7 | | |
Electronic Arts, Inc. | | | 1.5 | | |
Alliance Data Systems Corp. | | | 1.5 | | |
Foot Locker, Inc. | | | 1.5 | | |
Signature Bank | | | 1.4 | | |
L Brands, Inc. | | | 1.4 | | |
Percentages indicated are based upon total investments (excluding Money Market Funds).
For further detail about these holdings, please refer to the section entitled "Portfolio of Investments."
Fund holdings are as of the date given, are subject to change at any time, and are not recommendations to buy or sell any security.
Annual Report 2015
5
COLUMBIA MID CAP GROWTH FUND
MANAGER DISCUSSION OF FUND PERFORMANCE (continued)
Portfolio Breakdown (%)
(at August 31, 2015) | |
Common Stocks | | | 95.6 | | |
Money Market Funds | | | 4.4 | | |
Total | | | 100.0 | | |
Percentages indicated are based upon total investments. The Fund's portfolio composition is subject to change.
Equity Sector Breakdown (%)
(at August 31, 2015) | |
Consumer Discretionary | | | 23.8 | | |
Consumer Staples | | | 7.4 | | |
Energy | | | 1.7 | | |
Financials | | | 11.0 | | |
Health Care | | | 14.3 | | |
Industrials | | | 14.6 | | |
Information Technology | | | 18.3 | | |
Materials | | | 6.2 | | |
Telecommunication Services | | | 2.0 | | |
Utilities | | | 0.7 | | |
Total | | | 100.0 | | |
Percentages indicated are based upon total equity investments. The Fund's portfolio composition is subject to change.
Investment Risks
Market risk may affect a single issuer, sector of the economy, industry or the market as a whole. Growth securities, at times, may not perform as well as value securities or the stock market in general and may be out of favor with investors. Foreign investments subject the Fund to risks, including political, economic, market, social and others within a particular country, as well as to currency instabilities and less stringent financial and accounting standards generally applicable to U.S. issuers. Investments in mid-cap companies involve risks and volatility greater than investments in larger, more established companies. The Fund may invest significantly in issuers within a particular sector, which may be negatively affected by market, economic or other conditions, making the Fund more vulnerable to unfavorable developments in the sector. See the Fund's prospectus for information on these and other risks.
guidance that confirmed significant top-line/bottom-line momentum throughout 2015. In addition, the company announced a new paint line available through Lowe's stores. We think that Sherwin-Williams earnings could do especially well if the price of oil and other raw materials remain low.
Even though stock selection was positive in all sectors, there were certain individual names that detracted from relative results. Kirby, United Rentals and Cameron International were three such disappointments. Kirby is a marine transportation company that provides tow and barge services for liquid cargo on the Mississippi River and the Gulf Intracoastal Waterway and services diesel engines. Adverse weather conditions on the Gulf Coast and pricing concerns hurt the inland marine segment and declining oil prices curtailed growth in the land-based diesel engine services market. United Rentals is an equipment rental company, with 900 rental locations in the United States and Canada. Weather disruptions, foreign currency headwinds and weakness in the energy end markets were a drag on results.
Almost all of the Fund's energy sector names detracted from performance for the period, especially Continental Resources, Cameron International, Cabot Oil & Gas and FMC Technologies. A strengthening U.S. dollar, increasing supply and lower demand driven by fears of a global economic slowdown negatively affected the energy markets. Oil prices declined sharply and left the energy sector down more than 40% for the period.
Looking Ahead
We see three challenges facing markets that intersect, which were brought into sharp focus by the recent Chinese currency devaluation. First, the equity market is still processing the implications of a big increase in energy supply brought to market by U.S. shale producers. Second, improved economic data has put pressure on the Fed to raise short-term interest rates. Third, China's economy continues to slow, which has put additional pressure on commodity prices and resulted in a collapse in the value of Chinese domestic equities and equities around the globe. We believe that the recent market correction provides investors with a better entry point for building positions in long-term assets. Against that backdrop, we believe the Fund is currently well positioned to benefit from our bottom-up, fundamental research process, which favors high quality companies with sustainable growth prospects and high or improving margins and returns on invested capital.
Annual Report 2015
6
COLUMBIA MID CAP GROWTH FUND
UNDERSTANDING YOUR FUND'S EXPENSES
(Unaudited)
As an investor, you incur two types of costs. There are transaction costs, which generally include sales charges on purchases and may include redemption fees. There are also ongoing costs, which generally include management fees, distribution and/or service fees, and other fund expenses. The following information is intended to help you understand your ongoing costs (in dollars) of investing in the Fund and to help you compare these costs with the ongoing costs of investing in other mutual funds.
Analyzing Your Fund's Expenses
To illustrate these ongoing costs, we have provided examples and calculated the expenses paid by investors in each share class of the Fund during the period. The actual and hypothetical information in the table is based on an initial investment of $1,000 at the beginning of the period indicated and held for the entire period. Expense information is calculated two ways and each method provides you with different information. The amount listed in the "Actual" column is calculated using the Fund's actual operating expenses and total return for the period. You may use the Actual information, together with the amount invested, to estimate the expenses that you paid over the period. Simply divide your account value by $1,000 (for example, an $8,600 account value divided by $1,000 = 8.6), then multiply the results by the expenses paid during the period under the "Actual" column. The amount listed in the "Hypothetical" column assumes a 5% annual rate of return before expenses (which is not the Fund's actual return) and then applies the Fund's actual expense ratio for the period to the hypothetical return. You should not use the hypothetical account values and expenses to estimate either your actual account balance at the end of the period or the expenses you paid during the period. See "Compare With Other Funds" below for details on how to use the hypothetical data.
Compare With Other Funds
Since all mutual funds are required to include the same hypothetical calculations about expenses in shareholder reports, you can use this information to compare the ongoing cost of investing in the Fund with other funds. To do so, compare the hypothetical example with the 5% hypothetical examples that appear in the shareholder reports of other funds. As you compare hypothetical examples of other funds, it is important to note that hypothetical examples are meant to highlight the ongoing costs of investing in a fund only and do not reflect any transaction costs, such as sales charges, or redemption or exchange fees. Therefore, the hypothetical calculations are useful in comparing ongoing costs only, and will not help you determine the relative total costs of owning different funds. If transaction costs were included in these calculations, your costs would be higher.
March 1, 2015 – August 31, 2015
| | | Account Value at the Beginning
of the Period ($) | | Account Value at the End of the
Period ($) | | Expenses Paid During the
Period ($) | | Fund's Annualized
Expense Ratio (%) | |
| | | Actual | | Hypothetical | | Actual | | Hypothetical | | Actual | | Hypothetical | | Actual | |
Class A | | | 1,000.00 | | | | 1,000.00 | | | | 980.50 | | | | 1,019.36 | | | | 5.92 | | | | 6.04 | | | | 1.18 | | |
Class B | | | 1,000.00 | | | | 1,000.00 | | | | 976.80 | | | | 1,015.56 | | | | 9.67 | | | | 9.86 | | | | 1.93 | | |
Class C | | | 1,000.00 | | | | 1,000.00 | | | | 976.90 | | | | 1,015.56 | | | | 9.67 | | | | 9.86 | | | | 1.93 | | |
Class I | | | 1,000.00 | | | | 1,000.00 | | | | 983.50 | | | | 1,021.49 | | | | 3.82 | | | | 3.89 | | | | 0.76 | | |
Class K | | | 1,000.00 | | | | 1,000.00 | | | | 981.00 | | | | 1,019.92 | | | | 5.37 | | | | 5.48 | | | | 1.07 | | |
Class R | | | 1,000.00 | | | | 1,000.00 | | | | 979.30 | | | | 1,018.09 | | | | 7.17 | | | | 7.31 | | | | 1.43 | | |
Class R4 | | | 1,000.00 | | | | 1,000.00 | | | | 981.80 | | | | 1,020.63 | | | | 4.67 | | | | 4.76 | | | | 0.93 | | |
Class R5 | | | 1,000.00 | | | | 1,000.00 | | | | 982.40 | | | | 1,021.24 | | | | 4.07 | | | | 4.15 | | | | 0.81 | | |
Class T | | | 1,000.00 | | | | 1,000.00 | | | | 980.50 | | | | 1,019.36 | | | | 5.92 | | | | 6.04 | | | | 1.18 | | |
Class W | | | 1,000.00 | | | | 1,000.00 | | | | 980.50 | | | | 1,019.36 | | | | 5.92 | | | | 6.04 | | | | 1.18 | | |
Class Y | | | 1,000.00 | | | | 1,000.00 | | | | 983.10 | | | | 1,021.85 | | | | 3.47 | | | | 3.54 | | | | 0.69 | | |
Class Z | | | 1,000.00 | | | | 1,000.00 | | | | 981.70 | | | | 1,020.63 | | | | 4.67 | | | | 4.76 | | | | 0.93 | | |
Expenses paid during the period are equal to the annualized expense ratio for each class as indicated above, multiplied by the average account value over the period and then multiplied by the number of days in the Fund's most recent fiscal half year and divided by 365.
Expenses do not include fees and expenses incurred indirectly by the Fund from its investment in underlying funds, including affiliated and non-affiliated pooled investment vehicles, such as mutual funds and exchange-traded funds.
Annual Report 2015
7
COLUMBIA MID CAP GROWTH FUND
PORTFOLIO OF INVESTMENTS
August 31, 2015
(Percentages represent value of investments compared to net assets)
Common Stocks 95.0%
Issuer | | Shares | | Value ($) | |
CONSUMER DISCRETIONARY 22.6% | |
Auto Components 1.4% | |
Delphi Automotive PLC | | | 274,253 | | | | 20,711,587 | | |
Visteon Corp.(a) | | | 82,350 | | | | 8,207,001 | | |
Total | | | | | 28,918,588 | | |
Hotels, Restaurants & Leisure 3.4% | |
Chipotle Mexican Grill, Inc.(a) | | | 20,060 | | | | 14,242,801 | | |
Domino's Pizza, Inc. | | | 147,600 | | | | 15,636,744 | | |
Hilton Worldwide Holdings, Inc. | | | 1,012,820 | | | | 25,148,321 | | |
Starwood Hotels & Resorts
Worldwide, Inc. | | | 204,220 | | | | 14,595,603 | | |
Total | | | | | 69,623,469 | | |
Household Durables 2.3% | |
Harman International Industries, Inc. | | | 206,700 | | | | 20,202,858 | | |
Lennar Corp., Class A | | | 317,810 | | | | 16,176,529 | | |
Mohawk Industries, Inc.(a) | | | 52,720 | | | | 10,384,258 | | |
Total | | | | | 46,763,645 | | |
Internet & Catalog Retail 0.7% | |
Expedia, Inc. | | | 135,910 | | | | 15,628,291 | | |
Media 2.2% | |
CBS Corp., Class B Non Voting | | | 227,530 | | | | 10,293,457 | | |
Cinemark Holdings, Inc. | | | 516,120 | | | | 18,348,066 | | |
Interpublic Group of Companies,
Inc. (The) | | | 867,710 | | | | 16,382,365 | | |
Total | | | | | 45,023,888 | | |
Multiline Retail 2.2% | |
Dollar General Corp. | | | 313,290 | | | | 23,336,972 | | |
Dollar Tree, Inc.(a) | | | 278,346 | | | | 21,226,666 | | |
Total | | | | | 44,563,638 | | |
Specialty Retail 8.0% | |
Best Buy Co., Inc. | | | 373,730 | | | | 13,730,840 | | |
CarMax, Inc.(a) | | | 278,060 | | | | 16,961,660 | | |
Foot Locker, Inc. | | | 413,245 | | | | 29,253,614 | | |
L Brands, Inc. | | | 328,580 | | | | 27,567,862 | | |
O'Reilly Automotive, Inc.(a) | | | 90,120 | | | | 21,635,108 | | |
Ross Stores, Inc. | | | 459,420 | | | | 22,337,000 | | |
Tractor Supply Co. | | | 271,600 | | | | 23,170,196 | | |
Ulta Salon Cosmetics & Fragrance, Inc.(a) | | | 63,440 | | | | 10,029,230 | | |
Total | | | | | 164,685,510 | | |
Common Stocks (continued)
Issuer | | Shares | | Value ($) | |
Textiles, Apparel & Luxury Goods 2.4% | |
Kate Spade & Co.(a) | | | 269,280 | | | | 5,105,549 | | |
PVH Corp. | | | 120,760 | | | | 14,368,025 | | |
Skechers U.S.A., Inc., Class A(a) | | | 73,230 | | | | 10,306,390 | | |
Under Armour, Inc., Class A(a) | | | 81,080 | | | | 7,745,572 | | |
VF Corp. | | | 160,270 | | | | 11,608,356 | | |
Total | | | | | 49,133,892 | | |
Total Consumer Discretionary | | | | | 464,340,921 | | |
CONSUMER STAPLES 7.0% | |
Beverages 3.0% | |
Brown-Forman Corp., Class B | | | 187,404 | | | | 18,384,333 | | |
Coca-Cola Enterprises, Inc. | | | 228,623 | | | | 11,771,798 | | |
Constellation Brands, Inc., Class A | | | 189,370 | | | | 24,239,360 | | |
Monster Beverage Corp.(a) | | | 49,900 | | | | 6,909,154 | | |
Total | | | | | 61,304,645 | | |
Food & Staples Retailing 1.2% | |
Kroger Co. (The) | | | 296,490 | | | | 10,228,905 | | |
Sprouts Farmers Market, Inc.(a) | | | 671,530 | | | | 13,679,066 | | |
Total | | | | | 23,907,971 | | |
Food Products 2.5% | |
Hain Celestial Group, Inc. (The)(a) | | | 189,520 | | | | 11,534,187 | | |
Keurig Green Mountain, Inc. | | | 91,130 | | | | 5,157,958 | | |
Mead Johnson Nutrition Co. | | | 195,457 | | | | 15,312,101 | | |
Tyson Foods, Inc., Class A | | | 471,780 | | | | 19,946,859 | | |
Total | | | | | 51,951,105 | | |
Personal Products 0.3% | |
Herbalife Ltd.(a) | | | 109,090 | | | | 6,280,311 | | |
Total Consumer Staples | | | | | 143,444,032 | | |
ENERGY 1.6% | |
Oil, Gas & Consumable Fuels 1.6% | |
Cabot Oil & Gas Corp. | | | 630,102 | | | | 14,914,515 | | |
Concho Resources, Inc.(a) | | | 162,877 | | | | 17,616,776 | | |
Total | | | | | 32,531,291 | | |
Total Energy | | | | | 32,531,291 | | |
FINANCIALS 10.4% | |
Banks 1.8% | |
Signature Bank(a) | | | 209,412 | | | | 27,954,408 | | |
SVB Financial Group(a) | | | 79,669 | | | | 9,964,998 | | |
Total | | | | | 37,919,406 | | |
The accompanying Notes to Financial Statements are an integral part of this statement.
Annual Report 2015
8
COLUMBIA MID CAP GROWTH FUND
PORTFOLIO OF INVESTMENTS (continued)
August 31, 2015
Common Stocks (continued)
Issuer | | Shares | | Value ($) | |
Capital Markets 0.6% | |
Affiliated Managers Group, Inc.(a) | | | 65,630 | | | | 12,236,057 | | |
Diversified Financial Services 3.7% | |
CBOE Holdings, Inc. | | | 284,390 | | | | 17,990,511 | | |
McGraw Hill Financial, Inc. | | | 342,870 | | | | 33,254,961 | | |
Moody's Corp. | | | 237,895 | | | | 24,339,038 | | |
Total | | | | | 75,584,510 | | |
Insurance 0.9% | |
Aon PLC | | | 209,660 | | | | 19,590,630 | | |
Real Estate Investment Trusts (REITs) 2.3% | |
Alexandria Real Estate Equities, Inc. | | | 121,310 | | | | 10,431,447 | | |
Crown Castle International Corp. | | | 215,580 | | | | 17,977,216 | | |
Extra Space Storage, Inc. | | | 243,530 | | | | 17,894,585 | | |
Total | | | | | 46,303,248 | | |
Real Estate Management & Development 0.5% | |
CBRE Group, Inc., Class A(a) | | | 335,830 | | | | 10,753,277 | | |
Thrifts & Mortgage Finance 0.6% | |
Radian Group, Inc. | | | 648,750 | | | | 11,664,525 | | |
Total Financials | | | | | 214,051,653 | | |
HEALTH CARE 13.6% | |
Biotechnology 3.7% | |
Alkermes PLC(a) | | | 227,400 | | | | 13,543,944 | | |
BioMarin Pharmaceutical, Inc.(a) | | | 134,760 | | | | 17,416,382 | | |
Bluebird Bio, Inc.(a) | | | 42,150 | | | | 5,608,901 | | |
Incyte Corp.(a) | | | 185,700 | | | | 21,576,483 | | |
Intercept Pharmaceuticals, Inc.(a) | | | 16,420 | | | | 3,115,859 | | |
Medivation, Inc.(a) | | | 94,620 | | | | 8,332,237 | | |
Ultragenyx Pharmaceutical, Inc.(a) | | | 63,090 | | | | 7,042,106 | | |
Total | | | | | 76,635,912 | | |
Health Care Equipment & Supplies 4.6% | |
Align Technology, Inc.(a) | | | 240,100 | | | | 13,589,660 | | |
CR Bard, Inc. | | | 120,650 | | | | 23,380,764 | | |
DexCom, Inc.(a) | | | 111,337 | | | | 10,481,265 | | |
IDEXX Laboratories, Inc.(a) | | | 226,740 | | | | 16,205,108 | | |
St. Jude Medical, Inc. | | | 232,980 | | | | 16,497,314 | | |
Zimmer Biomet Holdings, Inc. | | | 146,340 | | | | 15,154,970 | | |
Total | | | | | 95,309,081 | | |
Common Stocks (continued)
Issuer | | Shares | | Value ($) | |
Health Care Providers & Services 2.8% | |
Cardinal Health, Inc. | | | 201,390 | | | | 16,568,355 | | |
Centene Corp.(a) | | | 218,000 | | | | 13,454,960 | | |
Community Health Systems, Inc.(a) | | | 259,410 | | | | 13,930,317 | | |
Henry Schein, Inc.(a) | | | 94,548 | | | | 12,935,112 | | |
Total | | | | | 56,888,744 | | |
Health Care Technology 0.9% | |
Cerner Corp.(a) | | | 300,745 | | | | 18,574,011 | | |
Life Sciences Tools & Services 0.5% | |
Mettler-Toledo International, Inc.(a) | | | 32,640 | | | | 9,679,392 | | |
Pharmaceuticals 1.1% | |
Jazz Pharmaceuticals PLC(a) | | | 77,290 | | | | 13,048,098 | | |
Zoetis, Inc. | | | 200,550 | | | | 8,998,678 | | |
Total | | | | | 22,046,776 | | |
Total Health Care | | | | | 279,133,916 | | |
INDUSTRIALS 13.9% | |
Aerospace & Defense 0.9% | |
Rockwell Collins, Inc. | | | 95,520 | | | | 7,818,312 | | |
TransDigm Group, Inc.(a) | | | 45,760 | | | | 10,517,021 | | |
Total | | | | | 18,335,333 | | |
Airlines 2.8% | |
Alaska Air Group, Inc. | | | 312,970 | | | | 23,428,934 | | |
Southwest Airlines Co. | | | 934,210 | | | | 34,285,507 | | |
Total | | | | | 57,714,441 | | |
Building Products 0.7% | |
Fortune Brands Home & Security, Inc. | | | 295,390 | | | | 14,134,412 | | |
Commercial Services & Supplies 0.4% | |
Tyco International PLC | | | 207,480 | | | | 7,529,449 | | |
Electrical Equipment 1.8% | |
AMETEK, Inc. | | | 462,273 | | | | 24,879,533 | | |
Rockwell Automation, Inc. | | | 99,783 | | | | 11,158,733 | | |
Total | | | | | 36,038,266 | | |
Industrial Conglomerates 1.0% | |
Roper Technologies, Inc. | | | 129,660 | | | | 21,016,590 | | |
Machinery 2.7% | |
Flowserve Corp. | | | 180,580 | | | | 8,149,575 | | |
Ingersoll-Rand PLC | | | 259,630 | | | | 14,354,943 | | |
Middleby Corp. (The)(a) | | | 156,480 | | | | 16,985,904 | | |
Wabtec Corp. | | | 166,420 | | | | 15,936,379 | | |
Total | | | | | 55,426,801 | | |
The accompanying Notes to Financial Statements are an integral part of this statement.
Annual Report 2015
9
COLUMBIA MID CAP GROWTH FUND
PORTFOLIO OF INVESTMENTS (continued)
August 31, 2015
Common Stocks (continued)
Issuer | | Shares | | Value ($) | |
Professional Services 1.2% | |
Nielsen Holdings PLC | | | 228,950 | | | | 10,355,408 | | |
Verisk Analytics, Inc.(a) | | | 198,171 | | | | 14,482,337 | | |
Total | | | | | 24,837,745 | | |
Road & Rail 0.7% | |
JB Hunt Transport Services, Inc. | | | 202,680 | | | | 14,751,050 | | |
Trading Companies & Distributors 1.7% | |
Fastenal Co. | | | 334,180 | | | | 12,879,297 | | |
United Rentals, Inc.(a) | | | 321,308 | | | | 22,276,284 | | |
Total | | | | | 35,155,581 | | |
Total Industrials | | | | | 284,939,668 | | |
INFORMATION TECHNOLOGY 17.4% | |
Communications Equipment 1.0% | |
Palo Alto Networks, Inc.(a) | | | 123,250 | | | | 20,240,115 | | |
Internet Software & Services 1.4% | |
CoStar Group, Inc.(a) | | | 85,999 | | | | 15,225,263 | | |
LinkedIn Corp., Class A(a) | | | 79,240 | | | | 14,310,744 | | |
Total | | | | | 29,536,007 | | |
IT Services 3.7% | |
Alliance Data Systems Corp.(a) | | | 114,710 | | | | 29,502,265 | | |
FleetCor Technologies, Inc.(a) | | | 160,380 | | | | 23,922,281 | | |
Gartner, Inc.(a) | | | 135,670 | | | | 11,601,141 | | |
WEX, Inc.(a) | | | 118,030 | | | | 11,157,376 | | |
Total | | | | | 76,183,063 | | |
Semiconductors & Semiconductor Equipment 2.5% | |
Lam Research Corp. | | | 219,210 | | | | 15,951,912 | | |
NXP Semiconductors NV(a) | | | 70,113 | | | | 5,935,065 | | |
Qorvo, Inc.(a) | | | 132,210 | | | | 7,338,977 | | |
Skyworks Solutions, Inc. | | | 254,071 | | | | 22,193,102 | | |
Total | | | | | 51,419,056 | | |
Software 8.8% | |
Activision Blizzard, Inc. | | | 1,736,970 | | | | 49,729,451 | | |
Electronic Arts, Inc.(a) | | | 450,330 | | | | 29,789,329 | | |
Guidewire Software, Inc.(a) | | | 151,520 | | | | 8,471,483 | | |
Intuit, Inc. | | | 291,065 | | | | 24,958,824 | | |
Red Hat, Inc.(a) | | | 218,932 | | | | 15,809,080 | | |
ServiceNow, Inc.(a) | | | 296,308 | | | | 21,026,016 | | |
Splunk, Inc.(a) | | | 158,170 | | | | 9,801,795 | | |
Common Stocks (continued)
Issuer | | Shares | | Value ($) | |
Tableau Software, Inc., Class A(a) | | | 154,970 | | | | 14,593,525 | | |
Ultimate Software Group, Inc. (The)(a) | | | 34,120 | | | | 6,011,603 | | |
Total | | | | | 180,191,106 | | |
Total Information Technology | | | | | 357,569,347 | | |
MATERIALS 5.9% | |
Chemicals 3.8% | |
Eastman Chemical Co. | | | 161,533 | | | | 11,704,681 | | |
International Flavors & Fragrances, Inc. | | | 107,384 | | | | 11,763,917 | | |
Sherwin-Williams Co. (The) | | | 166,415 | | | | 42,570,621 | | |
Westlake Chemical Corp. | | | 218,812 | | | | 12,084,987 | | |
Total | | | | | 78,124,206 | | |
Construction Materials 0.6% | |
Eagle Materials, Inc. | | | 141,420 | | | | 11,572,399 | | |
Containers & Packaging 0.6% | |
Westrock Co. | | | 212,792 | | | | 12,629,205 | | |
Paper & Forest Products 0.9% | |
International Paper Co. | | | 434,970 | | | | 18,764,606 | | |
Total Materials | | | | | 121,090,416 | | |
TELECOMMUNICATION SERVICES 1.9% | |
Wireless Telecommunication Services 1.9% | |
SBA Communications Corp., Class A(a) | | | 332,241 | | | | 39,270,886 | | |
Total Telecommunication Services | | | | | 39,270,886 | | |
UTILITIES 0.7% | |
Electric Utilities 0.7% | |
ITC Holdings Corp. | | | 427,000 | | | | 13,962,900 | | |
Total Utilities | | | | | 13,962,900 | | |
Total Common Stocks
(Cost: $1,552,833,272) | | | | | 1,950,335,030 | | |
Money Market Funds 4.4%
| | | Shares | | Value ($) | |
Columbia Short-Term Cash Fund,
0.150%(b)(c) | | | 90,396,048 | | | | 90,396,048 | | |
Total Money Market Funds
(Cost: $90,396,048) | | | | | 90,396,048 | | |
Total Investments
(Cost: $1,643,229,320) | | | | | 2,040,731,078 | | |
Other Assets & Liabilities, Net | | | | | 13,238,007 | | |
Net Assets | | | | | 2,053,969,085 | | |
The accompanying Notes to Financial Statements are an integral part of this statement.
Annual Report 2015
10
COLUMBIA MID CAP GROWTH FUND
PORTFOLIO OF INVESTMENTS (continued)
August 31, 2015
Notes to Portfolio of Investments
(a) Non-income producing investment.
(b) The rate shown is the seven-day current annualized yield at August 31, 2015.
(c) As defined in the Investment Company Act of 1940, an affiliated company is one in which the Fund owns 5% or more of the company's outstanding voting securities, or a company which is under common ownership or control with the Fund. Holdings and transactions in these affiliated companies during the year ended August 31, 2015 are as follows:
Issuer | | Beginning
Cost ($) | | Purchase
Cost ($) | | Proceeds
From Sales ($) | | Ending
Cost ($) | | Dividends —
Affiliated
Issuers ($) | | Value ($) | |
Columbia Short-Term Cash Fund | | | 55,786,697 | | | | 1,048,193,894 | | | | (1,013,584,543 | ) | | | 90,396,048 | | | | 83,259 | | | | 90,396,048 | | |
Fair Value Measurements
The Fund categorizes its fair value measurements according to a three-level hierarchy that maximizes the use of observable inputs and minimizes the use of unobservable inputs by prioritizing that the most observable input be used when available. Observable inputs are those that market participants would use in pricing an investment based on market data obtained from sources independent of the reporting entity. Unobservable inputs are those that reflect the Fund's assumptions about the information market participants would use in pricing an investment. An investment's level within the fair value hierarchy is based on the lowest level of any input that is deemed significant to the asset's or liability's fair value measurement. The input levels are not necessarily an indication of the risk or liquidity associated with investments at that level. For example, certain U.S. government securities are generally high quality and liquid, however, they are reflected as Level 2 because the inputs used to determine fair value may not always be quoted prices in an active market.
Fair value inputs are summarized in the three broad levels listed below:
> Level 1 — Valuations based on quoted prices for investments in active markets that the Fund has the ability to access at the measurement date (including NAV for open-end mutual funds). Valuation adjustments are not applied to Level 1 investments.
> Level 2 — Valuations based on other significant observable inputs (including quoted prices for similar securities, interest rates, prepayment speeds, credit risks, etc.).
> Level 3 — Valuations based on significant unobservable inputs (including the Fund's own assumptions and judgment in determining the fair value of investments).
Inputs that are used in determining fair value of an investment may include price information, credit data, volatility statistics, and other factors. These inputs can be either observable or unobservable. The availability of observable inputs can vary between investments, and is affected by various factors such as the type of investment, and the volume and level of activity for that investment or similar investments in the marketplace. The inputs will be considered by the Investment Manager, along with any other relevant factors in the calculation of an investment's fair value. The Fund uses prices and inputs that are current as of the measurement date, which may include periods of market dislocations. During these periods, the availability of prices and inputs may be reduced for many investments. This condition could cause an investment to be reclassified between the various levels within the hierarchy.
Investments falling into the Level 3 category are primarily supported by quoted prices from brokers and dealers participating in the market for those investments. However, these may be classified as Level 3 investments due to lack of market transparency and corroboration to support these quoted prices. Additionally, valuation models may be used as the pricing source for any remaining investments classified as Level 3. These models may rely on one or more significant unobservable inputs and/or significant assumptions by the Investment Manager. Inputs used in valuations may include, but are not limited to, financial statement analysis, capital account balances, discount rates and estimated cash flows, and comparable company data.
Under the direction of the Fund's Board of Trustees (the Board), the Investment Manager's Valuation Committee (the Committee) is responsible for overseeing the valuation procedures approved by the Board. The Committee consists of voting and non-voting members from various groups within the Investment Manager's organization, including operations and accounting, trading and investments, compliance, risk management and legal.
The Committee meets at least monthly to review and approve valuation matters, which may include a description of specific valuation determinations, data regarding pricing information received from approved pricing vendors and brokers and the results of Board-approved valuation control policies and procedures (the Policies). The Policies address, among other things, instances when market quotations are or are not readily available, including recommendations of third party pricing vendors and a determination of appropriate pricing methodologies; events that require specific valuation determinations and assessment of fair value techniques; securities with a potential for stale pricing, including those that are illiquid, restricted, or in default; and the effectiveness of third party pricing vendors, including periodic reviews of vendors. The Committee meets more frequently, as needed, to discuss additional valuation matters, which may include the need to review back-testing results, review time-sensitive information or approve related valuation actions. The Committee reports to the Board, with members of the Committee meeting with the Board at each of its regularly scheduled meetings to discuss valuation matters and actions during the period, similar to those described earlier.
The accompanying Notes to Financial Statements are an integral part of this statement.
Annual Report 2015
11
COLUMBIA MID CAP GROWTH FUND
PORTFOLIO OF INVESTMENTS (continued)
August 31, 2015
Fair Value Measurements (continued)
For investments categorized as Level 3, the Committee monitors information similar to that described above, which may include: (i) data specific to the issuer or comparable issuers, (ii) general market or specific sector news and (iii) quoted prices and specific or similar security transactions. The Committee considers this data and any changes from prior periods in order to assess the reasonableness of observable and unobservable inputs, any assumptions or internal models used to value those securities and changes in fair value. This data is also used to corroborate, when available, information received from approved pricing vendors and brokers. Various factors impact the frequency of monitoring this information (which may occur as often as daily). However, the Committee may determine that changes to inputs, assumptions and models are not required as a result of the monitoring procedures performed.
The following table is a summary of the inputs used to value the Fund's investments at August 31, 2015:
| | | Level 1
Quoted Prices in Active
Markets for Identical
Assets ($) | | Level 2
Other Significant
Observable Inputs ($) | | Level 3
Significant
Unobservable Inputs ($) | | Total ($) | |
Investments | |
Common Stocks | |
Consumer Discretionary | | | 464,340,921 | | | | — | | | | — | | | | 464,340,921 | | |
Consumer Staples | | | 143,444,032 | | | | — | | | | — | | | | 143,444,032 | | |
Energy | | | 32,531,291 | | | | — | | | | — | | | | 32,531,291 | | |
Financials | | | 214,051,653 | | | | — | | | | — | | | | 214,051,653 | | |
Health Care | | | 279,133,916 | | | | — | | | | — | | | | 279,133,916 | | |
Industrials | | | 284,939,668 | | | | — | | | | — | | | | 284,939,668 | | |
Information Technology | | | 357,569,347 | | | | — | | | | — | | | | 357,569,347 | | |
Materials | | | 121,090,416 | | | | — | | | | — | | | | 121,090,416 | | |
Telecommunication Services | | | 39,270,886 | | | | — | | | | — | | | | 39,270,886 | | |
Utilities | | | 13,962,900 | | | | — | | | | — | | | | 13,962,900 | | |
Total Common Stocks | | | 1,950,335,030 | | | | — | | | | — | | | | 1,950,335,030 | | |
Money Market Funds | | | — | | | | 90,396,048 | | | | — | | | | 90,396,048 | | |
Total Investments | | | 1,950,335,030 | | | | 90,396,048 | | | | — | | | | 2,040,731,078 | | |
See the Portfolio of Investments for all investment classifications not indicated in the table.
The Fund's assets assigned to the Level 2 input category are generally valued using the market approach, in which a security's value is determined through reference to prices and information from market transactions for similar or identical assets.
Financial assets were transferred from Level 1 to Level 2 as the market for these assets is not considered publicly available. Fund per share market values were obtained using observable market inputs.
The following table shows transfers between Level 1 and Level 2 of the fair value hierarchy:
Transfers In | | Transfers Out | |
| Level 1 ($) | | Level 2 ($) | | Level 1 ($) | | Level 2 ($) | |
| | — | | | | 55,786,697 | | | | 55,786,697 | | | | — | | |
Transfers between Level 1 and Level 2 are determined based on the fair value at the beginning of the period for security positions held throughout the period.
There were no transfers of financial assets between Levels 2 and 3 during the period.
The accompanying Notes to Financial Statements are an integral part of this statement.
Annual Report 2015
12
COLUMBIA MID CAP GROWTH FUND
STATEMENT OF ASSETS AND LIABILITIES
August 31, 2015
Assets | |
Investments, at value | |
Unaffiliated issuers (identified cost $1,552,833,272) | | $ | 1,950,335,030 | | |
Affiliated issuers (identified cost $90,396,048) | | | 90,396,048 | | |
Total investments (identified cost $1,643,229,320) | | | 2,040,731,078 | | |
Cash | | | 19,951,320 | | |
Receivable for: | |
Investments sold | | | 32,978,264 | | |
Capital shares sold | | | 877,693 | | |
Dividends | | | 1,576,748 | | |
Prepaid expenses | | | 21,603 | | |
Trustees' deferred compensation plan | | | 109,771 | | |
Other assets | | | 2,199 | | |
Total assets | | | 2,096,248,676 | | |
Liabilities | |
Payable for: | |
Investments purchased | | | 39,797,282 | | |
Capital shares purchased | | | 1,672,632 | | |
Investment management fees | | | 117,548 | | |
Distribution and/or service fees | | | 25,932 | | |
Transfer agent fees | | | 282,282 | | |
Administration fees | | | 9,152 | | |
Plan administration fees | | | 102 | | |
Compensation of board members | | | 66,682 | | |
Chief compliance officer expenses | | | 181 | | |
Other expenses | | | 198,027 | | |
Trustees' deferred compensation plan | | | 109,771 | | |
Total liabilities | | | 42,279,591 | | |
Net assets applicable to outstanding capital stock | | $ | 2,053,969,085 | | |
Represented by | |
Paid-in capital | | $ | 1,401,997,144 | | |
Undistributed net investment income | | | 19,150,872 | | |
Accumulated net realized gain | | | 235,319,311 | | |
Unrealized appreciation (depreciation) on: | |
Investments | | | 397,501,758 | | |
Total — representing net assets applicable to outstanding capital stock | | $ | 2,053,969,085 | | |
The accompanying Notes to Financial Statements are an integral part of this statement.
Annual Report 2015
13
COLUMBIA MID CAP GROWTH FUND
STATEMENT OF ASSETS AND LIABILITIES (continued)
August 31, 2015
Class A | |
Net assets | | $ | 948,826,031 | | |
Shares outstanding | | | 33,071,009 | | |
Net asset value per share | | $ | 28.69 | | |
Maximum offering price per share(a) | | $ | 30.44 | | |
Class B | |
Net assets | | $ | 7,785,084 | | |
Shares outstanding | | | 308,672 | | |
Net asset value per share | | $ | 25.22 | | |
Class C | |
Net assets | | $ | 51,859,103 | | |
Shares outstanding | | | 2,046,683 | | |
Net asset value per share | | $ | 25.34 | | |
Class I | |
Net assets | | $ | 2,734 | | |
Shares outstanding | | | 90 | | |
Net asset value per share(b) | | $ | 30.32 | | |
Class K | |
Net assets | | $ | 455,128 | | |
Shares outstanding | | | 15,184 | | |
Net asset value per share | | $ | 29.97 | | |
Class R | |
Net assets | | $ | 18,965,404 | | |
Shares outstanding | | | 680,207 | | |
Net asset value per share | | $ | 27.88 | | |
Class R4 | |
Net assets | | $ | 26,912,393 | | |
Shares outstanding | | | 877,508 | | |
Net asset value per share | | $ | 30.67 | | |
Class R5 | |
Net assets | | $ | 37,588,582 | | |
Shares outstanding | | | 1,244,675 | | |
Net asset value per share | | $ | 30.20 | | |
Class T | |
Net assets | | $ | 22,589,914 | | |
Shares outstanding | | | 789,603 | | |
Net asset value per share | | $ | 28.61 | | |
Maximum offering price per share(a) | | $ | 30.36 | | |
Class W | |
Net assets | | $ | 201,050 | | |
Shares outstanding | | | 7,007 | | |
Net asset value per share | | $ | 28.69 | | |
The accompanying Notes to Financial Statements are an integral part of this statement.
Annual Report 2015
14
COLUMBIA MID CAP GROWTH FUND
STATEMENT OF ASSETS AND LIABILITIES (continued)
August 31, 2015
Class Y | |
Net assets | | $ | 2,560 | | |
Shares outstanding | | | 85 | | |
Net asset value per share(b) | | $ | 30.21 | | |
Class Z | |
Net assets | | $ | 938,781,102 | | |
Shares outstanding | | | 31,257,366 | | |
Net asset value per share | | $ | 30.03 | | |
(a) The maximum offering price per share is calculated by dividing the net asset value per share by 1.0 minus the maximum sales charge of 5.75%.
(b) Net asset value per share rounds to this amount due to fractional shares outstanding.
The accompanying Notes to Financial Statements are an integral part of this statement.
Annual Report 2015
15
COLUMBIA MID CAP GROWTH FUND
STATEMENT OF OPERATIONS
Year Ended August 31, 2015
Net investment income | |
Income: | |
Dividends — unaffiliated issuers | | $ | 44,159,651 | | |
Dividends — affiliated issuers | | | 83,259 | | |
Foreign taxes withheld | | | (5,753 | ) | |
Total income | | | 44,237,157 | | |
Expenses: | |
Investment management fees | | | 15,395,981 | | |
Distribution and/or service fees | |
Class A | | | 2,475,688 | | |
Class B | | | 106,399 | | |
Class C | | | 527,221 | | |
Class R | | | 105,184 | | |
Class T | | | 64,436 | | |
Class W | | | 591 | | |
Transfer agent fees | |
Class A | | | 1,690,861 | | |
Class B | | | 18,308 | | |
Class C | | | 89,981 | | |
Class K | | | 215 | | |
Class R | | | 36,027 | | |
Class R4 | | | 8,002 | | |
Class R5 | | | 18,477 | | |
Class T | | | 41,296 | | |
Class W | | | 406 | | |
Class Z | | | 1,794,453 | | |
Administration fees | | | 1,201,473 | | |
Plan administration fees | |
Class K | | | 1,073 | | |
Compensation of board members | | | 65,294 | | |
Custodian fees | | | 26,117 | | |
Printing and postage fees | | | 202,686 | | |
Registration fees | | | 142,459 | | |
Professional fees | | | 98,149 | | |
Chief compliance officer expenses | | | 1,108 | | |
Other | | | 89,072 | | |
Total expenses | | | 24,200,957 | | |
Expense reductions | | | (5,869 | ) | |
Total net expenses | | | 24,195,088 | | |
Net investment income | | | 20,042,069 | | |
Realized and unrealized gain (loss) — net | |
Net realized gain (loss) on: | |
Investments | | | 319,648,959 | | |
Net realized gain | | | 319,648,959 | | |
Net change in unrealized appreciation (depreciation) on: | |
Investments | | | (218,187,874 | ) | |
Net change in unrealized depreciation | | | (218,187,874 | ) | |
Net realized and unrealized gain | | | 101,461,085 | | |
Net increase in net assets resulting from operations | | $ | 121,503,154 | | |
The accompanying Notes to Financial Statements are an integral part of this statement.
Annual Report 2015
16
COLUMBIA MID CAP GROWTH FUND
STATEMENT OF CHANGES IN NET ASSETS
| | | Year Ended
August 31,
2015 | | Year Ended
August 31,
2014 | |
Operations | |
Net investment income (loss) | | $ | 20,042,069 | | | $ | (7,589,425 | ) | |
Net realized gain | | | 319,648,959 | | | | 402,841,434 | | |
Net change in unrealized appreciation (depreciation) | | | (218,187,874 | ) | | | 61,946,682 | | |
Net increase in net assets resulting from operations | | | 121,503,154 | | | | 457,198,691 | | |
Distributions to shareholders | |
Net realized gains | |
Class A | | | (148,818,366 | ) | | | (97,798,371 | ) | |
Class B | | | (1,954,906 | ) | | | (1,771,600 | ) | |
Class C | | | (8,485,326 | ) | | | (5,434,628 | ) | |
Class I | | | (7,528,333 | ) | | | (19,628,016 | ) | |
Class K | | | (57,329 | ) | | | (32,772 | ) | |
Class R | | | (3,548,457 | ) | | | (2,707,690 | ) | |
Class R4 | | | (105,003 | ) | | | (18,150 | ) | |
Class R5 | | | (5,182,347 | ) | | | (490,341 | ) | |
Class T | | | (3,670,320 | ) | | | (2,209,093 | ) | |
Class W | | | (38,026 | ) | | | (1,734,715 | ) | |
Class Y | | | (431 | ) | | | (23,201 | ) | |
Class Z | | | (159,524,590 | ) | | | (116,675,804 | ) | |
Total distributions to shareholders | | | (338,913,434 | ) | | | (248,524,381 | ) | |
Decrease in net assets from capital stock activity | | | (220,893,183 | ) | | | (369,944,351 | ) | |
Total decrease in net assets | | | (438,303,463 | ) | | | (161,270,041 | ) | |
Net assets at beginning of year | | | 2,492,272,548 | | | | 2,653,542,589 | | |
Net assets at end of year | | $ | 2,053,969,085 | | | $ | 2,492,272,548 | | |
Undistributed (excess of distributions over) net investment income | | $ | 19,150,872 | | | $ | (177,739 | ) | |
The accompanying Notes to Financial Statements are an integral part of this statement.
Annual Report 2015
17
COLUMBIA MID CAP GROWTH FUND
STATEMENT OF CHANGES IN NET ASSETS (continued)
| | | Year Ended August 31, 2015 | | Year Ended August 31, 2014 | |
| | | Shares | | Dollars ($) | | Shares | | Dollars ($) | |
Capital stock activity | |
Class A shares | |
Subscriptions(a) | | | 2,316,713 | | | | 68,516,197 | | | | 1,878,987 | | | | 58,133,675 | | |
Distributions reinvested | | | 5,058,499 | | | | 140,221,584 | | | | 3,124,293 | | | | 91,916,714 | | |
Redemptions | | | (5,287,673 | ) | | | (157,813,159 | ) | | | (7,023,561 | ) | | | (216,896,624 | ) | |
Net increase (decrease) | | | 2,087,539 | | | | 50,924,622 | | | | (2,020,281 | ) | | | (66,846,235 | ) | |
Class B shares | |
Subscriptions | | | 9,836 | | | | 253,912 | | | | 8,109 | | | | 226,079 | | |
Distributions reinvested | | | 76,220 | | | | 1,868,145 | | | | 64,005 | | | | 1,701,880 | | |
Redemptions(a) | | | (236,661 | ) | | | (6,215,032 | ) | | | (274,303 | ) | | | (7,638,238 | ) | |
Net decrease | | | (150,605 | ) | | | (4,092,975 | ) | | | (202,189 | ) | | | (5,710,279 | ) | |
Class C shares | |
Subscriptions | | | 268,540 | | | | 6,974,565 | | | | 153,084 | | | | 4,266,191 | | |
Distributions reinvested | | | 297,080 | | | | 7,314,114 | | | | 171,032 | | | | 4,564,849 | | |
Redemptions | | | (341,673 | ) | | | (8,997,212 | ) | | | (416,881 | ) | | | (11,671,220 | ) | |
Net increase (decrease) | | | 223,947 | | | | 5,291,467 | | | | (92,765 | ) | | | (2,840,180 | ) | |
Class I shares | |
Subscriptions | | | 494,672 | | | | 16,334,466 | | | | 293,729 | | | | 9,884,287 | | |
Distributions reinvested | | | 257,981 | | | | 7,527,875 | | | | 639,684 | | | | 19,625,503 | | |
Redemptions | | | (6,696,099 | ) | | | (221,663,215 | ) | | | (2,740,849 | ) | | | (90,606,806 | ) | |
Net decrease | | | (5,943,446 | ) | | | (197,800,874 | ) | | | (1,807,436 | ) | | | (61,097,016 | ) | |
Class K shares | |
Subscriptions | | | 2,324 | | | | 70,306 | | | | 4,589 | | | | 147,312 | | |
Distributions reinvested | | | 1,966 | | | | 56,912 | | | | 1,040 | | | | 31,720 | | |
Redemptions | | | (605 | ) | | | (19,259 | ) | | | (6,958 | ) | | | (225,675 | ) | |
Net increase (decrease) | | | 3,685 | | | | 107,959 | | | | (1,329 | ) | | | (46,643 | ) | |
Class R shares | |
Subscriptions | | | 199,493 | | | | 5,763,107 | | | | 215,643 | | | | 6,490,329 | | |
Distributions reinvested | | | 96,740 | | | | 2,611,023 | | | | 72,395 | | | | 2,084,243 | | |
Redemptions | | | (411,370 | ) | | | (11,808,786 | ) | | | (434,378 | ) | | | (13,201,016 | ) | |
Net decrease | | | (115,137 | ) | | | (3,434,656 | ) | | | (146,340 | ) | | | (4,626,444 | ) | |
Class R4 shares | |
Subscriptions | | | 898,802 | | | | 28,857,053 | | | | 10,571 | | | | 354,734 | | |
Distributions reinvested | | | 3,477 | | | | 102,854 | | | | 513 | | | | 15,931 | | |
Redemptions | | | (35,739 | ) | | | (1,139,034 | ) | | | (1,073 | ) | | | (35,144 | ) | |
Net increase | | | 866,540 | | | | 27,820,873 | | | | 10,011 | | | | 335,521 | | |
Class R5 shares | |
Subscriptions | | | 452,364 | | | | 14,094,437 | | | | 1,260,805 | | | | 39,689,498 | | |
Distributions reinvested | | | 178,074 | | | | 5,181,943 | | | | 16,005 | | | | 490,060 | | |
Redemptions | | | (319,238 | ) | | | (9,882,628 | ) | | | (467,323 | ) | | | (15,156,602 | ) | |
Net increase | | | 311,200 | | | | 9,393,752 | | | | 809,487 | | | | 25,022,956 | | |
The accompanying Notes to Financial Statements are an integral part of this statement.
Annual Report 2015
18
COLUMBIA MID CAP GROWTH FUND
STATEMENT OF CHANGES IN NET ASSETS (continued)
| | | Year Ended August 31, 2015 | | Year Ended August 31, 2014 | |
| | | Shares | | Dollars ($) | | Shares | | Dollars ($) | |
Capital stock activity (continued) | |
Class T shares | |
Subscriptions | | | 17,670 | | | | 496,409 | | | | 10,761 | | | | 320,464 | | |
Distributions reinvested | | | 110,863 | | | | 3,065,366 | | | | 62,773 | | | | 1,843,016 | | |
Redemptions | | | (86,131 | ) | | | (2,545,667 | ) | | | (64,923 | ) | | | (2,003,303 | ) | |
Net increase | | | 42,402 | | | | 1,016,108 | | | | 8,611 | | | | 160,177 | | |
Class W shares | |
Subscriptions | | | — | | | | — | | | | 130,844 | | | | 4,122,011 | | |
Distributions reinvested | | | 1,357 | | | | 37,620 | | | | 58,932 | | | | 1,734,377 | | |
Redemptions | | | (3,195 | ) | | | (95,530 | ) | | | (3,683,661 | ) | | | (118,163,945 | ) | |
Net decrease | | | (1,838 | ) | | | (57,910 | ) | | | (3,493,885 | ) | | | (112,307,557 | ) | |
Class Y shares | |
Subscriptions | | | 66 | | | | 2,219 | | | | 1,222 | | | | 39,218 | | |
Distributions reinvested | | | — | | | | — | | | | 696 | | | | 21,303 | | |
Redemptions | | | (7,446 | ) | | | (245,773 | ) | | | (1,852 | ) | | | (60,092 | ) | |
Net increase (decrease) | | | (7,380 | ) | | | (243,554 | ) | | | 66 | | | | 429 | | |
Class Z shares | |
Subscriptions | | | 1,815,074 | | | | 55,869,162 | | | | 2,788,066 | | | | 89,029,202 | | |
Distributions reinvested | | | 3,690,742 | | | | 106,920,783 | | | | 2,587,851 | | | | 78,955,342 | | |
Redemptions | | | (8,664,812 | ) | | | (272,607,940 | ) | | | (9,678,879 | ) | | | (309,973,624 | ) | |
Net decrease | | | (3,158,996 | ) | | | (109,817,995 | ) | | | (4,302,962 | ) | | | (141,989,080 | ) | |
Total net decrease | | | (5,842,089 | ) | | | (220,893,183 | ) | | | (11,239,012 | ) | | | (369,944,351 | ) | |
(a) Includes conversions of Class B shares to Class A shares, if any.
The accompanying Notes to Financial Statements are an integral part of this statement.
Annual Report 2015
19
COLUMBIA MID CAP GROWTH FUND
The following tables are intended to help you understand the Fund's financial performance. Certain information reflects financial results for a single share of a class held for the periods shown. Per share net investment income (loss) amounts are calculated based on average shares outstanding during the period. Total return assumes reinvestment of all dividends and distributions, if any. Total return does not reflect payment of sales charges, if any. Total return and portfolio turnover are not annualized for periods of less than one year. The portfolio turnover rate is calculated without regard to purchase and sales transactions of short-term instruments and certain derivatives, if any. If such transactions were included, the Fund's portfolio turnover rate may be higher.
| | | Year Ended August 31, | |
Class A | | 2015 | | 2014 | | 2013 | | 2012 | | 2011 | |
Per share data | |
Net asset value, beginning of period | | $ | 32.14 | | | $ | 29.89 | | | $ | 26.41 | | | $ | 25.75 | | | $ | 20.22 | | |
Income from investment operations: | |
Net investment income (loss) | | | 0.25 | (f) | | | (0.13 | ) | | | (0.11 | ) | | | (0.06 | ) | | | (0.17 | ) | |
Net realized and unrealized gain | | | 1.29 | | | | 5.45 | | | | 4.36 | | | | 1.55 | | | | 5.70 | | |
Total from investment operations | | | 1.54 | | | | 5.32 | | | | 4.25 | | | | 1.49 | | | | 5.53 | | |
Less distributions to shareholders: | |
Net realized gains | | | (4.99 | ) | | | (3.07 | ) | | | (0.77 | ) | | | (0.83 | ) | | | — | | |
Total distributions to shareholders | | | (4.99 | ) | | | (3.07 | ) | | | (0.77 | ) | | | (0.83 | ) | | | — | | |
Proceeds from regulatory settlements | | | — | | | | — | | | | — | | | | 0.00 | (a) | | | 0.00 | (a) | |
Net asset value, end of period | | $ | 28.69 | | | $ | 32.14 | | | $ | 29.89 | | | $ | 26.41 | | | $ | 25.75 | | |
Total return | | | 5.33 | % | | | 18.77 | % | | | 16.60 | % | | | 5.97 | % | | | 27.35 | % | |
Ratios to average net assets(b) | |
Total gross expenses | | | 1.19 | % | | | 1.19 | % | | | 1.20 | % | | | 1.22 | % | | | 1.19 | %(c) | |
Total net expenses(d) | | | 1.19 | %(e) | | | 1.19 | %(e) | | | 1.20 | %(e) | | | 1.22 | %(e) | | | 1.19 | %(c)(e) | |
Net investment income (loss) | | | 0.83 | % | | | (0.42 | %) | | | (0.40 | %) | | | (0.22 | %) | | | (0.63 | %) | |
Supplemental data | |
Net assets, end of period (in thousands) | | $ | 948,826 | | | $ | 995,730 | | | $ | 986,482 | | | $ | 330,302 | | | $ | 304,214 | | |
Portfolio turnover | | | 101 | % | | | 100 | % | | | 109 | % | | | 141 | % | | | 138 | % | |
Notes to Financial Highlights
(a) Rounds to zero.
(b) In addition to the fees and expenses that the Fund bears directly, the Fund indirectly bears a pro rata share of the fees and expenses of any other funds in which it invests. Such indirect expenses are not included in the Fund's reported expense ratios.
(c) Ratios include line of credit interest expense which is less than 0.01%.
(d) Total net expenses include the impact of certain fee waivers/expense reimbursements made by the Investment Manager and certain of its affiliates, if applicable.
(e) The benefits derived from expense reductions had an impact of less than 0.01%.
(f) Net investment income per share includes special dividends. The effect of these dividends amounted to $0.35 per share.
The accompanying Notes to Financial Statements are an integral part of this statement.
Annual Report 2015
20
COLUMBIA MID CAP GROWTH FUND
FINANCIAL HIGHLIGHTS (continued)
| | | Year Ended August 31, | |
Class B | | 2015 | | 2014 | | 2013 | | 2012 | | 2011 | |
Per share data | |
Net asset value, beginning of period | | $ | 28.88 | | | $ | 27.20 | | | $ | 24.29 | | | $ | 23.92 | | | $ | 18.93 | | |
Income from investment operations: | |
Net investment loss | | | (0.05 | )(f) | | | (0.33 | ) | | | (0.31 | ) | | | (0.23 | ) | | | (0.34 | ) | |
Net realized and unrealized gain | | | 1.22 | | | | 4.94 | | | | 3.99 | | | | 1.43 | | | | 5.33 | | |
Total from investment operations | | | 1.17 | | | | 4.61 | | | | 3.68 | | | | 1.20 | | | | 4.99 | | |
Less distributions to shareholders: | |
Net realized gains | | | (4.83 | ) | | | (2.93 | ) | | | (0.77 | ) | | | (0.83 | ) | | | — | | |
Total distributions to shareholders | | | (4.83 | ) | | | (2.93 | ) | | | (0.77 | ) | | | (0.83 | ) | | | — | | |
Proceeds from regulatory settlements | | | — | | | | — | | | | — | | | | 0.00 | (a) | | | 0.00 | (a) | |
Net asset value, end of period | | $ | 25.22 | | | $ | 28.88 | | | $ | 27.20 | | | $ | 24.29 | | | $ | 23.92 | | |
Total return | | | 4.54 | % | | | 17.88 | % | | | 15.68 | % | | | 5.19 | % | | | 26.36 | % | |
Ratios to average net assets(b) | |
Total gross expenses | | | 1.94 | % | | | 1.94 | % | | | 1.95 | % | | | 1.99 | % | | | 1.95 | %(c) | |
Total net expenses(d) | | | 1.94 | %(e) | | | 1.94 | %(e) | | | 1.95 | %(e) | | | 1.99 | %(e) | | | 1.95 | %(c)(e) | |
Net investment loss | | | (0.18 | %) | | | (1.18 | %) | | | (1.20 | %) | | | (0.99 | %) | | | (1.39 | %) | |
Supplemental data | |
Net assets, end of period (in thousands) | | $ | 7,785 | | | $ | 13,264 | | | $ | 17,994 | | | $ | 5,140 | | | $ | 7,604 | | |
Portfolio turnover | | | 101 | % | | | 100 | % | | | 109 | % | | | 141 | % | | | 138 | % | |
Notes to Financial Highlights
(a) Rounds to zero.
(b) In addition to the fees and expenses that the Fund bears directly, the Fund indirectly bears a pro rata share of the fees and expenses of any other funds in which it invests. Such indirect expenses are not included in the Fund's reported expense ratios.
(c) Ratios include line of credit interest expense which is less than 0.01%.
(d) Total net expenses include the impact of certain fee waivers/expense reimbursements made by the Investment Manager and certain of its affiliates, if applicable.
(e) The benefits derived from expense reductions had an impact of less than 0.01%.
(f) Net investment loss per share includes special dividends. The effect of these dividends amounted to $0.24 per share.
The accompanying Notes to Financial Statements are an integral part of this statement.
Annual Report 2015
21
COLUMBIA MID CAP GROWTH FUND
FINANCIAL HIGHLIGHTS (continued)
| | | Year Ended August 31, | |
Class C | | 2015 | | 2014 | | 2013 | | 2012 | | 2011 | |
Per share data | |
Net asset value, beginning of period | | $ | 28.99 | | | $ | 27.30 | | | $ | 24.37 | | | $ | 23.99 | | | $ | 18.98 | | |
Income from investment operations: | |
Net investment income (loss) | | | 0.03 | (f) | | | (0.33 | ) | | | (0.26 | ) | | | (0.23 | ) | | | (0.35 | ) | |
Net realized and unrealized gain | | | 1.15 | | | | 4.95 | | | | 3.96 | | | | 1.44 | | | | 5.36 | | |
Total from investment operations | | | 1.18 | | | | 4.62 | | | | 3.70 | | | | 1.21 | | | | 5.01 | | |
Less distributions to shareholders: | |
Net realized gains | | | (4.83 | ) | | | (2.93 | ) | | | (0.77 | ) | | | (0.83 | ) | | | — | | |
Total distributions to shareholders | | | (4.83 | ) | | | (2.93 | ) | | | (0.77 | ) | | | (0.83 | ) | | | — | | |
Proceeds from regulatory settlements | | | — | | | | — | | | | — | | | | 0.00 | (a) | | | 0.00 | (a) | |
Net asset value, end of period | | $ | 25.34 | | | $ | 28.99 | | | $ | 27.30 | | | $ | 24.37 | | | $ | 23.99 | | |
Total return | | | 4.56 | % | | | 17.84 | % | | | 15.71 | % | | | 5.22 | % | | | 26.40 | % | |
Ratios to average net assets(b) | |
Total gross expenses | | | 1.94 | % | | | 1.94 | % | | | 1.96 | % | | | 1.98 | % | | | 1.94 | %(c) | |
Total net expenses(d) | | | 1.94 | %(e) | | | 1.94 | %(e) | | | 1.96 | %(e) | | | 1.98 | %(e) | | | 1.94 | %(c)(e) | |
Net investment income (loss) | | | 0.11 | % | | | (1.17 | %) | | | (1.04 | %) | | | (0.98 | %) | | | (1.39 | %) | |
Supplemental data | |
Net assets, end of period (in thousands) | | $ | 51,859 | | | $ | 52,845 | | | $ | 52,284 | | | $ | 45,236 | | | $ | 54,224 | | |
Portfolio turnover | | | 101 | % | | | 100 | % | | | 109 | % | | | 141 | % | | | 138 | % | |
Notes to Financial Highlights
(a) Rounds to zero.
(b) In addition to the fees and expenses that the Fund bears directly, the Fund indirectly bears a pro rata share of the fees and expenses of any other funds in which it invests. Such indirect expenses are not included in the Fund's reported expense ratios.
(c) Ratios include line of credit interest expense which is less than 0.01%.
(d) Total net expenses include the impact of certain fee waivers/expense reimbursements made by the Investment Manager and certain of its affiliates, if applicable.
(e) The benefits derived from expense reductions had an impact of less than 0.01%.
(f) Net investment income per share includes special dividends. The effect of these dividends amounted to $0.32 per share.
The accompanying Notes to Financial Statements are an integral part of this statement.
Annual Report 2015
22
COLUMBIA MID CAP GROWTH FUND
FINANCIAL HIGHLIGHTS (continued)
| | | Year Ended August 31, | |
Class I | | 2015 | | 2014 | | 2013 | | 2012 | | 2011(a) | |
Per share data | |
Net asset value, beginning of period | | $ | 33.62 | | | $ | 31.09 | | | $ | 27.33 | | | $ | 26.49 | | | $ | 23.23 | | |
Income from investment operations: | |
Net investment income (loss) | | | 0.00 | (b)(h) | | | (0.00 | )(b) | | | 0.05 | | | | 0.06 | | | | (0.06 | ) | |
Net realized and unrealized gain | | | 1.78 | | | | 5.69 | | | | 4.48 | | | | 1.61 | | | | 3.32 | | |
Total from investment operations | | | 1.78 | | | | 5.69 | | | | 4.53 | | | | 1.67 | | | | 3.26 | | |
Less distributions to shareholders: | |
Net realized gains | | | (5.08 | ) | | | (3.16 | ) | | | (0.77 | ) | | | (0.83 | ) | | | — | | |
Total distributions to shareholders | | | (5.08 | ) | | | (3.16 | ) | | | (0.77 | ) | | | (0.83 | ) | | | — | | |
Proceeds from regulatory settlements | | | — | | | | — | | | | — | | | | 0.00 | (b) | | | 0.00 | (b) | |
Net asset value, end of period | | $ | 30.32 | | | $ | 33.62 | | | $ | 31.09 | | | $ | 27.33 | | | $ | 26.49 | | |
Total return | | | 5.88 | % | | | 19.27 | % | | | 17.08 | % | | | 6.49 | % | | | 14.03 | % | |
Ratios to average net assets(c) | |
Total gross expenses | | | 0.76 | % | | | 0.75 | % | | | 0.77 | % | | | 0.78 | % | | | 0.80 | %(d)(e) | |
Total net expenses(f) | | | 0.76 | % | | | 0.75 | % | | | 0.77 | % | | | 0.78 | % | | | 0.80 | %(d)(e)(g) | |
Net investment income (loss) | | | 0.01 | % | | | (0.00 | %)(b) | | | 0.17 | % | | | 0.23 | % | | | (0.22 | %)(d) | |
Supplemental data | |
Net assets, end of period (in thousands) | | $ | 3 | | | $ | 199,823 | | | $ | 240,974 | | | $ | 268,601 | | | $ | 180,383 | | |
Portfolio turnover | | | 101 | % | | | 100 | % | | | 109 | % | | | 141 | % | | | 138 | % | |
Notes to Financial Highlights
(a) Based on operations from September 27, 2010 (commencement of operations) through the stated period end.
(b) Rounds to zero.
(c) In addition to the fees and expenses that the Fund bears directly, the Fund indirectly bears a pro rata share of the fees and expenses of any other funds in which it invests. Such indirect expenses are not included in the Fund's reported expense ratios.
(d) Annualized.
(e) Ratios include line of credit interest expense which is less than 0.01%.
(f) Total net expenses include the impact of certain fee waivers/expense reimbursements made by the Investment Manager and certain of its affiliates, if applicable.
(g) The benefits derived from expense reductions had an impact of less than 0.01%.
(h) Net investment income per share includes special dividends. The effect of these dividends amounted to less than $0.01 per share.
The accompanying Notes to Financial Statements are an integral part of this statement.
Annual Report 2015
23
COLUMBIA MID CAP GROWTH FUND
FINANCIAL HIGHLIGHTS (continued)
| | | Year Ended August 31, | |
Class K | | 2015 | | 2014 | | 2013(a) | |
Per share data | |
Net asset value, beginning of period | | $ | 33.35 | | | $ | 30.89 | | | $ | 28.08 | | |
Income from investment operations: | |
Net investment income (loss) | | | 0.33 | (e) | | | (0.08 | ) | | | (0.06 | ) | |
Net realized and unrealized gain | | | 1.31 | | | | 5.64 | | | | 2.87 | | |
Total from investment operations | | | 1.64 | | | | 5.56 | | | | 2.81 | | |
Less distributions to shareholders: | |
Net realized gains | | | (5.02 | ) | | | (3.10 | ) | | | — | | |
Total distributions to shareholders | | | (5.02 | ) | | | (3.10 | ) | | | — | | |
Net asset value, end of period | | $ | 29.97 | | | $ | 33.35 | | | $ | 30.89 | | |
Total return | | | 5.45 | % | | | 18.95 | % | | | 10.01 | % | |
Ratios to average net assets(b) | |
Total gross expenses | | | 1.07 | % | | | 1.05 | % | | | 1.05 | %(c) | |
Total net expenses(d) | | | 1.07 | % | | | 1.05 | % | | | 1.05 | %(c) | |
Net investment income (loss) | | | 1.07 | % | | | (0.26 | %) | | | (0.42 | %)(c) | |
Supplemental data | |
Net assets, end of period (in thousands) | | $ | 455 | | | $ | 383 | | | $ | 396 | | |
Portfolio turnover | | | 101 | % | | | 100 | % | | | 109 | % | |
Notes to Financial Highlights
(a) Based on operations from February 28, 2013 (commencement of operations) through the stated period end.
(b) In addition to the fees and expenses that the Fund bears directly, the Fund indirectly bears a pro rata share of the fees and expenses of any other funds in which it invests. Such indirect expenses are not included in the Fund's reported expense ratios.
(c) Annualized.
(d) Total net expenses include the impact of certain fee waivers/expense reimbursements made by the Investment Manager and certain of its affiliates, if applicable.
(e) Net investment income per share includes special dividends. The effect of these dividends amounted to $0.40 per share.
The accompanying Notes to Financial Statements are an integral part of this statement.
Annual Report 2015
24
COLUMBIA MID CAP GROWTH FUND
FINANCIAL HIGHLIGHTS (continued)
| | | Year Ended August 31, | |
Class R | | 2015 | | 2014 | | 2013 | | 2012 | | 2011 | |
Per share data | |
Net asset value, beginning of period | | $ | 31.39 | | | $ | 29.28 | | | $ | 25.96 | | | $ | 25.38 | | | $ | 19.98 | | |
Income from investment operations: | |
Net investment income (loss) | | | 0.15 | (f) | | | (0.20 | ) | | | (0.14 | ) | | | (0.12 | ) | | | (0.23 | ) | |
Net realized and unrealized gain | | | 1.28 | | | | 5.33 | | | | 4.23 | | | | 1.53 | | | | 5.63 | | |
Total from investment operations | | | 1.43 | | | | 5.13 | | | | 4.09 | | | | 1.41 | | | | 5.40 | | |
Less distributions to shareholders: | |
Net realized gains | | | (4.94 | ) | | | (3.02 | ) | | | (0.77 | ) | | | (0.83 | ) | | | — | | |
Total distributions to shareholders | | | (4.94 | ) | | | (3.02 | ) | | | (0.77 | ) | | | (0.83 | ) | | | — | | |
Proceeds from regulatory settlements | | | — | | | | — | | | | — | | | | 0.00 | (a) | | | 0.00 | (a) | |
Net asset value, end of period | | $ | 27.88 | | | $ | 31.39 | | | $ | 29.28 | | | $ | 25.96 | | | $ | 25.38 | | |
Total return | | | 5.06 | % | | | 18.47 | % | | | 16.27 | % | | | 5.73 | % | | | 27.03 | % | |
Ratios to average net assets(b) | |
Total gross expenses | | | 1.44 | % | | | 1.44 | % | | | 1.46 | % | | | 1.48 | % | | | 1.44 | %(c) | |
Total net expenses(d) | | | 1.44 | %(e) | | | 1.44 | %(e) | | | 1.46 | %(e) | | | 1.48 | %(e) | | | 1.44 | %(c)(e) | |
Net investment income (loss) | | | 0.52 | % | | | (0.67 | %) | | | (0.53 | %) | | | (0.48 | %) | | | (0.88 | %) | |
Supplemental data | |
Net assets, end of period (in thousands) | | $ | 18,965 | | | $ | 24,965 | | | $ | 27,574 | | | $ | 25,613 | | | $ | 26,196 | | |
Portfolio turnover | | | 101 | % | | | 100 | % | | | 109 | % | | | 141 | % | | | 138 | % | |
Notes to Financial Highlights
(a) Rounds to zero.
(b) In addition to the fees and expenses that the Fund bears directly, the Fund indirectly bears a pro rata share of the fees and expenses of any other funds in which it invests. Such indirect expenses are not included in the Fund's reported expense ratios.
(c) Ratios include line of credit interest expense which is less than 0.01%.
(d) Total net expenses include the impact of certain fee waivers/expense reimbursements made by the Investment Manager and certain of its affiliates, if applicable.
(e) The benefits derived from expense reductions had an impact of less than 0.01%.
(f) Net investment income per share includes special dividends. The effect of these dividends amounted to $0.32 per share.
The accompanying Notes to Financial Statements are an integral part of this statement.
Annual Report 2015
25
COLUMBIA MID CAP GROWTH FUND
FINANCIAL HIGHLIGHTS (continued)
| | | Year Ended August 31, | |
Class R4 | | 2015 | | 2014 | | 2013(a) | |
Per share data | |
Net asset value, beginning of period | | $ | 33.99 | | | $ | 31.42 | | | $ | 26.58 | | |
Income from investment operations: | |
Net investment income (loss) | | | 1.93 | (g) | | | (0.03 | ) | | | (0.09 | ) | |
Net realized and unrealized gain (loss) | | | (0.21 | )(b) | | | 5.72 | | | | 5.70 | | |
Total from investment operations | | | 1.72 | | | | 5.69 | | | | 5.61 | | |
Less distributions to shareholders: | |
Net realized gains | | | (5.04 | ) | | | (3.12 | ) | | | (0.77 | ) | |
Total distributions to shareholders | | | (5.04 | ) | | | (3.12 | ) | | | (0.77 | ) | |
Net asset value, end of period | | $ | 30.67 | | | $ | 33.99 | | | $ | 31.42 | | |
Total return | | | 5.61 | % | | | 19.05 | % | | | 21.61 | % | |
Ratios to average net assets(c) | |
Total gross expenses | | | 0.93 | % | | | 0.94 | % | | | 1.08 | %(d) | |
Total net expenses(e) | | | 0.93 | %(f) | | | 0.94 | %(f) | | | 0.96 | %(d)(f) | |
Net investment income (loss) | | | 6.10 | % | | | (0.08 | %) | | | (0.41 | %)(d) | |
Supplemental data | |
Net assets, end of period (in thousands) | | $ | 26,912 | | | $ | 373 | | | $ | 30 | | |
Portfolio turnover | | | 101 | % | | | 100 | % | | | 109 | % | |
Notes to Financial Highlights
(a) Based on operations from November 8, 2012 (commencement of operations) through the stated period end.
(b) Calculation of the net gain (loss) per share (both realized and unrealized) does not correlate to the aggregate realized and unrealized gain (loss) presented in the Statement of Operations due to the timing of subscriptions and redemptions of Fund shares in relation to fluctuations in the market value of the portfolio.
(c) In addition to the fees and expenses that the Fund bears directly, the Fund indirectly bears a pro rata share of the fees and expenses of any other funds in which it invests. Such indirect expenses are not included in the Fund's reported expense ratios.
(d) Annualized.
(e) Total net expenses include the impact of certain fee waivers/expense reimbursements made by the Investment Manager and certain of its affiliates, if applicable.
(f) The benefits derived from expense reductions had an impact of less than 0.01%.
(g) Net investment income per share includes special dividends. The effect of these dividends amounted to $2.00 per share.
The accompanying Notes to Financial Statements are an integral part of this statement.
Annual Report 2015
26
COLUMBIA MID CAP GROWTH FUND
FINANCIAL HIGHLIGHTS (continued)
| | | Year Ended August 31, | |
Class R5 | | 2015 | | 2014 | | 2013 | | 2012 | | 2011(a) | |
Per share data | |
Net asset value, beginning of period | | $ | 33.54 | | | $ | 31.03 | | | $ | 27.31 | | | $ | 26.47 | | | $ | 28.05 | | |
Income from investment operations: | |
Net investment income (loss) | | | 0.40 | (i) | | | 0.03 | | | | (0.04 | ) | | | 0.06 | | | | (0.03 | ) | |
Net realized and unrealized gain (loss) | | | 1.33 | | | | 5.63 | | | | 4.53 | | | | 1.61 | | | | (1.55 | )(b) | |
Total from investment operations | | | 1.73 | | | | 5.66 | | | | 4.49 | | | | 1.67 | | | | (1.58 | ) | |
Less distributions to shareholders: | |
Net realized gains | | | (5.07 | ) | | | (3.15 | ) | | | (0.77 | ) | | | (0.83 | ) | | | — | | |
Total distributions to shareholders | | | (5.07 | ) | | | (3.15 | ) | | | (0.77 | ) | | | (0.83 | ) | | | — | | |
Proceeds from regulatory settlements | | | — | | | | — | | | | — | | | | 0.00 | (c) | | | — | | |
Net asset value, end of period | | $ | 30.20 | | | $ | 33.54 | | | $ | 31.03 | | | $ | 27.31 | | | $ | 26.47 | | |
Total return | | | 5.72 | % | | | 19.21 | % | | | 16.94 | % | | | 6.50 | % | | | (5.63 | %) | |
Ratios to average net assets(d) | |
Total gross expenses | | | 0.82 | % | | | 0.81 | % | | | 0.81 | % | | | 0.78 | % | | | 0.78 | %(e)(f) | |
Total net expenses(g) | | | 0.82 | % | | | 0.81 | % | | | 0.81 | % | | | 0.78 | % | | | 0.78 | %(e)(f)(h) | |
Net investment income (loss) | | | 1.28 | % | | | 0.09 | % | | | (0.14 | %) | | | 0.22 | % | | | (0.24 | %)(e) | |
Supplemental data | |
Net assets, end of period (in thousands) | | $ | 37,589 | | | $ | 31,305 | | | $ | 3,847 | | | $ | 2,336 | | | $ | 2,198 | | |
Portfolio turnover | | | 101 | % | | | 100 | % | | | 109 | % | | | 141 | % | | | 138 | % | |
Notes to Financial Highlights
(a) Based on operations from March 7, 2011 (commencement of operations) through the stated period end.
(b) Calculation of the net gain (loss) per share (both realized and unrealized) does not correlate to the aggregate realized and unrealized gain (loss) presented in the Statement of Operations due to the timing of subscriptions and redemptions of Fund shares in relation to fluctuations in the market value of the portfolio.
(c) Rounds to zero.
(d) In addition to the fees and expenses that the Fund bears directly, the Fund indirectly bears a pro rata share of the fees and expenses of any other funds in which it invests. Such indirect expenses are not included in the Fund's reported expense ratios.
(e) Annualized.
(f) Ratios include line of credit interest expense which is less than 0.01%.
(g) Total net expenses include the impact of certain fee waivers/expense reimbursements made by the Investment Manager and certain of its affiliates, if applicable.
(h) The benefits derived from expense reductions had an impact of less than 0.01%.
(i) Net investment income per share includes special dividends. The effect of these dividends amounted to $0.39 per share.
The accompanying Notes to Financial Statements are an integral part of this statement.
Annual Report 2015
27
COLUMBIA MID CAP GROWTH FUND
FINANCIAL HIGHLIGHTS (continued)
| | | Year Ended August 31, | |
Class T | | 2015 | | 2014 | | 2013 | | 2012 | | 2011 | |
Per share data | |
Net asset value, beginning of period | | $ | 32.05 | | | $ | 29.82 | | | $ | 26.37 | | | $ | 25.72 | | | $ | 20.21 | | |
Income from investment operations: | |
Net investment income (loss) | | | 0.24 | (f) | | | (0.14 | ) | | | (0.09 | ) | | | (0.07 | ) | | | (0.18 | ) | |
Net realized and unrealized gain | | | 1.30 | | | | 5.43 | | | | 4.31 | | | | 1.55 | | | | 5.69 | | |
Total from investment operations | | | 1.54 | | | | 5.29 | | | | 4.22 | | | | 1.48 | | | | 5.51 | | |
Less distributions to shareholders: | |
Net realized gains | | | (4.98 | ) | | | (3.06 | ) | | | (0.77 | ) | | | (0.83 | ) | | | — | | |
Total distributions to shareholders | | | (4.98 | ) | | | (3.06 | ) | | | (0.77 | ) | | | (0.83 | ) | | | — | | |
Proceeds from regulatory settlements | | | — | | | | — | | | | — | | | | 0.00 | (a) | | | 0.00 | (a) | |
Net asset value, end of period | | $ | 28.61 | | | $ | 32.05 | | | $ | 29.82 | | | $ | 26.37 | | | $ | 25.72 | | |
Total return | | | 5.34 | % | | | 18.69 | % | | | 16.51 | % | | | 5.94 | % | | | 27.26 | % | |
Ratios to average net assets(b) | |
Total gross expenses | | | 1.20 | % | | | 1.24 | % | | | 1.26 | % | | | 1.28 | % | | | 1.26 | %(c) | |
Total net expenses(d) | | | 1.20 | %(e) | | | 1.24 | %(e) | | | 1.26 | %(e) | | | 1.28 | %(e) | | | 1.26 | %(c)(e) | |
Net investment income | | | 0.80 | % | | | (0.47 | %) | | | (0.32 | %) | | | (0.28 | %) | | | (0.69 | %) | |
Supplemental data | |
Net assets, end of period (in thousands) | | $ | 22,590 | | | $ | 23,951 | | | $ | 22,027 | | | $ | 20,965 | | | $ | 22,127 | | |
Portfolio turnover | | | 101 | % | | | 100 | % | | | 109 | % | | | 141 | % | | | 138 | % | |
Notes to Financial Highlights
(a) Rounds to zero.
(b) In addition to the fees and expenses that the Fund bears directly, the Fund indirectly bears a pro rata share of the fees and expenses of any other funds in which it invests. Such indirect expenses are not included in the Fund's reported expense ratios.
(c) Ratios include line of credit interest expense which is less than 0.01%.
(d) Total net expenses include the impact of certain fee waivers/expense reimbursements made by the Investment Manager and certain of its affiliates, if applicable.
(e) The benefits derived from expense reductions had an impact of less than 0.01%.
(f) Net investment income per share includes special dividends. The effect of these dividends amounted to $0.34 per share.
The accompanying Notes to Financial Statements are an integral part of this statement.
Annual Report 2015
28
COLUMBIA MID CAP GROWTH FUND
FINANCIAL HIGHLIGHTS (continued)
| | | Year Ended August 31, | |
Class W | | 2015 | | 2014 | | 2013 | | 2012 | | 2011(a) | |
Per share data | |
Net asset value, beginning of period | | $ | 32.15 | | | $ | 29.91 | | | $ | 26.43 | | | $ | 25.76 | | | $ | 22.67 | | |
Income from investment operations: | |
Net investment income (loss) | | | 0.21 | (h) | | | (0.23 | ) | | | (0.08 | ) | | | (0.05 | ) | | | (0.16 | ) | |
Net realized and unrealized gain | | | 1.33 | | | | 5.54 | | | | 4.33 | | | | 1.55 | | | | 3.25 | | |
Total from investment operations | | | 1.54 | | | | 5.31 | | | | 4.25 | | | | 1.50 | | | | 3.09 | | |
Less distributions to shareholders: | |
Net realized gains | | | (5.00 | ) | | | (3.07 | ) | | | (0.77 | ) | | | (0.83 | ) | | | — | | |
Total distributions to shareholders | | | (5.00 | ) | | | (3.07 | ) | | | (0.77 | ) | | | (0.83 | ) | | | — | | |
Proceeds from regulatory settlements | | | — | | | | — | | | | — | | | | 0.00 | (b) | | | 0.00 | (b) | |
Net asset value, end of period | | $ | 28.69 | | | $ | 32.15 | | | $ | 29.91 | | | $ | 26.43 | | | $ | 25.76 | | |
Total return | | | 5.32 | % | | | 18.71 | % | | | 16.59 | % | | | 6.01 | % | | | 13.63 | % | |
Ratios to average net assets(c) | |
Total gross expenses | | | 1.19 | % | | | 1.14 | % | | | 1.21 | % | | | 1.22 | % | | | 1.19 | %(d)(e) | |
Total net expenses(f) | | | 1.19 | %(g) | | | 1.14 | %(g) | | | 1.21 | %(g) | | | 1.22 | %(g) | | | 1.19 | %(d)(e)(g) | |
Net investment income (loss) | | | 0.71 | % | | | (0.69 | %) | | | (0.28 | %) | | | (0.21 | %) | | | (0.63 | %)(d) | |
Supplemental data | |
Net assets, end of period (in thousands) | | $ | 201 | | | $ | 284 | | | $ | 104,752 | | | $ | 66,704 | | | $ | 45,119 | | |
Portfolio turnover | | | 101 | % | | | 100 | % | | | 109 | % | | | 141 | % | | | 138 | % | |
Notes to Financial Highlights
(a) Based on operations from September 27, 2010 (commencement of operations) through the stated period end.
(b) Rounds to zero.
(c) In addition to the fees and expenses that the Fund bears directly, the Fund indirectly bears a pro rata share of the fees and expenses of any other funds in which it invests. Such indirect expenses are not included in the Fund's reported expense ratios.
(d) Annualized.
(e) Ratios include line of credit interest expense which is less than 0.01%.
(f) Total net expenses include the impact of certain fee waivers/expense reimbursements made by the Investment Manager and certain of its affiliates, if applicable.
(g) The benefits derived from expense reductions had an impact of less than 0.01%.
(h) Net investment income per share includes special dividends. The effect of these dividends amounted to $0.31 per share.
The accompanying Notes to Financial Statements are an integral part of this statement.
Annual Report 2015
29
COLUMBIA MID CAP GROWTH FUND
FINANCIAL HIGHLIGHTS (continued)
| | | Year Ended August 31, | |
Class Y | | 2015 | | 2014 | | 2013 | | 2012 | | 2011 | |
Per share data | |
Net asset value, beginning of period | | $ | 33.53 | | | $ | 31.01 | | | $ | 27.26 | | | $ | 26.46 | | | $ | 20.72 | | |
Income from investment operations: | |
Net investment income (loss) | | | 0.05 | (f) | | | 0.01 | | | | 0.07 | | | | 0.03 | | | | (0.04 | ) | |
Net realized and unrealized gain | | | 1.71 | | | | 5.66 | | | | 4.45 | | | | 1.60 | | | | 5.78 | | |
Total from investment operations | | | 1.76 | | | | 5.67 | | | | 4.52 | | | | 1.63 | | | | 5.74 | | |
Less distributions to shareholders: | |
Net realized gains | | | (5.08 | ) | | | (3.15 | ) | | | (0.77 | ) | | | (0.83 | ) | | | — | | |
Total distributions to shareholders | | | (5.08 | ) | | | (3.15 | ) | | | (0.77 | ) | | | (0.83 | ) | | | — | | |
Proceeds from regulatory settlements | | | — | | | | — | | | | — | | | | 0.00 | (a) | | | 0.00 | (a) | |
Net asset value, end of period | | $ | 30.21 | | | $ | 33.53 | | | $ | 31.01 | | | $ | 27.26 | | | $ | 26.46 | | |
Total return | | | 5.83 | % | | | 19.24 | % | | | 17.09 | % | | | 6.35 | % | | | 27.70 | % | |
Ratios to average net assets(b) | |
Total gross expenses | | | 0.73 | % | | | 0.75 | % | | | 0.83 | % | | | 0.88 | % | | | 0.86 | %(c) | |
Total net expenses(d) | | | 0.73 | % | | | 0.75 | % | | | 0.83 | % | | | 0.88 | % | | | 0.86 | %(c)(e) | |
Net investment income (loss) | | | 0.15 | % | | | 0.02 | % | | | 0.26 | % | | | 0.10 | % | | | (0.15 | %) | |
Supplemental data | |
Net assets, end of period (in thousands) | | $ | 3 | | | $ | 250 | | | $ | 229 | | | $ | 16 | | | $ | 32 | | |
Portfolio turnover | | | 101 | % | | | 100 | % | | | 109 | % | | | 141 | % | | | 138 | % | |
Notes to Financial Highlights
(a) Rounds to zero.
(b) In addition to the fees and expenses that the Fund bears directly, the Fund indirectly bears a pro rata share of the fees and expenses of any other funds in which it invests. Such indirect expenses are not included in the Fund's reported expense ratios.
(c) Ratios include line of credit interest expense which is less than 0.01%.
(d) Total net expenses include the impact of certain fee waivers/expense reimbursements made by the Investment Manager and certain of its affiliates, if applicable.
(e) The benefits derived from expense reductions had an impact of less than 0.01%.
(f) Net investment income per share includes special dividends. The effect of these dividends amounted to $0.04 per share.
The accompanying Notes to Financial Statements are an integral part of this statement.
Annual Report 2015
30
COLUMBIA MID CAP GROWTH FUND
FINANCIAL HIGHLIGHTS (continued)
| | | Year Ended August 31, | |
Class Z | | 2015 | | 2014 | | 2013 | | 2012 | | 2011 | |
Per share data | |
Net asset value, beginning of period | | $ | 33.39 | | | $ | 30.91 | | | $ | 27.23 | | | $ | 26.45 | | | $ | 20.72 | | |
Income from investment operations: | |
Net investment income (loss) | | | 0.32 | (f) | | | (0.06 | ) | | | (0.00 | )(a) | | | 0.01 | | | | (0.10 | ) | |
Net realized and unrealized gain | | | 1.36 | | | | 5.66 | | | | 4.45 | | | | 1.60 | | | | 5.83 | | |
Total from investment operations | | | 1.68 | | | | 5.60 | | | | 4.45 | | | | 1.61 | | | | 5.73 | | |
Less distributions to shareholders: | |
Net realized gains | | | (5.04 | ) | | | (3.12 | ) | | | (0.77 | ) | | | (0.83 | ) | | | — | | |
Total distributions to shareholders | | | (5.04 | ) | | | (3.12 | ) | | | (0.77 | ) | | | (0.83 | ) | | | — | | |
Proceeds from regulatory settlements | | | — | | | | — | | | | — | | | | 0.00 | (a) | | | 0.00 | (a) | |
Net asset value, end of period | | $ | 30.03 | | | $ | 33.39 | | | $ | 30.91 | | | $ | 27.23 | | | $ | 26.45 | | |
Total return | | | 5.58 | % | | | 19.07 | % | | | 16.84 | % | | | 6.27 | % | | | 27.65 | % | |
Ratios to average net assets(b) | |
Total gross expenses | | | 0.94 | % | | | 0.94 | % | | | 0.96 | % | | | 0.97 | % | | | 0.95 | %(c) | |
Total net expenses(d) | | | 0.94 | %(e) | | | 0.94 | %(e) | | | 0.96 | %(e) | | | 0.97 | %(e) | | | 0.95 | %(c)(e) | |
Net investment income (loss) | | | 1.01 | % | | | (0.17 | %) | | | (0.01 | %) | | | 0.03 | % | | | (0.39 | %) | |
Supplemental data | |
Net assets, end of period (in thousands) | | $ | 938,781 | | | $ | 1,149,098 | | | $ | 1,196,953 | | | $ | 1,274,026 | | | $ | 1,198,927 | | |
Portfolio turnover | | | 101 | % | | | 100 | % | | | 109 | % | | | 141 | % | | | 138 | % | |
Notes to Financial Highlights
(a) Rounds to zero.
(b) In addition to the fees and expenses that the Fund bears directly, the Fund indirectly bears a pro rata share of the fees and expenses of any other funds in which it invests. Such indirect expenses are not included in the Fund's reported expense ratios.
(c) Ratios include line of credit interest expense which is less than 0.01%.
(d) Total net expenses include the impact of certain fee waivers/expense reimbursements made by the Investment Manager and certain of its affiliates, if applicable.
(e) The benefits derived from expense reductions had an impact of less than 0.01%.
(f) Net investment income per share includes special dividends. The effect of these dividends amounted to $0.34 per share.
The accompanying Notes to Financial Statements are an integral part of this statement.
Annual Report 2015
31
COLUMBIA MID CAP GROWTH FUND
NOTES TO FINANCIAL STATEMENTS
August 31, 2015
Note 1. Organization
Columbia Mid Cap Growth Fund (the Fund), a series of Columbia Funds Series Trust I (the Trust), is a diversified fund. The Trust is registered under the Investment Company Act of 1940, as amended (the 1940 Act), as an open-end management investment company organized as a Massachusetts business trust.
Fund Shares
The Trust may issue an unlimited number of shares (without par value). The Fund offers Class A, Class B, Class C, Class I, Class K, Class R, Class R4, Class R5, Class T, Class W, Class Y and Class Z shares. Although all share classes generally have identical voting, dividend and liquidation rights, each share class votes separately when required by the Trust's organizational documents or by law. Different share classes pay different distribution amounts to the extent the expenses of such share classes differ, and distributions in liquidation will be proportional to the net asset value of each share class. Each share class has its own expense and sales charge structure.
Class A shares are subject to a maximum front-end sales charge of 5.75% based on the initial investment amount. Class A shares purchased without an initial sales charge in accounts aggregating $1 million to $50 million at the time of purchase are subject to a contingent deferred sales charge (CDSC) if the shares are sold within 18 months after purchase, charged as follows: 1.00% CDSC if redeemed within 12 months after purchase, and 0.50% CDSC if redeemed more than 12, but less than 18, months after purchase.
Class B shares may be subject to a maximum CDSC of 5.00% based upon the holding period after purchase. Class B shares will generally convert to Class A shares eight years after purchase. The Fund no longer accepts investments by new or existing investors in the Fund's Class B shares, except in connection with the reinvestment of any dividend and/or capital gain distributions in Class B shares of the Fund and exchanges by existing Class B shareholders of certain other funds within the Columbia Family of Funds.
Class C shares are subject to a 1.00% CDSC on shares redeemed within one year after purchase.
Class I shares are not subject to sales charges and are available only to the Columbia Family of Funds.
Class K shares are not subject to sales charges, however this share class is closed to new investors.
Class R shares are not subject to sales charges and are generally available only to certain retirement plans and other investors as described in the Fund's prospectus.
Class R4 shares are not subject to sales charges and are generally available only to omnibus retirement plans and certain investors as described in the Fund's prospectus.
Class R5 shares are not subject to sales charges and are generally available only to investors purchasing through authorized investment professionals and omnibus retirement plans.
Class T shares are subject to a maximum front-end sales charge of 5.75% based on the investment amount. Class T shares purchased without an initial sales charge in accounts aggregating $1 million to $50 million at the time of purchase are subject to a CDSC if the shares are sold within 18 months after purchase, charged as follows: 1.00% CDSC if redeemed within 12 months after purchase, and 0.50% CDSC if redeemed more than 12, but less than 18, months after purchase. Class T shares are available only to investors who received (and who have continuously held) Class T shares in connection with previous fund reorganizations.
Class W shares are not subject to sales charges and are available only to investors purchasing through authorized investment programs managed by investment professionals, including discretionary managed account programs.
Class Y shares are not subject to sales charges and are generally available only to certain retirement plans as described in the Fund's prospectus.
Class Z shares are not subject to sales charges and are available only to eligible investors, which are subject to different investment minimums as described in the Fund's prospectus.
Note 2. Summary of Significant Accounting Policies
Basis of Preparation
The Fund is an investment company that applies the accounting and reporting guidance in the Financial Accounting Standards Board (FASB) Accounting Standards Codification Topic 946, Financial Services — Investment Companies (ASC 946). The financial statements are prepared in accordance with U.S. generally accepted accounting principles (GAAP), which requires management to make certain estimates and assumptions that affect the reported amounts of assets
Annual Report 2015
32
COLUMBIA MID CAP GROWTH FUND
NOTES TO FINANCIAL STATEMENTS (continued)
August 31, 2015
and liabilities, the disclosure of contingent assets and liabilities at the date of the financial statements and the reported amounts of income and expenses during the reporting period. Actual results could differ from those estimates.
The following is a summary of significant accounting policies followed by the Fund in the preparation of its financial statements.
Security Valuation
All equity securities are valued at the close of business of the New York Stock Exchange (NYSE). Equity securities are valued at the last quoted sales price on the principal exchange or market on which they trade, except for securities traded on the NASDAQ Stock Market, which are valued at the NASDAQ official close price. Unlisted securities or listed securities for which there were no sales during the day are valued at the mean of the latest quoted bid and ask prices on such exchanges or markets.
Foreign equity securities are valued based on the closing price on the foreign exchange in which such securities are primarily traded. If any foreign equity security closing prices are not readily available, the securities are valued at the mean of the latest quoted bid and ask prices on such exchanges or markets. Foreign currency exchange rates are generally determined at 4:00 p.m. Eastern (U.S.) time. Many securities markets and exchanges outside the U.S. close prior to the close of the NYSE; therefore, the closing prices for securities in such markets or on such exchanges may not fully reflect events that occur after such close but before the close of the NYSE. In those situations, foreign securities will be fair valued pursuant to a policy adopted by the Board of Trustees (the Board), including, if available, utilizing a third party pricing service to determine these fair values. The third party pricing service takes into account multiple factors, including, but not limited to, movements in the U.S. securities markets, certain depositary receipts, futures contracts and foreign exchange rates that have occurred subsequent to the close of the foreign exchange or market, to determine a good faith estimate that reasonably reflects the current market conditions as of the close of the NYSE. The fair value of a security is likely to be different from the quoted or published price, if available.
Investments in open-end investment companies, including money market funds, are valued at their latest net asset value.
Investments for which market quotations are not readily available, or that have quotations which management believes are not reflective of market value or reliable, are valued at fair value as determined in good faith under procedures approved by and under the general supervision of the Board. If a security or class of securities (such as foreign securities) is valued at fair value, such value is likely to be different from the quoted or published price for the security.
The determination of fair value often requires significant judgment. To determine fair value, management may use assumptions including but not limited to future cash flows and estimated risk premiums. Multiple inputs from various sources may be used to determine fair value.
GAAP requires disclosure regarding the inputs and valuation techniques used to measure fair value and any changes in valuation inputs or techniques. In addition, investments shall be disclosed by major category. This information is disclosed following the Fund's Portfolio of Investments.
Security Transactions
Security transactions are accounted for on the trade date. Cost is determined and gains (losses) are based upon the specific identification method for both financial statement and federal income tax purposes.
Income Recognition
Corporate actions and dividend income are generally recorded net of any non-reclaimable tax withholdings, on the ex-dividend date or upon receipt of ex-dividend notification in the case of certain foreign securities.
The Fund may receive distributions from holdings in equity securities, business development companies (BDCs), exchange-traded funds, other regulated investment companies (RICs), and real estate investment trusts (REITs), which report information on the tax character of their distributions annually. These distributions are allocated to dividend income, capital gain and return of capital based on actual information reported. Return of capital is recorded as a reduction of the cost basis of securities held. If the Fund no longer owns the applicable securities, return of capital is recorded as a realized gain. With respect to REITs, to the extent actual information has not yet been reported, estimates for return of capital are made by the Fund's management. Management's estimates are subsequently adjusted when the actual character of the distributions is disclosed by the REITs, which could result
Annual Report 2015
33
COLUMBIA MID CAP GROWTH FUND
NOTES TO FINANCIAL STATEMENTS (continued)
August 31, 2015
in a proportionate change in return of capital to shareholders.
Awards from class action litigation are recorded as a reduction of cost basis if the Fund still owns the applicable securities on the payment date. If the Fund no longer owns the applicable securities, the proceeds are recorded as realized gains.
Expenses
General expenses of the Trust are allocated to the Fund and other funds of the Trust based upon relative net assets or other expense allocation methodologies determined by the nature of the expense. Expenses directly attributable to the Fund are charged to the Fund. Expenses directly attributable to a specific class of shares are charged to that share class.
Determination of Class Net Asset Value
All income, expenses (other than class-specific expenses, which are charged to that share class, as shown in the Statement of Operations) and realized and unrealized gains (losses) are allocated to each class of the Fund on a daily basis, based on the relative net assets of each class, for purposes of determining the net asset value of each class.
Federal Income Tax Status
The Fund intends to qualify each year as a regulated investment company under Subchapter M of the Internal Revenue Code, as amended, and will distribute substantially all of its taxable income (including net short-term capital gains), if any, for its tax year, and as such will not be subject to federal income taxes. In addition, the Fund intends to distribute in each calendar year substantially all of its net investment income, capital gains and certain other amounts, if any, such that the Fund should not be subject to federal excise tax. Therefore, no federal income or excise tax provision is recorded.
Foreign Taxes
The Fund may be subject to foreign taxes on income, gains on investments or currency repatriation, a portion of which may be recoverable. The Fund will accrue such taxes and recoveries, as applicable, based upon its current interpretation of tax rules and regulations that exist in the markets in which it invests.
Realized gains in certain countries may be subject to foreign taxes at the Fund level, based on statutory rates. The Fund accrues for such foreign taxes on realized and unrealized gains at the appropriate rate for each
jurisdiction, as applicable. The amount, if any, is disclosed as a liability on the Statement of Assets and Liabilities.
Distributions to Shareholders
Distributions from net investment income, if any, are declared and paid annually. Net realized capital gains, if any, are distributed along with the income distribution. Income distributions and capital gain distributions are determined in accordance with federal income tax regulations, which may differ from GAAP.
Guarantees and Indemnifications
Under the Trust's organizational documents and, in some cases, by contract, its officers and trustees are indemnified against certain liabilities arising out of the performance of their duties to the Trust or its funds. In addition, certain of the Fund's contracts with its service providers contain general indemnification clauses. The Fund's maximum exposure under these arrangements is unknown since the amount of any future claims that may be made against the Fund cannot be determined, and the Fund has no historical basis for predicting the likelihood of any such claims.
Recent Accounting Pronouncement
Fair Value Measurement (Topic 820), Disclosure for Investments in Certain Entities That Calculate Net Asset Value per Share (or Its Equivalent)
In May 2015, the Financial Accounting Standards Board (FASB) issued Accounting Standards Update (ASU) No. 2015-07, Fair Value Measurement (Topic 820), Disclosure for Investments in Certain Entities That Calculate Net Asset Value per Share (or Its Equivalent). ASU No. 2015-07 changes the disclosure requirements for investments for which fair value is measured using the net asset value per share practical expedient. The disclosure requirements are effective for annual periods beginning after December 15, 2015 and interim periods within those fiscal years. At this time, management is evaluating the implications of this guidance and the impact it will have on the financial statement amounts and footnote disclosures, if any.
Note 3. Fees and Other Transactions with Affiliates
Investment Management Fees
Under an Investment Management Services Agreement, Columbia Management Investment Advisers, LLC (the Investment Manager), a wholly-owned subsidiary of
Annual Report 2015
34
COLUMBIA MID CAP GROWTH FUND
NOTES TO FINANCIAL STATEMENTS (continued)
August 31, 2015
Ameriprise Financial, Inc. (Ameriprise Financial), determines which securities will be purchased, held or sold. The investment management fee is an annual fee that is equal to a percentage of the Fund's average daily net assets that declines from 0.76% to 0.62% as the Fund's net assets increase. The effective investment management fee rate for the year ended August 31, 2015 was 0.68% of the Fund's average daily net assets.
Administration Fees
Under an Administrative Services Agreement, the Investment Manager also serves as the Fund Administrator. The Fund pays the Fund Administrator an annual fee for administration and accounting services equal to a percentage of the Fund's average daily net assets that declines from 0.06% to 0.03% as the Fund's net assets increase. The effective administration fee rate for the year ended August 31, 2015 was 0.05% of the Fund's average daily net assets.
Compensation of Board Members
Board members, who are not officers or employees of the Investment Manager or Ameriprise Financial, are compensated for their services to the Fund as disclosed in the Statement of Operations. These Board members may participate in a Deferred Compensation Plan (the Plan) which may be terminated at any time. Obligations of the Plan will be paid solely out of the Fund's assets, and all amounts payable under the Plan constitute a general unsecured obligation of the Fund.
Compensation of Chief Compliance Officer
The Board has appointed a Chief Compliance Officer to the Fund in accordance with federal securities regulations. The Fund is allocated a portion of the expenses associated with the Chief Compliance Officer based on relative net assets of the Trust.
Transfer Agency Fees
Under a Transfer and Dividend Disbursing Agent Agreement, Columbia Management Investment Services Corp. (the Transfer Agent), an affiliate of the Investment Manager and a wholly-owned subsidiary of Ameriprise Financial, is responsible for providing transfer agency services to the Fund. The Transfer Agent has contracted with Boston Financial Data Services (BFDS) to serve as sub-transfer agent.
Effective November 1, 2014, the Transfer Agent receives a monthly transfer agency fee based on the number or the average value of accounts, depending on the type of account. Prior to November 1, 2014, the Transfer Agent
received a monthly account-based service fee based on the number of open accounts. In addition, the Transfer Agent also receives sub-transfer agency fees based on a percentage of the average aggregate value of the Fund's shares maintained in omnibus accounts (other than omnibus accounts for which American Enterprise Investment Services Inc. is the broker of record or accounts where the beneficial shareholder is a customer of Ameriprise Financial Services, Inc., for which the Transfer Agent receives a per account fee). The Transfer Agent pays the fees of BFDS for services as sub-transfer agent and is not entitled to reimbursement for such fees from the Fund (with the exception of out-of-pocket fees).
The Transfer Agent also receives compensation from the Fund for various shareholder services and reimbursements for certain out-of-pocket fees. Total transfer agency fees for Class K and Class R5 shares are subject to an annual limitation of not more than 0.05% of the average daily net assets attributable to each share class. Class I and Class Y shares do not pay transfer agency fees. Prior to December 31, 2014, Class A, Class B, Class C, Class R, Class R4, Class T, Class W and Class Z shares were subject to an annual transfer agent fee limitation of not more than 0.19% of the average annual net assets attributable to each share class.
For the year ended August 31, 2015, the Fund's effective transfer agency fee rates as a percentage of average daily net assets of each class were as follows:
Class A | | | 0.17 | % | |
Class B | | | 0.17 | | |
Class C | | | 0.17 | | |
Class K | | | 0.05 | | |
Class R | | | 0.17 | | |
Class R4 | | | 0.16 | | |
Class R5 | | | 0.05 | | |
Class T | | | 0.17 | | |
Class W | | | 0.17 | | |
Class Z | | | 0.17 | | |
The Fund and certain other associated investment companies have severally, but not jointly, guaranteed the performance and observance of all the terms and conditions of a lease entered into by Seligman Data Corp. (SDC), the former transfer agent, including the payment of rent by SDC (the Guaranty). SDC was the legacy Seligman funds' former transfer agent.
The lease and the Guaranty expire in January 2019. At August 31, 2015, the Fund's total potential future
Annual Report 2015
35
COLUMBIA MID CAP GROWTH FUND
NOTES TO FINANCIAL STATEMENTS (continued)
August 31, 2015
obligation over the life of the Guaranty is $131,247. The liability remaining at August 31, 2015 for non-recurring charges associated with the lease amounted to $75,471 and is recorded as a part of the payable for other expenses in the Statement of Assets and Liabilities. SDC is owned by six associated investment companies, including the Fund. The Fund's ownership interest in SDC at August 31, 2015 is recorded as a part of other assets in the Statement of Assets and Liabilities at a cost of $2,199, which approximates the fair value of the ownership interest.
An annual minimum account balance fee of $20 may apply to certain accounts with a value below the applicable share class's initial minimum investment requirements to reduce the impact of small accounts on transfer agency fees. These minimum account balance fees are remitted to the Fund and recorded as part of expense reductions in the Statement of Operations. For the year ended August 31, 2015, these minimum account balance fees reduced total expenses of the Fund by $5,869.
Plan Administration Fees
Under a Plan Administration Services Agreement with the Transfer Agent, the Fund pays an annual fee at a rate of 0.25% of the Fund's average daily net assets attributable to Class K shares for the provision of various administrative, recordkeeping, communication and educational services.
Distribution and Service Fees
The Fund has an agreement with Columbia Management Investment Distributors, Inc. (the Distributor), an affiliate of the Investment Manager and a wholly-owned subsidiary of Ameriprise Financial, for distribution and shareholder services. The Board has approved, and the Fund has adopted, distribution and shareholder service plans (the Plans) applicable to certain share classes, which set the distribution and service fees for the Fund. These fees are calculated daily and are intended to compensate the Distributor and/or eligible selling and/or servicing agents for selling shares of the Fund and providing services to investors.
Under the Plans, the Fund pays a monthly service fee to the Distributor at the maximum annual rate of 0.25% of the average daily net assets attributable to Class A, Class B, Class C and Class W shares of the Fund. Also under the Plans, the Fund pays a monthly distribution fee to the Distributor at the maximum annual rates of 0.10%, 0.75%, 0.75%, 0.50% and 0.25% of the average daily net
assets attributable to Class A, Class B, Class C, Class R and Class W shares of the Fund, respectively.
Although the Fund may pay distribution and service fees up to a maximum annual rate of 0.35% of the Fund's average daily net assets attributable to Class A shares (comprised of up to 0.10% for distribution services and up to 0.25% for shareholder liaison services), the Fund currently limits such fees to an aggregate fee of not more than 0.25% of the Fund's average daily net assets attributable to Class A shares.
Although the Fund may pay a distribution fee up to 0.25% of the Fund's average daily net assets attributable to Class W shares and a service fee of up to 0.25% of the Fund's average daily net assets attributable to Class W shares, however the aggregate fee shall not exceed 0.25% of the Fund's average daily net assets attributable to Class W shares.
Shareholder Services Fees
The Fund has adopted a shareholder services plan that permits it to pay for certain services provided to Class T shareholders by their selling and/or servicing agents. The Fund may pay shareholder servicing fees up to an aggregate annual rate of 0.50% of the Fund's average daily net assets attributable to Class T shares (comprised of up to 0.25% for shareholder liaison services and up to 0.25% for administrative support services). Effective January 1, 2015, these fees are currently limited to an aggregate annual rate of not more than 0.25% of the Fund's average daily net assets attributable to Class T shares. Prior to January 1, 2015, these fees were limited to 0.30% of the Fund's average daily net assets attributable to Class T shares. The effective shareholder services fee rate for the year ended August 31, 2015 was 0.27% of the Fund's average daily net assets attributable to Class T shares.
Sales Charges
Sales charges, including front-end charges and CDSCs, received by the Distributor for distributing Fund shares were $314,355 for Class A, $2,229 for Class B, $595 for Class C and $27 for Class T shares for the year ended August 31, 2015.
Expenses Waived/Reimbursed by the Investment Manager and its Affiliates
The Fund's expense ratio is subject to an expense reimbursement arrangement pursuant to which fees will be waived and/or expenses reimbursed (excluding certain fees and expenses described below), so that the
Annual Report 2015
36
COLUMBIA MID CAP GROWTH FUND
NOTES TO FINANCIAL STATEMENTS (continued)
August 31, 2015
Fund's net operating expenses, after giving effect to fees waived/expenses reimbursed and any balance credits and/or overdraft charges from the Fund's custodian, do not exceed the annual rates of:
| | | Voluntary
Expense Cap
Effective
January 1, 2015 | | Contractual
Expense Cap
Prior to
January 1, 2015 | |
Class A | | | 1.30 | % | | | 1.33 | % | |
Class B | | | 2.05 | | | | 2.08 | | |
Class C | | | 2.05 | | | | 2.08 | | |
Class I | | | 0.92 | | | | 0.94 | | |
Class K | | | 1.22 | | | | 1.24 | | |
Class R | | | 1.55 | | | | 1.58 | | |
Class R4 | | | 1.05 | | | | 1.08 | | |
Class R5 | | | 0.97 | | | | 0.99 | | |
Class T | | | 1.30 | | | | 1.38 | | |
Class W | | | 1.30 | | | | 1.33 | | |
Class Y | | | 0.92 | | | | 0.94 | | |
Class Z | | | 1.05 | | | | 1.08 | | |
The voluntary expense cap arrangement may be revised or discontinued at any time. The contractual agreement may be modified or amended only with approval from all parties. Under the arrangements, the following fees and expenses are excluded from the waiver/reimbursement commitment, and therefore will be paid by the Fund, if applicable: taxes (including foreign transaction taxes), expenses associated with investments in affiliated and non-affiliated pooled investment vehicles (including mutual funds and exchange-traded funds), transaction costs and brokerage commissions, costs related to any securities lending program, dividend and interest expenses associated with securities sold short, inverse floater program fees and expenses, transaction charges and interest on borrowed money, interest and extraordinary expenses. Any fees waived and/or expenses reimbursed under the expense reimbursement arrangements described above are not recoverable by the Investment Manager or its affiliates in future periods.
Note 4. Federal Tax Information
The timing and character of income and capital gain distributions are determined in accordance with income tax regulations, which may differ from GAAP because of temporary or permanent book to tax differences.
At August 31, 2015, these differences are primarily due to differing treatment for capital loss carryforwards, deferral/reversal of wash sale losses, Trustees' deferred compensation, distribution reclassifications and
proceeds from regulatory settlements. To the extent these differences are permanent, reclassifications are made among the components of the Fund's net assets in the Statement of Assets and Liabilities. Temporary differences do not require reclassifications. In the Statement of Assets and Liabilities the following reclassifications were made:
Undistributed net investment income | | $ | (713,458 | ) | |
Accumulated net realized gain | | | 1,067,269 | | |
Paid-in capital | | | (353,811 | ) | |
Net investment income (loss) and net realized gains (losses), as disclosed in the Statement of Operations, and net assets were not affected by this reclassification.
The tax character of distributions paid during the years indicated was as follows:
Year Ended August 31, | | 2015 | | 2014 | |
Ordinary income | | $ | 26,626,338 | | | $ | 14,739,942 | | |
Long-term capital gains | | | 312,287,096 | | | | 233,784,439 | | |
Total | | | 338,913,434 | | | | 248,524,381 | | |
Short-term capital gain distributions, if any, are considered ordinary income distributions for tax purposes.
At August 31, 2015, the components of distributable earnings on a tax basis were as follows:
Undistributed ordinary income | | $ | 19,321,010 | | |
Undistributed long-term capital gains | | | 273,898,815 | | |
Capital loss carryforwards | | | (27,659,954 | ) | |
Net unrealized appreciation | | | 386,582,208 | | |
At August 31, 2015, the cost of investments for federal income tax purposes was $1,654,148,870 and the aggregate gross unrealized appreciation and depreciation based on that cost was:
Unrealized appreciation | | $ | 433,273,367 | | |
Unrealized depreciation | | | (46,691,159 | ) | |
Net unrealized appreciation | | | 386,582,208 | | |
The following capital loss carryforwards, determined at August 31, 2015, may be available to reduce taxable income arising from future net realized gains on investments, if any, to the extent permitted by the Internal Revenue Code:
Year of Expiration | | Amount ($) | |
| 2016 | | | 27,659,954 | | |
Annual Report 2015
37
COLUMBIA MID CAP GROWTH FUND
NOTES TO FINANCIAL STATEMENTS (continued)
August 31, 2015
For the year ended August 31, 2015, $29,522,690 of capital loss carryforward was utilized and $226,710 was permanently lost.
Management of the Fund has concluded that there are no significant uncertain tax positions in the Fund that would require recognition in the financial statements. However, management's conclusion may be subject to review and adjustment at a later date based on factors including, but not limited to, new tax laws, regulations, and administrative interpretations (including relevant court decisions). Generally, the Fund's federal tax returns for the prior three fiscal years remain subject to examination by the Internal Revenue Service.
Note 5. Portfolio Information
The cost of purchases and proceeds from sales of securities, excluding short-term investments and derivatives, if any, aggregated to $2,190,640,010 and $2,770,909,350, respectively, for the year ended August 31, 2015. The amount of purchase and sale activity impacts the portfolio turnover rate reported in the Financial Highlights.
Note 6. Affiliated Money Market Fund
The Fund invests in Columbia Short-Term Cash Fund, an affiliated money market fund established for the exclusive use by the Fund and other affiliated funds. The income earned by the Fund from such investments is included as Dividends — affiliated issuers in the Statement of Operations. As an investing fund, the Fund indirectly bears its proportionate share of the expenses of Columbia Short-Term Cash Fund.
Note 7. Line of Credit
The Fund has entered into a revolving credit facility with a syndicate of banks led by JPMorgan Chase Bank, N.A. whereby the Fund may borrow for the temporary funding of shareholder redemptions or for other temporary or emergency purposes. Pursuant to a December 9, 2014 amendment, the credit facility agreement, which is a collective agreement between the Fund and certain other funds managed by the Investment Manager, severally and not jointly, permits collective borrowings up to $550 million. Interest is charged to each participating fund based on its borrowings at a rate equal to the higher of (i) the overnight federal funds rate plus 1.00% or (ii) the one-month LIBOR rate plus 1.00%. Each borrowing under the credit facility matures no later than 60 days after the date of borrowing. The Fund also pays a commitment fee equal to its pro rata share of the amount of the credit
facility at a rate of 0.075% per annum. The commitment fee is included in other expenses in the Statement of Operations. Prior to the December 9, 2014 amendment, the credit facility agreement permitted borrowings up to $500 million under the same terms and interest rates as described above.
The Fund had no borrowings during the year ended August 31, 2015.
Note 8. Significant Risks
Consumer Discretionary Sector Risk
The Fund may be more susceptible to the particular risks that may affect companies in the consumer discretionary sector than if it were invested in a wider variety of companies in unrelated sectors. Companies in the consumer discretionary sector are subject to certain risks, including fluctuations in the performance of the overall domestic and international economy, interest rate changes, increased competition and consumer confidence. Performance of such companies may be affected by factors including reduced disposable household income, reduced consumer spending, changing demographics and consumer tastes.
Shareholder Concentration Risk
At August 31, 2015, one unaffiliated shareholder of record owned 14.2% of the outstanding shares of the Fund in one or more accounts. The Fund has no knowledge about whether any portion of those shares was owned beneficially. Affiliated shareholders of record owned 32.3% of the outstanding shares of the Fund in one or more accounts. Subscription and redemption activity by concentrated accounts may have a significant effect on the operations of the Fund. In the case of a large redemption, the Fund may be forced to sell investments at inopportune times, including its liquid or more liquid positions, resulting in Fund losses and the Fund holding a higher percentage of less liquid or illiquid securities. Large redemptions could result in decreased economies of scale and increased operating expenses for non-redeeming Fund shareholders.
Note 9. Subsequent Events
Management has evaluated the events and transactions that have occurred through the date the financial statements were issued and noted no items requiring adjustment of the financial statements or additional disclosure.
Annual Report 2015
38
COLUMBIA MID CAP GROWTH FUND
NOTES TO FINANCIAL STATEMENTS (continued)
August 31, 2015
Note 10. Information Regarding Pending and Settled Legal Proceedings
In December 2005, without admitting or denying the allegations, American Express Financial Corporation (AEFC, which is now known as Ameriprise Financial, Inc. (Ameriprise Financial)) entered into settlement agreements with the Securities and Exchange Commission (SEC) and Minnesota Department of Commerce (MDOC) related to market timing activities. As a result, AEFC was censured and ordered to cease and desist from committing or causing any violations of certain provisions of the Investment Advisers Act of 1940, the Investment Company Act of 1940, and various Minnesota laws. AEFC agreed to pay disgorgement of $10 million and civil money penalties of $7 million. AEFC also agreed to retain an independent distribution consultant to assist in developing a plan for distribution of all disgorgement and civil penalties ordered by the SEC in accordance with various undertakings detailed at http://www.sec.gov/litigation/admin/ia-2451.pdf. Ameriprise Financial and its affiliates have cooperated with the SEC and the MDOC in these legal proceedings, and have made regular reports to the Funds' Boards of Trustees.
Ameriprise Financial and certain of its affiliates have historically been involved in a number of legal, arbitration and regulatory proceedings, including routine litigation, class actions, and governmental actions, concerning matters arising in connection with the conduct of their business activities. Ameriprise Financial believes that the Funds are not currently the subject of, and that neither Ameriprise Financial nor any of its affiliates are the subject of, any pending legal, arbitration or regulatory proceedings that are likely to have a material adverse effect on the Funds or the ability of Ameriprise Financial or its affiliates to perform under their contracts with the Funds. Ameriprise Financial is required to make quarterly (10-Q), annual (10-K) and, as necessary, 8-K filings with the SEC on legal and regulatory matters that relate to Ameriprise Financial and its affiliates. Copies of these filings may be obtained by accessing the SEC website at www.sec.gov.
There can be no assurance that these matters, or the adverse publicity associated with them, will not result in increased fund redemptions, reduced sale of fund shares or other adverse consequences to the Funds. Further, although we believe proceedings are not likely to have a material adverse effect on the Funds or the ability of Ameriprise Financial or its affiliates to perform under
their contracts with the Funds, these proceedings are subject to uncertainties and, as such, we are unable to estimate the possible loss or range of loss that may result. An adverse outcome in one or more of these proceedings could result in adverse judgments, settlements, fines, penalties or other relief that could have a material adverse effect on the consolidated financial condition or results of operations of Ameriprise Financial.
Annual Report 2015
39
COLUMBIA MID CAP GROWTH FUND
REPORT OF INDEPENDENT REGISTERED PUBLIC ACCOUNTING FIRM
To the Trustees of Columbia Funds Series Trust I and the Shareholders of
Columbia Mid Cap Growth Fund
In our opinion, the accompanying statement of assets and liabilities, including the portfolio of investments, and the related statements of operations and of changes in net assets and the financial highlights present fairly, in all material respects, the financial position of Columbia Mid Cap Growth Fund (the "Fund," a series of Columbia Funds Series Trust I) at August 31, 2015, and the results of its operations, the changes in its net assets and the financial highlights for each of the periods indicated, in conformity with accounting principles generally accepted in the United States of America. These financial statements and financial highlights (hereafter referred to as "financial statements") are the responsibility of the Fund's management. Our responsibility is to express an opinion on these financial statements based on our audits. We conducted our audits of these financial statements in accordance with the standards of the Public Company Accounting Oversight Board (United States). Those standards require that we plan and perform the audit to obtain reasonable assurance about whether the financial statements are free of material misstatement. An audit includes examining, on a test basis, evidence supporting the amounts and disclosures in the financial statements, assessing the accounting principles used and significant estimates made by management, and evaluating the overall financial statement presentation. We believe that our audits, which included confirmation of securities at August 31, 2015 by correspondence with the custodian, brokers and transfer agent, provide a reasonable basis for our opinion.
PricewaterhouseCoopers LLP
Minneapolis, MN
October 22, 2015
Annual Report 2015
40
COLUMBIA MID CAP GROWTH FUND
FEDERAL INCOME TAX INFORMATION
(Unaudited)
The Fund hereby designates the following tax attributes for the fiscal year ended August 31, 2015. Shareholders will be notified in early 2016 of the amounts for use in preparing 2015 income tax returns.
Tax Designations:
| Qualified Dividend Income | | | 63.96 | % | |
| Dividends Received Deduction | | | 61.37 | % | |
Capital Gain Dividend | | $ | 291,668,625 | | |
Qualified Dividend Income. For taxable, non-corporate shareholders, the percentage of ordinary income distributed during the fiscal year that represents qualified dividend income subject to reduced tax rates.
Dividends Received Deduction. The percentage of ordinary income distributed during the fiscal year that qualifies for the corporate dividends received deduction.
Capital Gain Dividend. The Fund designates as a capital gain dividend the amount reflected above, or if subsequently determined to be different, the net capital gain of such fiscal period.
Annual Report 2015
41
COLUMBIA MID CAP GROWTH FUND
The Trustees serve terms of indefinite duration. The names and birth years of the Trustees and Officers of the Funds in Columbia Funds Series Trust I, the year each was first elected or appointed to office, their principal business occupations during at least the last five years, the number of Funds overseen by each Trustee and other directorships they hold are shown below. Each officer listed below serves as an officer of each Fund in Columbia Funds Series Trust I. The mailing address of each Trustee is: c/o Columbia Management Investment Advisers, LLC, 225 Franklin Street, Mail Drop BX32 05228, Boston, MA 02110.
Independent Trustees
Name, Year of Birth
and Position Held
with the Trust | | Year First
Appointed or
Elected as
Trustee to any
Fund Currently
in the Columbia
Funds Complex
or a Predecessor
Thereof | | Principal Occupation(s)
during the Past Five Years | | Number
of Funds
in the
Columbia
Funds
Complex
Overseen | | Other Directorships
Held by Trustee During
the Past Five Years | |
Janet Langford Carrig
(Born 1957)
Trustee | | | 1996 | | | Senior Vice President, General Counsel and Corporate Secretary, ConocoPhillips (integrated energy company) since September 2007; Deputy General Counsel — Corporate Legal Services, ConocoPhillips from August 2006 to August 2007; Partner, Zelle, Hofmann, Voelbel, Mason & Gette LLP (law firm) from March 2005 to July 2006; Adjunct Professor of Law, Northwestern University from September 2004 to June 2006; Director, UAL Corporation (airline) from February 2006 to July 2006; Chief Administrative Officer and Senior Vice President, Kmart Holding Corporation (consumer goods) from September 2003 to March 2004 | | | 60 | | | None | |
Douglas A. Hacker
(Born 1955)
Trustee and Chairman
of the Board | | | 1996 | | | Independent business executive since May 2006; Executive Vice President — Strategy of United Airlines from December 2002 to May 2006; President of UAL Loyalty Services (airline marketing company) from September 2001 to December 2002; Executive Vice President and Chief Financial Officer of United Airlines from July 1999 to September 2001 | | | 60 | | | Spartan Nash Company, (food distributor); Nash Finch Company (food distributor) from 2005 to 2013; Aircastle Limited (aircraft leasing); SeaCube Container Leasing Ltd. (container leasing) from 2010 to 2013; and Travelport Worldwide Limited (travel information technology) | |
Nancy T. Lukitsh
(Born 1956)
Trustee | | | 2011 | | | Senior Vice President, Partner and Director of Marketing, Wellington Management Company, LLP (investment adviser) from 1997 to 2010; Chair, Wellington Management Investment Portfolios (commingled non-U.S. investment pools) from 2007 to 2010; Director, Wellington Trust Company, NA and other Wellington affiliates from 1997 to 2010 | | | 60 | | | None | |
William E. Mayer
(Born 1940)
Trustee | | | 1991 | | | Partner, Park Avenue Equity Partners (private equity) since February 1999 | | | 60 | | | DynaVox Inc. (speech creation); Lee Enterprises (print media); WR Hambrecht + Co. (financial service provider) from 2000 to 2012; BlackRock Kelso Capital Corporation (investment company); and Premier, Inc. (healthcare) | |
Annual Report 2015
42
COLUMBIA MID CAP GROWTH FUND
TRUSTEES AND OFFICERS (continued)
Independent Trustees (continued)
Name, Year of Birth
and Position Held
with the Trust | | Year First
Appointed or
Elected as
Trustee to any
Fund Currently
in the Columbia
Funds Complex
or a Predecessor
Thereof | | Principal Occupation(s)
during the Past Five Years | | Number
of Funds
in the
Columbia
Funds
Complex
Overseen | | Other Directorships
Held by Trustee During
the Past Five Years | |
David M. Moffett
(Born 1952)
Trustee | | | 2011 | | | Retired. Consultant to Bridgewater and Associates; Chief Executive Officer, Federal Home Loan Mortgage Corporation, from 2008 to 2009; Senior Adviser, Global Financial Services Group, Carlyle Group, Inc., from 2007 to 2008; Vice Chairman and Chief Financial Officer, U.S. Bancorp, from 1993 to 2007 | | | 60 | | | Building Materials Holding Corp. (building materials and construction services); CIT Group Inc. (commercial and consumer finance); eBay Inc. (online trading community); E.W. Scripps Co. (print and television media); Genworth Financial, Inc. (financial and insurance products and services); MBIA Inc. (financial service provider); Paypal Holdings Inc. (payment and data processing services); and University of Oklahoma Foundation | |
Charles R. Nelson
(Born 1942)
Trustee | | | 1981 | | | Retired. Professor Emeritus, University of Washington since 2011; Professor of Economics, University of Washington from 1976 to 2011; Ford and Louisa Van Voorhis Professor of Political Economy, University of Washington from 1993 to 2011; Adjunct Professor of Statistics, University of Washington from 1980 to 2011; Associate Editor, Journal of Money, Credit and Banking from September 1993 to 2008; consultant on econometric and statistical matters | | | 60 | | | None | |
John J. Neuhauser
(Born 1943)
Trustee | | | 1984 | | | President, Saint Michael's College since August 2007; Director or Trustee of several non-profit organizations, including Fletcher Allen Health Care, Inc.; Academic Vice President and Dean of Faculties, Boston College from August 1999 to October 2005; University Professor, Boston College from November 2005 to August 2007 | | | 60 | | | Liberty All-Star Equity Fund and Liberty All-Star Growth Fund (closed-end funds) | |
Patrick J. Simpson
(Born 1944)
Trustee | | | 2000 | | | Partner, Perkins Coie LLP (law firm) | | | 60 | | | None | |
Anne-Lee Verville
(Born 1945)
Trustee | | | 1998 | | | Retired. General Manager, Global Education Industry from 1994 to 1997, President — Application Systems Division from 1991 to 1994, Chief Financial Officer — US Marketing & Services from 1988 to 1991, and Chief Information Officer from 1987 to 1988, IBM Corporation (computer and technology) | | | 60 | | | Enesco Group, Inc. (producer of giftware and home and garden decor products) from 2001 to 2006 | |
Annual Report 2015
43
COLUMBIA MID CAP GROWTH FUND
TRUSTEES AND OFFICERS (continued)
Interested Trustee Affiliate with Investment Manager*
Name, Year of Birth
and Position Held
with the Trust | | Year First
Appointed or
Elected as
Trustee to any
Fund Currently
in the Columbia
Funds Complex
or a Predecessor
Thereof | | Principal Occupation(s)
during the Past Five Years | | Number
of Funds
in the
Columbia
Funds
Complex
Overseen | | Other Directorships
Held by Trustee During
the Past Five Years | |
William F. Truscott
(Born 1960)
Trustee | | | 2012 | | | Chairman of the Board and President, Columbia Management Investment Advisers, LLC since May 2010 and February 2012, respectively (previously President and Chief Investment Officer, 2001-April 2010); Chief Executive Officer, Global Asset Management, Ameriprise Financial, Inc. since September 2012 (previously Chief Executive Officer, U.S. Asset Management & President, Annuities, May 2010-September 2012 and President — U.S. Asset Management and Chief Investment Officer, 2005-April 2010); Director and Chief Executive Officer, Columbia Management Investment Distributors, Inc. since May 2010 and February 2012, respectively (previously Chairman of the Board and Chief Executive Officer, 2006-April 2010); Chairman of the Board and Chief Executive Officer, RiverSource Distributors, Inc. since 2006; Director, Threadneedle Asset Management Holdings, SARL since 2014; President and Chief Executive Officer, Ameriprise Certificate Company, 2006-August 2012 | | | 187 | | | Chairman of the Board, Columbia Management Investment Advisers, LLC since May 2010; Director, Columbia Management Investment Distributors, Inc. since May 2010; Director, Ameriprise Certificate Company, 2006 to January 2013 | |
* Interested person (as defined under the 1940 Act) by reason of being an officer, director, security holder and/or employee of the Investment Manager or Ameriprise Financial.
The Statement of Additional Information has additional information about the Fund's Board members and is available, without charge, upon request by calling 800.345.6611; contacting your financial intermediary; or visiting columbiathreadneedle.com/us.
The Board has appointed officers who are responsible for day-to-day business decisions based on policies it has established. The officers serve at the pleasure of the Board. In addition to Mr. Truscott, who is Senior Vice President, the Funds' other officers are:
Fund Officers
Name,
Address and
Year of Birth | | Position and Year
First Appointed to
Position for any Fund
in the Columbia
Funds Complex or a
Predecessor Thereof | | Principal Occupation(s) During Past Five Years | |
Christopher O. Petersen
5228 Ameriprise
Financial Center
Minneapolis, MN 55474
Born 1970 | | President and Principal Executive Officer (2015) | | Vice President and Lead Chief Counsel, Ameriprise Financial, Inc. since January 2015 (previously, Vice President and Chief Counsel January 2010-December 2014; and Vice President and Group Counsel or Counsel 2004- January 2010); officer of Columbia Funds and affiliated funds since 2007. | |
Michael G. Clarke
225 Franklin Street
Boston, MA 02110
Born 1969 | | Treasurer (2011) and Chief Financial Officer (2009) | | Vice President — Mutual Fund Administration, Columbia Management Investment Advisers, LLC, since May 2010; Managing Director of Fund Administration, Columbia Management Advisors, LLC, September 2004-April 2010; senior officer of Columbia Funds and affiliated funds since 2002. | |
Annual Report 2015
44
COLUMBIA MID CAP GROWTH FUND
TRUSTEES AND OFFICERS (continued)
Fund Officers (continued)
Name,
Address and
Year of Birth | | Position and Year
First Appointed to
Position for any Fund
in the Columbia
Funds Complex or a
Predecessor Thereof | | Principal Occupation(s) During Past Five Years | |
Paul B. Goucher
100 Park Avenue
New York, NY 10017
Born 1968 | | Senior Vice President (2011), Chief Legal Officer (2015) and Assistant Secretary (2008) | | Vice President and Lead Chief Counsel, Ameriprise Financial, Inc. since November 2008 and January 2013, respectively (previously Chief Counsel, January 2010-January 2013 and Group Counsel, November 2008-January 2010). | |
Thomas P. McGuire
225 Franklin Street
Boston, MA 02110
Born 1972 | | Vice President and Chief Compliance Officer (2012) | | Vice President — Asset Management Compliance, Ameriprise Financial, Inc., since May 2010; Chief Compliance Officer, Ameriprise Certificate Company since September 2010; Compliance Executive, Bank of America, 2005-April 2010. | |
Colin Moore
225 Franklin Street
Boston, MA 02110
Born 1958 | | Senior Vice President (2010) | | Executive Vice President and Global Chief Investment Officer, Ameriprise Financial, Inc., since July 2013; Director and Global Chief Investment Officer, Columbia Management Investment Advisers, LLC since May 2010; Manager, Managing Director and Chief Investment Officer, Columbia Management Advisors, LLC, 2007-April 2010. | |
Michael E. DeFao
225 Franklin Street
Boston, MA 02110
Born 1968 | | Vice President (2011) and Assistant Secretary (2010) | | Vice President and Chief Counsel, Ameriprise Financial, Inc. since May 2010; Associate General Counsel, Bank of America, 2005-April 2010. | |
Joseph F. DiMaria
225 Franklin Street
Boston, MA 02110
Born 1968 | | Vice President (2011), Assistant Treasurer (2012) and Chief Accounting Officer (2008) | | Vice President — Mutual Fund Treasurer, Columbia Management Investment Advisers, LLC since May 2010; Director of Fund Administration, Columbia Management Advisors, LLC, 2006-April 2010. | |
Amy Johnson
5228 Ameriprise
Financial Center
Minneapolis, MN 55474
Born 1965 | | Vice President (2006) | | Managing Director and Chief Operating Officer, Columbia Management Investment Advisers, LLC since May 2010 (previously Chief Administrative Officer, 2009-April 2010, and Vice President — Asset Management and Trust Company Services, 2006-2009). | |
Lyn Kephart-Strong
5228 Ameriprise
Financial Center
Minneapolis, MN 55474
Born 1960 | | Vice President (2015) | | President, Columbia Management Investment Services Corp. since October 2014; Vice President & Resolution Officer, Ameriprise Trust Company since August 2009; President, RiverSource Service Corporation 2004-2010. | |
Ryan C. Larrenaga
225 Franklin Street
Boston, MA 02110
Born 1970 | | Vice President and Secretary (2015) | | Vice President and Group Counsel, Ameriprise Financial, Inc. since August 2011 (previously, Counsel from May 2010 to August 2011); Assistant General Counsel, Bank of America, 2005-April 2010; officer of Columbia Funds and affiliated funds since 2005. | |
Annual Report 2015
45
COLUMBIA MID CAP GROWTH FUND
BOARD CONSIDERATION AND APPROVAL OF ADVISORY AGREEMENT
On June 10, 2015, the Board of Trustees (the "Board") and the Trustees who are not interested persons (as defined in the Investment Company Act of 1940) (the "Independent Trustees") of Columbia Funds Series Trust I (the "Trust") unanimously approved the continuation of the Investment Management Services Agreement (the "Advisory Agreement") with Columbia Management Investment Advisers, LLC (the "Investment Manager") with respect to Columbia Mid Cap Growth Fund (the "Fund"), a series of the Trust. The Board and the Independent Trustees also unanimously approved an agreement (the "Management Agreement" and, together with the Advisory Agreement, the "Agreements") combining the Advisory Agreement and the Fund's existing administrative services agreement (the "Administrative Services Agreement") in a single agreement. The Board and the Independent Trustees approved the restatement of the Advisory Agreement with the Management Agreement to be effective for the Fund on January 1, 2016, the Fund's next annual prospectus update. As detailed below, the Board's Advisory Fees and Expenses Committee (the "Committee") and the Board met on multiple occasions to review and discuss, both among themselves and with the management team of the Investment Manager, materials provided by the Investment Manager and others before determining to approve the Management Agreement and the continuation of the Advisory Agreement.
In connection with their deliberations regarding the approval of the Management Agreement and the continuation of the Advisory Agreement, the Committee and the Board evaluated materials requested from the Investment Manager regarding the Fund and the Agreements, and discussed these materials with representatives of the Investment Manager at Committee meetings held on March 3, 2015, April 29, 2015 and June 9, 2015 and at Board meetings held on March 4, 2015 and June 10, 2015. In addition, the Board considers matters bearing on the Agreements at most of its other meetings throughout the year and meets regularly with senior management of the Trust and the Investment Manager. Through the Board's Investment Oversight Committees, Trustees also meet with selected portfolio managers of the funds the Trustees oversee and other investment personnel at various times throughout the year. The Committee and the Board also consulted with its independent fee consultant, Fund counsel and with the Independent Trustees' independent legal counsel, who advised on various matters with respect to the Committee's and the Board's considerations and otherwise assisted the Committee and the Board in their deliberations. On June 9, 2015, the Committee recommended that the Board approve the Management Agreement and the continuation of the Advisory Agreement. On June 10, 2015, the Board, including the Independent Trustees, voting separately, unanimously approved the Management Agreement and the continuation of the Advisory Agreement for the Fund.
The Committee and the Board considered all information that they, their legal counsel or the Investment Manager believed reasonably necessary to evaluate and to determine whether to approve the Management Agreement and the continuation of the Advisory Agreement. The information and factors considered by the Committee and the Board in recommending for approval or approving the Management Agreement and the continuation of the Advisory Agreement for the Fund included the following:
• Information on the investment performance of the Fund relative to the performance of a group of mutual funds determined to be comparable to the Fund by an independent third-party data provider, as well as performance relative to benchmarks;
• Information on the Fund's advisory fees and total expenses, including information comparing the Fund's expenses to those of a group of comparable mutual funds, as determined by the independent third-party data provider;
• The Investment Manager's agreement to contractually limit or cap total operating expenses for the Fund so that total operating expenses (excluding certain fees and expenses, such as portfolio transaction costs and certain other investment related expenses, interest, taxes, acquired fund fees and expenses, and extraordinary expenses) would not exceed a specified percentage of the Fund's average annual net assets from January 1, 2016 through December 31, 2016;
• The terms and conditions of the Agreements;
Annual Report 2015
46
COLUMBIA MID CAP GROWTH FUND
BOARD CONSIDERATION AND APPROVAL OF ADVISORY AGREEMENT (continued)
• The current and proposed terms and conditions of other agreements and arrangements with affiliates of the Investment Manager relating to the operations of the Fund, including the Administrative Services Agreement1 and agreements with respect to the provision of distribution and transfer agency services to the Fund;
• Descriptions of various functions performed by the Investment Manager under the Agreements, including portfolio management and portfolio trading practices;
• Information regarding the management fees and investment performance of similarly-managed portfolios of other clients of the Investment Manager, including institutional separate accounts;
• Information regarding the reputation, regulatory history and resources of the Investment Manager, including information regarding senior management, portfolio managers and other personnel;
• Information regarding the capabilities of the Investment Manager with respect to compliance monitoring services, including an assessment of the Investment Manager's compliance system by the Fund's Chief Compliance Officer; and
• The profitability to the Investment Manager and its affiliates from their relationships with the Fund.
Nature, Extent and Quality of Services Provided under the Agreements
The Committee and the Board considered the nature, extent and quality of services provided to the Fund by the Investment Manager and its affiliates under the Agreements and under separate agreements for the provision of transfer agency and administrative services, and the resources dedicated to the Fund and the other Columbia Funds by the Investment Manager and its affiliates. The Committee and the Board also determined that the nature and level of the services to be provided under the Management Agreement would not decrease relative to the services provided under the Advisory Agreement and the Administrative Services Agreement. The Committee and the Board considered, among other things, the Investment Manager's ability to attract, motivate and retain highly qualified research, advisory and supervisory investment professionals (including personnel and other resources, compensation programs for personnel involved in fund management, reputation and other attributes), the portfolio management services provided by those investment professionals, and the quality of the Investment Manager's investment research capabilities and trade execution services. The Committee and the Board also considered the potential benefits to shareholders of investing in a mutual fund that is part of a fund complex offering exposure to a variety of asset classes and investment disciplines and providing a variety of fund and shareholder services.
The Committee and the Board also considered the professional experience and qualifications of the senior personnel of the Investment Manager, which included consideration of the Investment Manager's experience with similarly-structured funds. The Committee and the Board noted the compliance programs of and the compliance-related resources provided to the Fund by the Investment Manager and its affiliates, and considered the Investment Manager's ability to provide administrative services to the Fund and coordinate the activities of the Fund's other service providers. In evaluating the nature, extent and quality of services provided under the Agreements, the Committee and the Board considered that these services were provided to the Fund, rather than directly to Fund shareholders. The Committee and the Board accordingly affirmed, after considering various other matters, including the potential benefits to the Fund and its shareholders of the Independent Trustees' important role as pre-suit gatekeepers with respect to claims that they may determine are meritless or contrary to the Fund's best interests, that it was not the intention of the Board or the Investment Manager that there be any third-party beneficiaries of the Agreements. After reviewing these and related factors, the Committee and the Board concluded, within the context of their overall conclusions, that the nature, extent and quality of the services provided to the Fund under the Agreements supported the approval of the Management Agreement and the continuation of the Advisory Agreement.
1 Like the Advisory Agreement, the Administrative Services Agreement will terminate with respect to the Fund once the Management Agreement is effective for the Fund.
Annual Report 2015
47
COLUMBIA MID CAP GROWTH FUND
BOARD CONSIDERATION AND APPROVAL OF ADVISORY AGREEMENT (continued)
Investment Performance
The Committee and the Board reviewed information about the performance of the Fund over various time periods, including performance information relative to benchmarks and information based on reports of the independent third-party data provider that compared the performance of the Fund to the performance of a group of comparable mutual funds, and data provided by the independent fee consultant. The Committee and the Board also reviewed a description of the third party's methodology for identifying the Fund's peer groups for purposes of performance and expense comparisons. Although the Fund's performance lagged that of a relevant peer group for certain (although not necessarily all) periods, the Committee and the Board concluded that other factors relevant to performance were sufficient, in light of other considerations, to warrant continuation of the Advisory Agreement and approval of the Management Agreement. Those factors included one or more of the following: (i) that the Fund's performance, although lagging in certain recent periods, was stronger over the longer term; (ii) that the underperformance was attributable, to a significant extent, to investment decisions that were reasonable and consistent with the Fund's investment strategy and policies and that the Fund was performing within a reasonable range of expectations, given those investment decisions, market conditions and the Fund's investment strategy; (iii) that the Fund's performance was competitive when compared to other relevant performance benchmarks or peer groups; and (iv) that the Investment Manager had taken or was taking steps designed to help improve the Fund's investment performance, including, but not limited to, replacing portfolio managers, enhancing the resources supporting the portfolio managers, or modifying investment strategies.
The Committee and the Board noted that, through December 31, 2014, the Fund's performance was in the sixty-ninth, ninetieth and fifty-seventh percentile (where the best performance would be in the first percentile) of its category selected by the independent third-party data provider for the purposes of performance comparisons for the one-, three- and five- year periods, respectively.
The Committee and the Board also considered the Investment Manager's performance and reputation generally, the Investment Manager's historical responsiveness to Board concerns about performance, and the Investment Manager's willingness to take steps intended to improve performance. After reviewing these and related factors, the Committee and the Board concluded, within the context of their overall conclusions, that the performance of the Fund was sufficient, in light of other considerations, to warrant the continuation of the Advisory Agreement and the approval of the Management Agreement.
Investment Advisory Fee Rates and Other Expenses
The Committee and the Board considered the advisory fees charged to the Fund under the Advisory Agreement as well as the total expenses incurred by the Fund. In assessing the reasonableness of the fees under the Advisory Agreement, the Committee and the Board considered, among other information, the Fund's advisory fee and its total expense ratio as a percentage of average daily net assets. The Committee and the Board also considered that the proposed management fee would not exceed the sum of the fee rates payable under the Advisory Agreement and the Administrative Services Agreement. The Committee and the Board considered data provided by the independent fee consultant. The Committee and the Board noted that, as of December 31, 2014, the Fund's actual management fee and net expense ratio are ranked in the third and second quintiles, respectively, (where the lowest fees and expenses would be in the first quintile) against the Fund's expense universe as determined by the independent third-party data provider for purposes of expense comparison. The Committee and the Board also took into account the fee waiver and expense limitation arrangements agreed to by the Investment Manager, as noted above.
The Committee and the Board also received and considered information about the advisory fees charged by the Investment Manager to institutional separate accounts. In considering the fees charged to those accounts, the Committee and the Board took into account, among other things, the Investment Manager's representations about the differences between managing mutual funds as compared to other types of accounts, including differences in the services provided, differences in the risk profile of such business for the Investment Manager and the additional resources required to manage mutual funds effectively. The Committee and the Board also received and considered information about the fees charged by the Investment Manager for sub-advisory services
Annual Report 2015
48
COLUMBIA MID CAP GROWTH FUND
BOARD CONSIDERATION AND APPROVAL OF ADVISORY AGREEMENT (continued)
provided to comparable unaffiliated funds. In evaluating the Fund's advisory fees, the Committee and the Board also took into account the demands, complexity and quality of the investment management of the Fund.
After reviewing these and related factors, the Committee and the Board concluded, within the context of their overall conclusions, that the advisory/management fee rates and expenses of the Fund were sufficient, in light of other considerations, to warrant the approval of the Management Agreement and continuation of the Advisory Agreement.
Costs of Services Provided and Profitability
The Committee and the Board also took note of the costs the Investment Manager and its affiliates incur in connection with the services provided (both on an absolute and relative basis) and the profitability to the Investment Manager and its affiliates in connection with their relationships with the Fund.
The Committee and the Board also considered the compensation directly or indirectly received by the Investment Manager's affiliates in connection with their relationships with the Fund. The Committee and the Board reviewed information provided by management as to the profitability to the Investment Manager and its affiliates of their relationships with the Fund, information about the allocation of expenses used to calculate profitability, and comparisons of profitability levels realized in 2014 to profitability levels realized in 2013. When reviewing profitability, the Committee and the Board also considered court cases in which adviser profitability was an issue in whole or in part, the performance of similarly managed funds, the performance of the Fund, and the expense ratio of the Fund. The Committee and the Board also considered information provided by the Investment Manager regarding the Investment Manager's financial condition and comparing its profitability to that of other asset management firms that are, or are subsidiaries of, publicly traded companies.
After reviewing these and related factors, the Committee and the Board concluded, within the context of their overall conclusions, that the costs of services provided and the profitability to the Investment Manager and its affiliates from their relationships with the Fund supported the approval of the Management Agreement and the continuation of the Advisory Agreement.
Economies of Scale
The Committee and the Board considered the potential existence of economies of scale in the provision by the Investment Manager of services to the Fund, to groups of related funds, and to the Investment Manager's investment advisory clients as a whole, and whether those economies of scale were shared with the Fund through breakpoints in investment advisory fees or other means, such as expense limitation arrangements and additional investments by the Investment Manager in investment, trading and compliance resources. The Committee and the Board noted that the investment advisory and management fee schedules for the Fund contained breakpoints that would reduce the fee rate on assets above specified threshold levels.
In considering these matters, the Committee and the Board also considered the costs of the services provided and the profitability to the Investment Manager and its affiliates from their relationships with the Fund, as discussed above. After reviewing these and related factors, the Committee and the Board concluded, within the context of their overall conclusions, that the extent to which any economies of scale were expected to be shared with the Fund supported the approval of the Management Agreement and the continuation of the Advisory Agreement.
Other Benefits to the Investment Manager
The Committee and the Board received and considered information regarding "fall-out" or ancillary benefits received by the Investment Manager and its affiliates as a result of their relationships with the Fund, such as the engagement of the Investment Manager to provide administrative services to the Fund and the engagement of the Investment Manager's affiliates to provide distribution and transfer agency services to the Fund. In this regard, among other matters, the Committee and the Board considered that the Fund's distributor retains a portion of the distribution fees from the Fund and receives a portion of the sales charges on sales or redemptions of certain classes of shares of the Fund. The Committee and the Board also considered the benefits
Annual Report 2015
49
COLUMBIA MID CAP GROWTH FUND
BOARD CONSIDERATION AND APPROVAL OF ADVISORY AGREEMENT (continued)
of research made available to the Investment Manager by reason of brokerage commissions generated by the Fund's securities transactions, and reviewed information about the Investment Manager's practices with respect to allocating portfolio transactions for brokerage and research services. The Committee and the Board considered the possible conflicts of interest associated with certain fall-out or other ancillary benefits and the reporting, disclosure and other processes that are in place to address such possible conflicts of interest. The Committee and the Board recognized that the Investment Manager's profitability would be somewhat lower without these benefits.
Conclusion
The Committee and the Board reviewed all of the above considerations in reaching their decisions to recommend or approve the Management Agreement and the continuation of the Advisory Agreement. In their deliberations, the Trustees did not identify any particular information that was all-important or controlling, and individual Trustees may have attributed different weights to the various factors. Based on their evaluation of all factors that they deemed to be material, including those factors described above, and assisted by the advice of independent legal counsel, the Board, including the Independent Trustees, voting separately, unanimously approved the Management Agreement and the continuation of the Advisory Agreement.
Annual Report 2015
50
COLUMBIA MID CAP GROWTH FUND
IMPORTANT INFORMATION ABOUT THIS REPORT
Each fund mails one shareholder report to each shareholder address. If you would like more than one report, please call shareholder services at 800.345.6611 and additional reports will be sent to you.
The policy of the Board is to vote the proxies of the companies in which each fund holds investments consistent with the procedures as stated in the Statement of Additional Information (SAI). You may obtain a copy of the SAI without charge by calling 800.345.6611; contacting your financial intermediary; visiting columbiathreadneedle.com/us; or searching the website of the Securities and Exchange Commission (SEC) at sec.gov. Information regarding how each fund voted proxies relating to portfolio securities is filed with the SEC by August 31st for the most recent 12-month period ending June 30th of that year, and is available without charge by visiting columbiathreadneedle.com/us, or searching the website of the SEC at sec.gov.
Each fund files a complete schedule of portfolio holdings with the SEC for the first and third quarters of each fiscal year on Form N-Q. Each fund's Form N-Q is available on the SEC's website at sec.gov and may be reviewed and copied at the SEC's Public Reference Room in Washington, D.C. Information on the operation of the Public Reference Room may be obtained by calling 800.SEC.0330. Each fund's complete schedule of portfolio holdings, as filed on Form N-Q, can also be obtained without charge, upon request, by calling 800.345.6611.
Annual Report 2015
51
Columbia Mid Cap Growth Fund
P.O. Box 8081
Boston, MA 02266-8081

This information is for use with concurrent or prior delivery of a fund prospectus. Please read and consider the investment objectives, risks, charges and expenses for any fund carefully before investing. For a prospectus and summary prospectus, which contains this and other important information about the Fund, go to columbiathreadneedle.com/us. The Fund is distributed by Columbia Management Investment Distributors, Inc., member FINRA, and managed by Columbia Management Investment Advisers, LLC.
Columbia Threadneedle Investments (Columbia Threadneedle) is the global brand name of the Columbia and Threadneedle group of companies.
All rights reserved. Columbia Management Investment Distributors, Inc., 225 Franklin Street, Boston, MA 02110-2804
© 2015 Columbia Management Investment Advisers, LLC.
columbiathreadneedle.com/us
ANN194_08_E01_(10/15)

ANNUAL REPORT
August 31, 2015

COLUMBIA SMALL CAP CORE FUND

 Dear Shareholder,
Today's investors are typically focused on outcomes, like living a certain retirement lifestyle, paying for college education or building a legacy. But in today's complex global investment landscape, even simple goals are not easily achieved.
At Columbia Threadneedle Investments, we aspire to help satisfy five core needs of today's investors:
n Generate an appropriate stream of income in retirement
Traditional approaches to generating income may not provide the diversification benefits they once did, and they may actually introduce unwanted risk in today's market. To seek to improve your potential to live comfortably long term, we endeavor to pursue investments that explore less traveled paths to income.
n Navigate a changing interest rate environment
Today's uncertain market environment includes the prospect of a rise in interest rates. Blending traditional investments with non-traditional or alternative products may help protect your wealth during periods of volatility. We can attempt to help strengthen your portfolio with agile products designed to take on the market's ups and downs.
n Maximize after-tax returns
In an environment where what you keep may be more important than what you earn, municipal bonds can help mitigate high tax burdens while providing potentially attractive yields. Our state and federal tax-exempt products are aimed at helping investors manage risk, minimize the fluctuation of capital and grow wealth on a more tax-efficient basis.
n Grow assets to achieve financial goals
We believe that finding and protecting growth comes from a disciplined security selection process designed to create excess return. Our goal is to provide investment solutions built to help you face today's market challenges and grow your assets at each crossroad of your journey.
n Ease the impact of volatile markets
Despite a bull market run that has benefited many investors over the past several years, it's important to remember the lessons of 2008 and the value that a well-diversified portfolio may provide through times of market volatility. We are here to help you hold onto the savings you have worked tirelessly to amass, and to provide you the best opportunity to maintain your standard of living regardless of market conditions.
Find out today how we can help you confidently invest to realize your dreams. Please visit us at blog.columbiathreadneedleus.com/our-best-ideas to learn more about our unique investment solutions.
The world is constantly changing, but our priority remains the same: to help you secure your finances, meet your goals and achieve success. Thank you for your continued investment with us.
Sincerely,

Christopher O. Petersen
President, Columbia Funds
Investors should consider the investment objectives, risks, charges and expenses of a mutual fund carefully before investing. For a free prospectus and summary prospectus, which contains this and other important information about a fund, visit columbiathreadneedle.com/us. The prospectus should be read carefully before investing.
Columbia Funds are distributed by Columbia Management Investment Distributors, Inc., member FINRA, and managed by Columbia Management Investment Advisers, LLC.
© 2015 Columbia Management Investment Advisers, LLC. All rights reserved.
COLUMBIA SMALL CAP CORE FUND
Performance Overview | | | 2 | | |
Manager Discussion of Fund Performance | | | 4 | | |
Understanding Your Fund's Expenses | | | 6 | | |
Portfolio of Investments | | | 7 | | |
Statement of Assets and Liabilities | | | 13 | | |
Statement of Operations | | | 15 | | |
Statement of Changes in Net Assets | | | 16 | | |
Financial Highlights | | | 19 | | |
Notes to Financial Statements | | | 29 | | |
Report of Independent Registered
Public Accounting Firm | | | 38 | | |
Federal Income Tax Information | | | 39 | | |
Trustees and Officers | | | 40 | | |
Board Consideration and Approval of Advisory Agreement | | | 44 | | |
Important Information About This Report | | | 49 | | |
Fund Investment Manager
Columbia Management Investment
Advisers, LLC
225 Franklin Street
Boston, MA 02110
Fund Distributor
Columbia Management Investment
Distributors, Inc.
225 Franklin Street
Boston, MA 02110
Fund Transfer Agent
Columbia Management Investment
Services Corp.
P.O. Box 8081
Boston, MA 02266-8081
For more information about any of the funds, please visit columbiathreadneedle.com/us or call 800.345.6611. Customer Service Representatives are available to answer your questions Monday through Friday from 8 a.m. to 7 p.m. Eastern time.
The views expressed in this report reflect the current views of the respective parties. These views are not guarantees of future performance and involve certain risks, uncertainties and assumptions that are difficult to predict, so actual outcomes and results may differ significantly from the views expressed. These views are subject to change at any time based upon economic, market or other conditions and the respective parties disclaim any responsibility to update such views. These views may not be relied on as investment advice and, because investment decisions for a Columbia fund are based on numerous factors, may not be relied on as an indication of trading intent on behalf of any particular Columbia fund. References to specific securities should not be construed as a recommendation or investment advice.
COLUMBIA SMALL CAP CORE FUND
Performance Summary
n Columbia Small Cap Core Fund (the Fund) Class A shares returned -6.81% excluding sales charges for the 12-month period that ended August 31, 2015.
n During the same time period, the Fund underperformed both the Russell 2000 Index and the S&P SmallCap 600 Index, which returned 0.03% and 1.80%, respectively.
n The Fund's value bias, underexposure to the top-performing biotechnology segment, overweight in microcap stocks and above-average international exposure hurt relative performance. Security selection in the information technology, health care and financial sectors was particularly disappointing.
Average Annual Total Returns (%) (for period ended August 31, 2015)
| | | Inception | | 1 Year | | 5 Years | | 10 Years | |
Class A | | 11/01/98 | | | | | | | | | | | | | |
Excluding sales charges | | | | | | | -6.81 | | | | 12.75 | | | | 6.40 | | |
Including sales charges | | | | | | | -12.15 | | | | 11.41 | | | | 5.77 | | |
Class B | | 11/01/98 | | | | | | | | | | | | | |
Excluding sales charges | | | | | | | -7.54 | | | | 11.93 | | | | 5.61 | | |
Including sales charges | | | | | | | -11.72 | | | | 11.67 | | | | 5.61 | | |
Class C | | 11/18/02 | | | | | | | | | | | | | |
Excluding sales charges | | | | | | | -7.53 | | | | 11.91 | | | | 5.60 | | |
Including sales charges | | | | | | | -8.37 | | | | 11.91 | | | | 5.60 | | |
Class I* | | 09/27/10 | | | -6.35 | | | | 13.28 | | | | 6.78 | | |
Class R4* | | 11/08/12 | | | -6.56 | | | | 13.04 | | | | 6.67 | | |
Class R5* | | 11/08/12 | | | -6.43 | | | | 13.16 | | | | 6.72 | | |
Class T | | 02/12/93 | | | | | | | | | | | | | |
Excluding sales charges | | | | | | | -6.87 | | | | 12.69 | | | | 6.35 | | |
Including sales charges | | | | | | | -12.23 | | | | 11.38 | | | | 5.72 | | |
Class W* | | 09/27/10 | | | -6.80 | | | | 12.77 | | | | 6.41 | | |
Class Y* | | 11/08/12 | | | -6.39 | | | | 13.18 | | | | 6.73 | | |
Class Z | | 12/14/92 | | | -6.56 | | | | 13.05 | | | | 6.67 | | |
Russell 2000 Index | | | | | | | 0.03 | | | | 15.55 | | | | 7.12 | | |
S&P SmallCap 600 Index | | | | | | | 1.80 | | | | 17.37 | | | | 8.13 | | |
Returns for Class A and Class T are shown with and without the maximum initial sales charge of 5.75%. Returns for Class B are shown with and without the applicable contingent deferred sales charge (CDSC) of 5.00% in the first year, declining to 1.00% in the sixth year and eliminated thereafter. Returns for Class C are shown with and without the 1.00% CDSC for the first year only. The Fund's other classes are not subject to sales charges and have limited eligibility. Please see the Fund's prospectus for details. Performance for different share classes will vary based on differences in sales charges and fees associated with each class. All results shown assume reinvestment of distributions during the period. Returns do not reflect the deduction of taxes that a shareholder may pay on Fund distributions or on the redemption of Fund shares. Performance results reflect the effect of any fee waivers or reimbursements of Fund expenses by Columbia Management Investment Advisers, LLC and/or any of its affiliates. Absent these fee waivers or expense reimbursement arrangements, performance results would have been lower.
The performance information shown represents past performance and is not a guarantee of future results. The investment return and principal value of your investment will fluctuate so that your shares, when redeemed, may be worth more or less than their original cost. Current performance may be lower or higher than the performance information shown. You may obtain performance information current to the most recent month-end by contacting your financial intermediary, visiting columbiathreadneedle.com/us or calling 800.345.6611.
*The returns shown for periods prior to the share class inception date (including returns for the Life of the Fund, if shown, which are since Fund inception) include the returns of the Fund's oldest share class. These returns are adjusted to reflect any higher class-related operating expenses of the newer share classes, as applicable. Please visit columbiathreadneedle.com/us/investment-products/mutual-funds/
appended-performance for more information.
The Russell 2000 Index measures the performance of the small-cap segment of the U.S. equity universe. The Russell 2000 is a subset of the Russell 3000 Index representing approximately 10% of the total market capitalization of that index. It includes the securities of approximately 2,000 of the smallest companies in the Russell 3000 Index based on a combination of their market capitalization and current index membership.
The S&P SmallCap 600 Index tracks the performance of 600 domestic companies traded on major stock exchanges. The S&P SmallCap 600 is heavily weighted with the stocks of companies with small market capitalizations.
Indices are not available for investment, are not professionally managed and do not reflect sales charges, fees, brokerage commissions, taxes or other expenses of investing. Securities in the Fund may not match those in an index.
Annual Report 2015
2
COLUMBIA SMALL CAP CORE FUND
PERFORMANCE OVERVIEW (continued)
Performance of a Hypothetical $10,000 Investment (September 1, 2005 – August 31, 2015)
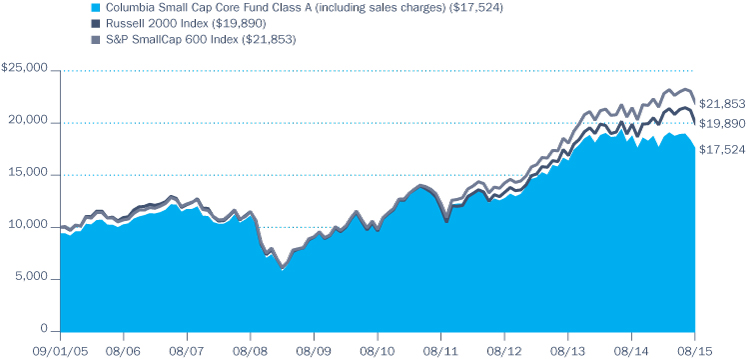
The chart above shows the change in value of a hypothetical $10,000 investment in Class A shares of Columbia Small Cap Core Fund during the stated time period, and does not reflect the deduction of taxes that a shareholder may pay on Fund distributions or on the redemption of Fund shares.
Annual Report 2015
3
COLUMBIA SMALL CAP CORE FUND
MANAGER DISCUSSION OF FUND PERFORMANCE
Portfolio Management
Richard D'Auteuil
Jeffrey Hershey, CFA
Paul Szczygiel, CFA
Morningstar Style BoxTM

The Morningstar Style BoxTM is based on a fund's portfolio holdings. For equity funds, the vertical axis shows the market capitalization of the stocks owned, and the horizontal axis shows investment style (value, blend, or growth). Information shown is based on the most recent data provided by Morningstar.
© 2015 Morningstar, Inc. All rights reserved. The Morningstar information contained herein: (1) is proprietary to Morningstar and/or its content providers; (2) may not be copied or distributed; and (3) is not warranted to be accurate, complete or timely. Neither Morningstar nor its content providers are responsible for any damages or losses arising from any use of this information.
Top Ten Holdings (%)
(at August 31, 2015) | |
Providence Service Corp. (The) | | | 2.4 | | |
Sensient Technologies Corp. | | | 1.6 | | |
John Wiley & Sons, Inc., Class A | | | 1.5 | | |
Plantronics, Inc. | | | 1.5 | | |
Atrion Corp. | | | 1.5 | | |
LSI Industries, Inc. | | | 1.4 | | |
Plexus Corp. | | | 1.3 | | |
Staar Surgical Co. | | | 1.3 | | |
Helen of Troy Ltd. | | | 1.3 | | |
PMFG, Inc. | | | 1.3 | | |
Percentages indicated are based upon total investments (excluding Money Market Funds).
For further detail about these holdings, please refer to the section entitled "Portfolio of Investments."
Fund holdings are as of the date given, are subject to change at any time, and are not recommendations to buy or sell any security.
For the 12-month period that ended August 31, 2015, the Fund's Class A shares returned -6.81% excluding sales charges. During the same time period, the Fund underperformed the Russell 2000 Index and the S&P SmallCap 600 Index, which returned 0.03% and 1.80%, respectively. The Fund remained focused on well-managed small companies with solid balance sheets, demonstrated profitability and good long-term earnings growth prospects. We aim to buy when stocks are under pressure and when we see potential catalysts — such as a restructuring, management change or activist involvement — to help propel them higher. Our value bias, however, hampered relative performance as growth stocks outperformed value stocks by a sizable margin this past year. Underexposure to the top-performing biotechnology segment, a sizable overweight in microcaps — which lagged larger small-cap stocks — and more international exposure than the Russell 2000 Index also hindered results.
Market Volatility Increased
After a strong start, the pace of U.S. economic growth fluctuated during the 12-month reporting period. A strong U.S. dollar, widening trade deficit and declining oil prices negatively impacted growth, rattling the market. Another stormy winter in the Northeast and Midwest also whittled away at first-quarter gross domestic product (GDP). Yet many of these setbacks proved temporary as the economy rebounded in the second quarter of 2015. U.S. unemployment fell, home sales were robust, and manufacturing activity remained solid. The financial markets, however, grew increasingly volatile, amid mounting concern over sluggish global economic growth and the timing of a Federal Reserve interest rate hike. Solid stock market gains in the first half of the 12-month period were all but wiped out in the second half.
Positioning, Stock Selection Detracted from Results
The Fund had less exposure than the Russell 2000 Index to the strong-performing biotechnology segment, which detracted from relative results. We avoided many biotech companies because they were not generating earnings and, in many cases, revenues. Further, we believed their valuations seemed expensive. Some of the health care stocks the Fund owned also underperformed, including Air Methods, a leading emergency services helicopter company. Its share price fell as tough winter weather hampered volumes and a shifting business mix pressured revenues. We viewed the weather-related issues as temporary and remained encouraged by private equity investors' interest, the company's ability to raise prices and its share buyback plans.
These disappointments were partially offset by strong contributions from the Fund's investment in Repligen, which makes materials that help in the production of monoclonal antibodies, and Supernus Pharmaceuticals, which focuses on ADHD (Attention Deficit Hyperactivity Disorder) and epilepsy treatments. Both stocks posted steep gains, with Repligen benefiting from growing demand for monoclonal antibodies and Supernus Pharmaceuticals climbing as its strong sales force tripled revenues over the past three years.
The information technology sector hampered relative performance partly due to an underweight in the software subsector, which performed well. We kept
Annual Report 2015
4
COLUMBIA SMALL CAP CORE FUND
MANAGER DISCUSSION OF FUND PERFORMANCE (continued)
our long-term focus on fundamentals and remained valuation sensitive, which worked against us as investors bid some expensive tech stocks even higher. In financials, two positions in particular proved costly: foreign-exchange broker FXCM and Puerto Rico bank OFG Bancorp. FXCM's stock plunged when the Swiss National Bank unexpectedly removed the Swiss franc's peg to the euro. We eliminated FXCM from the portfolio, as its long-term earnings outlook no longer looked favorable to us. OFG Bancorp's share price fell amid worries over credit lines it had extended to the local electric power utility, which in turn was pressured by Puerto Rico's weak economy. We thought OFG Bancorp's stock was down far more than its fundamentals warranted and maintained an overweight position in the stock.
Energy and materials were the weakest performers by far within the Russell 2000 Index and yielded some of the Fund's biggest individual detractors. GulfMark Offshore, which provides ocean vessels for shuttling crews and equipment to offshore rigs, saw its stock suffer as plunging oil prices slowed demand for its services. An investment in Unit Corp. — which explores for oil and gas, owns and leases drilling rigs and has some pipeline assets — tumbled because of declines in land rig pricing and the company's slightly higher-than-average production costs. In materials, shares of Rayonier Advanced Materials, a chemicals company that supplies cellulose specialty products, fell as excess capacity led to pricing weakness in the industry.
Telecommunication Services and Consumer Discretionary Aided Performance
Stock selection in the telecommunication services and consumer discretionary sectors benefited relative performance. Individual standouts included Steiner Leisure, which provides onboard spa services for cruise ships, operates laser hair removal centers in the U.S. and sells spa products. A recovery in the company's laser hair removal business and a buyout offer from a private equity firm helped drive the stock higher. Elsewhere in the portfolio, an investment in Digital River stood out. The company, which provides outsourced e-commerce services, received an acquisition offer at a healthy premium. We locked in profits and sold both positions before period end.
Looking Ahead
Despite a disappointing year, we remain optimistic at this time about the prospects for small-cap stocks, which tend to be among the biggest beneficiaries of a U.S. economic expansion. Approximately 75% of the Fund's investments are in small companies that are experiencing short-term difficulties but that we believe have attractive long-term prospects and are undervalued. The balance of the portfolio consists of companies that we believe aren't on Wall Street's radar. These tend to be companies with market caps under $1 billion that have little, if any, Wall Street research coverage and little institutional ownership. At some point, we expect our patience to be rewarded as valuations on these microcaps attract investor interest. Eventually, we believe the pendulum will swing back toward value. In the meantime, we plan to take advantage of buying opportunities that occur when investors overreact to disappointing near-term earnings reports.
Portfolio Breakdown (%)
(at August 31, 2015) | |
Common Stocks | | | 99.6 | | |
Money Market Funds | | | 0.4 | | |
Total | | | 100.0 | | |
Percentages indicated are based upon total investments. The Fund's portfolio composition is subject to change.
Equity Sector Breakdown (%)
(at August 31, 2015) | |
Consumer Discretionary | | | 14.2 | | |
Consumer Staples | | | 0.9 | | |
Energy | | | 4.1 | | |
Financials | | | 18.3 | | |
Health Care | | | 15.0 | | |
Industrials | | | 20.0 | | |
Information Technology | | | 18.6 | | |
Materials | | | 5.3 | | |
Telecommunication Services | | | 1.1 | | |
Utilities | | | 2.5 | | |
Total | | | 100.0 | | |
Percentages indicated are based upon total equity investments. The Fund's portfolio composition is subject to change.
Investment Risks
Market risk may affect a single issuer, sector of the economy, industry or the market as a whole. Value securities may be unprofitable if the market fails to recognize their intrinsic worth or the portfolio manager misgauged that worth. Foreign investments subject the Fund to risks, including political, economic, market, social and others within a particular country, as well as to currency instabilities and less stringent financial and accounting standards generally applicable to U.S. issuers. Investments in small-cap companies involve risks and volatility greater than investments in larger, more established companies. The Fund may invest significantly in issuers within a particular sector, which may be negatively affected by market, economic or other conditions, making the Fund more vulnerable to unfavorable developments in the sector. See the Fund's prospectus for more information on these and other risks.
Annual Report 2015
5
COLUMBIA SMALL CAP CORE FUND
UNDERSTANDING YOUR FUND'S EXPENSES
(Unaudited)
As an investor, you incur two types of costs. There are transaction costs, which generally include sales charges on purchases and may include redemption fees. There are also ongoing costs, which generally include management fees, distribution and/or service fees, and other fund expenses. The following information is intended to help you understand your ongoing costs (in dollars) of investing in the Fund and to help you compare these costs with the ongoing costs of investing in other mutual funds.
Analyzing Your Fund's Expenses
To illustrate these ongoing costs, we have provided examples and calculated the expenses paid by investors in each share class of the Fund during the period. The actual and hypothetical information in the table is based on an initial investment of $1,000 at the beginning of the period indicated and held for the entire period. Expense information is calculated two ways and each method provides you with different information. The amount listed in the "Actual" column is calculated using the Fund's actual operating expenses and total return for the period. You may use the Actual information, together with the amount invested, to estimate the expenses that you paid over the period. Simply divide your account value by $1,000 (for example, an $8,600 account value divided by $1,000 = 8.6), then multiply the results by the expenses paid during the period under the "Actual" column. The amount listed in the "Hypothetical" column assumes a 5% annual rate of return before expenses (which is not the Fund's actual return) and then applies the Fund's actual expense ratio for the period to the hypothetical return. You should not use the hypothetical account values and expenses to estimate either your actual account balance at the end of the period or the expenses you paid during the period. See "Compare With Other Funds" below for details on how to use the hypothetical data.
Compare With Other Funds
Since all mutual funds are required to include the same hypothetical calculations about expenses in shareholder reports, you can use this information to compare the ongoing cost of investing in the Fund with other funds. To do so, compare the hypothetical example with the 5% hypothetical examples that appear in the shareholder reports of other funds. As you compare hypothetical examples of other funds, it is important to note that hypothetical examples are meant to highlight the ongoing costs of investing in a fund only and do not reflect any transaction costs, such as sales charges, or redemption or exchange fees. Therefore, the hypothetical calculations are useful in comparing ongoing costs only, and will not help you determine the relative total costs of owning different funds. If transaction costs were included in these calculations, your costs would be higher.
March 1, 2015 – August 31, 2015
| | | Account Value at the Beginning
of the Period ($) | | Account Value at the End of the
Period ($) | | Expenses Paid During the
Period ($) | | Fund's Annualized
Expense Ratio (%) | |
| | | Actual | | Hypothetical | | Actual | | Hypothetical | | Actual | | Hypothetical | | Actual | |
Class A | | | 1,000.00 | | | | 1,000.00 | | | | 937.20 | | | | 1,018.45 | | | | 6.68 | | | | 6.96 | | | | 1.36 | | |
Class B | | | 1,000.00 | | | | 1,000.00 | | | | 932.90 | | | | 1,014.70 | | | | 10.29 | | | | 10.72 | | | | 2.10 | | |
Class C | | | 1,000.00 | | | | 1,000.00 | | | | 933.00 | | | | 1,014.70 | | | | 10.29 | | | | 10.72 | | | | 2.10 | | |
Class I | | | 1,000.00 | | | | 1,000.00 | | | | 939.10 | | | | 1,020.83 | | | | 4.37 | | | | 4.56 | | | | 0.89 | | |
Class R4 | | | 1,000.00 | | | | 1,000.00 | | | | 938.30 | | | | 1,019.77 | | | | 5.40 | | | | 5.63 | | | | 1.10 | | |
Class R5 | | | 1,000.00 | | | | 1,000.00 | | | | 938.90 | | | | 1,020.58 | | | | 4.62 | | | | 4.81 | | | | 0.94 | | |
Class T | | | 1,000.00 | | | | 1,000.00 | | | | 936.90 | | | | 1,018.50 | | | | 6.63 | | | | 6.91 | | | | 1.35 | | |
Class W | | | 1,000.00 | | | | 1,000.00 | | | | 937.20 | | | | 1,018.50 | | | | 6.63 | | | | 6.91 | | | | 1.35 | | |
Class Y | | | 1,000.00 | | | | 1,000.00 | | | | 939.20 | | | | 1,020.88 | | | | 4.32 | | | | 4.51 | | | | 0.88 | | |
Class Z | | | 1,000.00 | | | | 1,000.00 | | | | 938.20 | | | | 1,019.77 | | | | 5.40 | | | | 5.63 | | | | 1.10 | | |
Expenses paid during the period are equal to the annualized expense ratio for each class as indicated above, multiplied by the average account value over the period and then multiplied by the number of days in the Fund's most recent fiscal half year and divided by 365.
Expenses do not include fees and expenses incurred indirectly by the Fund from its investment in underlying funds, including affiliated and non-affiliated pooled investment vehicles, such as mutual funds and exchange-traded funds.
Annual Report 2015
6
COLUMBIA SMALL CAP CORE FUND
PORTFOLIO OF INVESTMENTS
August 31, 2015
(Percentages represent value of investments compared to net assets)
Common Stocks 98.2%
Issuer | | Shares | | Value ($) | |
CONSUMER DISCRETIONARY 13.9% | |
Auto Components 1.0% | |
Dorman Products, Inc.(a) | | | 49,844 | | | | 2,509,645 | | |
Fox Factory Holding Corp.(a) | | | 205,972 | | | | 3,093,700 | | |
Total | | | | | 5,603,345 | | |
Diversified Consumer Services 0.4% | |
Bridgepoint Education, Inc.(a) | | | 267,140 | | | | 2,158,491 | | |
Hotels, Restaurants & Leisure 1.9% | |
Cheesecake Factory, Inc. (The) | | | 54,341 | | | | 2,949,086 | | |
Denny's Corp.(a) | | | 139,366 | | | | 1,565,080 | | |
Diversified Restaurant Holdings, Inc.(a) | | | 790,261 | | | | 2,141,607 | | |
Morgans Hotel Group Co.(a) | | | 747,665 | | | | 3,431,783 | | |
Total | | | | | 10,087,556 | | |
Household Durables 3.7% | |
Century Communities, Inc.(a) | | | 168,646 | | | | 3,710,212 | | |
Helen of Troy Ltd.(a) | | | 81,768 | | | | 6,961,728 | | |
Installed Building Products, Inc.(a) | | | 127,592 | | | | 3,409,258 | | |
Jarden Corp.(a) | | | 118,822 | | | | 6,100,321 | | |
Total | | | | | 20,181,519 | | |
Leisure Products 0.8% | |
Arctic Cat, Inc. | | | 75,135 | | | | 1,985,818 | | |
Callaway Golf Co. | | | 245,825 | | | | 2,175,551 | | |
Total | | | | | 4,161,369 | | |
Media 2.6% | |
Carmike Cinemas, Inc.(a) | | | 175,834 | | | | 4,193,641 | | |
Hemisphere Media Group, Inc.(a) | | | 159,001 | | | | 2,164,004 | | |
John Wiley & Sons, Inc., Class A | | | 153,285 | | | | 7,903,374 | | |
Total | | | | | 14,261,019 | | |
Multiline Retail 0.2% | |
Tuesday Morning Corp.(a) | | | 174,460 | | | | 1,383,468 | | |
Specialty Retail 3.3% | |
Buckle, Inc. (The) | | | 88,113 | | | | 3,718,369 | | |
Destination Maternity Corp. | | | 213,563 | | | | 2,423,940 | | |
Express, Inc.(a) | | | 181,005 | | | | 3,692,502 | | |
Hibbett Sports, Inc.(a) | | | 52,499 | | | | 2,073,711 | | |
Penske Automotive Group, Inc. | | | 117,029 | | | | 5,921,667 | | |
Total | | | | | 17,830,189 | | |
Total Consumer Discretionary | | | | | 75,666,956 | | |
Common Stocks (continued)
Issuer | | Shares | | Value ($) | |
CONSUMER STAPLES 0.9% | |
Food & Staples Retailing 0.5% | |
Casey's General Stores, Inc. | | | 26,477 | | | | 2,802,855 | | |
Personal Products 0.4% | |
Elizabeth Arden, Inc.(a) | | | 180,715 | | | | 1,993,287 | | |
Total Consumer Staples | | | | | 4,796,142 | | |
ENERGY 4.0% | |
Energy Equipment & Services 2.2% | |
Glori Energy, Inc.(a) | | | 597,636 | | | | 597,636 | | |
Gulfmark Offshore, Inc., Class A | | | 102,724 | | | | 927,598 | | |
Helix Energy Solutions Group, Inc.(a) | | | 101,361 | | | | 704,459 | | |
Newpark Resources, Inc.(a) | | | 213,548 | | | | 1,565,307 | | |
Oceaneering International, Inc. | | | 26,098 | | | | 1,143,614 | | |
Tetra Technologies, Inc.(a) | | | 822,464 | | | | 6,324,748 | | |
Unit Corp.(a) | | | 60,076 | | | | 913,155 | | |
Total | | | | | 12,176,517 | | |
Oil, Gas & Consumable Fuels 1.8% | |
Carrizo Oil & Gas, Inc.(a) | | | 59,201 | | | | 2,156,692 | | |
Diamondback Energy, Inc.(a) | | | 54,950 | | | | 3,752,536 | | |
Matador Resources Co.(a) | | | 157,133 | | | | 3,599,917 | | |
Total | | | | | 9,509,145 | | |
Total Energy | | | | | 21,685,662 | | |
FINANCIALS 17.9% | |
Banks 8.8% | |
Berkshire Hills Bancorp, Inc. | | | 60,782 | | | | 1,700,680 | | |
Bryn Mawr Bank Corp. | | | 161,194 | | | | 4,784,238 | | |
Financial Institutions, Inc. | | | 227,568 | | | | 5,636,859 | | |
Independent Bank Corp. | | | 247,323 | | | | 3,479,835 | | |
Live Oak Bancshares, Inc.(a) | | | 141,107 | | | | 2,719,132 | | |
National Bank Holdings Corp., Class A | | | 134,654 | | | | 2,715,971 | | |
OFG Bancorp | | | 529,768 | | | | 4,577,196 | | |
PacWest Bancorp | | | 99,706 | | | | 4,251,464 | | |
Simmons First National Corp., Class A | | | 55,456 | | | | 2,432,855 | | |
South State Corp. | | | 19,288 | | | | 1,449,493 | | |
Southwest Bancorp, Inc. | | | 347,536 | | | | 5,796,901 | | |
Trico Bancshares | | | 132,911 | | | | 3,155,307 | | |
Union Bankshares Corp. | | | 142,935 | | | | 3,373,266 | | |
Veritex Holdings, Inc.(a) | | | 122,861 | | | | 1,914,174 | | |
Total | | | | | 47,987,371 | | |
The accompanying Notes to Financial Statements are an integral part of this statement.
Annual Report 2015
7
COLUMBIA SMALL CAP CORE FUND
PORTFOLIO OF INVESTMENTS (continued)
August 31, 2015
Common Stocks (continued)
Issuer | | Shares | | Value ($) | |
Capital Markets 1.5% | |
INTL FCStone, Inc.(a) | | | 122,699 | | | | 3,246,615 | | |
MVC Capital, Inc. | | | 240,183 | | | | 2,269,729 | | |
Virtus Investment Partners, Inc. | | | 23,028 | | | | 2,649,602 | | |
Total | | | | | 8,165,946 | | |
Insurance 2.7% | |
Arthur J Gallagher & Co. | | | 57,067 | | | | 2,494,969 | | |
CNO Financial Group, Inc. | | | 278,575 | | | | 4,983,707 | | |
Enstar Group Ltd.(a) | | | 22,847 | | | | 3,338,175 | | |
Horace Mann Educators Corp. | | | 112,616 | | | | 3,741,104 | | |
Total | | | | | 14,557,955 | | |
Real Estate Investment Trusts (REITs) 3.9% | |
Acadia Realty Trust | | | 104,052 | | | | 3,074,737 | | |
American Campus Communities, Inc. | | | 91,851 | | | | 3,145,897 | | |
First Potomac Realty Trust | | | 260,095 | | | | 2,733,598 | | |
Physicians Realty Trust | | | 239,873 | | | | 3,478,158 | | |
STAG Industrial, Inc. | | | 259,709 | | | | 4,430,636 | | |
Summit Hotel Properties, Inc. | | | 340,548 | | | | 4,130,847 | | |
Total | | | | | 20,993,873 | | |
Thrifts & Mortgage Finance 1.0% | |
Dime Community Bancshares, Inc. | | | 159,367 | | | | 2,714,020 | | |
Federal Agricultural Mortgage Corp., Class C | | | 126,337 | | | | 2,990,397 | | |
Total | | | | | 5,704,417 | | |
Total Financials | | | | | 97,409,562 | | |
HEALTH CARE 14.7% | |
Biotechnology 1.0% | |
Repligen Corp.(a) | | | 158,882 | | | | 5,414,699 | | |
Health Care Equipment & Supplies 6.9% | |
Analogic Corp. | | | 75,991 | | | | 6,123,355 | | |
Atrion Corp. | | | 20,133 | | | | 7,791,471 | | |
CryoLife, Inc. | | | 263,853 | | | | 2,580,482 | | |
Haemonetics Corp.(a) | | | 71,602 | | | | 2,585,548 | | |
Hill-Rom Holdings, Inc. | | | 43,540 | | | | 2,300,654 | | |
Invacare Corp. | | | 157,499 | | | | 2,770,407 | | |
Staar Surgical Co.(a) | | | 875,052 | | | | 6,991,665 | | |
Teleflex, Inc. | | | 23,757 | | | | 3,107,416 | | |
West Pharmaceutical Services, Inc. | | | 57,910 | | | | 3,234,274 | | |
Total | | | | | 37,485,272 | | |
Common Stocks (continued)
Issuer | | Shares | | Value ($) | |
Health Care Providers & Services 4.3% | |
Air Methods Corp.(a) | | | 164,831 | | | | 6,172,921 | | |
Magellan Health, Inc.(a) | | | 77,190 | | | | 4,322,640 | | |
Providence Service Corp. (The)(a) | | | 281,147 | | | | 12,603,820 | | |
Total | | | | | 23,099,381 | | |
Life Sciences Tools & Services 1.6% | |
Bio-Rad Laboratories, Inc., Class A(a) | | | 31,821 | | | | 4,433,620 | | |
Bio-Techne Corp. | | | 29,840 | | | | 2,819,283 | | |
Bruker Corp.(a) | | | 80,798 | | | | 1,485,067 | | |
Total | | | | | 8,737,970 | | |
Pharmaceuticals 0.9% | |
Supernus Pharmaceuticals, Inc.(a) | | | 275,722 | | | | 5,004,354 | | |
Total Health Care | | | | | 79,741,676 | | |
INDUSTRIALS 19.7% | |
Aerospace & Defense 1.2% | |
AAR Corp. | | | 107,829 | | | | 2,623,480 | | |
American Science & Engineering, Inc. | | | 101,079 | | | | 3,973,415 | | |
Total | | | | | 6,596,895 | | |
Air Freight & Logistics 0.6% | |
Atlas Air Worldwide Holdings, Inc.(a) | | | 79,467 | | | | 3,282,782 | | |
Commercial Services & Supplies 2.3% | |
ABM Industries, Inc. | | | 74,839 | | | | 2,395,597 | | |
McGrath Rentcorp | | | 190,542 | | | | 4,887,402 | | |
Unifirst Corp. | | | 48,637 | | | | 5,272,737 | | |
Total | | | | | 12,555,736 | | |
Construction & Engineering 4.1% | |
Argan, Inc. | | | 102,558 | | | | 4,015,146 | | |
EMCOR Group, Inc. | | | 102,258 | | | | 4,713,071 | | |
Great Lakes Dredge & Dock Corp.(a) | | | 342,686 | | | | 1,901,907 | | |
MasTec, Inc.(a) | | | 272,422 | | | | 4,511,308 | | |
Primoris Services Corp. | | | 228,018 | | | | 4,188,691 | | |
Sterling Construction Co., Inc.(a) | | | 624,643 | | | | 2,898,344 | | |
Total | | | | | 22,228,467 | | |
Electrical Equipment 2.0% | |
EnerSys | | | 54,614 | | | | 2,920,210 | | |
Global Power Equipment Group, Inc. | | | 149,410 | | | | 687,286 | | |
LSI Industries, Inc. | | | 760,885 | | | | 7,220,799 | | |
Total | | | | | 10,828,295 | | |
The accompanying Notes to Financial Statements are an integral part of this statement.
Annual Report 2015
8
COLUMBIA SMALL CAP CORE FUND
PORTFOLIO OF INVESTMENTS (continued)
August 31, 2015
Common Stocks (continued)
Issuer | | Shares | | Value ($) | |
Industrial Conglomerates 0.5% | |
Raven Industries, Inc. | | | 133,634 | | | | 2,421,448 | | |
Machinery 5.6% | |
Alamo Group, Inc. | | | 71,104 | | | | 3,661,145 | | |
Albany International Corp., Class A | | | 79,250 | | | | 2,528,075 | | |
ESCO Technologies, Inc. | | | 56,185 | | | | 2,028,840 | | |
Key Technology, Inc.(a) | | | 297,951 | | | | 3,667,777 | | |
Miller Industries, Inc. | | | 129,627 | | | | 2,811,610 | | |
NN, Inc. | | | 92,138 | | | | 2,230,661 | | |
PMFG, Inc.(a) | | | 1,051,229 | | | | 6,854,013 | | |
TriMas Corp.(a) | | | 134,900 | | | | 2,460,576 | | |
Wabash National Corp.(a) | | | 351,267 | | | | 4,295,995 | | |
Total | | | | | 30,538,692 | | |
Marine 0.5% | |
Rand Logistics, Inc.(a)(b) | | | 1,006,432 | | | | 2,475,823 | | |
Professional Services 0.6% | |
Kforce, Inc. | | | 122,037 | | | | 3,269,371 | | |
Road & Rail 0.4% | |
Marten Transport Ltd. | | | 116,215 | | | | 2,151,140 | | |
Trading Companies & Distributors 1.9% | |
Kaman Corp. | | | 140,843 | | | | 5,468,934 | | |
MRC Global, Inc.(a) | | | 137,000 | | | | 1,779,630 | | |
Rush Enterprises, Inc., Class A(a) | | | 129,109 | | | | 3,294,861 | | |
Total | | | | | 10,543,425 | | |
Total Industrials | | | | | 106,892,074 | | |
INFORMATION TECHNOLOGY 18.3% | |
Communications Equipment 4.5% | |
ADTRAN, Inc. | | | 212,594 | | | | 3,405,756 | | |
InterDigital, Inc. | | | 97,478 | | | | 4,822,237 | | |
Mitel Networks Corp.(a) | | | 425,709 | | | | 3,137,475 | | |
Netscout Systems, Inc.(a) | | | 103,203 | | | | 3,772,070 | | |
Plantronics, Inc. | | | 147,571 | | | | 7,844,874 | | |
Sonus Networks, Inc.(a) | | | 221,098 | | | | 1,556,530 | | |
Total | | | | | 24,538,942 | | |
Electronic Equipment, Instruments & Components 7.7% | |
Anixter International, Inc.(a) | | | 48,506 | | | | 3,087,892 | | |
Belden, Inc. | | | 125,747 | | | | 6,336,391 | | |
Benchmark Electronics, Inc.(a) | | | 186,185 | | | | 3,978,773 | | |
Cognex Corp. | | | 56,670 | | | | 2,015,185 | | |
Common Stocks (continued)
Issuer | | Shares | | Value ($) | |
CTS Corp. | | | 135,488 | | | | 2,553,949 | | |
FARO Technologies, Inc.(a) | | | 78,315 | | | | 3,042,538 | | |
GSI Group, Inc.(a) | | | 244,099 | | | | 3,170,846 | | |
Littelfuse, Inc. | | | 41,344 | | | | 3,710,624 | | |
Newport Corp.(a) | | | 245,738 | | | | 3,759,791 | | |
Plexus Corp.(a) | | | 186,985 | | | | 7,118,519 | | |
Rogers Corp.(a) | | | 53,031 | | | | 2,951,706 | | |
Total | | | | | 41,726,214 | | |
IT Services 3.4% | |
Computer Task Group, Inc. | | | 309,987 | | | | 2,080,013 | | |
CoreLogic, Inc.(a) | | | 148,366 | | | | 5,630,490 | | |
DST Systems, Inc. | | | 66,426 | | | | 6,803,351 | | |
PRGX Global, Inc.(a)(b) | | | 1,048,076 | | | | 3,783,554 | | |
Total | | | | | 18,297,408 | | |
Semiconductors & Semiconductor Equipment 0.9% | |
Integrated Device Technology, Inc.(a) | | | 135,793 | | | | 2,578,709 | | |
Xcerra Corp.(a) | | | 314,262 | | | | 1,967,280 | | |
Total | | | | | 4,545,989 | | |
Software 1.6% | |
American Software, Inc., Class A | | | 317,105 | | | | 2,904,682 | | |
Mentor Graphics Corp. | | | 97,889 | | | | 2,529,452 | | |
Progress Software Corp.(a) | | | 126,680 | | | | 3,431,761 | | |
Total | | | | | 8,865,895 | | |
Technology Hardware, Storage & Peripherals 0.2% | |
Intevac, Inc.(a) | | | 256,288 | | | | 1,207,116 | | |
Total Information Technology | | | | | 99,181,564 | | |
MATERIALS 5.2% | |
Chemicals 4.0% | |
H.B. Fuller Co. | | | 42,865 | | | | 1,553,428 | | |
Innophos Holdings, Inc. | | | 65,733 | | | | 3,159,785 | | |
Omnova Solutions, Inc.(a) | | | 641,971 | | | | 4,037,997 | | |
Rayonier Advanced Materials, Inc. | | | 174,213 | | | | 1,188,133 | | |
Sensient Technologies Corp. | | | 132,832 | | | | 8,654,005 | | |
Stepan Co. | | | 76,698 | | | | 3,453,711 | | |
Total | | | | | 22,047,059 | | |
Containers & Packaging 0.6% | |
Greif, Inc., Class A | | | 110,547 | | | | 3,236,816 | | |
Metals & Mining 0.2% | |
Universal Stainless & Alloy Products, Inc.(a) | | | 69,221 | | | | 899,181 | | |
The accompanying Notes to Financial Statements are an integral part of this statement.
Annual Report 2015
9
COLUMBIA SMALL CAP CORE FUND
PORTFOLIO OF INVESTMENTS (continued)
August 31, 2015
Common Stocks (continued)
Issuer | | Shares | | Value ($) | |
Paper & Forest Products 0.4% | |
PH Glatfelter Co. | | | 122,960 | | | | 2,220,658 | | |
Total Materials | | | | | 28,403,714 | | |
TELECOMMUNICATION SERVICES 1.1% | |
Diversified Telecommunication Services 1.1% | |
General Communication, Inc., Class A(a) | | | 357,560 | | | | 6,024,886 | | |
Total Telecommunication Services | | | | | 6,024,886 | | |
UTILITIES 2.5% | |
Electric Utilities 0.5% | |
Allete, Inc. | | | 56,771 | | | | 2,712,518 | | |
Gas Utilities 2.0% | |
Laclede Group, Inc. (The) | | | 82,700 | | | | 4,378,138 | | |
New Jersey Resources Corp. | | | 120,480 | | | | 3,405,970 | | |
South Jersey Industries, Inc. | | | 127,980 | | | | 3,084,318 | | |
Total | | | | | 10,868,426 | | |
Total Utilities | | | | | 13,580,944 | | |
Total Common Stocks
(Cost: $397,343,295) | | | | | 533,383,180 | | |
Money Market Funds 0.4%
| | | Shares | | Value ($) | |
Columbia Short-Term Cash Fund,
0.150%(b)(c) | | | 2,287,779 | | | | 2,287,779 | | |
Total Money Market Funds
(Cost: $2,287,779) | | | | | 2,287,779 | | |
Total Investments
(Cost: $399,631,074) | | | | | 535,670,959 | | |
Other Assets & Liabilities, Net | | | | | 7,406,360 | | |
Net Assets | | | | | 543,077,319 | | |
Notes to Portfolio of Investments
(a) Non-income producing investment.
(b) As defined in the Investment Company Act of 1940, an affiliated company is one in which the Fund owns 5% or more of the company's outstanding voting securities, or a company which is under common ownership or control with the Fund. Holdings and transactions in these affiliated companies during the year ended August 31, 2015 are as follows:
Issuer | | Beginning
Cost ($) | | Purchase
Cost ($) | | Proceeds
From Sales ($) | | Realized
Gain (Loss) ($) | | Ending
Cost ($) | | Dividends —
Affiliated
Issuers ($) | | Value ($) | |
Columbia Short-Term
Cash Fund | | | 12,075,821 | | | | 481,637,401 | | | | (491,425,443 | ) | | | — | | | | 2,287,779 | | | | 22,636 | | | | 2,287,779 | | |
PRGX Global, Inc.* | | | 8,426,444 | | | | — | | | | (1,510,769 | ) | | | (687,581 | ) | | | 6,228,094 | | | | — | | | | 3,783,554 | | |
Rand Logistics, Inc.* | | | 4,870,856 | | | | 792,087 | | | | — | | | | — | | | | 5,662,943 | | | | — | | | | 2,475,823 | | |
Total | | | 25,373,121 | | | | 482,429,488 | | | | (492,936,212 | ) | | | (687,581 | ) | | | 14,178,816 | | | | 22,636 | | | | 8,547,156 | | |
*Issuer was not an affiliate for the entire period ended August 31, 2015.
(c) The rate shown is the seven-day current annualized yield at August 31, 2015.
The accompanying Notes to Financial Statements are an integral part of this statement.
Annual Report 2015
10
COLUMBIA SMALL CAP CORE FUND
PORTFOLIO OF INVESTMENTS (continued)
August 31, 2015
Fair Value Measurements
The Fund categorizes its fair value measurements according to a three-level hierarchy that maximizes the use of observable inputs and minimizes the use of unobservable inputs by prioritizing that the most observable input be used when available. Observable inputs are those that market participants would use in pricing an investment based on market data obtained from sources independent of the reporting entity. Unobservable inputs are those that reflect the Fund's assumptions about the information market participants would use in pricing an investment. An investment's level within the fair value hierarchy is based on the lowest level of any input that is deemed significant to the asset's or liability's fair value measurement. The input levels are not necessarily an indication of the risk or liquidity associated with investments at that level. For example, certain U.S. government securities are generally high quality and liquid, however, they are reflected as Level 2 because the inputs used to determine fair value may not always be quoted prices in an active market.
Fair value inputs are summarized in the three broad levels listed below:
> Level 1 — Valuations based on quoted prices for investments in active markets that the Fund has the ability to access at the measurement date (including NAV for open-end mutual funds). Valuation adjustments are not applied to Level 1 investments.
> Level 2 — Valuations based on other significant observable inputs (including quoted prices for similar securities, interest rates, prepayment speeds, credit risks, etc.).
> Level 3 — Valuations based on significant unobservable inputs (including the Fund's own assumptions and judgment in determining the fair value of investments).
Inputs that are used in determining fair value of an investment may include price information, credit data, volatility statistics, and other factors. These inputs can be either observable or unobservable. The availability of observable inputs can vary between investments, and is affected by various factors such as the type of investment, and the volume and level of activity for that investment or similar investments in the marketplace. The inputs will be considered by the Investment Manager, along with any other relevant factors in the calculation of an investment's fair value. The Fund uses prices and inputs that are current as of the measurement date, which may include periods of market dislocations. During these periods, the availability of prices and inputs may be reduced for many investments. This condition could cause an investment to be reclassified between the various levels within the hierarchy.
Investments falling into the Level 3 category are primarily supported by quoted prices from brokers and dealers participating in the market for those investments. However, these may be classified as Level 3 investments due to lack of market transparency and corroboration to support these quoted prices. Additionally, valuation models may be used as the pricing source for any remaining investments classified as Level 3. These models may rely on one or more significant unobservable inputs and/or significant assumptions by the Investment Manager. Inputs used in valuations may include, but are not limited to, financial statement analysis, capital account balances, discount rates and estimated cash flows, and comparable company data.
Under the direction of the Fund's Board of Trustees (the Board), the Investment Manager's Valuation Committee (the Committee) is responsible for overseeing the valuation procedures approved by the Board. The Committee consists of voting and non-voting members from various groups within the Investment Manager's organization, including operations and accounting, trading and investments, compliance, risk management and legal.
The Committee meets at least monthly to review and approve valuation matters, which may include a description of specific valuation determinations, data regarding pricing information received from approved pricing vendors and brokers and the results of Board-approved valuation control policies and procedures (the Policies). The Policies address, among other things, instances when market quotations are or are not readily available, including recommendations of third party pricing vendors and a determination of appropriate pricing methodologies; events that require specific valuation determinations and assessment of fair value techniques; securities with a potential for stale pricing, including those that are illiquid, restricted, or in default; and the effectiveness of third party pricing vendors, including periodic reviews of vendors. The Committee meets more frequently, as needed, to discuss additional valuation matters, which may include the need to review back-testing results, review time-sensitive information or approve related valuation actions. The Committee reports to the Board, with members of the Committee meeting with the Board at each of its regularly scheduled meetings to discuss valuation matters and actions during the period, similar to those described earlier.
For investments categorized as Level 3, the Committee monitors information similar to that described above, which may include: (i) data specific to the issuer or comparable issuers, (ii) general market or specific sector news and (iii) quoted prices and specific or similar security transactions. The Committee considers this data and any changes from prior periods in order to assess the reasonableness of observable and unobservable inputs, any assumptions or internal models used to value those securities and changes in fair value. This data is also used to corroborate, when available, information received from approved pricing vendors and brokers. Various factors impact the frequency of monitoring this information (which may occur as often as daily). However, the Committee may determine that changes to inputs, assumptions and models are not required as a result of the monitoring procedures performed.
The accompanying Notes to Financial Statements are an integral part of this statement.
Annual Report 2015
11
COLUMBIA SMALL CAP CORE FUND
PORTFOLIO OF INVESTMENTS (continued)
August 31, 2015
Fair Value Measurements (continued)
The following table is a summary of the inputs used to value the Fund's investments at August 31, 2015:
| | | Level 1
Quoted Prices in Active
Assets ($) | | Level 2
Markets for Identical
Observable Inputs ($) | | Level 3
Other Significant
Unobservable Inputs ($) | | Significant
Total ($) | |
Investments | |
Common Stocks | |
Consumer Discretionary | | | 75,666,956 | | | | — | | | | — | | | | 75,666,956 | | |
Consumer Staples | | | 4,796,142 | | | | — | | | | — | | | | 4,796,142 | | |
Energy | | | 21,685,662 | | | | — | | | | — | | | | 21,685,662 | | |
Financials | | | 97,409,562 | | | | — | | | | — | | | | 97,409,562 | | |
Health Care | | | 79,741,676 | | | | — | | | | — | | | | 79,741,676 | | |
Industrials | | | 106,892,074 | | | | — | | | | — | | | | 106,892,074 | | |
Information Technology | | | 99,181,564 | | | | — | | | | — | | | | 99,181,564 | | |
Materials | | | 28,403,714 | | | | — | | | | — | | | | 28,403,714 | | |
Telecommunication Services | | | 6,024,886 | | | | — | | | | — | | | | 6,024,886 | | |
Utilities | | | 13,580,944 | | | | — | | | | — | | | | 13,580,944 | | |
Total Common Stocks | | | 533,383,180 | | | | — | | | | — | | | | 533,383,180 | | |
Money Market Funds | | | — | | | | 2,287,779 | | | | — | | | | 2,287,779 | | |
Total Investments | | | 533,383,180 | | | | 2,287,779 | | | | — | | | | 535,670,959 | | |
See the Portfolio of Investments for all investment classifications not indicated in the table.
The Fund's assets assigned to the Level 2 input category are generally valued using the market approach, in which a security's value is determined through reference to prices and information from market transactions for similar or identical assets.
Financial assets were transferred from Level 1 to Level 2 as the market for these assets is not considered publicly available. Fund per share market values were obtained using observable market inputs.
The following table shows transfers between Level 1 and Level 2 of the fair value hierarchy:
Transfers In | | Transfers Out | |
| Level 1 ($) | | Level 2 ($) | | Level 1 ($) | | Level 2 ($) | |
| | — | | | | 12,075,821 | | | | 12,075,821 | | | | — | | |
Transfers between Level 1 and Level 2 are determined based on the fair value at the beginning of the period for security positions held throughout the period.
There were no transfers of financial assets between Levels 2 and 3 during the period.
The accompanying Notes to Financial Statements are an integral part of this statement.
Annual Report 2015
12
COLUMBIA SMALL CAP CORE FUND
STATEMENT OF ASSETS AND LIABILITIES
August 31, 2015
Assets | |
Investments, at value | |
Unaffiliated issuers (identified cost $385,452,258) | | $ | 527,123,803 | | |
Affiliated issuers (identified cost $14,178,816) | | | 8,547,156 | | |
Total investments (identified cost $399,631,074) | | | 535,670,959 | | |
Receivable for: | |
Investments sold | | | 8,358,741 | | |
Capital shares sold | | | 200,220 | | |
Dividends | | | 370,395 | | |
Prepaid expenses | | | 8,273 | | |
Trustees' deferred compensation plan | | | 85,915 | | |
Total assets | | | 544,694,503 | | |
Liabilities | |
Payable for: | |
Capital shares purchased | | | 1,300,742 | | |
Investment management fees | | | 35,131 | | |
Distribution and/or service fees | | | 6,075 | | |
Transfer agent fees | | | 114,825 | | |
Administration fees | | | 3,556 | | |
Compensation of board members | | | 846 | | |
Chief compliance officer expenses | | | 72 | | |
Other expenses | | | 70,022 | | |
Trustees' deferred compensation plan | | | 85,915 | | |
Total liabilities | | | 1,617,184 | | |
Net assets applicable to outstanding capital stock | | $ | 543,077,319 | | |
Represented by | |
Paid-in capital | | $ | 270,144,872 | | |
Excess of distributions over net investment income | | | (83,090 | ) | |
Accumulated net realized gain | | | 136,975,652 | | |
Unrealized appreciation (depreciation) on: | |
Investments — unaffiliated issuers | | | 141,671,545 | | |
Investments — affiliated issuers | | | (5,631,660 | ) | |
Total — representing net assets applicable to outstanding capital stock | | $ | 543,077,319 | | |
The accompanying Notes to Financial Statements are an integral part of this statement.
Annual Report 2015
13
COLUMBIA SMALL CAP CORE FUND
STATEMENT OF ASSETS AND LIABILITIES (continued)
August 31, 2015
Class A | |
Net assets | | $ | 137,486,064 | | |
Shares outstanding | | | 8,224,230 | | |
Net asset value per share | | $ | 16.72 | | |
Maximum offering price per share(a) | | $ | 17.74 | | |
Class B | |
Net assets | | $ | 315,135 | | |
Shares outstanding | | | 22,649 | | |
Net asset value per share | | $ | 13.91 | | |
Class C | |
Net assets | | $ | 22,624,876 | | |
Shares outstanding | | | 1,623,715 | | |
Net asset value per share | | $ | 13.93 | | |
Class I | |
Net assets | | $ | 55,803,808 | | |
Shares outstanding | | | 3,174,872 | | |
Net asset value per share | | $ | 17.58 | | |
Class R4 | |
Net assets | | $ | 6,122,732 | | |
Shares outstanding | | | 347,336 | | |
Net asset value per share | | $ | 17.63 | | |
Class R5 | |
Net assets | | $ | 12,955,409 | | |
Shares outstanding | | | 732,932 | | |
Net asset value per share | | $ | 17.68 | | |
Class T | |
Net assets | | $ | 65,184,461 | | |
Shares outstanding | | | 3,991,107 | | |
Net asset value per share | | $ | 16.33 | | |
Maximum offering price per share(a) | | $ | 17.33 | | |
Class W | |
Net assets | | $ | 305,639 | | |
Shares outstanding | | | 18,285 | | |
Net asset value per share | | $ | 16.72 | | |
Class Y | |
Net assets | | $ | 3,023,765 | | |
Shares outstanding | | | 170,250 | | |
Net asset value per share | | $ | 17.76 | | |
Class Z | |
Net assets | | $ | 239,255,430 | | |
Shares outstanding | | | 13,704,395 | | |
Net asset value per share | | $ | 17.46 | | |
(a) The maximum offering price per share is calculated by dividing the net asset value per share by 1.0 minus the maximum sales charge of 5.75%.
The accompanying Notes to Financial Statements are an integral part of this statement.
Annual Report 2015
14
COLUMBIA SMALL CAP CORE FUND
STATEMENT OF OPERATIONS
Year Ended August 31, 2015
Net investment income | |
Income: | |
Dividends — unaffiliated issuers | | $ | 9,543,891 | | |
Dividends — affiliated issuers | | | 22,636 | | |
Foreign taxes withheld | | | (32,295 | ) | |
Total income | | | 9,534,232 | | |
Expenses: | |
Investment management fees | | | 7,204,789 | | |
Distribution and/or service fees | |
Class A | | | 879,479 | | |
Class B | | | 4,550 | | |
Class C | | | 274,339 | | |
Class T | | | 196,314 | | |
Class W | | | 30,881 | | |
Transfer agent fees | |
Class A | | | 802,127 | | |
Class B | | | 1,022 | | |
Class C | | | 61,099 | | |
Class R4 | | | 16,238 | | |
Class R5 | | | 11,195 | | |
Class T | | | 162,944 | | |
Class W | | | 28,035 | | |
Class Z | | | 835,177 | | |
Administration fees | | | 727,538 | | |
Compensation of board members | | | 36,807 | | |
Custodian fees | | | 18,009 | | |
Printing and postage fees | | | 99,319 | | |
Registration fees | | | 129,829 | | |
Professional fees | | | 55,565 | | |
Chief compliance officer expenses | | | 477 | | |
Other | | | 30,348 | | |
Total expenses | | | 11,606,081 | | |
Expense reductions | | | (1,698 | ) | |
Total net expenses | | | 11,604,383 | | |
Net investment loss | | | (2,070,151 | ) | |
Realized and unrealized gain (loss) — net | |
Net realized gain (loss) on: | |
Investments — unaffiliated issuers | | | 162,319,738 | | |
Investments — affiliated issuers | | | (687,581 | ) | |
Futures contracts | | | 1,239,948 | | |
Net realized gain | | | 162,872,105 | | |
Net change in unrealized appreciation (depreciation) on: | |
Investments — unaffiliated issuers | | | (197,028,306 | ) | |
Investments — affiliated issuers | | | (5,840,560 | ) | |
Net change in unrealized depreciation | | | (202,868,866 | ) | |
Net realized and unrealized loss | | | (39,996,761 | ) | |
Net decrease in net assets from operations | | $ | (42,066,912 | ) | |
The accompanying Notes to Financial Statements are an integral part of this statement.
Annual Report 2015
15
COLUMBIA SMALL CAP CORE FUND
STATEMENT OF CHANGES IN NET ASSETS
| | | Year Ended
August 31,
2015 | | Year Ended
August 31,
2014 | |
Operations | |
Net investment loss | | $ | (2,070,151 | ) | | $ | (2,385,412 | ) | |
Net realized gain | | | 162,872,105 | | | | 92,902,087 | | |
Net change in unrealized appreciation (depreciation) | | | (202,868,866 | ) | | | 72,252,013 | | |
Net increase (decrease) in net assets resulting from operations | | | (42,066,912 | ) | | | 162,768,688 | | |
Distributions to shareholders | |
Net investment income | |
Class A | | | (321,649 | ) | | | (221,305 | ) | |
Class I | | | (143,812 | ) | | | (197,543 | ) | |
Class R4 | | | (12,379 | ) | | | (9,113 | ) | |
Class R5 | | | (60,601 | ) | | | (57,948 | ) | |
Class T | | | (49,306 | ) | | | (20,127 | ) | |
Class W | | | (404 | ) | | | (35,121 | ) | |
Class Y | | | (44,683 | ) | | | (40,631 | ) | |
Class Z | | | (677,669 | ) | | | (941,189 | ) | |
Net realized gains | |
Class A | | | (32,612,168 | ) | | | (33,788,373 | ) | |
Class B | | | (47,871 | ) | | | (79,847 | ) | |
Class C | | | (2,818,598 | ) | | | (3,037,420 | ) | |
Class I | | | (4,823,973 | ) | | | (4,838,311 | ) | |
Class R4 | | | (617,780 | ) | | | (384,653 | ) | |
Class R5 | | | (2,214,144 | ) | | | (1,585,680 | ) | |
Class T | | | (6,294,308 | ) | | | (6,765,254 | ) | |
Class W | | | (39,342 | ) | | | (5,362,159 | ) | |
Class Y | | | (1,519,612 | ) | | | (995,148 | ) | |
Class Z | | | (33,818,753 | ) | | | (38,568,079 | ) | |
Total distributions to shareholders | | | (86,117,052 | ) | | | (96,927,901 | ) | |
Decrease in net assets from capital stock activity | | | (505,558,338 | ) | | | (24,329,915 | ) | |
Total increase (decrease) in net assets | | | (633,742,302 | ) | | | 41,510,872 | | |
Net assets at beginning of year | | | 1,176,819,621 | | | | 1,135,308,749 | | |
Net assets at end of year | | $ | 543,077,319 | | | $ | 1,176,819,621 | | |
Excess of distributions over net investment income | | $ | (83,090 | ) | | $ | (85,480 | ) | |
The accompanying Notes to Financial Statements are an integral part of this statement.
Annual Report 2015
16
COLUMBIA SMALL CAP CORE FUND
STATEMENT OF CHANGES IN NET ASSETS (continued)
| | | Year Ended August 31, 2015 | | Year Ended August 31, 2014 | |
| | | Shares | | Dollars ($) | | Shares | | Dollars ($) | |
Capital stock activity | |
Class A shares | |
Subscriptions(a) | | | 6,038,108 | | | | 109,877,216 | | | | 7,129,870 | | | | 139,314,547 | | |
Distributions reinvested | | | 1,663,833 | | | | 29,050,518 | | | | 1,546,124 | | | | 29,113,513 | | |
Redemptions | | | (20,876,804 | ) | | | (377,368,984 | ) | | | (8,776,045 | ) | | | (172,100,037 | ) | |
Net decrease | | | (13,174,863 | ) | | | (238,441,250 | ) | | | (100,051 | ) | | | (3,671,977 | ) | |
Class B shares | |
Subscriptions | | | 2,626 | | | | 39,372 | | | | 3,797 | | | | 63,676 | | |
Distributions reinvested | | | 2,943 | | | | 42,992 | | | | 4,245 | | | | 68,426 | | |
Redemptions(a) | | | (18,255 | ) | | | (276,946 | ) | | | (27,155 | ) | | | (453,519 | ) | |
Net decrease | | | (12,686 | ) | | | (194,582 | ) | | | (19,113 | ) | | | (321,417 | ) | |
Class C shares | |
Subscriptions | | | 218,882 | | | | 3,280,446 | | | | 300,945 | | | | 5,067,006 | | |
Distributions reinvested | | | 155,737 | | | | 2,278,432 | | | | 152,375 | | | | 2,459,331 | | |
Redemptions | | | (611,233 | ) | | | (9,163,129 | ) | | | (435,774 | ) | | | (7,288,707 | ) | |
Net increase (decrease) | | | (236,614 | ) | | | (3,604,251 | ) | | | 17,546 | | | | 237,630 | | |
Class I shares | |
Subscriptions | | | 42,500 | | | | 799,236 | | | | 53,854 | | | | 1,090,050 | | |
Distributions reinvested | | | 271,601 | | | | 4,967,583 | | | | 257,046 | | | | 5,035,530 | | |
Redemptions | | | (206,136 | ) | | | (3,928,603 | ) | | | (308,575 | ) | | | (6,405,604 | ) | |
Net increase (decrease) | | | 107,965 | | | | 1,838,216 | | | | 2,325 | | | | (280,024 | ) | |
Class R4 shares | |
Subscriptions | | | 227,971 | | | | 4,281,902 | | | | 364,439 | | | | 7,407,898 | | |
Distributions reinvested | | | 30,985 | | | | 569,195 | | | | 17,256 | | | | 339,943 | | |
Redemptions | | | (258,894 | ) | | | (4,808,877 | ) | | | (81,013 | ) | | | (1,663,227 | ) | |
Net increase | | | 62 | | | | 42,220 | | | | 300,682 | | | | 6,084,614 | | |
Class R5 shares | |
Subscriptions | | | 633,457 | | | | 12,298,079 | | | | 589,511 | | | | 11,960,034 | | |
Distributions reinvested | | | 123,627 | | | | 2,274,745 | | | | 83,419 | | | | 1,643,352 | | |
Redemptions | | | (1,373,626 | ) | | | (26,305,125 | ) | | | (185,276 | ) | | | (3,802,886 | ) | |
Net increase (decrease) | | | (616,542 | ) | | | (11,732,301 | ) | | | 487,654 | | | | 9,800,500 | | |
Class T shares | |
Subscriptions | | | 119,277 | | | | 2,054,946 | | | | 113,545 | | | | 2,109,189 | | |
Distributions reinvested | | | 258,803 | | | | 4,412,598 | | | | 255,823 | | | | 4,717,374 | | |
Redemptions | | | (503,703 | ) | | | (8,865,381 | ) | | | (426,622 | ) | | | (8,141,229 | ) | |
Net decrease | | | (125,623 | ) | | | (2,397,837 | ) | | | (57,254 | ) | | | (1,314,666 | ) | |
The accompanying Notes to Financial Statements are an integral part of this statement.
Annual Report 2015
17
COLUMBIA SMALL CAP CORE FUND
STATEMENT OF CHANGES IN NET ASSETS (continued)
| | | Year Ended August 31, 2015 | | Year Ended August 31, 2014 | |
| | | Shares | | Dollars ($) | | Shares | | Dollars ($) | |
Capital stock activity (continued) | |
Class W shares | |
Subscriptions | | | 72,730 | | | | 1,351,975 | | | | 1,487,653 | | | | 29,711,270 | | |
Distributions reinvested | | | 2,266 | | | | 39,543 | | | | 286,615 | | | | 5,396,959 | | |
Redemptions | | | (3,583,872 | ) | | | (69,287,149 | ) | | | (1,497,159 | ) | | | (29,336,726 | ) | |
Net increase (decrease) | | | (3,508,876 | ) | | | (67,895,631 | ) | | | 277,109 | | | | 5,771,503 | | |
Class Y shares | |
Subscriptions | | | 515,623 | | | | 9,829,785 | | | | 195,604 | | | | 4,015,043 | | |
Distributions reinvested | | | 84,637 | | | | 1,564,098 | | | | 52,351 | | | | 1,035,503 | | |
Redemptions | | | (1,137,822 | ) | | | (21,822,720 | ) | | | (121,063 | ) | | | (2,491,321 | ) | |
Net increase (decrease) | | | (537,562 | ) | | | (10,428,837 | ) | | | 126,892 | | | | 2,559,225 | | |
Class Z shares | |
Subscriptions | | | 1,889,258 | | | | 35,638,739 | | | | 3,384,207 | | | | 68,347,321 | | |
Distributions reinvested | | | 956,789 | | | | 17,403,988 | | | | 996,637 | | | | 19,464,326 | | |
Redemptions | | | (12,078,763 | ) | | | (225,786,812 | ) | | | (6,479,611 | ) | | | (131,006,950 | ) | |
Net decrease | | | (9,232,716 | ) | | | (172,744,085 | ) | | | (2,098,767 | ) | | | (43,195,303 | ) | |
Total net decrease | | | (27,337,455 | ) | | | (505,558,338 | ) | | | (1,062,977 | ) | | | (24,329,915 | ) | |
(a) Includes conversions of Class B shares to Class A shares, if any.
The accompanying Notes to Financial Statements are an integral part of this statement.
Annual Report 2015
18
COLUMBIA SMALL CAP CORE FUND
The following tables are intended to help you understand the Fund's financial performance. Certain information reflects financial results for a single share of a class held for the periods shown. Per share net investment income (loss) amounts are calculated based on average shares outstanding during the period. Total return assumes reinvestment of all dividends and distributions, if any. Total return does not reflect payment of sales charges, if any. Total return and portfolio turnover are not annualized for periods of less than one year. The portfolio turnover rate is calculated without regard to purchase and sales transactions of short-term instruments and certain derivatives, if any. If such transactions were included, the Fund's portfolio turnover rate may be higher.
| | | Year Ended August 31, | | Year Ended
September 30, | |
Class A | | 2015 | | 2014 | | 2013 | | 2012(a) | | 2011 | | 2010 | |
Per share data | |
Net asset value, beginning of period | | $ | 19.57 | | | $ | 18.57 | | | $ | 15.05 | | | $ | 12.98 | | | $ | 13.33 | | | $ | 11.58 | | |
Income from investment operations: | |
Net investment loss | | | (0.06 | ) | | | (0.06 | ) | | | (0.01 | ) | | | (0.04 | ) | | | (0.07 | ) | | | (0.05 | ) | |
Net realized and unrealized gain (loss) | | | (1.21 | ) | | | 2.73 | | | | 4.08 | | | | 2.68 | | | | (0.28 | ) | | | 1.80 | | |
Total from investment operations | | | (1.27 | ) | | | 2.67 | | | | 4.07 | | | | 2.64 | | | | (0.35 | ) | | | 1.75 | | |
Less distributions to shareholders: | |
Net investment income | | | (0.01 | ) | | | (0.01 | ) | | | (0.06 | ) | | | — | | | | — | | | | — | | |
Net realized gains | | | (1.57 | ) | | | (1.66 | ) | | | (0.49 | ) | | | (0.57 | ) | | | — | | | | — | | |
Total distributions to shareholders | | | (1.58 | ) | | | (1.67 | ) | | | (0.55 | ) | | | (0.57 | ) | | | — | | | | — | | |
Proceeds from regulatory settlements | | | — | | | | — | | | | — | | | | — | | | | 0.00 | (b) | | | — | | |
Net asset value, end of period | | $ | 16.72 | | | $ | 19.57 | | | $ | 18.57 | | | $ | 15.05 | | | $ | 12.98 | | | $ | 13.33 | | |
Total return | | | (6.81 | %) | | | 14.73 | % | | | 27.93 | % | | | 20.46 | % | | | (2.63 | %) | | | 15.11 | % | |
Ratios to average net assets(c) | |
Total gross expenses | | | 1.36 | % | | | 1.35 | %(d) | | | 1.37 | %(d) | | | 1.37 | %(e) | | | 1.32 | % | | | 1.30 | % | |
Total net expenses(f) | | | 1.36 | %(g) | | | 1.35 | %(d)(g) | | | 1.36 | %(d)(g) | | | 1.36 | %(e)(g) | | | 1.29 | %(g) | | | 1.30 | %(g) | |
Net investment loss | | | (0.35 | %) | | | (0.32 | %) | | | (0.07 | %) | | | (0.28 | %)(e) | | | (0.48 | %) | | | (0.38 | %) | |
Supplemental data | |
Net assets, end of period (in thousands) | | $ | 137,486 | | | $ | 418,814 | | | $ | 399,232 | | | $ | 228,303 | | | $ | 162,502 | | | $ | 121,456 | | |
Portfolio turnover | | | 23 | % | | | 19 | % | | | 34 | % | | | 26 | % | | | 33 | % | | | 26 | % | |
Notes to Financial Highlights
(a) For the period from October 1, 2011 to August 31, 2012. During the period, the Fund's fiscal year end was changed from September 30 to August 31.
(b) Rounds to zero.
(c) In addition to the fees and expenses that the Fund bears directly, the Fund indirectly bears a pro rata share of the fees and expenses of any other funds in which it invests. Such indirect expenses are not included in the Fund's reported expense ratios.
(d) Ratios include line of credit interest expense which is less than 0.01%.
(e) Annualized.
(f) Total net expenses include the impact of certain fee waivers/expense reimbursements made by the Investment Manager and certain of its affiliates, if applicable.
(g) The benefits derived from expense reductions had an impact of less than 0.01%.
The accompanying Notes to Financial Statements are an integral part of this statement.
Annual Report 2015
19
COLUMBIA SMALL CAP CORE FUND
FINANCIAL HIGHLIGHTS (continued)
| | | Year Ended August 31, | | Year Ended
September 30, | |
Class B | | 2015 | | 2014 | | 2013 | | 2012(a) | | 2011 | | 2010 | |
Per share data | |
Net asset value, beginning of period | | $ | 16.66 | | | $ | 16.13 | | | $ | 13.19 | | | $ | 11.50 | | | $ | 11.90 | | | $ | 10.42 | | |
Income from investment operations: | |
Net investment loss | | | (0.17 | ) | | | (0.18 | ) | | | (0.09 | ) | | | (0.12 | ) | | | (0.17 | ) | | | (0.12 | ) | |
Net realized and unrealized gain (loss) | | | (1.01 | ) | | | 2.37 | | | | 3.52 | | | | 2.38 | | | | (0.23 | ) | | | 1.60 | | |
Total from investment operations | | | (1.18 | ) | | | 2.19 | | | | 3.43 | | | | 2.26 | | | | (0.40 | ) | | | 1.48 | | |
Less distributions to shareholders: | |
Net realized gains | | | (1.57 | ) | | | (1.66 | ) | | | (0.49 | ) | | | (0.57 | ) | | | — | | | | — | | |
Total distributions to shareholders | | | (1.57 | ) | | | (1.66 | ) | | | (0.49 | ) | | | (0.57 | ) | | | — | | | | — | | |
Proceeds from regulatory settlements | | | — | | | | — | | | | — | | | | — | | | | 0.00 | (b) | | | — | | |
Net asset value, end of period | | $ | 13.91 | | | $ | 16.66 | | | $ | 16.13 | | | $ | 13.19 | | | $ | 11.50 | | | $ | 11.90 | | |
Total return | | | (7.54 | %) | | | 13.92 | % | | | 26.90 | % | | | 19.77 | % | | | (3.36 | %) | | | 14.20 | % | |
Ratios to average net assets(c) | |
Total gross expenses | | | 2.11 | % | | | 2.10 | %(d) | | | 2.11 | %(d) | | | 2.20 | %(e) | | | 2.08 | % | | | 2.05 | % | |
Total net expenses(f) | | | 2.11 | %(g) | | | 2.10 | %(d)(g) | | | 2.11 | %(d)(g) | | | 2.11 | %(e)(g) | | | 2.04 | %(g) | | | 2.05 | %(g) | |
Net investment loss | | | (1.09 | %) | | | (1.05 | %) | | | (0.61 | %) | | | (1.00 | %)(e) | | | (1.26 | %) | | | (1.11 | %) | |
Supplemental data | |
Net assets, end of period (in thousands) | | $ | 315 | | | $ | 589 | | | $ | 878 | | | $ | 1,497 | | | $ | 9,244 | | | $ | 15,478 | | |
Portfolio turnover | | | 23 | % | | | 19 | % | | | 34 | % | | | 26 | % | | | 33 | % | | | 26 | % | |
Notes to Financial Highlights
(a) For the period from October 1, 2011 to August 31, 2012. During the period, the Fund's fiscal year end was changed from September 30 to August 31.
(b) Rounds to zero.
(c) In addition to the fees and expenses that the Fund bears directly, the Fund indirectly bears a pro rata share of the fees and expenses of any other funds in which it invests. Such indirect expenses are not included in the Fund's reported expense ratios.
(d) Ratios include line of credit interest expense which is less than 0.01%.
(e) Annualized.
(f) Total net expenses include the impact of certain fee waivers/expense reimbursements made by the Investment Manager and certain of its affiliates, if applicable.
(g) The benefits derived from expense reductions had an impact of less than 0.01%.
The accompanying Notes to Financial Statements are an integral part of this statement.
Annual Report 2015
20
COLUMBIA SMALL CAP CORE FUND
FINANCIAL HIGHLIGHTS (continued)
| | | Year Ended August 31, | | Year Ended
September 30, | |
Class C | | 2015 | | 2014 | | 2013 | | 2012(a) | | 2011 | | 2010 | |
Per share data | |
Net asset value, beginning of period | | $ | 16.68 | | | $ | 16.15 | | | $ | 13.20 | | | $ | 11.52 | | | $ | 11.92 | | | $ | 10.43 | | |
Income from investment operations: | |
Net investment loss | | | (0.17 | ) | | | (0.18 | ) | | | (0.10 | ) | | | (0.12 | ) | | | (0.17 | ) | | | (0.12 | ) | |
Net realized and unrealized gain (loss) | | | (1.01 | ) | | | 2.37 | | | | 3.54 | | | | 2.37 | | | | (0.23 | ) | | | 1.61 | | |
Total from investment operations | | | (1.18 | ) | | | 2.19 | | | | 3.44 | | | | 2.25 | | | | (0.40 | ) | | | 1.49 | | |
Less distributions to shareholders: | |
Net realized gains | | | (1.57 | ) | | | (1.66 | ) | | | (0.49 | ) | | | (0.57 | ) | | | — | | | | — | | |
Total distributions to shareholders | | | (1.57 | ) | | | (1.66 | ) | | | (0.49 | ) | | | (0.57 | ) | | | — | | | | — | | |
Proceeds from regulatory settlements | | | — | | | | — | | | | — | | | | — | | | | 0.00 | (b) | | | — | | |
Net asset value, end of period | | $ | 13.93 | | | $ | 16.68 | | | $ | 16.15 | | | $ | 13.20 | | | $ | 11.52 | | | $ | 11.92 | | |
Total return | | | (7.53 | %) | | | 13.90 | % | | | 26.95 | % | | | 19.65 | % | | | (3.36 | %) | | | 14.29 | % | |
Ratios to average net assets(c) | |
Total gross expenses | | | 2.11 | % | | | 2.10 | %(d) | | | 2.11 | %(d) | | | 2.12 | %(e) | | | 2.07 | % | | | 2.05 | % | |
Total net expenses(f) | | | 2.11 | %(g) | | | 2.10 | %(d)(g) | | | 2.11 | %(d)(g) | | | 2.11 | %(e)(g) | | | 2.04 | %(g) | | | 2.05 | %(g) | |
Net investment loss | | | (1.09 | %) | | | (1.06 | %) | | | (0.71 | %) | | | (1.03 | %)(e) | | | (1.23 | %) | | | (1.12 | %) | |
Supplemental data | |
Net assets, end of period (in thousands) | | $ | 22,625 | | | $ | 31,035 | | | $ | 29,769 | | | $ | 26,077 | | | $ | 22,535 | | | $ | 19,635 | | |
Portfolio turnover | | | 23 | % | | | 19 | % | | | 34 | % | | | 26 | % | | | 33 | % | | | 26 | % | |
Notes to Financial Highlights
(a) For the period from October 1, 2011 to August 31, 2012. During the period, the Fund's fiscal year end was changed from September 30 to August 31.
(b) Rounds to zero.
(c) In addition to the fees and expenses that the Fund bears directly, the Fund indirectly bears a pro rata share of the fees and expenses of any other funds in which it invests. Such indirect expenses are not included in the Fund's reported expense ratios.
(d) Ratios include line of credit interest expense which is less than 0.01%.
(e) Annualized.
(f) Total net expenses include the impact of certain fee waivers/expense reimbursements made by the Investment Manager and certain of its affiliates, if applicable.
(g) The benefits derived from expense reductions had an impact of less than 0.01%.
The accompanying Notes to Financial Statements are an integral part of this statement.
Annual Report 2015
21
COLUMBIA SMALL CAP CORE FUND
FINANCIAL HIGHLIGHTS (continued)
| | | Year Ended August 31, | | Year Ended
September 30, | |
Class I | | 2015 | | 2014 | | 2013 | | 2012(a) | | 2011 | | 2010(b) | |
Per share data | |
Net asset value, beginning of period | | $ | 20.43 | | | $ | 19.28 | | | $ | 15.61 | | | $ | 13.38 | | | $ | 13.69 | | | $ | 13.37 | | |
Income from investment operations: | |
Net investment income (loss) | | | 0.02 | | | | 0.03 | | | | 0.09 | | | | 0.03 | | | | (0.01 | ) | | | 0.00 | (c) | |
Net realized and unrealized gain (loss) | | | (1.25 | ) | | | 2.85 | | | | 4.21 | | | | 2.77 | | | | (0.30 | ) | | | 0.32 | | |
Total from investment operations | | | (1.23 | ) | | | 2.88 | | | | 4.30 | | | | 2.80 | | | | (0.31 | ) | | | 0.32 | | |
Less distributions to shareholders: | |
Net investment income | | | (0.05 | ) | | | (0.07 | ) | | | (0.14 | ) | | | — | | | | — | | | | — | | |
Net realized gains | | | (1.57 | ) | | | (1.66 | ) | | | (0.49 | ) | | | (0.57 | ) | | | — | | | | — | | |
Total distributions to shareholders | | | (1.62 | ) | | | (1.73 | ) | | | (0.63 | ) | | | (0.57 | ) | | | — | | | | — | | |
Proceeds from regulatory settlements | | | — | | | | — | | | | — | | | | — | | | | 0.00 | (c) | | | — | | |
Net asset value, end of period | | $ | 17.58 | | | $ | 20.43 | | | $ | 19.28 | | | $ | 15.61 | | | $ | 13.38 | | | $ | 13.69 | | |
Total return | | | (6.35 | %) | | | 15.31 | % | | | 28.49 | % | | | 21.06 | % | | | (2.26 | %) | | | 2.39 | % | |
Ratios to average net assets(d) | |
Total gross expenses | | | 0.89 | % | | | 0.87 | %(e) | | | 0.88 | %(e) | | | 0.91 | %(f) | | | 0.88 | % | | | 0.90 | %(f) | |
Total net expenses(g) | | | 0.89 | % | | | 0.87 | %(e) | | | 0.88 | %(e) | | | 0.91 | %(f) | | | 0.88 | %(h) | | | 0.90 | %(f)(h) | |
Net investment income (loss) | | | 0.13 | % | | | 0.17 | % | | | 0.52 | % | | | 0.19 | %(f) | | | (0.04 | %) | | | 2.13 | %(f) | |
Supplemental data | |
Net assets, end of period (in thousands) | | $ | 55,804 | | | $ | 62,663 | | | $ | 59,098 | | | $ | 55,276 | | | $ | 3,765 | | | $ | 3 | | |
Portfolio turnover | | | 23 | % | | | 19 | % | | | 34 | % | | | 26 | % | | | 33 | % | | | 26 | % | |
Notes to Financial Highlights
(a) For the period from October 1, 2011 to August 31, 2012. During the period, the Fund's fiscal year end was changed from September 30 to August 31.
(b) Based on operations from September 27, 2010 (commencement of operations) through the stated period end.
(c) Rounds to zero.
(d) In addition to the fees and expenses that the Fund bears directly, the Fund indirectly bears a pro rata share of the fees and expenses of any other funds in which it invests. Such indirect expenses are not included in the Fund's reported expense ratios.
(e) Ratios include line of credit interest expense which is less than 0.01%.
(f) Annualized.
(g) Total net expenses include the impact of certain fee waivers/expense reimbursements made by the Investment Manager and certain of its affiliates, if applicable.
(h) The benefits derived from expense reductions had an impact of less than 0.01%.
The accompanying Notes to Financial Statements are an integral part of this statement.
Annual Report 2015
22
COLUMBIA SMALL CAP CORE FUND
FINANCIAL HIGHLIGHTS (continued)
| | | Year Ended August 31, | |
Class R4 | | 2015 | | 2014 | | 2013(a) | |
Per share data | |
Net asset value, beginning of period | | $ | 20.51 | | | $ | 19.37 | | | $ | 15.57 | | |
Income from investment operations: | |
Net investment loss | | | (0.02 | ) | | | (0.02 | ) | | | (0.05 | ) | |
Net realized and unrealized gain (loss) | | | (1.26 | ) | | | 2.86 | | | | 4.45 | | |
Total from investment operations | | | (1.28 | ) | | | 2.84 | | | | 4.40 | | |
Less distributions to shareholders: | |
Net investment income | | | (0.03 | ) | | | (0.04 | ) | | | (0.11 | ) | |
Net realized gains | | | (1.57 | ) | | | (1.66 | ) | | | (0.49 | ) | |
Total distributions to shareholders | | | (1.60 | ) | | | (1.70 | ) | | | (0.60 | ) | |
Net asset value, end of period | | $ | 17.63 | | | $ | 20.51 | | | $ | 19.37 | | |
Total return | | | (6.56 | %) | | | 15.02 | % | | | 29.18 | % | |
Ratios to average net assets(b) | |
Total gross expenses | | | 1.11 | % | | | 1.10 | %(c) | | | 1.12 | %(c)(d) | |
Total net expenses(e) | | | 1.11 | %(f) | | | 1.10 | %(c)(f) | | | 1.12 | %(c)(d)(f) | |
Net investment loss | | | (0.09 | %) | | | (0.09 | %) | | | (0.31 | %)(d) | |
Supplemental data | |
Net assets, end of period (in thousands) | | $ | 6,123 | | | $ | 7,124 | | | $ | 903 | | |
Portfolio turnover | | | 23 | % | | | 19 | % | | | 34 | % | |
Notes to Financial Highlights
(a) Based on operations from November 8, 2012 (commencement of operations) through the stated period end.
(b) In addition to the fees and expenses that the Fund bears directly, the Fund indirectly bears a pro rata share of the fees and expenses of any other funds in which it invests. Such indirect expenses are not included in the Fund's reported expense ratios.
(c) Ratios include line of credit interest expense which is less than 0.01%.
(d) Annualized.
(e) Total net expenses include the impact of certain fee waivers/expense reimbursements made by the Investment Manager and certain of its affiliates, if applicable.
(f) The benefits derived from expense reductions had an impact of less than 0.01%.
The accompanying Notes to Financial Statements are an integral part of this statement.
Annual Report 2015
23
COLUMBIA SMALL CAP CORE FUND
FINANCIAL HIGHLIGHTS (continued)
| | | Year Ended August 31, | |
Class R5 | | 2015 | | 2014 | | 2013(a) | |
Per share data | |
Net asset value, beginning of period | | $ | 20.55 | | | $ | 19.38 | | | $ | 15.57 | | |
Income from investment operations: | |
Net investment income (loss) | | | 0.02 | | | | 0.02 | | | | (0.05 | ) | |
Net realized and unrealized gain (loss) | | | (1.28 | ) | | | 2.87 | | | | 4.47 | | |
Total from investment operations | | | (1.26 | ) | | | 2.89 | | | | 4.42 | | |
Less distributions to shareholders: | |
Net investment income | | | (0.04 | ) | | | (0.06 | ) | | | (0.12 | ) | |
Net realized gains | | | (1.57 | ) | | | (1.66 | ) | | | (0.49 | ) | |
Total distributions to shareholders | | | (1.61 | ) | | | (1.72 | ) | | | (0.61 | ) | |
Net asset value, end of period | | $ | 17.68 | | | $ | 20.55 | | | $ | 19.38 | | |
Total return | | | (6.43 | %) | | | 15.30 | % | | | 29.36 | % | |
Ratios to average net assets(b) | |
Total gross expenses | | | 0.93 | % | | | 0.90 | %(c) | | | 0.94 | %(c)(d) | |
Total net expenses(e) | | | 0.93 | % | | | 0.90 | %(c) | | | 0.94 | %(c)(d) | |
Net investment income (loss) | | | 0.10 | % | | | 0.11 | % | | | (0.32 | %)(d) | |
Supplemental data | |
Net assets, end of period (in thousands) | | $ | 12,955 | | | $ | 27,726 | | | $ | 16,704 | | |
Portfolio turnover | | | 23 | % | | | 19 | % | | | 34 | % | |
Notes to Financial Highlights
(a) Based on operations from November 8, 2012 (commencement of operations) through the stated period end.
(b) In addition to the fees and expenses that the Fund bears directly, the Fund indirectly bears a pro rata share of the fees and expenses of any other funds in which it invests. Such indirect expenses are not included in the Fund's reported expense ratios.
(c) Ratios include line of credit interest expense which is less than 0.01%.
(d) Annualized.
(e) Total net expenses include the impact of certain fee waivers/expense reimbursements made by the Investment Manager and certain of its affiliates, if applicable.
The accompanying Notes to Financial Statements are an integral part of this statement.
Annual Report 2015
24
COLUMBIA SMALL CAP CORE FUND
FINANCIAL HIGHLIGHTS (continued)
| | | Year Ended August 31, | | Year Ended
September 30, | |
Class T | | 2015 | | 2014 | | 2013 | | 2012(a) | | 2011 | | 2010 | |
Per share data | |
Net asset value, beginning of period | | $ | 19.16 | | | $ | 18.21 | | | $ | 14.77 | | | $ | 12.75 | | | $ | 13.10 | | | $ | 11.39 | | |
Income from investment operations: | |
Net investment income (loss) | | | (0.06 | ) | | | (0.07 | ) | | | (0.00 | )(b) | | | (0.04 | ) | | | (0.08 | ) | | | (0.05 | ) | |
Net realized and unrealized gain (loss) | | | (1.19 | ) | | | 2.68 | | | | 3.99 | | | | 2.63 | | | | (0.27 | ) | | | 1.76 | | |
Total from investment operations | | | (1.25 | ) | | | 2.61 | | | | 3.99 | | | | 2.59 | | | | (0.35 | ) | | | 1.71 | | |
Less distributions to shareholders: | |
Net investment income | | | (0.01 | ) | | | (0.00 | )(b) | | | (0.06 | ) | | | — | | | | — | | | | — | | |
Net realized gains | | | (1.57 | ) | | | (1.66 | ) | | | (0.49 | ) | | | (0.57 | ) | | | — | | | | — | | |
Total distributions to shareholders | | | (1.58 | ) | | | (1.66 | ) | | | (0.55 | ) | | | (0.57 | ) | | | — | | | | — | | |
Proceeds from regulatory settlements | | | — | | | | — | | | | — | | | | — | | | | 0.00 | (b) | | | — | | |
Net asset value, end of period | | $ | 16.33 | | | $ | 19.16 | | | $ | 18.21 | | | $ | 14.77 | | | $ | 12.75 | | | $ | 13.10 | | |
Total return | | | (6.87 | %) | | | 14.71 | % | | | 27.86 | % | | | 20.44 | % | | | (2.67 | %) | | | 15.01 | % | |
Ratios to average net assets(c) | |
Total gross expenses | | | 1.38 | % | | | 1.40 | %(d) | | | 1.41 | %(d) | | | 1.42 | %(e) | | | 1.38 | % | | | 1.35 | % | |
Total net expenses(f) | | | 1.38 | %(g) | | | 1.40 | %(d)(g) | | | 1.41 | %(d)(g) | | | 1.41 | %(e)(g) | | | 1.35 | %(g) | | | 1.35 | %(g) | |
Net investment income | | | (0.36 | %) | | | (0.36 | %) | | | (0.01 | %) | | | (0.33 | %)(e) | | | (0.56 | %) | | | (0.42 | %) | |
Supplemental data | |
Net assets, end of period (in thousands) | | $ | 65,184 | | | $ | 78,860 | | | $ | 76,011 | | | $ | 68,074 | | | $ | 63,595 | | | $ | 73,960 | | |
Portfolio turnover | | | 23 | % | | | 19 | % | | | 34 | % | | | 26 | % | | | 33 | % | | | 26 | % | |
Notes to Financial Highlights
(a) For the period from October 1, 2011 to August 31, 2012. During the period, the Fund's fiscal year end was changed from September 30 to August 31.
(b) Rounds to zero.
(c) In addition to the fees and expenses that the Fund bears directly, the Fund indirectly bears a pro rata share of the fees and expenses of any other funds in which it invests. Such indirect expenses are not included in the Fund's reported expense ratios.
(d) Ratios include line of credit interest expense which is less than 0.01%.
(e) Annualized.
(f) Total net expenses include the impact of certain fee waivers/expense reimbursements made by the Investment Manager and certain of its affiliates, if applicable.
(g) The benefits derived from expense reductions had an impact of less than 0.01%.
The accompanying Notes to Financial Statements are an integral part of this statement.
Annual Report 2015
25
COLUMBIA SMALL CAP CORE FUND
FINANCIAL HIGHLIGHTS (continued)
| | | Year Ended August 31, | | Year Ended
September 30, | |
Class W | | 2015 | | 2014 | | 2013 | | 2012(a) | | 2011 | | 2010(b) | |
Per share data | |
Net asset value, beginning of period | | $ | 19.57 | | | $ | 18.57 | | | $ | 15.05 | | | $ | 12.98 | | | $ | 13.32 | | | $ | 13.01 | | |
Income from investment operations: | |
Net investment income (loss) | | | (0.09 | ) | | | (0.06 | ) | | | 0.01 | | | | (0.04 | ) | | | (0.07 | ) | | | 0.00 | (c) | |
Net realized and unrealized gain (loss) | | | (1.18 | ) | | | 2.73 | | | | 4.06 | | | | 2.68 | | | | (0.27 | ) | | | 0.31 | | |
Total from investment operations | | | (1.27 | ) | | | 2.67 | | | | 4.07 | | | | 2.64 | | | | (0.34 | ) | | | 0.31 | | |
Less distributions to shareholders: | |
Net investment income | | | (0.01 | ) | | | (0.01 | ) | | | (0.06 | ) | | | — | | | | — | | | | — | | |
Net realized gains | | | (1.57 | ) | | | (1.66 | ) | | | (0.49 | ) | | | (0.57 | ) | | | — | | | | — | | |
Total distributions to shareholders | | | (1.58 | ) | | | (1.67 | ) | | | (0.55 | ) | | | (0.57 | ) | | | — | | | | — | | |
Proceeds from regulatory settlements | | | — | | | | — | | | | — | | | | — | | | | 0.00 | (c) | | | — | | |
Net asset value, end of period | | $ | 16.72 | | | $ | 19.57 | | | $ | 18.57 | | | $ | 15.05 | | | $ | 12.98 | | | $ | 13.32 | | |
Total return | | | (6.80 | %) | | | 14.73 | % | | | 27.93 | % | | | 20.46 | % | | | (2.55 | %) | | | 2.38 | % | |
Ratios to average net assets(d) | |
Total gross expenses | | | 1.30 | % | | | 1.35 | %(e) | | | 1.36 | %(e) | | | 1.38 | %(f) | | | 1.32 | % | | | 1.34 | %(f) | |
Total net expenses(g) | | | 1.30 | %(h) | | | 1.35 | %(e)(h) | | | 1.36 | %(e)(h) | | | 1.36 | %(f)(h) | | | 1.29 | %(h) | | | 1.34 | %(f)(h) | |
Net investment income (loss) | | | (0.44 | %) | | | (0.32 | %) | | | 0.05 | % | | | (0.27 | %)(f) | | | (0.47 | %) | | | 1.69 | %(f) | |
Supplemental data | |
Net assets, end of period (in thousands) | | $ | 306 | | | $ | 69,033 | | | $ | 60,353 | | | $ | 60,112 | | | $ | 41,634 | | | $ | 3 | | |
Portfolio turnover | | | 23 | % | | | 19 | % | | | 34 | % | | | 26 | % | | | 33 | % | | | 26 | % | |
Notes to Financial Highlights
(a) For the period from October 1, 2011 to August 31, 2012. During the period, the Fund's fiscal year end was changed from September 30 to August 31.
(b) Based on operations from September 27, 2010 (commencement of operations) through the stated period end.
(c) Rounds to zero.
(d) In addition to the fees and expenses that the Fund bears directly, the Fund indirectly bears a pro rata share of the fees and expenses of any other funds in which it invests. Such indirect expenses are not included in the Fund's reported expense ratios.
(e) Ratios include line of credit interest expense which is less than 0.01%.
(f) Annualized.
(g) Total net expenses include the impact of certain fee waivers/expense reimbursements made by the Investment Manager and certain of its affiliates, if applicable.
(h) The benefits derived from expense reductions had an impact of less than 0.01%.
The accompanying Notes to Financial Statements are an integral part of this statement.
Annual Report 2015
26
COLUMBIA SMALL CAP CORE FUND
FINANCIAL HIGHLIGHTS (continued)
| | | Year Ended August 31, | |
Class Y | | 2015 | | 2014 | | 2013(a) | |
Per share data | |
Net asset value, beginning of period | | $ | 20.63 | | | $ | 19.45 | | | $ | 15.63 | | |
Income from investment operations: | |
Net investment income | | | 0.03 | | | | 0.03 | | | | 0.02 | | |
Net realized and unrealized gain (loss) | | | (1.29 | ) | | | 2.88 | | | | 4.42 | | |
Total from investment operations | | | (1.26 | ) | | | 2.91 | | | | 4.44 | | |
Less distributions to shareholders: | |
Net investment income | | | (0.04 | ) | | | (0.07 | ) | | | (0.13 | ) | |
Net realized gains | | | (1.57 | ) | | | (1.66 | ) | | | (0.49 | ) | |
Total distributions to shareholders | | | (1.61 | ) | | | (1.73 | ) | | | (0.62 | ) | |
Net asset value, end of period | | $ | 17.76 | | | $ | 20.63 | | | $ | 19.45 | | |
Total return | | | (6.39 | %) | | | 15.33 | % | | | 29.37 | % | |
Ratios to average net assets(b) | |
Total gross expenses | | | 0.88 | % | | | 0.87 | %(c) | | | 0.88 | %(c)(d) | |
Total net expenses(e) | | | 0.88 | % | | | 0.87 | %(c) | | | 0.88 | %(c)(d) | |
Net investment income | | | 0.17 | % | | | 0.16 | % | | | 0.07 | %(d) | |
Supplemental data | |
Net assets, end of period (in thousands) | | $ | 3,024 | | | $ | 14,600 | | | $ | 11,301 | | |
Portfolio turnover | | | 23 | % | | | 19 | % | | | 34 | % | |
Notes to Financial Highlights
(a) Based on operations from November 8, 2012 (commencement of operations) through the stated period end.
(b) In addition to the fees and expenses that the Fund bears directly, the Fund indirectly bears a pro rata share of the fees and expenses of any other funds in which it invests. Such indirect expenses are not included in the Fund's reported expense ratios.
(c) Ratios include line of credit interest expense which is less than 0.01%.
(d) Annualized.
(e) Total net expenses include the impact of certain fee waivers/expense reimbursements made by the Investment Manager and certain of its affiliates, if applicable.
The accompanying Notes to Financial Statements are an integral part of this statement.
Annual Report 2015
27
COLUMBIA SMALL CAP CORE FUND
FINANCIAL HIGHLIGHTS (continued)
| | | Year Ended August 31, | | Year Ended
September 30, | |
Class Z | | 2015 | | 2014 | | 2013 | | 2012(a) | | 2011 | | 2010 | |
Per share data | |
Net asset value, beginning of period | | $ | 20.33 | | | $ | 19.21 | | | $ | 15.56 | | | $ | 13.36 | | | $ | 13.69 | | | $ | 11.87 | | |
Income from investment operations: | |
Net investment income (loss) | | | (0.02 | ) | | | (0.01 | ) | | | 0.05 | | | | (0.00 | )(b) | | | (0.04 | ) | | | (0.02 | ) | |
Net realized and unrealized gain (loss) | | | (1.25 | ) | | | 2.83 | | | | 4.19 | | | | 2.77 | | | | (0.29 | ) | | | 1.84 | | |
Total from investment operations | | | (1.27 | ) | | | 2.82 | | | | 4.24 | | | | 2.77 | | | | (0.33 | ) | | | 1.82 | | |
Less distributions to shareholders: | |
Net investment income | | | (0.03 | ) | | | (0.04 | ) | | | (0.10 | ) | | | — | | | | — | | | | — | | |
Net realized gains | | | (1.57 | ) | | | (1.66 | ) | | | (0.49 | ) | | | (0.57 | ) | | | — | | | | — | | |
Total distributions to shareholders | | | (1.60 | ) | | | (1.70 | ) | | | (0.59 | ) | | | (0.57 | ) | | | — | | | | — | | |
Proceeds from regulatory settlements | | | — | | | | — | | | | — | | | | — | | | | 0.00 | (b) | | | — | | |
Net asset value, end of period | | $ | 17.46 | | | $ | 20.33 | | | $ | 19.21 | | | $ | 15.56 | | | $ | 13.36 | | | $ | 13.69 | | |
Total return | | | (6.56 | %) | | | 15.04 | % | | | 28.17 | % | | | 20.86 | % | | | (2.41 | %) | | | 15.33 | % | |
Ratios to average net assets(c) | |
Total gross expenses | | | 1.11 | % | | | 1.10 | %(d) | | | 1.11 | %(d) | | | 1.12 | %(e) | | | 1.07 | % | | | 1.05 | % | |
Total net expenses(f) | | | 1.11 | %(g) | | | 1.10 | %(d)(g) | | | 1.11 | %(d)(g) | | | 1.11 | %(e)(g) | | | 1.05 | %(g) | | | 1.05 | %(g) | |
Net investment income (loss) | | | (0.09 | %) | | | (0.06 | %) | | | 0.30 | % | | | (0.03 | %)(e) | | | (0.26 | %) | | | (0.12 | %) | |
Supplemental data | |
Net assets, end of period (in thousands) | | $ | 239,255 | | | $ | 466,376 | | | $ | 481,061 | | | $ | 442,000 | | | $ | 369,903 | | | $ | 411,684 | | |
Portfolio turnover | | | 23 | % | | | 19 | % | | | 34 | % | | | 26 | % | | | 33 | % | | | 26 | % | |
Notes to Financial Highlights
(a) For the period from October 1, 2011 to August 31, 2012. During the period, the Fund's fiscal year end was changed from September 30 to August 31.
(b) Rounds to zero.
(c) In addition to the fees and expenses that the Fund bears directly, the Fund indirectly bears a pro rata share of the fees and expenses of any other funds in which it invests. Such indirect expenses are not included in the Fund's reported expense ratios.
(d) Ratios include line of credit interest expense which is less than 0.01%.
(e) Annualized.
(f) Total net expenses include the impact of certain fee waivers/expense reimbursements made by the Investment Manager and certain of its affiliates, if applicable.
(g) The benefits derived from expense reductions had an impact of less than 0.01%.
The accompanying Notes to Financial Statements are an integral part of this statement.
Annual Report 2015
28
COLUMBIA SMALL CAP CORE FUND
NOTES TO FINANCIAL STATEMENTS
August 31, 2015
Note 1. Organization
Columbia Small Cap Core Fund (the Fund), a series of Columbia Funds Series Trust I (the Trust), is a diversified fund. The Trust is registered under the Investment Company Act of 1940, as amended (the 1940 Act), as an open-end management investment company organized as a Massachusetts business trust.
Fund Shares
The Trust may issue an unlimited number of shares (without par value). The Fund offers Class A, Class B, Class C, Class I, Class R4, Class R5, Class T, Class W, Class Y and Class Z shares. Although all share classes generally have identical voting, dividend and liquidation rights, each share class votes separately when required by the Trust's organizational documents or by law. Different share classes pay different distribution amounts to the extent the expenses of such share classes differ, and distributions in liquidation will be proportional to the net asset value of each share class. Each share class has its own expense and sales charge structure.
Class A shares are subject to a maximum front-end sales charge of 5.75% based on the initial investment amount. Class A shares purchased without an initial sales charge in accounts aggregating $1 million to $50 million at the time of purchase are subject to a contingent deferred sales charge (CDSC) if the shares are sold within 18 months after purchase, charged as follows: 1.00% CDSC if redeemed within 12 months after purchase, and 0.50% CDSC if redeemed more than 12, but less than 18, months after purchase.
Class B shares may be subject to a maximum CDSC of 5.00% based upon the holding period after purchase. Class B shares will generally convert to Class A shares eight years after purchase. The Fund no longer accepts investments by new or existing investors in the Fund's Class B shares, except in connection with the reinvestment of any dividend and/or capital gain distributions in Class B shares of the Fund and exchanges by existing Class B shareholders of certain other funds within the Columbia Family of Funds.
Class C shares are subject to a 1.00% CDSC on shares redeemed within one year after purchase.
Class I shares are not subject to sales charges and are available only to the Columbia Family of Funds.
Class R4 shares are not subject to sales charges and are generally available only to omnibus retirement plans and certain investors as described in the Fund's prospectus.
Class R5 shares are not subject to sales charges and are generally available only to investors purchasing through authorized investment professionals and omnibus retirement plans.
Class T shares are subject to a maximum front-end sales charge of 5.75% based on the investment amount. Class T shares purchased without an initial sales charge in accounts aggregating $1 million to $50 million at the time of purchase are subject to a CDSC if the shares are sold within 18 months after purchase, charged as follows: 1.00% CDSC if redeemed within 12 months after purchase, and 0.50% CDSC if redeemed more than 12, but less than 18, months after purchase. Class T shares are available only to investors who received (and who have continuously held) Class T shares in connection with previous fund reorganizations.
Class W shares are not subject to sales charges and are available only to investors purchasing through authorized investment programs managed by investment professionals, including discretionary managed account programs.
Class Y shares are not subject to sales charges and are generally available only to certain retirement plans as described in the Fund's prospectus.
Class Z shares are not subject to sales charges and are available only to eligible investors, which are subject to different investment minimums as described in the Fund's prospectus.
Note 2. Summary of Significant Accounting Policies
Basis of Preparation
The Fund is an investment company that applies the accounting and reporting guidance in the Financial Accounting Standards Board (FASB) Accounting Standards Codification Topic 946, Financial Services — Investment Companies (ASC 946). The financial statements are prepared in accordance with U.S. generally accepted accounting principles (GAAP), which requires management to make certain estimates and assumptions that affect the reported amounts of assets and liabilities, the disclosure of contingent assets and liabilities at the date of the financial statements and the reported amounts of income and expenses during the reporting period. Actual results could differ from those estimates.
The following is a summary of significant accounting policies followed by the Fund in the preparation of its financial statements.
Annual Report 2015
29
COLUMBIA SMALL CAP CORE FUND
NOTES TO FINANCIAL STATEMENTS (continued)
August 31, 2015
Security Valuation
All equity securities are valued at the close of business of the New York Stock Exchange (NYSE). Equity securities are valued at the last quoted sales price on the principal exchange or market on which they trade, except for securities traded on the NASDAQ Stock Market, which are valued at the NASDAQ official close price. Unlisted securities or listed securities for which there were no sales during the day are valued at the mean of the latest quoted bid and ask prices on such exchanges or markets.
Foreign equity securities are valued based on the closing price on the foreign exchange in which such securities are primarily traded. If any foreign equity security closing prices are not readily available, the securities are valued at the mean of the latest quoted bid and ask prices on such exchanges or markets. Foreign currency exchange rates are generally determined at 4:00 p.m. Eastern (U.S.) time. Many securities markets and exchanges outside the U.S. close prior to the close of the NYSE; therefore, the closing prices for securities in such markets or on such exchanges may not fully reflect events that occur after such close but before the close of the NYSE. In those situations, foreign securities will be fair valued pursuant to a policy adopted by the Board of Trustees (the Board), including, if available, utilizing a third party pricing service to determine these fair values. The third party pricing service takes into account multiple factors, including, but not limited to, movements in the U.S. securities markets, certain depositary receipts, futures contracts and foreign exchange rates that have occurred subsequent to the close of the foreign exchange or market, to determine a good faith estimate that reasonably reflects the current market conditions as of the close of the NYSE. The fair value of a security is likely to be different from the quoted or published price, if available.
Investments in open-end investment companies, including money market funds, are valued at their latest net asset value.
Investments for which market quotations are not readily available, or that have quotations which management believes are not reflective of market value or reliable, are valued at fair value as determined in good faith under procedures approved by and under the general supervision of the Board. If a security or class of securities (such as foreign securities) is valued at fair value, such value is likely to be different from the quoted or published price for the security.
The determination of fair value often requires significant judgment. To determine fair value, management may use assumptions including but not limited to future cash
flows and estimated risk premiums. Multiple inputs from various sources may be used to determine fair value.
GAAP requires disclosure regarding the inputs and valuation techniques used to measure fair value and any changes in valuation inputs or techniques. In addition, investments shall be disclosed by major category. This information is disclosed following the Fund's Portfolio of Investments.
Derivative Instruments
The Fund invests in certain derivative instruments, as detailed below, to meet its investment objectives. Derivatives are instruments whose values depend on, or are derived from, in whole or in part, the value of one or more securities, currencies, commodities, indices, or other assets or instruments. Derivatives may be used to increase investment flexibility (including to maintain cash reserves while maintaining desired exposure to certain assets), for risk management (hedging) purposes, to facilitate trading, to reduce transaction costs and to pursue higher investment returns. The Fund may also use derivative instruments to mitigate certain investment risks, such as foreign currency exchange rate risk, interest rate risk and credit risk. Derivatives may involve various risks, including the potential inability of the counterparty to fulfill its obligation under the terms of the contract, the potential for an illiquid secondary market (making it difficult for the Fund to sell, including at favorable prices) and the potential for market movements which may expose the Fund to gains or losses in excess of the amount shown in the Statement of Assets and Liabilities. The notional amounts of derivative instruments, if applicable, are not recorded in the financial statements.
A derivative instrument may suffer a marked-to-market loss if the value of the contract decreases due to an unfavorable change in the market rates or values of the underlying instrument. Losses can also occur if the counterparty does not perform under the contract. The Fund's risk of loss from counterparty credit risk on over-the-counter derivatives is generally limited to the aggregate unrealized gain netted against any collateral held by the Fund and the amount of any variation margin held by the counterparty. With exchange-traded or centrally cleared derivatives, there is reduced counterparty credit risk to the Fund since the exchange's clearinghouse, as counterparty to such instruments, guarantees against a possible default. The clearinghouse stands between the buyer and the seller of the contract; therefore, the counterparty credit risk is failure of the clearinghouse. However, credit risk still exists in
Annual Report 2015
30
COLUMBIA SMALL CAP CORE FUND
NOTES TO FINANCIAL STATEMENTS (continued)
August 31, 2015
exchange-traded or centrally cleared derivatives with respect to initial and variation margin that is held in a broker's customer account. While brokers are required to segregate customer margin from their own assets, in the event that a broker becomes insolvent or goes into bankruptcy and at that time there is a shortfall in the aggregate amount of margin held by the broker for all its clients, U.S. bankruptcy laws will typically allocate that shortfall on a pro-rata basis across all the broker's customers (including the Fund), potentially resulting in losses to the Fund.
In order to better define its contractual rights and to secure rights that will help the Fund mitigate its counterparty risk, the Fund may enter into an International Swaps and Derivatives Association, Inc. Master Agreement (ISDA Master Agreement) or similar agreement with its derivatives contract counterparties. An ISDA Master Agreement is an agreement between the Fund and a counterparty that governs over-the-counter derivatives and forward foreign currency exchange contracts and typically contains, among other things, collateral posting terms and netting provisions in the event of a default and/or termination event. Under an ISDA Master Agreement, the Fund may, under certain circumstances, offset with the counterparty certain derivative instrument's payables and/or receivables with collateral held and/or posted and create one single net payment. The provisions of the ISDA Master Agreement typically permit a single net payment in the event of default (close-out netting) including the bankruptcy or insolvency of the counterparty. Note, however, that bankruptcy or insolvency laws of a particular jurisdiction may impose restrictions on or prohibitions against the right of offset in bankruptcy, insolvency or other events.
Collateral (margin) requirements differ by type of derivative. Margin requirements are established by the exchange or clearinghouse for exchange-traded and centrally cleared derivatives. Brokers can ask for margin in excess of the minimum in certain circumstances. Collateral terms are contract specific for over-the-counter derivatives. For over-the-counter derivatives traded under an ISDA Master Agreement, the collateral requirements are typically calculated by netting the marked-to-market amount for each transaction under such agreement and comparing that amount to the value of any variation margin currently pledged by the Fund and/or the counterparty. Generally, the amount of collateral due from or to a party has to exceed a minimum transfer amount threshold (e.g., $500,000) before a transfer has to be made. To the extent amounts due to the Fund from its counterparties are not fully collateralized, contractually or
otherwise, the Fund bears the risk of loss from counterparty nonperformance. The Fund attempts to mitigate counterparty risk by only entering into agreements with counterparties that it believes have the financial resources to honor their obligations and by monitoring the financial stability of those counterparties.
Certain ISDA Master Agreements allow counterparties to over-the-counter derivatives transactions to terminate derivatives contracts prior to maturity in the event the Fund's net asset value declines by a stated percentage over a specified time period or if the Fund fails to meet certain terms of the ISDA Master Agreement, which would cause the Fund to accelerate payment of any net liability owed to the counterparty. The Fund also has termination rights if the counterparty fails to meet certain terms of the ISDA Master Agreement. In addition to considering counterparty credit risk, the Fund would consider terminating the derivatives contracts based on whether termination would result in a net liability owed from the counterparty.
For financial reporting purposes, the Fund does not offset derivative assets and derivative liabilities that are subject to netting arrangements in the Statement of Assets and Liabilities.
Futures Contracts
Futures contracts are exchange traded and represent commitments for the future purchase or sale of an asset at a specified price on a specified date. The Fund bought and sold futures contracts to maintain appropriate equity market exposure while keeping sufficient cash to accommodate daily redemptions. These instruments may be used for other purposes in future periods. Upon entering into futures contracts, the Fund bears risks that it may not achieve the anticipated benefits of the futures contracts and may realize a loss. Additional risks include counterparty credit risk, the possibility of an illiquid market, and that a change in the value of the contract or option may not correlate with changes in the value of the underlying asset.
Upon entering into a futures contract, the Fund pledges cash or securities with the broker in an amount sufficient to meet the initial margin requirement. The initial margin deposit must be maintained at an established level over the life of the contract. Cash deposited as initial margin is recorded in the Statement of Assets and Liabilities as margin deposits. Securities deposited as initial margin are designated in the Portfolio of Investments. Subsequent payments (variation margin) are made or received by the Fund each day. The variation margin payments are equal to the daily change in the contract
Annual Report 2015
31
COLUMBIA SMALL CAP CORE FUND
NOTES TO FINANCIAL STATEMENTS (continued)
August 31, 2015
value and are recorded as variation margin receivable or payable and are offset in unrealized gains or losses. The Fund recognizes a realized gain or loss when the contract is closed or expires. Futures contracts involve, to varying degrees, risk of loss in excess of the variation margin disclosed in the Statement of Assets and Liabilities.
Effects of Derivative Transactions in the Financial Statements
The following tables are intended to provide additional information about the effect of derivatives on the financial statements of the Fund, including: the fair value of derivatives by risk category and the location of those fair values in the Statement of Assets and Liabilities; and the impact of derivative transactions over the period in the Statement of Operations, including realized and unrealized gains (losses). The derivative instrument schedules following the Portfolio of Investments present additional information regarding derivative instruments outstanding at the end of the period, if any.
The following table indicates the effect of derivative instruments (not considered to be hedging instruments for accounting disclosure purposes) in the Statement of Operations for the year ended August 31, 2015:
Amount of Realized Gain (Loss) on Derivatives Recognized in Income | |
Risk Exposure Category | | Futures Contracts ($) | |
Equity risk | | | 1,239,948 | | |
The following table provides a summary of the average outstanding volume by derivative instrument for the year ended August 31, 2015:
Derivative Instrument | | Average notional amounts ($)* | |
Futures contracts — Long | | | 2,247,879 | | |
*Based on the daily outstanding amounts for the year ended August 31, 2015.
Security Transactions
Security transactions are accounted for on the trade date. Cost is determined and gains (losses) are based upon the specific identification method for both financial statement and federal income tax purposes.
Income Recognition
Corporate actions and dividend income are generally recorded net of any non-reclaimable tax withholdings, on the ex-dividend date or upon receipt of ex-dividend notification in the case of certain foreign securities.
The Fund may receive distributions from holdings in equity securities, business development companies (BDCs), exchange-traded funds, other regulated
investment companies (RICs), and real estate investment trusts (REITs), which report information on the tax character of their distributions annually. These distributions are allocated to dividend income, capital gain and return of capital based on actual information reported. Return of capital is recorded as a reduction of the cost basis of securities held. If the Fund no longer owns the applicable securities, return of capital is recorded as a realized gain. With respect to REITs, to the extent actual information has not yet been reported, estimates for return of capital are made by the Fund's management. Management's estimates are subsequently adjusted when the actual character of the distributions is disclosed by the REITs, which could result in a proportionate change in return of capital to shareholders.
Awards from class action litigation are recorded as a reduction of cost basis if the Fund still owns the applicable securities on the payment date. If the Fund no longer owns the applicable securities, the proceeds are recorded as realized gains.
Expenses
General expenses of the Trust are allocated to the Fund and other funds of the Trust based upon relative net assets or other expense allocation methodologies determined by the nature of the expense. Expenses directly attributable to the Fund are charged to the Fund. Expenses directly attributable to a specific class of shares are charged to that share class.
Determination of Class Net Asset Value
All income, expenses (other than class-specific expenses, which are charged to that share class, as shown in the Statement of Operations) and realized and unrealized gains (losses) are allocated to each class of the Fund on a daily basis, based on the relative net assets of each class, for purposes of determining the net asset value of each class.
Federal Income Tax Status
The Fund intends to qualify each year as a regulated investment company under Subchapter M of the Internal Revenue Code, as amended, and will distribute substantially all of its taxable income (including net short-term capital gains), if any, for its tax year, and as such will not be subject to federal income taxes. In addition, the Fund intends to distribute in each calendar year substantially all of its net investment income, capital gains and certain other amounts, if any, such that the Fund should not be subject to federal excise tax.
Annual Report 2015
32
COLUMBIA SMALL CAP CORE FUND
NOTES TO FINANCIAL STATEMENTS (continued)
August 31, 2015
Therefore, no federal income or excise tax provision is recorded.
Foreign Taxes
The Fund may be subject to foreign taxes on income, gains on investments or currency repatriation, a portion of which may be recoverable. The Fund will accrue such taxes and recoveries, as applicable, based upon its current interpretation of tax rules and regulations that exist in the markets in which it invests.
Realized gains in certain countries may be subject to foreign taxes at the Fund level, based on statutory rates. The Fund accrues for such foreign taxes on realized and unrealized gains at the appropriate rate for each jurisdiction, as applicable. The amount, if any, is disclosed as a liability on the Statement of Assets and Liabilities.
Distributions to Shareholders
Distributions from net investment income, if any, are declared and paid annually. Net realized capital gains, if any, are distributed along with the income distribution. Income distributions and capital gain distributions are determined in accordance with federal income tax regulations, which may differ from GAAP.
Guarantees and Indemnifications
Under the Trust's organizational documents and, in some cases, by contract, its officers and trustees are indemnified against certain liabilities arising out of the performance of their duties to the Trust or its funds. In addition, certain of the Fund's contracts with its service providers contain general indemnification clauses. The Fund's maximum exposure under these arrangements is unknown since the amount of any future claims that may be made against the Fund cannot be determined, and the Fund has no historical basis for predicting the likelihood of any such claims.
Recent Accounting Pronouncement
Fair Value Measurement (Topic 820), Disclosure for Investments in Certain Entities That Calculate Net Asset Value per Share (or Its Equivalent)
In May 2015, the Financial Accounting Standards Board (FASB) issued Accounting Standards Update (ASU) No. 2015-07, Fair Value Measurement (Topic 820), Disclosure for Investments in Certain Entities That Calculate Net Asset Value per Share (or Its Equivalent). ASU No. 2015-07 changes the disclosure requirements for investments for which fair value is measured using the net asset value per share practical expedient. The
disclosure requirements are effective for annual periods beginning after December 15, 2015 and interim periods within those fiscal years. At this time, management is evaluating the implications of this guidance and the impact it will have on the financial statement amounts and footnote disclosures, if any.
Note 3. Fees and Other Transactions with Affiliates
Investment Management Fees
Under an Investment Management Services Agreement, Columbia Management Investment Advisers, LLC (the Investment Manager), a wholly-owned subsidiary of Ameriprise Financial, Inc. (Ameriprise Financial), determines which securities will be purchased, held or sold. The investment management fee is an annual fee that is equal to a percentage of the Fund's average daily net assets that declines from 0.79% to 0.70% as the Fund's net assets increase. The effective investment management fee rate for the year ended August 31, 2015 was 0.77% of the Fund's average daily net assets.
Administration Fees
Under an Administrative Services Agreement, the Investment Manager also serves as the Fund Administrator. The Fund pays the Fund Administrator an annual fee for administration and accounting services equal to a percentage of the Fund's average daily net assets that declines from 0.08% to 0.05% as the Fund's net assets increase. The effective administration fee rate for the year ended August 31, 2015 was 0.08% of the Fund's average daily net assets.
Compensation of Board Members
Board members, who are not officers or employees of the Investment Manager or Ameriprise Financial, are compensated for their services to the Fund as disclosed in the Statement of Operations. These Board members may participate in a Deferred Compensation Plan (the Plan) which may be terminated at any time. Obligations of the Plan will be paid solely out of the Fund's assets, and all amounts payable under the Plan constitute a general unsecured obligation of the Fund.
Compensation of Chief Compliance Officer
The Board has appointed a Chief Compliance Officer to the Fund in accordance with federal securities regulations. The Fund is allocated a portion of the expenses associated with the Chief Compliance Officer based on relative net assets of the Trust.
Annual Report 2015
33
COLUMBIA SMALL CAP CORE FUND
NOTES TO FINANCIAL STATEMENTS (continued)
August 31, 2015
Transactions with Affiliated Funds
For the year ended August 31, 2015, the Fund engaged in purchase and/or sales transactions with funds that have a common investment manager (or affiliated investment managers), common directors/trustees, and/or common officers. Those sale transactions complied with provisions of Rule 17a-7 under the 1940 Act and were $50,664,531. The sale transactions resulted in a net realized loss of $994,802.
Transfer Agency Fees
Under a Transfer and Dividend Disbursing Agent Agreement, Columbia Management Investment Services Corp. (the Transfer Agent), an affiliate of the Investment Manager and a wholly-owned subsidiary of Ameriprise Financial, is responsible for providing transfer agency services to the Fund. The Transfer Agent has contracted with Boston Financial Data Services (BFDS) to serve as sub-transfer agent.
Effective November 1, 2014, the Transfer Agent receives a monthly transfer agency fee based on the number or the average value of accounts, depending on the type of account. Prior to November 1, 2014, the Transfer Agent received a monthly account-based service fee based on the number of open accounts. In addition, the Transfer Agent also receives sub-transfer agency fees based on a percentage of the average aggregate value of the Fund's shares maintained in omnibus accounts (other than omnibus accounts for which American Enterprise Investment Services Inc. is the broker of record or accounts where the beneficial shareholder is a customer of Ameriprise Financial Services, Inc., for which the Transfer Agent receives a per account fee). The Transfer Agent pays the fees of BFDS for services as sub-transfer agent and is not entitled to reimbursement for such fees from the Fund (with the exception of out-of-pocket fees).
The Transfer Agent also receives compensation from the Fund for various shareholder services and reimbursements for certain out-of-pocket fees. Total transfer agency fees for Class R5 shares are subject to an annual limitation of not more than 0.05% of the average daily net assets attributable to Class R5 shares. Class I and Class Y shares do not pay transfer agency fees.
For the year ended August 31, 2015, the Fund's effective transfer agency fee rates as a percentage of average daily net assets of each class were as follows:
Class A | | | 0.23 | % | |
Class B | | | 0.22 | | |
Class C | | | 0.22 | | |
Class R4 | | | 0.22 | | |
Class R5 | | | 0.05 | | |
Class T | | | 0.22 | | |
Class W | | | 0.23 | | |
Class Z | | | 0.23 | | |
An annual minimum account balance fee of $20 may apply to certain accounts with a value below the applicable share class's initial minimum investment requirements to reduce the impact of small accounts on transfer agency fees. These minimum account balance fees are remitted to the Fund and recorded as part of expense reductions in the Statement of Operations. For the year ended August 31, 2015, these minimum account balance fees reduced total expenses of the Fund by $1,698.
Distribution and Service Fees
The Fund has an agreement with Columbia Management Investment Distributors, Inc. (the Distributor), an affiliate of the Investment Manager and a wholly-owned subsidiary of Ameriprise Financial, for distribution and shareholder services. The Board has approved, and the Fund has adopted, distribution and shareholder service plans (the Plans) applicable to certain share classes, which set the distribution and service fees for the Fund. These fees are calculated daily and are intended to compensate the Distributor and/or eligible selling and/or servicing agents for selling shares of the Fund and providing services to investors.
Under the Plans, the Fund pays a monthly service fee to the Distributor at the maximum annual rate of 0.25% of the average daily net assets attributable to Class A, Class B, Class C and Class W shares of the Fund. Also under the Plans, the Fund pays a monthly distribution fee to the Distributor at the maximum annual rates of 0.10%, 0.75%, 0.75% and 0.25% of the average daily net assets attributable to Class A, Class B, Class C and Class W shares of the Fund, respectively.
Annual Report 2015
34
COLUMBIA SMALL CAP CORE FUND
NOTES TO FINANCIAL STATEMENTS (continued)
August 31, 2015
Although the Fund may pay distribution and service fees up to a maximum annual rate of 0.35% of the Fund's average daily net assets attributable to Class A shares (comprised of up to 0.10% for distribution services and up to 0.25% for shareholder liaison services), the Fund currently limits such fees to an aggregate fee of not more than 0.25% of the Fund's average daily net assets attributable to Class A shares.
Although the Fund may pay a distribution fee up to 0.25% of the Fund's average daily net assets attributable to Class W shares and a service fee of up to 0.25% of the Fund's average daily net assets attributable to Class W shares, the aggregate fee shall not exceed 0.25% of the Fund's average daily net assets attributable to Class W shares.
Shareholder Services Fees
The Fund has adopted a shareholder services plan that permits it to pay for certain services provided to Class T shareholders by their selling and/or servicing agents. The Fund may pay shareholder servicing fees up to an aggregate annual rate of 0.50% of the Fund's average daily net assets attributable to Class T shares (comprised of up to 0.25% for shareholder liaison services and up to 0.25% for administrative support services). Effective January 1, 2015, these fees are currently limited to an aggregate annual rate of not more than 0.25% of the Fund's average daily net assets attributable to Class T shares. Prior to January 1, 2015, these fees were limited to 0.30% of the Fund's average daily net assets attributable to Class T shares. The effective shareholder services fee rate for the year ended August 31, 2015 was 0.27% of the Fund's average daily net assets attributable to Class T shares.
Sales Charges
Sales charges, including front-end charges and CDSCs, received by the Distributor for distributing Fund shares were $40,728 for Class A, $72 for Class B, $3,897 for Class C and $13,120 for Class T shares for the year ended August 31, 2015.
Expenses Waived/Reimbursed by the Investment Manager and its Affiliates
The Fund's expense ratio is subject to an expense reimbursement arrangement pursuant to which fees will be waived and/or expenses reimbursed (excluding certain fees and expenses described below), so that the Fund's net operating expenses, after giving effect to fees waived/expenses reimbursed and any balance credits
and/or overdraft charges from the Fund's custodian, do not exceed the annual rates of:
| | | Voluntary
Expense Cap
Effective
January 1, 2015 | | Contractual
Expense Cap
Prior to
January 1, 2015 | |
Class A | | | 1.38 | % | | | 1.40 | % | |
Class B | | | 2.13 | | | | 2.15 | | |
Class C | | | 2.13 | | | | 2.15 | | |
Class I | | | 0.94 | | | | 0.98 | | |
Class R4 | | | 1.13 | | | | 1.15 | | |
Class R5 | | | 0.99 | | | | 1.03 | | |
Class T | | | 1.38 | | | | 1.45 | | |
Class W | | | 1.38 | | | | 1.40 | | |
Class Y | | | 0.94 | | | | 0.98 | | |
Class Z | | | 1.13 | | | | 1.15 | | |
The voluntary expense cap arrangement may be revised or discontinued at any time. Under the arrangements, the following fees and expenses are excluded from the waiver/reimbursement commitment, and therefore will be paid by the Fund, if applicable: taxes (including foreign transaction taxes), expenses associated with investments in affiliated and non-affiliated pooled investment vehicles (including mutual funds and exchange-traded funds), transaction costs and brokerage commissions, costs related to any securities lending program, dividend and interest expenses associated with securities sold short, inverse floater program fees and expenses, transaction charges and interest on borrowed money, interest and extraordinary expenses. Any fees waived and/or expenses reimbursed under the expense reimbursement arrangements described above are not recoverable by the Investment Manager or its affiliates in future periods.
Note 4. Federal Tax Information
The timing and character of income and capital gain distributions are determined in accordance with income tax regulations, which may differ from GAAP because of temporary or permanent book to tax differences.
At August 31, 2015, these differences are primarily due to differing treatment for deferral/reversal of wash sale losses, Trustees' deferred compensation, distribution reclassifications, net operating loss reclassification, former PFIC holdings and re-characterization of distributions for investments. To the extent these differences are permanent, reclassifications are made among the components of the Fund's net assets in the
Annual Report 2015
35
COLUMBIA SMALL CAP CORE FUND
NOTES TO FINANCIAL STATEMENTS (continued)
August 31, 2015
Statement of Assets and Liabilities. Temporary differences do not require reclassifications. In the Statement of Assets and Liabilities the following reclassifications were made:
Excess of distributions over net investment income | | $ | 3,383,044 | | |
Accumulated net realized gain | | | (3,383,045 | ) | |
Paid-in capital | | | 1 | | |
Net investment income (loss) and net realized gains (losses), as disclosed in the Statement of Operations, and net assets were not affected by this reclassification.
The tax character of distributions paid during the years indicated was as follows:
Year Ended August 31, | | 2015 | | 2014 | |
Ordinary income | | $ | 4,474,055 | | | $ | 22,124,935 | | |
Long-term capital gains | | | 81,642,997 | | | | 74,802,966 | | |
Total | | | 86,117,052 | | | | 96,927,901 | | |
Short-term capital gain distributions, if any, are considered ordinary income distributions for tax purposes.
At August 31, 2015, the components of distributable earnings on a tax basis were as follows:
Undistributed ordinary income | | | 167,777 | | |
Undistributed long-term capital gains | | | 140,625,152 | | |
Net unrealized appreciation | | | 132,222,608 | | |
At August 31, 2015, the cost of investments for federal income tax purposes was $403,448,351 and the aggregate gross unrealized appreciation and depreciation based on that cost was:
Unrealized appreciation | | $ | 184,427,792 | | |
Unrealized depreciation | | | (52,205,184 | ) | |
Net unrealized appreciation | | | 132,222,608 | | |
Management of the Fund has concluded that there are no significant uncertain tax positions in the Fund that would require recognition in the financial statements. However, management's conclusion may be subject to review and adjustment at a later date based on factors including, but not limited to, new tax laws, regulations, and administrative interpretations (including relevant court decisions). Generally, the Fund's federal tax returns for the prior three fiscal years remain subject to examination by the Internal Revenue Service.
Note 5. Portfolio Information
The cost of purchases and proceeds from sales of securities, excluding short-term investments and
derivatives, if any, aggregated to $211,602,797 and $807,691,693, respectively, for the year ended August 31, 2015. The amount of purchase and sale activity impacts the portfolio turnover rate reported in the Financial Highlights.
Note 6. Affiliated Money Market Fund
The Fund invests in Columbia Short-Term Cash Fund, an affiliated money market fund established for the exclusive use by the Fund and other affiliated funds. The income earned by the Fund from such investments is included as Dividends — affiliated issuers in the Statement of Operations. As an investing fund, the Fund indirectly bears its proportionate share of the expenses of Columbia Short-Term Cash Fund.
Note 7. Line of Credit
The Fund has entered into a revolving credit facility with a syndicate of banks led by JPMorgan Chase Bank, N.A. whereby the Fund may borrow for the temporary funding of shareholder redemptions or for other temporary or emergency purposes. Pursuant to a December 9, 2014 amendment, the credit facility agreement, which is a collective agreement between the Fund and certain other funds managed by the Investment Manager, severally and not jointly, permits collective borrowings up to $550 million. Interest is charged to each participating fund based on its borrowings at a rate equal to the higher of (i) the overnight federal funds rate plus 1.00% or (ii) the one-month LIBOR rate plus 1.00%. Each borrowing under the credit facility matures no later than 60 days after the date of borrowing. The Fund also pays a commitment fee equal to its pro rata share of the amount of the credit facility at a rate of 0.075% per annum. The commitment fee is included in other expenses in the Statement of Operations. Prior to the December 9, 2014 amendment, the credit facility agreement permitted borrowings up to $500 million under the same terms and interest rates as described above.
The Fund had no borrowings during the year ended August 31, 2015.
Note 8. Significant Risks
Shareholder Concentration Risk
At August 31, 2015, one unaffiliated shareholder of record owned 34.0% of the outstanding shares of the Fund in one or more accounts. The Fund has no knowledge about whether any portion of those shares was owned beneficially. Affiliated shareholders of record owned 17.2% of the outstanding shares of the Fund in
Annual Report 2015
36
COLUMBIA SMALL CAP CORE FUND
NOTES TO FINANCIAL STATEMENTS (continued)
August 31, 2015
one or more accounts. Subscription and redemption activity by concentrated accounts may have a significant effect on the operations of the Fund. In the case of a large redemption, the Fund may be forced to sell investments at inopportune times, including its liquid or more liquid positions, resulting in Fund losses and the Fund holding a higher percentage of less liquid or illiquid securities. Large redemptions could result in decreased economies of scale and increased operating expenses for non-redeeming Fund shareholders.
Note 9. Subsequent Events
Management has evaluated the events and transactions that have occurred through the date the financial statements were issued and noted no items requiring adjustment of the financial statements or additional disclosure.
Note 10. Information Regarding Pending and Settled Legal Proceedings
In December 2005, without admitting or denying the allegations, American Express Financial Corporation (AEFC, which is now known as Ameriprise Financial, Inc. (Ameriprise Financial)) entered into settlement agreements with the Securities and Exchange Commission (SEC) and Minnesota Department of Commerce (MDOC) related to market timing activities. As a result, AEFC was censured and ordered to cease and desist from committing or causing any violations of certain provisions of the Investment Advisers Act of 1940, the Investment Company Act of 1940, and various Minnesota laws. AEFC agreed to pay disgorgement of $10 million and civil money penalties of $7 million. AEFC also agreed to retain an independent distribution consultant to assist in developing a plan for distribution of all disgorgement and civil penalties ordered by the SEC in accordance with various undertakings detailed at http://www.sec.gov/litigation/admin/ia-2451.pdf. Ameriprise Financial and its affiliates have cooperated with the SEC and the MDOC in these legal proceedings, and have made regular reports to the Funds' Boards of Trustees.
Ameriprise Financial and certain of its affiliates have historically been involved in a number of legal, arbitration and regulatory proceedings, including routine litigation, class actions, and governmental actions, concerning matters arising in connection with the conduct of their business activities. Ameriprise Financial believes that the Funds are not currently the subject of, and that neither Ameriprise Financial nor any of its affiliates are the subject of, any pending legal, arbitration or regulatory
proceedings that are likely to have a material adverse effect on the Funds or the ability of Ameriprise Financial or its affiliates to perform under their contracts with the Funds. Ameriprise Financial is required to make quarterly (10-Q), annual (10-K) and, as necessary, 8-K filings with the SEC on legal and regulatory matters that relate to Ameriprise Financial and its affiliates. Copies of these filings may be obtained by accessing the SEC website at www.sec.gov.
There can be no assurance that these matters, or the adverse publicity associated with them, will not result in increased fund redemptions, reduced sale of fund shares or other adverse consequences to the Funds. Further, although we believe proceedings are not likely to have a material adverse effect on the Funds or the ability of Ameriprise Financial or its affiliates to perform under their contracts with the Funds, these proceedings are subject to uncertainties and, as such, we are unable to estimate the possible loss or range of loss that may result. An adverse outcome in one or more of these proceedings could result in adverse judgments, settlements, fines, penalties or other relief that could have a material adverse effect on the consolidated financial condition or results of operations of Ameriprise Financial.
Annual Report 2015
37
COLUMBIA SMALL CAP CORE FUND
REPORT OF INDEPENDENT REGISTERED PUBLIC ACCOUNTING FIRM
To the Trustees of Columbia Funds Series Trust I and the Shareholders of
Columbia Small Cap Core Fund
In our opinion, the accompanying statement of assets and liabilities, including the portfolio of investments, and the related statements of operations and of changes in net assets and the financial highlights present fairly, in all material respects, the financial position of Columbia Small Cap Core Fund (the "Fund," a series of Columbia Funds Series Trust I) at August 31, 2015, and the results of its operations, the changes in its net assets and the financial highlights for each of the periods indicated, in conformity with accounting principles generally accepted in the United States of America. These financial statements and financial highlights (hereafter referred to as "financial statements") are the responsibility of the Fund's management. Our responsibility is to express an opinion on these financial statements based on our audits. We conducted our audits of these financial statements in accordance with the standards of the Public Company Accounting Oversight Board (United States). Those standards require that we plan and perform the audit to obtain reasonable assurance about whether the financial statements are free of material misstatement. An audit includes examining, on a test basis, evidence supporting the amounts and disclosures in the financial statements, assessing the accounting principles used and significant estimates made by management, and evaluating the overall financial statement presentation. We believe that our audits, which included confirmation of securities at August 31, 2015 by correspondence with the custodian, brokers and transfer agent, provide a reasonable basis for our opinion.
PricewaterhouseCoopers LLP
Minneapolis, MN
October 22, 2015
Annual Report 2015
38
COLUMBIA SMALL CAP CORE FUND
FEDERAL INCOME TAX INFORMATION
(Unaudited)
The Fund hereby designates the following tax attributes for the fiscal year ended August 31, 2015. Shareholders will be notified in early 2016 of the amounts for use in preparing 2015 income tax returns.
Tax Designations:
| Qualified Dividend Income | | 100.00% | |
| Dividends Received Deduction | | 100.00% | |
Capital Gain Dividend | | $164,402,945 | |
Qualified Dividend Income. For taxable, non-corporate shareholders, the percentage of ordinary income distributed during the fiscal year that represents qualified dividend income subject to reduced tax rates.
Dividends Received Deduction. The percentage of ordinary income distributed during the fiscal year that qualifies for the corporate dividends received deduction.
Capital Gain Dividend. The Fund designates as a capital gain dividend the amount reflected above, or if subsequently determined to be different, the net capital gain of such fiscal period.
Annual Report 2015
39
COLUMBIA SMALL CAP CORE FUND
The Trustees serve terms of indefinite duration. The names and birth years of the Trustees and Officers of the Funds in Columbia Funds Series Trust I, the year each was first elected or appointed to office, their principal business occupations during at least the last five years, the number of Funds overseen by each Trustee and other directorships they hold are shown below. Each officer listed below serves as an officer of each Fund in Columbia Funds Series Trust I. The mailing address of each Trustee is: c/o Columbia Management Investment Advisers, LLC, 225 Franklin Street, Mail Drop BX32 05228, Boston, MA 02110.
Independent Trustees
Name, Year of Birth
and Position Held
with the Trust | | Year First
Appointed or
Elected as
Trustee to any
Fund Currently
in the Columbia
Funds Complex
or a Predecessor
Thereof | | Principal Occupation(s)
during the Past Five Years | | Number
of Funds
in the
Columbia
Funds
Complex
Overseen | | Other Directorships
Held by Trustee During
the Past Five Years | |
Janet Langford Carrig
(Born 1957)
Trustee | | | 1996 | | | Senior Vice President, General Counsel and Corporate Secretary, ConocoPhillips (integrated energy company) since September 2007; Deputy General Counsel — Corporate Legal Services, ConocoPhillips from August 2006 to August 2007; Partner, Zelle, Hofmann, Voelbel, Mason & Gette LLP (law firm) from March 2005 to July 2006; Adjunct Professor of Law, Northwestern University from September 2004 to June 2006; Director, UAL Corporation (airline) from February 2006 to July 2006; Chief Administrative Officer and Senior Vice President, Kmart Holding Corporation (consumer goods) from September 2003 to March 2004 | | | 60 | | | None | |
Douglas A. Hacker
(Born 1955)
Trustee and Chairman
of the Board | | | 1996 | | | Independent business executive since May 2006; Executive Vice President — Strategy of United Airlines from December 2002 to May 2006; President of UAL Loyalty Services (airline marketing company) from September 2001 to December 2002; Executive Vice President and Chief Financial Officer of United Airlines from July 1999 to September 2001 | | | 60 | | | Spartan Nash Company, (food distributor); Nash Finch Company (food distributor) from 2005 to 2013; Aircastle Limited (aircraft leasing); SeaCube Container Leasing Ltd. (container leasing) from 2010 to 2013; and Travelport Worldwide Limited (travel information technology) | |
Nancy T. Lukitsh
(Born 1956)
Trustee | | | 2011 | | | Senior Vice President, Partner and Director of Marketing, Wellington Management Company, LLP (investment adviser) from 1997 to 2010; Chair, Wellington Management Investment Portfolios (commingled non-U.S. investment pools) from 2007 to 2010; Director, Wellington Trust Company, NA and other Wellington affiliates from 1997 to 2010 | | | 60 | | | None | |
William E. Mayer
(Born 1940)
Trustee | | | 1991 | | | Partner, Park Avenue Equity Partners (private equity) since February 1999 | | | 60 | | | DynaVox Inc. (speech creation); Lee Enterprises (print media); WR Hambrecht + Co. (financial service provider) from 2000 to 2012; BlackRock Kelso Capital Corporation (investment company); and Premier, Inc. (healthcare) | |
Annual Report 2015
40
COLUMBIA SMALL CAP CORE FUND
TRUSTEES AND OFFICERS (continued)
Independent Trustees (continued)
Name, Year of Birth
and Position Held
with the Trust | | Year First
Appointed or
Elected as
Trustee to any
Fund Currently
in the Columbia
Funds Complex
or a Predecessor
Thereof | | Principal Occupation(s)
during the Past Five Years | | Number
of Funds
in the
Columbia
Funds
Complex
Overseen | | Other Directorships
Held by Trustee During
the Past Five Years | |
David M. Moffett
(Born 1952)
Trustee | | | 2011 | | | Retired. Consultant to Bridgewater and Associates; Chief Executive Officer, Federal Home Loan Mortgage Corporation, from 2008 to 2009; Senior Adviser, Global Financial Services Group, Carlyle Group, Inc., from 2007 to 2008; Vice Chairman and Chief Financial Officer, U.S. Bancorp, from 1993 to 2007 | | | 60 | | | Building Materials Holding Corp. (building materials and construction services); CIT Group Inc. (commercial and consumer finance); eBay Inc. (online trading community); E.W. Scripps Co. (print and television media); Genworth Financial, Inc. (financial and insurance products and services); MBIA Inc. (financial service provider); Paypal Holdings Inc. (payment and data processing services); and University of Oklahoma Foundation | |
Charles R. Nelson
(Born 1942)
Trustee | | | 1981 | | | Retired. Professor Emeritus, University of Washington since 2011; Professor of Economics, University of Washington from 1976 to 2011; Ford and Louisa Van Voorhis Professor of Political Economy, University of Washington from 1993 to 2011; Adjunct Professor of Statistics, University of Washington from 1980 to 2011; Associate Editor, Journal of Money, Credit and Banking from September 1993 to 2008; consultant on econometric and statistical matters | | | 60 | | | None | |
John J. Neuhauser
(Born 1943)
Trustee | | | 1984 | | | President, Saint Michael's College since August 2007; Director or Trustee of several non-profit organizations, including Fletcher Allen Health Care, Inc.; Academic Vice President and Dean of Faculties, Boston College from August 1999 to October 2005; University Professor, Boston College from November 2005 to August 2007 | | | 60 | | | Liberty All-Star Equity Fund and Liberty All-Star Growth Fund (closed-end funds) | |
Patrick J. Simpson
(Born 1944)
Trustee | | | 2000 | | | Partner, Perkins Coie LLP (law firm) | | | 60 | | | None | |
Anne-Lee Verville
(Born 1945)
Trustee | | | 1998 | | | Retired. General Manager, Global Education Industry from 1994 to 1997, President — Application Systems Division from 1991 to 1994, Chief Financial Officer — US Marketing & Services from 1988 to 1991, and Chief Information Officer from 1987 to 1988, IBM Corporation (computer and technology) | | | 60 | | | Enesco Group, Inc. (producer of giftware and home and garden decor products) from 2001 to 2006 | |
Annual Report 2015
41
COLUMBIA SMALL CAP CORE FUND
TRUSTEES AND OFFICERS (continued)
Interested Trustee Affiliate with Investment Manager*
Name, Year of Birth
and Position Held
with the Trust | | Year First
Appointed or
Elected as
Trustee to any
Fund Currently
in the Columbia
Funds Complex
or a Predecessor
Thereof | | Principal Occupation(s)
during the Past Five Years | | Number
of Funds
in the
Columbia
Funds
Complex
Overseen | | Other Directorships
Held by Trustee During
the Past Five Years | |
William F. Truscott
(Born 1960)
Trustee | | | 2012 | | | Chairman of the Board and President, Columbia Management Investment Advisers, LLC since May 2010 and February 2012, respectively (previously President and Chief Investment Officer, 2001-April 2010); Chief Executive Officer, Global Asset Management, Ameriprise Financial, Inc. since September 2012 (previously Chief Executive Officer, U.S. Asset Management & President, Annuities, May 2010-September 2012 and President — U.S. Asset Management and Chief Investment Officer, 2005-April 2010); Director and Chief Executive Officer, Columbia Management Investment Distributors, Inc. since May 2010 and February 2012, respectively (previously Chairman of the Board and Chief Executive Officer, 2006-April 2010); Chairman of the Board and Chief Executive Officer, RiverSource Distributors, Inc. since 2006; Director, Threadneedle Asset Management Holdings, SARL since 2014; President and Chief Executive Officer, Ameriprise Certificate Company, 2006-August 2012 | | | 187 | | | Chairman of the Board, Columbia Management Investment Advisers, LLC since May 2010; Director, Columbia Management Investment Distributors, Inc. since May 2010; Director, Ameriprise Certificate Company, 2006 to January 2013 | |
* Interested person (as defined under the 1940 Act) by reason of being an officer, director, security holder and/or employee of the Investment Manager or Ameriprise Financial.
The Statement of Additional Information has additional information about the Fund's Board members and is available, without charge, upon request by calling 800.345.6611; contacting your financial intermediary; or visiting columbiathreadneedle.com/us.
The Board has appointed officers who are responsible for day-to-day business decisions based on policies it has established. The officers serve at the pleasure of the Board. In addition to Mr. Truscott, who is Senior Vice President, the Funds' other officers are:
Fund Officers
Name,
Address and
Year of Birth | | Position and Year
First Appointed to
Position for any Fund
in the Columbia
Funds Complex or a
Predecessor Thereof | | Principal Occupation(s) During Past Five Years | |
Christopher O. Petersen
5228 Ameriprise
Financial Center
Minneapolis, MN 55474
Born 1970 | | President and Principal Executive Officer (2015) | | Vice President and Lead Chief Counsel, Ameriprise Financial, Inc. since January 2015 (previously, Vice President and Chief Counsel January 2010-December 2014; and Vice President and Group Counsel or Counsel 2004- January 2010); officer of Columbia Funds and affiliated funds since 2007. | |
Michael G. Clarke
225 Franklin Street
Boston, MA 02110
Born 1969 | | Treasurer (2011) and Chief Financial Officer (2009) | | Vice President — Mutual Fund Administration, Columbia Management Investment Advisers, LLC, since May 2010; Managing Director of Fund Administration, Columbia Management Advisors, LLC, September 2004-April 2010; senior officer of Columbia Funds and affiliated funds since 2002. | |
Annual Report 2015
42
COLUMBIA SMALL CAP CORE FUND
TRUSTEES AND OFFICERS (continued)
Fund Officers (continued)
Name,
Address and
Year of Birth | | Position and Year
First Appointed to
Position for any Fund
in the Columbia
Funds Complex or a
Predecessor Thereof | | Principal Occupation(s) During Past Five Years | |
Paul B. Goucher
100 Park Avenue
New York, NY 10017
Born 1968 | | Senior Vice President (2011), Chief Legal Officer (2015) and Assistant Secretary (2008) | | Vice President and Lead Chief Counsel, Ameriprise Financial, Inc. since November 2008 and January 2013, respectively (previously Chief Counsel, January 2010-January 2013 and Group Counsel, November 2008-January 2010). | |
Thomas P. McGuire
225 Franklin Street
Boston, MA 02110
Born 1972 | | Vice President and Chief Compliance Officer (2012) | | Vice President — Asset Management Compliance, Ameriprise Financial, Inc., since May 2010; Chief Compliance Officer, Ameriprise Certificate Company since September 2010; Compliance Executive, Bank of America, 2005-April 2010. | |
Colin Moore
225 Franklin Street
Boston, MA 02110
Born 1958 | | Senior Vice President (2010) | | Executive Vice President and Global Chief Investment Officer, Ameriprise Financial, Inc., since July 2013; Director and Global Chief Investment Officer, Columbia Management Investment Advisers, LLC since May 2010; Manager, Managing Director and Chief Investment Officer, Columbia Management Advisors, LLC, 2007-April 2010. | |
Michael E. DeFao
225 Franklin Street
Boston, MA 02110
Born 1968 | | Vice President (2011) and Assistant Secretary (2010) | | Vice President and Chief Counsel, Ameriprise Financial, Inc. since May 2010; Associate General Counsel, Bank of America, 2005-April 2010. | |
Joseph F. DiMaria
225 Franklin Street
Boston, MA 02110
Born 1968 | | Vice President (2011), Assistant Treasurer (2012) and Chief Accounting Officer (2008) | | Vice President — Mutual Fund Treasurer, Columbia Management Investment Advisers, LLC since May 2010; Director of Fund Administration, Columbia Management Advisors, LLC, 2006-April 2010. | |
Amy Johnson
5228 Ameriprise
Financial Center
Minneapolis, MN 55474
Born 1965 | | Vice President (2006) | | Managing Director and Chief Operating Officer, Columbia Management Investment Advisers, LLC since May 2010 (previously Chief Administrative Officer, 2009-April 2010, and Vice President — Asset Management and Trust Company Services, 2006-2009). | |
Lyn Kephart-Strong
5228 Ameriprise
Financial Center
Minneapolis, MN 55474
Born 1960 | | Vice President (2015) | | President, Columbia Management Investment Services Corp. since October 2014; Vice President & Resolution Officer, Ameriprise Trust Company since August 2009; President, RiverSource Service Corporation 2004-2010. | |
Ryan C. Larrenaga
225 Franklin Street
Boston, MA 02110
Born 1970 | | Vice President and Secretary (2015) | | Vice President and Group Counsel, Ameriprise Financial, Inc. since August 2011 (previously, Counsel from May 2010 to August 2011); Assistant General Counsel, Bank of America, 2005-April 2010; officer of Columbia Funds and affiliated funds since 2005. | |
Annual Report 2015
43
COLUMBIA SMALL CAP CORE FUND
BOARD CONSIDERATION AND APPROVAL OF ADVISORY AGREEMENT
On June 10, 2015, the Board of Trustees (the Board) and the Trustees who are not interested persons (as defined in the Investment Company Act of 1940) (the Independent Trustees) of Columbia Funds Series Trust I (the Trust) unanimously approved the continuation of the Investment Management Services Agreement (the Advisory Agreement) with Columbia Management Investment Advisers, LLC (the Investment Manager) with respect to Columbia Small Cap Core Fund (the Fund), a series of the Trust. The Board and the Independent Trustees also unanimously approved an agreement (the Management Agreement and, together with the Advisory Agreement, the Agreements) combining the Advisory Agreement and the Fund's existing administrative services agreement (the Administrative Services Agreement) in a single agreement. The Board and the Independent Trustees approved the restatement of the Advisory Agreement with the Management Agreement to be effective for the Fund on January 1, 2016, the Fund's next annual prospectus update. As detailed below, the Board's Advisory Fees and Expenses Committee (the Committee) and the Board met on multiple occasions to review and discuss, both among themselves and with the management team of the Investment Manager, materials provided by the Investment Manager and others before determining to approve the Management Agreement and the continuation of the Advisory Agreement.
In connection with their deliberations regarding the approval of the Management Agreement and the continuation of the Advisory Agreement, the Committee and the Board evaluated materials requested from the Investment Manager regarding the Fund and the Agreements, and discussed these materials with representatives of the Investment Manager at Committee meetings held on March 3, 2015, April 29, 2015 and June 9, 2015 and at Board meetings held on March 4, 2015 and June 10, 2015. In addition, the Board considers matters bearing on the Agreements at most of its other meetings throughout the year and meets regularly with senior management of the Trust and the Investment Manager. Through the Board's Investment Oversight Committees, Trustees also meet with selected portfolio managers of the funds the Trustees oversee and other investment personnel at various times throughout the year. The Committee and the Board also consulted with its independent fee consultant, Fund counsel and with the Independent Trustees' independent legal counsel, who advised on various matters with respect to the Committee's and the Board's considerations and otherwise assisted the Committee and the Board in their deliberations. On June 9, 2015, the Committee recommended that the Board approve the Management Agreement and the continuation of the Advisory Agreement. On June 10, 2015, the Board, including the Independent Trustees, voting separately, unanimously approved the Management Agreement and the continuation of the Advisory Agreement for the Fund.
The Committee and the Board considered all information that they, their legal counsel or the Investment Manager believed reasonably necessary to evaluate and to determine whether to approve the Management Agreement and the continuation of the Advisory Agreement. The information and factors considered by the Committee and the Board in recommending for approval or approving the Management Agreement and the continuation of the Advisory Agreement for the Fund included the following:
• Information on the investment performance of the Fund relative to the performance of a group of mutual funds determined to be comparable to the Fund by an independent third-party data provider, as well as performance relative to benchmarks;
• Information on the Fund's advisory fees and total expenses, including information comparing the Fund's expenses to those of a group of comparable mutual funds, as determined by the independent third-party data provider;
• The Investment Manager's agreement to contractually limit or cap total operating expenses for the Fund so that total operating expenses (excluding certain fees and expenses, such as portfolio transaction costs and certain other investment related expenses, interest, taxes, acquired fund fees and expenses, and extraordinary expenses) would not exceed a specified percentage of the Fund's average annual net assets from January 1, 2016 through December 31, 2016;
• The terms and conditions of the Agreements;
Annual Report 2015
44
COLUMBIA SMALL CAP CORE FUND
BOARD CONSIDERATION AND APPROVAL OF ADVISORY AGREEMENT (continued)
• The current and proposed terms and conditions of other agreements and arrangements with affiliates of the Investment Manager relating to the operations of the Fund, including the Administrative Services Agreement1 and agreements with respect to the provision of distribution and transfer agency services to the Fund;
• Descriptions of various functions performed by the Investment Manager under the Agreements, including portfolio management and portfolio trading practices;
• Information regarding the management fees and investment performance of similarly-managed portfolios of other clients of the Investment Manager, including institutional separate accounts;
• Information regarding the reputation, regulatory history and resources of the Investment Manager, including information regarding senior management, portfolio managers and other personnel;
• Information regarding the capabilities of the Investment Manager with respect to compliance monitoring services, including an assessment of the Investment Manager's compliance system by the Fund's Chief Compliance Officer; and
• The profitability to the Investment Manager and its affiliates from their relationships with the Fund.
Nature, Extent and Quality of Services Provided under the Agreements
The Committee and the Board considered the nature, extent and quality of services provided to the Fund by the Investment Manager and its affiliates under the Agreements and under separate agreements for the provision of transfer agency and administrative services, and the resources dedicated to the Fund and the other Columbia Funds by the Investment Manager and its affiliates. The Committee and the Board also determined that the nature and level of the services to be provided under the Management Agreement would not decrease relative to the services provided under the Advisory Agreement and the Administrative Services Agreement. The Committee and the Board considered, among other things, the Investment Manager's ability to attract, motivate and retain highly qualified research, advisory and supervisory investment professionals (including personnel and other resources, compensation programs for personnel involved in fund management, reputation and other attributes), the portfolio management services provided by those investment professionals, and the quality of the Investment Manager's investment research capabilities and trade execution services. The Committee and the Board also considered the potential benefits to shareholders of investing in a mutual fund that is part of a fund complex offering exposure to a variety of asset classes and investment disciplines and providing a variety of fund and shareholder services.
The Committee and the Board also considered the professional experience and qualifications of the senior personnel of the Investment Manager, which included consideration of the Investment Manager's experience with similarly-structured funds. The Committee and the Board noted the compliance programs of and the compliance-related resources provided to the Fund by the Investment Manager and its affiliates, and considered the Investment Manager's ability to provide administrative services to the Fund and coordinate the activities of the Fund's other service providers. In evaluating the nature, extent and quality of services provided under the Agreements, the Committee and the Board considered that these services were provided to the Fund, rather than directly to Fund shareholders. The Committee and the Board accordingly affirmed, after considering various other matters, including the potential benefits to the Fund and its shareholders of the Independent Trustees' important role as pre-suit gatekeepers with respect to claims that they may determine are meritless or contrary to the Fund's best interests, that it was not the intention of the Board or the Investment Manager that there be any third-party beneficiaries of the Agreements. After reviewing these and related factors, the Committee and the Board concluded, within the context of their overall conclusions, that the nature, extent and quality of the services provided to the Fund under the Agreements supported the approval of the Management Agreement and the continuation of the Advisory Agreement.
1 Like the Advisory Agreement, the Administrative Services Agreement will terminate with respect to the Fund once the Management Agreement is effective for the Fund.
Annual Report 2015
45
COLUMBIA SMALL CAP CORE FUND
BOARD CONSIDERATION AND APPROVAL OF ADVISORY AGREEMENT (continued)
Investment Performance
The Committee and the Board reviewed information about the performance of the Fund over various time periods, including performance information relative to benchmarks and information based on reports of the independent third-party data provider that compared the performance of the Fund to the performance of a group of comparable mutual funds, and data provided by the independent fee consultant. The Committee and the Board also reviewed a description of the third party's methodology for identifying the Fund's peer groups for purposes of performance and expense comparisons. Although the Fund's performance lagged that of a relevant peer group for certain (although not necessarily all) periods, the Committee and the Board concluded that other factors relevant to performance were sufficient, in light of other considerations, to warrant continuation of the Advisory Agreement and approval of the Management Agreement. Those factors included one or more of the following: (i) that the Fund's performance, although lagging in certain recent periods, was stronger over the longer term; (ii) that the underperformance was attributable, to a significant extent, to investment decisions that were reasonable and consistent with the Fund's investment strategy and policies and that the Fund was performing within a reasonable range of expectations, given those investment decisions, market conditions and the Fund's investment strategy; (iii) that the Fund's performance was competitive when compared to other relevant performance benchmarks or peer groups; and (iv) that the Investment Manager had taken or was taking steps designed to help improve the Fund's investment performance, including, but not limited to, replacing portfolio managers, enhancing the resources supporting the portfolio managers, or modifying investment strategies.
The Committee and the Board noted that, through December 31, 2014, the Fund's performance was in the eighty-fourth, seventy-ninth and sixty-seventh percentile (where the best performance would be in the first percentile) of its category selected by the independent third-party data provider for the purposes of performance comparisons for the one-, three- and five- year periods, respectively.
The Committee and the Board also considered the Investment Manager's performance and reputation generally, the Investment Manager's historical responsiveness to Board concerns about performance, and the Investment Manager's willingness to take steps intended to improve performance. After reviewing these and related factors, the Committee and the Board concluded, within the context of their overall conclusions, that the performance of the Fund was sufficient, in light of other considerations, to warrant the continuation of the Advisory Agreement and the approval of the Management Agreement.
Investment Advisory Fee Rates and Other Expenses
The Committee and the Board considered the advisory fees charged to the Fund under the Advisory Agreement as well as the total expenses incurred by the Fund. In assessing the reasonableness of the fees under the Advisory Agreement, the Committee and the Board considered, among other information, the Fund's advisory fee and its total expense ratio as a percentage of average daily net assets. The Committee and the Board also considered that the proposed management fee would not exceed the sum of the fee rates payable under the Advisory Agreement and the Administrative Services Agreement. The Committee and the Board considered data provided by the independent fee consultant. The Committee and the Board noted that, as of December 31, 2014, the Fund's actual management fee and net expense ratio are both ranked in the third quintile (where the lowest fees and expenses would be in the first quintile) against the Fund's expense universe as determined by the independent third-party data provider for purposes of expense comparison. The Committee and the Board also took into account the fee waiver and expense limitation arrangements agreed to by the Investment Manager, as noted above.
The Committee and the Board also received and considered information about the advisory fees charged by the Investment Manager to institutional separate accounts. In considering the fees charged to those accounts, the Committee and the Board took into account, among other things, the Investment Manager's representations about the differences between managing mutual funds as compared to other types of accounts, including differences in the services provided, differences in the risk profile of such business for the Investment Manager and the additional resources required to manage mutual funds effectively. The Committee and the Board also received and considered information about the fees charged by the Investment Manager for sub-advisory services
Annual Report 2015
46
COLUMBIA SMALL CAP CORE FUND
BOARD CONSIDERATION AND APPROVAL OF ADVISORY AGREEMENT (continued)
provided to comparable unaffiliated funds. In evaluating the Fund's advisory fees, the Committee and the Board also took into account the demands, complexity and quality of the investment management of the Fund.
After reviewing these and related factors, the Committee and the Board concluded, within the context of their overall conclusions, that the advisory/management fee rates and expenses of the Fund were sufficient, in light of other considerations, to warrant the approval of the Management Agreement and continuation of the Advisory Agreement.
Costs of Services Provided and Profitability
The Committee and the Board also took note of the costs the Investment Manager and its affiliates incur in connection with the services provided (both on an absolute and relative basis) and the profitability to the Investment Manager and its affiliates in connection with their relationships with the Fund.
The Committee and the Board also considered the compensation directly or indirectly received by the Investment Manager's affiliates in connection with their relationships with the Fund. The Committee and the Board reviewed information provided by management as to the profitability to the Investment Manager and its affiliates of their relationships with the Fund, information about the allocation of expenses used to calculate profitability, and comparisons of profitability levels realized in 2014 to profitability levels realized in 2013. When reviewing profitability, the Committee and the Board also considered court cases in which adviser profitability was an issue in whole or in part, the performance of similarly managed funds, the performance of the Fund, and the expense ratio of the Fund. The Committee and the Board also considered information provided by the Investment Manager regarding the Investment Manager's financial condition and comparing its profitability to that of other asset management firms that are, or are subsidiaries of, publicly traded companies.
After reviewing these and related factors, the Committee and the Board concluded, within the context of their overall conclusions, that the costs of services provided and the profitability to the Investment Manager and its affiliates from their relationships with the Fund supported the approval of the Management Agreement and the continuation of the Advisory Agreement.
Economies of Scale
The Committee and the Board considered the potential existence of economies of scale in the provision by the Investment Manager of services to the Fund, to groups of related funds, and to the Investment Manager's investment advisory clients as a whole, and whether those economies of scale were shared with the Fund through breakpoints in investment advisory fees or other means, such as expense limitation arrangements and additional investments by the Investment Manager in investment, trading and compliance resources. The Committee and the Board noted that the investment advisory and management fee schedules for the Fund contained breakpoints that would reduce the fee rate on assets above specified threshold levels.
In considering these matters, the Committee and the Board also considered the costs of the services provided and the profitability to the Investment Manager and its affiliates from their relationships with the Fund, as discussed above. After reviewing these and related factors, the Committee and the Board concluded, within the context of their overall conclusions, that the extent to which any economies of scale were expected to be shared with the Fund supported the approval of the Management Agreement and the continuation of the Advisory Agreement.
Other Benefits to the Investment Manager
The Committee and the Board received and considered information regarding "fall-out" or ancillary benefits received by the Investment Manager and its affiliates as a result of their relationships with the Fund, such as the engagement of the Investment Manager to provide administrative services to the Fund and the engagement of the Investment Manager's affiliates to provide distribution and transfer agency services to the Fund. In this regard, among other matters, the Committee and the Board considered that the Fund's distributor retains a portion of the distribution fees from the Fund and receives a portion of the sales charges on sales or redemptions of certain classes of shares of the Fund. The Committee and the Board also considered the benefits of research made available to the Investment Manager by reason of brokerage commissions generated by the
Annual Report 2015
47
COLUMBIA SMALL CAP CORE FUND
BOARD CONSIDERATION AND APPROVAL OF ADVISORY AGREEMENT (continued)
Fund's securities transactions, and reviewed information about the Investment Manager's practices with respect to allocating portfolio transactions for brokerage and research services. The Committee and the Board considered the possible conflicts of interest associated with certain fall-out or other ancillary benefits and the reporting, disclosure and other processes that are in place to address such possible conflicts of interest. The Committee and the Board recognized that the Investment Manager's profitability would be somewhat lower without these benefits.
Conclusion
The Committee and the Board reviewed all of the above considerations in reaching their decisions to recommend or approve the Management Agreement and the continuation of the Advisory Agreement. In their deliberations, the Trustees did not identify any particular information that was all-important or controlling, and individual Trustees may have attributed different weights to the various factors. Based on their evaluation of all factors that they deemed to be material, including those factors described above, and assisted by the advice of independent legal counsel, the Board, including the Independent Trustees, voting separately, unanimously approved the Management Agreement and the continuation of the Advisory Agreement.
Annual Report 2015
48
COLUMBIA SMALL CAP CORE FUND
IMPORTANT INFORMATION ABOUT THIS REPORT
Each fund mails one shareholder report to each shareholder address. If you would like more than one report, please call shareholder services at 800.345.6611 and additional reports will be sent to you.
The policy of the Board is to vote the proxies of the companies in which each fund holds investments consistent with the procedures as stated in the Statement of Additional Information (SAI). You may obtain a copy of the SAI without charge by calling 800.345.6611; contacting your financial intermediary; visiting columbiathreadneedle.com/us; or searching the website of the Securities and Exchange Commission (SEC) at sec.gov. Information regarding how each fund voted proxies relating to portfolio securities is filed with the SEC by August 31st for the most recent 12-month period ending June 30th of that year, and is available without charge by visiting columbiathreadneedle.com/us, or searching the website of the SEC at sec.gov.
Each fund files a complete schedule of portfolio holdings with the SEC for the first and third quarters of each fiscal year on Form N-Q. Each fund's Form N-Q is available on the SEC's website at sec.gov and may be reviewed and copied at the SEC's Public Reference Room in Washington, D.C. Information on the operation of the Public Reference Room may be obtained by calling 800.SEC.0330. Each fund's complete schedule of portfolio holdings, as filed on Form N-Q, can also be obtained without charge, upon request, by calling 800.345.6611.
Annual Report 2015
49
Columbia Small Cap Core Fund
P.O. Box 8081
Boston, MA 02266-8081

This information is for use with concurrent or prior delivery of a fund prospectus. Please read and consider the investment objectives, risks, charges and expenses for any fund carefully before investing. For a prospectus and summary prospectus, which contains this and other important information about the Fund, go to columbiathreadneedle.com/us. The Fund is distributed by Columbia Management Investment Distributors, Inc., member FINRA, and managed by Columbia Management Investment Advisers, LLC.
Columbia Threadneedle Investments (Columbia Threadneedle) is the global brand name of the Columbia and Threadneedle group of companies.
All rights reserved. Columbia Management Investment Distributors, Inc., 225 Franklin Street, Boston, MA 02110-2804
© 2015 Columbia Management Investment Advisers, LLC.
columbiathreadneedle.com/us
ANN225_08_E01_(10/15)

ANNUAL REPORT
August 31, 2015

COLUMBIA SMALL CAP GROWTH FUND I

 Dear Shareholder,
Today's investors are typically focused on outcomes, like living a certain retirement lifestyle, paying for college education or building a legacy. But in today's complex global investment landscape, even simple goals are not easily achieved.
At Columbia Threadneedle Investments, we aspire to help satisfy five core needs of today's investors:
n Generate an appropriate stream of income in retirement
Traditional approaches to generating income may not provide the diversification benefits they once did, and they may actually introduce unwanted risk in today's market. To seek to improve your potential to live comfortably long term, we endeavor to pursue investments that explore less traveled paths to income.
n Navigate a changing interest rate environment
Today's uncertain market environment includes the prospect of a rise in interest rates. Blending traditional investments with non-traditional or alternative products may help protect your wealth during periods of volatility. We can attempt to help strengthen your portfolio with agile products designed to take on the market's ups and downs.
n Maximize after-tax returns
In an environment where what you keep may be more important than what you earn, municipal bonds can help mitigate high tax burdens while providing potentially attractive yields. Our state and federal tax-exempt products are aimed at helping investors manage risk, minimize the fluctuation of capital and grow wealth on a more tax-efficient basis.
n Grow assets to achieve financial goals
We believe that finding and protecting growth comes from a disciplined security selection process designed to create excess return. Our goal is to provide investment solutions built to help you face today's market challenges and grow your assets at each crossroad of your journey.
n Ease the impact of volatile markets
Despite a bull market run that has benefited many investors over the past several years, it's important to remember the lessons of 2008 and the value that a well-diversified portfolio may provide through times of market volatility. We are here to help you hold onto the savings you have worked tirelessly to amass, and to provide you the best opportunity to maintain your standard of living regardless of market conditions.
Find out today how we can help you confidently invest to realize your dreams. Please visit us at blog.columbiathreadneedleus.com/our-best-ideas to learn more about our unique investment solutions.
The world is constantly changing, but our priority remains the same: to help you secure your finances, meet your goals and achieve success. Thank you for your continued investment with us.
Sincerely,

Christopher O. Petersen
President, Columbia Funds
Investors should consider the investment objectives, risks, charges and expenses of a mutual fund carefully before investing. For a free prospectus and summary prospectus, which contains this and other important information about a fund, visit columbiathreadneedle.com/us. The prospectus should be read carefully before investing.
Columbia Funds are distributed by Columbia Management Investment Distributors, Inc., member FINRA, and managed by Columbia Management Investment Advisers, LLC.
© 2015 Columbia Management Investment Advisers, LLC. All rights reserved.
COLUMBIA SMALL CAP GROWTH FUND I
Performance Overview | | | 2 | | |
Manager Discussion of Fund Performance | | | 4 | | |
Understanding Your Fund's Expenses | | | 7 | | |
Portfolio of Investments | | | 8 | | |
Statement of Assets and Liabilities | | | 13 | | |
Statement of Operations | | | 16 | | |
Statement of Changes in Net Assets | | | 17 | | |
Financial Highlights | | | 20 | | |
Notes to Financial Statements | | | 30 | | |
Report of Independent Registered
Public Accounting Firm | | | 38 | | |
Federal Income Tax Information | | | 39 | | |
Trustees and Officers | | | 40 | | |
Board Consideration and Approval of Advisory Agreement | | | 44 | | |
Important Information About This Report | | | 49 | | |
Fund Investment Manager
Columbia Management Investment
Advisers, LLC
225 Franklin Street
Boston, MA 02110
Fund Distributor
Columbia Management Investment
Distributors, Inc.
225 Franklin Street
Boston, MA 02110
Fund Transfer Agent
Columbia Management Investment
Services Corp.
P.O. Box 8081
Boston, MA 02266-8081
For more information about any of the funds, please visit columbiathreadneedle.com/us or call 800.345.6611. Customer Service Representatives are available to answer your questions Monday through Friday from 8 a.m. to 7 p.m. Eastern time.
The views expressed in this report reflect the current views of the respective parties. These views are not guarantees of future performance and involve certain risks, uncertainties and assumptions that are difficult to predict, so actual outcomes and results may differ significantly from the views expressed. These views are subject to change at any time based upon economic, market or other conditions and the respective parties disclaim any responsibility to update such views. These views may not be relied on as investment advice and, because investment decisions for a Columbia fund are based on numerous factors, may not be relied on as an indication of trading intent on behalf of any particular Columbia fund. References to specific securities should not be construed as a recommendation or investment advice
COLUMBIA SMALL CAP GROWTH FUND I
Performance Summary
n Columbia Small Cap Growth Fund I (the Fund) Class A shares returned 11.87% excluding sales charges for the 12 months ended August 31, 2015.
n During the same time period, the Fund sharply outperformed the Russell 2000 Growth Index and the Russell 2000 Index, which returned 5.11% and 0.03%, respectively.
n Stock selection generally accounted for the Fund's significant performance advantage over the Russell 2000 Growth Index. An overweight in health care also aided relative results.
Average Annual Total Returns (%) (for period ended August 31, 2015)
| | | Inception | | 1 Year | | 5 Years | | 10 Years | |
Class A* | | 11/01/05 | | | | | | | |
Excluding sales charges | | | | | | | 11.87 | | | | 14.88 | | | | 8.64 | | |
Including sales charges | | | | | | | 5.45 | | | | 13.53 | | | | 8.00 | | |
Class B* | | 11/01/05 | | | | | | | |
Excluding sales charges | | | | | | | 11.02 | | | | 14.02 | | | | 7.84 | | |
Including sales charges | | | | | | | 6.50 | | | | 13.78 | | | | 7.84 | | |
Class C* | | 11/01/05 | | | | | | | |
Excluding sales charges | | | | | | | 11.07 | | | | 14.03 | | | | 7.84 | | |
Including sales charges | | | | | | | 10.16 | | | | 14.03 | | | | 7.84 | | |
Class I* | | 09/27/10 | | | 12.42 | | | | 15.40 | | | | 9.02 | | |
Class K* | | 02/28/13 | | | 12.08 | | | | 15.05 | | | | 8.79 | | |
Class R* | | 09/27/10 | | | 11.63 | | | | 14.61 | | | | 8.38 | | |
Class R4* | | 11/08/12 | | | 12.18 | | | | 15.19 | | | | 8.92 | | |
Class R5* | | 02/28/13 | | | 12.33 | | | | 15.33 | | | | 8.99 | | |
Class Y* | | 07/15/09 | | | 12.38 | | | | 15.38 | | | | 9.03 | | |
Class Z | | 10/01/96 | | | 12.16 | | | | 15.17 | | | | 8.91 | | |
Russell 2000 Growth Index | | | | | | | 5.11 | | | | 17.83 | | | | 8.46 | | |
Russell 2000 Index | | | | | | | 0.03 | | | | 15.55 | | | | 7.12 | | |
Returns for Class A are shown with and without the maximum initial sales charge of 5.75%. Returns for Class B are shown with and without the applicable contingent deferred sales charge (CDSC) of 5.00% in the first year, declining to 1.00% in the sixth year and eliminated thereafter. Returns for Class C are shown with and without the 1.00% CDSC for the first year only. The Fund's other classes are not subject to sales charges and have limited eligibility. Please see the Fund's prospectus for details. Performance for different share classes will vary based on differences in sales charges and fees associated with each class. All results shown assume reinvestment of distributions during the period. Returns do not reflect the deduction of taxes that a shareholder may pay on Fund distributions or on the redemption of Fund shares. Performance results reflect the effect of any fee waivers or reimbursements of Fund expenses by Columbia Management Investment Advisers, LLC and/or any of its affiliates. Absent these fee waivers or expense reimbursement arrangements, performance results would have been lower.
The performance information shown represents past performance and is not a guarantee of future results. The investment return and principal value of your investment will fluctuate so that your shares, when redeemed, may be worth more or less than their original cost. Current performance may be lower or higher than the performance information shown. You may obtain performance information current to the most recent month-end by contacting your financial intermediary, visiting columbiathreadneedle.com/us or calling 800.345.6611.
*The returns shown for periods prior to the share class inception date (including returns for the Life of the Fund, if shown, which are since Fund inception) include the returns of the Fund's oldest share class. These returns are adjusted to reflect any higher class-related operating expenses of the newer share classes, as applicable. Please visit columbiathreadneedle.com/us/investment-products/mutual-funds/appended-performance for more information.
The Russell 2000 Growth Index, an unmanaged index, measures the performance of those Russell 2000 Index companies with higher price-to-book ratios and higher forecasted growth values.
The Russell 2000 Index measures the performance of the small-cap segment of the U.S. equity universe. The Russell 2000 is a subset of the Russell 3000 Index representing approximately 10% of the total market capitalization of that index. It includes approximately 2000 of the smallest securities based on a combination of their market cap and current index membership.
Indices are not available for investment, are not professionally managed and do not reflect sales charges, fees, brokerage commissions, taxes or other expenses of investing. Securities in the Fund may not match those in an index.
Annual Report 2015
2
COLUMBIA SMALL CAP GROWTH FUND I
PERFORMANCE OVERVIEW (continued)
Performance of a Hypothetical $10,000 Investment (September 1, 2005 – August 31, 2015)
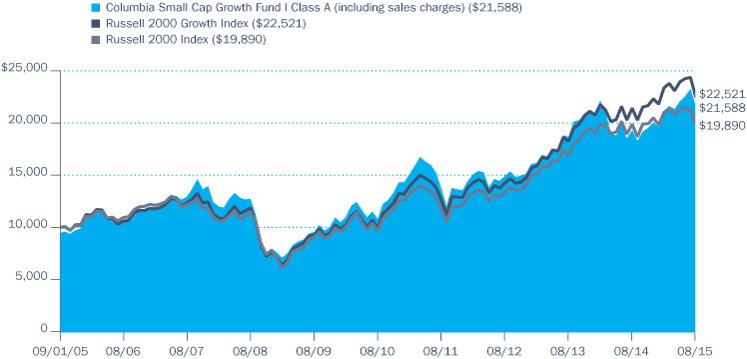
The chart above shows the change in value of a hypothetical $10,000 investment in Class A shares of Columbia Small Cap Growth Fund I during the stated time period, and does not reflect the deduction of taxes that a shareholder may pay on Fund distributions or on the redemption of Fund shares.
Annual Report 2015
3
COLUMBIA SMALL CAP GROWTH FUND I
MANAGER DISCUSSION OF FUND PERFORMANCE
Portfolio Management
Daniel Cole, CFA
Wayne Collette, CFA
Lawrence Lin, CFA
Rahul Narang
Morningstar Style BoxTM

The Morningstar Style BoxTM is based on a fund's portfolio holdings. For equity funds, the vertical axis shows the market capitalization of the stocks owned, and the horizontal axis shows investment style (value, blend, or growth). Information shown is based on the most recent data provided by Morningstar.
© 2015 Morningstar, Inc. All rights reserved. The Morningstar information contained herein: (1) is proprietary to Morningstar and/or its content providers; (2) may not be copied or distributed; and (3) is not warranted to be accurate, complete or timely. Neither Morningstar nor its content providers are responsible for any damages or losses arising from any use of this information.
For the 12-month period that ended August 31, 2015, the Fund's Class A shares returned 11.87% excluding sales charges. During the same time period, the Fund outperformed both the Russell 2000 Growth Index and the Russell 2000 Index, which returned 5.11% and 0.03%, respectively. Stock selection generally accounted for the Fund's significant performance advantage over its benchmarks. An overweight in health care also bolstered relative results.
Markets Turned Volatile as Pressures Mounted
The pace of U.S. economic growth fluctuated during the 12-month period that ended August 31, 2015. Another stormy winter in the Northeast and Midwest whittled away at gross domestic product (GDP) early in 2015. A strong dollar, a widening trade deficit and declining oil prices also took a significant bite out of growth. Yet most of these setbacks proved to be temporary and the U.S. economy rebounded as temperatures warmed. An average of 243,000 new jobs were added monthly to the U.S. workforce, driving the unemployment rate down to 5.1% and bolstering consumer confidence. Manufacturing activity was solid even though the pace of expansion slowed over the year. Home sales were robust. However, stubbornly low inventory levels and rising prices have kept many first-time home buyers out of the market.
As concerns mounted about a sluggish global economy, weakening growth in China and the timing of a Federal Reserve interest rate hike, the financial markets turned volatile. Solid stock market gains in the first half of the 12-month period were all but wiped out in the second half. Large-cap stocks edged out mid-cap and small-cap stocks, while growth stocks significantly outperformed value. Within the Russell 2000 Growth Index, health care stocks posted the biggest gains, while energy stocks fell sharply.
Stock Selection Aided Fund Results
Stock selection was particularly strong in the consumer discretionary and industrials sectors. Gains from these sectors were more than enough to offset disappointments in consumer staples and telecommunication services. Skechers U.S.A., in the consumer discretionary sector, was the Fund's top contributor for the period. The maker of lifestyle and performance footwear reported results that beat consensus estimates despite foreign exchange headwinds and unseasonable weather. The Skechers brand remains in high demand across all geographies and demographics, and we believe that the company's opportunities to expand distribution and increase penetration around the globe remain plentiful. Eros International, also in the consumer discretionary sector, was another top contributor for the period. The company produces, acquires and distributes Indian language films in multiple formats worldwide. Eros Now, the company's digital, subscription-based service for movies, TV shows and music has garnered more than 19 million registered users. The company is also collaborating with Chinese firms to co-produce and distribute Sino-Indian films. Both Skechers and Eros fit the profile of companies with the traits we look for: A significant runway for growth, rising economic momentum and robust cashflow growth. We believe the
Annual Report 2015
4
COLUMBIA SMALL CAP GROWTH FUND I
MANAGER DISCUSSION OF FUND PERFORMANCE (continued)
management teams of each company have shown an aptitude for good capital allocation decisions. We continue to own both stocks.
In the industrials sector, the Fund's airline holdings were particularly strong performers, especially Alaska Air and JetBlue Airways. Alaska Air reported earnings that exceeded consensus estimates and revenue that was in line with expectations, as higher ancillary fees offset weaker pricing. Lower labor and fuel costs boosted profitability. JetBlue's new CEO unveiled initiatives aimed to improve revenue growth and slow cost inflation over the next four years, which, coupled with improved return on invested capital, was well received by investors. We took profits in JetBlue but continue to own Alaska Air. The growth of its franchise out of the Seattle market continues to expand and the low cost nature of its operations, combined with what we believe to be management's top notch capital allocation decision-making, have the potential to continue to bolster the economic momentum of the company.
A strengthening U.S. dollar, increasing supply and lower demand gripped the energy markets and resulted in a drastic decline in oil prices, which left the energy sector down more than 50% for the period. Several energy holdings detracted from relative results, including Carrizo Oil & Gas and U.S. Silica Holdings. Despite these two major disappointments, we avoided some of the hardest hit names in the Russell 2000 Growth Index. We exited U.S. Silica last fall because we foresaw the impact that sinking crude oil prices would have on the company's high fixed-cost operations. Since that time, we believe the company's core product, fracking sand, has grown in importance. In this business, the network and logistics capabilities are essential in creating competitive advantage vs. less advantaged peers, and we see the potential for fracking sand usage to grow in intensity over time. We see the potential for the multiple current providers to consolidate to a handful of the best positioned players, and we believe that U.S. Silica is one of them. As a result, we slowly started to rebuild the Fund's position in the stock.
Constant Contact was another disappointment during the period. The company provides online marketing tools for small businesses and organizations, including an online marketing platform. The company reported increased customer attrition, reduced partner contributions and weakened conversion rates, which helped drive a revenue shortfall and a downward revision to earnings guidance for the year. Typical of our investment process, we periodically review our confidence in the underlying economics of the businesses we have invested in as well as the duration of the competitive advantage period and growth of these companies. Because our confidence in the duration of Constant Contact's financial return profile waned, we sold the stock.
Looking Ahead
At this time, we see three challenges facing markets that intersect, which were brought into sharp focus by the recent Chinese currency devaluation.
Top Ten Holdings (%)
(at August 31, 2015) | |
Align Technology, Inc. | | | 2.1 | | |
Euronet Worldwide, Inc. | | | 2.0 | | |
Sovran Self Storage, Inc. | | | 1.9 | | |
Webster Financial Corp. | | | 1.8 | | |
Eros International PLC | | | 1.7 | | |
CEB, Inc. | | | 1.7 | | |
Akorn, Inc. | | | 1.6 | | |
PTC, Inc. | | | 1.6 | | |
QLIK Technologies, Inc. | | | 1.6 | | |
Team Health Holdings, Inc. | | | 1.6 | | |
Percentages indicated are based upon total investments (excluding Money Market Funds).
For further detail about these holdings, please refer to the section entitled "Portfolio of Investments."
Fund holdings are as of the date given, are subject to change at any time, and are not recommendations to buy or sell any security.
Portfolio Breakdown (%)
(at August 31, 2015) | |
Common Stocks | | | 97.7 | | |
Money Market Funds | | | 2.3 | | |
Total | | | 100.0 | | |
Percentages indicated are based upon total investments. The Fund's portfolio composition is subject to change.
Annual Report 2015
5
COLUMBIA SMALL CAP GROWTH FUND I
MANAGER DISCUSSION OF FUND PERFORMANCE (continued)
Equity Sector Breakdown (%)
(at August 31, 2015) | |
Consumer Discretionary | | | 18.9 | | |
Consumer Staples | | | 2.1 | | |
Energy | | | 2.9 | | |
Financials | | | 7.5 | | |
Health Care | | | 27.5 | | |
Industrials | | | 11.8 | | |
Information Technology | | | 24.1 | | |
Materials | | | 5.2 | | |
Total | | | 100.0 | | |
Percentages indicated are based upon total equity investments. The Fund's portfolio composition is subject to change.
Investment Risks
Market risk may affect a single issuer, sector of the economy, industry or the market as a whole. Foreign investments subject the Fund to risks, including political, economic, market, social and others within a particular country, as well as to currency instabilities and less stringent financial and accounting standards generally applicable to U.S. issuers. Investments in small-cap companies involve risks and volatility greater than investments in larger, more established companies. Growth securities, at times, may not perform as well as value securities or the stock market in general and may be out of favor with investors. The Fund may invest significantly in issuers within a particular sector, which may be negatively affected by market, economic or other conditions, making the Fund more vulnerable to unfavorable developments in the sector. See the Fund's prospectus for more information on these and other risks.
First, the equity market is still digesting a big increase in energy supply brought to market by U.S. shale producers. Second, improved economic data has put pressure on the Federal Reserve to hike short-term interest rates. Third, China's economy continues to slow, which has put additional pressure on commodity prices and resulted in a collapse in the value of Chinese domestic equities and equities around the globe. We believe that the recent market correction provides investors with a better entry point for building positions in long-term assets. Against that backdrop, we believe the Fund is currently well positioned to benefit from our bottom-up, fundamental research process, which favors high-quality companies with sustainable competitive advantages and durable long-term growth prospects, which are in the sweet spot of their profit lifecycle and cashflow production.
Annual Report 2015
6
COLUMBIA SMALL CAP GROWTH FUND I
UNDERSTANDING YOUR FUND'S EXPENSES
(Unaudited)
As an investor, you incur two types of costs. There are transaction costs, which generally include sales charges on purchases and may include redemption fees. There are also ongoing costs, which generally include management fees, distribution and/or service fees, and other fund expenses. The following information is intended to help you understand your ongoing costs (in dollars) of investing in the Fund and to help you compare these costs with the ongoing costs of investing in other mutual funds.
Analyzing Your Fund's Expenses
To illustrate these ongoing costs, we have provided examples and calculated the expenses paid by investors in each share class of the Fund during the period. The actual and hypothetical information in the table is based on an initial investment of $1,000 at the beginning of the period indicated and held for the entire period. Expense information is calculated two ways and each method provides you with different information. The amount listed in the "Actual" column is calculated using the Fund's actual operating expenses and total return for the period. You may use the Actual information, together with the amount invested, to estimate the expenses that you paid over the period. Simply divide your account value by $1,000 (for example, an $8,600 account value divided by $1,000 = 8.6), then multiply the results by the expenses paid during the period under the "Actual" column. The amount listed in the "Hypothetical" column assumes a 5% annual rate of return before expenses (which is not the Fund's actual return) and then applies the Fund's actual expense ratio for the period to the hypothetical return. You should not use the hypothetical account values and expenses to estimate either your actual account balance at the end of the period or the expenses you paid during the period. See "Compare With Other Funds" below for details on how to use the hypothetical data.
Compare With Other Funds
Since all mutual funds are required to include the same hypothetical calculations about expenses in shareholder reports, you can use this information to compare the ongoing cost of investing in the Fund with other funds. To do so, compare the hypothetical example with the 5% hypothetical examples that appear in the shareholder reports of other funds. As you compare hypothetical examples of other funds, it is important to note that hypothetical examples are meant to highlight the ongoing costs of investing in a fund only and do not reflect any transaction costs, such as sales charges, or redemption or exchange fees. Therefore, the hypothetical calculations are useful in comparing ongoing costs only, and will not help you determine the relative total costs of owning different funds. If transaction costs were included in these calculations, your costs would be higher.
March 1, 2015 – August 31, 2015
| | | Account Value at the Beginning
of the Period ($) | | Account Value at the End of the
Period ($) | | Expenses Paid During the
Period ($) | | Fund's Annualized
Expense Ratio (%) | |
| | | Actual | | Hypothetical | | Actual | | Hypothetical | | Actual | | Hypothetical | | Actual | |
Class A | | | 1,000.00 | | | | 1,000.00 | | | | 1,019.50 | | | | 1,018.45 | | | | 6.96 | | | | 6.96 | | | | 1.36 | | |
Class B | | | 1,000.00 | | | | 1,000.00 | | | | 1,015.50 | | | | 1,014.65 | | | | 10.78 | | | | 10.77 | | | | 2.11 | | |
Class C | | | 1,000.00 | | | | 1,000.00 | | | | 1,015.90 | | | | 1,014.65 | | | | 10.78 | | | | 10.77 | | | | 2.11 | | |
Class I | | | 1,000.00 | | | | 1,000.00 | | | | 1,022.10 | | | | 1,020.68 | | | | 4.71 | | | | 4.71 | | | | 0.92 | | |
Class K | | | 1,000.00 | | | | 1,000.00 | | | | 1,020.50 | | | | 1,019.16 | | | | 6.25 | | | | 6.24 | | | | 1.22 | | |
Class R | | | 1,000.00 | | | | 1,000.00 | | | | 1,018.50 | | | | 1,017.18 | | | | 8.24 | | | | 8.23 | | | | 1.61 | | |
Class R4 | | | 1,000.00 | | | | 1,000.00 | | | | 1,021.00 | | | | 1,019.72 | | | | 5.69 | | | | 5.68 | | | | 1.11 | | |
Class R5 | | | 1,000.00 | | | | 1,000.00 | | | | 1,021.80 | | | | 1,020.43 | | | | 4.97 | | | | 4.97 | | | | 0.97 | | |
Class Y | | | 1,000.00 | | | | 1,000.00 | | | | 1,021.70 | | | | 1,020.68 | | | | 4.71 | | | | 4.71 | | | | 0.92 | | |
Class Z | | | 1,000.00 | | | | 1,000.00 | | | | 1,020.80 | | | | 1,019.72 | | | | 5.68 | | | | 5.68 | | | | 1.11 | | |
Expenses paid during the period are equal to the annualized expense ratio for each class as indicated above, multiplied by the average account value over the period and then multiplied by the number of days in the Fund's most recent fiscal half year and divided by 365.
Expenses do not include fees and expenses incurred indirectly by the Fund from its investment in underlying funds, including affiliated and non-affiliated pooled investment vehicles, such as mutual funds and exchange-traded funds.
Annual Report 2015
7
COLUMBIA SMALL CAP GROWTH FUND I
PORTFOLIO OF INVESTMENTS
August 31, 2015
(Percentages represent value of investments compared to net assets)
Common Stocks 97.8%
Issuer | | Shares | | Value ($) | |
CONSUMER DISCRETIONARY 18.4% | |
Hotels, Restaurants & Leisure 10.6% | |
Bojangles', Inc.(a) | | | 83,438 | | | | 1,737,179 | | |
Buffalo Wild Wings, Inc.(a) | | | 14,200 | | | | 2,693,456 | | |
Chuy's Holdings, Inc.(a) | | | 138,800 | | | | 4,252,832 | | |
Domino's Pizza, Inc. | | | 47,617 | | | | 5,044,545 | | |
Fiesta Restaurant Group, Inc.(a) | | | 83,559 | | | | 4,314,987 | | |
Habit Restaurants, Inc. (The), Class A(a) | | | 195,400 | | | | 4,869,368 | | |
Marriott Vacations Worldwide Corp. | | | 58,400 | | | | 4,146,984 | | |
Papa John's International, Inc. | | | 31,500 | | | | 2,118,375 | | |
Planet Fitness, Inc., Class A(a) | | | 139,825 | | | | 2,490,283 | | |
Red Robin Gourmet Burgers, Inc.(a) | | | 62,100 | | | | 4,892,859 | | |
Six Flags Entertainment Corp. | | | 145,680 | | | | 6,551,230 | | |
Sonic Corp. | | | 130,400 | | | | 3,520,800 | | |
Texas Roadhouse, Inc. | | | 79,800 | | | | 2,872,002 | | |
Wingstop, Inc.(a) | | | 55,003 | | | | 1,504,882 | | |
Zoe's Kitchen, Inc.(a) | | | 63,400 | | | | 2,189,836 | | |
Total | | | | | 53,199,618 | | |
Household Durables 0.4% | |
TopBuild Corp.(a) | | | 55,700 | | | | 1,766,804 | | |
Internet & Catalog Retail 0.6% | |
Liberty TripAdvisor Holdings, Inc.,
Class A(a) | | | 125,000 | | | | 3,171,250 | | |
Leisure Products 1.3% | |
Smith & Wesson Holding Corp.(a) | | | 353,500 | | | | 6,391,280 | | |
Media 2.0% | |
Eros International PLC(a) | | | 258,316 | | | | 8,555,426 | | |
IMAX Corp.(a) | | | 55,400 | | | | 1,736,790 | | |
Total | | | | | 10,292,216 | | |
Specialty Retail 2.1% | |
DSW, Inc., Class A | | | 141,700 | | | | 4,207,073 | | |
Lithia Motors, Inc., Class A | | | 38,100 | | | | 4,061,460 | | |
Tile Shop Holdings, Inc.(a) | | | 206,200 | | | | 2,453,780 | | |
Total | | | | | 10,722,313 | | |
Textiles, Apparel & Luxury Goods 1.4% | |
Skechers U.S.A., Inc., Class A(a) | | | 51,400 | | | | 7,234,036 | | |
Total Consumer Discretionary | | | | | 92,777,517 | | |
CONSUMER STAPLES 2.0% | |
Food & Staples Retailing 2.0% | |
Smart & Final Stores, Inc.(a) | | | 335,178 | | | | 5,463,401 | | |
Common Stocks (continued)
Issuer | | Shares | | Value ($) | |
Sprouts Farmers Market, Inc.(a) | | | 234,200 | | | | 4,770,654 | | |
Total | | | | | 10,234,055 | | |
Total Consumer Staples | | | | | 10,234,055 | | |
ENERGY 2.9% | |
Energy Equipment & Services 0.7% | |
US Silica Holdings, Inc. | | | 163,600 | | | | 3,288,360 | | |
Oil, Gas & Consumable Fuels 2.2% | |
Carrizo Oil & Gas, Inc.(a) | | | 93,914 | | | | 3,421,287 | | |
Matador Resources Co.(a) | | | 248,100 | | | | 5,683,971 | | |
Western Refining, Inc. | | | 48,500 | | | | 2,086,470 | | |
Total | | | | | 11,191,728 | | |
Total Energy | | | | | 14,480,088 | | |
FINANCIALS 7.4% | |
Banks 1.8% | |
Webster Financial Corp. | | | 251,900 | | | | 8,912,222 | | |
Capital Markets 0.5% | |
HFF, Inc., Class A | | | 68,300 | | | | 2,481,339 | | |
Consumer Finance 0.8% | |
PRA Group, Inc.(a) | | | 72,778 | | | | 3,878,340 | | |
Diversified Financial Services 0.5% | |
MarkeTaxess Holdings, Inc. | | | 27,300 | | | | 2,468,466 | | |
Real Estate Investment Trusts (REITs) 2.9% | |
CyrusOne, Inc. | | | 69,848 | | | | 2,211,387 | | |
Sovran Self Storage, Inc. | | | 106,800 | | | | 9,583,164 | | |
STORE Capital Corp. | | | 135,392 | | | | 2,729,503 | | |
Total | | | | | 14,524,054 | | |
Thrifts & Mortgage Finance 0.9% | |
Radian Group, Inc. | | | 263,700 | | | | 4,741,326 | | |
Total Financials | | | | | 37,005,747 | | |
HEALTH CARE 26.9% | |
Biotechnology 9.4% | |
AMAG Pharmaceuticals, Inc.(a) | | | 48,800 | | | | 3,051,952 | | |
Anacor Pharmaceuticals, Inc.(a) | | | 26,900 | | | | 3,508,029 | | |
Arena Pharmaceuticals, Inc.(a) | | | 235,600 | | | | 638,476 | | |
ARIAD Pharmaceuticals, Inc.(a) | | | 97,400 | | | | 919,456 | | |
Arrowhead Research Corp.(a) | | | 148,100 | | | | 878,233 | | |
Bluebird Bio, Inc.(a) | | | 10,300 | | | | 1,370,621 | | |
Blueprint Medicines Corp.(a) | | | 68,959 | | | | 1,886,718 | | |
The accompanying Notes to Financial Statements are an integral part of this statement.
Annual Report 2015
8
COLUMBIA SMALL CAP GROWTH FUND I
PORTFOLIO OF INVESTMENTS (continued)
August 31, 2015
Common Stocks (continued)
Issuer | | Shares | | Value ($) | |
Celldex Therapeutics, Inc.(a) | | | 70,200 | | | | 1,041,768 | | |
Clovis Oncology, Inc.(a) | | | 26,000 | | | | 2,024,360 | | |
Curis, Inc.(a) | | | 447,200 | | | | 1,171,664 | | |
Dyax Corp.(a) | | | 114,900 | | | | 2,644,998 | | |
Dynavax Technologies Corp.(a) | | | 88,291 | | | | 2,503,933 | | |
Exelixis, Inc.(a) | | | 164,300 | | | | 977,585 | | |
Heron Therapeutics, Inc.(a) | | | 67,518 | | | | 2,596,742 | | |
Insmed, Inc.(a) | | | 47,700 | | | | 1,165,788 | | |
Insys Therapeutics, Inc.(a) | | | 53,700 | | | | 1,740,954 | | |
Keryx Biopharmaceuticals, Inc.(a) | | | 107,700 | | | | 665,586 | | |
Merrimack Pharmaceuticals, Inc.(a) | | | 102,000 | | | | 1,029,180 | | |
Neurocrine Biosciences, Inc.(a) | | | 53,100 | | | | 2,462,778 | | |
Novavax, Inc.(a) | | | 425,463 | | | | 4,582,236 | | |
PTC Therapeutics, Inc.(a) | | | 11,600 | | | | 443,004 | | |
Spark Therapeutics, Inc.(a) | | | 16,741 | | | | 730,075 | | |
TESARO, Inc.(a) | | | 44,896 | | | | 2,311,246 | | |
Tokai Pharmaceuticals, Inc.(a) | | | 103,600 | | | | 1,223,516 | | |
Ultragenyx Pharmaceutical, Inc.(a) | | | 40,446 | | | | 4,514,583 | | |
vTv Therapeutics, Inc., Class A(a) | | | 156,725 | | | | 1,366,642 | | |
Total | | | | | 47,450,123 | | |
Health Care Equipment & Supplies 3.5% | |
Align Technology, Inc.(a) | | | 185,746 | | | | 10,513,224 | | |
ICU Medical, Inc.(a) | | | 41,100 | | | | 4,665,672 | | |
Natus Medical, Inc.(a) | | | 62,914 | | | | 2,559,341 | | |
Total | | | | | 17,738,237 | | |
Health Care Providers & Services 6.6% | |
Air Methods Corp.(a) | | | 88,600 | | | | 3,318,070 | | |
Amsurg Corp.(a) | | | 15,500 | | | | 1,215,510 | | |
Diplomat Pharmacy, Inc.(a) | | | 54,886 | | | | 2,167,448 | | |
HealthEquity, Inc.(a) | | | 156,632 | | | | 4,592,450 | | |
HealthSouth Corp. | | | 116,700 | | | | 4,983,090 | | |
LHC Group, Inc.(a) | | | 37,412 | | | | 1,619,940 | | |
Molina Healthcare, Inc.(a) | | | 62,400 | | | | 4,654,416 | | |
Team Health Holdings, Inc.(a) | | | 135,063 | | | | 7,933,601 | | |
WellCare Health Plans, Inc.(a) | | | 30,600 | | | | 2,774,502 | | |
Total | | | | | 33,259,027 | | |
Health Care Technology 1.9% | |
HealthStream, Inc.(a) | | | 104,900 | | | | 2,606,765 | | |
Medidata Solutions, Inc.(a) | | | 51,700 | | | | 2,482,634 | | |
Common Stocks (continued)
Issuer | | Shares | | Value ($) | |
Veeva Systems Inc., Class A(a) | | | 166,600 | | | | 4,314,940 | | |
Total | | | | | 9,404,339 | | |
Life Sciences Tools & Services 1.4% | |
ICON PLC(a) | | | 60,974 | | | | 4,694,998 | | |
INC Research Holdings, Inc. Class A(a) | | | 53,505 | | | | 2,194,240 | | |
Total | | | | | 6,889,238 | | |
Pharmaceuticals 4.1% | |
Aerie Pharmaceuticals, Inc.(a) | | | 151,400 | | | | 2,393,634 | | |
Akorn, Inc.(a) | | | 203,600 | | | | 8,101,244 | | |
Catalent, Inc.(a) | | | 137,767 | | | | 4,379,613 | | |
Flex Pharma, Inc.(a) | | | 105,308 | | | | 1,266,855 | | |
Phibro Animal Health Corp., Class A | | | 130,766 | | | | 4,616,040 | | |
Total | | | | | 20,757,386 | | |
Total Health Care | | | | | 135,498,350 | | |
INDUSTRIALS 11.5% | |
Aerospace & Defense 1.2% | |
Teledyne Technologies, Inc.(a) | | | 58,700 | | | | 5,747,317 | | |
Airlines 2.2% | |
Alaska Air Group, Inc. | | | 66,542 | | | | 4,981,334 | | |
Allegiant Travel Co. | | | 31,000 | | | | 6,301,060 | | |
Total | | | | | 11,282,394 | | |
Commercial Services & Supplies 1.1% | |
ARC Document Solutions, Inc.(a) | | | 479,000 | | | | 3,180,560 | | |
MiX Telematics Ltd., ADR(a) | | | 342,908 | | | | 2,084,881 | | |
Total | | | | | 5,265,441 | | |
Electrical Equipment 1.4% | |
EnerSys | | | 60,800 | | | | 3,250,976 | | |
Generac Holdings, Inc.(a) | | | 127,500 | | | | 3,942,300 | | |
Total | | | | | 7,193,276 | | |
Machinery 2.5% | |
John Bean Technologies Corp. | | | 72,455 | | | | 2,399,710 | | |
Mueller Water Products, Inc., Class A | | | 598,300 | | | | 5,354,785 | | |
Watts Water Technologies, Inc., Class A | | | 89,500 | | | | 4,909,075 | | |
Total | | | | | 12,663,570 | | |
Professional Services 2.3% | |
CEB, Inc. | | | 114,600 | | | | 8,207,652 | | |
Wageworks, Inc.(a) | | | 77,800 | | | | 3,486,218 | | |
Total | | | | | 11,693,870 | | |
The accompanying Notes to Financial Statements are an integral part of this statement.
Annual Report 2015
9
COLUMBIA SMALL CAP GROWTH FUND I
PORTFOLIO OF INVESTMENTS (continued)
August 31, 2015
Common Stocks (continued)
Issuer | | Shares | | Value ($) | |
Road & Rail 0.8% | |
Swift Transportation Co.(a) | | | 213,737 | | | | 4,165,734 | | |
Total Industrials | | | | | 58,011,602 | | |
INFORMATION TECHNOLOGY 23.6% | |
Communications Equipment 1.5% | |
Arris Group, Inc.(a) | | | 88,000 | | | | 2,324,960 | | |
Infinera Corp.(a) | | | 64,700 | | | | 1,411,754 | | |
Netscout Systems, Inc.(a) | | | 97,900 | | | | 3,578,245 | | |
Total | | | | | 7,314,959 | | |
Electronic Equipment, Instruments & Components 1.4% | |
Littelfuse, Inc. | | | 50,800 | | | | 4,559,300 | | |
Methode Electronics, Inc. | | | 101,100 | | | | 2,686,227 | | |
Total | | | | | 7,245,527 | | |
Internet Software & Services 2.9% | |
comScore, Inc.(a) | | | 133,400 | | | | 6,964,814 | | |
Cvent, Inc.(a) | | | 69,300 | | | | 2,185,722 | | |
j2 Global, Inc. | | | 36,400 | | | | 2,532,712 | | |
LogMeIn, Inc.(a) | | | 48,300 | | | | 3,011,022 | | |
Total | | | | | 14,694,270 | | |
IT Services 3.6% | |
CoreLogic, Inc.(a) | | | 162,600 | | | | 6,170,670 | | |
Euronet Worldwide, Inc.(a) | | | 152,100 | | | | 9,805,887 | | |
MAXIMUS, Inc. | | | 39,100 | | | | 2,367,505 | | |
Total | | | | | 18,344,062 | | |
Semiconductors & Semiconductor Equipment 4.0% | |
Cavium, Inc.(a) | | | 52,700 | | | | 3,584,654 | | |
Microsemi Corp.(a) | | | 148,100 | | | | 4,703,656 | | |
Monolithic Power Systems, Inc. | | | 52,300 | | | | 2,515,107 | | |
Power Integrations, Inc. | | | 76,400 | | | | 2,998,700 | | |
Rambus, Inc.(a) | | | 215,900 | | | | 2,899,537 | | |
Silicon Laboratories, Inc.(a) | | | 80,400 | | | | 3,495,792 | | |
Total | | | | | 20,197,446 | | |
Software 9.1% | |
A10 Networks, Inc.(a) | | | 597,768 | | | | 3,969,180 | | |
Aspen Technology, Inc.(a) | | | 52,039 | | | | 1,970,717 | | |
Barracuda Networks, Inc.(a) | | | 166,397 | | | | 4,374,577 | | |
Common Stocks (continued)
Issuer | | Shares | | Value ($) | |
BroadSoft, Inc.(a) | | | 84,400 | | | | 2,663,664 | | |
Fortinet, Inc.(a) | | | 140,500 | | | | 5,920,670 | | |
Guidewire Software, Inc.(a) | | | 110,400 | | | | 6,172,464 | | |
Manhattan Associates, Inc.(a) | | | 76,600 | | | | 4,479,568 | | |
PTC, Inc.(a) | | | 243,400 | | | | 8,061,408 | | |
QLIK Technologies, Inc.(a) | | | 210,900 | | | | 7,984,674 | | |
Total | | | | | 45,596,922 | | |
Technology Hardware, Storage & Peripherals 1.1% | |
Electronics for Imaging, Inc.(a) | | | 122,200 | | | | 5,348,694 | | |
Total Information Technology | | | | | 118,741,880 | | |
MATERIALS 5.1% | |
Chemicals 1.3% | |
Innospec, Inc. | | | 75,900 | | | | 3,726,690 | | |
PolyOne Corp. | | | 85,300 | | | | 2,769,691 | | |
Total | | | | | 6,496,381 | | |
Construction Materials 2.6% | |
Eagle Materials, Inc. | | | 54,600 | | | | 4,467,918 | | |
Headwaters, Inc.(a) | | | 239,400 | | | | 4,831,092 | | |
US Concrete, Inc.(a) | | | 73,400 | | | | 3,800,652 | | |
Total | | | | | 13,099,662 | | |
Paper & Forest Products 1.2% | |
Clearwater Paper Corp.(a) | | | 107,623 | | | | 6,033,345 | | |
Total Materials | | | | | 25,629,388 | | |
Total Common Stocks
(Cost: $425,665,044) | | | | | 492,378,627 | | |
Money Market Funds 2.3%
| | | Shares | | Value ($) | |
Columbia Short-Term Cash Fund,
0.150%(b)(c) | | | 11,368,067 | | | | 11,368,067 | | |
Total Money Market Funds
(Cost: $11,368,067) | | | | | 11,368,067 | | |
Total Investments
(Cost: $437,033,111) | | | | | 503,746,694 | | |
Other Assets & Liabilities, Net | | | | | (506,278 | ) | |
Net Assets | | | | | 503,240,416 | | |
The accompanying Notes to Financial Statements are an integral part of this statement.
Annual Report 2015
10
COLUMBIA SMALL CAP GROWTH FUND I
PORTFOLIO OF INVESTMENTS (continued)
August 31, 2015
Notes to Portfolio of Investments
(a) Non-income producing investment.
(b) The rate shown is the seven-day current annualized yield at August 31, 2015.
(c) As defined in the Investment Company Act of 1940, an affiliated company is one in which the Fund owns 5% or more of the company's outstanding voting securities, or a company which is under common ownership or control with the Fund. Holdings and transactions in these affiliated companies during the year ended August 31, 2015 are as follows:
Issuer | | Beginning
Cost ($) | | Purchase
Cost ($) | | Proceeds
From Sales ($) | | Ending
Cost ($) | | Dividends —
Affiliated
Issuers ($) | | Value ($) | |
Columbia Short-Term Cash Fund | | | 20,000,963 | | | | 460,489,490 | | | | (469,122,386 | ) | | | 11,368,067 | | | | 13,389 | | | | 11,368,067 | | |
Abbreviation Legend
ADR American Depositary Receipt
Fair Value Measurements
The Fund categorizes its fair value measurements according to a three-level hierarchy that maximizes the use of observable inputs and minimizes the use of unobservable inputs by prioritizing that the most observable input be used when available. Observable inputs are those that market participants would use in pricing an investment based on market data obtained from sources independent of the reporting entity. Unobservable inputs are those that reflect the Fund's assumptions about the information market participants would use in pricing an investment. An investment's level within the fair value hierarchy is based on the lowest level of any input that is deemed significant to the asset's or liability's fair value measurement. The input levels are not necessarily an indication of the risk or liquidity associated with investments at that level. For example, certain U.S. government securities are generally high quality and liquid, however, they are reflected as Level 2 because the inputs used to determine fair value may not always be quoted prices in an active market.
Fair value inputs are summarized in the three broad levels listed below:
> Level 1 — Valuations based on quoted prices for investments in active markets that the Fund has the ability to access at the measurement date (including NAV for open-end mutual funds). Valuation adjustments are not applied to Level 1 investments.
> Level 2 — Valuations based on other significant observable inputs (including quoted prices for similar securities, interest rates, prepayment speeds, credit risks, etc.).
> Level 3 — Valuations based on significant unobservable inputs (including the Fund's own assumptions and judgment in determining the fair value of investments).
Inputs that are used in determining fair value of an investment may include price information, credit data, volatility statistics, and other factors. These inputs can be either observable or unobservable. The availability of observable inputs can vary between investments, and is affected by various factors such as the type of investment, and the volume and level of activity for that investment or similar investments in the marketplace. The inputs will be considered by the Investment Manager, along with any other relevant factors in the calculation of an investment's fair value. The Fund uses prices and inputs that are current as of the measurement date, which may include periods of market dislocations. During these periods, the availability of prices and inputs may be reduced for many investments. This condition could cause an investment to be reclassified between the various levels within the hierarchy.
Investments falling into the Level 3 category are primarily supported by quoted prices from brokers and dealers participating in the market for those investments. However, these may be classified as Level 3 investments due to lack of market transparency and corroboration to support these quoted prices. Additionally, valuation models may be used as the pricing source for any remaining investments classified as Level 3. These models may rely on one or more significant unobservable inputs and/or significant assumptions by the Investment Manager. Inputs used in valuations may include, but are not limited to, financial statement analysis, capital account balances, discount rates and estimated cash flows, and comparable company data.
Under the direction of the Fund's Board of Trustees (the Board), the Investment Manager's Valuation Committee (the Committee) is responsible for overseeing the valuation procedures approved by the Board. The Committee consists of voting and non-voting members from various groups within the Investment Manager's organization, including operations and accounting, trading and investments, compliance, risk management and legal.
The Committee meets at least monthly to review and approve valuation matters, which may include a description of specific valuation determinations, data regarding pricing information received from approved pricing vendors and brokers and the results of Board-approved valuation control policies and procedures (the Policies). The Policies address, among other things, instances when market quotations are or are not readily available, including recommendations of third party pricing vendors and a determination of appropriate pricing methodologies; events that require specific valuation determinations and assessment of fair value techniques; securities with a potential for stale pricing,
The accompanying Notes to Financial Statements are an integral part of this statement.
Annual Report 2015
11
COLUMBIA SMALL CAP GROWTH FUND I
PORTFOLIO OF INVESTMENTS (continued)
August 31, 2015
Fair Value Measurements (continued)
including those that are illiquid, restricted, or in default; and the effectiveness of third party pricing vendors, including periodic reviews of vendors. The Committee meets more frequently, as needed, to discuss additional valuation matters, which may include the need to review back-testing results, review time-sensitive information or approve related valuation actions. The Committee reports to the Board, with members of the Committee meeting with the Board at each of its regularly scheduled meetings to discuss valuation matters and actions during the period, similar to those described earlier.
For investments categorized as Level 3, the Committee monitors information similar to that described above, which may include: (i) data specific to the issuer or comparable issuers, (ii) general market or specific sector news and (iii) quoted prices and specific or similar security transactions. The Committee considers this data and any changes from prior periods in order to assess the reasonableness of observable and unobservable inputs, any assumptions or internal models used to value those securities and changes in fair value. This data is also used to corroborate, when available, information received from approved pricing vendors and brokers. Various factors impact the frequency of monitoring this information (which may occur as often as daily). However, the Committee may determine that changes to inputs, assumptions and models are not required as a result of the monitoring procedures performed.
The following table is a summary of the inputs used to value the Fund's investments at August 31, 2015:
| | | Level 1
Quoted Prices in Active
Markets for Identical
Assets ($) | | Level 2
Other Significant
Observable Inputs ($) | | Level 3
Significant
Unobservable Inputs ($) | | Total ($) | |
Investments | |
Common Stocks | |
Consumer Discretionary | | | 92,777,517 | | | | — | | | | — | | | | 92,777,517 | | |
Consumer Staples | | | 10,234,055 | | | | — | | | | — | | | | 10,234,055 | | |
Energy | | | 14,480,088 | | | | — | | | | — | | | | 14,480,088 | | |
Financials | | | 37,005,747 | | | | — | | | | — | | | | 37,005,747 | | |
Health Care | | | 135,498,350 | | | | — | | | | — | | | | 135,498,350 | | |
Industrials | | | 58,011,602 | | | | — | | | | — | | | | 58,011,602 | | |
Information Technology | | | 118,741,880 | | | | — | | | | — | | | | 118,741,880 | | |
Materials | | | 25,629,388 | | | | — | | | | — | | | | 25,629,388 | | |
Total Common Stocks | | | 492,378,627 | | | | — | | | | — | | | | 492,378,627 | | |
Money Market Funds | | | — | | | | 11,368,067 | | | | — | | | | 11,368,067 | | |
Total Investments | | | 492,378,627 | | | | 11,368,067 | | | | — | | | | 503,746,694 | | |
See the Portfolio of Investments for all investment classifications not indicated in the table.
The Fund's assets assigned to the Level 2 input category are generally valued using the market approach, in which a security's value is determined through reference to prices and information from market transactions for similar or identical assets.
Financial assets were transferred from Level 1 to Level 2 as the market for these assets is not considered publicly available. Fund per share market values were obtained using observable market inputs.
The following table shows transfers between Level 1 and Level 2 of the fair value hierarchy:
Transfers In | | Transfers Out | |
Level 1 ($) | | Level 2 ($) | | Level 1 ($) | | Level 2 ($) | |
| | — | | | | 20,000,963 | | | | 20,000,963 | | | | — | | |
Transfers between Level 1 and Level 2 are determined based on the fair value at the beginning of the period for security positions held throughout the period.
There were no transfers of financial assets between Levels 2 and 3 during the period.
The accompanying Notes to Financial Statements are an integral part of this statement.
Annual Report 2015
12
COLUMBIA SMALL CAP GROWTH FUND I
STATEMENT OF ASSETS AND LIABILITIES
August 31, 2015
Assets | |
Investments, at value | |
Unaffiliated issuers (identified cost $425,665,044) | | $ | 492,378,627 | | |
Affiliated issuers (identified cost $11,368,067) | | | 11,368,067 | | |
Total investments (identified cost $437,033,111) | | | 503,746,694 | | |
Cash | | | 306 | | |
Receivable for: | |
Investments sold | | | 3,512,039 | | |
Capital shares sold | | | 2,308,273 | | |
Dividends | | | 67,865 | | |
Prepaid expenses | | | 4,938 | | |
Trustees' deferred compensation plan | | | 87,284 | | |
Total assets | | | 509,727,399 | | |
Liabilities | |
Payable for: | |
Investments purchased | | | 5,544,683 | | |
Capital shares purchased | | | 614,617 | | |
Investment management fees | | | 33,046 | | |
Distribution and/or service fees | | | 5,802 | | |
Transfer agent fees | | | 74,225 | | |
Administration fees | | | 3,346 | | |
Plan administration fees | | | 9 | | |
Compensation of board members | | | 48,989 | | |
Chief compliance officer expenses | | | 46 | | |
Other expenses | | | 74,936 | | |
Trustees' deferred compensation plan | | | 87,284 | | |
Total liabilities | | | 6,486,983 | | |
Net assets applicable to outstanding capital stock | | $ | 503,240,416 | | |
Represented by | |
Paid-in capital | | $ | 276,451,642 | | |
Excess of distributions over net investment income | | | (1,336,691 | ) | |
Accumulated net realized gain | | | 161,411,882 | | |
Unrealized appreciation (depreciation) on: | |
Investments | | | 66,713,583 | | |
Total — representing net assets applicable to outstanding capital stock | | $ | 503,240,416 | | |
The accompanying Notes to Financial Statements are an integral part of this statement.
Annual Report 2015
13
COLUMBIA SMALL CAP GROWTH FUND I
STATEMENT OF ASSETS AND LIABILITIES (continued)
August 31, 2015
Class A | |
Net assets | | $ | 202,565,888 | | |
Shares outstanding | | | 7,441,268 | | |
Net asset value per share | | $ | 27.22 | | |
Maximum offering price per share(a) | | $ | 28.88 | | |
Class B | |
Net assets | | $ | 1,517,139 | | |
Shares outstanding | | | 61,016 | | |
Net asset value per share | | $ | 24.86 | | |
Class C | |
Net assets | | $ | 16,809,716 | | |
Shares outstanding | | | 676,002 | | |
Net asset value per share | | $ | 24.87 | | |
Class I | |
Net assets | | $ | 48,780,215 | | |
Shares outstanding | | | 1,725,395 | | |
Net asset value per share | | $ | 28.27 | | |
Class K | |
Net assets | | $ | 41,319 | | |
Shares outstanding | | | 1,482 | | |
Net asset value per share(b) | | $ | 27.89 | | |
Class R | |
Net assets | | $ | 1,705,500 | | |
Shares outstanding | | | 63,201 | | |
Net asset value per share | | $ | 26.99 | | |
Class R4 | |
Net assets | | $ | 69,036 | | |
Shares outstanding | | | 2,406 | | |
Net asset value per share | | $ | 28.69 | | |
Class R5 | |
Net assets | | $ | 11,990,323 | | |
Shares outstanding | | | 426,620 | | |
Net asset value per share | | $ | 28.11 | | |
Class Y | |
Net assets | | $ | 3,822,800 | | |
Shares outstanding | | | 135,357 | | |
Net asset value per share | | $ | 28.24 | | |
The accompanying Notes to Financial Statements are an integral part of this statement.
Annual Report 2015
14
COLUMBIA SMALL CAP GROWTH FUND I
STATEMENT OF ASSETS AND LIABILITIES (continued)
August 31, 2015
Class Z | |
Net assets | | $ | 215,938,480 | | |
Shares outstanding | | | 7,716,769 | | |
Net asset value per share | | $ | 27.98 | | |
(a) The maximum offering price per share is calculated by dividing the net asset value per share by 1.0 minus the maximum sales charge of 5.75%.
(b) Net asset value per share rounds to this amount due to fractional shares outstanding.
The accompanying Notes to Financial Statements are an integral part of this statement.
Annual Report 2015
15
COLUMBIA SMALL CAP GROWTH FUND I
STATEMENT OF OPERATIONS
Year Ended August 31, 2015
Net investment income | |
Income: | |
Dividends — unaffiliated issuers | | $ | 2,778,682 | | |
Dividends — affiliated issuers | | | 13,389 | | |
Foreign taxes withheld | | | (14,165 | ) | |
Total income | | | 2,777,906 | | |
Expenses: | |
Investment management fees | | | 5,347,823 | | |
Distribution and/or service fees | |
Class A | | | 525,345 | | |
Class B | | | 21,888 | | |
Class C | | | 176,269 | | |
Class R | | | 9,950 | | |
Transfer agent fees | |
Class A | | | 431,780 | | |
Class B | | | 4,537 | | |
Class C | | | 36,216 | | |
Class K | | | 20 | | |
Class R | | | 4,101 | | |
Class R4 | | | 189 | | |
Class R5 | | | 4,535 | | |
Class Z | | | 808,945 | | |
Administration fees | | | 540,729 | | |
Plan administration fees | |
Class K | | | 100 | | |
Compensation of board members | | | 34,780 | | |
Custodian fees | | | 24,986 | | |
Printing and postage fees | | | 76,936 | | |
Registration fees | | | 111,200 | | |
Professional fees | | | 47,869 | | |
Chief compliance officer expenses | | | 329 | | |
Other | | | 32,117 | | |
Total expenses | | | 8,240,644 | | |
Expense reductions | | | (7,834 | ) | |
Total net expenses | | | 8,232,810 | | |
Net investment loss | | | (5,454,904 | ) | |
Realized and unrealized gain (loss) — net | |
Net realized gain (loss) on: | |
Investments | | | 187,014,108 | | |
Foreign currency translations | | | (1,164 | ) | |
Net realized gain | | | 187,012,944 | | |
Net change in unrealized appreciation (depreciation) on: | |
Investments | | | (107,098,517 | ) | |
Net change in unrealized depreciation | | | (107,098,517 | ) | |
Net realized and unrealized gain | | | 79,914,427 | | |
Net increase in net assets resulting from operations | | $ | 74,459,523 | | |
The accompanying Notes to Financial Statements are an integral part of this statement.
Annual Report 2015
16
COLUMBIA SMALL CAP GROWTH FUND I
STATEMENT OF CHANGES IN NET ASSETS
| | | Year Ended
August 31,
2015 | | Year Ended
August 31,
2014 | |
Operations | |
Net investment loss | | $ | (5,454,904 | ) | | $ | (8,953,804 | ) | |
Net realized gain | | | 187,012,944 | | | | 221,702,496 | | |
Net change in unrealized depreciation | | | (107,098,517 | ) | | | (154,639,421 | ) | |
Net increase in net assets resulting from operations | | | 74,459,523 | | | | 58,109,271 | | |
Distributions to shareholders | |
Net realized gains | |
Class A | | | (35,687,202 | ) | | | (39,108,125 | ) | |
Class B | | | (447,283 | ) | | | (586,455 | ) | |
Class C | | | (3,197,524 | ) | | | (3,537,546 | ) | |
Class I | | | (8,892,749 | ) | | | (14,193,780 | ) | |
Class K | | | (6,356 | ) | | | (7,689 | ) | |
Class R | | | (347,538 | ) | | | (506,567 | ) | |
Class R4 | | | (18,284 | ) | | | (80,948 | ) | |
Class R5 | | | (1,395,590 | ) | | | (304,366 | ) | |
Class Y | | | (760,513 | ) | | | (2,212,647 | ) | |
Class Z | | | (93,625,792 | ) | | | (151,266,634 | ) | |
Total distributions to shareholders | | | (144,378,831 | ) | | | (211,804,757 | ) | |
Decrease in net assets from capital stock activity | | | (462,207,963 | ) | | | (194,913,273 | ) | |
Proceeds from regulatory settlements (Note 6) | | | 2,181,933 | | | | — | | |
Increase from payment by affiliate (Note 7) | | | — | | | | 30,476 | | |
Total decrease in net assets | | | (529,945,338 | ) | | | (348,578,283 | ) | |
Net assets at beginning of year | | | 1,033,185,754 | | | | 1,381,764,037 | | |
Net assets at end of year | | $ | 503,240,416 | | | $ | 1,033,185,754 | | |
Excess of distributions over net investment income | | $ | (1,336,691 | ) | | $ | (5,834,528 | ) | |
The accompanying Notes to Financial Statements are an integral part of this statement.
Annual Report 2015
17
COLUMBIA SMALL CAP GROWTH FUND I
STATEMENT OF CHANGES IN NET ASSETS (continued)
| | | Year Ended August 31, 2015 | | Year Ended August 31, 2014 | |
| | | Shares | | Dollars ($) | | Shares | | Dollars ($) | |
Capital stock activity | |
Class A shares | |
Subscriptions(a) | | | 362,024 | | | | 9,427,704 | | | | 428,226 | | | | 13,792,504 | | |
Distributions reinvested | | | 1,240,559 | | | | 30,455,715 | | | | 1,078,480 | | | | 33,659,359 | | |
Redemptions | | | (1,531,621 | ) | | | (41,545,932 | ) | | | (1,761,759 | ) | | | (56,199,184 | ) | |
Net increase (decrease) | | | 70,962 | | | | (1,662,513 | ) | | | (255,053 | ) | | | (8,747,321 | ) | |
Class B shares | |
Subscriptions | | | 1,782 | | | | 41,107 | | | | 1,994 | | | | 60,818 | | |
Distributions reinvested | | | 17,537 | | | | 395,459 | | | | 18,325 | | | | 537,478 | | |
Redemptions(a) | | | (55,350 | ) | | | (1,388,961 | ) | | | (46,512 | ) | | | (1,376,009 | ) | |
Net decrease | | | (36,031 | ) | | | (952,395 | ) | | | (26,193 | ) | | | (777,713 | ) | |
Class C shares | |
Subscriptions | | | 36,712 | | | | 870,747 | | | | 39,925 | | | | 1,221,685 | | |
Distributions reinvested | | | 115,796 | | | | 2,611,190 | | | | 97,909 | | | | 2,871,685 | | |
Redemptions | | | (159,493 | ) | | | (4,035,891 | ) | | | (176,435 | ) | | | (5,195,132 | ) | |
Net decrease | | | (6,985 | ) | | | (553,954 | ) | | | (38,601 | ) | | | (1,101,762 | ) | |
Class I shares | |
Subscriptions | | | 200,109 | | | | 5,941,104 | | | | 708,290 | | | | 25,458,120 | | |
Distributions reinvested | | | 350,095 | | | | 8,892,421 | | | | 443,841 | | | | 14,189,583 | | |
Redemptions | | | (1,927,577 | ) | | | (57,525,171 | ) | | | (336,410 | ) | | | (11,801,003 | ) | |
Net increase (decrease) | | | (1,377,373 | ) | | | (42,691,646 | ) | | | 815,721 | | | | 27,846,700 | | |
Class K shares | |
Subscriptions | | | — | | | | — | | | | 290 | | | | 9,715 | | |
Distributions reinvested | | | 239 | | | | 5,994 | | | | 176 | | | | 5,604 | | |
Redemptions | | | — | | | | — | | | | (645 | ) | | | (19,765 | ) | |
Net increase (decrease) | | | 239 | | | | 5,994 | | | | (179 | ) | | | (4,446 | ) | |
Class R shares | |
Subscriptions | | | 12,190 | | | | 336,675 | | | | 21,902 | | | | 715,818 | | |
Distributions reinvested | | | 13,623 | | | | 332,117 | | | | 15,609 | | | | 485,754 | | |
Redemptions | | | (48,090 | ) | | | (1,336,240 | ) | | | (62,044 | ) | | | (1,995,578 | ) | |
Net decrease | | | (22,277 | ) | | | (667,448 | ) | | | (24,533 | ) | | | (794,006 | ) | |
Class R4 shares | |
Subscriptions | | | 1,118 | | | | 34,221 | | | | 4,821 | | | | 171,202 | | |
Distributions reinvested | | | 694 | | | | 17,911 | | | | 2,478 | | | | 80,486 | | |
Redemptions | | | (4,843 | ) | | | (136,597 | ) | | | (25,568 | ) | | | (908,018 | ) | |
Net decrease | | | (3,031 | ) | | | (84,465 | ) | | | (18,269 | ) | | | (656,330 | ) | |
Class R5 shares | |
Subscriptions | | | 428,294 | | | | 12,667,330 | | | | 158,905 | | | | 5,432,901 | | |
Distributions reinvested | | | 55,212 | | | | 1,395,209 | | | | 9,545 | | | | 303,146 | | |
Redemptions | | | (80,834 | ) | | | (2,232,192 | ) | | | (178,284 | ) | | | (5,268,360 | ) | |
Net increase (decrease) | | | 402,672 | | | | 11,830,347 | | | | (9,834 | ) | | | 467,687 | | |
The accompanying Notes to Financial Statements are an integral part of this statement.
Annual Report 2015
18
COLUMBIA SMALL CAP GROWTH FUND I
STATEMENT OF CHANGES IN NET ASSETS (continued)
| | | Year Ended August 31, 2015 | | Year Ended August 31, 2014 | |
| | | Shares | | Dollars ($) | | Shares | | Dollars ($) | |
Capital stock activity (continued) | |
Class Y shares | |
Subscriptions | | | 162,599 | | | | 4,739,379 | | | | 169,483 | | | | 5,009,648 | | |
Distributions reinvested | | | 29,938 | | | | 760,120 | | | | 69,217 | | | | 2,212,174 | | |
Redemptions | | | (205,912 | ) | | | (5,532,176 | ) | | | (524,663 | ) | | | (16,131,735 | ) | |
Net decrease | | | (13,375 | ) | | | (32,677 | ) | | | (285,963 | ) | | | (8,909,913 | ) | |
Class Z shares | |
Subscriptions | | | 1,039,444 | | | | 28,864,010 | | | | 2,738,201 | | | | 91,592,400 | | |
Distributions reinvested | | | 2,585,855 | | | | 65,137,683 | | | | 2,963,509 | | | | 94,269,227 | | |
Redemptions | | | (19,013,407 | ) | | | (521,400,899 | ) | | | (12,162,480 | ) | | | (388,097,796 | ) | |
Net decrease | | | (15,388,108 | ) | | | (427,399,206 | ) | | | (6,460,770 | ) | | | (202,236,169 | ) | |
Total net decrease | | | (16,373,307 | ) | | | (462,207,963 | ) | | | (6,303,674 | ) | | | (194,913,273 | ) | |
(a) Includes conversions of Class B shares to Class A shares, if any.
The accompanying Notes to Financial Statements are an integral part of this statement.
Annual Report 2015
19
COLUMBIA SMALL CAP GROWTH FUND I
The following tables are intended to help you understand the Fund's financial performance. Certain information reflects financial results for a single share of a class held for the periods shown. Per share net investment income (loss) amounts are calculated based on average shares outstanding during the period. Total return assumes reinvestment of all dividends and distributions, if any. Total return does not reflect payment of sales charges, if any. Total return and portfolio turnover are not annualized for periods of less than one year. The portfolio turnover rate is calculated without regard to purchase and sales transactions of short-term instruments and certain derivatives, if any. If such transactions were included, the Fund's portfolio turnover rate may be higher.
| | | Year Ended August 31, | |
Class A | | 2015 | | 2014 | | 2013 | | 2012 | | 2011 | |
Per share data | |
Net asset value, beginning of period | | $ | 29.40 | | | $ | 33.32 | | | $ | 29.55 | | | $ | 29.94 | | | $ | 23.55 | | |
Income from investment operations: | |
Net investment loss | | | (0.27 | ) | | | (0.28 | ) | | | (0.23 | ) | | | (0.15 | ) | | | (0.31 | ) | |
Net realized and unrealized gain | | | 3.09 | | | | 1.71 | | | | 6.90 | | | | 2.56 | | | | 6.70 | | |
Total from investment operations | | | 2.82 | | | | 1.43 | | | | 6.67 | | | | 2.41 | | | | 6.39 | | |
Less distributions to shareholders: | |
Net realized gains | | | (5.11 | ) | | | (5.35 | ) | | | (2.90 | ) | | | (2.80 | ) | | | — | | |
Total distributions to shareholders | | | (5.11 | ) | | | (5.35 | ) | | | (2.90 | ) | | | (2.80 | ) | | | — | | |
Proceeds from regulatory settlements | | | 0.11 | | | | — | | | | — | | | | — | | | | — | | |
Net asset value, end of period | | $ | 27.22 | | | $ | 29.40 | | | $ | 33.32 | | | $ | 29.55 | | | $ | 29.94 | | |
Total return | | | 11.87 | %(a) | | | 3.35 | % | | | 25.12 | % | | | 8.81 | % | | | 27.13 | % | |
Ratios to average net assets(b) | |
Total gross expenses | | | 1.36 | % | | | 1.30 | %(c) | | | 1.31 | % | | | 1.33 | % | | | 1.30 | % | |
Total net expenses(d) | | | 1.36 | %(e) | | | 1.30 | %(c)(e) | | | 1.31 | %(e) | | | 1.31 | %(e) | | | 1.30 | %(e) | |
Net investment loss | | | (0.98 | %) | | | (0.88 | %) | | | (0.74 | %) | | | (0.53 | %) | | | (1.00 | %) | |
Supplemental data | |
Net assets, end of period (in thousands) | | $ | 202,566 | | | $ | 216,670 | | | $ | 254,055 | | | $ | 61,032 | | | $ | 91,234 | | |
Portfolio turnover | | | 117 | % | | | 148 | % | | | 104 | % | | | 113 | % | | | 113 | % | |
Notes to Financial Highlights
(a) The Fund received proceeds from regulatory settlements. Had the Fund not received these proceeds, the total return would have been lower by 0.39%.
(b) In addition to the fees and expenses that the Fund bears directly, the Fund indirectly bears a pro rata share of the fees and expenses of any other funds in which it invests. Such indirect expenses are not included in the Fund's reported expense ratios.
(c) Ratios include line of credit interest expense which is less than 0.01%.
(d) Total net expenses include the impact of certain fee waivers/expense reimbursements made by the Investment Manager and certain of its affiliates, if applicable.
(e) The benefits derived from expense reductions had an impact of less than 0.01%.
The accompanying Notes to Financial Statements are an integral part of this statement.
Annual Report 2015
20
COLUMBIA SMALL CAP GROWTH FUND I
FINANCIAL HIGHLIGHTS (continued)
| | | Year Ended August 31, | |
Class B | | 2015 | | 2014 | | 2013 | | 2012 | | 2011 | |
Per share data | |
Net asset value, beginning of period | | $ | 27.47 | | | $ | 31.44 | | | $ | 28.19 | | | $ | 28.82 | | | $ | 22.84 | | |
Income from investment operations: | |
Net investment loss | | | (0.43 | ) | | | (0.49 | ) | | | (0.42 | ) | | | (0.35 | ) | | | (0.53 | ) | |
Net realized and unrealized gain | | | 2.83 | | | | 1.62 | | | | 6.52 | | | | 2.45 | | | | 6.51 | | |
Total from investment operations | | | 2.40 | | | | 1.13 | | | | 6.10 | | | | 2.10 | | | | 5.98 | | |
Less distributions to shareholders: | |
Net realized gains | | | (5.11 | ) | | | (5.10 | ) | | | (2.85 | ) | | | (2.73 | ) | | | — | | |
Total distributions to shareholders | | | (5.11 | ) | | | (5.10 | ) | | | (2.85 | ) | | | (2.73 | ) | | | — | | |
Proceeds from regulatory settlements | | | 0.10 | | | | — | | | | — | | | | — | | | | — | | |
Net asset value, end of period | | $ | 24.86 | | | $ | 27.47 | | | $ | 31.44 | | | $ | 28.19 | | | $ | 28.82 | | |
Total return | | | 11.02 | %(a) | | | 2.57 | % | | | 24.20 | % | | | 7.99 | % | | | 26.18 | % | |
Ratios to average net assets(b) | |
Total gross expenses | | | 2.11 | % | | | 2.05 | %(c) | | | 2.06 | % | | | 2.08 | % | | | 2.05 | % | |
Total net expenses(d) | | | 2.11 | %(e) | | | 2.05 | %(c)(e) | | | 2.06 | %(e) | | | 2.06 | %(e) | | | 2.05 | %(e) | |
Net investment loss | | | (1.71 | %) | | | (1.64 | %) | | | (1.46 | %) | | | (1.27 | %) | | | (1.76 | %) | |
Supplemental data | |
Net assets, end of period (in thousands) | | $ | 1,517 | | | $ | 2,666 | | | $ | 3,874 | | | $ | 1,428 | | | $ | 1,974 | | |
Portfolio turnover | | | 117 | % | | | 148 | % | | | 104 | % | | | 113 | % | | | 113 | % | |
Notes to Financial Highlights
(a) The Fund received proceeds from regulatory settlements. Had the Fund not received these proceeds, the total return would have been lower by 0.39%.
(b) In addition to the fees and expenses that the Fund bears directly, the Fund indirectly bears a pro rata share of the fees and expenses of any other funds in which it invests. Such indirect expenses are not included in the Fund's reported expense ratios.
(c) Ratios include line of credit interest expense which is less than 0.01%.
(d) Total net expenses include the impact of certain fee waivers/expense reimbursements made by the Investment Manager and certain of its affiliates, if applicable.
(e) The benefits derived from expense reductions had an impact of less than 0.01%.
The accompanying Notes to Financial Statements are an integral part of this statement.
Annual Report 2015
21
COLUMBIA SMALL CAP GROWTH FUND I
FINANCIAL HIGHLIGHTS (continued)
| | | Year Ended August 31, | |
Class C | | 2015 | | 2014 | | 2013 | | 2012 | | 2011 | |
Per share data | |
Net asset value, beginning of period | | $ | 27.47 | | | $ | 31.44 | | | $ | 28.19 | | | $ | 28.82 | | | $ | 22.84 | | |
Income from investment operations: | |
Net investment loss | | | (0.44 | ) | | | (0.49 | ) | | | (0.41 | ) | | | (0.35 | ) | | | (0.53 | ) | |
Net realized and unrealized gain | | | 2.85 | | | | 1.62 | | | | 6.51 | | | | 2.45 | | | | 6.51 | | |
Total from investment operations | | | 2.41 | | | | 1.13 | | | | 6.10 | | | | 2.10 | | | | 5.98 | | |
Less distributions to shareholders: | |
Net realized gains | | | (5.11 | ) | | | (5.10 | ) | | | (2.85 | ) | | | (2.73 | ) | | | — | | |
Total distributions to shareholders | | | (5.11 | ) | | | (5.10 | ) | | | (2.85 | ) | | | (2.73 | ) | | | — | | |
Proceeds from regulatory settlements | | | 0.10 | | | | — | | | | — | | | | — | | | | — | | |
Net asset value, end of period | | $ | 24.87 | | | $ | 27.47 | | | $ | 31.44 | | | $ | 28.19 | | | $ | 28.82 | | |
Total return | | | 11.07 | %(a) | | | 2.57 | % | | | 24.20 | % | | | 7.99 | % | | | 26.18 | % | |
Ratios to average net assets(b) | |
Total gross expenses | | | 2.11 | % | | | 2.05 | %(c) | | | 2.06 | % | | | 2.07 | % | | | 2.05 | % | |
Total net expenses(d) | | | 2.11 | %(e) | | | 2.05 | %(c)(e) | | | 2.06 | %(e) | | | 2.06 | %(e) | | | 2.05 | %(e) | |
Net investment loss | | | (1.72 | %) | | | (1.63 | %) | | | (1.42 | %) | | | (1.27 | %) | | | (1.75 | %) | |
Supplemental data | |
Net assets, end of period (in thousands) | | $ | 16,810 | | | $ | 18,762 | | | $ | 22,685 | | | $ | 11,287 | | | $ | 15,864 | | |
Portfolio turnover | | | 117 | % | | | 148 | % | | | 104 | % | | | 113 | % | | | 113 | % | |
Notes to Financial Highlights
(a) The Fund received proceeds from regulatory settlements. Had the Fund not received these proceeds, the total return would have been lower by 0.39%.
(b) In addition to the fees and expenses that the Fund bears directly, the Fund indirectly bears a pro rata share of the fees and expenses of any other funds in which it invests. Such indirect expenses are not included in the Fund's reported expense ratios.
(c) Ratios include line of credit interest expense which is less than 0.01%.
(d) Total net expenses include the impact of certain fee waivers/expense reimbursements made by the Investment Manager and certain of its affiliates, if applicable.
(e) The benefits derived from expense reductions had an impact of less than 0.01%.
The accompanying Notes to Financial Statements are an integral part of this statement.
Annual Report 2015
22
COLUMBIA SMALL CAP GROWTH FUND I
FINANCIAL HIGHLIGHTS (continued)
| | | Year Ended August 31, | |
Class I | | 2015 | | 2014 | | 2013 | | 2012 | | 2011(a) | |
Per share data | |
Net asset value, beginning of period | | $ | 30.21 | | | $ | 34.10 | | | $ | 30.09 | | | $ | 30.45 | | | $ | 26.86 | | |
Income from investment operations: | |
Net investment loss | | | (0.15 | ) | | | (0.14 | ) | | | (0.04 | ) | | | (0.02 | ) | | | (0.17 | ) | |
Net realized and unrealized gain | | | 3.19 | | | | 1.73 | | | | 6.99 | | | | 2.59 | | | | 3.76 | | |
Total from investment operations | | | 3.04 | | | | 1.59 | | | | 6.95 | | | | 2.57 | | | | 3.59 | | |
Less distributions to shareholders: | |
Net realized gains | | | (5.11 | ) | | | (5.49 | ) | | | (2.94 | ) | | | (2.93 | ) | | | — | | |
Total distributions to shareholders | | | (5.11 | ) | | | (5.49 | ) | | | (2.94 | ) | | | (2.93 | ) | | | — | | |
Proceeds from regulatory settlements | | | 0.13 | | | | — | | | | — | | | | — | | | | — | | |
Increase from payment by affiliate | | | — | | | | 0.01 | | | | — | | | | — | | | | — | | |
Net asset value, end of period | | $ | 28.27 | | | $ | 30.21 | | | $ | 34.10 | | | $ | 30.09 | | | $ | 30.45 | | |
Total return | | | 12.42 | %(b) | | | 3.82 | %(c) | | | 25.69 | % | | | 9.27 | % | | | 13.37 | % | |
Ratios to average net assets(d) | |
Total gross expenses | | | 0.91 | % | | | 0.86 | %(e) | | | 0.87 | % | | | 0.88 | % | | | 0.88 | %(f) | |
Total net expenses(g) | | | 0.91 | % | | | 0.86 | %(e) | | | 0.87 | % | | | 0.88 | % | | | 0.88 | %(f)(h) | |
Net investment loss | | | (0.52 | %) | | | (0.42 | %) | | | (0.12 | %) | | | (0.06 | %) | | | (0.57 | %)(f) | |
Supplemental data | |
Net assets, end of period (in thousands) | | $ | 48,780 | | | $ | 93,740 | | | $ | 77,983 | | | $ | 90,936 | | | $ | 90,132 | | |
Portfolio turnover | | | 117 | % | | | 148 | % | | | 104 | % | | | 113 | % | | | 113 | % | |
Notes to Financial Highlights
(a) Based on operations from September 27, 2010 (commencement of operations) through the stated period end.
(b) The Fund received proceeds from regulatory settlements. Had the Fund not received these proceeds, the total return would have been lower by 0.39%.
(c) The Fund received a payment from an affiliate. Had the Fund not received this payment, the total return would have been lower by 0.02%.
(d) In addition to the fees and expenses that the Fund bears directly, the Fund indirectly bears a pro rata share of the fees and expenses of any other funds in which it invests. Such indirect expenses are not included in the Fund's reported expense ratios.
(e) Ratios include line of credit interest expense which is less than 0.01%.
(f) Annualized.
(g) Total net expenses include the impact of certain fee waivers/expense reimbursements made by the Investment Manager and certain of its affiliates, if applicable.
(h) The benefits derived from expense reductions had an impact of less than 0.01%.
The accompanying Notes to Financial Statements are an integral part of this statement.
Annual Report 2015
23
COLUMBIA SMALL CAP GROWTH FUND I
FINANCIAL HIGHLIGHTS (continued)
| | | Year Ended August 31, | |
Class K | | 2015 | | 2014 | | 2013(a) | |
Per share data | |
Net asset value, beginning of period | | $ | 29.95 | | | $ | 33.85 | | | $ | 29.28 | | |
Income from investment operations: | |
Net investment loss | | | (0.23 | ) | | | (0.24 | ) | | | (0.11 | ) | |
Net realized and unrealized gain | | | 3.16 | | | | 1.74 | | | | 4.68 | | |
Total from investment operations | | | 2.93 | | | | 1.50 | | | | 4.57 | | |
Less distributions to shareholders: | |
Net realized gains | | | (5.11 | ) | | | (5.40 | ) | | | — | | |
Total distributions to shareholders | | | (5.11 | ) | | | (5.40 | ) | | | — | | |
Proceeds from regulatory settlements | | | 0.12 | �� | | | — | | | | — | | |
Net asset value, end of period | | $ | 27.89 | | | $ | 29.95 | | | $ | 33.85 | | |
Total return | | | 12.08 | %(b) | | | 3.51 | % | | | 15.61 | % | |
Ratios to average net assets(c) | |
Total gross expenses | | | 1.21 | % | | | 1.16 | %(d) | | | 1.16 | %(e) | |
Total net expenses(f) | | | 1.21 | % | | | 1.16 | %(d) | | | 1.16 | %(e) | |
Net investment loss | | | (0.83 | %) | | | (0.74 | %) | | | (0.68 | %)(e) | |
Supplemental data | |
Net assets, end of period (in thousands) | | $ | 41 | | | $ | 37 | | | $ | 48 | | |
Portfolio turnover | | | 117 | % | | | 148 | % | | | 104 | % | |
Notes to Financial Highlights
(a) Based on operations from February 28, 2013 (commencement of operations) through the stated period end.
(b) The Fund received proceeds from regulatory settlements. Had the Fund not received these proceeds, the total return would have been lower by 0.39%.
(c) In addition to the fees and expenses that the Fund bears directly, the Fund indirectly bears a pro rata share of the fees and expenses of any other funds in which it invests. Such indirect expenses are not included in the Fund's reported expense ratios.
(d) Ratios include line of credit interest expense which is less than 0.01%.
(e) Annualized.
(f) Total net expenses include the impact of certain fee waivers/expense reimbursements made by the Investment Manager and certain of its affiliates, if applicable.
The accompanying Notes to Financial Statements are an integral part of this statement.
Annual Report 2015
24
COLUMBIA SMALL CAP GROWTH FUND I
FINANCIAL HIGHLIGHTS (continued)
| | | Year Ended August 31, | |
Class R | | 2015 | | 2014 | | 2013 | | 2012 | | 2011(a) | |
Per share data | |
Net asset value, beginning of period | | $ | 29.25 | | | $ | 33.18 | | | $ | 29.47 | | | $ | 29.88 | | | $ | 26.52 | | |
Income from investment operations: | |
Net investment loss | | | (0.33 | ) | | | (0.36 | ) | | | (0.35 | ) | | | (0.21 | ) | | | (0.35 | ) | |
Net realized and unrealized gain | | | 3.07 | | | | 1.70 | | | | 6.93 | | | | 2.53 | | | | 3.71 | | |
Total from investment operations | | | 2.74 | | | | 1.34 | | | | 6.58 | | | | 2.32 | | | | 3.36 | | |
Less distributions to shareholders: | |
Net realized gains | | | (5.11 | ) | | | (5.27 | ) | | | (2.87 | ) | | | (2.73 | ) | | | — | | |
Total distributions to shareholders | | | (5.11 | ) | | | (5.27 | ) | | | (2.87 | ) | | | (2.73 | ) | | | — | | |
Proceeds from regulatory settlements | | | 0.11 | | | | — | | | | — | | | | — | | | | — | | |
Net asset value, end of period | | $ | 26.99 | | | $ | 29.25 | | | $ | 33.18 | | | $ | 29.47 | | | $ | 29.88 | | |
Total return | | | 11.63 | %(b) | | | 3.08 | % | | | 24.85 | % | | | 8.48 | % | | | 12.67 | % | |
Ratios to average net assets(c) | |
Total gross expenses | | | 1.61 | % | | | 1.55 | %(d) | | | 1.56 | % | | | 1.57 | % | | | 1.55 | %(e) | |
Total net expenses(f) | | | 1.61 | %(g) | | | 1.55 | %(d)(g) | | | 1.56 | %(g) | | | 1.56 | %(g) | | | 1.54 | %(e)(g) | |
Net investment loss | | | (1.22 | %) | | | (1.13 | %) | | | (1.11 | %) | | | (0.74 | %) | | | (1.16 | %)(e) | |
Supplemental data | |
Net assets, end of period (in thousands) | | $ | 1,706 | | | $ | 2,500 | | | $ | 3,650 | | | $ | 54 | | | $ | 55 | | |
Portfolio turnover | | | 117 | % | | | 148 | % | | | 104 | % | | | 113 | % | | | 113 | % | |
Notes to Financial Highlights
(a) Based on operations from September 27, 2010 (commencement of operations) through the stated period end.
(b) The Fund received proceeds from regulatory settlements. Had the Fund not received these proceeds, the total return would have been lower by 0.39%.
(c) In addition to the fees and expenses that the Fund bears directly, the Fund indirectly bears a pro rata share of the fees and expenses of any other funds in which it invests. Such indirect expenses are not included in the Fund's reported expense ratios.
(d) Ratios include line of credit interest expense which is less than 0.01%.
(e) Annualized.
(f) Total net expenses include the impact of certain fee waivers/expense reimbursements made by the Investment Manager and certain of its affiliates, if applicable.
(g) The benefits derived from expense reductions had an impact of less than 0.01%.
The accompanying Notes to Financial Statements are an integral part of this statement.
Annual Report 2015
25
COLUMBIA SMALL CAP GROWTH FUND I
FINANCIAL HIGHLIGHTS (continued)
| | | Year Ended August 31, | |
Class R4 | | 2015 | | 2014 | | 2013(a) | |
Per share data | |
Net asset value, beginning of period | | $ | 30.64 | | | $ | 34.52 | | | $ | 29.37 | | |
Income from investment operations: | |
Net investment loss | | | (0.20 | ) | | | (0.23 | ) | | | (0.18 | ) | |
Net realized and unrealized gain | | | 3.24 | | | | 1.78 | | | | 8.25 | | |
Total from investment operations | | | 3.04 | | | | 1.55 | | | | 8.07 | | |
Less distributions to shareholders: | |
Net realized gains | | | (5.11 | ) | | | (5.43 | ) | | | (2.92 | ) | |
Total distributions to shareholders | | | (5.11 | ) | | | (5.43 | ) | | | (2.92 | ) | |
Proceeds from regulatory settlements | | | 0.12 | | | | — | | | | — | | |
Net asset value, end of period | | $ | 28.69 | | | $ | 30.64 | | | $ | 34.52 | | |
Total return | | | 12.18 | %(b) | | | 3.59 | % | | | 30.11 | % | |
Ratios to average net assets(c) | |
Total gross expenses | | | 1.10 | % | | | 1.04 | %(d) | | | 1.09 | %(e) | |
Total net expenses(f) | | | 1.10 | %(g) | | | 1.04 | %(d)(g) | | | 1.09 | %(e)(g) | |
Net investment loss | | | (0.68 | %) | | | (0.67 | %) | | | (0.67 | %)(e) | |
Supplemental data | |
Net assets, end of period (in thousands) | | $ | 69 | | | $ | 167 | | | $ | 818 | | |
Portfolio turnover | | | 117 | % | | | 148 | % | | | 104 | % | |
Notes to Financial Highlights
(a) Based on operations from November 8, 2012 (commencement of operations) through the stated period end.
(b) The Fund received proceeds from regulatory settlements. Had the Fund not received these proceeds, the total return would have been lower by 0.39%.
(c) In addition to the fees and expenses that the Fund bears directly, the Fund indirectly bears a pro rata share of the fees and expenses of any other funds in which it invests. Such indirect expenses are not included in the Fund's reported expense ratios.
(d) Ratios include line of credit interest expense which is less than 0.01%.
(e) Annualized.
(f) Total net expenses include the impact of certain fee waivers/expense reimbursements made by the Investment Manager and certain of its affiliates, if applicable.
(g) The benefits derived from expense reductions had an impact of less than 0.01%.
The accompanying Notes to Financial Statements are an integral part of this statement.
Annual Report 2015
26
COLUMBIA SMALL CAP GROWTH FUND I
FINANCIAL HIGHLIGHTS (continued)
| | | Year Ended August 31, | |
Class R5 | | 2015 | | 2014 | | 2013(a) | |
Per share data | |
Net asset value, beginning of period | | $ | 30.09 | | | $ | 33.90 | | | $ | 29.28 | | |
Income from investment operations: | |
Net investment loss | | | (0.16 | ) | | | (0.14 | ) | | | (0.07 | ) | |
Net realized and unrealized gain | | | 3.17 | | | | 1.80 | | | | 4.69 | | |
Total from investment operations | | | 3.01 | | | | 1.66 | | | | 4.62 | | |
Less distributions to shareholders: | |
Net realized gains | | | (5.11 | ) | | | (5.48 | ) | | | — | | |
Total distributions to shareholders | | | (5.11 | ) | | | (5.48 | ) | | | — | | |
Proceeds from regulatory settlements | | | 0.12 | | | | — | | | | — | | |
Increase from payment by affiliate | | | — | | | | 0.01 | | | | — | | |
Net asset value, end of period | | $ | 28.11 | | | $ | 30.09 | | | $ | 33.90 | | |
Total return | | | 12.33 | %(b) | | | 4.07 | %(c) | | | 15.78 | % | |
Ratios to average net assets(d) | |
Total gross expenses | | | 0.96 | % | | | 0.91 | %(e) | | | 0.93 | %(f) | |
Total net expenses(g) | | | 0.96 | % | | | 0.91 | %(e) | | | 0.93 | %(f) | |
Net investment loss | | | (0.58 | %) | | | (0.46 | %) | | | (0.41 | %)(f) | |
Supplemental data | |
Net assets, end of period (in thousands) | | $ | 11,990 | | | $ | 721 | | | $ | 1,145 | | |
Portfolio turnover | | | 117 | % | | | 148 | % | | | 104 | % | |
Notes to Financial Highlights
(a) Based on operations from February 28, 2013 (commencement of operations) through the stated period end.
(b) The Fund received proceeds from regulatory settlements. Had the Fund not received these proceeds, the total return would have been lower by 0.39%.
(c) The Fund received a payment from an affiliate. Had the Fund not received this payment, the total return would have been lower by 0.05%.
(d) In addition to the fees and expenses that the Fund bears directly, the Fund indirectly bears a pro rata share of the fees and expenses of any other funds in which it invests. Such indirect expenses are not included in the Fund's reported expense ratios.
(e) Ratios include line of credit interest expense which is less than 0.01%.
(f) Annualized.
(g) Total net expenses include the impact of certain fee waivers/expense reimbursements made by the Investment Manager and certain of its affiliates, if applicable.
The accompanying Notes to Financial Statements are an integral part of this statement.
Annual Report 2015
27
COLUMBIA SMALL CAP GROWTH FUND I
FINANCIAL HIGHLIGHTS (continued)
| | | Year Ended August 31, | |
Class Y | | 2015 | | 2014 | | 2013 | | 2012 | | 2011 | |
Per share data | |
Net asset value, beginning of period | | $ | 30.19 | | | $ | 34.09 | | | $ | 30.08 | | | $ | 30.44 | | | $ | 23.85 | | |
Income from investment operations: | |
Net investment loss | | | (0.14 | ) | | | (0.14 | ) | | | (0.04 | ) | | | (0.02 | ) | | | (0.18 | ) | |
Net realized and unrealized gain | | | 3.18 | | | | 1.73 | | | | 6.99 | | | | 2.59 | | | | 6.77 | | |
Total from investment operations | | | 3.04 | | | | 1.59 | | | | 6.95 | | | | 2.57 | | | | 6.59 | | |
Less distributions to shareholders: | |
Net realized gains | | | (5.11 | ) | | | (5.49 | ) | | | (2.94 | ) | | | (2.93 | ) | | | — | | |
Total distributions to shareholders | | | (5.11 | ) | | | (5.49 | ) | | | (2.94 | ) | | | (2.93 | ) | | | — | | |
Proceeds from regulatory settlements | | | 0.12 | | | | — | | | | — | | | | — | | | | — | | |
Net asset value, end of period | | $ | 28.24 | | | $ | 30.19 | | | $ | 34.09 | | | $ | 30.08 | | | $ | 30.44 | | |
Total return | | | 12.38 | %(a) | | | 3.78 | % | | | 25.70 | % | | | 9.27 | % | | | 27.63 | % | |
Ratios to average net assets(b) | |
Total gross expenses | | | 0.90 | % | | | 0.86 | %(c) | | | 0.87 | % | | | 0.88 | % | | | 0.88 | % | |
Total net expenses(d) | | | 0.90 | % | | | 0.86 | %(c) | | | 0.87 | % | | | 0.88 | % | | | 0.88 | %(e) | |
Net investment loss | | | (0.50 | %) | | | (0.43 | %) | | | (0.14 | %) | | | (0.07 | %) | | | (0.58 | %) | |
Supplemental data | |
Net assets, end of period (in thousands) | | $ | 3,823 | | | $ | 4,491 | | | $ | 14,817 | | | $ | 12,496 | | | $ | 11,453 | | |
Portfolio turnover | | | 117 | % | | | 148 | % | | | 104 | % | | | 113 | % | | | 113 | % | |
Notes to Financial Highlights
(a) The Fund received proceeds from regulatory settlements. Had the Fund not received these proceeds, the total return would have been lower by 0.39%.
(b) In addition to the fees and expenses that the Fund bears directly, the Fund indirectly bears a pro rata share of the fees and expenses of any other funds in which it invests. Such indirect expenses are not included in the Fund's reported expense ratios.
(c) Ratios include line of credit interest expense which is less than 0.01%.
(d) Total net expenses include the impact of certain fee waivers/expense reimbursements made by the Investment Manager and certain of its affiliates, if applicable.
(e) The benefits derived from expense reductions had an impact of less than 0.01%.
The accompanying Notes to Financial Statements are an integral part of this statement.
Annual Report 2015
28
COLUMBIA SMALL CAP GROWTH FUND I
FINANCIAL HIGHLIGHTS (continued)
| | | Year Ended August 31, | |
Class Z | | 2015 | | 2014 | | 2013 | | 2012 | | 2011 | |
Per share data | |
Net asset value, beginning of period | | $ | 30.01 | | | $ | 33.91 | | | $ | 29.98 | | | $ | 30.35 | | | $ | 23.81 | | |
Income from investment operations: | |
Net investment loss | | | (0.20 | ) | | | (0.21 | ) | | | (0.10 | ) | | | (0.08 | ) | | | (0.23 | ) | |
Net realized and unrealized gain | | | 3.16 | | | | 1.74 | | | | 6.95 | | | | 2.59 | | | | 6.77 | | |
Total from investment operations | | | 2.96 | | | | 1.53 | | | | 6.85 | | | | 2.51 | | | | 6.54 | | |
Less distributions to shareholders: | |
Net realized gains | | | (5.11 | ) | | | (5.43 | ) | | | (2.92 | ) | | | (2.88 | ) | | | — | | |
Total distributions to shareholders | | | (5.11 | ) | | | (5.43 | ) | | | (2.92 | ) | | | (2.88 | ) | | | — | | |
Proceeds from regulatory settlements | | | 0.12 | | | | — | | | | — | | | | — | | | | — | | |
Net asset value, end of period | | $ | 27.98 | | | $ | 30.01 | | | $ | 33.91 | | | $ | 29.98 | | | $ | 30.35 | | |
Total return | | | 12.16 | %(a) | | | 3.61 | % | | | 25.42 | % | | | 9.06 | % | | | 27.47 | % | |
Ratios to average net assets(b) | |
Total gross expenses | | | 1.11 | % | | | 1.05 | %(c) | | | 1.07 | % | | | 1.07 | % | | | 1.05 | % | |
Total net expenses(d) | | | 1.11 | %(e) | | | 1.05 | %(c)(e) | | | 1.06 | %(e) | | | 1.06 | %(e) | | | 1.05 | %(e) | |
Net investment loss | | | (0.69 | %) | | | (0.64 | %) | | | (0.34 | %) | | | (0.26 | %) | | | (0.73 | %) | |
Supplemental data | |
Net assets, end of period (in thousands) | | $ | 215,938 | | | $ | 693,432 | | | $ | 1,002,689 | | | $ | 839,982 | | | $ | 951,620 | | |
Portfolio turnover | | | 117 | % | | | 148 | % | | | 104 | % | | | 113 | % | | | 113 | % | |
Notes to Financial Highlights
(a) The Fund received proceeds from regulatory settlements. Had the Fund not received these proceeds, the total return would have been lower by 0.39%.
(b) In addition to the fees and expenses that the Fund bears directly, the Fund indirectly bears a pro rata share of the fees and expenses of any other funds in which it invests. Such indirect expenses are not included in the Fund's reported expense ratios.
(c) Ratios include line of credit interest expense which is less than 0.01%.
(d) Total net expenses include the impact of certain fee waivers/expense reimbursements made by the Investment Manager and certain of its affiliates, if applicable.
(e) The benefits derived from expense reductions had an impact of less than 0.01%.
The accompanying Notes to Financial Statements are an integral part of this statement.
Annual Report 2015
29
COLUMBIA SMALL CAP GROWTH FUND I
NOTES TO FINANCIAL STATEMENTS
August 31, 2015
Note 1. Organization
Columbia Small Cap Growth Fund I (the Fund), a series of Columbia Funds Series Trust I (the Trust), is a diversified fund. The Trust is registered under the Investment Company Act of 1940, as amended (the 1940 Act), as an open-end management investment company organized as a Massachusetts business trust.
Fund Shares
The Trust may issue an unlimited number of shares (without par value). The Fund offers Class A, Class B, Class C, Class I, Class K, Class R, Class R4, Class R5, Class Y and Class Z shares. Although all share classes generally have identical voting, dividend and liquidation rights, each share class votes separately when required by the Trust's organizational documents or by law. Different share classes pay different distribution amounts to the extent the expenses of such share classes differ, and distributions in liquidation will be proportional to the net asset value of each share class. Each share class has its own expense and sales charge structure.
The Fund is closed to new investors and new accounts, subject to certain limited exceptions.
Class A shares are subject to a maximum front-end sales charge of 5.75% based on the initial investment amount. Class A shares purchased without an initial sales charge in accounts aggregating $1 million to $50 million at the time of purchase are subject to a contingent deferred sales charge (CDSC) if the shares are sold within 18 months after purchase, charged as follows: 1.00% CDSC if redeemed within 12 months after purchase, and 0.50% CDSC if redeemed more than 12, but less than 18, months after purchase.
Class B shares may be subject to a maximum CDSC of 5.00% based upon the holding period after purchase. Class B shares will generally convert to Class A shares eight years after purchase.
Class C shares are subject to a 1.00% CDSC on shares redeemed within one year after purchase.
Class I shares are not subject to sales charges and are available only to the Columbia Family of Funds.
Class K shares are not subject to sales charges, however this share class is closed to new investors.
Class R shares are not subject to sales charges and are generally available only to certain retirement plans and other investors as described in the Fund's prospectus.
Class R4 shares are not subject to sales charges and are generally available only to omnibus retirement plans and certain investors as described in the Fund's prospectus.
Class R5 shares are not subject to sales charges and are generally available only to investors purchasing through authorized investment professionals and omnibus retirement plans.
Class Y shares are not subject to sales charges and are generally available only to certain retirement plans as described in the Fund's prospectus.
Class Z shares are not subject to sales charges and are available only to eligible investors, which are subject to different investment minimums as described in the Fund's prospectus.
Note 2. Summary of Significant Accounting Policies
Basis of Preparation
The Fund is an investment company that applies the accounting and reporting guidance in the Financial Accounting Standards Board (FASB) Accounting Standards Codification Topic 946, Financial Services — Investment Companies (ASC 946). The financial statements are prepared in accordance with U.S. generally accepted accounting principles (GAAP), which requires management to make certain estimates and assumptions that affect the reported amounts of assets and liabilities, the disclosure of contingent assets and liabilities at the date of the financial statements and the reported amounts of income and expenses during the reporting period. Actual results could differ from those estimates.
The following is a summary of significant accounting policies followed by the Fund in the preparation of its financial statements.
Security Valuation
All equity securities are valued at the close of business of the New York Stock Exchange (NYSE). Equity securities are valued at the last quoted sales price on the principal exchange or market on which they trade, except for securities traded on the NASDAQ Stock Market, which are valued at the NASDAQ official close price. Unlisted securities or listed securities for which there were no sales during the day are valued at the mean of the latest quoted bid and ask prices on such exchanges or markets.
Annual Report 2015
30
COLUMBIA SMALL CAP GROWTH FUND I
NOTES TO FINANCIAL STATEMENTS (continued)
August 31, 2015
Foreign equity securities are valued based on the closing price on the foreign exchange in which such securities are primarily traded. If any foreign equity security closing prices are not readily available, the securities are valued at the mean of the latest quoted bid and ask prices on such exchanges or markets. Foreign currency exchange rates are generally determined at 4:00 p.m. Eastern (U.S.) time. Many securities markets and exchanges outside the U.S. close prior to the close of the NYSE; therefore, the closing prices for securities in such markets or on such exchanges may not fully reflect events that occur after such close but before the close of the NYSE. In those situations, foreign securities will be fair valued pursuant to a policy adopted by the Board of Trustees (the Board), including, if available, utilizing a third party pricing service to determine these fair values. The third party pricing service takes into account multiple factors, including, but not limited to, movements in the U.S. securities markets, certain depositary receipts, futures contracts and foreign exchange rates that have occurred subsequent to the close of the foreign exchange or market, to determine a good faith estimate that reasonably reflects the current market conditions as of the close of the NYSE. The fair value of a security is likely to be different from the quoted or published price, if available.
Investments in open-end investment companies, including money market funds, are valued at their latest net asset value.
Investments for which market quotations are not readily available, or that have quotations which management believes are not reflective of market value or reliable, are valued at fair value as determined in good faith under procedures approved by and under the general supervision of the Board. If a security or class of securities (such as foreign securities) is valued at fair value, such value is likely to be different from the quoted or published price for the security.
The determination of fair value often requires significant judgment. To determine fair value, management may use assumptions including but not limited to future cash flows and estimated risk premiums. Multiple inputs from various sources may be used to determine fair value.
GAAP requires disclosure regarding the inputs and valuation techniques used to measure fair value and any changes in valuation inputs or techniques. In addition, investments shall be disclosed by major category. This information is disclosed following the Fund's Portfolio of Investments.
Foreign Currency Transactions and Translations
The values of all assets and liabilities denominated in foreign currencies are generally translated into U.S. dollars at exchange rates determined at the close of the NYSE. Net realized and unrealized gains (losses) on foreign currency transactions and translations include gains (losses) arising from the fluctuation in exchange rates between trade and settlement dates on securities transactions, gains (losses) arising from the disposition of foreign currency and currency gains (losses) between the accrual and payment dates on dividends, interest income and foreign withholding taxes.
For financial statement purposes, the Fund does not distinguish that portion of gains (losses) on investments which is due to changes in foreign exchange rates from that which is due to changes in market prices of the investments. Such fluctuations are included with the net realized and unrealized gains (losses) on investments in the Statement of Operations.
Security Transactions
Security transactions are accounted for on the trade date. Cost is determined and gains (losses) are based upon the specific identification method for both financial statement and federal income tax purposes.
Income Recognition
Corporate actions and dividend income are generally recorded net of any non-reclaimable tax withholdings, on the ex-dividend date or upon receipt of ex-dividend notification in the case of certain foreign securities.
The Fund may receive distributions from holdings in equity securities, business development companies (BDCs), exchange-traded funds, other regulated investment companies (RICs), and real estate investment trusts (REITs), which report information on the tax character of their distributions annually. These distributions are allocated to dividend income, capital gain and return of capital based on actual information reported. Return of capital is recorded as a reduction of the cost basis of securities held. If the Fund no longer owns the applicable securities, return of capital is recorded as a realized gain. With respect to REITs, to the extent actual information has not yet been reported, estimates for return of capital are made by the Fund's management. Management's estimates are subsequently adjusted when the actual character of the distributions is disclosed by the REITs, which could result in a proportionate change in return of capital to shareholders.
Annual Report 2015
31
COLUMBIA SMALL CAP GROWTH FUND I
NOTES TO FINANCIAL STATEMENTS (continued)
August 31, 2015
Awards from class action litigation are recorded as a reduction of cost basis if the Fund still owns the applicable securities on the payment date. If the Fund no longer owns the applicable securities, the proceeds are recorded as realized gains.
Expenses
General expenses of the Trust are allocated to the Fund and other funds of the Trust based upon relative net assets or other expense allocation methodologies determined by the nature of the expense. Expenses directly attributable to the Fund are charged to the Fund. Expenses directly attributable to a specific class of shares are charged to that share class.
Determination of Class Net Asset Value
All income, expenses (other than class-specific expenses, which are charged to that share class, as shown in the Statement of Operations) and realized and unrealized gains (losses) are allocated to each class of the Fund on a daily basis, based on the relative net assets of each class, for purposes of determining the net asset value of each class.
Federal Income Tax Status
The Fund intends to qualify each year as a regulated investment company under Subchapter M of the Internal Revenue Code, as amended, and will distribute substantially all of its taxable income (including net short-term capital gains), if any, for its tax year, and as such will not be subject to federal income taxes. In addition, the Fund intends to distribute in each calendar year substantially all of its net investment income, capital gains and certain other amounts, if any, such that the Fund should not be subject to federal excise tax. Therefore, no federal income or excise tax provision is recorded.
Foreign Taxes
The Fund may be subject to foreign taxes on income, gains on investments or currency repatriation, a portion of which may be recoverable. The Fund will accrue such taxes and recoveries, as applicable, based upon its current interpretation of tax rules and regulations that exist in the markets in which it invests.
Realized gains in certain countries may be subject to foreign taxes at the Fund level, based on statutory rates. The Fund accrues for such foreign taxes on realized and unrealized gains at the appropriate rate for each jurisdiction, as applicable. The amount, if any, is disclosed as a liability on the Statement of Assets and Liabilities.
Distributions to Shareholders
Distributions from net investment income, if any, are declared and paid annually. Net realized capital gains, if any, are distributed along with the income distribution. Income distributions and capital gain distributions are determined in accordance with federal income tax regulations, which may differ from GAAP.
Guarantees and Indemnifications
Under the Trust's organizational documents and, in some cases, by contract, its officers and trustees are indemnified against certain liabilities arising out of the performance of their duties to the Trust or its funds. In addition, certain of the Fund's contracts with its service providers contain general indemnification clauses. The Fund's maximum exposure under these arrangements is unknown since the amount of any future claims that may be made against the Fund cannot be determined, and the Fund has no historical basis for predicting the likelihood of any such claims.
Recent Accounting Pronouncement
Fair Value Measurement (Topic 820), Disclosure for Investments in Certain Entities That Calculate Net Asset Value per Share (or Its Equivalent)
In May 2015, the Financial Accounting Standards Board (FASB) issued Accounting Standards Update (ASU) No. 2015-07, Fair Value Measurement (Topic 820), Disclosure for Investments in Certain Entities That Calculate Net Asset Value per Share (or Its Equivalent). ASU No. 2015-07 changes the disclosure requirements for investments for which fair value is measured using the net asset value per share practical expedient. The disclosure requirements are effective for annual periods beginning after December 15, 2015 and interim periods within those fiscal years. At this time, management is evaluating the implications of this guidance and the impact it will have on the financial statement amounts and footnote disclosures, if any.
Note 3. Fees and Other Transactions with Affiliates
Investment Management Fees
Under an Investment Management Services Agreement, Columbia Management Investment Advisers, LLC (the Investment Manager), a wholly-owned subsidiary of Ameriprise Financial, Inc. (Ameriprise Financial), determines which securities will be purchased, held or sold. The investment management fee is an annual fee that is equal to a percentage of the Fund's average daily net assets that declines from 0.79% to 0.70% as the
Annual Report 2015
32
COLUMBIA SMALL CAP GROWTH FUND I
NOTES TO FINANCIAL STATEMENTS (continued)
August 31, 2015
Fund's net assets increase. The effective investment management fee rate for the year ended August 31, 2015 was 0.78% of the Fund's average daily net assets.
Administration Fees
Under an Administrative Services Agreement, the Investment Manager also serves as the Fund Administrator. The Fund pays the Fund Administrator an annual fee for administration and accounting services equal to a percentage of the Fund's average daily net assets that declines from 0.08% to 0.05% as the Fund's net assets increase. The effective administration fee rate for the year ended August 31, 2015 was 0.08% of the Fund's average daily net assets.
Compensation of Board Members
Board members, who are not officers or employees of the Investment Manager or Ameriprise Financial, are compensated for their services to the Fund as disclosed in the Statement of Operations. These Board members may participate in a Deferred Compensation Plan (the Plan) which may be terminated at any time. Obligations of the Plan will be paid solely out of the Fund's assets, and all amounts payable under the Plan constitute a general unsecured obligation of the Fund.
Compensation of Chief Compliance Officer
The Board has appointed a Chief Compliance Officer to the Fund in accordance with federal securities regulations. The Fund is allocated a portion of the expenses associated with the Chief Compliance Officer based on relative net assets of the Trust.
Transfer Agency Fees
Under a Transfer and Dividend Disbursing Agent Agreement, Columbia Management Investment Services Corp. (the Transfer Agent), an affiliate of the Investment Manager and a wholly-owned subsidiary of Ameriprise Financial, is responsible for providing transfer agency services to the Fund. The Transfer Agent has contracted with Boston Financial Data Services (BFDS) to serve as sub-transfer agent.
Effective November 1, 2014, the Transfer Agent receives a monthly transfer agency fee based on the number or the average value of accounts, depending on the type of account. Prior to November 1, 2014, the Transfer Agent received a monthly account-based service fee based on the number of open accounts. In addition, the Transfer Agent also receives sub-transfer agency fees based on a percentage of the average aggregate value of the Fund's shares maintained in omnibus accounts (other than omnibus accounts for which American Enterprise
Investment Services Inc. is the broker of record or accounts where the beneficial shareholder is a customer of Ameriprise Financial Services, Inc., for which the Transfer Agent receives a per account fee). The Transfer Agent pays the fees of BFDS for services as sub-transfer agent and is not entitled to reimbursement for such fees from the Fund (with the exception of out-of-pocket fees).
The Transfer Agent also receives compensation from the Fund for various shareholder services and reimbursements for certain out-of-pocket fees. Total transfer agency fees for Class K and Class R5 shares are subject to an annual limitation of not more than 0.05% of the average daily net assets attributable to each share class. Class I and Class Y shares do not pay transfer agency fees.
For the year ended August 31, 2015, the Fund's effective transfer agency fee rates as a percentage of average daily net assets of each class were as follows:
Class A | | | 0.21 | % | |
Class B | | | 0.21 | | |
Class C | | | 0.21 | | |
Class K | | | 0.05 | | |
Class R | | | 0.21 | | |
Class R4 | | | 0.21 | | |
Class R5 | | | 0.05 | | |
Class Z | | | 0.21 | | |
The Fund and certain other associated investment companies have severally, but not jointly, guaranteed the performance and observance of all the terms and conditions of a lease entered into by Seligman Data Corp. (SDC), the former transfer agent, including the payment of rent by SDC (the Guaranty). SDC was the legacy Seligman funds' former transfer agent.
The lease and the Guaranty expire in January 2019. At August 31, 2015, the Fund's total potential future obligation over the life of the Guaranty is $21,953. The liability remaining at August 31, 2015 for non-recurring charges associated with the lease amounted to $13,997 and is recorded as a part of the payable for other expenses in the Statement of Assets and Liabilities.
An annual minimum account balance fee of $20 may apply to certain accounts with a value below the applicable share class's initial minimum investment requirements to reduce the impact of small accounts on transfer agency fees. These minimum account balance fees are remitted to the Fund and recorded as part of expense reductions in the Statement of Operations. For the year ended August 31, 2015, these minimum
Annual Report 2015
33
COLUMBIA SMALL CAP GROWTH FUND I
NOTES TO FINANCIAL STATEMENTS (continued)
August 31, 2015
account balance fees reduced total expenses of the Fund by $7,834.
Plan Administration Fees
Under a Plan Administration Services Agreement with the Transfer Agent, the Fund pays an annual fee at a rate of 0.25% of the Fund's average daily net assets attributable to Class K shares for the provision of various administrative, recordkeeping, communication and educational services.
Distribution and Service Fees
The Fund has an agreement with Columbia Management Investment Distributors, Inc. (the Distributor), an affiliate of the Investment Manager and a wholly-owned subsidiary of Ameriprise Financial, for distribution and shareholder services. The Board has approved, and the Fund has adopted, distribution and shareholder service plans (the Plans) applicable to certain share classes, which set the distribution and service fees for the Fund. These fees are calculated daily and are intended to compensate the Distributor and/or eligible selling and/or servicing agents for selling shares of the Fund and providing services to investors.
Under the Plans, the Fund pays a monthly service fee to the Distributor at the maximum annual rate of 0.25% of the average daily net assets attributable to Class A, Class B and Class C shares of the Fund. Also under the Plans, the Fund pays a monthly distribution fee to the Distributor at the maximum annual rates of 0.10%, 0.75%, 0.75% and 0.50% of the average daily net assets attributable to Class A, Class B, Class C and Class R shares of the Fund, respectively.
Although the Fund may pay distribution and service fees up to a maximum annual rate of 0.35% of the Fund's average daily net assets attributable to Class A shares (comprised of up to 0.10% for distribution services and up to 0.25% for shareholder liaison services), the Fund currently limits such fees to an aggregate fee of not more than 0.25% of the Fund's average daily net assets attributable to Class A shares.
Sales Charges
Sales charges, including front-end charges and CDSCs, received by the Distributor for distributing Fund shares were $29,128 for Class A, $305 for Class B and $244 for Class C shares for the year ended August 31, 2015.
Expenses Waived/Reimbursed by the Investment Manager and its Affiliates
The Fund's expense ratio is subject to an expense reimbursement arrangement pursuant to which fees will
be waived and/or expenses reimbursed (excluding certain fees and expenses described below), so that the Fund's net operating expenses, after giving effect to fees waived/expenses reimbursed and any balance credits and/or overdraft charges from the Fund's custodian, do not exceed the annual rates of:
| | | Voluntary
Expense Cap
Effective
January 1, 2015 | | Contractual
Expense Cap
Prior to
January 1, 2015 | |
Class A | | | 1.39 | % | | | 1.40 | % | |
Class B | | | 2.14 | | | | 2.15 | | |
Class C | | | 2.14 | | | | 2.15 | | |
Class I | | | 0.98 | | | | 1.00 | | |
Class K | | | 1.28 | | | | 1.30 | | |
Class R | | | 1.64 | | | | 1.65 | | |
Class R4 | | | 1.14 | | | | 1.15 | | |
Class R5 | | | 1.03 | | | | 1.05 | | |
Class Y | | | 0.98 | | | | 1.00 | | |
Class Z | | | 1.14 | | | | 1.15 | | |
The voluntary expense cap arrangement may be revised or discontinued at any time. Under the arrangements, the following fees and expenses are excluded from the waiver/reimbursement commitment, and therefore will be paid by the Fund, if applicable: taxes (including foreign transaction taxes), expenses associated with investments in affiliated and non-affiliated pooled investment vehicles (including mutual funds and exchange-traded funds), transaction costs and brokerage commissions, costs related to any securities lending program, dividend and interest expenses associated with securities sold short, inverse floater program fees and expenses, transaction charges and interest on borrowed money, interest and extraordinary expenses. Any fees waived and/or expenses reimbursed under the expense reimbursement arrangements described above are not recoverable by the Investment Manager or its affiliates in future periods.
Note 4. Federal Tax Information
The timing and character of income and capital gain distributions are determined in accordance with income tax regulations, which may differ from GAAP because of temporary or permanent book to tax differences.
At August 31, 2015, these differences are primarily due to differing treatment for capital loss carryforwards, deferral/reversal of wash sale losses, Trustees' deferred compensation, foreign currency transactions, investments in partnerships, net operating loss reclassification, late-year ordinary losses,
Annual Report 2015
34
COLUMBIA SMALL CAP GROWTH FUND I
NOTES TO FINANCIAL STATEMENTS (continued)
August 31, 2015
re characterization of distributions for investments and proceeds from regulatory settlements. To the extent these differences are permanent, reclassifications are made among the components of the Fund's net assets in the Statement of Assets and Liabilities. Temporary differences do not require reclassifications. In the Statement of Assets and Liabilities the following reclassifications were made:
Excess of distributions over net investment income | | $ | 9,952,741 | | |
Accumulated net realized gain | | | (7,770,756 | ) | |
Paid-in capital | | | (2,181,985 | ) | |
Net investment income (loss) and net realized gains (losses), as disclosed in the Statement of Operations, and net assets were not affected by this reclassification.
The tax character of distributions paid during the years indicated was as follows:
Year Ended August 31, | | 2015 | | 2014 | |
Ordinary income | | $ | — | | | $ | 41,590,647 | | |
Long-term capital gains | | | 144,378,831 | | | | 170,214,110 | | |
Total | | $ | 144,378,831 | | | $ | 211,804,757 | | |
Short-term capital gain distributions, if any, are considered ordinary income distributions for tax purposes.
At August 31, 2015, the components of distributable earnings on a tax basis were as follows:
Undistributed ordinary income | | $ | 27,499,881 | | |
Undistributed long-term capital gains | | | 138,460,851 | | |
Capital loss carryforwards | | | (2,033,760 | ) | |
Net unrealized appreciation | | | 64,198,496 | | |
At August 31, 2015, the cost of investments for federal income tax purposes was $439,548,198 and the aggregate gross unrealized appreciation and depreciation based on that cost was:
Unrealized appreciation | | $ | 87,639,809 | | |
Unrealized depreciation | | | (23,441,313 | ) | |
Net unrealized appreciation | | $ | 64,198,496 | | |
The following capital loss carryforwards, determined at August 31, 2015, may be available to reduce taxable income arising from future net realized gains on investments, if any, to the extent permitted by the Internal Revenue Code:
Year of Expiration | | Amount ($) | |
| | 2016 | | | | 2,033,760 | | |
For the year ended August 31, 2015, $2,033,760 of capital loss carryforward was utilized.
Under current tax rules, regulated investment companies can elect to treat certain late-year ordinary losses incurred and post-October capital losses (capital losses realized after October 31) as arising on the first day of the following taxable year. As of August 31, 2015, the Fund will elect to treat late-year ordinary losses of $1,203,651 as arising on September 1, 2015.
Management of the Fund has concluded that there are no significant uncertain tax positions in the Fund that would require recognition in the financial statements. However, management's conclusion may be subject to review and adjustment at a later date based on factors including, but not limited to, new tax laws, regulations, and administrative interpretations (including relevant court decisions). Generally, the Fund's federal tax returns for the prior three fiscal years remain subject to examination by the Internal Revenue Service.
Note 5. Portfolio Information
The cost of purchases and proceeds from sales of securities, excluding short-term investments and derivatives, if any, aggregated to $789,049,746 and $1,396,551,185, respectively, for the year ended August 31, 2015. The amount of purchase and sale activity impacts the portfolio turnover rate reported in the Financial Highlights.
Note 6. Regulatory Settlements
During the year ended August 31, 2015, the Fund recorded a receivable of $2,181,933 as a result of a regulatory settlement proceeding brought by the Securities and Exchange Commission against an unaffiliated third party relating to market timing and/or late trading of mutual funds. This amount represented the Fund's portion of the proceeds from the settlement (neither the Fund nor the Investment Manager were a party to the proceeding). The payments have been included in Proceeds from regulatory settlements in the Statement of Changes in Net Assets.
Note 7. Payments by Affiliates
During the year ended August 31, 2014, the Fund received a payment of $30,476 from the Investment Manager as a reimbursement for certain shareholder transactions processed at an incorrect price. The payment has been included in "Increase from payment by affiliate" on the Statement of Changes in Net Assets.
Note 8. Affiliated Money Market Fund
The Fund invests in Columbia Short-Term Cash Fund, an affiliated money market fund established for the
Annual Report 2015
35
COLUMBIA SMALL CAP GROWTH FUND I
NOTES TO FINANCIAL STATEMENTS (continued)
August 31, 2015
exclusive use by the Fund and other affiliated funds. The income earned by the Fund from such investments is included as Dividends — affiliated issuers in the Statement of Operations. As an investing fund, the Fund indirectly bears its proportionate share of the expenses of Columbia Short-Term Cash Fund.
Note 9. Line of Credit
The Fund has entered into a revolving credit facility with a syndicate of banks led by JPMorgan Chase Bank, N.A. whereby the Fund may borrow for the temporary funding of shareholder redemptions or for other temporary or emergency purposes. Pursuant to a December 9, 2014 amendment, the credit facility agreement, which is a collective agreement between the Fund and certain other funds managed by the Investment Manager, severally and not jointly, permits collective borrowings up to $550 million. Interest is charged to each participating fund based on its borrowings at a rate equal to the higher of (i) the overnight federal funds rate plus 1.00% or (ii) the one-month LIBOR rate plus 1.00%. Each borrowing under the credit facility matures no later than 60 days after the date of borrowing. The Fund also pays a commitment fee equal to its pro rata share of the amount of the credit facility at a rate of 0.075% per annum. The commitment fee is included in other expenses in the Statement of Operations. Prior to the December 9, 2014 amendment, the credit facility agreement permitted borrowings up to $500 million under the same terms and interest rates as described above.
The Fund had no borrowings during the year ended August 31, 2015.
Note 10. Significant Risks
Health Care Sector Risk
The Fund may be more susceptible to the particular risks that may affect companies in the health care sector than if it were invested in a wider variety of companies in unrelated sectors. Companies in the health care sector are subject to certain risks, including restrictions on government reimbursement for medical expenses, government approval of medical products and services, competitive pricing pressures, and the rising cost of medical products and services (especially for companies dependent upon a relatively limited number of products or services). Performance of such companies may be affected by factors including, government regulation, obtaining and protecting patents (or the failure to do so),
product liability and other similar litigation as well as product obsolescence.
Shareholder Concentration Risk
At August 31, 2015, one unaffiliated shareholder of record owned 10.4% of the outstanding shares of the Fund in one or more accounts. The Fund has no knowledge about whether any portion of those shares was owned beneficially. Affiliated shareholders of record owned 18.6% of the outstanding shares of the Fund in one or more accounts. Subscription and redemption activity by concentrated accounts may have a significant effect on the operations of the Fund. In the case of a large redemption, the Fund may be forced to sell investments at inopportune times, including its liquid or more liquid positions, resulting in Fund losses and the Fund holding a higher percentage of less liquid or illiquid securities. Large redemptions could result in decreased economies of scale and increased operating expenses for non-redeeming Fund shareholders.
Technology and Technology-related Investment Risk
The Fund may be more susceptible to the particular risks that may affect companies in the information technology sector, as well as other technology-related sectors (collectively, the technology sectors) than if it were invested in a wider variety of companies in unrelated sectors. Companies in the technology sectors are subject to certain risks, including the risk that new services, equipment or technologies will not be accepted by consumers and businesses or will become rapidly obsolete. Performance of such companies may be affected by factors including obtaining and protecting patents (or the failure to do so) and significant competitive pressures, including aggressive pricing of their products or services, new market entrants, competition for market share and short product cycles due to an accelerated rate of technological developments. Such competitive pressures may lead to limited earnings and/or falling profit margins. As a result, the value of their securities may fall or fail to rise. In addition, many technology sector companies have limited operating histories and prices of these companies' securities historically have been more volatile than other securities, especially over the short term.
Note 11. Subsequent Events
Management has evaluated the events and transactions that have occurred through the date the financial statements were issued and noted no items requiring
Annual Report 2015
36
COLUMBIA SMALL CAP GROWTH FUND I
NOTES TO FINANCIAL STATEMENTS (continued)
August 31, 2015
adjustment of the financial statements or additional disclosure.
Note 12. Information Regarding Pending and Settled Legal Proceedings
In December 2005, without admitting or denying the allegations, American Express Financial Corporation (AEFC, which is now known as Ameriprise Financial, Inc. (Ameriprise Financial)) entered into settlement agreements with the Securities and Exchange Commission (SEC) and Minnesota Department of Commerce (MDOC) related to market timing activities. As a result, AEFC was censured and ordered to cease and desist from committing or causing any violations of certain provisions of the Investment Advisers Act of 1940, the Investment Company Act of 1940, and various Minnesota laws. AEFC agreed to pay disgorgement of $10 million and civil money penalties of $7 million. AEFC also agreed to retain an independent distribution consultant to assist in developing a plan for distribution of all disgorgement and civil penalties ordered by the SEC in accordance with various undertakings detailed at http://www.sec.gov/litigation/admin/ia-2451.pdf. Ameriprise Financial and its affiliates have cooperated with the SEC and the MDOC in these legal proceedings, and have made regular reports to the Funds' Boards of Trustees.
Ameriprise Financial and certain of its affiliates have historically been involved in a number of legal, arbitration and regulatory proceedings, including routine litigation, class actions, and governmental actions, concerning matters arising in connection with the conduct of their business activities. Ameriprise Financial believes that the Funds are not currently the subject of, and that neither Ameriprise Financial nor any of its affiliates are the subject of, any pending legal, arbitration or regulatory proceedings that are likely to have a material adverse effect on the Funds or the ability of Ameriprise Financial or its affiliates to perform under their contracts with the Funds. Ameriprise Financial is required to make quarterly (10-Q), annual (10-K) and, as necessary, 8-K filings with the SEC on legal and regulatory matters that relate to Ameriprise Financial and its affiliates. Copies of these filings may be obtained by accessing the SEC website at www.sec.gov.
There can be no assurance that these matters, or the adverse publicity associated with them, will not result in increased fund redemptions, reduced sale of fund shares or other adverse consequences to the Funds. Further, although we believe proceedings are not likely to have a
material adverse effect on the Funds or the ability of Ameriprise Financial or its affiliates to perform under their contracts with the Funds, these proceedings are subject to uncertainties and, as such, we are unable to estimate the possible loss or range of loss that may result. An adverse outcome in one or more of these proceedings could result in adverse judgments, settlements, fines, penalties or other relief that could have a material adverse effect on the consolidated financial condition or results of operations of Ameriprise Financial.
Annual Report 2015
37
COLUMBIA SMALL CAP GROWTH FUND I
REPORT OF INDEPENDENT REGISTERED PUBLIC ACCOUNTING FIRM
To the Trustees of Columbia Funds Series Trust I and the Shareholders of
Columbia Small Cap Growth Fund I
In our opinion, the accompanying statement of assets and liabilities, including the portfolio of investments, and the related statements of operations and of changes in net assets and the financial highlights present fairly, in all material respects, the financial position of Columbia Small Cap Growth Fund I (the "Fund," a series of Columbia Funds Series Trust I) at August 31, 2015, and the results of its operations, the changes in its net assets and the financial highlights for each of the periods indicated, in conformity with accounting principles generally accepted in the United States of America. These financial statements and financial highlights (hereafter referred to as "financial statements") are the responsibility of the Fund's management. Our responsibility is to express an opinion on these financial statements based on our audits. We conducted our audits of these financial statements in accordance with the standards of the Public Company Accounting Oversight Board (United States). Those standards require that we plan and perform the audit to obtain reasonable assurance about whether the financial statements are free of material misstatement. An audit includes examining, on a test basis, evidence supporting the amounts and disclosures in the financial statements, assessing the accounting principles used and significant estimates made by management, and evaluating the overall financial statement presentation. We believe that our audits, which included confirmation of securities at August 31, 2015 by correspondence with the custodian, brokers and transfer agent, and the application of alternative auditing procedures where such confirmations had not been received, provide a reasonable basis for our opinion.
PricewaterhouseCoopers LLP
Minneapolis, MN
October 22, 2015
Annual Report 2015
38
COLUMBIA SMALL CAP GROWTH FUND I
FEDERAL INCOME TAX INFORMATION
(Unaudited)
The Fund hereby designates the following tax attributes for the fiscal year ended August 31, 2015. Shareholders will be notified in early 2016 of the amounts for use in preparing 2015 income tax returns.
Tax Designations:
Capital Gain Dividend | | $ | 145,404,667 | | |
Capital Gain Dividend. The Fund designates as a capital gain dividend the amount reflected above, or if subsequently determined to be different, the net capital gain of such fiscal period.
Annual Report 2015
39
COLUMBIA SMALL CAP GROWTH FUND I
The Trustees serve terms of indefinite duration. The names and birth years of the Trustees and Officers of the Funds in Columbia Funds Series Trust I, the year each was first elected or appointed to office, their principal business occupations during at least the last five years, the number of Funds overseen by each Trustee and other directorships they hold are shown below. Each officer listed below serves as an officer of each Fund in Columbia Funds Series Trust I. The mailing address of each Trustee is: c/o Columbia Management Investment Advisers, LLC, 225 Franklin Street, Mail Drop BX32 05228, Boston, MA 02110.
Independent Trustees
Name, Year of Birth
and Position Held
with the Trust | | Year First
Appointed or
Elected as
Trustee to any
Fund Currently
in the Columbia
Funds Complex
or a Predecessor
Thereof | | Principal Occupation(s)
during the Past Five Years | | Number
of Funds
in the
Columbia
Funds
Complex
Overseen | | Other Directorships
Held by Trustee During
the Past Five Years | |
Janet Langford Carrig
(Born 1957)
Trustee | | | 1996 | | | Senior Vice President, General Counsel and Corporate Secretary, ConocoPhillips (integrated energy company) since September 2007; Deputy General Counsel — Corporate Legal Services, ConocoPhillips from August 2006 to August 2007; Partner, Zelle, Hofmann, Voelbel, Mason & Gette LLP (law firm) from March 2005 to July 2006; Adjunct Professor of Law, Northwestern University from September 2004 to June 2006; Director, UAL Corporation (airline) from February 2006 to July 2006; Chief Administrative Officer and Senior Vice President, Kmart Holding Corporation (consumer goods) from September 2003 to March 2004 | | | 60 | | | None | |
Douglas A. Hacker
(Born 1955)
Trustee and Chairman
of the Board | | | 1996 | | | Independent business executive since May 2006; Executive Vice President — Strategy of United Airlines from December 2002 to May 2006; President of UAL Loyalty Services (airline marketing company) from September 2001 to December 2002; Executive Vice President and Chief Financial Officer of United Airlines from July 1999 to September 2001 | | | 60 | | | Spartan Nash Company, (food distributor); Nash Finch Company (food distributor) from 2005 to 2013; Aircastle Limited (aircraft leasing); SeaCube Container Leasing Ltd. (container leasing) from 2010 to 2013; and Travelport Worldwide Limited (travel information technology) | |
Nancy T. Lukitsh
(Born 1956)
Trustee | | | 2011 | | | Senior Vice President, Partner and Director of Marketing, Wellington Management Company, LLP (investment adviser) from 1997 to 2010; Chair, Wellington Management Investment Portfolios (commingled non-U.S. investment pools) from 2007 to 2010; Director, Wellington Trust Company, NA and other Wellington affiliates from 1997 to 2010 | | | 60 | | | None | |
William E. Mayer
(Born 1940)
Trustee | | | 1991 | | | Partner, Park Avenue Equity Partners (private equity) since February 1999 | | | 60 | | | DynaVox Inc. (speech creation); Lee Enterprises (print media); WR Hambrecht + Co. (financial service provider) from 2000 to 2012; BlackRock Kelso Capital Corporation (investment company); and Premier, Inc. (healthcare) | |
Annual Report 2015
40
COLUMBIA SMALL CAP GROWTH FUND I
TRUSTEES AND OFFICERS (continued)
Independent Trustees (continued)
Name, Year of Birth
and Position Held
with the Trust | | Year First
Appointed or
Elected as
Trustee to any
Fund Currently
in the Columbia
Funds Complex
or a Predecessor
Thereof | | Principal Occupation(s)
during the Past Five Years | | Number
of Funds
in the
Columbia
Funds
Complex
Overseen | | Other Directorships
Held by Trustee During
the Past Five Years | |
David M. Moffett
(Born 1952)
Trustee | | | 2011 | | | Retired. Consultant to Bridgewater and Associates; Chief Executive Officer, Federal Home Loan Mortgage Corporation, from 2008 to 2009; Senior Adviser, Global Financial Services Group, Carlyle Group, Inc., from 2007 to 2008; Vice Chairman and Chief Financial Officer, U.S. Bancorp, from 1993 to 2007 | | | 60 | | | Building Materials Holding Corp. (building materials and construction services); CIT Group Inc. (commercial and consumer finance); eBay Inc. (online trading community); E.W. Scripps Co. (print and television media); Genworth Financial, Inc. (financial and insurance products and services); MBIA Inc. (financial service provider); Paypal Holdings Inc. (payment and data processing services); and University of Oklahoma Foundation | |
Charles R. Nelson
(Born 1942)
Trustee | | | 1981 | | | Retired. Professor Emeritus, University of Washington since 2011; Professor of Economics, University of Washington from 1976 to 2011; Ford and Louisa Van Voorhis Professor of Political Economy, University of Washington from 1993 to 2011; Adjunct Professor of Statistics, University of Washington from 1980 to 2011; Associate Editor, Journal of Money, Credit and Banking from September 1993 to 2008; consultant on econometric and statistical matters | | | 60 | | | None | |
John J. Neuhauser
(Born 1943)
Trustee | | | 1984 | | | President, Saint Michael's College since August 2007; Director or Trustee of several non-profit organizations, including Fletcher Allen Health Care, Inc.; Academic Vice President and Dean of Faculties, Boston College from August 1999 to October 2005; University Professor, Boston College from November 2005 to August 2007 | | | 60 | | | Liberty All-Star Equity Fund and Liberty All-Star Growth Fund (closed-end funds) | |
Patrick J. Simpson
(Born 1944)
Trustee | | | 2000 | | | Partner, Perkins Coie LLP (law firm) | | | 60 | | | None | |
Anne-Lee Verville
(Born 1945)
Trustee | | | 1998 | | | Retired. General Manager, Global Education Industry from 1994 to 1997, President — Application Systems Division from 1991 to 1994, Chief Financial Officer — US Marketing & Services from 1988 to 1991, and Chief Information Officer from 1987 to 1988, IBM Corporation (computer and technology) | | | 60 | | | Enesco Group, Inc. (producer of giftware and home and garden decor products) from 2001 to 2006 | |
Annual Report 2015
41
COLUMBIA SMALL CAP GROWTH FUND I
TRUSTEES AND OFFICERS (continued)
Interested Trustee Affiliate with Investment Manager*
Name, Year of Birth
and Position Held
with the Trust | | Year First
Appointed or
Elected as
Trustee to any
Fund Currently
in the Columbia
Funds Complex
or a Predecessor
Thereof | | Principal Occupation(s)
during the Past Five Years | | Number
of Funds
in the
Columbia
Funds
Complex
Overseen | | Other Directorships
Held by Trustee During
the Past Five Years | |
William F. Truscott
(Born 1960)
Trustee | | | 2012 | | | Chairman of the Board and President, Columbia Management Investment Advisers, LLC since May 2010 and February 2012, respectively (previously President and Chief Investment Officer, 2001-April 2010); Chief Executive Officer, Global Asset Management, Ameriprise Financial, Inc. since September 2012 (previously Chief Executive Officer, U.S. Asset Management & President, Annuities, May 2010-September 2012 and President — U.S. Asset Management and Chief Investment Officer, 2005-April 2010); Director and Chief Executive Officer, Columbia Management Investment Distributors, Inc. since May 2010 and February 2012, respectively (previously Chairman of the Board and Chief Executive Officer, 2006-April 2010); Chairman of the Board and Chief Executive Officer, RiverSource Distributors, Inc. since 2006; Director, Threadneedle Asset Management Holdings, SARL since 2014; President and Chief Executive Officer, Ameriprise Certificate Company, 2006-August 2012 | | | 187 | | | Chairman of the Board, Columbia Management Investment Advisers, LLC since May 2010; Director, Columbia Management Investment Distributors, Inc. since May 2010; Director, Ameriprise Certificate Company, 2006 to January 2013 | |
* Interested person (as defined under the 1940 Act) by reason of being an officer, director, security holder and/or employee of the Investment Manager or Ameriprise Financial.
The Statement of Additional Information has additional information about the Fund's Board members and is available, without charge, upon request by calling 800.345.6611; contacting your financial intermediary; or visiting columbiathreadneedle.com/us.
The Board has appointed officers who are responsible for day-to-day business decisions based on policies it has established. The officers serve at the pleasure of the Board. In addition to Mr. Truscott, who is Senior Vice President, the Funds' other officers are:
Fund Officers
Name,
Address and
Year of Birth | | Position and Year
First Appointed to
Position for any Fund
in the Columbia
Funds Complex or a
Predecessor Thereof | | Principal Occupation(s) During Past Five Years | |
Christopher O. Petersen
5228 Ameriprise
Financial Center
Minneapolis, MN 55474
Born 1970 | | President and Principal Executive Officer (2015) | | Vice President and Lead Chief Counsel, Ameriprise Financial, Inc. since January 2015 (previously, Vice President and Chief Counsel January 2010-December 2014; and Vice President and Group Counsel or Counsel 2004- January 2010); officer of Columbia Funds and affiliated funds since 2007. | |
Michael G. Clarke
225 Franklin Street
Boston, MA 02110
Born 1969 | | Treasurer (2011) and Chief Financial Officer (2009) | | Vice President — Mutual Fund Administration, Columbia Management Investment Advisers, LLC, since May 2010; Managing Director of Fund Administration, Columbia Management Advisors, LLC, September 2004-April 2010; senior officer of Columbia Funds and affiliated funds since 2002. | |
Annual Report 2015
42
COLUMBIA SMALL CAP GROWTH FUND I
TRUSTEES AND OFFICERS (continued)
Fund Officers (continued)
Name,
Address and
Year of Birth | | Position and Year
First Appointed to
Position for any Fund
in the Columbia
Funds Complex or a
Predecessor Thereof | | Principal Occupation(s) During Past Five Years | |
Paul B. Goucher
100 Park Avenue
New York, NY 10017
Born 1968 | | Senior Vice President (2011), Chief Legal Officer (2015) and Assistant Secretary (2008) | | Vice President and Lead Chief Counsel, Ameriprise Financial, Inc. since November 2008 and January 2013, respectively (previously Chief Counsel, January 2010-January 2013 and Group Counsel, November 2008-January 2010). | |
Thomas P. McGuire
225 Franklin Street
Boston, MA 02110
Born 1972 | | Vice President and Chief Compliance Officer (2012) | | Vice President — Asset Management Compliance, Ameriprise Financial, Inc., since May 2010; Chief Compliance Officer, Ameriprise Certificate Company since September 2010; Compliance Executive, Bank of America, 2005-April 2010. | |
Colin Moore
225 Franklin Street
Boston, MA 02110
Born 1958 | | Senior Vice President (2010) | | Executive Vice President and Global Chief Investment Officer, Ameriprise Financial, Inc., since July 2013; Director and Global Chief Investment Officer, Columbia Management Investment Advisers, LLC since May 2010; Manager, Managing Director and Chief Investment Officer, Columbia Management Advisors, LLC, 2007-April 2010. | |
Michael E. DeFao
225 Franklin Street
Boston, MA 02110
Born 1968 | | Vice President (2011) and Assistant Secretary (2010) | | Vice President and Chief Counsel, Ameriprise Financial, Inc. since May 2010; Associate General Counsel, Bank of America, 2005-April 2010. | |
Joseph F. DiMaria
225 Franklin Street
Boston, MA 02110
Born 1968 | | Vice President (2011), Assistant Treasurer (2012) and Chief Accounting Officer (2008) | | Vice President — Mutual Fund Treasurer, Columbia Management Investment Advisers, LLC since May 2010; Director of Fund Administration, Columbia Management Advisors, LLC, 2006-April 2010. | |
Amy Johnson
5228 Ameriprise
Financial Center
Minneapolis, MN 55474
Born 1965 | | Vice President (2006) | | Managing Director and Chief Operating Officer, Columbia Management Investment Advisers, LLC since May 2010 (previously Chief Administrative Officer, 2009-April 2010, and Vice President — Asset Management and Trust Company Services, 2006-2009). | |
Lyn Kephart-Strong
5228 Ameriprise
Financial Center
Minneapolis, MN 55474
Born 1960 | | Vice President (2015) | | President, Columbia Management Investment Services Corp. since October 2014; Vice President & Resolution Officer, Ameriprise Trust Company since August 2009; President, RiverSource Service Corporation 2004-2010. | |
Ryan C. Larrenaga
225 Franklin Street
Boston, MA 02110
Born 1970 | | Vice President and Secretary (2015) | | Vice President and Group Counsel, Ameriprise Financial, Inc. since August 2011 (previously, Counsel from May 2010 to August 2011); Assistant General Counsel, Bank of America, 2005-April 2010; officer of Columbia Funds and affiliated funds since 2005. | |
Annual Report 2015
43
COLUMBIA SMALL CAP GROWTH FUND I
BOARD CONSIDERATION AND APPROVAL OF ADVISORY AGREEMENT
On June 10, 2015, the Board of Trustees (the Board) and the Trustees who are not interested persons (as defined in the Investment Company Act of 1940) (the Independent Trustees) of Columbia Funds Series Trust I (the Trust) unanimously approved the continuation of the Investment Management Services Agreement (the Advisory Agreement) with Columbia Management Investment Advisers, LLC (the Investment Manager) with respect to Columbia Small Cap Growth Fund I (the Fund), a series of the Trust. The Board and the Independent Trustees also unanimously approved an agreement (the Management Agreement and, together with the Advisory Agreement, the Agreements) combining the Advisory Agreement and the Fund's existing administrative services agreement (the Administrative Services Agreement) in a single agreement. The Board and the Independent Trustees approved the restatement of the Advisory Agreement with the Management Agreement to be effective for the Fund on January 1, 2016, the Fund's next annual prospectus update. As detailed below, the Board's Advisory Fees and Expenses Committee (the Committee) and the Board met on multiple occasions to review and discuss, both among themselves and with the management team of the Investment Manager, materials provided by the Investment Manager and others before determining to approve the Management Agreement and the continuation of the Advisory Agreement.
In connection with their deliberations regarding the approval of the Management Agreement and the continuation of the Advisory Agreement, the Committee and the Board evaluated materials requested from the Investment Manager regarding the Fund and the Agreements, and discussed these materials with representatives of the Investment Manager at Committee meetings held on March 3, 2015, April 29, 2015 and June 9, 2015 and at Board meetings held on March 4, 2015 and June 10, 2015. In addition, the Board considers matters bearing on the Agreements at most of its other meetings throughout the year and meets regularly with senior management of the Trust and the Investment Manager. Through the Board's Investment Oversight Committees, Trustees also meet with selected portfolio managers of the funds the Trustees oversee and other investment personnel at various times throughout the year. The Committee and the Board also consulted with its independent fee consultant, Fund counsel and with the Independent Trustees' independent legal counsel, who advised on various matters with respect to the Committee's and the Board's considerations and otherwise assisted the Committee and the Board in their deliberations. On June 9, 2015, the Committee recommended that the Board approve the Management Agreement and the continuation of the Advisory Agreement. On June 10, 2015, the Board, including the Independent Trustees, voting separately, unanimously approved the Management Agreement and the continuation of the Advisory Agreement for the Fund.
The Committee and the Board considered all information that they, their legal counsel or the Investment Manager believed reasonably necessary to evaluate and to determine whether to approve the Management Agreement and the continuation of the Advisory Agreement. The information and factors considered by the Committee and the Board in recommending for approval or approving the Management Agreement and the continuation of the Advisory Agreement for the Fund included the following:
• Information on the investment performance of the Fund relative to the performance of a group of mutual funds determined to be comparable to the Fund by an independent third-party data provider, as well as performance relative to benchmarks;
• Information on the Fund's advisory fees and total expenses, including information comparing the Fund's expenses to those of a group of comparable mutual funds, as determined by the independent third-party data provider;
• The Investment Manager's agreement to contractually limit or cap total operating expenses for the Fund so that total operating expenses (excluding certain fees and expenses, such as portfolio transaction costs and certain other investment related expenses, interest, taxes, acquired fund fees and expenses, and extraordinary expenses) would not exceed a specified percentage of the Fund's average annual net assets from January 1, 2016 through December 31, 2016;
• The terms and conditions of the Agreements;
Annual Report 2015
44
COLUMBIA SMALL CAP GROWTH FUND I
BOARD CONSIDERATION AND APPROVAL OF ADVISORY AGREEMENT (continued)
• The current and proposed terms and conditions of other agreements and arrangements with affiliates of the Investment Manager relating to the operations of the Fund, including the Administrative Services Agreement1 and agreements with respect to the provision of distribution and transfer agency services to the Fund;
• Descriptions of various functions performed by the Investment Manager under the Agreements, including portfolio management and portfolio trading practices;
• Information regarding the management fees and investment performance of similarly-managed portfolios of other clients of the Investment Manager, including institutional separate accounts;
• Information regarding the reputation, regulatory history and resources of the Investment Manager, including information regarding senior management, portfolio managers and other personnel;
• Information regarding the capabilities of the Investment Manager with respect to compliance monitoring services, including an assessment of the Investment Manager's compliance system by the Fund's Chief Compliance Officer; and
• The profitability to the Investment Manager and its affiliates from their relationships with the Fund.
Nature, Extent and Quality of Services Provided under the Agreements
The Committee and the Board considered the nature, extent and quality of services provided to the Fund by the Investment Manager and its affiliates under the Agreements and under separate agreements for the provision of transfer agency and administrative services, and the resources dedicated to the Fund and the other Columbia Funds by the Investment Manager and its affiliates. The Committee and the Board also determined that the nature and level of the services to be provided under the Management Agreement would not decrease relative to the services provided under the Advisory Agreement and the Administrative Services Agreement. The Committee and the Board considered, among other things, the Investment Manager's ability to attract, motivate and retain highly qualified research, advisory and supervisory investment professionals (including personnel and other resources, compensation programs for personnel involved in fund management, reputation and other attributes), the portfolio management services provided by those investment professionals, and the quality of the Investment Manager's investment research capabilities and trade execution services. The Committee and the Board also considered the potential benefits to shareholders of investing in a mutual fund that is part of a fund complex offering exposure to a variety of asset classes and investment disciplines and providing a variety of fund and shareholder services.
The Committee and the Board also considered the professional experience and qualifications of the senior personnel of the Investment Manager, which included consideration of the Investment Manager's experience with similarly-structured funds. The Committee and the Board noted the compliance programs of and the compliance-related resources provided to the Fund by the Investment Manager and its affiliates, and considered the Investment Manager's ability to provide administrative services to the Fund and coordinate the activities of the Fund's other service providers. In evaluating the nature, extent and quality of services provided under the Agreements, the Committee and the Board considered that these services were provided to the Fund, rather than directly to Fund shareholders. The Committee and the Board accordingly affirmed, after considering various other matters, including the potential benefits to the Fund and its shareholders of the Independent Trustees' important role as pre-suit gatekeepers with respect to claims that they may determine are meritless or contrary to the Fund's best interests, that it was not the intention of the Board or the Investment Manager that there be any third-party beneficiaries of the Agreements. After reviewing these and related factors, the Committee and the Board concluded, within the context of their overall conclusions, that the nature, extent and quality of the services provided to the Fund under the Agreements supported the approval of the Management Agreement and the continuation of the Advisory Agreement.
1 Like the Advisory Agreement, the Administrative Services Agreement will terminate with respect to the Fund once the Management Agreement is effective for the Fund.
Annual Report 2015
45
COLUMBIA SMALL CAP GROWTH FUND I
BOARD CONSIDERATION AND APPROVAL OF ADVISORY AGREEMENT (continued)
Investment Performance
The Committee and the Board reviewed information about the performance of the Fund over various time periods, including performance information relative to benchmarks and information based on reports of the independent third-party data provider that compared the performance of the Fund to the performance of a group of comparable mutual funds, and data provided by the independent fee consultant. The Committee and the Board also reviewed a description of the third party's methodology for identifying the Fund's peer groups for purposes of performance and expense comparisons. Although the Fund's performance lagged that of a relevant peer group for certain (although not necessarily all) periods, the Committee and the Board concluded that other factors relevant to performance were sufficient, in light of other considerations, to warrant continuation of the Advisory Agreement and approval of the Management Agreement. Those factors included one or more of the following: (i) that the Fund's performance, although lagging in certain recent periods, was stronger over the longer term; (ii) that the underperformance was attributable, to a significant extent, to investment decisions that were reasonable and consistent with the Fund's investment strategy and policies and that the Fund was performing within a reasonable range of expectations, given those investment decisions, market conditions and the Fund's investment strategy; (iii) that the Fund's performance was competitive when compared to other relevant performance benchmarks or peer groups; and (iv) that the Investment Manager had taken or was taking steps designed to help improve the Fund's investment performance, including, but not limited to, replacing portfolio managers, enhancing the resources supporting the portfolio managers, or modifying investment strategies.
The Committee and the Board noted that, through December 31, 2014, the Fund's performance was in the ninetieth, ninety-third and eighty-seventh percentile (where the best performance would be in the first percentile) of its category selected by the independent third-party data provider for the purposes of performance comparisons for the one-, three- and five- year periods, respectively.
The Committee and the Board also considered the Investment Manager's performance and reputation generally, the Investment Manager's historical responsiveness to Board concerns about performance, and the Investment Manager's willingness to take steps intended to improve performance. After reviewing these and related factors, the Committee and the Board concluded, within the context of their overall conclusions, that the performance of the Fund was sufficient, in light of other considerations, to warrant the continuation of the Advisory Agreement and the approval of the Management Agreement.
Investment Advisory Fee Rates and Other Expenses
The Committee and the Board considered the advisory fees charged to the Fund under the Advisory Agreement as well as the total expenses incurred by the Fund. In assessing the reasonableness of the fees under the Advisory Agreement, the Committee and the Board considered, among other information, the Fund's advisory fee and its total expense ratio as a percentage of average daily net assets. The Committee and the Board also considered that the proposed management fee would not exceed the sum of the fee rates payable under the Advisory Agreement and the Administrative Services Agreement. The Committee and the Board considered data provided by the independent fee consultant. The Committee and the Board noted that, as of December 31, 2014, the Fund's actual management fee and net expense ratio are both ranked in the third quintile (where the lowest fees and expenses would be in the first quintile) against the Fund's expense universe as determined by the independent third-party data provider for purposes of expense comparison. The Committee and the Board also took into account the fee waiver and expense limitation arrangements agreed to by the Investment Manager, as noted above.
The Committee and the Board also received and considered information about the advisory fees charged by the Investment Manager to institutional separate accounts. In considering the fees charged to those accounts, the Committee and the Board took into account, among other things, the Investment Manager's representations about the differences between managing mutual funds as compared to other types of accounts, including differences in the services provided, differences in the risk profile of such business for the Investment Manager and the additional resources required to manage mutual funds effectively. The Committee and the Board also received and considered information about the fees charged by the Investment Manager for sub-advisory services
Annual Report 2015
46
COLUMBIA SMALL CAP GROWTH FUND I
BOARD CONSIDERATION AND APPROVAL OF ADVISORY AGREEMENT (continued)
provided to comparable unaffiliated funds. In evaluating the Fund's advisory fees, the Committee and the Board also took into account the demands, complexity and quality of the investment management of the Fund.
After reviewing these and related factors, the Committee and the Board concluded, within the context of their overall conclusions, that the advisory/management fee rates and expenses of the Fund were sufficient, in light of other considerations, to warrant the approval of the Management Agreement and continuation of the Advisory Agreement.
Costs of Services Provided and Profitability
The Committee and the Board also took note of the costs the Investment Manager and its affiliates incur in connection with the services provided (both on an absolute and relative basis) and the profitability to the Investment Manager and its affiliates in connection with their relationships with the Fund.
The Committee and the Board also considered the compensation directly or indirectly received by the Investment Manager's affiliates in connection with their relationships with the Fund. The Committee and the Board reviewed information provided by management as to the profitability to the Investment Manager and its affiliates of their relationships with the Fund, information about the allocation of expenses used to calculate profitability, and comparisons of profitability levels realized in 2014 to profitability levels realized in 2013. When reviewing profitability, the Committee and the Board also considered court cases in which adviser profitability was an issue in whole or in part, the performance of similarly managed funds, the performance of the Fund, and the expense ratio of the Fund. The Committee and the Board also considered information provided by the Investment Manager regarding the Investment Manager's financial condition and comparing its profitability to that of other asset management firms that are, or are subsidiaries of, publicly traded companies.
After reviewing these and related factors, the Committee and the Board concluded, within the context of their overall conclusions, that the costs of services provided and the profitability to the Investment Manager and its affiliates from their relationships with the Fund supported the approval of the Management Agreement and the continuation of the Advisory Agreement.
Economies of Scale
The Committee and the Board considered the potential existence of economies of scale in the provision by the Investment Manager of services to the Fund, to groups of related funds, and to the Investment Manager's investment advisory clients as a whole, and whether those economies of scale were shared with the Fund through breakpoints in investment advisory fees or other means, such as expense limitation arrangements and additional investments by the Investment Manager in investment, trading and compliance resources. The Committee and the Board noted that the investment advisory and management fee schedules for the Fund contained breakpoints that would reduce the fee rate on assets above specified threshold levels.
In considering these matters, the Committee and the Board also considered the costs of the services provided and the profitability to the Investment Manager and its affiliates from their relationships with the Fund, as discussed above. After reviewing these and related factors, the Committee and the Board concluded, within the context of their overall conclusions, that the extent to which any economies of scale were expected to be shared with the Fund supported the approval of the Management Agreement and the continuation of the Advisory Agreement.
Other Benefits to the Investment Manager
The Committee and the Board received and considered information regarding "fall-out" or ancillary benefits received by the Investment Manager and its affiliates as a result of their relationships with the Fund, such as the engagement of the Investment Manager to provide administrative services to the Fund and the engagement of the Investment Manager's affiliates to provide distribution and transfer agency services to the Fund. In this regard, among other matters, the Committee and the Board considered that the Fund's distributor retains a portion of the distribution fees from the Fund and receives a portion of the sales charges on sales or redemptions of certain classes of shares of the Fund. The Committee and the Board also considered the benefits
Annual Report 2015
47
COLUMBIA SMALL CAP GROWTH FUND I
BOARD CONSIDERATION AND APPROVAL OF ADVISORY AGREEMENT (continued)
of research made available to the Investment Manager by reason of brokerage commissions generated by the Fund's securities transactions, and reviewed information about the Investment Manager's practices with respect to allocating portfolio transactions for brokerage and research services. The Committee and the Board considered the possible conflicts of interest associated with certain fall-out or other ancillary benefits and the reporting, disclosure and other processes that are in place to address such possible conflicts of interest. The Committee and the Board recognized that the Investment Manager's profitability would be somewhat lower without these benefits.
Conclusion
The Committee and the Board reviewed all of the above considerations in reaching their decisions to recommend or approve the Management Agreement and the continuation of the Advisory Agreement. In their deliberations, the Trustees did not identify any particular information that was all-important or controlling, and individual Trustees may have attributed different weights to the various factors. Based on their evaluation of all factors that they deemed to be material, including those factors described above, and assisted by the advice of independent legal counsel, the Board, including the Independent Trustees, voting separately, unanimously approved the Management Agreement and the continuation of the Advisory Agreement.
Annual Report 2015
48
COLUMBIA SMALL CAP GROWTH FUND I
IMPORTANT INFORMATION ABOUT THIS REPORT
Each fund mails one shareholder report to each shareholder address. If you would like more than one report, please call shareholder services at 800.345.6611 and additional reports will be sent to you.
The policy of the Board is to vote the proxies of the companies in which each fund holds investments consistent with the procedures as stated in the Statement of Additional Information (SAI). You may obtain a copy of the SAI without charge by calling 800.345.6611; contacting your financial intermediary; visiting columbiathreadneedle.com/us; or searching the website of the Securities and Exchange Commission (SEC) at sec.gov. Information regarding how each fund voted proxies relating to portfolio securities is filed with the SEC by August 31st for the most recent 12-month period ending June 30th of that year, and is available without charge by visiting columbiathreadneedle.com/us, or searching the website of the SEC at sec.gov.
Each fund files a complete schedule of portfolio holdings with the SEC for the first and third quarters of each fiscal year on Form N-Q. Each fund's Form N-Q is available on the SEC's website at sec.gov and may be reviewed and copied at the SEC's Public Reference Room in Washington, D.C. Information on the operation of the Public Reference Room may be obtained by calling 800.SEC.0330. Each fund's complete schedule of portfolio holdings, as filed on Form N-Q, can also be obtained without charge, upon request, by calling 800.345.6611.
Annual Report 2015
49
Columbia Small Cap Growth Fund I
P.O. Box 8081
Boston, MA 02266-8081

This information is for use with concurrent or prior delivery of a fund prospectus. Please read and consider the investment objectives, risks, charges and expenses for any fund carefully before investing. For a prospectus and summary prospectus, which contains this and other important information about the Fund, go to columbiathreadneedle.com/us. The Fund is distributed by Columbia Management Investment Distributors, Inc., member FINRA, and managed by Columbia Management Investment Advisers, LLC.
Columbia Threadneedle Investments (Columbia Threadneedle) is the global brand name of the Columbia and Threadneedle group of companies.
All rights reserved. Columbia Management Investment Distributors, Inc., 225 Franklin Street, Boston, MA 02110-2804
© 2015 Columbia Management Investment Advisers, LLC.
columbiathreadneedle.com/us
ANN226_08_E01_(10/15)

ANNUAL REPORT
August 31, 2015

COLUMBIA VALUE AND RESTRUCTURING FUND

 Dear Shareholder,
Today's investors are typically focused on outcomes, like living a certain retirement lifestyle, paying for college education or building a legacy. But in today's complex global investment landscape, even simple goals are not easily achieved.
At Columbia Threadneedle Investments, we aspire to help satisfy five core needs of today's investors:
n Generate an appropriate stream of income in retirement
Traditional approaches to generating income may not provide the diversification benefits they once did, and they may actually introduce unwanted risk in today's market. To seek to improve your potential to live comfortably long term, we endeavor to pursue investments that explore less traveled paths to income.
n Navigate a changing interest rate environment
Today's uncertain market environment includes the prospect of a rise in interest rates. Blending traditional investments with non-traditional or alternative products may help protect your wealth during periods of volatility. We can attempt to help strengthen your portfolio with agile products designed to take on the market's ups and downs.
n Maximize after-tax returns
In an environment where what you keep may be more important than what you earn, municipal bonds can help mitigate high tax burdens while providing potentially attractive yields. Our state and federal tax-exempt products are aimed at helping investors manage risk, minimize the fluctuation of capital and grow wealth on a more tax-efficient basis.
n Grow assets to achieve financial goals
We believe that finding and protecting growth comes from a disciplined security selection process designed to create excess return. Our goal is to provide investment solutions built to help you face today's market challenges and grow your assets at each crossroad of your journey.
n Ease the impact of volatile markets
Despite a bull market run that has benefited many investors over the past several years, it's important to remember the lessons of 2008 and the value that a well-diversified portfolio may provide through times of market volatility. We are here to help you hold onto the savings you have worked tirelessly to amass, and to provide you the best opportunity to maintain your standard of living regardless of market conditions.
Find out today how we can help you confidently invest to realize your dreams. Please visit us at blog.columbiathreadneedleus.com/our-best-ideas to learn more about our unique investment solutions.
The world is constantly changing, but our priority remains the same: to help you secure your finances, meet your goals and achieve success. Thank you for your continued investment with us.
Sincerely,

Christopher O. Petersen
President, Columbia Funds
Investors should consider the investment objectives, risks, charges and expenses of a mutual fund carefully before investing. For a free prospectus and summary prospectus, which contains this and other important information about a fund, visit columbiathreadneedle.com/us. The prospectus should be read carefully before investing.
Columbia Funds are distributed by Columbia Management Investment Distributors, Inc., member FINRA, and managed by Columbia Management Investment Advisers, LLC.
© 2015 Columbia Management Investment Advisers, LLC. All rights reserved.
COLUMBIA VALUE AND RESTRUCTURING FUND
Performance Overview | | | 2 | | |
Manager Discussion of Fund Performance | | | 4 | | |
Understanding Your Fund's Expenses | | | 6 | | |
Portfolio of Investments | | | 7 | | |
Statement of Assets and Liabilities | | | 12 | | |
Statement of Operations | | | 14 | | |
Statement of Changes in Net Assets | | | 15 | | |
Financial Highlights | | | 18 | | |
Notes to Financial Statements | | | 27 | | |
Report of Independent Registered
Public Accounting Firm | | | 34 | | |
Federal Income Tax Information | | | 35 | | |
Trustees and Officers | | | 36 | | |
Board Consideration and Approval of Advisory Agreement | | | 40 | | |
Important Information About This Report | | | 45 | | |
Fund Investment Manager
Columbia Management Investment
Advisers, LLC
225 Franklin Street
Boston, MA 02110
Fund Distributor
Columbia Management Investment
Distributors, Inc.
225 Franklin Street
Boston, MA 02110
Fund Transfer Agent
Columbia Management Investment
Services Corp.
P.O. Box 8081
Boston, MA 02266-8081
For more information about any of the funds, please visit columbiathreadneedle.com/us or call 800.345.6611. Customer Service Representatives are available to answer your questions Monday through Friday from 8 a.m. to 7 p.m. Eastern time.
The views expressed in this report reflect the current views of the respective parties. These views are not guarantees of future performance and involve certain risks, uncertainties and assumptions that are difficult to predict, so actual outcomes and results may differ significantly from the views expressed. These views are subject to change at any time based upon economic, market or other conditions and the respective parties disclaim any responsibility to update such views. These views may not be relied on as investment advice and, because investment decisions for a Columbia fund are based on numerous factors, may not be relied on as an indication of trading intent on behalf of any particular Columbia fund. References to specific securities should not be construed as a recommendation or investment advice.
COLUMBIA VALUE AND RESTRUCTURING FUND
Performance Summary
n Columbia Value and Restructuring Fund (the Fund) Class A shares returned 1.76% excluding sales charges for the 12-month period that ended August 31, 2015.
n The Fund outperformed both the S&P 500 Index and the Russell 1000 Value Index, which returned 0.48% and -3.48%, respectively, for the same period.
n Sector allocation decisions and individual stock selection contributed to the Fund's performance advantage over the Russell 1000 Value Index.
Average Annual Total Returns (%) (for period ended August 31, 2015)
| | | Inception | | 1 Year | | 5 Years | | 10 Years | |
Class A* | | 09/28/07 | | | | | | | |
Excluding sales charges | | | | | 1.76 | | | | 14.39 | | | | 6.16 | | |
Including sales charges | | | | | -4.09 | | | | 13.04 | | | | 5.54 | | |
Class C* | | 09/28/07 | | | | | | | |
Excluding sales charges | | | | | 0.98 | | | | 13.53 | | | | 5.38 | | |
Including sales charges | | | | | 0.14 | | | | 13.53 | | | | 5.38 | | |
Class I* | | 09/27/10 | | | 2.21 | | | | 14.84 | | | | 6.49 | | |
Class R | | 12/31/04 | | | 1.50 | | | | 14.11 | | | | 5.89 | | |
Class R4* | | 11/08/12 | | | 2.02 | | | | 14.68 | | | | 6.42 | | |
Class R5* | | 11/08/12 | | | 2.19 | | | | 14.77 | | | | 6.46 | | |
Class W* | | 09/27/10 | | | 1.81 | | | | 14.43 | | | | 6.17 | | |
Class Y* | | 11/08/12 | | | 2.22 | | | | 14.80 | | | | 6.47 | | |
Class Z | | 12/31/92 | | | 2.00 | | | | 14.67 | | | | 6.41 | | |
S&P 500 Index | | | | | 0.48 | | | | 15.87 | | | | 7.15 | | |
Russell 1000 Value Index | | | | | -3.48 | | | | 14.68 | | | | 6.18 | | |
Returns for Class A are shown with and without the maximum initial sales charge of 5.75%. Returns for Class C are shown with and without the 1.00% contingent deferred sales charge for the first year only. The Fund's other classes are not subject to sales charges and have limited eligibility. Please see the Fund's prospectus for details. Performance for different share classes will vary based on differences in sales charges and fees associated with each class. All results shown assume reinvestment of distributions during the period. Returns do not reflect the deduction of taxes that a shareholder may pay on Fund distributions or on the redemption of Fund shares. Performance results reflect the effect of any fee waivers or reimbursements of Fund expenses by Columbia Management Investment Advisers, LLC and/or any of its affiliates. Absent these fee waivers or expense reimbursement arrangements, performance results would have been lower.
The performance information shown represents past performance and is not a guarantee of future results. The investment return and principal value of your investment will fluctuate so that your shares, when redeemed, may be worth more or less than their original cost. Current performance may be lower or higher than the performance information shown. You may obtain performance information current to the most recent month-end by contacting your financial intermediary, visiting columbiathreadneedle.com/us or calling 800.345.6611.
*The returns shown for periods prior to the share class inception date (including returns for the Life of the Fund, if shown, which are since Fund inception) include the returns of the Fund's oldest share class. These returns are adjusted to reflect any higher class-related operating expenses of the newer share classes, as applicable. Please visit columbiathreadneedle.com/us/investment-products/mutual-funds/appended-performance for more information.
The S&P 500 Index, an unmanaged index, measures the performance of 500 widely held, large-capitalization U.S. stocks and is frequently used as a general measure of market performance.
The Russell 1000 Value Index, an unmanaged index, measures the performance of those stocks in the Russell 1000 Index with lower price-to-book ratios and lower forecasted growth values.
Indices are not available for investment, are not professionally managed and do not reflect sales charges, fees, brokerage commissions, taxes or other expenses of investing. Securities in the Fund may not match those in an index.
Annual Report 2015
2
COLUMBIA VALUE AND RESTRUCTURING FUND
PERFORMANCE OVERVIEW (continued)
Performance of a Hypothetical $10,000 Investment (September 1, 2005 – August 31, 2015)

The chart above shows the change in value of a hypothetical $10,000 investment in Class A shares of Columbia Value and Restructuring Fund during the stated time period, and does not reflect the deduction of taxes that a shareholder may pay on Fund distributions or on the redemption of Fund shares.
Annual Report 2015
3
COLUMBIA VALUE AND RESTRUCTURING FUND
MANAGER DISCUSSION OF FUND PERFORMANCE
Portfolio Management
Guy Pope, CFA
J. Nicholas Smith, CFA
Morningstar Style BoxTM

The Morningstar Style BoxTM is based on a fund's portfolio holdings. For equity funds, the vertical axis shows the market capitalization of the stocks owned, and the horizontal axis shows investment style (value, blend, or growth). Information shown is based on the most recent data provided by Morningstar.
© 2015 Morningstar, Inc. All rights reserved. The Morningstar information contained herein: (1) is proprietary to Morningstar and/or its content providers; (2) may not be copied or distributed; and (3) is not warranted to be accurate, complete or timely. Neither Morningstar nor its content providers are responsible for any damages or losses arising from any use of this information.
Top Ten Holdings (%)
(at August 31, 2015) | |
Apple, Inc. | | | 4.1 | | |
CVS Health Corp. | | | 3.1 | | |
Medtronic PLC | | | 3.1 | | |
JPMorgan Chase & Co. | | | 2.9 | | |
Berkshire Hathaway, Inc.,
Class B | | | 2.9 | | |
American Express Co. | | | 2.8 | | |
Verizon Communications, Inc. | | | 2.8 | | |
Google, Inc., Class C | | | 2.6 | | |
Johnson & Johnson | | | 2.4 | | |
Comcast Corp., Class A | | | 2.4 | | |
Percentages indicated are based upon total investments (excluding Money Market Funds).
For further detail about these holdings, please refer to the section entitled "Portfolio of Investments."
Fund holdings are as of the date given, are subject to change at any time, and are not recommendations to buy or sell any security.
For the 12-month period that ended August 31, 2015, the Fund's Class A shares returned 1.76% excluding sales charges. The Fund outperformed both the S&P 500 Index and the Russell 1000 Value Index, which returned 0.48% and -3.48%, respectively, for the same period. Stock selection within the information technology and health care sectors and a timely underweight of the energy sector aided performance relative to the Russell 1000 Value Index.
Markets Turned Volatile as Pressures Mounted
The pace of U.S. economic growth fluctuated during the 12-month period that ended August 31, 2015. Another stormy winter in the Northeast and Midwest whittled away at gross domestic product (GDP) early in 2015. A strong dollar, a widening trade deficit and declining oil prices also negatively impacted growth. Yet most of these setbacks proved to be temporary, and the U.S. economy rebounded as temperatures warmed. An average of 243,000 new jobs were added monthly to the U.S. workforce, driving the unemployment rate down to 5.1% and bolstering consumer confidence. Manufacturing activity was solid even though the pace of manufacturing growth slowed over the year. Home sales were robust. However, stubbornly low inventory levels and rising prices kept many first-time home buyers out of the market.
As concerns mounted about a sluggish global economy, weakening growth in China and the timing of a Federal Reserve (Fed) interest rate hike, the financial markets turned volatile. Solid stock market gains in the first half of the 12-month period were all but wiped out in the second half. Large-cap stocks edged out mid-cap and small-cap stocks, while growth stocks significantly outperformed value stocks.
Contributors and Detractors
Within the information technology sector, the Fund did well with video game companies Activision Blizzard and Electronic Arts, both of which benefited from a new game console cycle as well as from a secular shift away from video discs in favor of digital platforms, where profit margins tend to be higher. In the semiconductor subsector, Skyworks Solutions and Broadcom were also solid performers. Skyworks is a leading supplier of radio frequency integrated circuits (RFICs) and other semiconductors for the wireless handset market, especially Apple iPhones. After handily beating earnings estimates for several quarters in a row, Skyworks rallied on strong demand for the iPhone 6, which released in September 2015. Broadcom was acquired at a premium by Avago Technologies, which benefited from strong handset demand and increased content within Apple products. Merger and acquisition activity in the health care sector also contributed positively to the Fund's performance. Long-time holding Covidien became part of Medtronic, and shares of Cigna and Perrigo were boosted by buyout offers received during the period.
Within the consumer staples sector, the Fund enjoyed favorable returns from drug-store chains CVS and Walgreen's. CVS achieved double-digit earnings growth through a combination of increased revenues and share repurchases, while Walgreen's new management team undertook an extensive cost-cutting campaign. In addition, the domestic emphasis of
Annual Report 2015
4
COLUMBIA VALUE AND RESTRUCTURING FUND
MANAGER DISCUSSION OF FUND PERFORMANCE (continued)
both companies insulated them from a rising dollar, unlike many of the multinational companies within the consumer staples sector.
Another key decision for the Fund was to maintain an underweight position in the energy sector. This stance proved especially important as oil prices experienced a sharp decline through much of the period. However, stock selection within energy was less favorable and offset some of the advantage of the sector's underweight. We added to the Fund's energy exposure toward the end of the period, finishing with only a modest underweight.
Stock selection within the gaming industry also detracted from overall performance. China was the major source of the industry's woes, because of a steeper-than-expected economic slowdown and also because of the government's anti-corruption campaign, which hit the gaming industry extremely hard. Fund holdings Wynn Resorts and Las Vegas Sands, each of which has historically enjoyed strong profits from their Macao operations, were both hurt by the anti-corruption campaign. The Fund sold both positions before the close of the reporting period.
Looking Ahead
At this time, we continue to regard equities as an attractive long-term asset class even though the short-term market backdrop has been less forgiving than in previous periods, given higher valuations, decelerating earnings growth and less accommodative monetary policy. The past year has demonstrated that U.S. markets are by no means insulated from weaknesses in overseas economies. We expect the performance of global economies will be closely watched in the year ahead and could bring an extra measure of volatility to the market. In our view, domestically, it appears that all eyes will be on the Fed, which has thus far delayed its long-anticipated move to push short-term interest rates higher. In addition, we believe that investors will further focus in on company fundamentals, which have clearly weakened over the last 12 months.
Portfolio Breakdown (%)
(at August 31, 2015) | |
Common Stocks | | | 99.6 | | |
Money Market Funds | | | 0.4 | | |
Total | | | 100.0 | | |
Percentages indicated are based upon total investments. The Fund's portfolio composition is subject to change.
Equity Sector Breakdown (%)
(at August 31, 2015) | |
Consumer Discretionary | | | 11.1 | | |
Consumer Staples | | | 8.1 | | |
Energy | | | 6.3 | | |
Financials | | | 18.8 | | |
Health Care | | | 16.2 | | |
Industrials | | | 11.7 | | |
Information Technology | | | 22.4 | | |
Materials | | | 0.6 | | |
Telecommunication Services | | | 2.8 | | |
Utilities | | | 2.0 | | |
Total | | | 100.0 | | |
Percentages indicated are based upon total equity investments. The Fund's portfolio composition is subject to change.
Investment Risks
Market risk may affect a single issuer, sector of the economy, industry or the market as a whole. Foreign investments subject the Fund to risks, including political, economic, market, social and others within a particular country, as well as to currency instabilities and less stringent financial and accounting standards generally applicable to U.S. issuers. Risks are enhanced for emerging market issuers. Value securities may be unprofitable if the market fails to recognize their intrinsic worth or the portfolio manager misgauged that worth. The Fund may invest significantly in issuers within a particular sector, which may be negatively affected by market, economic or other conditions, making the Fund more vulnerable to unfavorable developments in the sector. See the Fund's prospectus for more information on these and other risks.
Annual Report 2015
5
COLUMBIA VALUE AND RESTRUCTURING FUND
UNDERSTANDING YOUR FUND'S EXPENSES
(Unaudited)
As an investor, you incur two types of costs. There are transaction costs, which generally include sales charges on purchases and may include redemption fees. There are also ongoing costs, which generally include management fees, distribution and/or service fees, and other fund expenses. The following information is intended to help you understand your ongoing costs (in dollars) of investing in the Fund and to help you compare these costs with the ongoing costs of investing in other mutual funds.
Analyzing Your Fund's Expenses
To illustrate these ongoing costs, we have provided examples and calculated the expenses paid by investors in each share class of the Fund during the period. The actual and hypothetical information in the table is based on an initial investment of $1,000 at the beginning of the period indicated and held for the entire period. Expense information is calculated two ways and each method provides you with different information. The amount listed in the "Actual" column is calculated using the Fund's actual operating expenses and total return for the period. You may use the Actual information, together with the amount invested, to estimate the expenses that you paid over the period. Simply divide your account value by $1,000 (for example, an $8,600 account value divided by $1,000 = 8.6), then multiply the results by the expenses paid during the period under the "Actual" column. The amount listed in the "Hypothetical" column assumes a 5% annual rate of return before expenses (which is not the Fund's actual return) and then applies the Fund's actual expense ratio for the period to the hypothetical return. You should not use the hypothetical account values and expenses to estimate either your actual account balance at the end of the period or the expenses you paid during the period. See "Compare With Other Funds" below for details on how to use the hypothetical data.
Compare With Other Funds
Since all mutual funds are required to include the same hypothetical calculations about expenses in shareholder reports, you can use this information to compare the ongoing cost of investing in the Fund with other funds. To do so, compare the hypothetical example with the 5% hypothetical examples that appear in the shareholder reports of other funds. As you compare hypothetical examples of other funds, it is important to note that hypothetical examples are meant to highlight the ongoing costs of investing in a fund only and do not reflect any transaction costs, such as sales charges, or redemption or exchange fees. Therefore, the hypothetical calculations are useful in comparing ongoing costs only, and will not help you determine the relative total costs of owning different funds. If transaction costs were included in these calculations, your costs would be higher.
March 1, 2015 – August 31, 2015
| | | Account Value at the Beginning
of the Period ($) | | Account Value at the End of the
Period ($) | | Expenses Paid During the
Period ($) | | Fund's Annualized
Expense Ratio (%) | |
| | | Actual | | Hypothetical | | Actual | | Hypothetical | | Actual | | Hypothetical | | Actual | |
Class A | | | 1,000.00 | | | | 1,000.00 | | | | 956.80 | | | | 1,019.21 | | | | 6.00 | | | | 6.19 | | | | 1.21 | | |
Class C | | | 1,000.00 | | | | 1,000.00 | | | | 953.10 | | | | 1,015.41 | | | | 9.70 | | | | 10.01 | | | | 1.96 | | |
Class I | | | 1,000.00 | | | | 1,000.00 | | | | 959.00 | | | | 1,021.54 | | | | 3.72 | | | | 3.84 | | | | 0.75 | | |
Class R | | | 1,000.00 | | | | 1,000.00 | | | | 955.60 | | | | 1,017.94 | | | | 7.24 | | | | 7.47 | | | | 1.46 | | |
Class R4 | | | 1,000.00 | | | | 1,000.00 | | | | 958.20 | | | | 1,020.48 | | | | 4.76 | | | | 4.92 | | | | 0.96 | | |
Class R5 | | | 1,000.00 | | | | 1,000.00 | | | | 959.00 | | | | 1,021.24 | | | | 4.02 | | | | 4.15 | | | | 0.81 | | |
Class W | | | 1,000.00 | | | | 1,000.00 | | | | 957.30 | | | | 1,019.56 | | | | 5.65 | | | | 5.83 | | | | 1.14 | | |
Class Y | | | 1,000.00 | | | | 1,000.00 | | | | 959.40 | | | | 1,021.49 | | | | 3.77 | | | | 3.89 | | | | 0.76 | | |
Class Z | | | 1,000.00 | | | | 1,000.00 | | | | 958.00 | | | | 1,020.48 | | | | 4.76 | | | | 4.92 | | | | 0.96 | | |
Expenses paid during the period are equal to the annualized expense ratio for each class as indicated above, multiplied by the average account value over the period and then multiplied by the number of days in the Fund's most recent fiscal half year and divided by 365.
Expenses do not include fees and expenses incurred indirectly by the Fund from its investment in underlying funds, including affiliated and non-affiliated pooled investment vehicles, such as mutual funds and exchange-traded funds.
Annual Report 2015
6
COLUMBIA VALUE AND RESTRUCTURING FUND
PORTFOLIO OF INVESTMENTS
August 31, 2015
(Percentages represent value of investments compared to net assets)
Common Stocks 99.0%
Issuer | | Shares | | Value ($) | |
CONSUMER DISCRETIONARY 11.0% | |
Auto Components 1.5% | |
Delphi Automotive PLC | | | 313,540 | | | | 23,678,541 | | |
Hotels, Restaurants & Leisure 1.3% | |
Aramark | | | 388,180 | | | | 12,165,561 | | |
McDonald's Corp. | | | 97,250 | | | | 9,240,695 | | |
Total | | | | | 21,406,256 | | |
Household Durables 0.4% | |
Mohawk Industries, Inc.(a) | | | 35,028 | | | | 6,899,465 | | |
Internet & Catalog Retail 1.3% | |
Priceline Group, Inc. (The)(a) | | | 17,145 | | | | 21,407,933 | | |
Media 3.4% | |
CBS Corp., Class B Non Voting | | | 378,880 | | | | 17,140,531 | | |
Comcast Corp., Class A | | | 680,790 | | | | 38,348,901 | | |
Total | | | | | 55,489,432 | | |
Specialty Retail 2.4% | |
Lowe's Companies, Inc. | | | 391,615 | | | | 27,088,009 | | |
Michaels Companies, Inc. (The)(a) | | | 427,757 | | | | 11,211,511 | | |
Total | | | | | 38,299,520 | | |
Textiles, Apparel & Luxury Goods 0.7% | |
PVH Corp. | | | 92,805 | | | | 11,041,939 | | |
Total Consumer Discretionary | | | | | 178,223,086 | | |
CONSUMER STAPLES 8.0% | |
Beverages 3.1% | |
Diageo PLC, ADR | | | 170,505 | | | | 18,136,617 | | |
PepsiCo, Inc. | | | 337,455 | | | | 31,359,693 | | |
Total | | | | | 49,496,310 | | |
Food & Staples Retailing 3.7% | |
CVS Health Corp. | | | 485,995 | | | | 49,765,888 | | |
Walgreens Boots Alliance, Inc. | | | 125,435 | | | | 10,856,399 | | |
Total | | | | | 60,622,287 | | |
Tobacco 1.2% | |
Philip Morris International, Inc. | | | 253,520 | | | | 20,230,896 | | |
Total Consumer Staples | | | | | 130,349,493 | | |
ENERGY 6.2% | |
Energy Equipment & Services 0.9% | |
Schlumberger Ltd. | | | 195,830 | | | | 15,151,367 | | |
Common Stocks (continued)
Issuer | | Shares | | Value ($) | |
Oil, Gas & Consumable Fuels 5.3% | |
Canadian Natural Resources Ltd. | | | 475,340 | | | | 10,680,890 | | |
Chevron Corp. | | | 274,385 | | | | 22,222,441 | | |
ConocoPhillips | | | 206,990 | | | | 10,173,559 | | |
Exxon Mobil Corp. | | | 183,750 | | | | 13,825,350 | | |
Noble Energy, Inc. | | | 129,530 | | | | 4,327,597 | | |
Range Resources Corp. | | | 255,865 | | | | 9,881,506 | | |
Williams Companies, Inc. (The) | | | 306,307 | | | | 14,763,998 | | |
Total | | | | | 85,875,341 | | |
Total Energy | | | | | 101,026,708 | | |
FINANCIALS 18.6% | |
Banks 8.2% | |
Bank of America Corp. | | | 1,546,565 | | | | 25,270,872 | | |
Citigroup, Inc. | | | 641,975 | | | | 34,332,823 | | |
JPMorgan Chase & Co. | | | 734,220 | | | | 47,063,502 | | |
Wells Fargo & Co. | | | 486,455 | | | | 25,942,645 | | |
Total | | | | | 132,609,842 | | |
Capital Markets 3.1% | |
BlackRock, Inc. | | | 83,080 | | | | 25,129,208 | | |
Goldman Sachs Group, Inc. (The) | | | 131,420 | | | | 24,785,812 | | |
Total | | | | | 49,915,020 | | |
Consumer Finance 2.8% | |
American Express Co. | | | 585,395 | | | | 44,911,504 | | |
Diversified Financial Services 2.8% | |
Berkshire Hathaway, Inc., Class B(a) | | | 345,740 | | | | 46,342,990 | | |
Insurance 1.5% | |
Aon PLC | | | 260,680 | | | | 24,357,939 | | |
Real Estate Investment Trusts (REITs) 0.2% | |
Rayonier, Inc. | | | 174,860 | | | | 4,021,780 | | |
Total Financials | | | | | 302,159,075 | | |
HEALTH CARE 16.1% | |
Biotechnology 4.2% | |
Baxalta, Inc. | | | 299,895 | | | | 10,541,309 | | |
Biogen, Inc.(a) | | | 73,740 | | | | 21,922,902 | | |
Celgene Corp.(a) | | | 216,543 | | | | 25,569,398 | | |
Vertex Pharmaceuticals, Inc.(a) | | | 75,031 | | | | 9,567,953 | | |
Total | | | | | 67,601,562 | | |
The accompanying Notes to Financial Statements are an integral part of this statement.
Annual Report 2015
7
COLUMBIA VALUE AND RESTRUCTURING FUND
PORTFOLIO OF INVESTMENTS (continued)
August 31, 2015
Common Stocks (continued)
Issuer | | Shares | | Value ($) | |
Health Care Equipment & Supplies 5.8% | |
Abbott Laboratories | | | 635,320 | | | | 28,773,643 | | |
Medtronic PLC | | | 683,472 | | | | 49,408,191 | | |
St. Jude Medical, Inc. | | | 229,686 | | | | 16,264,065 | | |
Total | | | | | 94,445,899 | | |
Health Care Providers & Services 3.4% | |
Cardinal Health, Inc. | | | 370,112 | | | | 30,449,114 | | |
CIGNA Corp. | | | 170,165 | | | | 23,957,531 | | |
Total | | | | | 54,406,645 | | |
Pharmaceuticals 2.7% | |
Johnson & Johnson | | | 410,130 | | | | 38,544,017 | | |
Perrigo Co. PLC | | | 28,113 | | | | 5,143,836 | | |
Total | | | | | 43,687,853 | | |
Total Health Care | | | | | 260,141,959 | | |
INDUSTRIALS 11.6% | |
Aerospace & Defense 3.0% | |
Honeywell International, Inc. | | | 318,605 | | | | 31,627,919 | | |
United Technologies Corp. | | | 192,225 | | | | 17,609,732 | | |
Total | | | | | 49,237,651 | | |
Air Freight & Logistics 1.2% | |
FedEx Corp. | | | 125,460 | | | | 18,895,531 | | |
Building Products 0.6% | |
Fortune Brands Home & Security, Inc. | | | 200,673 | | | | 9,602,203 | | |
Commercial Services & Supplies 1.2% | |
Tyco International PLC | | | 527,227 | | | | 19,133,068 | | |
Industrial Conglomerates 1.8% | |
General Electric Co. | | | 1,146,945 | | | | 28,467,175 | | |
Professional Services 3.4% | |
Dun & Bradstreet Corp. (The) | | | 106,410 | | | | 11,276,268 | | |
IHS, Inc., Class A(a) | | | 78,115 | | | | 9,062,902 | | |
Nielsen Holdings PLC | | | 780,785 | | | | 35,314,905 | | |
Total | | | | | 55,654,075 | | |
Road & Rail 0.4% | |
Kansas City Southern | | | 71,068 | | | | 6,590,846 | | |
Total Industrials | | | | | 187,580,549 | | |
INFORMATION TECHNOLOGY 22.2% | |
Communications Equipment 0.3% | |
QUALCOMM, Inc. | | | 99,050 | | | | 5,604,249 | | |
Common Stocks (continued)
Issuer | | Shares | | Value ($) | |
Internet Software & Services 5.9% | |
Alibaba Group Holding Ltd., ADR(a) | | | 55,570 | | | | 3,674,288 | | |
Facebook, Inc., Class A(a) | | | 278,670 | | | | 24,921,458 | | |
Google, Inc., Class A(a) | | | 38,005 | | | | 24,620,399 | | |
Google, Inc., Class C(a) | | | 68,642 | | | | 42,437,917 | | |
Total | | | | | 95,654,062 | | |
IT Services 2.3% | |
MasterCard, Inc., Class A | | | 396,012 | | | | 36,579,629 | | |
Semiconductors & Semiconductor Equipment 2.4% | |
Broadcom Corp., Class A | | | 451,363 | | | | 23,321,926 | | |
Qorvo, Inc.(a) | | | 61,740 | | | | 3,427,187 | | |
Skyworks Solutions, Inc. | | | 134,650 | | | | 11,761,678 | | |
Total | | | | | 38,510,791 | | |
Software 5.4% | |
Activision Blizzard, Inc. | | | 849,320 | | | | 24,316,032 | | |
Electronic Arts, Inc.(a) | | | 195,490 | | | | 12,931,663 | | |
Intuit, Inc. | | | 149,960 | | | | 12,859,070 | | |
Microsoft Corp. | | | 863,390 | | | | 37,574,733 | | |
Total | | | | | 87,681,498 | | |
Technology Hardware, Storage & Peripherals 5.9% | |
Apple, Inc. | | | 589,165 | | | | 66,434,245 | | |
EMC Corp. | | | 839,320 | | | | 20,873,888 | | |
Hewlett-Packard Co. | | | 289,060 | | | | 8,111,024 | | |
Total | | | | | 95,419,157 | | |
Total Information Technology | | | | | 359,449,386 | | |
MATERIALS 0.6% | |
Chemicals 0.6% | |
LyondellBasell Industries NV, Class A | | | 39,580 | | | | 3,379,340 | | |
Monsanto Co. | | | 58,321 | | | | 5,695,046 | | |
Total | | | | | 9,074,386 | | |
Total Materials | | | | | 9,074,386 | | |
TELECOMMUNICATION SERVICES 2.8% | |
Diversified Telecommunication Services 2.8% | |
Verizon Communications, Inc. | | | 972,225 | | | | 44,732,072 | | |
Total Telecommunication Services | | | | | 44,732,072 | | |
The accompanying Notes to Financial Statements are an integral part of this statement.
Annual Report 2015
8
COLUMBIA VALUE AND RESTRUCTURING FUND
PORTFOLIO OF INVESTMENTS (continued)
August 31, 2015
Common Stocks (continued)
Issuer | | Shares | | Value ($) | |
UTILITIES 1.9% | |
Electric Utilities 1.3% | |
Duke Energy Corp. | | | 140,770 | | | | 9,982,001 | | |
Edison International | | | 190,172 | | | | 11,121,258 | | |
Total | | | | | 21,103,259 | | |
Multi-Utilities 0.6% | |
DTE Energy Co. | | | 128,689 | | | | 10,045,464 | | |
Total Utilities | | | | | 31,148,723 | | |
Total Common Stocks
(Cost: $1,252,364,334) | | | | | 1,603,885,437 | | |
Money Market Funds 0.4%
| | | Shares | | Value ($) | |
Columbia Short-Term Cash Fund,
0.150%(b)(c) | | | 6,183,725 | | | | 6,183,725 | | |
Total Money Market Funds
(Cost: $6,183,725) | | | | | 6,183,725 | | |
Total Investments
(Cost: $1,258,548,059) | | | | | 1,610,069,162 | | |
Other Assets & Liabilities, Net | | | | | 10,327,116 | | |
Net Assets | | | | | 1,620,396,278 | | |
Notes to Portfolio of Investments
(a) Non-income producing investment.
(b) The rate shown is the seven-day current annualized yield at August 31, 2015.
(c) As defined in the Investment Company Act of 1940, an affiliated company is one in which the Fund owns 5% or more of the company's outstanding voting securities, or a company which is under common ownership or control with the Fund. Holdings and transactions in these affiliated companies during the year ended August 31, 2015 are as follows:
Issuer | | Beginning
Cost ($) | | Purchase
Cost ($) | | Proceeds
From Sales ($) | | Ending
Cost ($) | | Dividends —
Affiliated
Issuers ($) | | Value ($) | |
Columbia Short-Term Cash Fund | | | 30,285,104 | | | | 530,583,325 | | | | (554,684,704 | ) | | | 6,183,725 | | | | 26,211 | | | | 6,183,725 | | |
Abbreviation Legend
ADR American Depositary Receipt
Fair Value Measurements
The Fund categorizes its fair value measurements according to a three-level hierarchy that maximizes the use of observable inputs and minimizes the use of unobservable inputs by prioritizing that the most observable input be used when available. Observable inputs are those that market participants would use in pricing an investment based on market data obtained from sources independent of the reporting entity. Unobservable inputs are those that reflect the Fund's assumptions about the information market participants would use in pricing an investment. An investment's level within the fair value hierarchy is based on the lowest level of any input that is deemed significant to the asset's or liability's fair value measurement. The input levels are not necessarily an indication of the risk or liquidity associated with investments at that level. For example, certain U.S. government securities are generally high quality and liquid, however, they are reflected as Level 2 because the inputs used to determine fair value may not always be quoted prices in an active market.
Fair value inputs are summarized in the three broad levels listed below:
> Level 1 — Valuations based on quoted prices for investments in active markets that the Fund has the ability to access at the measurement date (including NAV for open-end mutual funds). Valuation adjustments are not applied to Level 1 investments.
> Level 2 — Valuations based on other significant observable inputs (including quoted prices for similar securities, interest rates, prepayment speeds, credit risks, etc.).
> Level 3 — Valuations based on significant unobservable inputs (including the Fund's own assumptions and judgment in determining the fair value of investments).
The accompanying Notes to Financial Statements are an integral part of this statement.
Annual Report 2015
9
COLUMBIA VALUE AND RESTRUCTURING FUND
PORTFOLIO OF INVESTMENTS (continued)
August 31, 2015
Fair Value Measurements (continued)
Inputs that are used in determining fair value of an investment may include price information, credit data, volatility statistics, and other factors. These inputs can be either observable or unobservable. The availability of observable inputs can vary between investments, and is affected by various factors such as the type of investment, and the volume and level of activity for that investment or similar investments in the marketplace. The inputs will be considered by the Investment Manager, along with any other relevant factors in the calculation of an investment's fair value. The Fund uses prices and inputs that are current as of the measurement date, which may include periods of market dislocations. During these periods, the availability of prices and inputs may be reduced for many investments. This condition could cause an investment to be reclassified between the various levels within the hierarchy.
Investments falling into the Level 3 category are primarily supported by quoted prices from brokers and dealers participating in the market for those investments. However, these may be classified as Level 3 investments due to lack of market transparency and corroboration to support these quoted prices. Additionally, valuation models may be used as the pricing source for any remaining investments classified as Level 3. These models may rely on one or more significant unobservable inputs and/or significant assumptions by the Investment Manager. Inputs used in valuations may include, but are not limited to, financial statement analysis, capital account balances, discount rates and estimated cash flows, and comparable company data.
Under the direction of the Fund's Board of Trustees (the Board), the Investment Manager's Valuation Committee (the Committee) is responsible for overseeing the valuation procedures approved by the Board. The Committee consists of voting and non-voting members from various groups within the Investment Manager's organization, including operations and accounting, trading and investments, compliance, risk management and legal.
The Committee meets at least monthly to review and approve valuation matters, which may include a description of specific valuation determinations, data regarding pricing information received from approved pricing vendors and brokers and the results of Board-approved valuation control policies and procedures (the Policies). The Policies address, among other things, instances when market quotations are or are not readily available, including recommendations of third party pricing vendors and a determination of appropriate pricing methodologies; events that require specific valuation determinations and assessment of fair value techniques; securities with a potential for stale pricing, including those that are illiquid, restricted, or in default; and the effectiveness of third party pricing vendors, including periodic reviews of vendors. The Committee meets more frequently, as needed, to discuss additional valuation matters, which may include the need to review back-testing results, review time-sensitive information or approve related valuation actions. The Committee reports to the Board, with members of the Committee meeting with the Board at each of its regularly scheduled meetings to discuss valuation matters and actions during the period, similar to those described earlier.
For investments categorized as Level 3, the Committee monitors information similar to that described above, which may include: (i) data specific to the issuer or comparable issuers, (ii) general market or specific sector news and (iii) quoted prices and specific or similar security transactions. The Committee considers this data and any changes from prior periods in order to assess the reasonableness of observable and unobservable inputs, any assumptions or internal models used to value those securities and changes in fair value. This data is also used to corroborate, when available, information received from approved pricing vendors and brokers. Various factors impact the frequency of monitoring this information (which may occur as often as daily). However, the Committee may determine that changes to inputs, assumptions and models are not required as a result of the monitoring procedures performed.
The accompanying Notes to Financial Statements are an integral part of this statement.
Annual Report 2015
10
COLUMBIA VALUE AND RESTRUCTURING FUND
PORTFOLIO OF INVESTMENTS (continued)
August 31, 2015
Fair Value Measurements (continued)
The following table is a summary of the inputs used to value the Fund's investments at August 31, 2015:
| | | Level 1
Quoted Prices in Active
Markets for Identical
Assets ($) | | Level 2
Other Significant
Observable Inputs ($) | | Level 3
Significant
Unobservable Inputs ($) | | Total ($) | |
Investments | |
Common Stocks | |
Consumer Discretionary | | | 178,223,086 | | | | — | | | | — | | | | 178,223,086 | | |
Consumer Staples | | | 130,349,493 | | | | — | | | | — | | | | 130,349,493 | | |
Energy | | | 101,026,708 | | | | — | | | | — | | | | 101,026,708 | | |
Financials | | | 302,159,075 | | | | — | | | | — | | | | 302,159,075 | | |
Health Care | | | 260,141,959 | | | | — | | | | — | | | | 260,141,959 | | |
Industrials | | | 187,580,549 | | | | — | | | | — | | | | 187,580,549 | | |
Information Technology | | | 359,449,386 | | | | — | | | | — | | | | 359,449,386 | | |
Materials | | | 9,074,386 | | | | — | | | | — | | | | 9,074,386 | | |
Telecommunication Services | | | 44,732,072 | | | | — | | | | — | | | | 44,732,072 | | |
Utilities | | | 31,148,723 | | | | — | | | | — | | | | 31,148,723 | | |
Total Common Stocks | | | 1,603,885,437 | | | | — | | | | — | | | | 1,603,885,437 | | |
Money Market Funds | | | — | | | | 6,183,725 | | | | — | | | | 6,183,725 | | |
Total Investments | | | 1,603,885,437 | | | | 6,183,725 | | | | — | | | | 1,610,069,162 | | |
See the Portfolio of Investments for all investment classifications not indicated in the table.
Financial assets were transferred from Level 1 to Level 2 as the market for these assets is not considered publicly available. Fund per share market values were obtained using observable market inputs.
The following table shows transfers between Level 1 and Level 2 of the fair value hierarchy:
Transfers In | | Transfers Out | |
| Level 1 ($) | | Level 2 ($) | | Level 1 ($) | | Level 2 ($) | |
| | — | | | | 30,285,104 | | | | 30,285,104 | | | | — | | |
Transfers between Level 1 and Level 2 are determined based on the fair value at the beginning of the period for security positions held throughout the period.
There were no transfers of financial assets between Levels 2 and 3 during the period.
The accompanying Notes to Financial Statements are an integral part of this statement.
Annual Report 2015
11
COLUMBIA VALUE AND RESTRUCTURING FUND
STATEMENT OF ASSETS AND LIABILITIES
August 31, 2015
Assets | |
Investments, at value | |
Unaffiliated issuers (identified cost $1,252,364,334) | | $ | 1,603,885,437 | | |
Affiliated issuers (identified cost $6,183,725) | | | 6,183,725 | | |
Total investments (identified cost $1,258,548,059) | | | 1,610,069,162 | | |
Receivable for: | |
Investments sold | | | 18,081,950 | | |
Capital shares sold | | | 529,544 | | |
Dividends | | | 2,899,266 | | |
Foreign tax reclaims | | | 703 | | |
Prepaid expenses | | | 17,033 | | |
Trustees' deferred compensation plan | | | 247,262 | | |
Total assets | | | 1,631,844,920 | | |
Liabilities | |
Payable for: | |
Investments purchased | | | 7,276,199 | | |
Capital shares purchased | | | 3,449,711 | | |
Investment management fees | | | 95,793 | | |
Distribution and/or service fees | | | 4,061 | | |
Transfer agent fees | | | 283,252 | | |
Compensation of board members | | | 1,081 | | |
Chief compliance officer expenses | | | 143 | | |
Other expenses | | | 91,140 | | |
Trustees' deferred compensation plan | | | 247,262 | | |
Total liabilities | | | 11,448,642 | | |
Net assets applicable to outstanding capital stock | | $ | 1,620,396,278 | | |
Represented by | |
Paid-in capital | | $ | 1,081,200,869 | | |
Undistributed net investment income | | | 31,205,553 | | |
Accumulated net realized gain | | | 156,468,753 | | |
Unrealized appreciation (depreciation) on: | |
Investments | | | 351,521,103 | | |
Total — representing net assets applicable to outstanding capital stock | | $ | 1,620,396,278 | | |
The accompanying Notes to Financial Statements are an integral part of this statement.
Annual Report 2015
12
COLUMBIA VALUE AND RESTRUCTURING FUND
STATEMENT OF ASSETS AND LIABILITIES (continued)
August 31, 2015
Class A | |
Net assets | | $ | 76,611,151 | | |
Shares outstanding | | | 1,695,749 | | |
Net asset value per share | | $ | 45.18 | | |
Maximum offering price per share(a) | | $ | 47.94 | | |
Class C | |
Net assets | | $ | 25,598,869 | | |
Shares outstanding | | | 574,952 | | |
Net asset value per share | | $ | 44.52 | | |
Class I | |
Net assets | | $ | 2,319 | | |
Shares outstanding | | | 51 | | |
Net asset value per share(b) | | $ | 45.04 | | |
Class R | |
Net assets | | $ | 8,354,897 | | |
Shares outstanding | | | 185,263 | | |
Net asset value per share | | $ | 45.10 | | |
Class R4 | |
Net assets | | $ | 5,336,622 | | |
Shares outstanding | | | 115,940 | | |
Net asset value per share | | $ | 46.03 | | |
Class R5 | |
Net assets | | $ | 18,039,275 | | |
Shares outstanding | | | 391,767 | | |
Net asset value per share | | $ | 46.05 | | |
Class W | |
Net assets | | $ | 2,325 | | |
Shares outstanding | | | 51 | | |
Net asset value per share(b) | | $ | 45.16 | | |
Class Y | |
Net assets | | $ | 1,105,091 | | |
Shares outstanding | | | 24,047 | | |
Net asset value per share | | $ | 45.96 | | |
Class Z | |
Net assets | | $ | 1,485,345,729 | | |
Shares outstanding | | | 32,896,062 | | |
Net asset value per share | | $ | 45.15 | | |
(a) The maximum offering price per share is calculated by dividing the net asset value per share by 1.0 minus the maximum sales charge of 5.75%.
(b) Net asset value per share rounds to this amount due to fractional shares outstanding.
The accompanying Notes to Financial Statements are an integral part of this statement.
Annual Report 2015
13
COLUMBIA VALUE AND RESTRUCTURING FUND
STATEMENT OF OPERATIONS
Year Ended August 31, 2015
Net investment income | |
Income: | |
Dividends — unaffiliated issuers | | $ | 71,946,431 | | |
Dividends — affiliated issuers | | | 26,211 | | |
Foreign taxes withheld | | | (121,831 | ) | |
Total income | | | 71,850,811 | | |
Expenses: | |
Investment management fees | | | 13,635,782 | | |
Distribution and/or service fees | |
Class A | | | 222,070 | | |
Class C | | | 280,854 | | |
Class R | | | 50,488 | | |
Class W | | | 6 | | |
Transfer agent fees | |
Class A | | | 174,651 | | |
Class C | | | 55,269 | | |
Class R | | | 19,877 | | |
Class R4 | | | 9,465 | | |
Class R5 | | | 8,449 | | |
Class W | | | 4 | | |
Class Z | | | 3,314,497 | | |
Compensation of board members | | | 53,176 | | |
Custodian fees | | | 16,243 | | |
Printing and postage fees | | | 139,905 | | |
Registration fees | | | 124,269 | | |
Professional fees | | | 97,387 | | |
Chief compliance officer expenses | | | 903 | | |
Other | | | 48,394 | | |
Total expenses | | | 18,251,689 | | |
Expense reductions | | | (10,382 | ) | |
Total net expenses | | | 18,241,307 | | |
Net investment income | | | 53,609,504 | | |
Realized and unrealized gain (loss) — net | |
Net realized gain (loss) on: | |
Investments | | | 196,585,186 | | |
Foreign currency translations | | | (45,235 | ) | |
Net realized gain | | | 196,539,951 | | |
Net change in unrealized appreciation (depreciation) on: | |
Investments | | | (205,927,845 | ) | |
Foreign currency translations | | | 18,312 | | |
Net change in unrealized depreciation | | | (205,909,533 | ) | |
Net realized and unrealized loss | | | (9,369,582 | ) | |
Net increase in net assets resulting from operations | | $ | 44,239,922 | | |
The accompanying Notes to Financial Statements are an integral part of this statement.
Annual Report 2015
14
COLUMBIA VALUE AND RESTRUCTURING FUND
STATEMENT OF CHANGES IN NET ASSETS
| | | Year Ended
August 31,
2015 | | Year Ended
August 31,
2014 | |
Operations | |
Net investment income | | $ | 53,609,504 | | | $ | 16,395,649 | | |
Net realized gain | | | 196,539,951 | | | | 319,397,026 | | |
Net change in unrealized appreciation (depreciation) | | | (205,909,533 | ) | | | 116,822,658 | | |
Net increase in net assets resulting from operations | | | 44,239,922 | | | | 452,615,333 | | |
Distributions to shareholders | |
Net investment income | |
Class A | | | (1,056,246 | ) | | | (502,787 | ) | |
Class C | | | (203,200 | ) | | | — | | |
Class I | | | (42 | ) | | | (27 | ) | |
Class R | | | (88,545 | ) | | | (34,842 | ) | |
Class R4 | | | (67,003 | ) | | | (29,800 | ) | |
Class R5 | | | (267,688 | ) | | | (99,296 | ) | |
Class W | | | (31 | ) | | | (15 | ) | |
Class Y | | | (18,906 | ) | | | (8,670 | ) | |
Class Z | | | (23,967,549 | ) | | | (13,922,846 | ) | |
Net realized gains | |
Class A | | | (15,210,805 | ) | | | (19,773,142 | ) | |
Class C | | | (4,579,159 | ) | | | (5,258,141 | ) | |
Class I | | | (446 | ) | | | (573 | ) | |
Class R | | | (1,702,094 | ) | | | (2,735,402 | ) | |
Class R4 | | | (781,042 | ) | | | (711,057 | ) | |
Class R5 | | | (2,494,019 | ) | | | (1,904,189 | ) | |
Class W | | | (446 | ) | | | (572 | ) | |
Class Y | | | (172,306 | ) | | | (176,818 | ) | |
Class Z | | | (280,000,008 | ) | | | (345,469,085 | ) | |
Total distributions to shareholders | | | (330,609,535 | ) | | | (390,627,262 | ) | |
Decrease in net assets from capital stock activity | | | (55,291,136 | ) | | | (217,281,989 | ) | |
Total decrease in net assets | | | (341,660,749 | ) | | | (155,293,918 | ) | |
Net assets at beginning of year | | | 1,962,057,027 | | | | 2,117,350,945 | | |
Net assets at end of year | | $ | 1,620,396,278 | | | $ | 1,962,057,027 | | |
Undistributed net investment income | | $ | 31,205,553 | | | $ | 3,316,425 | | |
The accompanying Notes to Financial Statements are an integral part of this statement.
Annual Report 2015
15
COLUMBIA VALUE AND RESTRUCTURING FUND
STATEMENT OF CHANGES IN NET ASSETS (continued)
| | | Year Ended August 31, 2015 | | Year Ended August 31, 2014 | |
| | | Shares | | Dollars ($) | | Shares | | Dollars ($) | |
Capital stock activity | |
Class A shares | |
Subscriptions | | | 348,457 | | | | 17,422,755 | | | | 375,367 | | | | 19,868,540 | | |
Distributions reinvested | | | 331,848 | | | | 15,182,599 | | | | 397,534 | | | | 19,043,672 | | |
Redemptions | | | (781,661 | ) | | | (37,883,080 | ) | | | (942,149 | ) | | | (47,675,725 | ) | |
Net decrease | | | (101,356 | ) | | | (5,277,726 | ) | | | (169,248 | ) | | | (8,763,513 | ) | |
Class C shares | |
Subscriptions | | | 39,013 | | | | 1,814,781 | | | | 36,514 | | | | 1,808,527 | | |
Distributions reinvested | | | 91,526 | | | | 4,131,292 | | | | 97,980 | | | | 4,656,025 | | |
Redemptions | | | (102,060 | ) | | | (4,851,856 | ) | | | (138,492 | ) | | | (6,979,548 | ) | |
Net increase (decrease) | | | 28,479 | | | | 1,094,217 | | | | (3,998 | ) | | | (514,996 | ) | |
Class I shares | |
Redemptions | | | — | | | | — | | | | (7 | ) | | | (300 | ) | |
Net increase (decrease) | | | — | | | | — | | | | (7 | ) | | | (300 | ) | |
Class R shares | |
Subscriptions | | | 30,807 | | | | 1,503,768 | | | | 42,415 | | | | 2,180,001 | | |
Distributions reinvested | | | 39,222 | | | | 1,790,639 | | | | 57,901 | | | | 2,769,518 | | |
Redemptions | | | (93,918 | ) | | | (4,520,637 | ) | | | (237,423 | ) | | | (12,177,484 | ) | |
Net decrease | | | (23,889 | ) | | | (1,226,230 | ) | | | (137,107 | ) | | | (7,227,965 | ) | |
Class R4 shares | |
Subscriptions | | | 37,714 | | | | 1,847,242 | | | | 32,137 | | | | 1,672,683 | | |
Distributions reinvested | | | 18,181 | | | | 847,561 | | | | 15,214 | | | | 740,324 | | |
Redemptions | | | (33,839 | ) | | | (1,669,211 | ) | | | (15,715 | ) | | | (806,151 | ) | |
Net increase | | | 22,056 | | | | 1,025,592 | | | | 31,636 | | | | 1,606,856 | | |
Class R5 shares | |
Subscriptions | | | 234,283 | | | | 11,340,234 | | | | 152,610 | | | | 7,893,368 | | |
Distributions reinvested | | | 59,181 | | | | 2,761,219 | | | | 41,146 | | | | 2,002,907 | | |
Redemptions | | | (195,693 | ) | | | (9,565,480 | ) | | | (71,358 | ) | | | (3,659,652 | ) | |
Net increase | | | 97,771 | | | | 4,535,973 | | | | 122,398 | | | | 6,236,623 | | |
Class W shares | |
Redemptions | | | — | | | | — | | | | (7 | ) | | | (300 | ) | |
Net increase (decrease) | | | — | | | | — | | | | (7 | ) | | | (300 | ) | |
Class Y shares | |
Subscriptions | | | 3,043 | | | | 146,692 | | | | 8,617 | | | | 458,557 | | |
Distributions reinvested | | | 4,095 | | | | 190,722 | | | | 3,807 | | | | 184,949 | | |
Redemptions | | | (2,562 | ) | | | (125,361 | ) | | | (7,971 | ) | | | (407,825 | ) | |
Net increase | | | 4,576 | | | | 212,053 | | | | 4,453 | | | | 235,681 | | |
The accompanying Notes to Financial Statements are an integral part of this statement.
Annual Report 2015
16
COLUMBIA VALUE AND RESTRUCTURING FUND
STATEMENT OF CHANGES IN NET ASSETS (continued)
| | | Year Ended August 31, 2015 | | Year Ended August 31, 2014 | |
| | | Shares | | Dollars ($) | | Shares | | Dollars ($) | |
Capital stock activity (continued) | |
Class Z shares | |
Subscriptions | | | 1,053,132 | | | | 50,605,248 | | | | 1,223,887 | | | | 62,142,265 | | |
Distributions reinvested | | | 5,676,217 | | | | 259,653,974 | | | | 6,367,437 | | | | 304,978,976 | | |
Redemptions | | | (7,572,908 | ) | | | (365,914,237 | ) | | | (11,215,373 | ) | | | (575,975,316 | ) | |
Net decrease | | | (843,559 | ) | | | (55,655,015 | ) | | | (3,624,049 | ) | | | (208,854,075 | ) | |
Total net decrease | | | (815,922 | ) | | | (55,291,136 | ) | | | (3,775,929 | ) | | | (217,281,989 | ) | |
The accompanying Notes to Financial Statements are an integral part of this statement.
Annual Report 2015
17
COLUMBIA VALUE AND RESTRUCTURING FUND
The following tables are intended to help you understand the Fund's financial performance. Certain information reflects financial results for a single share of a class held for the periods shown. Per share net investment income (loss) amounts are calculated based on average shares outstanding during the period. Total return assumes reinvestment of all dividends and distributions, if any. Total return does not reflect payment of sales charges, if any. Total return and portfolio turnover are not annualized for periods of less than one year. The portfolio turnover rate is calculated without regard to purchase and sales transactions of short-term instruments and certain derivatives, if any. If such transactions were included, the Fund's portfolio turnover rate may be higher.
| | | Year Ended August 31, | | Year Ended
March 31, | |
Class A | | 2015 | | 2014 | | 2013 | | 2012(a) | | 2012 | | 2011 | |
Per share data | |
Net asset value, beginning of period | | $ | 53.48 | | | $ | 52.33 | | | $ | 48.59 | | | $ | 49.58 | | | $ | 53.03 | | | $ | 44.68 | | |
Income from investment operations: | |
Net investment income | | | 1.29 | (h) | | | 0.30 | | | | 0.32 | | | | 0.23 | | | | 0.49 | | | | 0.53 | (b) | |
Net realized and unrealized gain (loss) | | | (0.33 | ) | | | 11.06 | | | | 9.81 | | | | (1.06 | ) | | | (3.45 | ) | | | 8.37 | | |
Total from investment operations | | | 0.96 | | | | 11.36 | | | | 10.13 | | | | (0.83 | ) | | | (2.96 | ) | | | 8.90 | | |
Less distributions to shareholders: | |
Net investment income | | | (0.59 | ) | | | (0.25 | ) | | | (0.39 | ) | | | (0.16 | ) | | | (0.49 | ) | | | (0.55 | ) | |
Net realized gains | | | (8.67 | ) | | | (9.96 | ) | | | (6.00 | ) | | | — | | | | — | | | | — | | |
Total distributions to shareholders | | | (9.26 | ) | | | (10.21 | ) | | | (6.39 | ) | | | (0.16 | ) | | | (0.49 | ) | | | (0.55 | ) | |
Net asset value, end of period | | $ | 45.18 | | | $ | 53.48 | | | $ | 52.33 | | | $ | 48.59 | | | $ | 49.58 | | | $ | 53.03 | | |
Total return | | | 1.76 | % | | | 24.05 | % | | | 23.42 | % | | | (1.65 | %) | | | (5.49 | %) | | | 20.17 | % | |
Ratios to average net assets(c) | |
Total gross expenses | | | 1.22 | % | | | 1.21 | % | | | 1.21 | %(d) | | | 1.26 | %(e) | | | 1.26 | %(d) | | | 1.20 | %(d) | |
Total net expenses(f) | | | 1.22 | %(g) | | | 1.21 | %(g) | | | 1.21 | %(d)(g) | | | 1.19 | %(e)(g) | | | 1.19 | %(d)(g) | | | 1.20 | %(d)(g) | |
Net investment income | | | 2.62 | % | | | 0.58 | % | | | 0.66 | % | | | 1.15 | %(e) | | | 1.03 | % | | | 1.16 | % | |
Supplemental data | |
Net assets, end of period (in thousands) | | $ | 76,611 | | | $ | 96,116 | | | $ | 102,893 | | | $ | 134,228 | | | $ | 166,301 | | | $ | 268,124 | | |
Portfolio turnover | | | 58 | % | | | 55 | % | | | 55 | % | | | 64 | % | | | 9 | % | | | 12 | % | |
Notes to Financial Highlights
(a) For the period from April 1, 2012 to August 31, 2012. During the period, the Fund's fiscal year end was changed from March 31 to August 31.
(b) Net investment income per share reflects special dividends. The effect of these dividends amounted to $0.18 per share.
(c) In addition to the fees and expenses that the Fund bears directly, the Fund indirectly bears a pro rata share of the fees and expenses of any other funds in which it invests. Such indirect expenses are not included in the Fund's reported expense ratios.
(d) Ratios include line of credit interest expense which is less than 0.01%.
(e) Annualized.
(f) Total net expenses include the impact of certain fee waivers/expense reimbursements made by the Investment Manager and certain of its affiliates, if applicable.
(g) The benefits derived from expense reductions had an impact of less than 0.01%.
(h) Net investment income per share includes special dividends. The effect of these dividends amounted to $1.12 per share.
The accompanying Notes to Financial Statements are an integral part of this statement.
Annual Report 2015
18
COLUMBIA VALUE AND RESTRUCTURING FUND
FINANCIAL HIGHLIGHTS (continued)
| | | Year Ended August 31, | | Year Ended
March 31, | |
Class C | | 2015 | | 2014 | | 2013 | | 2012(a) | | 2012 | | 2011 | |
Per share data | |
Net asset value, beginning of period | | $ | 52.96 | | | $ | 52.02 | | | $ | 48.38 | | | $ | 49.44 | | | $ | 52.89 | | | $ | 44.60 | | |
Income from investment operations: | |
Net investment income (loss) | | | 0.98 | (h) | | | (0.09 | ) | | | (0.04 | ) | | | 0.08 | | | | 0.13 | | | | 0.18 | (b) | |
Net realized and unrealized gain (loss) | | | (0.40 | ) | | | 10.99 | | | | 9.76 | | | | (1.07 | ) | | | (3.41 | ) | | | 8.36 | | |
Total from investment operations | | | 0.58 | | | | 10.90 | | | | 9.72 | | | | (0.99 | ) | | | (3.28 | ) | | | 8.54 | | |
Less distributions to shareholders: | |
Net investment income | | | (0.35 | ) | | | — | | | | (0.08 | ) | | | (0.07 | ) | | | (0.17 | ) | | | (0.25 | ) | |
Net realized gains | | | (8.67 | ) | | | (9.96 | ) | | | (6.00 | ) | | | — | | | | — | | | | — | | |
Total distributions to shareholders | | | (9.02 | ) | | | (9.96 | ) | | | (6.08 | ) | | | (0.07 | ) | | | (0.17 | ) | | | (0.25 | ) | |
Net asset value, end of period | | $ | 44.52 | | | $ | 52.96 | | | $ | 52.02 | | | $ | 48.38 | | | $ | 49.44 | | | $ | 52.89 | | |
Total return | | | 0.98 | % | | | 23.14 | % | | | 22.52 | % | | | (1.98 | %) | | | (6.18 | %) | | | 19.27 | % | |
Ratios to average net assets(c) | |
Total gross expenses | | | 1.97 | % | | | 1.96 | % | | | 1.96 | %(d) | | | 2.01 | %(e) | | | 1.99 | %(d) | | | 1.95 | %(d) | |
Total net expenses(f) | | | 1.97 | %(g) | | | 1.96 | %(g) | | | 1.96 | %(d)(g) | | | 1.94 | %(e)(g) | | | 1.95 | %(d)(g) | | | 1.95 | %(d)(g) | |
Net investment income (loss) | | | 2.02 | % | | | (0.17 | %) | | | (0.09 | %) | | | 0.41 | %(e) | | | 0.28 | % | | | 0.40 | % | |
Supplemental data | |
Net assets, end of period (in thousands) | | $ | 25,599 | | | $ | 28,942 | | | $ | 28,634 | | | $ | 35,288 | | | $ | 41,945 | | | $ | 71,083 | | |
Portfolio turnover | | | 58 | % | | | 55 | % | | | 55 | % | | | 64 | % | | | 9 | % | | | 12 | % | |
Notes to Financial Highlights
(a) For the period from April 1, 2012 to August 31, 2012. During the period, the Fund's fiscal year end was changed from March 31 to August 31.
(b) Net investment income per share reflects special dividends. The effect of these dividends amounted to $0.18 per share.
(c) In addition to the fees and expenses that the Fund bears directly, the Fund indirectly bears a pro rata share of the fees and expenses of any other funds in which it invests. Such indirect expenses are not included in the Fund's reported expense ratios.
(d) Ratios include line of credit interest expense which is less than 0.01%.
(e) Annualized.
(f) Total net expenses include the impact of certain fee waivers/expense reimbursements made by the Investment Manager and certain of its affiliates, if applicable.
(g) The benefits derived from expense reductions had an impact of less than 0.01%.
(h) Net investment income per share includes special dividends. The effect of these dividends amounted to $1.18 per share.
The accompanying Notes to Financial Statements are an integral part of this statement.
Annual Report 2015
19
COLUMBIA VALUE AND RESTRUCTURING FUND
FINANCIAL HIGHLIGHTS (continued)
| | | Year Ended August 31, | | Year Ended
March 31, | |
Class I | | 2015 | | 2014 | | 2013 | | 2012(a) | | 2012 | | 2011(b) | |
Per share data | |
Net asset value, beginning of period | | $ | 53.35 | | | $ | 52.22 | | | $ | 48.50 | | | $ | 49.48 | | | $ | 53.03 | | | $ | 43.47 | | |
Income from investment operations: | |
Net investment income | | | 1.59 | (h) | | | 0.53 | | | | 0.55 | | | | 0.31 | | | | 0.09 | | | | 0.27 | | |
Net realized and unrealized gain (loss) | | | (0.42 | ) | | | 11.04 | | | | 9.77 | | | | (1.08 | ) | | | (2.95 | ) | | | 9.57 | | |
Total from investment operations | | | 1.17 | | | | 11.57 | | | | 10.32 | | | | (0.77 | ) | | | (2.86 | ) | | | 9.84 | | |
Less distributions to shareholders: | |
Net investment income | | | (0.81 | ) | | | (0.48 | ) | | | (0.60 | ) | | | (0.21 | ) | | | (0.69 | ) | | | (0.28 | ) | |
Net realized gains | | | (8.67 | ) | | | (9.96 | ) | | | (6.00 | ) | | | — | | | | — | | | | — | | |
Total distributions to shareholders | | | (9.48 | ) | | | (10.44 | ) | | | (6.60 | ) | | | (0.21 | ) | | | (0.69 | ) | | | (0.28 | ) | |
Net asset value, end of period | | $ | 45.04 | | | $ | 53.35 | | | $ | 52.22 | | | $ | 48.50 | | | $ | 49.48 | | | $ | 53.03 | | |
Total return | | | 2.21 | % | | | 24.63 | % | | | 23.98 | % | | | (1.52 | %) | | | (5.26 | %) | | | 22.67 | % | |
Ratios to average net assets(c) | |
Total gross expenses | | | 0.76 | % | | | 0.76 | % | | | 0.76 | %(d) | | | 0.81 | %(e) | | | 0.78 | %(d) | | | 0.79 | %(d)(e) | |
Total net expenses(f) | | | 0.76 | % | | | 0.76 | % | | | 0.76 | %(d) | | | 0.81 | %(e) | | | 0.78 | %(d)(g) | | | 0.79 | %(d)(e)(g) | |
Net investment income | | | 3.24 | % | | | 1.03 | % | | | 1.11 | % | | | 1.55 | %(e) | | | 0.17 | % | | | 1.05 | %(e) | |
Supplemental data | |
Net assets, end of period (in thousands) | | $ | 2 | | | $ | 3 | | | $ | 3 | | | $ | 3 | | | $ | 3 | | | $ | 26,652 | | |
Portfolio turnover | | | 58 | % | | | 55 | % | | | 55 | % | | | 64 | % | | | 9 | % | | | 12 | % | |
Notes to Financial Highlights
(a) For the period from April 1, 2012 to August 31, 2012. During the period, the Fund's fiscal year end was changed from March 31 to August 31.
(b) Based on operations from September 27, 2010 (commencement of operations) through the stated period end.
(c) In addition to the fees and expenses that the Fund bears directly, the Fund indirectly bears a pro rata share of the fees and expenses of any other funds in which it invests. Such indirect expenses are not included in the Fund's reported expense ratios.
(d) Ratios include line of credit interest expense which is less than 0.01%.
(e) Annualized.
(f) Total net expenses include the impact of certain fee waivers/expense reimbursements made by the Investment Manager and certain of its affiliates, if applicable.
(g) The benefits derived from expense reductions had an impact of less than 0.01%.
(h) Net investment income per share includes special dividends. The effect of these dividends amounted to $1.20 per share.
The accompanying Notes to Financial Statements are an integral part of this statement.
Annual Report 2015
20
COLUMBIA VALUE AND RESTRUCTURING FUND
FINANCIAL HIGHLIGHTS (continued)
| | | Year Ended August 31, | | Year Ended
March 31, | |
Class R | | 2015 | | 2014 | | 2013 | | 2012(a) | | 2012 | | 2011 | |
Per share data | |
Net asset value, beginning of period | | $ | 53.40 | | | $ | 52.26 | | | $ | 48.53 | | | $ | 49.55 | | | $ | 52.98 | | | $ | 44.64 | | |
Income from investment operations: | |
Net investment income | | | 1.13 | (h) | | | 0.16 | | | | 0.20 | | | | 0.18 | | | | 0.37 | | | | 0.41 | (b) | |
Net realized and unrealized gain (loss) | | | (0.30 | ) | | | 11.06 | | | | 9.80 | | | | (1.07 | ) | | | (3.43 | ) | | | 8.37 | | |
Total from investment operations | | | 0.83 | | | | 11.22 | | | | 10.00 | | | | (0.89 | ) | | | (3.06 | ) | | | 8.78 | | |
Less distributions to shareholders: | |
Net investment income | | | (0.46 | ) | | | (0.12 | ) | | | (0.27 | ) | | | (0.13 | ) | | | (0.37 | ) | | | (0.44 | ) | |
Net realized gains | | | (8.67 | ) | | | (9.96 | ) | | | (6.00 | ) | | | — | | | | — | | | | — | | |
Total distributions to shareholders | | | (9.13 | ) | | | (10.08 | ) | | | (6.27 | ) | | | (0.13 | ) | | | (0.37 | ) | | | (0.44 | ) | |
Net asset value, end of period | | $ | 45.10 | | | $ | 53.40 | | | $ | 52.26 | | | $ | 48.53 | | | $ | 49.55 | | | $ | 52.98 | | |
Total return | | | 1.50 | % | | | 23.75 | % | | | 23.12 | % | | | (1.77 | %) | | | (5.70 | %) | | | 19.86 | % | |
Ratios to average net assets(c) | |
Total gross expenses | | | 1.47 | % | | | 1.46 | % | | | 1.46 | %(d) | | | 1.51 | %(e) | | | 1.50 | %(d) | | | 1.45 | %(d) | |
Total net expenses(f) | | | 1.47 | %(g) | | | 1.46 | %(g) | | | 1.46 | %(d)(g) | | | 1.44 | %(e)(g) | | | 1.44 | %(d)(g) | | | 1.45 | %(d)(g) | |
Net investment income | | | 2.30 | % | | | 0.31 | % | | | 0.40 | % | | | 0.91 | %(e) | | | 0.76 | % | | | 0.91 | % | |
Supplemental data | |
Net assets, end of period (in thousands) | | $ | 8,355 | | | $ | 11,170 | | | $ | 18,096 | | | $ | 32,095 | | | $ | 38,799 | | | $ | 65,321 | | |
Portfolio turnover | | | 58 | % | | | 55 | % | | | 55 | % | | | 64 | % | | | 9 | % | | | 12 | % | |
Notes to Financial Highlights
(a) For the period from April 1, 2012 to August 31, 2012. During the period, the Fund's fiscal year end was changed from March 31 to August 31.
(b) Net investment income per share reflects special dividends. The effect of these dividends amounted to $0.18 per share.
(c) In addition to the fees and expenses that the Fund bears directly, the Fund indirectly bears a pro rata share of the fees and expenses of any other funds in which it invests. Such indirect expenses are not included in the Fund's reported expense ratios.
(d) Ratios include line of credit interest expense which is less than 0.01%.
(e) Annualized.
(f) Total net expenses include the impact of certain fee waivers/expense reimbursements made by the Investment Manager and certain of its affiliates, if applicable.
(g) The benefits derived from expense reductions had an impact of less than 0.01%.
(h) Net investment income per share includes special dividends. The effect of these dividends amounted to $1.09 per share.
The accompanying Notes to Financial Statements are an integral part of this statement.
Annual Report 2015
21
COLUMBIA VALUE AND RESTRUCTURING FUND
FINANCIAL HIGHLIGHTS (continued)
| | | Year Ended August 31, | |
Class R4 | | 2015 | | 2014 | | 2013(a) | |
Per share data | |
Net asset value, beginning of period | | $ | 54.31 | | | $ | 53.00 | | | $ | 48.51 | | |
Income from investment operations: | |
Net investment income | | | 1.77 | (g) | | | 0.43 | | | | 0.43 | | |
Net realized and unrealized gain (loss) | | | (0.67 | ) | | | 11.22 | | | | 10.42 | | |
Total from investment operations | | | 1.10 | | | | 11.65 | | | | 10.85 | | |
Less distributions to shareholders: | |
Net investment income | | | (0.71 | ) | | | (0.38 | ) | | | (0.36 | ) | |
Net realized gains | | | (8.67 | ) | | | (9.96 | ) | | | (6.00 | ) | |
Total distributions to shareholders | | | (9.38 | ) | | | (10.34 | ) | | | (6.36 | ) | |
Net asset value, end of period | | $ | 46.03 | | | $ | 54.31 | | | $ | 53.00 | | |
Total return | | | 2.02 | % | | | 24.37 | % | | | 24.95 | % | |
Ratios to average net assets(b) | |
Total gross expenses | | | 0.96 | % | | | 0.96 | % | | | 0.94 | %(c)(d) | |
Total net expenses(e) | | | 0.96 | %(f) | | | 0.96 | %(f) | | | 0.94 | %(c)(d)(f) | |
Net investment income | | | 3.55 | % | | | 0.83 | % | | | 1.04 | %(c) | |
Supplemental data | |
Net assets, end of period (in thousands) | | $ | 5,337 | | | $ | 5,099 | | | $ | 3,299 | | |
Portfolio turnover | | | 58 | % | | | 55 | % | | | 55 | % | |
Notes to Financial Highlights
(a) Based on operations from November 8, 2012 (commencement of operations) through the stated period end.
(b) In addition to the fees and expenses that the Fund bears directly, the Fund indirectly bears a pro rata share of the fees and expenses of any other funds in which it invests. Such indirect expenses are not included in the Fund's reported expense ratios.
(c) Annualized.
(d) Ratios include line of credit interest expense which is less than 0.01%.
(e) Total net expenses include the impact of certain fee waivers/expense reimbursements made by the Investment Manager and certain of its affiliates, if applicable.
(f) The benefits derived from expense reductions had an impact of less than 0.01%.
(g) Net investment income per share includes special dividends. The effect of these dividends amounted to $1.47 per share.
The accompanying Notes to Financial Statements are an integral part of this statement.
Annual Report 2015
22
COLUMBIA VALUE AND RESTRUCTURING FUND
FINANCIAL HIGHLIGHTS (continued)
| | | Year Ended August 31, | |
Class R5 | | 2015 | | 2014 | | 2013(a) | |
Per share data | |
Net asset value, beginning of period | | $ | 54.32 | | | $ | 53.00 | | | $ | 48.51 | | |
Income from investment operations: | |
Net investment income | | | 1.78 | (f) | | | 0.50 | | | | 0.46 | | |
Net realized and unrealized gain (loss) | | | (0.60 | ) | | | 11.23 | | | | 10.43 | | |
Total from investment operations | | | 1.18 | | | | 11.73 | | | | 10.89 | | |
Less distributions to shareholders: | |
Net investment income | | | (0.78 | ) | | | (0.45 | ) | | | (0.40 | ) | |
Net realized gains | | | (8.67 | ) | | | (9.96 | ) | | | (6.00 | ) | |
Total distributions to shareholders | | | (9.45 | ) | | | (10.41 | ) | | | (6.40 | ) | |
Net asset value, end of period | | $ | 46.05 | | | $ | 54.32 | | | $ | 53.00 | | |
Total return | | | 2.19 | % | | | 24.55 | % | | | 25.05 | % | |
Ratios to average net assets(b) | |
Total gross expenses | | | 0.82 | % | | | 0.83 | % | | | 0.81 | %(c)(d) | |
Total net expenses(e) | | | 0.82 | % | | | 0.83 | % | | | 0.81 | %(c)(d) | |
Net investment income | | | 3.58 | % | | | 0.97 | % | | | 1.11 | %(c) | |
Supplemental data | |
Net assets, end of period (in thousands) | | $ | 18,039 | | | $ | 15,970 | | | $ | 9,095 | | |
Portfolio turnover | | | 58 | % | | | 55 | % | | | 55 | % | |
Notes to Financial Highlights
(a) Based on operations from November 8, 2012 (commencement of operations) through the stated period end.
(b) In addition to the fees and expenses that the Fund bears directly, the Fund indirectly bears a pro rata share of the fees and expenses of any other funds in which it invests. Such indirect expenses are not included in the Fund's reported expense ratios.
(c) Annualized.
(d) Ratios include line of credit interest expense which is less than 0.01%.
(e) Total net expenses include the impact of certain fee waivers/expense reimbursements made by the Investment Manager and certain of its affiliates, if applicable.
(f) Net investment income per share includes special dividends. The effect of these dividends amounted to $1.41 per share.
The accompanying Notes to Financial Statements are an integral part of this statement.
Annual Report 2015
23
COLUMBIA VALUE AND RESTRUCTURING FUND
FINANCIAL HIGHLIGHTS (continued)
| | | Year Ended August 31, | | Year Ended
March 31, | |
Class W | | 2015 | | 2014 | | 2013 | | 2012(a) | | 2012 | | 2011(b) | |
Per share data | |
Net asset value, beginning of period | | $ | 53.46 | | | $ | 52.30 | | | $ | 48.56 | | | $ | 49.56 | | | $ | 53.04 | | | $ | 43.49 | | |
Income from investment operations: | |
Net investment income | | | 1.40 | (h) | | | 0.32 | | | | 0.36 | | | | 0.23 | | | | 0.50 | | | | 0.20 | | |
Net realized and unrealized gain (loss) | | | (0.42 | ) | | | 11.07 | | | | 9.79 | | | | (1.07 | ) | | | (3.47 | ) | | | 9.53 | | |
Total from investment operations | | | 0.98 | | | | 11.39 | | | | 10.15 | | | | (0.84 | ) | | | (2.97 | ) | | | 9.73 | | |
Less distributions to shareholders: | |
Net investment income | | | (0.61 | ) | | | (0.27 | ) | | | (0.41 | ) | | | (0.16 | ) | | | (0.51 | ) | | | (0.18 | ) | |
Net realized gains | | | (8.67 | ) | | | (9.96 | ) | | | (6.00 | ) | | | — | | | | — | | | | — | | |
Total distributions to shareholders | | | (9.28 | ) | | | (10.23 | ) | | | (6.41 | ) | | | (0.16 | ) | | | (0.51 | ) | | | (0.18 | ) | |
Net asset value, end of period | | $ | 45.16 | | | $ | 53.46 | | | $ | 52.30 | | | $ | 48.56 | | | $ | 49.56 | | | $ | 53.04 | | |
Total return | | | 1.81 | % | | | 24.13 | % | | | 23.49 | % | | | (1.66 | %) | | | (5.50 | %) | | | 22.41 | % | |
Ratios to average net assets(c) | |
Total gross expenses | | | 1.15 | % | | | 1.17 | % | | | 1.14 | %(d) | | | 1.24 | %(e) | | | 1.22 | %(d) | | | 1.19 | %(d)(e) | |
Total net expenses(f) | | | 1.15 | %(g) | | | 1.17 | %(g) | | | 1.14 | %(d)(g) | | | 1.18 | %(e)(g) | | | 1.17 | %(d)(g) | | | 1.19 | %(d)(e)(g) | |
Net investment income | | | 2.84 | % | | | 0.61 | % | | | 0.73 | % | | | 1.18 | %(e) | | | 1.04 | % | | | 0.81 | %(e) | |
Supplemental data | |
Net assets, end of period (in thousands) | | $ | 2 | | | $ | 3 | | | $ | 3 | | | $ | 3 | | | $ | 3 | | | $ | 3 | | |
Portfolio turnover | | | 58 | % | | | 55 | % | | | 55 | % | | | 64 | % | | | 9 | % | | | 12 | % | |
Notes to Financial Highlights
(a) For the period from April 1, 2012 to August 31, 2012. During the period, the Fund's fiscal year end was changed from March 31 to August 31.
(b) Based on operations from September 27, 2010 (commencement of operations) through the stated period end.
(c) In addition to the fees and expenses that the Fund bears directly, the Fund indirectly bears a pro rata share of the fees and expenses of any other funds in which it invests. Such indirect expenses are not included in the Fund's reported expense ratios.
(d) Ratios include line of credit interest expense which is less than 0.01%.
(e) Annualized.
(f) Total net expenses include the impact of certain fee waivers/expense reimbursements made by the Investment Manager and certain of its affiliates, if applicable.
(g) The benefits derived from expense reductions had an impact of less than 0.01%.
(h) Net investment income per share includes special dividends. The effect of these dividends amounted to $1.20 per share.
The accompanying Notes to Financial Statements are an integral part of this statement.
Annual Report 2015
24
COLUMBIA VALUE AND RESTRUCTURING FUND
FINANCIAL HIGHLIGHTS (continued)
| | | Year Ended August 31, | |
Class Y | | 2015 | | 2014 | | 2013(a) | |
Per share data | |
Net asset value, beginning of period | | $ | 54.24 | | | $ | 52.94 | | | $ | 48.45 | | |
Income from investment operations: | |
Net investment income | | | 1.65 | (f) | | | 0.53 | | | | 0.48 | | |
Net realized and unrealized gain (loss) | | | (0.45 | ) | | | 11.21 | | | | 10.43 | | |
Total from investment operations | | | 1.20 | | | | 11.74 | | | | 10.91 | | |
Less distributions to shareholders: | |
Net investment income | | | (0.81 | ) | | | (0.48 | ) | | | (0.42 | ) | |
Net realized gains | | | (8.67 | ) | | | (9.96 | ) | | | (6.00 | ) | |
Total distributions to shareholders | | | (9.48 | ) | | | (10.44 | ) | | | (6.42 | ) | |
Net asset value, end of period | | $ | 45.96 | | | $ | 54.24 | | | $ | 52.94 | | |
Total return | | | 2.22 | % | | | 24.61 | % | | | 25.12 | % | |
Ratios to average net assets(b) | |
Total gross expenses | | | 0.77 | % | | | 0.77 | % | | | 0.75 | %(c)(d) | |
Total net expenses(e) | | | 0.77 | % | | | 0.77 | % | | | 0.75 | %(c)(d) | |
Net investment income | | | 3.33 | % | | | 1.03 | % | | | 1.12 | %(c) | |
Supplemental data | |
Net assets, end of period (in thousands) | | $ | 1,105 | | | $ | 1,056 | | | $ | 795 | | |
Portfolio turnover | | | 58 | % | | | 55 | % | | | 55 | % | |
Notes to Financial Highlights
(a) Based on operations from November 8, 2012 (commencement of operations) through the stated period end.
(b) In addition to the fees and expenses that the Fund bears directly, the Fund indirectly bears a pro rata share of the fees and expenses of any other funds in which it invests. Such indirect expenses are not included in the Fund's reported expense ratios.
(c) Annualized.
(d) Ratios include line of credit interest expense which is less than 0.01%.
(e) Total net expenses include the impact of certain fee waivers/expense reimbursements made by the Investment Manager and certain of its affiliates, if applicable.
(f) Net investment income per share includes special dividends. The effect of these dividends amounted to $1.26 per share.
The accompanying Notes to Financial Statements are an integral part of this statement.
Annual Report 2015
25
COLUMBIA VALUE AND RESTRUCTURING FUND
FINANCIAL HIGHLIGHTS (continued)
| | | Year Ended August 31, | | Year Ended
March 31, | |
Class Z | | 2015 | | 2014 | | 2013 | | 2012(a) | | 2012 | | 2011 | |
Per share data | |
Net asset value, beginning of period | | $ | 53.46 | | | $ | 52.31 | | | $ | 48.57 | | | $ | 49.55 | | | $ | 53.01 | | | $ | 44.66 | | |
Income from investment operations: | |
Net investment income | | | 1.45 | (h) | | | 0.42 | | | | 0.45 | | | | 0.27 | | | | 0.61 | | | | 0.64 | (b) | |
Net realized and unrealized gain (loss) | | | (0.38 | ) | | | 11.07 | | | | 9.80 | | | | (1.06 | ) | | | (3.46 | ) | | | 8.37 | | |
Total from investment operations | | | 1.07 | | | | 11.49 | | | | 10.25 | | | | (0.79 | ) | | | (2.85 | ) | | | 9.01 | | |
Less distributions to shareholders: | |
Net investment income | | | (0.71 | ) | | | (0.38 | ) | | | (0.51 | ) | | | (0.19 | ) | | | (0.61 | ) | | | (0.66 | ) | |
Net realized gains | | | (8.67 | ) | | | (9.96 | ) | | | (6.00 | ) | | | — | | | | — | | | | — | | |
Total distributions to shareholders | | | (9.38 | ) | | | (10.34 | ) | | | (6.51 | ) | | | (0.19 | ) | | | (0.61 | ) | | | (0.66 | ) | |
Net asset value, end of period | | $ | 45.15 | | | $ | 53.46 | | | $ | 52.31 | | | $ | 48.57 | | | $ | 49.55 | | | $ | 53.01 | | |
Total return | | | 2.00 | % | | | 24.38 | % | | | 23.74 | % | | | (1.57 | %) | | | (5.26 | %) | | | 20.46 | % | |
Ratios to average net assets(c) | |
Total gross expenses | | | 0.97 | % | | | 0.96 | % | | | 0.96 | %(d) | | | 1.01 | %(e) | | | 0.99 | %(d) | | | 0.95 | %(d) | |
Total net expenses(f) | | | 0.97 | %(g) | | | 0.96 | %(g) | | | 0.96 | %(d)(g) | | | 0.94 | %(e)(g) | | | 0.94 | %(d)(g) | | | 0.95 | %(d)(g) | |
Net investment income | | | 2.95 | % | | | 0.83 | % | | | 0.90 | % | | | 1.36 | %(e) | | | 1.28 | % | | | 1.40 | % | |
Supplemental data | |
Net assets, end of period
(in thousands) | | $ | 1,485,346 | | | $ | 1,803,699 | | | $ | 1,954,532 | | | $ | 2,601,708 | | | $ | 3,887,512 | | | $ | 6,583,690 | | |
Portfolio turnover | | | 58 | % | | | 55 | % | | | 55 | % | | | 64 | % | | | 9 | % | | | 12 | % | |
Notes to Financial Highlights
(a) For the period from April 1, 2012 to August 31, 2012. During the period, the Fund's fiscal year end was changed from March 31 to August 31.
(b) Net investment income per share reflects special dividends. The effect of these dividends amounted to $0.18 per share.
(c) In addition to the fees and expenses that the Fund bears directly, the Fund indirectly bears a pro rata share of the fees and expenses of any other funds in which it invests. Such indirect expenses are not included in the Fund's reported expense ratios.
(d) Ratios include line of credit interest expense which is less than 0.01%.
(e) Annualized.
(f) Total net expenses include the impact of certain fee waivers/expense reimbursements made by the Investment Manager and certain of its affiliates, if applicable.
(g) The benefits derived from expense reductions had an impact of less than 0.01%.
(h) Net investment income per share includes special dividends. The effect of these dividends amounted to $1.16 per share.
The accompanying Notes to Financial Statements are an integral part of this statement.
Annual Report 2015
26
COLUMBIA VALUE AND RESTRUCTURING FUND
NOTES TO FINANCIAL STATEMENTS
August 31, 2015
Note 1. Organization
Columbia Value and Restructuring Fund (the Fund), a series of Columbia Funds Series Trust I (the Trust), is a diversified fund. The Trust is registered under the Investment Company Act of 1940, as amended (the 1940 Act), as an open-end management investment company organized as a Massachusetts business trust.
Fund Shares
The Trust may issue an unlimited number of shares (without par value). The Fund offers Class A, Class C, Class I, Class R, Class R4, Class R5, Class W, Class Y and Class Z shares. Although all share classes generally have identical voting, dividend and liquidation rights, each share class votes separately when required by the Trust's organizational documents or by law. Different share classes pay different distribution amounts to the extent the expenses of such share classes differ, and distributions in liquidation will be proportional to the net asset value of each share class. Each share class has its own expense and sales charge structure.
Class A shares are subject to a maximum front-end sales charge of 5.75% based on the initial investment amount. Class A shares purchased without an initial sales charge in accounts aggregating $1 million to $50 million at the time of purchase are subject to a contingent deferred sales charge (CDSC) if the shares are sold within 18 months after purchase, charged as follows: 1.00% CDSC if redeemed within 12 months after purchase, and 0.50% CDSC if redeemed more than 12, but less than 18, months after purchase.
Class C shares are subject to a 1.00% CDSC on shares redeemed within one year after purchase.
Class I shares are not subject to sales charges and are available only to the Columbia Family of Funds.
Class R shares are not subject to sales charges and are generally available only to certain retirement plans and other investors as described in the Fund's prospectus.
Class R4 shares are not subject to sales charges and are generally available only to omnibus retirement plans and certain investors as described in the Fund's prospectus.
Class R5 shares are not subject to sales charges and are generally available only to investors purchasing through authorized investment professionals and omnibus retirement plans.
Class W shares are not subject to sales charges and are available only to investors purchasing through authorized
investment programs managed by investment professionals, including discretionary managed account programs.
Class Y shares are not subject to sales charges and are generally available only to certain retirement plans as described in the Fund's prospectus.
Class Z shares are not subject to sales charges and are available only to eligible investors, which are subject to different investment minimums as described in the Fund's prospectus.
Note 2. Summary of Significant Accounting Policies
Basis of Preparation
The Fund is an investment company that applies the accounting and reporting guidance in the Financial Accounting Standards Board (FASB) Accounting Standards Codification Topic 946, Financial Services — Investment Companies (ASC 946). The financial statements are prepared in accordance with U.S. generally accepted accounting principles (GAAP), which requires management to make certain estimates and assumptions that affect the reported amounts of assets and liabilities, the disclosure of contingent assets and liabilities at the date of the financial statements and the reported amounts of income and expenses during the reporting period. Actual results could differ from those estimates.
The following is a summary of significant accounting policies followed by the Fund in the preparation of its financial statements.
Security Valuation
All equity securities are valued at the close of business of the New York Stock Exchange (NYSE). Equity securities are valued at the last quoted sales price on the principal exchange or market on which they trade, except for securities traded on the NASDAQ Stock Market, which are valued at the NASDAQ official close price. Unlisted securities or listed securities for which there were no sales during the day are valued at the mean of the latest quoted bid and ask prices on such exchanges or markets.
Foreign equity securities are valued based on the closing price on the foreign exchange in which such securities are primarily traded. If any foreign equity security closing prices are not readily available, the securities are valued at the mean of the latest quoted bid and ask prices on such exchanges or markets. Foreign currency exchange
Annual Report 2015
27
COLUMBIA VALUE AND RESTRUCTURING FUND
NOTES TO FINANCIAL STATEMENTS (continued)
August 31, 2015
rates are generally determined at 4:00 p.m. Eastern (U.S.) time. Many securities markets and exchanges outside the U.S. close prior to the close of the NYSE; therefore, the closing prices for securities in such markets or on such exchanges may not fully reflect events that occur after such close but before the close of the NYSE. In those situations, foreign securities will be fair valued pursuant to a policy adopted by the Board of Trustees (the Board), including, if available, utilizing a third party pricing service to determine these fair values. The third party pricing service takes into account multiple factors, including, but not limited to, movements in the U.S. securities markets, certain depositary receipts, futures contracts and foreign exchange rates that have occurred subsequent to the close of the foreign exchange or market, to determine a good faith estimate that reasonably reflects the current market conditions as of the close of the NYSE. The fair value of a security is likely to be different from the quoted or published price, if available.
Investments in open-end investment companies, including money market funds, are valued at their latest net asset value.
Investments for which market quotations are not readily available, or that have quotations which management believes are not reflective of market value or reliable, are valued at fair value as determined in good faith under procedures approved by and under the general supervision of the Board. If a security or class of securities (such as foreign securities) is valued at fair value, such value is likely to be different from the quoted or published price for the security.
The determination of fair value often requires significant judgment. To determine fair value, management may use assumptions including but not limited to future cash flows and estimated risk premiums. Multiple inputs from various sources may be used to determine fair value.
GAAP requires disclosure regarding the inputs and valuation techniques used to measure fair value and any changes in valuation inputs or techniques. In addition, investments shall be disclosed by major category. This information is disclosed following the Fund's Portfolio of Investments.
Foreign Currency Transactions and Translations
The values of all assets and liabilities denominated in foreign currencies are generally translated into U.S. dollars at exchange rates determined at the close of the NYSE. Net realized and unrealized gains (losses) on
foreign currency transactions and translations include gains (losses) arising from the fluctuation in exchange rates between trade and settlement dates on securities transactions, gains (losses) arising from the disposition of foreign currency and currency gains (losses) between the accrual and payment dates on dividends, interest income and foreign withholding taxes.
For financial statement purposes, the Fund does not distinguish that portion of gains (losses) on investments which is due to changes in foreign exchange rates from that which is due to changes in market prices of the investments. Such fluctuations are included with the net realized and unrealized gains (losses) on investments in the Statement of Operations.
Security Transactions
Security transactions are accounted for on the trade date. Cost is determined and gains (losses) are based upon the specific identification method for both financial statement and federal income tax purposes.
Income Recognition
Corporate actions and dividend income are generally recorded net of any non-reclaimable tax withholdings, on the ex-dividend date or upon receipt of ex-dividend notification in the case of certain foreign securities.
The Fund may receive distributions from holdings in equity securities, business development companies (BDCs), exchange-traded funds, other regulated investment companies (RICs), and real estate investment trusts (REITs), which report information on the tax character of their distributions annually. These distributions are allocated to dividend income, capital gain and return of capital based on actual information reported. Return of capital is recorded as a reduction of the cost basis of securities held. If the Fund no longer owns the applicable securities, return of capital is recorded as a realized gain. With respect to REITs, to the extent actual information has not yet been reported, estimates for return of capital are made by the Fund's management. Management's estimates are subsequently adjusted when the actual character of the distributions is disclosed by the REITs, which could result in a proportionate change in return of capital to shareholders.
Awards from class action litigation are recorded as a reduction of cost basis if the Fund still owns the applicable securities on the payment date. If the Fund no longer owns the applicable securities, the proceeds are recorded as realized gains.
Annual Report 2015
28
COLUMBIA VALUE AND RESTRUCTURING FUND
NOTES TO FINANCIAL STATEMENTS (continued)
August 31, 2015
Expenses
General expenses of the Trust are allocated to the Fund and other funds of the Trust based upon relative net assets or other expense allocation methodologies determined by the nature of the expense. Expenses directly attributable to the Fund are charged to the Fund. Expenses directly attributable to a specific class of shares are charged to that share class.
Determination of Class Net Asset Value
All income, expenses (other than class-specific expenses, which are charged to that share class, as shown in the Statement of Operations) and realized and unrealized gains (losses) are allocated to each class of the Fund on a daily basis, based on the relative net assets of each class, for purposes of determining the net asset value of each class.
Federal Income Tax Status
The Fund intends to qualify each year as a regulated investment company under Subchapter M of the Internal Revenue Code, as amended, and will distribute substantially all of its taxable income (including net short-term capital gains), if any, for its tax year, and as such will not be subject to federal income taxes. In addition, the Fund intends to distribute in each calendar year substantially all of its net investment income, capital gains and certain other amounts, if any, such that the Fund should not be subject to federal excise tax. Therefore, no federal income or excise tax provision is recorded.
Foreign Taxes
The Fund may be subject to foreign taxes on income, gains on investments or currency repatriation, a portion of which may be recoverable. The Fund will accrue such taxes and recoveries, as applicable, based upon its current interpretation of tax rules and regulations that exist in the markets in which it invests.
Realized gains in certain countries may be subject to foreign taxes at the Fund level, based on statutory rates. The Fund accrues for such foreign taxes on realized and unrealized gains at the appropriate rate for each jurisdiction, as applicable. The amount, if any, is disclosed as a liability on the Statement of Assets and Liabilities.
Distributions to Shareholders
Distributions from net investment income, if any, are declared and paid each calendar quarter. Net realized capital gains, if any, are distributed at least annually.
Income distributions and capital gain distributions are determined in accordance with federal income tax regulations, which may differ from GAAP.
Guarantees and Indemnifications
Under the Trust's organizational documents and, in some cases, by contract, its officers and trustees are indemnified against certain liabilities arising out of the performance of their duties to the Trust or its funds. In addition, certain of the Fund's contracts with its service providers contain general indemnification clauses. The Fund's maximum exposure under these arrangements is unknown since the amount of any future claims that may be made against the Fund cannot be determined, and the Fund has no historical basis for predicting the likelihood of any such claims.
Recent Accounting Pronouncement
Fair Value Measurement (Topic 820), Disclosure for Investments in Certain Entities That Calculate Net Asset Value per Share (or Its Equivalent)
In May 2015, the Financial Accounting Standards Board (FASB) issued Accounting Standards Update (ASU) No. 2015-07, Fair Value Measurement (Topic 820), Disclosure for Investments in Certain Entities That Calculate Net Asset Value per Share (or Its Equivalent). ASU No. 2015-07 changes the disclosure requirements for investments for which fair value is measured using the net asset value per share practical expedient. The disclosure requirements are effective for annual periods beginning after December 15, 2015 and interim periods within those fiscal years. At this time, management is evaluating the implications of this guidance and the impact it will have on the financial statement amounts and footnote disclosures, if any.
Note 3. Fees and Other Transactions with Affiliates
Management Fees
Effective July 1, 2015, the Fund entered into a Management Agreement with Columbia Management Investment Advisers, LLC (the Investment Manager), a wholly-owned subsidiary of Ameriprise Financial, Inc. (Ameriprise Financial). Under the Management Agreement, the Investment Manager provides the Fund with investment research and advice, as well as administrative and accounting services. The management services fee is an annual fee that is equal to a percentage of the Fund's average daily net assets that declines from 0.75% to 0.57% as the Fund's net
Annual Report 2015
29
COLUMBIA VALUE AND RESTRUCTURING FUND
NOTES TO FINANCIAL STATEMENTS (continued)
August 31, 2015
assets increase. The effective management services fee rate for the year ended August 31, 2015 was 0.74% of the Fund's average daily net assets.
Prior to July 1, 2015, the Fund paid the Investment Manager an annual fee for advisory services under an Investment Management Services Agreement and a separate annual fee for administrative and accounting services under an Administrative Services Agreement. For the period from September 1, 2014 through June 30, 2015, the investment advisory services fee paid to the Investment Manager was $10,643,647, and the administrative services fee paid to the Investment Manager was $925,535.
Compensation of Board Members
Board members, who are not officers or employees of the Investment Manager or Ameriprise Financial, are compensated for their services to the Fund as disclosed in the Statement of Operations. These Board members may participate in a Deferred Compensation Plan (the Plan) which may be terminated at any time. Obligations of the Plan will be paid solely out of the Fund's assets, and all amounts payable under the Plan constitute a general unsecured obligation of the Fund.
Compensation of Chief Compliance Officer
The Board has appointed a Chief Compliance Officer to the Fund in accordance with federal securities regulations. The Fund is allocated a portion of the expenses associated with the Chief Compliance Officer based on relative net assets of the Trust.
Transfer Agent Fees
Under a Transfer and Dividend Disbursing Agent Agreement, Columbia Management Investment Services Corp. (the Transfer Agent), an affiliate of the Investment Manager and a wholly-owned subsidiary of Ameriprise Financial, is responsible for providing transfer agency services to the Fund. The Transfer Agent has contracted with Boston Financial Data Services (BFDS) to serve as sub-transfer agent.
Effective November 1, 2014, the Transfer Agent receives a monthly transfer agency fee based on the number or the average value of accounts, depending on the type of account. Prior to November 1, 2014, the Transfer Agent received a monthly account-based service fee based on the number of open accounts. In addition, the Transfer Agent also receives sub-transfer agency fees based on a percentage of the average aggregate value of the Fund's shares maintained in omnibus accounts (other than
omnibus accounts for which American Enterprise Investment Services Inc. is the broker of record or accounts where the beneficial shareholder is a customer of Ameriprise Financial Services, Inc., which receive a per account fee). The Transfer Agent pays the fees of BFDS for services as sub-transfer agent and is not entitled to reimbursement for such fees from the Fund (with the exception of out-of-pocket fees).
The Transfer Agent also receives compensation from the Fund for various shareholder services and reimbursements for certain out-of-pocket fees. Total transfer agent fees for Class R5 shares are subject to an annual limitation of not more than 0.05% of the average daily net assets attributable to Class R5 shares. Class I and Class Y shares do not pay transfer agency fees.
For the year ended August 31, 2015, the Fund's effective transfer agent fee rates as a percentage of average daily net assets of each class were as follows:
Class A | | | 0.20 | % | |
Class C | | | 0.20 | | |
Class R | | | 0.20 | | |
Class R4 | | | 0.20 | | |
Class R5 | | | 0.05 | | |
Class W | | | 0.15 | | |
Class Z | | | 0.20 | | |
An annual minimum account balance fee of $20 may apply to certain accounts with a value below the applicable share class's initial minimum investment requirements to reduce the impact of small accounts on transfer agency fees. These minimum account balance fees are remitted to the Fund and recorded as part of expense reductions in the Statement of Operations. For the year ended August 31, 2015, these minimum account balance fees reduced total expenses of the Fund by $10,382.
Distribution and Service Fees
The Fund has an agreement with Columbia Management Investment Distributors, Inc. (the Distributor), an affiliate of the Investment Manager and a wholly-owned subsidiary of Ameriprise Financial, for distribution and shareholder services. The Board has approved, and the Fund has adopted, distribution and shareholder service plans (the Plans) applicable to certain share classes, which set the distribution and service fees for the Fund. These fees are calculated daily and are intended to compensate the Distributor and/or eligible selling and/or
Annual Report 2015
30
COLUMBIA VALUE AND RESTRUCTURING FUND
NOTES TO FINANCIAL STATEMENTS (continued)
August 31, 2015
servicing agents for selling shares of the Fund and providing services to investors.
Under the Plans, the Fund pays a monthly service fee to the Distributor at the maximum annual rate of 0.25% of the average daily net assets attributable to Class A, Class C and Class W shares of the Fund. Also under the Plans, the Fund pays a monthly distribution fee to the Distributor at the maximum annual rates of 0.75%, 0.50% and 0.25% of the average daily net assets attributable to Class C, Class R and Class W shares, respectively.
Although the Fund may pay a distribution fee up to 0.25% of the Fund's average daily net assets attributable to Class W shares and a service fee of up to 0.25% of the Fund's average daily net assets attributable to Class W shares, the aggregate fee shall not exceed 0.25% of the Fund's average daily net assets attributable to Class W shares.
Sales Charges
Sales charges, including front-end charges and CDSCs, received by the Distributor for distributing Fund shares were $32,227 for Class A and $354 for Class C shares for the year ended August 31, 2015.
Expenses Waived/Reimbursed by the Investment Manager and its Affiliates
The Fund's expense ratio is subject to an expense reimbursement arrangement pursuant to which fees will be waived and/or expenses reimbursed (excluding certain fees and expenses described below), so that the Fund's net operating expenses, after giving effect to fees waived/expenses reimbursed and any balance credits and/or overdraft charges from the Fund's custodian, do not exceed the annual rates of:
| | | Voluntary
Expense Cap
Effective
January 1, 2015 | | Contractual
Expense Cap
Prior to
January 1, 2015 | |
Class A | | | 1.24 | % | | | 1.24 | % | |
Class C | | | 1.99 | | | | 1.99 | | |
Class I | | | 0.84 | | | | 0.85 | | |
Class R | | | 1.49 | | | | 1.49 | | |
Class R4 | | | 0.99 | | | | 0.99 | | |
Class R5 | | | 0.89 | | | | 0.90 | | |
Class W | | | 1.24 | | | | 1.24 | | |
Class Y | | | 0.84 | | | | 0.85 | | |
Class Z | | | 0.99 | | | | 0.99 | | |
The voluntary expense cap arrangement may be revised or discontinued at any time. Under the arrangements, the following fees and expenses are excluded from the waiver/reimbursement commitment, and therefore will be paid by the Fund, if applicable: taxes (including foreign transaction taxes), expenses associated with investments in affiliated and non-affiliated pooled investment vehicles (including mutual funds and exchange-traded funds), transaction costs and brokerage commissions, costs related to any securities lending program, dividend expenses associated with securities sold short, inverse floater program fees and expenses, transaction charges and interest on borrowed money, interest and extraordinary expenses. Any fees waived and/or expenses reimbursed under the expense reimbursement arrangements described above are not recoverable by the Investment Manager or its affiliates in future periods.
Note 4. Federal Tax Information
The timing and character of income and capital gain distributions are determined in accordance with income tax regulations, which may differ from GAAP because of temporary or permanent book to tax differences.
At August 31, 2015, these differences are primarily due to differing treatment for deferral/reversal of wash sale losses, Trustees' deferred compensation, foreign currency transactions and re-characterization of distributions for investments. To the extent these differences are permanent, reclassifications are made among the components of the Fund's net assets in the Statement of Assets and Liabilities. Temporary differences do not require reclassifications. In the Statement of Assets and Liabilities the following reclassifications were made:
Undistributed net investment income | | $ | (51,166 | ) | |
Accumulated net realized gain | | | 51,167 | | |
Paid-in capital | | | (1 | ) | |
Net investment income (loss) and net realized gains (losses), as disclosed in the Statement of Operations, and net assets were not affected by this reclassification.
The tax character of distributions paid during the years indicated was as follows:
Year Ended August 31, | | 2015 | | 2014 | |
Ordinary income | | $ | 73,219,817 | | | $ | 146,061,474 | | |
Long-term capital gains | | | 257,389,718 | | | | 244,565,788 | | |
Total | | $ | 330,609,535 | | | $ | 390,627,262 | | |
Annual Report 2015
31
COLUMBIA VALUE AND RESTRUCTURING FUND
NOTES TO FINANCIAL STATEMENTS (continued)
August 31, 2015
Short-term capital gain distributions, if any, are considered ordinary income distributions for tax purposes.
At August 31, 2015, the components of distributable earnings on a tax basis were as follows:
Undistributed ordinary income | | $ | 42,417,353 | | |
Undistributed long-term capital gains | | | 154,553,058 | | |
Net unrealized appreciation | | | 342,467,494 | | |
At August 31, 2015, the cost of investments for federal income tax purposes was $1,267,601,668 and the aggregate gross unrealized appreciation and depreciation based on that cost was:
Unrealized appreciation | | $ | 390,846,233 | | |
Unrealized depreciation | | | (48,378,739 | ) | |
Net unrealized appreciation | | $ | 342,467,494 | | |
Management of the Fund has concluded that there are no significant uncertain tax positions in the Fund that would require recognition in the financial statements. However, management's conclusion may be subject to review and adjustment at a later date based on factors including, but not limited to, new tax laws, regulations, and administrative interpretations (including relevant court decisions). Generally, the Fund's federal tax returns for the prior three fiscal years remain subject to examination by the Internal Revenue Service.
Note 5. Portfolio Information
The cost of purchases and proceeds from sales of securities, excluding short-term investments and derivatives, if any, aggregated to $1,047,451,886 and $1,359,439,042, respectively, for the year ended August 31, 2015. The amount of purchase and sale activity impacts the portfolio turnover rate reported in the Financial Highlights.
Note 6. Affiliated Money Market Fund
The Fund invests in Columbia Short-Term Cash Fund, an affiliated money market fund established for the exclusive use by the Fund and other affiliated funds. The income earned by the Fund from such investments is included as Dividends — affiliated issuers in the Statement of Operations. As an investing fund, the Fund indirectly bears its proportionate share of the expenses of Columbia Short-Term Cash Fund.
Note 7. Line of Credit
The Fund has entered into a revolving credit facility with a syndicate of banks led by JPMorgan Chase Bank, N.A.
whereby the Fund may borrow for the temporary funding of shareholder redemptions or for other temporary or emergency purposes. Pursuant to a December 9, 2014 amendment, the credit facility agreement, which is a collective agreement between the Fund and certain other funds managed by the Investment Manager, severally and not jointly, permits collective borrowings up to $550 million. Interest is charged to each participating fund based on its borrowings at a rate equal to the higher of (i) the overnight federal funds rate plus 1.00% or (ii) the one-month LIBOR rate plus 1.00%. Each borrowing under the credit facility matures no later than 60 days after the date of borrowing. The Fund also pays a commitment fee equal to its pro rata share of the amount of the credit facility at a rate of 0.075% per annum. The commitment fee is included in other expenses in the Statement of Operations. Prior to the December 9, 2014 amendment, the credit facility agreement permitted borrowings up to $500 million under the same terms and interest rates as described above.
The Fund had no borrowings during the year ended August 31, 2015.
Note 8. Significant Risks
Shareholder Concentration Risk
At August 31, 2015, three unaffiliated shareholders of record owned 61.2% of the outstanding shares of the Fund in one or more accounts. The Fund has no knowledge about whether any portion of those shares was owned beneficially. Subscription and redemption activity by concentrated accounts may have a significant effect on the operations of the Fund. In the case of a large redemption, the Fund may be forced to sell investments at inopportune times, including its liquid or more liquid positions, resulting in Fund losses and the Fund holding a higher percentage of less liquid or illiquid securities. Large redemptions could result in decreased economies of scale and increased operating expenses for non-redeeming Fund shareholders.
Technology and Technology-related Investment Risk
The Fund may be more susceptible to the particular risks that may affect companies in the information technology sector, as well as other technology-related sectors (collectively, the technology sectors) than if it were invested in a wider variety of companies in unrelated sectors. Companies in the technology sectors are subject to certain risks, including the risk that new services, equipment or technologies will not be accepted
Annual Report 2015
32
COLUMBIA VALUE AND RESTRUCTURING FUND
NOTES TO FINANCIAL STATEMENTS (continued)
August 31, 2015
by consumers and businesses or will become rapidly obsolete. Performance of such companies may be affected by factors including obtaining and protecting patents (or the failure to do so) and significant competitive pressures, including aggressive pricing of their products or services, new market entrants, competition for market share and short product cycles due to an accelerated rate of technological developments. Such competitive pressures may lead to limited earnings and/or falling profit margins. As a result, the value of their securities may fall or fail to rise. In addition, many technology sector companies have limited operating histories and prices of these companies' securities historically have been more volatile than other securities, especially over the short term.
Note 9. Subsequent Events
Management has evaluated the events and transactions that have occurred through the date the financial statements were issued and noted no items requiring adjustment of the financial statements or additional disclosure.
Note 10. Information Regarding Pending and Settled Legal Proceedings
In December 2005, without admitting or denying the allegations, American Express Financial Corporation (AEFC, which is now known as Ameriprise Financial, Inc. (Ameriprise Financial)) entered into settlement agreements with the Securities and Exchange Commission (SEC) and Minnesota Department of Commerce (MDOC) related to market timing activities. As a result, AEFC was censured and ordered to cease and desist from committing or causing any violations of certain provisions of the Investment Advisers Act of 1940, the Investment Company Act of 1940, and various Minnesota laws. AEFC agreed to pay disgorgement of $10 million and civil money penalties of $7 million. AEFC also agreed to retain an independent distribution consultant to assist in developing a plan for distribution of all disgorgement and civil penalties ordered by the SEC in accordance with various undertakings detailed at http://www.sec.gov/litigation/admin/ia-2451.pdf. Ameriprise Financial and its affiliates have cooperated with the SEC and the MDOC in these legal proceedings, and have made regular reports to the Funds' Boards of Trustees.
Ameriprise Financial and certain of its affiliates have historically been involved in a number of legal, arbitration and regulatory proceedings, including routine litigation,
class actions, and governmental actions, concerning matters arising in connection with the conduct of their business activities. Ameriprise Financial believes that the Funds are not currently the subject of, and that neither Ameriprise Financial nor any of its affiliates are the subject of, any pending legal, arbitration or regulatory proceedings that are likely to have a material adverse effect on the Funds or the ability of Ameriprise Financial or its affiliates to perform under their contracts with the Funds. Ameriprise Financial is required to make quarterly (10-Q), annual (10-K) and, as necessary, 8-K filings with the SEC on legal and regulatory matters that relate to Ameriprise Financial and its affiliates. Copies of these filings may be obtained by accessing the SEC website at www.sec.gov.
There can be no assurance that these matters, or the adverse publicity associated with them, will not result in increased fund redemptions, reduced sale of fund shares or other adverse consequences to the Funds. Further, although we believe proceedings are not likely to have a material adverse effect on the Funds or the ability of Ameriprise Financial or its affiliates to perform under their contracts with the Funds, these proceedings are subject to uncertainties and, as such, we are unable to estimate the possible loss or range of loss that may result. An adverse outcome in one or more of these proceedings could result in adverse judgments, settlements, fines, penalties or other relief that could have a material adverse effect on the consolidated financial condition or results of operations of Ameriprise Financial.
Annual Report 2015
33
COLUMBIA VALUE AND RESTRUCTURING FUND
REPORT OF INDEPENDENT REGISTERED PUBLIC ACCOUNTING FIRM
To the Trustees of Columbia Funds Series Trust I and the Shareholders of
Columbia Value and Restructuring Fund
In our opinion, the accompanying statement of assets and liabilities, including the portfolio of investments, and the related statements of operations and of changes in net assets and the financial highlights present fairly, in all material respects, the financial position of Columbia Value and Restructuring Fund (the "Fund," a series of Columbia Funds Series Trust I) at August 31, 2015, and the results of its operations, the changes in its net assets and the financial highlights for each of the periods indicated, in conformity with accounting principles generally accepted in the United States of America. These financial statements and financial highlights (hereafter referred to as "financial statements") are the responsibility of the Fund's management. Our responsibility is to express an opinion on these financial statements based on our audits. We conducted our audits of these financial statements in accordance with the standards of the Public Company Accounting Oversight Board (United States). Those standards require that we plan and perform the audit to obtain reasonable assurance about whether the financial statements are free of material misstatement. An audit includes examining, on a test basis, evidence supporting the amounts and disclosures in the financial statements, assessing the accounting principles used and significant estimates made by management, and evaluating the overall financial statement presentation. We believe that our audits, which included confirmation of securities at August 31, 2015 by correspondence with the custodian, brokers and transfer agent, and the application of alternative auditing procedures where such confirmations had not been received, provide a reasonable basis for our opinion.
PricewaterhouseCoopers LLP
Minneapolis, MN
October 22, 2015
Annual Report 2015
34
COLUMBIA VALUE AND RESTRUCTURING FUND
FEDERAL INCOME TAX INFORMATION
(Unaudited)
The Fund hereby designates the following tax attributes for the fiscal year ended August 31, 2015. Shareholders will be notified in early 2016 of the amounts for use in preparing 2015 income tax returns.
Tax Designations:
| Qualified Dividend Income | | | 67.62 | % | |
| Dividends Received Deduction | | | 42.96 | % | |
| Capital Gain Dividend | | $ | 195,181,894 | | |
Qualified Dividend Income. For taxable, non-corporate shareholders, the percentage of ordinary income distributed during the fiscal year that represents qualified dividend income subject to reduced tax rates.
Dividends Received Deduction. The percentage of ordinary income distributed during the fiscal year that qualifies for the corporate dividends received deduction.
Capital Gain Dividend. The Fund designates as a capital gain dividend the amount reflected above, or if subsequently determined to be different, the net capital gain of such fiscal period.
Annual Report 2015
35
COLUMBIA VALUE AND RESTRUCTURING FUND
The Trustees serve terms of indefinite duration. The names and birth years of the Trustees and Officers of the Funds in Columbia Funds Series Trust I, the year each was first elected or appointed to office, their principal business occupations during at least the last five years, the number of Funds overseen by each Trustee and other directorships they hold are shown below. Each officer listed below serves as an officer of each Fund in Columbia Funds Series Trust I. The mailing address of each Trustee is: c/o Columbia Management Investment Advisers, LLC, 225 Franklin Street, Mail Drop BX32 05228, Boston, MA 02110.
Independent Trustees
Name, Year of Birth
and Position Held
with the Trust | | Year First
Appointed or
Elected as
Trustee to any
Fund Currently
in the Columbia
Funds Complex
or a Predecessor
Thereof | | Principal Occupation(s)
during the Past Five Years | | Number
of Funds
in the
Columbia
Funds
Complex
Overseen | | Other Directorships
Held by Trustee During
the Past Five Years | |
Janet Langford Carrig
(Born 1957)
Trustee | | | 1996 | | | Senior Vice President, General Counsel and Corporate Secretary, ConocoPhillips (integrated energy company) since September 2007; Deputy General Counsel — Corporate Legal Services, ConocoPhillips from August 2006 to August 2007; Partner, Zelle, Hofmann, Voelbel, Mason & Gette LLP (law firm) from March 2005 to July 2006; Adjunct Professor of Law, Northwestern University from September 2004 to June 2006; Director, UAL Corporation (airline) from February 2006 to July 2006; Chief Administrative Officer and Senior Vice President, Kmart Holding Corporation (consumer goods) from September 2003 to March 2004 | | | 60 | | | None | |
Douglas A. Hacker
(Born 1955)
Trustee and Chairman
of the Board | | | 1996 | | | Independent business executive since May 2006; Executive Vice President — Strategy of United Airlines from December 2002 to May 2006; President of UAL Loyalty Services (airline marketing company) from September 2001 to December 2002; Executive Vice President and Chief Financial Officer of United Airlines from July 1999 to September 2001 | | | 60 | | | Spartan Nash Company, (food distributor); Nash Finch Company (food distributor) from 2005 to 2013; Aircastle Limited (aircraft leasing); SeaCube Container Leasing Ltd. (container leasing) from 2010 to 2013; and Travelport Worldwide Limited (travel information technology) | |
Nancy T. Lukitsh
(Born 1956)
Trustee | | | 2011 | | | Senior Vice President, Partner and Director of Marketing, Wellington Management Company, LLP (investment adviser) from 1997 to 2010; Chair, Wellington Management Investment Portfolios (commingled non-U.S. investment pools) from 2007 to 2010; Director, Wellington Trust Company, NA and other Wellington affiliates from 1997 to 2010 | | | 60 | | | None | |
William E. Mayer
(Born 1940)
Trustee | | | 1991 | | | Partner, Park Avenue Equity Partners (private equity) since February 1999 | | | 60 | | | DynaVox Inc. (speech creation); Lee Enterprises (print media); WR Hambrecht + Co. (financial service provider) from 2000 to 2012; BlackRock Kelso Capital Corporation (investment company); and Premier, Inc. (healthcare) | |
Annual Report 2015
36
COLUMBIA VALUE AND RESTRUCTURING FUND
TRUSTEES AND OFFICERS (continued)
Independent Trustees (continued)
Name, Year of Birth
and Position Held
with the Trust | | Year First
Appointed or
Elected as
Trustee to any
Fund Currently
in the Columbia
Funds Complex
or a Predecessor
Thereof | | Principal Occupation(s)
during the Past Five Years | | Number
of Funds
in the
Columbia
Funds
Complex
Overseen | | Other Directorships
Held by Trustee During
the Past Five Years | |
David M. Moffett
(Born 1952)
Trustee | | | 2011 | | | Retired. Consultant to Bridgewater and Associates; Chief Executive Officer, Federal Home Loan Mortgage Corporation, from 2008 to 2009; Senior Adviser, Global Financial Services Group, Carlyle Group, Inc., from 2007 to 2008; Vice Chairman and Chief Financial Officer, U.S. Bancorp, from 1993 to 2007 | | | 60 | | | Building Materials Holding Corp. (building materials and construction services); CIT Group Inc. (commercial and consumer finance); eBay Inc. (online trading community); E.W. Scripps Co. (print and television media); Genworth Financial, Inc. (financial and insurance products and services); MBIA Inc. (financial service provider); Paypal Holdings Inc. (payment and data processing services); and University of Oklahoma Foundation | |
Charles R. Nelson
(Born 1942)
Trustee | | | 1981 | | | Retired. Professor Emeritus, University of Washington since 2011; Professor of Economics, University of Washington from 1976 to 2011; Ford and Louisa Van Voorhis Professor of Political Economy, University of Washington from 1993 to 2011; Adjunct Professor of Statistics, University of Washington from 1980 to 2011; Associate Editor, Journal of Money, Credit and Banking from September 1993 to 2008; consultant on econometric and statistical matters | | | 60 | | | None | |
John J. Neuhauser
(Born 1943)
Trustee | | | 1984 | | | President, Saint Michael's College since August 2007; Director or Trustee of several non-profit organizations, including Fletcher Allen Health Care, Inc.; Academic Vice President and Dean of Faculties, Boston College from August 1999 to October 2005; University Professor, Boston College from November 2005 to August 2007 | | | 60 | | | Liberty All-Star Equity Fund and Liberty All-Star Growth Fund (closed-end funds) | |
Patrick J. Simpson
(Born 1944)
Trustee | | | 2000 | | | Partner, Perkins Coie LLP (law firm) | | | 60 | | | None | |
Anne-Lee Verville
(Born 1945)
Trustee | | | 1998 | | | Retired. General Manager, Global Education Industry from 1994 to 1997, President — Application Systems Division from 1991 to 1994, Chief Financial Officer — US Marketing & Services from 1988 to 1991, and Chief Information Officer from 1987 to 1988, IBM Corporation (computer and technology) | | | 60 | | | Enesco Group, Inc. (producer of giftware and home and garden decor products) from 2001 to 2006 | |
Annual Report 2015
37
COLUMBIA VALUE AND RESTRUCTURING FUND
TRUSTEES AND OFFICERS (continued)
Interested Trustee Affiliate with Investment Manager*
Name, Year of Birth
and Position Held
with the Trust | | Year First
Appointed or
Elected as
Trustee to any
Fund Currently
in the Columbia
Funds Complex
or a Predecessor
Thereof | | Principal Occupation(s)
during the Past Five Years | | Number
of Funds
in the
Columbia
Funds
Complex
Overseen | | Other Directorships
Held by Trustee During
the Past Five Years | |
William F. Truscott
(Born 1960)
Trustee | | | 2012 | | | Chairman of the Board and President, Columbia Management Investment Advisers, LLC since May 2010 and February 2012, respectively (previously President and Chief Investment Officer, 2001-April 2010); Chief Executive Officer, Global Asset Management, Ameriprise Financial, Inc. since September 2012 (previously Chief Executive Officer, U.S. Asset Management & President, Annuities, May 2010-September 2012 and President — U.S. Asset Management and Chief Investment Officer, 2005-April 2010); Director and Chief Executive Officer, Columbia Management Investment Distributors, Inc. since May 2010 and February 2012, respectively (previously Chairman of the Board and Chief Executive Officer, 2006-April 2010); Chairman of the Board and Chief Executive Officer, RiverSource Distributors, Inc. since 2006; Director, Threadneedle Asset Management Holdings, SARL since 2014; President and Chief Executive Officer, Ameriprise Certificate Company, 2006-August 2012 | | | 187 | | | Chairman of the Board, Columbia Management Investment Advisers, LLC since May 2010; Director, Columbia Management Investment Distributors, Inc. since May 2010; Director, Ameriprise Certificate Company, 2006 to January 2013 | |
* Interested person (as defined under the 1940 Act) by reason of being an officer, director, security holder and/or employee of the Investment Manager or Ameriprise Financial.
The Statement of Additional Information has additional information about the Fund's Board members and is available, without charge, upon request by calling 800.345.6611; contacting your financial intermediary; or visiting columbiathreadneedle.com/us.
The Board has appointed officers who are responsible for day-to-day business decisions based on policies it has established. The officers serve at the pleasure of the Board. In addition to Mr. Truscott, who is Senior Vice President, the Funds' other officers are:
Fund Officers
Name,
Address and
Year of Birth | | Position and Year
First Appointed to
Position for any Fund
in the Columbia
Funds Complex or a
Predecessor Thereof | | Principal Occupation(s) During Past Five Years | |
Christopher O. Petersen
5228 Ameriprise
Financial Center
Minneapolis, MN 55474
Born 1970 | | President and Principal Executive Officer (2015) | | Vice President and Lead Chief Counsel, Ameriprise Financial, Inc. since January 2015 (previously, Vice President and Chief Counsel January 2010-December 2014; and Vice President and Group Counsel or Counsel 2004- January 2010); officer of Columbia Funds and affiliated funds since 2007. | |
Michael G. Clarke
225 Franklin Street
Boston, MA 02110
Born 1969 | | Treasurer (2011) and Chief Financial Officer (2009) | | Vice President — Mutual Fund Administration, Columbia Management Investment Advisers, LLC, since May 2010; Managing Director of Fund Administration, Columbia Management Advisors, LLC, September 2004-April 2010; senior officer of Columbia Funds and affiliated funds since 2002. | |
Annual Report 2015
38
COLUMBIA VALUE AND RESTRUCTURING FUND
TRUSTEES AND OFFICERS (continued)
Fund Officers (continued)
Name,
Address and
Year of Birth | | Position and Year
First Appointed to
Position for any Fund
in the Columbia
Funds Complex or a
Predecessor Thereof | | Principal Occupation(s) During Past Five Years | |
Paul B. Goucher
100 Park Avenue
New York, NY 10017
Born 1968 | | Senior Vice President (2011), Chief Legal Officer (2015) and Assistant Secretary (2008) | | Vice President and Lead Chief Counsel, Ameriprise Financial, Inc. since November 2008 and January 2013, respectively (previously Chief Counsel, January 2010-January 2013 and Group Counsel, November 2008-January 2010). | |
Thomas P. McGuire
225 Franklin Street
Boston, MA 02110
Born 1972 | | Vice President and Chief Compliance Officer (2012) | | Vice President — Asset Management Compliance, Ameriprise Financial, Inc., since May 2010; Chief Compliance Officer, Ameriprise Certificate Company since September 2010; Compliance Executive, Bank of America, 2005-April 2010. | |
Colin Moore
225 Franklin Street
Boston, MA 02110
Born 1958 | | Senior Vice President (2010) | | Executive Vice President and Global Chief Investment Officer, Ameriprise Financial, Inc., since July 2013; Director and Global Chief Investment Officer, Columbia Management Investment Advisers, LLC since May 2010; Manager, Managing Director and Chief Investment Officer, Columbia Management Advisors, LLC, 2007-April 2010. | |
Michael E. DeFao
225 Franklin Street
Boston, MA 02110
Born 1968 | | Vice President (2011) and Assistant Secretary (2010) | | Vice President and Chief Counsel, Ameriprise Financial, Inc. since May 2010; Associate General Counsel, Bank of America, 2005-April 2010. | |
Joseph F. DiMaria
225 Franklin Street
Boston, MA 02110
Born 1968 | | Vice President (2011), Assistant Treasurer (2012) and Chief Accounting Officer (2008) | | Vice President — Mutual Fund Treasurer, Columbia Management Investment Advisers, LLC since May 2010; Director of Fund Administration, Columbia Management Advisors, LLC, 2006-April 2010. | |
Amy Johnson
5228 Ameriprise
Financial Center
Minneapolis, MN 55474
Born 1965 | | Vice President (2006) | | Managing Director and Chief Operating Officer, Columbia Management Investment Advisers, LLC since May 2010 (previously Chief Administrative Officer, 2009-April 2010, and Vice President — Asset Management and Trust Company Services, 2006-2009). | |
Lyn Kephart-Strong
5228 Ameriprise
Financial Center
Minneapolis, MN 55474
Born 1960 | | Vice President (2015) | | President, Columbia Management Investment Services Corp. since October 2014; Vice President & Resolution Officer, Ameriprise Trust Company since August 2009; President, RiverSource Service Corporation 2004-2010. | |
Ryan C. Larrenaga
225 Franklin Street
Boston, MA 02110
Born 1970 | | Vice President and Secretary (2015) | | Vice President and Group Counsel, Ameriprise Financial, Inc. since August 2011 (previously, Counsel from May 2010 to August 2011); Assistant General Counsel, Bank of America, 2005-April 2010; officer of Columbia Funds and affiliated funds since 2005. | |
Annual Report 2015
39
COLUMBIA VALUE AND RESTRUCTURING FUND
BOARD CONSIDERATION AND APPROVAL OF ADVISORY AGREEMENT
On June 10, 2015, the Board of Trustees (the Board) and the Trustees who are not interested persons (as defined in the Investment Company Act of 1940) (the Independent Trustees) of Columbia Funds Series Trust I (the Trust) unanimously approved the continuation of the Investment Management Services Agreement (the Advisory Agreement) with Columbia Management Investment Advisers, LLC (the Investment Manager) with respect to Columbia Value and Restructuring Fund (the Fund), a series of the Trust. The Board and the Independent Trustees also unanimously approved an agreement (the Management Agreement and, together with the Advisory Agreement, the Agreements) combining the Advisory Agreement and the Fund's existing administrative services agreement (the Administrative Services Agreement) in a single agreement. The Board and the Independent Trustees approved the restatement of the Advisory Agreement with the Management Agreement to be effective for the Fund on July 1, 2015. As detailed below, the Board's Advisory Fees and Expenses Committee (the Committee) and the Board met on multiple occasions to review and discuss, both among themselves and with the management team of the Investment Manager, materials provided by the Investment Manager and others before determining to approve the Management Agreement and the continuation of the Advisory Agreement.
In connection with their deliberations regarding the approval of the Management Agreement and the continuation of the Advisory Agreement, the Committee and the Board evaluated materials requested from the Investment Manager regarding the Fund and the Agreements, and discussed these materials with representatives of the Investment Manager at Committee meetings held on March 3, 2015, April 29, 2015 and June 9, 2015 and at Board meetings held on March 4, 2015 and June 10, 2015. In addition, the Board considers matters bearing on the Agreements at most of its other meetings throughout the year and meets regularly with senior management of the Trust and the Investment Manager. Through the Board's Investment Oversight Committees, Trustees also meet with selected portfolio managers of the funds the Trustees oversee and other investment personnel at various times throughout the year. The Committee and the Board also consulted with its independent fee consultant, Fund counsel and with the Independent Trustees' independent legal counsel, who advised on various matters with respect to the Committee's and the Board's considerations and otherwise assisted the Committee and the Board in their deliberations. On June 9, 2015, the Committee recommended that the Board approve the Management Agreement and the continuation of the Advisory Agreement. On June 10, 2015, the Board, including the Independent Trustees, voting separately, unanimously approved the Management Agreement and the continuation of the Advisory Agreement for the Fund.
The Committee and the Board considered all information that they, their legal counsel or the Investment Manager believed reasonably necessary to evaluate and to determine whether to approve the Management Agreement and the continuation of the Advisory Agreement. The information and factors considered by the Committee and the Board in recommending for approval or approving the Management Agreement and the continuation of the Advisory Agreement for the Fund included the following:
• Information on the investment performance of the Fund relative to the performance of a group of mutual funds determined to be comparable to the Fund by an independent third-party data provider, as well as performance relative to benchmarks;
• Information on the Fund's advisory fees and total expenses, including information comparing the Fund's expenses to those of a group of comparable mutual funds, as determined by the independent third-party data provider;
• The Investment Manager's agreement to contractually limit or cap total operating expenses for the Fund so that total operating expenses (excluding certain fees and expenses, such as portfolio transaction costs and certain other investment related expenses, interest, taxes, acquired fund fees and expenses, and extraordinary expenses) would not exceed a specified percentage of the Fund's average annual net assets from January 1, 2016 through December 31, 2016;
• The terms and conditions of the Agreements;
Annual Report 2015
40
COLUMBIA VALUE AND RESTRUCTURING FUND
BOARD CONSIDERATION AND APPROVAL OF ADVISORY AGREEMENT (continued)
• The current and proposed terms and conditions of other agreements and arrangements with affiliates of the Investment Manager relating to the operations of the Fund, including the Administrative Services Agreement1 and agreements with respect to the provision of distribution and transfer agency services to the Fund;
• Descriptions of various functions performed by the Investment Manager under the Agreements, including portfolio management and portfolio trading practices;
• Information regarding the management fees and investment performance of similarly-managed portfolios of other clients of the Investment Manager, including institutional separate accounts;
• Information regarding the reputation, regulatory history and resources of the Investment Manager, including information regarding senior management, portfolio managers and other personnel;
• Information regarding the capabilities of the Investment Manager with respect to compliance monitoring services, including an assessment of the Investment Manager's compliance system by the Fund's Chief Compliance Officer; and
• The profitability to the Investment Manager and its affiliates from their relationships with the Fund.
Nature, Extent and Quality of Services Provided under the Agreements
The Committee and the Board considered the nature, extent and quality of services provided to the Fund by the Investment Manager and its affiliates under the Agreements and under separate agreements for the provision of transfer agency and administrative services, and the resources dedicated to the Fund and the other Columbia Funds by the Investment Manager and its affiliates. The Committee and the Board also determined that the nature and level of the services to be provided under the Management Agreement would not decrease relative to the services provided under the Advisory Agreement and the Administrative Services Agreement. The Committee and the Board considered, among other things, the Investment Manager's ability to attract, motivate and retain highly qualified research, advisory and supervisory investment professionals (including personnel and other resources, compensation programs for personnel involved in fund management, reputation and other attributes), the portfolio management services provided by those investment professionals, and the quality of the Investment Manager's investment research capabilities and trade execution services. The Committee and the Board also considered the potential benefits to shareholders of investing in a mutual fund that is part of a fund complex offering exposure to a variety of asset classes and investment disciplines and providing a variety of fund and shareholder services.
The Committee and the Board also considered the professional experience and qualifications of the senior personnel of the Investment Manager, which included consideration of the Investment Manager's experience with similarly-structured funds. The Committee and the Board noted the compliance programs of and the compliance-related resources provided to the Fund by the Investment Manager and its affiliates, and considered the Investment Manager's ability to provide administrative services to the Fund and coordinate the activities of the Fund's other service providers. In evaluating the nature, extent and quality of services provided under the Agreements, the Committee and the Board considered that these services were provided to the Fund, rather than directly to Fund shareholders. The Committee and the Board accordingly affirmed, after considering various other matters, including the potential benefits to the Fund and its shareholders of the Independent Trustees' important role as pre-suit gatekeepers with respect to claims that they may determine are meritless or contrary to the Fund's best interests, that it was not the intention of the Board or the Investment Manager that there be any third-party beneficiaries of the Agreements. After reviewing these and related factors, the Committee and the Board concluded, within the context of their overall conclusions, that the nature, extent and quality of the services provided to the Fund under the Agreements supported the approval of the Management Agreement and the continuation of the Advisory Agreement.
1 Like the Advisory Agreement, the Administrative Services Agreement will terminate with respect to the Fund once the Management Agreement is effective for the Fund.
Annual Report 2015
41
COLUMBIA VALUE AND RESTRUCTURING FUND
BOARD CONSIDERATION AND APPROVAL OF ADVISORY AGREEMENT (continued)
Investment Performance
The Committee and the Board reviewed information about the performance of the Fund over various time periods, including performance information relative to benchmarks and information based on reports of the independent third-party data provider that compared the performance of the Fund to the performance of a group of comparable mutual funds, and data provided by the independent fee consultant. The Committee and the Board also reviewed a description of the third party's methodology for identifying the Fund's peer groups for purposes of performance and expense comparisons. Although the Fund's performance lagged that of a relevant peer group for certain (although not necessarily all) periods, the Committee and the Board concluded that other factors relevant to performance were sufficient, in light of other considerations, to warrant continuation of the Advisory Agreement and approval of the Management Agreement. Those factors included one or more of the following: (i) that the Fund's performance, although lagging in certain recent periods, was stronger over the longer term; (ii) that the underperformance was attributable, to a significant extent, to investment decisions that were reasonable and consistent with the Fund's investment strategy and policies and that the Fund was performing within a reasonable range of expectations, given those investment decisions, market conditions and the Fund's investment strategy; (iii) that the Fund's performance was competitive when compared to other relevant performance benchmarks or peer groups; and (iv) that the Investment Manager had taken or was taking steps designed to help improve the Fund's investment performance, including, but not limited to, replacing portfolio managers, enhancing the resources supporting the portfolio managers, or modifying investment strategies.
The Committee and the Board noted that, through December 31, 2014, the Fund's performance was in the 32nd, 28th and 69th percentile (where the best performance would be in the first percentile) of its category selected by the independent third-party data provider for the purposes of performance comparisons for the one-, three- and five- year periods, respectively.
The Committee and the Board also considered the Investment Manager's performance and reputation generally, the Investment Manager's historical responsiveness to Board concerns about performance, and the Investment Manager's willingness to take steps intended to improve performance. After reviewing these and related factors, the Committee and the Board concluded, within the context of their overall conclusions, that the performance of the Fund was sufficient, in light of other considerations, to warrant the continuation of the Advisory Agreement and the approval of the Management Agreement.
Investment Advisory Fee Rates and Other Expenses
The Committee and the Board considered the advisory fees charged to the Fund under the Advisory Agreement as well as the total expenses incurred by the Fund. In assessing the reasonableness of the fees under the Advisory Agreement, the Committee and the Board considered, among other information, the Fund's advisory fee and its total expense ratio as a percentage of average daily net assets. The Committee and the Board also considered that the proposed management fee would not exceed the sum of the fee rates payable under the Advisory Agreement and the Administrative Services Agreement. The Committee and the Board considered data provided by the independent fee consultant. The Committee and the Board noted that, as of December 31, 2014, the Fund's actual management fee and net expense ratio are ranked in the 5th and 4th quintiles, respectively, (where the lowest fees and expenses would be in the first quintile) against the Fund's expense universe as determined by the independent third-party data provider for purposes of expense comparison. The Committee and the Board also took into account the fee waiver and expense limitation arrangements agreed to by the Investment Manager, as noted above.
The Committee and the Board also received and considered information about the advisory fees charged by the Investment Manager to institutional separate accounts. In considering the fees charged to those accounts, the Committee and the Board took into account, among other things, the Investment Manager's representations about the differences between managing mutual funds as compared to other types of accounts, including differences in the services provided, differences in the risk profile of such business for the Investment Manager and the additional resources required to manage mutual funds effectively. The Committee and the Board also received and considered information about the fees charged by the Investment Manager for sub-advisory services
Annual Report 2015
42
COLUMBIA VALUE AND RESTRUCTURING FUND
BOARD CONSIDERATION AND APPROVAL OF ADVISORY AGREEMENT (continued)
provided to comparable unaffiliated funds. In evaluating the Fund's advisory fees, the Committee and the Board also took into account the demands, complexity and quality of the investment management of the Fund.
After reviewing these and related factors, the Committee and the Board concluded, within the context of their overall conclusions, that the advisory/management fee rates and expenses of the Fund were sufficient, in light of other considerations, to warrant the approval of the Management Agreement and continuation of the Advisory Agreement.
Costs of Services Provided and Profitability
The Committee and the Board also took note of the costs the Investment Manager and its affiliates incur in connection with the services provided (both on an absolute and relative basis) and the profitability to the Investment Manager and its affiliates in connection with their relationships with the Fund.
The Committee and the Board also considered the compensation directly or indirectly received by the Investment Manager's affiliates in connection with their relationships with the Fund. The Committee and the Board reviewed information provided by management as to the profitability to the Investment Manager and its affiliates of their relationships with the Fund, information about the allocation of expenses used to calculate profitability, and comparisons of profitability levels realized in 2014 to profitability levels realized in 2013. When reviewing profitability, the Committee and the Board also considered court cases in which adviser profitability was an issue in whole or in part, the performance of similarly managed funds, the performance of the Fund, and the expense ratio of the Fund. The Committee and the Board also considered information provided by the Investment Manager regarding the Investment Manager's financial condition and comparing its profitability to that of other asset management firms that are, or are subsidiaries of, publicly traded companies.
After reviewing these and related factors, the Committee and the Board concluded, within the context of their overall conclusions, that the costs of services provided and the profitability to the Investment Manager and its affiliates from their relationships with the Fund supported the approval of the Management Agreement and the continuation of the Advisory Agreement.
Economies of Scale
The Committee and the Board considered the potential existence of economies of scale in the provision by the Investment Manager of services to the Fund, to groups of related funds, and to the Investment Manager's investment advisory clients as a whole, and whether those economies of scale were shared with the Fund through breakpoints in investment advisory fees or other means, such as expense limitation arrangements and additional investments by the Investment Manager in investment, trading and compliance resources. The Committee and the Board noted that the investment advisory and management fee schedules for the Fund contained breakpoints that would reduce the fee rate on assets above specified threshold levels.
In considering these matters, the Committee and the Board also considered the costs of the services provided and the profitability to the Investment Manager and its affiliates from their relationships with the Fund, as discussed above. After reviewing these and related factors, the Committee and the Board concluded, within the context of their overall conclusions, that the extent to which any economies of scale were expected to be shared with the Fund supported the approval of the Management Agreement and the continuation of the Advisory Agreement.
Other Benefits to the Investment Manager
The Committee and the Board received and considered information regarding "fall-out" or ancillary benefits received by the Investment Manager and its affiliates as a result of their relationships with the Fund, such as the engagement of the Investment Manager to provide administrative services to the Fund and the engagement of the Investment Manager's affiliates to provide distribution and transfer agency services to the Fund. In this regard, among other matters, the Committee and the Board considered that the Fund's distributor retains a portion of the distribution fees from the Fund and receives a portion of the sales charges on sales or redemptions of certain classes of shares of the Fund. The Committee and the Board also considered the benefits
Annual Report 2015
43
COLUMBIA VALUE AND RESTRUCTURING FUND
BOARD CONSIDERATION AND APPROVAL OF ADVISORY AGREEMENT (continued)
of research made available to the Investment Manager by reason of brokerage commissions generated by the Fund's securities transactions, and reviewed information about the Investment Manager's practices with respect to allocating portfolio transactions for brokerage and research services. The Committee and the Board considered the possible conflicts of interest associated with certain fall-out or other ancillary benefits and the reporting, disclosure and other processes that are in place to address such possible conflicts of interest. The Committee and the Board recognized that the Investment Manager's profitability would be somewhat lower without these benefits.
Conclusion
The Committee and the Board reviewed all of the above considerations in reaching their decisions to recommend or approve the Management Agreement and the continuation of the Advisory Agreement. In their deliberations, the Trustees did not identify any particular information that was all-important or controlling, and individual Trustees may have attributed different weights to the various factors. Based on their evaluation of all factors that they deemed to be material, including those factors described above, and assisted by the advice of independent legal counsel, the Board, including the Independent Trustees, voting separately, unanimously approved the Management Agreement and the continuation of the Advisory Agreement.
Annual Report 2015
44
COLUMBIA VALUE AND RESTRUCTURING FUND
IMPORTANT INFORMATION ABOUT THIS REPORT
Each fund mails one shareholder report to each shareholder address. If you would like more than one report, please call shareholder services at 800.345.6611 and additional reports will be sent to you.
The policy of the Board is to vote the proxies of the companies in which each fund holds investments consistent with the procedures as stated in the Statement of Additional Information (SAI). You may obtain a copy of the SAI without charge by calling 800.345.6611; contacting your financial intermediary; visiting columbiathreadneedle.com/us; or searching the website of the Securities and Exchange Commission (SEC) at sec.gov. Information regarding how each fund voted proxies relating to portfolio securities is filed with the SEC by August 31st for the most recent 12-month period ending June 30th of that year, and is available without charge by visiting columbiathreadneedle.com/us, or searching the website of the SEC at sec.gov.
Each fund files a complete schedule of portfolio holdings with the SEC for the first and third quarters of each fiscal year on Form N-Q. Each fund's Form N-Q is available on the SEC's website at sec.gov and may be reviewed and copied at the SEC's Public Reference Room in Washington, D.C. Information on the operation of the Public Reference Room may be obtained by calling 800.SEC.0330. Each fund's complete schedule of portfolio holdings, as filed on Form N-Q, can also be obtained without charge, upon request, by calling 800.345.6611.
Annual Report 2015
45
Columbia Value and Restructuring Fund
P.O. Box 8081
Boston, MA 02266-8081

This information is for use with concurrent or prior delivery of a fund prospectus. Please read and consider the investment objectives, risks, charges and expenses for any fund carefully before investing. For a prospectus and summary prospectus, which contains this and other important information about the Fund, go to columbiathreadneedle.com/us. The Fund is distributed by Columbia Management Investment Distributors, Inc., member FINRA, and managed by Columbia Management Investment Advisers, LLC.
Columbia Threadneedle Investments (Columbia Threadneedle) is the global brand name of the Columbia and Threadneedle group of companies.
All rights reserved. Columbia Management Investment Distributors, Inc., 225 Franklin Street, Boston, MA 02110-2804
© 2015 Columbia Management Investment Advisers, LLC.
columbiathreadneedle.com/us
ANN238_08_E01_(10/15)

ANNUAL REPORT
August 31, 2015


 Dear Shareholder,
Today's investors are typically focused on outcomes, like living a certain retirement lifestyle, paying for college education or building a legacy. But in today's complex global investment landscape, even simple goals are not easily achieved.
At Columbia Threadneedle Investments, we aspire to help satisfy five core needs of today's investors:
n Generate an appropriate stream of income in retirement
Traditional approaches to generating income may not provide the diversification benefits they once did, and they may actually introduce unwanted risk in today's market. To seek to improve your potential to live comfortably long term, we endeavor to pursue investments that explore less traveled paths to income.
n Navigate a changing interest rate environment
Today's uncertain market environment includes the prospect of a rise in interest rates. Blending traditional investments with non-traditional or alternative products may help protect your wealth during periods of volatility. We can attempt to help strengthen your portfolio with agile products designed to take on the market's ups and downs.
n Maximize after-tax returns
In an environment where what you keep may be more important than what you earn, municipal bonds can help mitigate high tax burdens while providing potentially attractive yields. Our state and federal tax-exempt products are aimed at helping investors manage risk, minimize the fluctuation of capital and grow wealth on a more tax-efficient basis.
n Grow assets to achieve financial goals
We believe that finding and protecting growth comes from a disciplined security selection process designed to create excess return. Our goal is to provide investment solutions built to help you face today's market challenges and grow your assets at each crossroad of your journey.
n Ease the impact of volatile markets
Despite a bull market run that has benefited many investors over the past several years, it's important to remember the lessons of 2008 and the value that a well-diversified portfolio may provide through times of market volatility. We are here to help you hold onto the savings you have worked tirelessly to amass, and to provide you the best opportunity to maintain your standard of living regardless of market conditions.
Find out today how we can help you confidently invest to realize your dreams. Please visit us at blog.columbiathreadneedleus.com/our-best-ideas to learn more about our unique investment solutions.
The world is constantly changing, but our priority remains the same: to help you secure your finances, meet your goals and achieve success. Thank you for your continued investment with us.
Sincerely,

Christopher O. Petersen
President, Columbia Funds
Investors should consider the investment objectives, risks, charges and expenses of a mutual fund carefully before investing. For a free prospectus and summary prospectus, which contains this and other important information about a fund, visit columbiathreadneedle.com/us. The prospectus should be read carefully before investing.
Columbia Funds are distributed by Columbia Management Investment Distributors, Inc., member FINRA, and managed by Columbia Management Investment Advisers, LLC.
© 2015 Columbia Management Investment Advisers, LLC. All rights reserved.
Performance Overview | | | 2 | | |
Manager Discussion of Fund Performance | | | 4 | | |
Understanding Your Fund's Expenses | | | 6 | | |
Portfolio of Investments | | | 7 | | |
Statement of Assets and Liabilities | | | 29 | | |
Statement of Operations | | | 31 | | |
Statement of Changes in Net Assets | | | 32 | | |
Financial Highlights | | | 35 | | |
Notes to Financial Statements | | | 44 | | |
Report of Independent Registered
Public Accounting Firm | | | 55 | | |
Federal Income Tax Information | | | 56 | | |
Trustees and Officers | | | 57 | | |
Board Consideration and Approval of Advisory Agreement | | | 61 | | |
Important Information About This Report | | | 65 | | |
Fund Investment Manager
Columbia Management Investment
Advisers, LLC
225 Franklin Street
Boston, MA 02110
Fund Distributor
Columbia Management Investment
Distributors, Inc.
225 Franklin Street
Boston, MA 02110
Fund Transfer Agent
Columbia Management Investment
Services Corp.
P.O. Box 8081
Boston, MA 02266-8081
For more information about any of the funds, please visit columbiathreadneedle.com/us or call 800.345.6611. Customer Service Representatives are available to answer your questions Monday through Friday from 8 a.m. to 7 p.m. Eastern time.
The views expressed in this report reflect the current views of the respective parties. These views are not guarantees of future performance and involve certain risks, uncertainties and assumptions that are difficult to predict, so actual outcomes and results may differ significantly from the views expressed. These views are subject to change at any time based upon economic, market or other conditions and the respective parties disclaim any responsibility to update such views. These views may not be relied on as investment advice and, because investment decisions for a Columbia fund are based on numerous factors, may not be relied on as an indication of trading intent on behalf of any particular Columbia fund. References to specific securities should not be construed as a recommendation or investment advice.
Performance Summary
n Columbia Balanced Fund (the Fund) Class A shares returned 1.38% excluding sales charges for the 12-month period that ended August 31, 2015.
n The Fund outperformed its Blended Index, which returned 1.06% during the same time period.
n The Fund's equity component outperformed the S&P 500 Index, which returned 0.48%, while the fixed-income segment performed in line with the Barclays U.S. Aggregate Bond Index, which returned 1.56% during the same time period
Average Annual Total Returns (%) (for period ended August 31, 2015)
| | | Inception | | 1 Year | | 5 Years | | 10 Years | |
Class A | | 11/01/02 | | | | | | | | | | | | | |
Excluding sales charges | | | | | | | 1.38 | | | | 11.73 | | | | 7.59 | | |
Including sales charges | | | | | | | -4.45 | | | | 10.42 | | | | 6.95 | | |
Class B | | 11/01/02 | | | | | | | | | | | | | |
Excluding sales charges | | | | | | | 0.63 | | | | 10.89 | | | | 6.78 | | |
Including sales charges | | | | | | | -4.21 | | | | 10.63 | | | | 6.78 | | |
Class C | | 10/13/03 | | | | | | | | | | | | | |
Excluding sales charges | | | | | | | 0.63 | | | | 10.90 | | | | 6.78 | | |
Including sales charges | | | | | | | -0.34 | | | | 10.90 | | | | 6.78 | | |
Class K* | | 03/07/11 | | | 1.49 | | | | 11.82 | | | | 7.63 | | |
Class R* | | 09/27/10 | | | 1.10 | | | | 11.45 | | | | 7.31 | | |
Class R4* | | 11/08/12 | | | 1.62 | | | | 12.01 | | | | 7.85 | | |
Class R5* | | 03/07/11 | | | 1.74 | | | | 12.11 | | | | 7.90 | | |
Class Y* | | 11/08/12 | | | 1.78 | | | | 12.11 | | | | 7.90 | | |
Class Z | | 10/01/91 | | | 1.64 | | | | 12.00 | | | | 7.85 | | |
Blended Index | | | | | | | 1.06 | | | | 10.75 | | | | 6.36 | | |
S&P 500 Index | | | | | | | 0.48 | | | | 15.87 | | | | 7.15 | | |
Barclays U.S. Aggregate Bond Index | | | | | | | 1.56 | | | | 2.98 | | | | 4.46 | | |
Returns for Class A are shown with and without the maximum initial sales charge of 5.75%. Returns for Class B are shown with and without the applicable contingent deferred sales charge (CDSC) of 5.00% in the first year, declining to 1.00% in the sixth year and eliminated thereafter. Returns for Class C are shown with and without the 1.00% CDSC for the first year only. The Fund's other classes are not subject to sales charges and have limited eligibility. Please see the Fund's prospectus for details. Performance for different share classes will vary based on differences in sales charges and fees associated with each class. All results shown assume reinvestment of distributions during the period. Returns do not reflect the deduction of taxes that a shareholder may pay on Fund distributions or on the redemption of Fund shares. Performance results reflect the effect of any fee waivers or reimbursements of Fund expenses by Columbia Management Investment Advisers, LLC and/or any of its affiliates. Absent these fee waivers or expense reimbursement arrangements, performance results would have been lower.
The performance information shown represents past performance and is not a guarantee of future results. The investment return and principal value of your investment will fluctuate so that your shares, when redeemed, may be worth more or less than their original cost. Current performance may be lower or higher than the performance information shown. You may obtain performance information current to the most recent month-end by contacting your financial intermediary, visiting columbiathreadneedle.com/us or calling 800.345.6611.
*The returns shown for periods prior to the share class inception date (including returns for the Life of the Fund, if shown, which are since Fund inception) include the returns of the Fund's oldest share class. These returns are adjusted to reflect any higher class-related operating expenses of the newer share classes, as applicable. Please visit columbiathreadneedle.com/us/investment-products/mutual-funds/ appended-performance for more information.
The Blended Index is a weighted custom composite consisting of 60% S&P 500 Index and 40% Barclays U.S. Aggregate Bond Index.
The S&P 500 Index, an unmanaged index, measures the performance of 500 widely held, large-capitalization U.S. stocks and is frequently used as a general measure of market performance.
The Barclays U.S. Aggregate Bond Index is a broad-based benchmark that measures the investment-grade, U.S. dollar-denominated, fixed-rate taxable bond market, including Treasuries, government-related and corporate securities, mortgage-backed securities (agency fixed-rate and hybrid adjustable-rate mortgage passthroughs), asset-backed securities, and commercial mortgage-backed securities.
Indices are not available for investment, are not professionally managed and do not reflect sales charges, fees, brokerage commissions, taxes or other expenses of investing. Securities in the Fund may not match those in an index.
Annual Report 2015
2
PERFORMANCE OVERVIEW (continued)
Performance of a Hypothetical $10,000 Investment (September 1, 2005 – August 31, 2015)

The chart above shows the change in value of a hypothetical $10,000 investment in Class A shares of Columbia Balanced Fund during the stated time period, and does not reflect the deduction of taxes that a shareholder may pay on Fund distributions or on the redemption of Fund shares.
Annual Report 2015
3
MANAGER DISCUSSION OF FUND PERFORMANCE
Portfolio Management
Leonard Aplet, CFA
Brian Lavin, CFA
Gregory Liechty
Guy Pope, CFA
Ronald Stahl, CFA
Top Ten Holdings (%)
(at August 31, 2015) | |
U.S. Treasury | | | 2.8 | | |
Apple, Inc. | | | 2.7 | | |
JPMorgan Chase & Co. | | | 1.9 | | |
CVS Health Corp. | | | 1.9 | | |
Medtronic PLC | | | 1.9 | | |
Berkshire Hathaway, Inc.,
Class B | | | 1.9 | | |
Verizon Communications, Inc. | | | 1.8 | | |
American Express Co. | | | 1.8 | | |
Google, Inc., Class C | | | 1.7 | | |
Comcast Corp., Class A | | | 1.6 | | |
Percentages indicated are based upon total investments (excluding Money Market).
For further detail about these holdings, please refer to the section entitled "Portfolio of Investments."
Fund holdings are as of the date given, are subject to change at any time, and are not recommendations to buy or sell any security.
For the 12-month period that ended August 31, 2015, the Fund's Class A shares returned 1.38% excluding sales charges. The Fund's return was higher than the 1.06% return of its Blended Index, a 60/40 mix of the S&P 500 Index and the Barclays U.S. Aggregate Bond Index, which returned 0.48% and 1.56%, respectively. Even though bonds outperformed stocks for the period, the Fund's equity portion outperformed its benchmark and accounted for the Fund's advantage relative to its Blended Index. The fixed-income portion of the portfolio performed in line with its benchmark.
Markets Turned Volatile as Pressures Mounted
The pace of U.S. economic growth fluctuated during the 12-month period that ended August 31, 2015. Another stormy winter in the Northeast and Midwest whittled away at gross domestic product (GDP) early in 2015. A strong dollar, a widening trade deficit and declining oil prices also took a significant bite out of growth. Yet most of these setbacks proved to be temporary, and the U.S. economy rebounded as temperatures thawed. An average of 243,000 new jobs were added monthly to the U.S. workforce, driving the unemployment rate down to 5.1% and bolstering consumer confidence. Manufacturing activity was solid even though the pace of manufacturing growth slowed over the year. Home sales were robust. However, stubbornly low inventory levels and rising prices have kept many first-time buyers out of the market.
As concerns mounted about a sluggish global economy, weakening growth in China and the timing of a Federal Reserve (Fed) interest rate hike, the financial markets turned volatile. Solid stock market gains in the first half of the 12-month period were all but wiped out in the second half. Large-cap stocks edged out mid-cap and small-cap stocks, while growth stocks significantly outperformed value stocks. Bonds generally outperformed stocks for the period.
Favorable Results from Equity Holdings
The Fund's investments in the information technology sector aided relative performance. Shares of video game companies Activision Blizzard and Electronic Arts led the way, supported by new product offerings and a consumer trend toward digital platforms. Trends in semiconductor content within smart phones were favorable for companies such as Skyworks Solutions and Broadcom, the latter of which was purchased by Avago toward the end of the period. Merger and acquisition activity also aided the Fund within the health care sector. Medtronic finalized its purchase of Covidien, and Cigna and Perrigo each received buyout offers during the period. Among consumer staples companies, shares of drug-store chains CVS and Walgreens moved higher as investors rewarded company efforts to improve their respective balance sheets.
The Fund experienced mixed results from the energy sector. An underweight relative to the equity benchmark aided results as oil prices declined sharply. However, the Fund gave some of that advantage back on stock selection. Holdings in the gaming industry also detracted from overall performance, with Wynn Resorts and Las Vegas Sands each experiencing a difficult period with their Asian casino properties.
Fixed Income Matched Index
Within fixed income, Treasury securities outperformed most other asset classes for the period and generally speaking, higher quality securities
Annual Report 2015
4
MANAGER DISCUSSION OF FUND PERFORMANCE (continued)
outperformed lower quality securities. In contrast to the past few years, investors were not rewarded for carrying extra risk. Against this backdrop, the fixed-income portion of the fund was overweight in corporate bonds, which underperformed similar duration U.S. Treasuries by 3.37%. Duration is a measure of sensitivity to changes in interest rates. Within the corporate market, exposure to energy, basic industry and media sectors detracted from performance as these sectors underperformed the rest of the corporate market. Lower quality securities underperformed higher quality securities within most subsectors as well. Thus, the Fund's small allocation to high-yield securities also hampered performance.
On the plus side, the Fund's positions in banking and finance issues held up better than the rest of the corporate market. The Fund's yield curve positioning also was additive to results. Although interest rates didn't move a great deal one way or another during the period, the yield curve flattened slightly, with the yield on two-year notes rising fractionally as longer term yields came down. The Fund's ownership of longer term securities was therefore additive to performance. With inflation remaining below 2%, the Fed continued to signal patience with respect to its widely anticipated shift towards a less accommodative monetary policy stance, and maintained its federal funds target rate at 0.00%-0.25%.
Looking Ahead
We continue to regard equities at this time as an attractive long term asset class even though the short term market backdrop is less forgiving than it has been, given higher valuations, decelerating earnings growth and less accommodative monetary policy. The past year has demonstrated that U.S. markets are by no means insulated from weaknesses in overseas economies. We expect the performance of global economies will be closely watched in the year ahead and could bring an extra measure of volatility to the market. Domestically, all eyes will be on the Fed, which has thus far delayed its long-anticipated move to push short-term interest rates higher. In addition, we believe that investors will further focus in on company fundamentals, which have clearly weakened over the last 12 months.
On the fixed-income side, the Fund continues to target a shorter duration than that of the benchmark and remains underweight in U.S. government securities. The Fund currently has more exposure than its fixed-income benchmark to asset-backed securities (ABS) and commercial mortgage-backed securities (CMBS) including Ginnie Mae government-backed project loans, as we believe they continue to offer some of the most attractive relative spreads in the investment-grade market. We prefer seasoned, AAA, super-senior CMBS holdings as well as short, current-pay GNMA project loan tranches.
At this time, we believe the corporate sector has the potential to offer positive excess returns relative to U.S. Treasuries. This marginal outperformance should mainly be driven by its yield advantage. Corporate balance sheets currently remain in good shape even though leverage is expected to rise for the nonfinancial sectors. Corporate issuance for the first eight months of 2015 was the highest on record and is expected to be strong throughout the remainder of the year, largely due to acquisition financing and desired shareholder returns. Within corporates, we are most optimistic at this time about the electric utility, insurance and energy sectors.
Portfolio Breakdown (%)
(at August 31, 2015) | |
Asset-Backed Securities —
Non-Agency | | | 1.6 | | |
Commercial Mortgage-Backed Securities — Agency | | | 3.3 | | |
Commercial Mortgage-Backed Securities — Non-Agency | | | 3.0 | | |
Common Stocks | | | 59.4 | | |
Corporate Bonds & Notes | | | 11.2 | | |
Foreign Government Obligations | | | 0.5 | | |
Inflation-Indexed Bonds | | | 0.6 | | |
Money Market Funds | | | 8.0 | | |
Municipal Bonds | | | 0.1 | | |
Residential Mortgage-Backed
Securities — Agency | | | 8.7 | | |
Residential Mortgage-Backed
Securities — Non-Agency | | | 0.2 | | |
Senior Loans | | | 0.0 | (a) | |
U.S. Treasury Obligations | | | 3.4 | | |
Total | | | 100.0 | | |
Percentages indicated are based upon total investments. The Fund's portfolio composition is subject to change.
(a) Rounds to zero.
Investment Risks
Market risk may affect a single issuer, sector of the economy, industry or the market as a whole. There are risks associated with fixed-income investments, including credit risk, interest rate risk, and prepayment and extension risk. In general, bond prices rise when interest rates fall and vice versa. This effect is usually more pronounced for longer term securities. A rise in interest rates may result in a price decline of fixed-income instruments held by the Fund, negatively impacting its performance and NAV. Falling rates may result in the Fund investing in lower yielding debt instruments, lowering the Fund's income and yield. These risks may be heightened for longer maturity and duration securities. Foreign investments subject the Fund to risks, including political, economic, market, social and others within a particular country, as well as to currency instabilities and less stringent financial and accounting standards generally applicable to U.S. issuers. Investing in derivatives is a specialized activity that involves special risks that subject the Fund to significant loss potential, including when used as leverage, and may result in greater fluctuation in fund value. See the Fund's prospectus for more information on these and other risks.
Annual Report 2015
5
UNDERSTANDING YOUR FUND'S EXPENSES
(Unaudited)
As an investor, you incur two types of costs. There are transaction costs, which generally include sales charges on purchases and may include redemption fees. There are also ongoing costs, which generally include management fees, distribution and/or service fees, and other fund expenses. The following information is intended to help you understand your ongoing costs (in dollars) of investing in the Fund and to help you compare these costs with the ongoing costs of investing in other mutual funds.
Analyzing Your Fund's Expenses
To illustrate these ongoing costs, we have provided examples and calculated the expenses paid by investors in each share class of the Fund during the period. The actual and hypothetical information in the table is based on an initial investment of $1,000 at the beginning of the period indicated and held for the entire period. Expense information is calculated two ways and each method provides you with different information. The amount listed in the "Actual" column is calculated using the Fund's actual operating expenses and total return for the period. You may use the Actual information, together with the amount invested, to estimate the expenses that you paid over the period. Simply divide your account value by $1,000 (for example, an $8,600 account value divided by $1,000 = 8.6), then multiply the results by the expenses paid during the period under the "Actual" column. The amount listed in the "Hypothetical" column assumes a 5% annual rate of return before expenses (which is not the Fund's actual return) and then applies the Fund's actual expense ratio for the period to the hypothetical return. You should not use the hypothetical account values and expenses to estimate either your actual account balance at the end of the period or the expenses you paid during the period. See "Compare With Other Funds" below for details on how to use the hypothetical data.
Compare With Other Funds
Since all mutual funds are required to include the same hypothetical calculations about expenses in shareholder reports, you can use this information to compare the ongoing cost of investing in the Fund with other funds. To do so, compare the hypothetical example with the 5% hypothetical examples that appear in the shareholder reports of other funds. As you compare hypothetical examples of other funds, it is important to note that hypothetical examples are meant to highlight the ongoing costs of investing in a fund only and do not reflect any transaction costs, such as sales charges, or redemption or exchange fees. Therefore, the hypothetical calculations are useful in comparing ongoing costs only, and will not help you determine the relative total costs of owning different funds. If transaction costs were included in these calculations, your costs would be higher.
March 1, 2015 – August 31, 2015
| | | Account Value at the Beginning
of the Period ($) | | Account Value at the End of the
Period ($) | | Expenses Paid During the
Period ($) | | Fund's Annualized
Expense Ratio (%) | |
| | | Actual | | Hypothetical | | Actual | | Hypothetical | | Actual | | Hypothetical | | Actual | |
Class A | | | 1,000.00 | | | | 1,000.00 | | | | 969.70 | | | | 1,020.02 | | | | 5.24 | | | | 5.38 | | | | 1.05 | | |
Class B | | | 1,000.00 | | | | 1,000.00 | | | | 966.00 | | | | 1,016.22 | | | | 8.97 | | | | 9.20 | | | | 1.80 | | |
Class C | | | 1,000.00 | | | | 1,000.00 | | | | 966.00 | | | | 1,016.22 | | | | 8.97 | | | | 9.20 | | | | 1.80 | | |
Class K | | | 1,000.00 | | | | 1,000.00 | | | | 970.10 | | | | 1,020.53 | | | | 4.74 | | | | 4.86 | | | | 0.95 | | |
Class R | | | 1,000.00 | | | | 1,000.00 | | | | 968.30 | | | | 1,018.75 | | | | 6.48 | | | | 6.65 | | | | 1.30 | | |
Class R4 | | | 1,000.00 | | | | 1,000.00 | | | | 971.10 | | | | 1,021.29 | | | | 4.00 | | | | 4.10 | | | | 0.80 | | |
Class R5 | | | 1,000.00 | | | | 1,000.00 | | | | 971.40 | | | | 1,021.79 | | | | 3.50 | | | | 3.59 | | | | 0.70 | | |
Class Y | | | 1,000.00 | | | | 1,000.00 | | | | 971.60 | | | | 1,022.05 | | | | 3.25 | | | | 3.33 | | | | 0.65 | | |
Class Z | | | 1,000.00 | | | | 1,000.00 | | | | 970.90 | | | | 1,021.29 | | | | 4.00 | | | | 4.10 | | | | 0.80 | | |
Expenses paid during the period are equal to the annualized expense ratio for each class as indicated above, multiplied by the average account value over the period and then multiplied by the number of days in the Fund's most recent fiscal half year and divided by 365.
Expenses do not include fees and expenses incurred indirectly by the Fund from its investment in underlying funds, including affiliated and non-affiliated pooled investment vehicles, such as mutual funds and exchange-traded funds.
Annual Report 2015
6
PORTFOLIO OF INVESTMENTS
August 31, 2015
(Percentages represent value of investments compared to net assets)
Common Stocks 60.4%
Issuer | | Shares | | Value ($) | |
CONSUMER DISCRETIONARY 6.7% | |
Auto Components 0.9% | |
Delphi Automotive PLC | | | 382,555 | | | | 28,890,554 | | |
Hotels, Restaurants & Leisure 0.7% | |
Aramark | | | 366,785 | | | | 11,495,042 | | |
McDonald's Corp. | | | 136,720 | | | | 12,991,134 | | |
Total | | | | | 24,486,176 | | |
Household Durables 0.3% | |
Mohawk Industries, Inc.(a) | | | 43,814 | | | | 8,630,044 | | |
Internet & Catalog Retail 0.9% | |
Priceline Group, Inc. (The)(a) | | | 22,300 | | | | 27,844,672 | | |
Media 2.1% | |
CBS Corp., Class B Non Voting | | | 449,885 | | | | 20,352,797 | | |
Comcast Corp., Class A | | | 850,421 | | | | 47,904,215 | | |
Total | | | | | 68,257,012 | | |
Specialty Retail 1.4% | |
Lowe's Companies, Inc. | | | 516,472 | | | | 35,724,368 | | |
Michaels Companies, Inc. (The)(a) | | | 440,727 | | | | 11,551,455 | | |
Total | | | | | 47,275,823 | | |
Textiles, Apparel & Luxury Goods 0.4% | |
PVH Corp. | | | 106,371 | | | | 12,656,021 | | |
Total Consumer Discretionary | | | | | 218,040,302 | | |
CONSUMER STAPLES 4.8% | |
Beverages 1.9% | |
Diageo PLC, ADR | | | 218,254 | | | | 23,215,678 | | |
PepsiCo, Inc. | | | 413,818 | | | | 38,456,107 | | |
Total | | | | | 61,671,785 | | |
Food & Staples Retailing 2.2% | |
CVS Health Corp. | | | 567,705 | | | | 58,132,992 | | |
Walgreens Boots Alliance, Inc. | | | 154,239 | | | | 13,349,385 | | |
Total | | | | | 71,482,377 | | |
Tobacco 0.7% | |
Philip Morris International, Inc. | | | 306,760 | | | | 24,479,448 | | |
Total Consumer Staples | | | | | 157,633,610 | | |
ENERGY 4.2% | |
Energy Equipment & Services 0.6% | |
Schlumberger Ltd. | | | 250,575 | | | | 19,386,988 | | |
Common Stocks (continued)
Issuer | | Shares | | Value ($) | |
Oil, Gas & Consumable Fuels 3.6% | |
Canadian Natural Resources Ltd. | | | 597,015 | | | | 13,414,927 | | |
Chevron Corp. | | | 333,966 | | | | 27,047,906 | | |
ConocoPhillips | | | 253,439 | | | | 12,456,527 | | |
Exxon Mobil Corp. | | | 353,555 | | | | 26,601,478 | | |
Noble Energy, Inc. | | | 156,638 | | | | 5,233,276 | | |
Range Resources Corp. | | | 344,225 | | | | 13,293,970 | | |
Williams Companies, Inc. (The) | | | 431,581 | | | | 20,802,204 | | |
Total | | | | | 118,850,288 | | |
Total Energy | | | | | 138,237,276 | | |
FINANCIALS 11.2% | |
Banks 5.0% | |
Bank of America Corp. | | | 1,942,549 | | | | 31,741,250 | | |
Citigroup, Inc. | | | 806,237 | | | | 43,117,555 | | |
JPMorgan Chase & Co. | | | 922,208 | | | | 59,113,533 | | |
Wells Fargo & Co. | | | 548,661 | | | | 29,260,091 | | |
Total | | | | | 163,232,429 | | |
Capital Markets 1.8% | |
BlackRock, Inc. | | | 101,286 | | | | 30,635,976 | | |
Goldman Sachs Group, Inc. (The) | | | 153,865 | | | | 29,018,939 | | |
Total | | | | | 59,654,915 | | |
Consumer Finance 1.7% | |
American Express Co. | | | 707,585 | | | | 54,285,921 | | |
Diversified Financial Services 1.8% | |
Berkshire Hathaway, Inc., Class B(a) | | | 425,245 | | | | 56,999,840 | | |
Insurance 0.8% | |
Aon PLC | | | 281,492 | | | | 26,302,613 | | |
Real Estate Investment Trusts (REITs) 0.1% | |
Rayonier, Inc. | | | 197,610 | | | | 4,545,030 | | |
Total Financials | | | | | 365,020,748 | | |
HEALTH CARE 9.7% | |
Biotechnology 2.7% | |
Baxalta, Inc. | | | 372,435 | | | | 13,091,090 | | |
Biogen, Inc.(a) | | | 101,070 | | | | 30,048,111 | | |
Celgene Corp.(a) | | | 264,382 | | | | 31,218,227 | | |
Vertex Pharmaceuticals, Inc.(a) | | | 102,590 | | | | 13,082,277 | | |
Total | | | | | 87,439,705 | | |
The accompanying Notes to Financial Statements are an integral part of this statement.
Annual Report 2015
7
PORTFOLIO OF INVESTMENTS (continued)
August 31, 2015
Common Stocks (continued)
Issuer | | Shares | | Value ($) | |
Health Care Equipment & Supplies 3.4% | |
Abbott Laboratories | | | 732,035 | | | | 33,153,865 | | |
Medtronic PLC | | | 794,194 | | | | 57,412,284 | | |
St. Jude Medical, Inc. | | | 291,197 | | | | 20,619,660 | | |
Total | | | | | 111,185,809 | | |
Health Care Providers & Services 2.0% | |
Cardinal Health, Inc. | | | 458,586 | | | | 37,727,870 | | |
CIGNA Corp. | | | 186,239 | | | | 26,220,589 | | |
Total | | | | | 63,948,459 | | |
Pharmaceuticals 1.6% | |
Johnson & Johnson | | | 505,770 | | | | 47,532,264 | | |
Perrigo Co. PLC | | | 34,405 | | | | 6,295,083 | | |
Total | | | | | 53,827,347 | | |
Total Health Care | | | | | 316,401,320 | | |
INDUSTRIALS 7.1% | |
Aerospace & Defense 1.9% | |
Honeywell International, Inc. | | | 394,863 | | | | 39,198,050 | | |
United Technologies Corp. | | | 238,234 | | | | 21,824,617 | | |
Total | | | | | 61,022,667 | | |
Air Freight & Logistics 0.7% | |
FedEx Corp. | | | 154,692 | | | | 23,298,162 | | |
Building Products 0.3% | |
Fortune Brands Home & Security, Inc. | | | 215,637 | | | | 10,318,230 | | |
Commercial Services & Supplies 0.7% | |
Tyco International PLC | | | 655,621 | | | | 23,792,486 | | |
Industrial Conglomerates 1.1% | |
General Electric Co. | | | 1,475,975 | | | | 36,633,699 | | |
Professional Services 2.1% | |
Dun & Bradstreet Corp. (The) | | | 125,425 | | | | 13,291,287 | | |
IHS, Inc., Class A(a) | | | 95,032 | | | | 11,025,613 | | |
Nielsen Holdings PLC | | | 962,855 | | | | 43,549,932 | | |
Total | | | | | 67,866,832 | | |
Road & Rail 0.3% | |
Kansas City Southern | | | 87,136 | | | | 8,080,993 | | |
Total Industrials | | | | | 231,013,069 | | |
INFORMATION TECHNOLOGY 13.5% | |
Communications Equipment 0.2% | |
QUALCOMM, Inc. | | | 124,414 | | | | 7,039,344 | | |
Common Stocks (continued)
Issuer | | Shares | | Value ($) | |
Internet Software & Services 3.5% | |
Alibaba Group Holding Ltd., ADR(a) | | | 68,010 | | | | 4,496,821 | | |
Facebook, Inc., Class A(a) | | | 361,100 | | | | 32,293,173 | | |
Google, Inc., Class A(a) | | | 41,399 | | | | 26,819,100 | | |
Google, Inc., Class C(a) | | | 81,928 | | | | 50,651,986 | | |
Total | | | | | 114,261,080 | | |
IT Services 1.2% | |
MasterCard, Inc., Class A | | | 431,165 | | | | 39,826,711 | | |
Semiconductors & Semiconductor Equipment 1.4% | |
Broadcom Corp., Class A | | | 552,598 | | | | 28,552,739 | | |
Qorvo, Inc.(a) | | | 89,875 | | | | 4,988,961 | | |
Skyworks Solutions, Inc. | | | 143,193 | | | | 12,507,909 | | |
Total | | | | | 46,049,609 | | |
Software 3.4% | |
Activision Blizzard, Inc. | | | 1,069,165 | | | | 30,610,194 | | |
Electronic Arts, Inc.(a) | | | 236,402 | | | | 15,637,992 | | |
Intuit, Inc. | | | 202,865 | | | | 17,395,674 | | |
Microsoft Corp. | | | 1,038,054 | | | | 45,176,110 | | |
Total | | | | | 108,819,970 | | |
Technology Hardware, Storage & Peripherals 3.8% | |
Apple, Inc. | | | 727,870 | | | | 82,074,621 | | |
EMC Corp. | | | 1,034,475 | | | | 25,727,393 | | |
Hewlett-Packard Co. | | | 589,496 | | | | 16,541,258 | | |
Total | | | | | 124,343,272 | | |
Total Information Technology | | | | | 440,339,986 | | |
MATERIALS 0.3% | |
Chemicals 0.3% | |
LyondellBasell Industries NV, Class A | | | 48,780 | | | | 4,164,837 | | |
Monsanto Co. | | | 71,580 | | | | 6,989,787 | | |
Total | | | | | 11,154,624 | | |
Total Materials | | | | | 11,154,624 | | |
TELECOMMUNICATION SERVICES 1.7% | |
Diversified Telecommunication Services 1.7% | |
Verizon Communications, Inc. | | | 1,185,549 | | | | 54,547,110 | | |
Total Telecommunication Services | | | | | 54,547,110 | | |
The accompanying Notes to Financial Statements are an integral part of this statement.
Annual Report 2015
8
PORTFOLIO OF INVESTMENTS (continued)
August 31, 2015
Common Stocks (continued)
Issuer | | Shares | | Value ($) | |
UTILITIES 1.2% | |
Electric Utilities 0.8% | |
Duke Energy Corp. | | | 171,750 | | | | 12,178,792 | | |
Edison International | | | 232,946 | | | | 13,622,682 | | |
Total | | | | | 25,801,474 | | |
Multi-Utilities 0.4% | |
DTE Energy Co. | | | 156,880 | | | | 12,246,053 | | |
Total Utilities | | | | | 38,047,527 | | |
Total Common Stocks
(Cost: $1,698,732,137) | | | | | 1,970,435,572 | | |
Corporate Bonds & Notes 11.4%
Issuer | | Coupon
Rate | | Principal
Amount ($) | | Value ($) | |
AEROSPACE & DEFENSE 0.3% | |
BAE Systems Holdings, Inc.(b)
10/07/24 | | | 3.800 | % | | | 2,000,000 | | | | 2,009,004 | | |
Bombardier, Inc.(b)
03/15/25 | | | 7.500 | % | | | 85,000 | | | | 64,388 | | |
Huntington Ingalls Industries, Inc.(b)
12/15/21 | | | 5.000 | % | | | 64,000 | | | | 66,080 | | |
L-3 Communications Corp.
02/15/21 | | | 4.950 | % | | | 2,644,000 | | | | 2,798,238 | | |
Lockheed Martin Corp.
09/15/21 | | | 3.350 | % | | | 3,200,000 | | | | 3,272,134 | | |
TransDigm, Inc.
10/15/20 | | | 5.500 | % | | | 4,000 | | | | 3,921 | | |
07/15/21 | | | 7.500 | % | | | 35,000 | | | | 37,275 | | |
07/15/24 | | | 6.500 | % | | | 100,000 | | | | 97,750 | | |
TransDigm, Inc.(b)
05/15/25 | | | 6.500 | % | | | 94,000 | | | | 92,472 | | |
Total | | | | | | | 8,441,262 | | |
AUTOMOTIVE 0.1% | |
American Axle & Manufacturing, Inc.
02/15/19 | | | 5.125 | % | | | 28,000 | | | | 28,350 | | |
03/15/21 | | | 6.250 | % | | | 75,000 | | | | 76,500 | | |
Ford Motor Credit Co. LLC
01/16/18 | | | 2.375 | % | | | 2,000,000 | | | | 1,996,270 | | |
Gates Global LLC/Co.(b)
07/15/22 | | | 6.000 | % | | | 103,000 | | | | 83,955 | | |
Schaeffler Finance BV(b)
05/15/21 | | | 4.250 | % | | | 196,000 | | | | 190,610 | | |
Corporate Bonds & Notes (continued)
Issuer | | Coupon
Rate | | Principal
Amount ($) | | Value ($) | |
Schaeffler Holding Finance BV
PIK(b)
11/15/19 | | | 6.250 | % | | | 65,000 | | | | 68,412 | | |
Tenneco, Inc.
12/15/24 | | | 5.375 | % | | | 29,000 | | | | 29,943 | | |
ZF North America Capital, Inc.(b)
04/29/25 | | | 4.750 | % | | | 160,000 | | | | 151,600 | | |
Total | | | | | | | 2,625,640 | | |
BANKING 2.3% | |
Ally Financial, Inc.
02/15/17 | | | 5.500 | % | | | 54,000 | | | | 55,766 | | |
01/27/19 | | | 3.500 | % | | | 31,000 | | | | 31,000 | | |
02/13/22 | | | 4.125 | % | | | 186,000 | | | | 181,815 | | |
05/19/22 | | | 4.625 | % | | | 57,000 | | | | 57,214 | | |
09/30/24 | | | 5.125 | % | | | 190,000 | | | | 191,900 | | |
03/30/25 | | | 4.625 | % | | | 52,000 | | | | 50,180 | | |
BB&T Corp.(c)
12/01/16 | | | 0.754 | % | | | 2,000,000 | | | | 2,001,784 | | |
Bank of America Corp.
01/05/21 | | | 5.875 | % | | | 6,500,000 | | | | 7,402,109 | | |
Barclays Bank PLC
05/15/24 | | | 3.750 | % | | | 2,500,000 | | | | 2,510,822 | | |
Bear Stearns Companies LLC (The)
02/01/18 | | | 7.250 | % | | | 4,575,000 | | | | 5,121,516 | | |
Capital One Financial Corp.
07/15/21 | | | 4.750 | % | | | 3,500,000 | | | | 3,746,162 | | |
Citigroup, Inc.
05/15/18 | | | 6.125 | % | | | 5,250,000 | | | | 5,789,595 | | |
Credit Suisse
09/09/24 | | | 3.625 | % | | | 2,500,000 | | | | 2,490,075 | | |
Discover Financial Services
11/21/22 | | | 3.850 | % | | | 2,700,000 | | | | 2,633,912 | | |
Fifth Third Bancorp
03/15/22 | | | 3.500 | % | | | 2,600,000 | | | | 2,625,636 | | |
Goldman Sachs Group, Inc. (The)
07/08/24 | | | 3.850 | % | | | 5,500,000 | | | | 5,557,337 | | |
HSBC Holdings PLC
04/05/21 | | | 5.100 | % | | | 3,100,000 | | | | 3,421,578 | | |
Huntington National Bank (The)
06/30/18 | | | 2.000 | % | | | 3,290,000 | | | | 3,275,406 | | |
ING Bank NV(b)(c)
03/16/18 | | | 0.836 | % | | | 3,000,000 | | | | 2,992,500 | | |
Morgan Stanley
01/25/21 | | | 5.750 | % | | | 4,400,000 | | | | 4,987,699 | | |
PNC Bank NA
01/30/23 | | | 2.950 | % | | | 4,000,000 | | | | 3,869,236 | | |
The accompanying Notes to Financial Statements are an integral part of this statement.
Annual Report 2015
9
PORTFOLIO OF INVESTMENTS (continued)
August 31, 2015
Corporate Bonds & Notes (continued)
Issuer | | Coupon
Rate | | Principal
Amount ($) | | Value ($) | |
Regions Financial Corp.
05/15/18 | | | 2.000 | % | | | 3,180,000 | | | | 3,163,273 | | |
Royal Bank of Scotland Group PLC
05/28/24 | | | 5.125 | % | | | 149,000 | | | | 150,394 | | |
Royal Bank of Scotland PLC (The)
08/24/20 | | | 5.625 | % | | | 2,625,000 | | | | 2,968,389 | | |
State Street Corp.
08/18/25 | | | 3.550 | % | | | 3,650,000 | | | | 3,669,381 | | |
Synovus Financial Corp.
06/15/17 | | | 5.125 | % | | | 55,000 | | | | 56,678 | | |
02/15/19 | | | 7.875 | % | | | 113,000 | | | | 127,408 | | |
U.S. Bancorp
07/15/22 | | | 2.950 | % | | | 4,000,000 | | | | 3,927,540 | | |
Wells Fargo & Co.
02/13/23 | | | 3.450 | % | | | 3,400,000 | | | | 3,387,019 | | |
Total | | | | | | | 76,443,324 | | |
BROKERAGE/ASSET MANAGERS/EXCHANGES —% | |
E*TRADE Financial Corp.
11/15/22 | | | 5.375 | % | | | 169,000 | | | | 176,605 | | |
09/15/23 | | | 4.625 | % | | | 134,000 | | | | 134,000 | | |
National Financial Partners Corp.(b)
07/15/21 | | | 9.000 | % | | | 23,000 | | | | 22,540 | | |
Total | | | | | | | 333,145 | | |
BUILDING MATERIALS —% | |
Allegion US Holding Co., Inc.
10/01/21 | | | 5.750 | % | | | 76,000 | | | | 77,900 | | |
American Builders & Contractors Supply Co., Inc.(b)
04/15/21 | | | 5.625 | % | | | 130,000 | | | | 132,437 | | |
Gibraltar Industries, Inc.
02/01/21 | | | 6.250 | % | | | 19,000 | | | | 19,190 | | |
HD Supply, Inc.
04/15/20 | | | 11.000 | % | | | 33,000 | | | | 36,671 | | |
07/15/20 | | | 7.500 | % | | | 311,000 | | | | 331,992 | | |
HD Supply, Inc.(b)
12/15/21 | | | 5.250 | % | | | 91,000 | | | | 93,503 | | |
NCI Building Systems, Inc.(b)
01/15/23 | | | 8.250 | % | | | 92,000 | | | | 95,450 | | |
Nortek, Inc.
04/15/21 | | | 8.500 | % | | | 124,000 | | | | 132,835 | | |
RSI Home Products, Inc.(b)
03/15/23 | | | 6.500 | % | | | 45,000 | | | | 46,013 | | |
USG Corp.(b)
11/01/21 | | | 5.875 | % | | | 18,000 | | | | 18,765 | | |
03/01/25 | | | 5.500 | % | | | 9,000 | | | | 9,079 | | |
Total | | | | | | | 993,835 | | |
Corporate Bonds & Notes (continued)
Issuer | | Coupon
Rate | | Principal
Amount ($) | | Value ($) | |
CABLE AND SATELLITE 0.2% | |
CCO Holdings LLC/Capital Corp.
01/31/22 | | | 6.625 | % | | | 50,000 | | | | 52,625 | | |
09/30/22 | | | 5.250 | % | | | 98,000 | | | | 98,784 | | |
CCO Holdings LLC/Capital Corp.(b)
05/01/23 | | | 5.125 | % | | | 4,000 | | | | 4,000 | | |
05/01/25 | | | 5.375 | % | | | 97,000 | | | | 94,211 | | |
05/01/27 | | | 5.875 | % | | | 70,000 | | | | 68,600 | | |
CSC Holdings LLC
02/15/18 | | | 7.875 | % | | | 22,000 | | | | 24,035 | | |
02/15/19 | | | 8.625 | % | | | 32,000 | | | | 36,000 | | |
11/15/21 | | | 6.750 | % | | | 172,000 | | | | 179,740 | | |
06/01/24 | | | 5.250 | % | | | 48,000 | | | | 44,544 | | |
Cable One, Inc.(b)
06/15/22 | | | 5.750 | % | | | 42,000 | | | | 42,420 | | |
Cequel Communications Holdings I LLC/Capital Corp.(b)
09/15/20 | | | 6.375 | % | | | 142,000 | | | | 139,408 | | |
12/15/21 | | | 5.125 | % | | | 48,000 | | | | 43,980 | | |
DIRECTV Holdings LLC/Financing Co., Inc.
03/15/22 | | | 3.800 | % | | | 2,750,000 | | | | 2,728,360 | | |
DISH DBS Corp.
09/01/19 | | | 7.875 | % | | | 102,000 | | | | 110,558 | | |
07/15/22 | | | 5.875 | % | | | 63,000 | | | | 59,575 | | |
03/15/23 | | | 5.000 | % | | | 155,000 | | | | 136,885 | | |
11/15/24 | | | 5.875 | % | | | 59,000 | | | | 53,764 | | |
DigitalGlobe, Inc.(b)
02/01/21 | | | 5.250 | % | | | 80,000 | | | | 76,800 | | |
Hughes Satellite Systems Corp.
06/15/21 | | | 7.625 | % | | | 34,000 | | | | 37,188 | | |
Intelsat Jackson Holdings SA
10/15/20 | | | 7.250 | % | | | 160,000 | | | | 153,800 | | |
04/01/21 | | | 7.500 | % | | | 37,000 | | | | 35,844 | | |
Intelsat Luxembourg SA
06/01/21 | | | 7.750 | % | | | 66,000 | | | | 49,450 | | |
06/01/23 | | | 8.125 | % | | | 53,000 | | | | 38,955 | | |
NBCUniversal Media LLC
04/01/41 | | | 5.950 | % | | | 2,100,000 | | | | 2,526,779 | | |
UPCB Finance IV Ltd.(b)
01/15/25 | | | 5.375 | % | | | 136,000 | | | | 131,920 | | |
Unitymedia GmbH(b)
01/15/25 | | | 6.125 | % | | | 56,000 | | | | 57,400 | | |
Unitymedia Hessen GmbH & Co. KG NRW(b)
01/15/25 | | | 5.000 | % | | | 260,000 | | | | 254,150 | | |
Videotron Ltd.
07/15/22 | | | 5.000 | % | | | 110,000 | | | | 109,862 | | |
Videotron Ltd.(b)
06/15/24 | | | 5.375 | % | | | 21,000 | | | | 21,368 | | |
The accompanying Notes to Financial Statements are an integral part of this statement.
Annual Report 2015
10
PORTFOLIO OF INVESTMENTS (continued)
August 31, 2015
Corporate Bonds & Notes (continued)
Issuer | | Coupon
Rate | | Principal
Amount ($) | | Value ($) | |
Virgin Media Finance PLC(b)
10/15/24 | | | 6.000 | % | | | 56,000 | | | | 57,470 | | |
01/15/25 | | | 5.750 | % | | | 253,000 | | | | 254,107 | | |
Virgin Media Secured Finance PLC(b)
01/15/26 | | | 5.250 | % | | | 60,000 | | | | 58,200 | | |
Total | | | | | | | 7,780,782 | | |
CHEMICALS 0.2% | |
Angus Chemical Co.(b)
02/15/23 | | | 8.750 | % | | | 89,000 | | | | 88,555 | | |
Ashland, Inc.
04/15/18 | | | 3.875 | % | | | 49,000 | | | | 50,118 | | |
Axalta Coating Systems Dutch Holding B BV/U.S.
Holdings, Inc.(b)
05/01/21 | | | 7.375 | % | | | 191,000 | | | | 204,351 | | |
Celanese U.S. Holdings LLC
06/15/21 | | | 5.875 | % | | | 135,000 | | | | 141,412 | | |
Chemours Co. LLC (The)(b)
05/15/23 | | | 6.625 | % | | | 160,000 | | | | 139,200 | | |
05/15/25 | | | 7.000 | % | | | 63,000 | | | | 53,865 | | |
Dow Chemical Co. (The)
11/01/29 | | | 7.375 | % | | | 1,103,000 | | | | 1,398,841 | | |
Eastman Chemical Co.
06/01/17 | | | 2.400 | % | | | 1,300,000 | | | | 1,314,799 | | |
Eco Services Operations LLC/Finance Corp.(b)
11/01/22 | | | 8.500 | % | | | 77,000 | | | | 73,535 | | |
Huntsman International LLC
11/15/20 | | | 4.875 | % | | | 29,000 | | | | 28,420 | | |
03/15/21 | | | 8.625 | % | | | 4,000 | | | | 4,180 | | |
Huntsman International LLC(b)
11/15/22 | | | 5.125 | % | | | 24,000 | | | | 22,800 | | |
INEOS Group Holdings SA(b)
08/15/18 | | | 6.125 | % | | | 17,000 | | | | 17,021 | | |
02/15/19 | | | 5.875 | % | | | 94,000 | | | | 93,178 | | |
JM Huber Corp.(b)
11/01/19 | | | 9.875 | % | | | 90,000 | | | | 94,613 | | |
LYB International Finance BV
07/15/23 | | | 4.000 | % | | | 2,850,000 | | | | 2,872,794 | | |
NOVA Chemicals Corp.(b)
05/01/25 | | | 5.000 | % | | | 125,000 | | | | 125,000 | | |
PQ Corp.(b)
11/01/18 | | | 8.750 | % | | | 425,000 | | | | 443,328 | | |
Platform Specialty Products Corp.(b)
02/01/22 | | | 6.500 | % | | | 182,000 | | | | 176,236 | | |
WR Grace & Co.(b)
10/01/21 | | | 5.125 | % | | | 96,000 | | | | 97,200 | | |
10/01/24 | | | 5.625 | % | | | 28,000 | | | | 28,875 | | |
Total 7,468,321
Corporate Bonds & Notes (continued)
Issuer | | Coupon
Rate | | Principal
Amount ($) | | Value ($) | |
CONSTRUCTION MACHINERY 0.1% | |
Caterpillar Financial Services Corp.
06/01/22 | | | 2.850 | % | | | 2,205,000 | | | | 2,165,628 | | |
United Rentals North America, Inc.
05/15/20 | | | 7.375 | % | | | 45,000 | | | | 47,756 | | |
04/15/22 | | | 7.625 | % | | | 66,000 | | | | 71,115 | | |
Total | | | | | | | 2,284,499 | | |
CONSUMER CYCLICAL SERVICES —% | |
ADT Corp. (The)
07/15/22 | | | 3.500 | % | | | 126,000 | | | | 112,808 | | |
APX Group, Inc.
12/01/19 | | | 6.375 | % | | | 221,000 | | | | 214,646 | | |
12/01/20 | | | 8.750 | % | | | 61,000 | | | | 53,680 | | |
IHS, Inc.
11/01/22 | | | 5.000 | % | | | 164,000 | | | | 165,845 | | |
Interval Acquisition Corp.(b)
04/15/23 | | | 5.625 | % | | | 77,000 | | | | 76,038 | | |
Monitronics International, Inc.
04/01/20 | | | 9.125 | % | | | 62,000 | | | | 57,970 | | |
Total | | | | | | | 680,987 | | |
CONSUMER PRODUCTS —% | |
Serta Simmons Bedding LLC(b)
10/01/20 | | | 8.125 | % | | | 163,000 | | | | 172,576 | | |
Spectrum Brands, Inc.
11/15/20 | | | 6.375 | % | | | 125,000 | | | | 132,662 | | |
Spectrum Brands, Inc.(b)
07/15/25 | | | 5.750 | % | | | 155,000 | | | | 159,650 | | |
Springs Industries, Inc.
06/01/21 | | | 6.250 | % | | | 115,000 | | | | 114,569 | | |
Tempur Sealy International, Inc.
12/15/20 | | | 6.875 | % | | | 87,000 | | | | 93,090 | | |
Total | | | | | | | 672,547 | | |
DIVERSIFIED MANUFACTURING 0.1% | |
Amsted Industries, Inc.(b)
03/15/22 | | | 5.000 | % | | | 41,000 | | | | 41,000 | | |
Entegris, Inc.(b)
04/01/22 | | | 6.000 | % | | | 82,000 | | | | 83,025 | | |
United Technologies Corp.
06/01/22 | | | 3.100 | % | | | 2,550,000 | | | | 2,558,313 | | |
Total | | | | | | | 2,682,338 | | |
ELECTRIC 1.1% | |
AES Corp. (The)
07/01/21 | | | 7.375 | % | | | 169,000 | | | | 182,098 | | |
The accompanying Notes to Financial Statements are an integral part of this statement.
Annual Report 2015
11
PORTFOLIO OF INVESTMENTS (continued)
August 31, 2015
Corporate Bonds & Notes (continued)
Issuer | | Coupon
Rate | | Principal
Amount ($) | | Value ($) | |
Arizona Public Service Co.
04/01/42 | | | 4.500 | % | | | 925,000 | | | | 937,743 | | |
CMS Energy Corp.
02/01/20 | | | 6.250 | % | | | 1,825,000 | | | | 2,068,999 | | |
Calpine Corp.(b)
01/15/22 | | | 6.000 | % | | | 75,000 | | | | 80,250 | | |
DTE Energy Co.
04/15/33 | | | 6.375 | % | | | 1,840,000 | | | | 2,287,225 | | |
Dominion Resources, Inc.
08/15/19 | | | 5.200 | % | | | 2,100,000 | | | | 2,312,331 | | |
Exelon Generation Co. LLC
06/15/22 | | | 4.250 | % | | | 1,900,000 | | | | 1,948,659 | | |
Indiana Michigan Power Co.
03/15/37 | | | 6.050 | % | | | 1,100,000 | | | | 1,301,906 | | |
NRG Energy, Inc.
07/15/22 | | | 6.250 | % | | | 180,000 | | | | 175,500 | | |
NRG Yield Operating LLC
08/15/24 | | | 5.375 | % | | | 201,000 | | | | 193,463 | | |
Nevada Power Co.
08/01/18 | | | 6.500 | % | | | 900,000 | | | | 1,022,218 | | |
NextEra Energy Capital Holdings, Inc.
06/01/17 | | | 1.586 | % | | | 3,065,000 | | | | 3,048,038 | | |
PPL Capital Funding, Inc.
06/01/23 | | | 3.400 | % | | | 3,000,000 | | | | 2,958,594 | | |
PacifiCorp
07/01/25 | | | 3.350 | % | | | 1,680,000 | | | | 1,675,659 | | |
Pacific Gas & Electric Co.
03/01/37 | | | 5.800 | % | | | 2,870,000 | | | | 3,331,972 | | |
Progress Energy, Inc.
03/01/31 | | | 7.750 | % | | | 1,375,000 | | | | 1,828,025 | | |
Public Service Co. of Colorado
05/15/25 | | | 2.900 | % | | | 3,050,000 | | | | 2,966,403 | | |
Southern California Edison Co.
09/01/40 | | | 4.500 | % | | | 1,775,000 | | | | 1,817,241 | | |
Talen Energy Supply LLC(b)
06/01/25 | | | 6.500 | % | | | 113,000 | | | | 104,808 | | |
TerraForm Power Operating LLC(b)
02/01/23 | | | 5.875 | % | | | 130,000 | | | | 123,500 | | |
06/15/25 | | | 6.125 | % | | | 70,000 | | | | 65,975 | | |
TransAlta Corp.
06/03/17 | | | 1.900 | % | | | 2,000,000 | | | | 1,975,848 | | |
WEC Energy Group, Inc.
06/15/25 | | | 3.550 | % | | | 3,300,000 | | | | 3,312,510 | | |
Total | | | | | | | 35,718,965 | | |
Corporate Bonds & Notes (continued)
Issuer | | Coupon
Rate | | Principal
Amount ($) | | Value ($) | |
FINANCE COMPANIES 0.3% | |
AerCap Ireland Capital Ltd./Global Aviation Trust
05/15/21 | | | 4.500 | % | | | 671,000 | | | | 681,904 | | |
10/01/21 | | | 5.000 | % | | | 96,000 | | | | 99,240 | | |
Aircastle Ltd.
03/15/21 | | | 5.125 | % | | | 27,000 | | | | 27,608 | | |
02/15/22 | | | 5.500 | % | | | 73,000 | | | | 75,555 | | |
CIT Group, Inc.
08/15/17 | | | 4.250 | % | | | 48,000 | | | | 48,720 | | |
05/15/20 | | | 5.375 | % | | | 75,000 | | | | 78,375 | | |
CIT Group, Inc.(b)
04/01/18 | | | 6.625 | % | | | 99,000 | | | | 106,177 | | |
02/15/19 | | | 5.500 | % | | | 120,000 | | | | 126,300 | | |
General Electric Capital Corp.
01/09/23 | | | 3.100 | % | | | 8,085,000 | | | | 8,104,218 | | |
International Lease Finance Corp.
09/01/17 | | | 8.875 | % | | | 80,000 | | | | 88,000 | | |
04/15/18 | | | 3.875 | % | | | 3,000 | | | | 3,015 | | |
05/15/19 | | | 6.250 | % | | | 29,000 | | | | 31,247 | | |
12/15/20 | | | 8.250 | % | | | 29,000 | | | | 34,365 | | |
04/15/21 | | | 4.625 | % | | | 5,000 | | | | 5,088 | | |
Navient Corp.
01/15/19 | | | 5.500 | % | | | 24,000 | | | | 22,920 | | |
10/26/20 | | | 5.000 | % | | | 47,000 | | | | 41,830 | | |
01/25/22 | | | 7.250 | % | | | 33,000 | | | | 31,103 | | |
01/25/23 | | | 5.500 | % | | | 58,000 | | | | 48,865 | | |
03/25/24 | | | 6.125 | % | | | 52,000 | | | | 44,200 | | |
10/25/24 | | | 5.875 | % | | | 162,000 | | | | 136,890 | | |
OneMain Financial Holdings, Inc.(b)
12/15/19 | | | 6.750 | % | | | 38,000 | | | | 39,710 | | |
12/15/21 | | | 7.250 | % | | | 111,000 | | | | 114,885 | | |
Provident Funding Associates LP/Finance Corp.(b)
06/15/21 | | | 6.750 | % | | | 216,000 | | | | 205,200 | | |
Quicken Loans, Inc.(b)
05/01/25 | | | 5.750 | % | | | 191,000 | | | | 186,225 | | |
Springleaf Finance Corp.
12/15/17 | | | 6.900 | % | | | 42,000 | | | | 44,467 | | |
06/01/20 | | | 6.000 | % | | | 10,000 | | | | 10,150 | | |
10/01/21 | | | 7.750 | % | | | 69,000 | | | | 75,210 | | |
10/01/23 | | | 8.250 | % | | | 131,000 | | | | 146,720 | | |
iStar, Inc.
07/01/19 | | | 5.000 | % | | | 76,000 | | | | 73,720 | | |
Total | | | | | | | 10,731,907 | | |
FOOD AND BEVERAGE 0.5% | |
Anheuser-Busch InBev Worldwide, Inc.
07/15/22 | | | 2.500 | % | | | 3,100,000 | | | | 2,984,125 | | |
Aramark Services, Inc.
03/15/20 | | | 5.750 | % | | | 22,000 | | | | 22,811 | | |
The accompanying Notes to Financial Statements are an integral part of this statement.
Annual Report 2015
12
PORTFOLIO OF INVESTMENTS (continued)
August 31, 2015
Corporate Bonds & Notes (continued)
Issuer | | Coupon
Rate | | Principal
Amount ($) | | Value ($) | |
ConAgra Foods, Inc.
01/25/23 | | | 3.200 | % | | | 3,200,000 | | | | 2,994,240 | | |
Constellation Brands, Inc.
11/15/19 | | | 3.875 | % | | | 67,000 | | | | 68,759 | | |
11/15/24 | | | 4.750 | % | | | 148,000 | | | | 151,330 | | |
Diageo Capital PLC
04/29/23 | | | 2.625 | % | | | 1,345,000 | | | | 1,281,273 | | |
Diamond Foods, Inc.(b)
03/15/19 | | | 7.000 | % | | | 81,000 | | | | 83,430 | | |
Kraft Heinz Co. (The)(b)
07/15/22 | | | 3.500 | % | | | 3,165,000 | | | | 3,194,862 | | |
PepsiCo, Inc.
03/05/22 | | | 2.750 | % | | | 1,270,000 | | | | 1,256,205 | | |
Post Holdings, Inc.
02/15/22 | | | 7.375 | % | | | 18,000 | | | | 18,450 | | |
Post Holdings, Inc.(b)
12/15/22 | | | 6.000 | % | | | 17,000 | | | | 16,405 | | |
03/15/24 | | | 7.750 | % | | | 120,000 | | | | 123,900 | | |
SABMiller Holdings, Inc.(b)
01/15/22 | | | 3.750 | % | | | 2,840,000 | | | | 2,925,413 | | |
WhiteWave Foods Co. (The)
10/01/22 | | | 5.375 | % | | | 143,000 | | | | 147,826 | | |
Total | | | | | | | 15,269,029 | | |
GAMING —% | |
Boyd Gaming Corp.
05/15/23 | | | 6.875 | % | | | 49,000 | | | | 50,348 | | |
GLP Capital LP/Financing II, Inc.
11/01/20 | | | 4.875 | % | | | 70,000 | | | | 72,450 | | |
11/01/23 | | | 5.375 | % | | | 51,000 | | | | 52,912 | | |
International Game Technology PLC(b)
02/15/22 | | | 6.250 | % | | | 199,000 | | | | 191,414 | | |
MGM Resorts International
03/01/18 | | | 11.375 | % | | | 71,000 | | | | 83,425 | | |
10/01/20 | | | 6.750 | % | | | 44,000 | | | | 46,860 | | |
12/15/21 | | | 6.625 | % | | | 112,000 | | | | 119,000 | | |
03/15/23 | | | 6.000 | % | | | 70,000 | | | | 71,050 | | |
Penn National Gaming, Inc.
11/01/21 | | | 5.875 | % | | | 33,000 | | | | 33,495 | | |
Pinnacle Entertainment, Inc.
08/01/21 | | | 6.375 | % | | | 56,000 | | | | 59,640 | | |
Scientific Games International, Inc.
12/01/22 | | | 10.000 | % | | | 132,000 | | | | 121,110 | | |
Scientific Games International, Inc.(b)
01/01/22 | | | 7.000 | % | | | 220,000 | | | | 224,950 | | |
Seminole Tribe of Florida, Inc.(b)
10/01/20 | | | 6.535 | % | | | 46,000 | | | | 48,530 | | |
Corporate Bonds & Notes (continued)
Issuer | | Coupon
Rate | | Principal
Amount ($) | | Value ($) | |
SugarHouse HSP Gaming LP/Finance Corp.(b)
06/01/21 | | | 6.375 | % | | | 81,000 | | | | 76,950 | | |
Tunica-Biloxi Gaming Authority(b)(d)
11/15/15 | | | 9.000 | % | | | 25,000 | | | | 13,750 | | |
Total | | | | | | | 1,265,884 | | |
HEALTH CARE 0.5% | |
Acadia Healthcare Co., Inc.
07/01/22 | | | 5.125 | % | | | 14,000 | | | | 14,070 | | |
02/15/23 | | | 5.625 | % | | | 24,000 | | | | 24,467 | | |
Air Medical Merger Sub Corp.(b)
05/15/23 | | | 6.375 | % | | | 51,000 | | | | 47,430 | | |
Alere, Inc.(b)
07/01/23 | | | 6.375 | % | | | 67,000 | | | | 68,675 | | |
Amsurg Corp.
11/30/20 | | | 5.625 | % | | | 29,000 | | | | 29,725 | | |
07/15/22 | | | 5.625 | % | | | 37,000 | | | | 37,763 | | |
Becton Dickinson and Co.
12/15/24 | | | 3.734 | % | | | 2,400,000 | | | | 2,393,076 | | |
CHS/Community Health Systems, Inc.
11/15/19 | | | 8.000 | % | | | 65,000 | | | | 67,925 | | |
08/01/21 | | | 5.125 | % | | | 122,000 | | | | 125,355 | | |
02/01/22 | | | 6.875 | % | | | 288,000 | | | | 306,089 | | |
Cardinal Health, Inc.
12/15/20 | | | 4.625 | % | | | 1,325,000 | | | | 1,432,700 | | |
ConvaTec Finance International SA
PIK(b)
01/15/19 | | | 8.250 | % | | | 67,000 | | | | 65,995 | | |
DaVita HealthCare Partners, Inc.
08/15/22 | | | 5.750 | % | | | 115,000 | | | | 122,360 | | |
07/15/24 | | | 5.125 | % | | | 111,000 | | | | 110,514 | | |
05/01/25 | | | 5.000 | % | | | 13,000 | | | | 12,740 | | |
Emdeon, Inc.
12/31/19 | | | 11.000 | % | | | 58,000 | | | | 62,350 | | |
Emdeon, Inc.(b)
02/15/21 | | | 6.000 | % | | | 62,000 | | | | 61,070 | | |
ExamWorks Group, Inc.
04/15/23 | | | 5.625 | % | | | 58,000 | | | | 59,378 | | |
Express Scripts Holding Co.
02/15/22 | | | 3.900 | % | | | 2,000,000 | | | | 2,023,566 | | |
Fresenius Medical Care U.S. Finance II, Inc.(b)
09/15/18 | | | 6.500 | % | | | 29,000 | | | | 32,045 | | |
07/31/19 | | | 5.625 | % | | | 99,000 | | | | 106,920 | | |
01/31/22 | | | 5.875 | % | | | 18,000 | | | | 19,440 | | |
10/15/24 | | | 4.750 | % | | | 32,000 | | | | 32,038 | | |
HCA, Inc.
02/15/20 | | | 6.500 | % | | | 146,000 | | | | 161,330 | | |
02/15/22 | | | 7.500 | % | | | 78,000 | | | | 89,481 | | |
02/01/25 | | | 5.375 | % | | | 597,000 | | | | 605,955 | | |
04/15/25 | | | 5.250 | % | | | 175,000 | | | | 181,563 | | |
The accompanying Notes to Financial Statements are an integral part of this statement.
Annual Report 2015
13
PORTFOLIO OF INVESTMENTS (continued)
August 31, 2015
Corporate Bonds & Notes (continued)
Issuer | | Coupon
Rate | | Principal
Amount ($) | | Value ($) | |
HealthSouth Corp.(b)
11/01/24 | | | 5.750 | % | | | 37,000 | | | | 37,514 | | |
Hologic, Inc.(b)
07/15/22 | | | 5.250 | % | | | 102,000 | | | | 103,913 | | |
IMS Health, Inc.(b)
11/01/20 | | | 6.000 | % | | | 47,000 | | | | 48,293 | | |
Kinetic Concepts, Inc./KCI U.S.A., Inc.
11/01/18 | | | 10.500 | % | | | 40,000 | | | | 41,900 | | |
LifePoint Health, Inc.
12/01/21 | | | 5.500 | % | | | 127,000 | | | | 132,318 | | |
MPH Acquisition Holdings LLC(b)
04/01/22 | | | 6.625 | % | | | 105,000 | | | | 107,625 | | |
McKesson Corp.
12/15/22 | | | 2.700 | % | | | 2,450,000 | | | | 2,340,705 | | |
Medtronic, Inc.(b)
03/15/22 | | | 3.150 | % | | | 2,500,000 | | | | 2,504,645 | | |
Sterigenics-Nordion Holdings LLC(b)
05/15/23 | | | 6.500 | % | | | 95,000 | | | | 96,898 | | |
Surgical Care Affiliates, Inc.(b)
04/01/23 | | | 6.000 | % | | | 35,000 | | | | 35,350 | | |
Teleflex, Inc.
06/15/24 | | | 5.250 | % | | | 4,000 | | | | 4,010 | | |
Tenet Healthcare Corp.
03/01/19 | | | 5.000 | % | | | 9,000 | | | | 8,984 | | |
06/01/20 | | | 4.750 | % | | | 84,000 | | | | 85,680 | | |
10/01/20 | | | 6.000 | % | | | 123,000 | | | | 131,610 | | |
04/01/21 | | | 4.500 | % | | | 83,000 | | | | 83,415 | | |
04/01/22 | | | 8.125 | % | | | 200,000 | | | | 221,500 | | |
06/15/23 | | | 6.750 | % | | | 221,000 | | | | 227,630 | | |
Universal Health Services, Inc.(b)
08/01/22 | | | 4.750 | % | | | 144,000 | | | | 148,320 | | |
Total | | | | | | | 14,654,330 | | |
HEALTHCARE INSURANCE 0.2% | |
Centene Corp.
05/15/22 | | | 4.750 | % | | | 64,000 | | | | 64,839 | | |
Cigna Corp.
06/15/20 | | | 5.125 | % | | | 2,250,000 | | | | 2,488,804 | | |
UnitedHealth Group, Inc.
03/15/23 | | | 2.875 | % | | | 3,100,000 | | | | 3,019,918 | | |
Total | | | | | | | 5,573,561 | | |
HOME CONSTRUCTION —% | |
D.R. Horton, Inc.
03/01/19 | | | 3.750 | % | | | 50,000 | | | | 50,406 | | |
09/15/22 | | | 4.375 | % | | | 50,000 | | | | 49,625 | | |
DR Horton, Inc.
02/15/20 | | | 4.000 | % | | | 2,000 | | | | 2,010 | | |
Corporate Bonds & Notes (continued)
Issuer | | Coupon
Rate | | Principal
Amount ($) | | Value ($) | |
Meritage Homes Corp.
03/01/18 | | | 4.500 | % | | | 122,000 | | | | 123,525 | | |
04/15/20 | | | 7.150 | % | | | 16,000 | | | | 17,280 | | |
04/01/22 | | | 7.000 | % | | | 40,000 | | | | 42,700 | | |
06/01/25 | | | 6.000 | % | | | 93,000 | | | | 93,755 | | |
Standard Pacific Corp.
12/15/21 | | | 6.250 | % | | | 36,000 | | | | 38,250 | | |
11/15/24 | | | 5.875 | % | | | 149,000 | | | | 152,725 | | |
Taylor Morrison Communities, Inc./Monarch, Inc.(b)
04/15/21 | | | 5.250 | % | | | 121,000 | | | | 121,605 | | |
03/01/24 | | | 5.625 | % | | | 81,000 | | | | 78,975 | | |
Toll Brothers Finance Corp.
12/31/18 | | | 4.000 | % | | | 201,000 | | | | 205,020 | | |
Total | | | | | | | 975,876 | | |
INDEPENDENT ENERGY 0.7% | |
Anadarko Petroleum Corp.
09/15/36 | | | 6.450 | % | | | 1,240,000 | | | | 1,395,737 | | |
Antero Resources Corp.
12/01/22 | | | 5.125 | % | | | 113,000 | | | | 102,289 | | |
Antero Resources Corp.(b)
06/01/23 | | | 5.625 | % | | | 134,000 | | | | 121,940 | | |
Canadian Natural Resources Ltd.
11/15/21 | | | 3.450 | % | | | 2,200,000 | | | | 2,128,060 | | |
Carrizo Oil & Gas, Inc.
04/15/23 | | | 6.250 | % | | | 423,000 | | | | 380,700 | | |
Chesapeake Energy Corp.
02/15/21 | | | 6.125 | % | | | 36,000 | | | | 27,878 | | |
03/15/23 | | | 5.750 | % | | | 190,000 | | | | 141,647 | | |
Cimarex Energy Co.
06/01/24 | | | 4.375 | % | | | 2,870,000 | | | | 2,761,026 | | |
Concho Resources, Inc.
01/15/22 | | | 6.500 | % | | | 19,000 | | | | 19,384 | | |
04/01/23 | | | 5.500 | % | | | 362,000 | | | | 357,623 | | |
Continental Resources, Inc.
04/15/23 | | | 4.500 | % | | | 1,410,000 | | | | 1,270,328 | | |
CrownRock LP/Finance, Inc.(b)
02/15/23 | | | 7.750 | % | | | 186,000 | | | | 184,140 | | |
Devon Energy Corp.
07/15/21 | | | 4.000 | % | | | 1,925,000 | | | | 1,959,571 | | |
Diamondback Energy, Inc.
10/01/21 | | | 7.625 | % | | | 96,000 | | | | 100,800 | | |
EP Energy LLC/Everest Acquisition Finance, Inc.
05/01/20 | | | 9.375 | % | | | 88,000 | | | | 84,700 | | |
09/01/22 | | | 7.750 | % | | | 139,000 | | | | 127,880 | | |
06/15/23 | | | 6.375 | % | | | 103,000 | | | | 87,550 | | |
EnCana Corp.
11/15/21 | | | 3.900 | % | | | 2,125,000 | | | | 1,975,493 | | |
The accompanying Notes to Financial Statements are an integral part of this statement.
Annual Report 2015
14
PORTFOLIO OF INVESTMENTS (continued)
August 31, 2015
Corporate Bonds & Notes (continued)
Issuer | | Coupon
Rate | | Principal
Amount ($) | | Value ($) | |
Laredo Petroleum, Inc.
01/15/22 | | | 5.625 | % | | | 72,000 | | | | 64,800 | | |
05/01/22 | | | 7.375 | % | | | 145,000 | | | | 141,375 | | |
03/15/23 | | | 6.250 | % | | | 173,000 | | | | 158,295 | | |
Noble Energy, Inc.
11/15/24 | | | 3.900 | % | | | 2,275,000 | | | | 2,149,238 | | |
Oasis Petroleum, Inc.
11/01/21 | | | 6.500 | % | | | 31,000 | | | | 24,955 | | |
03/15/22 | | | 6.875 | % | | | 152,000 | | | | 126,160 | | |
01/15/23 | | | 6.875 | % | | | 153,000 | | | | 120,870 | | |
Parsley Energy LLC/Finance Corp.(b)
02/15/22 | | | 7.500 | % | | | 278,000 | | | | 272,440 | | |
RSP Permian, Inc.(b)
10/01/22 | | | 6.625 | % | | | 49,000 | | | | 48,020 | | |
10/01/22 | | | 6.625 | % | | | 53,000 | | | | 51,940 | | |
Range Resources Corp.
06/01/21 | | | 5.750 | % | | | 53,000 | | | | 50,880 | | |
SM Energy Co.
06/01/25 | | | 5.625 | % | | | 117,000 | | | | 103,837 | | |
Southwestern Energy Co.
02/01/18 | | | 7.500 | % | | | 2,055,000 | | | | 2,226,280 | | |
Whiting Petroleum Corp.
03/15/21 | | | 5.750 | % | | | 121,000 | | | | 108,295 | | |
04/01/23 | | | 6.250 | % | | | 166,000 | | | | 146,080 | | |
Woodside Finance Ltd.(b)
05/10/21 | | | 4.600 | % | | | 2,300,000 | | | | 2,404,395 | | |
Total | | | | | | | 21,424,606 | | |
INTEGRATED ENERGY 0.3% | |
BP Capital Markets PLC
02/10/24 | | | 3.814 | % | | | 3,000,000 | | | | 3,017,775 | | |
Cenovus Energy, Inc.
08/15/22 | | | 3.000 | % | | | 1,325,000 | | | | 1,203,003 | | |
09/15/23 | | | 3.800 | % | | | 1,510,000 | | | | 1,416,978 | | |
Petro-Canada
05/15/18 | | | 6.050 | % | | | 2,000,000 | | | | 2,204,362 | | |
Shell International Finance BV
05/11/25 | | | 3.250 | % | | | 3,300,000 | | | | 3,231,189 | | |
Total | | | | | | | 11,073,307 | | |
LEISURE —% | |
AMC Entertainment, Inc.
06/15/25 | | | 5.750 | % | | | 78,000 | | | | 77,610 | | |
Activision Blizzard, Inc.(b)
09/15/21 | | | 5.625 | % | | | 308,000 | | | | 323,785 | | |
09/15/23 | | | 6.125 | % | | | 52,000 | | | | 55,900 | | |
Cedar Fair LP/Canada's Wonderland Co./
Magnum Management Corp.
03/15/21 | | | 5.250 | % | | | 48,000 | | | | 48,840 | | |
06/01/24 | | | 5.375 | % | | | 17,000 | | | | 17,255 | | |
Corporate Bonds & Notes (continued)
Issuer | | Coupon
Rate | | Principal
Amount ($) | | Value ($) | |
LTF Merger Sub, Inc.(b)
06/15/23 | | | 8.500 | % | | | 76,000 | | | | 74,100 | | |
Total | | | | | | | 597,490 | | |
LIFE INSURANCE 0.5% | |
American International Group, Inc.
02/15/24 | | | 4.125 | % | | | 3,300,000 | | | | 3,415,421 | | |
Five Corners Funding Trust(b)
11/15/23 | | | 4.419 | % | | | 3,000,000 | | | | 3,101,793 | | |
Metropolitan Life Global Funding I(b)
04/11/22 | | | 3.875 | % | | | 2,400,000 | | | | 2,499,185 | | |
Peachtree Corners Funding Trust(b)
02/15/25 | | | 3.976 | % | | | 3,600,000 | | | | 3,565,296 | | |
Principal Financial Group, Inc.
05/15/25 | | | 3.400 | % | | | 2,725,000 | | | | 2,632,791 | | |
Total | | | | | | | 15,214,486 | | |
LODGING —% | |
Choice Hotels International, Inc.
07/01/22 | | | 5.750 | % | | | 155,000 | | | | 166,625 | | |
Hilton Worldwide Finance LLC/Corp.
10/15/21 | | | 5.625 | % | | | 218,000 | | | | 227,265 | | |
Playa Resorts Holding BV(b)
08/15/20 | | | 8.000 | % | | | 155,000 | | | | 156,937 | | |
RHP Hotel Properties LP/Finance Corp.(b)
04/15/23 | | | 5.000 | % | | | 39,000 | | | | 38,610 | | |
Total | | | | | | | 589,437 | | |
MEDIA AND ENTERTAINMENT 0.4% | |
21st Century Fox America, Inc.
03/15/33 | | | 6.550 | % | | | 1,725,000 | | | | 2,067,959 | | |
AMC Networks, Inc.
07/15/21 | | | 7.750 | % | | | 7,000 | | | | 7,490 | | |
12/15/22 | | | 4.750 | % | | | 165,000 | | | | 162,624 | | |
Clear Channel Worldwide Holdings, Inc.
03/15/20 | | | 7.625 | % | | | 156,000 | | | | 161,460 | | |
11/15/22 | | | 6.500 | % | | | 184,000 | | | | 190,072 | | |
MDC Partners, Inc.(b)
04/01/20 | | | 6.750 | % | | | 207,000 | | | | 205,189 | | |
Netflix, Inc.(b)
02/15/22 | | | 5.500 | % | | | 166,000 | | | | 170,150 | | |
02/15/25 | | | 5.875 | % | | | 197,000 | | | | 204,634 | | |
Nielsen Finance LLC/Co.
10/01/20 | | | 4.500 | % | | | 36,000 | | | | 36,585 | | |
Nielsen Finance LLC/Co.(b)
04/15/22 | | | 5.000 | % | | | 30,000 | | | | 29,587 | | |
The accompanying Notes to Financial Statements are an integral part of this statement.
Annual Report 2015
15
PORTFOLIO OF INVESTMENTS (continued)
August 31, 2015
Corporate Bonds & Notes (continued)
Issuer | | Coupon
Rate | | Principal
Amount ($) | | Value ($) | |
Outfront Media Capital LLC/Corp.
02/15/22 | | | 5.250 | % | | | 10,000 | | | | 10,075 | | |
02/15/24 | | | 5.625 | % | | | 10,000 | | | | 10,238 | | |
03/15/25 | | | 5.875 | % | | | 172,000 | | | | 175,010 | | |
Outfront Media Capital LLC/Corp.(b)
02/15/24 | | | 5.625 | % | | | 12,000 | | | | 12,360 | | |
RELX Capital, Inc.
10/15/22 | | | 3.125 | % | | | 2,428,000 | | | | 2,356,027 | | |
Scripps Networks Interactive, Inc.
11/15/24 | | | 3.900 | % | | | 2,510,000 | | | | 2,494,006 | | |
Sky PLC(b)
11/26/22 | | | 3.125 | % | | | 1,994,000 | | | | 1,903,381 | | |
TEGNA, Inc.
10/15/19 | | | 5.125 | % | | | 40,000 | | | | 41,300 | | |
Thomson Reuters Corp.
05/23/43 | | | 4.500 | % | | | 1,600,000 | | | | 1,442,640 | | |
Univision Communications, Inc.(b)
09/15/22 | | | 6.750 | % | | | 59,000 | | | | 62,392 | | |
05/15/23 | | | 5.125 | % | | | 28,000 | | | | 27,580 | | |
02/15/25 | | | 5.125 | % | | | 328,000 | | | | 318,160 | | |
iHeartCommunications, Inc.
03/01/21 | | | 9.000 | % | | | 75,000 | | | | 66,469 | | |
03/15/23 | | | 10.625 | % | | | 55,000 | | | | 49,362 | | |
Total | | | | | | | 12,204,750 | | |
METALS 0.2% | |
Alcoa, Inc.
10/01/24 | | | 5.125 | % | | | 67,000 | | | | 65,660 | | |
ArcelorMittal
03/01/21 | | | 6.250 | % | | | 222,000 | | | | 218,947 | | |
FMG Resources August 2006 Proprietary Ltd.(b)
03/01/22 | | | 9.750 | % | | | 50,000 | | | | 45,688 | | |
Rio Tinto Finance USA Ltd.
06/15/25 | | | 3.750 | % | | | 2,800,000 | | | | 2,710,526 | | |
Vale Overseas Ltd.
01/11/22 | | | 4.375 | % | | | 3,300,000 | | | | 3,060,090 | | |
Total | | | | | | | 6,100,911 | | |
MIDSTREAM 0.5% | |
Blue Racer Midstream LLC/Finance Corp.(b)
11/15/22 | | | 6.125 | % | | | 168,000 | | | | 164,640 | | |
Columbia Pipeline Group, Inc.(b)
06/01/45 | | | 5.800 | % | | | 2,350,000 | | | | 2,256,672 | | |
Crestwood Midstream Partners LP/Finance Corp.
12/15/20 | | | 6.000 | % | | | 9,000 | | | | 8,505 | | |
03/01/22 | | | 6.125 | % | | | 67,000 | | | | 60,970 | | |
Crestwood Midstream Partners LP/Finance Corp.(b)
04/01/23 | | | 6.250 | % | | | 108,000 | | | | 97,740 | | |
Corporate Bonds & Notes (continued)
Issuer | | Coupon
Rate | | Principal
Amount ($) | | Value ($) | |
Energy Transfer Equity LP
01/15/24 | | | 5.875 | % | | | 61,000 | | | | 58,865 | | |
06/01/27 | | | 5.500 | % | | | 186,000 | | | | 172,980 | | |
Enterprise Products Operating LLC
02/01/41 | | | 5.950 | % | | | 2,215,000 | | | | 2,273,297 | | |
Hiland Partners LP/Finance Corp.(b)
10/01/20 | | | 7.250 | % | | | 131,000 | | | | 138,532 | | |
05/15/22 | | | 5.500 | % | | | 50,000 | | | | 50,875 | | |
Kinder Morgan Energy Partners LP
03/01/44 | | | 5.500 | % | | | 2,600,000 | | | | 2,223,351 | | |
MarkWest Energy Partners LP/Finance Corp.
02/15/23 | | | 5.500 | % | | | 99,000 | | | | 97,020 | | |
07/15/23 | | | 4.500 | % | | | 132,000 | | | | 122,100 | | |
12/01/24 | | | 4.875 | % | | | 92,000 | | | | 85,330 | | |
06/01/25 | | | 4.875 | % | | | 87,000 | | | | 80,475 | | |
NiSource Finance Corp.
02/15/44 | | | 4.800 | % | | | 1,300,000 | | | | 1,311,734 | | |
Plains All American Pipeline LP/Finance Corp.
11/01/24 | | | 3.600 | % | | | 2,150,000 | | | | 2,001,261 | | |
Rose Rock Midstream LP/Finance Corp.(b)
11/15/23 | | | 5.625 | % | | | 78,000 | | | | 69,810 | | |
Sabine Pass Liquefaction LLC(b)
03/01/25 | | | 5.625 | % | | | 233,000 | | | | 225,282 | | |
Targa Resources Partners LP/Finance Corp.
05/01/23 | | | 5.250 | % | | | 3,000 | | | | 2,820 | | |
11/15/23 | | | 4.250 | % | | | 157,000 | | | | 137,375 | | |
Targa Resources Partners LP/Finance Corp.(b)
01/15/18 | | | 5.000 | % | | | 97,000 | | | | 96,030 | | |
11/15/19 | | | 4.125 | % | | | 35,000 | | | | 32,987 | | |
Tesoro Logistics LP/Finance Corp.(b)
10/15/19 | | | 5.500 | % | | | 18,000 | | | | 18,180 | | |
10/15/22 | | | 6.250 | % | | | 183,000 | | | | 183,000 | | |
TransCanada PipeLines Ltd.(c)
06/30/16 | | | 0.962 | % | | | 1,874,000 | | | | 1,873,753 | | |
Williams Partners LP/ACMP Finance Corp.
05/15/23 | | | 4.875 | % | | | 24,000 | | | | 22,608 | | |
Williams Partners LP
03/15/22 | | | 3.600 | % | | | 3,300,000 | | | | 3,124,189 | | |
Total | | | | | | | 16,990,381 | | |
NATURAL GAS 0.1% | |
Sempra Energy
10/01/22 | | | 2.875 | % | | | 3,550,000 | | | | 3,401,777 | | |
OIL FIELD SERVICES 0.2% | |
Halliburton Co.
08/01/23 | | | 3.500 | % | | | 2,500,000 | | | | 2,499,863 | | |
Noble Holding International Ltd.
03/01/21 | | | 4.625 | % | | | 2,610,000 | | | | 2,260,346 | | |
The accompanying Notes to Financial Statements are an integral part of this statement.
Annual Report 2015
16
PORTFOLIO OF INVESTMENTS (continued)
August 31, 2015
Corporate Bonds & Notes (continued)
Issuer | | Coupon
Rate | | Principal
Amount ($) | | Value ($) | |
Weatherford International LLC
06/15/37 | | | 6.800 | % | | | 1,250,000 | | | | 1,041,501 | | |
Total | | | | | | | 5,801,710 | | |
OTHER FINANCIAL INSTITUTIONS —% | |
Icahn Enterprises LP/Finance Corp.
08/01/20 | | | 6.000 | % | | | 103,000 | | | | 106,590 | | |
OTHER INDUSTRY —% | |
CB Richard Ellis Services, Inc.
03/15/25 | | | 5.250 | % | | | 60,000 | | | | 61,549 | | |
OTHER REIT —% | |
CyrusOne LP/Finance Corp.
11/15/22 | | | 6.375 | % | | | 48,000 | | | | 49,080 | | |
PACKAGING —% | |
Ardagh Packaging Finance PLC/Holdings USA, Inc.(b)
01/31/21 | | | 6.750 | % | | | 43,000 | | | | 43,860 | | |
Berry Plastics Corp.
05/15/22 | | | 5.500 | % | | | 141,000 | | | | 136,417 | | |
Beverage Packaging Holdings (Luxembourg) II SA(b)
12/15/16 | | | 5.625 | % | | | 15,000 | | | | 14,925 | | |
06/15/17 | | | 6.000 | % | | | 11,000 | | | | 10,945 | | |
Plastipak Holdings, Inc.(b)
10/01/21 | | | 6.500 | % | | | 101,000 | | | | 98,980 | | |
Reynolds Group Issuer, Inc./LLC
08/15/19 | | | 7.875 | % | | | 74,000 | | | | 77,052 | | |
08/15/19 | | | 9.875 | % | | | 67,000 | | | | 70,434 | | |
02/15/21 | | | 6.875 | % | | | 94,000 | | | | 98,465 | | |
02/15/21 | | | 8.250 | % | | | 53,000 | | | | 54,524 | | |
Signode Industrial Group Luxembourg SA/US, Inc.(b)
05/01/22 | | | 6.375 | % | | | 97,000 | | | | 93,605 | | |
Total | | | | | | | 699,207 | | |
PHARMACEUTICALS 0.4% | |
AMAG Pharmaceuticals, Inc.(b)
09/01/23 | | | 7.875 | % | | | 51,000 | | | | 52,211 | | |
AbbVie, Inc.
11/06/22 | | | 2.900 | % | | | 3,000,000 | | | | 2,896,551 | | |
Actavis, Inc.
10/01/22 | | | 3.250 | % | | | 2,875,000 | | | | 2,762,064 | | |
Amgen, Inc.
05/22/24 | | | 3.625 | % | | | 2,690,000 | | | | 2,654,817 | | |
Capsugel SA
PIK(b)
05/15/19 | | | 7.000 | % | | | 22,000 | | | | 22,261 | | |
Concordia Healthcare Corp.(b)
04/15/23 | | | 7.000 | % | | | 45,000 | | | | 46,467 | | |
Corporate Bonds & Notes (continued)
Issuer | | Coupon
Rate | | Principal
Amount ($) | | Value ($) | |
Endo Finance LLC/Finco, Inc.(b)
02/01/25 | | | 6.000 | % | | | 92,000 | | | | 94,530 | | |
Endo Finance LLC/Ltd./Finco, Inc.(b)
07/15/23 | | | 6.000 | % | | | 160,000 | | | | 166,400 | | |
Grifols Worldwide Operations Ltd.
04/01/22 | | | 5.250 | % | | | 131,000 | | | | 133,129 | | |
Jaguar Holding Co. II/Pharmaceutical Product
Development LLC(b)
08/01/23 | | | 6.375 | % | | | 171,000 | | | | 169,461 | | |
Mallinckrodt International Finance SA/CB LLC(b)
04/15/25 | | | 5.500 | % | | | 28,000 | | | | 27,790 | | |
Mallinckrodt International Finance SA
04/15/18 | | | 3.500 | % | | | 206,000 | | | | 207,030 | | |
Quintiles Transnational Corp.(b)
05/15/23 | | | 4.875 | % | | | 68,000 | | | | 69,360 | | |
Roche Holdings, Inc.(b)
09/30/24 | | | 3.350 | % | | | 2,463,000 | | | | 2,477,490 | | |
Valeant Pharmaceuticals International, Inc.(b)
10/15/20 | | | 6.375 | % | | | 256,000 | | | | 266,240 | | |
07/15/21 | | | 7.500 | % | | | 79,000 | | | | 84,826 | | |
12/01/21 | | | 5.625 | % | | | 15,000 | | | | 15,263 | | |
03/01/23 | | | 5.500 | % | | | 125,000 | | | | 126,719 | | |
05/15/23 | | | 5.875 | % | | | 123,000 | | | | 125,460 | | |
04/15/25 | | | 6.125 | % | | | 238,000 | | | | 245,140 | | |
Total | | | | | | | 12,643,209 | | |
PROPERTY & CASUALTY 0.4% | |
ACE INA Holdings, Inc.
03/15/18 | | | 5.800 | % | | | 1,172,000 | | | | 1,292,812 | | |
CNA Financial Corp.
11/15/19 | | | 7.350 | % | | | 1,731,000 | | | | 2,041,773 | | |
HUB International Ltd.(b)
10/01/21 | | | 7.875 | % | | | 264,000 | | | | 263,340 | | |
Hartford Financial Services Group, Inc. (The)
03/30/20 | | | 5.500 | % | | | 2,200,000 | | | | 2,463,138 | | |
Hub Holdings LLC/Finance, Inc.
PIK(b)
07/15/19 | | | 8.125 | % | | | 13,000 | | | | 12,740 | | |
Liberty Mutual Group, Inc.(b)
05/01/22 | | | 4.950 | % | | | 3,000,000 | | | | 3,201,579 | | |
Loews Corp.
05/15/23 | | | 2.625 | % | | | 3,500,000 | | | | 3,316,653 | | |
Transatlantic Holdings, Inc.
11/30/39 | | | 8.000 | % | | | 1,000,000 | | | | 1,327,871 | | |
Total | | | | | | | 13,919,906 | | |
RAILROADS 0.2% | |
Burlington Northern Santa Fe LLC
09/01/24 | | | 3.400 | % | | | 1,955,000 | | | | 1,940,521 | | |
The accompanying Notes to Financial Statements are an integral part of this statement.
Annual Report 2015
17
PORTFOLIO OF INVESTMENTS (continued)
August 31, 2015
Corporate Bonds & Notes (continued)
Issuer | | Coupon
Rate | | Principal
Amount ($) | | Value ($) | |
CSX Corp.
03/15/44 | | | 4.100 | % | | | 3,000,000 | | | | 2,720,892 | | |
Florida East Coast Holdings Corp.(b)
05/01/19 | | | 6.750 | % | | | 79,000 | | | | 79,593 | | |
Total | | | | | | | 4,741,006 | | |
REFINING —% | |
Marathon Petroleum Corp.
03/01/41 | | | 6.500 | % | | | 800,000 | | | | 867,193 | | |
RESTAURANTS 0.1% | |
BC ULC/New Red Finance, Inc.(b)
01/15/22 | | | 4.625 | % | | | 123,000 | | | | 123,615 | | |
04/01/22 | | | 6.000 | % | | | 63,000 | | | | 64,890 | | |
Yum! Brands, Inc.
11/01/23 | | | 3.875 | % | | | 2,850,000 | | | | 2,830,594 | | |
Total | | | | | | | 3,019,099 | | |
RETAIL REIT 0.2% | |
Kimco Realty Corp.
06/01/23 | | | 3.125 | % | | | 3,500,000 | | | | 3,373,615 | | |
Simon Property Group LP
02/01/40 | | | 6.750 | % | | | 1,500,000 | | | | 1,942,083 | | |
Total | | | | | | | 5,315,698 | | |
RETAILERS 0.2% | |
Asbury Automotive Group, Inc.
12/15/24 | | | 6.000 | % | | | 37,000 | | | | 38,480 | | |
CVS Health Corp.
07/20/22 | | | 3.500 | % | | | 2,910,000 | | | | 2,967,277 | | |
CVS Pass-Through Trust(b)
01/10/32 | | | 7.507 | % | | | 306,289 | | | | 379,788 | | |
Caleres, Inc.(b)
08/15/23 | | | 6.250 | % | | | 31,000 | | | | 31,349 | | |
Dollar Tree, Inc.(b)
03/01/23 | | | 5.750 | % | | | 194,000 | | | | 203,215 | | |
Group 1 Automotive, Inc.
06/01/22 | | | 5.000 | % | | | 22,000 | | | | 21,835 | | |
L Brands, Inc.
04/01/21 | | | 6.625 | % | | | 148,000 | | | | 166,500 | | |
Macy's Retail Holdings, Inc.
07/15/34 | | | 6.700 | % | | | 750,000 | | | | 859,522 | | |
Penske Automotive Group, Inc.
10/01/22 | | | 5.750 | % | | | 139,000 | | | | 143,170 | | |
12/01/24 | | | 5.375 | % | | | 40,000 | | | | 40,100 | | |
PetSmart, Inc.(b)
03/15/23 | | | 7.125 | % | | | 61,000 | | | | 63,897 | | |
Corporate Bonds & Notes (continued)
Issuer | | Coupon
Rate | | Principal
Amount ($) | | Value ($) | |
Rite Aid Corp.
03/15/20 | | | 9.250 | % | | | 72,000 | | | | 77,535 | | |
06/15/21 | | | 6.750 | % | | | 4,000 | | | | 4,220 | | |
02/15/27 | | | 7.700 | % | | | 25,000 | | | | 29,250 | | |
Rite Aid Corp.(b)
04/01/23 | | | 6.125 | % | | | 163,000 | | | | 167,279 | | |
Sally Holdings LLC/Capital, Inc.
06/01/22 | | | 5.750 | % | | | 98,000 | | | | 101,675 | | |
Target Corp.
07/01/24 | | | 3.500 | % | | | 1,800,000 | | | | 1,851,266 | | |
Total | | | | | | | 7,146,358 | | |
TECHNOLOGY 0.4% | |
Alliance Data Systems Corp.(b)
12/01/17 | | | 5.250 | % | | | 59,000 | | | | 60,918 | | |
04/01/20 | | | 6.375 | % | | | 102,000 | | | | 105,315 | | |
08/01/22 | | | 5.375 | % | | | 211,000 | | | | 208,362 | | |
Ancestry.com, Inc.
12/15/20 | | | 11.000 | % | | | 70,000 | | | | 77,788 | | |
Apple, Inc.
05/03/23 | | | 2.400 | % | | | 3,500,000 | | | | 3,341,383 | | |
Audatex North America, Inc.(b)
06/15/21 | | | 6.000 | % | | | 94,000 | | | | 91,787 | | |
11/01/23 | | | 6.125 | % | | | 172,000 | | | | 170,476 | | |
Cisco Systems, Inc.
06/15/25 | | | 3.500 | % | | | 2,600,000 | | | | 2,643,927 | | |
Equinix, Inc.
04/01/20 | | | 4.875 | % | | | 132,000 | | | | 134,970 | | |
01/01/22 | | | 5.375 | % | | | 25,000 | | | | 25,250 | | |
04/01/23 | | | 5.375 | % | | | 111,000 | | | | 111,278 | | |
First Data Corp.
01/15/21 | | | 12.625 | % | | | 109,000 | | | | 125,214 | | |
First Data Corp.(b)
08/15/20 | | | 8.875 | % | | | 21,000 | | | | 21,947 | | |
11/01/20 | | | 6.750 | % | | | 80,000 | | | | 84,200 | | |
01/15/21 | | | 8.250 | % | | | 149,000 | | | | 156,822 | | |
08/15/23 | | | 5.375 | % | | | 120,000 | | | | 121,500 | | |
Goodman Networks, Inc.
07/01/18 | | | 12.125 | % | | | 27,000 | | | | 10,260 | | |
Hewlett-Packard Co.
06/01/21 | | | 4.300 | % | | | 2,350,000 | | | | 2,446,021 | | |
Infor US, Inc.(b)
08/15/20 | | | 5.750 | % | | | 23,000 | | | | 23,058 | | |
MSCI, Inc.(b)
11/15/24 | | | 5.250 | % | | | 131,000 | | | | 133,292 | | |
08/15/25 | | | 5.750 | % | | | 81,000 | | | | 82,620 | | |
NCR Corp.
12/15/21 | | | 5.875 | % | | | 32,000 | | | | 32,560 | | |
12/15/23 | | | 6.375 | % | | | 28,000 | | | | 28,735 | | |
The accompanying Notes to Financial Statements are an integral part of this statement.
Annual Report 2015
18
PORTFOLIO OF INVESTMENTS (continued)
August 31, 2015
Corporate Bonds & Notes (continued)
Issuer | | Coupon
Rate | | Principal
Amount ($) | | Value ($) | |
NXP BV/Funding LLC(b)
06/15/22 | | | 4.625 | % | | | 76,000 | | | | 75,240 | | |
Oracle Corp.
04/15/38 | | | 6.500 | % | | | 2,000,000 | | | | 2,540,250 | | |
Plantronics, Inc.(b)
05/31/23 | | | 5.500 | % | | | 54,000 | | | | 54,270 | | |
Qualitytech LP/Finance Corp.
08/01/22 | | | 5.875 | % | | | 92,000 | | | | 92,920 | | |
Riverbed Technology, Inc.(b)
03/01/23 | | | 8.875 | % | | | 134,000 | | | | 121,940 | | |
VeriSign, Inc.
05/01/23 | | | 4.625 | % | | | 81,000 | | | | 78,975 | | |
04/01/25 | | | 5.250 | % | | | 72,000 | | | | 72,540 | | |
Zebra Technologies Corp.(b)
10/15/22 | | | 7.250 | % | | | 177,000 | | | | 189,390 | | |
Total | | | | | | | 13,463,208 | | |
TRANSPORTATION SERVICES 0.1% | |
ERAC U.S.A. Finance LLC(b)
10/15/37 | | | 7.000 | % | | | 1,796,000 | | | | 2,202,167 | | |
WIRELESS 0.1% | |
Altice Luxembourg SA(b)
05/15/22 | | | 7.750 | % | | | 126,000 | | | | 122,850 | | |
02/15/25 | | | 7.625 | % | | | 12,000 | | | | 11,400 | | |
Altice US Finance I Corp.(b)
07/15/23 | | | 5.375 | % | | | 62,000 | | | | 61,380 | | |
Altice US Finance II Corp.(b)
07/15/25 | | | 7.750 | % | | | 48,000 | | | | 46,800 | | |
Crown Castle International Corp.
04/15/22 | | | 4.875 | % | | | 96,000 | | | | 98,520 | | |
01/15/23 | | | 5.250 | % | | | 111,000 | | | | 116,134 | | |
Numericable-SFR(b)
05/15/22 | | | 6.000 | % | | | 199,000 | | | | 199,000 | | |
Rogers Communications, Inc.
10/01/23 | | | 4.100 | % | | | 1,550,000 | | | | 1,560,256 | | |
SBA Communications Corp
07/15/22 | | | 4.875 | % | | | 12,000 | | | | 11,895 | | |
SBA Telecommunications, Inc.
07/15/20 | | | 5.750 | % | | | 74,000 | | | | 77,238 | | |
Sprint Communications, Inc.
11/15/21 | | | 11.500 | % | | | 83,000 | | | | 94,827 | | |
Sprint Communications, Inc.(b)
11/15/18 | | | 9.000 | % | | | 122,000 | | | | 135,877 | | |
03/01/20 | | | 7.000 | % | | | 209,000 | | | | 222,000 | | |
Sprint Corp.
09/15/21 | | | 7.250 | % | | | 41,000 | | | | 39,873 | | |
09/15/23 | | | 7.875 | % | | | 116,000 | | | | 111,505 | | |
Corporate Bonds & Notes (continued)
Issuer | | Coupon
Rate | | Principal
Amount ($) | | Value ($) | |
06/15/24 | | | 7.125 | % | | | 47,000 | | | | 43,460 | | |
02/15/25 | | | 7.625 | % | | | 57,000 | | | | 53,188 | | |
T-Mobile USA, Inc.
04/28/21 | | | 6.633 | % | | | 86,000 | | | | 89,870 | | |
01/15/22 | | | 6.125 | % | | | 18,000 | | | | 18,563 | | |
04/28/22 | | | 6.731 | % | | | 14,000 | | | | 14,700 | | |
03/01/23 | | | 6.000 | % | | | 75,000 | | | | 76,462 | | |
04/01/23 | | | 6.625 | % | | | 173,000 | | | | 180,439 | | |
04/28/23 | | | 6.836 | % | | | 74,000 | | | | 77,515 | | |
01/15/24 | | | 6.500 | % | | | 58,000 | | | | 59,595 | | |
03/01/25 | | | 6.375 | % | | | 21,000 | | | | 21,462 | | |
Wind Acquisition Finance SA(b)
04/30/20 | | | 6.500 | % | | | 111,000 | | | | 116,827 | | |
07/15/20 | | | 4.750 | % | | | 76,000 | | | | 76,570 | | |
04/23/21 | | | 7.375 | % | | | 67,000 | | | | 68,508 | | |
Total | | | | | | | 3,806,714 | | |
WIRELINES 0.5% | |
AT&T, Inc.
02/15/39 | | | 6.550 | % | | | 3,620,000 | | | | 4,119,509 | | |
CenturyLink, Inc.
04/01/20 | | | 5.625 | % | | | 48,000 | | | | 47,880 | | |
03/15/22 | | | 5.800 | % | | | 131,000 | | | | 124,286 | | |
12/01/23 | | | 6.750 | % | | | 45,000 | | | | 43,763 | | |
CenturyLink, Inc.(b)
04/01/25 | | | 5.625 | % | | | 42,000 | | | | 37,506 | | |
Deutsche Telekom International Finance BV
03/23/16 | | | 5.750 | % | | | 1,585,000 | | | | 1,626,473 | | |
Frontier Communications Corp.
07/01/21 | | | 9.250 | % | | | 22,000 | | | | 22,605 | | |
01/15/23 | | | 7.125 | % | | | 59,000 | | | | 53,277 | | |
01/15/25 | | | 6.875 | % | | | 165,000 | | | | 139,631 | | |
Level 3 Communications, Inc.
12/01/22 | | | 5.750 | % | | | 94,000 | | | | 93,765 | | |
Level 3 Financing, Inc.
06/01/20 | | | 7.000 | % | | | 16,000 | | | | 16,840 | | |
07/15/20 | | | 8.625 | % | | | 24,000 | | | | 25,428 | | |
01/15/21 | | | 6.125 | % | | | 36,000 | | | | 37,710 | | |
08/15/22 | | | 5.375 | % | | | 127,000 | | | | 127,450 | | |
Orange SA
07/08/19 | | | 5.375 | % | | | 1,330,000 | | | | 1,477,706 | | |
Telecom Italia SpA(b)
05/30/24 | | | 5.303 | % | | | 144,000 | | | | 146,249 | | |
Telefonica Emisiones SAU
06/20/36 | | | 7.045 | % | | | 765,000 | | | | 936,069 | | |
Verizon New York, Inc.
04/01/32 | | | 7.375 | % | | | 4,500,000 | | | | 5,226,953 | | |
Windstream Services LLC
10/15/20 | | | 7.750 | % | | | 11,000 | | | | 9,790 | | |
The accompanying Notes to Financial Statements are an integral part of this statement.
Annual Report 2015
19
PORTFOLIO OF INVESTMENTS (continued)
August 31, 2015
Corporate Bonds & Notes (continued)
Issuer | | Coupon
Rate | | Principal
Amount ($) | | Value ($) | |
Zayo Group LLC/Capital, Inc.
07/01/20 | | | 10.125 | % | | | 8,000 | | | | 8,800 | | |
Zayo Group LLC/Capital, Inc.(b)
04/01/23 | | | 6.000 | % | | | 287,000 | | | | 286,627 | | |
05/15/25 | | | 6.375 | % | | | 43,000 | | | | 42,570 | | |
Total | | | | | | | 14,650,887 | | |
Total Corporate Bonds & Notes
(Cost: $373,293,272) | | | | | | | 370,686,958 | | |
Residential Mortgage-Backed Securities —
Agency 8.8%
Federal Home Loan Mortgage Corp.
05/01/39-
06/01/41 | | | 4.500 | % | | | 8,481,878 | | | | 9,213,721 | | |
12/01/42-
07/01/45 | | | 4.000 | % | | | 15,742,996 | | | | 16,735,067 | | |
10/01/26-
06/01/45 | | | 3.500 | % | | | 59,206,235 | | | | 61,548,585 | | |
06/01/32-
07/01/32 | | | 7.000 | % | | | 524,183 | | | | 617,860 | | |
08/01/32-
03/01/38 | | | 6.500 | % | | | 32,903 | | | | 37,976 | | |
03/01/17-
10/01/39 | | | 6.000 | % | | | 1,770,760 | | | | 1,998,258 | | |
12/01/17-
05/01/40 | | | 5.500 | % | | | 1,566,833 | | | | 1,724,129 | | |
08/01/18-
05/01/41 | | | 5.000 | % | | | 4,829,664 | | | | 5,296,729 | | |
12/01/42-
06/01/45 | | | 3.000 | % | | | 43,035,895 | | | | 43,191,704 | | |
CMO Series 1614 Class MZ
11/15/23 | | | 6.500 | % | | | 19,451 | | | | 21,514 | | |
Federal Home Loan Mortgage Corp.(c)
12/01/36 | | | 6.140 | % | | | 12,937 | | | | 13,832 | | |
08/01/36 | | | 2.384 | % | | | 45,545 | | | | 48,520 | | |
Federal Home Loan Mortgage Corp.(e)
09/14/45 | | | 3.500 | % | | | 19,375,000 | | | | 20,057,103 | | |
09/14/45 | | | 4.000 | % | | | 18,610,000 | | | | 19,741,138 | | |
Federal National Mortgage Association
05/01/40-
06/01/44 | | | 4.500 | % | | | 10,721,163 | | | | 11,644,662 | | |
01/01/29-
12/01/41 | | | 4.000 | % | | | 17,439,410 | | | | 18,523,201 | | |
12/01/25-
12/01/29 | | | 3.500 | % | | | 31,997,123 | | | | 33,764,789 | | |
08/01/18-
02/01/38 | | | 5.500 | % | | | 628,696 | | | | 697,546 | | |
12/01/20 | | | 5.000 | % | | | 97,948 | | | | 105,076 | | |
03/01/17-
08/01/37 | | | 6.500 | % | | | 681,157 | | | | 784,520 | | |
Residential Mortgage-Backed Securities —
Agency (continued)
Issuer | | Coupon
Rate | | Principal
Amount ($) | | Value ($) | |
07/01/27-
08/01/43 | | | 3.000 | % | | | 2,910,211 | | | | 3,015,657 | | |
06/01/31-
08/01/32 | | | 7.000 | % | | | 321,853 | | | | 387,931 | | |
09/01/17-
11/01/32 | | | 6.000 | % | | | 494,926 | | | | 552,943 | | |
Federal National Mortgage Association(c)
08/01/36 | | | 2.415 | % | | | 30,305 | | | | 32,451 | | |
04/01/36 | | | 1.925 | % | | | 30,669 | | | | 32,124 | | |
Federal National Mortgage Association(e)
09/14/45 | | | 4.000 | % | | | 15,405,000 | | | | 16,375,637 | | |
Government National Mortgage Association(e)
02/15/45 | | | 3.500 | % | | | 20,260,865 | | | | 21,125,080 | | |
Total Residential Mortgage-Backed
Securities — Agency
(Cost: $284,755,913) | | | | | | | 287,287,753 | | |
Residential Mortgage-Backed Securities —
Non-Agency 0.2%
JPMorgan Resecuritization Trust
CMO Series 2009-12 Class 9A1(b)(c)
05/26/36 | | | 2.723 | % | | | 1,025,942 | | | | 1,036,067 | | |
SACO I, Inc.
CMO Series 1995-1 Class A(b)(c)(g)(h)
09/25/24 | | | 0.000 | % | | | 4,128 | | | | 2,292 | | |
Springleaf Mortgage Loan Trust(b)(c)
CMO Series 2012-3A Class A
12/25/59 | | | 1.570 | % | | | 775,586 | | | | 771,282 | | |
CMO Series 2013-1A Class A
06/25/58 | | | 1.270 | % | | | 770,524 | | | | 765,509 | | |
CMO Series 2013-2A Class A
12/25/65 | | | 1.780 | % | | | 828,451 | | | | 828,873 | | |
CMO Series 2013-3A Class A
09/25/57 | | | 1.870 | % | | | 1,855,448 | | | | 1,849,445 | | |
Total Residential Mortgage-Backed
Securities — Non-Agency
(Cost: $5,268,721) | | | | | | | 5,253,468 | | |
Commercial Mortgage-Backed Securities —
Agency 3.3%
Federal National Mortgage Association
Series 2006-M2 Class A2A(c)
10/25/32 | | | 5.271 | % | | | 2,139,380 | | | | 2,467,666 | | |
Government National Mortgage Association
Series 2011-149 Class A
10/16/46 | | | 3.000 | % | | | 210,042 | | | | 211,752 | | |
Series 2011-161 Class A
01/16/34 | | | 1.738 | % | | | 1,830,530 | | | | 1,837,552 | | |
The accompanying Notes to Financial Statements are an integral part of this statement.
Annual Report 2015
20
PORTFOLIO OF INVESTMENTS (continued)
August 31, 2015
Commercial Mortgage-Backed Securities —
Agency (continued)
Issuer | | Coupon
Rate | | Principal
Amount ($) | | Value ($) | |
Series 2011-31 Class A
12/16/35 | | | 2.210 | % | | | 176,025 | | | | 176,548 | | |
Series 2011-78 Class A
08/16/34 | | | 2.250 | % | | | 389,413 | | | | 389,950 | | |
Series 2012-111 Class AC
04/16/47 | | | 2.211 | % | | | 580,582 | | | | 583,051 | | |
Series 2012-25 Class A
11/16/42 | | | 2.575 | % | | | 2,502,637 | | | | 2,555,260 | | |
Series 2012-45 Class A
03/16/40 | | | 2.830 | % | | | 571,472 | | | | 577,854 | | |
Series 2012-55 Class A
08/16/33 | | | 1.704 | % | | | 717,577 | | | | 720,571 | | |
Series 2012-58 Class A
01/16/40 | | | 2.500 | % | | | 823,183 | | | | 836,445 | | |
Series 2012-79 Class A
04/16/39 | | | 1.800 | % | | | 938,331 | | | | 935,420 | | |
Series 2012-9 Class A
05/16/39 | | | 3.220 | % | | | 458,622 | | | | 465,056 | | |
Series 2013-105 Class A
02/16/37 | | | 1.705 | % | | | 4,588,358 | | | | 4,552,693 | | |
Series 2013-118 Class AB
06/16/36 | | | 2.000 | % | | | 2,469,029 | | | | 2,465,933 | | |
Series 2013-12 Class A
10/16/42 | | | 1.410 | % | | | 1,760,520 | | | | 1,738,340 | | |
Series 2013-126 Class AB
04/16/38 | | | 1.540 | % | | | 2,560,992 | | | | 2,524,935 | | |
Series 2013-138 Class A
08/16/35 | | | 2.150 | % | | | 3,017,383 | | | | 3,052,602 | | |
Series 2013-146 Class AH
08/16/40 | | | 2.000 | % | | | 2,187,175 | | | | 2,206,455 | | |
Series 2013-17 Class AH
10/16/43 | | | 1.558 | % | | | 1,452,030 | | | | 1,435,456 | | |
Series 2013-179 Class A
07/16/37 | | | 1.800 | % | | | 2,606,054 | | | | 2,591,796 | | |
Series 2013-194 Class AB
05/16/38 | | | 2.250 | % | | | 1,857,976 | | | | 1,873,657 | | |
Series 2013-2 Class AB
12/16/42 | | | 1.600 | % | | | 1,236,271 | | | | 1,227,086 | | |
Series 2013-30 Class A
05/16/42 | | | 1.500 | % | | | 2,754,687 | | | | 2,707,990 | | |
Series 2013-32 Class AB
01/16/42 | | | 1.900 | % | | | 2,817,219 | | | | 2,796,157 | | |
Series 2013-33 Class A
07/16/38 | | | 1.061 | % | | | 3,951,603 | | | | 3,881,963 | | |
Series 2013-40 Class A
10/16/41 | | | 1.511 | % | | | 1,724,065 | | | | 1,704,030 | | |
Series 2013-57 Class A
06/16/37 | | | 1.350 | % | | | 4,527,747 | | | | 4,457,495 | | |
Series 2013-61 Class A
01/16/43 | | | 1.450 | % | | | 2,027,593 | | | | 1,992,836 | | |
Series 2013-73 Class AE
01/16/39 | | | 1.350 | % | | | 956,846 | | | | 942,660 | | |
Series 2013-78 Class AB
07/16/39 | | | 1.624 | % | | | 2,100,327 | | | | 2,070,463 | | |
Series 2014-103 Class AB
06/16/53 | | | 1.742 | % | | | 2,687,377 | | | | 2,754,559 | | |
Commercial Mortgage-Backed Securities —
Agency (continued)
Issuer | | Coupon
Rate | | Principal
Amount ($) | | Value ($) | |
Series 2014-109 Class A
01/16/46 | | | 2.325 | % | | | 5,281,752 | | | | 5,361,839 | | |
Series 2014-135 Class AD
08/16/45 | | | 2.400 | % | | | 2,277,938 | | | | 2,293,697 | | |
Series 2014-138 Class A
01/16/44 | | | 2.700 | % | | | 1,305,283 | | | | 1,329,799 | | |
Series 2014-148 Class A
11/16/43 | | | 2.650 | % | | | 3,313,408 | | | | 3,389,845 | | |
Series 2014-169 Class A
11/16/42 | | | 2.600 | % | | | 2,779,492 | | | | 2,841,686 | | |
Series 2014-24 Class BA
07/16/38 | | | 2.100 | % | | | 3,262,314 | | | | 3,279,999 | | |
Series 2014-33 Class A
08/16/39 | | | 2.300 | % | | | 1,507,314 | | | | 1,517,261 | | |
Series 2014-64 Class A
02/16/45 | | | 2.200 | % | | | 2,793,779 | | | | 2,820,954 | | |
Series 2014-67 Class AE
05/16/39 | | | 2.150 | % | | | 1,234,268 | | | | 1,254,834 | | |
Series 2015-21 Class A
11/16/42 | | | 2.600 | % | | | 3,285,251 | | | | 3,342,201 | | |
Series 2015-33 Class AH
02/16/45 | | | 2.650 | % | | | 1,988,440 | | | | 2,024,503 | | |
Series 2015-5 Class KA
11/16/39 | | | 2.500 | % | | | 5,289,993 | | | | 5,361,228 | | |
Series 2015-78 Class A
06/16/40 | | | 2.918 | % | | | 6,357,822 | | | | 6,509,456 | | |
Series 2015-85 Class AF
05/16/44 | | | 2.400 | % | | | 3,985,430 | | | | 4,029,975 | | |
Series 2015-98 Class AE
04/16/41 | | | 2.100 | % | | | 3,100,000 | | | | 3,112,970 | | |
Government National Mortgage Association(c)
Series 2013-50 Class AH
06/16/39 | | | 2.100 | % | | | 1,756,186 | | | | 1,756,019 | | |
Total Commercial Mortgage-Backed
Securities — Agency
(Cost: $109,477,656) | | | | | | | 108,960,497 | | |
Commercial Mortgage-Backed Securities —
Non-Agency 3.0%
American Homes 4 Rent Trust(b)
Series 2014-SFR2 Class A
10/17/36 | | | 3.786 | % | | | 2,993,650 | | | | 3,058,759 | | |
Series 2014-SFR3 Class A
12/17/36 | | | 3.678 | % | | | 3,513,650 | | | | 3,560,786 | | |
American Homes 4 Rent
Series 2015-SFR1 Class A(b)
04/17/52 | | | 3.467 | % | | | 3,653,012 | | | | 3,639,025 | | |
Americold 2010 LLC Trust
Series 2010-ARTA Class A1(b)
01/14/29 | | | 3.847 | % | | | 271,065 | | | | 285,265 | | |
The accompanying Notes to Financial Statements are an integral part of this statement.
Annual Report 2015
21
PORTFOLIO OF INVESTMENTS (continued)
August 31, 2015
Commercial Mortgage-Backed Securities —
Non-Agency (continued)
Issuer | | Coupon
Rate | | Principal
Amount ($) | | Value ($) | |
Banc of America Commercial Mortgage Trust
Series 2006-4 Class A4
07/10/46 | | | 5.634 | % | | | 2,985,721 | | | | 3,046,430 | | |
Bear Stearns Commercial Mortgage Securities Trust
Series 2006-PW14 Class A4
12/11/38 | | | 5.201 | % | | | 1,217,339 | | | | 1,259,014 | | |
Series 2006-T24 Class A4
10/12/41 | | | 5.537 | % | | | 1,233,707 | | | | 1,270,778 | | |
Bear Stearns Commercial Mortgage Securities Trust(c)
Series 2005-T20 Class A4A
10/12/42 | | | 5.257 | % | | | 20,942 | | | | 20,920 | | |
Series 2007-T28 Class A4
09/11/42 | | | 5.742 | % | | | 790,000 | | | | 846,192 | | |
CD Mortgage Trust
Series 2007-CD5 Class A4(c)
11/15/44 | | | 5.886 | % | | | 4,556,610 | | | | 4,868,200 | | |
COBALT CMBS Commercial Mortgage Trust
Series 2007-C2 Class A3(c)
04/15/47 | | | 5.484 | % | | | 6,401,334 | | | | 6,722,028 | | |
Citigroup Commercial Mortgage Trust
Series 2006-C5 Class A4
10/15/49 | | | 5.431 | % | | | 2,445,000 | | | | 2,515,179 | | |
Citigroup/Deutsche Bank Commercial Mortgage Trust
Series 2007-CD4 Class A4
12/11/49 | | | 5.322 | % | | | 6,750,000 | | | | 6,983,345 | | |
Colony Multifamily Mortgage Trust
Series 2014-1 Class A(b)
04/20/50 | | | 2.543 | % | | | 1,705,042 | | | | 1,709,692 | | |
DBUBS Mortgage Trust
Series 2011-LC1A Class A3(b)
11/10/46 | | | 5.002 | % | | | 150,000 | | | | 167,702 | | |
GE Capital Commercial Mortgage Corp.
Series 2006-C1 Class A4(c)
03/10/44 | | | 5.452 | % | | | 1,866,280 | | | | 1,871,915 | | |
GS Mortgage Securities Trust
Series 2006-GG8 Class A4
11/10/39 | | | 5.560 | % | | | 2,558,627 | | | | 2,636,310 | | |
General Electric Capital Assurance Co.
Series 2003-1 Class A5(b)(c)
05/12/35 | | | 5.743 | % | | | 244,470 | | | | 267,462 | | |
JPMorgan Chase Commercial Mortgage Securities Trust
Series 2007-CB18 Class A4
06/12/47 | | | 5.440 | % | | | 771,893 | | | | 803,326 | | |
JPMorgan Chase Commercial Mortgage Securities Trust(b)
Series 2009-IWST Class A2
12/05/27 | | | 5.633 | % | | | 300,000 | | | | 340,572 | | |
Series 2010-C1 Class A1
06/15/43 | | | 3.853 | % | | | 9,190 | | | | 9,190 | | |
Commercial Mortgage-Backed Securities —
Non-Agency (continued)
Issuer | | Coupon
Rate | | Principal
Amount ($) | | Value ($) | |
Series 2010-CNTR Class A2
08/05/32 | | | 4.311 | % | | | 450,000 | | | | 487,773 | | |
Series 2011-C3 Class A4
02/15/46 | | | 4.717 | % | | | 450,000 | | | | 492,541 | | |
JPMorgan Chase Commercial Mortgage Securities Trust(c)
Series 2005-LDP5 Class A4
12/15/44 | | | 5.405 | % | | | 1,468,090 | | | | 1,470,863 | | |
LB-UBS Commercial Mortgage Trust
Series 2006-C6 Class A1A
09/15/39 | | | 5.342 | % | | | 1,547,662 | | | | 1,598,689 | | |
LB-UBS Commercial Mortgage Trust(c)
Series 2006-C4 Class A4
06/15/38 | | | 6.028 | % | | | 1,798,535 | | | | 1,834,265 | | |
Series 2007-C7 Class A3
09/15/45 | | | 5.866 | % | | | 1,953,322 | | | | 2,095,189 | | |
Morgan Stanley Capital I Trust
Series 2007-IQ13 Class A4
03/15/44 | | | 5.364 | % | | | 3,125,000 | | | | 3,251,856 | | |
Morgan Stanley Capital I Trust(b)(c)
Series 2011-C1 Class A4
09/15/47 | | | 5.033 | % | | | 300,000 | | | | 334,134 | | |
Morgan Stanley Capital I Trust(c)
Series 2006-T23 Class A4
08/12/41 | | | 6.009 | % | | | 1,627,806 | | | | 1,663,748 | | |
Series 2007-HQ11 Class A4
02/12/44 | | | 5.447 | % | | | 1,600,000 | | | | 1,661,021 | | |
Series 2007-T27 Class A1A
06/11/42 | | | 5.825 | % | | | 3,328,075 | | | | 3,523,692 | | |
Series 2007-T27 Class A4
06/11/42 | | | 5.825 | % | | | 7,327,965 | | | | 7,805,279 | | |
Morgan Stanley Re-Remic Trust(b)(c)
Series 2009-GG10 Class A4A
08/12/45 | | | 5.989 | % | | | 1,917,731 | | | | 2,018,247 | | |
Series 2010-GG10 Class A4A
08/15/45 | | | 5.988 | % | | | 4,939,869 | | | | 5,198,787 | | |
Wachovia Bank Commercial Mortgage Trust
Series 2006-C29 Class A1A
11/15/48 | | | 5.297 | % | | | 2,347,454 | | | | 2,445,441 | | |
Wachovia Bank Commercial Mortgage Trust(c)
Series 2006-C24 Class A1A
03/15/45 | | | 5.557 | % | | | 6,084,510 | | | | 6,151,634 | | |
Series 2006-C24 Class A3
03/15/45 | | | 5.558 | % | | | 2,936,751 | | | | 2,947,065 | | |
Series 2006-C25 Class A1A
05/15/43 | | | 5.893 | % | | | 2,619,912 | | | | 2,675,323 | | |
Series 2006-C26 Class A1A
06/15/45 | | | 6.009 | % | | | 1,733,480 | | | | 1,780,144 | | |
Series 2006-C26 Class A3
06/15/45 | | | 6.011 | % | | | 2,775,000 | | | | 2,834,807 | | |
Total Commercial Mortgage-Backed
Securities — Non-Agency
(Cost: $99,549,187) | | | | | | | 98,152,588 | | |
The accompanying Notes to Financial Statements are an integral part of this statement.
Annual Report 2015
22
PORTFOLIO OF INVESTMENTS (continued)
August 31, 2015
Asset-Backed Securities — Non-Agency 1.6%
Issuer | | Coupon
Rate | | Principal
Amount ($) | | Value ($) | |
Ally Master Owner Trust
Series 2014-1 Class A1(c)
01/15/19 | | | 0.668 | % | | | 825,000 | | | | 825,802 | | |
AmeriCredit Automobile Receivables Trust
Series 2013-4 Class B
09/10/18 | | | 1.660 | % | | | 770,000 | | | | 770,246 | | |
American Credit Acceptance Receivables Trust(b)
Series 2013-1 Class A
04/16/18 | | | 1.450 | % | | | 75,683 | | | | 75,741 | | |
Series 2015-2 Class A
06/12/19 | | | 1.570 | % | | | 984,505 | | | | 983,822 | | |
CNH Wholesale Master Note Trust
Series 2013-2A Class A(b)(c)
08/15/19 | | | 0.798 | % | | | 1,650,000 | | | | 1,651,743 | | |
California Republic Auto Receivables Trust
Series 2015-1 Class A3
04/15/19 | | | 1.330 | % | | | 1,195,000 | | | | 1,196,939 | | |
CarFinance Capital Auto Trust(b)
Series 2013-2A Class A
11/15/17 | | | 1.750 | % | | | 168,952 | | | | 169,092 | | |
Series 2014-1A Class A
12/17/18 | | | 1.460 | % | | | 470,355 | | | | 469,964 | | |
Series 2015-1A Class A
06/15/21 | | | 1.750 | % | | | 1,728,903 | | | | 1,725,489 | | |
Chesapeake Funding LLC
Series 2012-1A Class A(b)(c)
11/07/23 | | | 0.944 | % | | | 186,757 | | | | 186,789 | | |
DT Auto Owner Trust(b)
Series 2014-3A Class A
04/16/18 | | | 0.980 | % | | | 612,468 | | | | 612,146 | | |
Series 2015-2A Class A
09/17/18 | | | 1.240 | % | | | 1,700,962 | | | | 1,700,478 | | |
Diamond Resorts Owner Trust
Series 2013-2 Class A(b)
05/20/26 | | | 2.270 | % | | | 652,161 | | | | 655,258 | | |
Drive Auto Receivables Trust(b)
Series 2015-AA Class A3
07/16/18 | | | 1.430 | % | | | 1,945,000 | | | | 1,947,857 | | |
Series 2015-CA Class A3
10/15/18 | | | 1.380 | % | | | 755,000 | | | | 754,929 | | |
Equifirst Mortgage Loan Trust
Series 2003-1 Class IF1(c)
12/25/32 | | | 4.010 | % | | | 76,434 | | | | 76,985 | | |
Exeter Automobile Receivables Trust(b)
Series 2014-2A Class A
08/15/18 | | | 1.060 | % | | | 272,658 | | | | 272,143 | | |
Series 2014-3A Class A
01/15/19 | | | 1.320 | % | | | 811,725 | | | | 810,742 | | |
Series 2015-1A Class A
06/17/19 | | | 1.600 | % | | | 2,797,537 | | | | 2,794,454 | | |
Series 2015-2A Class A
11/15/19 | | | 1.540 | % | | | 4,022,524 | | | | 4,018,635 | | |
Asset-Backed Securities — Non-Agency (continued)
Issuer | | Coupon
Rate | | Principal
Amount ($) | | Value ($) | |
First Investors Auto Owner Trust
Series 2014-3A Class A2(b)
11/15/18 | | | 1.060 | % | | | 846,710 | | | | 847,039 | | |
Hertz Fleet Lease Funding LP
Series 2014-1 Class A(b)(c)
04/10/28 | | | 0.592 | % | | | 1,876,887 | | | | 1,878,173 | | |
Hilton Grand Vacations Trust(b)
Series 2013-A Class A
01/25/26 | | | 2.280 | % | | | 1,242,520 | | | | 1,251,010 | | |
Series 2014-AA Class A
11/25/26 | | | 1.770 | % | | | 2,009,461 | | | | 1,992,083 | | |
Hyundai Auto Lease Securitization Trust
Series 2015-A Class A3(b)
09/17/18 | | | 1.420 | % | | | 2,515,000 | | | | 2,521,099 | | |
KeyCorp Student Loan Trust
Series 1999-A Class A2(c)
12/27/29 | | | 0.612 | % | | | 117,496 | | | | 116,605 | | |
MVW Owner Trust
Series 2015-1A Class A(b)
12/20/32 | | | 2.520 | % | | | 4,675,000 | | | | 4,686,651 | | |
Navient Private Education Loan Trust
Series 2015-AA Class A1(b)(c)
12/15/21 | | | 0.698 | % | | | 662,428 | | | | 660,192 | | |
New York City Tax Lien Trust
Series 2014-A Class A(b)
11/10/27 | | | 1.030 | % | | | 222,338 | | | | 222,114 | | |
PFS Tax Lien Trust
Series 2014-1 Class NOTE(b)
04/15/16 | | | 1.440 | % | | | 546,287 | | | | 547,680 | | |
Prestige Auto Receivables Trust
Series 2015-1 Class A2(b)
02/15/19 | | | 1.090 | % | | | 1,590,000 | | | | 1,590,354 | | |
SLM Private Credit Student Loan Trust
Series 2004-B Class A2(c)
06/15/21 | | | 0.486 | % | | | 533,616 | | | | 531,021 | | |
SLM Private Education Loan Trust(b)
Series 2012-A Class A2
01/17/45 | | | 3.830 | % | | | 500,000 | | | | 524,622 | | |
SLM Private Education Loan Trust(b)(c)
Series 2011-C Class A1
12/15/23 | | | 1.598 | % | | | 57,843 | | | | 57,909 | | |
SMART ABS Trust
Series 2015-1US Class A3A
09/14/18 | | | 1.500 | % | | | 2,035,000 | | | | 2,032,190 | | |
SMB Private Education Loan Trust
Series 2015-B Class A1(b)(c)
02/15/23 | | | 0.891 | % | | | 995,000 | | | | 993,122 | | |
Sierra Timeshare Receivables Funding Co. LLC
Series 2010-3A Class A(b)
11/20/25 | | | 3.510 | % | | | 22,633 | | | | 22,791 | | |
The accompanying Notes to Financial Statements are an integral part of this statement.
Annual Report 2015
23
PORTFOLIO OF INVESTMENTS (continued)
August 31, 2015
Asset-Backed Securities — Non-Agency (continued)
Issuer | | Coupon
Rate | | Principal
Amount ($) | | Value ($) | |
TAL Advantage V LLC
Series 2014-2A Class A1(b)
05/20/39 | | | 1.700 | % | | | 1,225,705 | | | | 1,217,227 | | |
TCF Auto Receivables Owner Trust
Series 2015-1A Class A2(b)
08/15/18 | | | 1.020 | % | | | 1,875,000 | | | | 1,874,816 | | |
Volvo Financial Equipment LLC
Series 2015-1A Class A3(b)
06/17/19 | | | 1.510 | % | | | 2,400,000 | | | | 2,405,899 | | |
Westlake Automobile Receivables Trust
Series 2015-1A Class A2(b)
03/15/18 | | | 1.170 | % | | | 4,500,000 | | | | 4,493,061 | | |
Total Asset-Backed Securities — Non-Agency
(Cost: $52,135,808) | | | | | | | 52,164,912 | | |
Inflation-Indexed Bonds 0.6%
UNITED STATES 0.6% | |
U.S. Treasury Inflation-Indexed Bond
04/15/17 | | | 0.125 | % | | | 20,177,925 | | | | 20,105,143 | | |
Total Inflation-Indexed Bonds
(Cost: $20,455,994) | | | | | | | 20,105,143 | | |
U.S. Treasury Obligations 3.5%
U.S. Treasury
08/15/40 | | | 3.875 | % | | | 71,736,000 | | | | 84,475,668 | | |
07/31/18 | | | 1.375 | % | | | 29,700,000 | | | | 29,960,261 | | |
Total U.S. Treasury Obligations
(Cost: $109,637,746) | | | | | | | 114,435,929 | | |
Foreign Government Obligations(i) 0.6%
CANADA 0.5% | |
Province of Nova Scotia
01/26/17 | | | 5.125 | % | | | 4,000,000 | | | | 4,232,808 | | |
Province of Ontario
02/14/18 | | | 1.200 | % | | | 5,400,000 | | | | 5,390,377 | | |
Province of Quebec
05/14/18 | | | 4.625 | % | | | 4,400,000 | | | | 4,784,697 | | |
Total | | | 14,407,882 | | |
MEXICO 0.1% | |
Pemex Project Funding Master Trust
01/21/21 | | | 5.500 | % | | | 3,100,000 | | | | 3,324,750 | | |
Total Foreign Government Obligations
(Cost: $17,551,545) | | | | | | | 17,732,632 | | |
Municipal Bonds 0.1%
Issue
Description | | Coupon
Rate | | Principal
Amount ($) | | Value ($) | |
ILLINOIS 0.1% | |
State of Illinois
Unlimited General Obligation Bonds
Taxable
Series 2011
03/01/17 | | | 5.365 | % | | | 4,155,000 | | | | 4,320,452 | | |
Total Municipal Bonds
(Cost: $4,366,381) | | | | | | | 4,320,452 | | |
Senior Loans —%
Borrower | | Weighted
Average
Coupon | | Principal
Amount | | Value ($) | |
HEALTH CARE —% | |
American Renal Holdings, Inc.
2nd Lien Term Loan(c)(j)
03/20/20 | | | 8.500 | % | | | 40,000 | | | | 39,700 | | |
RETAILERS —% | |
Rite Aid Corp.
Tranche 1 2nd Lien Term Loan(c)(j)
08/21/20 | | | 5.750 | % | | | 50,000 | | | | 50,469 | | |
TECHNOLOGY —% | |
Applied Systems, Inc.
2nd Lien Term Loan(c)(j)
01/24/22 | | | 7.500 | % | | | 7,000 | | | | 6,954 | | |
Riverbed Technology, Inc.
Term Loan(c)(j)
04/25/22 | | | 6.000 | % | | | 62,851 | | | | 62,825 | | |
Total Senior Loans
(Cost: $159,836) | | | 159,948 | | |
Money Market Funds 8.2%
| | | Shares | | Value ($) | |
Columbia Short-Term Cash Fund,
0.150%(f)(k) | | | 266,135,925 | | | | 266,135,925 | | |
Total Money Market Funds
(Cost: $266,135,925) | | | | | 266,135,925 | | |
Total Investments
(Cost: $3,041,520,121) | | | | | 3,315,831,777 | | |
Other Assets & Liabilities, Net | | | | | (54,513,441 | ) | |
Net Assets | | | | | 3,261,318,336 | | |
The accompanying Notes to Financial Statements are an integral part of this statement.
Annual Report 2015
24
PORTFOLIO OF INVESTMENTS (continued)
August 31, 2015
Notes to Portfolio of Investments
(a) Non-income producing investment.
(b) Security exempt from registration pursuant to Rule 144A under the Securities Act of 1933. This security may be resold in transactions exempt from registration, normally to qualified institutional buyers. At August 31, 2015, the value of these securities amounted to $128,370,836 or 3.94% of net assets.
(c) Variable rate security.
(d) Represents securities that have defaulted on payment of interest. The Fund has stopped accruing interest on these securities. At August 31, 2015, the value of these securities amounted to $13,750, which represents less then 0.01% of net assets.
(e) Security, or a portion thereof, has been purchased on a when-issued or delayed delivery basis.
(f) The rate shown is the seven-day current annualized yield at August 31, 2015.
(g) Identifies securities considered by the Investment Manager to be illiquid and may be difficult to sell. The aggregate value of such securities at August 31, 2015 was $2,292, which represents less then 0.01% of net assets. Information concerning such security holdings at August 31, 2015 is as follows:
Security Description | | Acquisition Dates | | Cost ($) | |
SACO I, Inc.
CMO Series 1995-1 Class A
09/25/24 0.000% | | 04/30/1999 - 12/20/2002 | | | 3,948 | | |
(h) Represents fair value as determined in good faith under procedures approved by the Board of Trustees. At August 31, 2015, the value of these securities amounted to $2,292, which represents less then 0.01% of net assets.
(i) Principal and interest may not be guaranteed by the government.
(j) Senior loans have interest rates that float periodically based primarily on the London Interbank Offered Rate ("LIBOR") and other short-term rates. The interest rate shown reflects the weighted average coupon as of August 31, 2015. The interest rate shown for senior loans purchased on a when-issued or delayed delivery basis, if any, reflects an estimated average coupon. Remaining maturities of senior loans may be less than the stated maturities shown as a result of contractual or optional prepayments by the borrower. Such prepayments cannot be predicted.
(k) As defined in the Investment Company Act of 1940, an affiliated company is one in which the Fund owns 5% or more of the company's outstanding voting securities, or a company which is under common ownership or control with the Fund. Holdings and transactions in these affiliated companies during the year ended August 31, 2015 are as follows:
Issuer | | Beginning
Cost ($) | | Purchase
Cost ($) | | Proceeds
From Sales ($) | | Ending
Cost ($) | | Dividends —
Affiliated
Issuers ($) | | Value ($) | |
Columbia Short-Term Cash Fund | | | 172,907,678 | | | | 1,262,966,909 | | | | (1,169,738,662 | ) | | | 266,135,925 | | | | 329,410 | | | | 266,135,925 | | |
Abbreviation Legend
ADR American Depositary Receipt
CMO Collateralized Mortgage Obligation
PIK Payment-in-Kind
Fair Value Measurements
The Fund categorizes its fair value measurements according to a three-level hierarchy that maximizes the use of observable inputs and minimizes the use of unobservable inputs by prioritizing that the most observable input be used when available. Observable inputs are those that market participants would use in pricing an investment based on market data obtained from sources independent of the reporting entity. Unobservable inputs are those that reflect the Fund's assumptions about the information market participants would use in pricing an investment. An investment's level within the fair value hierarchy is based on the lowest level of any input that is deemed significant to the asset's or liability's fair value measurement. The input levels are not necessarily an indication of the risk or liquidity associated with investments at that level. For example, certain U.S. government securities are generally high quality and liquid, however, they are reflected as Level 2 because the inputs used to determine fair value may not always be quoted prices in an active market.
The accompanying Notes to Financial Statements are an integral part of this statement.
Annual Report 2015
25
PORTFOLIO OF INVESTMENTS (continued)
August 31, 2015
Fair Value Measurements (continued)
Fair value inputs are summarized in the three broad levels listed below:
> Level 1 — Valuations based on quoted prices for investments in active markets that the Fund has the ability to access at the measurement date (including NAV for open-end mutual funds). Valuation adjustments are not applied to Level 1 investments.
> Level 2 — Valuations based on other significant observable inputs (including quoted prices for similar securities, interest rates, prepayment speeds, credit risks, etc.).
> Level 3 — Valuations based on significant unobservable inputs (including the Fund's own assumptions and judgment in determining the fair value of investments).
Inputs that are used in determining fair value of an investment may include price information, credit data, volatility statistics, and other factors. These inputs can be either observable or unobservable. The availability of observable inputs can vary between investments, and is affected by various factors such as the type of investment, and the volume and level of activity for that investment or similar investments in the marketplace. The inputs will be considered by the Investment Manager, along with any other relevant factors in the calculation of an investment's fair value. The Fund uses prices and inputs that are current as of the measurement date, which may include periods of market dislocations. During these periods, the availability of prices and inputs may be reduced for many investments. This condition could cause an investment to be reclassified between the various levels within the hierarchy.
Investments falling into the Level 3 category are primarily supported by quoted prices from brokers and dealers participating in the market for those investments. However, these may be classified as Level 3 investments due to lack of market transparency and corroboration to support these quoted prices. Additionally, valuation models may be used as the pricing source for any remaining investments classified as Level 3. These models may rely on one or more significant unobservable inputs and/or significant assumptions by the Investment Manager. Inputs used in valuations may include, but are not limited to, financial statement analysis, capital account balances, discount rates and estimated cash flows, and comparable company data.
Under the direction of the Fund's Board of Trustees (the Board), the Investment Manager's Valuation Committee (the Committee) is responsible for overseeing the valuation procedures approved by the Board. The Committee consists of voting and non-voting members from various groups within the Investment Manager's organization, including operations and accounting, trading and investments, compliance, risk management and legal.
The Committee meets at least monthly to review and approve valuation matters, which may include a description of specific valuation determinations, data regarding pricing information received from approved pricing vendors and brokers and the results of Board-approved valuation control policies and procedures (the Policies). The Policies address, among other things, instances when market quotations are or are not readily available, including recommendations of third party pricing vendors and a determination of appropriate pricing methodologies; events that require specific valuation determinations and assessment of fair value techniques; securities with a potential for stale pricing, including those that are illiquid, restricted, or in default; and the effectiveness of third party pricing vendors, including periodic reviews of vendors. The Committee meets more frequently, as needed, to discuss additional valuation matters, which may include the need to review back-testing results, review time-sensitive information or approve related valuation actions. The Committee reports to the Board, with members of the Committee meeting with the Board at each of its regularly scheduled meetings to discuss valuation matters and actions during the period, similar to those described earlier.
For investments categorized as Level 3, the Committee monitors information similar to that described above, which may include: (i) data specific to the issuer or comparable issuers, (ii) general market or specific sector news and (iii) quoted prices and specific or similar security transactions. The Committee considers this data and any changes from prior periods in order to assess the reasonableness of observable and unobservable inputs, any assumptions or internal models used to value those securities and changes in fair value. This data is also used to corroborate, when available, information received from approved pricing vendors and brokers. Various factors impact the frequency of monitoring this information (which may occur as often as daily). However, the Committee may determine that changes to inputs, assumptions and models are not required as a result of the monitoring procedures performed.
The accompanying Notes to Financial Statements are an integral part of this statement.
Annual Report 2015
26
PORTFOLIO OF INVESTMENTS (continued)
August 31, 2015
Fair Value Measurements (continued)
The following table is a summary of the inputs used to value the Fund's investments at August 31, 2015:
| | | Level 1
Quoted Prices in Active
Markets for Identical
Assets ($) | | Level 2
Other Significant
Observable Inputs ($) | | Level 3
Significant
Unobservable Inputs ($) | | Total ($) | |
Investments | |
Common Stocks | |
Consumer Discretionary | | | 218,040,302 | | | | — | | | | — | | | | 218,040,302 | | |
Consumer Staples | | | 157,633,610 | | | | — | | | | — | | | | 157,633,610 | | |
Energy | | | 138,237,276 | | | | — | | | | — | | | | 138,237,276 | | |
Financials | | | 365,020,748 | | | | — | | | | — | | | | 365,020,748 | | |
Health Care | | | 316,401,320 | | | | — | | | | — | | | | 316,401,320 | | |
Industrials | | | 231,013,069 | | | | — | | | | — | | | | 231,013,069 | | |
Information Technology | | | 440,339,986 | | | | — | | | | — | | | | 440,339,986 | | |
Materials | | | 11,154,624 | | | | — | | | | — | | | | 11,154,624 | | |
Telecommunication Services | | | 54,547,110 | | | | — | | | | — | | | | 54,547,110 | | |
Utilities | | | 38,047,527 | | | | — | | | | — | | | | 38,047,527 | | |
Total Common Stocks | | | 1,970,435,572 | | | | — | | | | — | | | | 1,970,435,572 | | |
Corporate Bonds & Notes | | | — | | | | 370,686,958 | | | | — | | | | 370,686,958 | | |
Residential Mortgage-Backed
Securities — Agency | | | — | | | | 287,287,753 | | | | — | | | | 287,287,753 | | |
Residential Mortgage-Backed
Securities — Non-Agency | | | — | | | | 5,251,176 | | | | 2,292 | | | | 5,253,468 | | |
Commercial Mortgage-Backed
Securities — Agency | | | — | | | | 108,960,497 | | | | — | | | | 108,960,497 | | |
Commercial Mortgage-Backed
Securities — Non-Agency | | | — | | | | 98,152,588 | | | | — | | | | 98,152,588 | | |
Asset-Backed Securities —
Non-Agency | | | — | | | | 52,164,912 | | | | — | | | | 52,164,912 | | |
Inflation-Indexed Bonds | | | — | | | | 20,105,143 | | | | — | | | | 20,105,143 | | |
U.S. Treasury Obligations | | | 114,435,929 | | | | — | | | | — | | | | 114,435,929 | | |
Foreign Government Obligations | | | — | | | | 17,732,632 | | | | — | | | | 17,732,632 | | |
Municipal Bonds | | | — | | | | 4,320,452 | | | | — | | | | 4,320,452 | | |
Senior Loans | | | — | | | | 159,948 | | | | — | | | | 159,948 | | |
Money Market Funds | | | — | | | | 266,135,925 | | | | — | | | | 266,135,925 | | |
Total Investments | | | 2,084,871,501 | | | | 1,230,957,984 | | | | 2,292 | | | | 3,315,831,777 | | |
See the Portfolio of Investments for all investment classifications not indicated in the table.
The Fund's assets assigned to the Level 2 input category are generally valued using the market approach, in which a security's value is determined through reference to prices and information from market transactions for similar or identical assets.
Financial assets were transferred from Level 1 to Level 2 as the market for these assets is not considered publicly available. Fund per share market values were obtained using observable market inputs.
The accompanying Notes to Financial Statements are an integral part of this statement.
Annual Report 2015
27
PORTFOLIO OF INVESTMENTS (continued)
August 31, 2015
Fair Value Measurements (continued)
The following table shows transfers between Level 1 and Level 2 of the fair value hierarchy:
Transfers In | | Transfers Out | |
| Level 1 ($) | | Level 2 ($) | | Level 1 ($) | | Level 2 ($) | |
| | — | | | | 172,907,678 | | | | 172,907,678 | | | | — | | |
Transfers between Level 1 and Level 2 are determined based on the fair value at the beginning of the period for security positions held throughout the period.
The Fund does not hold any significant investments (greater than one percent of net assets) categorized as Level 3.
The Fund's assets assigned to the Level 3 category are valued utilizing the valuation technique deemed the most appropriate in the circumstances. Certain residential mortgage-backed securities classified as Level 3 securities are valued using the market approach. To determine fair value for these securities, management considered various factors which may have included, but were not limited to, estimated cash flows of the securities, discount rates observed in the market for similar assets as well as observed yields on securities management deemed comparable. Significant increases (decreases) to any of these inputs would result in a significantly lower (higher) fair value measurement. Generally, a change in observable yields on comparable securities would result in a directionally similar change to discount rates.
Financial assets were transferred from Level 3 to Level 2 as observable market inputs were utilized and management determination that there was sufficient, reliable and observable market data to value these assets as of period end.
Transfers In | | Transfers Out | |
| Level 2 ($) | | Level 3 ($) | | Level 2 ($) | | Level 3 ($) | |
| | 39,775 | | | | — | | | | — | | | | 39,775 | | |
Transfers in and/or out of Level 3 are determined based on the fair value at the beginning of the period for security positions held throughout the period.
The accompanying Notes to Financial Statements are an integral part of this statement.
Annual Report 2015
28
STATEMENT OF ASSETS AND LIABILITIES
August 31, 2015
Assets | |
Investments, at value | |
Unaffiliated issuers (identified cost $2,775,384,196) | | $ | 3,049,695,852 | | |
Affiliated issuers (identified cost $266,135,925) | | | 266,135,925 | | |
Total investments (identified cost $3,041,520,121) | | | 3,315,831,777 | | |
Receivable for: | |
Investments sold | | | 17,393,937 | | |
Investments sold on a delayed delivery basis | | | 16,857,228 | | |
Capital shares sold | | | 17,331,069 | | |
Dividends | | | 3,533,183 | | |
Interest | | | 5,860,513 | | |
Foreign tax reclaims | | | 21,444 | | |
Prepaid expenses | | | 30,622 | | |
Trustees' deferred compensation plan | | | 58,306 | | |
Other assets | | | 3,553 | | |
Total assets | | | 3,376,921,632 | | |
Liabilities | |
Payable for: | |
Investments purchased | | | 15,721,073 | | |
Investments purchased on a delayed delivery basis | | | 94,023,755 | | |
Capital shares purchased | | | 4,933,025 | | |
Investment management fees | | | 151,259 | | |
Distribution and/or service fees | | | 91,467 | | |
Transfer agent fees | | | 435,076 | | |
Administration fees | | | 13,834 | | |
Plan administration fees | | | 5,085 | | |
Compensation of board members | | | 3,063 | | |
Chief compliance officer expenses | | | 237 | | |
Other expenses | | | 167,116 | | |
Trustees' deferred compensation plan | | | 58,306 | | |
Total liabilities | | | 115,603,296 | | |
Net assets applicable to outstanding capital stock | | $ | 3,261,318,336 | | |
Represented by | |
Paid-in capital | | $ | 2,898,698,172 | | |
Undistributed net investment income | | | 29,776,070 | | |
Accumulated net realized gain | | | 58,532,438 | | |
Unrealized appreciation (depreciation) on: | |
Investments | | | 274,311,656 | | |
Total — representing net assets applicable to outstanding capital stock | | $ | 3,261,318,336 | | |
The accompanying Notes to Financial Statements are an integral part of this statement.
Annual Report 2015
29
STATEMENT OF ASSETS AND LIABILITIES (continued)
August 31, 2015
Class A | |
Net assets | | $ | 1,885,537,697 | | |
Shares outstanding | | | 52,668,829 | | |
Net asset value per share | | $ | 35.80 | | |
Maximum offering price per share(a) | | $ | 37.98 | | |
Class B | |
Net assets | | $ | 8,833,824 | | |
Shares outstanding | | | 247,678 | | |
Net asset value per share | | $ | 35.67 | | |
Class C | |
Net assets | | $ | 612,243,050 | | |
Shares outstanding | | | 17,158,683 | | |
Net asset value per share | | $ | 35.68 | | |
Class K | |
Net assets | | $ | 22,260,317 | | |
Shares outstanding | | | 622,727 | | |
Net asset value per share | | $ | 35.75 | | |
Class R | |
Net assets | | $ | 37,089,044 | | |
Shares outstanding | | | 1,036,206 | | |
Net asset value per share | | $ | 35.79 | | |
Class R4 | |
Net assets | | $ | 38,489,409 | | |
Shares outstanding | | | 1,067,500 | | |
Net asset value per share | | $ | 36.06 | | |
Class R5 | |
Net assets | | $ | 110,945,549 | | |
Shares outstanding | | | 3,100,804 | | |
Net asset value per share | | $ | 35.78 | | |
Class Y | |
Net assets | | $ | 65,757,621 | | |
Shares outstanding | | | 1,823,042 | | |
Net asset value per share | | $ | 36.07 | | |
Class Z | |
Net assets | | $ | 480,161,825 | | |
Shares outstanding | | | 13,431,859 | | |
Net asset value per share | | $ | 35.75 | | |
(a) The maximum offering price per share is calculated by dividing the net asset value per share by 1.0 minus the maximum sales charge of 5.75%.
The accompanying Notes to Financial Statements are an integral part of this statement.
Annual Report 2015
30
STATEMENT OF OPERATIONS
Year Ended August 31, 2015
Net investment income | |
Income: | |
Dividends — unaffiliated issuers | | $ | 63,319,340 | | |
Dividends — affiliated issuers | | | 329,410 | | |
Interest | | | 20,586,148 | | |
Foreign taxes withheld | | | (136,842 | ) | |
Total income | | | 84,098,056 | | |
Expenses: | |
Investment management fees | | | 15,376,747 | | |
Distribution and/or service fees | |
Class A | | | 4,024,551 | | |
Class B | | | 113,152 | | |
Class C | | | 4,428,389 | | |
Class R | | | 137,826 | | |
Transfer agent fees | |
Class A | | | 2,434,449 | | |
Class B | | | 17,109 | | |
Class C | | | 669,992 | | |
Class K | | | 11,942 | | |
Class R | | | 41,705 | | |
Class R4 | | | 47,401 | | |
Class R5 | | | 40,765 | | |
Class Z | | | 634,378 | | |
Administration fees | | | 1,412,144 | | |
Plan administration fees | |
Class K | | | 59,712 | | |
Compensation of board members | | | 64,453 | | |
Custodian fees | | | 50,324 | | |
Printing and postage fees | | | 233,448 | | |
Registration fees | | | 252,863 | | |
Professional fees | | | 116,344 | | |
Chief compliance officer expenses | | | 1,297 | | |
Other | | | 55,175 | | |
Total expenses | | | 30,224,166 | | |
Expense reductions | | | (2,583 | ) | |
Total net expenses | | | 30,221,583 | | |
Net investment income | | | 53,876,473 | | |
Realized and unrealized gain (loss) — net | |
Net realized gain (loss) on: | |
Investments | | | 79,696,603 | | |
Foreign currency translations | | | (4,404 | ) | |
Futures contracts | | | (28,921 | ) | |
Net realized gain | | | 79,663,278 | | |
Net change in unrealized appreciation (depreciation) on: | |
Investments | | | (126,070,757 | ) | |
Futures contracts | | | 25,549 | | |
Net change in unrealized depreciation | | | (126,045,208 | ) | |
Net realized and unrealized loss | | | (46,381,930 | ) | |
Net increase in net assets resulting from operations | | $ | 7,494,543 | | |
The accompanying Notes to Financial Statements are an integral part of this statement.
Annual Report 2015
31
STATEMENT OF CHANGES IN NET ASSETS
| | | Year Ended
August 31,
2015 | | Year Ended
August 31,
2014 | |
Operations | |
Net investment income | | $ | 53,876,473 | | | $ | 16,679,443 | | |
Net realized gain | | | 79,663,278 | | | | 123,328,431 | | |
Net change in unrealized appreciation (depreciation) | | | (126,045,208 | ) | | | 152,115,360 | | |
Net increase in net assets resulting from operations | | | 7,494,543 | | | | 292,123,234 | | |
Distributions to shareholders | |
Net investment income | |
Class A | | | (17,583,657 | ) | | | (10,145,453 | ) | |
Class B | | | (42,723 | ) | | | (17,023 | ) | |
Class C | | | (2,170,594 | ) | | | (294,362 | ) | |
Class K | | | (279,351 | ) | | | (227,333 | ) | |
Class R | | | (235,751 | ) | | | (104,635 | ) | |
Class R4 | | | (405,564 | ) | | | (102,651 | ) | |
Class R5 | | | (1,182,676 | ) | | | (499,676 | ) | |
Class Y | | | (464,225 | ) | | | (172,558 | ) | |
Class Z | | | (5,540,058 | ) | | | (3,679,726 | ) | |
Net realized gains | |
Class A | | | (51,318,940 | ) | | | — | | |
Class B | | | (436,395 | ) | | | — | | |
Class C | | | (12,484,969 | ) | | | — | | |
Class K | | | (829,944 | ) | | | — | | |
Class R | | | (829,019 | ) | | | — | | |
Class R4 | | | (869,521 | ) | | | — | | |
Class R5 | | | (1,893,151 | ) | | | — | | |
Class Y | | | (936,890 | ) | | | — | | |
Class Z | | | (13,624,282 | ) | | | — | | |
Total distributions to shareholders | | | (111,127,710 | ) | | | (15,243,417 | ) | |
Increase in net assets from capital stock activity | | | 1,222,955,848 | | | | 273,518,577 | | |
Increase from payment by affiliate (Note 6) | | | — | | | | 243,303 | | |
Total increase in net assets | | | 1,119,322,681 | | | | 550,641,697 | | |
Net assets at beginning of year | | | 2,141,995,655 | | | | 1,591,353,958 | | |
Net assets at end of year | | $ | 3,261,318,336 | | | $ | 2,141,995,655 | | |
Undistributed net investment income | | $ | 29,776,070 | | | $ | 3,703,421 | | |
The accompanying Notes to Financial Statements are an integral part of this statement.
Annual Report 2015
32
STATEMENT OF CHANGES IN NET ASSETS (continued)
| | | Year Ended August 31, 2015 | | Year Ended August 31, 2014 | |
| | | Shares | | Dollars ($) | | Shares | | Dollars ($) | |
Capital stock activity | |
Class A shares | |
Subscriptions(a) | | | 23,044,574 | | | | 849,143,615 | | | | 9,917,748 | | | | 341,351,085 | | |
Distributions reinvested | | | 1,755,826 | | | | 63,595,896 | | | | 266,155 | | | | 9,181,368 | | |
Redemptions | | | (8,445,175 | ) | | | (310,953,059 | ) | | | (5,106,180 | ) | | | (177,103,822 | ) | |
Net increase | | | 16,355,225 | | | | 601,786,452 | | | | 5,077,723 | | | | 173,428,631 | | |
Class B shares | |
Subscriptions | | | 88,902 | | | | 3,259,026 | | | | 106,482 | | | | 3,635,445 | | |
Distributions reinvested | | | 12,310 | | | | 443,459 | | | | 447 | | | | 15,498 | | |
Redemptions(a) | | | (192,301 | ) | | | (7,050,415 | ) | | | (153,234 | ) | | | (5,285,378 | ) | |
Net decrease | | | (91,089 | ) | | | (3,347,930 | ) | | | (46,305 | ) | | | (1,634,435 | ) | |
Class C shares | |
Subscriptions | | | 10,211,580 | | | | 375,103,625 | | | | 4,040,423 | | | | 139,283,691 | | |
Distributions reinvested | | | 363,462 | | | | 13,124,747 | | | | 7,468 | | | | 260,258 | | |
Redemptions | | | (1,423,591 | ) | | | (52,266,510 | ) | | | (751,921 | ) | | | (26,065,253 | ) | |
Net increase | | | 9,151,451 | | | | 335,961,862 | | | | 3,295,970 | | | | 113,478,696 | | |
Class K shares | |
Subscriptions | | | 94,952 | | | | 3,466,998 | | | | 385,555 | | | | 13,262,953 | | |
Distributions reinvested | | | 30,677 | | | | 1,108,787 | | | | 6,652 | | | | 227,269 | | |
Redemptions | | | (133,353 | ) | | | (4,891,086 | ) | | | (1,976,240 | ) | | | (64,732,285 | ) | |
Net decrease | | | (7,724 | ) | | | (315,301 | ) | | | (1,584,033 | ) | | | (51,242,063 | ) | |
Class R shares | |
Subscriptions | | | 797,090 | | | | 29,364,631 | | | | 341,923 | | | | 11,863,573 | | |
Distributions reinvested | | | 21,236 | | | | 768,655 | | | | 2,517 | | | | 86,913 | | |
Redemptions | | | (361,624 | ) | | | (13,361,380 | ) | | | (177,088 | ) | | | (6,154,741 | ) | |
Net increase | | | 456,702 | | | | 16,771,906 | | | | 167,352 | | | | 5,795,745 | | |
Class R4 shares | |
Subscriptions | | | 868,563 | | | | 32,087,299 | | | | 417,642 | | | | 14,594,294 | | |
Distributions reinvested | | | 29,517 | | | | 1,078,665 | | | | 1,722 | | | | 60,808 | | |
Redemptions | | | (249,090 | ) | | | (9,255,556 | ) | | | (110,599 | ) | | | (3,941,817 | ) | |
Net increase | | | 648,990 | | | | 23,910,408 | | | | 308,765 | | | | 10,713,285 | | |
Class R5 shares | |
Subscriptions | | | 2,250,236 | | | | 82,589,442 | | | | 534,624 | | | | 18,323,902 | | |
Distributions reinvested | | | 84,668 | | | | 3,075,827 | | | | 14,489 | | | | 499,612 | | |
Redemptions | | | (527,586 | ) | | | (19,297,513 | ) | | | (187,080 | ) | | | (6,480,424 | ) | |
Net increase | | | 1,807,318 | | | | 66,367,756 | | | | 362,033 | | | | 12,343,090 | | |
The accompanying Notes to Financial Statements are an integral part of this statement.
Annual Report 2015
33
STATEMENT OF CHANGES IN NET ASSETS (continued)
| | | Year Ended August 31, 2015 | | Year Ended August 31, 2014 | |
| | | Shares | | Dollars ($) | | Shares | | Dollars ($) | |
Capital stock activity (continued) | |
Class Y shares | |
Subscriptions | | | 1,537,795 | | | | 57,194,044 | | | | 206,084 | | | | 7,051,149 | | |
Distributions reinvested | | | 38,339 | | | | 1,401,115 | | | | 4,974 | | | | 172,529 | | |
Redemptions | | | (211,982 | ) | | | (7,879,818 | ) | | | (57,518 | ) | | | (1,993,216 | ) | |
Net increase | | | 1,364,152 | | | | 50,715,341 | | | | 153,540 | | | | 5,230,462 | | |
Class Z shares | |
Subscriptions | | | 6,092,718 | | | | 223,848,477 | | | | 2,412,087 | | | | 83,264,768 | | |
Distributions reinvested | | | 437,899 | | | | 15,841,211 | | | | 88,114 | | | | 3,028,323 | | |
Redemptions | | | (2,959,328 | ) | | | (108,584,334 | ) | | | (2,359,519 | ) | | | (80,887,925 | ) | |
Net increase | | | 3,571,289 | | | | 131,105,354 | | | | 140,682 | | | | 5,405,166 | | |
Total net increase | | | 33,256,314 | | | | 1,222,955,848 | | | | 7,875,727 | | | | 273,518,577 | | |
(a) Includes conversions of Class B shares to Class A shares, if any.
The accompanying Notes to Financial Statements are an integral part of this statement.
Annual Report 2015
34
The following tables are intended to help you understand the Fund's financial performance. Certain information reflects financial results for a single share of a class held for the periods shown. Per share net investment income (loss) amounts are calculated based on average shares outstanding during the period. Total return assumes reinvestment of all dividends and distributions, if any. Total return does not reflect payment of sales charges, if any. Total return and portfolio turnover are not annualized for periods of less than one year. The portfolio turnover rate is calculated without regard to purchase and sales transactions of short-term instruments and certain derivatives, if any. If such transactions were included, the Fund's portfolio turnover rate may be higher.
| | | Year Ended August 31, | |
Class A | | 2015 | | 2014 | | 2013 | | 2012 | | 2011 | |
Per share data | |
Net asset value, beginning of period | | $ | 37.01 | | | $ | 31.83 | | | $ | 28.21 | | | $ | 26.06 | | | $ | 23.29 | | |
Income from investment operations: | |
Net investment income | | | 0.75 | (d) | | | 0.32 | | | | 0.28 | | | | 0.33 | | | | 0.37 | | |
Net realized and unrealized gain (loss) | | | (0.23 | ) | | | 5.16 | | | | 3.64 | | | | 2.97 | | | | 2.79 | | |
Total from investment operations | | | 0.52 | | | | 5.48 | | | | 3.92 | | | | 3.30 | | | | 3.16 | | |
Less distributions to shareholders: | |
Net investment income | | | (0.40 | ) | | | (0.30 | ) | | | (0.30 | ) | | | (0.34 | ) | | | (0.39 | ) | |
Net realized gains | | | (1.33 | ) | | | — | | | | — | | | | (0.81 | ) | | | — | | |
Total distributions to shareholders | | | (1.73 | ) | | | (0.30 | ) | | | (0.30 | ) | | | (1.15 | ) | | | (0.39 | ) | |
Net asset value, end of period | | $ | 35.80 | | | $ | 37.01 | | | $ | 31.83 | | | $ | 28.21 | | | $ | 26.06 | | |
Total return | | | 1.38 | % | | | 17.29 | % | | | 13.97 | % | | | 13.14 | % | | | 13.57 | % | |
Ratios to average net assets(a) | |
Total gross expenses | | | 1.06 | % | | | 1.09 | % | | | 1.14 | % | | | 1.16 | % | | | 1.10 | % | |
Total net expenses(b) | | | 1.06 | %(c) | | | 1.09 | %(c) | | | 1.13 | %(c) | | | 1.11 | %(c) | | | 1.03 | %(c) | |
Net investment income | | | 2.03 | % | | | 0.94 | % | | | 0.91 | % | | | 1.24 | % | | | 1.38 | % | |
Supplemental data | |
Net assets, end of period (in thousands) | | $ | 1,885,538 | | | $ | 1,344,071 | | | $ | 994,163 | | | $ | 774,214 | | | $ | 657,604 | | |
Portfolio turnover | | | 102 | % | | | 109 | % | | | 141 | % | | | 130 | % | | | 99 | % | |
Notes to Financial Highlights
(a) In addition to the fees and expenses that the Fund bears directly, the Fund indirectly bears a pro rata share of the fees and expenses of any other funds in which it invests. Such indirect expenses are not included in the Fund's reported expense ratios.
(b) Total net expenses include the impact of certain fee waivers/expense reimbursements made by the Investment Manager and certain of its affiliates, if applicable.
(c) The benefits derived from expense reductions had an impact of less than 0.01%.
(d) Net investment income per share includes special dividends. The effect of these dividends amounted to $0.48 per share.
The accompanying Notes to Financial Statements are an integral part of this statement.
Annual Report 2015
35
FINANCIAL HIGHLIGHTS (continued)
| | | Year Ended August 31, | |
Class B | | 2015 | | 2014 | | 2013 | | 2012 | | 2011 | |
Per share data | |
Net asset value, beginning of period | | $ | 36.91 | | | $ | 31.75 | | | $ | 28.15 | | | $ | 26.00 | | | $ | 23.24 | | |
Income from investment operations: | |
Net investment income | | | 0.30 | (d) | | | 0.06 | | | | 0.05 | | | | 0.13 | | | | 0.17 | | |
Net realized and unrealized gain (loss) | | | (0.06 | ) | | | 5.15 | | | | 3.63 | | | | 2.97 | | | | 2.78 | | |
Total from investment operations | | | 0.24 | | | | 5.21 | | | | 3.68 | | | | 3.10 | | | | 2.95 | | |
Less distributions to shareholders: | |
Net investment income | | | (0.15 | ) | | | (0.05 | ) | | | (0.08 | ) | | | (0.14 | ) | | | (0.19 | ) | |
Net realized gains | | | (1.33 | ) | | | — | | | | — | | | | (0.81 | ) | | | — | | |
Total distributions to shareholders | | | (1.48 | ) | | | (0.05 | ) | | | (0.08 | ) | | | (0.95 | ) | | | (0.19 | ) | |
Net asset value, end of period | | $ | 35.67 | | | $ | 36.91 | | | $ | 31.75 | | | $ | 28.15 | | | $ | 26.00 | | |
Total return | | | 0.63 | % | | | 16.40 | % | | | 13.12 | % | | | 12.30 | % | | | 12.71 | % | |
Ratios to average net assets(a) | |
Total gross expenses | | | 1.81 | % | | | 1.84 | % | | | 1.89 | % | | | 1.91 | % | | | 1.84 | % | |
Total net expenses(b) | | | 1.81 | %(c) | | | 1.84 | %(c) | | | 1.88 | %(c) | | | 1.86 | %(c) | | | 1.78 | %(c) | |
Net investment income | | | 0.82 | % | | | 0.18 | % | | | 0.16 | % | | | 0.49 | % | | | 0.64 | % | |
Supplemental data | |
Net assets, end of period (in thousands) | | $ | 8,834 | | | $ | 12,504 | | | $ | 12,225 | | | $ | 11,910 | | | $ | 14,227 | | |
Portfolio turnover | | | 102 | % | | | 109 | % | | | 141 | % | | | 130 | % | | | 99 | % | |
Notes to Financial Highlights
(a) In addition to the fees and expenses that the Fund bears directly, the Fund indirectly bears a pro rata share of the fees and expenses of any other funds in which it invests. Such indirect expenses are not included in the Fund's reported expense ratios.
(b) Total net expenses include the impact of certain fee waivers/expense reimbursements made by the Investment Manager and certain of its affiliates, if applicable.
(c) The benefits derived from expense reductions had an impact of less than 0.01%.
(d) Net investment income per share includes special dividends. The effect of these dividends amounted to $0.32 per share.
The accompanying Notes to Financial Statements are an integral part of this statement.
Annual Report 2015
36
FINANCIAL HIGHLIGHTS (continued)
| | | Year Ended August 31, | |
Class C | | 2015 | | 2014 | | 2013 | | 2012 | | 2011 | |
Per share data | |
Net asset value, beginning of period | | $ | 36.92 | | | $ | 31.75 | | | $ | 28.15 | | | $ | 25.99 | | | $ | 23.24 | | |
Income from investment operations: | |
Net investment income | | | 0.56 | (e) | | | 0.07 | | | | 0.05 | | | | 0.13 | | | | 0.17 | | |
Net realized and unrealized gain (loss) | | | (0.32 | ) | | | 5.14 | | | | 3.63 | | | | 2.98 | | | | 2.77 | | |
Total from investment operations | | | 0.24 | | | | 5.21 | | | | 3.68 | | | | 3.11 | | | | 2.94 | | |
Less distributions to shareholders: | |
Net investment income | | | (0.15 | ) | | | (0.05 | ) | | | (0.08 | ) | | | (0.14 | ) | | | (0.19 | ) | |
Net realized gains | | | (1.33 | ) | | | — | | | | — | | | | (0.81 | ) | | | — | | |
Total distributions to shareholders | | | (1.48 | ) | | | (0.05 | ) | | | (0.08 | ) | | | (0.95 | ) | | | (0.19 | ) | |
Increase from payment by affiliate | | | — | | | | 0.01 | | | | — | | | | — | | | | — | | |
Net asset value, end of period | | $ | 35.68 | | | $ | 36.92 | | | $ | 31.75 | | | $ | 28.15 | | | $ | 25.99 | | |
Total return | | | 0.63 | % | | | 16.44 | %(a) | | | 13.12 | % | | | 12.34 | % | | | 12.67 | % | |
Ratios to average net assets(b) | |
Total gross expenses | | | 1.81 | % | | | 1.84 | % | | | 1.89 | % | | | 1.91 | % | | | 1.84 | % | |
Total net expenses(c) | | | 1.81 | %(d) | | | 1.84 | %(d) | | | 1.88 | %(d) | | | 1.86 | %(d) | | | 1.79 | %(d) | |
Net investment income | | | 1.52 | % | | | 0.19 | % | | | 0.16 | % | | | 0.50 | % | | | 0.62 | % | |
Supplemental data | |
Net assets, end of period (in thousands) | | $ | 612,243 | | | $ | 295,665 | | | $ | 149,581 | | | $ | 74,771 | | | $ | 48,236 | | |
Portfolio turnover | | | 102 | % | | | 109 | % | | | 141 | % | | | 130 | % | | | 99 | % | |
Notes to Financial Highlights
(a) The Fund received a payment from an affiliate. Had the Fund not received this payment, the total return would have been lower by 0.03%.
(b) In addition to the fees and expenses that the Fund bears directly, the Fund indirectly bears a pro rata share of the fees and expenses of any other funds in which it invests. Such indirect expenses are not included in the Fund's reported expense ratios.
(c) Total net expenses include the impact of certain fee waivers/expense reimbursements made by the Investment Manager and certain of its affiliates, if applicable.
(d) The benefits derived from expense reductions had an impact of less than 0.01%.
(e) Net investment income per share includes special dividends. The effect of these dividends amounted to $0.56 per share.
The accompanying Notes to Financial Statements are an integral part of this statement.
Annual Report 2015
37
FINANCIAL HIGHLIGHTS (continued)
| | | Year Ended August 31, | |
Class K | | 2015 | | 2014 | | 2013 | | 2012 | | 2011(a) | |
Per share data | |
Net asset value, beginning of period | | $ | 36.96 | | | $ | 31.80 | | | $ | 28.18 | | | $ | 26.02 | | | $ | 27.16 | | |
Income from investment operations: | |
Net investment income | | | 0.69 | (g) | | | 0.35 | | | | 0.31 | | | | 0.35 | | | | 0.18 | | |
Net realized and unrealized gain (loss) | | | (0.13 | ) | | | 5.15 | | | | 3.64 | | | | 2.98 | | | | (1.15 | )(b) | |
Total from investment operations | | | 0.56 | | | | 5.50 | | | | 3.95 | | | | 3.33 | | | | (0.97 | ) | |
Less distributions to shareholders: | |
Net investment income | | | (0.44 | ) | | | (0.34 | ) | | | (0.33 | ) | | | (0.36 | ) | | | (0.17 | ) | |
Net realized gains | | | (1.33 | ) | | | — | | | | — | | | | (0.81 | ) | | | — | | |
Total distributions to shareholders | | | (1.77 | ) | | | (0.34 | ) | | | (0.33 | ) | | | (1.17 | ) | | | (0.17 | ) | |
Net asset value, end of period | | $ | 35.75 | | | $ | 36.96 | | | $ | 31.80 | | | $ | 28.18 | | | $ | 26.02 | | |
Total return | | | 1.49 | % | | | 17.39 | % | | | 14.11 | % | | | 13.26 | % | | | (3.59 | %) | |
Ratios to average net assets(c) | |
Total gross expenses | | | 0.95 | % | | | 0.97 | % | | | 1.01 | % | | | 1.03 | % | | | 1.02 | %(d) | |
Total net expenses(e) | | | 0.95 | % | | | 0.97 | % | | | 1.01 | % | | | 1.03 | % | | | 1.02 | %(d)(f) | |
Net investment income | | | 1.86 | % | | | 1.00 | % | | | 1.02 | % | | | 1.32 | % | | | 1.40 | %(d) | |
Supplemental data | |
Net assets, end of period (in thousands) | | $ | 22,260 | | | $ | 23,303 | | | $ | 70,411 | | | $ | 60,735 | | | $ | 48,799 | | |
Portfolio turnover | | | 102 | % | | | 109 | % | | | 141 | % | | | 130 | % | | | 99 | % | |
Notes to Financial Highlights
(a) Based on operations from March 7, 2011 (commencement of operations) through the stated period end.
(b) Calculation of the net gain (loss) per share (both realized and unrealized) does not correlate to the aggregate realized and unrealized gain (loss) presented in the Statement of Operations due to the timing of subscriptions and redemptions of Fund shares in relation to fluctuations in the market value of the portfolio.
(c) In addition to the fees and expenses that the Fund bears directly, the Fund indirectly bears a pro rata share of the fees and expenses of any other funds in which it invests. Such indirect expenses are not included in the Fund's reported expense ratios.
(d) Annualized.
(e) Total net expenses include the impact of certain fee waivers/expense reimbursements made by the Investment Manager and certain of its affiliates, if applicable.
(f) The benefits derived from expense reductions had an impact of less than 0.01%.
(g) Net investment income per share includes special dividends. The effect of these dividends amounted to $0.39 per share.
The accompanying Notes to Financial Statements are an integral part of this statement.
Annual Report 2015
38
FINANCIAL HIGHLIGHTS (continued)
| | | Year Ended August 31, | |
Class R | | 2015 | | 2014 | | 2013 | | 2012 | | 2011(a) | |
Per share data | |
Net asset value, beginning of period | | $ | 37.01 | | | $ | 31.82 | | | $ | 28.19 | | | $ | 26.04 | | | $ | 24.62 | | |
Income from investment operations: | |
Net investment income | �� | | 0.73 | (g) | | | 0.24 | | | | 0.20 | | | | 0.27 | | | | 0.30 | | |
Net realized and unrealized gain (loss) | | | (0.31 | ) | | | 5.15 | | | | 3.65 | | | | 2.97 | | | | 1.35 | | |
Total from investment operations | | | 0.42 | | | | 5.39 | | | | 3.85 | | | | 3.24 | | | | 1.65 | | |
Less distributions to shareholders: | |
Net investment income | | | (0.31 | ) | | | (0.21 | ) | | | (0.22 | ) | | | (0.28 | ) | | | (0.23 | ) | |
Net realized gains | | | (1.33 | ) | | | — | | | | — | | | | (0.81 | ) | | | — | | |
Total distributions to shareholders | | | (1.64 | ) | | | (0.21 | ) | | | (0.22 | ) | | | (1.09 | ) | | | (0.23 | ) | |
Increase from payment by affiliate | | | — | | | | 0.01 | | | | — | | | | — | | | | — | | |
Net asset value, end of period | | $ | 35.79 | | | $ | 37.01 | | | $ | 31.82 | | | $ | 28.19 | | | $ | 26.04 | | |
Total return | | | 1.10 | % | | | 17.04 | %(b) | | | 13.73 | % | | | 12.87 | % | | | 6.70 | % | |
Ratios to average net assets(c) | |
Total gross expenses | | | 1.31 | % | | | 1.34 | % | | | 1.39 | % | | | 1.42 | % | | | 1.37 | %(d) | |
Total net expenses(e) | | | 1.31 | %(f) | | | 1.34 | %(f) | | | 1.38 | %(f) | | | 1.36 | %(f) | | | 1.28 | %(d)(f) | |
Net investment income | | | 1.97 | % | | | 0.69 | % | | | 0.64 | % | | | 1.01 | % | | | 1.20 | %(d) | |
Supplemental data | |
Net assets, end of period (in thousands) | | $ | 37,089 | | | $ | 21,445 | | | $ | 13,113 | | | $ | 2,740 | | | $ | 457 | | |
Portfolio turnover | | | 102 | % | | | 109 | % | | | 141 | % | | | 130 | % | | | 99 | % | |
Notes to Financial Highlights
(a) Based on operations from September 27, 2010 (commencement of operations) through the stated period end.
(b) The Fund received a payment from an affiliate. Had the Fund not received this payment, the total return would have been lower by 0.03%.
(c) In addition to the fees and expenses that the Fund bears directly, the Fund indirectly bears a pro rata share of the fees and expenses of any other funds in which it invests. Such indirect expenses are not included in the Fund's reported expense ratios.
(d) Annualized.
(e) Total net expenses include the impact of certain fee waivers/expense reimbursements made by the Investment Manager and certain of its affiliates, if applicable.
(f) The benefits derived from expense reductions had an impact of less than 0.01%.
(g) Net investment income per share includes special dividends. The effect of these dividends amounted to $0.55 per share.
The accompanying Notes to Financial Statements are an integral part of this statement.
Annual Report 2015
39
FINANCIAL HIGHLIGHTS (continued)
| | | Year Ended August 31, | |
Class R4 | | 2015 | | 2014 | | 2013(a) | |
Per share data | |
Net asset value, beginning of period | | $ | 37.27 | | | $ | 32.03 | | | $ | 28.25 | | |
Income from investment operations: | |
Net investment income | | | 0.88 | (g) | | | 0.42 | | | | 0.29 | | |
Net realized and unrealized gain (loss) | | | (0.27 | ) | | | 5.18 | | | | 3.76 | | |
Total from investment operations | | | 0.61 | | | | 5.60 | | | | 4.05 | | |
Less distributions to shareholders: | |
Net investment income | | | (0.49 | ) | | | (0.38 | ) | | | (0.27 | ) | |
Net realized gains | | | (1.33 | ) | | | — | | | | — | | |
Total distributions to shareholders | | | (1.82 | ) | | | (0.38 | ) | | | (0.27 | ) | |
Increase from payment by affiliate | | | — | | | | 0.02 | | | | — | | |
Net asset value, end of period | | $ | 36.06 | | | $ | 37.27 | | | $ | 32.03 | | |
Total return | | | 1.62 | % | | | 17.64 | %(b) | | | 14.40 | % | |
Ratios to average net assets(c) | |
Total gross expenses | | | 0.81 | % | | | 0.84 | % | | | 0.88 | %(d) | |
Total net expenses(e) | | | 0.81 | %(f) | | | 0.84 | %(f) | | | 0.88 | %(d)(f) | |
Net investment income | | | 2.37 | % | | | 1.21 | % | | | 1.14 | %(d) | |
Supplemental data | |
Net assets, end of period (in thousands) | | $ | 38,489 | | | $ | 15,596 | | | $ | 3,515 | | |
Portfolio turnover | | | 102 | % | | | 109 | % | | | 141 | % | |
Notes to Financial Highlights
(a) Based on operations from November 8, 2012 (commencement of operations) through the stated period end.
(b) The Fund received a payment from an affiliate. Had the Fund not received this payment, the total return would have been lower by 0.05%.
(c) In addition to the fees and expenses that the Fund bears directly, the Fund indirectly bears a pro rata share of the fees and expenses of any other funds in which it invests. Such indirect expenses are not included in the Fund's reported expense ratios.
(d) Annualized.
(e) Total net expenses include the impact of certain fee waivers/expense reimbursements made by the Investment Manager and certain of its affiliates, if applicable.
(f) The benefits derived from expense reductions had an impact of less than 0.01%.
(g) Net investment income per share includes special dividends. The effect of these dividends amounted to $0.51 per share.
The accompanying Notes to Financial Statements are an integral part of this statement.
Annual Report 2015
40
FINANCIAL HIGHLIGHTS (continued)
| | | Year Ended August 31, | |
Class R5 | | 2015 | | 2014 | | 2013 | | 2012 | | 2011(a) | |
Per share data | |
Net asset value, beginning of period | | $ | 36.99 | | | $ | 31.80 | | | $ | 28.17 | | | $ | 26.02 | | | $ | 27.16 | | |
Income from investment operations: | |
Net investment income | | | 0.97 | (h) | | | 0.45 | | | | 0.39 | | | | 0.42 | | | | 0.24 | | |
Net realized and unrealized gain (loss) | | | (0.32 | ) | | | 5.14 | | | | 3.64 | | | | 2.97 | | | | (1.18 | )(b) | |
Total from investment operations | | | 0.65 | | | | 5.59 | | | | 4.03 | | | | 3.39 | | | | (0.94 | ) | |
Less distributions to shareholders: | |
Net investment income | | | (0.53 | ) | | | (0.42 | ) | | | (0.40 | ) | | | (0.43 | ) | | | (0.20 | ) | |
Net realized gains | | | (1.33 | ) | | | — | | | | — | | | | (0.81 | ) | | | — | | |
Total distributions to shareholders | | | (1.86 | ) | | | (0.42 | ) | | | (0.40 | ) | | | (1.24 | ) | | | (0.20 | ) | |
Increase from payment by affiliate | | | — | | | | 0.02 | | | | — | | | | — | | | | — | | |
Net asset value, end of period | | $ | 35.78 | | | $ | 36.99 | | | $ | 31.80 | | | $ | 28.17 | | | $ | 26.02 | | |
Total return | | | 1.74 | % | | | 17.76 | %(c) | | | 14.42 | % | | | 13.52 | % | | | (3.46 | %) | |
Ratios to average net assets(d) | |
Total gross expenses | | | 0.70 | % | | | 0.73 | % | | | 0.76 | % | | | 0.78 | % | | | 0.75 | %(e) | |
Total net expenses(f) | | | 0.70 | % | | | 0.73 | % | | | 0.76 | % | | | 0.78 | % | | | 0.73 | %(e)(g) | |
Net investment income | | | 2.63 | % | | | 1.30 | % | | | 1.26 | % | | | 1.57 | % | | | 1.79 | %(e) | |
Supplemental data | |
Net assets, end of period (in thousands) | | $ | 110,946 | | | $ | 47,848 | | | $ | 29,617 | | | $ | 15 | | | $ | 13 | | |
Portfolio turnover | | | 102 | % | | | 109 | % | | | 141 | % | | | 130 | % | | | 99 | % | |
Notes to Financial Highlights
(a) Based on operations from March 7, 2011 (commencement of operations) through the stated period end.
(b) Calculation of the net gain (loss) per share (both realized and unrealized) does not correlate to the aggregate realized and unrealized gain (loss) presented in the Statement of Operations due to the timing of subscriptions and redemptions of Fund shares in relation to fluctuations in the market value of the portfolio.
(c) The Fund received a payment from an affiliate. Had the Fund not received this payment, the total return would have been lower by 0.05%.
(d) In addition to the fees and expenses that the Fund bears directly, the Fund indirectly bears a pro rata share of the fees and expenses of any other funds in which it invests. Such indirect expenses are not included in the Fund's reported expense ratios.
(e) Annualized.
(f) Total net expenses include the impact of certain fee waivers/expense reimbursements made by the Investment Manager and certain of its affiliates, if applicable.
(g) The benefits derived from expense reductions had an impact of less than 0.01%.
(h) Net investment income per share includes special dividends. The effect of these dividends amounted to $0.57 per share.
The accompanying Notes to Financial Statements are an integral part of this statement.
Annual Report 2015
41
FINANCIAL HIGHLIGHTS (continued)
| | | Year Ended August 31, | |
Class Y | | 2015 | | 2014 | | 2013(a) | |
Per share data | |
Net asset value, beginning of period | | $ | 37.28 | | | $ | 32.04 | | | $ | 28.25 | | |
Income from investment operations: | |
Net investment income | | | 1.21 | (f) | | | 0.47 | | | | 0.34 | | |
Net realized and unrealized gain (loss) | | | (0.54 | ) | | | 5.19 | | | | 3.75 | | |
Total from investment operations | | | 0.67 | | | | 5.66 | | | | 4.09 | | |
Less distributions to shareholders: | |
Net investment income | | | (0.55 | ) | | | (0.44 | ) | | | (0.30 | ) | |
Net realized gains | | | (1.33 | ) | | | — | | | | — | | |
Total distributions to shareholders | | | (1.88 | ) | | | (0.44 | ) | | | (0.30 | ) | |
Increase from payment by affiliate | | | — | | | | 0.02 | | | | — | | |
Net asset value, end of period | | $ | 36.07 | | | $ | 37.28 | | | $ | 32.04 | | |
Total return | | | 1.78 | % | | | 17.84 | %(b) | | | 14.54 | % | |
Ratios to average net assets(c) | |
Total gross expenses | | | 0.66 | % | | | 0.68 | % | | | 0.70 | %(d) | |
Total net expenses(e) | | | 0.66 | % | | | 0.68 | % | | | 0.70 | %(d) | |
Net investment income | | | 3.27 | % | | | 1.35 | % | | | 1.34 | %(d) | |
Supplemental data | |
Net assets, end of period (in thousands) | | $ | 65,758 | | | $ | 17,106 | | | $ | 9,784 | | |
Portfolio turnover | | | 102 | % | | | 109 | % | | | 141 | % | |
Notes to Financial Highlights
(a) Based on operations from November 8, 2012 (commencement of operations) through the stated period end.
(b) The Fund received a payment from an affiliate. Had the Fund not received this payment, the total return would have been lower by 0.04%.
(c) In addition to the fees and expenses that the Fund bears directly, the Fund indirectly bears a pro rata share of the fees and expenses of any other funds in which it invests. Such indirect expenses are not included in the Fund's reported expense ratios.
(d) Annualized.
(e) Total net expenses include the impact of certain fee waivers/expense reimbursements made by the Investment Manager and certain of its affiliates, if applicable.
(f) Net investment income per share includes special dividends. The effect of these dividends amounted to $0.78 per share.
The accompanying Notes to Financial Statements are an integral part of this statement.
Annual Report 2015
42
FINANCIAL HIGHLIGHTS (continued)
| | | Year Ended August 31, | |
Class Z | | 2015 | | 2014 | | 2013 | | 2012 | | 2011 | |
Per share data | |
Net asset value, beginning of period | | $ | 36.96 | | | $ | 31.78 | | | $ | 28.17 | | | $ | 26.02 | | | $ | 23.27 | | |
Income from investment operations: | |
Net investment income | | | 0.83 | (d) | | | 0.41 | | | | 0.35 | | | | 0.40 | | | | 0.43 | | |
Net realized and unrealized gain (loss) | | | (0.22 | ) | | | 5.15 | | | | 3.63 | | | | 2.96 | | | | 2.77 | | |
Total from investment operations | | | 0.61 | | | | 5.56 | | | | 3.98 | | | | 3.36 | | | | 3.20 | | |
Less distributions to shareholders: | |
Net investment income | | | (0.49 | ) | | | (0.38 | ) | | | (0.37 | ) | | | (0.40 | ) | | | (0.45 | ) | |
Net realized gains | | | (1.33 | ) | | | — | | | | — | | | | (0.81 | ) | | | — | | |
Total distributions to shareholders | | | (1.82 | ) | | | (0.38 | ) | | | (0.37 | ) | | | (1.21 | ) | | | (0.45 | ) | |
Net asset value, end of period | | $ | 35.75 | | | $ | 36.96 | | | $ | 31.78 | | | $ | 28.17 | | | $ | 26.02 | | |
Total return | | | 1.64 | % | | | 17.60 | % | | | 14.24 | % | | | 13.42 | % | | | 13.78 | % | |
Ratios to average net assets(a) | |
Total gross expenses | | | 0.81 | % | | | 0.84 | % | | | 0.89 | % | | | 0.91 | % | | | 0.83 | % | |
Total net expenses(b) | | | 0.81 | %(c) | | | 0.84 | %(c) | | | 0.88 | %(c) | | | 0.86 | %(c) | | | 0.78 | %(c) | |
Net investment income | | | 2.24 | % | | | 1.18 | % | | | 1.16 | % | | | 1.49 | % | | | 1.62 | % | |
Supplemental data | |
Net assets, end of period (in thousands) | | $ | 480,162 | | | $ | 364,457 | | | $ | 308,945 | | | $ | 284,934 | | | $ | 229,744 | | |
Portfolio turnover | | | 102 | % | | | 109 | % | | | 141 | % | | | 130 | % | | | 99 | % | |
Notes to Financial Highlights
(a) In addition to the fees and expenses that the Fund bears directly, the Fund indirectly bears a pro rata share of the fees and expenses of any other funds in which it invests. Such indirect expenses are not included in the Fund's reported expense ratios.
(b) Total net expenses include the impact of certain fee waivers/expense reimbursements made by the Investment Manager and certain of its affiliates, if applicable.
(c) The benefits derived from expense reductions had an impact of less than 0.01%.
(d) Net investment income per share includes special dividends. The effect of these dividends amounted to $0.47 per share.
The accompanying Notes to Financial Statements are an integral part of this statement.
Annual Report 2015
43
NOTES TO FINANCIAL STATEMENTS
August 31, 2015
Note 1. Organization
Columbia Balanced Fund (the Fund), a series of Columbia Funds Series Trust I (the Trust), is a diversified fund. The Trust is registered under the Investment Company Act of 1940, as amended (the 1940 Act), as an open-end management investment company organized as a Massachusetts business trust.
Fund Shares
The Trust may issue an unlimited number of shares (without par value). The Fund offers Class A, Class B, Class C, Class K, Class R, Class R4, Class R5, Class Y and Class Z shares. Although all share classes generally have identical voting, dividend and liquidation rights, each share class votes separately when required by the Trust's organizational documents or by law. Different share classes pay different distribution amounts to the extent the expenses of such share classes differ, and distributions in liquidation will be proportional to the net asset value of each share class. Each share class has its own expense and sales charge structure.
Class A shares are subject to a maximum front-end sales charge of 5.75% based on the initial investment amount. Class A shares purchased without an initial sales charge in accounts aggregating $1 million to $50 million at the time of purchase are subject to a contingent deferred sales charge (CDSC) if the shares are sold within 18 months after purchase, charged as follows: 1.00% CDSC if redeemed within 12 months after purchase, and 0.50% CDSC if redeemed more than 12, but less than 18, months after purchase.
Class B shares may be subject to a maximum CDSC of 5.00% based upon the holding period after purchase. Class B shares will generally convert to Class A shares eight years after purchase. The Fund no longer accepts investments by new or existing investors in the Fund's Class B shares, except in connection with the reinvestment of any dividend and/or capital gain distributions in Class B shares of the Fund and exchanges by existing Class B shareholders of certain other funds within the Columbia Family of Funds.
Class C shares are subject to a 1.00% CDSC on shares redeemed within one year after purchase.
Class K shares are not subject to sales charges, however this share class is closed to new investors.
Class R shares are not subject to sales charges and are generally available only to certain retirement plans and other investors as described in the Fund's prospectus.
Class R4 shares are not subject to sales charges and are generally available only to omnibus retirement plans and certain investors as described in the Fund's prospectus.
Class R5 shares are not subject to sales charges and are generally available only to investors purchasing through authorized investment professionals and omnibus retirement plans.
Class Y shares are not subject to sales charges and are generally available only to certain retirement plans as described in the Fund's prospectus.
Class Z shares are not subject to sales charges and are available only to eligible investors, which are subject to different investment minimums as described in the Fund's prospectus.
Note 2. Summary of Significant Accounting Policies
Basis of Preparation
The Fund is an investment company that applies the accounting and reporting guidance in the Financial Accounting Standards Board (FASB) Accounting Standards Codification Topic 946, Financial Services — Investment Companies (ASC 946). The financial statements are prepared in accordance with U.S. generally accepted accounting principles (GAAP), which requires management to make certain estimates and assumptions that affect the reported amounts of assets and liabilities, the disclosure of contingent assets and liabilities at the date of the financial statements and the reported amounts of income and expenses during the reporting period. Actual results could differ from those estimates.
The following is a summary of significant accounting policies followed by the Fund in the preparation of its financial statements.
Security Valuation
All equity securities are valued at the close of business of the New York Stock Exchange (NYSE). Equity securities are valued at the last quoted sales price on the principal exchange or market on which they trade, except for securities traded on the NASDAQ Stock Market, which are valued at the NASDAQ official close price. Unlisted securities or listed securities for which there were no sales during the day are valued at the mean of the latest quoted bid and ask prices on such exchanges or markets.
Annual Report 2015
44
NOTES TO FINANCIAL STATEMENTS (continued)
August 31, 2015
Debt securities generally are valued by pricing services approved by the Board of Trustees (the Board) based upon market transactions for normal, institutional-size trading units of similar securities. The services may use various pricing techniques that take into account, as applicable, factors such as yield, quality, coupon rate, maturity, type of issue, trading characteristics and other data, as well as broker quotes. Debt securities for which quotations are not readily available or not believed to be reflective of market value may also be valued based upon a bid quote from an approved independent broker-dealer. Debt securities maturing in 60 days or less are valued primarily at amortized cost value, unless this method results in a valuation that management believes does not approximate market value.
Asset- and mortgage-backed securities are generally valued by pricing services, which utilize pricing models that incorporate the securities' cash flow and loan performance data. These models also take into account available market data, including trades, market quotations, and benchmark yield curves for identical or similar securities. Factors used to identify similar securities may include, but are not limited to, issuer, collateral type, vintage, prepayment speeds, collateral performance, credit ratings, credit enhancement and expected life. Asset-backed securities for which quotations are readily available may also be valued based upon an over-the-counter or exchange bid quote from an approved independent broker-dealer.
Senior loan securities for which reliable market quotations are readily available are generally valued by pricing services at the average of the bids received.
Foreign equity securities are valued based on the closing price on the foreign exchange in which such securities are primarily traded. If any foreign equity security closing prices are not readily available, the securities are valued at the mean of the latest quoted bid and ask prices on such exchanges or markets. Foreign currency exchange rates are generally determined at 4:00 p.m. Eastern (U.S.) time. Many securities markets and exchanges outside the U.S. close prior to the close of the NYSE; therefore, the closing prices for securities in such markets or on such exchanges may not fully reflect events that occur after such close but before the close of the NYSE. In those situations, foreign securities will be fair valued pursuant to a policy adopted by the Board, including, if available, utilizing a third party pricing service to determine these fair values. The third party pricing service takes into account multiple factors, including, but not limited to, movements in the U.S. securities markets,
certain depositary receipts, futures contracts and foreign exchange rates that have occurred subsequent to the close of the foreign exchange or market, to determine a good faith estimate that reasonably reflects the current market conditions as of the close of the NYSE. The fair value of a security is likely to be different from the quoted or published price, if available.
Investments in open-end investment companies, including money market funds, are valued at their latest net asset value.
Futures and options on futures contracts are valued based upon the settlement price at the close of regular trading on their principal exchanges or, in the absence of transactions, at the mean of the latest quoted bid and ask prices.
Investments for which market quotations are not readily available, or that have quotations which management believes are not reflective of market value or reliable, are valued at fair value as determined in good faith under procedures approved by and under the general supervision of the Board. If a security or class of securities (such as foreign securities) is valued at fair value, such value is likely to be different from the quoted or published price for the security.
The determination of fair value often requires significant judgment. To determine fair value, management may use assumptions including but not limited to future cash flows and estimated risk premiums. Multiple inputs from various sources may be used to determine fair value.
GAAP requires disclosure regarding the inputs and valuation techniques used to measure fair value and any changes in valuation inputs or techniques. In addition, investments shall be disclosed by major category. This information is disclosed following the Fund's Portfolio of Investments.
Foreign Currency Transactions and Translations
The values of all assets and liabilities denominated in foreign currencies are generally translated into U.S. dollars at exchange rates determined at the close of the NYSE. Net realized and unrealized gains (losses) on foreign currency transactions and translations include gains (losses) arising from the fluctuation in exchange rates between trade and settlement dates on securities transactions, gains (losses) arising from the disposition of foreign currency and currency gains (losses) between the accrual and payment dates on dividends, interest income and foreign withholding taxes.
Annual Report 2015
45
NOTES TO FINANCIAL STATEMENTS (continued)
August 31, 2015
For financial statement purposes, the Fund does not distinguish that portion of gains (losses) on investments which is due to changes in foreign exchange rates from that which is due to changes in market prices of the investments. Such fluctuations are included with the net realized and unrealized gains (losses) on investments in the Statement of Operations.
Derivative Instruments
The Fund invests in certain derivative instruments, as detailed below, to meet its investment objectives. Derivatives are instruments whose values depend on, or are derived from, in whole or in part, the value of one or more securities, currencies, commodities, indices, or other assets or instruments. Derivatives may be used to increase investment flexibility (including to maintain cash reserves while maintaining desired exposure to certain assets), for risk management (hedging) purposes, to facilitate trading, to reduce transaction costs and to pursue higher investment returns. The Fund may also use derivative instruments to mitigate certain investment risks, such as foreign currency exchange rate risk, interest rate risk and credit risk. Derivatives may involve various risks, including the potential inability of the counterparty to fulfill its obligation under the terms of the contract, the potential for an illiquid secondary market (making it difficult for the Fund to sell, including at favorable prices) and the potential for market movements which may expose the Fund to gains or losses in excess of the amount shown in the Statement of Assets and Liabilities. The notional amounts of derivative instruments, if applicable, are not recorded in the financial statements.
A derivative instrument may suffer a marked-to-market loss if the value of the contract decreases due to an unfavorable change in the market rates or values of the underlying instrument. Losses can also occur if the counterparty does not perform under the contract. The Fund's risk of loss from counterparty credit risk on over-the-counter derivatives is generally limited to the aggregate unrealized gain netted against any collateral held by the Fund and the amount of any variation margin held by the counterparty. With exchange-traded or centrally cleared derivatives, there is reduced counterparty credit risk to the Fund since the exchange's clearinghouse, as counterparty to such instruments, guarantees against a possible default. The clearinghouse stands between the buyer and the seller of the contract; therefore, the counterparty credit risk is failure of the clearinghouse. However, credit risk still exists in
exchange-traded or centrally cleared derivatives with respect to initial and variation margin that is held in a broker's customer account. While brokers are required to segregate customer margin from their own assets, in the event that a broker becomes insolvent or goes into bankruptcy and at that time there is a shortfall in the aggregate amount of margin held by the broker for all its clients, U.S. bankruptcy laws will typically allocate that shortfall on a pro-rata basis across all the broker's customers (including the Fund), potentially resulting in losses to the Fund.
In order to better define its contractual rights and to secure rights that will help the Fund mitigate its counterparty risk, the Fund may enter into an International Swaps and Derivatives Association, Inc. Master Agreement (ISDA Master Agreement) or similar agreement with its derivatives contract counterparties. An ISDA Master Agreement is an agreement between the Fund and a counterparty that governs over-the-counter derivatives and forward foreign currency exchange contracts and typically contains, among other things, collateral posting terms and netting provisions in the event of a default and/or termination event. Under an ISDA Master Agreement, the Fund may, under certain circumstances, offset with the counterparty certain derivative instrument's payables and/or receivables with collateral held and/or posted and create one single net payment. The provisions of the ISDA Master Agreement typically permit a single net payment in the event of default (close-out netting) including the bankruptcy or insolvency of the counterparty. Note, however, that bankruptcy or insolvency laws of a particular jurisdiction may impose restrictions on or prohibitions against the right of offset in bankruptcy, insolvency or other events.
Collateral (margin) requirements differ by type of derivative. Margin requirements are established by the exchange or clearinghouse for exchange-traded and centrally cleared derivatives. Brokers can ask for margin in excess of the minimum in certain circumstances. Collateral terms are contract specific for over-the-counter derivatives. For over-the-counter derivatives traded under an ISDA Master Agreement, the collateral requirements are typically calculated by netting the marked-to-market amount for each transaction under such agreement and comparing that amount to the value of any variation margin currently pledged by the Fund and/or the counterparty. Generally, the amount of collateral due from or to a party has to exceed a minimum transfer amount threshold (e.g., $500,000) before a transfer has to be made. To the extent amounts due to the Fund from its
Annual Report 2015
46
NOTES TO FINANCIAL STATEMENTS (continued)
August 31, 2015
counterparties are not fully collateralized, contractually or otherwise, the Fund bears the risk of loss from counterparty nonperformance. The Fund attempts to mitigate counterparty risk by only entering into agreements with counterparties that it believes have the financial resources to honor their obligations and by monitoring the financial stability of those counterparties.
Certain ISDA Master Agreements allow counterparties to over-the-counter derivatives transactions to terminate derivatives contracts prior to maturity in the event the Fund's net asset value declines by a stated percentage over a specified time period or if the Fund fails to meet certain terms of the ISDA Master Agreement, which would cause the Fund to accelerate payment of any net liability owed to the counterparty. The Fund also has termination rights if the counterparty fails to meet certain terms of the ISDA Master Agreement. In addition to considering counterparty credit risk, the Fund would consider terminating the derivatives contracts based on whether termination would result in a net liability owed from the counterparty.
For financial reporting purposes, the Fund does not offset derivative assets and derivative liabilities that are subject to netting arrangements in the Statement of Assets and Liabilities.
Futures Contracts
Futures contracts are exchange traded and represent commitments for the future purchase or sale of an asset at a specified price on a specified date. The Fund bought and sold futures contracts to manage the duration and yield curve exposure of the Fund versus the benchmark and manage exposure to movements in interest rates. These instruments may be used for other purposes in future periods. Upon entering into futures contracts, the Fund bears risks that it may not achieve the anticipated benefits of the futures contracts and may realize a loss. Additional risks include counterparty credit risk, the possibility of an illiquid market, and that a change in the value of the contract or option may not correlate with changes in the value of the underlying asset.
Upon entering into a futures contract, the Fund pledges cash or securities with the broker in an amount sufficient to meet the initial margin requirement. The initial margin deposit must be maintained at an established level over the life of the contract. Cash deposited as initial margin is recorded in the Statement of Assets and Liabilities as margin deposits. Securities deposited as initial margin are designated in the Portfolio of Investments. Subsequent payments (variation margin) are made or
received by the Fund each day. The variation margin payments are equal to the daily change in the contract value and are recorded as variation margin receivable or payable and are offset in unrealized gains or losses. The Fund recognizes a realized gain or loss when the contract is closed or expires. Futures contracts involve, to varying degrees, risk of loss in excess of the variation margin disclosed in the Statement of Assets and Liabilities.
Effects of Derivative Transactions in the Financial Statements
The following tables are intended to provide additional information about the effect of derivatives on the financial statements of the Fund, including: the fair value of derivatives by risk category and the location of those fair values in the Statement of Assets and Liabilities; and the impact of derivative transactions over the period in the Statement of Operations, including realized and unrealized gains (losses). The derivative instrument schedules following the Portfolio of Investments present additional information regarding derivative instruments outstanding at the end of the period, if any.
At August 31, 2015, the fund had no outstanding derivatives.
The following table indicates the effect of derivative instruments (not considered to be hedging instruments for accounting disclosure purposes) in the Statement of Operations for the year ended August 31, 2015:
Amount of Realized Gain (Loss) on Derivatives Recognized in Income | |
Risk Exposure Category | | Futures Contracts ($) | |
Interest rate risk | | | (28,921 | ) | |
Change in Unrealized Appreciation (Depreciation) on
Derivatives Recognized in Income | |
Risk Exposure Category | | Futures Contracts ($) | |
Interest rate risk | | | 25,549 | | |
The following table provides a summary of the average outstanding volume by derivative instrument for the year ended August 31, 2015:
Derivative Instrument | | Average Notional Amounts ($)* | |
Futures contracts — Long | | | 8,704,746 | | |
Futures contracts — Short | | | 7,395,996 | | |
*Based on the ending quarterly outstanding amounts for the year ended August 31, 2015.
Investments in Senior Loans
The Fund may invest in senior loan assignments. When the Fund purchases an assignment of a senior loan, the Fund typically has direct rights against the borrower;
Annual Report 2015
47
NOTES TO FINANCIAL STATEMENTS (continued)
August 31, 2015
provided, however, that the Fund's rights may be more limited than the lender from which it acquired the assignment and the Fund may be able to enforce its rights only through an administrative agent. Although certain senior loan assignments are secured by collateral, the Fund could experience delays or limitations in realizing such collateral or have its interest subordinated to other indebtedness of the obligor. In the event that the administrator or collateral agent of a loan becomes insolvent, enters into receivership or bankruptcy, the Fund may incur costs and delays in realizing payment or may suffer a loss of principal and/or interest. The risk of loss is greater for unsecured or subordinated loans. In addition, senior loan assignments are vulnerable to market, economic or other conditions or events that may reduce the demand for senior loan assignments and certain senior loan assignments which were liquid, when purchased, may become illiquid.
The Fund may enter into senior loan assignments where all or a portion of the loan may be unfunded. The Fund is obligated to fund these commitments at the borrower's discretion. These commitments are generally traded and priced in the same manner as other senior loan securities and are disclosed as unfunded senior loan commitments in the Fund's Portfolio of Investments with a corresponding payable for investments purchased. The Fund designates cash or liquid securities to cover these commitments.
Asset- and Mortgage-Backed Securities
The Fund may invest in asset-backed and mortgage-backed securities. The maturity dates shown represent the original maturity of the underlying obligation. Actual maturity may vary based upon prepayment activity on these obligations. All, or a portion, of the obligation may be prepaid at any time because the underlying asset may be prepaid. As a result, decreasing market interest rates could result in an increased level of prepayment. An increased prepayment rate will have the effect of shortening the maturity of the security. Unless otherwise noted, the coupon rates presented are fixed rates.
Delayed Delivery Securities
The Fund may trade securities on other than normal settlement terms, including securities purchased or sold on a "when-issued" basis. This may increase risk to the Fund since the other party to the transaction may fail to deliver, which could cause the Fund to subsequently invest at less advantageous prices. The Fund designates cash or liquid securities in an amount equal to the delayed delivery commitment.
Mortgage Dollar Roll Transactions
The Fund may enter into mortgage "dollar rolls" in which the Fund sells securities for delivery in the current month and simultaneously contracts with the same counterparty to repurchase similar but not identical securities (same type, coupon and maturity) on a specified future date. During the roll period, the Fund loses the right to receive principal and interest paid on the securities sold. However, the Fund will benefit because it receives negotiated amounts in the form of reductions of the purchase price for the future purchase plus the interest earned on the cash proceeds of the securities sold until the settlement date of the forward purchase. The Fund records the incremental difference between the forward purchase and sale of each forward roll as a realized gain or loss. Unless any realized gains exceed the income, capital appreciation, and gain or loss due to mortgage prepayments that would have been realized on the securities sold as part of the mortgage dollar roll, the use of this technique will diminish the investment performance of the Fund compared to what the performance would have been without the use of mortgage dollar rolls. All cash proceeds will be invested in instruments that are permissible investments for the Fund. The Fund identifies cash or liquid securities in an amount equal to the forward purchase price.
For financial reporting and tax purposes, the Fund treats "to be announced" mortgage dollar rolls as two separate transactions, one involving the purchase of a security and a separate transaction involving a sale. These transactions may increase the Fund's portfolio turnover rate. The Fund does not currently enter into mortgage dollar rolls that are accounted for as financing transactions.
Mortgage dollar rolls involve the risk that the market value of the securities the Fund is obligated to repurchase may decline below the repurchase price, or that the counterparty may default on its obligations.
Treasury Inflation Protected Securities
The Fund may invest in treasury inflation protected securities (TIPS). The principal amount of TIPS is adjusted periodically and is increased for inflation or decreased for deflation based on a monthly published index. These adjustments are recorded as interest income in the Statement of Operations. Coupon payments are based on the adjusted principal at the time the interest is paid.
Annual Report 2015
48
NOTES TO FINANCIAL STATEMENTS (continued)
August 31, 2015
Security Transactions
Security transactions are accounted for on the trade date. Cost is determined and gains (losses) are based upon the specific identification method for both financial statement and federal income tax purposes.
Trade date for senior loans purchased in the primary market is the date on which the loan is allocated. Trade date for senior loans purchased in the secondary market is the date on which the transaction is entered into.
Income Recognition
Corporate actions and dividend income are generally recorded net of any non-reclaimable tax withholdings, on the ex-dividend date or upon receipt of ex-dividend notification in the case of certain foreign securities.
Interest income is recorded on an accrual basis. Market premiums and discounts, including original issue discounts, are amortized and accreted, respectively, over the expected life of the security on all debt securities, unless otherwise noted. The Fund classifies gains and losses realized on prepayments received on mortgage-backed securities as adjustments to interest income.
The Fund may place a debt security on non-accrual status and reduce related interest income when it becomes probable that the interest will not be collected and the amount of uncollectible interest can be reasonably estimated. A defaulted debt security is removed from non-accrual status when the issuer resumes interest payments or when collectibility of interest is reasonably assured.
The Fund may receive distributions from holdings in equity securities, business development companies (BDCs), exchange-traded funds, other regulated investment companies (RICs), and real estate investment trusts (REITs), which report information on the tax character of their distributions annually. These distributions are allocated to dividend income, capital gain and return of capital based on actual information reported. Return of capital is recorded as a reduction of the cost basis of securities held. If the Fund no longer owns the applicable securities, return of capital is recorded as a realized gain. With respect to REITs, to the extent actual information has not yet been reported, estimates for return of capital are made by the Fund's management. Management's estimates are subsequently adjusted when the actual character of the distributions is disclosed by the REITs, which could result in a proportionate change in return of capital to shareholders.
Awards from class action litigation are recorded as a reduction of cost basis if the Fund still owns the applicable securities on the payment date. If the Fund no longer owns the applicable securities, the proceeds are recorded as realized gains.
The value of additional securities received as an income payment is recorded as income and increases the cost basis of such securities.
The Fund may receive other income from senior loans, including amendment fees, consent fees and commitment fees. These fees are recorded as income when received by the Fund. These amounts are included in Interest Income in the Statement of Operations.
Expenses
General expenses of the Trust are allocated to the Fund and other funds of the Trust based upon relative net assets or other expense allocation methodologies determined by the nature of the expense. Expenses directly attributable to the Fund are charged to the Fund. Expenses directly attributable to a specific class of shares are charged to that share class.
Determination of Class Net Asset Value
All income, expenses (other than class-specific expenses, which are charged to that share class, as shown in the Statement of Operations) and realized and unrealized gains (losses) are allocated to each class of the Fund on a daily basis, based on the relative net assets of each class, for purposes of determining the net asset value of each class.
Federal Income Tax Status
The Fund intends to qualify each year as a regulated investment company under Subchapter M of the Internal Revenue Code, as amended, and will distribute substantially all of its taxable income (including net short-term capital gains), if any, for its tax year, and as such will not be subject to federal income taxes. In addition, the Fund intends to distribute in each calendar year substantially all of its net investment income, capital gains and certain other amounts, if any, such that the Fund should not be subject to federal excise tax. Therefore, no federal income or excise tax provision is recorded.
Foreign Taxes
The Fund may be subject to foreign taxes on income, gains on investments or currency repatriation, a portion of which may be recoverable. The Fund will accrue such taxes and recoveries, as applicable, based upon its
Annual Report 2015
49
NOTES TO FINANCIAL STATEMENTS (continued)
August 31, 2015
current interpretation of tax rules and regulations that exist in the markets in which it invests.
Realized gains in certain countries may be subject to foreign taxes at the Fund level, based on statutory rates. The Fund accrues for such foreign taxes on realized and unrealized gains at the appropriate rate for each jurisdiction, as applicable. The amount, if any, is disclosed as a liability on the Statement of Assets and Liabilities.
Distributions to Shareholders
Distributions from net investment income, if any, are declared and paid each calendar quarter. Net realized capital gains, if any, are distributed at least annually. Income distributions and capital gain distributions are determined in accordance with federal income tax regulations, which may differ from GAAP.
Guarantees and Indemnifications
Under the Trust's organizational documents and, in some cases, by contract, its officers and trustees are indemnified against certain liabilities arising out of the performance of their duties to the Trust or its funds. In addition, certain of the Fund's contracts with its service providers contain general indemnification clauses. The Fund's maximum exposure under these arrangements is unknown since the amount of any future claims that may be made against the Fund cannot be determined, and the Fund has no historical basis for predicting the likelihood of any such claims.
Recent Accounting Pronouncement
Fair Value Measurement (Topic 820), Disclosure for Investments in Certain Entities That Calculate Net Asset Value per Share (or Its Equivalent)
In May 2015, the Financial Accounting Standards Board (FASB) issued Accounting Standards Update (ASU) No. 2015-07, Fair Value Measurement (Topic 820), Disclosure for Investments in Certain Entities That Calculate Net Asset Value per Share (or Its Equivalent). ASU No. 2015-07 changes the disclosure requirements for investments for which fair value is measured using the net asset value per share practical expedient. The disclosure requirements are effective for annual periods beginning after December 15, 2015 and interim periods within those fiscal years. At this time, management is evaluating the implications of this guidance and the impact it will have on the financial statement amounts and footnote disclosures, if any.
Note 3. Fees and Other Transactions with Affiliates
Investment Management Fees
Under an Investment Management Services Agreement, Columbia Management Investment Advisers, LLC (the Investment Manager), a wholly-owned subsidiary of Ameriprise Financial, Inc. (Ameriprise Financial), determines which securities will be purchased, held or sold. The investment management fee is an annual fee that is equal to a percentage of the Fund's average daily net assets that declines from 0.66% to 0.49% as the Fund's net assets increase. The effective investment management fee rate for the year ended August 31, 2015 was 0.57% of the Fund's average daily net assets.
Administration Fees
Under an Administrative Services Agreement, the Investment Manager also serves as the Fund Administrator. The Fund pays the Fund Administrator an annual fee for administration and accounting services equal to a percentage of the Fund's average daily net assets that declines from 0.06% to 0.03% as the Fund's net assets increase. The effective administration fee rate for the year ended August 31, 2015 was 0.05% of the Fund's average daily net assets.
Compensation of Board Members
Board members, who are not officers or employees of the Investment Manager or Ameriprise Financial, are compensated for their services to the Fund as disclosed in the Statement of Operations. These Board members may participate in a Deferred Compensation Plan (the Plan) which may be terminated at any time. Obligations of the Plan will be paid solely out of the Fund's assets, and all amounts payable under the Plan constitute a general unsecured obligation of the Fund.
Compensation of Chief Compliance Officer
The Board has appointed a Chief Compliance Officer to the Fund in accordance with federal securities regulations. The Fund is allocated a portion of the expenses associated with the Chief Compliance Officer based on relative net assets of the Trust.
Transfer Agency Fees
Under a Transfer and Dividend Disbursing Agent Agreement, Columbia Management Investment Services Corp. (the Transfer Agent), an affiliate of the Investment Manager and a wholly-owned subsidiary of Ameriprise Financial, is responsible for providing transfer agency
Annual Report 2015
50
NOTES TO FINANCIAL STATEMENTS (continued)
August 31, 2015
services to the Fund. The Transfer Agent has contracted with Boston Financial Data Services (BFDS) to serve as sub-transfer agent.
Effective November 1, 2014, the Transfer Agent receives a monthly transfer agency fee based on the number or the average value of accounts, depending on the type of account. Prior to November 1, 2014, the Transfer Agent received a monthly account-based service fee based on the number of open accounts. In addition, the Transfer Agent also receives sub-transfer agency fees based on a percentage of the average aggregate value of the Fund's shares maintained in omnibus accounts (other than omnibus accounts for which American Enterprise Investment Services Inc. is the broker of record or accounts where the beneficial shareholder is a customer of Ameriprise Financial Services, Inc., which receive a per account fee). The Transfer Agent pays the fees of BFDS for services as sub-transfer agent and is not entitled to reimbursement for such fees from the Fund (with the exception of out-of-pocket fees).
The Transfer Agent also receives compensation from the Fund for various shareholder services and reimbursements for certain out-of-pocket fees. Total transfer agency fees for Class K and Class R5 shares are subject to an annual limitation of not more than 0.05% of the average daily net assets attributable to each share class. Class Y shares do not pay transfer agency fees.
For the year ended August 31, 2015, the Fund's effective transfer agency fee rates as a percentage of average daily net assets of each class were as follows:
Class A | | | 0.15 | % | |
Class B | | | 0.15 | | |
Class C | | | 0.15 | | |
Class K | | | 0.05 | | |
Class R | | | 0.15 | | |
Class R4 | | | 0.15 | | |
Class R5 | | | 0.05 | | |
Class Z | | | 0.15 | | |
The Fund and certain other associated investment companies have severally, but not jointly, guaranteed the performance and observance of all the terms and conditions of a lease entered into by Seligman Data Corp. (SDC), the former transfer agent, including the payment of rent by SDC (the Guaranty). SDC was the legacy Seligman funds' former transfer agent.
The lease and the Guaranty expire in January 2019. At August 31, 2015, the Fund's total potential future obligation over the life of the Guaranty is $22,476. The liability remaining at August 31, 2015 for non-recurring charges associated with the lease amounted to $14,033 and is recorded as a part of the payable for other expenses in the Statement of Assets and Liabilities. SDC is owned by six associated investment companies, including the Fund. The Fund's ownership interest in SDC at August 31, 2015 is recorded as a part of other assets in the Statement of Assets and Liabilities at a cost of $3,553, which approximates the fair value of the ownership interest.
An annual minimum account balance fee of $20 may apply to certain accounts with a value below the applicable share class's initial minimum investment requirements to reduce the impact of small accounts on transfer agency fees. These minimum account balance fees are remitted to the Fund and recorded as part of expense reductions in the Statement of Operations. For the year ended August 31, 2015, these minimum account balance fees reduced total expenses of the Fund by $2,583.
Plan Administration Fees
Under a Plan Administration Services Agreement with the Transfer Agent, the Fund pays an annual fee at a rate of 0.25% of the Fund's average daily net assets attributable to Class K shares for the provision of various administrative, recordkeeping, communication and educational services.
Distribution and Service Fees
The Fund has an agreement with Columbia Management Investment Distributors, Inc. (the Distributor), an affiliate of the Investment Manager and a wholly-owned subsidiary of Ameriprise Financial, for distribution and shareholder services. The Board has approved, and the Fund has adopted, distribution and shareholder service plans (the Plans) applicable to certain share classes, which set the distribution and service fees for the Fund. These fees are calculated daily and are intended to compensate the Distributor and/or eligible selling and/or servicing agents for selling shares of the Fund and providing services to investors.
Under the Plans, the Fund pays a monthly service fee to the Distributor at the maximum annual rate of 0.25% of the average daily net assets attributable to Class A, Class B and Class C shares of the Fund. Also under the Plans, the Fund pays a monthly distribution fee to the
Annual Report 2015
51
NOTES TO FINANCIAL STATEMENTS (continued)
August 31, 2015
Distributor at the maximum annual rates of 0.10%, 0.75%, 0.75% and 0.50% of the average daily net assets attributable to Class A, Class B, Class C and Class R shares of the Fund, respectively.
Although the Fund may pay distribution and service fees up to a maximum annual rate of 0.35% of the Fund's average daily net assets attributable to Class A shares (comprised of up to 0.10% for distribution services and up to 0.25% for shareholder liaison services), the Fund currently limits such fees to an aggregate fee of not more than 0.25% of the Fund's average daily net assets attributable to Class A shares.
Sales Charges
Sales charges, including front-end charges and CDSCs, received by the Distributor for distributing Fund shares were $6,219,796 for Class A, $1,056 for Class B and $60,503 for Class C shares for the year ended August 31, 2015.
Expenses Waived/Reimbursed by the Investment Manager and its Affiliates
The Fund's expense ratio is subject to an expense reimbursement arrangement pursuant to which fees will be waived and/or expenses reimbursed (excluding certain fees and expenses described below), so that the Fund's net operating expenses, after giving effect to fees waived/expenses reimbursed and any balance credits and/or overdraft charges from the Fund's custodian, do not exceed the annual rates of:
| | | Voluntary
Expense Cap
Effective
January 1, 2015 | | Contractual
Expense Cap
Prior to
January 1, 2015 | |
Class A | | | 1.20 | % | | | 1.20 | % | |
Class B | | | 1.95 | | | | 1.95 | | |
Class C | | | 1.95 | | | | 1.95 | | |
Class K | | | 1.14 | | | | 1.12 | | |
Class R | | | 1.45 | | | | 1.45 | | |
Class R4 | | | 0.95 | | | | 0.95 | | |
Class R5 | | | 0.89 | | | | 0.87 | | |
Class Y | | | 0.84 | | | | 0.82 | | |
Class Z | | | 0.95 | | | | 0.95 | | |
The voluntary expense cap arrangement may be revised or discontinued at any time. Under the arrangements, the following fees and expenses are excluded from the waiver/reimbursement commitment, and therefore will be paid by the Fund, if applicable: taxes (including foreign transaction taxes), expenses associated with
investments in affiliated and non-affiliated pooled investment vehicles (including mutual funds and exchange-traded funds), transaction costs and brokerage commissions, costs related to any securities lending program, dividend and interest expenses associated with securities sold short, inverse floater program fees and expenses, transaction charges and interest on borrowed money, interest and extraordinary expenses. Any fees waived and/or expenses reimbursed under the expense reimbursement arrangements described above are not recoverable by the Investment Manager or its affiliates in future periods.
Note 4. Federal Tax Information
The timing and character of income and capital gain distributions are determined in accordance with income tax regulations, which may differ from GAAP because of temporary or permanent book to tax differences.
At August 31, 2015, these differences are primarily due to differing treatment for principal and/or interest from fixed income securities, deferral/reversal of wash sale losses, Trustees' deferred compensation, foreign currency transactions, re-characterization of distributions for investments and tax straddles. To the extent these differences are permanent, reclassifications are made among the components of the Fund's net assets in the Statement of Assets and Liabilities. Temporary differences do not require reclassifications. In the Statement of Assets and Liabilities the following reclassifications were made:
Undistributed net investment income | | $ | 100,775 | | |
Accumulated net realized gain | | | (100,775 | ) | |
Net investment income (loss) and net realized gains (losses), as disclosed in the Statement of Operations, and net assets were not affected by this reclassification.
The tax character of distributions paid during the years indicated was as follows:
Year Ended August 31, | | 2015 | | 2014 | |
Ordinary income | | $ | 27,904,599 | | | $ | 15,243,417 | | |
Long-term capital gains | | | 83,223,111 | | | | — | | |
Total | | $ | 111,127,710 | | | $ | 15,243,417 | | |
Short-term capital gain distributions, if any, are considered ordinary income distributions for tax purposes.
Annual Report 2015
52
NOTES TO FINANCIAL STATEMENTS (continued)
August 31, 2015
At August 31, 2015, the components of distributable earnings on a tax basis were as follows:
Undistributed ordinary income | | $ | 33,135,355 | | |
Undistributed long-term capital gains | | | 68,290,875 | | |
Net unrealized appreciation | | | 261,334,956 | | |
At August 31, 2015, the cost of investments for federal income tax purposes was $3,054,496,821 and the aggregate gross unrealized appreciation and depreciation based on that cost was:
Unrealized appreciation | | $ | 326,368,662 | | |
Unrealized depreciation | | | (65,033,706 | ) | |
Net unrealized appreciation | | $ | 261,334,956 | | |
Management of the Fund has concluded that there are no significant uncertain tax positions in the Fund that would require recognition in the financial statements. However, management's conclusion may be subject to review and adjustment at a later date based on factors including, but not limited to, new tax laws, regulations, and administrative interpretations (including relevant court decisions). Generally, the Fund's federal tax returns for the prior three fiscal years remain subject to examination by the Internal Revenue Service.
Note 5. Portfolio Information
The cost of purchases and proceeds from sales of securities, excluding short-term investments and derivatives, if any, aggregated to $3,583,133,676 and $2,519,270,370, respectively, for the year ended August 31, 2015, of which $1,506,152,082 and $1,365,386,776, respectively, were U.S. government securities. The amount of purchase and sale activity impacts the portfolio turnover rate reported in the Financial Highlights.
Note 6. Payments by Affiliates
During the year ended August 31, 2014, the Fund received a payment of $243,303 from the Investment Manager as a reimbursement for certain shareholder transactions processed at an incorrect price. The payment has been included in "Increase from payment by affiliate" on the Statement of Changes in Net Assets.
Note 7. Affiliated Money Market Fund
The Fund invests in Columbia Short-Term Cash Fund, an affiliated money market fund established for the exclusive use by the Fund and other affiliated funds. The income earned by the Fund from such investments is included as Dividends — affiliated issuers in the Statement of Operations. As an investing fund, the Fund
indirectly bears its proportionate share of the expenses of Columbia Short-Term Cash Fund.
Note 8. Line of Credit
The Fund has entered into a revolving credit facility with a syndicate of banks led by JPMorgan Chase Bank, N.A. whereby the Fund may borrow for the temporary funding of shareholder redemptions or for other temporary or emergency purposes. Pursuant to a December 9, 2014 amendment, the credit facility agreement, which is a collective agreement between the Fund and certain other funds managed by the Investment Manager, severally and not jointly, permits collective borrowings up to $550 million. Interest is charged to each participating fund based on its borrowings at a rate equal to the higher of (i) the overnight federal funds rate plus 1.00% or (ii) the one-month LIBOR rate plus 1.00%. Each borrowing under the credit facility matures no later than 60 days after the date of borrowing. The Fund also pays a commitment fee equal to its pro rata share of the amount of the credit facility at a rate of 0.075% per annum. The commitment fee is included in other expenses in the Statement of Operations. Prior to the December 9, 2014 amendment, the credit facility agreement permitted borrowings up to $500 million under the same terms and interest rates as described above.
The Fund had no borrowings during the year ended August 31, 2015.
Note 9. Significant Risks
Credit Risk
Credit risk is the risk that the value of debt securities in the Fund's portfolio may decline because the issuer may default and fail to pay interest or repay principal when due. Rating agencies assign credit ratings to debt securities to indicate their credit risk. Lower rated or unrated debt securities held by the Fund may present increased credit risk as compared to higher-rated debt securities.
Interest Rate Risk
Interest rate risk is the risk of losses attributable to changes in interest rates. In general, if prevailing interest rates rise, the values of debt securities tend to fall, and if interest rates fall, the values of debt securities tend to rise. Actions by governments and central banking authorities can result in increases in interest rates. Increasing interest rates may negatively affect the value of debt securities held by the Fund, resulting in a negative impact on the Fund's performance and net
Annual Report 2015
53
NOTES TO FINANCIAL STATEMENTS (continued)
August 31, 2015
asset value per share. In general, the longer the maturity or duration of a debt security, the greater its sensitivity to changes in interest rates.
Liquidity Risk
Liquidity risk is the risk associated with a lack of marketability of investments which may make it difficult to sell the investment at a desirable time or price. Changing regulatory, market or other conditions or environments (for example, the interest rate or credit environments) may adversely affect the liquidity of the Fund's investments. The Fund may have to accept a lower selling price for the holding, sell other investments, or forego another, more appealing investment opportunity. Generally, the less liquid the market at the time the Fund sells a portfolio investment, the greater the risk of loss or decline of value to the Fund. A less liquid market can lead to an increase in Fund redemptions, which may negatively impact Fund performance and net asset value per share, including, for example, if the Fund is forced to sell securities in a down market.
Shareholder Concentration Risk
Affiliated shareholders of record owned 45.1% of the outstanding shares of the Fund in one or more accounts. Subscription and redemption activity by concentrated accounts may have a significant effect on the operations of the Fund. In the case of a large redemption, the Fund may be forced to sell investments at inopportune times, including its liquid or more liquid positions, resulting in Fund losses and the Fund holding a higher percentage of less liquid or illiquid securities. Large redemptions could result in decreased economies of scale and increased operating expenses for non-redeeming Fund shareholders.
Note 10. Subsequent Events
Management has evaluated the events and transactions that have occurred through the date the financial statements were issued and noted no items requiring adjustment of the financial statements or additional disclosure.
Note 11. Information Regarding Pending and Settled Legal Proceedings
In December 2005, without admitting or denying the allegations, American Express Financial Corporation (AEFC, which is now known as Ameriprise Financial, Inc. (Ameriprise Financial)) entered into settlement agreements with the Securities and Exchange Commission (SEC) and Minnesota Department of
Commerce (MDOC) related to market timing activities. As a result, AEFC was censured and ordered to cease and desist from committing or causing any violations of certain provisions of the Investment Advisers Act of 1940, the Investment Company Act of 1940, and various Minnesota laws. AEFC agreed to pay disgorgement of $10 million and civil money penalties of $7 million. AEFC also agreed to retain an independent distribution consultant to assist in developing a plan for distribution of all disgorgement and civil penalties ordered by the SEC in accordance with various undertakings detailed at http://www.sec.gov/litigation/admin/ia-2451.pdf. Ameriprise Financial and its affiliates have cooperated with the SEC and the MDOC in these legal proceedings, and have made regular reports to the Funds' Boards of Trustees.
Ameriprise Financial and certain of its affiliates have historically been involved in a number of legal, arbitration and regulatory proceedings, including routine litigation, class actions, and governmental actions, concerning matters arising in connection with the conduct of their business activities. Ameriprise Financial believes that the Funds are not currently the subject of, and that neither Ameriprise Financial nor any of its affiliates are the subject of, any pending legal, arbitration or regulatory proceedings that are likely to have a material adverse effect on the Funds or the ability of Ameriprise Financial or its affiliates to perform under their contracts with the Funds. Ameriprise Financial is required to make quarterly (10-Q), annual (10-K) and, as necessary, 8-K filings with the SEC on legal and regulatory matters that relate to Ameriprise Financial and its affiliates. Copies of these filings may be obtained by accessing the SEC website at www.sec.gov.
There can be no assurance that these matters, or the adverse publicity associated with them, will not result in increased fund redemptions, reduced sale of fund shares or other adverse consequences to the Funds. Further, although we believe proceedings are not likely to have a material adverse effect on the Funds or the ability of Ameriprise Financial or its affiliates to perform under their contracts with the Funds, these proceedings are subject to uncertainties and, as such, we are unable to estimate the possible loss or range of loss that may result. An adverse outcome in one or more of these proceedings could result in adverse judgments, settlements, fines, penalties or other relief that could have a material adverse effect on the consolidated financial condition or results of operations of Ameriprise Financial.
Annual Report 2015
54
REPORT OF INDEPENDENT REGISTERED PUBLIC ACCOUNTING FIRM
To the Trustees of Columbia Funds Series Trust I and the Shareholders of
Columbia Balanced Fund
In our opinion, the accompanying statement of assets and liabilities, including the portfolio of investments, and the related statements of operations and of changes in net assets and the financial highlights present fairly, in all material respects, the financial position of Columbia Balanced Fund (the "Fund," a series of Columbia Funds Series Trust I) at August 31, 2015, and the results of its operations, the changes in its net assets and the financial highlights for each of the periods indicated, in conformity with accounting principles generally accepted in the United States of America. These financial statements and financial highlights (hereafter referred to as "financial statements") are the responsibility of the Fund's management. Our responsibility is to express an opinion on these financial statements based on our audits. We conducted our audits of these financial statements in accordance with the standards of the Public Company Accounting Oversight Board (United States). Those standards require that we plan and perform the audit to obtain reasonable assurance about whether the financial statements are free of material misstatement. An audit includes examining, on a test basis, evidence supporting the amounts and disclosures in the financial statements, assessing the accounting principles used and significant estimates made by management, and evaluating the overall financial statement presentation. We believe that our audits, which included confirmation of securities at August 31, 2015 by correspondence with the custodian, brokers and transfer agent, and the application of alternative auditing procedures where such confirmations had not been received, provide a reasonable basis for our opinion.
PricewaterhouseCoopers LLP
Minneapolis, MN
October 22, 2015
Annual Report 2015
55
FEDERAL INCOME TAX INFORMATION
(Unaudited)
The Fund hereby designates the following tax attributes for the fiscal year ended August 31, 2015. Shareholders will be notified in early 2016 of the amounts for use in preparing 2015 income tax returns.
Tax Designations:
| Qualified Dividend Income | | | 100.00 | % | |
| Dividends Received Deduction | | | 45.40 | % | |
Capital Gain Dividend | | $ | 90,210,085 | | |
Qualified Dividend Income. For taxable, non-corporate shareholders, the percentage of ordinary income distributed during the fiscal year that represents qualified dividend income subject to reduced tax rates.
Dividends Received Deduction. The percentage of ordinary income distributed during the fiscal year that qualifies for the corporate dividends received deduction.
Capital Gain Dividend. The Fund designates as a capital gain dividend the amount reflected above, or if subsequently determined to be different, the net capital gain of such fiscal period.
Annual Report 2015
56
The Trustees serve terms of indefinite duration. The names and birth years of the Trustees and Officers of the Funds in Columbia Funds Series Trust I, the year each was first elected or appointed to office, their principal business occupations during at least the last five years, the number of Funds overseen by each Trustee and other directorships they hold are shown below. Each officer listed below serves as an officer of each Fund in Columbia Funds Series Trust I. The mailing address of each Trustee is: c/o Columbia Management Investment Advisers, LLC, 225 Franklin Street, Mail Drop BX32 05228, Boston, MA 02110.
Independent Trustees
Name, Year of Birth
and Position Held
with the Trust | | Year First
Appointed or
Elected as
Trustee to any
Fund Currently
in the Columbia
Funds Complex
or a Predecessor
Thereof | | Principal Occupation(s)
during the Past Five Years | | Number
of Funds
in the
Columbia
Funds
Complex
Overseen | | Other Directorships
Held by Trustee During
the Past Five Years | |
Janet Langford Carrig
(Born 1957)
Trustee | | | 1996 | | | Senior Vice President, General Counsel and Corporate Secretary, ConocoPhillips (integrated energy company) since September 2007; Deputy General Counsel — Corporate Legal Services, ConocoPhillips from August 2006 to August 2007; Partner, Zelle, Hofmann, Voelbel, Mason & Gette LLP (law firm) from March 2005 to July 2006; Adjunct Professor of Law, Northwestern University from September 2004 to June 2006; Director, UAL Corporation (airline) from February 2006 to July 2006; Chief Administrative Officer and Senior Vice President, Kmart Holding Corporation (consumer goods) from September 2003 to March 2004 | | | 60 | | | None | |
Douglas A. Hacker
(Born 1955)
Trustee and Chairman
of the Board | | | 1996 | | | Independent business executive since May 2006; Executive Vice President — Strategy of United Airlines from December 2002 to May 2006; President of UAL Loyalty Services (airline marketing company) from September 2001 to December 2002; Executive Vice President and Chief Financial Officer of United Airlines from July 1999 to September 2001 | | | 60 | | | Spartan Nash Company, (food distributor); Nash Finch Company (food distributor) from 2005 to 2013; Aircastle Limited (aircraft leasing); SeaCube Container Leasing Ltd. (container leasing) from 2010 to 2013; and Travelport Worldwide Limited (travel information technology) | |
Nancy T. Lukitsh
(Born 1956)
Trustee | | | 2011 | | | Senior Vice President, Partner and Director of Marketing, Wellington Management Company, LLP (investment adviser) from 1997 to 2010; Chair, Wellington Management Investment Portfolios (commingled non-U.S. investment pools) from 2007 to 2010; Director, Wellington Trust Company, NA and other Wellington affiliates from 1997 to 2010 | | | 60 | | | None | |
William E. Mayer
(Born 1940)
Trustee | | | 1991 | | | Partner, Park Avenue Equity Partners (private equity) since February 1999 | | | 60 | | | DynaVox Inc. (speech creation); Lee Enterprises (print media); WR Hambrecht + Co. (financial service provider) from 2000 to 2012; BlackRock Kelso Capital Corporation (investment company); and Premier, Inc. (healthcare) | |
Annual Report 2015
57
TRUSTEES AND OFFICERS (continued)
Independent Trustees (continued)
Name, Year of Birth
and Position Held
with the Trust | | Year First
Appointed or
Elected as
Trustee to any
Fund Currently
in the Columbia
Funds Complex
or a Predecessor
Thereof | | Principal Occupation(s)
during the Past Five Years | | Number
of Funds
in the
Columbia
Funds
Complex
Overseen | | Other Directorships
Held by Trustee During
the Past Five Years | |
David M. Moffett
(Born 1952)
Trustee | | | 2011 | | | Retired. Consultant to Bridgewater and Associates; Chief Executive Officer, Federal Home Loan Mortgage Corporation, from 2008 to 2009; Senior Adviser, Global Financial Services Group, Carlyle Group, Inc., from 2007 to 2008; Vice Chairman and Chief Financial Officer, U.S. Bancorp, from 1993 to 2007 | | | 60 | | | Building Materials Holding Corp. (building materials and construction services); CIT Group Inc. (commercial and consumer finance); eBay Inc. (online trading community); E.W. Scripps Co. (print and television media); Genworth Financial, Inc. (financial and insurance products and services); MBIA Inc. (financial service provider); Paypal Holdings Inc. (payment and data processing services); and University of Oklahoma Foundation | |
Charles R. Nelson
(Born 1942)
Trustee | | | 1981 | | | Retired. Professor Emeritus, University of Washington since 2011; Professor of Economics, University of Washington from 1976 to 2011; Ford and Louisa Van Voorhis Professor of Political Economy, University of Washington from 1993 to 2011; Adjunct Professor of Statistics, University of Washington from 1980 to 2011; Associate Editor, Journal of Money, Credit and Banking from September 1993 to 2008; consultant on econometric and statistical matters | | | 60 | | | None | |
John J. Neuhauser
(Born 1943)
Trustee | | | 1984 | | | President, Saint Michael's College since August 2007; Director or Trustee of several non-profit organizations, including Fletcher Allen Health Care, Inc.; Academic Vice President and Dean of Faculties, Boston College from August 1999 to October 2005; University Professor, Boston College from November 2005 to August 2007 | | | 60 | | | Liberty All-Star Equity Fund and Liberty All-Star Growth Fund (closed-end funds) | |
Patrick J. Simpson
(Born 1944)
Trustee | | | 2000 | | | Partner, Perkins Coie LLP (law firm) | | | 60 | | | None | |
Anne-Lee Verville
(Born 1945)
Trustee | | | 1998 | | | Retired. General Manager, Global Education Industry from 1994 to 1997, President — Application Systems Division from 1991 to 1994, Chief Financial Officer — US Marketing & Services from 1988 to 1991, and Chief Information Officer from 1987 to 1988, IBM Corporation (computer and technology) | | | 60 | | | Enesco Group, Inc. (producer of giftware and home and garden decor products) from 2001 to 2006 | |
Annual Report 2015
58
TRUSTEES AND OFFICERS (continued)
Interested Trustee Affiliate with Investment Manager*
Name, Year of Birth
and Position Held
with the Trust | | Year First
Appointed or
Elected as
Trustee to any
Fund Currently
in the Columbia
Funds Complex
or a Predecessor
Thereof | | Principal Occupation(s)
during the Past Five Years | | Number
of Funds
in the
Columbia
Funds
Complex
Overseen | | Other Directorships
Held by Trustee During
the Past Five Years | |
William F. Truscott
(Born 1960)
Trustee | | | 2012 | | | Chairman of the Board and President, Columbia Management Investment Advisers, LLC since May 2010 and February 2012, respectively (previously President and Chief Investment Officer, 2001-April 2010); Chief Executive Officer, Global Asset Management, Ameriprise Financial, Inc. since September 2012 (previously Chief Executive Officer, U.S. Asset Management & President, Annuities, May 2010-September 2012 and President — U.S. Asset Management and Chief Investment Officer, 2005-April 2010); Director and Chief Executive Officer, Columbia Management Investment Distributors, Inc. since May 2010 and February 2012, respectively (previously Chairman of the Board and Chief Executive Officer, 2006-April 2010); Chairman of the Board and Chief Executive Officer, RiverSource Distributors, Inc. since 2006; Director, Threadneedle Asset Management Holdings, SARL since 2014; President and Chief Executive Officer, Ameriprise Certificate Company, 2006-August 2012 | | | 187 | | | Chairman of the Board, Columbia Management Investment Advisers, LLC since May 2010; Director, Columbia Management Investment Distributors, Inc. since May 2010; Director, Ameriprise Certificate Company, 2006 to January 2013 | |
* Interested person (as defined under the 1940 Act) by reason of being an officer, director, security holder and/or employee of the Investment Manager or Ameriprise Financial.
The Statement of Additional Information has additional information about the Fund's Board members and is available, without charge, upon request by calling 800.345.6611; contacting your financial intermediary; or visiting columbiathreadneedle.com/us.
The Board has appointed officers who are responsible for day-to-day business decisions based on policies it has established. The officers serve at the pleasure of the Board. In addition to Mr. Truscott, who is Senior Vice President, the Funds' other officers are:
Fund Officers
Name,
Address and
Year of Birth | | Position and Year
First Appointed to
Position for any Fund
in the Columbia
Funds Complex or a
Predecessor Thereof | | Principal Occupation(s) During Past Five Years | |
Christopher O. Petersen
5228 Ameriprise
Financial Center
Minneapolis, MN 55474
Born 1970 | | President and Principal Executive Officer (2015) | | Vice President and Lead Chief Counsel, Ameriprise Financial, Inc. since January 2015 (previously, Vice President and Chief Counsel January 2010-December 2014; and Vice President and Group Counsel or Counsel 2004- January 2010); officer of Columbia Funds and affiliated funds since 2007. | |
Michael G. Clarke
225 Franklin Street
Boston, MA 02110
Born 1969 | | Treasurer (2011) and Chief Financial Officer (2009) | | Vice President — Mutual Fund Administration, Columbia Management Investment Advisers, LLC, since May 2010; Managing Director of Fund Administration, Columbia Management Advisors, LLC, September 2004-April 2010; senior officer of Columbia Funds and affiliated funds since 2002. | |
Annual Report 2015
59
TRUSTEES AND OFFICERS (continued)
Fund Officers (continued)
Name,
Address and
Year of Birth | | Position and Year
First Appointed to
Position for any Fund
in the Columbia
Funds Complex or a
Predecessor Thereof | | Principal Occupation(s) During Past Five Years | |
Paul B. Goucher
100 Park Avenue
New York, NY 10017
Born 1968 | | Senior Vice President (2011), Chief Legal Officer (2015) and Assistant Secretary (2008) | | Vice President and Lead Chief Counsel, Ameriprise Financial, Inc. since November 2008 and January 2013, respectively (previously Chief Counsel, January 2010-January 2013 and Group Counsel, November 2008-January 2010). | |
Thomas P. McGuire
225 Franklin Street
Boston, MA 02110
Born 1972 | | Vice President and Chief Compliance Officer (2012) | | Vice President — Asset Management Compliance, Ameriprise Financial, Inc., since May 2010; Chief Compliance Officer, Ameriprise Certificate Company since September 2010; Compliance Executive, Bank of America, 2005-April 2010. | |
Colin Moore
225 Franklin Street
Boston, MA 02110
Born 1958 | | Senior Vice President (2010) | | Executive Vice President and Global Chief Investment Officer, Ameriprise Financial, Inc., since July 2013; Director and Global Chief Investment Officer, Columbia Management Investment Advisers, LLC since May 2010; Manager, Managing Director and Chief Investment Officer, Columbia Management Advisors, LLC, 2007-April 2010. | |
Michael E. DeFao
225 Franklin Street
Boston, MA 02110
Born 1968 | | Vice President (2011) and Assistant Secretary (2010) | | Vice President and Chief Counsel, Ameriprise Financial, Inc. since May 2010; Associate General Counsel, Bank of America, 2005-April 2010. | |
Joseph F. DiMaria
225 Franklin Street
Boston, MA 02110
Born 1968 | | Vice President (2011), Assistant Treasurer (2012) and Chief Accounting Officer (2008) | | Vice President — Mutual Fund Treasurer, Columbia Management Investment Advisers, LLC since May 2010; Director of Fund Administration, Columbia Management Advisors, LLC, 2006-April 2010. | |
Amy Johnson
5228 Ameriprise
Financial Center
Minneapolis, MN 55474
Born 1965 | | Vice President (2006) | | Managing Director and Chief Operating Officer, Columbia Management Investment Advisers, LLC since May 2010 (previously Chief Administrative Officer, 2009-April 2010, and Vice President — Asset Management and Trust Company Services, 2006-2009). | |
Lyn Kephart-Strong
5228 Ameriprise
Financial Center
Minneapolis, MN 55474
Born 1960 | | Vice President (2015) | | President, Columbia Management Investment Services Corp. since October 2014; Vice President & Resolution Officer, Ameriprise Trust Company since August 2009; President, RiverSource Service Corporation 2004-2010. | |
Ryan C. Larrenaga
225 Franklin Street
Boston, MA 02110
Born 1970 | | Vice President and Secretary (2015) | | Vice President and Group Counsel, Ameriprise Financial, Inc. since August 2011 (previously, Counsel from May 2010 to August 2011); Assistant General Counsel, Bank of America, 2005-April 2010; officer of Columbia Funds and affiliated funds since 2005. | |
Annual Report 2015
60
BOARD CONSIDERATION AND APPROVAL OF ADVISORY AGREEMENT
On June 10, 2015, the Board of Trustees (the "Board") and the Trustees who are not interested persons (as defined in the Investment Company Act of 1940) (the "Independent Trustees") of Columbia Funds Series Trust I (the "Trust") unanimously approved the continuation of the Investment Management Services Agreement (the "Advisory Agreement") with Columbia Management Investment Advisers, LLC (the "Investment Manager") with respect to Columbia Balanced Fund (the "Fund"), a series of the Trust. The Board and the Independent Trustees also unanimously approved an agreement (the "Management Agreement" and, together with the Advisory Agreement, the "Agreements") combining the Advisory Agreement and the Fund's existing administrative services agreement (the "Administrative Services Agreement") in a single agreement. The Board and the Independent Trustees approved the restatement of the Advisory Agreement with the Management Agreement to be effective for the Fund on January 1, 2016, the Fund's next annual prospectus update. As detailed below, the Board's Advisory Fees and Expenses Committee (the "Committee") and the Board met on multiple occasions to review and discuss, both among themselves and with the management team of the Investment Manager, materials provided by the Investment Manager and others before determining to approve the Management Agreement and the continuation of the Advisory Agreement.
In connection with their deliberations regarding the approval of the Management Agreement and the continuation of the Advisory Agreement, the Committee and the Board evaluated materials requested from the Investment Manager regarding the Fund and the Agreements, and discussed these materials with representatives of the Investment Manager at Committee meetings held on March 3, 2015, April 29, 2015 and June 9, 2015 and at Board meetings held on March 4, 2015 and June 10, 2015. In addition, the Board considers matters bearing on the Agreements at most of its other meetings throughout the year and meets regularly with senior management of the Trust and the Investment Manager. Through the Board's Investment Oversight Committees, Trustees also meet with selected portfolio managers of the funds the Trustees oversee and other investment personnel at various times throughout the year. The Committee and the Board also consulted with its independent fee consultant, Fund counsel and with the Independent Trustees' independent legal counsel, who advised on various matters with respect to the Committee's and the Board's considerations and otherwise assisted the Committee and the Board in their deliberations. On June 9, 2015, the Committee recommended that the Board approve the Management Agreement and the continuation of the Advisory Agreement. On June 10, 2015, the Board, including the Independent Trustees, voting separately, unanimously approved the Management Agreement and the continuation of the Advisory Agreement for the Fund.
The Committee and the Board considered all information that they, their legal counsel or the Investment Manager believed reasonably necessary to evaluate and to determine whether to approve the Management Agreement and the continuation of the Advisory Agreement. The information and factors considered by the Committee and the Board in recommending for approval or approving the Management Agreement and the continuation of the Advisory Agreement for the Fund included the following:
• Information on the investment performance of the Fund relative to the performance of a group of mutual funds determined to be comparable to the Fund by an independent third-party data provider, as well as performance relative to benchmarks;
• Information on the Fund's advisory fees and total expenses, including information comparing the Fund's expenses to those of a group of comparable mutual funds, as determined by the independent third-party data provider;
• The Investment Manager's agreement to contractually limit or cap total operating expenses for the Fund so that total operating expenses (excluding certain fees and expenses, such as portfolio transaction costs and certain other investment related expenses, interest, taxes, acquired fund fees and expenses, and extraordinary expenses) would not exceed a specified percentage of the Fund's average annual net assets from January 1, 2016 through December 31, 2016;
• The terms and conditions of the Agreements;
Annual Report 2015
61
BOARD CONSIDERATION AND APPROVAL OF ADVISORY AGREEMENT (continued)
• The current and proposed terms and conditions of other agreements and arrangements with affiliates of the Investment Manager relating to the operations of the Fund, including the Administrative Services Agreement1 and agreements with respect to the provision of distribution and transfer agency services to the Fund;
• Descriptions of various functions performed by the Investment Manager under the Agreements, including portfolio management and portfolio trading practices;
• Information regarding the management fees and investment performance of similarly-managed portfolios of other clients of the Investment Manager, including institutional separate accounts;
• Information regarding the reputation, regulatory history and resources of the Investment Manager, including information regarding senior management, portfolio managers and other personnel;
• Information regarding the capabilities of the Investment Manager with respect to compliance monitoring services, including an assessment of the Investment Manager's compliance system by the Fund's Chief Compliance Officer; and
• The profitability to the Investment Manager and its affiliates from their relationships with the Fund.
Nature, Extent and Quality of Services Provided under the Agreements
The Committee and the Board considered the nature, extent and quality of services provided to the Fund by the Investment Manager and its affiliates under the Agreements and under separate agreements for the provision of transfer agency and administrative services, and the resources dedicated to the Fund and the other Columbia Funds by the Investment Manager and its affiliates. The Committee and the Board also determined that the nature and level of the services to be provided under the Management Agreement would not decrease relative to the services provided under the Advisory Agreement and the Administrative Services Agreement. The Committee and the Board considered, among other things, the Investment Manager's ability to attract, motivate and retain highly qualified research, advisory and supervisory investment professionals (including personnel and other resources, compensation programs for personnel involved in fund management, reputation and other attributes), the portfolio management services provided by those investment professionals, and the quality of the Investment Manager's investment research capabilities and trade execution services. The Committee and the Board also considered the potential benefits to shareholders of investing in a mutual fund that is part of a fund complex offering exposure to a variety of asset classes and investment disciplines and providing a variety of fund and shareholder services.
The Committee and the Board also considered the professional experience and qualifications of the senior personnel of the Investment Manager, which included consideration of the Investment Manager's experience with similarly-structured funds. The Committee and the Board noted the compliance programs of and the compliance-related resources provided to the Fund by the Investment Manager and its affiliates, and considered the Investment Manager's ability to provide administrative services to the Fund and coordinate the activities of the Fund's other service providers. In evaluating the nature, extent and quality of services provided under the Agreements, the Committee and the Board considered that these services were provided to the Fund, rather than directly to Fund shareholders. The Committee and the Board accordingly affirmed, after considering various other matters, including the potential benefits to the Fund and its shareholders of the Independent Trustees' important role as pre-suit gatekeepers with respect to claims that they may determine are meritless or contrary to the Fund's best interests, that it was not the intention of the Board or the Investment Manager that there be any third-party beneficiaries of the Agreements. After reviewing these and related factors, the Committee and the Board concluded, within the context of their overall conclusions, that the nature, extent and quality of the services provided to the Fund under the Agreements supported the approval of the Management Agreement and the continuation of the Advisory Agreement.
1 Like the Advisory Agreement, the Administrative Services Agreement will terminate with respect to the Fund once the Management Agreement is effective for the Fund.
Annual Report 2015
62
BOARD CONSIDERATION AND APPROVAL OF ADVISORY AGREEMENT (continued)
Investment Performance
The Committee and the Board reviewed information about the performance of the Fund over various time periods, including performance information relative to benchmarks and information based on reports of the independent third-party data provider that compared the performance of the Fund to the performance of a group of comparable mutual funds, and data provided by the independent fee consultant. The Committee and the Board also reviewed a description of the third party's methodology for identifying the Fund's peer groups for purposes of performance and expense comparisons.
The Committee and the Board noted that, through December 31, 2014, the Fund's performance was in the ninth, twelfth and seventeenth percentile (where the best performance would be in the first percentile) of its category selected by the independent third-party data provider for the purposes of performance comparisons for the one-, three- and five- year periods, respectively.
The Committee and the Board also considered the Investment Manager's performance and reputation generally, the Investment Manager's historical responsiveness to Board concerns about performance, and the Investment Manager's willingness to take steps intended to improve performance. After reviewing these and related factors, the Committee and the Board concluded, within the context of their overall conclusions, that the performance of the Fund was sufficient, in light of other considerations, to warrant the continuation of the Advisory Agreement and the approval of the Management Agreement.
Investment Advisory Fee Rates and Other Expenses
The Committee and the Board considered the advisory fees charged to the Fund under the Advisory Agreement as well as the total expenses incurred by the Fund. In assessing the reasonableness of the fees under the Advisory Agreement, the Committee and the Board considered, among other information, the Fund's advisory fee and its total expense ratio as a percentage of average daily net assets. The Committee and the Board also considered that the proposed management fee would not exceed the sum of the fee rates payable under the Advisory Agreement and the Administrative Services Agreement. The Committee and the Board considered data provided by the independent fee consultant. The Committee and the Board noted that, as of December 31, 2014, the Fund's actual management fee and net expense ratio are ranked in the fourth and second quintiles, respectively, (where the lowest fees and expenses would be in the first quintile) against the Fund's expense universe as determined by the independent third-party data provider for purposes of expense comparison. The Committee and the Board also took into account the fee waiver and expense limitation arrangements agreed to by the Investment Manager, as noted above.
The Committee and the Board also received and considered information about the advisory fees charged by the Investment Manager to institutional separate accounts. In considering the fees charged to those accounts, the Committee and the Board took into account, among other things, the Investment Manager's representations about the differences between managing mutual funds as compared to other types of accounts, including differences in the services provided, differences in the risk profile of such business for the Investment Manager and the additional resources required to manage mutual funds effectively. The Committee and the Board also received and considered information about the fees charged by the Investment Manager for sub-advisory services provided to comparable unaffiliated funds. In evaluating the Fund's advisory fees, the Committee and the Board also took into account the demands, complexity and quality of the investment management of the Fund.
After reviewing these and related factors, the Committee and the Board concluded, within the context of their overall conclusions, that the advisory/management fee rates and expenses of the Fund were sufficient, in light of other considerations, to warrant the approval of the Management Agreement and continuation of the Advisory Agreement.
Costs of Services Provided and Profitability
The Committee and the Board also took note of the costs the Investment Manager and its affiliates incur in connection with the services provided (both on an absolute and relative basis) and the profitability to the Investment Manager and its affiliates in connection with their relationships with the Fund.
Annual Report 2015
63
BOARD CONSIDERATION AND APPROVAL OF ADVISORY AGREEMENT (continued)
The Committee and the Board also considered the compensation directly or indirectly received by the Investment Manager's affiliates in connection with their relationships with the Fund. The Committee and the Board reviewed information provided by management as to the profitability to the Investment Manager and its affiliates of their relationships with the Fund, information about the allocation of expenses used to calculate profitability, and comparisons of profitability levels realized in 2014 to profitability levels realized in 2013. When reviewing profitability, the Committee and the Board also considered court cases in which adviser profitability was an issue in whole or in part, the performance of similarly managed funds, the performance of the Fund, and the expense ratio of the Fund. The Committee and the Board also considered information provided by the Investment Manager regarding the Investment Manager's financial condition and comparing its profitability to that of other asset management firms that are, or are subsidiaries of, publicly traded companies.
After reviewing these and related factors, the Committee and the Board concluded, within the context of their overall conclusions, that the costs of services provided and the profitability to the Investment Manager and its affiliates from their relationships with the Fund supported the approval of the Management Agreement and the continuation of the Advisory Agreement.
Economies of Scale
The Committee and the Board considered the potential existence of economies of scale in the provision by the Investment Manager of services to the Fund, to groups of related funds, and to the Investment Manager's investment advisory clients as a whole, and whether those economies of scale were shared with the Fund through breakpoints in investment advisory fees or other means, such as expense limitation arrangements and additional investments by the Investment Manager in investment, trading and compliance resources. The Committee and the Board noted that the investment advisory and management fee schedules for the Fund contained breakpoints that would reduce the fee rate on assets above specified threshold levels.
In considering these matters, the Committee and the Board also considered the costs of the services provided and the profitability to the Investment Manager and its affiliates from their relationships with the Fund, as discussed above. After reviewing these and related factors, the Committee and the Board concluded, within the context of their overall conclusions, that the extent to which any economies of scale were expected to be shared with the Fund supported the approval of the Management Agreement and the continuation of the Advisory Agreement.
Other Benefits to the Investment Manager
The Committee and the Board received and considered information regarding "fall-out" or ancillary benefits received by the Investment Manager and its affiliates as a result of their relationships with the Fund, such as the engagement of the Investment Manager to provide administrative services to the Fund and the engagement of the Investment Manager's affiliates to provide distribution and transfer agency services to the Fund. In this regard, among other matters, the Committee and the Board considered that the Fund's distributor retains a portion of the distribution fees from the Fund receives a portion of the sales charges on sales or redemptions of certain classes of shares of the Fund. The Committee and the Board also considered the benefits of research made available to the Investment Manager by reason of brokerage commissions generated by the Fund's securities transactions, and reviewed information about the Investment Manager's practices with respect to allocating portfolio transactions for brokerage and research services. The Committee and the Board considered the possible conflicts of interest associated with certain fall-out or other ancillary benefits and the reporting, disclosure and other processes that are in place to address such possible conflicts of interest. The Committee and the Board recognized that the Investment Manager's profitability would be somewhat lower without these benefits.
Conclusion
The Committee and the Board reviewed all of the above considerations in reaching their decisions to recommend or approve the Management Agreement and the continuation of the Advisory Agreement. In their deliberations, the Trustees did not identify any particular information that was all-important or controlling, and individual Trustees may have attributed different weights to the various factors. Based on their evaluation of all factors that they deemed to be material, including those factors described above, and assisted by the advice of independent legal counsel, the Board, including the Independent Trustees, voting separately, unanimously approved the Management Agreement and the continuation of the Advisory Agreement.
Annual Report 2015
64
IMPORTANT INFORMATION ABOUT THIS REPORT
Each fund mails one shareholder report to each shareholder address. If you would like more than one report, please call shareholder services at 800.345.6611 and additional reports will be sent to you.
The policy of the Board is to vote the proxies of the companies in which each fund holds investments consistent with the procedures as stated in the Statement of Additional Information (SAI). You may obtain a copy of the SAI without charge by calling 800.345.6611; contacting your financial intermediary; visiting columbiathreadneedle.com/us; or searching the website of the Securities and Exchange Commission (SEC) at sec.gov. Information regarding how each fund voted proxies relating to portfolio securities is filed with the SEC by August 31st for the most recent 12-month period ending June 30th of that year, and is available without charge by visiting columbiathreadneedle.com/us, or searching the website of the SEC at sec.gov.
Each fund files a complete schedule of portfolio holdings with the SEC for the first and third quarters of each fiscal year on Form N-Q. Each fund's Form N-Q is available on the SEC's website at sec.gov and may be reviewed and copied at the SEC's Public Reference Room in Washington, D.C. Information on the operation of the Public Reference Room may be obtained by calling 800.SEC.0330. Each fund's complete schedule of portfolio holdings, as filed on Form N-Q, can also be obtained without charge, upon request, by calling 800.345.6611.
Annual Report 2015
65
Columbia Balanced Fund
P.O. Box 8081
Boston, MA 02266-8081

This information is for use with concurrent or prior delivery of a fund prospectus. Please read and consider the investment objectives, risks, charges and expenses for any fund carefully before investing. For a prospectus and summary prospectus, which contains this and other important information about the Fund, go to columbiathreadneedle.com/us. The Fund is distributed by Columbia Management Investment Distributors, Inc., member FINRA, and managed by Columbia Management Investment Advisers, LLC.
Columbia Threadneedle Investments (Columbia Threadneedle) is the global brand name of the Columbia and Threadneedle group of companies.
All rights reserved. Columbia Management Investment Distributors, Inc., 225 Franklin Street, Boston, MA 02110-2804
© 2015 Columbia Management Investment Advisers, LLC.
columbiathreadneedle.com/us
ANN120_08_E01_(10/15)

ANNUAL REPORT
August 31, 2015

COLUMBIA EMERGING MARKETS FUND

ABOUT COLUMBIA THREADNEEDLE INVESTMENTS
Columbia Threadneedle Investments is a leading global asset management group that provides a broad range of actively managed investment strategies and solutions for individual, institutional and corporate clients around the world.
With more than 2,000 people, including over 450 investment professionals based in North America, Europe and Asia, we manage $503 billion* of assets across developed and emerging market equities, fixed income, asset allocation solutions and alternatives. We are the 13th largest manager of long-term mutual fund assets in the U.S.** and the 4th largest manager of retail funds in the U.K.***
Our priority is the investment success of our clients. We aim to deliver the investment outcomes they expect through an investment approach that is team-based, performance-driven and risk-aware. Our culture is dynamic and interactive. By sharing our insights across asset classes and geographies, we generate richer perspectives on global, regional and local investment landscapes. The ability to exchange and debate investment ideas in a collaborative environment enriches our teams' investment processes. More importantly, it results in better informed investment decisions for our clients.
Columbia funds are distributed by Columbia Management Investment Distributors, Inc., member FINRA, and managed by Columbia Management Investment Advisers, LLC.
Columbia Threadneedle Investments (Columbia Threadneedle) is the global brand name of the Columbia and Threadneedle group of companies.
* In U.S. dollars as of June 30, 2015. Source: Ameriprise Q2 Earnings Release. Includes all assets managed by entities in the Columbia and Threadneedle groups of companies. Contact us for more current data.
** Source: ICI as of June 30, 2015 for Columbia Management Investment Advisers, LLC.
*** Source: Investment Association as of June 2015 for Threadneedle Asset Management Limited.
© 2015 Columbia Management Investment Advisers, LLC. All rights reserved.
Not part of the shareholder report
Get the market insight you need from our investment experts
Connect with Columbia Threadneedle Investments
Investor insight
Find economic and market commentary, investment videos, white papers, mutual fund commentary and more at columbiathreadneedle.com/us.
Columbia Threadneedle Investor Newsletter (e-newsletter)
Read our award-winning* shareholder newsletter. Our quarterly newsletter is available online and provides timely and relevant content about economic trends, fund news, service enhancements and changes. Sign up to receive the newsletter electronically at columbiathreadneedle.com/
us/newsletter.
Investment videos
Get analysis of current events and trends that may affect your investments. Visit our online video library to watch and discover what our thought leaders are saying about the financial markets and economy.
Social media
We offer you multiple ways to access our market commentary and investment insights.
n Perspectives blog at columbiathreadneedle.com/us
Read timely posts by our investment team, including our chief investment officer, chief economist and portfolio managers.
n twitter.com/CTinvest_US
Follow us on Twitter for quick, up-to-the-minute comments on market news and more.
n youtube.com/CTinvestUS
View our commentaries on the economy, markets and current investment opportunities.
n linkedin.com/company/columbia-threadneedle-investments-us
Connect with us on LinkedIn for updates from our thought leaders.
*Columbia Threadneedle Investor Newsletter was awarded top honors in the Mutual Fund Education Alliance STAR Awards competition for excellence in mutual fund marketing and communications in 2011, 2012 and 2013. Materials in the competition were evaluated on educational value, message comprehension, effective design and objectives.
Not part of the shareholder report
Stay informed
Become a subscriber to receive the latest investment publications and mutual fund commentaries
Subscribe to Columbia Threadneedle Investments
Email subscription center
Subscribe to the latest information from Columbia Threadneedle. Visit our email subscription center at columbiathreadneedle.com/us/subscribe to register for economic and market commentary, product and service updates, white papers and more.
n Columbia Threadneedle Investor Newsletter
Quarterly newsletter featuring the latest macro- and micro-economic trends, investment themes, products, service changes and other items of interest to our investors
n Investment Strategy Outlook
Quarterly publication featuring the Columbia Threadneedle Asset Allocation Team's perspective on global economic investment conditions and markets
n MarketTrack
Quarterly publication featuring more than 40 charts and graphs that highlight the current state of the economy and the markets; includes straightforward insight on current investment opportunities
n White papers
Frequent articles that delve deep into a variety of investment topics
n Mutual fund updates
Quarterly portfolio manager commentary and fund fact sheets available for Columbia funds. (Not all funds have a commentary.)
Register your information online at columbiathreadneedle.com/us/subscribe and select the publications you would like to receive. Update your subscriptions at any time by accessing the email subscription center.
 Dear Shareholder,
Today's investors are typically focused on outcomes, like living a certain retirement lifestyle, paying for college education or building a legacy. But in today's complex global investment landscape, even simple goals are not easily achieved.
At Columbia Threadneedle Investments, we aspire to help satisfy five core needs of today's investors:
n Generate an appropriate stream of income in retirement
Traditional approaches to generating income may not provide the diversification benefits they once did, and they may actually introduce unwanted risk in today's market. To seek to improve your potential to live comfortably long term, we endeavor to pursue investments that explore less traveled paths to income.
n Navigate a changing interest rate environment
Today's uncertain market environment includes the prospect of a rise in interest rates. Blending traditional investments with non-traditional or alternative products may help protect your wealth during periods of volatility. We can attempt to help strengthen your portfolio with agile products designed to take on the market's ups and downs.
n Maximize after-tax returns
In an environment where what you keep may be more important than what you earn, municipal bonds can help mitigate high tax burdens while providing potentially attractive yields. Our state and federal tax-exempt products are aimed at helping investors manage risk, minimize the fluctuation of capital and grow wealth on a more tax-efficient basis.
n Grow assets to achieve financial goals
We believe that finding and protecting growth comes from a disciplined security selection process designed to create excess return. Our goal is to provide investment solutions built to help you face today's market challenges and grow your assets at each crossroad of your journey.
n Ease the impact of volatile markets
Despite a bull market run that has benefited many investors over the past several years, it's important to remember the lessons of 2008 and the value that a well-diversified portfolio may provide through times of market volatility. We are here to help you hold onto the savings you have worked tirelessly to amass, and to provide you the best opportunity to maintain your standard of living regardless of market conditions.
Find out today how we can help you confidently invest to realize your dreams. Please visit us at blog.columbiathreadneedleus.com/our-best-ideas to learn more about our unique investment solutions.
The world is constantly changing, but our priority remains the same: to help you secure your finances, meet your goals and achieve success. Thank you for your continued investment with us.
Sincerely,

Christopher O. Petersen
President, Columbia Funds
Investors should consider the investment objectives, risks, charges and expenses of a mutual fund carefully before investing. For a free prospectus and summary prospectus, which contains this and other important information about a fund, visit columbiathreadneedle.com/us. The prospectus should be read carefully before investing.
Columbia Funds are distributed by Columbia Management Investment Distributors, Inc., member FINRA, and managed by Columbia Management Investment Advisers, LLC.
© 2015 Columbia Management Investment Advisers, LLC. All rights reserved.
COLUMBIA EMERGING MARKETS FUND
Fund Investment Manager
Columbia Management Investment
Advisers, LLC
225 Franklin Street
Boston, MA 02110
Fund Distributor
Columbia Management Investment
Distributors, Inc.
225 Franklin Street
Boston, MA 02110
Fund Transfer Agent
Columbia Management Investment
Services Corp.
P.O. Box 8081
Boston, MA 02266-8081
For more information about any of the funds, please visit columbiathreadneedle.com/us or call 800.345.6611. Customer Service Representatives are available to answer your questions Monday through Friday from 8 a.m. to 7 p.m. Eastern time.
The views expressed in this report reflect the current views of the respective parties. These views are not guarantees of future performance and involve certain risks, uncertainties and assumptions that are difficult to predict, so actual outcomes and results may differ significantly from the views expressed. These views are subject to change at any time based upon economic, market or other conditions and the respective parties disclaim any responsibility to update such views. These views may not be relied on as investment advice and, because investment decisions for a Columbia fund are based on numerous factors, may not be relied on as an indication of trading intent on behalf of any particular Columbia fund. References to specific securities should not be construed as a recommendation or investment advice.
Performance Overview | | | 3 | | |
Manager Discussion of Fund Performance | | | 5 | | |
Understanding Your Fund's Expenses | | | 8 | | |
Portfolio of Investments | | | 9 | | |
Statement of Assets and Liabilities | | | 15 | | |
Statement of Operations | | | 17 | | |
Statement of Changes in Net Assets | | | 18 | | |
Financial Highlights | | | 21 | | |
Notes to Financial Statements | | | 32 | | |
Report of Independent Registered
Public Accounting Firm | | | 40 | | |
Federal Income Tax Information | | | 41 | | |
Trustees and Officers | | | 42 | | |
Board Consideration and Approval of Advisory Agreement | | | 46 | | |
Important Information About This Report | | | 51 | | |
COLUMBIA EMERGING MARKETS FUND
Performance Summary
n Columbia Emerging Markets Fund (the Fund) Class A shares returned -19.65% excluding sales charges for the 12-month period that ended August 31, 2015.
n The Fund's benchmark, the MSCI Emerging Markets Index (Net), returned -22.95% during the 12-month period, while the MSCI EAFE Index (Net), a measure of more developed foreign markets, returned -7.47%.
n The Fund's relative performance was helped by its underweight position in commodity-producing countries and below-benchmark weightings in the underperforming energy and materials sectors.
Average Annual Total Returns (%) (for period ended August 31, 2015)
| | | Inception | | 1 Year | | 5 Years | | 10 Years | |
Class A* | | 09/28/07 | | | | | | | | | | | | | |
Excluding sales charges | | | | | | | -19.65 | | | | 0.17 | | | | 4.70 | | |
Including sales charges | | | | | | | -24.29 | | | | -1.01 | | | | 4.08 | | |
Class B* | | 02/28/13 | | | | | | | | | | | | | |
Excluding sales charges | | | | | | | -20.30 | | | | -0.59 | | | | 3.89 | | |
Including sales charges | | | | | | | -24.29 | | | | -0.93 | | | | 3.89 | | |
Class C* | | 09/28/07 | | | | | | | | | | | | | |
Excluding sales charges | | | | | | | -20.28 | | | | -0.62 | | | | 3.90 | | |
Including sales charges | | | | | | | -21.08 | | | | -0.62 | | | | 3.90 | | |
Class I* | | 09/27/10 | | | -19.33 | | | | 0.58 | | | | 5.02 | | |
Class K* | | 02/28/13 | | | -19.50 | | | | 0.33 | | | | 4.84 | | |
Class R* | | 09/27/10 | | | -19.93 | | | | -0.08 | | | | 4.41 | | |
Class R4* | | 03/19/13 | | | -19.45 | | | | 0.41 | | | | 4.94 | | |
Class R5* | | 11/08/12 | | | -19.35 | | | | 0.50 | | | | 4.98 | | |
Class W* | | 09/27/10 | | | -19.74 | | | | 0.14 | | | | 4.67 | | |
Class Y* | | 11/08/12 | | | -19.34 | | | | 0.53 | | | | 5.00 | | |
Class Z | | 01/02/98 | | | -19.41 | | | | 0.42 | | | | 4.94 | | |
MSCI Emerging Markets Index (Net) | | | | | | | -22.95 | | | | -0.92 | | | | 5.52 | | |
MSCI EAFE Index (Net) | | | | | | | -7.47 | | | | 7.05 | | | | 3.96 | | |
Returns for Class A are shown with and without the maximum initial sales charge of 5.75%. Returns for Class B are shown with and without the applicable contingent deferred sales charge (CDSC) of 5.00% in the first year, declining to 1.00% in the sixth year and eliminated thereafter. Returns for Class C are shown with and without the 1.00% CDSC for the first year only. The Fund's other classes are not subject to sales charges and have limited eligibility. Please see the Fund's prospectus for details. Performance for different share classes will vary based on differences in sales charges and fees associated with each class. All results shown assume reinvestment of distributions during the period. Returns do not reflect the deduction of taxes that a shareholder may pay on Fund distributions or on the redemption of Fund shares. Performance results reflect the effect of any fee waivers or reimbursements of Fund expenses by Columbia Management Investment Advisers, LLC and/or any of its affiliates. Absent these fee waivers or expense reimbursement arrangements, performance results would have been lower.
The performance information shown represents past performance and is not a guarantee of future results. The investment return and principal value of your investment will fluctuate so that your shares, when redeemed, may be worth more or less than their original cost. Current performance may be lower or higher than the performance information shown. You may obtain performance information current to the most recent month-end by contacting your financial intermediary, visiting columbiathreadneedle.com/us or calling 800.345.6611.
*The returns shown for periods prior to the share class inception date (including returns for the Life of the Fund, if shown, which are since Fund inception) include the returns of the Fund's oldest share class. These returns are adjusted to reflect any higher class-related operating expenses of the newer share classes, as applicable. Please visit columbiathreadneedle.com/us/investment-products/mutual-funds/ appended-performance for more information.
The MSCI Emerging Markets Index (Net) is a free float-adjusted market capitalization index that is designed to measure equity market performance of emerging markets.
The MSCI EAFE Index (Net) is a free float-adjusted market capitalization index that is designed to measure the equity market performance of developed markets, excluding the U.S. and Canada. The index is compiled from a composite of securities markets of Europe, Australasia and the Far East and is widely recognized by investors in foreign markets as the measurement index for portfolios of non-North American securities.
Indices are not available for investment, are not professionally managed and do not reflect sales charges, fees, brokerage commissions, taxes (except the MSCI Emerging Markets Index (Net) and the MSCI EAFE Index (Net), which reflect reinvested dividends net of withholding taxes) or other expenses of investing. Securities in the Fund may not match those in an index.
Annual Report 2015
3
COLUMBIA EMERGING MARKETS FUND
PERFORMANCE OVERVIEW (continued)
Performance of a Hypothetical $10,000 Investment (September 1, 2005 – August 31, 2015)
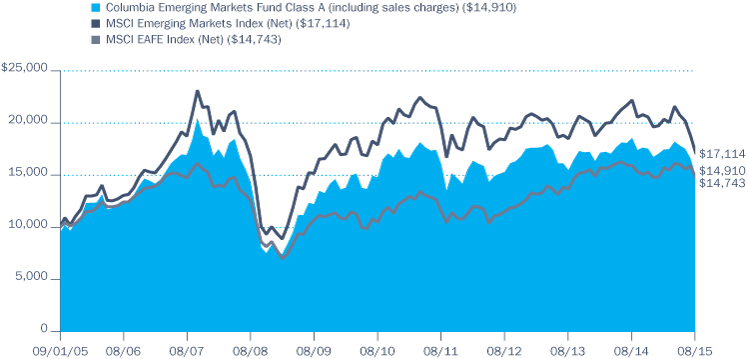
The chart above shows the change in value of a hypothetical $10,000 investment in Class A shares of Columbia Emerging Markets Fund during the stated time period, and does not reflect the deduction of taxes that a shareholder may pay on Fund distributions or on the redemption of Fund shares.
Annual Report 2015
4
COLUMBIA EMERGING MARKETS FUND
MANAGER DISCUSSION OF FUND PERFORMANCE
The Fund's Class A shares returned -19.65% excluding sales charges during the 12-month period that ended August 31, 2015. The Fund's benchmark, the MSCI Emerging Markets Index (Net), returned -22.95%. The MSCI EAFE Index (Net), a measure of more developed foreign markets, returned -7.47%. The Fund's relative performance was helped by its underweight position in commodity-producing countries and below-benchmark weightings in the underperforming energy and materials sectors.
Market Overview
Emerging markets stocks experienced significant headwinds during the 12 months ended August 31, 2015, leading to above-average volatility and substantial underperformance relative to the developed markets. The environment of slow global growth contributed to a sharp downturn in commodity prices, which weighed heavily on stocks in commodity-exporting countries. Further, the strength of the U.S. dollar had a two-pronged impact in that it made dollar-linked emerging markets currencies less competitive and also depressed returns for dollar-based investors. Emerging markets equities were also pressured by the uncertainty associated with U.S. Federal Reserve (Fed) policy. Since higher U.S. rates are typically a negative for emerging markets stocks, investors remained on edge due to the persistent speculation regarding the timing of the Fed's first rate hike. These factors had the most pronounced impact from May onward, causing the index to close the period near its lowest level since 2009.
Performance and Positioning
Although the Fund produced a negative absolute return for the period, our actively managed, bottom-up approach added value by mitigating some of the downside in the broader market. A key factor in our outperformance was our decision to tilt the Fund away from countries that are commodity exporters — such as Brazil, Peru, Malaysia, and Colombia, among others — and emphasize those that are commodity importers, including China, India, and the Philippines. This strategy proved very helpful to relative performance, as many exporting nations finished among the worst-performing countries in the asset class during the period.
Our efforts to minimize commodities exposure were also reflected in the Fund's sector weightings, highlighted by our underweight positions in energy and materials — the two worst-performing sectors in the market during the period. At the same time, we held overweight positions in technology and health care, both of which outperformed the broader market. Our preference for these sectors reflects our desire to own innovative companies with business models or product cycles that are relatively independent of broader economic trends. We see health care, in particular, as being an important growth area. We expect that as per-capita gross domestic product rises throughout the emerging markets, consumers will devote more of their budgets to improving their health care. With the sector currently making up only about 2% of the benchmark, we believe there may be significant upside potential in the coming years.
Portfolio Management
Dara White, CFA
Jasmine Weili Huang, CFA, CPA (U.S. and China), CFM
Robert Cameron
Young Kim
Morningstar Style BoxTM

The Morningstar Style BoxTM is based on a fund's portfolio holdings. For equity funds, the vertical axis shows the market capitalization of the stocks owned, and the horizontal axis shows investment style (value, blend, or growth). Information shown is based on the most recent data provided by Morningstar.
© 2015 Morningstar, Inc. All rights reserved. The Morningstar information contained herein: (1) is proprietary to Morningstar and/or its content providers; (2) may not be copied or distributed; and (3) is not warranted to be accurate, complete or timely. Neither Morningstar nor its content providers are responsible for any damages or losses arising from any use of this information.
Top Ten Holdings (%)
(at August 31, 2015) | |
Tencent Holdings Ltd. (China) | | | 4.1 | | |
Naspers Ltd., Class N
(South Africa) | | | 3.0 | | |
Industrial & Commercial Bank
of China Ltd., Class H (China) | | | 2.9 | | |
Samsung Electronics Co., Ltd.
(South Korea) | | | 2.8 | | |
Ping An Insurance Group Co.
of China Ltd., Class H (China) | | | 2.6 | | |
China Mobile Ltd. (China) | | | 2.4 | | |
Taiwan Semiconductor
Manufacturing Co., Ltd. (Taiwan) | | | 2.2 | | |
SK Telecom Co., Ltd. (South Korea) | | | 1.7 | | |
Cathay Financial Holding Co., Ltd.
(Taiwan) | | | 1.7 | | |
Metropolitan Bank & Trust Co.
(Philippines) | | | 1.7 | | |
Percentages indicated are based upon total investments (excluding Money Market Funds).
For further detail about these holdings, please refer to the section entitled "Portfolio of Investments."
Fund holdings are as of the date given, are subject to change at any time, and are not recommendations to buy or sell any security.
Annual Report 2015
5
COLUMBIA EMERGING MARKETS FUND
MANAGER DISCUSSION OF FUND PERFORMANCE (continued)
Country Breakdown (%)
(at August 31, 2015) | |
Brazil | | | 5.1 | | |
China | | | 26.3 | | |
Czech Republic | | | 0.5 | | |
Hong Kong | | | 2.4 | | |
India | | | 15.1 | | |
Indonesia | | | 3.4 | | |
Mexico | | | 3.4 | | |
Peru | | | 0.6 | | |
Philippines | | | 4.1 | | |
Poland | | | 0.4 | | |
Russian Federation | | | 3.7 | | |
South Africa | | | 6.5 | | |
South Korea | | | 10.1 | | |
Taiwan | | | 10.4 | | |
Thailand | | | 2.6 | | |
Turkey | | | 1.3 | | |
United Arab Emirates | | | 1.0 | | |
United Kingdom | | | 0.2 | | |
United States(a) | | | 2.9 | | |
Total | | | 100.0 | | |
Country Breakdown is based primarily on issuer's place of organization/incorporation. Percentages indicated are based upon total investments. The Fund's portfolio composition is subject to change.
(a) Includes investments in Money Market Funds.
Equity Sector Breakdown (%)
(at August 31, 2015) | |
Consumer Discretionary | | | 14.9 | | |
Consumer Staples | | | 7.1 | | |
Energy | | | 3.3 | | |
Financials | | | 28.6 | | |
Health Care | | | 5.7 | | |
Industrials | | | 5.1 | | |
Information Technology | | | 22.2 | | |
Materials | | | 5.1 | | |
Telecommunication Services | | | 6.0 | | |
Utilities | | | 2.0 | | |
Total | | | 100.0 | | |
Percentages indicated are based upon total equity investments. The Fund's portfolio composition is subject to change.
Stock selection also played a positive role in the Fund's outperformance, with our strongest relative results occurring in India, the Philippines, and South Africa. India-based Eicher Motors, which experienced strong sales for its Royal Enfield motorcycle brand, was the largest positive contributor to performance. Dish TV India, GT Capital Holdings (Philippines) and PT Mitra Keluarga Karyasehat, an Indonesia-based hospital operator, also stood out as being leading contributors. On the negative side, our investments in the financial and information technology sectors underperformed. Our leading detractors were largely stocks that were directly impacted by slowing economic growth, such as the Mexican cement producer Cemex and Melco Crown Entertainment, which operates casinos in China's Macau region. Certain banking stocks that were affected by slowdowns in their respective countries also detracted from performance, including Bangkok Bank and Kasikornbank in Thailand, and Itaú Unibanco Holding SA in Brazil. We sold the Fund's positions in Melco Crown Entertainment and Bangkok Bank before the close of the reporting period.
Opportunities in China and India
China and India were the Fund's largest country weightings at the close of the period, and both represented meaningful overweights relative to the benchmark. China's stock market experienced unusual volatility during the past year, with a substantial rally in March and April followed by an even more dramatic decline in the subsequent four months. These fluctuations, in dominating the headlines, have obscured what we believe are the increasingly attractive investment opportunities in the country. We were underweight in China for many years due to our concerns about slowing economic growth and potential overcapacity, but we moved to an overweight during the period due to the central bank's looser monetary policy and the government's effort at making meaningful economic reforms. India, for its part, has already moved past its economic slowdown and is seeing growth pick up due in part to its accommodative monetary policy and the reforms being put in place by the country's pro-business government. With 150 million citizens set to enter the workforce in the next ten years, we believe India is at the beginning of an extended period of prosperity. Not least, we have found that both countries are home to an abundance of individual companies that meet our bottom-up criteria.
Outlook
At this time, we anticipate additional volatility in the coming months, as the challenges that emerging markets stocks have faced throughout the past year are still largely in place. In our view, Fed policy remains highly uncertain, the strength of the U.S. dollar represents a continued obstacle to both economic growth and market performance, and headline risk remains elevated. Nevertheless, the emerging markets are a large, diverse, and growing asset class, which means that we continue to find an abundance of individual companies with positive drivers of performance. We therefore welcome volatility, as it provides the opportunity to purchase shares in high-quality companies at inexpensive prices.
Annual Report 2015
6
COLUMBIA EMERGING MARKETS FUND
MANAGER DISCUSSION OF FUND PERFORMANCE (continued)
Investment Risks
Market risk may affect a single issuer, sector of the economy, industry or the market as a whole. International investing involves certain risks and volatility due to potential political, economic or currency instabilities and different financial and accounting standards. Risks are enhanced for emerging market issuers. Investments in small- and mid-cap companies involve risks and volatility greater than investments in larger, more established companies. Value securities may be unprofitable if the market fails to recognize their intrinsic worth or the portfolio manager misgauged that worth. Growth securities, at times, may not perform as well as value securities or the stock market in general and may be out of favor with investors. Certain issuer events, including initial public offerings, business consolidation or restructuring, may present heightened risks to securities from the high degree of uncertainty associated with such events. See the Fund's prospectus for more information on these and other risks.
Annual Report 2015
7
COLUMBIA EMERGING MARKETS FUND
UNDERSTANDING YOUR FUND'S EXPENSES
(Unaudited)
As an investor, you incur two types of costs. There are transaction costs, which generally include sales charges on purchases and may include redemption fees. There are also ongoing costs, which generally include management fees, distribution and/or service fees, and other fund expenses. The following information is intended to help you understand your ongoing costs (in dollars) of investing in the Fund and to help you compare these costs with the ongoing costs of investing in other mutual funds.
Analyzing Your Fund's Expenses
To illustrate these ongoing costs, we have provided examples and calculated the expenses paid by investors in each share class of the Fund during the period. The actual and hypothetical information in the table is based on an initial investment of $1,000 at the beginning of the period indicated and held for the entire period. Expense information is calculated two ways and each method provides you with different information. The amount listed in the "Actual" column is calculated using the Fund's actual operating expenses and total return for the period. You may use the Actual information, together with the amount invested, to estimate the expenses that you paid over the period. Simply divide your account value by $1,000 (for example, an $8,600 account value divided by $1,000 = 8.6), then multiply the results by the expenses paid during the period under the "Actual" column. The amount listed in the "Hypothetical" column assumes a 5% annual rate of return before expenses (which is not the Fund's actual return) and then applies the Fund's actual expense ratio for the period to the hypothetical return. You should not use the hypothetical account values and expenses to estimate either your actual account balance at the end of the period or the expenses you paid during the period. See "Compare With Other Funds" below for details on how to use the hypothetical data.
Compare With Other Funds
Since all mutual funds are required to include the same hypothetical calculations about expenses in shareholder reports, you can use this information to compare the ongoing cost of investing in the Fund with other funds. To do so, compare the hypothetical example with the 5% hypothetical examples that appear in the shareholder reports of other funds. As you compare hypothetical examples of other funds, it is important to note that hypothetical examples are meant to highlight the ongoing costs of investing in a fund only and do not reflect any transaction costs, such as sales charges, or redemption or exchange fees. Therefore, the hypothetical calculations are useful in comparing ongoing costs only, and will not help you determine the relative total costs of owning different funds. If transaction costs were included in these calculations, your costs would be higher.
March 1, 2015 – August 31, 2015
| | | Account Value at the Beginning
of the Period ($) | | Account Value at the End of the
Period ($) | | Expenses Paid During the
Period ($) | | Fund's Annualized
Expense Ratio (%) | |
| | | Actual | | Hypothetical | | Actual | | Hypothetical | | Actual | | Hypothetical | | Actual | |
Class A | | | 1,000.00 | | | | 1,000.00 | | | | 854.20 | | | | 1,017.08 | | | | 7.66 | | | | 8.33 | | | | 1.63 | | |
Class B | | | 1,000.00 | | | | 1,000.00 | | | | 850.80 | | | | 1,013.28 | | | | 11.16 | | | | 12.14 | | | | 2.38 | | |
Class C | | | 1,000.00 | | | | 1,000.00 | | | | 851.00 | | | | 1,013.28 | | | | 11.16 | | | | 12.14 | | | | 2.38 | | |
Class I | | | 1,000.00 | | | | 1,000.00 | | | | 856.00 | | | | 1,019.46 | | | | 5.46 | | | | 5.94 | | | | 1.16 | | |
Class K | | | 1,000.00 | | | | 1,000.00 | | | | 855.50 | | | | 1,017.99 | | | | 6.82 | | | | 7.42 | | | | 1.45 | | |
Class R | | | 1,000.00 | | | | 1,000.00 | | | | 853.20 | | | | 1,015.81 | | | | 8.83 | | | | 9.60 | | | | 1.88 | | |
Class R4 | | | 1,000.00 | | | | 1,000.00 | | | | 855.80 | | | | 1,018.25 | | | | 6.58 | | | | 7.16 | | | | 1.40 | | |
Class R5 | | | 1,000.00 | | | | 1,000.00 | | | | 856.20 | | | | 1,019.16 | | | | 5.74 | | | | 6.24 | | | | 1.22 | | |
Class W | | | 1,000.00 | | | | 1,000.00 | | | | 854.10 | | | | 1,017.08 | | | | 7.66 | | | | 8.33 | | | | 1.63 | | |
Class Y | | | 1,000.00 | | | | 1,000.00 | | | | 855.80 | | | | 1,019.41 | | | | 5.50 | | | | 5.99 | | | | 1.17 | | |
Class Z | | | 1,000.00 | | | | 1,000.00 | | | | 855.80 | | | | 1,018.35 | | | | 6.49 | | | | 7.06 | | | | 1.38 | | |
Expenses paid during the period are equal to the annualized expense ratio for each class as indicated above, multiplied by the average account value over the period and then multiplied by the number of days in the Fund's most recent fiscal half year and divided by 365.
Expenses do not include fees and expenses incurred indirectly by the Fund from its investment in underlying funds, including affiliated and non-affiliated pooled investment vehicles, such as mutual funds and exchange-traded funds.
Annual Report 2015
8
COLUMBIA EMERGING MARKETS FUND
PORTFOLIO OF INVESTMENTS
August 31, 2015
(Percentages represent value of investments compared to net assets)
Common Stocks 99.8%
Issuer | | Shares | | Value ($) | |
BRAZIL 5.1% | |
AmBev SA, ADR | | | 2,060,849 | | | | 10,860,674 | | |
BB Seguridade Participacoes SA | | | 1,835,800 | | | | 14,588,603 | | |
Hypermarcas SA(a) | | | 1,304,400 | | | | 5,945,358 | | |
Itaú Unibanco Holding SA, ADR | | | 1,149,504 | | | | 8,414,369 | | |
M. Dias Branco SA | | | 24,000 | | | | 418,833 | | |
Raia Drogasil SA | | | 276,900 | | | | 3,004,430 | | |
Ultrapar Participacoes SA | | | 466,900 | | | | 8,239,449 | | |
Valid Solucoes e Servicos de
Seguranca em Meios de Pagamento e
Identificacao SA | | | 688,800 | | | | 8,926,585 | | |
Total | | | | | 60,398,301 | | |
CHINA 25.8% | |
3SBio, Inc.(a)(b) | | | 3,626,000 | | | | 3,644,691 | | |
58.Com, Inc., ADR(a) | | | 190,397 | | | | 8,655,448 | | |
AAC Technologies Holdings, Inc. | | | 1,613,000 | | | | 9,085,108 | | |
Alibaba Group Holding Ltd., ADR(a) | | | 203,126 | | | | 13,430,691 | | |
Baidu, Inc., ADR(a) | | | 87,151 | | | | 12,832,985 | | |
Bank of China Ltd., Class H | | | 12,663,000 | | | | 5,767,577 | | |
Beijing Urban Construction Design &
Development Group Co., Ltd.
Class H(b) | | | 6,304,000 | | | | 3,174,903 | | |
China Animal Healthcare Ltd.(a)(c)(d) | | | 6,354,000 | | | | 1,975,876 | | |
China Biologic Products, Inc.(a) | | | 69,891 | | | | 6,628,462 | | |
China Mobile Ltd. | | | 2,370,500 | | | | 28,512,604 | | |
China Mobile Ltd., ADR | | | 105,617 | | | | 6,318,009 | | |
China Pacific Insurance Group Co.,
Ltd., Class H | | | 4,396,600 | | | | 15,948,158 | | |
Chongqing Changan Automobile Co.,
Ltd., Class B | | | 4,779,592 | | | | 7,578,368 | | |
CSPC Pharmaceutical Group Ltd. | | | 6,000,000 | | | | 5,522,014 | | |
CT Environmental Group Ltd. | | | 15,698,264 | | | | 5,147,604 | | |
ENN Energy Holdings Ltd. | | | 1,868,000 | | | | 9,542,285 | | |
Industrial & Commercial Bank of
China Ltd., Class H | | | 59,370,000 | | | | 34,760,313 | | |
JD.com, Inc. ADR(a) | | | 241,951 | | | | 6,261,692 | | |
Pax Global Technology Ltd. | | | 3,779,000 | | | | 3,516,669 | | |
Ping An Insurance Group Co. of
China Ltd., Class H | | | 6,360,000 | | | | 31,060,784 | | |
Shenzhou International Group
Holdings Ltd. | | | 2,794,000 | | | | 14,105,729 | | |
Sihuan Pharmaceutical Holdings
Group Ltd.(c)(d) | | | 13,799,000 | | | | 2,813,197 | | |
Common Stocks (continued)
Issuer | | Shares | | Value ($) | |
Sinotrans Ltd., Class H | | | 11,163,000 | | | | 5,125,746 | | |
Tencent Holdings Ltd. | | | 2,923,200 | | | | 48,954,906 | | |
Vipshop Holdings Ltd., ADR(a) | | | 615,546 | | | | 11,073,672 | | |
WuXi PharmaTech (Cayman), Inc. ADR(a) | | | 85,653 | | | | 3,619,696 | | |
Zhuzhou CSR Times Electric Co., Ltd.,
Class H | | | 1,364,000 | | | | 8,972,100 | | |
Total | | | | | 314,029,287 | | |
CZECH REPUBLIC 0.5% | |
Komercni Banka AS | | | 24,371 | | | | 5,554,050 | | |
HONG KONG 3.2% | |
AIA Group Ltd. | | | 2,589,000 | | | | 14,304,478 | | |
Sands China Ltd. | | | 1,868,400 | | | | 6,494,218 | | |
Techtronic Industries Co., Ltd. | | | 2,239,500 | | | | 8,098,873 | | |
Total | | | | | 28,897,569 | | |
INDIA 15.3% | |
Apollo Hospitals Enterprise Ltd. | | | 205,398 | | | | 4,138,294 | | |
Asian Paints Ltd. | | | 675,642 | | | | 8,622,683 | | |
Bharat Petroleum Corp., Ltd. | | | 579,426 | | | | 7,679,107 | | |
Bharti Infratel Ltd. | | | 1,140,061 | | | | 6,854,119 | | |
Dish TV India Ltd.(a) | | | 7,193,312 | | | | 11,296,702 | | |
Eicher Motors Ltd. | | | 30,245 | | | | 8,647,700 | | |
Havells India Ltd | | | 1,302,315 | | | | 5,096,673 | | |
HCL Technologies Ltd. | | | 753,249 | | | | 11,003,271 | | |
HDFC Bank Ltd., ADR | | | 190,816 | | | | 10,874,604 | | |
ICICI Bank Ltd., ADR | | | 1,463,230 | | | | 12,759,366 | | |
IndusInd Bank Ltd. | | | 1,277,184 | | | | 16,478,703 | | |
Infosys Ltd. | | | 358,371 | | | | 5,943,703 | | |
Just Dial Ltd. | | | 353,224 | | | | 4,490,058 | | |
Larsen & Toubro Ltd. | | | 259,610 | | | | 6,260,399 | | |
LIC Housing Finance Ltd. | | | 749,850 | | | | 5,000,355 | | |
Lupin Ltd. | | | 191,875 | | | | 5,576,367 | | |
Motherson Sumi Systems Ltd. | | | 3,076,408 | | | | 14,058,998 | | |
Natco Pharma Ltd. | | | 191,763 | | | | 6,462,602 | | |
Syngene International Ltd.(a)(b)(c)(d) | | | 1,112,545 | | | | 5,214,233 | | |
Tata Motors Ltd.(a) | | | 795,169 | | | | 4,103,091 | | |
UPL Ltd. | | | 1,547,051 | | | | 11,694,417 | | |
Yes Bank Ltd. | | | 809,387 | | | | 8,387,274 | | |
Total | | | | | 180,642,719 | | |
The accompanying Notes to Financial Statements are an integral part of this statement.
Annual Report 2015
9
COLUMBIA EMERGING MARKETS FUND
PORTFOLIO OF INVESTMENTS (continued)
August 31, 2015
Common Stocks (continued)
Issuer | | Shares | | Value ($) | |
INDONESIA 3.4% | |
PT Bank Rakyat Indonesia Persero Tbk | | | 12,378,200 | | | | 9,371,254 | | |
PT Matahari Department Store Tbk | | | 11,952,300 | | | | 14,893,647 | | |
PT Mitra Keluarga Karyasehat Tbk | | | 1,973,500 | | | | 3,794,595 | | |
PT Nippon Indosari Corpindo Tbk | | | 60,910,900 | | | | 4,982,860 | | |
PT Pakuwon Jati Tbk | | | 149,709,500 | | | | 4,059,219 | | |
PT Sumber Alfaria Trijaya Tbk | | | 77,727,500 | | | | 3,208,680 | | |
Total | | | | | 40,310,255 | | |
MEXICO 3.4% | |
Alfa SAB de CV, Class A | | | 2,365,100 | | | | 4,722,344 | | |
Cemex SAB de CV, ADR(a) | | | 1,651,285 | | | | 12,979,100 | | |
Grupo Financiero Banorte SAB de
CV, Class O | | | 2,293,600 | | | | 10,979,463 | | |
Grupo Financiero Santander Mexico
SAB de CV, ADR, Class B | | | 462,661 | | | | 3,590,250 | | |
Grupo Mexico SAB de CV, Class B | | | 3,091,690 | | | | 7,842,218 | | |
Total | | | | | 40,113,375 | | |
PERU 0.6% | |
Credicorp Ltd. | | | 65,492 | | | | 7,202,810 | | |
PHILIPPINES 4.2% | |
GT Capital Holdings, Inc. | | | 522,785 | | | | 14,208,764 | | |
Metropolitan Bank & Trust Co. | | | 11,165,566 | | | | 19,978,116 | | |
Robinsons Retail Holdings, Inc. | | | 4,255,840 | | | | 6,324,705 | | |
SM Prime Holdings, Inc. | | | 12,274,100 | | | | 5,115,988 | | |
Universal Robina Corp. | | | 967,350 | | | | 4,006,695 | | |
Total | | | | | 49,634,268 | | |
POLAND 0.4% | |
Bank Pekao SA | | | 111,805 | | | | 4,765,692 | | |
RUSSIAN FEDERATION 3.7% | |
Lukoil PJSC, ADR | | | 256,459 | | | | 9,915,987 | | |
Magnit PJSC | | | 93,673 | | | | 17,907,430 | | |
Mail.ru Group Ltd., GDR(a)(b) | | | 221,245 | | | | 4,065,766 | | |
MMC Norilsk Nickel PJSC, ADR | | | 597,923 | | | | 9,408,817 | | |
QIWI PLC, ADR | | | 115,856 | | | | 3,029,634 | | |
Total | | | | | 44,327,634 | | |
SOUTH AFRICA 6.5% | |
Aspen Pharmacare Holdings Ltd. | | | 364,988 | | | | 9,427,649 | | |
AVI Ltd. | | | 1,321,121 | | | | 8,070,105 | | |
Common Stocks (continued)
Issuer | | Shares | | Value ($) | |
Clicks Group Ltd. | | | 445,728 | | | | 3,077,035 | | |
Discovery Ltd. | | | 877,970 | | | | 8,872,958 | | |
Naspers Ltd., Class N | | | 268,965 | | | | 34,867,693 | | |
Sasol Ltd. | | | 409,351 | | | | 13,117,297 | | |
Total | | | | | 77,432,737 | | |
SOUTH KOREA 10.2% | |
Cuckoo Electronics Co., Ltd. | | | 45,407 | | | | 10,474,166 | | |
Duk San Neolux Co., Ltd.(a) | | | 216,118 | | | | 3,059,452 | | |
EO Technics Co., Ltd. | | | 38,077 | | | | 3,476,004 | | |
Hotel Shilla Co., Ltd. | | | 57,355 | | | | 5,841,865 | | |
Hyungkuk F&B Co., Ltd.(a)(d) | | | 6,502 | | | | 266,869 | | |
Korea Electric Power Corp. | | | 210,447 | | | | 8,597,399 | | |
LG Uplus Corp. | | | 973,893 | | | | 9,054,657 | | |
Lotte Chemical Corp. | | | 22,960 | | | | 4,795,238 | | |
Pharma Research Products Co., Ltd.(a) | | | 20,808 | | | | 1,324,745 | | |
Samchuly Bicycle Co., Ltd. | | | 209,874 | | | | 3,874,221 | | |
Samsung Electronics Co., Ltd. | | | 36,175 | | | | 33,287,239 | | |
Seegene, Inc.(a) | | | 87,542 | | | | 3,434,764 | | |
SK Hynix, Inc. | | | 311,804 | | | | 9,437,485 | | |
SK Telecom Co., Ltd. | | | 97,797 | | | | 20,143,417 | | |
Wonik IPS Co., Ltd.(a) | | | 396,906 | | | | 3,726,601 | | |
Total | | | | | 120,794,122 | | |
TAIWAN 10.5% | |
Advanced Semiconductor Engineering,
Inc. | | | 8,079,000 | | | | 8,155,976 | | |
Catcher Technology Co., Ltd. | | | 968,000 | | | | 9,895,625 | | |
Cathay Financial Holding Co., Ltd. | | | 13,907,850 | | | | 20,090,336 | | |
CTBC Financial Holding Co., Ltd. | | | 21,543,524 | | | | 12,995,952 | | |
Cub Elecparts, Inc. | | | 741,000 | | | | 7,718,693 | | |
Eclat Textile Co., Ltd. | | | 532,200 | | | | 8,003,989 | | |
eMemory Technology, Inc. | | | 661,000 | | | | 6,179,988 | | |
Gigasolar Materials Corp. | | | 296,200 | | | | 4,222,908 | | |
Hota Industrial Manufacturing Co., Ltd. | | | 197,000 | | | | 596,009 | | |
Largan Precision Co., Ltd. | | | 86,000 | | | | 8,003,389 | | |
Merida Industry Co., Ltd. | | | 1,100,400 | | | | 5,999,479 | | |
Pegatron Corp. | | | 1,966,000 | | | | 5,101,832 | | |
Superalloy Industrial Co., Ltd. | | | 306,577 | | | | 958,577 | | |
Taiwan Semiconductor Manufacturing
Co., Ltd. | | | 6,773,048 | | | | 26,352,634 | | |
Total | | | | | 124,275,387 | | |
The accompanying Notes to Financial Statements are an integral part of this statement.
Annual Report 2015
10
COLUMBIA EMERGING MARKETS FUND
PORTFOLIO OF INVESTMENTS (continued)
August 31, 2015
Common Stocks (continued)
Issuer | | Shares | | Value ($) | |
THAILAND 2.6% | |
Kasikornbank PCL, Foreign Registered
Shares | | | 1,309,900 | | | | 6,608,051 | | |
Mega Lifesciences PCL, Foreign
Registered Shares | | | 7,727,000 | | | | 3,771,730 | | |
Muangthai Leasing PCL | | | 7,674,900 | | | | 3,640,086 | | |
Siam Commercial Bank PCL (The),
Foreign Registered Shares | | | 1,453,600 | | | | 5,755,963 | | |
Srisawad Power 1979 PCL | | | 4,483,100 | | | | 4,595,542 | | |
Thai Union Frozen Products PCL,
Foreign Registered Shares | | | 13,440,800 | | | | 6,525,480 | | |
Total | | | | | 30,896,852 | | |
TURKEY 1.3% | |
Coca-Cola Icecek AS | | | 464,722 | | | | 5,748,545 | | |
Pegasus Hava Tasimaciligi AS(a) | | | 341,687 | | | | 2,166,143 | | |
Turk Traktor ve Ziraat Makineleri AS | | | 135,722 | | | | 3,299,430 | | |
Ulker Biskuvi Sanayi AS | | | 635,130 | | | | 3,906,411 | | |
Total | | | | | 15,120,529 | | |
UNITED ARAB EMIRATES 1.0% | |
Emaar Properties PJSC | | | 6,380,304 | | | | 11,809,411 | | |
Common Stocks (continued)
Issuer | | Shares | | Value ($) | |
UNITED KINGDOM 0.2% | |
Randgold Resources Ltd. | | | 38,432 | | | | 2,324,197 | | |
UNITED STATES 1.9% | |
Atento SA(a) | | | 350,334 | | | | 3,881,701 | | |
Cognizant Technology Solutions
Corp., Class A(a) | | | 141,115 | | | | 8,881,778 | | |
Luxoft Holding, Inc.(a) | | | 161,922 | | | | 9,891,815 | | |
Total | | | | | 22,655,294 | | |
Total Common Stocks
(Cost: $1,166,720,708) | | | | | 1,181,184,489 | | |
Money Market Funds 1.0%
| | | Shares | | Value ($) | |
Columbia Short-Term Cash Fund,
0.150%(e)(f) | | | 12,058,111 | | | | 12,058,111 | | |
Total Money Market Funds
(Cost: $12,058,111) | | | | | 12,058,111 | | |
Total Investments
(Cost: $1,178,778,819) | | | | | 1,193,242,600 | | |
Other Assets & Liabilities, Net | | | | | (9,092,569 | ) | |
Net Assets | | | | | 1,184,150,031 | | |
Notes to Portfolio of Investments
(a) Non-income producing investment.
(b) Security exempt from registration pursuant to Rule 144A under the Securities Act of 1933. This security may be resold in transactions exempt from registration, normally to qualified institutional buyers. At August 31, 2015, the value of these securities amounted to $16,099,593 or 1.36% of net assets.
(c) Identifies securities considered by the Investment Manager to be illiquid and may be difficult to sell. The aggregate value of such securities at August 31, 2015 was $10,003,306, which represents 0.84% of net assets. Information concerning such security holdings at August 31, 2015 is as follows:
Security Description | | Acquisition Dates | | Cost ($) | |
China Animal Healthcare Ltd. | | 07/21/2014 - 11/19/2014 | | | 4,620,487 | | |
Sihuan Pharmaceutical Holdings Group Ltd. | | 02/23/2015 - 03/04/2015 | | | 8,151,384 | | |
Syngene International Ltd. | | 7/24/15 | | | 4,999,428 | | |
(d) Represents fair value as determined in good faith under procedures approved by the Board of Trustees. At August 31, 2015, the value of these securities amounted to $10,270,175, which represents 0.87% of net assets.
(e) The rate shown is the seven-day current annualized yield at August 31, 2015.
The accompanying Notes to Financial Statements are an integral part of this statement.
Annual Report 2015
11
COLUMBIA EMERGING MARKETS FUND
PORTFOLIO OF INVESTMENTS (continued)
August 31, 2015
Notes to Portfolio of Investments (continued)
(f) As defined in the Investment Company Act of 1940, an affiliated company is one in which the Fund owns 5% or more of the company's outstanding voting securities, or a company which is under common ownership or control with the Fund. Holdings and transactions in these affiliated companies during the year ended August 31, 2015 are as follows:
Issuer | | Beginning
Cost ($) | | Purchase
Cost ($) | | Proceeds
From Sales ($) | | Ending
Cost ($) | | Dividends —
Affiliated
Issuers ($) | | Value ($) | |
Columbia Short-Term Cash Fund | | | 17,068,200 | | | | 599,024,604 | | | | (604,034,693 | ) | | | 12,058,111 | | | | 29,403 | | | | 12,058,111 | | |
Abbreviation Legend
ADR American Depositary Receipt
GDR Global Depositary Receipt
Fair Value Measurements
The Fund categorizes its fair value measurements according to a three-level hierarchy that maximizes the use of observable inputs and minimizes the use of unobservable inputs by prioritizing that the most observable input be used when available. Observable inputs are those that market participants would use in pricing an investment based on market data obtained from sources independent of the reporting entity. Unobservable inputs are those that reflect the Fund's assumptions about the information market participants would use in pricing an investment. An investment's level within the fair value hierarchy is based on the lowest level of any input that is deemed significant to the asset's or liability's fair value measurement. The input levels are not necessarily an indication of the risk or liquidity associated with investments at that level. For example, certain U.S. government securities are generally high quality and liquid, however, they are reflected as Level 2 because the inputs used to determine fair value may not always be quoted prices in an active market.
Fair value inputs are summarized in the three broad levels listed below:
> Level 1 — Valuations based on quoted prices for investments in active markets that the Fund has the ability to access at the measurement date (including NAV for open-end mutual funds). Valuation adjustments are not applied to Level 1 investments.
> Level 2 — Valuations based on other significant observable inputs (including quoted prices for similar securities, interest rates, prepayment speeds, credit risks, etc.).
> Level 3 — Valuations based on significant unobservable inputs (including the Fund's own assumptions and judgment in determining the fair value of investments).
Inputs that are used in determining fair value of an investment may include price information, credit data, volatility statistics, and other factors. These inputs can be either observable or unobservable. The availability of observable inputs can vary between investments, and is affected by various factors such as the type of investment, and the volume and level of activity for that investment or similar investments in the marketplace. The inputs will be considered by the Investment Manager, along with any other relevant factors in the calculation of an investment's fair value. The Fund uses prices and inputs that are current as of the measurement date, which may include periods of market dislocations. During these periods, the availability of prices and inputs may be reduced for many investments. This condition could cause an investment to be reclassified between the various levels within the hierarchy.
Foreign equity securities actively traded in markets where there is a significant delay in the local close relative to the New York Stock Exchange (NYSE) are classified as Level 2. The values of these securities may include an adjustment to reflect the impact of significant market movements following the close of local trading, as described in Note 2 to the financial statements — Security Valuation.
Investments falling into the Level 3 category are primarily supported by quoted prices from brokers and dealers participating in the market for those investments. However, these may be classified as Level 3 investments due to lack of market transparency and corroboration to support these quoted prices. Additionally, valuation models may be used as the pricing source for any remaining investments classified as Level 3. These models may rely on one or more significant unobservable inputs and/or significant assumptions by the Investment Manager. Inputs used in valuations may include, but are not limited to, financial statement analysis, capital account balances, discount rates and estimated cash flows, and comparable company data.
Under the direction of the Fund's Board of Trustees (the Board), the Investment Manager's Valuation Committee (the Committee) is responsible for overseeing the valuation procedures approved by the Board. The Committee consists of voting and non-voting members from various groups within the Investment Manager's organization, including operations and accounting, trading and investments, compliance, risk management and legal.
The Committee meets at least monthly to review and approve valuation matters, which may include a description of specific valuation determinations, data regarding pricing information received from approved pricing vendors and brokers and the results of Board-approved valuation control policies and procedures (the Policies). The Policies address, among other things, instances when market quotations are or
The accompanying Notes to Financial Statements are an integral part of this statement.
Annual Report 2015
12
COLUMBIA EMERGING MARKETS FUND
PORTFOLIO OF INVESTMENTS (continued)
August 31, 2015
Fair Value Measurements (continued)
are not readily available, including recommendations of third party pricing vendors and a determination of appropriate pricing methodologies; events that require specific valuation determinations and assessment of fair value techniques; securities with a potential for stale pricing, including those that are illiquid, restricted, or in default; and the effectiveness of third party pricing vendors, including periodic reviews of vendors. The Committee meets more frequently, as needed, to discuss additional valuation matters, which may include the need to review back-testing results, review time-sensitive information or approve related valuation actions. The Committee reports to the Board, with members of the Committee meeting with the Board at each of its regularly scheduled meetings to discuss valuation matters and actions during the period, similar to those described earlier.
For investments categorized as Level 3, the Committee monitors information similar to that described above, which may include: (i) data specific to the issuer or comparable issuers, (ii) general market or specific sector news and (iii) quoted prices and specific or similar security transactions. The Committee considers this data and any changes from prior periods in order to assess the reasonableness of observable and unobservable inputs, any assumptions or internal models used to value those securities and changes in fair value. This data is also used to corroborate, when available, information received from approved pricing vendors and brokers. Various factors impact the frequency of monitoring this information (which may occur as often as daily). However, the Committee may determine that changes to inputs, assumptions and models are not required as a result of the monitoring procedures performed.
The following table is a summary of the inputs used to value the Fund's investments at August 31, 2015:
| | | Level 1
Quoted Prices in Active
Markets for Identical
Assets ($) | | Level 2
Other Significant
Observable Inputs ($) | | Level 3
Significant
Unobservable Inputs ($) | | Total ($) | |
Investments | |
Common Stocks | |
Brazil | | | 60,398,301 | | | | — | | | | — | | | | 60,398,301 | | |
China | | | 68,820,655 | | | | 240,419,559 | | | | 4,789,073 | | | | 314,029,287 | | |
Czech Republic | | | — | | | | 5,554,050 | | | | — | | | | 5,554,050 | | |
Hong Kong | | | — | | | | 28,897,569 | | | | — | | | | 28,897,569 | | |
India | | | 23,633,970 | | | | 151,794,516 | | | | 5,214,233 | | | | 180,642,719 | | |
Indonesia | | | — | | | | 40,310,255 | | | | — | | | | 40,310,255 | | |
Mexico | | | 40,113,375 | | | | — | | | | — | | | | 40,113,375 | | |
Peru | | | 7,202,810 | | | | — | | | | — | | | | 7,202,810 | | |
Philippines | | | — | | | | 49,634,268 | | | | — | | | | 49,634,268 | | |
Poland | | | — | | | | 4,765,692 | | | | — | | | | 4,765,692 | | |
Russian Federation | | | 12,945,621 | | | | 31,382,013 | | | | — | | | | 44,327,634 | | |
South Africa | | | — | | | | 77,432,737 | | | | — | | | | 77,432,737 | | |
South Korea | | | — | | | | 120,527,253 | | | | 266,869 | | | | 120,794,122 | | |
Taiwan | | | — | | | | 124,275,387 | | | | — | | | | 124,275,387 | | |
Thailand | | | — | | | | 30,896,852 | | | | — | | | | 30,896,852 | | |
Turkey | | | — | | | | 15,120,529 | | | | — | | | | 15,120,529 | | |
United Arab Emirates | | | — | | | | 11,809,411 | | | | — | | | | 11,809,411 | | |
United Kingdom | | | — | | | | 2,324,197 | | | | — | | | | 2,324,197 | | |
United States | | | 22,655,294 | | | | — | | | | — | | | | 22,655,294 | | |
Total Common Stocks | | | 235,770,026 | | | | 935,144,288 | | | | 10,270,175 | | | | 1,181,184,489 | | |
Money Market Funds | | | — | | | | 12,058,111 | | | | — | | | | 12,058,111 | | |
Total Investments | | | 235,770,026 | | | | 947,202,399 | | | | 10,270,175 | | | | 1,193,242,600 | | |
See the Portfolio of Investments for all investment classifications not indicated in the table.
The accompanying Notes to Financial Statements are an integral part of this statement.
Annual Report 2015
13
COLUMBIA EMERGING MARKETS FUND
PORTFOLIO OF INVESTMENTS (continued)
August 31, 2015
Fair Value Measurements (continued)
The Fund's assets assigned to the Level 2 input category are generally valued using the market approach, in which a security's value is determined through reference to prices and information from market transactions for similar or identical assets. These assets include certain foreign securities for which a third party statistical pricing service may be employed for purposes of fair market valuation. The model utilized by such third party statistical pricing service takes into account a security's correlation to available market data including, but not limited to, intraday index, ADR, and exchange-traded fund movements.
Financial assets were transferred from Level 1 to Level 2 as the market for these assets is not considered publicly available. Fund per share market values were obtained using observable market inputs.
The following table shows transfers between Level 1 and Level 2 of the fair value hierarchy:
Transfers In | | Transfers Out | |
| Level 1 ($) | | Level 2 ($) | | Level 1 ($) | | Level 2 ($) | |
| | — | | | | 17,068,200 | | | | 17,068,200 | | | | — | | |
Transfers between Level 1 and Level 2 are determined based on the fair value at the beginning of the period for security positions held throughout the period.
The Fund does not hold any significant investments (greater than one percent of net assets) categorized as Level 3.
The Fund's assets assigned to the Level 3 category are valued utilizing the valuation technique deemed the most appropriate in the circumstances. Certain common stock classified as Level 3 securities are valued using the market approach. To determine fair value for these securities, management considered various factors which may have included, but were not limited to, the halt price of the security, discount rates observed in the market for similar assets as well as the movement in certain foreign or domestic market indices. Significant increases (decreases) to any of these inputs would result in a significantly lower (higher) fair value measurement. Generally, a change in observable yields on comparable securities would result in a directionally similar change to discount rates.
Transfers In | | Transfers Out | |
| Level 2 ($) | | Level 3 ($) | | Level 2 ($) | | Level 3 ($) | |
| | — | | | | 3,442,000 | | | | 3,442,000 | | | | — | | |
Transfers in and/or out of Level 3 are determined based on the fair value at the beginning of the period for security positions held throughout the period.
The accompanying Notes to Financial Statements are an integral part of this statement.
Annual Report 2015
14
COLUMBIA EMERGING MARKETS FUND
STATEMENT OF ASSETS AND LIABILITIES
August 31, 2015
Assets | |
Investments, at value | |
Unaffiliated issuers (identified cost $1,166,720,708) | | $ | 1,181,184,489 | | |
Affiliated issuers (identified cost $12,058,111) | | | 12,058,111 | | |
Total investments (identified cost $1,178,778,819) | | | 1,193,242,600 | | |
Receivable for: | |
Investments sold | | | 6,923,729 | | |
Capital shares sold | | | 467,174 | | |
Dividends | | | 1,475,596 | | |
Foreign tax reclaims | | | 2,847 | | |
Prepaid expenses | | | 14,705 | | |
Trustees' deferred compensation plan | | | 44,074 | | |
Total assets | | | 1,202,170,725 | | |
Liabilities | |
Foreign currency (cost $2,092,002) | | | 2,092,002 | | |
Payable for: | |
Investments purchased | | | 7,074,924 | | |
Capital shares purchased | | | 8,175,218 | | |
Investment management fees | | | 101,588 | | |
Distribution and/or service fees | | | 7,151 | | |
Transfer agent fees | | | 211,349 | | |
Administration fees | | | 7,666 | | |
Plan administration fees | | | 22 | | |
Compensation of board members | | | 13,362 | | |
Chief compliance officer expenses | | | 126 | | |
Other expenses | | | 293,212 | | |
Trustees' deferred compensation plan | | | 44,074 | | |
Total liabilities | | | 18,020,694 | | |
Net assets applicable to outstanding capital stock | | $ | 1,184,150,031 | | |
Represented by | |
Paid-in capital | | $ | 1,247,952,692 | | |
Excess of distributions over net investment income | | | (945,045 | ) | |
Accumulated net realized loss | | | (77,293,971 | ) | |
Unrealized appreciation (depreciation) on: | |
Investments | | | 14,463,781 | | |
Foreign currency translations | | | (27,426 | ) | |
Total — representing net assets applicable to outstanding capital stock | | $ | 1,184,150,031 | | |
The accompanying Notes to Financial Statements are an integral part of this statement.
Annual Report 2015
15
COLUMBIA EMERGING MARKETS FUND
STATEMENT OF ASSETS AND LIABILITIES (continued)
August 31, 2015
Class A | |
Net assets | | $ | 238,932,435 | | |
Shares outstanding | | | 27,185,966 | | |
Net asset value per share | | $ | 8.79 | | |
Maximum offering price per share(a) | | $ | 9.33 | | |
Class B | |
Net assets | | $ | 2,599,922 | | |
Shares outstanding | | | 308,030 | | |
Net asset value per share | | $ | 8.44 | | |
Class C | |
Net assets | | $ | 20,462,199 | | |
Shares outstanding | | | 2,420,668 | | |
Net asset value per share | | $ | 8.45 | | |
Class I | |
Net assets | | $ | 129,429,846 | | |
Shares outstanding | | | 14,600,813 | | |
Net asset value per share | | $ | 8.86 | | |
Class K | |
Net assets | | $ | 95,594 | | |
Shares outstanding | | | 10,844 | | |
Net asset value per share | | $ | 8.82 | | |
Class R | |
Net assets | | $ | 6,996,872 | | |
Shares outstanding | | | 802,197 | | |
Net asset value per share | | $ | 8.72 | | |
Class R4 | |
Net assets | | $ | 1,827,348 | | |
Shares outstanding | | | 205,394 | | |
Net asset value per share | | $ | 8.90 | | |
Class R5 | |
Net assets | | $ | 17,558,723 | | |
Shares outstanding | | | 1,979,919 | | |
Net asset value per share | | $ | 8.87 | | |
Class W | |
Net assets | | $ | 57,491 | | |
Shares outstanding | | | 6,545 | | |
Net asset value per share | | $ | 8.78 | | |
Class Y | |
Net assets | | $ | 5,350,583 | | |
Shares outstanding | | | 601,138 | | |
Net asset value per share | | $ | 8.90 | | |
Class Z | |
Net assets | | $ | 760,839,018 | | |
Shares outstanding | | | 86,101,076 | | |
Net asset value per share | | $ | 8.84 | | |
(a) The maximum offering price per share is calculated by dividing the net asset value per share by 1.0 minus the maximum sales charge of 5.75%.
The accompanying Notes to Financial Statements are an integral part of this statement.
Annual Report 2015
16
COLUMBIA EMERGING MARKETS FUND
STATEMENT OF OPERATIONS
Year Ended August 31, 2015
Net investment income | |
Income: | |
Dividends — unaffiliated issuers | | $ | 26,268,588 | | |
Dividends — affiliated issuers | | | 29,403 | | |
Interest | | | 9,394 | | |
Foreign taxes withheld | | | (2,920,818 | ) | |
Total income | | | 23,386,567 | | |
Expenses: | |
Investment management fees | | | 14,725,495 | | |
Distribution and/or service fees | |
Class A | | | 720,705 | | |
Class B | | | 43,876 | | |
Class C | | | 249,122 | | |
Class R | | | 37,831 | | |
Class W | | | 247 | | |
Transfer agent fees | |
Class A | | | 648,615 | | |
Class B | | | 9,857 | | |
Class C | | | 56,047 | | |
Class K | | | 80 | | |
Class R | | | 17,025 | | |
Class R4 | | | 2,188 | | |
Class R5 | | | 4,978 | | |
Class W | | | 222 | | |
Class Z | | | 2,283,015 | | |
Administration fees | | | 1,140,095 | | |
Plan administration fees | |
Class K | | | 398 | | |
Compensation of board members | | | 46,940 | | |
Custodian fees | | | 756,972 | | |
Printing and postage fees | | | 99,600 | | |
Registration fees | | | 185,545 | | |
Professional fees | | | 89,381 | | |
Line of credit interest expense | | | 2,338 | | |
Chief compliance officer expenses | | | 765 | | |
Other | | | 188,455 | | |
Total expenses | | | 21,309,792 | | |
Expense reductions | | | (2,024 | ) | |
Total net expenses | | | 21,307,768 | | |
Net investment income | | | 2,078,799 | | |
Realized and unrealized gain (loss) — net | |
Net realized gain (loss) on: | |
Investments | | | (70,168,197 | ) | |
Foreign currency translations | | | (970,739 | ) | |
Net realized loss | | | (71,138,936 | ) | |
Net change in unrealized appreciation (depreciation) on: | |
Investments | | | (236,226,314 | ) | |
Foreign currency translations | | | (15,699 | ) | |
Foreign capital gains tax | | | 620,027 | | |
Net change in unrealized depreciation | | | (235,621,986 | ) | |
Net realized and unrealized loss | | | (306,760,922 | ) | |
Net decrease in net assets from operations | | $ | (304,682,123 | ) | |
The accompanying Notes to Financial Statements are an integral part of this statement.
Annual Report 2015
17
COLUMBIA EMERGING MARKETS FUND
STATEMENT OF CHANGES IN NET ASSETS
| | | Year Ended
August 31,
2015 | | Year Ended
August 31,
2014 | |
Operations | |
Net investment income | | $ | 2,078,799 | | | $ | 1,993,411 | | |
Net realized gain (loss) | | | (71,138,936 | ) | | | 9,708,890 | | |
Net change in unrealized appreciation (depreciation) | | | (235,621,986 | ) | | | 234,248,571 | | |
Net increase (decrease) in net assets resulting from operations | | | (304,682,123 | ) | | | 245,950,872 | | |
Distributions to shareholders | |
Net investment income | |
Class A | | | (10,564 | ) | | | (485,759 | ) | |
Class I | | | (711,105 | ) | | | (1,306,561 | ) | |
Class K | | | (370 | ) | | | (1,567 | ) | |
Class R4 | | | (836 | ) | | | (592 | ) | |
Class R5 | | | (15,205 | ) | | | (12,369 | ) | |
Class W | | | (4 | ) | | | (43,241 | ) | |
Class Y | | | (18,877 | ) | | | (19,594 | ) | |
Class Z | | | (2,847,786 | ) | | | (2,600,356 | ) | |
Total distributions to shareholders | | | (3,604,747 | ) | | | (4,470,039 | ) | |
Increase (decrease) in net assets from capital stock activity | | | (82,410,927 | ) | | | 129,453,926 | | |
Total increase (decrease) in net assets | | | (390,697,797 | ) | | | 370,934,759 | | |
Net assets at beginning of year | | | 1,574,847,828 | | | | 1,203,913,069 | | |
Net assets at end of year | | $ | 1,184,150,031 | | | $ | 1,574,847,828 | | |
Excess of distributions over net investment income | | $ | (945,045 | ) | | $ | 1,833,025 | | |
The accompanying Notes to Financial Statements are an integral part of this statement.
Annual Report 2015
18
COLUMBIA EMERGING MARKETS FUND
STATEMENT OF CHANGES IN NET ASSETS (continued)
| | | Year Ended August 31, 2015 | | Year Ended August 31, 2014 | |
| | | Shares | | Dollars ($) | | Shares | | Dollars ($) | |
Capital stock activity | |
Class A shares | |
Subscriptions(a) | | | 3,874,794 | | | | 39,633,768 | | | | 5,326,155 | | | | 54,370,328 | | |
Distributions reinvested | | | 1,055 | | | | 10,310 | | | | 47,467 | | | | 474,197 | | |
Redemptions | | | (5,404,992 | ) | | | (54,656,539 | ) | | | (9,574,283 | ) | | | (97,494,231 | ) | |
Net decrease | | | (1,529,143 | ) | | | (15,012,461 | ) | | | (4,200,661 | ) | | | (42,649,706 | ) | |
Class B shares | |
Subscriptions | | | 7,828 | | | | 77,258 | | | | 18,004 | | | | 176,732 | | |
Redemptions(a) | | | (269,797 | ) | | | (2,655,593 | ) | | | (428,149 | ) | | | (4,209,341 | ) | |
Net decrease | | | (261,969 | ) | | | (2,578,335 | ) | | | (410,145 | ) | | | (4,032,609 | ) | |
Class C shares | |
Subscriptions | | | 539,018 | | | | 5,292,880 | | | | 599,191 | | | | 5,881,148 | | |
Redemptions | | | (676,372 | ) | | | (6,633,044 | ) | | | (709,620 | ) | | | (7,008,679 | ) | |
Net decrease | | | (137,354 | ) | | | (1,340,164 | ) | | | (110,429 | ) | | | (1,127,531 | ) | |
Class I shares | |
Subscriptions | | | 2,050,692 | | | | 20,687,009 | | | | 2,624,531 | | | | 26,468,771 | | |
Distributions reinvested | | | 72,413 | | | | 711,091 | | | | 129,997 | | | | 1,306,471 | | |
Redemptions | | | (1,198,281 | ) | | | (12,438,393 | ) | | | (9,157,184 | ) | | | (92,186,054 | ) | |
Net increase (decrease) | | | 924,824 | | | | 8,959,707 | | | | (6,402,656 | ) | | | (64,410,812 | ) | |
Class K shares | |
Subscriptions | | | 10 | | | | 101 | | | | 60 | | | | 610 | | |
Distributions reinvested | | | 37 | | | | 365 | | | | 156 | | | | 1,558 | | |
Redemptions | | | (8,008 | ) | | | (82,348 | ) | | | (36,650 | ) | | | (364,980 | ) | |
Net decrease | | | (7,961 | ) | | | (81,882 | ) | | | (36,434 | ) | | | (362,812 | ) | |
Class R shares | |
Subscriptions | | | 296,050 | | | | 2,998,912 | | | | 379,738 | | | | 3,798,262 | | |
Redemptions | | | (250,445 | ) | | | (2,529,410 | ) | | | (267,771 | ) | | | (2,707,376 | ) | |
Net increase | | | 45,605 | | | | 469,502 | | | | 111,967 | | | | 1,090,886 | | |
Class R4 shares | |
Subscriptions | | | 205,002 | | | | 2,201,092 | | | | 31,393 | | | | 326,818 | | |
Distributions reinvested | | | 84 | | | | 829 | | | | 58 | | | | 583 | | |
Redemptions | | | (26,824 | ) | | | (271,603 | ) | | | (8,362 | ) | | | (88,803 | ) | |
Net increase | | | 178,262 | | | | 1,930,318 | | | | 23,089 | | | | 238,598 | | |
Class R5 shares | |
Subscriptions | | | 1,876,656 | | | | 19,546,076 | | | | 157,161 | | | | 1,605,674 | | |
Distributions reinvested | | | 1,547 | | | | 15,205 | | | | 1,225 | | | | 12,327 | | |
Redemptions | | | (177,693 | ) | | | (1,777,242 | ) | | | (28,717 | ) | | | (295,302 | ) | |
Net increase | | | 1,700,510 | | | | 17,784,039 | | | | 129,669 | | | | 1,322,699 | | |
The accompanying Notes to Financial Statements are an integral part of this statement.
Annual Report 2015
19
COLUMBIA EMERGING MARKETS FUND
STATEMENT OF CHANGES IN NET ASSETS (continued)
| | | Year Ended August 31, 2015 | | Year Ended August 31, 2014 | |
| | | Shares | | Dollars ($) | | Shares | | Dollars ($) | |
Capital stock activity (continued) | |
Class W shares | |
Subscriptions | | | — | | | | — | | | | 457,495 | | | | 4,599,843 | | |
Distributions reinvested | | | — | | | | 4 | | | | 4,328 | | | | 43,235 | | |
Redemptions | | | (5,654 | ) | | | (54,765 | ) | | | (3,892,835 | ) | | | (37,806,523 | ) | |
Net decrease | | | (5,654 | ) | | | (54,761 | ) | | | (3,431,012 | ) | | | (33,163,445 | ) | |
Class Y shares | |
Subscriptions | | | 318,963 | | | | 3,269,168 | | | | 389,144 | | | | 4,031,568 | | |
Distributions reinvested | | | 1,913 | | | | 18,865 | | | | 1,940 | | | | 19,578 | | |
Redemptions | | | (93,927 | ) | | | (940,649 | ) | | | (67,191 | ) | | | (684,925 | ) | |
Net increase | | | 226,949 | | | | 2,347,384 | | | | 323,893 | | | | 3,366,221 | | |
Class Z shares | |
Subscriptions | | | 43,726,071 | | | | 446,533,740 | | | | 52,550,625 | | | | 538,414,334 | | |
Distributions reinvested | | | 22,101 | | | | 216,800 | | | | 36,241 | | | | 363,498 | | |
Redemptions | | | (53,999,466 | ) | | | (541,584,814 | ) | | | (26,620,173 | ) | | | (269,595,395 | ) | |
Net increase (decrease) | | | (10,251,294 | ) | | | (94,834,274 | ) | | | 25,966,693 | | | | 269,182,437 | | |
Total net increase (decrease) | | | (9,117,225 | ) | | | (82,410,927 | ) | | | 11,963,974 | | | | 129,453,926 | | |
(a) Includes conversions of Class B shares to Class A shares, if any.
The accompanying Notes to Financial Statements are an integral part of this statement.
Annual Report 2015
20
COLUMBIA EMERGING MARKETS FUND
The following tables are intended to help you understand the Fund's financial performance. Certain information reflects financial results for a single share of a class held for the periods shown. Per share net investment income (loss) amounts are calculated based on average shares outstanding during the period. Total return assumes reinvestment of all dividends and distributions, if any. Total return does not reflect payment of sales charges, if any. Total return and portfolio turnover are not annualized for periods of less than one year. The portfolio turnover rate is calculated without regard to purchase and sales transactions of short-term instruments and certain derivatives, if any. If such transactions were included, the Fund's portfolio turnover rate may be higher.
| | | Year Ended August 31, | | Year Ended
March 31, | |
Class A | | 2015 | | 2014 | | 2013 | | 2012(a) | | 2012 | | 2011 | |
Per share data | |
Net asset value, beginning of period | | $ | 10.94 | | | $ | 9.13 | | | $ | 9.08 | | | $ | 10.01 | | | $ | 11.48 | | | $ | 11.27 | | |
Income from investment operations: | |
Net investment income (loss) | | | (0.01 | ) | | | (0.01 | ) | | | 0.14 | | | | 0.05 | | | | 0.05 | | | | 0.01 | | |
Net realized and unrealized gain (loss) | | | (2.14 | ) | | | 1.84 | | | | (0.05 | ) | | | (0.55 | ) | | | (0.95 | ) | | | 1.75 | | |
Total from investment operations | | | (2.15 | ) | | | 1.83 | | | | 0.09 | | | | (0.50 | ) | | | (0.90 | ) | | | 1.76 | | |
Less distributions to shareholders: | |
Net investment income | | | (0.00 | )(b) | | | (0.02 | ) | | | (0.04 | ) | | | — | | | | — | | | | (0.09 | ) | |
Net realized gains | | | — | | | | — | | | | — | | | | (0.43 | ) | | | (0.57 | ) | | | (1.46 | ) | |
Total distributions to shareholders | | | (0.00 | )(b) | | | (0.02 | ) | | | (0.04 | ) | | | (0.43 | ) | | | (0.57 | ) | | | (1.55 | ) | |
Net asset value, end of period | | $ | 8.79 | | | $ | 10.94 | | | $ | 9.13 | | | $ | 9.08 | | | $ | 10.01 | | | $ | 11.48 | | |
Total return | | | (19.65 | %) | | | 20.01 | % | | | 0.98 | % | | | (4.80 | %) | | | (8.06 | %) | | | 16.74 | % | |
Ratios to average net assets(c) | |
Total gross expenses | | | 1.62 | %(d) | | | 1.67 | %(d) | | | 1.76 | % | | | 2.08 | %(e) | | | 2.08 | %(d) | | | 1.96 | %(d) | |
Total net expenses(f) | | | 1.62 | %(d)(g) | | | 1.67 | %(d)(g) | | | 1.75 | %(g) | | | 1.92 | %(e)(g) | | | 1.87 | %(d)(g) | | | 1.65 | %(d)(g) | |
Net investment income (loss) | | | (0.07 | %) | | | (0.07 | %) | | | 1.42 | % | | | 1.41 | %(e) | | | 0.54 | % | | | 0.07 | % | |
Supplemental data | |
Net assets, end of period (in thousands) | | $ | 238,932 | | | $ | 314,231 | | | $ | 300,601 | | | $ | 11,177 | | | $ | 12,260 | | | $ | 12,388 | | |
Portfolio turnover | | | 76 | % | | | 80 | % | | | 81 | % | | | 35 | % | | | 117 | % | | | 78 | % | |
Notes to Financial Highlights
(a) For the period from April 1, 2012 to August 31, 2012. During the period, the Fund's fiscal year end was changed from March 31 to August 31.
(b) Rounds to zero.
(c) In addition to the fees and expenses that the Fund bears directly, the Fund indirectly bears a pro rata share of the fees and expenses of any other funds in which it invests. Such indirect expenses are not included in the Fund's reported expense ratios.
(d) Ratios include line of credit interest expense which is less than 0.01%.
(e) Annualized.
(f) Total net expenses include the impact of certain fee waivers/expense reimbursements made by the Investment Manager and certain of its affiliates, if applicable.
(g) The benefits derived from expense reductions had an impact of less than 0.01%.
The accompanying Notes to Financial Statements are an integral part of this statement.
Annual Report 2015
21
COLUMBIA EMERGING MARKETS FUND
FINANCIAL HIGHLIGHTS (continued)
| | | Year Ended August 31, | |
Class B | | 2015 | | 2014 | | 2013(a) | |
Per share data | |
Net asset value, beginning of period | | $ | 10.59 | | | $ | 8.89 | | | $ | 10.17 | | |
Income from investment operations: | |
Net investment income (loss) | | | (0.10 | ) | | | (0.09 | ) | | | 0.04 | | |
Net realized and unrealized gain (loss) | | | (2.05 | ) | | | 1.79 | | | | (1.32 | ) | |
Total from investment operations | | | (2.15 | ) | | | 1.70 | | | | (1.28 | ) | |
Net asset value, end of period | | $ | 8.44 | | | $ | 10.59 | | | $ | 8.89 | | |
Total return | | | (20.30 | %) | | | 19.12 | % | | | (12.59 | %) | |
Ratios to average net assets(b) | |
Total gross expenses | | | 2.37 | %(c) | | | 2.42 | %(c) | | | 2.49 | %(d) | |
Total net expenses(e) | | | 2.37 | %(c)(f) | | | 2.42 | %(c)(f) | | | 2.49 | %(d)(f) | |
Net investment income (loss) | | | (0.96 | %) | | | (0.89 | %) | | | 0.81 | %(d) | |
Supplemental data | |
Net assets, end of period (in thousands) | | $ | 2,600 | | | $ | 6,035 | | | $ | 8,713 | | |
Portfolio turnover | | | 76 | % | | | 80 | % | | | 81 | % | |
Notes to Financial Highlights
(a) Based on operations from February 28, 2013 (commencement of operations) through the stated period end.
(b) In addition to the fees and expenses that the Fund bears directly, the Fund indirectly bears a pro rata share of the fees and expenses of any other funds in which it invests. Such indirect expenses are not included in the Fund's reported expense ratios.
(c) Ratios include line of credit interest expense which is less than 0.01%.
(d) Annualized.
(e) Total net expenses include the impact of certain fee waivers/expense reimbursements made by the Investment Manager and certain of its affiliates, if applicable.
(f) The benefits derived from expense reductions had an impact of less than 0.01%.
The accompanying Notes to Financial Statements are an integral part of this statement.
Annual Report 2015
22
COLUMBIA EMERGING MARKETS FUND
FINANCIAL HIGHLIGHTS (continued)
| | | Year Ended August 31, | | Year Ended
March 31, | |
Class C | | 2015 | | 2014 | | 2013 | | 2012(a) | | 2012 | | 2011 | |
Per share data | |
Net asset value, beginning of period | | | $10.60 | | | $ | 8.90 | | | $ | 8.89 | | | $ | 9.84 | | | $ | 11.39 | | | $ | 11.21 | | |
Income from investment operations: | |
Net investment income (loss) | | | (0.08 | ) | | | (0.08 | ) | | | 0.05 | | | | 0.02 | | | | (0.03 | ) | | | (0.07 | ) | |
Net realized and unrealized gain (loss) | | | (2.07 | ) | | | 1.78 | | | | (0.03 | ) | | | (0.54 | ) | | | (0.95 | ) | | | 1.73 | | |
Total from investment operations | | | (2.15 | ) | | | 1.70 | | | | 0.02 | | | | (0.52 | ) | | | (0.98 | ) | | | 1.66 | | |
Less distributions to shareholders: | |
Net investment income | | | — | | | | — | | | | (0.01 | ) | | | — | | | | — | | | | (0.02 | ) | |
Net realized gains | | | — | | | | — | | | | — | | | | (0.43 | ) | | | (0.57 | ) | | | (1.46 | ) | |
Total distributions to shareholders | | | — | | | | — | | | | (0.01 | ) | | | (0.43 | ) | | | (0.57 | ) | | | (1.48 | ) | |
Redemption fees: | |
Net asset value, end of period | | $ | 8.45 | | | $ | 10.60 | | | $ | 8.90 | | | $ | 8.89 | | | $ | 9.84 | | | $ | 11.39 | | |
Total return | | | (20.28 | %) | | | 19.10 | % | | | 0.26 | % | | | (5.09 | %) | | | (8.86 | %) | | | 15.92 | % | |
Ratios to average net assets(b) | |
Total gross expenses | | | 2.37 | %(c) | | | 2.42 | %(c) | | | 2.53 | % | | | 2.83 | %(d) | | | 2.83 | %(c) | | | 2.71 | %(c) | |
Total net expenses(e) | | | 2.37 | %(c)(f) | | | 2.42 | %(c)(f) | | | 2.50 | %(f) | | | 2.67 | %(d)(f) | | | 2.62 | %(c)(f) | | | 2.40 | %(c)(f) | |
Net investment income (loss) | | | (0.83 | %) | | | (0.81 | %) | | | 0.49 | % | | | 0.65 | %(d) | | | (0.27 | %) | | | (0.62 | %) | |
Supplemental data | |
Net assets, end of period (in thousands) | | $ | 20,462 | | | $ | 27,126 | | | $ | 23,756 | | | $ | 2,820 | | | $ | 2,879 | | | $ | 2,100 | | |
Portfolio turnover | | | 76 | % | | | 80 | % | | | 81 | % | | | 35 | % | | | 117 | % | | | 78 | % | |
Notes to Financial Highlights
(a) For the period from April 1, 2012 to August 31, 2012. During the period, the Fund's fiscal year end was changed from March 31 to August 31.
(b) In addition to the fees and expenses that the Fund bears directly, the Fund indirectly bears a pro rata share of the fees and expenses of any other funds in which it invests. Such indirect expenses are not included in the Fund's reported expense ratios.
(c) Ratios include line of credit interest expense which is less than 0.01%.
(d) Annualized.
(e) Total net expenses include the impact of certain fee waivers/expense reimbursements made by the Investment Manager and certain of its affiliates, if applicable.
(f) The benefits derived from expense reductions had an impact of less than 0.01%.
The accompanying Notes to Financial Statements are an integral part of this statement.
Annual Report 2015
23
COLUMBIA EMERGING MARKETS FUND
FINANCIAL HIGHLIGHTS (continued)
| | | Year Ended August 31, | | Year Ended
March 31, | |
Class I | | 2015 | | 2014 | | 2013 | | 2012(a) | | 2012 | | 2011(b) | |
Per share data | |
Net asset value, beginning of period | | $ | 11.04 | | | $ | 9.21 | | | $ | 9.13 | | | $ | 10.04 | | | $ | 11.48 | | | $ | 11.71 | | |
Income from investment operations: | |
Net investment income (loss) | | | 0.04 | | | | 0.03 | | | | 0.08 | | | | 0.07 | | | | 0.06 | | | | (0.01 | ) | |
Net realized and unrealized gain (loss) | | | (2.17 | ) | | | 1.86 | | | | 0.06 | (c) | | | (0.55 | ) | | | (0.93 | ) | | | 0.88 | | |
Total from investment operations | | | (2.13 | ) | | | 1.89 | | | | 0.14 | | | | (0.48 | ) | | | (0.87 | ) | | | 0.87 | | |
Less distributions to shareholders: | |
Net investment income | | | (0.05 | ) | | | (0.06 | ) | | | (0.06 | ) | | | — | | | | — | | | | (0.10 | ) | |
Net realized gains | | | — | | | | — | | | | — | | | | (0.43 | ) | | | (0.57 | ) | | | (1.00 | ) | |
Total distributions to shareholders | | | (0.05 | ) | | | (0.06 | ) | | | (0.06 | ) | | | (0.43 | ) | | | (0.57 | ) | | | (1.10 | ) | |
Net asset value, end of period | | $ | 8.86 | | | $ | 11.04 | | | $ | 9.21 | | | $ | 9.13 | | | $ | 10.04 | | | $ | 11.48 | | |
Total return | | | (19.33 | %) | | | 20.60 | % | | | 1.47 | % | | | (4.58 | %) | | | (7.79 | %) | | | 7.75 | % | |
Ratios to average net assets(d) | |
Total gross expenses | | | 1.15 | %(e) | | | 1.18 | %(e) | | | 1.37 | % | | | 1.53 | %(f) | | | 1.56 | %(e) | | | 1.59 | %(e)(f) | |
Total net expenses(g) | | | 1.15 | %(e) | | | 1.18 | %(e) | | | 1.29 | % | | | 1.48 | %(f) | | | 1.51 | %(e) | | | 1.33 | %(e)(f) | |
Net investment income (loss) | | | 0.42 | % | | | 0.34 | % | | | 0.75 | % | | | 1.86 | %(f) | | | 0.65 | % | | | (0.09 | %)(f) | |
Supplemental data | |
Net assets, end of period (in thousands) | | $ | 129,430 | | | $ | 151,003 | | | $ | 184,937 | | | $ | 239,618 | | | $ | 214,524 | | | $ | 104,595 | | |
Portfolio turnover | | | 76 | % | | | 80 | % | | | 81 | % | | | 35 | % | | | 117 | % | | | 78 | % | |
Notes to Financial Highlights
(a) For the period from April 1, 2012 to August 31, 2012. During the period, the Fund's fiscal year end was changed from March 31 to August 31.
(b) Based on operations from September 27, 2010 (commencement of operations) through the stated period end.
(c) Calculation of the net gain (loss) per share (both realized and unrealized) does not correlate to the aggregate realized and unrealized gain (loss) presented in the Statement of Operations due to the timing of subscriptions and redemptions of Fund shares in relation to fluctuations in the market value of the portfolio.
(d) In addition to the fees and expenses that the Fund bears directly, the Fund indirectly bears a pro rata share of the fees and expenses of any other funds in which it invests. Such indirect expenses are not included in the Fund's reported expense ratios.
(e) Ratios include line of credit interest expense which is less than 0.01%.
(f) Annualized.
(g) Total net expenses include the impact of certain fee waivers/expense reimbursements made by the Investment Manager and certain of its affiliates, if applicable.
The accompanying Notes to Financial Statements are an integral part of this statement.
Annual Report 2015
24
COLUMBIA EMERGING MARKETS FUND
FINANCIAL HIGHLIGHTS (continued)
| | | Year Ended August 31, | |
Class K | | 2015 | | 2014 | | 2013(a) | |
Per share data | |
Net asset value, beginning of period | | $ | 10.98 | | | $ | 9.17 | | | $ | 10.44 | | |
Income from investment operations: | |
Net investment income (loss) | | | (0.01 | ) | | | (0.00 | )(b) | | | 0.11 | | |
Net realized and unrealized gain (loss) | | | (2.13 | ) | | | 1.85 | | | | (1.38 | ) | |
Total from investment operations | | | (2.14 | ) | | | 1.85 | | | | (1.27 | ) | |
Less distributions to shareholders: | |
Net investment income | | | (0.02 | ) | | | (0.04 | ) | | | — | | |
Total distributions to shareholders | | | (0.02 | ) | | | (0.04 | ) | | | — | | |
Net asset value, end of period | | $ | 8.82 | | | $ | 10.98 | | | $ | 9.17 | | |
Total return | | | (19.50 | %) | | | 20.21 | % | | | (12.16 | %) | |
Ratios to average net assets(c) | |
Total gross expenses | | | 1.44 | %(d) | | | 1.47 | %(d) | | | 1.51 | %(e) | |
Total net expenses(f) | | | 1.44 | %(d) | | | 1.47 | %(d) | | | 1.51 | %(e) | |
Net investment income (loss) | | | (0.06 | %) | | | (0.04 | %) | | | 2.21 | %(e) | |
Supplemental data | |
Net assets, end of period (in thousands) | | $ | 96 | | | $ | 206 | | | $ | 506 | | |
Portfolio turnover | | | 76 | % | | | 80 | % | | | 81 | % | |
Notes to Financial Highlights
(a) Based on operations from February 28, 2013 (commencement of operations) through the stated period end.
(b) Rounds to zero.
(c) In addition to the fees and expenses that the Fund bears directly, the Fund indirectly bears a pro rata share of the fees and expenses of any other funds in which it invests. Such indirect expenses are not included in the Fund's reported expense ratios.
(d) Ratios include line of credit interest expense which is less than 0.01%.
(e) Annualized.
(f) Total net expenses include the impact of certain fee waivers/expense reimbursements made by the Investment Manager and certain of its affiliates, if applicable.
The accompanying Notes to Financial Statements are an integral part of this statement.
Annual Report 2015
25
COLUMBIA EMERGING MARKETS FUND
FINANCIAL HIGHLIGHTS (continued)
| | | Year Ended August 31, | | Year Ended
March 31, | |
Class R | | 2015 | | 2014 | | 2013 | | 2012(a) | | 2012 | | 2011(b) | |
Per share data | |
Net asset value, beginning of period | | $ | 10.89 | | | $ | 9.09 | | | $ | 9.06 | | | $ | 9.99 | | | $ | 11.49 | | | $ | 11.70 | | |
Income from investment operations: | |
Net investment income (loss) | | | (0.03 | ) | | | (0.03 | ) | | | 0.11 | | | | 0.04 | | | | (0.06 | ) | | | (0.06 | ) | |
Net realized and unrealized gain (loss) | | | (2.14 | ) | | | 1.83 | | | | (0.05 | ) | | | (0.54 | ) | | | (0.87 | ) | | | 0.91 | | |
Total from investment operations | | | (2.17 | ) | | | 1.80 | | | | 0.06 | | | | (0.50 | ) | | | (0.93 | ) | | | 0.85 | | |
Less distributions to shareholders: | |
Net investment income | | | — | | | | — | | | | (0.03 | ) | | | — | | | | — | | | | (0.06 | ) | |
Net realized gains | | | — | | | | — | | | | — | | | | (0.43 | ) | | | (0.57 | ) | | | (1.00 | ) | |
Total distributions to shareholders | | | — | | | | — | | | | (0.03 | ) | | | (0.43 | ) | | | (0.57 | ) | | | (1.06 | ) | |
Net asset value, end of period | | $ | 8.72 | | | $ | 10.89 | | | $ | 9.09 | | | $ | 9.06 | | | $ | 9.99 | | | $ | 11.49 | | |
Total return | | | (19.93 | %) | | | 19.80 | % | | | 0.67 | % | | | (4.81 | %) | | | (8.32 | %) | | | 7.50 | % | |
Ratios to average net assets(c) | |
Total gross expenses | | | 1.87 | %(d) | | | 1.91 | %(d) | | | 2.02 | % | | | 2.33 | %(e) | | | 2.37 | %(d) | | | 2.21 | %(d)(e) | |
Total net expenses(f) | | | 1.87 | %(d)(g) | | | 1.91 | %(d)(g) | | | 2.00 | %(g) | | | 2.17 | %(e)(g) | | | 2.20 | %(d)(g) | | | 1.91 | %(d)(e)(g) | |
Net investment income (loss) | | | (0.30 | %) | | | (0.26 | %) | | | 1.09 | % | | | 1.15 | %(e) | | | (0.58 | %) | | | (0.97 | %)(e) | |
Supplemental data | |
Net assets, end of period (in thousands) | | $ | 6,997 | | | $ | 8,237 | | | $ | 5,863 | | | $ | 491 | | | $ | 514 | | | $ | 2 | | |
Portfolio turnover | | | 76 | % | | | 80 | % | | | 81 | % | | | 35 | % | | | 117 | % | | | 78 | % | |
Notes to Financial Highlights
(a) For the period from April 1, 2012 to August 31, 2012. During the period, the Fund's fiscal year end was changed from March 31 to August 31.
(b) Based on operations from September 27, 2010 (commencement of operations) through the stated period end.
(c) In addition to the fees and expenses that the Fund bears directly, the Fund indirectly bears a pro rata share of the fees and expenses of any other funds in which it invests. Such indirect expenses are not included in the Fund's reported expense ratios.
(d) Ratios include line of credit interest expense which is less than 0.01%.
(e) Annualized.
(f) Total net expenses include the impact of certain fee waivers/expense reimbursements made by the Investment Manager and certain of its affiliates, if applicable.
(g) The benefits derived from expense reductions had an impact of less than 0.01%.
The accompanying Notes to Financial Statements are an integral part of this statement.
Annual Report 2015
26
COLUMBIA EMERGING MARKETS FUND
FINANCIAL HIGHLIGHTS (continued)
| | | Year Ended August 31, | |
Class R4 | | 2015 | | 2014 | | 2013(a) | |
Per share data | |
Net asset value, beginning of period | | $ | 11.08 | | | $ | 9.24 | | | $ | 10.42 | | |
Income from investment operations: | |
Net investment income | | | 0.09 | | | | 0.04 | | | | 0.06 | | |
Net realized and unrealized gain (loss) | | | (2.24 | ) | | | 1.84 | | | | (1.24 | ) | |
Total from investment operations | | | (2.15 | ) | | | 1.88 | | | | (1.18 | ) | |
Less distributions to shareholders: | |
Net investment income | | | (0.03 | ) | | | (0.04 | ) | | | — | | |
Total distributions to shareholders | | | (0.03 | ) | | | (0.04 | ) | | | — | | |
Net asset value, end of period | | $ | 8.90 | | | $ | 11.08 | | | $ | 9.24 | | |
Total return | | | (19.45 | %) | | | 20.36 | % | | | (11.32 | %) | |
Ratios to average net assets(b) | |
Total gross expenses | | | 1.39 | %(c) | | | 1.41 | %(c) | | | 1.54 | %(d) | |
Total net expenses(e) | | | 1.39 | %(c)(f) | | | 1.41 | %(c)(f) | | | 1.53 | %(d)(f) | |
Net investment income | | | 0.91 | % | | | 0.35 | % | | | 1.31 | %(d) | |
Supplemental data | |
Net assets, end of period (in thousands) | | $ | 1,827 | | | $ | 301 | | | $ | 37 | | |
Portfolio turnover | | | 76 | % | | | 80 | % | | | 81 | % | |
Notes to Financial Highlights
(a) Based on operations from March 19, 2013 (commencement of operations) through the stated period end.
(b) In addition to the fees and expenses that the Fund bears directly, the Fund indirectly bears a pro rata share of the fees and expenses of any other funds in which it invests. Such indirect expenses are not included in the Fund's reported expense ratios.
(c) Ratios include line of credit interest expense which is less than 0.01%.
(d) Annualized.
(e) Total net expenses include the impact of certain fee waivers/expense reimbursements made by the Investment Manager and certain of its affiliates, if applicable.
(f) The benefits derived from expense reductions had an impact of less than 0.01%.
The accompanying Notes to Financial Statements are an integral part of this statement.
Annual Report 2015
27
COLUMBIA EMERGING MARKETS FUND
FINANCIAL HIGHLIGHTS (continued)
| | | Year Ended August 31, | |
Class R5 | | 2015 | | 2014 | | 2013(a) | |
Per share data | |
Net asset value, beginning of period | | $ | 11.05 | | | $ | 9.22 | | | $ | 9.72 | | |
Income from investment operations: | |
Net investment income | | | 0.11 | | | | 0.05 | | | | 0.13 | | |
Net realized and unrealized gain (loss) | | | (2.24 | ) | | | 1.84 | | | | (0.57 | ) | |
Total from investment operations | | | (2.13 | ) | | | 1.89 | | | | (0.44 | ) | |
Less distributions to shareholders: | |
Net investment income | | | (0.05 | ) | | | (0.06 | ) | | | (0.06 | ) | |
Total distributions to shareholders | | | (0.05 | ) | | | (0.06 | ) | | | (0.06 | ) | |
Net asset value, end of period | | $ | 8.87 | | | $ | 11.05 | | | $ | 9.22 | | |
Total return | | | (19.35 | %) | | | 20.58 | % | | | (4.60 | %) | |
Ratios to average net assets(b) | |
Total gross expenses | | | 1.21 | %(c) | | | 1.22 | %(c) | | | 1.32 | %(d) | |
Total net expenses(e) | | | 1.21 | %(c) | | | 1.22 | %(c) | | | 1.29 | %(d) | |
Net investment income | | | 1.08 | % | | | 0.46 | % | | | 1.65 | %(d) | |
Supplemental data | |
Net assets, end of period (in thousands) | | $ | 17,559 | | | $ | 3,087 | | | $ | 1,381 | | |
Portfolio turnover | | | 76 | % | | | 80 | % | | | 81 | % | |
Notes to Financial Highlights
(a) Based on operations from November 8, 2012 (commencement of operations) through the stated period end.
(b) In addition to the fees and expenses that the Fund bears directly, the Fund indirectly bears a pro rata share of the fees and expenses of any other funds in which it invests. Such indirect expenses are not included in the Fund's reported expense ratios.
(c) Ratios include line of credit interest expense which is less than 0.01%.
(d) Annualized.
(e) Total net expenses include the impact of certain fee waivers/expense reimbursements made by the Investment Manager and certain of its affiliates, if applicable.
The accompanying Notes to Financial Statements are an integral part of this statement.
Annual Report 2015
28
COLUMBIA EMERGING MARKETS FUND
FINANCIAL HIGHLIGHTS (continued)
| | | Year Ended August 31, | | Year Ended
March 31, | |
Class W | | 2015 | | 2014 | | 2013 | | 2012(a) | | 2012 | | 2011(b) | |
Per share data | |
Net asset value, beginning of period | | $ | 10.94 | | | $ | 9.13 | | | $ | 9.07 | | | $ | 10.00 | | | $ | 11.48 | | | $ | 11.70 | | |
Income from investment operations: | |
Net investment income (loss) | | | (0.02 | ) | | | (0.07 | ) | | | 0.02 | | | | 0.05 | | | | 0.07 | | | | (0.02 | ) | |
Net realized and unrealized gain (loss) | | | (2.14 | ) | | | 1.89 | | | | 0.08 | (c) | | | (0.55 | ) | | | (0.98 | ) | | | 0.88 | | |
Total from investment operations | | | (2.16 | ) | | | 1.82 | | | | 0.10 | | | | (0.50 | ) | | | (0.91 | ) | | | 0.86 | | |
Less distributions to shareholders: | |
Net investment income | | | (0.00 | )(d) | | | (0.01 | ) | | | (0.04 | ) | | | — | | | | — | | | | (0.08 | ) | |
Net realized gains | | | — | | | | — | | | | — | | | | (0.43 | ) | | | (0.57 | ) | | | (1.00 | ) | |
Total distributions to shareholders | | | (0.00 | )(d) | | | (0.01 | ) | | | (0.04 | ) | | | (0.43 | ) | | | (0.57 | ) | | | (1.08 | ) | |
Net asset value, end of period | | $ | 8.78 | | | $ | 10.94 | | | $ | 9.13 | | | $ | 9.07 | | | $ | 10.00 | | | $ | 11.48 | | |
Total return | | | (19.74 | %) | | | 19.98 | % | | | 1.09 | % | | | (4.81 | %) | | | (8.15 | %) | | | 7.61 | % | |
Ratios to average net assets(e) | |
Total gross expenses | | | 1.62 | %(f) | | | 1.67 | %(f) | | | 1.91 | % | | | 2.09 | %(g) | | | 2.09 | %(f) | | | 1.95 | %(f)(g) | |
Total net expenses(h) | | | 1.62 | %(f)(i) | | | 1.67 | %(f)(i) | | | 1.77 | %(i) | | | 1.92 | %(g)(i) | | | 1.85 | %(f)(i) | | | 1.65 | %(f)(g)(i) | |
Net investment income (loss) | | | (0.15 | %) | | | (0.68 | %) | | | 0.25 | % | | | 1.41 | %(g) | | | 0.73 | % | | | (0.41 | %)(g) | |
Supplemental data | |
Net assets, end of period (in thousands) | | $ | 57 | | | $ | 133 | | | $ | 31,426 | | | $ | 31,470 | | | $ | 30,863 | | | $ | 50,623 | | |
Portfolio turnover | | | 76 | % | | | 80 | % | | | 81 | % | | | 35 | % | | | 117 | % | | | 78 | % | |
Notes to Financial Highlights
(a) For the period from April 1, 2012 to August 31, 2012. During the period, the Fund's fiscal year end was changed from March 31 to August 31.
(b) Based on operations from September 27, 2010 (commencement of operations) through the stated period end.
(c) Calculation of the net gain (loss) per share (both realized and unrealized) does not correlate to the aggregate realized and unrealized gain (loss) presented in the Statement of Operations due to the timing of subscriptions and redemptions of Fund shares in relation to fluctuations in the market value of the portfolio.
(d) Rounds to zero.
(e) In addition to the fees and expenses that the Fund bears directly, the Fund indirectly bears a pro rata share of the fees and expenses of any other funds in which it invests. Such indirect expenses are not included in the Fund's reported expense ratios.
(f) Ratios include line of credit interest expense which is less than 0.01%.
(g) Annualized.
(h) Total net expenses include the impact of certain fee waivers/expense reimbursements made by the Investment Manager and certain of its affiliates, if applicable.
(i) The benefits derived from expense reductions had an impact of less than 0.01%.
The accompanying Notes to Financial Statements are an integral part of this statement.
Annual Report 2015
29
COLUMBIA EMERGING MARKETS FUND
FINANCIAL HIGHLIGHTS (continued)
| | | Year Ended August 31, | |
Class Y | | 2015 | | 2014 | | 2013(a) | |
Per share data | |
Net asset value, beginning of period | | $ | 11.09 | | | $ | 9.24 | | | $ | 9.74 | | |
Income from investment operations: | |
Net investment income | | | 0.05 | | | | 0.06 | | | | 0.09 | | |
Net realized and unrealized gain (loss) | | | (2.19 | ) | | | 1.85 | | | | (0.53 | ) | |
Total from investment operations | | | (2.14 | ) | | | 1.91 | | | | (0.44 | ) | |
Less distributions to shareholders: | |
Net investment income | | | (0.05 | ) | | | (0.06 | ) | | | (0.06 | ) | |
Total distributions to shareholders | | | (0.05 | ) | | | (0.06 | ) | | | (0.06 | ) | |
Net asset value, end of period | | $ | 8.90 | | | $ | 11.09 | | | $ | 9.24 | | |
Total return | | | (19.34 | %) | | | 20.73 | % | | | (4.57 | %) | |
Ratios to average net assets(b) | |
Total gross expenses | | | 1.15 | %(c) | | | 1.19 | %(c) | | | 1.31 | %(d) | |
Total net expenses(e) | | | 1.15 | %(c) | | | 1.19 | %(c) | | | 1.31 | %(d) | |
Net investment income | | | 0.46 | % | | | 0.56 | % | | | 1.16 | %(d) | |
Supplemental data | |
Net assets, end of period (in thousands) | | $ | 5,351 | | | $ | 4,148 | | | $ | 465 | | |
Portfolio turnover | | | 76 | % | | | 80 | % | | | 81 | % | |
Notes to Financial Highlights
(a) Based on operations from November 8, 2012 (commencement of operations) through the stated period end.
(b) In addition to the fees and expenses that the Fund bears directly, the Fund indirectly bears a pro rata share of the fees and expenses of any other funds in which it invests. Such indirect expenses are not included in the Fund's reported expense ratios.
(c) Ratios include line of credit interest expense which is less than 0.01%.
(d) Annualized.
(e) Total net expenses include the impact of certain fee waivers/expense reimbursements made by the Investment Manager and certain of its affiliates, if applicable.
The accompanying Notes to Financial Statements are an integral part of this statement.
Annual Report 2015
30
COLUMBIA EMERGING MARKETS FUND
FINANCIAL HIGHLIGHTS (continued)
| | | Year Ended August 31, | | Year Ended
March 31, | |
Class Z | | 2015 | | 2014 | | 2013 | | 2012(a) | | 2012 | | 2011 | |
Per share data | |
Net asset value, beginning of period | | $ | 11.00 | | | $ | 9.18 | | | $ | 9.11 | | | $ | 10.03 | | | $ | 11.49 | | | $ | 11.26 | | |
Income from investment operations: | |
Net investment income | | | 0.02 | | | | 0.03 | | | | 0.09 | | | | 0.06 | | | | 0.09 | | | | 0.06 | | |
Net realized and unrealized gain (loss) | | | (2.15 | ) | | | 1.83 | | | | 0.03 | (b) | | | (0.55 | ) | | | (0.98 | ) | | | 1.74 | | |
Total from investment operations | | | (2.13 | ) | | | 1.86 | | | | 0.12 | | | | (0.49 | ) | | | (0.89 | ) | | | 1.80 | | |
Less distributions to shareholders: | |
Net investment income | | | (0.03 | ) | | | (0.04 | ) | | | (0.05 | ) | | | — | | | | — | | | | (0.11 | ) | |
Net realized gains | | | — | | | | — | | | | — | | | | (0.43 | ) | | | (0.57 | ) | | | (1.46 | ) | |
Total distributions to shareholders | | | (0.03 | ) | | | (0.04 | ) | | | (0.05 | ) | | | (0.43 | ) | | | (0.57 | ) | | | (1.57 | ) | |
Net asset value, end of period | | $ | 8.84 | | | $ | 11.00 | | | $ | 9.18 | | | $ | 9.11 | | | $ | 10.03 | | | $ | 11.49 | | |
Total return | | | (19.41 | %) | | | 20.28 | % | | | 1.29 | % | | | (4.69 | %) | | | (7.96 | %) | | | 17.16 | % | |
Ratios to average net assets(c) | |
Total gross expenses | | | 1.37 | %(d) | | | 1.41 | %(d) | | | 1.60 | % | | | 1.83 | %(e) | | | 1.83 | %(d) | | | 1.71 | %(d) | |
Total net expenses(f) | | | 1.37 | %(d)(g) | | | 1.41 | %(d)(g) | | | 1.52 | %(g) | | | 1.67 | %(e)(g) | | | 1.61 | %(d)(g) | | | 1.40 | %(d)(g) | |
Net investment income | | | 0.18 | % | | | 0.25 | % | | | 0.94 | % | | | 1.65 | %(e) | | | 0.87 | % | | | 0.52 | % | |
Supplemental data | |
Net assets, end of period (in thousands) | | $ | 760,839 | | | $ | 1,060,340 | | | $ | 646,228 | | | $ | 174,554 | | | $ | 206,451 | | | $ | 326,675 | | |
Portfolio turnover | | | 76 | % | | | 80 | % | | | 81 | % | | | 35 | % | | | 117 | % | | | 78 | % | |
Notes to Financial Highlights
(a) For the period from April 1, 2012 to August 31, 2012. During the period, the Fund's fiscal year end was changed from March 31 to August 31.
(b) Calculation of the net gain (loss) per share (both realized and unrealized) does not correlate to the aggregate realized and unrealized gain (loss) presented in the Statement of Operations due to the timing of subscriptions and redemptions of Fund shares in relation to fluctuations in the market value of the portfolio.
(c) In addition to the fees and expenses that the Fund bears directly, the Fund indirectly bears a pro rata share of the fees and expenses of any other funds in which it invests. Such indirect expenses are not included in the Fund's reported expense ratios.
(d) Ratios include line of credit interest expense which is less than 0.01%.
(e) Annualized.
(f) Total net expenses include the impact of certain fee waivers/expense reimbursements made by the Investment Manager and certain of its affiliates, if applicable.
(g) The benefits derived from expense reductions had an impact of less than 0.01%.
The accompanying Notes to Financial Statements are an integral part of this statement.
Annual Report 2015
31
COLUMBIA EMERGING MARKETS FUND
NOTES TO FINANCIAL STATEMENTS
August 31, 2015
Note 1. Organization
Columbia Emerging Markets Fund (the Fund), a series of Columbia Funds Series Trust I (the Trust), is a diversified fund. The Trust is registered under the Investment Company Act of 1940, as amended (the 1940 Act), as an open-end management investment company organized as a Massachusetts business trust.
Fund Shares
The Trust may issue an unlimited number of shares (without par value). The Fund offers Class A, Class B, Class C, Class I, Class K, Class R, Class R4, Class R5, Class W, Class Y and Class Z shares. Although all share classes generally have identical voting, dividend and liquidation rights, each share class votes separately when required by the Trust's organizational documents or by law. Different share classes pay different distribution amounts to the extent the expenses of such share classes differ, and distributions in liquidation will be proportional to the net asset value of each share class. Each share class has its own expense and sales charge structure.
Class A shares are subject to a maximum front-end sales charge of 5.75% based on the initial investment amount. Class A shares purchased without an initial sales charge in accounts aggregating $1 million to $50 million at the time of purchase are subject to a contingent deferred sales charge (CDSC) if the shares are sold within 18 months after purchase, charged as follows: 1.00% CDSC if redeemed within 12 months after purchase, and 0.50% CDSC if redeemed more than 12, but less than 18, months after purchase.
Class B shares may be subject to a maximum CDSC of 5.00% based upon the holding period after purchase. Class B shares will generally convert to Class A shares eight years after purchase. The Fund no longer accepts investments by new or existing investors in the Fund's Class B shares, except in connection with the reinvestment of any dividend and/or capital gain distributions in Class B shares of the Fund and exchanges by existing Class B shareholders of certain other funds within the Columbia Family of Funds.
Class C shares are subject to a 1.00% CDSC on shares redeemed within one year after purchase.
Class I shares are not subject to sales charges and are available only to the Columbia Family of Funds.
Class K shares are not subject to sales charges, however this share class is closed to new investors.
Class R shares are not subject to sales charges and are generally available only to certain retirement plans and other investors as described in the Fund's prospectus.
Class R4 shares are not subject to sales charges and are generally available only to omnibus retirement plans and certain investors as described in the Fund's prospectus.
Class R5 shares are not subject to sales charges and are generally available only to investors purchasing through authorized investment professionals and omnibus retirement plans.
Class W shares are not subject to sales charges and are available only to investors purchasing through authorized investment programs managed by investment professionals, including discretionary managed account programs.
Class Y shares are not subject to sales charges and are generally available only to certain retirement plans as described in the Fund's prospectus.
Class Z shares are not subject to sales charges and are available only to eligible investors, which are subject to different investment minimums as described in the Fund's prospectus.
Note 2. Summary of Significant Accounting Policies
Basis of Preparation
The Fund is an investment company that applies the accounting and reporting guidance in the Financial Accounting Standards Board (FASB) Accounting Standards Codification Topic 946, Financial Services — Investment Companies (ASC 946). The financial statements are prepared in accordance with U.S. generally accepted accounting principles (GAAP), which requires management to make certain estimates and assumptions that affect the reported amounts of assets and liabilities, the disclosure of contingent assets and liabilities at the date of the financial statements and the reported amounts of income and expenses during the reporting period. Actual results could differ from those estimates.
The following is a summary of significant accounting policies followed by the Fund in the preparation of its financial statements.
Security Valuation
All equity securities are valued at the close of business of the New York Stock Exchange (NYSE). Equity securities are valued at the last quoted sales price on the principal
Annual Report 2015
32
COLUMBIA EMERGING MARKETS FUND
NOTES TO FINANCIAL STATEMENTS (continued)
August 31, 2015
exchange or market on which they trade, except for securities traded on the NASDAQ Stock Market, which are valued at the NASDAQ official close price. Unlisted securities or listed securities for which there were no sales during the day are valued at the mean of the latest quoted bid and ask prices on such exchanges or markets.
Foreign equity securities are valued based on the closing price on the foreign exchange in which such securities are primarily traded. If any foreign equity security closing prices are not readily available, the securities are valued at the mean of the latest quoted bid and ask prices on such exchanges or markets. Foreign currency exchange rates are generally determined at 4:00 p.m. Eastern (U.S.) time. Many securities markets and exchanges outside the U.S. close prior to the close of the NYSE; therefore, the closing prices for securities in such markets or on such exchanges may not fully reflect events that occur after such close but before the close of the NYSE. In those situations, foreign securities will be fair valued pursuant to a policy adopted by the Board of Trustees (the Board), including, if available, utilizing a third party pricing service to determine these fair values. The third party pricing service takes into account multiple factors, including, but not limited to, movements in the U.S. securities markets, certain depositary receipts, futures contracts and foreign exchange rates that have occurred subsequent to the close of the foreign exchange or market, to determine a good faith estimate that reasonably reflects the current market conditions as of the close of the NYSE. The fair value of a security is likely to be different from the quoted or published price, if available.
Investments in open-end investment companies, including money market funds, are valued at their latest net asset value.
Investments for which market quotations are not readily available, or that have quotations which management believes are not reflective of market value or reliable, are valued at fair value as determined in good faith under procedures approved by and under the general supervision of the Board. If a security or class of securities (such as foreign securities) is valued at fair value, such value is likely to be different from the quoted or published price for the security.
The determination of fair value often requires significant judgment. To determine fair value, management may use assumptions including but not limited to future cash
flows and estimated risk premiums. Multiple inputs from various sources may be used to determine fair value.
GAAP requires disclosure regarding the inputs and valuation techniques used to measure fair value and any changes in valuation inputs or techniques. In addition, investments shall be disclosed by major category. This information is disclosed following the Fund's Portfolio of Investments.
Foreign Currency Transactions and Translations
The values of all assets and liabilities denominated in foreign currencies are generally translated into U.S. dollars at exchange rates determined at the close of the NYSE. Net realized and unrealized gains (losses) on foreign currency transactions and translations include gains (losses) arising from the fluctuation in exchange rates between trade and settlement dates on securities transactions, gains (losses) arising from the disposition of foreign currency and currency gains (losses) between the accrual and payment dates on dividends, interest income and foreign withholding taxes.
For financial statement purposes, the Fund does not distinguish that portion of gains (losses) on investments which is due to changes in foreign exchange rates from that which is due to changes in market prices of the investments. Such fluctuations are included with the net realized and unrealized gains (losses) on investments in the Statement of Operations.
Security Transactions
Security transactions are accounted for on the trade date. Cost is determined and gains (losses) are based upon the specific identification method for both financial statement and federal income tax purposes.
Income Recognition
Corporate actions and dividend income are generally recorded net of any non-reclaimable tax withholdings, on the ex-dividend date or upon receipt of ex-dividend notification in the case of certain foreign securities.
The Fund may receive distributions from holdings in equity securities, business development companies (BDCs), exchange-traded funds, other regulated investment companies (RICs), and real estate investment trusts (REITs), which report information on the tax character of their distributions annually. These distributions are allocated to dividend income, capital gain and return of capital based on actual information reported. Return of capital is recorded as a reduction of the cost basis of securities held. If the Fund no longer
Annual Report 2015
33
COLUMBIA EMERGING MARKETS FUND
NOTES TO FINANCIAL STATEMENTS (continued)
August 31, 2015
owns the applicable securities, return of capital is recorded as a realized gain. With respect to REITs, to the extent actual information has not yet been reported, estimates for return of capital are made by the Fund's management. Management's estimates are subsequently adjusted when the actual character of the distributions is disclosed by the REITs, which could result in a proportionate change in return of capital to shareholders.
Awards from class action litigation are recorded as a reduction of cost basis if the Fund still owns the applicable securities on the payment date. If the Fund no longer owns the applicable securities, the proceeds are recorded as realized gains.
Expenses
General expenses of the Trust are allocated to the Fund and other funds of the Trust based upon relative net assets or other expense allocation methodologies determined by the nature of the expense. Expenses directly attributable to the Fund are charged to the Fund. Expenses directly attributable to a specific class of shares are charged to that share class.
Determination of Class Net Asset Value
All income, expenses (other than class-specific expenses, which are charged to that share class, as shown in the Statement of Operations) and realized and unrealized gains (losses) are allocated to each class of the Fund on a daily basis, based on the relative net assets of each class, for purposes of determining the net asset value of each class.
Federal Income Tax Status
The Fund intends to qualify each year as a regulated investment company under Subchapter M of the Internal Revenue Code, as amended, and will distribute substantially all of its taxable income (including net short-term capital gains), if any, for its tax year, and as such will not be subject to federal income taxes. In addition, the Fund intends to distribute in each calendar year substantially all of its net investment income, capital gains and certain other amounts, if any, such that the Fund should not be subject to federal excise tax. Therefore, no federal income or excise tax provision is recorded.
Foreign Taxes
The Fund may be subject to foreign taxes on income, gains on investments or currency repatriation, a portion of which may be recoverable. The Fund will accrue such
taxes and recoveries, as applicable, based upon its current interpretation of tax rules and regulations that exist in the markets in which it invests.
Realized gains in certain countries may be subject to foreign taxes at the Fund level, based on statutory rates. The Fund accrues for such foreign taxes on realized and unrealized gains at the appropriate rate for each jurisdiction, as applicable. The amount, if any, is disclosed as a liability on the Statement of Assets and Liabilities.
Distributions to Shareholders
Distributions from net investment income, if any, are declared and paid annually. Net realized capital gains, if any, are distributed along with the income distribution. Income distributions and capital gain distributions are determined in accordance with federal income tax regulations, which may differ from GAAP.
Guarantees and Indemnifications
Under the Trust's organizational documents and, in some cases, by contract, its officers and trustees are indemnified against certain liabilities arising out of the performance of their duties to the Trust or its funds. In addition, certain of the Fund's contracts with its service providers contain general indemnification clauses. The Fund's maximum exposure under these arrangements is unknown since the amount of any future claims that may be made against the Fund cannot be determined, and the Fund has no historical basis for predicting the likelihood of any such claims.
Recent Accounting Pronouncement
Fair Value Measurement (Topic 820), Disclosure for Investments in Certain Entities That Calculate Net Asset Value per Share (or Its Equivalent)
In May 2015, the Financial Accounting Standards Board (FASB) issued Accounting Standards Update (ASU) No. 2015-07, Fair Value Measurement (Topic 820), Disclosure for Investments in Certain Entities That Calculate Net Asset Value per Share (or Its Equivalent). ASU No. 2015-07 changes the disclosure requirements for investments for which fair value is measured using the net asset value per share practical expedient. The disclosure requirements are effective for annual periods beginning after December 15, 2015 and interim periods within those fiscal years. At this time, management is evaluating the implications of this guidance and the impact it will have on the financial statement amounts and footnote disclosures, if any.
Annual Report 2015
34
COLUMBIA EMERGING MARKETS FUND
NOTES TO FINANCIAL STATEMENTS (continued)
August 31, 2015
Note 3. Fees and Other Transactions with Affiliates
Investment Management Fees
Under an Investment Management Services Agreement, Columbia Management Investment Advisers, LLC (the Investment Manager), a wholly-owned subsidiary of Ameriprise Financial, Inc. (Ameriprise Financial), determines which securities will be purchased, held or sold. The investment management fee is an annual fee that is equal to a percentage of the Fund's average daily net assets that declines from 1.10% to 0.66% as the Fund's net assets increase. The effective investment management fee rate for the year ended August 31, 2015 was 0.98% of the Fund's average daily net assets.
Administration Fees
Under an Administrative Services Agreement, the Investment Manager also serves as the Fund Administrator. The Fund pays the Fund Administrator an annual fee for administration and accounting services equal to a percentage of the Fund's average daily net assets that declines from 0.08% to 0.06% as the Fund's net assets increase. The effective administration fee rate for the year ended August 31, 2015 was 0.08% of the Fund's average daily net assets.
Compensation of Board Members
Board members, who are not officers or employees of the Investment Manager or Ameriprise Financial, are compensated for their services to the Fund as disclosed in the Statement of Operations. These Board members may participate in a Deferred Compensation Plan (the Plan) which may be terminated at any time. Obligations of the Plan will be paid solely out of the Fund's assets, and all amounts payable under the Plan constitute a general unsecured obligation of the Fund.
Compensation of Chief Compliance Officer
The Board has appointed a Chief Compliance Officer to the Fund in accordance with federal securities regulations. The Fund is allocated a portion of the expenses associated with the Chief Compliance Officer based on relative net assets of the Trust.
Transfer Agency Fees
Under a Transfer and Dividend Disbursing Agent Agreement, Columbia Management Investment Services Corp. (the Transfer Agent), an affiliate of the Investment Manager and a wholly-owned subsidiary of Ameriprise Financial, is responsible for providing transfer agency
services to the Fund. The Transfer Agent has contracted with Boston Financial Data Services (BFDS) to serve as sub-transfer agent.
Effective November 1, 2014, the Transfer Agent receives a monthly transfer agency fee based on the number or the average value of accounts, depending on the type of account. Prior to November 1, 2014, the Transfer Agent received a monthly account-based service fee based on the number of open accounts. In addition, the Transfer Agent also receives sub-transfer agency fees based on a percentage of the average aggregate value of the Fund's shares maintained in omnibus accounts (other than omnibus accounts for which American Enterprise Investment Services Inc. is the broker of record or accounts where the beneficial shareholder is a customer of Ameriprise Financial Services, Inc., for which the Transfer Agent receives a per account fee). The Transfer Agent pays the fees of BFDS for services as sub-transfer agent and is not entitled to reimbursement for such fees from the Fund (with the exception of out-of-pocket fees).
The Transfer Agent also receives compensation from the Fund for various shareholder services and reimbursements for certain out-of-pocket fees. Total transfer agency fees for Class K and Class R5 shares are subject to an annual limitation of not more than 0.05% of the average daily net assets attributable to each share class. Class I and Class Y shares do not pay transfer agency fees.
For the year ended August 31, 2015, the Fund's effective transfer agency fee rates as a percentage of average daily net assets of each class were as follows:
Class A | | | 0.22 | % | |
Class B | | | 0.22 | | |
Class C | | | 0.22 | | |
Class K | | | 0.05 | | |
Class R | | | 0.23 | | |
Class R4 | | | 0.23 | | |
Class R5 | | | 0.05 | | |
Class W | | | 0.22 | | |
Class Z | | | 0.22 | | |
The Fund and certain other associated investment companies have severally, but not jointly, guaranteed the performance and observance of all the terms and conditions of a lease entered into by Seligman Data Corp. (SDC), the former transfer agent, including the payment of rent by SDC (the Guaranty). SDC was the legacy Seligman funds' former transfer agent.
Annual Report 2015
35
COLUMBIA EMERGING MARKETS FUND
NOTES TO FINANCIAL STATEMENTS (continued)
August 31, 2015
The lease and the Guaranty expire in January 2019. At August 31, 2015, the Fund's total potential future obligation over the life of the Guaranty is $50,485. The liability remaining at August 31, 2015 for non-recurring charges associated with the lease amounted to $29,035 and is recorded as a part of the payable for other expenses in the Statement of Assets and Liabilities.
An annual minimum account balance fee of $20 may apply to certain accounts with a value below the applicable share class's initial minimum investment requirements to reduce the impact of small accounts on transfer agency fees. These minimum account balance fees are remitted to the Fund and recorded as part of expense reductions in the Statement of Operations. For the year ended August 31, 2015, these minimum account balance fees reduced total expenses of the Fund by $2,024.
Plan Administration Fees
Under a Plan Administration Services Agreement with the Transfer Agent, the Fund pays an annual fee at a rate of 0.25% of the Fund's average daily net assets attributable to Class K shares for the provision of various administrative, recordkeeping, communication and educational services.
Distribution and Service Fees
The Fund has an agreement with Columbia Management Investment Distributors, Inc. (the Distributor), an affiliate of the Investment Manager and a wholly-owned subsidiary of Ameriprise Financial, for distribution and shareholder services. The Board has approved, and the Fund has adopted, distribution and shareholder service plans (the Plans) applicable to certain share classes, which set the distribution and service fees for the Fund. These fees are calculated daily and are intended to compensate the Distributor and/or eligible selling and/or servicing agents for selling shares of the Fund and providing services to investors.
Under the Plans, the Fund pays a monthly service fee to the Distributor at the maximum annual rate of 0.25% of the average daily net assets attributable to Class A, Class B, Class C and Class W shares of the Fund. Also under the Plans, the Fund pays a monthly distribution fee to the Distributor at the maximum annual rates of 0.75%, 0.75%, 0.50% and 0.25% of the average daily net assets attributable to Class B, Class C, Class R and Class W shares of the Fund, respectively.
Although the Fund may pay a distribution fee up to 0.25% of the Fund's average daily net assets attributable to
Class W shares and a service fee of up to 0.25% of the Fund's average daily net assets attributable to Class W shares, the aggregate fee shall not exceed 0.25% of the Fund's average daily net assets attributable to Class W shares.
Sales Charges
Sales charges, including front-end charges and CDSCs, received by the Distributor for distributing Fund shares were $220,928 for Class A, $683 for Class B and $1,505 for Class C shares for the year ended August 31, 2015.
Expenses Waived/Reimbursed by the Investment Manager and its Affiliates
The Fund's expense ratio is subject to an expense reimbursement arrangement pursuant to which fees will be waived and/or expenses reimbursed (excluding certain fees and expenses described below), so that the Fund's net operating expenses, after giving effect to fees waived/expenses reimbursed and any balance credits and/or overdraft charges from the Fund's custodian, do not exceed the annual rates of:
| | | Voluntary
Expense Cap
Effective
January 1, 2015 | | Contractual
Expense Cap
Prior to
January 1, 2015 | |
Class A | | | 1.74 | % | | | 1.78 | % | |
Class B | | | 2.49 | | | | 2.53 | | |
Class C | | | 2.49 | | | | 2.53 | | |
Class I | | | 1.33 | | | | 1.33 | | |
Class K | | | 1.63 | | | | 1.63 | | |
Class R | | | 1.99 | | | | 2.03 | | |
Class R4 | | | 1.49 | | | | 1.53 | | |
Class R5 | | | 1.38 | | | | 1.38 | | |
Class W | | | 1.74 | | | | 1.78 | | |
Class Y | | | 1.33 | | | | 1.33 | | |
Class Z | | | 1.49 | | | | 1.53 | | |
The voluntary expense cap arrangement may be revised or discontinued at any time. Under the arrangements, the following fees and expenses are excluded from the waiver/reimbursement commitment, and therefore will be paid by the Fund, if applicable: taxes (including foreign transaction taxes), expenses associated with investments in affiliated and non-affiliated pooled investment vehicles (including mutual funds and exchange-traded funds), transaction costs and brokerage commissions, costs related to any securities lending program, dividend and interest expenses associated with
Annual Report 2015
36
COLUMBIA EMERGING MARKETS FUND
NOTES TO FINANCIAL STATEMENTS (continued)
August 31, 2015
securities sold short, inverse floater program fees and expenses, transaction charges and interest on borrowed money, interest and extraordinary expenses. Any fees waived and/or expenses reimbursed under the expense reimbursement arrangements described above are not recoverable by the Investment Manager or its affiliates in future periods.
Note 4. Federal Tax Information
The timing and character of income and capital gain distributions are determined in accordance with income tax regulations, which may differ from GAAP because of temporary or permanent book to tax differences.
At August 31, 2015, these differences are primarily due to differing treatment for deferral/reversal of wash sale losses, Trustees' deferred compensation, distribution reclassifications, foreign capital gains tax, foreign currency transactions, post-October capital losses, late-year ordinary losses and excess distributions. To the extent these differences are permanent, reclassifications are made among the components of the Fund's net assets in the Statement of Assets and Liabilities. Temporary differences do not require reclassifications. In the Statement of Assets and Liabilities the following reclassifications were made:
Excess of distributions over net investment income | | $ | (1,252,122 | ) | |
Accumulated net realized loss | | | 2,422,367 | | |
Paid-in capital | | | (1,170,245 | ) | |
Net investment income (loss) and net realized gains (losses), as disclosed in the Statement of Operations, and net assets were not affected by this reclassification.
The tax character of distributions paid during the years indicated was as follows:
Year Ended August 31, | | 2015 | | 2014 | |
Ordinary income | | $ | 3,319,253 | | | $ | 4,470,039 | | |
Long-term capital gains | | | 285,494 | | | | — | | |
Total | | $ | 3,604,747 | | | $ | 4,470,039 | | |
Short-term capital gain distributions, if any, are considered ordinary income distributions for tax purposes.
At August 31, 2015, the components of distributable earnings on a tax basis were as follows:
Net unrealized appreciation | | $ | 12,718,097 | | |
At August 31, 2015, the cost of investments for federal income tax purposes was $1,180,524,503 and the
aggregate gross unrealized appreciation and depreciation based on that cost was:
Unrealized appreciation | | $ | 134,164,372 | | |
Unrealized depreciation | | | (121,446,275 | ) | |
Net unrealized appreciation | | | 12,718,097 | | |
For the year ended August 31, 2015, $6,941,797 of capital loss carryforward was utilized.
Under current tax rules, regulated investment companies can elect to treat certain late-year ordinary losses incurred and post-October capital losses (capital losses realized after October 31) as arising on the first day of the following taxable year. As of August 31, 2015, the Fund will elect to treat late-year ordinary losses of $892,367 and post-October capital losses of $75,548,287 as arising on September 1, 2015.
Management of the Fund has concluded that there are no significant uncertain tax positions in the Fund that would require recognition in the financial statements. However, management's conclusion may be subject to review and adjustment at a later date based on factors including, but not limited to, new tax laws, regulations, and administrative interpretations (including relevant court decisions). Generally, the Fund's federal tax returns for the prior three fiscal years remain subject to examination by the Internal Revenue Service.
Note 5. Portfolio Information
The cost of purchases and proceeds from sales of securities, excluding short-term investments and derivatives, if any, aggregated to $1,104,966,415 and $1,172,564,907, respectively, for the year ended August 31, 2015. The amount of purchase and sale activity impacts the portfolio turnover rate reported in the Financial Highlights.
Note 6. Affiliated Money Market Fund
The Fund invests in Columbia Short-Term Cash Fund, an affiliated money market fund established for the exclusive use by the Fund and other affiliated funds. The income earned by the Fund from such investments is included as Dividends — affiliated issuers in the Statement of Operations. As an investing fund, the Fund indirectly bears its proportionate share of the expenses of Columbia Short-Term Cash Fund.
Note 7. Line of Credit
The Fund has entered into a revolving credit facility with a syndicate of banks led by JPMorgan Chase Bank, N.A. whereby the Fund may borrow for the temporary funding
Annual Report 2015
37
COLUMBIA EMERGING MARKETS FUND
NOTES TO FINANCIAL STATEMENTS (continued)
August 31, 2015
of shareholder redemptions or for other temporary or emergency purposes. Pursuant to a December 9, 2014 amendment, the credit facility agreement, which is a collective agreement between the Fund and certain other funds managed by the Investment Manager, severally and not jointly, permits collective borrowings up to $550 million. Interest is charged to each participating fund based on its borrowings at a rate equal to the higher of (i) the overnight federal funds rate plus 1.00% or (ii) the one-month LIBOR rate plus 1.00%. Each borrowing under the credit facility matures no later than 60 days after the date of borrowing. The Fund also pays a commitment fee equal to its pro rata share of the amount of the credit facility at a rate of 0.075% per annum. The commitment fee is included in other expenses in the Statement of Operations. Prior to the December 9, 2014 amendment, the credit facility agreement permitted borrowings up to $500 million under the same terms and interest rates as described above.
For the year ended August 31, 2015, the average daily loan balance outstanding on days when borrowing existed was $8,875,000 at a weighted average interest rate of 1.19%. Interest expense incurred by the Fund is recorded as a line of credit interest expense in the Statement of Operations.
Note 8. Significant Risks
Foreign Securities and Emerging Market Countries Risk
Investing in foreign securities may include certain risks and considerations not typically associated with investing in U.S. securities, such as fluctuating currency values and changing local and regional economic, political and social conditions, which may result in greater market volatility. In addition, certain foreign securities may not be as liquid as U.S. securities. Investing in emerging markets may accentuate these risks. These countries are also more likely to experience high levels of inflation, deflation or currency devaluation which could hurt their economies and securities markets. To the extent that the Fund concentrates its investment exposure to any one or a few specific countries, the Fund will be particularly susceptible to the various conditions, events or other factors impacting those countries and may, therefore, have a greater risk than that of a fund which is more geographically diversified.
Financial Sector Risk
The Fund may be more susceptible to the particular risks that may affect companies in the financial services sector than if it were invested in a wider variety of companies in unrelated sectors. Companies in the financial services sector are subject to certain risks, including the risk of regulatory change, decreased liquidity in credit markets and unstable interest rates. Such companies may have concentrated portfolios, such as a high level of loans to real estate developers, which makes them vulnerable to economic conditions that affect that industry. Performance of such companies may be affected by competitive pressures and exposure to investments or agreements that, under certain circumstances, may lead to losses (e.g., subprime loans). Companies in the financial services sector are subject to extensive governmental regulation that may limit the amount and types of loans and other financial commitments they can make, and interest rates and fees that they may charge. In addition, profitability of such companies is largely dependent upon the availability and the cost of capital.
Technology and Technology-related Investment Risk
The Fund may be more susceptible to the particular risks that may affect companies in the information technology sector, as well as other technology-related sectors (collectively, the technology sectors) than if it were invested in a wider variety of companies in unrelated sectors. Companies in the technology sectors are subject to certain risks, including the risk that new services, equipment or technologies will not be accepted by consumers and businesses or will become rapidly obsolete. Performance of such companies may be affected by factors including obtaining and protecting patents (or the failure to do so) and significant competitive pressures, including aggressive pricing of their products or services, new market entrants, competition for market share and short product cycles due to an accelerated rate of technological developments. Such competitive pressures may lead to limited earnings and/or falling profit margins. As a result, the value of their securities may fall or fail to rise. In addition, many technology sector companies have limited operating histories and prices of these companies' securities historically have been more volatile than other securities, especially over the short term.
Annual Report 2015
38
COLUMBIA EMERGING MARKETS FUND
NOTES TO FINANCIAL STATEMENTS (continued)
August 31, 2015
Shareholder Concentration Risk
At August 31, 2015, one unaffiliated shareholder of record owned 58.7% of the outstanding shares of the Fund in one or more accounts. The Fund has no knowledge about whether any portion of those shares was owned beneficially. Affiliated shareholders of record owned 28.2% of the outstanding shares of the Fund in one or more accounts. Subscription and redemption activity by concentrated accounts may have a significant effect on the operations of the Fund. In the case of a large redemption, the Fund may be forced to sell investments at inopportune times, including its liquid or more liquid positions, resulting in Fund losses and the Fund holding a higher percentage of less liquid or illiquid securities. Large redemptions could result in decreased economies of scale and increased operating expenses for non-redeeming Fund shareholders.
Note 9. Subsequent Events
Management has evaluated the events and transactions that have occurred through the date the financial statements were issued and noted no items requiring adjustment of the financial statements or additional disclosure.
Note 10. Information Regarding Pending and Settled Legal Proceedings
In December 2005, without admitting or denying the allegations, American Express Financial Corporation (AEFC, which is now known as Ameriprise Financial, Inc. (Ameriprise Financial)) entered into settlement agreements with the Securities and Exchange Commission (SEC) and Minnesota Department of Commerce (MDOC) related to market timing activities. As a result, AEFC was censured and ordered to cease and desist from committing or causing any violations of certain provisions of the Investment Advisers Act of 1940, the Investment Company Act of 1940, and various Minnesota laws. AEFC agreed to pay disgorgement of $10 million and civil money penalties of $7 million. AEFC also agreed to retain an independent distribution consultant to assist in developing a plan for distribution of all disgorgement and civil penalties ordered by the SEC in accordance with various undertakings detailed at http://www.sec.gov/litigation/admin/ia-2451.pdf. Ameriprise Financial and its affiliates have cooperated with the SEC and the MDOC in these legal proceedings, and have made regular reports to the Funds' Boards of Trustees.
Ameriprise Financial and certain of its affiliates have historically been involved in a number of legal, arbitration and regulatory proceedings, including routine litigation, class actions, and governmental actions, concerning matters arising in connection with the conduct of their business activities. Ameriprise Financial believes that the Funds are not currently the subject of, and that neither Ameriprise Financial nor any of its affiliates are the subject of, any pending legal, arbitration or regulatory proceedings that are likely to have a material adverse effect on the Funds or the ability of Ameriprise Financial or its affiliates to perform under their contracts with the Funds. Ameriprise Financial is required to make quarterly (10-Q), annual (10-K) and, as necessary, 8-K filings with the SEC on legal and regulatory matters that relate to Ameriprise Financial and its affiliates. Copies of these filings may be obtained by accessing the SEC website at www.sec.gov.
There can be no assurance that these matters, or the adverse publicity associated with them, will not result in increased fund redemptions, reduced sale of fund shares or other adverse consequences to the Funds. Further, although we believe proceedings are not likely to have a material adverse effect on the Funds or the ability of Ameriprise Financial or its affiliates to perform under their contracts with the Funds, these proceedings are subject to uncertainties and, as such, we are unable to estimate the possible loss or range of loss that may result. An adverse outcome in one or more of these proceedings could result in adverse judgments, settlements, fines, penalties or other relief that could have a material adverse effect on the consolidated financial condition or results of operations of Ameriprise Financial.
Annual Report 2015
39
COLUMBIA EMERGING MARKETS FUND
REPORT OF INDEPENDENT REGISTERED PUBLIC ACCOUNTING FIRM
To the Trustees of Columbia Funds Series Trust I and the Shareholders of
Columbia Emerging Markets Fund
In our opinion, the accompanying statement of assets and liabilities, including the portfolio of investments, and the related statements of operations and of changes in net assets and the financial highlights present fairly, in all material respects, the financial position of Columbia Emerging Markets Fund (the "Fund," a series of Columbia Funds Series Trust I) at August 31, 2015, and the results of its operations, the changes in its net assets and the financial highlights for each of the periods indicated, in conformity with accounting principles generally accepted in the United States of America. These financial statements and financial highlights (hereafter referred to as "financial statements") are the responsibility of the Fund's management. Our responsibility is to express an opinion on these financial statements based on our audits. We conducted our audits of these financial statements in accordance with the standards of the Public Company Accounting Oversight Board (United States). Those standards require that we plan and perform the audit to obtain reasonable assurance about whether the financial statements are free of material misstatement. An audit includes examining, on a test basis, evidence supporting the amounts and disclosures in the financial statements, assessing the accounting principles used and significant estimates made by management, and evaluating the overall financial statement presentation. We believe that our audits, which included confirmation of securities at August 31, 2015 by correspondence with the custodian, brokers and transfer agent, provide a reasonable basis for our opinion.
PricewaterhouseCoopers LLP
Minneapolis, MN
October 22, 2015
Annual Report 2015
40
COLUMBIA EMERGING MARKETS FUND
FEDERAL INCOME TAX INFORMATION
(Unaudited)
The Fund hereby designates the following tax attributes for the fiscal year ended August 31, 2015. Shareholders will be notified in early 2016 of the amounts for use in preparing 2015 income tax returns.
Tax Designations:
| Qualified Dividend Income | | | 100.00 | % | |
| Dividends Received Deduction | | | 2.18 | % | |
| Capital Gain Dividend | | $ | 299,769 | | |
| Foreign Taxes Paid | | $ | 4,650,094 | | |
| Foreign Taxes Paid Per Share | | $ | 0.03 | | |
| Foreign Source Income | | $ | 26,009,849 | | |
| Foreign Source Income Per Share | | $ | 0.19 | | |
Qualified Dividend Income. For taxable, non-corporate shareholders, the percentage of ordinary income distributed during the fiscal year that represents qualified dividend income subject to reduced tax rates.
Dividends Received Deduction. The percentage of ordinary income distributed during the fiscal year that qualifies for the corporate dividends received deduction.
Capital Gain Dividend. The Fund designates as a capital gain dividend the amount reflected above, or if subsequently determined to be different, the net capital gain of such fiscal period.
Foreign Taxes. The Fund makes the election to pass through to shareholders the foreign taxes paid. Eligible shareholders may claim a foreign tax credit. These taxes, and the corresponding foreign source income, are provided.
Annual Report 2015
41
COLUMBIA EMERGING MARKETS FUND
The Trustees serve terms of indefinite duration. The names and birth years of the Trustees and Officers of the Funds in Columbia Funds Series Trust I, the year each was first elected or appointed to office, their principal business occupations during at least the last five years, the number of Funds overseen by each Trustee and other directorships they hold are shown below. Each officer listed below serves as an officer of each Fund in Columbia Funds Series Trust I. The mailing address of each Trustee is: c/o Columbia Management Investment Advisers, LLC, 225 Franklin Street, Mail Drop BX32 05228, Boston, MA 02110.
Independent Trustees
Name, Year of Birth
and Position Held
with the Trust | | Year First
Appointed or
Elected as
Trustee to any
Fund Currently
in the Columbia
Funds Complex
or a Predecessor
Thereof | | Principal Occupation(s)
during the Past Five Years | | Number
of Funds
in the
Columbia
Funds
Complex
Overseen | | Other Directorships
Held by Trustee During
the Past Five Years | |
Janet Langford Carrig
(Born 1957)
Trustee | | | 1996 | | | Senior Vice President, General Counsel and Corporate Secretary, ConocoPhillips (integrated energy company) since September 2007; Deputy General Counsel — Corporate Legal Services, ConocoPhillips from August 2006 to August 2007; Partner, Zelle, Hofmann, Voelbel, Mason & Gette LLP (law firm) from March 2005 to July 2006; Adjunct Professor of Law, Northwestern University from September 2004 to June 2006; Director, UAL Corporation (airline) from February 2006 to July 2006; Chief Administrative Officer and Senior Vice President, Kmart Holding Corporation (consumer goods) from September 2003 to March 2004 | | | 60 | | | None | |
Douglas A. Hacker
(Born 1955)
Trustee and Chairman
of the Board | | | 1996 | | | Independent business executive since May 2006; Executive Vice President — Strategy of United Airlines from December 2002 to May 2006; President of UAL Loyalty Services (airline marketing company) from September 2001 to December 2002; Executive Vice President and Chief Financial Officer of United Airlines from July 1999 to September 2001 | | | 60 | | | Spartan Nash Company, (food distributor); Nash Finch Company (food distributor) from 2005 to 2013; Aircastle Limited (aircraft leasing); SeaCube Container Leasing Ltd. (container leasing) from 2010 to 2013; and Travelport Worldwide Limited (travel information technology) | |
Nancy T. Lukitsh
(Born 1956)
Trustee | | | 2011 | | | Senior Vice President, Partner and Director of Marketing, Wellington Management Company, LLP (investment adviser) from 1997 to 2010; Chair, Wellington Management Investment Portfolios (commingled non-U.S. investment pools) from 2007 to 2010; Director, Wellington Trust Company, NA and other Wellington affiliates from 1997 to 2010 | | | 60 | | | None | |
William E. Mayer
(Born 1940)
Trustee | | | 1991 | | | Partner, Park Avenue Equity Partners (private equity) since February 1999 | | | 60 | | | DynaVox Inc. (speech creation); Lee Enterprises (print media); WR Hambrecht + Co. (financial service provider) from 2000 to 2012; BlackRock Kelso Capital Corporation (investment company); and Premier, Inc. (healthcare) | |
Annual Report 2015
42
COLUMBIA EMERGING MARKETS FUND
TRUSTEES AND OFFICERS (continued)
Independent Trustees (continued)
Name, Year of Birth
and Position Held
with the Trust | | Year First
Appointed or
Elected as
Trustee to any
Fund Currently
in the Columbia
Funds Complex
or a Predecessor
Thereof | | Principal Occupation(s)
during the Past Five Years | | Number
of Funds
in the
Columbia
Funds
Complex
Overseen | | Other Directorships
Held by Trustee During
the Past Five Years | |
David M. Moffett
(Born 1952)
Trustee | | | 2011 | | | Retired. Consultant to Bridgewater and Associates; Chief Executive Officer, Federal Home Loan Mortgage Corporation, from 2008 to 2009; Senior Adviser, Global Financial Services Group, Carlyle Group, Inc., from 2007 to 2008; Vice Chairman and Chief Financial Officer, U.S. Bancorp, from 1993 to 2007 | | | 60 | | | Building Materials Holding Corp. (building materials and construction services); CIT Group Inc. (commercial and consumer finance); eBay Inc. (online trading community); E.W. Scripps Co. (print and television media); Genworth Financial, Inc. (financial and insurance products and services); MBIA Inc. (financial service provider); Paypal Holdings Inc. (payment and data processing services); and University of Oklahoma Foundation | |
Charles R. Nelson
(Born 1942)
Trustee | | | 1981 | | | Retired. Professor Emeritus, University of Washington since 2011; Professor of Economics, University of Washington from 1976 to 2011; Ford and Louisa Van Voorhis Professor of Political Economy, University of Washington from 1993 to 2011; Adjunct Professor of Statistics, University of Washington from 1980 to 2011; Associate Editor, Journal of Money, Credit and Banking from September 1993 to 2008; consultant on econometric and statistical matters | | | 60 | | | None | |
John J. Neuhauser
(Born 1943)
Trustee | | | 1984 | | | President, Saint Michael's College since August 2007; Director or Trustee of several non-profit organizations, including Fletcher Allen Health Care, Inc.; Academic Vice President and Dean of Faculties, Boston College from August 1999 to October 2005; University Professor, Boston College from November 2005 to August 2007 | | | 60 | | | Liberty All-Star Equity Fund and Liberty All-Star Growth Fund (closed-end funds) | |
Patrick J. Simpson
(Born 1944)
Trustee | | | 2000 | | | Partner, Perkins Coie LLP (law firm) | | | 60 | | | None | |
Anne-Lee Verville
(Born 1945)
Trustee | | | 1998 | | | Retired. General Manager, Global Education Industry from 1994 to 1997, President — Application Systems Division from 1991 to 1994, Chief Financial Officer — US Marketing & Services from 1988 to 1991, and Chief Information Officer from 1987 to 1988, IBM Corporation (computer and technology) | | | 60 | | | Enesco Group, Inc. (producer of giftware and home and garden decor products) from 2001 to 2006 | |
Annual Report 2015
43
COLUMBIA EMERGING MARKETS FUND
TRUSTEES AND OFFICERS (continued)
Interested Trustee Affiliate with Investment Manager*
Name, Year of Birth
and Position Held
with the Trust | | Year First
Appointed or
Elected as
Trustee to any
Fund Currently
in the Columbia
Funds Complex
or a Predecessor
Thereof | | Principal Occupation(s)
during the Past Five Years | | Number
of Funds
in the
Columbia
Funds
Complex
Overseen | | Other Directorships
Held by Trustee During
the Past Five Years | |
William F. Truscott
(Born 1960)
Trustee | | | 2012 | | | Chairman of the Board and President, Columbia Management Investment Advisers, LLC since May 2010 and February 2012, respectively (previously President and Chief Investment Officer, 2001-April 2010); Chief Executive Officer, Global Asset Management, Ameriprise Financial, Inc. since September 2012 (previously Chief Executive Officer, U.S. Asset Management & President, Annuities, May 2010-September 2012 and President — U.S. Asset Management and Chief Investment Officer, 2005-April 2010); Director and Chief Executive Officer, Columbia Management Investment Distributors, Inc. since May 2010 and February 2012, respectively (previously Chairman of the Board and Chief Executive Officer, 2006-April 2010); Chairman of the Board and Chief Executive Officer, RiverSource Distributors, Inc. since 2006; Director, Threadneedle Asset Management Holdings, SARL since 2014; President and Chief Executive Officer, Ameriprise Certificate Company, 2006-August 2012 | | | 187 | | | Chairman of the Board, Columbia Management Investment Advisers, LLC since May 2010; Director, Columbia Management Investment Distributors, Inc. since May 2010; Director, Ameriprise Certificate Company, 2006 to January 2013 | |
* Interested person (as defined under the 1940 Act) by reason of being an officer, director, security holder and/or employee of the Investment Manager or Ameriprise Financial.
The Statement of Additional Information has additional information about the Fund's Board members and is available, without charge, upon request by calling 800.345.6611; contacting your financial intermediary; or visiting columbiathreadneedle.com/us.
The Board has appointed officers who are responsible for day-to-day business decisions based on policies it has established. The officers serve at the pleasure of the Board. In addition to Mr. Truscott, who is Senior Vice President, the Funds' other officers are:
Fund Officers
Name,
Address and
Year of Birth | | Position and Year
First Appointed to
Position for any Fund
in the Columbia
Funds Complex or a
Predecessor Thereof | | Principal Occupation(s) During Past Five Years | |
Christopher O. Petersen
5228 Ameriprise
Financial Center
Minneapolis, MN 55474
Born 1970 | | President and Principal Executive Officer (2015) | | Vice President and Lead Chief Counsel, Ameriprise Financial, Inc. since January 2015 (previously, Vice President and Chief Counsel January 2010-December 2014; and Vice President and Group Counsel or Counsel 2004- January 2010); officer of Columbia Funds and affiliated funds since 2007. | |
Michael G. Clarke
225 Franklin Street
Boston, MA 02110
Born 1969 | | Treasurer (2011) and Chief Financial Officer (2009) | | Vice President — Mutual Fund Administration, Columbia Management Investment Advisers, LLC, since May 2010; Managing Director of Fund Administration, Columbia Management Advisors, LLC, September 2004-April 2010; senior officer of Columbia Funds and affiliated funds since 2002. | |
Annual Report 2015
44
COLUMBIA EMERGING MARKETS FUND
TRUSTEES AND OFFICERS (continued)
Fund Officers (continued)
Name,
Address and
Year of Birth | | Position and Year
First Appointed to
Position for any Fund
in the Columbia
Funds Complex or a
Predecessor Thereof | | Principal Occupation(s) During Past Five Years | |
Paul B. Goucher
100 Park Avenue
New York, NY 10017
Born 1968 | | Senior Vice President (2011), Chief Legal Officer (2015) and Assistant Secretary (2008) | | Vice President and Lead Chief Counsel, Ameriprise Financial, Inc. since November 2008 and January 2013, respectively (previously Chief Counsel, January 2010-January 2013 and Group Counsel, November 2008-January 2010). | |
Thomas P. McGuire
225 Franklin Street
Boston, MA 02110
Born 1972 | | Vice President and Chief Compliance Officer (2012) | | Vice President — Asset Management Compliance, Ameriprise Financial, Inc., since May 2010; Chief Compliance Officer, Ameriprise Certificate Company since September 2010; Compliance Executive, Bank of America, 2005-April 2010. | |
Colin Moore
225 Franklin Street
Boston, MA 02110
Born 1958 | | Senior Vice President (2010) | | Executive Vice President and Global Chief Investment Officer, Ameriprise Financial, Inc., since July 2013; Director and Global Chief Investment Officer, Columbia Management Investment Advisers, LLC since May 2010; Manager, Managing Director and Chief Investment Officer, Columbia Management Advisors, LLC, 2007-April 2010. | |
Michael E. DeFao
225 Franklin Street
Boston, MA 02110
Born 1968 | | Vice President (2011) and Assistant Secretary (2010) | | Vice President and Chief Counsel, Ameriprise Financial, Inc. since May 2010; Associate General Counsel, Bank of America, 2005-April 2010. | |
Joseph F. DiMaria
225 Franklin Street
Boston, MA 02110
Born 1968 | | Vice President (2011), Assistant Treasurer (2012) and Chief Accounting Officer (2008) | | Vice President — Mutual Fund Treasurer, Columbia Management Investment Advisers, LLC since May 2010; Director of Fund Administration, Columbia Management Advisors, LLC, 2006-April 2010. | |
Amy Johnson
5228 Ameriprise
Financial Center
Minneapolis, MN 55474
Born 1965 | | Vice President (2006) | | Managing Director and Chief Operating Officer, Columbia Management Investment Advisers, LLC since May 2010 (previously Chief Administrative Officer, 2009-April 2010, and Vice President — Asset Management and Trust Company Services, 2006-2009). | |
Lyn Kephart-Strong
5228 Ameriprise
Financial Center
Minneapolis, MN 55474
Born 1960 | | Vice President (2015) | | President, Columbia Management Investment Services Corp. since October 2014; Vice President & Resolution Officer, Ameriprise Trust Company since August 2009; President, RiverSource Service Corporation 2004-2010. | |
Ryan C. Larrenaga
225 Franklin Street
Boston, MA 02110
Born 1970 | | Vice President and Secretary (2015) | | Vice President and Group Counsel, Ameriprise Financial, Inc. since August 2011 (previously, Counsel from May 2010 to August 2011); Assistant General Counsel, Bank of America, 2005-April 2010; officer of Columbia Funds and affiliated funds since 2005. | |
Annual Report 2015
45
COLUMBIA EMERGING MARKETS FUND
BOARD CONSIDERATION AND APPROVAL OF ADVISORY AGREEMENT
On June 10, 2015, the Board of Trustees (the Board) and the Trustees who are not interested persons (as defined in the Investment Company Act of 1940) (the Independent Trustees) of Columbia Funds Series Trust I (the Trust) unanimously approved the continuation of the Investment Management Services Agreement (the Advisory Agreement) with Columbia Management Investment Advisers, LLC (the Investment Manager) with respect to Columbia Emerging Markets Fund (the Fund), a series of the Trust. The Board and the Independent Trustees also unanimously approved an agreement (the Management Agreement and, together with the Advisory Agreement, the Agreements) combining the Advisory Agreement and the Fund's existing administrative services agreement (the Administrative Services Agreement) in a single agreement. The Board and the Independent Trustees approved the restatement of the Advisory Agreement with the Management Agreement to be effective for the Fund on January 1, 2016, the Fund's next annual prospectus update. As detailed below, the Board's Advisory Fees and Expenses Committee (the Committee) and the Board met on multiple occasions to review and discuss, both among themselves and with the management team of the Investment Manager, materials provided by the Investment Manager and others before determining to approve the Management Agreement and the continuation of the Advisory Agreement.
In connection with their deliberations regarding the approval of the Management Agreement and the continuation of the Advisory Agreement, the Committee and the Board evaluated materials requested from the Investment Manager regarding the Fund and the Agreements, and discussed these materials with representatives of the Investment Manager at Committee meetings held on March 3, 2015, April 29, 2015 and June 9, 2015 and at Board meetings held on March 4, 2015 and June 10, 2015. In addition, the Board considers matters bearing on the Agreements at most of its other meetings throughout the year and meets regularly with senior management of the Trust and the Investment Manager. Through the Board's Investment Oversight Committees, Trustees also meet with selected portfolio managers of the funds the Trustees oversee and other investment personnel at various times throughout the year. The Committee and the Board also consulted with its independent fee consultant, Fund counsel and with the Independent Trustees' independent legal counsel, who advised on various matters with respect to the Committee's and the Board's considerations and otherwise assisted the Committee and the Board in their deliberations. On June 9, 2015, the Committee recommended that the Board approve the Management Agreement and the continuation of the Advisory Agreement. On June 10, 2015, the Board, including the Independent Trustees, voting separately, unanimously approved the Management Agreement and the continuation of the Advisory Agreement for the Fund.
The Committee and the Board considered all information that they, their legal counsel or the Investment Manager believed reasonably necessary to evaluate and to determine whether to approve the Management Agreement and the continuation of the Advisory Agreement. The information and factors considered by the Committee and the Board in recommending for approval or approving the Management Agreement and the continuation of the Advisory Agreement for the Fund included the following:
• Information on the investment performance of the Fund relative to the performance of a group of mutual funds determined to be comparable to the Fund by an independent third-party data provider, as well as performance relative to benchmarks;
• Information on the Fund's advisory fees and total expenses, including information comparing the Fund's expenses to those of a group of comparable mutual funds, as determined by the independent third-party data provider;
• The Investment Manager's agreement to contractually limit or cap total operating expenses for the Fund so that total operating expenses (excluding certain fees and expenses, such as portfolio transaction costs and certain other investment related expenses, interest, taxes, acquired fund fees and expenses, and extraordinary expenses) would not exceed a specified percentage of the Fund's average annual net assets from January 1, 2016 through December 31, 2016;
• The terms and conditions of the Agreements;
Annual Report 2015
46
COLUMBIA EMERGING MARKETS FUND
BOARD CONSIDERATION AND APPROVAL OF ADVISORY AGREEMENT (continued)
• The current and proposed terms and conditions of other agreements and arrangements with affiliates of the Investment Manager relating to the operations of the Fund, including the Administrative Services Agreement1 and agreements with respect to the provision of distribution and transfer agency services to the Fund;
• Descriptions of various functions performed by the Investment Manager under the Agreements, including portfolio management and portfolio trading practices;
• Information regarding the management fees and investment performance of similarly-managed portfolios of other clients of the Investment Manager, including institutional separate accounts;
• Information regarding the reputation, regulatory history and resources of the Investment Manager, including information regarding senior management, portfolio managers and other personnel;
• Information regarding the capabilities of the Investment Manager with respect to compliance monitoring services, including an assessment of the Investment Manager's compliance system by the Fund's Chief Compliance Officer; and
• The profitability to the Investment Manager and its affiliates from their relationships with the Fund.
Nature, Extent and Quality of Services Provided under the Agreements
The Committee and the Board considered the nature, extent and quality of services provided to the Fund by the Investment Manager and its affiliates under the Agreements and under separate agreements for the provision of transfer agency and administrative services, and the resources dedicated to the Fund and the other Columbia Funds by the Investment Manager and its affiliates. The Committee and the Board also determined that the nature and level of the services to be provided under the Management Agreement would not decrease relative to the services provided under the Advisory Agreement and the Administrative Services Agreement. The Committee and the Board considered, among other things, the Investment Manager's ability to attract, motivate and retain highly qualified research, advisory and supervisory investment professionals (including personnel and other resources, compensation programs for personnel involved in fund management, reputation and other attributes), the portfolio management services provided by those investment professionals, and the quality of the Investment Manager's investment research capabilities and trade execution services. The Committee and the Board also considered the potential benefits to shareholders of investing in a mutual fund that is part of a fund complex offering exposure to a variety of asset classes and investment disciplines and providing a variety of fund and shareholder services.
The Committee and the Board also considered the professional experience and qualifications of the senior personnel of the Investment Manager, which included consideration of the Investment Manager's experience with similarly-structured funds. The Committee and the Board noted the compliance programs of and the compliance-related resources provided to the Fund by the Investment Manager and its affiliates, and considered the Investment Manager's ability to provide administrative services to the Fund and coordinate the activities of the Fund's other service providers. In evaluating the nature, extent and quality of services provided under the Agreements, the Committee and the Board considered that these services were provided to the Fund, rather than directly to Fund shareholders. The Committee and the Board accordingly affirmed, after considering various other matters, including the potential benefits to the Fund and its shareholders of the Independent Trustees' important role as pre-suit gatekeepers with respect to claims that they may determine are meritless or contrary to the Fund's best interests, that it was not the intention of the Board or the Investment Manager that there be any third-party beneficiaries of the Agreements. After reviewing these and related factors, the Committee and the Board concluded, within the context of their overall conclusions, that the nature, extent and quality of the services provided to the Fund under the Agreements supported the approval of the Management Agreement and the continuation of the Advisory Agreement.
1 Like the Advisory Agreement, the Administrative Services Agreement will terminate with respect to the Fund once the Management Agreement is effective for the Fund.
Annual Report 2015
47
COLUMBIA EMERGING MARKETS FUND
BOARD CONSIDERATION AND APPROVAL OF ADVISORY AGREEMENT (continued)
Investment Performance
The Committee and the Board reviewed information about the performance of the Fund over various time periods, including performance information relative to benchmarks and information based on reports of the independent third-party data provider that compared the performance of the Fund to the performance of a group of comparable mutual funds, and data provided by the independent fee consultant. The Committee and the Board also reviewed a description of the third party's methodology for identifying the Fund's peer groups for purposes of performance and expense comparisons. Although the Fund's performance lagged that of a relevant peer group for certain (although not necessarily all) periods, the Committee and the Board concluded that other factors relevant to performance were sufficient, in light of other considerations, to warrant continuation of the Advisory Agreement and approval of the Management Agreement. Those factors included one or more of the following: (i) that the Fund's performance, although lagging in certain recent periods, was stronger over the longer term; (ii) that the underperformance was attributable, to a significant extent, to investment decisions that were reasonable and consistent with the Fund's investment strategy and policies and that the Fund was performing within a reasonable range of expectations, given those investment decisions, market conditions and the Fund's investment strategy; (iii) that the Fund's performance was competitive when compared to other relevant performance benchmarks or peer groups; and (iv) that the Investment Manager had taken or was taking steps designed to help improve the Fund's investment performance, including, but not limited to, replacing portfolio managers, enhancing the resources supporting the portfolio managers, or modifying investment strategies.
The Committee and the Board noted that, through December 31, 2014, the Fund's performance was in the fiftieth, thirty-second and thirty-first percentile (where the best performance would be in the first percentile) of its category selected by the independent third-party data provider for the purposes of performance comparisons for the one-, three- and five-year periods, respectively.
The Committee and the Board also considered the Investment Manager's performance and reputation generally, the Investment Manager's historical responsiveness to Board concerns about performance, and the Investment Manager's willingness to take steps intended to improve performance. After reviewing these and related factors, the Committee and the Board concluded, within the context of their overall conclusions, that the performance of the Fund was sufficient, in light of other considerations, to warrant the continuation of the Advisory Agreement and the approval of the Management Agreement.
Investment Advisory Fee Rates and Other Expenses
The Committee and the Board considered the advisory fees charged to the Fund under the Advisory Agreement as well as the total expenses incurred by the Fund. In assessing the reasonableness of the fees under the Advisory Agreement, the Committee and the Board considered, among other information, the Fund's advisory fee and its total expense ratio as a percentage of average daily net assets. The Committee and the Board also considered that the proposed management fee would not exceed the sum of the fee rates payable under the Advisory Agreement and the Administrative Services Agreement. The Committee and the Board considered data provided by the independent fee consultant. The Committee and the Board noted that, as of December 31, 2014, the Fund's actual management fee and net expense ratio are ranked in the fourth and third quintiles, respectively, (where the lowest fees and expenses would be in the first quintile) against the Fund's expense universe as determined by the independent third-party data provider for purposes of expense comparison. The Committee and the Board also took into account the fee waiver and expense limitation arrangements agreed to by the Investment Manager, as noted above.
The Committee and the Board also received and considered information about the advisory fees charged by the Investment Manager to institutional separate accounts. In considering the fees charged to those accounts, the Committee and the Board took into account, among other things, the Investment Manager's representations about the differences between managing mutual funds as compared to other types of accounts, including differences in the services provided, differences in the risk profile of such business for the Investment Manager and the additional resources required to manage mutual funds effectively. The Committee and the Board also received and considered information about the fees charged by the Investment Manager for sub-advisory services
Annual Report 2015
48
COLUMBIA EMERGING MARKETS FUND
BOARD CONSIDERATION AND APPROVAL OF ADVISORY AGREEMENT (continued)
provided to comparable unaffiliated funds. In evaluating the Fund's advisory fees, the Committee and the Board also took into account the demands, complexity and quality of the investment management of the Fund.
After reviewing these and related factors, the Committee and the Board concluded, within the context of their overall conclusions, that the advisory/management fee rates and expenses of the Fund were sufficient, in light of other considerations, to warrant the approval of the Management Agreement and continuation of the Advisory Agreement.
Costs of Services Provided and Profitability
The Committee and the Board also took note of the costs the Investment Manager and its affiliates incur in connection with the services provided (both on an absolute and relative basis) and the profitability to the Investment Manager and its affiliates in connection with their relationships with the Fund.
The Committee and the Board also considered the compensation directly or indirectly received by the Investment Manager's affiliates in connection with their relationships with the Fund. The Committee and the Board reviewed information provided by management as to the profitability to the Investment Manager and its affiliates of their relationships with the Fund, information about the allocation of expenses used to calculate profitability, and comparisons of profitability levels realized in 2014 to profitability levels realized in 2013. When reviewing profitability, the Committee and the Board also considered court cases in which adviser profitability was an issue in whole or in part, the performance of similarly managed funds, the performance of the Fund, and the expense ratio of the Fund. The Committee and the Board also considered information provided by the Investment Manager regarding the Investment Manager's financial condition and comparing its profitability to that of other asset management firms that are, or are subsidiaries of, publicly traded companies.
After reviewing these and related factors, the Committee and the Board concluded, within the context of their overall conclusions, that the costs of services provided and the profitability to the Investment Manager and its affiliates from their relationships with the Fund supported the approval of the Management Agreement and the continuation of the Advisory Agreement.
Economies of Scale
The Committee and the Board considered the potential existence of economies of scale in the provision by the Investment Manager of services to the Fund, to groups of related funds, and to the Investment Manager's investment advisory clients as a whole, and whether those economies of scale were shared with the Fund through breakpoints in investment advisory fees or other means, such as expense limitation arrangements and additional investments by the Investment Manager in investment, trading and compliance resources. The Committee and the Board noted that the investment advisory and management fee schedules for the Fund contained breakpoints that would reduce the fee rate on assets above specified threshold levels.
In considering these matters, the Committee and the Board also considered the costs of the services provided and the profitability to the Investment Manager and its affiliates from their relationships with the Fund, as discussed above. After reviewing these and related factors, the Committee and the Board concluded, within the context of their overall conclusions, that the extent to which any economies of scale were expected to be shared with the Fund supported the approval of the Management Agreement and the continuation of the Advisory Agreement.
Other Benefits to the Investment Manager
The Committee and the Board received and considered information regarding "fall-out" or ancillary benefits received by the Investment Manager and its affiliates as a result of their relationships with the Fund, such as the engagement of the Investment Manager to provide administrative services to the Fund and the engagement of the Investment Manager's affiliates to provide distribution and transfer agency services to the Fund. In this regard, among other matters, the Committee and the Board considered that the Fund's distributor retains a portion of the distribution fees from the Fund and receives a portion of the sales charges on sales or redemptions of certain classes of shares of the Fund. The Committee and the Board also considered the benefits
Annual Report 2015
49
COLUMBIA EMERGING MARKETS FUND
BOARD CONSIDERATION AND APPROVAL OF ADVISORY AGREEMENT (continued)
of research made available to the Investment Manager by reason of brokerage commissions generated by the Fund's securities transactions, and reviewed information about the Investment Manager's practices with respect to allocating portfolio transactions for brokerage and research services. The Committee and the Board considered the possible conflicts of interest associated with certain fall-out or other ancillary benefits and the reporting, disclosure and other processes that are in place to address such possible conflicts of interest. The Committee and the Board recognized that the Investment Manager's profitability would be somewhat lower without these benefits.
Conclusion
The Committee and the Board reviewed all of the above considerations in reaching their decisions to recommend or approve the Management Agreement and the continuation of the Advisory Agreement. In their deliberations, the Trustees did not identify any particular information that was all-important or controlling, and individual Trustees may have attributed different weights to the various factors. Based on their evaluation of all factors that they deemed to be material, including those factors described above, and assisted by the advice of independent legal counsel, the Board, including the Independent Trustees, voting separately, unanimously approved the Management Agreement and the continuation of the Advisory Agreement.
Annual Report 2015
50
COLUMBIA EMERGING MARKETS FUND
IMPORTANT INFORMATION ABOUT THIS REPORT
Each fund mails one shareholder report to each shareholder address. If you would like more than one report, please call shareholder services at 800.345.6611 and additional reports will be sent to you.
The policy of the Board is to vote the proxies of the companies in which each fund holds investments consistent with the procedures as stated in the Statement of Additional Information (SAI). You may obtain a copy of the SAI without charge by calling 800.345.6611; contacting your financial intermediary; visiting columbiathreadneedle.com/us; or searching the website of the Securities and Exchange Commission (SEC) at sec.gov. Information regarding how each fund voted proxies relating to portfolio securities is filed with the SEC by August 31st for the most recent 12-month period ending June 30th of that year, and is available without charge by visiting columbiathreadneedle.com/us, or searching the website of the SEC at sec.gov.
Each fund files a complete schedule of portfolio holdings with the SEC for the first and third quarters of each fiscal year on Form N-Q. Each fund's Form N-Q is available on the SEC's website at sec.gov and may be reviewed and copied at the SEC's Public Reference Room in Washington, D.C. Information on the operation of the Public Reference Room may be obtained by calling 800.SEC.0330. Each fund's complete schedule of portfolio holdings, as filed on Form N-Q, can also be obtained without charge, upon request, by calling 800.345.6611.
Annual Report 2015
51
Columbia Emerging Markets Fund
P.O. Box 8081
Boston, MA 02266-8081

This information is for use with concurrent or prior delivery of a fund prospectus. Please read and consider the investment objectives, risks, charges and expenses for any fund carefully before investing. For a prospectus and summary prospectus, which contains this and other important information about the Fund, go to columbiathreadneedle.com/us. The Fund is distributed by Columbia Management Investment Distributors, Inc., member FINRA, and managed by Columbia Management Investment Advisers, LLC.
Columbia Threadneedle Investments (Columbia Threadneedle) is the global brand name of the Columbia and Threadneedle group of companies.
All rights reserved. Columbia Management Investment Distributors, Inc., 225 Franklin Street, Boston, MA 02110-2804
© 2015 Columbia Management Investment Advisers, LLC.
columbiathreadneedle.com/us
ANN142_08_E01_(10/15)

ANNUAL REPORT
August 31, 2015

COLUMBIA GLOBAL ENERGY AND NATURAL RESOURCES FUND

ABOUT COLUMBIA THREADNEEDLE INVESTMENTS
Columbia Threadneedle Investments is a leading global asset management group that provides a broad range of actively managed investment strategies and solutions for individual, institutional and corporate clients around the world.
With more than 2,000 people, including over 450 investment professionals based in North America, Europe and Asia, we manage $503 billion* of assets across developed and emerging market equities, fixed income, asset allocation solutions and alternatives. We are the 13th largest manager of long-term mutual fund assets in the U.S.** and the 4th largest manager of retail funds in the U.K.***
Our priority is the investment success of our clients. We aim to deliver the investment outcomes they expect through an investment approach that is team-based, performance-driven and risk-aware. Our culture is dynamic and interactive. By sharing our insights across asset classes and geographies, we generate richer perspectives on global, regional and local investment landscapes. The ability to exchange and debate investment ideas in a collaborative environment enriches our teams' investment processes. More importantly, it results in better informed investment decisions for our clients.
Columbia funds are distributed by Columbia Management Investment Distributors, Inc., member FINRA, and managed by Columbia Management Investment Advisers, LLC.
Columbia Threadneedle Investments (Columbia Threadneedle) is the global brand name of the Columbia and Threadneedle group of companies.
* In U.S. dollars as of June 30, 2015. Source: Ameriprise Q2 Earnings Release. Includes all assets managed by entities in the Columbia and Threadneedle groups of companies. Contact us for more current data.
** Source: ICI as of June 30, 2015 for Columbia Management Investment Advisers, LLC.
*** Source: Investment Association as of June 2015 for Threadneedle Asset Management Limited.
© 2015 Columbia Management Investment Advisers, LLC. All rights reserved.
Not part of the shareholder report
 Dear Shareholder,
Today's investors are typically focused on outcomes, like living a certain retirement lifestyle, paying for college education or building a legacy. But in today's complex global investment landscape, even simple goals are not easily achieved.
At Columbia Threadneedle Investments, we aspire to help satisfy five core needs of today's investors:
n Generate an appropriate stream of income in retirement
Traditional approaches to generating income may not provide the diversification benefits they once did, and they may actually introduce unwanted risk in today's market. To seek to improve your potential to live comfortably long term, we endeavor to pursue investments that explore less traveled paths to income.
n Navigate a changing interest rate environment
Today's uncertain market environment includes the prospect of a rise in interest rates. Blending traditional investments with non-traditional or alternative products may help protect your wealth during periods of volatility. We can attempt to help strengthen your portfolio with agile products designed to take on the market's ups and downs.
n Maximize after-tax returns
In an environment where what you keep may be more important than what you earn, municipal bonds can help mitigate high tax burdens while providing potentially attractive yields. Our state and federal tax-exempt products are aimed at helping investors manage risk, minimize the fluctuation of capital and grow wealth on a more tax-efficient basis.
n Grow assets to achieve financial goals
We believe that finding and protecting growth comes from a disciplined security selection process designed to create excess return. Our goal is to provide investment solutions built to help you face today's market challenges and grow your assets at each crossroad of your journey.
n Ease the impact of volatile markets
Despite a bull market run that has benefited many investors over the past several years, it's important to remember the lessons of 2008 and the value that a well-diversified portfolio may provide through times of market volatility. We are here to help you hold onto the savings you have worked tirelessly to amass, and to provide you the best opportunity to maintain your standard of living regardless of market conditions.
Find out today how we can help you confidently invest to realize your dreams. Please visit us at blog.columbiathreadneedleus.com/our-best-ideas to learn more about our unique investment solutions.
The world is constantly changing, but our priority remains the same: to help you secure your finances, meet your goals and achieve success. Thank you for your continued investment with us.
Sincerely,

Christopher O. Petersen
President, Columbia Funds
Investors should consider the investment objectives, risks, charges and expenses of a mutual fund carefully before investing. For a free prospectus and summary prospectus, which contains this and other important information about a fund, visit columbiathreadneedle.com/us. The prospectus should be read carefully before investing.
Columbia Funds are distributed by Columbia Management Investment Distributors, Inc., member FINRA, and managed by Columbia Management Investment Advisers, LLC.
© 2015 Columbia Management Investment Advisers, LLC. All rights reserved.
COLUMBIA GLOBAL ENERGY AND NATURAL RESOURCES FUND
Fund Investment Manager
Columbia Management Investment
Advisers, LLC
225 Franklin Street
Boston, MA 02110
Fund Distributor
Columbia Management Investment
Distributors, Inc.
225 Franklin Street
Boston, MA 02110
Fund Transfer Agent
Columbia Management Investment
Services Corp.
P.O. Box 8081
Boston, MA 02266-8081
For more information about any of the funds, please visit columbiathreadneedle.com/us or call 800.345.6611. Customer Service Representatives are available to answer your questions Monday through Friday from 8 a.m. to 7 p.m. Eastern time.
The views expressed in this report reflect the current views of the respective parties. These views are not guarantees of future performance and involve certain risks, uncertainties and assumptions that are difficult to predict, so actual outcomes and results may differ significantly from the views expressed. These views are subject to change at any time based upon economic, market or other conditions and the respective parties disclaim any responsibility to update such views. These views may not be relied on as investment advice and, because investment decisions for a Columbia fund are based on numerous factors, may not be relied on as an indication of trading intent on behalf of any particular Columbia fund. References to specific securities should not be construed as a recommendation or investment advice.
Performance Overview | | | 3 | | |
Manager Discussion of Fund Performance | | | 5 | | |
Understanding Your Fund's Expenses | | | 8 | | |
Portfolio of Investments | | | 9 | | |
Statement of Assets and Liabilities | | | 13 | | |
Statement of Operations | | | 15 | | |
Statement of Changes in Net Assets | | | 16 | | |
Financial Highlights | | | 19 | | |
Notes to Financial Statements | | | 28 | | |
Report of Independent Registered
Public Accounting Firm | | | 39 | | |
Federal Income Tax Information | | | 40 | | |
Trustees and Officers | | | 41 | | |
Board Consideration and Approval of Advisory Agreement | | | 45 | | |
Important Information About This Report | | | 49 | | |
COLUMBIA GLOBAL ENERGY AND NATURAL RESOURCES FUND
Performance Summary
n Columbia Global Energy and Natural Resources Fund (the Fund) Class A shares returned -31.16% excluding sales charges for the 12-month period that ended August 31, 2015.
n During the same 12-month period, the Fund underperformed its Blended Index, which returned -28.26%, but outperformed the S&P North American Natural Resources Sector Index, which returned -34.00%.
n Sharply declining commodity prices hurt both the Fund and its benchmarks.
Average Annual Total Returns (%) (for period ended August 31, 2015)
| | | Inception | | 1 Year | | 5 Years | | 10 Years | |
Class A* | | 09/28/07 | | | | | | | |
Excluding sales charges | | | | | | | -31.16 | | | | 0.63 | | | | 1.46 | | |
Including sales charges | | | | | | | -35.10 | | | | -0.56 | | | | 0.86 | | |
Class B* | | 03/07/11 | | | | | | | |
Excluding sales charges | | | | | | | -31.65 | | | | -0.14 | | | | 0.59 | | |
Including sales charges | | | | | | | -34.80 | | | | -0.50 | | | | 0.59 | | |
Class C* | | 09/28/07 | | | | | | | |
Excluding sales charges | | | | | | | -31.66 | | | | -0.12 | | | | 0.72 | | |
Including sales charges | | | | | | | -32.29 | | | | -0.12 | | | | 0.72 | | |
Class I* | | 09/27/10 | | | -30.81 | | | | 1.11 | | | | 1.82 | | |
Class K* | | 03/07/11 | | | -31.03 | | | | 0.78 | | | | 1.53 | | |
Class R* | | 09/27/10 | | | -31.29 | | | | 0.39 | | | | 1.16 | | |
Class R4* | | 11/08/12 | | | -31.00 | | | | 0.87 | | | | 1.70 | | |
Class R5* | | 11/08/12 | | | -30.85 | | | | 0.98 | | | | 1.76 | | |
Class Z | | 12/31/92 | | | -30.97 | | | | 0.88 | | | | 1.70 | | |
Blended Index | | | | | | | -28.26 | | | | 2.04 | | | | 2.89 | | |
S&P North American Natural Resources Sector Index | | | | | | | -34.00 | | | | 2.12 | | | | 2.86 | | |
Returns for Class A shown with and without the maximum initial sales charge of 5.75%. Returns for Class B are shown with and without the applicable contingent deferred sales charge (CDSC) of 5.00% in the first year, declining to 1.00% in the sixth year and eliminated thereafter. Returns for Class C are shown with and without the 1.00% CDSC for the first year only. The Fund's other classes are not subject to sales charges and have limited eligibility. Please see the Fund's prospectus for details. Performance for different share classes will vary based on differences in sales charges and fees associated with each class. All results shown assume reinvestment of distributions during the period. Returns do not reflect the deduction of taxes that a shareholder may pay on Fund distributions or on the redemption of Fund shares. Performance results reflect the effect of any fee waivers or reimbursements of Fund expenses by Columbia Management Investment Advisers, LLC and/or any of its affiliates. Absent these fee waivers or expense reimbursement arrangements, performance results would have been lower.
The performance information shown represents past performance and is not a guarantee of future results. The investment return and principal value of your investment will fluctuate so that your shares, when redeemed, may be worth more or less than their original cost. Current performance may be lower or higher than the performance information shown. You may obtain performance information current to the most recent month-end by contacting your financial intermediary, visiting columbiathreadneedle.com/us or calling 800.345.6611.
*The returns shown for periods prior to the share class inception date (including returns for the Life of the Fund, if shown, which are since Fund inception) include the returns of the Fund's oldest share class. These returns are adjusted to reflect any higher class-related operating expenses of the newer share classes, as applicable. Please visit columbiathreadneedle.com/us/investment-products/mutual-funds/appended-performance for more information.
The Blended Benchmark, a weighted custom composite, established by the Investment Manager, consists of a 60% weighting in the MSCI World Energy Sector Index (Net) and a 40% weighting in the MSCI World Materials Sector Index (Net). The MSCI World Energy Sector Index is a free float-adjusted market capitalization weighted index that represents the energy segment in global developed market equity performance. The MSCI World Materials Sector Index is a free float-adjusted market capitalization weighted index that represents the materials segment in global developed-market equity performance.
The S&P North American Natural Resources Sector Index is a modified market capitalization-weighted equity index designed as a benchmark for U.S. traded securities in the natural resources sector. The index includes companies involved in the following categories: extractive industries, energy companies, owners and operators of timber tracts, forestry services, producers of pulp and paper and owners of plantations.
Indices are not available for investment, are not professionally managed and do not reflect sales charges, fees, brokerage commissions, taxes (except the MSCI World Energy Sector Index (Net) and the MSCI World Materials Sector Index (Net), which reflect reinvested dividends net of withholding taxes) or other expenses of investing. Securities in the Fund may not match those in an index.
Annual Report 2015
3
COLUMBIA GLOBAL ENERGY AND NATURAL RESOURCES FUND
PERFORMANCE OVERVIEW (continued)
Performance of a Hypothetical $10,000 Investment (September 1, 2005 – August 31, 2015)
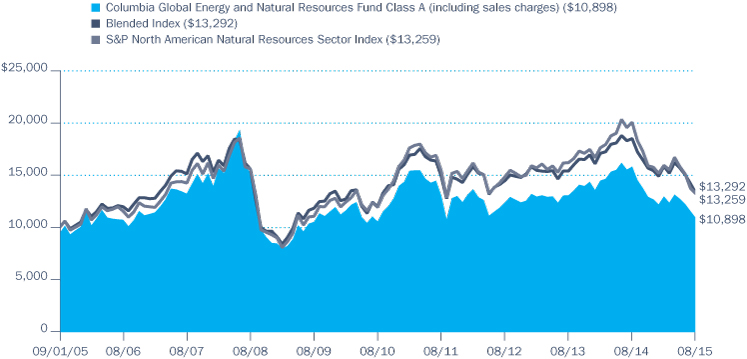
The chart above shows the change in value of a hypothetical $10,000 investment in Class A shares of Columbia Global Energy and Natural Resources Fund during the stated time period, and does not reflect the deduction of taxes that a shareholder may pay on Fund distributions or on the redemption of Fund shares.
Annual Report 2015
4
COLUMBIA GLOBAL ENERGY AND NATURAL RESOURCES FUND
MANAGER DISCUSSION OF FUND PERFORMANCE
For the 12-month period that ended August 31, 2015, the Fund's Class A shares returned -31.16% excluding sales charges. During the same 12-month period, the Fund underperformed its Blended Index, which returned -28.26%, but outperformed the S&P North American Natural Resources Sector Index, which returned -34.00%. Sharply declining commodity prices hurt both the energy and natural resources sectors, and the Fund declined generally in line with its benchmarks.
Market Overview
As energy supply outpaced demand, the price of oil declined approximately 50% during the 12-month period ended August 31, 2015. The decline, which commenced in the summer of 2014, accelerated near the end of the calendar year after the Organization of Petroleum Exporting Countries (OPEC) announced that it would not play its customary role in stabilizing oil prices by cutting production. Hopes for a V-shaped recovery gained some traction in the spring of 2015, when crude oil prices edged higher and appeared to have stabilized. However, prices resumed their decline on worries of increased production from OPEC and sluggish global economic growth, especially in China. Natural gas prices fell approximately 34% over the same period. A weak commodities market also weighed on the materials sector, as oversupply was the primary dynamic driving prices.
Contributors and Detractors
During a period that was weak for both energy and natural resources stocks, the Fund underperformed its blended benchmark. A well-timed shift to position the energy side of the portfolio more defensively aided relative results. Following OPECs November 2014 announcement, we raised the Fund's cash position and overweighted refining stocks, which held up somewhat better than other oil price-sensitive energy segments. We also avoided some big losers within the energy exploration and production segment of the Blended Index. Overweights in HollyFrontier, Tesoro and Valero Energy helped stem losses, as all three stocks were positive performers for the period.
Materials stocks detracted from results relative to the Blended Index, especially within commodity and specialty chemicals. An overweight in Methanex negatively affected returns. The price of methanol, the company's primary product, fell in line with energy prices, which hurt the stock. LyondellBasell Industries, which had been a strong performer for the Fund during prior periods, was another disappointment. The Fund had less exposure than the Blended Index to holdings in Japan, which hurt relative results in two ways: We missed out on some gains that accrued to the Blended Index, and we lost further ground by hedging the Japanese yen as it declined in value against the dollar. In April 2015, we decided to curtail currency hedging going forward.
Looking Ahead
Within energy, we took advantage of market volatility near the end of the period and deployed cash to add to the Fund's position in exploration and production names, making the portfolio slightly less defensive. Within
Portfolio Management
Josh Kapp, CFA
Jonathan Mogil, CFA
Morningstar Style BoxTM

The Morningstar Style BoxTM is based on a fund's portfolio holdings. For equity funds, the vertical axis shows the market capitalization of the stocks owned, and the horizontal axis shows investment style (value, blend, or growth). Information shown is based on the most recent data provided by Morningstar.
© 2015 Morningstar, Inc. All rights reserved. The Morningstar information contained herein: (1) is proprietary to Morningstar and/or its content providers; (2) may not be copied or distributed; and (3) is not warranted to be accurate, complete or timely. Neither Morningstar nor its content providers are responsible for any damages or losses arising from any use of this information.
Annual Report 2015
5
COLUMBIA GLOBAL ENERGY AND NATURAL RESOURCES FUND
MANAGER DISCUSSION OF FUND PERFORMANCE (continued)
Top Ten Holdings (%)
(at August 31, 2015) | |
Exxon Mobil Corp.
(United States) | | | 10.4 | | |
BP PLC (United Kingdom) | | | 4.3 | | |
Royal Dutch Shell PLC,
Class A (United Kingdom) | | | 4.0 | | |
BG Group PLC (United Kingdom) | | | 3.4 | | |
Rio Tinto PLC (United Kingdom) | | | 3.3 | | |
Kinder Morgan, Inc.
(United States) | | | 3.1 | | |
Schlumberger Ltd.
(United States) | | | 2.8 | | |
Occidental Petroleum Corp.
(United States) | | | 2.4 | | |
Suncor Energy, Inc. (Canada) | | | 2.4 | | |
Chevron Corp. (United States) | | | 2.3 | | |
Percentages indicated are based upon total investments (excluding Money Market Funds).
For further detail about these holdings, please refer to the section entitled "Portfolio of Investments."
Fund holdings are as of the date given, are subject to change at any time, and are not recommendations to buy or sell any security.
Country Breakdown (%)
(at August 31, 2015) | |
Australia | | | 1.7 | | |
Belgium | | | 1.0 | | |
Canada | | | 6.3 | | |
France | | | 2.9 | | |
Germany | | | 2.2 | | |
Ireland | | | 0.4 | | |
Netherlands | | | 1.8 | | |
Switzerland | | | 1.4 | | |
United Kingdom | | | 16.4 | | |
United States(a) | | | 65.9 | | |
Total | | | 100.0 | | |
Country Breakdown is based primarily on issuer's place of organization/incorporation. The Fund may use this and/or other criteria, for purposes of its investment policies, in determining whether an issuer is domestic (U.S.) or foreign. Percentages indicated are based upon total investments. The Fund's portfolio composition is subject to change.
(a) Includes investments in Money Market Funds.
materials, we added to LyondellBasell Industries, a position that we had reduced, taking profits, before the sector turned south. We currently plan to continue to look for opportunities among stocks that have been beaten down within both sectors of the portfolio.
Annual Report 2015
6
COLUMBIA GLOBAL ENERGY AND NATURAL RESOURCES FUND
MANAGER DISCUSSION OF FUND PERFORMANCE (continued)
Equity Sector Breakdown (%)
(at August 31, 2015) | |
Energy | | | 62.9 | | |
Materials | | | 37.1 | | |
Total | | | 100.0 | | |
Percentages indicated are based upon total equity investments. The Fund's portfolio composition is subject to change.
Summary of Investments in Securities by
Industry (%)
(at August 31, 2015) | |
Chemicals | | | 21.6 | | |
Construction Materials | | | 0.7 | | |
Containers & Packaging | | | 0.8 | | |
Energy Equipment & Services | | | 5.3 | | |
Metals & Mining | | | 11.9 | | |
Oil, Gas & Consumable Fuels | | | 55.6 | | |
Paper & Forest Products | | | 1.1 | | |
Money Market Funds | | | 2.4 | | |
Total | | | 99.4 | | |
Percentages indicated are based upon net assets. The Fund's portfolio composition is subject to change.
Investment Risks
Market risk may affect a single issuer, sector of the economy, industry or the market as a whole. Foreign investments subject the Fund to risks, including political, economic, market, social and others within a particular country, as well as to currency instabilities and less stringent financial and accounting standards generally applicable to U.S. issuers. Investing in derivatives is a specialized activity that involves special risks that subject the Fund to significant loss potential, including when used as leverage, and may result in greater fluctuation in fund value. Issuers engaged in the energy and natural resources industry may be subject to legislative or regulatory changes, adverse market conditions and/or increased competition. The values of natural resources are affected by numerous factors including naturally occurring events, demand, inflation, interest rates and local & international politics. As a non-diversified fund, fewer investments could have a greater effect on performance. See the Fund's prospectus for information on these and other risks.
Annual Report 2015
7
COLUMBIA GLOBAL ENERGY AND NATURAL RESOURCES FUND
UNDERSTANDING YOUR FUND'S EXPENSES
(Unaudited)
As an investor, you incur two types of costs. There are transaction costs, which generally include sales charges on purchases and may include redemption fees. There are also ongoing costs, which generally include management fees, distribution and/or service fees, and other fund expenses. The following information is intended to help you understand your ongoing costs (in dollars) of investing in the Fund and to help you compare these costs with the ongoing costs of investing in other mutual funds.
Analyzing Your Fund's Expenses
To illustrate these ongoing costs, we have provided examples and calculated the expenses paid by investors in each share class of the Fund during the period. The actual and hypothetical information in the table is based on an initial investment of $1,000 at the beginning of the period indicated and held for the entire period. Expense information is calculated two ways and each method provides you with different information. The amount listed in the "Actual" column is calculated using the Fund's actual operating expenses and total return for the period. You may use the Actual information, together with the amount invested, to estimate the expenses that you paid over the period. Simply divide your account value by $1,000 (for example, an $8,600 account value divided by $1,000 = 8.6), then multiply the results by the expenses paid during the period under the "Actual" column. The amount listed in the "Hypothetical" column assumes a 5% annual rate of return before expenses (which is not the Fund's actual return) and then applies the Fund's actual expense ratio for the period to the hypothetical return. You should not use the hypothetical account values and expenses to estimate either your actual account balance at the end of the period or the expenses you paid during the period. See "Compare With Other Funds" below for details on how to use the hypothetical data.
Compare With Other Funds
Since all mutual funds are required to include the same hypothetical calculations about expenses in shareholder reports, you can use this information to compare the ongoing cost of investing in the Fund with other funds. To do so, compare the hypothetical example with the 5% hypothetical examples that appear in the shareholder reports of other funds. As you compare hypothetical examples of other funds, it is important to note that hypothetical examples are meant to highlight the ongoing costs of investing in a fund only and do not reflect any transaction costs, such as sales charges, or redemption or exchange fees. Therefore, the hypothetical calculations are useful in comparing ongoing costs only, and will not help you determine the relative total costs of owning different funds. If transaction costs were included in these calculations, your costs would be higher.
March 1, 2015 – August 31, 2015
| | | Account Value at the Beginning
of the Period ($) | | Account Value at the End of the
Period ($) | | Expenses Paid During the
Period ($) | | Fund's Annualized
Expense Ratio (%) | |
| | | Actual | | Hypothetical | | Actual | | Hypothetical | | Actual | | Hypothetical | | Actual | |
Class A | | | 1,000.00 | | | | 1,000.00 | | | | 840.30 | | | | 1,018.65 | | | | 6.16 | | | | 6.75 | | | | 1.32 | | |
Class B | | | 1,000.00 | | | | 1,000.00 | | | | 837.20 | | | | 1,014.85 | | | | 9.64 | | | | 10.57 | | | | 2.07 | | |
Class C | | | 1,000.00 | | | | 1,000.00 | | | | 837.20 | | | | 1,014.85 | | | | 9.64 | | | | 10.57 | | | | 2.07 | | |
Class I | | | 1,000.00 | | | | 1,000.00 | | | | 842.10 | | | | 1,021.03 | | | | 3.97 | | | | 4.35 | | | | 0.85 | | |
Class K | | | 1,000.00 | | | | 1,000.00 | | | | 840.90 | | | | 1,019.62 | | | | 5.27 | | | | 5.78 | | | | 1.13 | | |
Class R | | | 1,000.00 | | | | 1,000.00 | | | | 839.30 | | | | 1,017.33 | | | | 7.36 | | | | 8.08 | | | | 1.58 | | |
Class R4 | | | 1,000.00 | | | | 1,000.00 | | | | 841.10 | | | | 1,019.92 | | | | 4.99 | | | | 5.48 | | | | 1.07 | | |
Class R5 | | | 1,000.00 | | | | 1,000.00 | | | | 842.30 | | | | 1,020.78 | | | | 4.20 | | | | 4.61 | | | | 0.90 | | |
Class Z | | | 1,000.00 | | | | 1,000.00 | | | | 841.50 | | | | 1,019.92 | | | | 4.99 | | | | 5.48 | | | | 1.07 | | |
Expenses paid during the period are equal to the annualized expense ratio for each class as indicated above, multiplied by the average account value over the period and then multiplied by the number of days in the Fund's most recent fiscal half year and divided by 365.
Expenses do not include fees and expenses incurred indirectly by the Fund from its investment in underlying funds, including affiliated and non-affiliated pooled investment vehicles, such as mutual funds and exchange-traded funds.
Annual Report 2015
8
COLUMBIA GLOBAL ENERGY AND NATURAL RESOURCES FUND
PORTFOLIO OF INVESTMENTS
August 31, 2015
(Percentages represent value of investments compared to net assets)
Common Stocks 90.4%
Issuer | | Shares | | Value ($) | |
AUSTRALIA 1.7% | |
BHP Billiton Ltd., ADR | | | 97,543 | | | | 3,592,509 | | |
Tronox Ltd., Class A | | | 70,188 | | | | 565,013 | | |
Total | | | | | 4,157,522 | | |
BELGIUM 1.0% | |
Solvay SA | | | 21,006 | | | | 2,472,692 | | |
CANADA 6.3% | |
Canadian Natural Resources Ltd. | | | 108,082 | | | | 2,435,871 | | |
Canadian Natural Resources Ltd. | | | 56,799 | | | | 1,276,274 | | |
Cenovus Energy, Inc. | | | 33,889 | | | | 491,231 | | |
First Quantum Minerals Ltd. | | | 150,274 | | | | 783,581 | | |
Methanex Corp. | | | 41,293 | | | | 1,683,103 | | |
Silver Wheaton Corp. | | | 55,036 | | | | 673,090 | | |
Suncor Energy, Inc. | | | 204,889 | | | | 5,802,800 | | |
Suncor Energy, Inc. | | | 61,021 | | | | 1,723,233 | | |
Tourmaline Oil Corp.(a) | | | 36,103 | | | | 913,826 | | |
Total | | | | | 15,783,009 | | |
FRANCE 2.8% | |
Air Liquide SA | | | 23,805 | | | | 2,854,262 | | |
Total SA | | | 93,971 | | | | 4,302,871 | | |
Total | | | | | 7,157,133 | | |
GERMANY 2.2% | |
BASF SE | | | 70,098 | | | | 5,649,398 | | |
IRELAND 0.4% | |
Weatherford International PLC(a) | | | 103,957 | | | | 1,055,163 | | |
NETHERLANDS 1.8% | |
LyondellBasell Industries NV, Class A | | | 51,955 | | | | 4,435,918 | | |
SWITZERLAND 1.4% | |
Clariant AG, Registered Shares | | | 97,760 | | | | 1,764,767 | | |
LafargeHolcim Ltd.(a) | | | 25,758 | | | | 1,637,143 | | |
Total | | | | | 3,401,910 | | |
UNITED KINGDOM 16.3% | |
Anglo American PLC | | | 111,774 | | | | 1,252,533 | | |
BG Group PLC | | | 550,246 | | | | 8,351,402 | | |
| BP PLC | | | 1,871,536 | | | | 10,373,484 | | |
| BP PLC, ADR | | | 29,148 | | | | 977,624 | | |
Cairn Energy PLC(a) | | | 194,961 | | | | 450,637 | | |
Common Stocks (continued)
Issuer | | Shares | | Value ($) | |
Ophir Energy PLC(a) | | | 301,020 | | | | 444,849 | | |
Randgold Resources Ltd. | | | 21,362 | | | | 1,291,879 | | |
Rio Tinto PLC | | | 221,578 | | | | 8,089,957 | | |
Rio Tinto PLC, ADR | | | 145 | | | | 5,324 | | |
Royal Dutch Shell PLC, Class A | | | 375,196 | | | | 9,774,713 | | |
Total | | | | | 41,012,402 | | |
UNITED STATES 56.5% | |
Albemarle Corp. | | | 69,356 | | | | 3,135,585 | | |
Alcoa, Inc. | | | 233,651 | | | | 2,208,002 | | |
Anadarko Petroleum Corp. | | | 62,717 | | | | 4,489,283 | | |
Atwood Oceanics, Inc. | | | 34,678 | | | | 662,697 | | |
Cabot Oil & Gas Corp. | | | 40,593 | | | | 960,836 | | |
Cheniere Energy, Inc.(a) | | | 15,435 | | | | 959,285 | | |
Chevron Corp. | | | 69,885 | | | | 5,659,986 | | |
Cimarex Energy Co. | | | 5,872 | | | | 648,915 | | |
Cobalt International Energy, Inc.(a) | | | 98,586 | | | | 789,674 | | |
ConocoPhillips | | | 27,778 | | | | 1,365,289 | | |
Delek U.S. Holdings, Inc. | | | 28,970 | | | | 891,117 | | |
Devon Energy Corp. | | | 27,009 | | | | 1,152,204 | | |
Dow Chemical Co. (The) | | | 129,105 | | | | 5,649,635 | | |
Eastman Chemical Co. | | | 56,096 | | | | 4,064,716 | | |
EI du Pont de Nemours & Co. | | | 62,456 | | | | 3,216,484 | | |
EOG Resources, Inc. | | | 21,997 | | | | 1,722,585 | | |
EQT Corp. | | | 27,916 | | | | 2,172,423 | | |
Exxon Mobil Corp. | | | 338,707 | | | | 25,484,315 | | |
FMC Technologies, Inc.(a) | | | 30,582 | | | | 1,063,642 | | |
Freeport-McMoRan, Inc. | | | 159,059 | | | | 1,692,388 | | |
Halliburton Co. | | | 92,224 | | | | 3,629,014 | | |
HollyFrontier Corp. | | | 39,436 | | | | 1,847,971 | | |
International Paper Co. | | | 65,408 | | | | 2,821,701 | | |
Kinder Morgan, Inc. | | | 236,576 | | | | 7,667,428 | | |
Marathon Petroleum Corp. | | | 62,188 | | | | 2,942,114 | | |
Monsanto Co. | | | 56,871 | | | | 5,553,453 | | |
Mosaic Co. (The) | | | 98,029 | | | | 4,002,524 | | |
Noble Energy, Inc. | | | 11,160 | | | | 372,856 | | |
Nucor Corp. | | | 87,157 | | | | 3,773,027 | | |
Occidental Petroleum Corp. | | | 81,621 | | | | 5,959,149 | | |
PBF Energy, Inc., Class A | | | 35,852 | | | | 1,072,692 | | |
Phillips 66 | | | 30,299 | | | | 2,395,742 | | |
The accompanying Notes to Financial Statements are an integral part of this statement.
Annual Report 2015
9
COLUMBIA GLOBAL ENERGY AND NATURAL RESOURCES FUND
PORTFOLIO OF INVESTMENTS (continued)
August 31, 2015
Common Stocks (continued)
Issuer | | Shares | | Value ($) | |
PPG Industries, Inc. | | | 47,366 | | | | 4,513,506 | | |
Praxair, Inc. | | | 45,560 | | | | 4,817,970 | | |
Range Resources Corp. | | | 18,299 | | | | 706,707 | | |
Schlumberger Ltd. | | | 88,640 | | | | 6,858,077 | | |
SemGroup Corp., Class A | | | 22,246 | | | | 1,223,530 | | |
Sonoco Products Co. | | | 52,498 | | | | 2,064,221 | | |
Steel Dynamics, Inc. | | | 143,734 | | | | 2,799,938 | | |
Tesoro Corp. | | | 21,668 | | | | 1,993,673 | | |
Valero Energy Corp. | | | 54,826 | | | | 3,253,375 | | |
Williams Companies, Inc. (The) | | | 76,036 | | | | 3,664,935 | | |
Total | | | | | 141,922,664 | | |
Total Common Stocks
(Cost: $254,244,730) | | | | | 227,047,811 | | |
Exchange-Traded Funds 3.6%
| | | Shares | | Value ($) | |
Market Vectors Gold Miners ETF | | | 269,970 | | | | 3,809,277 | | |
SPDR S&P Oil & Gas Exploration &
Production | | | 138,718 | | | | 5,301,802 | | |
Total Exchange-Traded Funds
(Cost: $8,512,504) | | | | | 9,111,079 | | |
Warrants 0.1%
Issuer | | Shares | | Value ($) | |
UNITED STATES 0.1% | |
Kinder Morgan, Inc.(a) | | | 290,588 | | | | 386,482 | | |
Total Warrants
(Cost: $1,479,810) | | | | | 386,482 | | |
Limited Partnerships 2.9%
Issuer | | Shares | | Value ($) | |
UNITED STATES 2.9% | |
Energy Transfer Equity LP | | | 45,380 | | | | 1,272,909 | | |
Enterprise Products Partners LP | | | 73,328 | | | | 2,061,250 | | |
PBF Logistics LP | | | 62,983 | | | | 1,306,897 | | |
Plains GP Holdings LP, Class A | | | 139,570 | | | | 2,734,176 | | |
Total | | | | | 7,375,232 | | |
Total Limited Partnerships
(Cost: $8,056,874) | | | | | 7,375,232 | | |
Money Market Funds 2.4%
| | | Shares | | Value ($) | |
Columbia Short-Term Cash Fund,
0.150%(b)(c) | | | 5,919,492 | | | | 5,919,492 | | |
Total Money Market Funds
(Cost: $5,919,492) | | | | | 5,919,492 | | |
Total Investments
(Cost: $278,213,410) | | | | | 249,840,096 | | |
Other Assets & Liabilities, Net | | | | | 1,433,347 | | |
Net Assets | | | | | 251,273,443 | | |
Notes to Portfolio of Investments
(a) Non-income producing investment.
(b) The rate shown is the seven-day current annualized yield at August 31, 2015.
(c) As defined in the Investment Company Act of 1940, an affiliated company is one in which the Fund owns 5% or more of the company's outstanding voting securities, or a company which is under common ownership or control with the Fund. Holdings and transactions in these affiliated companies during the year ended August 31, 2015 are as follows:
Issuer | | Beginning
Cost ($) | | Purchase
Cost ($) | | Proceeds
From Sales ($) | | Ending
Cost ($) | | Dividends —
Affiliated
Issuers ($) | | Value ($) | |
Columbia Short-Term Cash Fund | | | 660,004 | | | | 83,366,196 | | | | (78,106,708 | ) | | | 5,919,492 | | | | 11,404 | | | | 5,919,492 | | |
The accompanying Notes to Financial Statements are an integral part of this statement.
Annual Report 2015
10
COLUMBIA GLOBAL ENERGY AND NATURAL RESOURCES FUND
PORTFOLIO OF INVESTMENTS (continued)
August 31, 2015
Abbreviation Legend
ADR American Depositary Receipt
Fair Value Measurements
The Fund categorizes its fair value measurements according to a three-level hierarchy that maximizes the use of observable inputs and minimizes the use of unobservable inputs by prioritizing that the most observable input be used when available. Observable inputs are those that market participants would use in pricing an investment based on market data obtained from sources independent of the reporting entity. Unobservable inputs are those that reflect the Fund's assumptions about the information market participants would use in pricing an investment. An investment's level within the fair value hierarchy is based on the lowest level of any input that is deemed significant to the asset's or liability's fair value measurement. The input levels are not necessarily an indication of the risk or liquidity associated with investments at that level. For example, certain U.S. government securities are generally high quality and liquid, however, they are reflected as Level 2 because the inputs used to determine fair value may not always be quoted prices in an active market.
Fair value inputs are summarized in the three broad levels listed below:
> Level 1 — Valuations based on quoted prices for investments in active markets that the Fund has the ability to access at the measurement date (including NAV for open-end mutual funds). Valuation adjustments are not applied to Level 1 investments.
> Level 2 — Valuations based on other significant observable inputs (including quoted prices for similar securities, interest rates, prepayment speeds, credit risks, etc.).
> Level 3 — Valuations based on significant unobservable inputs (including the Fund's own assumptions and judgment in determining the fair value of investments).
Inputs that are used in determining fair value of an investment may include price information, credit data, volatility statistics, and other factors. These inputs can be either observable or unobservable. The availability of observable inputs can vary between investments, and is affected by various factors such as the type of investment, and the volume and level of activity for that investment or similar investments in the marketplace. The inputs will be considered by the Investment Manager, along with any other relevant factors in the calculation of an investment's fair value. The Fund uses prices and inputs that are current as of the measurement date, which may include periods of market dislocations. During these periods, the availability of prices and inputs may be reduced for many investments. This condition could cause an investment to be reclassified between the various levels within the hierarchy.
Foreign equity securities actively traded in markets where there is a significant delay in the local close relative to the New York Stock Exchange (NYSE) are classified as Level 2. The values of these securities may include an adjustment to reflect the impact of significant market movements following the close of local trading, as described in Note 2 to the financial statements — Security Valuation.
Investments falling into the Level 3 category are primarily supported by quoted prices from brokers and dealers participating in the market for those investments. However, these may be classified as Level 3 investments due to lack of market transparency and corroboration to support these quoted prices. Additionally, valuation models may be used as the pricing source for any remaining investments classified as Level 3. These models may rely on one or more significant unobservable inputs and/or significant assumptions by the Investment Manager. Inputs used in valuations may include, but are not limited to, financial statement analysis, capital account balances, discount rates and estimated cash flows, and comparable company data.
Under the direction of the Fund's Board of Trustees (the Board), the Investment Manager's Valuation Committee (the Committee) is responsible for overseeing the valuation procedures approved by the Board. The Committee consists of voting and non-voting members from various groups within the Investment Manager's organization, including operations and accounting, trading and investments, compliance, risk management and legal.
The Committee meets at least monthly to review and approve valuation matters, which may include a description of specific valuation determinations, data regarding pricing information received from approved pricing vendors and brokers and the results of Board-approved valuation control policies and procedures (the Policies). The Policies address, among other things, instances when market quotations are or are not readily available, including recommendations of third party pricing vendors and a determination of appropriate pricing methodologies; events that require specific valuation determinations and assessment of fair value techniques; securities with a potential for stale pricing, including those that are illiquid, restricted, or in default; and the effectiveness of third party pricing vendors, including periodic reviews of vendors. The Committee meets more frequently, as needed, to discuss additional valuation matters, which may include the need to review back-testing results, review time-sensitive information or approve related valuation actions. The Committee reports to the Board, with members of the Committee meeting with the Board at each of its regularly scheduled meetings to discuss valuation matters and actions during the period, similar to those described earlier.
For investments categorized as Level 3, the Committee monitors information similar to that described above, which may include: (i) data specific to the issuer or comparable issuers, (ii) general market or specific sector news and (iii) quoted prices and specific or similar security transactions. The Committee considers this data and any changes from prior periods in order to assess the reasonableness of observable and unobservable inputs, any assumptions or internal models used to value those securities and changes in fair value. This data is also used to corroborate, when available, information received from approved pricing vendors and brokers. Various factors impact the frequency of monitoring this information (which may occur as often as daily). However, the Committee may determine that changes to inputs, assumptions and models are not required as a result of the monitoring procedures performed.
The accompanying Notes to Financial Statements are an integral part of this statement.
Annual Report 2015
11
COLUMBIA GLOBAL ENERGY AND NATURAL RESOURCES FUND
PORTFOLIO OF INVESTMENTS (continued)
August 31, 2015
Fair Value Measurements (continued)
The following table is a summary of the inputs used to value the Fund's investments at August 31, 2015:
| | | Level 1
Quoted Prices in Active
Markets for Identical
Assets ($) | | Level 2
Other Significant
Observable Inputs ($) | | Level 3
Significant
Unobservable Inputs ($) | | Total ($) | |
Investments | |
Common Stocks | |
Australia | | | 4,157,522 | | | | — | | | | — | | | | 4,157,522 | | |
Belgium | | | — | | | | 2,472,692 | | | | — | | | | 2,472,692 | | |
Canada | | | 15,783,009 | | | | — | | | | — | | | | 15,783,009 | | |
France | | | — | | | | 7,157,133 | | | | — | | | | 7,157,133 | | |
Germany | | | — | | | | 5,649,398 | | | | — | | | | 5,649,398 | | |
Ireland | | | 1,055,163 | | | | — | | | | — | | | | 1,055,163 | | |
Netherlands | | | 4,435,918 | | | | — | | | | — | | | | 4,435,918 | | |
Switzerland | | | — | | | | 3,401,910 | | | | — | | | | 3,401,910 | | |
United Kingdom | | | 982,948 | | | | 40,029,454 | | | | — | | | | 41,012,402 | | |
United States | | | 141,922,664 | | | | — | | | | — | | | | 141,922,664 | | |
Total Common Stocks | | | 168,337,224 | | | | 58,710,587 | | | | — | | | | 227,047,811 | | |
Exchange-Traded Funds | | | 9,111,079 | | | | — | | | | — | | | | 9,111,079 | | |
Warrants | |
United States | | | 386,482 | | | | — | | | | — | | | | 386,482 | | |
Limited Partnerships | |
United States | | | 7,375,232 | | | | — | | | | — | | | | 7,375,232 | | |
Money Market Funds | | | — | | | | 5,919,492 | | | | — | | | | 5,919,492 | | |
Total Investments | | | 185,210,017 | | | | 64,630,079 | | | | — | | | | 249,840,096 | | |
See the Portfolio of Investments for all investment classifications not indicated in the table.
The Fund's assets assigned to the Level 2 input category are generally valued using the market approach, in which a security's value is determined through reference to prices and information from market transactions for similar or identical assets. These assets include certain foreign securities for which a third party statistical pricing service may be employed for purposes of fair market valuation. The model utilized by such third party statistical pricing service takes into account a security's correlation to available market data including, but not limited to, intraday index, ADR, and exchange-traded fund movements.
Financial assets were transferred from Level 1 to Level 2 as the market for these assets is not considered publicly available. Fund per share market values were obtained using observable market inputs.
The following table shows transfers between Level 1 and Level 2 of the fair value hierarchy:
Transfers In | | Transfers Out | |
| Level 1 ($) | | Level 2 ($) | | Level 1 ($) | | Level 2 ($) | |
| | — | | | | 660,004 | | | | 660,004 | | | | — | | |
Transfers between Level 1 and Level 2 are determined based on the fair value at the beginning of the period for security positions held throughout the period.
There were no transfers of financial assets between Levels 2 and 3 during the period.
The accompanying Notes to Financial Statements are an integral part of this statement.
Annual Report 2015
12
COLUMBIA GLOBAL ENERGY AND NATURAL RESOURCES FUND
STATEMENT OF ASSETS AND LIABILITIES
August 31, 2015
Assets | |
Investments, at value | |
Unaffiliated issuers (identified cost $272,293,918) | | $ | 243,920,604 | | |
Affiliated issuers (identified cost $5,919,492) | | | 5,919,492 | | |
Total investments (identified cost $278,213,410) | | | 249,840,096 | | |
Receivable for: | |
Investments sold | | | 6,629,691 | | |
Capital shares sold | | | 920,889 | | |
Dividends | | | 1,364,355 | | |
Foreign tax reclaims | | | 51,939 | | |
Prepaid expenses | | | 3,114 | | |
Trustees' deferred compensation plan | | | 39,549 | | |
Total assets | | | 258,849,633 | | |
Liabilities | |
Payable for: | |
Investments purchased | | | 7,187,362 | | |
Capital shares purchased | | | 235,226 | | |
Investment management fees | | | 14,228 | | |
Distribution and/or service fees | | | 3,147 | | |
Transfer agent fees | | | 40,086 | | |
Administration fees | | | 1,237 | | |
Plan administration fees | | | 1 | | |
Compensation of board members | | | 1,117 | | |
Chief compliance officer expenses | | | 24 | | |
Other expenses | | | 54,213 | | |
Trustees' deferred compensation plan | | | 39,549 | | |
Total liabilities | | | 7,576,190 | | |
Net assets applicable to outstanding capital stock | | $ | 251,273,443 | | |
Represented by | |
Paid-in capital | | $ | 287,798,647 | | |
Excess of distributions over net investment income | | | (4,297,035 | ) | |
Accumulated net realized loss | | | (3,840,497 | ) | |
Unrealized appreciation (depreciation) on: | |
Investments | | | (28,373,314 | ) | |
Foreign currency translations | | | (14,358 | ) | |
Total — representing net assets applicable to outstanding capital stock | | $ | 251,273,443 | | |
The accompanying Notes to Financial Statements are an integral part of this statement.
Annual Report 2015
13
COLUMBIA GLOBAL ENERGY AND NATURAL RESOURCES FUND
STATEMENT OF ASSETS AND LIABILITIES (continued)
August 31, 2015
Class A | |
Net assets | | $ | 86,132,601 | | |
Shares outstanding | | | 5,419,970 | | |
Net asset value per share | | $ | 15.89 | | |
Maximum offering price per share(a) | | $ | 16.86 | | |
Class B | |
Net assets | | $ | 986,417 | | |
Shares outstanding | | | 65,035 | | |
Net asset value per share | | $ | 15.17 | | |
Class C | |
Net assets | | $ | 14,428,445 | | |
Shares outstanding | | | 950,992 | | |
Net asset value per share | | $ | 15.17 | | |
Class I | |
Net assets | | $ | 35,649,761 | | |
Shares outstanding | | | 2,212,578 | | |
Net asset value per share | | $ | 16.11 | | |
Class K | |
Net assets | | $ | 4,993 | | |
Shares outstanding | | | 312 | | |
Net asset value per share(b) | | $ | 16.01 | | |
Class R | |
Net assets | | $ | 3,044,541 | | |
Shares outstanding | | | 192,372 | | |
Net asset value per share | | $ | 15.83 | | |
Class R4 | |
Net assets | | $ | 7,191,068 | | |
Shares outstanding | | | 441,052 | | |
Net asset value per share | | $ | 16.30 | | |
Class R5 | |
Net assets | | $ | 4,978,365 | | |
Shares outstanding | | | 304,460 | | |
Net asset value per share | | $ | 16.35 | | |
Class Z | |
Net assets | | $ | 98,857,252 | | |
Shares outstanding | | | 6,165,542 | | |
Net asset value per share | | $ | 16.03 | | |
(a) The maximum offering price per share is calculated by dividing the net asset value per share by 1.0 minus the maximum sales charge of 5.75%.
(b) Net asset value per share rounds to this amount due to fractional shares outstanding.
The accompanying Notes to Financial Statements are an integral part of this statement.
Annual Report 2015
14
COLUMBIA GLOBAL ENERGY AND NATURAL RESOURCES FUND
STATEMENT OF OPERATIONS
Year Ended August 31, 2015
Net investment income | |
Income: | |
Dividends — unaffiliated issuers | | $ | 8,860,111 | | |
Dividends — affiliated issuers | | | 11,404 | | |
Foreign taxes withheld | | | (464,523 | ) | |
Total income | | | 8,406,992 | | |
Expenses: | |
Investment management fees | | | 2,082,111 | | |
Distribution and/or service fees | |
Class A | | | 256,204 | | |
Class B | | | 15,632 | | |
Class C | | | 153,914 | | |
Class R | | | 13,052 | | |
Transfer agent fees | |
Class A | | | 233,711 | | |
Class B | | | 3,564 | | |
Class C | | | 35,129 | | |
Class K | | | 11 | | |
Class R | | | 5,944 | | |
Class R4 | | | 21,724 | | |
Class R5 | | | 2,363 | | |
Class Z | | | 296,675 | | |
Administration fees | | | 181,053 | | |
Plan administration fees | |
Class K | | | 57 | | |
Compensation of board members | | | 22,595 | | |
Custodian fees | | | 15,019 | | |
Printing and postage fees | | | 72,279 | | |
Registration fees | | | 114,379 | | |
Professional fees | | | 35,016 | | |
Chief compliance officer expenses | | | 150 | | |
Other | | | 18,393 | | |
Total expenses | | | 3,578,975 | | |
Expense reductions | | | (2,120 | ) | |
Total net expenses | | | 3,576,855 | | |
Net investment income | | | 4,830,137 | | |
Realized and unrealized gain (loss) — net | |
Net realized gain (loss) on: | |
Investments | | | 1,825,873 | | |
Foreign currency translations | | | (46,290 | ) | |
Forward foreign currency exchange contracts | | | (9,180,525 | ) | |
Options purchased | | | (13,843 | ) | |
Options contracts written | | | 21,848 | | |
Net realized loss | | | (7,392,937 | ) | |
Net change in unrealized appreciation (depreciation) on: | |
Investments | | | (113,995,341 | ) | |
Foreign currency translations | | | (4,738 | ) | |
Forward foreign currency exchange contracts | | | 566,209 | | |
Net change in unrealized depreciation | | | (113,433,870 | ) | |
Net realized and unrealized loss | | | (120,826,807 | ) | |
Net decrease in net assets from operations | | $ | (115,996,670 | ) | |
The accompanying Notes to Financial Statements are an integral part of this statement.
Annual Report 2015
15
COLUMBIA GLOBAL ENERGY AND NATURAL RESOURCES FUND
STATEMENT OF CHANGES IN NET ASSETS
| | | Year Ended
August 31,
2015 | | Year Ended
August 31,
2014 | |
Operations | |
Net investment income | | $ | 4,830,137 | | | $ | 4,816,629 | | |
Net realized gain (loss) | | | (7,392,937 | ) | | | 20,834,804 | | |
Net change in unrealized appreciation (depreciation) | | | (113,433,870 | ) | | | 46,712,914 | | |
Net increase (decrease) in net assets resulting from operations | | | (115,996,670 | ) | | | 72,364,347 | | |
Distributions to shareholders | |
Net investment income | |
Class A | | | — | | | | (782,389 | ) | |
Class I | | | — | | | | (629,305 | ) | |
Class K | | | — | | | | (611 | ) | |
Class R | | | — | | | | (8,739 | ) | |
Class R4 | | | — | | | | (112,916 | ) | |
Class R5 | | | — | | | | (40,140 | ) | |
Class Z | | | — | | | | (1,549,882 | ) | |
Net realized gains | |
Class A | | | (6,713,299 | ) | | | (1,619,315 | ) | |
Class B | | | (122,869 | ) | | | (40,187 | ) | |
Class C | | | (1,012,641 | ) | | | (219,569 | ) | |
Class I | | | (2,383,969 | ) | | | (750,650 | ) | |
Class K | | | (558 | ) | | | (992 | ) | |
Class R | | | (153,897 | ) | | | (29,313 | ) | |
Class R4 | | | (640,129 | ) | | | (172,825 | ) | |
Class R5 | | | (284,327 | ) | | | (50,556 | ) | |
Class Z | | | (9,288,249 | ) | | | (2,319,659 | ) | |
Total distributions to shareholders | | | (20,599,938 | ) | | | (8,327,048 | ) | |
Increase (decrease) in net assets from capital stock activity | | | 939,387 | | | | (41,619,168 | ) | |
Total increase (decrease) in net assets | | | (135,657,221 | ) | | | 22,418,131 | | |
Net assets at beginning of year | | | 386,930,664 | | | | 364,512,533 | | |
Net assets at end of year | | $ | 251,273,443 | | | $ | 386,930,664 | | |
Excess of distributions over net investment income | | $ | (4,297,035 | ) | | $ | 73,454 | | |
The accompanying Notes to Financial Statements are an integral part of this statement.
Annual Report 2015
16
COLUMBIA GLOBAL ENERGY AND NATURAL RESOURCES FUND
STATEMENT OF CHANGES IN NET ASSETS (continued)
| | | Year Ended August 31, 2015 | | Year Ended August 31, 2014 | |
| | | Shares | | Dollars ($) | | Shares | | Dollars ($) | |
Capital stock activity | |
Class A shares | |
Subscriptions(a) | | | 1,789,737 | | | | 33,413,364 | | | | 1,665,611 | | | | 38,827,931 | | |
Distributions reinvested | | | 375,496 | | | | 6,544,893 | | | | 106,463 | | | | 2,338,985 | | |
Redemptions | | | (1,977,843 | ) | | | (38,846,445 | ) | | | (1,803,353 | ) | | | (42,576,672 | ) | |
Net increase (decrease) | | | 187,390 | | | | 1,111,812 | | | | (31,279 | ) | | | (1,409,756 | ) | |
Class B shares | |
Subscriptions | | | 6,165 | | | | 108,825 | | | | 8,466 | | | | 193,632 | | |
Distributions reinvested | | | 6,765 | | | | 113,113 | | | | 1,812 | | | | 38,616 | | |
Redemptions(a) | | | (45,257 | ) | | | (823,555 | ) | | | (60,937 | ) | | | (1,356,384 | ) | |
Net decrease | | | (32,327 | ) | | | (601,617 | ) | | | (50,659 | ) | | | (1,124,136 | ) | |
Class C shares | |
Subscriptions | | | 431,553 | | | | 7,524,091 | | | | 74,863 | | | | 1,721,282 | | |
Distributions reinvested | | | 55,511 | | | | 928,699 | | | | 9,269 | | | | 197,611 | | |
Redemptions | | | (230,818 | ) | | | (4,108,184 | ) | | | (142,942 | ) | | | (3,162,678 | ) | |
Net increase (decrease) | | | 256,246 | | | | 4,344,606 | | | | (58,810 | ) | | | (1,243,785 | ) | |
Class I shares | |
Subscriptions | | | 446,103 | | | | 7,956,038 | | | | 360,746 | | | | 8,312,426 | | |
Distributions reinvested | | | 135,365 | | | | 2,383,782 | | | | 62,508 | | | | 1,379,541 | | |
Redemptions | | | (24,829 | ) | | | (439,951 | ) | | | (866,986 | ) | | | (19,726,204 | ) | |
Net increase (decrease) | | | 556,639 | | | | 9,899,869 | | | | (443,732 | ) | | | (10,034,237 | ) | |
Class K shares | |
Distributions reinvested | | | 23 | | | | 396 | | | | 69 | | | | 1,514 | | |
Redemptions | | | (2,867 | ) | | | (58,913 | ) | | | (159 | ) | | | (3,930 | ) | |
Net decrease | | | (2,844 | ) | | | (58,517 | ) | | | (90 | ) | | | (2,416 | ) | |
Class R shares | |
Subscriptions | | | 121,559 | | | | 2,260,130 | | | | 76,964 | | | | 1,815,492 | | |
Distributions reinvested | | | 8,850 | | | | 153,897 | | | | 1,729 | | | | 37,999 | | |
Redemptions | | | (63,594 | ) | | | (1,292,285 | ) | | | (32,238 | ) | | | (762,045 | ) | |
Net increase | | | 66,815 | | | | 1,121,742 | | | | 46,455 | | | | 1,091,446 | | |
Class R4 shares | |
Subscriptions | | | 196,943 | | | | 3,790,078 | | | | 628,818 | | | | 14,718,409 | | |
Distributions reinvested | | | 35,853 | | | | 639,975 | | | | 12,754 | | | | 285,679 | | |
Redemptions | | | (297,272 | ) | | | (5,758,896 | ) | | | (209,252 | ) | | | (4,897,763 | ) | |
Net increase (decrease) | | | (64,476 | ) | | | (1,328,843 | ) | | | 432,320 | | | | 10,106,325 | | |
The accompanying Notes to Financial Statements are an integral part of this statement.
Annual Report 2015
17
COLUMBIA GLOBAL ENERGY AND NATURAL RESOURCES FUND
STATEMENT OF CHANGES IN NET ASSETS (continued)
| | | Year Ended August 31, 2015 | | Year Ended August 31, 2014 | |
| | | Shares | | Dollars ($) | | Shares | | Dollars ($) | |
Capital stock activity (continued) | |
Class R5 shares | |
Subscriptions | | | 149,922 | | | | 2,869,278 | | | | 144,671 | | | | 3,216,269 | | |
Distributions reinvested | | | 15,893 | | | | 284,174 | | | | 4,046 | | | | 90,628 | | |
Redemptions | | | (40,616 | ) | | | (793,010 | ) | | | (18,581 | ) | | | (440,369 | ) | |
Net increase | | | 125,199 | | | | 2,360,442 | | | | 130,136 | | | | 2,866,528 | | |
Class Z shares | |
Subscriptions | | | 1,030,962 | | | | 19,595,090 | | | | 461,853 | | | | 10,787,460 | | |
Distributions reinvested | | | 507,374 | | | | 8,904,420 | | | | 167,347 | | | | 3,691,681 | | |
Redemptions | | | (2,328,664 | ) | | | (44,409,617 | ) | | | (2,465,234 | ) | | | (56,348,278 | ) | |
Net decrease | | | (790,328 | ) | | | (15,910,107 | ) | | | (1,836,034 | ) | | | (41,869,137 | ) | |
Total net increase (decrease) | | | 302,314 | | | | 939,387 | | | | (1,811,693 | ) | | | (41,619,168 | ) | |
(a) Includes conversions of Class B shares to Class A shares, if any.
The accompanying Notes to Financial Statements are an integral part of this statement.
Annual Report 2015
18
COLUMBIA GLOBAL ENERGY AND NATURAL RESOURCES FUND
The following tables are intended to help you understand the Fund's financial performance. Certain information reflects financial results for a single share of a class held for the periods shown. Per share net investment income (loss) amounts are calculated based on average shares outstanding during the period. Total return assumes reinvestment of all dividends and distributions, if any. Total return does not reflect payment of sales charges, if any. Total return and portfolio turnover are not annualized for periods of less than one year. The portfolio turnover rate is calculated without regard to purchase and sales transactions of short-term instruments and certain derivatives, if any. If such transactions were included, the Fund's portfolio turnover rate may be higher.
| | | Year Ended August 31, | | Year Ended
March 31, | |
Class A | | 2015 | | 2014 | | 2013 | | 2012(a) | | 2012 | | 2011 | |
Per share data | |
Net asset value, beginning of period | | $ | 24.98 | | | $ | 21.07 | | | $ | 20.04 | | | $ | 20.89 | | | $ | 25.57 | | | $ | 20.11 | | |
Income from investment operations: | |
Net investment income (loss) | | | 0.29 | | | | 0.26 | | | | 0.24 | | | | 0.06 | | | | 0.05 | | | | (0.02 | ) | |
Net realized and unrealized gain (loss) | | | (7.95 | ) | | | 4.10 | | | | 0.87 | | | | (0.88 | ) | | | (4.32 | ) | | | 5.49 | | |
Total from investment operations | | | (7.66 | ) | | | 4.36 | | | | 1.11 | | | | (0.82 | ) | | | (4.27 | ) | | | 5.47 | | |
Less distributions to shareholders: | |
Net investment income | | | — | | | | (0.14 | ) | | | (0.08 | ) | | | (0.03 | ) | | | (0.05 | ) | | | (0.01 | ) | |
Net realized gains | | | (1.43 | ) | | | (0.31 | ) | | | — | | | | — | | | | (0.36 | ) | | | — | | |
Total distributions to shareholders | | | (1.43 | ) | | | (0.45 | ) | | | (0.08 | ) | | | (0.03 | ) | | | (0.41 | ) | | | (0.01 | ) | |
Proceeds from regulatory settlements | | | — | | | | — | | | | — | | | | — | | | | 0.00 | (b) | | | — | | |
Net asset value, end of period | | $ | 15.89 | | | $ | 24.98 | | | $ | 21.07 | | | $ | 20.04 | | | $ | 20.89 | | | $ | 25.57 | | |
Total return | | | (31.16 | %) | | | 21.00 | % | | | 5.54 | % | | | (3.90 | %) | | | (16.64 | %) | | | 27.20 | % | |
Ratios to average net assets(c) | |
Total gross expenses | | | 1.32 | % | | | 1.30 | % | | | 1.32 | %(d) | | | 1.34 | %(e) | | | 1.28 | %(d) | | | 1.26 | %(d) | |
Total net expenses(f) | | | 1.32 | %(g) | | | 1.30 | %(g) | | | 1.32 | %(d)(g) | | | 1.34 | %(e)(g) | | | 1.28 | %(d)(g) | | | 1.26 | %(d)(g) | |
Net investment income (loss) | | | 1.48 | % | | | 1.13 | % | | | 1.17 | % | | | 0.79 | %(e) | | | 0.21 | % | | | (0.08 | %) | |
Supplemental data | |
Net assets, end of period (in thousands) | | $ | 86,133 | | | $ | 130,692 | | | $ | 110,896 | | | $ | 123,271 | | | $ | 145,298 | | | $ | 69,938 | | |
Portfolio turnover | | | 51 | % | | | 34 | % | | | 73 | % | | | 14 | % | | | 167 | % | | | 551 | % | |
Notes to Financial Highlights
(a) For the period from April 1, 2012 to August 31, 2012. During the period, the Fund's fiscal year end was changed from March 31 to August 31.
(b) Rounds to zero.
(c) In addition to the fees and expenses that the Fund bears directly, the Fund indirectly bears a pro rata share of the fees and expenses of any other funds in which it invests. Such indirect expenses are not included in the Fund's reported expense ratios.
(d) Ratios include line of credit interest expense which is less than 0.01%.
(e) Annualized.
(f) Total net expenses include the impact of certain fee waivers/expense reimbursements made by the Investment Manager and certain of its affiliates, if applicable.
(g) The benefits derived from expense reductions had an impact of less than 0.01%.
The accompanying Notes to Financial Statements are an integral part of this statement.
Annual Report 2015
19
COLUMBIA GLOBAL ENERGY AND NATURAL RESOURCES FUND
FINANCIAL HIGHLIGHTS (continued)
| | | Year Ended August 31, | | Year Ended
March 31, | |
Class B | | 2015 | | 2014 | | 2013 | | 2012(a) | | 2012 | | 2011(b) | |
Per share data | |
Net asset value, beginning of period | | $ | 24.10 | | | $ | 20.35 | | | $ | 19.44 | | | $ | 20.29 | | | $ | 24.96 | | | $ | 24.77 | | |
Income from investment operations: | |
Net investment income (loss) | | | 0.12 | | | | 0.08 | | | | 0.08 | | | | (0.00 | )(c) | | | (0.11 | ) | | | (0.03 | ) | |
Net realized and unrealized gain (loss) | | | (7.62 | ) | | | 3.98 | | | | 0.83 | | | | (0.85 | ) | | | (4.20 | ) | | | 0.22 | | |
Total from investment operations | | | (7.50 | ) | | | 4.06 | | | | 0.91 | | | | (0.85 | ) | | | (4.31 | ) | | | 0.19 | | |
Less distributions to shareholders: | |
Net investment income | | | — | | | | — | | | | (0.00 | )(c) | | | — | | | | — | | | | — | | |
Net realized gains | | | (1.43 | ) | | | (0.31 | ) | | | — | | | | — | | | | (0.36 | ) | | | — | | |
Total distributions to shareholders | | | (1.43 | ) | | | (0.31 | ) | | | (0.00 | )(c) | | | — | | | | (0.36 | ) | | | — | | |
Proceeds from regulatory settlements | | | — | | | | — | | | | — | | | | — | | | | 0.00 | (c) | | | — | | |
Net asset value, end of period | | $ | 15.17 | | | $ | 24.10 | | | $ | 20.35 | | | $ | 19.44 | | | $ | 20.29 | | | $ | 24.96 | | |
Total return | | | (31.65 | %) | | | 20.13 | % | | | 4.70 | % | | | (4.19 | %) | | | (17.24 | %) | | | 0.77 | % | |
Ratios to average net assets(d) | |
Total gross expenses | | | 2.07 | % | | | 2.05 | % | | | 2.06 | %(e) | | | 2.09 | %(f) | | | 2.01 | %(e) | | | 2.20 | %(e)(f) | |
Total net expenses(g) | | | 2.07 | %(h) | | | 2.05 | %(h) | | | 2.06 | %(e)(h) | | | 2.09 | %(f)(h) | | | 2.01 | %(e)(h) | | | 2.20 | %(e)(f)(h) | |
Net investment income (loss) | | | 0.65 | % | | | 0.35 | % | | | 0.40 | % | | | (0.00 | )(c)(f) | | | (0.54 | %) | | | (2.14 | %)(f) | |
Supplemental data | |
Net assets, end of period (in thousands) | | $ | 986 | | | $ | 2,346 | | | $ | 3,013 | | | $ | 3,913 | | | $ | 5,837 | | | $ | 58 | | |
Portfolio turnover | | | 51 | % | | | 34 | % | | | 73 | % | | | 14 | % | | | 167 | % | | | 551 | % | |
Notes to Financial Highlights
(a) For the period from April 1, 2012 to August 31, 2012. During the period, the Fund's fiscal year end was changed from March 31 to August 31.
(b) Based on operations from March 7, 2011 (commencement of operations) through the stated period end.
(c) Rounds to zero.
(d) In addition to the fees and expenses that the Fund bears directly, the Fund indirectly bears a pro rata share of the fees and expenses of any other funds in which it invests. Such indirect expenses are not included in the Fund's reported expense ratios.
(e) Ratios include line of credit interest expense which is less than 0.01%.
(f) Annualized.
(g) Total net expenses include the impact of certain fee waivers/expense reimbursements made by the Investment Manager and certain of its affiliates, if applicable.
(h) The benefits derived from expense reductions had an impact of less than 0.01%.
The accompanying Notes to Financial Statements are an integral part of this statement.
Annual Report 2015
20
COLUMBIA GLOBAL ENERGY AND NATURAL RESOURCES FUND
FINANCIAL HIGHLIGHTS (continued)
| | | Year Ended August 31, | | Year Ended
March 31, | |
Class C | | 2015 | | 2014 | | 2013 | | 2012(a) | | 2012 | | 2011 | |
Per share data | |
Net asset value, beginning of period | | $ | 24.10 | | | $ | 20.36 | | | $ | 19.44 | | | $ | 20.30 | | | $ | 24.96 | | | $ | 19.78 | | |
Income from investment operations: | |
Net investment income (loss) | | | 0.14 | | | | 0.08 | | | | 0.08 | | | | 0.00 | (b) | | | (0.12 | ) | | | (0.17 | ) | |
Net realized and unrealized gain (loss) | | | (7.64 | ) | | | 3.97 | | | | 0.84 | | | | (0.86 | ) | | | (4.18 | ) | | | 5.35 | | |
Total from investment operations | | | (7.50 | ) | | | 4.05 | | | | 0.92 | | | | (0.86 | ) | | | (4.30 | ) | | | 5.18 | | |
Less distributions to shareholders: | |
Net investment income | | | — | | | | — | | | | (0.00 | )(b) | | | — | | | | — | | | | — | | |
Net realized gains | | | (1.43 | ) | | | (0.31 | ) | | | — | | | | — | | | | (0.36 | ) | | | — | | |
Total distributions to shareholders | | | (1.43 | ) | | | (0.31 | ) | | | (0.00 | )(b) | | | — | | | | (0.36 | ) | | | — | | |
Proceeds from regulatory settlements | | | — | | | | — | | | | — | | | | — | | | | 0.00 | (b) | | | — | | |
Net asset value, end of period | | $ | 15.17 | | | $ | 24.10 | | | $ | 20.36 | | | $ | 19.44 | | | $ | 20.30 | | | $ | 24.96 | | |
Total return | | | (31.66 | %) | | | 20.07 | % | | | 4.75 | % | | | (4.24 | %) | | | (17.20 | %) | | | 26.19 | % | |
Ratios to average net assets(c) | |
Total gross expenses | | | 2.07 | % | | | 2.05 | % | | | 2.06 | %(d) | | | 2.09 | %(e) | | | 2.02 | %(d) | | | 2.01 | %(d) | |
Total net expenses(f) | | | 2.07 | %(g) | | | 2.05 | %(g) | | | 2.06 | %(d)(g) | | | 2.09 | %(e)(g) | | | 2.02 | %(d)(g) | | | 2.01 | %(d)(g) | |
Net investment income (loss) | | | 0.77 | % | | | 0.38 | % | | | 0.41 | % | | | 0.04 | %(e) | | | (0.55 | %) | | | (0.83 | %) | |
Supplemental data | |
Net assets, end of period (in thousands) | | $ | 14,428 | | | $ | 16,745 | | | $ | 15,340 | | | $ | 18,661 | | | $ | 22,785 | | | $ | 25,494 | | |
Portfolio turnover | | | 51 | % | | | 34 | % | | | 73 | % | | | 14 | % | | | 167 | % | | | 551 | % | |
Notes to Financial Highlights
(a) For the period from April 1, 2012 to August 31, 2012. During the period, the Fund's fiscal year end was changed from March 31 to August 31.
(b) Rounds to zero.
(c) In addition to the fees and expenses that the Fund bears directly, the Fund indirectly bears a pro rata share of the fees and expenses of any other funds in which it invests. Such indirect expenses are not included in the Fund's reported expense ratios.
(d) Ratios include line of credit interest expense which is less than 0.01%.
(e) Annualized.
(f) Total net expenses include the impact of certain fee waivers/expense reimbursements made by the Investment Manager and certain of its affiliates, if applicable.
(g) The benefits derived from expense reductions had an impact of less than 0.01%.
The accompanying Notes to Financial Statements are an integral part of this statement.
Annual Report 2015
21
COLUMBIA GLOBAL ENERGY AND NATURAL RESOURCES FUND
FINANCIAL HIGHLIGHTS (continued)
| | | Year Ended August 31, | | Year Ended
March 31, | |
Class I | | 2015 | | 2014 | | 2013 | | 2012(a) | | 2012 | | 2011(b) | |
Per share data | |
Net asset value, beginning of period | | $ | 25.18 | | | $ | 21.24 | | | $ | 20.15 | | | $ | 21.02 | | | $ | 25.70 | | | $ | 18.82 | | |
Income from investment operations: | |
Net investment income | | | 0.39 | | | | 0.36 | | | | 0.35 | | | | 0.10 | | | | 0.11 | | | | 0.05 | | |
Net realized and unrealized gain (loss) | | | (8.03 | ) | | | 4.14 | | | | 0.87 | | | | (0.89 | ) | | | (4.30 | ) | | | 6.86 | | |
Total from investment operations | | | (7.64 | ) | | | 4.50 | | | | 1.22 | | | | (0.79 | ) | | | (4.19 | ) | | | 6.91 | | |
Less distributions to shareholders: | |
Net investment income | | | — | | | | (0.25 | ) | | | (0.13 | ) | | | (0.08 | ) | | | (0.13 | ) | | | (0.03 | ) | |
Net realized gains | | | (1.43 | ) | | | (0.31 | ) | | | — | | | | — | | | | (0.36 | ) | | | — | | |
Total distributions to shareholders | | | (1.43 | ) | | | (0.56 | ) | | | (0.13 | ) | | | (0.08 | ) | | | (0.49 | ) | | | (0.03 | ) | |
Proceeds from regulatory settlements | | | — | | | | — | | | | — | | | | — | | | | 0.00 | (c) | | | — | | |
Net asset value, end of period | | $ | 16.11 | | | $ | 25.18 | | | $ | 21.24 | | | $ | 20.15 | | | $ | 21.02 | | | $ | 25.70 | | |
Total return | | | (30.81 | %) | | | 21.57 | % | | | 6.06 | % | | | (3.72 | %) | | | (16.23 | %) | | | 36.74 | % | |
Ratios to average net assets(d) | |
Total gross expenses | | | 0.84 | % | | | 0.82 | % | | | 0.83 | %(e) | | | 0.86 | %(f) | | | 0.80 | %(e) | | | 0.85 | %(e)(f) | |
Total net expenses(g) | | | 0.84 | % | | | 0.82 | % | | | 0.83 | %(e) | | | 0.86 | %(f) | | | 0.80 | %(e)(h) | | | 0.85 | %(e)(f)(h) | |
Net investment income | | | 1.99 | % | | | 1.56 | % | | | 1.70 | % | | | 1.29 | %(f) | | | 0.49 | % | | | 0.38 | %(f) | |
Supplemental data | |
Net assets, end of period (in thousands) | | $ | 35,650 | | | $ | 41,700 | | | $ | 44,595 | | | $ | 28,803 | | | $ | 29,761 | | | $ | 115,953 | | |
Portfolio turnover | | | 51 | % | | | 34 | % | | | 73 | % | | | 14 | % | | | 167 | % | | | 551 | % | |
Notes to Financial Highlights
(a) For the period from April 1, 2012 to August 31, 2012. During the period, the Fund's fiscal year end was changed from March 31 to August 31.
(b) Based on operations from September 27, 2010 (commencement of operations) through the stated period end.
(c) Rounds to zero.
(d) In addition to the fees and expenses that the Fund bears directly, the Fund indirectly bears a pro rata share of the fees and expenses of any other funds in which it invests. Such indirect expenses are not included in the Fund's reported expense ratios.
(e) Ratios include line of credit interest expense which is less than 0.01%.
(f) Annualized.
(g) Total net expenses include the impact of certain fee waivers/expense reimbursements made by the Investment Manager and certain of its affiliates, if applicable.
(h) The benefits derived from expense reductions had an impact of less than 0.01%.
The accompanying Notes to Financial Statements are an integral part of this statement.
Annual Report 2015
22
COLUMBIA GLOBAL ENERGY AND NATURAL RESOURCES FUND
FINANCIAL HIGHLIGHTS (continued)
| | | Year Ended August 31, | | Year Ended
March 31, | |
Class K | | 2015 | | 2014 | | 2013 | | 2012(a) | | 2012 | | 2011(b) | |
Per share data | |
Net asset value, beginning of period | | $ | 25.11 | | | $ | 21.18 | | | $ | 20.13 | | | $ | 20.99 | | | $ | 25.67 | | | $ | 25.48 | | |
Income from investment operations: | |
Net investment income (loss) | | | 0.26 | | | | 0.30 | | | | 0.28 | | | | 0.07 | | | | 0.09 | | | | (0.01 | ) | |
Net realized and unrealized gain (loss) | | | (7.93 | ) | | | 4.12 | | | | 0.87 | | | | (0.88 | ) | | | (4.33 | ) | | | 0.22 | | |
Total from investment operations | | | (7.67 | ) | | | 4.42 | | | | 1.15 | | | | (0.81 | ) | | | (4.24 | ) | | | 0.21 | | |
Less distributions to shareholders: | |
Net investment income | | | — | | | | (0.18 | ) | | | (0.10 | ) | | | (0.05 | ) | | | (0.08 | ) | | | (0.02 | ) | |
Net realized gains | | | (1.43 | ) | | | (0.31 | ) | | | — | | | | — | | | | (0.36 | ) | | | — | | |
Total distributions to shareholders | | | (1.43 | ) | | | (0.49 | ) | | | (0.10 | ) | | | (0.05 | ) | | | (0.44 | ) | | | (0.02 | ) | |
Proceeds from regulatory settlements | | | — | | | | — | | | | — | | | | — | | | | 0.00 | (c) | | | — | | |
Net asset value, end of period | | $ | 16.01 | | | $ | 25.11 | | | $ | 21.18 | | | $ | 20.13 | | | $ | 20.99 | | | $ | 25.67 | | |
Total return | | | (31.03 | %) | | | 21.21 | % | | | 5.71 | % | | | (3.85 | %) | | | (16.45 | %) | | | 0.82 | % | |
Ratios to average net assets(d) | |
Total gross expenses | | | 1.13 | % | | | 1.12 | % | | | 1.13 | %(e) | | | 1.16 | %(f) | | | 1.11 | %(e) | | | 1.26 | %(e)(f) | |
Total net expenses(g) | | | 1.13 | % | | | 1.12 | % | | | 1.13 | %(e) | | | 1.16 | %(f) | | | 1.11 | %(e)(h) | | | 1.26 | %(e)(f)(h) | |
Net investment income (loss) | | | 1.18 | % | | | 1.31 | % | | | 1.35 | % | | | 0.90 | %(f) | | | 0.43 | % | | | (0.57 | %)(f) | |
Supplemental data | |
Net assets, end of period (in thousands) | | $ | 5 | | | $ | 79 | | | $ | 69 | | | $ | 77 | | | $ | 109 | | | $ | 3 | | |
Portfolio turnover | | | 51 | % | | | 34 | % | | | 73 | % | | | 14 | % | | | 167 | % | | | 551 | % | |
Notes to Financial Highlights
(a) For the period from April 1, 2012 to August 31, 2012. During the period, the Fund's fiscal year end was changed from March 31 to August 31.
(b) Based on operations from March 7, 2011 (commencement of operations) through the stated period end.
(c) Rounds to zero.
(d) In addition to the fees and expenses that the Fund bears directly, the Fund indirectly bears a pro rata share of the fees and expenses of any other funds in which it invests. Such indirect expenses are not included in the Fund's reported expense ratios.
(e) Ratios include line of credit interest expense which is less than 0.01%.
(f) Annualized.
(g) Total net expenses include the impact of certain fee waivers/expense reimbursements made by the Investment Manager and certain of its affiliates, if applicable.
(h) The benefits derived from expense reductions had an impact of less than 0.01%.
The accompanying Notes to Financial Statements are an integral part of this statement.
Annual Report 2015
23
COLUMBIA GLOBAL ENERGY AND NATURAL RESOURCES FUND
FINANCIAL HIGHLIGHTS (continued)
| | | Year Ended August 31, | | Year Ended
March 31, | |
Class R | | 2015 | | 2014 | | 2013 | | 2012(a) | | 2012 | | 2011(b) | |
Per share data | |
Net asset value, beginning of period | | $ | 24.94 | | | $ | 21.03 | | | $ | 20.03 | | | $ | 20.88 | | | $ | 25.56 | | | $ | 18.76 | | |
Income from investment operations: | |
Net investment income (loss) | | | 0.25 | | | | 0.21 | | | | 0.21 | | | | 0.05 | | | | 0.02 | | | | (0.02 | ) | |
Net realized and unrealized gain (loss) | | | (7.93 | ) | | | 4.10 | | | | 0.84 | | | | (0.89 | ) | | | (4.33 | ) | | | 6.82 | | |
Total from investment operations | | | (7.68 | ) | | | 4.31 | | | | 1.05 | | | | (0.84 | ) | | | (4.31 | ) | | | 6.80 | | |
Less distributions to shareholders: | |
Net investment income | | | — | | | | (0.09 | ) | | | (0.05 | ) | | | (0.01 | ) | | | (0.01 | ) | | | — | | |
Net realized gains | | | (1.43 | ) | | | (0.31 | ) | | | — | | | | — | | | | (0.36 | ) | | | — | | |
Total distributions to shareholders | | | (1.43 | ) | | | (0.40 | ) | | | (0.05 | ) | | | (0.01 | ) | | | (0.37 | ) | | | — | | |
Proceeds from regulatory settlements | | | — | | | | — | | | | — | | | | — | | | | 0.00 | (c) | | | — | | |
Net asset value, end of period | | $ | 15.83 | | | $ | 24.94 | | | $ | 21.03 | | | $ | 20.03 | | | $ | 20.88 | | | $ | 25.56 | | |
Total return | | | (31.29 | %) | | | 20.73 | % | | | 5.27 | % | | | (4.04 | %) | | | (16.80 | %) | | | 36.25 | % | |
Ratios to average net assets(d) | |
Total gross expenses | | | 1.57 | % | | | 1.55 | % | | | 1.57 | %(e) | | | 1.59 | %(f) | | | 1.55 | %(e) | | | 1.60 | %(e)(f) | |
Total net expenses(g) | | | 1.57 | %(h) | | | 1.55 | %(h) | | | 1.57 | %(e)(h) | | | 1.59 | %(f)(h) | | | 1.55 | %(e)(h) | | | 1.60 | %(e)(f)(h) | |
Net investment income (loss) | | | 1.30 | % | | | 0.90 | % | | | 1.01 | % | | | 0.61 | %(f) | | | 0.11 | % | | | (0.13 | %)(f) | |
Supplemental data | |
Net assets, end of period (in thousands) | | $ | 3,045 | | | $ | 3,131 | | | $ | 1,664 | | | $ | 1,226 | | | $ | 880 | | | $ | 55 | | |
Portfolio turnover | | | 51 | % | | | 34 | % | | | 73 | % | | | 14 | % | | | 167 | % | | | 551 | % | |
Notes to Financial Highlights
(a) For the period from April 1, 2012 to August 31, 2012. During the period, the Fund's fiscal year end was changed from March 31 to August 31.
(b) Based on operations from September 27, 2010 (commencement of operations) through the stated period end.
(c) Rounds to zero.
(d) In addition to the fees and expenses that the Fund bears directly, the Fund indirectly bears a pro rata share of the fees and expenses of any other funds in which it invests. Such indirect expenses are not included in the Fund's reported expense ratios.
(e) Ratios include line of credit interest expense which is less than 0.01%.
(f) Annualized.
(g) Total net expenses include the impact of certain fee waivers/expense reimbursements made by the Investment Manager and certain of its affiliates, if applicable.
(h) The benefits derived from expense reductions had an impact of less than 0.01%.
The accompanying Notes to Financial Statements are an integral part of this statement.
Annual Report 2015
24
COLUMBIA GLOBAL ENERGY AND NATURAL RESOURCES FUND
FINANCIAL HIGHLIGHTS (continued)
| | | Year Ended August 31, | |
Class R4 | | 2015 | | 2014 | | 2013(a) | |
Per share data | |
Net asset value, beginning of period | | $ | 25.52 | | | $ | 21.51 | | | $ | 20.25 | | |
Income from investment operations: | |
Net investment income | | | 0.34 | | | | 0.35 | | | | 0.35 | | |
Net realized and unrealized gain (loss) | | | (8.13 | ) | | | 4.17 | | | | 0.96 | | |
Total from investment operations | | | (7.79 | ) | | | 4.52 | | | | 1.31 | | |
Less distributions to shareholders: | |
Net investment income | | | — | | | | (0.20 | ) | | | (0.05 | ) | |
Net realized gains | | | (1.43 | ) | | | (0.31 | ) | | | — | | |
Total distributions to shareholders | | | (1.43 | ) | | | (0.51 | ) | | | (0.05 | ) | |
Net asset value, end of period | | $ | 16.30 | | | $ | 25.52 | | | $ | 21.51 | | |
Total return | | | (31.00 | %) | | | 21.32 | % | | | 6.50 | % | |
Ratios to average net assets(b) | |
Total gross expenses | | | 1.07 | % | | | 1.05 | % | | | 1.06 | %(c) | |
Total net expenses(d) | | | 1.07 | %(e) | | | 1.05 | %(e) | | | 1.06 | %(c)(e) | |
Net investment income | | | 1.69 | % | | | 1.49 | % | | | 2.05 | %(c) | |
Supplemental data | |
Net assets, end of period (in thousands) | | $ | 7,191 | | | $ | 12,899 | | | $ | 1,575 | | |
Portfolio turnover | | | 51 | % | | | 34 | % | | | 73 | % | |
Notes to Financial Highlights
(a) Based on operations from November 8, 2012 (commencement of operations) through the stated period end.
(b) In addition to the fees and expenses that the Fund bears directly, the Fund indirectly bears a pro rata share of the fees and expenses of any other funds in which it invests. Such indirect expenses are not included in the Fund's reported expense ratios.
(c) Annualized.
(d) Total net expenses include the impact of certain fee waivers/expense reimbursements made by the Investment Manager and certain of its affiliates, if applicable.
(e) The benefits derived from expense reductions had an impact of less than 0.01%.
The accompanying Notes to Financial Statements are an integral part of this statement.
Annual Report 2015
25
COLUMBIA GLOBAL ENERGY AND NATURAL RESOURCES FUND
FINANCIAL HIGHLIGHTS (continued)
| | | Year Ended August 31, | |
Class R5 | | 2015 | | 2014 | | 2013(a) | |
Per share data | |
Net asset value, beginning of period | | $ | 25.54 | | | $ | 21.53 | | | $ | 20.25 | | |
Income from investment operations: | |
Net investment income | | | 0.39 | | | | 0.37 | | | | 0.34 | | |
Net realized and unrealized gain (loss) | | | (8.15 | ) | | | 4.19 | | | | 1.00 | | |
Total from investment operations | | | (7.76 | ) | | | 4.56 | | | | 1.34 | | |
Less distributions to shareholders: | |
Net investment income | | | — | | | | (0.24 | ) | | | (0.06 | ) | |
Net realized gains | | | (1.43 | ) | | | (0.31 | ) | | | — | | |
Total distributions to shareholders | | | (1.43 | ) | | | (0.55 | ) | | | (0.06 | ) | |
Net asset value, end of period | | $ | 16.35 | | | $ | 25.54 | | | $ | 21.53 | | |
Total return | | | (30.85 | %) | | | 21.53 | % | | | 6.63 | % | |
Ratios to average net assets(b) | |
Total gross expenses | | | 0.89 | % | | | 0.87 | % | | | 0.88 | %(c) | |
Total net expenses(d) | | | 0.89 | % | | | 0.87 | % | | | 0.88 | %(c) | |
Net investment income | | | 1.97 | % | | | 1.58 | % | | | 2.02 | %(c) | |
Supplemental data | |
Net assets, end of period (in thousands) | | $ | 4,978 | | | $ | 4,578 | | | $ | 1,058 | | |
Portfolio turnover | | | 51 | % | | | 34 | % | | | 73 | % | |
Notes to Financial Highlights
(a) Based on operations from November 8, 2012 (commencement of operations) through the stated period end.
(b) In addition to the fees and expenses that the Fund bears directly, the Fund indirectly bears a pro rata share of the fees and expenses of any other funds in which it invests. Such indirect expenses are not included in the Fund's reported expense ratios.
(c) Annualized.
(d) Total net expenses include the impact of certain fee waivers/expense reimbursements made by the Investment Manager and certain of its affiliates, if applicable.
The accompanying Notes to Financial Statements are an integral part of this statement.
Annual Report 2015
26
COLUMBIA GLOBAL ENERGY AND NATURAL RESOURCES FUND
FINANCIAL HIGHLIGHTS (continued)
| | | Year Ended August 31, | | Year Ended
March 31, | |
Class Z | | 2015 | | 2014 | | 2013 | | 2012(a) | | 2012 | | 2011 | |
Per share data | |
Net asset value, beginning of period | | $ | 25.12 | | | $ | 21.19 | | | $ | 20.13 | | | $ | 21.00 | | | $ | 25.67 | | | $ | 20.17 | | |
Income from investment operations: | |
Net investment income | | | 0.33 | | | | 0.32 | | | | 0.28 | | | | 0.08 | | | | 0.09 | | | | 0.03 | | |
Net realized and unrealized gain (loss) | | | (7.99 | ) | | | 4.12 | | | | 0.88 | | | | (0.89 | ) | | | (4.31 | ) | | | 5.51 | | |
Total from investment operations | | | (7.66 | ) | | | 4.44 | | | | 1.16 | | | | (0.81 | ) | | | (4.22 | ) | | | 5.54 | | |
Less distributions to shareholders: | |
Net investment income | | | — | | | | (0.20 | ) | | | (0.10 | ) | | | (0.06 | ) | | | (0.09 | ) | | | (0.04 | ) | |
Net realized gains | | | (1.43 | ) | | | (0.31 | ) | | | — | | | | — | | | | (0.36 | ) | | | — | | |
Total distributions to shareholders | | | (1.43 | ) | | | (0.51 | ) | | | (0.10 | ) | | | (0.06 | ) | | | (0.45 | ) | | | (0.04 | ) | |
Proceeds from regulatory settlements | | | — | | | | — | | | | — | | | | — | | | | 0.00 | (b) | | | — | | |
Net asset value, end of period | | $ | 16.03 | | | $ | 25.12 | | | $ | 21.19 | | | $ | 20.13 | | | $ | 21.00 | | | $ | 25.67 | | |
Total return | | | (30.97 | %) | | | 21.29 | % | | | 5.80 | % | | | (3.84 | %) | | | (16.37 | %) | | | 27.47 | % | |
Ratios to average net assets(c) | |
Total gross expenses | | | 1.07 | % | | | 1.05 | % | | | 1.07 | %(d) | | | 1.09 | %(e) | | | 1.01 | %(d) | | | 1.01 | %(d) | |
Total net expenses(f) | | | 1.07 | %(g) | | | 1.05 | %(g) | | | 1.07 | %(d)(g) | | | 1.09 | %(e)(g) | | | 1.01 | %(d)(g) | | | 1.01 | %(d)(g) | |
Net investment income | | | 1.68 | % | | | 1.36 | % | | | 1.35 | % | | | 1.03 | %(e) | | | 0.42 | % | | | 0.17 | % | |
Supplemental data | |
Net assets, end of period (in thousands) | | $ | 98,857 | | | $ | 174,759 | | | $ | 186,303 | | | $ | 310,620 | | | $ | 390,028 | | | $ | 704,685 | | |
Portfolio turnover | | | 51 | % | | | 34 | % | | | 73 | % | | | 14 | % | | | 167 | % | | | 551 | % | |
Notes to Financial Highlights
(a) For the period from April 1, 2012 to August 31, 2012. During the period, the Fund's fiscal year end was changed from March 31 to August 31.
(b) Rounds to zero.
(c) In addition to the fees and expenses that the Fund bears directly, the Fund indirectly bears a pro rata share of the fees and expenses of any other funds in which it invests. Such indirect expenses are not included in the Fund's reported expense ratios.
(d) Ratios include line of credit interest expense which is less than 0.01%.
(e) Annualized.
(f) Total net expenses include the impact of certain fee waivers/expense reimbursements made by the Investment Manager and certain of its affiliates, if applicable.
(g) The benefits derived from expense reductions had an impact of less than 0.01%.
The accompanying Notes to Financial Statements are an integral part of this statement.
Annual Report 2015
27
COLUMBIA GLOBAL ENERGY AND NATURAL RESOURCES FUND
NOTES TO FINANCIAL STATEMENTS
August 31, 2015
Note 1. Organization
Columbia Global Energy and Natural Resources Fund (the Fund), a series of Columbia Funds Series Trust I (the Trust), is a non-diversified fund. The Trust is registered under the Investment Company Act of 1940, as amended (the 1940 Act), as an open-end management investment company organized as a Massachusetts business trust.
Fund Shares
The Trust may issue an unlimited number of shares (without par value). The Fund offers Class A, Class B, Class C, Class I, Class K, Class R, Class R4, Class R5 and Class Z shares. Although all share classes generally have identical voting, dividend and liquidation rights, each share class votes separately when required by the Trust's organizational documents or by law. Different share classes pay different distribution amounts to the extent the expenses of such share classes differ, and distributions in liquidation will be proportional to the net asset value of each share class. Each share class has its own expense and sales charge structure.
Class A shares are subject to a maximum front-end sales charge of 5.75% based on the initial investment amount. Class A shares purchased without an initial sales charge in accounts aggregating $1 million to $50 million at the time of purchase are subject to a contingent deferred sales charge (CDSC) if the shares are sold within 18 months after purchase, charged as follows: 1.00% CDSC if redeemed within 12 months after purchase, and 0.50% CDSC if redeemed more than 12, but less than 18, months after purchase.
Class B shares may be subject to a maximum CDSC of 5.00% based upon the holding period after purchase. Class B shares will generally convert to Class A shares eight years after purchase. The Fund no longer accepts investments by new or existing investors in the Fund's Class B shares, except in connection with the reinvestment of any dividend and/or capital gain distributions in Class B shares of the Fund and exchanges by existing Class B shareholders of certain other funds within the Columbia Family of Funds.
Class C shares are subject to a 1.00% CDSC on shares redeemed within one year after purchase.
Class I shares are not subject to sales charges and are available only to the Columbia Family of Funds.
Class K shares are not subject to sales charges, however this share class is closed to new investors.
Class R shares are not subject to sales charges and are generally available only to certain retirement plans and other investors as described in the Fund's prospectus.
Class R4 shares are not subject to sales charges and are generally available only to omnibus retirement plans and certain investors as described in the Fund's prospectus.
Class R5 shares are not subject to sales charges and are generally available only to investors purchasing through authorized investment professionals and omnibus retirement plans.
Class Z shares are not subject to sales charges and are available only to eligible investors, which are subject to different investment minimums as described in the Fund's prospectus.
Note 2. Summary of Significant Accounting Policies
Basis of Preparation
The Fund is an investment company that applies the accounting and reporting guidance in the Financial Accounting Standards Board (FASB) Accounting Standards Codification Topic 946, Financial Services — Investment Companies (ASC 946). The financial statements are prepared in accordance with U.S. generally accepted accounting principles (GAAP), which requires management to make certain estimates and assumptions that affect the reported amounts of assets and liabilities, the disclosure of contingent assets and liabilities at the date of the financial statements and the reported amounts of income and expenses during the reporting period. Actual results could differ from those estimates.
The following is a summary of significant accounting policies followed by the Fund in the preparation of its financial statements.
Security Valuation
All equity securities and exchange-traded funds are valued at the close of business of the New York Stock Exchange (NYSE). Equity securities and exchange-traded funds are valued at the last quoted sales price on the principal exchange or market on which they trade, except for securities traded on the NASDAQ Stock Market, which are valued at the NASDAQ official close price. Unlisted securities or listed securities for which there were no sales during the day are valued at the mean of the latest quoted bid and ask prices on such exchanges or markets.
Foreign equity securities are valued based on the closing price on the foreign exchange in which such securities are primarily traded. If any foreign equity security closing prices are not readily available, the securities are valued at the mean of the latest quoted bid and ask prices on such exchanges or markets. Foreign currency exchange
Annual Report 2015
28
COLUMBIA GLOBAL ENERGY AND NATURAL RESOURCES FUND
NOTES TO FINANCIAL STATEMENTS (continued)
August 31, 2015
rates are generally determined at 4:00 p.m. Eastern (U.S.) time. Many securities markets and exchanges outside the U.S. close prior to the close of the NYSE; therefore, the closing prices for securities in such markets or on such exchanges may not fully reflect events that occur after such close but before the close of the NYSE. In those situations, foreign securities will be fair valued pursuant to a policy adopted by the Board of Trustees (the Board), including, if available, utilizing a third party pricing service to determine these fair values. The third party pricing service takes into account multiple factors, including, but not limited to, movements in the U.S. securities markets, certain depositary receipts, futures contracts and foreign exchange rates that have occurred subsequent to the close of the foreign exchange or market, to determine a good faith estimate that reasonably reflects the current market conditions as of the close of the NYSE. The fair value of a security is likely to be different from the quoted or published price, if available.
Investments in open-end investment companies, including money market funds, are valued at their latest net asset value.
Forward foreign currency exchange contracts are marked-to-market based upon foreign currency exchange rates provided by a pricing service.
Option contracts are valued at the mean of the latest quoted bid and ask prices on their primary exchanges. Option contracts, including over-the-counter option contracts, with no readily available market quotations are valued using quotes obtained from independent brokers as of the close of the NYSE.
Investments for which market quotations are not readily available, or that have quotations which management believes are not reflective of market value or reliable, are valued at fair value as determined in good faith under procedures approved by and under the general supervision of the Board. If a security or class of securities (such as foreign securities) is valued at fair value, such value is likely to be different from the quoted or published price for the security.
The determination of fair value often requires significant judgment. To determine fair value, management may use assumptions including but not limited to future cash flows and estimated risk premiums. Multiple inputs from various sources may be used to determine fair value.
GAAP requires disclosure regarding the inputs and valuation techniques used to measure fair value and any
changes in valuation inputs or techniques. In addition, investments shall be disclosed by major category. This information is disclosed following the Fund's Portfolio of Investments.
Foreign Currency Transactions and Translations
The values of all assets and liabilities denominated in foreign currencies are generally translated into U.S. dollars at exchange rates determined at the close of the NYSE. Net realized and unrealized gains (losses) on foreign currency transactions and translations include gains (losses) arising from the fluctuation in exchange rates between trade and settlement dates on securities transactions, gains (losses) arising from the disposition of foreign currency and currency gains (losses) between the accrual and payment dates on dividends, interest income and foreign withholding taxes.
For financial statement purposes, the Fund does not distinguish that portion of gains (losses) on investments which is due to changes in foreign exchange rates from that which is due to changes in market prices of the investments. Such fluctuations are included with the net realized and unrealized gains (losses) on investments in the Statement of Operations.
Derivative Instruments
The Fund invests in certain derivative instruments, as detailed below, to meet its investment objectives. Derivatives are instruments whose values depend on, or are derived from, in whole or in part, the value of one or more securities, currencies, commodities, indices, or other assets or instruments. Derivatives may be used to increase investment flexibility (including to maintain cash reserves while maintaining desired exposure to certain assets), for risk management (hedging) purposes, to facilitate trading, to reduce transaction costs and to pursue higher investment returns. The Fund may also use derivative instruments to mitigate certain investment risks, such as foreign currency exchange rate risk, interest rate risk and credit risk. Derivatives may involve various risks, including the potential inability of the counterparty to fulfill its obligation under the terms of the contract, the potential for an illiquid secondary market (making it difficult for the Fund to sell, including at favorable prices) and the potential for market movements which may expose the Fund to gains or losses in excess of the amount shown in the Statement of Assets and Liabilities. The notional amounts of derivative instruments, if applicable, are not recorded in the financial statements.
Annual Report 2015
29
COLUMBIA GLOBAL ENERGY AND NATURAL RESOURCES FUND
NOTES TO FINANCIAL STATEMENTS (continued)
August 31, 2015
A derivative instrument may suffer a marked-to-market loss if the value of the contract decreases due to an unfavorable change in the market rates or values of the underlying instrument. Losses can also occur if the counterparty does not perform under the contract. The Fund's risk of loss from counterparty credit risk on over-the-counter derivatives is generally limited to the aggregate unrealized gain netted against any collateral held by the Fund and the amount of any variation margin held by the counterparty. With exchange-traded or centrally cleared derivatives, there is reduced counterparty credit risk to the Fund since the exchange's clearinghouse, as counterparty to such instruments, guarantees against a possible default. The clearinghouse stands between the buyer and the seller of the contract; therefore, the counterparty credit risk is failure of the clearinghouse. However, credit risk still exists in exchange-traded or centrally cleared derivatives with respect to initial and variation margin that is held in a broker's customer account. While brokers are required to segregate customer margin from their own assets, in the event that a broker becomes insolvent or goes into bankruptcy and at that time there is a shortfall in the aggregate amount of margin held by the broker for all its clients, U.S. bankruptcy laws will typically allocate that shortfall on a pro-rata basis across all the broker's customers (including the Fund), potentially resulting in losses to the Fund.
In order to better define its contractual rights and to secure rights that will help the Fund mitigate its counterparty risk, the Fund may enter into an International Swaps and Derivatives Association, Inc. Master Agreement (ISDA Master Agreement) or similar agreement with its derivatives contract counterparties. An ISDA Master Agreement is an agreement between the Fund and a counterparty that governs over-the-counter derivatives and forward foreign currency exchange contracts and typically contains, among other things, collateral posting terms and netting provisions in the event of a default and/or termination event. Under an ISDA Master Agreement, the Fund may, under certain circumstances, offset with the counterparty certain derivative instrument's payables and/or receivables with collateral held and/or posted and create one single net payment. The provisions of the ISDA Master Agreement typically permit a single net payment in the event of default (close-out netting) including the bankruptcy or insolvency of the counterparty. Note, however, that bankruptcy or insolvency laws of a particular jurisdiction may impose restrictions on or prohibitions against the right of offset in bankruptcy, insolvency or other events.
Collateral (margin) requirements differ by type of derivative. Margin requirements are established by the exchange or clearinghouse for exchange-traded and centrally cleared derivatives. Brokers can ask for margin in excess of the minimum in certain circumstances. Collateral terms are contract specific for over-the-counter derivatives. For over-the-counter derivatives traded under an ISDA Master Agreement, the collateral requirements are typically calculated by netting the marked-to-market amount for each transaction under such agreement and comparing that amount to the value of any variation margin currently pledged by the Fund and/or the counterparty. Generally, the amount of collateral due from or to a party has to exceed a minimum transfer amount threshold (e.g., $500,000) before a transfer has to be made. To the extent amounts due to the Fund from its counterparties are not fully collateralized, contractually or otherwise, the Fund bears the risk of loss from counterparty nonperformance. The Fund attempts to mitigate counterparty risk by only entering into agreements with counterparties that it believes have the financial resources to honor their obligations and by monitoring the financial stability of those counterparties.
Certain ISDA Master Agreements allow counterparties to over-the-counter derivatives transactions to terminate derivatives contracts prior to maturity in the event the Fund's net asset value declines by a stated percentage over a specified time period or if the Fund fails to meet certain terms of the ISDA Master Agreement, which would cause the Fund to accelerate payment of any net liability owed to the counterparty. The Fund also has termination rights if the counterparty fails to meet certain terms of the ISDA Master Agreement. In addition to considering counterparty credit risk, the Fund would consider terminating the derivatives contracts based on whether termination would result in a net liability owed from the counterparty.
For financial reporting purposes, the Fund does not offset derivative assets and derivative liabilities that are subject to netting arrangements in the Statement of Assets and Liabilities.
Forward Foreign Currency Exchange Contracts
Forward foreign currency exchange contracts are over-the-counter agreements between two parties to buy and sell a currency at a set price on a future date. The Fund utilized forward foreign currency exchange contracts to hedge the currency exposure associated with some or all of the Fund's securities, to shift foreign currency exposure back to U.S. dollars, to shift investment
Annual Report 2015
30
COLUMBIA GLOBAL ENERGY AND NATURAL RESOURCES FUND
NOTES TO FINANCIAL STATEMENTS (continued)
August 31, 2015
exposure from one currency to another and to shift U.S. dollar exposure to achieve a representative weighted mix of major currencies in its benchmark and/or to recover an underweight country exposure in its portfolio. These instruments may be used for other purposes in future periods.
The values of forward foreign currency exchange contracts fluctuate daily with changes in foreign currency exchange rates. Changes in the value of these contracts are recorded as unrealized appreciation or depreciation until the contract is exercised or has expired. The Fund will realize a gain or loss when the forward foreign currency exchange contract is closed or expires.
The use of forward foreign currency exchange contracts does not eliminate fluctuations in the prices of the Fund's portfolio securities. The risks of forward foreign currency exchange contracts include movement in the values of the foreign currencies relative to the U.S. dollar (or other foreign currencies) and the possibility that counterparties will not complete their contractual obligations, which may be in excess of the amount reflected, if any, in the Statement of Assets and Liabilities.
Options Contracts
Options are contracts which entitle the holder to purchase or sell securities or other identified assets at a specified price, or in the case of index option contracts, to receive or pay the difference between the index value and the strike price of the index option contract. Option contracts can be either exchange-traded or over-the-counter. The Fund purchased and wrote option contracts to decrease the Fund's exposure to equity risk and increase return on investments, to protect gains and to facilitate buying and selling of securities for investments. These instruments may be used for other purposes in future periods. Completion of transactions for option contracts traded in the over-the-counter market depends upon the performance of the other party. Cash collateral may be collected or posted by the Fund to secure certain over-the-counter option contract trades. Cash collateral held or posted by the Fund for such option contract trades must be returned to the counterparty or the Fund upon closure, exercise or expiration of the contract.
Options contracts purchased are recorded as investments. When the Fund writes an options contract, the premium received is recorded as an asset and an amount equivalent to the premium is recorded as a liability in the Statement of Assets and Liabilities and is subsequently adjusted to reflect the current fair value of
the option written. Changes in the fair value of the written option are recorded as unrealized appreciation or depreciation until the contract is exercised or has expired. The Fund will realize a gain or loss when the option contract is closed or expires. When option contracts are exercised, the proceeds on sales for a written call or purchased put option contract, or the purchase cost for a written put or purchased call option contract, is adjusted by the amount of premium received or paid.
For over-the-counter options purchased, the Fund bears the risk of loss of the amount of the premiums paid plus the positive change in market values net of any collateral held by the Fund should the counterparty fail to perform under the contracts. Option contracts written by the Fund do not typically give rise to counterparty credit risk, as options written generally obligate the Fund and not the counterparty to perform. The risk in writing a call option contract is that the Fund gives up the opportunity for profit if the market price of the security increases above the strike price and the option contract is exercised. The risk in writing a put option contract is that the Fund may incur a loss if the market price of the security decreases below the strike price and the option contract is exercised. Exercise of a written option could result in the Fund purchasing or selling a security or foreign currency when it otherwise would not, or at a price different from the current market value. In purchasing and writing options, the Fund bears the risk of an unfavorable change in the value of the underlying instrument or the risk that the Fund may not be able to enter into a closing transaction due to an illiquid market.
Contracts and premiums associated with options contracts written for the year ended August 31, 2015 are as follows:
| | | Calls | |
| | | Contracts | | Premiums ($) | |
Balance at August 31, 2014 | | | — | | | | — | | |
Opened | | | 280 | | | | 21,848 | | |
Expired | | | (280 | ) | | | (21,848 | ) | |
Balance at August 31, 2015 | | | — | | | | — | | |
Effects of Derivative Transactions in the Financial Statements
The following tables are intended to provide additional information about the effect of derivatives on the financial statements of the Fund, including: the fair value of derivatives by risk category and the location of those fair values in the Statement of Assets and Liabilities; and the impact of derivative transactions over the period
Annual Report 2015
31
COLUMBIA GLOBAL ENERGY AND NATURAL RESOURCES FUND
NOTES TO FINANCIAL STATEMENTS (continued)
August 31, 2015
in the Statement of Operations, including realized and unrealized gains (losses). The derivative instrument schedules following the Portfolio of Investments present additional information regarding derivative instruments outstanding at the end of the period, if any.
At August 31, 2015, the fund had no outstanding derivatives.
The following table indicates the effect of derivative instruments (not considered to be hedging instruments for accounting disclosure purposes) in the Statement of Operations for the year ended August 31, 2015:
Amount of Realized Gain (Loss) on Derivatives Recognized in Income | |
Risk Exposure
Category | | Forward Foreign
Currency Exchange
Contracts ($) | | Options
Contracts
Written and
Purchased ($) | | Total ($) | |
Equity risk | | | — | | | | 8,005 | | | | 8,005 | | |
Foreign exchange
risk | | (9,180,525) | | — | | (9,180,525) | |
Total | | | (9,180,525 | ) | | | 8,005 | | | | (9,172,520 | ) | |
Change in Unrealized Appreciation (Depreciation) on Derivatives Recognized in Income | |
Risk Exposure
Category | | Forward Foreign
Currency Exchange
Contracts ($) | | Total ($) | |
Foreign exchange risk | | | 566,209 | | | | 566,209 | | |
The following table provides a summary of the average outstanding volume by derivative instrument for the year ended August 31, 2015:
Derivative Instrument | | Average Market
Value ($)* | |
Options contracts — Purchased | | | 4,253 | | |
Options contracts — Written | | | (384 | ) | |
Derivative Instrument | | Average Unrealized
Appreciation ($)** | | Average Unrealized
Depreciation ($)** | |
Forward foreign currency
exchange contracts | | | 47,345 | | | | (523,699 | ) | |
*Based on the ending daily outstanding amounts for the year ended August 31, 2015.
**Based on the ending quarterly outstanding amounts for the year ended August 31, 2015.
Security Transactions
Security transactions are accounted for on the trade date. Cost is determined and gains (losses) are based upon the specific identification method for both financial statement and federal income tax purposes.
Income Recognition
Corporate actions and dividend income are generally recorded net of any non-reclaimable tax withholdings, on the ex-dividend date or upon receipt of ex-dividend notification in the case of certain foreign securities.
The Fund may receive distributions from holdings in equity securities, business development companies (BDCs), exchange-traded funds, other regulated investment companies (RICs), and real estate investment trusts (REITs), which report information on the tax character of their distributions annually. These distributions are allocated to dividend income, capital gain and return of capital based on actual information reported. Return of capital is recorded as a reduction of the cost basis of securities held. If the Fund no longer owns the applicable securities, return of capital is recorded as a realized gain. With respect to REITs, to the extent actual information has not yet been reported, estimates for return of capital are made by the Fund's management. Management's estimates are subsequently adjusted when the actual character of the distributions is disclosed by the REITs, which could result in a proportionate change in return of capital to shareholders.
Awards from class action litigation are recorded as a reduction of cost basis if the Fund still owns the applicable securities on the payment date. If the Fund no longer owns the applicable securities, the proceeds are recorded as realized gains.
Expenses
General expenses of the Trust are allocated to the Fund and other funds of the Trust based upon relative net assets or other expense allocation methodologies determined by the nature of the expense. Expenses directly attributable to the Fund are charged to the Fund. Expenses directly attributable to a specific class of shares are charged to that share class.
Determination of Class Net Asset Value
All income, expenses (other than class-specific expenses, which are charged to that share class, as shown in the Statement of Operations) and realized and unrealized gains (losses) are allocated to each class of the Fund on a daily basis, based on the relative net assets of each class, for purposes of determining the net asset value of each class.
Annual Report 2015
32
COLUMBIA GLOBAL ENERGY AND NATURAL RESOURCES FUND
NOTES TO FINANCIAL STATEMENTS (continued)
August 31, 2015
Federal Income Tax Status
The Fund intends to qualify each year as a regulated investment company under Subchapter M of the Internal Revenue Code, as amended, and will distribute substantially all of its taxable income (including net short-term capital gains), if any, for its tax year, and as such will not be subject to federal income taxes. In addition, the Fund intends to distribute in each calendar year substantially all of its net investment income, capital gains and certain other amounts, if any, such that the Fund should not be subject to federal excise tax. Therefore, no federal income or excise tax provision is recorded.
Foreign Taxes
The Fund may be subject to foreign taxes on income, gains on investments or currency repatriation, a portion of which may be recoverable. The Fund will accrue such taxes and recoveries, as applicable, based upon its current interpretation of tax rules and regulations that exist in the markets in which it invests.
Realized gains in certain countries may be subject to foreign taxes at the Fund level, based on statutory rates. The Fund accrues for such foreign taxes on realized and unrealized gains at the appropriate rate for each jurisdiction, as applicable. The amount, if any, is disclosed as a liability on the Statement of Assets and Liabilities.
Distributions to Shareholders
Distributions from net investment income, if any, are declared and paid each calendar quarter. Net realized capital gains, if any, are distributed at least annually. Income distributions and capital gain distributions are determined in accordance with federal income tax regulations, which may differ from GAAP.
Guarantees and Indemnifications
Under the Trust's organizational documents and, in some cases, by contract, its officers and trustees are indemnified against certain liabilities arising out of the performance of their duties to the Trust or its funds. In addition, certain of the Fund's contracts with its service providers contain general indemnification clauses. The Fund's maximum exposure under these arrangements is unknown since the amount of any future claims that may be made against the Fund cannot be determined, and the Fund has no historical basis for predicting the likelihood of any such claims.
Recent Accounting Pronouncement
Fair Value Measurement (Topic 820), Disclosure for Investments in Certain Entities That Calculate Net Asset Value per Share (or Its Equivalent)
In May 2015, the Financial Accounting Standards Board (FASB) issued Accounting Standards Update (ASU) No. 2015-07, Fair Value Measurement (Topic 820), Disclosure for Investments in Certain Entities That Calculate Net Asset Value per Share (or Its Equivalent). ASU No. 2015-07 changes the disclosure requirements for investments for which fair value is measured using the net asset value per share practical expedient. The disclosure requirements are effective for annual periods beginning after December 15, 2015 and interim periods within those fiscal years. At this time, management is evaluating the implications of this guidance and the impact it will have on the financial statement amounts and footnote disclosures, if any.
Note 3. Fees and Other Transactions with Affiliates
Investment Management Fees
Under an Investment Management Services Agreement, Columbia Management Investment Advisers, LLC (the Investment Manager), a wholly-owned subsidiary of Ameriprise Financial, Inc. (Ameriprise Financial), determines which securities will be purchased, held or sold. The investment management fee is an annual fee that is equal to a percentage of the Fund's average daily net assets that declines from 0.69% to 0.54% as the Fund's net assets increase. The effective investment management fee rate for the year ended August 31, 2015 was 0.69% of the Fund's average daily net assets.
Administration Fees
Under an Administrative Services Agreement, the Investment Manager also serves as the Fund Administrator. The Fund pays the Fund Administrator an annual fee for administration and accounting services equal to a percentage of the Fund's average daily net assets that declines from 0.06% to 0.04% as the Fund's net assets increase. The effective administration fee rate for the year ended August 31, 2015 was 0.06% of the Fund's average daily net assets.
Compensation of Board Members
Board members, who are not officers or employees of the Investment Manager or Ameriprise Financial, are compensated for their services to the Fund as disclosed
Annual Report 2015
33
COLUMBIA GLOBAL ENERGY AND NATURAL RESOURCES FUND
NOTES TO FINANCIAL STATEMENTS (continued)
August 31, 2015
in the Statement of Operations. These Board members may participate in a Deferred Compensation Plan (the Plan) which may be terminated at any time. Obligations of the Plan will be paid solely out of the Fund's assets, and all amounts payable under the Plan constitute a general unsecured obligation of the Fund.
Compensation of Chief Compliance Officer
The Board has appointed a Chief Compliance Officer to the Fund in accordance with federal securities regulations. The Fund is allocated a portion of the expenses associated with the Chief Compliance Officer based on relative net assets of the Trust.
Transfer Agency Fees
Under a Transfer and Dividend Disbursing Agent Agreement, Columbia Management Investment Services Corp. (the Transfer Agent), an affiliate of the Investment Manager and a wholly-owned subsidiary of Ameriprise Financial, is responsible for providing transfer agency services to the Fund. The Transfer Agent has contracted with Boston Financial Data Services (BFDS) to serve as sub-transfer agent.
Effective November 1, 2014, the Transfer Agent receives a monthly transfer agency fee based on the number or the average value of accounts, depending on the type of account. Prior to November 1, 2014, the Transfer Agent received a monthly account-based service fee based on the number of open accounts. In addition, the Transfer Agent also receives sub-transfer agency fees based on a percentage of the average aggregate value of the Fund's shares maintained in omnibus accounts (other than omnibus accounts for which American Enterprise Investment Services Inc. is the broker of record or accounts where the beneficial shareholder is a customer of Ameriprise Financial Services, Inc., for which the Transfer Agent receives a per account fee). The Transfer Agent pays the fees of BFDS for services as sub-transfer agent and is not entitled to reimbursement for such fees from the Fund (with the exception of out-of-pocket fees).
The Transfer Agent also receives compensation from the Fund for various shareholder services and reimbursements for certain out-of-pocket fees. Class I shares do not pay transfer agency fees. Total transfer agency fees for Class K and Class R5 shares are subject to an annual limitation of not more than 0.05% of the average daily net assets attributable to each share class.
For the year ended August 31, 2015, the Fund's effective transfer agency fee rates as a percentage of average daily net assets of each class were as follows:
Class A | | | 0.23 | % | |
Class B | | | 0.23 | | |
Class C | | | 0.23 | | |
Class K | | | 0.05 | | |
Class R | | | 0.23 | | |
Class R4 | | | 0.23 | | |
Class R5 | | | 0.05 | | |
Class Z | | | 0.23 | | |
An annual minimum account balance fee of $20 may apply to certain accounts with a value below the applicable share class's initial minimum investment requirements to reduce the impact of small accounts on transfer agency fees. These minimum account balance fees are remitted to the Fund and recorded as part of expense reductions in the Statement of Operations. For the year ended August 31, 2015, these minimum account balance fees reduced total expenses of the Fund by $2,120.
Plan Administration Fees
Under a Plan Administration Services Agreement with the Transfer Agent, the Fund pays an annual fee at a rate of 0.25% of the Fund's average daily net assets attributable to Class K shares for the provision of various administrative, recordkeeping, communication and educational services.
Distribution and Service Fees
The Fund has an agreement with Columbia Management Investment Distributors, Inc. (the Distributor), an affiliate of the Investment Manager and a wholly-owned subsidiary of Ameriprise Financial, for distribution and shareholder services. The Board has approved, and the Fund has adopted, distribution and shareholder service plans (the Plans) applicable to certain share classes, which set the distribution and service fees for the Fund. These fees are calculated daily and are intended to compensate the Distributor and/or eligible selling and/or servicing agents for selling shares of the Fund and providing services to investors.
Under the Plans, the Fund pays a monthly service fee to the Distributor at the maximum annual rate of 0.25% of the average daily net assets attributable to Class A, Class B and Class C shares of the Fund. Also under the Plans, the Fund pays a monthly distribution fee to the
Annual Report 2015
34
COLUMBIA GLOBAL ENERGY AND NATURAL RESOURCES FUND
NOTES TO FINANCIAL STATEMENTS (continued)
August 31, 2015
Distributor at the maximum annual rates of 0.75%, 0.75% and 0.50% of the average daily net assets attributable to Class B, Class C and Class R shares of the Fund, respectively.
Sales Charges
Sales charges, including front-end charges and CDSCs, received by the Distributor for distributing Fund shares were $316,342 for Class A, $551 for Class B and $3,004 for Class C shares for the year ended August 31, 2015.
Expenses Waived/Reimbursed by the Investment Manager and its Affiliates
The Fund's expense ratio is subject to an expense reimbursement arrangement pursuant to which fees will be waived and/or expenses reimbursed (excluding certain fees and expenses described below), so that the Fund's net operating expenses, after giving effect to fees waived/expenses reimbursed and any balance credits and/or overdraft charges from the Fund's custodian, do not exceed the annual rates of:
| | | Voluntary
Expense Cap
Effective
January 1, 2015 | | Contractual
Expense Cap
Prior to
January 1, 2015 | |
Class A | | | 1.45 | % | | | 1.50 | % | |
Class B | | | 2.20 | | | | 2.25 | | |
Class C | | | 2.20 | | | | 2.25 | | |
Class I | | | 1.04 | | | | 1.08 | | |
Class K | | | 1.34 | | | | 1.38 | | |
Class R | | | 1.70 | | | | 1.75 | | |
Class R4 | | | 1.20 | | | | 1.25 | | |
Class R5 | | | 1.09 | | | | 1.13 | | |
Class Z | | | 1.20 | | | | 1.25 | | |
The voluntary expense cap arrangement may be revised or discontinued at any time. Under the arrangements, the following fees and expenses are excluded from the waiver/reimbursement commitment, and therefore will be paid by the Fund, if applicable: taxes (including foreign transaction taxes), expenses associated with investments in affiliated and non-affiliated pooled investment vehicles (including mutual funds and exchange-traded funds), transaction costs and brokerage commissions, costs related to any securities lending program, dividend and interest expenses associated with securities sold short, inverse floater program fees and expenses, transaction charges and interest on borrowed money, interest and extraordinary expenses. Any fees waived and/or expenses reimbursed under the expense reimbursement
arrangements described above are not recoverable by the Investment Manager or its affiliates in future periods.
Note 4. Federal Tax Information
The timing and character of income and capital gain distributions are determined in accordance with income tax regulations, which may differ from GAAP because of temporary or permanent book to tax differences.
At August 31, 2015, these differences are primarily due to differing treatment for deferral/reversal of wash sale losses, Trustees' deferred compensation, foreign currency transactions, investments in partnerships, post-October capital losses, late-year ordinary losses and tax straddles. To the extent these differences are permanent, reclassifications are made among the components of the Fund's net assets in the Statement of Assets and Liabilities. Temporary differences do not require reclassifications. In the Statement of Assets and Liabilities the following reclassifications were made:
Excess of distributions over net investment income | | $ | (9,200,626 | ) | |
Accumulated net realized loss | | | 9,200,694 | | |
Paid-in capital | | | (68 | ) | |
Net investment income (loss) and net realized gains (losses), as disclosed in the Statement of Operations, and net assets were not affected by this reclassification.
The tax character of distributions paid during the years indicated was as follows:
Year Ended August 31, | | 2015 | | 2014 | |
Ordinary income | | $ | 5,319,821 | | | $ | 3,123,982 | | |
Long-term capital gains | | | 15,280,117 | | | | 5,203,066 | | |
Total | | $ | 20,599,938 | | | $ | 8,327,048 | | |
Short-term capital gain distributions, if any, are considered ordinary income distributions for tax purposes.
At August 31, 2015, the components of distributable earnings on a tax basis were as follows:
Net unrealized depreciation | | | (30,886,022 | ) | |
At August 31, 2015, the cost of investments for federal income tax purposes was $280,726,118 and the aggregate gross unrealized appreciation and depreciation based on that cost was:
Unrealized appreciation | | $ | 18,834,628 | | |
Unrealized depreciation | | | (49,720,650 | ) | |
Net unrealized depreciation | | $ | (30,886,022 | ) | |
Annual Report 2015
35
COLUMBIA GLOBAL ENERGY AND NATURAL RESOURCES FUND
NOTES TO FINANCIAL STATEMENTS (continued)
August 31, 2015
Under current tax rules, regulated investment companies can elect to treat certain late-year ordinary losses incurred and post-October capital losses (capital losses realized after October 31) as arising on the first day of the following taxable year. As of August 31, 2015, the Fund will elect to treat late-year ordinary losses of $4,513,400 and post-October capital losses of $1,073,035 as arising on September 1, 2015.
Management of the Fund has concluded that there are no significant uncertain tax positions in the Fund that would require recognition in the financial statements. However, management's conclusion may be subject to review and adjustment at a later date based on factors including, but not limited to, new tax laws, regulations, and administrative interpretations (including relevant court decisions). Generally, the Fund's federal tax returns for the prior three fiscal years remain subject to examination by the Internal Revenue Service.
Note 5. Portfolio Information
The cost of purchases and proceeds from sales of securities, excluding short-term investments and derivatives, if any, aggregated to $150,058,161 and $179,001,197, respectively, for the year ended August 31, 2015. The amount of purchase and sale activity impacts the portfolio turnover rate reported in the Financial Highlights.
Note 6. Affiliated Money Market Fund
The Fund invests in Columbia Short-Term Cash Fund, an affiliated money market fund established for the exclusive use by the Fund and other affiliated funds. The income earned by the Fund from such investments is included as Dividends — affiliated issuers in the Statement of Operations. As an investing fund, the Fund indirectly bears its proportionate share of the expenses of Columbia Short-Term Cash Fund.
Note 7. Line of Credit
The Fund has entered into a revolving credit facility with a syndicate of banks led by JPMorgan Chase Bank, N.A. whereby the Fund may borrow for the temporary funding of shareholder redemptions or for other temporary or emergency purposes. Pursuant to a December 9, 2014 amendment, the credit facility agreement, which is a collective agreement between the Fund and certain other funds managed by the Investment Manager, severally and not jointly, permits collective borrowings up to $550 million. Interest is charged to each participating fund based on its borrowings at a rate equal to the
higher of (i) the overnight federal funds rate plus 1.00% or (ii) the one-month LIBOR rate plus 1.00%. Each borrowing under the credit facility matures no later than 60 days after the date of borrowing. The Fund also pays a commitment fee equal to its pro rata share of the amount of the credit facility at a rate of 0.075% per annum. The commitment fee is included in other expenses in the Statement of Operations. Prior to the December 9, 2014 amendment, the credit facility agreement permitted borrowings up to $500 million under the same terms and interest rates as described above.
The Fund had no borrowings during the year ended August 31, 2015.
Note 8. Significant Risks
Energy Sector Risk
The Fund may be more susceptible to the particular risks that may affect companies in the energy sector than if it were invested in a wider variety of companies in unrelated sectors. Companies in the energy sector are subject to certain risks, including legislative or regulatory changes, adverse market conditions and increased competition. Performance of such companies may be affected by factors including, among others, fluctuations in energy prices and supply and demand of energy fuels, energy conservation, the success of exploration projects, events occurring in nature and local and international politics. In addition, rising interest rates and high inflation may affect the demand for certain natural resources and, therefore, the performance of companies in the energy sector.
Materials Sector Risk
The Fund may be more susceptible to the particular risks that may affect companies in the materials sector than if it were invested in a wider variety of companies in unrelated sectors. Companies in the materials sector are subject to certain risks, including that many materials companies are significantly affected by the level and volatility of commodity prices, exchange rates, import controls, worldwide competition, environmental policies and consumer demand. Performance of such companies may be affected by factors including, among others, that at times worldwide production of industrial materials has exceeded demand as a result of over-building or economic downturns, leading to poor investment returns or losses. Other risks may include liabilities for environmental damage and general civil liabilities, depletion of resources, and mandated expenditures for
Annual Report 2015
36
COLUMBIA GLOBAL ENERGY AND NATURAL RESOURCES FUND
NOTES TO FINANCIAL STATEMENTS (continued)
August 31, 2015
safety and pollution control. The materials sector may also be affected by economic cycles, technical progress, labor relations, and government regulations.
Foreign Securities and Emerging Market Countries Risk
Investing in foreign securities may include certain risks and considerations not typically associated with investing in U.S. securities, such as fluctuating currency values and changing local and regional economic, political and social conditions, which may result in greater market volatility. In addition, certain foreign securities may not be as liquid as U.S. securities. Investing in emerging markets may accentuate these risks. These countries are also more likely to experience high levels of inflation, deflation or currency devaluation which could hurt their economies and securities markets. To the extent that the Fund concentrates its investment exposure to any one or a few specific countries, the Fund will be particularly susceptible to the various conditions, events or other factors impacting those countries and may, therefore, have a greater risk than that of a fund which is more geographically diversified.
Non-Diversification Risk
A non-diversified fund is permitted to invest a greater percentage of its total assets in fewer issuers than a diversified fund. The Fund may, therefore, have a greater risk of loss from a few issuers than a similar fund that invests more broadly.
Shareholder Concentration Risk
At August 31, 2015, one unaffiliated shareholder of record owned 15.2% of the outstanding shares of the Fund in one or more accounts. The Fund has no knowledge about whether any portion of those shares was owned beneficially. Affiliated shareholders of record owned 42.5% of the outstanding shares of the Fund in one or more accounts. Subscription and redemption activity by concentrated accounts may have a significant effect on the operations of the Fund. In the case of a large redemption, the Fund may be forced to sell investments at inopportune times, including its liquid or more liquid positions, resulting in Fund losses and the Fund holding a higher percentage of less liquid or illiquid securities. Large redemptions could result in decreased economies of scale and increased operating expenses for non-redeeming Fund shareholders.
Note 9. Subsequent Events
Management has evaluated the events and transactions that have occurred through the date the financial
statements were issued and noted no items requiring adjustment of the financial statements or additional disclosure.
Note 10. Information Regarding Pending and Settled Legal Proceedings
In December 2005, without admitting or denying the allegations, American Express Financial Corporation (AEFC, which is now known as Ameriprise Financial, Inc. (Ameriprise Financial)) entered into settlement agreements with the Securities and Exchange Commission (SEC) and Minnesota Department of Commerce (MDOC) related to market timing activities. As a result, AEFC was censured and ordered to cease and desist from committing or causing any violations of certain provisions of the Investment Advisers Act of 1940, the Investment Company Act of 1940, and various Minnesota laws. AEFC agreed to pay disgorgement of $10 million and civil money penalties of $7 million. AEFC also agreed to retain an independent distribution consultant to assist in developing a plan for distribution of all disgorgement and civil penalties ordered by the SEC in accordance with various undertakings detailed at http://www.sec.gov/litigation/admin/ia-2451.pdf. Ameriprise Financial and its affiliates have cooperated with the SEC and the MDOC in these legal proceedings, and have made regular reports to the Funds' Boards of Trustees.
Ameriprise Financial and certain of its affiliates have historically been involved in a number of legal, arbitration and regulatory proceedings, including routine litigation, class actions, and governmental actions, concerning matters arising in connection with the conduct of their business activities. Ameriprise Financial believes that the Funds are not currently the subject of, and that neither Ameriprise Financial nor any of its affiliates are the subject of, any pending legal, arbitration or regulatory proceedings that are likely to have a material adverse effect on the Funds or the ability of Ameriprise Financial or its affiliates to perform under their contracts with the Funds. Ameriprise Financial is required to make quarterly (10-Q), annual (10-K) and, as necessary, 8-K filings with the SEC on legal and regulatory matters that relate to Ameriprise Financial and its affiliates. Copies of these filings may be obtained by accessing the SEC website at www.sec.gov.
There can be no assurance that these matters, or the adverse publicity associated with them, will not result in increased fund redemptions, reduced sale of fund shares or other adverse consequences to the Funds. Further,
Annual Report 2015
37
COLUMBIA GLOBAL ENERGY AND NATURAL RESOURCES FUND
NOTES TO FINANCIAL STATEMENTS (continued)
August 31, 2015
although we believe proceedings are not likely to have a material adverse effect on the Funds or the ability of Ameriprise Financial or its affiliates to perform under their contracts with the Funds, these proceedings are subject to uncertainties and, as such, we are unable to estimate the possible loss or range of loss that may result. An adverse outcome in one or more of these proceedings could result in adverse judgments, settlements, fines, penalties or other relief that could have a material adverse effect on the consolidated financial condition or results of operations of Ameriprise Financial.
Annual Report 2015
38
COLUMBIA GLOBAL ENERGY AND NATURAL RESOURCES FUND
REPORT OF INDEPENDENT REGISTERED PUBLIC ACCOUNTING FIRM
To the Trustees of Columbia Funds Series Trust I and the Shareholders of
Columbia Global Energy and Natural Resources Fund
In our opinion, the accompanying statement of assets and liabilities, including the portfolio of investments, and the related statements of operations and of changes in net assets and the financial highlights present fairly, in all material respects, the financial position of Columbia Global Energy and Natural Resources Fund (the "Fund," a series of Columbia Funds Series Trust I) at August 31, 2015, and the results of its operations, the changes in its net assets and the financial highlights for each of the periods indicated, in conformity with accounting principles generally accepted in the United States of America. These financial statements and financial highlights (hereafter referred to as "financial statements") are the responsibility of the Fund's management. Our responsibility is to express an opinion on these financial statements based on our audits. We conducted our audits of these financial statements in accordance with the standards of the Public Company Accounting Oversight Board (United States). Those standards require that we plan and perform the audit to obtain reasonable assurance about whether the financial statements are free of material misstatement. An audit includes examining, on a test basis, evidence supporting the amounts and disclosures in the financial statements, assessing the accounting principles used and significant estimates made by management, and evaluating the overall financial statement presentation. We believe that our audits, which included confirmation of securities at August 31, 2015 by correspondence with the custodian, brokers and transfer agent, and the application of alternative auditing procedures where such confirmations had not been received, provide a reasonable basis for our opinion.
PricewaterhouseCoopers LLP
Minneapolis, MN
October 22, 2015
Annual Report 2015
39
COLUMBIA GLOBAL ENERGY AND NATURAL RESOURCES FUND
FEDERAL INCOME TAX INFORMATION
(Unaudited)
The Fund hereby designates the following tax attributes for the fiscal year ended August 31, 2015. Shareholders will be notified in early 2016 of the amounts for use in preparing 2015 income tax returns.
Tax Designations:
| Qualified Dividend Income | | | 100.00 | % | |
| Dividends Received Deduction | | | 52.89 | % | |
Capital Gain Dividend | | $ | 3,560,477 | | |
Qualified Dividend Income. For taxable, non-corporate shareholders, the percentage of ordinary income distributed during the fiscal year that represents qualified dividend income subject to reduced tax rates.
Dividends Received Deduction. The percentage of ordinary income distributed during the fiscal year that qualifies for the corporate dividends received deduction.
Capital Gain Dividend. The Fund designates as a capital gain dividend the amount reflected above, or if subsequently determined to be different, the net capital gain of such fiscal period.
Annual Report 2015
40
COLUMBIA GLOBAL ENERGY AND NATURAL RESOURCES FUND
The Trustees serve terms of indefinite duration. The names and birth years of the Trustees and Officers of the Funds in Columbia Funds Series Trust I, the year each was first elected or appointed to office, their principal business occupations during at least the last five years, the number of Funds overseen by each Trustee and other directorships they hold are shown below. Each officer listed below serves as an officer of each Fund in Columbia Funds Series Trust I. The mailing address of each Trustee is: c/o Columbia Management Investment Advisers, LLC, 225 Franklin Street, Mail Drop BX32 05228, Boston, MA 02110.
Independent Trustees
Name, Year of Birth
and Position Held
with the Trust | | Year First
Appointed or
Elected as
Trustee to any
Fund Currently
in the Columbia
Funds Complex
or a Predecessor
Thereof | | Principal Occupation(s)
during the Past Five Years | | Number
of Funds
in the
Columbia
Funds
Complex
Overseen | | Other Directorships
Held by Trustee During
the Past Five Years | |
Janet Langford Carrig
(Born 1957)
Trustee | | | 1996 | | | Senior Vice President, General Counsel and Corporate Secretary, ConocoPhillips (integrated energy company) since September 2007; Deputy General Counsel — Corporate Legal Services, ConocoPhillips from August 2006 to August 2007; Partner, Zelle, Hofmann, Voelbel, Mason & Gette LLP (law firm) from March 2005 to July 2006; Adjunct Professor of Law, Northwestern University from September 2004 to June 2006; Director, UAL Corporation (airline) from February 2006 to July 2006; Chief Administrative Officer and Senior Vice President, Kmart Holding Corporation (consumer goods) from September 2003 to March 2004 | | | 60 | | | None | |
Douglas A. Hacker
(Born 1955)
Trustee and Chairman
of the Board | | | 1996 | | | Independent business executive since May 2006; Executive Vice President — Strategy of United Airlines from December 2002 to May 2006; President of UAL Loyalty Services (airline marketing company) from September 2001 to December 2002; Executive Vice President and Chief Financial Officer of United Airlines from July 1999 to September 2001 | | | 60 | | | Spartan Nash Company, (food distributor); Nash Finch Company (food distributor) from 2005 to 2013; Aircastle Limited (aircraft leasing); SeaCube Container Leasing Ltd. (container leasing) from 2010 to 2013; and Travelport Worldwide Limited (travel information technology) | |
Nancy T. Lukitsh
(Born 1956)
Trustee | | | 2011 | | | Senior Vice President, Partner and Director of Marketing, Wellington Management Company, LLP (investment adviser) from 1997 to 2010; Chair, Wellington Management Investment Portfolios (commingled non-U.S. investment pools) from 2007 to 2010; Director, Wellington Trust Company, NA and other Wellington affiliates from 1997 to 2010 | | | 60 | | | None | |
William E. Mayer
(Born 1940)
Trustee | | | 1991 | | | Partner, Park Avenue Equity Partners (private equity) since February 1999 | | | 60 | | | DynaVox Inc. (speech creation); Lee Enterprises (print media); WR Hambrecht + Co. (financial service provider) from 2000 to 2012; BlackRock Kelso Capital Corporation (investment company); and Premier, Inc. (healthcare) | |
Annual Report 2015
41
COLUMBIA GLOBAL ENERGY AND NATURAL RESOURCES FUND
TRUSTEES AND OFFICERS (continued)
Independent Trustees (continued)
Name, Year of Birth
and Position Held
with the Trust | | Year First
Appointed or
Elected as
Trustee to any
Fund Currently
in the Columbia
Funds Complex
or a Predecessor
Thereof | | Principal Occupation(s)
during the Past Five Years | | Number
of Funds
in the
Columbia
Funds
Complex
Overseen | | Other Directorships
Held by Trustee During
the Past Five Years | |
David M. Moffett
(Born 1952)
Trustee | | | 2011 | | | Retired. Consultant to Bridgewater and Associates; Chief Executive Officer, Federal Home Loan Mortgage Corporation, from 2008 to 2009; Senior Adviser, Global Financial Services Group, Carlyle Group, Inc., from 2007 to 2008; Vice Chairman and Chief Financial Officer, U.S. Bancorp, from 1993 to 2007 | | | 60 | | | Building Materials Holding Corp. (building materials and construction services); CIT Group Inc. (commercial and consumer finance); eBay Inc. (online trading community); E.W. Scripps Co. (print and television media); Genworth Financial, Inc. (financial and insurance products and services); MBIA Inc. (financial service provider); Paypal Holdings Inc. (payment and data processing services); and University of Oklahoma Foundation | |
Charles R. Nelson
(Born 1942)
Trustee | | | 1981 | | | Retired. Professor Emeritus, University of Washington since 2011; Professor of Economics, University of Washington from 1976 to 2011; Ford and Louisa Van Voorhis Professor of Political Economy, University of Washington from 1993 to 2011; Adjunct Professor of Statistics, University of Washington from 1980 to 2011; Associate Editor, Journal of Money, Credit and Banking from September 1993 to 2008; consultant on econometric and statistical matters | | | 60 | | | None | |
John J. Neuhauser
(Born 1943)
Trustee | | | 1984 | | | President, Saint Michael's College since August 2007; Director or Trustee of several non-profit organizations, including Fletcher Allen Health Care, Inc.; Academic Vice President and Dean of Faculties, Boston College from August 1999 to October 2005; University Professor, Boston College from November 2005 to August 2007 | | | 60 | | | Liberty All-Star Equity Fund and Liberty All-Star Growth Fund (closed-end funds) | |
Patrick J. Simpson
(Born 1944)
Trustee | | | 2000 | | | Partner, Perkins Coie LLP (law firm) | | | 60 | | | None | |
Anne-Lee Verville
(Born 1945)
Trustee | | | 1998 | | | Retired. General Manager, Global Education Industry from 1994 to 1997, President — Application Systems Division from 1991 to 1994, Chief Financial Officer — US Marketing & Services from 1988 to 1991, and Chief Information Officer from 1987 to 1988, IBM Corporation (computer and technology) | | | 60 | | | Enesco Group, Inc. (producer of giftware and home and garden decor products) from 2001 to 2006 | |
Annual Report 2015
42
COLUMBIA GLOBAL ENERGY AND NATURAL RESOURCES FUND
TRUSTEES AND OFFICERS (continued)
Interested Trustee Affiliate with Investment Manager*
Name, Year of Birth
and Position Held
with the Trust | | Year First
Appointed or
Elected as
Trustee to any
Fund Currently
in the Columbia
Funds Complex
or a Predecessor
Thereof | | Principal Occupation(s)
during the Past Five Years | | Number
of Funds
in the
Columbia
Funds
Complex
Overseen | | Other Directorships
Held by Trustee During
the Past Five Years | |
William F. Truscott
(Born 1960)
Trustee | | | 2012 | | | Chairman of the Board and President, Columbia Management Investment Advisers, LLC since May 2010 and February 2012, respectively (previously President and Chief Investment Officer, 2001-April 2010); Chief Executive Officer, Global Asset Management, Ameriprise Financial, Inc. since September 2012 (previously Chief Executive Officer, U.S. Asset Management & President, Annuities, May 2010-September 2012 and President — U.S. Asset Management and Chief Investment Officer, 2005-April 2010); Director and Chief Executive Officer, Columbia Management Investment Distributors, Inc. since May 2010 and February 2012, respectively (previously Chairman of the Board and Chief Executive Officer, 2006-April 2010); Chairman of the Board and Chief Executive Officer, RiverSource Distributors, Inc. since 2006; Director, Threadneedle Asset Management Holdings, SARL since 2014; President and Chief Executive Officer, Ameriprise Certificate Company, 2006-August 2012 | | | 187 | | | Chairman of the Board, Columbia Management Investment Advisers, LLC since May 2010; Director, Columbia Management Investment Distributors, Inc. since May 2010; Director, Ameriprise Certificate Company, 2006 to January 2013 | |
* Interested person (as defined under the 1940 Act) by reason of being an officer, director, security holder and/or employee of the Investment Manager or Ameriprise Financial.
The Statement of Additional Information has additional information about the Fund's Board members and is available, without charge, upon request by calling 800.345.6611; contacting your financial intermediary; or visiting columbiathreadneedle.com/us.
The Board has appointed officers who are responsible for day-to-day business decisions based on policies it has established. The officers serve at the pleasure of the Board. In addition to Mr. Truscott, who is Senior Vice President, the Funds' other officers are:
Fund Officers
Name,
Address and
Year of Birth | | Position and Year
First Appointed to
Position for any Fund
in the Columbia
Funds Complex or a
Predecessor Thereof | | Principal Occupation(s) During Past Five Years | |
Christopher O. Petersen
5228 Ameriprise
Financial Center
Minneapolis, MN 55474
Born 1970 | | President and Principal Executive Officer (2015) | | Vice President and Lead Chief Counsel, Ameriprise Financial, Inc. since January 2015 (previously, Vice President and Chief Counsel January 2010-December 2014; and Vice President and Group Counsel or Counsel 2004- January 2010); officer of Columbia Funds and affiliated funds since 2007. | |
Michael G. Clarke
225 Franklin Street
Boston, MA 02110
Born 1969 | | Treasurer (2011) and Chief Financial Officer (2009) | | Vice President — Mutual Fund Administration, Columbia Management Investment Advisers, LLC, since May 2010; Managing Director of Fund Administration, Columbia Management Advisors, LLC, September 2004-April 2010; senior officer of Columbia Funds and affiliated funds since 2002. | |
Annual Report 2015
43
COLUMBIA GLOBAL ENERGY AND NATURAL RESOURCES FUND
TRUSTEES AND OFFICERS (continued)
Fund Officers (continued)
Name,
Address and
Year of Birth | | Position and Year
First Appointed to
Position for any Fund
in the Columbia
Funds Complex or a
Predecessor Thereof | | Principal Occupation(s) During Past Five Years | |
Paul B. Goucher
100 Park Avenue
New York, NY 10017
Born 1968 | | Senior Vice President (2011), Chief Legal Officer (2015) and Assistant Secretary (2008) | | Vice President and Lead Chief Counsel, Ameriprise Financial, Inc. since November 2008 and January 2013, respectively (previously Chief Counsel, January 2010-January 2013 and Group Counsel, November 2008-January 2010). | |
Thomas P. McGuire
225 Franklin Street
Boston, MA 02110
Born 1972 | | Vice President and Chief Compliance Officer (2012) | | Vice President — Asset Management Compliance, Ameriprise Financial, Inc., since May 2010; Chief Compliance Officer, Ameriprise Certificate Company since September 2010; Compliance Executive, Bank of America, 2005-April 2010. | |
Colin Moore
225 Franklin Street
Boston, MA 02110
Born 1958 | | Senior Vice President (2010) | | Executive Vice President and Global Chief Investment Officer, Ameriprise Financial, Inc., since July 2013; Director and Global Chief Investment Officer, Columbia Management Investment Advisers, LLC since May 2010; Manager, Managing Director and Chief Investment Officer, Columbia Management Advisors, LLC, 2007-April 2010. | |
Michael E. DeFao
225 Franklin Street
Boston, MA 02110
Born 1968 | | Vice President (2011) and Assistant Secretary (2010) | | Vice President and Chief Counsel, Ameriprise Financial, Inc. since May 2010; Associate General Counsel, Bank of America, 2005-April 2010. | |
Joseph F. DiMaria
225 Franklin Street
Boston, MA 02110
Born 1968 | | Vice President (2011), Assistant Treasurer (2012) and Chief Accounting Officer (2008) | | Vice President — Mutual Fund Treasurer, Columbia Management Investment Advisers, LLC since May 2010; Director of Fund Administration, Columbia Management Advisors, LLC, 2006-April 2010. | |
Amy Johnson
5228 Ameriprise
Financial Center
Minneapolis, MN 55474
Born 1965 | | Vice President (2006) | | Managing Director and Chief Operating Officer, Columbia Management Investment Advisers, LLC since May 2010 (previously Chief Administrative Officer, 2009-April 2010, and Vice President — Asset Management and Trust Company Services, 2006-2009). | |
Lyn Kephart-Strong
5228 Ameriprise
Financial Center
Minneapolis, MN 55474
Born 1960 | | Vice President (2015) | | President, Columbia Management Investment Services Corp. since October 2014; Vice President & Resolution Officer, Ameriprise Trust Company since August 2009; President, RiverSource Service Corporation 2004-2010. | |
Ryan C. Larrenaga
225 Franklin Street
Boston, MA 02110
Born 1970 | | Vice President and Secretary (2015) | | Vice President and Group Counsel, Ameriprise Financial, Inc. since August 2011 (previously, Counsel from May 2010 to August 2011); Assistant General Counsel, Bank of America, 2005-April 2010; officer of Columbia Funds and affiliated funds since 2005. | |
Annual Report 2015
44
COLUMBIA GLOBAL ENERGY AND NATURAL RESOURCES FUND
BOARD CONSIDERATION AND APPROVAL OF ADVISORY AGREEMENT
On June 10, 2015, the Board of Trustees (the Board) and the Trustees who are not interested persons (as defined in the Investment Company Act of 1940) (the Independent Trustees) of Columbia Funds Series Trust I (the Trust) unanimously approved the continuation of the Investment Management Services Agreement (the Advisory Agreement) with Columbia Management Investment Advisers, LLC (the Investment Manager) with respect to Columbia Global Energy and Natural Resources Fund (the Fund), a series of the Trust. The Board and the Independent Trustees also unanimously approved an agreement (the Management Agreement and, together with the Advisory Agreement, the Agreements) combining the Advisory Agreement and the Fund's existing administrative services agreement (the Administrative Services Agreement) in a single agreement. The Board and the Independent Trustees approved the restatement of the Advisory Agreement with the Management Agreement to be effective for the Fund on January 1, 2016, the Fund's next annual prospectus update. As detailed below, the Board's Advisory Fees and Expenses Committee (the Committee) and the Board met on multiple occasions to review and discuss, both among themselves and with the management team of the Investment Manager, materials provided by the Investment Manager and others before determining to approve the Management Agreement and the continuation of the Advisory Agreement.
In connection with their deliberations regarding the approval of the Management Agreement and the continuation of the Advisory Agreement, the Committee and the Board evaluated materials requested from the Investment Manager regarding the Fund and the Agreements, and discussed these materials with representatives of the Investment Manager at Committee meetings held on March 3, 2015, April 29, 2015 and June 9, 2015 and at Board meetings held on March 4, 2015 and June 10, 2015. In addition, the Board considers matters bearing on the Agreements at most of its other meetings throughout the year and meets regularly with senior management of the Trust and the Investment Manager. Through the Board's Investment Oversight Committees, Trustees also meet with selected portfolio managers of the funds the Trustees oversee and other investment personnel at various times throughout the year. The Committee and the Board also consulted with its independent fee consultant, Fund counsel and with the Independent Trustees' independent legal counsel, who advised on various matters with respect to the Committee's and the Board's considerations and otherwise assisted the Committee and the Board in their deliberations. On June 9, 2015, the Committee recommended that the Board approve the Management Agreement and the continuation of the Advisory Agreement. On June 10, 2015, the Board, including the Independent Trustees, voting separately, unanimously approved the Management Agreement and the continuation of the Advisory Agreement for the Fund.
The Committee and the Board considered all information that they, their legal counsel or the Investment Manager believed reasonably necessary to evaluate and to determine whether to approve the Management Agreement and the continuation of the Advisory Agreement. The information and factors considered by the Committee and the Board in recommending for approval or approving the Management Agreement and the continuation of the Advisory Agreement for the Fund included the following:
• Information on the investment performance of the Fund relative to the performance of a group of mutual funds determined to be comparable to the Fund by an independent third-party data provider, as well as performance relative to benchmarks;
• Information on the Fund's advisory fees and total expenses, including information comparing the Fund's expenses to those of a group of comparable mutual funds, as determined by the independent third-party data provider;
• The Investment Manager's agreement to contractually limit or cap total operating expenses for the Fund so that total operating expenses (excluding certain fees and expenses, such as portfolio transaction costs and certain other investment related expenses, interest, taxes, acquired fund fees and expenses, and extraordinary expenses) would not exceed a specified percentage of the Fund's average annual net assets from January 1, 2016 through December 31, 2016;
• The terms and conditions of the Agreements;
Annual Report 2015
45
COLUMBIA GLOBAL ENERGY AND NATURAL RESOURCES FUND
BOARD CONSIDERATION AND APPROVAL OF ADVISORY AGREEMENT (continued)
• The current and proposed terms and conditions of other agreements and arrangements with affiliates of the Investment Manager relating to the operations of the Fund, including the Administrative Services Agreement1 and agreements with respect to the provision of distribution and transfer agency services to the Fund;
• Descriptions of various functions performed by the Investment Manager under the Agreements, including portfolio management and portfolio trading practices;
• Information regarding the management fees and investment performance of similarly-managed portfolios of other clients of the Investment Manager, including institutional separate accounts;
• Information regarding the reputation, regulatory history and resources of the Investment Manager, including information regarding senior management, portfolio managers and other personnel;
• Information regarding the capabilities of the Investment Manager with respect to compliance monitoring services, including an assessment of the Investment Manager's compliance system by the Fund's Chief Compliance Officer; and
• The profitability to the Investment Manager and its affiliates from their relationships with the Fund.
Nature, Extent and Quality of Services Provided under the Agreements
The Committee and the Board considered the nature, extent and quality of services provided to the Fund by the Investment Manager and its affiliates under the Agreements and under separate agreements for the provision of transfer agency and administrative services, and the resources dedicated to the Fund and the other Columbia Funds by the Investment Manager and its affiliates. The Committee and the Board also determined that the nature and level of the services to be provided under the Management Agreement would not decrease relative to the services provided under the Advisory Agreement and the Administrative Services Agreement. The Committee and the Board considered, among other things, the Investment Manager's ability to attract, motivate and retain highly qualified research, advisory and supervisory investment professionals (including personnel and other resources, compensation programs for personnel involved in fund management, reputation and other attributes), the portfolio management services provided by those investment professionals, and the quality of the Investment Manager's investment research capabilities and trade execution services. The Committee and the Board also considered the potential benefits to shareholders of investing in a mutual fund that is part of a fund complex offering exposure to a variety of asset classes and investment disciplines and providing a variety of fund and shareholder services.
The Committee and the Board also considered the professional experience and qualifications of the senior personnel of the Investment Manager, which included consideration of the Investment Manager's experience with similarly-structured funds. The Committee and the Board noted the compliance programs of and the compliance-related resources provided to the Fund by the Investment Manager and its affiliates, and considered the Investment Manager's ability to provide administrative services to the Fund and coordinate the activities of the Fund's other service providers. In evaluating the nature, extent and quality of services provided under the Agreements, the Committee and the Board considered that these services were provided to the Fund, rather than directly to Fund shareholders. The Committee and the Board accordingly affirmed, after considering various other matters, including the potential benefits to the Fund and its shareholders of the Independent Trustees' important role as pre-suit gatekeepers with respect to claims that they may determine are meritless or contrary to the Fund's best interests, that it was not the intention of the Board or the Investment Manager that there be any third-party beneficiaries of the Agreements. After reviewing these and related factors, the Committee and the Board concluded, within the context of their overall conclusions, that the nature, extent and quality of the services provided to the Fund under the Agreements supported the approval of the Management Agreement and the continuation of the Advisory Agreement.
1 Like the Advisory Agreement, the Administrative Services Agreement will terminate with respect to the Fund once the Management Agreement is effective for the Fund.
Annual Report 2015
46
COLUMBIA GLOBAL ENERGY AND NATURAL RESOURCES FUND
BOARD CONSIDERATION AND APPROVAL OF ADVISORY AGREEMENT (continued)
Investment Performance
The Committee and the Board reviewed information about the performance of the Fund over various time periods, including performance information relative to benchmarks and information based on reports of the independent third-party data provider that compared the performance of the Fund to the performance of a group of comparable mutual funds, and data provided by the independent fee consultant. The Committee and the Board also reviewed a description of the third party's methodology for identifying the Fund's peer groups for purposes of performance and expense comparisons.
The Committee and the Board noted that, through December 31, 2014, the Fund's performance was in the 21st, 35th and 31st percentile (where the best performance would be in the first percentile) of its category selected by the independent third-party data provider for the purposes of performance comparisons for the one-, three- and five- year periods, respectively.
The Committee and the Board also considered the Investment Manager's performance and reputation generally, the Investment Manager's historical responsiveness to Board concerns about performance, and the Investment Manager's willingness to take steps intended to improve performance. After reviewing these and related factors, the Committee and the Board concluded, within the context of their overall conclusions, that the performance of the Fund was sufficient, in light of other considerations, to warrant the continuation of the Advisory Agreement and the approval of the Management Agreement.
Investment Advisory Fee Rates and Other Expenses
The Committee and the Board considered the advisory fees charged to the Fund under the Advisory Agreement as well as the total expenses incurred by the Fund. In assessing the reasonableness of the fees under the Advisory Agreement, the Committee and the Board considered, among other information, the Fund's advisory fee and its total expense ratio as a percentage of average daily net assets. The Committee and the Board also considered that the proposed management fee would not exceed the sum of the fee rates payable under the Advisory Agreement and the Administrative Services Agreement. The Committee and the Board considered data provided by the independent fee consultant. The Committee and the Board noted that, as of December 31, 2014, the Fund's actual management fee and net expense ratio are ranked in the 3rd and 2nd quintiles, respectively, (where the lowest fees and expenses would be in the first quintile) against the Fund's expense universe as determined by the independent third-party data provider for purposes of expense comparison. The Committee and the Board also took into account the fee waiver and expense limitation arrangements agreed to by the Investment Manager, as noted above.
The Committee and the Board also received and considered information about the advisory fees charged by the Investment Manager to institutional separate accounts. In considering the fees charged to those accounts, the Committee and the Board took into account, among other things, the Investment Manager's representations about the differences between managing mutual funds as compared to other types of accounts, including differences in the services provided, differences in the risk profile of such business for the Investment Manager and the additional resources required to manage mutual funds effectively. The Committee and the Board also received and considered information about the fees charged by the Investment Manager for sub-advisory services provided to comparable unaffiliated funds. In evaluating the Fund's advisory fees, the Committee and the Board also took into account the demands, complexity and quality of the investment management of the Fund.
After reviewing these and related factors, the Committee and the Board concluded, within the context of their overall conclusions, that the advisory/management fee rates and expenses of the Fund were sufficient, in light of other considerations, to warrant the approval of the Management Agreement and continuation of the Advisory Agreement.
Costs of Services Provided and Profitability
The Committee and the Board also took note of the costs the Investment Manager and its affiliates incur in connection with the services provided (both on an absolute and relative basis) and the profitability to the Investment Manager and its affiliates in connection with their relationships with the Fund.
The Committee and the Board also considered the compensation directly or indirectly received by the Investment Manager's affiliates in connection with their relationships with the Fund. The Committee and the Board reviewed
Annual Report 2015
47
COLUMBIA GLOBAL ENERGY AND NATURAL RESOURCES FUND
BOARD CONSIDERATION AND APPROVAL OF ADVISORY AGREEMENT (continued)
information provided by management as to the profitability to the Investment Manager and its affiliates of their relationships with the Fund, information about the allocation of expenses used to calculate profitability, and comparisons of profitability levels realized in 2014 to profitability levels realized in 2013. When reviewing profitability, the Committee and the Board also considered court cases in which adviser profitability was an issue in whole or in part, the performance of similarly managed funds, the performance of the Fund, and the expense ratio of the Fund. The Committee and the Board also considered information provided by the Investment Manager regarding the Investment Manager's financial condition and comparing its profitability to that of other asset management firms that are, or are subsidiaries of, publicly traded companies.
After reviewing these and related factors, the Committee and the Board concluded, within the context of their overall conclusions, that the costs of services provided and the profitability to the Investment Manager and its affiliates from their relationships with the Fund supported the approval of the Management Agreement and the continuation of the Advisory Agreement.
Economies of Scale
The Committee and the Board considered the potential existence of economies of scale in the provision by the Investment Manager of services to the Fund, to groups of related funds, and to the Investment Manager's investment advisory clients as a whole, and whether those economies of scale were shared with the Fund through breakpoints in investment advisory fees or other means, such as expense limitation arrangements and additional investments by the Investment Manager in investment, trading and compliance resources. The Committee and the Board noted that the investment advisory and management fee schedules for the Fund contained breakpoints that would reduce the fee rate on assets above specified threshold levels.
In considering these matters, the Committee and the Board also considered the costs of the services provided and the profitability to the Investment Manager and its affiliates from their relationships with the Fund, as discussed above. After reviewing these and related factors, the Committee and the Board concluded, within the context of their overall conclusions, that the extent to which any economies of scale were expected to be shared with the Fund supported the approval of the Management Agreement and the continuation of the Advisory Agreement.
Other Benefits to the Investment Manager
The Committee and the Board received and considered information regarding "fall-out" or ancillary benefits received by the Investment Manager and its affiliates as a result of their relationships with the Fund, such as the engagement of the Investment Manager to provide administrative services to the Fund and the engagement of the Investment Manager's affiliates to provide distribution and transfer agency services to the Fund. In this regard, among other matters, the Committee and the Board considered that the Fund's distributor retains a portion of the distribution fees from the Fund and receives a portion of the sales charges on sales or redemptions of certain classes of shares of the Fund. The Committee and the Board also considered the benefits of research made available to the Investment Manager by reason of brokerage commissions generated by the Fund's securities transactions, and reviewed information about the Investment Manager's practices with respect to allocating portfolio transactions for brokerage and research services. The Committee and the Board considered the possible conflicts of interest associated with certain fall-out or other ancillary benefits and the reporting, disclosure and other processes that are in place to address such possible conflicts of interest. The Committee and the Board recognized that the Investment Manager's profitability would be somewhat lower without these benefits.
Conclusion
The Committee and the Board reviewed all of the above considerations in reaching their decisions to recommend or approve the Management Agreement and the continuation of the Advisory Agreement. In their deliberations, the Trustees did not identify any particular information that was all-important or controlling, and individual Trustees may have attributed different weights to the various factors. Based on their evaluation of all factors that they deemed to be material, including those factors described above, and assisted by the advice of independent legal counsel, the Board, including the Independent Trustees, voting separately, unanimously approved the Management Agreement and the continuation of the Advisory Agreement.
Annual Report 2015
48
COLUMBIA GLOBAL ENERGY AND NATURAL RESOURCES FUND
IMPORTANT INFORMATION ABOUT THIS REPORT
Each fund mails one shareholder report to each shareholder address. If you would like more than one report, please call shareholder services at 800.345.6611 and additional reports will be sent to you.
The policy of the Board is to vote the proxies of the companies in which each fund holds investments consistent with the procedures as stated in the Statement of Additional Information (SAI). You may obtain a copy of the SAI without charge by calling 800.345.6611; contacting your financial intermediary; visiting columbiathreadneedle.com/us; or searching the website of the Securities and Exchange Commission (SEC) at sec.gov. Information regarding how each fund voted proxies relating to portfolio securities is filed with the SEC by August 31st for the most recent 12-month period ending June 30th of that year, and is available without charge by visiting columbiathreadneedle.com/us, or searching the website of the SEC at sec.gov.
Each fund files a complete schedule of portfolio holdings with the SEC for the first and third quarters of each fiscal year on Form N-Q. Each fund's Form N-Q is available on the SEC's website at sec.gov and may be reviewed and copied at the SEC's Public Reference Room in Washington, D.C. Information on the operation of the Public Reference Room may be obtained by calling 800.SEC.0330. Each fund's complete schedule of portfolio holdings, as filed on Form N-Q, can also be obtained without charge, upon request, by calling 800.345.6611.
Annual Report 2015
49
Columbia Global Energy and Natural Resources Fund
P.O. Box 8081
Boston, MA 02266-8081

This information is for use with concurrent or prior delivery of a fund prospectus. Please read and consider the investment objectives, risks, charges and expenses for any fund carefully before investing. For a prospectus and summary prospectus, which contains this and other important information about the Fund, go to columbiathreadneedle.com/us. The Fund is distributed by Columbia Management Investment Distributors, Inc., member FINRA, and managed by Columbia Management Investment Advisers, LLC.
Columbia Threadneedle Investments (Columbia Threadneedle) is the global brand name of the Columbia and Threadneedle group of companies.
All rights reserved. Columbia Management Investment Distributors, Inc., 225 Franklin Street, Boston, MA 02110-2804
© 2015 Columbia Management Investment Advisers, LLC.
columbiathreadneedle.com/us
ANN144_08_E01_(10/15)

ANNUAL REPORT
August 31, 2015

COLUMBIA GLOBAL TECHNOLOGY GROWTH FUND

ABOUT COLUMBIA THREADNEEDLE INVESTMENTS
Columbia Threadneedle Investments is a leading global asset management group that provides a broad range of actively managed investment strategies and solutions for individual, institutional and corporate clients around the world.
With more than 2,000 people, including over 450 investment professionals based in North America, Europe and Asia, we manage $503 billion* of assets across developed and emerging market equities, fixed income, asset allocation solutions and alternatives. We are the 13th largest manager of long-term mutual fund assets in the U.S.** and the 4th largest manager of retail funds in the U.K.***
Our priority is the investment success of our clients. We aim to deliver the investment outcomes they expect through an investment approach that is team-based, performance-driven and risk-aware. Our culture is dynamic and interactive. By sharing our insights across asset classes and geographies, we generate richer perspectives on global, regional and local investment landscapes. The ability to exchange and debate investment ideas in a collaborative environment enriches our teams' investment processes. More importantly, it results in better informed investment decisions for our clients.
Columbia funds are distributed by Columbia Management Investment Distributors, Inc., member FINRA, and managed by Columbia Management Investment Advisers, LLC.
Columbia Threadneedle Investments (Columbia Threadneedle) is the global brand name of the Columbia and Threadneedle group of companies.
* In U.S. dollars as of June 30, 2015. Source: Ameriprise Q2 Earnings Release. Includes all assets managed by entities in the Columbia and Threadneedle groups of companies. Contact us for more current data.
** Source: ICI as of June 30, 2015 for Columbia Management Investment Advisers, LLC.
*** Source: Investment Association as of June 2015 for Threadneedle Asset Management Limited.
© 2015 Columbia Management Investment Advisers, LLC. All rights reserved.
Not part of the shareholder report
Get the market insight you need from our investment experts
Connect with Columbia Threadneedle Investments
Investor insight
Find economic and market commentary, investment videos, white papers, mutual fund commentary and more at columbiathreadneedle.com/us.
Columbia Threadneedle Investor Newsletter (e-newsletter)
Read our award-winning* shareholder newsletter. Our quarterly newsletter is available online and provides timely and relevant content about economic trends, fund news, service enhancements and changes. Sign up to receive the newsletter electronically at columbiathreadneedle.com/
us/newsletter.
Investment videos
Get analysis of current events and trends that may affect your investments. Visit our online video library to watch and discover what our thought leaders are saying about the financial markets and economy.
Social media
We offer you multiple ways to access our market commentary and investment insights.
n Perspectives blog at columbiathreadneedle.com/us
Read timely posts by our investment team, including our chief investment officer, chief economist and portfolio managers.
n twitter.com/CTinvest_US
Follow us on Twitter for quick, up-to-the-minute comments on market news and more.
n youtube.com/CTinvestUS
View our commentaries on the economy, markets and current investment opportunities.
n linkedin.com/company/columbia-threadneedle-investments-us
Connect with us on LinkedIn for updates from our thought leaders.
*Columbia Threadneedle Investor Newsletter was awarded top honors in the Mutual Fund Education Alliance STAR Awards competition for excellence in mutual fund marketing and communications in 2011, 2012 and 2013. Materials in the competition were evaluated on educational value, message comprehension, effective design and objectives.
Not part of the shareholder report
 Dear Shareholder,
Today's investors are typically focused on outcomes, like living a certain retirement lifestyle, paying for college education or building a legacy. But in today's complex global investment landscape, even simple goals are not easily achieved.
At Columbia Threadneedle Investments, we aspire to help satisfy five core needs of today's investors:
n Generate an appropriate stream of income in retirement
Traditional approaches to generating income may not provide the diversification benefits they once did, and they may actually introduce unwanted risk in today's market. To seek to improve your potential to live comfortably long term, we endeavor to pursue investments that explore less traveled paths to income.
n Navigate a changing interest rate environment
Today's uncertain market environment includes the prospect of a rise in interest rates. Blending traditional investments with non-traditional or alternative products may help protect your wealth during periods of volatility. We can attempt to help strengthen your portfolio with agile products designed to take on the market's ups and downs.
n Maximize after-tax returns
In an environment where what you keep may be more important than what you earn, municipal bonds can help mitigate high tax burdens while providing potentially attractive yields. Our state and federal tax-exempt products are aimed at helping investors manage risk, minimize the fluctuation of capital and grow wealth on a more tax-efficient basis.
n Grow assets to achieve financial goals
We believe that finding and protecting growth comes from a disciplined security selection process designed to create excess return. Our goal is to provide investment solutions built to help you face today's market challenges and grow your assets at each crossroad of your journey.
n Ease the impact of volatile markets
Despite a bull market run that has benefited many investors over the past several years, it's important to remember the lessons of 2008 and the value that a well-diversified portfolio may provide through times of market volatility. We are here to help you hold onto the savings you have worked tirelessly to amass, and to provide you the best opportunity to maintain your standard of living regardless of market conditions.
Find out today how we can help you confidently invest to realize your dreams. Please visit us at blog.columbiathreadneedleus.com/our-best-ideas to learn more about our unique investment solutions.
The world is constantly changing, but our priority remains the same: to help you secure your finances, meet your goals and achieve success. Thank you for your continued investment with us.
Sincerely,

Christopher O. Petersen
President, Columbia Funds
Investors should consider the investment objectives, risks, charges and expenses of a mutual fund carefully before investing. For a free prospectus and summary prospectus, which contains this and other important information about a fund, visit columbiathreadneedle.com/us. The prospectus should be read carefully before investing.
Columbia Funds are distributed by Columbia Management Investment Distributors, Inc., member FINRA, and managed by Columbia Management Investment Advisers, LLC.
© 2015 Columbia Management Investment Advisers, LLC. All rights reserved.
COLUMBIA GLOBAL TECHNOLOGY GROWTH FUND
Performance Overview | | | 2 | | |
Manager Discussion of Fund Performance | | | 4 | | |
Understanding Your Fund's Expenses | | | 7 | | |
Portfolio of Investments | | | 8 | | |
Statement of Assets and Liabilities | | | 13 | | |
Statement of Operations | | | 15 | | |
Statement of Changes in Net Assets | | | 16 | | |
Financial Highlights | | | 18 | | |
Notes to Financial Statements | | | 25 | | |
Report of Independent Registered
Public Accounting Firm | | | 32 | | |
Federal Income Tax Information | | | 33 | | |
Trustees and Officers | | | 34 | | |
Board Consideration and Approval of Advisory Agreement | | | 38 | | |
Important Information About This Report | | | 43 | | |
Fund Investment Manager
Columbia Management Investment
Advisers, LLC
225 Franklin Street
Boston, MA 02110
Fund Distributor
Columbia Management Investment
Distributors, Inc.
225 Franklin Street
Boston, MA 02110
Fund Transfer Agent
Columbia Management Investment
Services Corp.
P.O. Box 8081
Boston, MA 02266-8081
For more information about any of the funds, please visit columbiathreadneedle.com/us or call 800.345.6611. Customer Service Representatives are available to answer your questions Monday through Friday from 8 a.m. to 7 p.m. Eastern time.
The views expressed in this report reflect the current views of the respective parties. These views are not guarantees of future performance and involve certain risks, uncertainties and assumptions that are difficult to predict, so actual outcomes and results may differ significantly from the views expressed. These views are subject to change at any time based upon economic, market or other conditions and the respective parties disclaim any responsibility to update such views. These views may not be relied on as investment advice and, because investment decisions for a Columbia fund are based on numerous factors, may not be relied on as an indication of trading intent on behalf of any particular Columbia fund. References to specific securities should not be construed as a recommendation or investment advice.
COLUMBIA GLOBAL TECHNOLOGY GROWTH FUND
Performance Summary
n Columbia Global Technology Growth Fund (the Fund) Class A shares returned 5.70% excluding sales charges for the 12-month period that ended August 31, 2015.
n The Fund significantly outperformed its benchmark, the Bank of America Merrill Lynch (BofAML) 100 Technology Index, which returned -0.26% for the same period.
n Stock selection aided the Fund's performance vs. its benchmark, particularly in the hardware, electronic equipment, semiconductors and software segments.
Average Annual Total Returns (%) (for period ended August 31, 2015)
| | | Inception | | 1 Year | | 5 Years | | 10 Years | |
Class A | | 11/01/02 | | | | | | | | | | | | | |
Excluding sales charges | | | | | | | 5.70 | | | | 17.04 | | | | 9.33 | | |
Including sales charges | | | | | | | -0.38 | | | | 15.67 | | | | 8.68 | | |
Class B | | 11/01/02 | | | | | | | | | | | | | |
Excluding sales charges | | | | | | | 4.92 | | | | 16.16 | | | | 8.52 | | |
Including sales charges | | | | | | | -0.08 | | | | 15.94 | | | | 8.52 | | |
Class C | | 10/13/03 | | | | | | | | | | | | | |
Excluding sales charges | | | | | | | 4.91 | | | | 16.14 | | | | 8.51 | | |
Including sales charges | | | | | | | 3.91 | | | | 16.14 | | | | 8.51 | | |
Class I* | | 03/25/15 | | | 6.09 | | | | 17.34 | | | | 9.60 | | |
Class R4* | | 11/08/12 | | | 6.04 | | | | 17.34 | | | | 9.60 | | |
Class R5* | | 11/08/12 | | | 6.13 | | | | 17.43 | | | | 9.65 | | |
Class Z | | 11/09/00 | | | 6.00 | | | | 17.32 | | | | 9.59 | | |
BofAML 100 Technology Index | | | | | | | -0.26 | | | | 13.07 | | | | 6.91 | | |
Returns for Class A are shown with and without the maximum initial sales charge of 5.75%. Returns for Class B are shown with and without the applicable contingent deferred sales charge (CDSC) of 5.00% in the first year, declining to 1.00% in the sixth year and eliminated thereafter. Returns for Class C are shown with and without the 1.00% CDSC for the first year only. The Fund's other classes are not subject to sales charges and have limited eligibility. Please see the Fund's prospectus for details. Performance for different share classes will vary based on differences in sales charges and fees associated with each class. All results shown assume reinvestment of distributions during the period. Returns do not reflect the deduction of taxes that a shareholder may pay on Fund distributions or on the redemption of Fund shares. Performance results reflect the effect of any fee waivers or reimbursements of Fund expenses by Columbia Management Investment Advisers, LLC and/or any of its affiliates. Absent these fee waivers or expense reimbursement arrangements, performance results would have been lower.
The performance information shown represents past performance and is not a guarantee of future results. The investment return and principal value of your investment will fluctuate so that your shares, when redeemed, may be worth more or less than their original cost. Current performance may be lower or higher than the performance information shown. You may obtain performance information current to the most recent month-end by contacting your financial intermediary, visiting columbiathreadneedle.com/us or calling 800.345.6611.
*The returns shown for periods prior to the share class inception date (including returns for the Life of the Fund, if shown, which are since Fund inception) include the returns of the Fund's oldest share class. These returns are adjusted to reflect any higher class-related operating expenses of the newer share classes, as applicable. Please visit columbiathreadneedle.com/us/investment-products/mutual-funds/appended-performance for more information.
The BofAML 100 Technology Index is an unmanaged equally weighted index of 100 leading technology stocks.
Indices are not available for investment, are not professionally managed and do not reflect sales charges, fees, brokerage commissions, taxes or other expenses of investing. Securities in the Fund may not match those in an index.
Annual Report 2015
2
COLUMBIA GLOBAL TECHNOLOGY GROWTH FUND
PERFORMANCE OVERVIEW (continued)
Performance of a Hypothetical $10,000 Investment (September 1, 2005 – August 31, 2015)
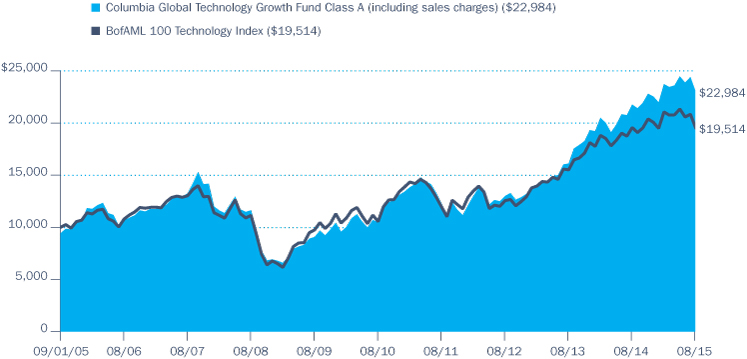
The chart above shows the change in value of a hypothetical $10,000 investment in Class A shares of Columbia Global Technology Growth Fund during the stated time period, and does not reflect the deduction of taxes that a shareholder may pay on Fund distributions or on the redemption of Fund shares.
Annual Report 2015
3
COLUMBIA GLOBAL TECHNOLOGY GROWTH FUND
MANAGER DISCUSSION OF FUND PERFORMANCE
Portfolio Management
Wayne Collette, CFA
Rahul Narang
Top Ten Holdings (%)
(at August 31, 2015) | |
Google, Inc., Class A
(United States) | | | 6.0 | | |
Apple, Inc. (United States) | | | 3.9 | | |
Facebook, Inc., Class A
(United States) | | | 3.3 | | |
Amazon.com, Inc.
(United States) | | | 2.8 | | |
Visa, Inc., Class A
(United States) | | | 2.7 | | |
Cisco Systems, Inc.
(United States) | | | 2.3 | | |
Activision Blizzard, Inc.
(United States) | | | 2.1 | | |
Lam Research Corp.
(United States) | | | 1.9 | | |
Skyworks Solutions, Inc.
(United States) | | | 1.8 | | |
Microsoft Corp. (United States) | | | 1.8 | | |
Percentages indicated are based upon total investments (excluding Money Market Funds).
For further detail about these holdings, please refer to the section entitled "Portfolio of Investments."
Fund holdings are as of the date given, are subject to change at any time, and are not recommendations to buy or sell any security.
For the 12-month period that ended August 31, 2015, the Fund's Class A shares returned 5.70% excluding sales charges. The Fund outperformed its benchmark, the Bank of America Merrill Lynch (BofAML) 100 Technology Index, which returned -0.26% for the same time period. Stock selection aided the Fund's performance vs. its benchmark, particularly in the hardware, electronic equipment, semiconductors and software segments.
Mixed Results for Global Economy
The global economy produced mixed results during the 12-month period as it grappled with lower energy prices, slower growth in China and the transition to normalization of U.S. monetary policy. The U.S. economy picked up momentum after a weak start in 2015, as manufacturing activity rebounded with the spring weather and job growth remained strong. The economies of the UK and Europe inched ahead despite the ongoing Greek debt crisis. Most Asia/Pacific economies expanded nicely in 2015, although Japan's recovery from recession has been tentative, with an up-and-down performance over the past year. In China, growth weakened more than expected and wreaked havoc on markets worldwide.
Currency fluctuation had a significant impact on financial markets over the year. The U.S. dollar strengthened against the yen and the British pound. Currencies of commodity-export countries in Latin America, as well as the currencies of Russia, Australia and South Africa weakened sharply.
Stock Selection Drove Fund's Performance Advantage
Against this backdrop, the Fund gained ground against its benchmark and logged solid gains for shareholders. Stock selection and decisions on individual security weights both figured into the Fund's performance advantage. In the technology hardware segment, an overweight in Apple continued to make a strong contribution to Fund returns and to its performance relative to the benchmark. Apple shares rose as the company continued to out-innovate its competitors and reported solid revenue, earnings and free cash flow during period, driven primarily by robust iPhone sales. Positive investor sentiment reflected high expectations for Apple's rollout of new products in the second half of 2015. We also did well to underweight or avoid many of the biggest losers within hardware and electronic equipment holdings in the benchmark, further aiding relative returns.
Within the semiconductor and semiconductor equipment industry, an overweight in Skyworks Solutions benefited results. Skyworks Solutions experienced increased demand for its amplifiers and filters. The company manufactures semiconductors for use in radio frequency and mobile communications systems. The Fund also benefited from a position in Qorvo, which is not in the benchmark. Qorvo is an American semiconductor company that designs, manufactures, and supplies radio frequency systems and solutions for wireless and broadband applications. The company was created by the merger of TriQuint Semiconductor and RF Micro Devices, which was announced in 2014 and completed on January 1, 2015. RF Micro Devices was an out-of-benchmark portfolio position prior to the merger.
Annual Report 2015
4
COLUMBIA GLOBAL TECHNOLOGY GROWTH FUND
MANAGER DISCUSSION OF FUND PERFORMANCE (continued)
Stock selection in the IT services industry was the Fund's major drag on performance for the period. A combination of individual disappointments and allocations within the industry detracted from relative results.
Looking Ahead
Even though technology stocks have generated strong returns over the past two years, we continue to find opportunities across the sector. Technology's price-to-forward earnings ratio is close to a 30-year low relative to the S&P 500 Index, and technology companies have continued to generate operating performance that is higher than that of the broader market, with higher overall earnings, a high level of cash return to shareholders, the highest level of free cash flow and cash on their balance sheets than any other sector in the benchmark. It is also worth noting that the technology sector is very different than it was in March 2000, when the Nasdaq last hit 5000 just before it crashed. Today, technology has two times the revenue and three times the income for every dollar of market capitalization. Far fewer new technology companies are going public and those that are going public are stronger, more mature businesses. In 1999, the number of technology initial public offerings (IPOs) was close to 400. In 2014, there were about 50 IPOs and in 2015 we expect an even smaller number. Valuations are more attractive, and there is considerable innovation in many industry segments. For these reasons, we remain bullish on technology at this time.
Country Breakdown (%)
(at August 31, 2015) | |
China | | | 4.0 | | |
Guernsey | | | 1.2 | | |
India | | | 0.3 | | |
Ireland | | | 0.3 | | |
Isle of Man | | | 1.1 | | |
Israel | | | 0.9 | | |
Netherlands | | | 2.8 | | |
Singapore | | | 1.4 | | |
South Africa | | | 0.9 | | |
Switzerland | | | 0.8 | | |
Taiwan | | | 0.7 | | |
United States(a) | | | 85.6 | | |
Total | | | 100.0 | | |
Country Breakdown is based primarily on issuer's place of organization/incorporation. The Fund may use this and/or other criteria, for purposes of its investment policies, in determining whether an issuer is domestic (U.S.) or foreign. Percentages indicated are based upon total investments. The Fund's portfolio composition is subject to change.
(a) Includes investments in Money Market Funds.
Equity Sector Breakdown (%)
(at August 31, 2015) | |
Consumer Discretionary | | | 10.5 | | |
Industrials | | | 0.2 | | |
Information Technology | | | 88.2 | | |
Telecommunication Services | | | 1.1 | | |
Total | | | 100.0 | | |
Percentages indicated are based upon total equity investments. The Fund's portfolio composition is subject to change.
Annual Report 2015
5
COLUMBIA GLOBAL TECHNOLOGY GROWTH FUND
MANAGER DISCUSSION OF FUND PERFORMANCE (continued)
Equity Sub-Industry Breakdown (%)
(at August 31, 2015) | |
Information Technology | |
Application Software | | | 9.2 | | |
Communications Equipment | | | 5.0 | | |
Data Processing &
Outsourced Services | | | 11.6 | | |
Electronic Components | | | 1.4 | | |
Electronic Manufacturing
Services | | | 0.9 | | |
Home Entertainment Software | | | 3.7 | | |
Internet Software & Services | | | 17.7 | | |
IT Consulting & Other Services | | | 3.5 | | |
Semiconductor Equipment | | | 3.8 | | |
Semiconductors | | | 16.8 | | |
Systems Software | | | 7.6 | | |
Technology Hardware,
Storage & Peripherals | | | 7.0 | | |
Total | | | 88.2 | | |
Percentages indicated are based upon total equity investments. The Fund's portfolio composition is subject to change.
Investment Risks
Market risk may affect a single issuer, sector of the economy, industry or the market as a whole. The products of technology companies may be subject to severe competition and rapid obsolescence, and technology stocks may be subject to greater price fluctuations. Growth securities, at times, may not perform as well as value securities or the stock market in general and may be out of favor with investors. Foreign investments subject the Fund to risks, including political, economic, market, social and others within a particular country, as well as to currency instabilities and less stringent financial and accounting standards generally applicable to U.S. issuers. Risks are enhanced for emerging market issuers. As a non-diversified fund, fewer investments could have a greater effect on performance. See the Fund's prospectus for more information on these and other risks.
Annual Report 2015
6
COLUMBIA GLOBAL TECHNOLOGY GROWTH FUND
UNDERSTANDING YOUR FUND'S EXPENSES
(Unaudited)
As an investor, you incur two types of costs. There are transaction costs, which generally include sales charges on purchases and may include redemption fees. There are also ongoing costs, which generally include management fees, distribution and/or service fees, and other fund expenses. The following information is intended to help you understand your ongoing costs (in dollars) of investing in the Fund and to help you compare these costs with the ongoing costs of investing in other mutual funds.
Analyzing Your Fund's Expenses
To illustrate these ongoing costs, we have provided examples and calculated the expenses paid by investors in each share class of the Fund during the period. The actual and hypothetical information in the table is based on an initial investment of $1,000 at the beginning of the period indicated and held for the entire period. Expense information is calculated two ways and each method provides you with different information. The amount listed in the "Actual" column is calculated using the Fund's actual operating expenses and total return for the period. You may use the Actual information, together with the amount invested, to estimate the expenses that you paid over the period. Simply divide your account value by $1,000 (for example, an $8,600 account value divided by $1,000 = 8.6), then multiply the results by the expenses paid during the period under the "Actual" column. The amount listed in the "Hypothetical" column assumes a 5% annual rate of return before expenses (which is not the Fund's actual return) and then applies the Fund's actual expense ratio for the period to the hypothetical return. You should not use the hypothetical account values and expenses to estimate either your actual account balance at the end of the period or the expenses you paid during the period. See "Compare With Other Funds" below for details on how to use the hypothetical data.
Compare With Other Funds
Since all mutual funds are required to include the same hypothetical calculations about expenses in shareholder reports, you can use this information to compare the ongoing cost of investing in the Fund with other funds. To do so, compare the hypothetical example with the 5% hypothetical examples that appear in the shareholder reports of other funds. As you compare hypothetical examples of other funds, it is important to note that hypothetical examples are meant to highlight the ongoing costs of investing in a fund only and do not reflect any transaction costs, such as sales charges, or redemption or exchange fees. Therefore, the hypothetical calculations are useful in comparing ongoing costs only, and will not help you determine the relative total costs of owning different funds. If transaction costs were included in these calculations, your costs would be higher.
March 1, 2015 – August 31, 2015
| | | Account Value at the Beginning
of the Period ($) | | Account Value at the End of the
Period ($) | | Expenses Paid During the
Period ($) | | Fund's Annualized
Expense Ratio (%) | |
| | | Actual | | Hypothetical | | Actual | | Hypothetical | | Actual | | Hypothetical | | Actual | |
Class A | | | 1,000.00 | | | | 1,000.00 | | | | 969.40 | | | | 1,018.30 | | | | 6.94 | | | | 7.11 | | | | 1.39 | | |
Class B | | | 1,000.00 | | | | 1,000.00 | | | | 965.50 | | | | 1,014.50 | | | | 10.66 | | | | 10.93 | | | | 2.14 | | |
Class C | | | 1,000.00 | | | | 1,000.00 | | | | 965.60 | | | | 1,014.50 | | | | 10.66 | | | | 10.93 | | | | 2.14 | | |
Class I | | | 1,000.00 | | | | 1,000.00 | | | | 993.50 | (a) | | | 1,020.38 | | | | 4.23 | (a) | | | 5.02 | | | | 0.98 | (a) | |
Class R4 | | | 1,000.00 | | | | 1,000.00 | | | | 970.70 | | | | 1,019.56 | | | | 5.69 | | | | 5.83 | | | | 1.14 | | |
Class R5 | | | 1,000.00 | | | | 1,000.00 | | | | 971.30 | | | | 1,020.27 | | | | 5.00 | | | | 5.12 | | | | 1.00 | | |
Class Z | | | 1,000.00 | | | | 1,000.00 | | | | 970.30 | | | | 1,019.56 | | | | 5.69 | | | | 5.83 | | | | 1.14 | | |
(a) Class I shares are based on operations from March 25, 2015 (commencement of operations) through the stated period end.
Expenses paid during the period are equal to the annualized expense ratio for each class as indicated above, multiplied by the average account value over the period and then multiplied by the number of days in the Fund's most recent fiscal half year and divided by 365.
Expenses do not include fees and expenses incurred indirectly by the Fund from its investment in underlying funds, including affiliated and non-affiliated pooled investment vehicles, such as mutual funds and exchange-traded funds.
Annual Report 2015
7
COLUMBIA GLOBAL TECHNOLOGY GROWTH FUND
PORTFOLIO OF INVESTMENTS
August 31, 2015
(Percentages represent value of investments compared to net assets)
Common Stocks 96.5%
Issuer | | Shares | | Value ($) | |
CHINA 4.0% | |
Alibaba Group Holding Ltd., ADR(a) | | | 36,204 | | | | 2,393,808 | | |
Baidu, Inc., ADR(a) | | | 18,921 | | | | 2,786,117 | | |
JD.com, Inc. ADR(a) | | | 87,793 | | | | 2,272,083 | | |
NetEase, Inc., ADR | | | 29,421 | | | | 3,271,027 | | |
Tencent Holdings Ltd. | | | 276,200 | | | | 4,625,529 | | |
Total | | | | | 15,348,564 | | |
GUERNSEY 1.2% | |
Amdocs Ltd. | | | 79,589 | | | | 4,553,287 | | |
INDIA 0.3% | |
Videocon d2h Ltd. ADR(a) | | | 119,144 | | | | 1,303,435 | | |
IRELAND 0.3% | |
King Digital Entertainment PLC | | | 88,943 | | | | 1,185,610 | | |
ISLE OF MAN 1.1% | |
Eros International PLC(a) | | | 126,133 | | | | 4,177,525 | | |
ISRAEL 0.9% | |
Check Point Software Technologies Ltd.(a) | | | 44,186 | | | | 3,446,950 | | |
NETHERLANDS 2.8% | |
| ASML Holding NV | | | 31,123 | | | | 2,832,816 | | |
Mobileye NV(a) | | | 58,121 | | | | 3,287,324 | | |
NXP Semiconductors NV(a) | | | 55,539 | | | | 4,701,376 | | |
Total | | | | | 10,821,516 | | |
SINGAPORE 1.4% | |
Avago Technologies Ltd. | | | 44,064 | | | | 5,550,742 | | |
SOUTH AFRICA 0.9% | |
MiX Telematics Ltd., ADR(a) | | | 147,607 | | | | 897,450 | | |
Naspers Ltd., Class N | | | 19,315 | | | | 2,503,930 | | |
Total | | | | | 3,401,380 | | |
SWITZERLAND 0.8% | |
TE Connectivity Ltd. | | | 55,483 | | | | 3,289,587 | | |
TAIWAN 0.7% | |
Taiwan Semiconductor Manufacturing
Co., Ltd., ADR | | | 139,237 | | | | 2,768,031 | | |
UNITED STATES 82.1% | |
A10 Networks, Inc.(a) | | | 242,157 | | | | 1,607,922 | | |
Accenture PLC, Class A | | | 41,813 | | | | 3,941,711 | | |
Common Stocks (continued)
Issuer | | Shares | | Value ($) | |
Activision Blizzard, Inc. | | | 277,182 | | | | 7,935,721 | | |
Adobe Systems, Inc.(a) | | | 54,328 | | | | 4,268,551 | | |
Akamai Technologies, Inc.(a) | | | 62,909 | | | | 4,486,041 | | |
Alliance Data Systems Corp.(a) | | | 16,271 | | | | 4,184,738 | | |
Altera Corp. | | | 63,172 | | | | 3,067,001 | | |
Amazon.com, Inc.(a) | | | 20,422 | | | | 10,474,240 | | |
Amphenol Corp., Class A | | | 74,932 | | | | 3,923,439 | | |
Analog Devices, Inc. | | | 66,989 | | | | 3,742,006 | | |
Apple, Inc. | | | 130,707 | | | | 14,738,521 | | |
Applied Materials, Inc. | | | 158,830 | | | | 2,554,781 | | |
Autodesk, Inc.(a) | | | 65,209 | | | | 3,048,521 | | |
Automatic Data Processing, Inc. | | | 49,143 | | | | 3,799,737 | | |
Barracuda Networks, Inc.(a) | | | 17,814 | | | | 468,330 | | |
Blackhawk Network Holdings, Inc.(a) | | | 4,380 | | | | 173,054 | | |
Broadcom Corp., Class A | | | 73,242 | | | | 3,784,414 | | |
Cavium, Inc.(a) | | | 22,778 | | | | 1,549,360 | | |
Cisco Systems, Inc. | | | 340,546 | | | | 8,813,330 | | |
Cognizant Technology Solutions Corp.,
Class A(a) | | | 71,816 | | | | 4,520,099 | | |
Comcast Corp., Class A | | | 50,788 | | | | 2,860,888 | | |
Computer Sciences Corp. | | | 43,968 | | | | 2,725,576 | | |
Corning, Inc. | | | 81,998 | | | | 1,411,186 | | |
eBay, Inc.(a) | | | 47,586 | | | | 1,290,056 | | |
Electronic Arts, Inc.(a) | | | 89,245 | | | | 5,903,557 | | |
EMC Corp. | | | 96,782 | | | | 2,406,968 | | |
Equinix, Inc. | | | 11,485 | | | | 3,098,308 | | |
Expedia, Inc. | | | 16,576 | | | | 1,906,074 | | |
Facebook, Inc., Class A(a) | | | 138,193 | | | | 12,358,600 | | |
Fidelity National Information Services, Inc. | | | 55,177 | | | | 3,810,524 | | |
Fiserv, Inc.(a) | | | 64,182 | | | | 5,472,799 | | |
FleetCor Technologies, Inc.(a) | | | 27,248 | | | | 4,064,312 | | |
Freescale Semiconductor Holdings I Ltd.(a) | | | 50,597 | | | | 1,807,831 | | |
Google, Inc., Class A(a) | | | 34,577 | | | | 22,399,672 | | |
GoPro, Inc., Class A(a) | | | 20,841 | | | | 970,982 | | |
Guidewire Software, Inc.(a) | | | 47,321 | | | | 2,645,717 | | |
Hewlett-Packard Co. | | | 46,668 | | | | 1,309,504 | | |
Infinera Corp.(a) | | | 16,923 | | | | 369,260 | | |
Intel Corp. | | | 116,741 | | | | 3,331,788 | | |
Intuit, Inc. | | | 41,944 | | | | 3,596,698 | | |
KLA-Tencor Corp. | | | 36,542 | | | | 1,831,120 | | |
The accompanying Notes to Financial Statements are an integral part of this statement.
Annual Report 2015
8
COLUMBIA GLOBAL TECHNOLOGY GROWTH FUND
PORTFOLIO OF INVESTMENTS (continued)
August 31, 2015
Common Stocks (continued)
Issuer | | Shares | | Value ($) | |
Lam Research Corp. | | | 97,880 | | | | 7,122,728 | | |
Linear Technology Corp. | | | 69,724 | | | | 2,808,483 | | |
LinkedIn Corp., Class A(a) | | | 20,810 | | | | 3,758,286 | | |
Marvell Technology Group Ltd. | | | 77,523 | | | | 873,684 | | |
MasterCard, Inc., Class A | | | 32,643 | | | | 3,015,234 | | |
Maxim Integrated Products, Inc. | | | 128,594 | | | | 4,329,760 | | |
Microchip Technology, Inc. | | | 83,129 | | | | 3,532,982 | | |
Micron Technology, Inc.(a) | | | 120,910 | | | | 1,984,133 | | |
Microsemi Corp.(a) | | | 25,495 | | | | 809,721 | | |
Microsoft Corp. | | | 151,376 | | | | 6,587,883 | | |
Motorola Solutions, Inc. | | | 23,096 | | | | 1,497,083 | | |
Netflix, Inc.(a) | | | 33,527 | | | | 3,856,611 | | |
NVIDIA Corp. | | | 189,968 | | | | 4,270,481 | | |
Oracle Corp. | | | 104,946 | | | | 3,892,447 | | |
Palo Alto Networks, Inc.(a) | | | 30,363 | | | | 4,986,212 | | |
Paychex, Inc. | | | 43,914 | | | | 1,961,199 | | |
PayPal Holdings, Inc.(a) | | | 47,640 | | | | 1,667,400 | | |
Power Integrations, Inc. | | | 30,216 | | | | 1,185,978 | | |
Priceline Group, Inc. (The)(a) | | | 3,727 | | | | 4,653,681 | | |
PTC, Inc.(a) | | | 34,017 | | | | 1,126,643 | | |
QLIK Technologies, Inc.(a) | | | 60,045 | | | | 2,273,304 | | |
QUALCOMM, Inc. | | | 39,922 | | | | 2,258,787 | | |
Rambus, Inc.(a) | | | 95,026 | | | | 1,276,199 | | |
Red Hat, Inc.(a) | | | 59,109 | | | | 4,268,261 | | |
Ruckus Wireless, Inc.(a) | | | 68,370 | | | | 773,948 | | |
Salesforce.com, inc.(a) | | | 88,551 | | | | 6,141,897 | | |
SanDisk Corp. | | | 32,317 | | | | 1,763,215 | | |
SBA Communications Corp., Class A(a) | | | 33,505 | | | | 3,960,291 | | |
Seagate Technology PLC | | | 54,803 | | | | 2,816,874 | | |
ServiceNow, Inc.(a) | | | 15,924 | | | | 1,129,967 | | |
Silicon Laboratories, Inc.(a) | | | 17,912 | | | | 778,814 | | |
Skyworks Solutions, Inc. | | | 78,608 | | | | 6,866,409 | | |
Common Stocks (continued)
Issuer | | Shares | | Value ($) | |
Splunk, Inc.(a) | | | 50,894 | | | | 3,153,901 | | |
Synopsys, Inc.(a) | | | 75,476 | | | | 3,542,089 | | |
Tableau Software, Inc., Class A(a) | | | 28,222 | | | | 2,657,666 | | |
Texas Instruments, Inc. | | | 83,663 | | | | 4,002,438 | | |
Total System Services, Inc. | | | 46,972 | | | | 2,152,727 | | |
VeriSign, Inc.(a) | | | 69,873 | | | | 4,817,045 | | |
Visa, Inc., Class A | | | 144,591 | | | | 10,309,338 | | |
VMware, Inc., Class A(a) | | | 53,266 | | | | 4,216,004 | | |
Walt Disney Co. (The) | | | 41,836 | | | | 4,262,252 | | |
Western Digital Corp. | | | 37,572 | | | | 3,079,401 | | |
Workiva, Inc.(a) | | | 10,726 | | | | 153,704 | | |
Yahoo!, Inc.(a) | | | 40,375 | | | | 1,301,690 | | |
Total | | | | | 318,529,787 | | |
Total Common Stocks
(Cost: $318,452,086) | | | | | 374,376,414 | | |
Exchange-Traded Funds 0.4%
Market Vectors Semiconductor ETF | | | 29,839 | | | | 1,478,523 | | |
Total Exchange-Traded Funds
(Cost: $1,314,842) | | | | | 1,478,523 | | |
Money Market Funds 3.1%
| | | Shares | | Value ($) | |
Columbia Short-Term Cash Fund,
0.150%(b)(c) | | | 12,140,396 | | | | 12,140,396 | | |
Total Money Market Funds
(Cost: $12,140,396) | | | | | 12,140,396 | | |
Total Investments
(Cost: $331,907,324) | | | | | 387,995,333 | | |
Other Assets & Liabilities, Net | | | | | 188,973 | | |
Net Assets | | | | | 388,184,306 | | |
Notes to Portfolio of Investments
(a) Non-income producing investment.
(b) The rate shown is the seven-day current annualized yield at August 31, 2015.
The accompanying Notes to Financial Statements are an integral part of this statement.
Annual Report 2015
9
COLUMBIA GLOBAL TECHNOLOGY GROWTH FUND
PORTFOLIO OF INVESTMENTS (continued)
August 31, 2015
Notes to Portfolio of Investments (continued)
(c) As defined in the Investment Company Act of 1940, an affiliated company is one in which the Fund owns 5% or more of the company's outstanding voting securities, or a company which is under common ownership or control with the Fund. Holdings and transactions in these affiliated companies during the year ended August 31, 2015 are as follows:
Issuer | | Beginning
Cost ($) | | Purchase
Cost ($) | | Proceeds
From Sales ($) | | Ending
Cost ($) | | Dividends —
Affiliated
Issuers ($) | | Value ($) | |
Columbia Short-Term Cash Fund | | | 4,768,139 | | | | 130,345,073 | | | | (122,972,816 | ) | | | 12,140,396 | | | | 8,334 | | | | 12,140,396 | | |
Abbreviation Legend
ADR American Depositary Receipt
Fair Value Measurements
The Fund categorizes its fair value measurements according to a three-level hierarchy that maximizes the use of observable inputs and minimizes the use of unobservable inputs by prioritizing that the most observable input be used when available. Observable inputs are those that market participants would use in pricing an investment based on market data obtained from sources independent of the reporting entity. Unobservable inputs are those that reflect the Fund's assumptions about the information market participants would use in pricing an investment. An investment's level within the fair value hierarchy is based on the lowest level of any input that is deemed significant to the asset's or liability's fair value measurement. The input levels are not necessarily an indication of the risk or liquidity associated with investments at that level. For example, certain U.S. government securities are generally high quality and liquid, however, they are reflected as Level 2 because the inputs used to determine fair value may not always be quoted prices in an active market.
Fair value inputs are summarized in the three broad levels listed below:
> Level 1 — Valuations based on quoted prices for investments in active markets that the Fund has the ability to access at the measurement date (including NAV for open-end mutual funds). Valuation adjustments are not applied to Level 1 investments.
> Level 2 — Valuations based on other significant observable inputs (including quoted prices for similar securities, interest rates, prepayment speeds, credit risks, etc.).
> Level 3 — Valuations based on significant unobservable inputs (including the Fund's own assumptions and judgment in determining the fair value of investments).
Inputs that are used in determining fair value of an investment may include price information, credit data, volatility statistics, and other factors. These inputs can be either observable or unobservable. The availability of observable inputs can vary between investments, and is affected by various factors such as the type of investment, and the volume and level of activity for that investment or similar investments in the marketplace. The inputs will be considered by the Investment Manager, along with any other relevant factors in the calculation of an investment's fair value. The Fund uses prices and inputs that are current as of the measurement date, which may include periods of market dislocations. During these periods, the availability of prices and inputs may be reduced for many investments. This condition could cause an investment to be reclassified between the various levels within the hierarchy.
Foreign equity securities actively traded in markets where there is a significant delay in the local close relative to the New York Stock Exchange (NYSE) are classified as Level 2. The values of these securities may include an adjustment to reflect the impact of significant market movements following the close of local trading, as described in Note 2 to the financial statements — Security Valuation.
Investments falling into the Level 3 category are primarily supported by quoted prices from brokers and dealers participating in the market for those investments. However, these may be classified as Level 3 investments due to lack of market transparency and corroboration to support these quoted prices. Additionally, valuation models may be used as the pricing source for any remaining investments classified as Level 3. These models may rely on one or more significant unobservable inputs and/or significant assumptions by the Investment Manager. Inputs used in valuations may include, but are not limited to, financial statement analysis, capital account balances, discount rates and estimated cash flows, and comparable company data.
Under the direction of the Fund's Board of Trustees (the Board), the Investment Manager's Valuation Committee (the Committee) is responsible for overseeing the valuation procedures approved by the Board. The Committee consists of voting and non-voting members from various groups within the Investment Manager's organization, including operations and accounting, trading and investments, compliance, risk management and legal.
The Committee meets at least monthly to review and approve valuation matters, which may include a description of specific valuation determinations, data regarding pricing information received from approved pricing vendors and brokers and the results of Board-approved valuation control policies and procedures (the Policies). The Policies address, among other things, instances when market quotations are or are not readily available, including recommendations of third party pricing vendors and a determination of appropriate pricing methodologies; events that require specific valuation determinations and assessment of fair value techniques; securities with a potential for stale pricing,
The accompanying Notes to Financial Statements are an integral part of this statement.
Annual Report 2015
10
COLUMBIA GLOBAL TECHNOLOGY GROWTH FUND
PORTFOLIO OF INVESTMENTS (continued)
August 31, 2015
Fair Value Measurements (continued)
including those that are illiquid, restricted, or in default; and the effectiveness of third party pricing vendors, including periodic reviews of vendors. The Committee meets more frequently, as needed, to discuss additional valuation matters, which may include the need to review back-testing results, review time-sensitive information or approve related valuation actions. The Committee reports to the Board, with members of the Committee meeting with the Board at each of its regularly scheduled meetings to discuss valuation matters and actions during the period, similar to those described earlier.
For investments categorized as Level 3, the Committee monitors information similar to that described above, which may include: (i) data specific to the issuer or comparable issuers, (ii) general market or specific sector news and (iii) quoted prices and specific or similar security transactions. The Committee considers this data and any changes from prior periods in order to assess the reasonableness of observable and unobservable inputs, any assumptions or internal models used to value those securities and changes in fair value. This data is also used to corroborate, when available, information received from approved pricing vendors and brokers. Various factors impact the frequency of monitoring this information (which may occur as often as daily). However, the Committee may determine that changes to inputs, assumptions and models are not required as a result of the monitoring procedures performed.
The following table is a summary of the inputs used to value the Fund's investments at August 31, 2015:
| | | Level 1
Quoted Prices in Active
Markets for Identical
Assets ($) | | Level 2
Other Significant
Observable Inputs ($) | | Level 3
Significant
Unobservable Inputs ($) | | Total ($) | |
Investments | |
Common Stocks | |
China | | | 10,723,035 | | | | 4,625,529 | | | | — | | | | 15,348,564 | | |
Guernsey | | | 4,553,287 | | | | — | | | | — | | | | 4,553,287 | | |
India | | | 1,303,435 | | | | — | | | | — | | | | 1,303,435 | | |
Ireland | | | 1,185,610 | | | | — | | | | — | | | | 1,185,610 | | |
Isle of Man | | | 4,177,525 | | | | — | | | | — | | | | 4,177,525 | | |
Israel | | | 3,446,950 | | | | — | | | | — | | | | 3,446,950 | | |
Netherlands | | | 10,821,516 | | | | — | | | | — | | | | 10,821,516 | | |
Singapore | | | 5,550,742 | | | | — | | | | — | | | | 5,550,742 | | |
South Africa | | | 897,450 | | | | 2,503,930 | | | | — | | | | 3,401,380 | | |
Switzerland | | | 3,289,587 | | | | — | | | | — | | | | 3,289,587 | | |
Taiwan | | | 2,768,031 | | | | — | | | | — | | | | 2,768,031 | | |
United States | | | 318,529,787 | | | | — | | | | — | | | | 318,529,787 | | |
Total Common Stocks | | | 367,246,955 | | | | 7,129,459 | | | | — | | | | 374,376,414 | | |
Exchange-Traded Funds | | | 1,478,523 | | | | — | | | | — | | | | 1,478,523 | | |
Money Market Funds | | | — | | | | 12,140,396 | | | | — | | | | 12,140,396 | | |
Total Investments | | | 368,725,478 | | | | 19,269,855 | | | | — | | | | 387,995,333 | | |
See the Portfolio of Investments for all investment classifications not indicated in the table.
The Fund's assets assigned to the Level 2 input category are generally valued using the market approach, in which a security's value is determined through reference to prices and information from market transactions for similar or identical assets. These assets include certain foreign securities for which a third party statistical pricing service may be employed for purposes of fair market valuation. The model utilized by such third party statistical pricing service takes into account a security's correlation to available market data including, but not limited to, intraday index, ADR, and exchange-traded fund movements.
Financial assets were transferred from Level 1 to Level 2 as the market for these assets is not considered publicly available. Fund per share market values were obtained using observable market inputs.
The accompanying Notes to Financial Statements are an integral part of this statement.
Annual Report 2015
11
COLUMBIA GLOBAL TECHNOLOGY GROWTH FUND
PORTFOLIO OF INVESTMENTS (continued)
August 31, 2015
Fair Value Measurements (continued)
The following table shows transfers between Level 1 and Level 2 of the fair value hierarchy:
Transfers In | | Transfers Out | |
| Level 1 ($) | | Level 2 ($) | | Level 1 ($) | | Level 2 ($) | |
| | — | | | | 4,768,139 | | | | 4,768,139 | | | | — | | |
Transfers between Level 1 and Level 2 are determined based on the fair value at the beginning of the period for security positions held throughout the period.
There were no transfers of financial assets between Levels 2 and 3 during the period.
The accompanying Notes to Financial Statements are an integral part of this statement.
Annual Report 2015
12
COLUMBIA GLOBAL TECHNOLOGY GROWTH FUND
STATEMENT OF ASSETS AND LIABILITIES
August 31, 2015
Assets | |
Investments, at value | |
Unaffiliated issuers (identified cost $319,766,928) | | $ | 375,854,937 | | |
Affiliated issuers (identified cost $12,140,396) | | | 12,140,396 | | |
Total investments (identified cost $331,907,324) | | | 387,995,333 | | |
Receivable for: | |
Investments sold | | | 626,871 | | |
Capital shares sold | | | 3,393,930 | | |
Dividends | | | 288,093 | | |
Prepaid expenses | | | 3,462 | | |
Trustees' deferred compensation plan | | | 35,421 | | |
Other assets | | | 700 | | |
Total assets | | | 392,343,810 | | |
Liabilities | |
Payable for: | |
Investments purchased | | | 2,968,692 | | |
Capital shares purchased | | | 1,010,643 | | |
Investment management fees | | | 27,939 | | |
Distribution and/or service fees | | | 6,075 | | |
Transfer agent fees | | | 70,522 | | |
Compensation of board members | | | 350 | | |
Chief compliance officer expenses | | | 27 | | |
Other expenses | | | 39,835 | | |
Trustees' deferred compensation plan | | | 35,421 | | |
Total liabilities | | | 4,159,504 | | |
Net assets applicable to outstanding capital stock | | $ | 388,184,306 | | |
Represented by | |
Paid-in capital | | $ | 324,402,574 | | |
Excess of distributions over net investment income | | | (33,644 | ) | |
Accumulated net realized gain | | | 7,727,367 | | |
Unrealized appreciation (depreciation) on: | |
Investments | | | 56,088,009 | | |
Total — representing net assets applicable to outstanding capital stock | | $ | 388,184,306 | | |
The accompanying Notes to Financial Statements are an integral part of this statement.
Annual Report 2015
13
COLUMBIA GLOBAL TECHNOLOGY GROWTH FUND
STATEMENT OF ASSETS AND LIABILITIES (continued)
August 31, 2015
Class A | |
Net assets | | $ | 131,078,585 | | |
Shares outstanding | | | 7,137,674 | | |
Net asset value per share | | $ | 18.36 | | |
Maximum offering price per share(a) | | $ | 19.48 | | |
Class B | |
Net assets | | $ | 1,152,903 | | |
Shares outstanding | | | 68,584 | | |
Net asset value per share | | $ | 16.81 | | |
Class C | |
Net assets | | $ | 39,659,858 | | |
Shares outstanding | | | 2,354,807 | | |
Net asset value per share | | $ | 16.84 | | |
Class I | |
Net assets | | $ | 32,235,361 | | |
Shares outstanding | | | 1,623,715 | | |
Net asset value per share | | $ | 19.85 | | |
Class R4 | |
Net assets | | $ | 8,345,352 | | |
Shares outstanding | | | 434,973 | | |
Net asset value per share | | $ | 19.19 | | |
Class R5 | |
Net assets | | $ | 9,964,412 | | |
Shares outstanding | | | 517,398 | | |
Net asset value per share | | $ | 19.26 | | |
Class Z | |
Net assets | | $ | 165,747,835 | | |
Shares outstanding | | | 8,745,360 | | |
Net asset value per share | | $ | 18.95 | | |
(a) The maximum offering price per share is calculated by dividing the net asset value per share by 1.0 minus the maximum sales charge of 5.75%.
The accompanying Notes to Financial Statements are an integral part of this statement.
Annual Report 2015
14
COLUMBIA GLOBAL TECHNOLOGY GROWTH FUND
STATEMENT OF OPERATIONS
Year Ended August 31, 2015
Net investment income | |
Income: | |
Dividends — unaffiliated issuers | | $ | 3,076,997 | | |
Dividends — affiliated issuers | | | 8,334 | | |
Foreign taxes withheld | | | (16,118 | ) | |
Total income | | | 3,069,213 | | |
Expenses: | |
Investment management fees | | | 2,604,481 | | |
Distribution and/or service fees | |
Class A | | | 263,687 | | |
Class B | | | 15,850 | | |
Class C | | | 302,959 | | |
Transfer agent fees | |
Class A | | | 208,153 | | |
Class B | | | 3,123 | | |
Class C | | | 59,795 | | |
Class R4 | | | 10,107 | | |
Class R5 | | | 3,001 | | |
Class Z | | | 288,465 | | |
Compensation of board members | | | 21,272 | | |
Custodian fees | | | 13,026 | | |
Printing and postage fees | | | 53,803 | | |
Registration fees | | | 100,123 | | |
Professional fees | | | 31,608 | | |
Chief compliance officer expenses | | | 143 | | |
Other | | | 15,812 | | |
Total expenses | | | 3,995,408 | | |
Expense reductions | | | (320 | ) | |
Total net expenses | | | 3,995,088 | | |
Net investment loss | | | (925,875 | ) | |
Realized and unrealized gain (loss) — net | |
Net realized gain (loss) on: | |
Investments | | | 11,312,529 | | |
Foreign currency translations | | | 6,713 | | |
Net realized gain | | | 11,319,242 | | |
Net change in unrealized appreciation (depreciation) on: | |
Investments | | | (21,322 | ) | |
Net change in unrealized depreciation | | | (21,322 | ) | |
Net realized and unrealized gain | | | 11,297,920 | | |
Net increase in net assets resulting from operations | | $ | 10,372,045 | | |
The accompanying Notes to Financial Statements are an integral part of this statement.
Annual Report 2015
15
COLUMBIA GLOBAL TECHNOLOGY GROWTH FUND
STATEMENT OF CHANGES IN NET ASSETS
| | | Year Ended
August 31,
2015 | | Year Ended
August 31,
2014 | |
Operations | |
Net investment loss | | $ | (925,875 | ) | | $ | (976,341 | ) | |
Net realized gain | | | 11,319,242 | | | | 21,010,399 | | |
Net change in unrealized appreciation (depreciation) | | | (21,322 | ) | | | 34,982,070 | | |
Net increase in net assets resulting from operations | | | 10,372,045 | | | | 55,016,128 | | |
Distributions to shareholders | |
Net investment income | |
Class A | | | (404,060 | ) | | | — | | |
Class B | | | (3,716 | ) | | | — | | |
Class C | | | (52,091 | ) | | | — | | |
Class R4 | | | (20,592 | ) | | | — | | |
Class R5 | | | (16,532 | ) | | | — | | |
Class Z | | | (663,608 | ) | | | — | | |
Net realized gains | |
Class A | | | (3,763,868 | ) | | | — | | |
Class B | | | (76,169 | ) | | | — | | |
Class C | | | (1,067,669 | ) | | | — | | |
Class R4 | | | (161,967 | ) | | | — | | |
Class R5 | | | (118,927 | ) | | | — | | |
Class Z | | | (5,219,687 | ) | | | — | | |
Total distributions to shareholders | | | (11,568,886 | ) | | | — | | |
Increase in net assets from capital stock activity | | | 166,396,812 | | | | 16,659,726 | | |
Total increase in net assets | | | 165,199,971 | | | | 71,675,854 | | |
Net assets at beginning of year | | | 222,984,335 | | | | 151,308,481 | | |
Net assets at end of year | | $ | 388,184,306 | | | $ | 222,984,335 | | |
Excess of distributions over net investment income | | $ | (33,644 | ) | | $ | (33,231 | ) | |
The accompanying Notes to Financial Statements are an integral part of this statement.
Annual Report 2015
16
COLUMBIA GLOBAL TECHNOLOGY GROWTH FUND
STATEMENT OF CHANGES IN NET ASSETS (continued)
| | | Year Ended August 31, 2015(a) | | Year Ended August 31, 2014 | |
| | | Shares | | Dollars ($) | | Shares | | Dollars ($) | |
Capital stock activity | |
Class A shares | |
Subscriptions(b) | | | 4,400,264 | | | | 82,218,947 | | | | 1,945,016 | | | | 32,024,278 | | |
Distributions reinvested | | | 220,321 | | | | 3,994,415 | | | | — | | | | — | | |
Redemptions | | | (2,085,187 | ) | | | (38,219,187 | ) | | | (1,331,622 | ) | | | (21,577,517 | ) | |
Net increase | | | 2,535,398 | | | | 47,994,175 | | | | 613,394 | | | | 10,446,761 | | |
Class B shares | |
Subscriptions | | | 3,546 | | | | 61,053 | | | | 2,474 | | | | 35,842 | | |
Distributions reinvested | | | 4,374 | | | | 73,009 | | | | — | | | | — | | |
Redemptions(b) | | | (61,049 | ) | | | (1,036,587 | ) | | | (131,971 | ) | | | (1,987,562 | ) | |
Net decrease | | | (53,129 | ) | | | (902,525 | ) | | | (129,497 | ) | | | (1,951,720 | ) | |
Class C shares | |
Subscriptions | | | 1,230,766 | | | | 21,167,794 | | | | 184,349 | | | | 2,804,119 | | |
Distributions reinvested | | | 41,819 | | | | 699,211 | | | | — | | | | — | | |
Redemptions | | | (212,634 | ) | | | (3,640,264 | ) | | | (227,337 | ) | | | (3,423,792 | ) | |
Net increase (decrease) | | | 1,059,951 | | | | 18,226,741 | | | | (42,988 | ) | | | (619,673 | ) | |
Class I shares | |
Subscriptions | | | 1,741,813 | | | | 36,140,802 | | | | — | | | | — | | |
Redemptions | | | (118,098 | ) | | | (2,430,540 | ) | | | — | | | | — | | |
Net increase | | | 1,623,715 | | | | 33,710,262 | | | | — | | | | — | | |
Class R4 shares | |
Subscriptions | | | 462,980 | | | | 9,048,769 | | | | 314,916 | | | | 5,093,551 | | |
Distributions reinvested | | | 9,654 | | | | 182,559 | | | | — | | | | — | | |
Redemptions | | | (81,844 | ) | | | (1,575,194 | ) | | | (283,402 | ) | | | (4,821,951 | ) | |
Net increase | | | 390,790 | | | | 7,656,134 | | | | 31,514 | | | | 271,600 | | |
Class R5 shares | |
Subscriptions | | | 467,347 | | | | 9,146,520 | | | | 265,462 | | | | 4,547,753 | | |
Distributions reinvested | | | 7,137 | | | | 135,326 | | | | — | | | | — | | |
Redemptions | | | (124,027 | ) | | | (2,408,969 | ) | | | (113,018 | ) | | | (2,042,196 | ) | |
Net increase | | | 350,457 | | | | 6,872,877 | | | | 152,444 | | | | 2,505,557 | | |
Class Z shares | |
Subscriptions | | | 4,539,525 | | | | 85,885,011 | | | | 1,597,584 | | | | 26,310,755 | | |
Distributions reinvested | | | 206,671 | | | | 3,860,616 | | | | — | | | | — | | |
Redemptions | | | (1,962,918 | ) | | | (36,906,479 | ) | | | (1,227,256 | ) | | | (20,303,554 | ) | |
Net increase | | | 2,783,278 | | | | 52,839,148 | | | | 370,328 | | | | 6,007,201 | | |
Total net increase | | | 8,690,460 | | | | 166,396,812 | | | | 995,195 | | | | 16,659,726 | | |
(a) Class I shares are based on operations from March 25, 2015 (commencement of operations) through the stated period end.
(b) Includes conversions of Class B shares to Class A shares, if any.
The accompanying Notes to Financial Statements are an integral part of this statement.
Annual Report 2015
17
COLUMBIA GLOBAL TECHNOLOGY GROWTH FUND
The following tables are intended to help you understand the Fund's financial performance. Certain information reflects financial results for a single share of a class held for the periods shown. Per share net investment income (loss) amounts are calculated based on average shares outstanding during the period. Total return assumes reinvestment of all dividends and distributions, if any. Total return does not reflect payment of sales charges, if any. Total return and portfolio turnover are not annualized for periods of less than one year. The portfolio turnover rate is calculated without regard to purchase and sales transactions of short-term instruments and certain derivatives, if any. If such transactions were included, the Fund's portfolio turnover rate may be higher.
| | | Year Ended August 31, | |
Class A | | 2015 | | 2014 | | 2013 | | 2012 | | 2011 | |
Per share data | |
Net asset value, beginning of period | | $ | 18.18 | | | $ | 13.47 | | | $ | 10.87 | | | $ | 10.25 | | | $ | 8.75 | | |
Income from investment operations: | |
Net investment loss | | | (0.07 | ) | | | (0.09 | ) | | | (0.04 | ) | | | (0.08 | ) | | | (0.11 | ) | |
Net realized and unrealized gain | | | 1.10 | | | | 4.80 | | | | 2.64 | | | | 0.70 | | | | 1.61 | | |
Total from investment operations | | | 1.03 | | | | 4.71 | | | | 2.60 | | | | 0.62 | | | | 1.50 | | |
Less distributions to shareholders: | |
Net investment income | | | (0.09 | ) | | | — | | | | — | | | | — | | | | — | | |
Net realized gains | | | (0.76 | ) | | | — | | | | — | | | | — | | | | — | | |
Total distributions to shareholders | | | (0.85 | ) | | | — | | | | — | | | | — | | | | — | | |
Net asset value, end of period | | $ | 18.36 | | | $ | 18.18 | | | $ | 13.47 | | | $ | 10.87 | | | $ | 10.25 | | |
Total return | | | 5.70 | % | | | 34.97 | % | | | 23.92 | % | | | 6.05 | % | | | 17.14 | % | |
Ratios to average net assets(a) | |
Total gross expenses | | | 1.40 | % | | | 1.42 | % | | | 1.49 | % | | | 1.39 | % | | | 1.46 | %(b) | |
Total net expenses(c) | | | 1.40 | %(d) | | | 1.42 | %(d) | | | 1.46 | %(d) | | | 1.39 | %(d) | | | 1.43 | %(b) | |
Net investment loss | | | (0.37 | %) | | | (0.55 | %) | | | (0.36 | %) | | | (0.80 | %) | | | (1.01 | %) | |
Supplemental data | |
Net assets, end of period (in thousands) | | $ | 131,079 | | | $ | 83,656 | | | $ | 53,711 | | | $ | 50,574 | | | $ | 65,071 | | |
Portfolio turnover | | | 60 | % | | | 68 | % | | | 135 | % | | | 220 | % | | | 263 | % | |
Notes to Financial Highlights
(a) In addition to the fees and expenses that the Fund bears directly, the Fund indirectly bears a pro rata share of the fees and expenses of any other funds in which it invests. Such indirect expenses are not included in the Fund's reported expense ratios.
(b) Ratios include line of credit interest expense which is less than 0.01%.
(c) Total net expenses include the impact of certain fee waivers/expense reimbursements made by the Investment Manager and certain of its affiliates, if applicable.
(d) The benefits derived from expense reductions had an impact of less than 0.01%.
The accompanying Notes to Financial Statements are an integral part of this statement.
Annual Report 2015
18
COLUMBIA GLOBAL TECHNOLOGY GROWTH FUND
FINANCIAL HIGHLIGHTS (continued)
| | | Year Ended August 31, | |
Class B | | 2015 | | 2014 | | 2013 | | 2012 | | 2011 | |
Per share data | |
Net asset value, beginning of period | | $ | 16.79 | | | $ | 12.53 | | | $ | 10.19 | | | $ | 9.68 | | | $ | 8.33 | | |
Income from investment operations: | |
Net investment loss | | | (0.18 | ) | | | (0.20 | ) | | | (0.12 | ) | | | (0.15 | ) | | | (0.19 | ) | |
Net realized and unrealized gain | | | 1.00 | | | | 4.46 | | | | 2.46 | | | | 0.66 | | | | 1.54 | | |
Total from investment operations | | | 0.82 | | | | 4.26 | | | | 2.34 | | | | 0.51 | | | | 1.35 | | |
Less distributions to shareholders: | |
Net investment income | | | (0.04 | ) | | | — | | | | — | | | | — | | | | — | | |
Net realized gains | | | (0.76 | ) | | | — | | | | — | | | | — | | | | — | | |
Total distributions to shareholders | | | (0.80 | ) | | | — | | | | — | | | | — | | | | — | | |
Net asset value, end of period | | $ | 16.81 | | | $ | 16.79 | | | $ | 12.53 | | | $ | 10.19 | | | $ | 9.68 | | |
Total return | | | 4.92 | % | | | 34.00 | % | | | 22.96 | % | | | 5.27 | % | | | 16.21 | % | |
Ratios to average net assets(a) | |
Total gross expenses | | | 2.14 | % | | | 2.16 | % | | | 2.24 | % | | | 2.15 | % | | | 2.21 | %(b) | |
Total net expenses(c) | | | 2.14 | %(d) | | | 2.16 | %(d) | | | 2.21 | %(d) | | | 2.15 | %(d) | | | 2.19 | %(b) | |
Net investment loss | | | (1.08 | %) | | | (1.35 | %) | | | (1.10 | %) | | | (1.56 | %) | | | (1.77 | %) | |
Supplemental data | |
Net assets, end of period (in thousands) | | $ | 1,153 | | | $ | 2,043 | | | $ | 3,147 | | | $ | 3,788 | | | $ | 5,573 | | |
Portfolio turnover | | | 60 | % | | | 68 | % | | | 135 | % | | | 220 | % | | | 263 | % | |
Notes to Financial Highlights
(a) In addition to the fees and expenses that the Fund bears directly, the Fund indirectly bears a pro rata share of the fees and expenses of any other funds in which it invests. Such indirect expenses are not included in the Fund's reported expense ratios.
(b) Ratios include line of credit interest expense which is less than 0.01%.
(c) Total net expenses include the impact of certain fee waivers/expense reimbursements made by the Investment Manager and certain of its affiliates, if applicable.
(d) The benefits derived from expense reductions had an impact of less than 0.01%.
The accompanying Notes to Financial Statements are an integral part of this statement.
Annual Report 2015
19
COLUMBIA GLOBAL TECHNOLOGY GROWTH FUND
FINANCIAL HIGHLIGHTS (continued)
| | | Year Ended August 31, | |
Class C | | 2015 | | 2014 | | 2013 | | 2012 | | 2011 | |
Per share data | |
Net asset value, beginning of period | | $ | 16.82 | | | $ | 12.55 | | | $ | 10.21 | | | $ | 9.70 | | | $ | 8.35 | | |
Income from investment operations: | |
Net investment loss | | | (0.20 | ) | | | (0.20 | ) | | | (0.12 | ) | | | (0.15 | ) | | | (0.19 | ) | |
Net realized and unrealized gain | | | 1.02 | | | | 4.47 | | | | 2.46 | | | | 0.66 | | | | 1.54 | | |
Total from investment operations | | | 0.82 | | | | 4.27 | | | | 2.34 | | | | 0.51 | | | | 1.35 | | |
Less distributions to shareholders: | |
Net investment income | | | (0.04 | ) | | | — | | | | — | | | | — | | | | — | | |
Net realized gains | | | (0.76 | ) | | | — | | | | — | | | | — | | | | — | | |
Total distributions to shareholders | | | (0.80 | ) | | | — | | | | — | | | | — | | | | — | | |
Net asset value, end of period | | $ | 16.84 | | | $ | 16.82 | | | $ | 12.55 | | | $ | 10.21 | | | $ | 9.70 | | |
Total return | | | 4.91 | % | | | 34.02 | % | | | 22.92 | % | | | 5.26 | % | | | 16.17 | % | |
Ratios to average net assets(a) | |
Total gross expenses | | | 2.15 | % | | | 2.17 | % | | | 2.23 | % | | | 2.17 | % | | | 2.22 | %(b) | |
Total net expenses(c) | | | 2.15 | %(d) | | | 2.17 | %(d) | | | 2.21 | %(d) | | | 2.17 | %(d) | | | 2.20 | %(b) | |
Net investment loss | | | (1.13 | %) | | | (1.31 | %) | | | (1.11 | %) | | | (1.57 | %) | | | (1.79 | %) | |
Supplemental data | |
Net assets, end of period (in thousands) | | $ | 39,660 | | | $ | 21,775 | | | $ | 16,791 | | | $ | 15,821 | | | $ | 20,360 | | |
Portfolio turnover | | | 60 | % | | | 68 | % | | | 135 | % | | | 220 | % | | | 263 | % | |
Notes to Financial Highlights
(a) In addition to the fees and expenses that the Fund bears directly, the Fund indirectly bears a pro rata share of the fees and expenses of any other funds in which it invests. Such indirect expenses are not included in the Fund's reported expense ratios.
(b) Ratios include line of credit interest expense which is less than 0.01%.
(c) Total net expenses include the impact of certain fee waivers/expense reimbursements made by the Investment Manager and certain of its affiliates, if applicable.
(d) The benefits derived from expense reductions had an impact of less than 0.01%.
The accompanying Notes to Financial Statements are an integral part of this statement.
Annual Report 2015
20
COLUMBIA GLOBAL TECHNOLOGY GROWTH FUND
FINANCIAL HIGHLIGHTS (continued)
Class I | | Year Ended
August 31,
2015(a) | |
Per share data | |
Net asset value, beginning of period | | $ | 19.98 | | |
Income from investment operations: | |
Net investment income | | | (0.00 | )(b) | |
Net realized and unrealized loss | | | (0.13 | )(c) | |
Total from investment operations | | | (0.13 | ) | |
Net asset value, end of period | | $ | 19.85 | | |
Total return | | | (0.65 | %) | |
Ratios to average net assets(d) | |
Total gross expenses | | | 0.98 | %(e) | |
Total net expenses(f) | | | 0.98 | %(e) | |
Net investment loss | | | (0.02 | %)(e) | |
Supplemental data | |
Net assets, end of period (in thousands) | | $ | 32,235 | | |
Portfolio turnover | | | 60 | % | |
Notes to Financial Highlights
(a) Based on operations from March 25, 2015 (commencement of operations) through the stated period end.
(b) Rounds to zero.
(c) Calculation of the net gain (loss) per share (both realized and unrealized) does not correlate to the aggregate realized and unrealized gain (loss) presented in the Statement of Operations due to the timing of subscriptions and redemptions of Fund shares in relation to fluctuations in the market value of the portfolio.
(d) In addition to the fees and expenses that the Fund bears directly, the Fund indirectly bears a pro rata share of the fees and expenses of any other funds in which it invests. Such indirect expenses are not included in the Fund's reported expense ratios.
(e) Annualized.
(f) Total net expenses include the impact of certain fee waivers/expense reimbursements made by the Investment Manager and certain of its affiliates, if applicable.
The accompanying Notes to Financial Statements are an integral part of this statement.
Annual Report 2015
21
COLUMBIA GLOBAL TECHNOLOGY GROWTH FUND
FINANCIAL HIGHLIGHTS (continued)
| | | Year Ended August 31, | |
Class R4 | | 2015 | | 2014 | | 2013(a) | |
Per share data | |
Net asset value, beginning of period | | $ | 18.92 | | | $ | 13.99 | | | $ | 10.73 | | |
Income from investment operations: | |
Net investment loss | | | (0.04 | ) | | | (0.06 | ) | | | (0.03 | ) | |
Net realized and unrealized gain | | | 1.17 | | | | 4.99 | | | | 3.29 | | |
Total from investment operations | | | 1.13 | | | | 4.93 | | | | 3.26 | | |
Less distributions to shareholders: | |
Net investment income | | | (0.10 | ) | | | — | | | | — | | |
Net realized gains | | | (0.76 | ) | | | — | | | | — | | |
Total distributions to shareholders | | | (0.86 | ) | | | — | | | | — | | |
Net asset value, end of period | | $ | 19.19 | | | $ | 18.92 | | | $ | 13.99 | | |
Total return | | | 6.04 | % | | | 35.24 | % | | | 30.38 | % | |
Ratios to average net assets(b) | |
Total gross expenses | | | 1.15 | % | | | 1.16 | % | | | 1.22 | %(c) | |
Total net expenses(d) | | | 1.15 | %(e) | | | 1.16 | %(e) | | | 1.22 | %(c)(e) | |
Net investment loss | | | (0.23 | %) | | | (0.37 | %) | | | (0.28 | %)(c) | |
Supplemental data | |
Net assets, end of period (in thousands) | | $ | 8,345 | | | $ | 836 | | | $ | 177 | | |
Portfolio turnover | | | 60 | % | | | 68 | % | | | 135 | % | |
Notes to Financial Highlights
(a) Based on operations from November 8, 2012 (commencement of operations) through the stated period end.
(b) In addition to the fees and expenses that the Fund bears directly, the Fund indirectly bears a pro rata share of the fees and expenses of any other funds in which it invests. Such indirect expenses are not included in the Fund's reported expense ratios.
(c) Annualized.
(d) Total net expenses include the impact of certain fee waivers/expense reimbursements made by the Investment Manager and certain of its affiliates, if applicable.
(e) The benefits derived from expense reductions had an impact of less than 0.01%.
The accompanying Notes to Financial Statements are an integral part of this statement.
Annual Report 2015
22
COLUMBIA GLOBAL TECHNOLOGY GROWTH FUND
FINANCIAL HIGHLIGHTS (continued)
| | | Year Ended August 31, | |
Class R5 | | 2015 | | 2014 | | 2013(a) | |
Per share data | |
Net asset value, beginning of period | | $ | 18.98 | | | $ | 14.00 | | | $ | 10.73 | | |
Income from investment operations: | |
Net investment income (loss) | | | (0.01 | ) | | | (0.01 | ) | | | 0.00 | (b) | |
Net realized and unrealized gain | | | 1.16 | | | | 4.99 | | | | 3.27 | | |
Total from investment operations | | | 1.15 | | | | 4.98 | | | | 3.27 | | |
Less distributions to shareholders: | |
Net investment income | | | (0.11 | ) | | | — | | | | — | | |
Net realized gains | | | (0.76 | ) | | | — | | | | — | | |
Total distributions to shareholders | | | (0.87 | ) | | | — | | | | — | | |
Net asset value, end of period | | $ | 19.26 | | | $ | 18.98 | | | $ | 14.00 | | |
Total return | | | 6.13 | % | | | 35.57 | % | | | 30.48 | % | |
Ratios to average net assets(c) | |
Total gross expenses | | | 1.00 | % | | | 1.03 | % | | | 1.08 | %(d) | |
Total net expenses(e) | | | 1.00 | % | | | 1.03 | % | | | 1.08 | %(d) | |
Net investment income (loss) | | | (0.05 | %) | | | (0.09 | %) | | | (0.08 | %)(d) | |
Supplemental data | |
Net assets, end of period (in thousands) | | $ | 9,964 | | | $ | 3,168 | | | $ | 203 | | |
Portfolio turnover | | | 60 | % | | | 68 | % | | | 135 | % | |
Notes to Financial Highlights
(a) Based on operations from November 8, 2012 (commencement of operations) through the stated period end.
(b) Rounds to zero.
(c) In addition to the fees and expenses that the Fund bears directly, the Fund indirectly bears a pro rata share of the fees and expenses of any other funds in which it invests. Such indirect expenses are not included in the Fund's reported expense ratios.
(d) Annualized.
(e) Total net expenses include the impact of certain fee waivers/expense reimbursements made by the Investment Manager and certain of its affiliates, if applicable.
The accompanying Notes to Financial Statements are an integral part of this statement.
Annual Report 2015
23
COLUMBIA GLOBAL TECHNOLOGY GROWTH FUND
FINANCIAL HIGHLIGHTS (continued)
| | | Year Ended August 31, | |
Class Z | | 2015 | | 2014 | | 2013 | | 2012 | | 2011 | |
Per share data | |
Net asset value, beginning of period | | $ | 18.70 | | | $ | 13.82 | | | $ | 11.13 | | | $ | 10.47 | | | $ | 8.92 | | |
Income from investment operations: | |
Net investment loss | | | (0.02 | ) | | | (0.05 | ) | | | (0.01 | ) | | | (0.07 | ) | | | (0.09 | ) | |
Net realized and unrealized gain | | | 1.13 | | | | 4.93 | | | | 2.70 | | | | 0.73 | | | | 1.64 | | |
Total from investment operations | | | 1.11 | | | | 4.88 | | | | 2.69 | | | | 0.66 | | | | 1.55 | | |
Less distributions to shareholders: | |
Net investment income | | | (0.10 | ) | | | — | | | | — | | | | — | | | | — | | |
Net realized gains | | | (0.76 | ) | | | — | | | | — | | | | — | | | | — | | |
Total distributions to shareholders | | | (0.86 | ) | | | — | | | | — | | | | — | | | | — | | |
Net asset value, end of period | | $ | 18.95 | | | $ | 18.70 | | | $ | 13.82 | | | $ | 11.13 | | | $ | 10.47 | | |
Total return | | | 6.00 | % | | | 35.31 | % | | | 24.17 | % | | | 6.30 | % | | | 17.38 | % | |
Ratios to average net assets(a) | |
Total gross expenses | | | 1.15 | % | | | 1.17 | % | | | 1.24 | % | | | 1.19 | % | | | 1.22 | %(b) | |
Total net expenses(c) | | | 1.15 | %(d) | | | 1.17 | %(d) | | | 1.21 | %(d) | | | 1.19 | %(d) | | | 1.20 | %(b) | |
Net investment loss | | | (0.11 | %) | | | (0.30 | %) | | | (0.12 | %) | | | (0.62 | %) | | | (0.79 | %) | |
Supplemental data | |
Net assets, end of period (in thousands) | | $ | 165,748 | | | $ | 111,506 | | | $ | 77,279 | | | $ | 71,456 | | | $ | 133,011 | | |
Portfolio turnover | | | 60 | % | | | 68 | % | | | 135 | % | | | 220 | % | | | 263 | % | |
Notes to Financial Highlights
(a) In addition to the fees and expenses that the Fund bears directly, the Fund indirectly bears a pro rata share of the fees and expenses of any other funds in which it invests. Such indirect expenses are not included in the Fund's reported expense ratios.
(b) Ratios include line of credit interest expense which is less than 0.01%.
(c) Total net expenses include the impact of certain fee waivers/expense reimbursements made by the Investment Manager and certain of its affiliates, if applicable.
(d) The benefits derived from expense reductions had an impact of less than 0.01%.
The accompanying Notes to Financial Statements are an integral part of this statement.
Annual Report 2015
24
COLUMBIA GLOBAL TECHNOLOGY GROWTH FUND
NOTES TO FINANCIAL STATEMENTS
August 31, 2015
Note 1. Organization
Columbia Global Technology Growth Fund (the Fund), a series of Columbia Funds Series Trust I (the Trust), is a non-diversified fund. The Trust is registered under the Investment Company Act of 1940, as amended (the 1940 Act), as an open-end management investment company organized as a Massachusetts business trust.
Fund Shares
The Trust may issue an unlimited number of shares (without par value). The Fund offers Class A, Class B, Class C, Class I, Class R4, Class R5 and Class Z shares. Although all share classes generally have identical voting, dividend and liquidation rights, each share class votes separately when required by the Trust's organizational documents or by law. Different share classes pay different distribution amounts to the extent the expenses of such share classes differ, and distributions in liquidation will be proportional to the net asset value of each share class. Each share class has its own expense and sales charge structure.
Class A shares are subject to a maximum front-end sales charge of 5.75% based on the initial investment amount. Class A shares purchased without an initial sales charge in accounts aggregating $1 million to $50 million at the time of purchase are subject to a contingent deferred sales charge (CDSC) if the shares are sold within 18 months after purchase, charged as follows: 1.00% CDSC if redeemed within 12 months after purchase, and 0.50% CDSC if redeemed more than 12, but less than 18, months after purchase.
Class B shares may be subject to a maximum CDSC of 5.00% based upon the holding period after purchase. Class B shares will generally convert to Class A shares eight years after purchase. The Fund no longer accepts investments by new or existing investors in the Fund's Class B shares, except in connection with the reinvestment of any dividend and/or capital gain distributions in Class B shares of the Fund and exchanges by existing Class B shareholders of certain other funds within the Columbia Family of Funds.
Class C shares are subject to a 1.00% CDSC on shares redeemed within one year after purchase.
Class I shares are not subject to sales charges and are available only to the Columbia Family of Funds. Class I shares commenced operations on March 25, 2015.
Class R4 shares are not subject to sales charges and are generally available only to omnibus retirement plans
and certain investors as described in the Fund's prospectus.
Class R5 shares are not subject to sales charges and are generally available only to investors purchasing through authorized investment professionals and omnibus retirement plans.
Class Z shares are not subject to sales charges and are available only to eligible investors, which are subject to different investment minimums as described in the Fund's prospectus.
Note 2. Summary of Significant Accounting Policies
Basis of Preparation
The Fund is an investment company that applies the accounting and reporting guidance in the Financial Accounting Standards Board (FASB) Accounting Standards Codification Topic 946, Financial Services — Investment Companies (ASC 946). The financial statements are prepared in accordance with U.S. generally accepted accounting principles (GAAP), which requires management to make certain estimates and assumptions that affect the reported amounts of assets and liabilities, the disclosure of contingent assets and liabilities at the date of the financial statements and the reported amounts of income and expenses during the reporting period. Actual results could differ from those estimates.
The following is a summary of significant accounting policies followed by the Fund in the preparation of its financial statements.
Security Valuation
All equity securities and exchange-traded funds are valued at the close of business of the New York Stock Exchange (NYSE). Equity securities and exchange-traded funds are valued at the last quoted sales price on the principal exchange or market on which they trade, except for securities traded on the NASDAQ Stock Market, which are valued at the NASDAQ official close price. Unlisted securities or listed securities for which there were no sales during the day are valued at the mean of the latest quoted bid and ask prices on such exchanges or markets.
Foreign equity securities are valued based on the closing price on the foreign exchange in which such securities are primarily traded. If any foreign equity security closing prices are not readily available, the securities are valued at the mean of the latest quoted bid and ask prices on
Annual Report 2015
25
COLUMBIA GLOBAL TECHNOLOGY GROWTH FUND
NOTES TO FINANCIAL STATEMENTS (continued)
August 31, 2015
such exchanges or markets. Foreign currency exchange rates are generally determined at 4:00 p.m. Eastern (U.S.) time. Many securities markets and exchanges outside the U.S. close prior to the close of the NYSE; therefore, the closing prices for securities in such markets or on such exchanges may not fully reflect events that occur after such close but before the close of the NYSE. In those situations, foreign securities will be fair valued pursuant to a policy adopted by the Board of Trustees (the Board), including, if available, utilizing a third party pricing service to determine these fair values. The third party pricing service takes into account multiple factors, including, but not limited to, movements in the U.S. securities markets, certain depositary receipts, futures contracts and foreign exchange rates that have occurred subsequent to the close of the foreign exchange or market, to determine a good faith estimate that reasonably reflects the current market conditions as of the close of the NYSE. The fair value of a security is likely to be different from the quoted or published price, if available.
Investments in open-end investment companies, including money market funds, are valued at their latest net asset value.
Investments for which market quotations are not readily available, or that have quotations which management believes are not reflective of market value or reliable, are valued at fair value as determined in good faith under procedures approved by and under the general supervision of the Board. If a security or class of securities (such as foreign securities) is valued at fair value, such value is likely to be different from the quoted or published price for the security.
The determination of fair value often requires significant judgment. To determine fair value, management may use assumptions including but not limited to future cash flows and estimated risk premiums. Multiple inputs from various sources may be used to determine fair value.
GAAP requires disclosure regarding the inputs and valuation techniques used to measure fair value and any changes in valuation inputs or techniques. In addition, investments shall be disclosed by major category. This information is disclosed following the Fund's Portfolio of Investments.
Foreign Currency Transactions and Translations
The values of all assets and liabilities denominated in foreign currencies are generally translated into U.S. dollars at exchange rates determined at the close of the
NYSE. Net realized and unrealized gains (losses) on foreign currency transactions and translations include gains (losses) arising from the fluctuation in exchange rates between trade and settlement dates on securities transactions, gains (losses) arising from the disposition of foreign currency and currency gains (losses) between the accrual and payment dates on dividends, interest income and foreign withholding taxes.
For financial statement purposes, the Fund does not distinguish that portion of gains (losses) on investments which is due to changes in foreign exchange rates from that which is due to changes in market prices of the investments. Such fluctuations are included with the net realized and unrealized gains (losses) on investments in the Statement of Operations.
Security Transactions
Security transactions are accounted for on the trade date. Cost is determined and gains (losses) are based upon the specific identification method for both financial statement and federal income tax purposes.
Income Recognition
Corporate actions and dividend income are generally recorded net of any non-reclaimable tax withholdings, on the ex-dividend date or upon receipt of ex-dividend notification in the case of certain foreign securities.
The Fund may receive distributions from holdings in equity securities, business development companies (BDCs), exchange-traded funds, other regulated investment companies (RICs), and real estate investment trusts (REITs), which report information on the tax character of their distributions annually. These distributions are allocated to dividend income, capital gain and return of capital based on actual information reported. Return of capital is recorded as a reduction of the cost basis of securities held. If the Fund no longer owns the applicable securities, return of capital is recorded as a realized gain. With respect to REITs, to the extent actual information has not yet been reported, estimates for return of capital are made by the Fund's management. Management's estimates are subsequently adjusted when the actual character of the distributions is disclosed by the REITs, which could result in a proportionate change in return of capital to shareholders.
Awards from class action litigation are recorded as a reduction of cost basis if the Fund still owns the applicable securities on the payment date. If the Fund no
Annual Report 2015
26
COLUMBIA GLOBAL TECHNOLOGY GROWTH FUND
NOTES TO FINANCIAL STATEMENTS (continued)
August 31, 2015
longer owns the applicable securities, the proceeds are recorded as realized gains.
Expenses
General expenses of the Trust are allocated to the Fund and other funds of the Trust based upon relative net assets or other expense allocation methodologies determined by the nature of the expense. Expenses directly attributable to the Fund are charged to the Fund. Expenses directly attributable to a specific class of shares are charged to that share class.
Determination of Class Net Asset Value
All income, expenses (other than class-specific expenses, which are charged to that share class, as shown in the Statement of Operations) and realized and unrealized gains (losses) are allocated to each class of the Fund on a daily basis, based on the relative net assets of each class, for purposes of determining the net asset value of each class.
Federal Income Tax Status
The Fund intends to qualify each year as a regulated investment company under Subchapter M of the Internal Revenue Code, as amended, and will distribute substantially all of its taxable income (including net short-term capital gains), if any, for its tax year, and as such will not be subject to federal income taxes. In addition, the Fund intends to distribute in each calendar year substantially all of its net investment income, capital gains and certain other amounts, if any, such that the Fund should not be subject to federal excise tax. Therefore, no federal income or excise tax provision is recorded.
Foreign Taxes
The Fund may be subject to foreign taxes on income, gains on investments or currency repatriation, a portion of which may be recoverable. The Fund will accrue such taxes and recoveries, as applicable, based upon its current interpretation of tax rules and regulations that exist in the markets in which it invests.
Realized gains in certain countries may be subject to foreign taxes at the Fund level, based on statutory rates. The Fund accrues for such foreign taxes on realized and unrealized gains at the appropriate rate for each jurisdiction, as applicable. The amount, if any, is disclosed as a liability on the Statement of Assets and Liabilities.
Distributions to Shareholders
Distributions from net investment income, if any, are declared and paid annually. Net realized capital gains, if any, are distributed along with the income distribution. Income distributions and capital gain distributions are determined in accordance with federal income tax regulations, which may differ from GAAP.
Guarantees and Indemnifications
Under the Trust's organizational documents and, in some cases, by contract, its officers and trustees are indemnified against certain liabilities arising out of the performance of their duties to the Trust or its funds. In addition, certain of the Fund's contracts with its service providers contain general indemnification clauses. The Fund's maximum exposure under these arrangements is unknown since the amount of any future claims that may be made against the Fund cannot be determined, and the Fund has no historical basis for predicting the likelihood of any such claims.
Recent Accounting Pronouncement
Fair Value Measurement (Topic 820), Disclosure for Investments in Certain Entities That Calculate Net Asset Value per Share (or Its Equivalent)
In May 2015, the Financial Accounting Standards Board (FASB) issued Accounting Standards Update (ASU) No. 2015-07, Fair Value Measurement (Topic 820), Disclosure for Investments in Certain Entities That Calculate Net Asset Value per Share (or Its Equivalent). ASU No. 2015-07 changes the disclosure requirements for investments for which fair value is measured using the net asset value per share practical expedient. The disclosure requirements are effective for annual periods beginning after December 15, 2015 and interim periods within those fiscal years. At this time, management is evaluating the implications of this guidance and the impact it will have on the financial statement amounts and footnote disclosures, if any.
Note 3. Fees and Other Transactions with Affiliates
Investment Management Fees
Under an Investment Management Services Agreement, Columbia Management Investment Advisers, LLC (the Investment Manager), a wholly-owned subsidiary of Ameriprise Financial, Inc. (Ameriprise Financial), determines which securities will be purchased, held or sold. The investment management fee is an annual fee
Annual Report 2015
27
COLUMBIA GLOBAL TECHNOLOGY GROWTH FUND
NOTES TO FINANCIAL STATEMENTS (continued)
August 31, 2015
that is equal to a percentage of the Fund's average daily net assets that declines from 0.87% to 0.77% as the Fund's net assets increase. The effective investment management fee rate for the year ended August 31, 2015 was 0.87% of the Fund's average daily net assets.
Administration Fees
Under an Administrative Services Agreement, the Investment Manager also serves as the Fund Administrator. The Investment Manager does not receive a fee for its services under the Administrative Services Agreement.
Compensation of Board Members
Board members, who are not officers or employees of the Investment Manager or Ameriprise Financial, are compensated for their services to the Fund as disclosed in the Statement of Operations. These Board members may participate in a Deferred Compensation Plan (the Plan) which may be terminated at any time. Obligations of the Plan will be paid solely out of the Fund's assets, and all amounts payable under the Plan constitute a general unsecured obligation of the Fund.
Compensation of Chief Compliance Officer
The Board has appointed a Chief Compliance Officer to the Fund in accordance with federal securities regulations. The Fund is allocated a portion of the expenses associated with the Chief Compliance Officer based on relative net assets of the Trust.
Transfer Agency Fees
Under a Transfer and Dividend Disbursing Agent Agreement, Columbia Management Investment Services Corp. (the Transfer Agent), an affiliate of the Investment Manager and a wholly-owned subsidiary of Ameriprise Financial, is responsible for providing transfer agency services to the Fund. The Transfer Agent has contracted with Boston Financial Data Services (BFDS) to serve as sub-transfer agent.
Effective November 1, 2014, the Transfer Agent receives a monthly transfer agency fee based on the number or the average value of accounts, depending on the type of account. Prior to November 1, 2014, the Transfer Agent received a monthly account-based service fee based on the number of open accounts. In addition, the Transfer Agent also receives sub-transfer agency fees based on a percentage of the average aggregate value of the Fund's shares maintained in omnibus accounts (other than omnibus accounts for which American Enterprise Investment Services Inc. is the broker of record or accounts where the beneficial shareholder is a customer
of Ameriprise Financial Services, Inc., for which the Transfer Agent receives a per account fee). The Transfer Agent pays the fees of BFDS for services as sub-transfer agent and is not entitled to reimbursement for such fees from the Fund (with the exception of out-of-pocket fees).
The Transfer Agent also receives compensation from the Fund for various shareholder services and reimbursements for certain out-of-pocket fees. Class I shares do not pay transfer agency fees. Total transfer agency fees for Class R5 shares are subject to an annual limitation of not more than 0.05% of the average daily net assets attributable to Class R5 shares.
For the year ended August 31, 2015, the Fund's effective transfer agency fee rates as a percentage of average daily net assets of each class were as follows:
Class A | | | 0.20 | % | |
Class B | | | 0.20 | | |
Class C | | | 0.20 | | |
Class R4 | | | 0.20 | | |
Class R5 | | | 0.05 | | |
Class Z | | | 0.20 | | |
An annual minimum account balance fee of $20 may apply to certain accounts with a value below the applicable share class's initial minimum investment requirements to reduce the impact of small accounts on transfer agency fees. These minimum account balance fees are remitted to the Fund and recorded as part of expense reductions in the Statement of Operations. For the year ended August 31, 2015, these minimum account balance fees reduced total expenses of the Fund by $320.
Distribution and Service Fees
The Fund has an agreement with Columbia Management Investment Distributors, Inc. (the Distributor), an affiliate of the Investment Manager and a wholly-owned subsidiary of Ameriprise Financial, for distribution and shareholder services. The Board has approved, and the Fund has adopted, distribution and shareholder service plans (the Plans) applicable to certain share classes, which set the distribution and service fees for the Fund. These fees are calculated daily and are intended to compensate the Distributor and/or eligible selling and/or servicing agents for selling shares of the Fund and providing services to investors.
Under the Plans, the Fund pays a monthly service fee to the Distributor at the maximum annual rate of 0.25% of the average daily net assets attributable to Class A, Class B and Class C shares of the Fund. Also under the
Annual Report 2015
28
COLUMBIA GLOBAL TECHNOLOGY GROWTH FUND
NOTES TO FINANCIAL STATEMENTS (continued)
August 31, 2015
Plans, the Fund pays a monthly distribution fee to the Distributor at the maximum annual rates of 0.10%, 0.75% and 0.75% of the average daily net assets attributable to Class A, Class B and Class C shares of the Fund, respectively.
Although the Fund may pay distribution and service fees up to a maximum annual rate of 0.35% of the Fund's average daily net assets attributable to Class A shares (comprised of up to 0.10% for distribution services and up to 0.25% for shareholder liaison services), the Fund currently limits such fees to an aggregate fee of not more than 0.25% of the Fund's average daily net assets attributable to Class A shares.
Sales Charges
Sales charges, including front-end charges and CDSCs, received by the Distributor for distributing Fund shares were $507,543 for Class A, $120 for Class B and $2,254 for Class C shares for the year ended August 31, 2015.
Expenses Waived/Reimbursed by the Investment Manager and its Affiliates
The Fund's expense ratio is subject to an expense reimbursement arrangement pursuant to which fees will be waived and/or expenses reimbursed (excluding certain fees and expenses described below), so that the Fund's net operating expenses, after giving effect to fees waived/expenses reimbursed and any balance credits and/or overdraft charges from the Fund's custodian, do not exceed the annual rates of:
| | | Voluntary
Expense Cap
Effective
January 1, 2015 | | Contractual
Expense Cap
Prior to
January 1, 2015 | |
Class A | | | 1.45 | % | | | 1.45 | % | |
Class B | | | 2.20 | | | | 2.20 | | |
Class C | | | 2.20 | | | | 2.20 | | |
Class I* | | | 1.05 | | | | — | | |
Class R4 | | | 1.20 | | | | 1.20 | | |
Class R5 | | | 1.10 | | | | 1.10 | | |
Class Z | | | 1.20 | | | | 1.20 | | |
*Expense cap rate is voluntary from March 25, 2015 (the commencement of operations of Class I shares).
The voluntary expense cap arrangement may be revised or discontinued at any time. Under the arrangements, the following fees and expenses are excluded from the waiver/reimbursement commitment, and therefore will be paid by the Fund, if applicable: taxes (including foreign transaction taxes), expenses associated with investments in affiliated and non-affiliated pooled
investment vehicles (including mutual funds and exchange-traded funds), transaction costs and brokerage commissions, costs related to any securities lending program, dividend and interest expenses associated with securities sold short, inverse floater program fees and expenses, transaction charges and interest on borrowed money, interest and extraordinary expenses. Any fees waived and/or expenses reimbursed under the expense reimbursement arrangements described above are not recoverable by the Investment Manager or its affiliates in future periods.
Note 4. Federal Tax Information
The timing and character of income and capital gain distributions are determined in accordance with income tax regulations, which may differ from GAAP because of temporary or permanent book to tax differences.
At August 31, 2015, these differences are primarily due to differing treatment for deferral/reversal of wash sale losses, Trustees' deferred compensation, distribution reclassifications, foreign currency transactions and passive foreign investment company (PFIC) holdings. To the extent these differences are permanent, reclassifications are made among the components of the Fund's net assets in the Statement of Assets and Liabilities. Temporary differences do not require reclassifications. In the Statement of Assets and Liabilities the following reclassifications were made:
Excess of distributions over net investment income | | $ | 2,086,061 | | |
Accumulated net realized gain | | | (2,086,061 | ) | |
Net investment income (loss) and net realized gains (losses), as disclosed in the Statement of Operations, and net assets were not affected by this reclassification.
The tax character of distributions paid during the years indicated was as follows:
Year Ended August 31, | | 2015 | | 2014 | |
Ordinary income | | $ | 7,561,325 | | | $ | — | | |
Long-term capital gains | | | 4,007,561 | | | | — | | |
Total | | | 11,568,886 | | | | — | | |
Short-term capital gain distributions, if any, are considered ordinary income distributions for tax purposes.
At August 31, 2015, the components of distributable earnings on a tax basis were as follows:
Undistributed ordinary income | | | 11,898 | | |
Undistributed long-term capital gains | | | 8,249,755 | | |
Net unrealized appreciation | | | 55,553,723 | | |
Annual Report 2015
29
COLUMBIA GLOBAL TECHNOLOGY GROWTH FUND
NOTES TO FINANCIAL STATEMENTS (continued)
August 31, 2015
At August 31, 2015, the cost of investments for federal income tax purposes was $332,441,610 and the aggregate gross unrealized appreciation and depreciation based on that cost was:
Unrealized appreciation | | $ | 65,341,953 | | |
Unrealized depreciation | | | (9,788,230 | ) | |
Net unrealized appreciation | | | 55,553,723 | | |
Management of the Fund has concluded that there are no significant uncertain tax positions in the Fund that would require recognition in the financial statements. However, management's conclusion may be subject to review and adjustment at a later date based on factors including, but not limited to, new tax laws, regulations, and administrative interpretations (including relevant court decisions). Generally, the Fund's federal tax returns for the prior three fiscal years remain subject to examination by the Internal Revenue Service.
Note 5. Portfolio Information
The cost of purchases and proceeds from sales of securities, excluding short-term investments and derivatives, if any, aggregated to $322,754,582 and $176,294,451, respectively, for the year ended August 31, 2015. The amount of purchase and sale activity impacts the portfolio turnover rate reported in the Financial Highlights.
Note 6. Affiliated Money Market Fund
The Fund invests in Columbia Short-Term Cash Fund, an affiliated money market fund established for the exclusive use by the Fund and other affiliated funds. The income earned by the Fund from such investments is included as Dividends — affiliated issuers in the Statement of Operations. As an investing fund, the Fund indirectly bears its proportionate share of the expenses of Columbia Short-Term Cash Fund.
Note 7. Line of Credit
The Fund has entered into a revolving credit facility with a syndicate of banks led by JPMorgan Chase Bank, N.A. whereby the Fund may borrow for the temporary funding of shareholder redemptions or for other temporary or emergency purposes. Pursuant to a December 9, 2014 amendment, the credit facility agreement, which is a collective agreement between the Fund and certain other funds managed by the Investment Manager, severally and not jointly, permits collective borrowings up to $550 million. Interest is charged to each participating fund based on its borrowings at a rate equal to the higher of (i) the overnight federal funds rate plus 1.00% or (ii) the one-month LIBOR
rate plus 1.00%. Each borrowing under the credit facility matures no later than 60 days after the date of borrowing. The Fund also pays a commitment fee equal to its pro rata share of the amount of the credit facility at a rate of 0.075% per annum. The commitment fee is included in other expenses in the Statement of Operations. Prior to the December 9, 2014 amendment, the credit facility agreement permitted borrowings up to $500 million under the same terms and interest rates as described above.
The Fund had no borrowings during the year ended August 31, 2015.
Note 8. Significant Risks
Foreign Securities and Emerging Market Countries Risk
Investing in foreign securities may include certain risks and considerations not typically associated with investing in U.S. securities, such as fluctuating currency values and changing local and regional economic, political and social conditions, which may result in greater market volatility. In addition, certain foreign securities may not be as liquid as U.S. securities. Investing in emerging markets may accentuate these risks. These countries are also more likely to experience high levels of inflation, deflation or currency devaluation which could hurt their economies and securities markets. To the extent that the Fund concentrates its investment exposure to any one or a few specific countries, the Fund will be particularly susceptible to the various conditions, events or other factors impacting those countries and may, therefore, have a greater risk than that of a fund which is more geographically diversified.
Non-Diversification Risk
A non-diversified fund is permitted to invest a greater percentage of its total assets in fewer issuers than a diversified fund. The Fund may, therefore, have a greater risk of loss from a few issuers than a similar fund that invests more broadly.
Shareholder Concentration Risk
At August 31, 2015, 2 unaffiliated shareholders of record owned 29.2% of the outstanding shares of the Fund in one or more accounts. The Fund has no knowledge about whether any portion of those shares was owned beneficially. Affiliated shareholders of record owned 19.8% of the outstanding shares of the Fund in one or more accounts. Subscription and redemption activity by concentrated accounts may have a significant effect on
Annual Report 2015
30
COLUMBIA GLOBAL TECHNOLOGY GROWTH FUND
NOTES TO FINANCIAL STATEMENTS (continued)
August 31, 2015
the operations of the Fund. In the case of a large redemption, the Fund may be forced to sell investments at inopportune times, including its liquid or more liquid positions, resulting in Fund losses and the Fund holding a higher percentage of less liquid or illiquid securities. Large redemptions could result in decreased economies of scale and increased operating expenses for non-redeeming Fund shareholders.
Technology and Technology-related Investment Risk
The Fund may be more susceptible to the particular risks that may affect companies in the information technology sector, as well as other technology-related sectors (collectively, the technology sectors) than if it were invested in a wider variety of companies in unrelated sectors. Companies in the technology sectors are subject to certain risks, including the risk that new services, equipment or technologies will not be accepted by consumers and businesses or will become rapidly obsolete. Performance of such companies may be affected by factors including obtaining and protecting patents (or the failure to do so) and significant competitive pressures, including aggressive pricing of their products or services, new market entrants, competition for market share and short product cycles due to an accelerated rate of technological developments. Such competitive pressures may lead to limited earnings and/or falling profit margins. As a result, the value of their securities may fall or fail to rise. In addition, many technology sector companies have limited operating histories and prices of these companies' securities historically have been more volatile than other securities, especially over the short term.
Note 9. Subsequent Events
Management has evaluated the events and transactions that have occurred through the date the financial statements were issued and noted no items requiring adjustment of the financial statements or additional disclosure.
Note 10. Information Regarding Pending and Settled Legal Proceedings
In December 2005, without admitting or denying the allegations, American Express Financial Corporation (AEFC, which is now known as Ameriprise Financial, Inc. (Ameriprise Financial)) entered into settlement agreements with the Securities and Exchange Commission (SEC) and Minnesota Department of Commerce (MDOC) related to market timing activities. As
a result, AEFC was censured and ordered to cease and desist from committing or causing any violations of certain provisions of the Investment Advisers Act of 1940, the Investment Company Act of 1940, and various Minnesota laws. AEFC agreed to pay disgorgement of $10 million and civil money penalties of $7 million. AEFC also agreed to retain an independent distribution consultant to assist in developing a plan for distribution of all disgorgement and civil penalties ordered by the SEC in accordance with various undertakings detailed at http://www.sec.gov/litigation/admin/ia-2451.pdf. Ameriprise Financial and its affiliates have cooperated with the SEC and the MDOC in these legal proceedings, and have made regular reports to the Funds' Boards of Trustees.
Ameriprise Financial and certain of its affiliates have historically been involved in a number of legal, arbitration and regulatory proceedings, including routine litigation, class actions, and governmental actions, concerning matters arising in connection with the conduct of their business activities. Ameriprise Financial believes that the Funds are not currently the subject of, and that neither Ameriprise Financial nor any of its affiliates are the subject of, any pending legal, arbitration or regulatory proceedings that are likely to have a material adverse effect on the Funds or the ability of Ameriprise Financial or its affiliates to perform under their contracts with the Funds. Ameriprise Financial is required to make quarterly (10-Q), annual (10-K) and, as necessary, 8-K filings with the SEC on legal and regulatory matters that relate to Ameriprise Financial and its affiliates. Copies of these filings may be obtained by accessing the SEC website at www.sec.gov.
There can be no assurance that these matters, or the adverse publicity associated with them, will not result in increased fund redemptions, reduced sale of fund shares or other adverse consequences to the Funds. Further, although we believe proceedings are not likely to have a material adverse effect on the Funds or the ability of Ameriprise Financial or its affiliates to perform under their contracts with the Funds, these proceedings are subject to uncertainties and, as such, we are unable to estimate the possible loss or range of loss that may result. An adverse outcome in one or more of these proceedings could result in adverse judgments, settlements, fines, penalties or other relief that could have a material adverse effect on the consolidated financial condition or results of operations of Ameriprise Financial.
Annual Report 2015
31
COLUMBIA GLOBAL TECHNOLOGY GROWTH FUND
REPORT OF INDEPENDENT REGISTERED PUBLIC ACCOUNTING FIRM
To the Trustees of Columbia Funds Series Trust I and the Shareholders of
Columbia Global Technology Growth Fund
In our opinion, the accompanying statement of assets and liabilities, including the portfolio of investments, and the related statements of operations and of changes in net assets and the financial highlights present fairly, in all material respects, the financial position of Columbia Global Technology Growth Fund (the "Fund," a series of Columbia Funds Series Trust I) at August 31, 2015, and the results of its operations, the changes in its net assets and the financial highlights for each of the periods indicated, in conformity with accounting principles generally accepted in the United States of America. These financial statements and financial highlights (hereafter referred to as "financial statements") are the responsibility of the Fund's management. Our responsibility is to express an opinion on these financial statements based on our audits. We conducted our audits of these financial statements in accordance with the standards of the Public Company Accounting Oversight Board (United States). Those standards require that we plan and perform the audit to obtain reasonable assurance about whether the financial statements are free of material misstatement. An audit includes examining, on a test basis, evidence supporting the amounts and disclosures in the financial statements, assessing the accounting principles used and significant estimates made by management, and evaluating the overall financial statement presentation. We believe that our audits, which included confirmation of securities at August 31, 2015 by correspondence with the custodian, brokers and transfer agent, and the application of alternative auditing procedures where such confirmations had not been received, provide a reasonable basis for our opinion.
PricewaterhouseCoopers LLP
Minneapolis, MN
October 22, 2015
Annual Report 2015
32
COLUMBIA GLOBAL TECHNOLOGY GROWTH FUND
FEDERAL INCOME TAX INFORMATION
(Unaudited)
The Fund hereby designates the following tax attributes for the fiscal year ended August 31, 2015. Shareholders will be notified in early 2016 of the amounts for use in preparing 2015 income tax returns.
Tax Designations:
| Qualified Dividend Income | | | 26.88 | % | |
| Dividends Received Deduction | | | 26.88 | % | |
Capital Gain Dividend | | $ | 8,953,686 | | |
Qualified Dividend Income. For taxable, non-corporate shareholders, the percentage of ordinary income distributed during the fiscal year that represents qualified dividend income subject to reduced tax rates.
Dividends Received Deduction. The percentage of ordinary income distributed during the fiscal year that qualifies for the corporate dividends received deduction.
Capital Gain Dividend. The Fund designates as a capital gain dividend the amount reflected above, or if subsequently determined to be different, the net capital gain of such fiscal period.
Annual Report 2015
33
COLUMBIA GLOBAL TECHNOLOGY GROWTH FUND
The Trustees serve terms of indefinite duration. The names and birth years of the Trustees and Officers of the Funds in Columbia Funds Series Trust I, the year each was first elected or appointed to office, their principal business occupations during at least the last five years, the number of Funds overseen by each Trustee and other directorships they hold are shown below. Each officer listed below serves as an officer of each Fund in Columbia Funds Series Trust I. The mailing address of each Trustee is: c/o Columbia Management Investment Advisers, LLC, 225 Franklin Street, Mail Drop BX32 05228, Boston, MA 02110.
Independent Trustees
Name, Year of Birth
and Position Held
with the Trust | | Year First
Appointed or
Elected as
Trustee to any
Fund Currently
in the Columbia
Funds Complex
or a Predecessor
Thereof | | Principal Occupation(s)
during the Past Five Years | | Number
of Funds
in the
Columbia
Funds
Complex
Overseen | | Other Directorships
Held by Trustee During
the Past Five Years | |
Janet Langford Carrig
(Born 1957)
Trustee | | | 1996 | | | Senior Vice President, General Counsel and Corporate Secretary, ConocoPhillips (integrated energy company) since September 2007; Deputy General Counsel — Corporate Legal Services, ConocoPhillips from August 2006 to August 2007; Partner, Zelle, Hofmann, Voelbel, Mason & Gette LLP (law firm) from March 2005 to July 2006; Adjunct Professor of Law, Northwestern University from September 2004 to June 2006; Director, UAL Corporation (airline) from February 2006 to July 2006; Chief Administrative Officer and Senior Vice President, Kmart Holding Corporation (consumer goods) from September 2003 to March 2004 | | | 60 | | | None | |
Douglas A. Hacker
(Born 1955)
Trustee and Chairman
of the Board | | | 1996 | | | Independent business executive since May 2006; Executive Vice President — Strategy of United Airlines from December 2002 to May 2006; President of UAL Loyalty Services (airline marketing company) from September 2001 to December 2002; Executive Vice President and Chief Financial Officer of United Airlines from July 1999 to September 2001 | | | 60 | | | Spartan Nash Company, (food distributor); Nash Finch Company (food distributor) from 2005 to 2013; Aircastle Limited (aircraft leasing); SeaCube Container Leasing Ltd. (container leasing) from 2010 to 2013; and Travelport Worldwide Limited (travel information technology) | |
Nancy T. Lukitsh
(Born 1956)
Trustee | | | 2011 | | | Senior Vice President, Partner and Director of Marketing, Wellington Management Company, LLP (investment adviser) from 1997 to 2010; Chair, Wellington Management Investment Portfolios (commingled non-U.S. investment pools) from 2007 to 2010; Director, Wellington Trust Company, NA and other Wellington affiliates from 1997 to 2010 | | | 60 | | | None | |
William E. Mayer
(Born 1940)
Trustee | | | 1991 | | | Partner, Park Avenue Equity Partners (private equity) since February 1999 | | | 60 | | | DynaVox Inc. (speech creation); Lee Enterprises (print media); WR Hambrecht + Co. (financial service provider) from 2000 to 2012; BlackRock Kelso Capital Corporation (investment company); and Premier, Inc. (healthcare) | |
Annual Report 2015
34
COLUMBIA GLOBAL TECHNOLOGY GROWTH FUND
TRUSTEES AND OFFICERS (continued)
Independent Trustees (continued)
Name, Year of Birth
and Position Held
with the Trust | | Year First
Appointed or
Elected as
Trustee to any
Fund Currently
in the Columbia
Funds Complex
or a Predecessor
Thereof | | Principal Occupation(s)
during the Past Five Years | | Number
of Funds
in the
Columbia
Funds
Complex
Overseen | | Other Directorships
Held by Trustee During
the Past Five Years | |
David M. Moffett
(Born 1952)
Trustee | | | 2011 | | | Retired. Consultant to Bridgewater and Associates; Chief Executive Officer, Federal Home Loan Mortgage Corporation, from 2008 to 2009; Senior Adviser, Global Financial Services Group, Carlyle Group, Inc., from 2007 to 2008; Vice Chairman and Chief Financial Officer, U.S. Bancorp, from 1993 to 2007 | | | 60 | | | Building Materials Holding Corp. (building materials and construction services); CIT Group Inc. (commercial and consumer finance); eBay Inc. (online trading community); E.W. Scripps Co. (print and television media); Genworth Financial, Inc. (financial and insurance products and services); MBIA Inc. (financial service provider); Paypal Holdings Inc. (payment and data processing services); and University of Oklahoma Foundation | |
Charles R. Nelson
(Born 1942)
Trustee | | | 1981 | | | Retired. Professor Emeritus, University of Washington since 2011; Professor of Economics, University of Washington from 1976 to 2011; Ford and Louisa Van Voorhis Professor of Political Economy, University of Washington from 1993 to 2011; Adjunct Professor of Statistics, University of Washington from 1980 to 2011; Associate Editor, Journal of Money, Credit and Banking from September 1993 to 2008; consultant on econometric and statistical matters | | | 60 | | | None | |
John J. Neuhauser
(Born 1943)
Trustee | | | 1984 | | | President, Saint Michael's College since August 2007; Director or Trustee of several non-profit organizations, including Fletcher Allen Health Care, Inc.; Academic Vice President and Dean of Faculties, Boston College from August 1999 to October 2005; University Professor, Boston College from November 2005 to August 2007 | | | 60 | | | Liberty All-Star Equity Fund and Liberty All-Star Growth Fund (closed-end funds) | |
Patrick J. Simpson
(Born 1944)
Trustee | | | 2000 | | | Partner, Perkins Coie LLP (law firm) | | | 60 | | | None | |
Anne-Lee Verville
(Born 1945)
Trustee | | | 1998 | | | Retired. General Manager, Global Education Industry from 1994 to 1997, President — Application Systems Division from 1991 to 1994, Chief Financial Officer — US Marketing & Services from 1988 to 1991, and Chief Information Officer from 1987 to 1988, IBM Corporation (computer and technology) | | | 60 | | | Enesco Group, Inc. (producer of giftware and home and garden decor products) from 2001 to 2006 | |
Annual Report 2015
35
COLUMBIA GLOBAL TECHNOLOGY GROWTH FUND
TRUSTEES AND OFFICERS (continued)
Interested Trustee Affiliate with Investment Manager*
Name, Year of Birth
and Position Held
with the Trust | | Year First
Appointed or
Elected as
Trustee to any
Fund Currently
in the Columbia
Funds Complex
or a Predecessor
Thereof | | Principal Occupation(s)
during the Past Five Years | | Number
of Funds
in the
Columbia
Funds
Complex
Overseen | | Other Directorships
Held by Trustee During
the Past Five Years | |
William F. Truscott
(Born 1960)
Trustee | | | 2012 | | | Chairman of the Board and President, Columbia Management Investment Advisers, LLC since May 2010 and February 2012, respectively (previously President and Chief Investment Officer, 2001-April 2010); Chief Executive Officer, Global Asset Management, Ameriprise Financial, Inc. since September 2012 (previously Chief Executive Officer, U.S. Asset Management & President, Annuities, May 2010-September 2012 and President — U.S. Asset Management and Chief Investment Officer, 2005-April 2010); Director and Chief Executive Officer, Columbia Management Investment Distributors, Inc. since May 2010 and February 2012, respectively (previously Chairman of the Board and Chief Executive Officer, 2006-April 2010); Chairman of the Board and Chief Executive Officer, RiverSource Distributors, Inc. since 2006; Director, Threadneedle Asset Management Holdings, SARL since 2014; President and Chief Executive Officer, Ameriprise Certificate Company, 2006-August 2012 | | | 187 | | | Chairman of the Board, Columbia Management Investment Advisers, LLC since May 2010; Director, Columbia Management Investment Distributors, Inc. since May 2010; Director, Ameriprise Certificate Company, 2006 to January 2013 | |
* Interested person (as defined under the 1940 Act) by reason of being an officer, director, security holder and/or employee of the Investment Manager or Ameriprise Financial.
The Statement of Additional Information has additional information about the Fund's Board members and is available, without charge, upon request by calling 800.345.6611; contacting your financial intermediary; or visiting columbiathreadneedle.com/us.
The Board has appointed officers who are responsible for day-to-day business decisions based on policies it has established. The officers serve at the pleasure of the Board. In addition to Mr. Truscott, who is Senior Vice President, the Funds' other officers are:
Fund Officers
Name,
Address and
Year of Birth | | Position and Year
First Appointed to
Position for any Fund
in the Columbia
Funds Complex or a
Predecessor Thereof | | Principal Occupation(s) During Past Five Years | |
Christopher O. Petersen
5228 Ameriprise
Financial Center
Minneapolis, MN 55474
Born 1970 | | President and Principal Executive Officer (2015) | | Vice President and Lead Chief Counsel, Ameriprise Financial, Inc. since January 2015 (previously, Vice President and Chief Counsel January 2010-December 2014; and Vice President and Group Counsel or Counsel 2004- January 2010); officer of Columbia Funds and affiliated funds since 2007. | |
Michael G. Clarke
225 Franklin Street
Boston, MA 02110
Born 1969 | | Treasurer (2011) and Chief Financial Officer (2009) | | Vice President — Mutual Fund Administration, Columbia Management Investment Advisers, LLC, since May 2010; Managing Director of Fund Administration, Columbia Management Advisors, LLC, September 2004-April 2010; senior officer of Columbia Funds and affiliated funds since 2002. | |
Annual Report 2015
36
COLUMBIA GLOBAL TECHNOLOGY GROWTH FUND
TRUSTEES AND OFFICERS (continued)
Fund Officers (continued)
Name,
Address and
Year of Birth | | Position and Year
First Appointed to
Position for any Fund
in the Columbia
Funds Complex or a
Predecessor Thereof | | Principal Occupation(s) During Past Five Years | |
Paul B. Goucher
100 Park Avenue
New York, NY 10017
Born 1968 | | Senior Vice President (2011), Chief Legal Officer (2015) and Assistant Secretary (2008) | | Vice President and Lead Chief Counsel, Ameriprise Financial, Inc. since November 2008 and January 2013, respectively (previously Chief Counsel, January 2010-January 2013 and Group Counsel, November 2008-January 2010). | |
Thomas P. McGuire
225 Franklin Street
Boston, MA 02110
Born 1972 | | Vice President and Chief Compliance Officer (2012) | | Vice President — Asset Management Compliance, Ameriprise Financial, Inc., since May 2010; Chief Compliance Officer, Ameriprise Certificate Company since September 2010; Compliance Executive, Bank of America, 2005-April 2010. | |
Colin Moore
225 Franklin Street
Boston, MA 02110
Born 1958 | | Senior Vice President (2010) | | Executive Vice President and Global Chief Investment Officer, Ameriprise Financial, Inc., since July 2013; Director and Global Chief Investment Officer, Columbia Management Investment Advisers, LLC since May 2010; Manager, Managing Director and Chief Investment Officer, Columbia Management Advisors, LLC, 2007-April 2010. | |
Michael E. DeFao
225 Franklin Street
Boston, MA 02110
Born 1968 | | Vice President (2011) and Assistant Secretary (2010) | | Vice President and Chief Counsel, Ameriprise Financial, Inc. since May 2010; Associate General Counsel, Bank of America, 2005-April 2010. | |
Joseph F. DiMaria
225 Franklin Street
Boston, MA 02110
Born 1968 | | Vice President (2011), Assistant Treasurer (2012) and Chief Accounting Officer (2008) | | Vice President — Mutual Fund Treasurer, Columbia Management Investment Advisers, LLC since May 2010; Director of Fund Administration, Columbia Management Advisors, LLC, 2006-April 2010. | |
Amy Johnson
5228 Ameriprise
Financial Center
Minneapolis, MN 55474
Born 1965 | | Vice President (2006) | | Managing Director and Chief Operating Officer, Columbia Management Investment Advisers, LLC since May 2010 (previously Chief Administrative Officer, 2009-April 2010, and Vice President — Asset Management and Trust Company Services, 2006-2009). | |
Lyn Kephart-Strong
5228 Ameriprise
Financial Center
Minneapolis, MN 55474
Born 1960 | | Vice President (2015) | | President, Columbia Management Investment Services Corp. since October 2014; Vice President & Resolution Officer, Ameriprise Trust Company since August 2009; President, RiverSource Service Corporation 2004-2010. | |
Ryan C. Larrenaga
225 Franklin Street
Boston, MA 02110
Born 1970 | | Vice President and Secretary (2015) | | Vice President and Group Counsel, Ameriprise Financial, Inc. since August 2011 (previously, Counsel from May 2010 to August 2011); Assistant General Counsel, Bank of America, 2005-April 2010; officer of Columbia Funds and affiliated funds since 2005. | |
Annual Report 2015
37
COLUMBIA GLOBAL TECHNOLOGY GROWTH FUND
BOARD CONSIDERATION AND APPROVAL OF ADVISORY AGREEMENT
On June 10, 2015, the Board of Trustees (the Board) and the Trustees who are not interested persons (as defined in the Investment Company Act of 1940) (the Independent Trustees) of Columbia Funds Series Trust I (the Trust) unanimously approved the continuation of the Investment Management Services Agreement (the Advisory Agreement) with Columbia Management Investment Advisers, LLC (the Investment Manager) with respect to Columbia Global Technology Growth Fund (the Fund), a series of the Trust. The Board and the Independent Trustees also unanimously approved an agreement (the Management Agreement and, together with the Advisory Agreement, the Agreements) combining the Advisory Agreement and the Fund's existing administrative services agreement (the Administrative Services Agreement) in a single agreement. The Board and the Independent Trustees approved the restatement of the Advisory Agreement with the Management Agreement to be effective for the Fund on January 1, 2016, the Fund's next annual prospectus update. As detailed below, the Board's Advisory Fees and Expenses Committee (the Committee) and the Board met on multiple occasions to review and discuss, both among themselves and with the management team of the Investment Manager, materials provided by the Investment Manager and others before determining to approve the Management Agreement and the continuation of the Advisory Agreement.
In connection with their deliberations regarding the approval of the Management Agreement and the continuation of the Advisory Agreement, the Committee and the Board evaluated materials requested from the Investment Manager regarding the Fund and the Agreements, and discussed these materials with representatives of the Investment Manager at Committee meetings held on March 3, 2015, April 29, 2015 and June 9, 2015 and at Board meetings held on March 4, 2015 and June 10, 2015. In addition, the Board considers matters bearing on the Agreements at most of its other meetings throughout the year and meets regularly with senior management of the Trust and the Investment Manager. Through the Board's Investment Oversight Committees, Trustees also meet with selected portfolio managers of the funds the Trustees oversee and other investment personnel at various times throughout the year. The Committee and the Board also consulted with its independent fee consultant, Fund counsel and with the Independent Trustees' independent legal counsel, who advised on various matters with respect to the Committee's and the Board's considerations and otherwise assisted the Committee and the Board in their deliberations. On June 9, 2015, the Committee recommended that the Board approve the Management Agreement and the continuation of the Advisory Agreement. On June 10, 2015, the Board, including the Independent Trustees, voting separately, unanimously approved the Management Agreement and the continuation of the Advisory Agreement for the Fund.
The Committee and the Board considered all information that they, their legal counsel or the Investment Manager believed reasonably necessary to evaluate and to determine whether to approve the Management Agreement and the continuation of the Advisory Agreement. The information and factors considered by the Committee and the Board in recommending for approval or approving the Management Agreement and the continuation of the Advisory Agreement for the Fund included the following:
• Information on the investment performance of the Fund relative to the performance of a group of mutual funds determined to be comparable to the Fund by an independent third-party data provider, as well as performance relative to benchmarks;
• Information on the Fund's advisory fees and total expenses, including information comparing the Fund's expenses to those of a group of comparable mutual funds, as determined by the independent third-party data provider;
• The Investment Manager's agreement to contractually limit or cap total operating expenses for the Fund so that total operating expenses (excluding certain fees and expenses, such as portfolio transaction costs and certain other investment related expenses, interest, taxes, acquired fund fees and expenses, and extraordinary expenses) would not exceed a specified percentage of the Fund's average annual net assets from January 1, 2016 through December 31, 2016;
• The terms and conditions of the Agreements;
Annual Report 2015
38
COLUMBIA GLOBAL TECHNOLOGY GROWTH FUND
BOARD CONSIDERATION AND APPROVAL OF ADVISORY AGREEMENT (continued)
• The current and proposed terms and conditions of other agreements and arrangements with affiliates of the Investment Manager relating to the operations of the Fund, including the Administrative Services Agreement1 and agreements with respect to the provision of distribution and transfer agency services to the Fund;
• Descriptions of various functions performed by the Investment Manager under the Agreements, including portfolio management and portfolio trading practices;
• Information regarding the management fees and investment performance of similarly-managed portfolios of other clients of the Investment Manager, including institutional separate accounts;
• Information regarding the reputation, regulatory history and resources of the Investment Manager, including information regarding senior management, portfolio managers and other personnel;
• Information regarding the capabilities of the Investment Manager with respect to compliance monitoring services, including an assessment of the Investment Manager's compliance system by the Fund's Chief Compliance Officer; and
• The profitability to the Investment Manager and its affiliates from their relationships with the Fund.
Nature, Extent and Quality of Services Provided under the Agreements
The Committee and the Board considered the nature, extent and quality of services provided to the Fund by the Investment Manager and its affiliates under the Agreements and under separate agreements for the provision of transfer agency and administrative services, and the resources dedicated to the Fund and the other Columbia Funds by the Investment Manager and its affiliates. The Committee and the Board also determined that the nature and level of the services to be provided under the Management Agreement would not decrease relative to the services provided under the Advisory Agreement and the Administrative Services Agreement. The Committee and the Board considered, among other things, the Investment Manager's ability to attract, motivate and retain highly qualified research, advisory and supervisory investment professionals (including personnel and other resources, compensation programs for personnel involved in fund management, reputation and other attributes), the portfolio management services provided by those investment professionals, and the quality of the Investment Manager's investment research capabilities and trade execution services. The Committee and the Board also considered the potential benefits to shareholders of investing in a mutual fund that is part of a fund complex offering exposure to a variety of asset classes and investment disciplines and providing a variety of fund and shareholder services.
The Committee and the Board also considered the professional experience and qualifications of the senior personnel of the Investment Manager, which included consideration of the Investment Manager's experience with similarly-structured funds. The Committee and the Board noted the compliance programs of and the compliance-related resources provided to the Fund by the Investment Manager and its affiliates, and considered the Investment Manager's ability to provide administrative services to the Fund and coordinate the activities of the Fund's other service providers. In evaluating the nature, extent and quality of services provided under the Agreements, the Committee and the Board considered that these services were provided to the Fund, rather than directly to Fund shareholders. The Committee and the Board accordingly affirmed, after considering various other matters, including the potential benefits to the Fund and its shareholders of the Independent Trustees' important role as pre-suit gatekeepers with respect to claims that they may determine are meritless or contrary to the Fund's best interests, that it was not the intention of the Board or the Investment Manager that there be any third-party beneficiaries of the Agreements. After reviewing these and related factors, the Committee and the Board concluded, within the context of their overall conclusions, that the nature, extent and quality of the services provided to the Fund under the Agreements supported the approval of the Management Agreement and the continuation of the Advisory Agreement.
1 Like the Advisory Agreement, the Administrative Services Agreement will terminate with respect to the Fund once the Management Agreement is effective for the Fund.
Annual Report 2015
39
COLUMBIA GLOBAL TECHNOLOGY GROWTH FUND
BOARD CONSIDERATION AND APPROVAL OF ADVISORY AGREEMENT (continued)
Investment Performance
The Committee and the Board reviewed information about the performance of the Fund over various time periods, including performance information relative to benchmarks and information based on reports of the independent third-party data provider that compared the performance of the Fund to the performance of a group of comparable mutual funds, and data provided by the independent fee consultant. The Committee and the Board also reviewed a description of the third party's methodology for identifying the Fund's peer groups for purposes of performance and expense comparisons.
The Committee and the Board noted that, through December 31, 2014, the Fund's performance was in the seventeenth, sixth and twenty-second percentile (where the best performance would be in the first percentile) of its category selected by the independent third-party data provider for the purposes of performance comparisons for the one-, three- and five-year periods, respectively.
The Committee and the Board also considered the Investment Manager's performance and reputation generally, the Investment Manager's historical responsiveness to Board concerns about performance, and the Investment Manager's willingness to take steps intended to improve performance. After reviewing these and related factors, the Committee and the Board concluded, within the context of their overall conclusions, that the performance of the Fund was sufficient, in light of other considerations, to warrant the continuation of the Advisory Agreement and the approval of the Management Agreement.
Investment Advisory Fee Rates and Other Expenses
The Committee and the Board considered the advisory fees charged to the Fund under the Advisory Agreement as well as the total expenses incurred by the Fund. In assessing the reasonableness of the fees under the Advisory Agreement, the Committee and the Board considered, among other information, the Fund's advisory fee and its total expense ratio as a percentage of average daily net assets. The Committee and the Board also considered that the proposed management fee would not exceed the sum of the fee rates payable under the Advisory Agreement and the Administrative Services Agreement. The Committee and the Board considered data provided by the independent fee consultant. The Committee and the Board noted that, as of December 31, 2014, the Fund's actual management fee and net expense ratio are both ranked in the 3rd quintile (where the lowest fees and expenses would be in the first quintile) against the Fund's expense universe as determined by the independent third-party data provider for purposes of expense comparison. The Committee and the Board also took into account the fee waiver and expense limitation arrangements agreed to by the Investment Manager, as noted above.
The Committee and the Board also received and considered information about the advisory fees charged by the Investment Manager to institutional separate accounts. In considering the fees charged to those accounts, the Committee and the Board took into account, among other things, the Investment Manager's representations about the differences between managing mutual funds as compared to other types of accounts, including differences in the services provided, differences in the risk profile of such business for the Investment Manager and the additional resources required to manage mutual funds effectively. The Committee and the Board also received and considered information about the fees charged by the Investment Manager for sub-advisory services provided to comparable unaffiliated funds. In evaluating the Fund's advisory fees, the Committee and the Board also took into account the demands, complexity and quality of the investment management of the Fund.
After reviewing these and related factors, the Committee and the Board concluded, within the context of their overall conclusions, that the advisory/management fee rates and expenses of the Fund were sufficient, in light of other considerations, to warrant the approval of the Management Agreement and continuation of the Advisory Agreement.
Costs of Services Provided and Profitability
The Committee and the Board also took note of the costs the Investment Manager and its affiliates incur in connection with the services provided (both on an absolute and relative basis) and the profitability to the Investment Manager and its affiliates in connection with their relationships with the Fund.
Annual Report 2015
40
COLUMBIA GLOBAL TECHNOLOGY GROWTH FUND
BOARD CONSIDERATION AND APPROVAL OF ADVISORY AGREEMENT (continued)
The Committee and the Board also considered the compensation directly or indirectly received by the Investment Manager's affiliates in connection with their relationships with the Fund. The Committee and the Board reviewed information provided by management as to the profitability to the Investment Manager and its affiliates of their relationships with the Fund, information about the allocation of expenses used to calculate profitability, and comparisons of profitability levels realized in 2014 to profitability levels realized in 2013. When reviewing profitability, the Committee and the Board also considered court cases in which adviser profitability was an issue in whole or in part, the performance of similarly managed funds, the performance of the Fund, and the expense ratio of the Fund. The Committee and the Board also considered information provided by the Investment Manager regarding the Investment Manager's financial condition and comparing its profitability to that of other asset management firms that are, or are subsidiaries of, publicly traded companies.
After reviewing these and related factors, the Committee and the Board concluded, within the context of their overall conclusions, that the costs of services provided and the profitability to the Investment Manager and its affiliates from their relationships with the Fund supported the approval of the Management Agreement and the continuation of the Advisory Agreement.
Economies of Scale
The Committee and the Board considered the potential existence of economies of scale in the provision by the Investment Manager of services to the Fund, to groups of related funds, and to the Investment Manager's investment advisory clients as a whole, and whether those economies of scale were shared with the Fund through breakpoints in investment advisory fees or other means, such as expense limitation arrangements and additional investments by the Investment Manager in investment, trading and compliance resources. The Committee and the Board noted that the investment advisory and management fee schedules for the Fund contained breakpoints that would reduce the fee rate on assets above specified threshold levels.
In considering these matters, the Committee and the Board also considered the costs of the services provided and the profitability to the Investment Manager and its affiliates from their relationships with the Fund, as discussed above. After reviewing these and related factors, the Committee and the Board concluded, within the context of their overall conclusions, that the extent to which any economies of scale were expected to be shared with the Fund supported the approval of the Management Agreement and the continuation of the Advisory Agreement.
Other Benefits to the Investment Manager
The Committee and the Board received and considered information regarding "fall-out" or ancillary benefits received by the Investment Manager and its affiliates as a result of their relationships with the Fund, such as the engagement of the Investment Manager to provide administrative services to the Fund and the engagement of the Investment Manager's affiliates to provide distribution and transfer agency services to the Fund. In this regard, among other matters, the Committee and the Board considered that the Fund's distributor retains a portion of the distribution fees from the Fund and receives a portion of the sales charges on sales or redemptions of certain classes of shares of the Fund. The Committee and the Board also considered the benefits of research made available to the Investment Manager by reason of brokerage commissions generated by the Fund's securities transactions, and reviewed information about the Investment Manager's practices with respect to allocating portfolio transactions for brokerage and research services. The Committee and the Board considered the possible conflicts of interest associated with certain fall-out or other ancillary benefits and the reporting, disclosure and other processes that are in place to address such possible conflicts of interest. The Committee and the Board recognized that the Investment Manager's profitability would be somewhat lower without these benefits.
Conclusion
The Committee and the Board reviewed all of the above considerations in reaching their decisions to recommend or approve the Management Agreement and the continuation of the Advisory Agreement. In their deliberations, the Trustees did not identify any particular information that was all-important or controlling, and individual
Annual Report 2015
41
COLUMBIA GLOBAL TECHNOLOGY GROWTH FUND
BOARD CONSIDERATION AND APPROVAL OF ADVISORY AGREEMENT (continued)
Trustees may have attributed different weights to the various factors. Based on their evaluation of all factors that they deemed to be material, including those factors described above, and assisted by the advice of independent legal counsel, the Board, including the Independent Trustees, voting separately, unanimously approved the Management Agreement and the continuation of the Advisory Agreement.
Annual Report 2015
42
COLUMBIA GLOBAL TECHNOLOGY GROWTH FUND
IMPORTANT INFORMATION ABOUT THIS REPORT
Each fund mails one shareholder report to each shareholder address. If you would like more than one report, please call shareholder services at 800.345.6611 and additional reports will be sent to you.
The policy of the Board is to vote the proxies of the companies in which each fund holds investments consistent with the procedures as stated in the Statement of Additional Information (SAI). You may obtain a copy of the SAI without charge by calling 800.345.6611; contacting your financial intermediary; visiting columbiathreadneedle.com/us; or searching the website of the Securities and Exchange Commission (SEC) at sec.gov. Information regarding how each fund voted proxies relating to portfolio securities is filed with the SEC by August 31st for the most recent 12-month period ending June 30th of that year, and is available without charge by visiting columbiathreadneedle.com/us, or searching the website of the SEC at sec.gov.
Each fund files a complete schedule of portfolio holdings with the SEC for the first and third quarters of each fiscal year on Form N-Q. Each fund's Form N-Q is available on the SEC's website at sec.gov and may be reviewed and copied at the SEC's Public Reference Room in Washington, D.C. Information on the operation of the Public Reference Room may be obtained by calling 800.SEC.0330. Each fund's complete schedule of portfolio holdings, as filed on Form N-Q, can also be obtained without charge, upon request, by calling 800.345.6611.
Annual Report 2015
43
Columbia Global Technology Growth Fund
P.O. Box 8081
Boston, MA 02266-8081

This information is for use with concurrent or prior delivery of a fund prospectus. Please read and consider the investment objectives, risks, charges and expenses for any fund carefully before investing. For a prospectus and summary prospectus, which contains this and other important information about the Fund, go to columbiathreadneedle.com/us. The Fund is distributed by Columbia Management Investment Distributors, Inc., member FINRA, and managed by Columbia Management Investment Advisers, LLC.
Columbia Threadneedle Investments (Columbia Threadneedle) is the global brand name of the Columbia and Threadneedle group of companies.
All rights reserved. Columbia Management Investment Distributors, Inc., 225 Franklin Street, Boston, MA 02110-2804
© 2015 Columbia Management Investment Advisers, LLC.
columbiathreadneedle.com/us
ANN234_08_E01_(10/15)

ANNUAL REPORT
August 31, 2015

ACTIVE PORTFOLIOS® MULTI-MANAGER
CORE PLUS BOND FUND


ABOUT COLUMBIA THREADNEEDLE INVESTMENTS
Columbia Threadneedle Investments is a leading global asset management group that provides a broad range of actively managed investment strategies and solutions for individual, institutional and corporate clients around the world.
With more than 2,000 people, including over 450 investment professionals based in North America, Europe and Asia, we manage $503 billion* of assets across developed and emerging market equities, fixed income, asset allocation solutions and alternatives. We are the 13th largest manager of long-term mutual fund assets in the U.S.** and the 4th largest manager of retail funds in the U.K.***
Our priority is the investment success of our clients. We aim to deliver the investment outcomes they expect through an investment approach that is team-based, performance-driven and risk-aware. Our culture is dynamic and interactive. By sharing our insights across asset classes and geographies, we generate richer perspectives on global, regional and local investment landscapes. The ability to exchange and debate investment ideas in a collaborative environment enriches our teams’ investment processes. More importantly, it results in better informed investment decisions for our clients.
Columbia funds are distributed by Columbia Management Investment Distributors, Inc., member FINRA, and managed by Columbia Management Investment Advisers, LLC.
Columbia Threadneedle Investments (Columbia Threadneedle) is the global brand name of the Columbia and Threadneedle group of companies.
| * | | In U.S. dollars as of June 30, 2015. Source: Ameriprise Q2 Earnings Release. Includes all assets managed by entities in the Columbia and Threadneedle groups of companies. |
Contact us for more current data.
| ** | | Source: ICI as of June 30, 2015 for Columbia Management Investment Advisers, LLC. |
| *** | | Source: Investment Association as of June 2015 for Threadneedle Asset Management Limited. |
© 2015 Columbia Management Investment Advisers, LLC. All rights reserved.
Not part of the shareholder report
PRESIDENT’S MESSAGE

Dear Shareholder,
Today’s investors are typically focused on outcomes, like living a certain retirement lifestyle, paying for college education or building a legacy. But in today’s complex global investment landscape, even simple goals are not easily achieved.
At Columbia Threadneedle Investments, we aspire to help satisfy five core needs of today’s investors:
| | n | | Generate an appropriate stream of income in retirement |
Traditional approaches to generating income may not provide the diversification benefits they once did, and they may actually introduce unwanted risk in today’s market. To seek to improve your potential to live comfortably long term, we endeavor to pursue investments that explore less traveled paths to income.
| n | | Navigate a changing interest rate environment |
Today’s uncertain market environment includes the prospect of a rise in interest rates. Blending traditional investments with non-traditional or alternative products may help protect your wealth during periods of volatility. We can attempt to help strengthen your portfolio with agile products designed to take on the market’s ups and downs.
| n | | Maximize after-tax returns |
In an environment where what you keep may be more important than what you earn, municipal bonds can help mitigate high tax burdens while providing potentially attractive yields. Our state and federal tax-exempt products are aimed at helping investors manage risk, minimize the fluctuation of capital and grow wealth on a more tax-efficient basis.
| n | | Grow assets to achieve financial goals |
We believe that finding and protecting growth comes from a disciplined security selection process designed to create excess return. Our goal is to provide investment solutions built to help you face today’s market challenges and grow your assets at each crossroad of your journey.
| n | | Ease the impact of volatile markets |
Despite a bull market run that has benefited many investors over the past several years, it’s important to remember the lessons of 2008 and the value that a well-diversified portfolio may provide through times of market volatility. We are here to help you hold onto the savings you have worked tirelessly to amass, and to provide you the best opportunity to maintain your standard of living regardless of market conditions.
Find out today how we can help you confidently invest to realize your dreams. Please visit us at blog.columbiathreadneedleus.com/our-best-ideas to learn more about our unique investment solutions.
The world is constantly changing, but our priority remains the same: to help you secure your finances, meet your goals and achieve success. Thank you for your continued investment with us.
Sincerely,

Christopher O. Petersen
President, Columbia Funds
Investors should consider the investment objectives, risks, charges and expenses of a mutual fund carefully before investing. For a free prospectus and summary prospectus, which contains this and other important information about a fund, visit columbiathreadneedle.com/us. The prospectus should be read carefully before investing.
Columbia Funds are distributed by Columbia Management Investment Distributors, Inc., member FINRA, and managed by Columbia Management Investment Advisers, LLC.
© 2015 Columbia Management Investment Advisers, LLC. All rights reserved.
Annual Report 2015
| | |
| |
| | ACTIVE PORTFOLIOS® MULTI-MANAGER CORE PLUS BOND FUND |
TABLE OF CONTENTS
Fund Investment Manager
Columbia Management Investment
Advisers, LLC
225 Franklin Street
Boston, MA 02110
Fund Distributor
Columbia Management Investment
Distributors, Inc.
225 Franklin Street
Boston, MA 02110
Fund Transfer Agent
Columbia Management Investment
Services Corp.
P.O. Box 8081
Boston, MA 02266-8081
For more information about any of the funds, please visit columbiathreadneedle.com/us or call 800.345.6611. Customer Service Representatives are available to answer your questions Monday through Friday from 8 a.m. to 7 p.m. Eastern time.
The views expressed in this report reflect the current views of the respective parties. These views are not guarantees of future performance and involve certain risks, uncertainties and assumptions that are difficult to predict, so actual outcomes and results may differ significantly from the views expressed. These views are subject to change at any time based upon economic, market or other conditions and the respective parties disclaim any responsibility to update such views. These views may not be relied on as investment advice and, because investment decisions for a Columbia fund are based on numerous factors, may not be relied on as an indication of trading intent on behalf of any particular Columbia fund. References to specific securities should not be construed as a recommendation or investment advice.
Annual Report 2015
| | |
| |
| ACTIVE PORTFOLIOS® MULTI-MANAGER CORE PLUS BOND FUND | | |
PERFORMANCE OVERVIEW
Performance Summary
| n | | Active Portfolios® Multi-Manager Core Plus Bond Fund (the Fund) Class A shares returned 0.49% for the 12-month period that ended August 31, 2015. |
| n | | The Fund underperformed its benchmark, the Barclays U.S. Aggregate Bond Index, which returned 1.56% over the same period. |
| n | | The Fund’s underperformance can be attributed primarily to sector allocation and duration positioning decisions. |
| | | | | | | | | | |
Average Annual Total Returns (%) (for period ended August 31, 2015) | | | | | | | | | | |
| | | Inception | | 1 Year | | | Life | |
Class A | | 04/20/12 | | | 0.49 | | | | 2.45 | |
Barclays U.S. Aggregate Bond Index | | | | | 1.56 | | | | 2.14 | |
All results shown assume reinvestment of distributions during the period. Returns do not reflect the deduction of taxes that a shareholder may pay on Fund distributions or on the redemption of Fund shares. Performance results reflect the effect of any fee waivers or reimbursements of Fund expenses by Columbia Management Investment Advisers, LLC and/or any of its affiliates. Absent these fee waivers or expense reimbursement arrangements, performance results would have been lower.
The performance information shown represents past performance and is not a guarantee of future results. The investment return and principal value of your investment will fluctuate so that your shares, when redeemed, may be worth more or less than their original cost. Current performance may be lower or higher than the performance information shown. You may obtain performance information current to the most recent month-end by contacting your financial intermediary, visiting columbiathreadneedle.com/us or calling 800.345.6611.
The Barclays U.S. Aggregate Bond Index is a broad-based benchmark that measures the investment grade, U.S. dollar-denominated, fixed-rate taxable bond market, including Treasuries, government-related and corporate securities, mortgage-backed securities (agency fixed-rate and hybrid adjustable-rate mortgage passthroughs), asset-backed securities, and commercial mortgage-backed securities.
Indices are not available for investment, are not professionally managed and do not reflect sales charges, fees, brokerage commissions, taxes or other expenses of investing. Securities in the Fund may not match those in an index.
| | |
| |
| | ACTIVE PORTFOLIOS® MULTI-MANAGER CORE PLUS BOND FUND |
PERFORMANCE OVERVIEW (continued)
|
Performance of a Hypothetical $10,000 Investment (April 20, 2012 — August 31, 2015) |

The chart above shows the change in value of a hypothetical $10,000 investment in Class A shares of Active Portfolios® Multi-Manager Core Plus Bond Fund during the stated time period, and does not reflect the deduction of taxes that a shareholder may pay on Fund distributions or on the redemption of Fund shares.
| | |
| |
| ACTIVE PORTFOLIOS® MULTI-MANAGER CORE PLUS BOND FUND | | |
MANAGER DISCUSSION OF FUND PERFORMANCE
The Fund is managed by two independent money management firms and by Columbia Management Investment Advisors, LLC (CMIA) with each investing a portion of the portfolio’s assets. As of August 31, 2015, Federated Investment Management Company (Federated), TCW Investment Management Company (TCW) and CMIA managed approximately 26%, 41% and 33% of the portfolio, respectively.
For the 12-month period that ended August 31, 2015, the Fund’s Class A shares returned 0.49%. The Fund underperformed its benchmark, the Barclays U.S. Aggregate Bond Index, which returned 1.56% over the same period. The Fund’s underperformance can be attributed primarily to sector allocation and duration positioning decisions.
Fixed-Income Markets Driven By Policy, Economic and Geopolitical Factors
Geopolitical events surrounding Greece’s potential exit from the European Union and China’s currency devaluation influenced U.S. rates during the fiscal period, as investors sought relative safety in U.S. Treasury securities. There was also great anticipation as to the timing and pace of the Federal Reserve’s (the Fed) first interest rate increase, while, simultaneously, other major central banks around the world were implementing versions of quantitative easing. As these events discouraged investors from holding “risk assets,” credit spreads widened. The decline in oil prices additionally impacted credit spreads amongst energy-related corporate bonds. Higher regulatory capital requirements and stricter trading risk tolerance for banks and broker-dealers impacted market trading of credit debt, causing some further amount of spread widening during the period. These factors, coupled with an enormous amount of new debt issuance during the period, also impacted market liquidity, particularly in secondary market trading of credit debt.
Against this backdrop, U.S. Treasury yields rose at the shorter term end of the yield curve, or spectrum of maturities, while rates fell for intermediate- and longer term U.S. Treasury securities. Short-term rates rose in response to the Fed’s statements about a less accommodative monetary policy. Longer rates reacted to demand from foreign investors seeking higher yields than available in Europe. As long-term rates fell and short-term rates rose, the yield curve flattened during the period.
Credit Sector Allocations and Duration Positioning Dampened Fund Returns
Federated: Our portion of the Fund underperformed the benchmark during the period primarily due to its “down in quality” credit sector bias. Duration positioning also detracted. Security selection overall and yield curve positioning contributed positively.
Our portion of the Fund held approximately 9% of its assets in high-yield corporate bonds and 2% in emerging market bonds and was overweight relative to the benchmark in BBB-rated securities within its investment-grade corporate bond allocation. Spreads, or yield differentials, to U.S. Treasuries of these lower rated credit segments widened during the period due to geopolitical worries about Greece and China, the decline in oil and other commodity prices, stock market volatility, outflows from bond mutual funds
Portfolio Management
Columbia Management Investment Advisers, LLC
Brian Lavin, CFA
Carl Pappo, CFA
Michael Zazzarino
Federated Investment Management Company
Jerome Conner, CFA
Donald Ellenberger
TCW Investment Management Company
Stephen Kane, CFA
Laird Landmann
Tad Rivelle
Bryan Whalen, CFA
| | | | |
Portfolio Breakdown (%)
(at August 31, 2015) | |
Asset-Backed Securities — Agency | | | 0.7 | |
Asset-Backed Securities — Non-Agency | | | 11.3 | |
Commercial Mortgage-Backed Securities — Agency | | | 1.9 | |
Commercial Mortgage-Backed Securities — Non-Agency | | | 3.7 | |
Common Stocks | | | 0.0 | (a) |
Corporate Bonds & Notes | | | 27.7 | |
Fixed-Income Funds | | | 0.6 | |
Foreign Government Obligations | | | 1.3 | |
Inflation-Indexed Bonds | | | 2.7 | |
Money Market Funds | | | 6.4 | |
Municipal Bonds | | | 0.4 | |
Preferred Debt | | | 0.3 | |
Residential Mortgage-Backed Securities — Agency | | | 21.4 | |
Residential Mortgage-Backed Securities — Non-Agency | | | 3.7 | |
Senior Loans | | | 0.3 | |
Treasury Bills | | | 0.0 | (a) |
U.S. Government & Agency Obligations | | | 1.0 | |
U.S. Treasury Obligations | | | 16.6 | |
Total | | | 100.0 | |
Percentages indicated are based upon total investments. The Fund’s portfolio composition is subject to change.
(a) Rounds to zero.
| | |
| |
| | ACTIVE PORTFOLIOS® MULTI-MANAGER CORE PLUS BOND FUND |
MANAGER DISCUSSION OF FUND PERFORMANCE (continued)
| | | | |
Quality Breakdown (%) (at August 31, 2015) | |
AAA rating | | | 61.4 | |
AA rating | | | 2.4 | |
A rating | | | 8.4 | |
BBB rating | | | 17.6 | |
BB rating | | | 3.7 | |
B rating | | | 2.5 | |
CCC rating | | | 1.6 | |
CC rating | | | 0.5 | |
C rating | | | 0.1 | |
D rating | | | 0.5 | |
Not rated | | | 1.3 | |
Total | | | 100.0 | |
Percentages indicated are based upon total fixed income investments (excluding Money Market Funds).
Bond ratings apply to the underlying holdings of the Fund and not the Fund itself and are divided into categories ranging from highest to lowest credit quality, determined by using the middle rating of Moody’s, S&P and Fitch, after dropping the highest and lowest available ratings. When ratings are available from only two rating agencies, the lower rating is used. When a rating is available from only one rating agency, that rating is used. When a bond is not rated by any rating agency, it is designated as “Not rated.” Credit quality ratings assigned by a rating agency are subjective opinions, not statements of fact, and are subject to change, including daily. The ratings assigned by credit rating agencies are but one of the considerations that the Investment Manager incorporates into its credit analysis process, along with such other issuer-specific factors as cash flows, capital structure and leverage ratios, ability to de-leverage (repay) through free cash flow, quality of management, market positioning and access to capital, as well as such security-specific factors as the terms of the security (e.g., interest rate and time to maturity) and the amount and type of any collateral.
and concerns the Fed would soon begin removing liquidity from the markets. Indeed, investment-grade corporate bond spreads widened to U.S. Treasuries in ten of the 12 months of the period, something that has only happened twice in the past 25 years. Duration positioning also detracted from relative results, albeit more modestly. Our portion of the Fund’s duration positioning varied during the period, as what we call our Duration Pod adjusted its position on interest rates. However, for most of the period, our portion of the Fund had a duration position shorter than that of the benchmark, concentrated in intermediate- and longer term securities, segments wherein rates fell. (Our Pods are critical decision-making tools built around five crucial factors in bond fund strategy — duration management, sector allocation, yield curve analysis, currency management and security selection.)
Security selection overall contributed positively to our portion of the Fund’s results. Lagging performance from Treasury inflation-protected securities and 30-year industrial corporate bonds was more than offset by an emphasis on banks and other financials and a lesser exposure to GNMA mortgage-backed securities, which proved beneficial. Yield curve positioning also helped. Our portion of the Fund was positioned for a flattening yield curve, and in fact, the yield curve flattened during the period as interest rates at the short-term end of the yield curve rose and rates at the long-term end of the yield curve fell. Short-term rates rose, as the start of the Fed’s tightening cycle drew nearer, while long-term rates fell modestly due to weak global economic growth, declining inflation due to collapsing commodity prices, equity market volatility and concerns that rate hikes by the Fed would be a policy error depressing U.S. economic growth prospects. This flattening bias offset the detracting effect of having an underweighted exposure to the intermediate segment of the yield curve, which performed well later in the period as the market began to price in a more protracted Fed tightening cycle.
TCW: Our portion of the Fund outperformed the benchmark during the period, predominantly due to its relative underweight to the corporate sector, which experienced spread widening amidst heavy issuance. Further contributions came from its relative underweight to commodity-related sectors, which significantly trailed the benchmark. In addition, exposure to non-agency mortgage-backed securities, which are not components of the benchmark, was additive, particularly securities backed by subprime collateral. Fundamentals for this sector showed improvement, with prepayment activity up and severities and delinquencies declining.
Conversely, issue selection among asset-backed securities detracted from performance, given our emphasis on government, guaranteed student loans, which experienced weakness late in the period due to concerns about potential downgrades. The defensive duration positioning of our portion of the Fund — i.e., approximately 7/10ths of a year short of the benchmark for most of the period — also detracted from relative results during the period, as U.S. Treasury yields fell across intermediate and long-term maturities. We had taken this duration stance based on our view that interest rates would rise over time.
An underweight to two-year to five-year maturities benefited our portion of the Fund, as short-term rates rose during the period. However, the positive effect of being underweight the short-term end of the yield curve was offset
| | |
| |
| ACTIVE PORTFOLIOS® MULTI-MANAGER CORE PLUS BOND FUND | | |
MANAGER DISCUSSION OF FUND PERFORMANCE (continued)
by the negative impact of being underweight the long-term end of the yield curve, where rates fell. Thus, overall, yield curve positioning had a neutral effect on our portion of the Fund’s results during the period.
CMIA: Our portion of the Fund underperformed the benchmark during the period, as an overweight allocation to credit dampened relative results. Within our portion of the Fund’s allocation to credit, exposure to energy-related bonds detracted from performance. Further detracting from our portion of the Fund’s results was an underweight position in U.S. Treasury securities, which outperformed credit during the period; issue selection in short maturity, high quality asset-backed securities; and exposure to agency mortgage-backed securities.
Duration and yield curve positioning hampered relative results as well. Our portion of the Fund maintained a modestly shorter duration than that of the benchmark in light of Fed statements and positive U.S. economic activity. We also generally maintained a flattening yield curve bias, although adjustments were made based on yield curve movements. Our thinking was the Fed’s signals to move short-term rates would lead short rates to rise more than long rates. Demand for yield and duration by pension plans and insurance companies would also keep longer rates stable and result in a flatter curve, in our view. While the yield curve did indeed flatten during the period, long rates actually fell.
On the positive side, security selection among investment-grade corporate bonds, non-agency mortgage-backed securities and commercial mortgage-backed securities proved beneficial. Within the investment-grade corporate bond sector, an overweight to and security selection among financial institutions, including an allocation to preferred debt, and an underweight to the metals and mining industry especially helped. Spreads widened materially in the metals and mining industry due to concerns of oversupply and waning demand from China.
Fed Policy and Exogenous Factors Drove Portfolio Changes
Federated: Our portion of the Fund’s top-down positioning is driven by our Alpha Pods, committees of senior investment professionals tasked with determining the direction of interest rates, the yield curve, spreads and the U.S. dollar versus other currencies. The main factors driving the Pods’ decisions during the period were the changing perceptions of when the Fed would begin raising interest rates and the pace at which it would proceed. We believed the Fed would begin tightening sooner than what actually happened. Also impacting our decision process were our views on the U.S. dollar, commodity prices and whether or not China would have a soft or hard landing, which, in turn, had significant implications for global economic growth and profitability at multi-national U.S. companies. Based on recommendations from our Alpha Pods, our portion of the Fund’s duration shifted between 85% and 95% of that of the benchmark. Also, our portion of the Fund moved between a flattening bias and a laddered position on the yield curve, had virtually no non-U.S. dollar currency exposure and generally remained overweight the credit sectors. The unifying thesis behind these positions was our expectation that the Fed would soon begin raising rates in response to an improving labor market and gradually rising wages.
Investment Risks
Market risk may affect a single issuer, sector of the economy, industry or the market as a whole. Mortgage- and asset-backed securities are affected by interest rates, financial health of issuers/originators, creditworthiness of entities providing credit enhancements and the value of underlying assets. Fixed-income securities present issuer default risk. Non-investment-grade (high-yield or junk) securities present greater price volatility and more risk to principal and income than higher rated securities. A rise in interest rates may result in a price decline of fixed-income instruments held by the Fund, negatively impacting its performance and NAV. Falling rates may result in the Fund investing in lower yielding debt instruments, lowering the Fund’s income and yield. These risks may be heightened for longer maturity and duration securities. Prepayment and extension risk exists as a loan, bond or other investment may be called, prepaid or redeemed before maturity and that similar yielding investments may not be available for purchase. Investing in derivatives is a specialized activity that involves special risks that subject the Fund to significant loss potential, including when used as leverage, and may result in greater fluctuation in fund value. The Fund is managed by multiple advisers independently of one another, which may result in contradicting trades (i.e., with no net benefit to the fund), while increasing transaction costs. Market or other (e.g., interest rate) environments may adversely affect the liquidity of fund investments, negatively impacting their price. Generally, the less liquid the market at the time the Fund sells a holding, the greater the risk of loss or decline of value to the Fund. See the Fund’s prospectus for information on these and other risks.
| | |
| |
| | ACTIVE PORTFOLIOS® MULTI-MANAGER CORE PLUS BOND FUND |
MANAGER DISCUSSION OF FUND PERFORMANCE (continued)
During the period, we increased our portion of the Fund’s position in Bank of America. In our view, banks are an attractive holding due to new Dodd-Frank regulations that require banks to hold more capital, more liquid assets and have less leverage. In addition, banks cannot increase dividends and buy back stock without approval of the Fed. We also added a position in a General Motors bond based on its improving profitability and forecasted strength in demand for both autos and light trucks. We also purchased a bond of the branded pharmaceutical division of Abbott Laboratories based on what we considered to be its attractive pricing, planned deleveraging and solid growth prospects for the company’s core drug franchises. We sold our portion of the Fund’s position in a Petrobras bond maturing in 2041 and replaced it with one maturing in 2021 to reduce spread duration to this credit. We also sold a position in a Barrick Gold bond based on concerns about declining gold prices relative to the firm’s production costs. We sold our portion of the Fund’s position in a Conagra bond due to concerns about potential shareholder-friendly activities in response to activist investor pressures.
At the end of August 2015, relative to the benchmark, our portion of the Fund was overweight in high-yield and investment-grade corporate bonds, commercial mortgage-backed securities and loans relative to the benchmark. Within the credit sectors, our portion of the Fund was overweight autos, banks, life insurance, real estate investment trusts, telecommunications, metals and mining, refiners and pipelines and was underweight consumer products, oil field services, health care, pharmaceuticals, retail, supermarkets and technology. Our portion of the Fund was underweight the benchmark index in U.S. Treasury securities and agency securities and rather neutral relative to the benchmark in agency mortgage-backed securities and emerging market bonds. Our portion of the Fund was positioned with a shorter duration than that of the benchmark at the end of the period.
TCW: Given the ongoing aging of the credit cycle, we continued to position our portion of the Fund with an eye toward risk reduction by moving into higher quality securities up in the capital structure. In terms of sector position, we trimmed our portion of the Fund’s exposure to corporate credits, as valuations became less attractive, in our view, from a risk/return standpoint. Additionally, within non-corporate credit, we considerably reduced exposure to municipal bonds. We added back a small amount of duration during the period, ending the period approximately 3/4ths of a year short of the benchmark compared to one year short of the benchmark in August 2014.
At the end of the period, corporate credit represented a relative underweight. Within corporate credit, positioning was focused on financials given limited re-leveraging risk and reasonable yield premiums, while industrial exposure remained selective with positions in what we perceived to be asset-heavy companies with stable cash flows and strong balance sheets. Additionally, we maintained a small position in our portion of the Fund in bank loans and high yield credit. Agency mortgage-backed securities also represented a relative underweight at the end of the period, especially among premium coupon issues given potential extension risk associated with a rising rate environment. Exposure to non-agency mortgage-backed securities emphasized issues with what we considered to be better relative quality and near-term cash flows. Asset-backed securities and commercial mortgage-backed securities represented relative overweights. Security selection
| | |
| |
| ACTIVE PORTFOLIOS® MULTI-MANAGER CORE PLUS BOND FUND | | |
MANAGER DISCUSSION OF FUND PERFORMANCE (continued)
focused on non-traditional asset-backed securities, such as student loans. Our portion of the Fund’s commercial mortgage-backed securities position favored agency issues with select exposure to non-agency commercial mortgage-backed securities. At the end of the period, our portion of the Fund remained defensively positioned with a duration stance approximately 3/4ths of year shorter than that of the benchmark.
CMIA: In addition to modest adjustments in duration and yield curve positioning as market conditions shifted, “rich” credit valuations on top of a pending change in Fed monetary policy prompted us to upgrade credit quality in our portion of the Fund during the period. The shift into higher quality assets dragged on Fund performance in late 2014 but benefited the portfolio through the uncertainties regarding Greece, China and the Fed’s pending rate move that dominated headlines through much of year-to-date 2015. Simultaneous to upgrading general credit quality, we reduced our portion of the Fund’s exposure to credit to an underweight relative to the benchmark. These adjustments were made based on bottom-up security selection decisions. For example, we made purchases of General Electric Capital hybrid securities, as we believe these securities offer attractive yields relative to what we currently consider to be their low risk profile and in addition have the potential of tender premiums. We also purchased several highly rated university bonds, particularly those of institutions widely considered best in class with excellent reputations supporting generational franchises. In our view, these bonds offer attractive relative value when compared with AAA-rated industrial corporate bonds. We sold positions in several high-yield energy corporate bonds, as we felt weakness in oil markets reduced the likelihood of upgrades to investment grade, pushing out positive catalysts and increasing downside risk in the intermediate term. We also sold and/or reduced several positions in metals and mining companies to reflect weakening fundamentals within the industry.
Following the sale of multiple corporate positions, we added exposure to agency mortgage-backed securities in an effort to maintain the yield of our portion of the Fund’s portfolio. We reduced our portion of the Fund’s exposure to commercial mortgage-backed securities given what we considered to be dimming prospects for the sector in the face of the persistently “risk off” environment and the upcoming announcement of new supply within the sector.
At the end of the period, our portion of the Fund was overweight relative to the benchmark in government-related securities, asset-backed securities, commercial mortgage-backed securities and other structured products and underweight in U.S. Treasury securities, agency mortgage-backed securities and investment-grade corporate bonds.
Derivative Positions
Overall, the usage of derivatives had a net negative impact on Fund performance during the period. While forward foreign currency exchange contracts contributed positively to performance, this was more than offset by the detracting effect of the Fund’s futures contracts and swap contracts.
Federated: During the period, we used exchange-traded futures contracts, primarily U.S. Treasury note futures, to implement duration and yield curve strategies.
| | |
| |
| | ACTIVE PORTFOLIOS® MULTI-MANAGER CORE PLUS BOND FUND |
MANAGER DISCUSSION OF FUND PERFORMANCE (continued)
TCW: Our portion of the Fund held futures during the period as a method of managing duration.
CMIA: Our portion of the Fund used U.S. Treasury futures, interest rate swaps, credit index swaps and credit default swaps for hedging purposes to help manage duration and yield curve exposure and to help manage credit exposure.
Looking Ahead
Federated: At the end of the period, we anticipated that the Fed was going to raise rates this year. In our view, the Fed understands that keeping the funds rate at emergency levels when there is no emergency creates substantial risk, since, if the economy sinks into recession, they would not be able to further lower rates to stimulate growth. We believe the longer the Fed waits to hike rates, the greater the chance that something, may happen as a result of the continued abundance of “cheap money”. We also believe the Fed understands that if it waits too long and the economy and inflation pick up, the Fed may have to raise rates faster and higher than if it starts sooner.
At the end of August 2015, the Fund maintained its yield curve flattening bias and its underweight to intermediate maturities. Our thinking is that if the economy slows, the curve should flatten as long-term rates fall. If the economy speeds up, short-term rates should spike higher as the market ratchets up the pace of Fed tightening. Either way, we currently foresee the curve flattening. The risk to the flattening bias is if the economy accelerates and the Fed does nothing, the curve will likely steepen.
In terms of sector allocation, our portion of the Fund remained overweight in most credit sectors at the end of the period. The main factor that causes spreads to widen is signs of a recession, but recessions on average do not typically start until five years after the Fed begins hiking rates. To us, the best single predictor of recessions is when the yield curve inverts, and we currently believe that is unlikely to occur in the near term. We also like credit because defaults have been low and stable (and, we believe should remain so outside the high-yield energy sector); corporate balance sheets have generally been healthy despite an upturn in both leverage and cash returned to shareholders; and a slow and shallow Fed hiking cycle should be good for most risk assets. While there could be a hiccup in spreads once the Fed starts raising rates, we would likely view that as a chance to add to our portion of the Fund’s credit sector overweights at less expensive levels. Unlike corporate bonds, we believe yields on government bonds do not compensate investors for their interest rate risk if rates rise as we expect. Mortgage-backed securities are also not particularly attractive at this time, in our view, from a valuation standpoint and tend to react negatively to rising interest rate volatility. However, we believe negative net supply in 2015, given the Fed’s reinvestment of paydowns, should limit underperformance, leaving us neutral on mortgages. As for emerging market bonds, where our portion of the Fund is also positioned neutrally to the benchmark, valuations look to us to be attractive, as spreads widened during the period. On the other hand, emerging market leverage during the past five years has risen at a faster pace than developed market leverage rose in the five years leading up to the financial crisis in 2008, and emerging markets usually do not do well when the Fed starts raising rates.
| | |
| |
| ACTIVE PORTFOLIOS® MULTI-MANAGER CORE PLUS BOND FUND | | |
MANAGER DISCUSSION OF FUND PERFORMANCE (continued)
TCW: Slow as it has been relative to history, the U.S. economic expansion is now in its seventh year and is increasingly accompanied by later-stage credit cycle dynamics. What that means is that leverage is on the rise, with more merger and acquisition and leverage buyout activity, increases in shareholder-friendly stock buybacks and dividend declarations, and less rigorous underwriting. At the same time, valuations remain relatively rich, in our view, given years of accommodative Fed policy and ongoing support from other global central banks. From a strategy perspective, we intend to maintain our portion of the Fund’s duration relatively short that of the benchmark, while market speculation about the Fed’s moves will likely lead, in our view, to tactical trading along the yield curve for value-added opportunities. We expect this to inform a disciplined approach within our strategy that will incrementally add to duration relative to the benchmark should rates push higher. We believe our portion of the Fund’s overall sector positioning remained conservative at the end of the period, as we maintain an eye toward preserving liquidity for deployment on increased volatility.
CMIA: The Fed’s decision to raise or not raise short-term interest rates and the impact of its decision on credit spreads will likely be the driving factors in the performance of the fixed-income markets during the coming months. Given our strategy bias toward sector rotation and security selection as the primary sources of excess returns, we do not anticipate our portion of the Fund’s duration will deviate more than half a year from the benchmark. We have re-positioned our portion of the Fund with lower credit exposure and a higher quality bias in anticipation of these events, particularly in anticipation of widening corporate credit spreads. In the event credit spreads do widen, we expect to look for what we believe to be improving or stable credit fundamentals and attractive valuations to add to our portion of the Fund’s credit allocation. Against the lower credit exposure, we increased our portion of the Fund’s allocation to U.S. Treasury securities but remained underweight relative to the benchmark.
| | |
| |
| | ACTIVE PORTFOLIOS® MULTI-MANAGER CORE PLUS BOND FUND |
UNDERSTANDING YOUR FUND’S EXPENSES
(Unaudited)
As an investor, you incur two types of costs. There are transaction costs, which may include redemption fees. There are also ongoing costs, which generally include management fees, distribution and/or service fees, and other fund expenses. The following information is intended to help you understand your ongoing costs (in dollars) of investing in the Fund and to help you compare these costs with the ongoing costs of investing in other mutual funds.
Analyzing Your Fund’s Expenses
To illustrate these ongoing costs, we have provided examples and calculated the expenses paid by investors of the Fund during the period. The actual and hypothetical information in the table is based on an initial investment of $1,000 at the beginning of the period indicated and held for the entire period. Expense information is calculated two ways and each method provides you with different information. The amount listed in the “Actual” column is calculated using the Fund’s actual operating expenses and total return for the period. You may use the Actual information, together with the amount invested, to estimate the expenses that you paid over the period. Simply divide your account value by $1,000 (for example, an $8,600 account value divided by $1,000 = 8.6), then multiply the results by the expenses paid during the period under the “Actual” column. The amount listed in the “Hypothetical” column assumes a 5% annual rate of return before expenses (which is not the Fund’s actual return) and then applies the Fund’s actual expense ratio for the period to the hypothetical return. You should not use the hypothetical account values and expenses to estimate either your actual account balance at the end of the period or the expenses you paid during the period. See “Compare With Other Funds” below for details on how to use the hypothetical data.
Compare With Other Funds
Since all mutual funds are required to include the same hypothetical calculations about expenses in shareholder reports, you can use this information to compare the ongoing cost of investing in the Fund with other funds. To do so, compare the hypothetical example with the 5% hypothetical examples that appear in the shareholder reports of other funds. As you compare hypothetical examples of other funds, it is important to note that hypothetical examples are meant to highlight the ongoing costs of investing in a fund only and do not reflect any transaction costs, such as redemption or exchange fees. Therefore, the hypothetical calculations are useful in comparing ongoing costs only, and will not help you determine the relative total costs of owning different funds. If transaction costs were included in these calculations, your costs would be higher.
March 1, 2015 – August 31, 2015
| | | | | | | | | | | | | | | | | | | | | | | | | | | | |
| | | Account Value at the
Beginning of the
Period ($) | | | Account Value at the
End of the
Period ($) | | | Expenses Paid During
the Period ($) | | | Fund’s Annualized
Expense Ratio (%) | |
| | | | Actual | | | | Hypothetical | | | | Actual | | | | Hypothetical | | | | Actual | | | | Hypothetical | | | | Actual | |
Class A | | | 1,000.00 | | | | 1,000.00 | | | | 989.40 | | | | 1,021.29 | | | | 4.03 | | | | 4.10 | | | | 0.80 | |
Expenses paid during the period are equal to the annualized expense ratio for each class as indicated above, multiplied by the average account value over the period and then multiplied by the number of days in the Fund’s most recent fiscal half year and divided by 365.
Expenses do not include fees and expenses incurred indirectly by the Fund from its investment in underlying funds, including affiliated and non-affiliated pooled investment vehicles, such as mutual funds and exchange-traded funds.
Had Columbia Management Investment Advisers, LLC and/or certain of its affiliates not waived/reimbursed certain fees and expenses, account value at the end of the period would have been reduced.
Class A shares of the Fund are available only to certain eligible investors through certain wrap fee programs sponsored and/or managed by Ameriprise Financial, Inc. or its affiliates. Fund shares are sold in accordance with the terms of the account through which you invest in the Fund. Participants in wrap fee programs pay an asset–based fee that is not included in the above table. Please read the wrap program documents for information regarding fees charged.
| | |
| |
| ACTIVE PORTFOLIOS® MULTI-MANAGER CORE PLUS BOND FUND | | |
PORTFOLIO OF INVESTMENTS
August 31, 2015
(Percentages represent value of investments compared to net assets)
| | | | | | | | | | | | |
| Corporate Bonds & Notes(a) 30.5% | |
| Issuer | | Coupon
Rate | | | Principal
Amount ($) | | | Value ($) | |
AEROSPACE & DEFENSE 0.2% | |
Bombardier, Inc.(b) | | | | | | | | | | | | |
03/15/25 | | | 7.500% | | | | 205,000 | | | | 155,287 | |
|
Embraer Netherlands Finance BV | |
06/15/25 | | | 5.050% | | | | 1,200,000 | | | | 1,136,640 | |
|
Embraer Overseas Ltd. | |
09/16/23 | | | 5.696% | | | | 100,000 | | | | 101,125 | |
|
Embraer SA | |
06/15/22 | | | 5.150% | | | | 1,750,000 | | | | 1,730,312 | |
|
Huntington Ingalls Industries, Inc.(b) | |
12/15/21 | | | 5.000% | | | | 59,000 | | | | 60,918 | |
|
KLX, Inc.(b) | |
12/01/22 | | | 5.875% | | | | 225,000 | | | | 220,500 | |
|
Lockheed Martin Corp. | |
09/15/21 | | | 3.350% | | | | 5,348,000 | | | | 5,468,555 | |
03/01/25 | | | 2.900% | | | | 860,000 | | | | 812,788 | |
|
Textron, Inc. | |
03/01/24 | | | 4.300% | | | | 690,000 | | | | 711,620 | |
03/01/25 | | | 3.875% | | | | 300,000 | | | | 297,511 | |
|
TransDigm, Inc. | |
07/15/21 | | | 7.500% | | | | 275,000 | | | | 292,875 | |
07/15/22 | | | 6.000% | | | | 225,000 | | | | 221,659 | |
07/15/24 | | | 6.500% | | | | 495,000 | | | | 483,862 | |
|
TransDigm, Inc.(b) | |
05/15/25 | | | 6.500% | | | | 337,000 | | | | 331,524 | |
| | | | | | | | | | | | | |
Total | | | | | | | | | | | 12,025,176 | |
| | | |
| | | | | | | | | | | | |
AIRLINES 0.6% | |
American Airlines Pass-Through Trust | |
01/15/23 | | | 4.950% | | | | 2,638,202 | | | | 2,809,685 | |
|
Continental Airlines Pass-Through Trust | |
01/02/18 | | | 6.900% | | | | 433,611 | | | | 452,300 | |
02/02/19 | | | 6.545% | | | | 1,985,054 | | | | 2,148,821 | |
04/19/22 | | | 5.983% | | | | 2,627,658 | | | | 2,900,278 | |
|
Delta Air Lines Pass-Through Trust | |
01/02/23 | | | 6.718% | | | | 3,319,044 | | | | 3,783,710 | |
|
Guanay Finance Ltd.(b) | |
12/15/20 | | | 6.000% | | | | 670,000 | | | | 680,050 | |
|
JetBlue Airways Pass-Through Trust(c) | |
11/15/16 | | | 0.771% | | | | 5,910,000 | | | | 5,828,737 | |
|
Southwest Airlines Co. | |
03/01/17 | | | 5.125% | | | | 3,000,000 | | | | 3,160,233 | |
|
U.S. Airways Pass-Through Trust | |
10/01/24 | | | 5.900% | | | | 3,448,440 | | | | 3,810,526 | |
06/03/25 | | | 4.625% | | | | 3,830,380 | | | | 3,974,019 | |
|
United Airlines, Inc. Pass-Through Trust | |
01/15/17 | | | 9.750% | | | | 1,183,109 | | | | 1,271,842 | |
| | | | | | | | | | | | | |
Total | | | | | | | | | | | 30,820,201 | |
| | | |
| | | | | | | | | | | | |
APARTMENT REIT 0.3% | |
AvalonBay Communities, Inc. | |
03/15/20 | | | 6.100% | | | | 1,865,000 | | | | 2,138,480 | |
09/15/22 | | | 2.950% | | | | 4,650,000 | | | | 4,542,697 | |
| | | | | | | | | | | | |
| Corporate Bonds & Notes(a) (continued) | |
| Issuer | | Coupon
Rate | | | Principal
Amount ($) | | | Value ($) | |
Mid-America Apartments LP | |
10/01/15 | | | 5.500% | | | | 4,650,000 | | | | 4,666,270 | |
06/15/24 | | | 3.750% | | | | 2,100,000 | | | | 2,065,568 | |
|
Post Apartment Homes LP | |
12/01/22 | | | 3.375% | | | | 1,000,000 | | | | 973,704 | |
|
UDR, Inc. | |
01/10/22 | | | 4.625% | | | | 1,000,000 | | | | 1,065,811 | |
07/01/24 | | | 3.750% | | | | 1,600,000 | | | | 1,605,643 | |
| | | | | | | | | | | | | |
Total | | | | | | | | | | | 17,058,173 | |
| | | |
| | | | | | | | | | | | |
AUTOMOTIVE 1.1% | |
Affinia Group, Inc. | |
05/01/21 | | | 7.750% | | | | 400,000 | | | | 424,000 | |
|
American Axle & Manufacturing, Inc. | |
02/15/19 | | | 5.125% | | | | 64,000 | | | | 64,800 | |
11/15/19 | | | 7.750% | | | | 175,000 | | | | 195,125 | |
03/15/21 | | | 6.250% | | | | 131,000 | | | | 133,620 | |
10/15/22 | | | 6.625% | | | | 325,000 | | | | 331,500 | |
|
American Honda Finance Corp.(b) | |
10/01/18 | | | 7.625% | | | | 2,250,000 | | | | 2,626,380 | |
|
Daimler Finance North America LLC(b) | |
01/11/18 | | | 1.875% | | | | 2,000,000 | | | | 1,998,660 | |
03/02/20 | | | 2.250% | | | | 1,500,000 | | | | 1,464,051 | |
|
Ford Motor Co. | |
08/01/18 | | | 6.500% | | | | 1,975,000 | | | | 2,200,664 | |
02/01/29 | | | 6.375% | | | | 1,165,000 | | | | 1,326,483 | |
01/15/43 | | | 4.750% | | | | 2,500,000 | | | | 2,377,077 | |
|
Ford Motor Credit Co. LLC | |
05/09/16 | | | 1.700% | | | | 2,500,000 | | | | 2,507,015 | |
06/12/17 | | | 3.000% | | | | 1,600,000 | | | | 1,627,518 | |
09/20/22 | | | 4.250% | | | | 1,100,000 | | | | 1,134,717 | |
|
Ford Motor Credit Co. LLC(c) | |
11/08/16 | | | 0.761% | | | | 3,690,000 | | | | 3,684,531 | |
03/27/17 | | | 0.912% | | | | 6,825,000 | | | | 6,797,229 | |
|
Gates Global LLC/Co.(b) | |
07/15/22 | | | 6.000% | | | | 587,000 | | | | 478,464 | |
| | | |
General Motors Co. | | | | | | | | | | | | |
04/01/25 | | | 4.000% | | | | 1,260,000 | | | | 1,192,519 | |
04/01/45 | | | 5.200% | | | | 1,270,000 | | | | 1,196,325 | |
|
General Motors Financial Co., Inc. | |
09/25/17 | | | 3.000% | | | | 5,000,000 | | | | 5,024,160 | |
05/15/23 | | | 4.250% | | | | 1,530,000 | | | | 1,504,787 | |
|
Harley-Davidson Financial Services, Inc.(b) | |
03/15/17 | | | 2.700% | | | | 1,380,000 | | | | 1,407,931 | |
|
Hyundai Capital America(b) | |
08/09/18 | | | 2.875% | | | | 1,250,000 | | | | 1,275,369 | |
02/06/19 | | | 2.550% | | | | 150,000 | | | | 149,505 | |
03/19/20 | | | 2.600% | | | | 680,000 | | | | 673,533 | |
|
Hyundai Capital Services, Inc.(b) | |
07/27/16 | | | 4.375% | | | | 2,000,000 | | | | 2,054,282 | |
|
International Automotive Components Group SA(b) | |
06/01/18 | | | 9.125% | | | | 325,000 | | | | 331,500 | |
|
JB Poindexter & Co., Inc.(b) | |
04/01/22 | | | 9.000% | | | | 250,000 | | | | 271,250 | |
The accompanying Notes to Financial Statements are an integral part of this statement.
| | |
| |
| | ACTIVE PORTFOLIOS® MULTI-MANAGER CORE PLUS BOND FUND |
PORTFOLIO OF INVESTMENTS (continued)
August 31, 2015
| | | | | | | | | | | | |
| Corporate Bonds & Notes(a) (continued) | |
| Issuer | | Coupon
Rate | | | Principal
Amount ($) | | | Value ($) | |
Lear Corp. | |
01/15/23 | | | 4.750% | | | | 500,000 | | | | 496,250 | |
01/15/25 | | | 5.250% | | | | 175,000 | | | | 174,125 | |
|
MPG Holdco I, Inc. | |
10/15/22 | | | 7.375% | | | | 350,000 | | | | 367,500 | |
|
Magna International, Inc. | |
06/15/24 | | | 3.625% | | | | 1,100,000 | | | | 1,073,272 | |
|
Metalsa SA de CV(b) | |
04/24/23 | | | 4.900% | | | | 200,000 | | | | 183,000 | |
|
Nissan Motor Acceptance Corp.(b) | |
09/12/17 | | | 1.950% | | | | 2,500,000 | | | | 2,516,707 | |
|
Omega US Sub LLC(b) | |
07/15/23 | | | 8.750% | | | | 175,000 | | | | 160,125 | |
|
RCI Banque SA(b) | |
04/12/16 | | | 4.600% | | | | 1,120,000 | | | | 1,142,734 | |
04/03/18 | | | 3.500% | | | | 4,000,000 | | | | 4,114,200 | |
|
Schaeffler Finance BV(b) | |
05/15/21 | | | 4.250% | | | | 359,000 | | | | 349,128 | |
05/15/23 | | | 4.750% | | | | 200,000 | | | | 191,500 | |
|
Schaeffler Holding Finance BV(b) | |
PIK | | | | | | | | | | | | |
08/15/18 | | | 6.875% | | | | 400,000 | | | | 411,936 | |
11/15/19 | | | 6.250% | | | | 135,000 | | | | 142,088 | |
11/15/22 | | | 6.750% | | | | 200,000 | | | | 213,500 | |
|
Stackpole International Intermediate Co.(b) | |
10/15/21 | | | 7.750% | | | | 350,000 | | | | 378,000 | |
|
Tenneco, Inc. | |
12/15/24 | | | 5.375% | | | | 213,000 | | | | 219,923 | |
|
UCI International, Inc. | |
02/15/19 | | | 8.625% | | | | 475,000 | | | | 389,500 | |
|
ZF North America Capital, Inc.(b) | |
04/29/25 | | | 4.750% | | | | 443,000 | | | | 419,743 | |
| | | | | | | | | | | | | |
Total | | | | | | | | | | | 57,396,226 | |
| | | |
| | | | | | | | | | | | |
BANKING 6.8% | |
ADIB Capital Invest 1 Ltd.(c) | |
12/31/49 | | | 6.375% | | | | 200,000 | | | | 206,250 | |
|
Ally Financial, Inc. | |
01/30/17 | | | 2.750% | | | | 425,000 | | | | 423,406 | |
09/10/18 | | | 4.750% | | | | 575,000 | | | | 592,969 | |
03/30/20 | | | 4.125% | | | | 50,000 | | | | 50,135 | |
02/13/22 | | | 4.125% | | | | 250,000 | | | | 244,375 | |
05/19/22 | | | 4.625% | | | | 344,000 | | | | 345,290 | |
09/30/24 | | | 5.125% | | | | 275,000 | | | | 277,750 | |
03/30/25 | | | 4.625% | | | | 265,000 | | | | 255,725 | |
|
American Express Credit Corp. | |
09/22/17 | | | 1.550% | | | | 1,950,000 | | | | 1,946,966 | |
|
Associated Banc-Corp. | |
01/15/25 | | | 4.250% | | | | 840,000 | | | | 850,050 | |
|
BB&T Corp. | |
02/01/19 | | | 2.250% | | | | 1,600,000 | | | | 1,608,274 | |
10/30/26 | | | 3.800% | | | | 2,500,000 | | | | 2,531,690 | |
|
BNP Paribas SA(b)(c) | |
12/31/49 | | | 7.375% | | | | 3,110,000 | | | | 3,184,640 | |
| | | | | | | | | | | | |
| Corporate Bonds & Notes(a) (continued) | |
| Issuer | | Coupon
Rate | | | Principal
Amount ($) | | | Value ($) | |
Banco Bilbao Vizcaya Argentaria Colombia SA(b) | |
04/21/25 | | | 4.875% | | | | 150,000 | | | | 145,350 | |
|
Banco Santander SA(b) | |
11/09/22 | | | 4.125% | | | | 150,000 | | | | 148,875 | |
|
Banco de Credito del Peru(c) | |
04/24/27 | | | 6.125% | | | | 80,000 | | | | 84,000 | |
|
Bank of America Corp. | |
10/14/16 | | | 5.625% | | | | 650,000 | | | | 679,275 | |
05/02/17 | | | 5.700% | | | | 3,740,000 | | | | 3,957,702 | |
01/11/18 | | | 2.000% | | | | 4,000,000 | | | | 3,999,628 | |
01/24/22 | | | 5.700% | | | | 4,800,000 | | | | 5,411,597 | |
01/11/23 | | | 3.300% | | | | 5,782,000 | | | | 5,698,334 | |
01/22/24 | | | 4.125% | | | | 3,000,000 | | | | 3,096,147 | |
01/22/25 | | | 4.000% | | | | 795,000 | | | | 777,943 | |
04/21/25 | | | 3.950% | | | | 3,270,000 | | | | 3,165,474 | |
04/01/44 | | | 4.875% | | | | 1,000,000 | | | | 1,041,120 | |
|
Bank of America NA | |
06/15/17 | | | 6.100% | | | | 4,000,000 | | | | 4,297,800 | |
|
Bank of America NA(c) | |
06/15/16 | | | 0.566% | | | | 3,924,000 | | | | 3,911,859 | |
|
Bank of Montreal | |
04/09/18 | | | 1.450% | | | | 750,000 | | | | 742,273 | |
|
Bank of New York Mellon Corp. (The) | |
05/15/19 | | | 5.450% | | | | 800,000 | | | | 890,475 | |
09/11/24 | | | 3.250% | | | | 2,960,000 | | | | 2,939,612 | |
|
Bank of New York Mellon Corp. (The)(c) | |
12/29/49 | | | 4.500% | | | | 2,976,000 | | | | 2,723,040 | |
|
Barclays Bank PLC | |
09/11/24 | | | 4.375% | | | | 915,000 | | | | 882,225 | |
|
Barclays Bank PLC(c) | |
04/10/23 | | | 7.750% | | | | 736,000 | | | | 791,200 | |
12/31/49 | | | 8.250% | | | | 907,000 | | | | 962,095 | |
12/31/49 | | | 6.625% | | | | 4,655,000 | | | | 4,515,350 | |
|
Burgan Finance No. 1 (Jersey) Ltd. | |
09/29/20 | | | 7.875% | | | | 100,000 | | | | 100,750 | |
|
Capital One Bank NA | |
07/23/21 | | | 2.950% | | | | 1,050,000 | | | | 1,025,207 | |
|
Capital One Bank USA NA | |
02/15/23 | | | 3.375% | | | | 1,140,000 | | | | 1,084,213 | |
|
Capital One Financial Corp. | |
11/21/18 | | | 2.150% | | | | 1,150,000 | | | | 1,140,131 | |
|
Citigroup, Inc. | |
11/15/16 | | �� | 1.300% | | | | 750,000 | | | | 749,297 | |
01/10/17 | | | 4.450% | | | | 1,000,000 | | | | 1,038,425 | |
08/15/17 | | | 6.000% | | | | 4,000,000 | | | | 4,316,996 | |
05/15/18 | | | 6.125% | | | | 1,250,000 | | | | 1,378,475 | |
09/26/18 | | | 2.500% | | | | 5,250,000 | | | | 5,288,850 | |
08/09/20 | | | 5.375% | | | | 10,000,000 | | | | 11,122,630 | |
08/25/36 | | | 6.125% | | | | 1,260,000 | | | | 1,445,325 | |
|
Citigroup, Inc.(c) | |
07/25/16 | | | 1.255% | | | | 3,000,000 | | | | 3,007,170 | |
08/14/17 | | | 0.799% | | | | 6,620,000 | | | | 6,581,909 | |
05/15/18 | | | 2.021% | | | | 2,275,000 | | | | 2,324,081 | |
The accompanying Notes to Financial Statements are an integral part of this statement.
| | |
| |
| ACTIVE PORTFOLIOS® MULTI-MANAGER CORE PLUS BOND FUND | | |
PORTFOLIO OF INVESTMENTS (continued)
August 31, 2015
| | | | | | | | | | | | |
| Corporate Bonds & Notes(a) (continued) | |
| Issuer | | Coupon
Rate | | | Principal
Amount ($) | | | Value ($) | |
Citizens Financial Group, Inc.(b) | |
09/28/22 | | | 4.150% | | | | 2,000,000 | | | | 2,018,898 | |
|
Comerica, Inc. | |
05/23/19 | | | 2.125% | | | | 645,000 | | | | 639,743 | |
07/22/26 | | | 3.800% | | | | 900,000 | | | | 884,696 | |
|
Compass Bank | |
09/29/19 | | | 2.750% | | | | 1,400,000 | | | | 1,379,970 | |
04/10/25 | | | 3.875% | | | | 395,000 | | | | 369,363 | |
|
Cooperatieve Centrale Raiffeisen-Boerenleenbank BA(b)(c) | |
12/31/49 | | | 11.000% | | | | 2,025,000 | | | | 2,520,315 | |
|
Discover Bank | |
02/21/18 | | | 2.000% | | | | 680,000 | | | | 673,469 | |
|
Discover Financial Services | |
04/27/22 | | | 5.200% | | | | 2,697,000 | | | | 2,846,341 | |
11/21/22 | | | 3.850% | | | | 4,258,000 | | | | 4,153,777 | |
|
Fifth Third Bancorp | |
03/01/19 | | | 2.300% | | | | 310,000 | | | | 310,038 | |
07/27/20 | | | 2.875% | | | | 1,570,000 | | | | 1,570,805 | |
|
Fifth Third Bancorp(c) | |
12/31/49 | | | 5.100% | | | | 6,105,000 | | | | 5,601,337 | |
|
Global Bank Corp.(b) | |
10/30/19 | | | 5.125% | | | | 200,000 | | | | 202,500 | |
|
Goldman Sachs Group, Inc. (The) | |
01/15/16 | | | 5.350% | | | | 9,000,000 | | | | 9,143,568 | |
01/18/18 | | | 5.950% | | | | 4,000,000 | | | | 4,359,576 | |
04/01/18 | | | 6.150% | | | | 4,810,000 | | | | 5,301,154 | |
07/19/18 | | | 2.900% | | | | 2,200,000 | | | | 2,247,727 | |
01/24/22 | | | 5.750% | | | | 3,800,000 | | | | 4,319,247 | |
01/23/25 | | | 3.500% | | | | 3,000,000 | | | | 2,929,356 | |
|
Goldman Sachs Group, Inc. (The)(c) | |
11/29/23 | | | 1.884% | | | | 1,675,000 | | | | 1,695,786 | |
|
HBOS PLC(b) | |
05/21/18 | | | 6.750% | | | | 5,927,000 | | | | 6,540,225 | |
11/01/33 | | | 6.000% | | | | 5,600,000 | | | | 6,216,560 | |
|
HSBC Holdings PLC(c) | |
12/31/49 | | | 6.375% | | | | 5,441,000 | | | | 5,400,192 | |
|
HSBC USA, Inc. | |
01/16/18 | | | 1.625% | | | | 3,000,000 | | | | 2,986,002 | |
06/23/24 | | | 3.500% | | | | 3,600,000 | | | | 3,606,779 | |
|
Huntington National Bank (The) | |
04/01/19 | | | 2.200% | | | | 1,500,000 | | | | 1,494,996 | |
|
ICICI Bank Ltd.(c) | |
04/30/22 | | | 6.375% | | | | 530,000 | | | | 539,784 | |
|
Industrial & Commercial Bank of China Ltd.(c) | |
12/31/49 | | | 6.000% | | | | 200,000 | | | | 207,500 | |
|
JPMorgan Chase & Co. | |
01/15/18 | | | 6.000% | | | | 1,400,000 | | | | 1,530,294 | |
04/23/19 | | | 6.300% | | | | 5,000,000 | | | | 5,671,710 | |
10/15/20 | | | 4.250% | | | | 2,000,000 | | | | 2,132,548 | |
01/24/22 | | | 4.500% | | | | 1,000,000 | | | | 1,066,585 | |
05/01/23 | | | 3.375% | | | | 1,000,000 | | | | 960,582 | |
|
JPMorgan Chase & Co.(c) | |
12/31/49 | | | 6.100% | | | | 7,355,000 | | | | 7,318,225 | |
| | | | | | | | | | | | |
| Corporate Bonds & Notes(a) (continued) | |
| Issuer | | Coupon
Rate | | | Principal
Amount ($) | | | Value ($) | |
JPMorgan Chase Bank NA | |
10/01/17 | | | 6.000% | | | | 2,605,000 | | | | 2,811,483 | |
|
JPMorgan Chase Bank NA(c) | |
06/13/16 | | | 0.616% | | | | 6,320,000 | | | | 6,301,824 | |
|
JPMorgan Chase Capital XXI(c) | |
02/02/37 | | | 1.250% | | | | 22,976,000 | | | | 18,225,712 | |
|
JPMorgan Chase Capital XXIII(c) | |
05/15/47 | | | 1.321% | | | | 8,000,000 | | | | 6,170,000 | |
|
KBC Groep NV(c) | |
12/31/49 | | | 5.625% | | | EUR | 2,346,000 | | | | 2,639,147 | |
|
KeyCorp Capital I(c) | |
07/01/28 | | | 1.024% | | | | 3,750,000 | | | | 3,159,375 | |
|
Korea Exchange Bank | |
06/12/19 | | | 2.500% | | | | 200,000 | | | | 199,778 | |
|
Lloyds Bank PLC | |
05/14/18 | | | 1.750% | | | | 5,805,000 | | | | 5,765,892 | |
|
Lloyds Banking Group PLC | |
11/04/24 | | | 4.500% | | | | 1,725,000 | | | | 1,743,471 | |
|
Lloyds Banking Group PLC(b)(c) | |
12/31/49 | | | 6.657% | | | | 1,052,000 | | | | 1,178,240 | |
|
M&T Bank Corp. | |
07/25/19 | | | 2.250% | | | | 3,000,000 | | | | 2,992,527 | |
12/31/49 | | | 6.875% | | | | 3,039,000 | | | | 3,069,390 | |
|
M&T Bank Corp.(c) | |
01/30/17 | | | 0.672% | | | | 700,000 | | | | 698,522 | |
|
MUFG Union Bank NA | |
09/26/18 | | | 2.625% | | | | 1,925,000 | | | | 1,947,472 | |
05/06/19 | | | 2.250% | | | | 825,000 | | | | 826,146 | |
|
Macquarie Bank Ltd.(b) | |
04/07/21 | | | 6.625% | | | | 5,360,000 | | | | 6,080,089 | |
|
Mellon Capital IV(c) | |
06/29/49 | | | 4.000% | | | | 250,000 | | | | 195,938 | |
|
Morgan Stanley | |
03/22/17 | | | 4.750% | | | | 4,750,000 | | | | 4,983,467 | |
08/28/17 | | | 6.250% | | | | 1,600,000 | | | | 1,739,771 | |
10/23/24 | | | 3.700% | | | | 2,000,000 | | | | 1,998,394 | |
07/23/25 | | | 4.000% | | | | 700,000 | | | | 714,438 | |
07/24/42 | | | 6.375% | | | | 4,300,000 | | | | 5,318,511 | |
|
Morgan Stanley(c) | |
01/05/18 | | | 1.024% | | | | 2,000,000 | | | | 1,999,988 | |
| | | |
Natixis SA(b)(c) | | | | | | | | | | | | |
12/31/49 | | | 10.000% | | | | 2,238,000 | | | | 2,590,485 | |
|
PNC Bank NA | |
06/01/25 | | | 3.250% | | | | 1,450,000 | | | | 1,420,214 | |
|
PNC Financial Services Group, Inc. (The)(c) | |
12/31/49 | | | 4.850% | | | | 731,000 | | | | 690,795 | |
|
PNC Funding Corp. | |
09/19/16 | | | 2.700% | | | | 2,800,000 | | | | 2,839,082 | |
|
Rabobank Capital Funding Trust III(b)(c) | |
12/31/49 | | | 5.254% | | | | 3,335,000 | | | | 3,372,519 | |
The accompanying Notes to Financial Statements are an integral part of this statement.
| | |
| |
| | ACTIVE PORTFOLIOS® MULTI-MANAGER CORE PLUS BOND FUND |
PORTFOLIO OF INVESTMENTS (continued)
August 31, 2015
| | | | | | | | | | | | |
| Corporate Bonds & Notes(a) (continued) | |
| Issuer | | Coupon
Rate | | | Principal
Amount ($) | | | Value ($) | |
Royal Bank of Scotland Group PLC | |
09/18/15 | | | 2.550% | | | | 7,000,000 | | | | 7,005,040 | |
10/21/19 | | | 6.400% | | | | 1,350,000 | | | | 1,511,062 | |
05/28/24 | | | 5.125% | | | | 131,000 | | | | 132,225 | |
|
Royal Bank of Scotland Group PLC(c) | |
12/31/49 | | | 7.500% | | | | 3,427,000 | | | | 3,435,567 | |
12/31/49 | | | 8.000% | | | | 7,519,000 | | | | 7,678,779 | |
|
Santander Holdings USA, Inc. | |
08/27/18 | | | 3.450% | | | | 3,849,000 | | | | 3,960,964 | |
|
State Street Capital Trust IV(c) | |
06/01/67 | | | 1.286% | | | | 1,321,000 | | | | 1,126,152 | |
|
State Street Corp. | |
03/15/18 | | | 4.956% | | | | 4,235,000 | | | | 4,507,738 | |
|
SunTrust Banks, Inc. | |
05/01/19 | | | 2.500% | | | | 1,770,000 | | | | 1,780,174 | |
|
Synovus Financial Corp. | |
02/15/19 | | | 7.875% | | | | 131,000 | | | | 147,703 | |
|
U.S. Bancorp | |
07/15/22 | | | 2.950% | | | | 1,988,000 | | | | 1,951,987 | |
|
UBS AG | |
07/15/16 | | | 5.875% | | | | 3,000,000 | | | | 3,109,476 | |
08/14/19 | | | 2.375% | | | | 3,500,000 | | | | 3,500,770 | |
|
Vesey Street Investment Trust 1(c) | |
09/01/16 | | | 4.404% | | | | 480,000 | | | | 493,672 | |
|
Wells Fargo & Co.(c) | |
12/31/49 | | | 5.900% | | | | 9,886,000 | | | | 9,923,072 | |
|
Wells Fargo Capital X | |
12/15/36 | | | 5.950% | | | | 965,000 | | | | 969,825 | |
|
Westpac Banking Corp. | |
11/19/19 | | | 4.875% | | | | 1,200,000 | | | | 1,316,290 | |
| | | | | | | | | | | | | |
Total | | | | | | | | | | | 347,045,167 | |
| | | |
| | | | | | | | | | | | |
BROKERAGE/ASSET MANAGERS/EXCHANGES 0.3% | |
Cantor Fitzgerald LP(b) | |
10/15/19 | | | 7.875% | | | | 1,600,000 | | | | 1,787,323 | |
|
E*TRADE Financial Corp. | |
11/15/22 | | | 5.375% | | | | 135,000 | | | | 141,075 | |
09/15/23 | | | 4.625% | | | | 111,000 | | | | 111,000 | |
|
Jefferies Group LLC | |
07/15/19 | | | 8.500% | | | | 2,800,000 | | | | 3,328,562 | |
01/20/23 | | | 5.125% | | | | 1,000,000 | | | | 1,032,459 | |
01/20/43 | | | 6.500% | | | | 600,000 | | | | 564,205 | |
|
NASDAQ OMX Group, Inc. (The) | |
01/15/20 | | | 5.550% | | | | 600,000 | | | | 654,384 | |
|
National Financial Partners Corp.(b) | |
07/15/21 | | | 9.000% | | | | 43,000 | | | | 42,140 | |
|
Raymond James Financial, Inc. | |
04/15/16 | | | 4.250% | | | | 3,345,000 | | | | 3,410,334 | |
|
Stifel Financial Corp. | |
07/18/24 | | | 4.250% | | | | 750,000 | | | | 742,081 | |
|
TD Ameritrade Holding Corp. | |
04/01/25 | | | 3.625% | | | | 2,500,000 | | | | 2,516,975 | |
| | | | | | | | | | | | | |
Total | | | | | | | | | | | 14,330,538 | |
| | | |
| | | | | | | | | | | | |
| | | | | | | | | | | | |
| Corporate Bonds & Notes(a) (continued) | |
| Issuer | | Coupon
Rate | | | Principal
Amount ($) | | | Value ($) | |
BUILDING MATERIALS 0.2% | |
Allegion US Holding Co., Inc. | |
10/01/21 | | | 5.750% | | | | 342,000 | | | | 350,550 | |
|
American Builders & Contractors Supply Co., Inc.(b) | |
04/15/21 | | | 5.625% | | | | 621,000 | | | | 632,644 | |
|
CPG Merger Sub LLC(b) | |
10/01/21 | | | 8.000% | | | | 150,000 | | | | 152,625 | |
|
Cemex Finance LLC(b) | |
04/01/24 | | | 6.000% | | | | 500,000 | | | | 475,000 | |
|
Gibraltar Industries, Inc. | |
02/01/21 | | | 6.250% | | | | 56,000 | | | | 56,560 | |
|
HD Supply, Inc. | |
07/15/20 | | | 7.500% | | | | 686,000 | | | | 732,305 | |
|
HD Supply, Inc.(b) | |
12/15/21 | | | 5.250% | | | | 150,000 | | | | 154,125 | |
|
Masco Corp. | |
04/15/18 | | | 6.625% | | | | 600,000 | | | | 655,500 | |
03/15/22 | | | 5.950% | | | | 3,000,000 | | | | 3,270,000 | |
04/01/25 | | | 4.450% | | | | 143,000 | | | | 142,984 | |
|
Masonite International Corp.(b) | |
03/15/23 | | | 5.625% | | | | 100,000 | | | | 100,500 | |
|
NCI Building Systems, Inc.(b) | |
01/15/23 | | | 8.250% | | | | 300,000 | | | | 311,250 | |
|
Nortek, Inc. | |
04/15/21 | | | 8.500% | | | | 616,000 | | | | 659,890 | |
|
RSI Home Products, Inc.(b) | |
03/15/23 | | | 6.500% | | | | 432,000 | | | | 441,720 | |
|
USG Corp.(b) | |
11/01/21 | | | 5.875% | | | | 83,000 | | | | 86,528 | |
03/01/25 | | | 5.500% | | | | 150,000 | | | | 151,312 | |
| | | | | | | | | | | | | |
Total | | | | | | | | | | | 8,373,493 | |
| | | |
| | | | | | | | | | | | |
CABLE AND SATELLITE 0.7% | |
Altice Financing SA(b) | |
02/15/23 | | | 6.625% | | | | 120,000 | | | | 119,400 | |
|
CCO Holdings LLC/Capital Corp. | |
03/15/21 | | | 5.250% | | | | 111,000 | | | | 112,110 | |
01/31/22 | | | 6.625% | | | | 107,000 | | | | 112,618 | |
09/30/22 | | | 5.250% | | | | 90,000 | | | | 90,720 | |
09/01/23 | | | 5.750% | | | | 1,000,000 | | | | 1,019,800 | |
|
CCO Holdings LLC/Capital Corp.(b) | |
05/01/23 | | | 5.125% | | | | 15,000 | | | | 15,000 | |
05/01/25 | | | 5.375% | | | | 344,000 | | | | 334,110 | |
05/01/27 | | | 5.875% | | | | 148,000 | | | | 145,040 | |
|
CCO Safari II LLC(b) | |
07/23/22 | | | 4.464% | | | | 5,210,000 | | | | 5,185,398 | |
07/23/25 | | | 4.908% | | | | 750,000 | | | | 742,870 | |
10/23/45 | | | 6.484% | | | | 680,000 | | | | 691,727 | |
|
COX Communications, Inc.(b) | |
12/15/22 | | | 3.250% | | | | 500,000 | | | | 468,509 | |
|
CSC Holdings LLC | |
02/15/18 | | | 7.875% | | | | 33,000 | | | | 36,053 | |
02/15/19 | | | 8.625% | | | | 44,000 | | | | 49,500 | |
The accompanying Notes to Financial Statements are an integral part of this statement.
| | |
| |
| ACTIVE PORTFOLIOS® MULTI-MANAGER CORE PLUS BOND FUND | | |
PORTFOLIO OF INVESTMENTS (continued)
August 31, 2015
| | | | | | | | | | | | |
| Corporate Bonds & Notes(a) (continued) | |
| Issuer | | Coupon
Rate | | | Principal
Amount ($) | | | Value ($) | |
11/15/21 | | | 6.750% | | | | 190,000 | | | | 198,550 | |
06/01/24 | | | 5.250% | | | | 120,000 | | | | 111,360 | |
|
Cable One, Inc.(b) | |
06/15/22 | | | 5.750% | | | | 66,000 | | | | 66,660 | |
|
Cequel Communications Holdings I LLC/Capital Corp.(b) | |
12/15/21 | | | 5.125% | | | | 98,000 | | | | 89,793 | |
12/15/21 | | | 5.125% | | | | 300,000 | | | | 274,875 | |
|
Comcast Corp. | |
01/15/17 | | | 6.500% | | | | 1,700,000 | | | | 1,820,382 | |
07/15/22 | | | 3.125% | | | | 3,780,000 | | | | 3,801,720 | |
02/15/25 | | | 3.375% | | | | 900,000 | | | | 895,034 | |
|
DIRECTV Holdings LLC/Financing Co., Inc. | |
03/15/22 | | | 3.800% | | | | 2,004,000 | | | | 1,988,231 | |
04/01/24 | | | 4.450% | | | | 450,000 | | | | 454,804 | |
03/01/41 | | | 6.375% | | | | 1,500,000 | | | | 1,605,480 | |
03/15/42 | | | 5.150% | | | | 500,000 | | | | 471,960 | |
|
DISH DBS Corp. | |
06/01/21 | | | 6.750% | | | | 506,000 | | | | 507,973 | |
07/15/22 | | | 5.875% | | | | 50,000 | | | | 47,282 | |
11/15/24 | | | 5.875% | | | | 785,000 | | | | 715,331 | |
|
DigitalGlobe, Inc.(b) | |
02/01/21 | | | 5.250% | | | | 18,000 | | | | 17,280 | |
|
Hughes Satellite Systems Corp. | |
06/15/19 | | | 6.500% | | | | 99,000 | | | | 107,910 | |
06/15/21 | | | 7.625% | | | | 42,000 | | | | 45,938 | |
|
Intelsat Jackson Holdings SA | |
04/01/19 | | | 7.250% | | | | 1,000,000 | | | | 977,500 | |
10/15/20 | | | 7.250% | | | | 288,000 | | | | 276,840 | |
04/01/21 | | | 7.500% | | | | 20,000 | | | | 19,375 | |
12/15/22 | | | 6.625% | | | | 650,000 | | | | 568,750 | |
08/01/23 | | | 5.500% | | | | 125,000 | | | | 110,000 | |
|
Intelsat Luxembourg SA | |
06/01/21 | | | 7.750% | | | | 150,000 | | | | 112,388 | |
06/01/23 | | | 8.125% | | | | 711,000 | | | | 522,585 | |
|
NBCUniversal Media LLC | |
04/30/20 | | | 5.150% | | | | 2,280,000 | | | | 2,554,811 | |
01/15/23 | | | 2.875% | | | | 720,000 | | | | 701,716 | |
|
Sirius XM Radio, Inc.(b) | |
10/01/20 | | | 5.875% | | | | 100,000 | | | | 104,000 | |
05/15/23 | | | 4.625% | | | | 475,000 | | | | 452,438 | |
07/15/24 | | | 6.000% | | | | 450,000 | | | | 463,500 | |
04/15/25 | | | 5.375% | | | | 200,000 | | | | 197,500 | |
|
Time Warner Cable, Inc. | |
02/01/20 | | | 5.000% | | | | 1,500,000 | | | | 1,609,492 | |
09/01/21 | | | 4.000% | | | | 1,500,000 | | | | 1,508,794 | |
09/01/41 | | | 5.500% | | | | 1,500,000 | | | | 1,355,146 | |
|
UPCB Finance IV Ltd.(b) | |
01/15/25 | | | 5.375% | | | | 215,000 | | | | 208,550 | |
|
Unitymedia GmbH(b) | |
01/15/25 | | | 6.125% | | | | 325,000 | | | | 333,125 | |
|
Unitymedia Hessen GmbH & Co. KG NRW(b) | |
01/15/23 | | | 5.500% | | | | 250,000 | | | | 257,500 | |
01/15/25 | | | 5.000% | | | | 302,000 | | | | 295,205 | |
|
Videotron Ltd. | |
07/15/22 | | | 5.000% | | | | 107,000 | | | | 106,866 | |
| | | | | | | | | | | | |
| Corporate Bonds & Notes(a) (continued) | |
| Issuer | | Coupon
Rate | | | Principal
Amount ($) | | | Value ($) | |
Virgin Media Finance PLC(b) | |
04/15/23 | | | 6.375% | | | | 300,000 | | | | 311,811 | |
01/15/25 | | | 5.750% | | | | 615,000 | | | | 617,691 | |
|
Virgin Media Secured Finance PLC(b) | |
01/15/26 | | | 5.250% | | | | 353,000 | | | | 342,410 | |
| | | | | | | | | | | | | |
Total | | | | | | | | | | | 36,351,411 | |
| | | |
| | | | | | | | | | | | |
CHEMICALS 0.2% | |
Albemarle Corp. | |
12/01/24 | | | 4.150% | | | | 535,000 | | | | 522,894 | |
12/01/44 | | | 5.450% | | | | 545,000 | | | | 543,048 | |
|
Angus Chemical Co.(b) | |
02/15/23 | | | 8.750% | | | | 134,000 | | | | 133,330 | |
|
Ashland, Inc. | |
08/15/22 | | | 4.750% | | | | 300,000 | | | | 297,750 | |
|
Axalta Coating Systems Dutch Holding B BV/U.S. Holdings, Inc.(b) | |
05/01/21 | | | 7.375% | | | | 725,000 | | | | 775,678 | |
|
Axiall Corp. | |
05/15/23 | | | 4.875% | | | | 50,000 | | | | 48,500 | |
|
Celanese U.S. Holdings LLC | |
06/15/21 | | | 5.875% | | | | 218,000 | | | | 228,355 | |
|
Chemours Co. LLC (The)(b) | |
05/15/23 | | | 6.625% | | | | 196,000 | | | | 170,520 | |
05/15/25 | | | 7.000% | | | | 108,000 | | | | 92,340 | |
|
Compass Minerals International, Inc.(b) | |
07/15/24 | | | 4.875% | | | | 200,000 | | | | 192,500 | |
|
Dow Chemical Co. (The) | |
05/15/19 | | | 8.550% | | | | 500,000 | | | | 603,944 | |
|
Eco Services Operations LLC/Finance Corp.(b) | |
11/01/22 | | | 8.500% | | | | 368,000 | | | | 351,440 | |
|
Hexion, Inc. | |
02/01/18 | | | 8.875% | | | | 575,000 | | | | 500,250 | |
|
Huntsman International LLC | |
11/15/20 | | | 4.875% | | | | 265,000 | | | | 259,700 | |
|
Huntsman International LLC(b) | |
11/15/22 | | | 5.125% | | | | 283,000 | | | | 268,850 | |
|
INEOS Group Holdings SA(b) | |
08/15/18 | | | 6.125% | | | | 31,000 | | | | 31,039 | |
02/15/19 | | | 5.875% | | | | 115,000 | | | | 113,994 | |
|
Incitec Pivot Finance LLC(b) | |
12/10/19 | | | 6.000% | | | | 1,000,000 | | | | 1,095,200 | |
|
JM Huber Corp.(b) | |
11/01/19 | | | 9.875% | | | | 213,000 | | | | 223,916 | |
|
LyondellBasell Industries NV | |
02/26/55 | | | 4.625% | | | | 1,150,000 | | | | 989,949 | |
| | | |
NOVA Chemicals Corp.(b) | | | | | | | | | | | | |
08/01/23 | | | 5.250% | | | | 72,000 | | | | 72,360 | |
05/01/25 | | | 5.000% | | | | 311,000 | | | | 311,000 | |
| | | |
PQ Corp.(b) | | | | | | | | | | | | |
11/01/18 | | | 8.750% | | | | 587,000 | | | | 612,314 | |
|
Platform Specialty Products Corp.(b) | |
02/01/22 | | | 6.500% | | | | 755,000 | | | | 731,089 | |
The accompanying Notes to Financial Statements are an integral part of this statement.
| | |
| |
| | ACTIVE PORTFOLIOS® MULTI-MANAGER CORE PLUS BOND FUND |
PORTFOLIO OF INVESTMENTS (continued)
August 31, 2015
| | | | | | | | | | | | |
| Corporate Bonds & Notes(a) (continued) | |
| Issuer | | Coupon
Rate | | | Principal
Amount ($) | | | Value ($) | |
RPM International, Inc. | | | | | | | | | | | | |
06/01/45 | | | 5.250% | | | | 1,000,000 | | | | 967,328 | |
|
Sociedad Quimica y Minera de Chile SA | |
04/21/20 | | | 5.500% | | | | 225,000 | | | | 226,365 | |
| | | |
Valspar Corp. (The) | | | | | | | | | | | | |
02/01/25 | | | 3.300% | | | | 380,000 | | | | 369,394 | |
02/01/45 | | | 4.400% | | | | 600,000 | | | | 552,349 | |
| | | |
WR Grace & Co.(b) | | | | | | | | | | | | |
10/01/21 | | | 5.125% | | | | 218,000 | | | | 220,725 | |
10/01/24 | | | 5.625% | | | | 192,000 | | | | 198,000 | |
| | | | | | | | | | | | | |
Total | | | | | | | | | | | 11,704,121 | |
| | | |
| | | | | | | | | | | | |
CONSTRUCTION MACHINERY 0.1% | |
ATS Automation Tooling Systems, Inc.(b) | |
06/15/23 | | | 6.500% | | | | 175,000 | | | | 176,312 | |
|
Caterpillar Financial Services Corp. | |
11/25/16 | | | 1.000% | | | | 1,500,000 | | | | 1,500,393 | |
|
John Deere Capital Corp.(c) | |
01/16/18 | | | 0.579% | | | | 2,665,000 | | | | 2,657,242 | |
|
Jurassic Holdings III, Inc.(b) | |
02/15/21 | | | 6.875% | | | | 250,000 | | | | 175,625 | |
|
United Rentals North America, Inc. | |
04/15/22 | | | 7.625% | | | | 103,000 | | | | 110,983 | |
06/15/23 | | | 6.125% | | | | 46,000 | | | | 46,920 | |
07/15/23 | | | 4.625% | | | | 175,000 | | | | 172,156 | |
07/15/25 | | | 5.500% | | | | 575,000 | | | | 554,875 | |
| | | | | | | | | | | | | |
Total | | | | | | | | | | | 5,394,506 | |
| | | |
| | | | | | | | | | | | |
CONSUMER CYCLICAL SERVICES 0.1% | |
ADT Corp. (The) | |
07/15/22 | | | 3.500% | | | | 133,000 | | | | 119,075 | |
|
APX Group, Inc. | |
12/01/19 | | | 6.375% | | | | 312,000 | | | | 303,030 | |
12/01/20 | | | 8.750% | | | | 136,000 | | | | 119,680 | |
|
Alibaba Group Holding Ltd.(b) | |
11/28/21 | | | 3.125% | | | | 200,000 | | | | 193,295 | |
11/28/24 | | | 3.600% | | | | 200,000 | | | | 189,081 | |
|
Expedia, Inc. | |
08/15/20 | | | 5.950% | | | | 1,380,000 | | | | 1,510,414 | |
|
Garda World Security Corp.(b) | |
11/15/21 | | | 7.250% | | | | 375,000 | | | | 351,637 | |
11/15/21 | | | 7.250% | | | | 125,000 | | | | 116,875 | |
|
Hearthside Group Holdings LLC/Finance Co.(b) | |
05/01/22 | | | 6.500% | | | | 550,000 | | | | 517,000 | |
|
IHS, Inc. | |
11/01/22 | | | 5.000% | | | | 311,000 | | | | 314,499 | |
|
Interval Acquisition Corp.(b) | |
04/15/23 | | | 5.625% | | | | 104,000 | | | | 102,700 | |
|
Monitronics International, Inc. | |
04/01/20 | | | 9.125% | | | | 138,000 | | | | 129,030 | |
| | | | | | | | | | | | |
| Corporate Bonds & Notes(a) (continued) | |
| Issuer | | Coupon
Rate | | | Principal
Amount ($) | | | Value ($) | |
Multi-Color Corp.(b) | |
12/01/22 | | | 6.125% | | | | 400,000 | | | | 407,500 | |
|
Sabre GLBL, Inc.(b) | |
04/15/23 | | | 5.375% | | | | 225,000 | | | | 220,500 | |
| | | | | | | | | | | | | |
Total | | | | | | | | | | | 4,594,316 | |
| | | |
| | | | | | | | | | | | |
CONSUMER PRODUCTS 0.1% | |
FGI Operating Co. LLC/Finance, Inc. | |
05/01/20 | | | 7.875% | | | | 325,000 | | | | 249,437 | |
|
First Quality Finance Co., Inc.(b) | |
05/15/21 | | | 4.625% | | | | 375,000 | | | | 352,500 | |
|
Hasbro, Inc. | |
05/15/44 | | | 5.100% | | | | 1,375,000 | | | | 1,336,301 | |
|
Party City Holdings, Inc. | |
08/01/20 | | | 8.875% | | | | 200,000 | | | | 213,250 | |
|
Party City Holdings, Inc.(b) | |
08/15/23 | | | 6.125% | | | | 275,000 | | | | 276,891 | |
|
Prestige Brands, Inc.(b) | |
12/15/21 | | | 5.375% | | | | 550,000 | | | | 545,875 | |
|
Serta Simmons Bedding LLC(b) | |
10/01/20 | | | 8.125% | | | | 927,000 | | | | 981,461 | |
|
Spectrum Brands, Inc. | |
11/15/20 | | | 6.375% | | | | 92,000 | | | | 97,640 | |
11/15/22 | | | 6.625% | | | | 388,000 | | | | 416,607 | |
|
Spectrum Brands, Inc.(b) | |
12/15/24 | | �� | 6.125% | | | | 175,000 | | | | 182,000 | |
07/15/25 | | | 5.750% | | | | 284,000 | | | | 292,520 | |
|
Springs Industries, Inc. | |
06/01/21 | | | 6.250% | | | | 507,000 | | | | 505,099 | |
|
Tempur Sealy International, Inc. | |
12/15/20 | | | 6.875% | | | | 178,000 | | | | 190,460 | |
| | | | | | | | | | | | | |
Total | | | | | | | | | | | 5,640,041 | |
| | | |
| | | | | | | | | | | | |
DIVERSIFIED MANUFACTURING 0.2% | |
ABB Finance U.S.A., Inc. | |
05/08/22 | | | 2.875% | | | | 630,000 | | | | 617,863 | |
|
Alfa SAB de CV | |
03/25/44 | | | 6.875% | | | | 300,000 | | | | 296,250 | |
|
Amsted Industries, Inc.(b) | |
03/15/22 | | | 5.000% | | | | 95,000 | | | | 95,000 | |
|
EnerSys(b) | |
04/30/23 | | | 5.000% | | | | 200,000 | | | | 192,750 | |
|
Entegris, Inc.(b) | |
04/01/22 | | | 6.000% | | | | 649,000 | | | | 657,112 | |
|
Gardner Denver, Inc.(b) | |
08/15/21 | | | 6.875% | | | | 450,000 | | | | 400,500 | |
|
General Electric Co. | |
10/09/42 | | | 4.125% | | | | 1,894,000 | | | | 1,810,545 | |
03/11/44 | | | 4.500% | | | | 660,000 | | | | 669,449 | |
The accompanying Notes to Financial Statements are an integral part of this statement.
| | |
| |
| ACTIVE PORTFOLIOS® MULTI-MANAGER CORE PLUS BOND FUND | | |
PORTFOLIO OF INVESTMENTS (continued)
August 31, 2015
| | | | | | | | | | | | |
| Corporate Bonds & Notes(a) (continued) | |
| Issuer | | Coupon
Rate | | | Principal
Amount ($) | | | Value ($) | |
Hamilton Sundstrand Corp.(b) | |
12/15/20 | | | 7.750% | | | | 300,000 | | | | 261,000 | |
|
Hutchison Whampoa International 12 Ltd.(c) | |
12/31/49 | | | 6.000% | | | | 100,000 | | | | 104,147 | |
|
United Technologies Corp. | |
05/15/45 | | | 4.150% | | | | 2,097,000 | | | | 2,017,274 | |
|
Valmont Industries, Inc. | |
04/20/20 | | | 6.625% | | | | 356,000 | | | | 406,077 | |
10/01/54 | | | 5.250% | | | | 2,050,000 | | | | 1,824,769 | |
|
WESCO Distribution, Inc. | |
12/15/21 | | | 5.375% | | | | 450,000 | | | | 437,625 | |
| | | | | | | | | | | | | |
Total | | | | | | | | | | | 9,790,361 | |
| | | |
| | | | | | | | | | | | |
ELECTRIC 1.6% | |
AES Corp. (The) | | | | | | | | | | | | |
07/01/21 | | | 7.375% | | | | 221,000 | | | | 238,128 | |
|
Alabama Power Co. | |
04/01/25 | | | 2.800% | | | | 1,275,000 | | | | 1,213,104 | |
01/15/42 | | | 4.100% | | | | 389,000 | | | | 366,751 | |
03/01/45 | | | 3.750% | | | | 1,165,000 | | | | 1,018,107 | |
|
American Electric Power Co., Inc. | |
12/15/22 | | | 2.950% | | | | 750,000 | | | | 725,018 | |
|
American Transmission Systems, Inc.(b) | |
01/15/22 | | | 5.250% | | | | 2,200,000 | | | | 2,420,471 | |
|
Berkshire Hathaway Energy Co. | |
02/01/25 | | | 3.500% | | | | 1,075,000 | | | | 1,076,990 | |
|
CMS Energy Corp. | |
02/15/18 | | | 5.050% | | | | 4,351,000 | | | | 4,654,691 | |
|
Calpine Corp. | |
01/15/25 | | | 5.750% | | | | 500,000 | | | | 484,375 | |
|
Calpine Corp.(b) | |
01/15/22 | | | 6.000% | | | | 214,000 | | | | 228,980 | |
01/15/24 | | | 5.875% | | | | 75,000 | | | | 78,750 | |
|
Consolidated Edison Co. of New York, Inc. | |
04/01/18 | | | 5.850% | | | | 3,000,000 | | | | 3,311,952 | |
|
Duke Energy Ohio, Inc. | |
09/01/23 | | | 3.800% | | | | 9,000 | | | | 9,423 | |
|
Duke Energy Progress LLC | |
03/30/44 | | | 4.375% | | | | 960,000 | | | | 973,023 | |
|
Duke Energy Progress, Inc. | |
08/15/45 | | | 4.200% | | | | 2,820,000 | | | | 2,817,955 | |
|
Duquesne Light Holdings, Inc.(b) | |
09/15/20 | | | 6.400% | | | | 5,000,000 | | | | 5,727,585 | |
|
Empresa Electrica Angamos SA(b) | |
05/25/29 | | | 4.875% | | | | 1,000,000 | | | | 937,500 | |
|
Entergy Mississippi, Inc. | |
07/01/23 | | | 3.100% | | | | 2,000,000 | | | | 1,971,902 | |
|
Exelon Corp. | |
06/15/25 | | | 3.950% | | | | 1,300,000 | | | | 1,303,240 | |
|
Exelon Generation Co. LLC | |
10/01/41 | | | 5.750% | | | | 2,000,000 | | | | 2,029,166 | |
| | | | | | | | | | | | |
| Corporate Bonds & Notes(a) (continued) | |
| Issuer | | Coupon
Rate | | | Principal
Amount ($) | | | Value ($) | |
FirstEnergy Corp. | |
03/15/18 | | | 2.750% | | | | 530,000 | | | | 531,754 | |
|
FirstEnergy Transmission LLC(b) | |
07/15/44 | | | 5.450% | | | | 1,000,000 | | | | 1,035,118 | |
|
Georgia Power Co. | |
09/01/40 | | | 4.750% | | | | 761,000 | | | | 738,106 | |
|
Gulf Power Co. | |
10/01/44 | | | 4.550% | | | | 1,350,000 | | | | 1,403,896 | |
|
Inkia Energy Ltd. | |
04/04/21 | | | 8.375% | | | | 200,000 | | | | 207,000 | |
|
Ipalco Enterprises, Inc. | |
05/01/18 | | | 5.000% | | | | 3,130,000 | | | | 3,317,800 | |
|
Jersey Central Power & Light Co.(b) | |
04/01/24 | | | 4.700% | | | | 500,000 | | | | 522,684 | |
|
Kansas City Power & Light Co. | |
08/15/25 | | | 3.650% | | | | 665,000 | | | | 667,654 | |
|
MidAmerican Energy Co. | |
10/15/24 | | | 3.500% | | | | 1,540,000 | | | | 1,564,726 | |
|
NRG Energy, Inc. | |
07/15/22 | | | 6.250% | | | | 283,000 | | | | 275,925 | |
03/15/23 | | | 6.625% | | | | 375,000 | | | | 368,438 | |
05/01/24 | | | 6.250% | | | | 275,000 | | | | 261,250 | |
|
NRG Yield Operating LLC | |
08/15/24 | | | 5.375% | | | | 298,000 | | | | 286,825 | |
|
National Rural Utilities Cooperative Finance Corp. | |
11/01/18 | | | 10.375% | | | | 2,500,000 | | | | 3,121,357 | |
|
Nevada Power Co. | |
05/15/18 | | | 6.500% | | | | 2,486,000 | | | | 2,780,688 | |
|
NextEra Energy Capital Holdings, Inc. | |
06/15/23 | | | 3.625% | | | | 3,000,000 | | | | 3,013,683 | |
|
Niagara Mohawk Power Corp.(b) | |
10/01/24 | | | 3.508% | | | | 1,505,000 | | | | 1,511,497 | |
|
Oncor Electric Delivery Co. LLC | |
09/30/40 | | | 5.250% | | | | 4,000,000 | | | | 4,359,468 | |
|
Oncor Electric Delivery Co. LLC(b) | |
04/01/25 | | | 2.950% | | | | 2,495,000 | | | | 2,373,291 | |
04/01/45 | | | 3.750% | | | | 1,660,000 | | | | 1,486,877 | |
|
PPL Capital Funding, Inc. | |
06/01/18 | | | 1.900% | | | | 1,675,000 | | | | 1,669,087 | |
06/15/22 | | | 4.200% | | | | 1,508,000 | | | | 1,580,652 | |
06/01/23 | | | 3.400% | | | | 2,907,000 | | | | 2,866,878 | |
03/15/24 | | | 3.950% | | | | 1,200,000 | | | | 1,220,777 | |
|
PSEG Power LLC | |
11/15/18 | | | 2.450% | | | | 840,000 | | | | 842,642 | |
|
Pacific Gas & Electric Co. | |
06/15/23 | | | 3.250% | | | | 2,291,000 | | | | 2,284,361 | |
03/15/45 | | | 4.300% | | | | 845,000 | | | | 820,429 | |
|
Southern California Edison Co. | |
09/01/40 | | | 4.500% | | | | 887,000 | | | | 908,109 | |
02/01/45 | | | 3.600% | | | | 1,165,000 | | | | 1,044,426 | |
|
Talen Energy Supply LLC(b) | |
06/01/25 | | | 6.500% | | | | 144,000 | | | | 133,560 | |
The accompanying Notes to Financial Statements are an integral part of this statement.
| | |
| |
| | ACTIVE PORTFOLIOS® MULTI-MANAGER CORE PLUS BOND FUND |
PORTFOLIO OF INVESTMENTS (continued)
August 31, 2015
| | | | | | | | | | | | |
| Corporate Bonds & Notes(a) (continued) | |
| Issuer | | Coupon
Rate | | | Principal
Amount ($) | | | Value ($) | |
TerraForm Power Operating LLC(b) | |
02/01/23 | | | 5.875% | | | | 382,000 | | | | 362,900 | |
06/15/25 | | | 6.125% | | | | 122,000 | | | | 114,985 | |
|
Toledo Edison Co. (The) | |
05/15/37 | | | 6.150% | | | | 1,001,000 | | | | 1,170,955 | |
|
Tucson Electric Power Co. | |
03/15/23 | | | 3.850% | | | | 3,100,000 | | | | 3,120,165 | |
|
UIL Holdings Corp. | |
10/01/20 | | | 4.625% | | | | 300,000 | | | | 320,127 | |
|
Virginia Electric & Power Co. | |
06/30/19 | | | 5.000% | | | | 1,280,000 | | | | 1,410,253 | |
|
WEC Energy Group, Inc. | |
06/15/25 | | | 3.550% | | | | 1,100,000 | | | | 1,104,170 | |
| | | | | | | | | | | | | |
Total | | | | | | | | | | | 82,389,624 | |
| | | |
| | | | | | | | | | | | |
FINANCE COMPANIES 1.4% | |
AerCap Ireland Capital Ltd./Global Aviation Trust | |
05/15/21 | | | 4.500% | | | | 1,153,000 | | | | 1,171,736 | |
10/01/21 | | | 5.000% | | | | 2,000,000 | | | | 2,067,500 | |
07/01/22 | | | 4.625% | | | | 150,000 | | | | 151,125 | |
|
Aircastle Ltd. | |
03/15/21 | | | 5.125% | | | | 63,000 | | | | 64,418 | |
02/15/22 | | | 5.500% | | | | 69,000 | | | | 71,415 | |
|
CIT Group, Inc. | |
05/15/17 | | | 5.000% | | | | 2,000,000 | | | | 2,057,500 | |
08/15/17 | | | 4.250% | | | | 2,500,000 | | | | 2,537,500 | |
03/15/18 | | | 5.250% | | | | 400,000 | | | | 415,500 | |
05/15/20 | | | 5.375% | | | | 282,000 | | | | 294,690 | |
08/01/23 | | | 5.000% | | | | 325,000 | | | | 329,062 | |
|
CIT Group, Inc.(b) | |
02/15/19 | | | 5.500% | | | | 162,000 | | | | 170,505 | |
|
GE Capital Trust I(c) | |
11/15/67 | | | 6.375% | | | | 1,838,000 | | | | 1,963,214 | |
|
General Electric Capital Corp. | |
01/08/20 | | | 5.500% | | | | 5,000,000 | | | | 5,637,095 | |
10/17/21 | | | 4.650% | | | | 1,700,000 | | | | 1,869,587 | |
09/07/22 | | | 3.150% | | | | 1,175,000 | | | | 1,181,501 | |
01/09/23 | | | 3.100% | | | | 4,000,000 | | | | 4,009,508 | |
01/14/38 | | | 5.875% | | | | 4,175,000 | | | | 5,068,830 | |
|
General Electric Capital Corp.(c) | |
08/15/36 | | | 0.801% | | | | 5,380,000 | | | | 4,887,402 | |
12/31/49 | | | 5.250% | | | | 11,321,000 | | | | 11,513,457 | |
11/15/67 | | | 6.375% | | | | 10,587,000 | | | | 11,301,622 | |
|
HSBC Finance Capital Trust IX(c) | |
11/30/35 | | | 5.911% | | | | 2,365,000 | | | | 2,373,869 | |
|
HSBC Finance Corp. | |
01/15/21 | | | 6.676% | | | | 6,591,000 | | | | 7,668,793 | |
|
International Lease Finance Corp. | |
12/15/20 | | | 8.250% | | | | 321,000 | | | | 380,385 | |
04/15/21 | | | 4.625% | | | | 275,000 | | | | 279,812 | |
08/15/22 | | | 5.875% | | | | 625,000 | | | | 674,219 | |
|
Navient Corp. | |
01/15/19 | | | 5.500% | | | | 284,000 | | | | 271,220 | |
10/26/20 | | | 5.000% | | | | 6,000 | | | | 5,340 | |
| | | | | | | | | | | | |
| Corporate Bonds & Notes(a) (continued) | |
| Issuer | | Coupon
Rate | | | Principal
Amount ($) | | | Value ($) | |
01/25/22 | | | 7.250% | | | | 74,000 | | | | 69,745 | |
03/25/24 | | | 6.125% | | | | 86,000 | | | | 73,100 | |
|
OneMain Financial Holdings, Inc.(b) | |
12/15/19 | | | 6.750% | | | | 69,000 | | | | 72,105 | |
12/15/21 | | | 7.250% | | | | 142,000 | | | | 146,970 | |
|
Provident Funding Associates LP/Finance Corp.(b) | |
06/15/21 | | | 6.750% | | | | 287,000 | | | | 272,650 | |
|
Quicken Loans, Inc.(b) | |
05/01/25 | | | 5.750% | | | | 796,000 | | | | 776,100 | |
|
Springleaf Finance Corp. | |
12/15/17 | | | 6.900% | | | | 74,000 | | | | 78,348 | |
06/01/20 | | | 6.000% | | | | 188,000 | | | | 190,820 | |
10/01/21 | | | 7.750% | | | | 84,000 | | | | 91,560 | |
10/01/23 | | | 8.250% | | | | 62,000 | | | | 69,440 | |
|
iStar, Inc. | |
07/01/19 | | | 5.000% | | | | 109,000 | | | | 105,730 | |
| | | | | | | | | | | | | |
Total | | | | | | | | | | | 70,363,373 | |
| | | |
| �� | | | | | | | | | | | |
FOOD AND BEVERAGE 0.6% | |
Acosta, Inc.(b) | | | | | | | | | | | | |
10/01/22 | | | 7.750% | | | | 750,000 | | | | 735,937 | |
|
Aramark Services, Inc. | |
03/15/20 | | | 5.750% | | | | 831,000 | | | | 861,643 | |
|
B&G Foods, Inc. | |
06/01/21 | | | 4.625% | | | | 186,000 | | | | 181,118 | |
|
Coca-Cola Femsa SAB de CV | |
11/26/18 | | | 2.375% | | | | 1,000,000 | | | | 1,008,600 | |
02/15/20 | | | 4.625% | | | | 1,500,000 | | | | 1,624,875 | |
|
ConAgra Foods, Inc. | |
08/15/39 | | | 6.625% | | | | 4,700,000 | | | | 4,937,594 | |
|
Constellation Brands, Inc. | |
11/15/19 | | | 3.875% | | | | 100,000 | | | | 102,625 | |
11/15/24 | | | 4.750% | | | | 232,000 | | | | 237,220 | |
|
Dean Foods Co.(b) | |
03/15/23 | | | 6.500% | | | | 300,000 | | | | 303,000 | |
|
Diamond Foods, Inc.(b) | |
03/15/19 | | | 7.000% | | | | 114,000 | | | | 117,420 | |
|
Grupo Bimbo SAB de CV(b) | |
01/25/22 | | | 4.500% | | | | 1,800,000 | | | | 1,874,682 | |
06/27/24 | | | 3.875% | | | | 450,000 | | | | 441,176 | |
|
Kerry Group Financial Services(b) | |
04/09/23 | | | 3.200% | | | | 3,000,000 | | | | 2,891,595 | |
|
Kraft Heinz Co. (The)(b) | |
07/15/25 | | | 3.950% | | | | 930,000 | | | | 944,611 | |
07/15/45 | | | 5.200% | | | | 1,715,000 | | | | 1,802,520 | |
|
Mondelez International, Inc. | |
02/01/24 | | | 4.000% | | | | 4,000,000 | | | | 4,098,748 | |
|
PepsiCo, Inc. | |
04/30/25 | | | 2.750% | | | | 1,300,000 | | | | 1,236,137 | |
|
Pinnacle Foods Finance LLC/Corp. | |
05/01/21 | | | 4.875% | | | | 550,000 | | | | 550,550 | |
The accompanying Notes to Financial Statements are an integral part of this statement.
| | |
| |
| ACTIVE PORTFOLIOS® MULTI-MANAGER CORE PLUS BOND FUND | | |
PORTFOLIO OF INVESTMENTS (continued)
August 31, 2015
| | | | | | | | | | | | |
| Corporate Bonds & Notes(a) (continued) | |
| Issuer | | Coupon
Rate | | | Principal
Amount ($) | | | Value ($) | |
Post Holdings, Inc. | |
02/15/22 | | | 7.375% | | | | 50,000 | | | | 51,250 | |
|
Post Holdings, Inc.(b) | |
12/15/22 | | | 6.000% | | | | 18,000 | | | | 17,370 | |
03/15/24 | | | 7.750% | | | | 334,000 | | | | 344,855 | |
07/15/25 | | | 8.000% | | | | 175,000 | | | | 180,688 | |
|
Smithfield Foods, Inc.(b) | |
08/01/21 | | | 5.875% | | | | 425,000 | | | | 440,938 | |
|
TreeHouse Foods, Inc. | |
03/15/22 | | | 4.875% | | | | 175,000 | | | | 173,688 | |
|
Tyson Foods, Inc. | |
06/15/22 | | | 4.500% | | | | 2,000,000 | | | | 2,099,390 | |
08/15/44 | | | 5.150% | | | | 200,000 | | | | 205,099 | |
|
U.S. Foods, Inc. | |
06/30/19 | | | 8.500% | | | | 775,000 | | | | 807,937 | |
|
WhiteWave Foods Co. (The) | |
10/01/22 | | | 5.375% | | | | 231,000 | | | | 238,796 | |
| | | | | | | | | | | | | |
Total | | | | | | | | | | | 28,510,062 | |
| | | |
| | | | | | | | | | | | |
FOREIGN AGENCIES —% | |
CNOOC Nexen Finance ULC | |
04/30/24 | | | 4.250% | | | | 100,000 | | | | 101,556 | |
|
Israel Electric Corp., Ltd. | |
01/15/19 | | | 7.250% | | | | 200,000 | | | | 228,000 | |
|
KazAgro National Management Holding JSC(b) | |
05/24/23 | | | 4.625% | | | | 400,000 | | | | 336,000 | |
|
Lamar Funding Ltd.(b) | |
05/07/25 | | | 3.958% | | | | 200,000 | | | | 187,500 | |
|
OCP SA(b) | |
04/25/24 | | | 5.625% | | | | 200,000 | | | | 205,040 | |
|
Petroleos Mexicanos | |
12/20/22 | | | 1.700% | | | | 768,750 | | | | 741,559 | |
01/23/46 | | | 5.625% | | | | 100,000 | | | | 89,000 | |
|
Vnesheconombank Via VEB Finance PLC | |
07/05/22 | | | 6.025% | | | | 200,000 | | | | 175,400 | |
|
YPF SA(b) | |
04/04/24 | | | 8.750% | | | | 50,000 | | | | 48,000 | |
| | | | | | | | | | | | | |
Total | | | | | | | | | | | 2,112,055 | |
| | | |
| | | | | | | | | | | | |
GAMING 0.1% | |
Boyd Gaming Corp. | |
05/15/23 | | | 6.875% | | | | 364,000 | | | | 374,010 | |
|
Chester Downs & Marina LLC/Finance Corp.(b) | |
02/01/20 | | | 9.250% | | | | 250,000 | | | | 192,500 | |
|
Churchill Downs, Inc. | |
12/15/21 | | | 5.375% | | | | 100,000 | | | | 102,000 | |
|
GLP Capital LP/Financing II, Inc. | |
11/01/20 | | | 4.875% | | | | 225,000 | | | | 232,875 | |
11/01/23 | | | 5.375% | | | | 286,000 | | | | 296,725 | |
|
International Game Technology PLC(b) | |
02/15/25 | | | 6.500% | | | | 296,000 | | | | 280,460 | |
| | | | | | | | | | | | |
| Corporate Bonds & Notes(a) (continued) | |
| Issuer | | Coupon
Rate | | | Principal
Amount ($) | | | Value ($) | |
MGM Resorts International | |
03/01/18 | | | 11.375% | | | | 151,000 | | | | 177,425 | |
03/31/20 | | | 5.250% | | | | 500,000 | | | | 502,500 | |
10/01/20 | | | 6.750% | | | | 454,000 | | | | 483,510 | |
12/15/21 | | | 6.625% | | | | 168,000 | | | | 178,500 | |
03/15/23 | | | 6.000% | | | | 154,000 | | | | 156,310 | |
|
Mohegan Tribal Gaming Authority | |
09/01/21 | | | 9.750% | | | | 300,000 | | | | 312,000 | |
|
Penn National Gaming, Inc. | |
11/01/21 | | | 5.875% | | | | 450,000 | | | | 456,750 | |
|
Pinnacle Entertainment, Inc. | |
08/01/21 | | | 6.375% | | | | 494,000 | | | | 526,110 | |
04/01/22 | | | 7.750% | | | | 175,000 | | | | 193,375 | |
|
Rivers Pittsburgh Borrower LP/Finance Corp.(b) | |
06/15/19 | | | 9.500% | | | | 229,000 | | | | 238,733 | |
|
Scientific Games International, Inc. | |
12/01/22 | | | 10.000% | | | | 282,000 | | | | 258,735 | |
|
Scientific Games International, Inc.(b) | |
01/01/22 | | | 7.000% | | | | 252,000 | | | | 257,670 | |
|
Seminole Hard Rock Entertainment Inc./International LLC(b) | |
05/15/21 | | | 5.875% | | | | 550,000 | | | | 548,625 | |
|
Seminole Tribe of Florida, Inc.(b) | |
10/01/20 | | | 6.535% | | | | 145,000 | | | | 152,975 | |
|
Station Casinos LLC | |
03/01/21 | | | 7.500% | | | | 400,000 | | | | 423,160 | |
|
Tunica-Biloxi Gaming Authority(b)(d) | |
11/15/15 | | | 9.000% | | | | 99,000 | | | | 54,450 | |
| | | | | | | | | | | | | |
Total | | | | | | | | | | | 6,399,398 | |
| | | |
| | | | | | | | | | | | |
HEALTH CARE 1.1% | |
Acadia Healthcare Co., Inc. | |
07/01/22 | | | 5.125% | | | | 31,000 | | | | 31,155 | |
02/15/23 | | | 5.625% | | | | 50,000 | | | | 50,972 | |
|
Agilent Technologies, Inc. | |
10/01/22 | | | 3.200% | | | | 1,000,000 | | | | 968,687 | |
07/15/23 | | | 3.875% | | | | 2,450,000 | | | | 2,461,559 | |
|
Air Medical Merger Sub Corp.(b) | |
05/15/23 | | | 6.375% | | | | 413,000 | | | | 384,090 | |
|
Alere, Inc.(b) | |
07/01/23 | | | 6.375% | | | | 106,000 | | | | 108,650 | |
| | | |
Amsurg Corp. | | | | | | | | | | | | |
07/15/22 | | | 5.625% | | | | 450,000 | | | | 459,283 | |
|
Barnabas Health, Inc. | |
07/01/28 | | | 4.000% | | | | 4,000,000 | | | | 4,015,252 | |
|
Becton Dickinson and Co. | |
05/15/24 | | | 3.875% | | | | 845,000 | | | | 850,335 | |
12/15/24 | | | 3.734% | | | | 1,762,000 | | | | 1,756,917 | |
12/15/44 | | | 4.685% | | | | 960,000 | | | | 945,300 | |
|
CHS/Community Health Systems, Inc. | |
08/15/18 | | | 5.125% | | | | 128,000 | | | | 131,040 | |
11/15/19 | | | 8.000% | | | | 203,000 | | | | 212,135 | |
08/01/21 | | | 5.125% | | | | 370,000 | | | | 380,175 | |
02/01/22 | | | 6.875% | | | | 772,000 | | | | 820,489 | |
The accompanying Notes to Financial Statements are an integral part of this statement.
| | |
| |
| | ACTIVE PORTFOLIOS® MULTI-MANAGER CORE PLUS BOND FUND |
PORTFOLIO OF INVESTMENTS (continued)
August 31, 2015
| | | | | | | | | | | | |
| Corporate Bonds & Notes(a) (continued) | |
| Issuer | | Coupon
Rate | | | Principal
Amount ($) | | | Value ($) | |
Catholic Health Initiatives | |
11/01/22 | | | 2.950% | | | | 2,500,000 | | | | 2,442,940 | |
08/01/23 | | | 4.200% | | | | 3,100,000 | | | | 3,243,040 | |
|
ConvaTec Finance International SA
PIK(b) | |
01/15/19 | | | 8.250% | | | | 113,000 | | | | 111,305 | |
|
Crimson Merger Sub, Inc.(b) | |
05/15/22 | | | 6.625% | | | | 850,000 | | | | 759,687 | |
|
DaVita HealthCare Partners, Inc. | |
08/15/22 | | | 5.750% | | | | 687,000 | | | | 730,968 | |
07/15/24 | | | 5.125% | | | | 2,328,000 | | | | 2,317,815 | |
05/01/25 | | | 5.000% | | | | 150,000 | | | | 147,000 | |
|
Emdeon, Inc. | |
12/31/19 | | | 11.000% | | | | 363,000 | | | | 390,225 | |
|
Emdeon, Inc.(b) | |
02/15/21 | | | 6.000% | | | | 215,000 | | | | 211,775 | |
|
Envision Healthcare Corp.(b) | |
07/01/22 | | | 5.125% | | | | 450,000 | | | | 457,312 | |
|
ExamWorks Group, Inc. | |
04/15/23 | | | 5.625% | | | | 93,000 | | | | 95,209 | |
|
Fresenius Medical Care U.S. Finance II, Inc.(b) | |
09/15/18 | | | 6.500% | | | | 115,000 | | | | 127,075 | |
07/31/19 | | | 5.625% | | | | 587,000 | | | | 633,960 | |
01/31/22 | | | 5.875% | | | | 162,000 | | | | 174,960 | |
10/15/24 | | | 4.750% | | | | 49,000 | | | | 49,059 | |
|
HCA, Inc. | |
02/15/20 | | | 6.500% | | | | 2,198,000 | | | | 2,428,790 | |
02/15/22 | | | 7.500% | | | | 478,000 | | | | 548,357 | |
03/15/22 | | | 5.875% | | | | 1,000,000 | | | | 1,087,500 | |
05/01/23 | | | 5.875% | | | | 53,000 | | | | 56,048 | |
03/15/24 | | | 5.000% | | | | 250,000 | | | | 255,938 | |
02/01/25 | | | 5.375% | | | | 1,411,000 | | | | 1,432,165 | |
04/15/25 | | | 5.250% | | | | 484,000 | | | | 502,150 | |
|
HealthSouth Corp.(b) | |
11/01/24 | | | 5.750% | | | | 53,000 | | | | 53,737 | |
|
Hill-Rom Holdings, Inc.(b)(e) | |
09/01/23 | | | 5.750% | | | | 100,000 | | | | 101,750 | |
|
Hologic, Inc.(b) | |
07/15/22 | | | 5.250% | | | | 278,000 | | | | 283,213 | |
|
IASIS Healthcare LLC/Capital Corp. | |
05/15/19 | | | 8.375% | | | | 350,000 | | | | 362,737 | |
|
IMS Health, Inc.(b) | |
11/01/20 | | | 6.000% | | | | 126,000 | | | | 129,465 | |
|
Kinetic Concepts, Inc./KCI U.S.A., Inc. | |
11/01/18 | | | 10.500% | | | | 64,000 | | | | 67,040 | |
|
LifePoint Health, Inc. | |
12/01/21 | | | 5.500% | | | | 427,000 | | | | 444,881 | |
|
MPH Acquisition Holdings LLC(b) | |
04/01/22 | | | 6.625% | | | | 801,000 | | | | 821,025 | |
|
Memorial Sloan-Kettering Cancer Center | |
07/01/52 | | | 4.125% | | | | 4,630,000 | | | | 4,299,770 | |
|
NYU Hospitals Center | |
07/01/42 | | | 4.428% | | | | 4,000,000 | | | | 3,892,440 | |
|
North Shore-Long Island Jewish Health Care, Inc. | |
11/01/42 | | | 4.800% | | | | 6,365,000 | | | | 6,131,112 | |
| | | | | | | | | | | | |
| Corporate Bonds & Notes(a) (continued) | |
| Issuer | | Coupon
Rate | | | Principal
Amount ($) | | | Value ($) | |
Sterigenics-Nordion Holdings LLC(b) | |
05/15/23 | | | 6.500% | | | | 514,000 | | | | 524,270 | |
|
Stryker Corp. | |
04/01/18 | | | 1.300% | | | | 800,000 | | | | 793,631 | |
|
Surgical Care Affiliates, Inc.(b) | |
04/01/23 | | | 6.000% | | | | 440,000 | | | | 444,400 | |
|
Sutter Health | |
08/15/53 | | | 2.286% | | | | 2,300,000 | | | | 2,279,875 | |
|
Teleflex, Inc. | |
06/15/24 | | | 5.250% | | | | 250,000 | | | | 250,625 | |
|
Tenet Healthcare Corp. | |
06/01/20 | | | 4.750% | | | | 4,000 | | | | 4,080 | |
10/01/20 | | | 6.000% | | | | 77,000 | | | | 82,390 | |
04/01/21 | | | 4.500% | | | | 931,000 | | | | 935,655 | |
10/01/21 | | | 4.375% | | | | 25,000 | | | | 25,000 | |
04/01/22 | | | 8.125% | | | | 992,000 | | | | 1,098,640 | |
06/15/23 | | | 6.750% | | | | 273,000 | | | | 281,190 | |
|
Thermo Fisher Scientific, Inc. | |
02/15/22 | | | 3.300% | | | | 470,000 | | | | 458,517 | |
|
Truven Health Analytics, Inc. | |
06/01/20 | | | 10.625% | | | | 325,000 | | | | 340,031 | |
|
Universal Health Services, Inc.(b) | |
08/01/22 | | | 4.750% | | | | 169,000 | | | | 174,070 | |
|
VWR Funding, Inc. | |
09/15/17 | | | 7.250% | | | | 575,000 | | | | 591,962 | |
|
Zimmer Biomet Holdings, Inc. | |
04/01/25 | | | 3.550% | | | | 985,000 | | | | 944,594 | |
| | | | | | | | | | | | | |
Total | | | | | | | | | | | 57,595,417 | |
| | | |
| | | | | | | | | | | | |
HEALTHCARE INSURANCE 0.1% | |
Centene Corp. | |
05/15/22 | | | 4.750% | | | | 137,000 | | | | 138,797 | |
|
UnitedHealth Group, Inc. | |
11/15/17 | | | 6.000% | | | | 2,383,000 | | | | 2,607,386 | |
07/15/25 | | | 3.750% | | | | 1,295,000 | | | | 1,327,178 | |
07/15/45 | | | 4.750% | | | | 460,000 | | | | 483,179 | |
| | | | | | | | | | | | | |
Total | | | | | | | | | | | 4,556,540 | |
| | | |
| | | | | | | | | | | | |
HEALTHCARE REIT 0.7% | |
Alexandria Real Estate Equities, Inc. | |
04/01/22 | | | 4.600% | | | | 1,198,000 | | | | 1,243,310 | |
06/15/23 | | | 3.900% | | | | 9,300,000 | | | | 9,227,079 | |
|
HCP, Inc. | |
01/30/17 | | | 6.000% | | | | 3,000,000 | | | | 3,173,223 | |
02/01/21 | | | 5.375% | | | | 144,000 | | | | 157,949 | |
11/15/23 | | | 4.250% | | | | 3,746,000 | | | | 3,740,272 | |
|
Health Care REIT, Inc. | |
03/15/16 | | | 3.625% | | | | 603,000 | | | | 610,433 | |
06/01/16 | | | 6.200% | | | | 1,000,000 | | | | 1,034,619 | |
04/01/19 | | | 4.125% | | | | 2,000,000 | | | | 2,108,266 | |
04/15/20 | | | 6.125% | | | | 4,000,000 | | | | 4,563,560 | |
03/15/23 | | | 3.750% | | | | 2,145,000 | | | | 2,119,444 | |
The accompanying Notes to Financial Statements are an integral part of this statement.
| | |
| |
| ACTIVE PORTFOLIOS® MULTI-MANAGER CORE PLUS BOND FUND | | |
PORTFOLIO OF INVESTMENTS (continued)
August 31, 2015
| | | | | | | | | | | | |
| Corporate Bonds & Notes(a) (continued) | |
| Issuer | | Coupon
Rate | | | Principal
Amount ($) | | | Value ($) | |
Healthcare Trust of America Holdings LP | |
07/15/21 | | | 3.375% | | | | 3,455,000 | | | | 3,427,059 | |
04/15/23 | | | 3.700% | | | | 800,000 | | | | 779,582 | |
|
Ventas Realty LP/Capital Corp. | |
04/01/20 | | | 2.700% | | | | 3,000,000 | | | | 2,970,897 | |
| | | | | | | | | | | | | |
Total | | | | | | | | | | | 35,155,693 | |
| | | |
| | | | | | | | | | | | |
HOME CONSTRUCTION —% | |
China Overseas Finance (Cayman) V Ltd. | |
11/15/22 | | | 3.950% | | | | 400,000 | | | | 387,761 | |
|
China Overseas Finance Cayman III Ltd. | |
10/29/43 | | | 6.375% | | | | 200,000 | | | | 204,849 | |
|
D.R. Horton, Inc. | |
02/15/20 | | | 4.000% | | | | 87,000 | | | | 87,435 | |
09/15/22 | | | 4.375% | | | | 60,000 | | | | 59,550 | |
|
Meritage Homes Corp. | |
03/01/18 | | | 4.500% | | | | 86,000 | | | | 87,075 | |
04/01/22 | | | 7.000% | | | | 194,000 | | | | 207,095 | |
06/01/25 | | | 6.000% | | | | 30,000 | | | | 30,244 | |
|
Standard Pacific Corp. | |
12/15/21 | | | 6.250% | | | | 174,000 | | | | 184,875 | |
11/15/24 | | | 5.875% | | | | 46,000 | | | | 47,150 | |
|
Taylor Morrison Communities, Inc./Monarch, Inc.(b) | |
04/15/23 | | | 5.875% | | | | 121,000 | | | | 121,908 | |
03/01/24 | | | 5.625% | | | | 56,000 | | | | 54,600 | |
| | | | | | | | | | | | | |
Total | | | | | | | | | | | 1,472,542 | |
| | | |
| | | | | | | | | | | | |
INDEPENDENT ENERGY 0.7% | |
Afren PLC(b)(d)(f) | |
12/09/20 | | | 6.625% | | | | 200,000 | | | | 6,000 | |
|
Anadarko Petroleum Corp. | |
07/15/24 | | | 3.450% | | | | 2,100,000 | | | | 2,016,876 | |
| | | |
Antero Resources Corp. | | | | | | | | | | | | |
12/01/20 | | | 6.000% | | | | 275,000 | | | | 262,625 | |
11/01/21 | | | 5.375% | | | | 75,000 | | | | 69,000 | |
12/01/22 | | | 5.125% | | | | 416,000 | | | | 376,567 | |
|
Antero Resources Corp.(b) | |
06/01/23 | | | 5.625% | | | | 305,000 | | | | 277,550 | |
|
Apache Corp. | |
01/15/23 | | | 2.625% | | | | 1,500,000 | | | | 1,371,241 | |
|
Approach Resources, Inc. | |
06/15/21 | | | 7.000% | | | | 350,000 | | | | 234,500 | |
|
BreitBurn Energy Partners LP/Finance Corp. | |
04/15/22 | | | 7.875% | | | | 100,000 | | | | 42,500 | |
|
California Resources Corp. | |
09/15/21 | | | 5.500% | | | | 50,000 | | | | 38,769 | |
11/15/24 | | | 6.000% | | | | 375,000 | | | | 278,062 | |
|
Canadian Natural Resources Ltd. | |
11/15/21 | | | 3.450% | | | | 1,779,000 | | | | 1,720,827 | |
04/15/24 | | | 3.800% | | | | 310,000 | | | | 291,363 | |
02/01/25 | | | 3.900% | | | | 1,850,000 | | | | 1,710,360 | |
03/15/38 | | | 6.250% | | | | 438,000 | | | | 437,397 | |
| | | | | | | | | | | | |
| Corporate Bonds & Notes(a) (continued) | |
| Issuer | | Coupon
Rate | | | Principal
Amount ($) | | | Value ($) | |
Carrizo Oil & Gas, Inc. | |
09/15/20 | | | 7.500% | | | | 375,000 | | | | 354,375 | |
04/15/23 | | | 6.250% | | | | 420,000 | | | | 378,000 | |
|
Chaparral Energy, Inc. | |
10/01/20 | | | 9.875% | | | | 75,000 | | | | 38,625 | |
11/15/22 | | | 7.625% | | | | 75,000 | | | | 32,625 | |
|
Chesapeake Energy Corp. | |
02/15/21 | | | 6.125% | | | | 270,000 | | | | 209,083 | |
03/15/23 | | | 5.750% | | | | 630,000 | | | | 469,671 | |
|
Cimarex Energy Co. | |
06/01/24 | | | 4.375% | | | | 1,627,000 | | | | 1,565,223 | |
|
Concho Resources, Inc. | |
04/01/23 | | | 5.500% | | | | 444,000 | | | | 438,632 | |
|
Conoco Funding Co. | |
10/15/31 | | | 7.250% | | | | 2,000,000 | | | | 2,598,100 | |
|
CrownRock LP/Finance, Inc.(b) | |
02/15/23 | | | 7.750% | | | | 310,000 | | | | 306,900 | |
|
Diamondback Energy, Inc. | |
10/01/21 | | | 7.625% | | | | 146,000 | | | | 153,300 | |
|
EOG Resources, Inc. | |
03/15/23 | | | 2.625% | | | | 1,195,000 | | | | 1,132,331 | |
|
EP Energy LLC/Everest Acquisition Finance, Inc. | |
05/01/20 | | | 9.375% | | | | 300,000 | | | | 288,750 | |
09/01/22 | | | 7.750% | | | | 287,000 | | | | 264,040 | |
06/15/23 | | | 6.375% | | | | 257,000 | | | | 218,450 | |
|
Energy XXI Gulf Coast, Inc. | |
12/15/21 | | | 7.500% | | | | 100,000 | | | | 18,750 | |
03/15/24 | | | 6.875% | | | | 100,000 | | | | 19,750 | |
|
Gulfport Energy Corp. | |
11/01/20 | | | 7.750% | | | | 225,000 | | | | 218,812 | |
|
Gulfport Energy Corp.(b) | |
05/01/23 | | | 6.625% | | | | 150,000 | | | | 139,500 | |
|
Halcon Resources Corp.(b) | |
02/01/20 | | | 8.625% | | | | 150,000 | | | | 131,625 | |
|
Hess Corp. | |
02/15/41 | | | 5.600% | | | | 2,000,000 | | | | 1,916,400 | |
|
Laredo Petroleum, Inc. | |
01/15/22 | | | 5.625% | | | | 225,000 | | | | 202,500 | |
05/01/22 | | | 7.375% | | | | 419,000 | | | | 408,525 | |
03/15/23 | | | 6.250% | | | | 251,000 | | | | 229,665 | |
|
Legacy Reserves LP/Finance Corp. | |
12/01/21 | | | 6.625% | | | | 375,000 | | | | 262,500 | |
|
Linn Energy LLC/Finance Corp. | |
11/01/19 | | | 6.250% | | | | 300,000 | | | | 117,000 | |
02/01/21 | | | 7.750% | | | | 125,000 | | | | 49,063 | |
09/15/21 | | | 6.500% | | | | 75,000 | | | | 28,688 | |
|
Marathon Oil Corp. | |
06/01/25 | | | 3.850% | | | | 1,400,000 | | | | 1,279,496 | |
|
Newfield Exploration Co. | |
07/01/24 | | | 5.625% | | | | 1,700,000 | | | | 1,654,100 | |
|
Noble Energy, Inc. | |
11/15/24 | | | 3.900% | | | | 2,210,000 | | | | 2,087,831 | |
The accompanying Notes to Financial Statements are an integral part of this statement.
| | |
| |
| | ACTIVE PORTFOLIOS® MULTI-MANAGER CORE PLUS BOND FUND |
PORTFOLIO OF INVESTMENTS (continued)
August 31, 2015
| | | | | | | | | | | | |
| Corporate Bonds & Notes(a) (continued) | |
| Issuer | | Coupon
Rate | | | Principal
Amount ($) | | | Value ($) | |
Northern Oil and Gas, Inc. | |
06/01/20 | | | 8.000% | | | | 100,000 | | | | 76,000 | |
06/01/20 | | | 8.000% | | | | 375,000 | | | | 285,000 | |
|
Oasis Petroleum, Inc. | |
11/01/21 | | | 6.500% | | | | 553,000 | | | | 445,165 | |
01/15/23 | | | 6.875% | | | | 336,000 | | | | 265,440 | |
|
PDC Energy, Inc. | |
10/15/22 | | | 7.750% | | | | 75,000 | | | | 75,000 | |
|
Parsley Energy LLC/Finance Corp.(b) | |
02/15/22 | | | 7.500% | | | | 388,000 | | | | 380,240 | |
|
RSP Permian, Inc.(b) | |
10/01/22 | | | 6.625% | | | | 321,000 | | | | 314,580 | |
10/01/22 | | | 6.625% | | | | 50,000 | | | | 49,000 | |
|
Range Resources Corp.(b) | |
05/15/25 | | | 4.875% | | | | 519,000 | | | | 467,100 | |
|
Ras Laffan Liquefied Natural Gas Co., Ltd. II(b) | |
09/30/20 | | | 5.298% | | | | 939,228 | | | | 1,003,800 | |
|
Rice Energy, Inc. | |
05/01/22 | | | 6.250% | | | | 275,000 | | | | 244,750 | |
|
Rice Energy, Inc.(b) | |
05/01/23 | | | 7.250% | | | | 50,000 | | | | 46,500 | |
|
SM Energy Co. | |
11/15/22 | | | 6.125% | | | | 146,000 | | | | 140,160 | |
01/01/23 | | | 6.500% | | | | 50,000 | | | | 48,075 | |
01/15/24 | | | 5.000% | | | | 50,000 | | | | 42,750 | |
06/01/25 | | | 5.625% | | | | 219,000 | | | | 194,363 | |
|
SandRidge Energy, Inc. | |
03/15/21 | | | 7.500% | | | | 50,000 | | | | 14,938 | |
10/15/22 | | | 8.125% | | | | 375,000 | | | | 107,813 | |
|
W&T Offshore, Inc. | |
06/15/19 | | | 8.500% | | | | 275,000 | | | | 129,250 | |
|
Whiting Petroleum Corp. | |
03/15/21 | | | 5.750% | | | | 198,000 | | | | 177,210 | |
04/01/23 | | | 6.250% | | | | 676,000 | | | | 594,880 | |
|
Woodside Finance Ltd.(b) | |
03/05/25 | | | 3.650% | | | | 3,077,000 | | | | 2,840,471 | |
| | | | | | | | | | | | | |
Total | | | | | | | | | | | 34,288,432 | |
| | | |
| | | | | | | | | | | | |
INTEGRATED ENERGY 0.4% | |
BG Energy Capital PLC(c) | |
11/30/72 | | | 6.500% | | | | 632,000 | | | | 672,171 | |
|
BP Capital Markets PLC | |
03/11/21 | | | 4.742% | | | | 3,500,000 | | | | 3,832,591 | |
11/01/21 | | | 3.561% | | | | 2,000,000 | | | | 2,059,280 | |
03/17/22 | | | 3.062% | | | | 2,115,000 | | | | 2,099,837 | |
05/10/23 | | | 2.750% | | | | 2,670,000 | | | | 2,536,695 | |
02/10/24 | | | 3.814% | | | | 630,000 | | | | 633,733 | |
|
Cenovus Energy, Inc. | |
11/15/39 | | | 6.750% | | | | 1,332,000 | | | | 1,381,913 | |
|
Chevron Corp. | |
06/24/23 | | | 3.191% | | | | 700,000 | | | | 700,955 | |
|
Husky Energy, Inc. | |
04/15/22 | | | 3.950% | | | | 3,000,000 | | | | 2,873,112 | |
| | | | | | | | | | | | |
| Corporate Bonds & Notes(a) (continued) | |
| Issuer | | Coupon
Rate | | | Principal
Amount ($) | | | Value ($) | |
Lone Pine Resources Canada Ltd.(f)(g)(h) | |
02/15/17 | | | 10.375% | | | | 25,000 | | | | — | |
|
Pacific Exploration and Production Corp. | |
01/19/25 | | | 5.625% | | | | 200,000 | | | | 102,000 | |
|
Petro-Canada | |
05/15/38 | | | 6.800% | | | | 800,000 | | | | 976,491 | |
|
Shell International Finance BV | |
05/11/25 | | | 3.250% | | | | 915,000 | | | | 895,920 | |
05/11/45 | | | 4.375% | | | | 2,080,000 | | | | 2,063,797 | |
| | | | | | | | | | | | | |
Total | | | | | | | | | | | 20,828,495 | |
| | | |
| | | | | | | | | | | | |
LEISURE 0.1% | |
AMC Entertainment, Inc. | |
06/15/25 | | | 5.750% | | | | 122,000 | | | | 121,390 | |
|
Activision Blizzard, Inc.(b) | |
09/15/21 | | | 5.625% | | | | 295,000 | | | | 310,119 | |
09/15/23 | | | 6.125% | | | | 274,000 | | | | 294,550 | |
|
Carnival Corp. | |
10/15/20 | | | 3.950% | | | | 3,295,000 | | | | 3,431,677 | |
|
Cedar Fair LP/Canada’s Wonderland Co./Magnum Management Corp. | |
03/15/21 | | | 5.250% | | | | 452,000 | | | | 459,910 | |
06/01/24 | | | 5.375% | | | | 44,000 | | | | 44,660 | |
|
Cinemark USA, Inc. | |
12/15/22 | | | 5.125% | | | | 375,000 | | | | 375,000 | |
|
LTF Merger Sub, Inc.(b) | |
06/15/23 | | | 8.500% | | | | 119,000 | | | | 116,025 | |
|
Regal Entertainment Group | |
03/15/22 | | | 5.750% | | | | 150,000 | | | | 150,937 | |
02/01/25 | | | 5.750% | | | | 125,000 | | | | 121,250 | |
|
Six Flags Entertainment Corp.(b) | |
01/15/21 | | | 5.250% | | | | 400,000 | | | | 406,000 | |
| | | | | | | | | | | | | |
Total | | | | | | | | | | | 5,831,518 | |
| | | |
| | | | | | | | | | | | |
LIFE INSURANCE 1.4% | |
AXA SA | |
12/15/30 | | | 8.600% | | | | 1,000,000 | | | | 1,340,000 | |
|
Aflac, Inc. | |
06/15/23 | | | 3.625% | | | | 5,000,000 | | | | 5,035,815 | |
|
American International Group, Inc. | |
08/15/20 | | | 3.375% | | | | 1,000,000 | | | | 1,033,625 | |
02/15/24 | | | 4.125% | | | | 3,325,000 | | | | 3,441,295 | |
|
Five Corners Funding Trust(b) | |
11/15/23 | | | 4.419% | | | | 1,815,000 | | | | 1,876,585 | |
|
Guardian Life Insurance Co. of America (The)(b) | |
06/19/64 | | | 4.875% | | | | 1,530,000 | | | | 1,451,461 | |
|
ING Capital Funding Trust III(c) | |
12/31/49 | | | 3.882% | | | | 1,080,000 | | | | 1,065,150 | |
|
Lincoln National Corp. | |
06/24/21 | | | 4.850% | | | | 2,000,000 | | | | 2,174,078 | |
06/15/40 | | | 7.000% | | | | 2,610,000 | | | | 3,341,322 | |
The accompanying Notes to Financial Statements are an integral part of this statement.
| | |
| |
| ACTIVE PORTFOLIOS® MULTI-MANAGER CORE PLUS BOND FUND | | |
PORTFOLIO OF INVESTMENTS (continued)
August 31, 2015
| | | | | | | | | | | | |
| Corporate Bonds & Notes(a) (continued) | |
| Issuer | | Coupon
Rate | | | Principal
Amount ($) | | | Value ($) | |
Massachusetts Mutual Life Insurance Co.(b) | |
06/01/39 | | | 8.875% | | | | 5,500,000 | | | | 8,242,421 | |
04/15/65 | | | 4.500% | | | | 955,000 | | | | 861,348 | |
|
MetLife Capital Trust X(b) | |
04/08/38 | | | 9.250% | | | | 4,941,000 | | | | 6,843,285 | |
| | | |
MetLife, Inc. | | | | | | | | | | | | |
08/15/18 | | | 6.817% | | | | 3,000,000 | | | | 3,426,801 | |
08/01/39 | | | 10.750% | | | | 2,852,000 | | | | 4,514,716 | |
|
Metropolitan Life Global Funding I(b) | |
04/11/22 | | | 3.875% | | | | 4,000,000 | | | | 4,165,308 | |
|
Northwestern Mutual Life Insurance Co. (The)(b) | |
03/30/40 | | | 6.063% | | | | 2,800,000 | | | | 3,329,724 | |
|
Peachtree Corners Funding Trust(b) | |
02/15/25 | | | 3.976% | | | | 1,865,000 | | | | 1,847,021 | |
|
Pricoa Global Funding I(b) | |
05/16/19 | | | 2.200% | | | | 4,850,000 | | | | 4,862,755 | |
|
Principal Financial Group, Inc. | |
09/15/22 | | | 3.300% | | | | 1,510,000 | | | | 1,504,665 | |
05/15/23 | | | 3.125% | | | | 667,000 | | | | 651,732 | |
|
Prudential Financial, Inc. | |
09/17/15 | | | 4.750% | | | | 3,000,000 | | | | 3,005,078 | |
12/01/17 | | | 6.000% | | | | 217,000 | | | | 236,208 | |
05/15/44 | | | 4.600% | | | | 750,000 | | | | 732,739 | |
|
Prudential Financial, Inc.(c) | |
09/15/42 | | | 5.875% | | | | 2,025,000 | | | | 2,136,375 | |
|
TIAA Asset Management Finance Co. LLC(b) | |
11/01/24 | | | 4.125% | | | | 1,050,000 | | | | 1,061,362 | |
|
Teachers Insurance & Annuity Association of America(b) | |
09/15/44 | | | 4.900% | | | | 1,025,000 | | | | 1,045,865 | |
| | | | | | | | | | | | | |
Total | | | | | | | | | | | 69,226,734 | |
| | | |
| | | | | | | | | | | | |
LODGING 0.1% | |
Choice Hotels International, Inc. | |
07/01/22 | | | 5.750% | | | | 97,000 | | | | 104,275 | |
|
ESH Hospitality, Inc.(b) | |
05/01/25 | | | 5.250% | | | | 150,000 | | | | 145,500 | |
|
Hilton Worldwide Finance LLC/Corp. | |
10/15/21 | | | 5.625% | | | | 439,000 | | | | 457,657 | |
|
Host Hotels & Resorts LP | |
06/15/25 | | | 4.000% | | | | 1,050,000 | | | | 1,020,899 | |
|
Hyatt Hotels Corp. | |
07/15/23 | | | 3.375% | | | | 1,350,000 | | | | 1,311,834 | |
|
Playa Resorts Holding BV(b) | |
08/15/20 | | | 8.000% | | | | 137,000 | | | | 138,713 | |
|
RHP Hotel Properties LP/Finance Corp.(b) | |
04/15/23 | | | 5.000% | | | | 143,000 | | | | 141,570 | |
| | | | | | | | | | | | | |
Total | | | | | | | | | | | 3,320,448 | |
| | | |
| | | | | | | | | | | | |
MEDIA AND ENTERTAINMENT 1.0% | |
21st Century Fox America, Inc. | |
08/15/20 | | | 5.650% | | | | 1,760,000 | | | | 1,988,374 | |
| | | | | | | | | | | | |
| Corporate Bonds & Notes(a) (continued) | |
| Issuer | | Coupon
Rate | | | Principal
Amount ($) | | | Value ($) | |
03/15/33 | | | 6.550% | | | | 1,000,000 | | | | 1,198,817 | |
01/09/38 | | | 6.750% | | | | 220,000 | | | | 270,579 | |
|
AMC Networks, Inc. | |
12/15/22 | | | 4.750% | | | | 575,000 | | | | 566,720 | |
|
CBS Corp. | |
08/15/44 | | | 4.900% | | | | 1,100,000 | | | | 972,871 | |
|
Clear Channel Worldwide Holdings, Inc. | |
11/15/22 | | | 6.500% | | | | 1,019,000 | | | | 1,052,627 | |
|
Cumulus Media Holdings, Inc. | |
05/01/19 | | | 7.750% | | | | 150,000 | | | | 124,500 | |
|
Entercom Radio LLC | |
12/01/19 | | | 10.500% | | | | 275,000 | | | | 291,156 | |
|
Expo Event Transco, Inc.(b) | |
06/15/21 | | | 9.000% | | | | 375,000 | | | | 377,813 | |
|
Gray Television, Inc. | |
10/01/20 | | | 7.500% | | | | 400,000 | | | | 413,620 | |
|
Grupo Televisa SAB | |
05/13/45 | | | 5.000% | | | | 2,100,000 | | | | 1,947,792 | |
|
IAC/InterActiveCorp | |
12/15/22 | | | 4.750% | | | | 425,000 | | | | 395,250 | |
|
Interpublic Group of Companies, Inc. (The) | |
11/15/17 | | | 2.250% | | | | 1,500,000 | | | | 1,502,452 | |
03/15/22 | | | 4.000% | | | | 1,605,000 | | | | 1,616,919 | |
02/15/23 | | | 3.750% | | | | 2,000,000 | | | | 1,945,176 | |
|
Lamar Media Corp. | |
05/01/23 | | | 5.000% | | | | 375,000 | | | | 372,188 | |
01/15/24 | | | 5.375% | | | | 125,000 | | | | 127,500 | |
|
MDC Partners, Inc.(b) | |
04/01/20 | | | 6.750% | | | | 274,000 | | | | 271,603 | |
|
McGraw Hill Financial, Inc.(b) | |
06/15/25 | | | 4.000% | | | | 690,000 | | | | 667,942 | |
02/15/26 | | | 4.400% | | | | 1,320,000 | | | | 1,312,760 | |
|
Media General Financing Sub, Inc.(b) | |
11/15/22 | | | 5.875% | | | | 300,000 | | | | 298,500 | |
|
Netflix, Inc.(b) | |
02/15/22 | | | 5.500% | | | | 191,000 | | | | 195,775 | |
02/15/25 | | | 5.875% | | | | 321,000 | | | | 333,439 | |
|
Nexstar Broadcasting, Inc.(b) | |
02/15/22 | | | 6.125% | | | | 275,000 | | | | 277,063 | |
|
Nielsen Finance Co. SARL (The)(b) | |
10/01/21 | | | 5.500% | | | | 194,000 | | | | 196,910 | |
|
Nielsen Finance LLC/Co. | |
10/01/20 | | | 4.500% | | | | 425,000 | | | | 431,906 | |
|
Nielsen Finance LLC/Co.(b) | |
04/15/22 | | | 5.000% | | | | 425,000 | | | | 419,156 | |
|
Omnicom Group, Inc. | |
05/01/22 | | | 3.625% | | | | 3,000,000 | | | | 2,971,059 | |
|
Outfront Media Capital LLC/Corp. | |
02/15/22 | | | 5.250% | | | | 125,000 | | | | 125,938 | |
02/15/24 | | | 5.625% | | | | 100,000 | | | | 102,375 | |
03/15/25 | | | 5.875% | | | | 499,000 | | | | 507,732 | |
The accompanying Notes to Financial Statements are an integral part of this statement.
| | |
| |
| | ACTIVE PORTFOLIOS® MULTI-MANAGER CORE PLUS BOND FUND |
PORTFOLIO OF INVESTMENTS (continued)
August 31, 2015
| | | | | | | | | | | | |
| Corporate Bonds & Notes(a) (continued) | |
| Issuer | | Coupon
Rate | | | Principal
Amount ($) | | | Value ($) | |
Outfront Media Capital LLC/Corp.(b) | |
02/15/24 | | | 5.625% | | | | 18,000 | | | | 18,540 | |
|
Pearson Funding Five PLC(b) | |
05/08/23 | | | 3.250% | | | | 480,000 | | | | 459,432 | |
|
Pearson Funding Two PLC(b) | |
05/17/16 | | | 4.000% | | | | 1,200,000 | | | | 1,223,462 | |
|
Radio One, Inc.(b) | |
02/15/20 | | | 9.250% | | | | 275,000 | | | | 248,188 | |
04/15/22 | | | 7.375% | | | | 250,000 | | | | 240,625 | |
|
Scripps Networks Interactive, Inc. | |
06/15/22 | | | 3.500% | | | | 2,915,000 | | | | 2,859,988 | |
06/15/25 | | | 3.950% | | | | 177,000 | | | | 172,557 | |
|
Sinclair Television Group, Inc. | |
10/01/22 | | | 6.125% | | | | 75,000 | | | | 75,375 | |
|
Sinclair Television Group, Inc.(b) | |
08/01/24 | | | 5.625% | | | | 525,000 | | | | 499,406 | |
|
Sky PLC(b) | |
11/26/22 | | | 3.125% | | | | 488,000 | | | | 465,822 | |
09/16/24 | | | 3.750% | | | | 5,733,000 | | | | 5,515,324 | |
|
Southern Graphics, Inc.(b) | |
10/15/20 | | | 8.375% | | | | 500,000 | | | | 501,250 | |
|
TEGNA, Inc. | |
10/15/23 | | | 6.375% | | | | 450,000 | | | | 471,375 | |
|
TEGNA, Inc.(b) | |
09/15/24 | | | 5.500% | | | | 75,000 | | | | 74,250 | |
|
Thomson Reuters Corp. | |
09/29/24 | | | 3.850% | | | | 2,049,000 | | | | 2,016,493 | |
|
Time Warner, Inc. | |
03/29/41 | | | 6.250% | | | | 2,280,000 | | | | 2,575,545 | |
|
Time, Inc.(b) | |
04/15/22 | | | 5.750% | | | | 300,000 | | | | 286,500 | |
|
Townsquare Media, Inc.(b) | |
04/01/23 | | | 6.500% | | | | 275,000 | | | | 265,375 | |
|
Tribune Media Co.(b) | |
07/15/22 | | | 5.875% | | | | 400,000 | | | | 403,000 | |
|
Univision Communications, Inc.(b) | |
09/15/22 | | | 6.750% | | | | 130,000 | | | | 137,475 | |
05/15/23 | | | 5.125% | | | | 368,000 | | | | 362,480 | |
02/15/25 | | | 5.125% | | | | 242,000 | | | | 234,740 | |
|
Viacom, Inc. | |
04/01/17 | | | 3.500% | | | | 1,500,000 | | | | 1,530,582 | |
04/01/19 | | | 2.200% | | | | 455,000 | | | | 442,412 | |
09/01/23 | | | 4.250% | | | | 2,410,000 | | | | 2,293,238 | |
|
WPP Finance 2010 | |
09/07/42 | | | 5.125% | | | | 2,500,000 | | | | 2,423,147 | |
|
Walt Disney Co. (The) | |
05/30/19 | | | 1.850% | | | | 1,500,000 | | | | 1,499,643 | |
|
iHeartCommunications, Inc. | |
03/01/21 | | | 9.000% | | | | 490,000 | | | | 434,262 | |
03/15/23 | | | 10.625% | | | | 183,000 | | | | 164,243 | |
| | | | | | | | | | | | | |
Total | | | | | | | | | | | 51,171,241 | |
| | | |
| | | | | | | | | | | | |
| | | | | | | | | | | | |
| Corporate Bonds & Notes(a) (continued) | |
| Issuer | | Coupon
Rate | | | Principal
Amount ($) | | | Value ($) | |
METALS 0.7% | |
ABJA Investment Co. Pte Ltd. | |
07/31/24 | | | 5.950% | | | | 200,000 | | | | 187,040 | |
| | | |
Alcoa, Inc. | | | | | | | | | | | | |
04/15/21 | | | 5.400% | | | | 2,250,000 | | | | 2,317,500 | |
|
Allegheny Technologies, Inc. | |
06/01/19 | | | 9.375% | | | | 1,470,000 | | | | 1,576,575 | |
|
Anglo American Capital PLC(b) | |
04/03/17 | | | 2.625% | | | | 2,000,000 | | | | 1,965,926 | |
|
AngloGold Ashanti Holdings PLC | |
07/30/20 | | | 8.500% | | | | 2,230,000 | | | | 2,352,650 | |
04/15/40 | | | 6.500% | | | | 1,010,000 | | | | 794,112 | |
|
ArcelorMittal | |
08/05/20 | | | 6.000% | | | | 5,000,000 | | | | 4,975,000 | |
03/01/21 | | | 6.250% | | | | 180,000 | | | | 177,525 | |
02/25/22 | | | 7.000% | | | | 137,000 | | | | 137,000 | |
06/01/25 | | | 6.125% | | | | 200,000 | | | | 184,500 | |
10/15/39 | | | 7.750% | | | | 171,000 | | | | 158,603 | |
03/01/41 | | | 7.500% | | | | 1,050,000 | | | | 963,375 | |
|
Barrick Gold Corp. | |
05/01/23 | | | 4.100% | | | | 2,630,000 | | | | 2,325,643 | |
|
Carpenter Technology Corp. | |
03/01/23 | | | 4.450% | | | | 2,000,000 | | | | 1,956,306 | |
|
China Hongqiao Group Ltd. | |
06/26/17 | | | 7.625% | | | | 300,000 | | | | 296,880 | |
|
FMG Resources August 2006 Proprietary Ltd.(b) | |
03/01/22 | | | 9.750% | | | | 95,000 | | | | 86,806 | |
|
GTL Trade Finance, Inc. | |
10/20/17 | | | 7.250% | | | | 200,000 | | | | 208,600 | |
|
Gerdau Trade, Inc.(b) | |
01/30/21 | | | 5.750% | | | | 1,500,000 | | | | 1,401,000 | |
|
Hyundai Steel Co.(b) | |
04/21/16 | | | 4.625% | | | | 1,000,000 | | | | 1,017,918 | |
|
Newcrest Finance Pty Ltd.(b) | |
10/01/22 | | | 4.200% | | | | 1,000,000 | | | | 886,741 | |
|
Newmont Mining Corp. | |
10/01/19 | | | 5.125% | | | | 300,000 | | | | 317,550 | |
|
Reliance Steel & Aluminum Co. | |
04/15/23 | | | 4.500% | | | | 1,500,000 | | | | 1,477,488 | |
|
Rio Tinto Finance USA Ltd. | |
07/15/18 | | | 6.500% | | | | 1,580,000 | | | | 1,758,189 | |
|
Samarco Mineracao SA(b) | |
11/01/22 | | | 4.125% | | | | 200,000 | | | | 172,000 | |
|
Southern Copper Corp. | |
04/23/25 | | | 3.875% | | | | 700,000 | | | | 667,429 | |
|
Steel Dynamics, Inc. | |
10/01/21 | | | 5.125% | | | | 75,000 | | | | 73,538 | |
08/15/22 | | | 6.375% | | | | 50,000 | | | | 51,625 | |
10/01/24 | | | 5.500% | | | | 275,000 | | | | 267,094 | |
|
Teck Resources Ltd. | |
02/01/18 | | | 2.500% | | | | 2,859,000 | | | | 2,444,445 | |
The accompanying Notes to Financial Statements are an integral part of this statement.
| | |
| |
| ACTIVE PORTFOLIOS® MULTI-MANAGER CORE PLUS BOND FUND | | |
PORTFOLIO OF INVESTMENTS (continued)
August 31, 2015
| | | | | | | | | | | | |
| Corporate Bonds & Notes(a) (continued) | |
| Issuer | | Coupon
Rate | | | Principal
Amount ($) | | | Value ($) | |
Vale Overseas Ltd. | |
01/11/22 | | | 4.375% | | | | 1,093,000 | | | | 1,013,539 | |
|
Wise Metals Intermediate Holdings LLC/Finance Corp.(b) | |
06/15/19 | | | 9.750% | | | | 175,000 | | | | 161,000 | |
|
Worthington Industries, Inc. | |
04/15/20 | | | 6.500% | | | | 1,240,000 | | | | 1,403,772 | |
04/15/26 | | | 4.550% | | | | 1,840,000 | | | | 1,811,452 | |
| | | | | | | | | | | | | |
Total | | | | | | | | | | | 35,588,821 | |
| | | |
| | | | | | | | | | | | |
MIDSTREAM 1.8% | |
Blue Racer Midstream LLC/Finance Corp.(b) | |
11/15/22 | | | 6.125% | | | | 472,000 | | | | 462,560 | |
|
Boardwalk Pipeline Partners LP | |
02/01/23 | | | 3.375% | | | | 2,000,000 | | | | 1,738,488 | |
|
Columbia Pipeline Group, Inc.(b) | |
06/01/25 | | | 4.500% | | | | 4,210,000 | | | | 4,017,405 | |
06/01/45 | | | 5.800% | | | | 1,120,000 | | | | 1,075,520 | |
|
Crestwood Midstream Partners LP/Finance Corp. | |
12/15/20 | | | 6.000% | | | | 144,000 | | | | 136,080 | |
03/01/22 | | | 6.125% | | | | 54,000 | | | | 49,140 | |
|
Crestwood Midstream Partners LP/Finance Corp.(b) | |
04/01/23 | | | 6.250% | | | | 497,000 | | | | 449,785 | |
|
Energy Transfer Equity LP | |
01/15/24 | | | 5.875% | | | | 1,114,000 | | | | 1,075,010 | |
06/01/27 | | | 5.500% | | | | 946,000 | | | | 879,780 | |
|
Energy Transfer Partners LP | |
06/15/18 | | | 2.500% | | | | 2,056,000 | | | | 2,041,853 | |
02/01/23 | | | 3.600% | | | | 1,000,000 | | | | 902,708 | |
02/01/24 | | | 4.900% | | | | 4,950,000 | | | | 4,838,872 | |
01/15/26 | | | 4.750% | | | | 1,000,000 | | | | 948,699 | |
10/01/43 | | | 5.950% | | | | 3,500,000 | | | | 3,264,793 | |
|
Enterprise Products Operating LLC | |
02/15/25 | | | 3.750% | | | | 1,055,000 | | | | 1,008,919 | |
|
Ferrellgas Partners LP/Finance Corp. | |
05/01/21 | | | 6.500% | | | | 275,000 | | | | 264,000 | |
01/15/22 | | | 6.750% | | | | 150,000 | | | | 144,750 | |
|
Ferrellgas Partners LP/Finance Corp(b) | |
06/15/23 | | | 6.750% | | | | 200,000 | | | | 192,000 | |
|
Florida Gas Transmission Co. LLC(b) | |
07/15/22 | | | 3.875% | | | | 2,250,000 | | | | 2,250,565 | |
|
Hiland Partners LP/Finance Corp.(b) | |
05/15/22 | | | 5.500% | | | | 350,000 | | | | 356,125 | |
|
Holly Energy Partners LP/Finance Corp. | |
03/01/20 | | | 6.500% | | | | 325,000 | | | | 308,809 | |
|
Kinder Morgan Energy Partners LP | |
03/01/21 | | | 3.500% | | | | 1,675,000 | | | | 1,597,027 | |
10/01/21 | | | 5.000% | | | | 2,723,000 | | | | 2,785,855 | |
09/01/22 | | | 3.950% | | | | 7,750,000 | | | | 7,226,441 | |
|
Kinder Morgan, Inc. | |
06/01/18 | | | 7.250% | | | | 390,000 | | | | 430,819 | |
|
Kinder Morgan, Inc.(b) | |
11/15/23 | | | 5.625% | | | | 866,000 | | | | 872,702 | |
| | | | | | | | | | | | |
| Corporate Bonds & Notes(a) (continued) | |
| Issuer | | Coupon
Rate | | | Principal
Amount ($) | | | Value ($) | |
MarkWest Energy Partners LP/Finance Corp. | |
02/15/23 | | | 5.500% | | | | 164,000 | | | | 160,720 | |
07/15/23 | | | 4.500% | | | | 378,000 | | | | 349,650 | |
12/01/24 | | | 4.875% | | | | 477,000 | | | | 442,417 | |
06/01/25 | | | 4.875% | | | | 200,000 | | | | 185,000 | |
|
NiSource Finance Corp. | |
02/15/23 | | | 3.850% | | | | 1,175,000 | | | | 1,217,464 | |
12/15/40 | | | 6.250% | | | | 1,866,000 | | | | 2,277,485 | |
|
Plains All American Pipeline LP/Finance Corp. | |
10/15/25 | | | 4.650% | | | | 2,160,000 | | | | 2,173,746 | |
|
Regency Energy Partners LP/Finance Corp. | |
10/01/22 | | | 5.000% | | | | 125,000 | | | | 122,452 | |
11/01/23 | | | 4.500% | | | | 350,000 | | | | 324,772 | |
|
Regency Energy Partners LP/Regency Energy Finance Corp. | |
07/15/21 | | | 6.500% | | | | 59,000 | | | | 60,918 | |
|
Rockies Express Pipeline LLC(b) | |
01/15/19 | | | 6.000% | | | | 1,000,000 | | | | 1,000,000 | |
04/15/20 | | | 5.625% | | | | 2,800,000 | | | | 2,702,000 | |
|
Rose Rock Midstream LP/Finance Corp. | |
07/15/22 | | | 5.625% | | | | 350,000 | | | | 318,500 | |
|
Rose Rock Midstream LP/Finance Corp.(b) | |
11/15/23 | | | 5.625% | | | | 299,000 | | | | 267,605 | |
|
Ruby Pipeline LLC(b) | |
04/01/22 | | | 6.000% | | | | 3,000,000 | | | | 3,230,994 | |
|
Sabine Pass LNG LP | |
| | | |
11/30/16 | | | 7.500% | | | | 4,000,000 | | | | 4,120,000 | |
|
Sabine Pass Liquefaction LLC | |
02/01/21 | | | 5.625% | | | | 825,000 | | | | 812,625 | |
|
Sabine Pass Liquefaction LLC(b) | |
03/01/25 | | | 5.625% | | | | 540,000 | | | | 522,112 | |
|
Southeast Supply Header LLC(b) | |
06/15/24 | | | 4.250% | | | | 450,000 | | | | 435,531 | |
|
Southern Natural Gas Co. LLC | |
02/15/31 | | | 7.350% | | | | 2,910,000 | | | | 3,226,797 | |
03/01/32 | | | 8.000% | | | | 1,102,000 | | | | 1,296,223 | |
|
Spectra Energy Capital LLC | |
02/15/32 | | | 6.750% | | | | 1,740,000 | | | | 1,880,315 | |
|
Suburban Propane Partners LP/Energy Finance Corp. | |
08/01/21 | | | 7.375% | | | | 386,000 | | | | 403,370 | |
03/01/25 | | | 5.750% | | | | 225,000 | | | | 215,438 | |
|
Summit Midstream Holdings LLC/Finance Corp. | |
08/15/22 | | | 5.500% | | | | 375,000 | | | | 331,875 | |
|
Targa Pipeline Partners LP/Finance Corp. | |
08/01/23 | | | 5.875% | | | | 100,000 | | | | 97,500 | |
|
Targa Resources Partners LP/Finance Corp. | |
05/01/23 | | | 5.250% | | | | 181,000 | | | | 170,140 | |
11/15/23 | | | 4.250% | | | | 353,000 | | | | 308,875 | |
|
Targa Resources Partners LP/Finance Corp.(b) | |
01/15/18 | | | 5.000% | | | | 320,000 | | | | 316,800 | |
11/15/19 | | | 4.125% | | | | 71,000 | | | | 66,918 | |
|
Tennessee Gas Pipeline Co. LLC | |
06/15/32 | | | 8.375% | | | | 3,465,000 | | | | 4,008,409 | |
04/01/37 | | | 7.625% | | | | 550,000 | | | | 605,348 | |
The accompanying Notes to Financial Statements are an integral part of this statement.
| | |
| |
| | ACTIVE PORTFOLIOS® MULTI-MANAGER CORE PLUS BOND FUND |
PORTFOLIO OF INVESTMENTS (continued)
August 31, 2015
| | | | | | | | | | | | |
| Corporate Bonds & Notes(a) (continued) | |
| Issuer | | Coupon
Rate | | | Principal
Amount ($) | | | Value ($) | |
Tesoro Logistics LP/Finance Corp. | |
10/01/20 | | | 5.875% | | | | 198,000 | | | | 198,495 | |
10/15/21 | | | 6.125% | | | | 300,000 | | | | 300,750 | |
|
Tesoro Logistics LP/Finance Corp.(b) | |
10/15/19 | | | 5.500% | | | | 27,000 | | | | 27,270 | |
10/15/22 | | | 6.250% | | | | 281,000 | | | | 281,000 | |
|
Texas Eastern Transmission LP(b) | |
10/15/22 | | | 2.800% | | | | 3,350,000 | | | | 3,101,065 | |
|
Williams Companies, Inc. (The) | |
01/15/23 | | | 3.700% | | | | 3,614,000 | | | | 3,133,923 | |
06/24/24 | | | 4.550% | | | | 1,679,000 | | | | 1,487,628 | |
|
Williams Partners LP/ACMP Finance Corp. | |
07/15/22 | | | 6.125% | | | | 325,000 | | | | 331,294 | |
05/15/23 | | | 4.875% | | | | 6,339,000 | | | | 5,971,211 | |
03/15/24 | | | 4.875% | | | | 75,000 | | | | 69,933 | |
|
Williams Partners LP | |
11/15/20 | | | 4.125% | | | | 1,000,000 | | | | 1,016,980 | |
01/15/25 | | | 3.900% | | | | 800,000 | | | | 711,532 | |
09/15/45 | | | 5.100% | | | | 1,055,000 | | | | 863,168 | |
| | | | | | | | | | | | | |
Total | | | | | | | | | | | 90,464,953 | |
| | | |
| | | | | | | | | | | | |
NATURAL GAS 0.2% | |
Atmos Energy Corp. | |
10/15/44 | | | 4.125% | | | | 2,045,000 | | | | 1,958,202 | |
|
National Fuel Gas Co. | |
03/01/23 | | | 3.750% | | | | 1,730,000 | | | | 1,615,498 | |
|
Sempra Energy | |
02/15/19 | | | 9.800% | | | | 1,000,000 | | | | 1,240,103 | |
10/01/22 | | | 2.875% | | | | 5,540,000 | | | | 5,308,688 | |
06/15/24 | | | 3.550% | | | | 1,500,000 | | | | 1,480,778 | |
| | | | | | | | | | | | | |
Total | | | | | | | | | | | 11,603,269 | |
| | | |
| | | | | | | | | | | | |
OFFICE REIT 0.4% | |
Boston Properties LP | | | | | | | | | | | | |
11/15/20 | | | 5.625% | | | | 4,590,000 | | | | 5,197,578 | |
02/01/23 | | | 3.850% | | | | 2,500,000 | | | | 2,540,688 | |
02/01/24 | | | 3.800% | | | | 1,355,000 | | | | 1,364,397 | |
| | | |
Highwoods Realty LP | | | | | | | | | | | | |
03/15/17 | | | 5.850% | | | | 3,069,000 | | | | 3,247,070 | |
| | | |
Kilroy Realty LP | | | | | | | | | | | | |
11/03/15 | | | 5.000% | | | | 1,510,000 | | | | 1,519,359 | |
| | | |
SL Green Realty Corp. | | | | | | | | | | | | |
08/15/18 | | | 5.000% | | | | 6,935,000 | | | | 7,398,008 | |
| | | | | | | | | | | | | |
Total | | | | | | | | | | | 21,267,100 | |
| | | |
| | | | | | | | | | | | |
OIL FIELD SERVICES 0.4% | |
FTS International, Inc. | | | | | | | | | | | | |
05/01/22 | | | 6.250% | | | | 200,000 | | | | 75,000 | |
|
Nabors Industries, Inc. | |
09/15/21 | | | 4.625% | | | | 3,250,000 | | | | 3,111,128 | |
| | | | | | | | | | | | |
| Corporate Bonds & Notes(a) (continued) | |
| Issuer | | Coupon
Rate | | | Principal
Amount ($) | | | Value ($) | |
Noble Holding International Ltd. | |
03/15/17 | | | 2.500% | | | | 5,448,000 | | | | 5,172,996 | |
03/16/18 | | | 4.000% | | | | 3,019,000 | | | | 2,981,462 | |
08/01/20 | | | 4.900% | | | | 700,000 | | | | 643,124 | |
03/01/21 | | | 4.625% | | | | 2,068,000 | | | | 1,790,956 | |
03/15/22 | | | 3.950% | | | | 837,000 | | | | 680,073 | |
04/01/25 | | | 5.950% | | | | 1,825,000 | | | | 1,610,938 | |
04/01/45 | | | 6.950% | | | | 1,190,000 | | | | 965,423 | |
|
Schlumberger Investment SA | |
12/01/23 | | | 3.650% | | | | 1,016,000 | | | | 1,036,490 | |
|
Weatherford International Ltd. | |
03/15/18 | | | 6.000% | | | | 1,000,000 | | | | 1,010,384 | |
03/01/39 | | | 9.875% | | | | 940,000 | | | | 1,015,820 | |
|
Western Refining Logistics LP/Finance Corp. | |
02/15/23 | | | 7.500% | | | | 200,000 | | | | 202,000 | |
| | | | | | | | | | | | | |
Total | | | | | | | | | | | 20,295,794 | |
| | | |
| | | | | | | | | | | | |
OTHER FINANCIAL INSTITUTIONS —% | |
Icahn Enterprises LP/Finance Corp. | |
08/01/20 | | | 6.000% | | | | 144,000 | | | | 149,018 | |
|
PT Perusahaan Gas Negara Persero Tbk(b) | |
05/16/24 | | | 5.125% | | | | 1,050,000 | | | | 1,017,240 | |
| | | | | | | | | | | | | |
Total | | | | | | | | | | | 1,166,258 | |
| | | |
| | | | | | | | | | | | |
OTHER INDUSTRY 0.6% | |
Anixter, Inc. | | | | | | | | | | | | |
05/01/19 | | | 5.625% | | | | 375,000 | | | | 392,813 | |
|
Anixter, Inc.(b) | |
03/01/23 | | | 5.500% | | | | 75,000 | | | | 75,000 | |
|
Belden, Inc.(b) | |
09/01/22 | | | 5.500% | | | | 275,000 | | | | 270,875 | |
07/15/24 | | | 5.250% | | | | 250,000 | | | | 236,875 | |
|
Board of Trustees of the Leland Stanford Junior University (The) | |
05/01/47 | | | 3.460% | | | | 4,660,000 | | | | 4,355,599 | |
|
CB Richard Ellis Services, Inc. | |
03/15/25 | | | 5.250% | | | | 73,000 | | | | 74,885 | |
|
CBRE Services, Inc. | |
03/15/23 | | | 5.000% | | | | 175,000 | | | | 176,667 | |
|
Cleaver-Brooks, Inc.(b) | |
12/15/19 | | | 8.750% | | | | 300,000 | | | | 288,375 | |
|
DH Services Luxembourg SARL(b) | |
12/15/20 | | | 7.750% | | | | 425,000 | | | | 433,500 | |
|
Hillman Group, Inc. (The)(b) | |
07/15/22 | | | 6.375% | | | | 350,000 | | | | 328,125 | |
|
Hutchison Whampoa International 11 Ltd.(b) | |
01/13/17 | | | 3.500% | | | | 1,000,000 | | | | 1,025,155 | |
01/13/22 | | | 4.625% | | | | 1,500,000 | | | | 1,602,446 | |
The accompanying Notes to Financial Statements are an integral part of this statement.
| | |
| |
| ACTIVE PORTFOLIOS® MULTI-MANAGER CORE PLUS BOND FUND | | |
PORTFOLIO OF INVESTMENTS (continued)
August 31, 2015
| | | | | | | | | | | | |
| Corporate Bonds & Notes(a) (continued) | |
| Issuer | | Coupon
Rate | | | Principal
Amount ($) | | | Value ($) | |
Massachusetts Institute of Technology | |
07/01/14 | | | 4.678% | | | | 2,990,000 | | | | 3,113,702 | |
|
Milacron LLC/Finance Corp(b) | |
02/15/21 | | | 7.750% | | | | 175,000 | | | | 179,375 | |
|
Northwestern University | |
12/01/38 | | | 3.688% | | | | 3,770,000 | | | | 3,628,591 | |
|
President and Fellows of Harvard College | |
10/15/40 | | | 4.875% | | | | 1,620,000 | | | | 1,891,015 | |
|
President and Fellows of Harvard College(b) | |
01/15/39 | | | 6.500% | | | | 3,180,000 | | | | 4,383,754 | |
|
Unifrax I LLC/Holding Co.(b) | |
02/15/19 | | | 7.500% | | | | 375,000 | | | | 375,938 | |
|
University of Notre Dame du Lac | |
02/15/45 | | | 3.438% | | | | 7,835,000 | | | | 7,294,314 | |
| | | | | | | | | | | | | |
Total | | | | | | | | | | | 30,127,004 | |
| | | |
| | | | | | | | | | | | |
OTHER REIT 0.2% | |
CyrusOne LP/Finance Corp. | |
11/15/22 | | | 6.375% | | | | 157,000 | | | | 160,532 | |
|
Duke Realty LP | |
06/15/22 | | | 4.375% | | | | 1,855,000 | | | | 1,920,409 | |
|
Liberty Property LP | |
06/15/23 | | | 3.375% | | | | 2,500,000 | | | | 2,408,405 | |
|
MAF Global Securities Ltd.(c) | |
12/31/49 | | | 7.125% | | | | 200,000 | | | | 212,700 | |
| | | |
ProLogis LP | | | | | | | | | | | | |
03/15/20 | | | 6.875% | | | | 902,000 | | | | 1,042,460 | |
02/01/21 | | | 3.350% | | | | 1,000,000 | | | | 1,000,622 | |
08/15/23 | | | 4.250% | | | | 1,600,000 | | | | 1,643,138 | |
| | | |
Trust F/1401 | | | | | | | | | | | | |
12/15/24 | | | 5.250% | | | | 200,000 | | | | 208,500 | |
|
WP Carey, Inc. | |
04/01/24 | | | 4.600% | | | | 1,725,000 | | | | 1,741,900 | |
| | | | | | | | | | | | | |
Total | | | | | | | | | | | 10,338,666 | |
| | | |
| | | | | | | | | | | | |
PACKAGING 0.2% | |
Ardagh Packaging Finance PLC/Holdings USA, Inc.(b) | |
01/31/21 | | | 6.750% | | | | 344,000 | | | | 350,880 | |
06/30/21 | | | 6.000% | | | | 100,000 | | | | 99,230 | |
|
Ardagh Packaging Finance PLC/MP Holdings U.S.A., Inc.(b) | |
11/15/20 | | | 7.000% | | | | 52,941 | | | | 53,471 | |
|
Ardagh Packaging Finance PLC(b) | |
10/15/20 | | | 9.125% | | | | 500,000 | | | | 525,000 | |
|
BWAY Holding Co.(b) | |
08/15/21 | | | 9.125% | | | | 550,000 | | | | 556,875 | |
| | | | | | | | | | | | |
| Corporate Bonds & Notes(a) (continued) | |
| Issuer | | Coupon
Rate | | | Principal
Amount ($) | | | Value ($) | |
Ball Corp. | |
11/15/23 | | | 4.000% | | | | 475,000 | | | | 447,688 | |
07/01/25 | | | 5.250% | | | | 250,000 | | | | 248,750 | |
|
Berry Plastics Corp. | |
05/15/22 | | | 5.500% | | | | 785,000 | | | | 759,487 | |
07/15/23 | | | 5.125% | | | | 200,000 | | | | 187,000 | |
|
Beverage Packaging Holdings (Luxembourg) II SA(b) | |
12/15/16 | | | 5.625% | | | | 34,000 | | | | 33,830 | |
06/15/17 | | | 6.000% | | | | 4,000 | | | | 3,980 | |
|
Crown Americas LLC/Capital Corp. IV | |
01/15/23 | | | 4.500% | | | | 475,000 | | | | 464,906 | |
|
Mustang Merger Corp.(b) | |
08/15/21 | | | 8.500% | | | | 325,000 | | | | 339,625 | |
|
Owens-Brockway Glass Container, Inc.(b) | |
01/15/22 | | | 5.000% | | | | 50,000 | | | | 49,250 | |
08/15/23 | | | 5.875% | | | | 100,000 | | | | 101,750 | |
01/15/25 | | | 5.375% | | | | 350,000 | | | | 338,625 | |
08/15/25 | | | 6.375% | | | | 100,000 | | | | 102,250 | |
|
Plastipak Holdings, Inc.(b) | |
10/01/21 | | | 6.500% | | | | 170,000 | | | | 166,600 | |
|
Reynolds Group Issuer, Inc./LLC | |
10/15/20 | | | 5.750% | | | | 1,115,000 | | | | 1,149,844 | |
02/15/21 | | | 8.250% | | | | 763,000 | | | | 784,936 | |
|
Sealed Air Corp.(b) | |
12/01/22 | | | 4.875% | | | | 325,000 | | | | 325,000 | |
04/01/23 | | | 5.250% | | | | 50,000 | | | | 51,125 | |
12/01/24 | | | 5.125% | | | | 275,000 | | | | 278,264 | |
09/15/25 | | | 5.500% | | | | 175,000 | | | | 180,688 | |
|
Signode Industrial Group Luxembourg SA/US, Inc.(b) | |
05/01/22 | | | 6.375% | | | | 765,000 | | | | 738,225 | |
|
Sonoco Products Co. | |
11/01/40 | | | 5.750% | | | | 1,000,000 | | | | 1,103,111 | |
| | | | | | | | | | | | | |
Total | | | | | | | | | | | 9,440,390 | |
| | | |
| | | | | | | | | | | | |
PAPER 0.1% | |
Clearwater Paper Corp. | | | | | | | | | | | | |
02/01/23 | | | 4.500% | | | | 150,000 | | | | 142,500 | |
|
Clearwater Paper Corp.(b) | |
02/01/25 | | | 5.375% | | | | 325,000 | | | | 317,688 | |
|
Graphic Packaging International, Inc. | |
04/15/21 | | | 4.750% | | | | 275,000 | | | | 279,125 | |
|
Packaging Corp. of America | |
11/01/23 | | | 4.500% | | | | 1,070,000 | | | | 1,112,880 | |
|
Plum Creek Timberlands LP | |
03/15/23 | | | 3.250% | | | | 1,630,000 | | | | 1,568,891 | |
|
Weyerhaeuser Co. | |
10/01/19 | | | 7.375% | | | | 1,000,000 | | | | 1,173,224 | |
03/15/32 | | | 7.375% | | | | 1,630,000 | | | | 2,045,834 | |
| | | | | | | | | | | | | |
Total | | | | | | | | | | | 6,640,142 | |
| | | |
| | | | | | | | | | | | |
The accompanying Notes to Financial Statements are an integral part of this statement.
| | |
| |
| | ACTIVE PORTFOLIOS® MULTI-MANAGER CORE PLUS BOND FUND |
PORTFOLIO OF INVESTMENTS (continued)
August 31, 2015
| | | | | | | | | | | | |
| Corporate Bonds & Notes(a) (continued) | |
| Issuer | | Coupon
Rate | | | Principal
Amount ($) | | | Value ($) | |
PHARMACEUTICALS 0.8% | |
AMAG Pharmaceuticals, Inc.(b) | |
09/01/23 | | | 7.875% | | | | 273,000 | | | | 279,484 | |
|
AbbVie, Inc. | |
11/06/15 | | | 1.200% | | | | 4,000,000 | | | | 4,002,864 | |
05/14/20 | | | 2.500% | | | | 1,200,000 | | | | 1,186,396 | |
05/14/25 | | | 3.600% | | | | 400,000 | | | | 393,789 | |
|
Actavis Funding SCS | |
03/15/22 | | | 3.450% | | | | 3,836,000 | | | | 3,747,975 | |
|
Actavis Funding SCS(c) | |
09/01/16 | | | 1.199% | | | | 920,000 | | | | 919,574 | |
|
Amgen, Inc. | |
05/01/45 | | | 4.400% | | | | 2,975,000 | | | | 2,773,711 | |
|
Bayer US Finance LLC(b) | |
10/08/19 | | | 2.375% | | | | 1,310,000 | | | | 1,316,078 | |
10/08/24 | | | 3.375% | | | | 520,000 | | | | 516,470 | |
|
Celgene Corp. | |
08/15/25 | | | 3.875% | | | | 690,000 | | | | 685,741 | |
08/15/45 | | | 5.000% | | | | 3,495,000 | | | | 3,526,787 | |
|
Concordia Healthcare Corp.(b) | |
04/15/23 | | | 7.000% | | | | 77,000 | | | | 79,510 | |
|
Endo Finance LLC/Finco, Inc.(b) | |
02/01/25 | | | 6.000% | | | | 636,000 | | | | 653,490 | |
|
Endo Finance LLC/Ltd./Finco, Inc.(b) | |
07/15/23 | | | 6.000% | | | | 456,000 | | | | 474,240 | |
|
Forest Laboratories LLC(b) | |
02/01/19 | | | 4.375% | | | | 575,000 | | | | 600,848 | |
02/15/21 | | | 4.875% | | | | 1,635,000 | | | | 1,747,089 | |
|
Gilead Sciences, Inc. | |
04/01/21 | | | 4.500% | | | | 1,500,000 | | | | 1,619,481 | |
02/01/25 | | | 3.500% | | | | 1,310,000 | | | | 1,305,788 | |
|
Grifols Worldwide Operations Ltd. | |
04/01/22 | | | 5.250% | | | | 566,000 | | | | 575,198 | |
|
Hospira, Inc. | |
08/12/20 | | | 5.200% | | | | 1,350,000 | | | | 1,508,552 | |
|
Jaguar Holding Co. II/Pharmaceutical Product Development LLC(b) | |
08/01/23 | | | 6.375% | | | | 994,000 | | | | 985,054 | |
|
Johnson & Johnson | |
12/05/33 | | | 4.375% | | | | 2,995,000 | | | | 3,199,765 | |
|
Mallinckrodt International Finance SA/CB LLC(b) | |
04/15/20 | | | 4.875% | | | | 50,000 | | | | 50,500 | |
04/15/25 | | | 5.500% | | | | 147,000 | | | | 145,898 | |
|
Mallinckrodt International Finance SA | |
04/15/23 | | | 4.750% | | | | 250,000 | | | | 237,031 | |
| | | |
Novartis Capital Corp. | | | | | | | | | | | | |
09/21/22 | | | 2.400% | | | | 1,045,000 | | | | 1,016,423 | |
|
Quintiles Transnational Corp.(b) | |
05/15/23 | | | 4.875% | | | | 242,000 | | | | 246,840 | |
|
Valeant Pharmaceuticals International, Inc.(b) | |
10/15/20 | | | 6.375% | | | | 1,428,000 | | | | 1,485,120 | |
07/15/21 | | | 7.500% | | | | 590,000 | | | | 633,513 | |
12/01/21 | | | 5.625% | | | | 244,000 | | | | 248,270 | |
07/15/22 | | | 7.250% | | | | 2,500,000 | | | | 2,631,250 | |
| | | | | | | | | | | | |
| Corporate Bonds & Notes(a) (continued) | |
| Issuer | | Coupon
Rate | | | Principal
Amount ($) | | | Value ($) | |
03/01/23 | | | 5.500% | | | | 181,000 | | | | 183,489 | |
05/15/23 | | | 5.875% | | | | 725,000 | | | | 739,500 | |
04/15/25 | | | 6.125% | | | | 914,000 | | | | 941,420 | |
| | | | | | | | | | | | | |
Total | | | | | | | | | | | 40,657,138 | |
| | | |
| | | | | | | | | | | | |
PROPERTY & CASUALTY 0.8% | |
ACE INA Holdings, Inc. | | | | | | | | | | | | |
05/15/24 | | | 3.350% | | | | 910,000 | | | | 893,071 | |
|
Berkshire Hathaway Finance Corp. | |
05/15/42 | | | 4.400% | | | | 3,850,000 | | | | 3,729,992 | |
|
CNA Financial Corp. | |
11/15/19 | | | 7.350% | | | | 3,435,000 | | | | 4,051,699 | |
08/15/21 | | | 5.750% | | | | 925,000 | | | | 1,043,326 | |
|
Chubb Corp. (The)(c) | |
03/29/67 | | | 6.375% | | | | 3,190,000 | | | | 3,150,125 | |
|
Farmers Exchange Capital II(b)(c) | |
11/01/53 | | | 6.151% | | | | 3,950,000 | | | | 4,214,583 | |
|
Farmers Exchange Capital(b) | |
07/15/28 | | | 7.050% | | | | 1,000,000 | | | | 1,218,749 | |
07/15/48 | | | 7.200% | | | | 1,615,000 | | | | 2,033,529 | |
|
HUB International Ltd.(b) | |
10/01/21 | | | 7.875% | | | | 1,047,000 | | | | 1,044,383 | |
|
Hartford Financial Services Group, Inc. (The) | |
04/15/22 | | | 5.125% | | | | 3,600,000 | | | | 4,007,365 | |
|
Hub Holdings LLC/Finance, Inc.
PIK(b) | |
07/15/19 | | | 8.125% | | | | 254,000 | | | | 248,920 | |
|
Liberty Mutual Group, Inc.(b) | |
05/01/22 | | | 4.950% | | | | 4,365,000 | | | | 4,658,297 | |
06/15/23 | | | 4.250% | | | | 275,000 | | | | 279,691 | |
03/15/35 | | | 6.500% | | | | 1,085,000 | | | | 1,247,434 | |
05/01/42 | | | 6.500% | | | | 705,000 | | | | 825,971 | |
08/01/44 | | | 4.850% | | | | 1,000,000 | | | | 953,092 | |
|
Nationwide Mutual Insurance Co.(b) | |
08/15/39 | | | 9.375% | | | | 1,700,000 | | | | 2,531,535 | |
|
Nationwide Mutual Insurance Co.(b)(c) | |
12/15/24 | | | 2.576% | | | | 1,725,000 | | | | 1,724,916 | |
|
Transatlantic Holdings, Inc. | |
11/30/39 | | | 8.000% | | | | 1,803,000 | | | | 2,394,151 | |
| | | | | | | | | | | | | |
Total | | | | | | | | | | | 40,250,829 | |
| | | |
| | | | | | | | | | | | |
RAILROADS 0.3% | |
BNSF Funding Trust I(c) | |
12/15/55 | | | 6.613% | | | | 2,220,000 | | | | 2,508,600 | |
|
Burlington Northern Santa Fe LLC | |
09/15/21 | | | 3.450% | | | | 295,000 | | | | 302,705 | |
09/01/22 | | | 3.050% | | | | 475,000 | | | | 467,631 | |
03/15/43 | | | 4.450% | | | | 2,500,000 | | | | 2,375,875 | |
09/01/45 | | | 4.700% | | | | 3,470,000 | | | | 3,462,498 | |
|
Canadian Pacific Railway Co. | |
03/15/23 | | | 4.450% | | | | 1,070,000 | | | | 1,134,770 | |
08/01/45 | | | 4.800% | | | | 1,660,000 | | | | 1,668,519 | |
|
Canadian Pacific Railway Ltd. | |
01/15/22 | | | 4.500% | | | | 600,000 | | | | 638,166 | |
The accompanying Notes to Financial Statements are an integral part of this statement.
| | |
| |
| ACTIVE PORTFOLIOS® MULTI-MANAGER CORE PLUS BOND FUND | | |
PORTFOLIO OF INVESTMENTS (continued)
August 31, 2015
| | | | | | | | | | | | |
| Corporate Bonds & Notes(a) (continued) | |
| Issuer | | Coupon
Rate | | | Principal
Amount ($) | | | Value ($) | |
Florida East Coast Holdings Corp.(b) | |
05/01/19 | | | 6.750% | | | | 109,000 | | | | 109,818 | |
|
Kansas City Southern de Mexico SA de CV | |
05/15/23 | | | 3.000% | | | | 1,000,000 | | | | 956,645 | |
|
Norfolk Southern Corp. | |
04/01/22 | | | 3.000% | | | | 2,000,000 | | | | 1,978,696 | |
|
Union Pacific Corp. | |
02/15/19 | | | 2.250% | | | | 765,000 | | | | 774,663 | |
02/01/55 | | | 3.875% | | | | 430,000 | | | | 374,228 | |
| | | | | | | | | | | | | |
Total | | | | | | | | | | | 16,752,814 | |
| | | |
| | | | | | | | | | | | |
REFINING 0.1% | |
CVR Refining LLC/Coffeyville Finance, Inc. | |
11/01/22 | | | 6.500% | | | | 225,000 | | | | 220,455 | |
|
Marathon Petroleum Corp. | |
03/01/21 | | | 5.125% | | | | 1,000,000 | | | | 1,088,620 | |
09/15/24 | | | 3.625% | | | | 500,000 | | | | 482,197 | |
|
Phillips 66 | |
11/15/44 | | | 4.875% | | | | 1,550,000 | | | | 1,481,398 | |
|
Puma International Financing SA(b) | |
02/01/21 | | | 6.750% | | | | 200,000 | | | | 200,980 | |
|
Reliance Holdings USA, Inc. | |
10/19/20 | | | 4.500% | | | | 560,000 | | | | 591,642 | |
|
Tesoro Corp. | |
04/01/24 | | | 5.125% | | | | 225,000 | | | | 220,500 | |
|
Tupras Turkiye Petrol Rafinerileri AS | |
05/02/18 | | | 4.125% | | | | 200,000 | | | | 199,400 | |
|
Valero Energy Corp. | |
03/15/19 | | | 9.375% | | | | 2,000,000 | | | | 2,438,268 | |
| | | | | | | | | | | | | |
Total | | | | | | | | | | | 6,923,460 | |
| | | |
| | | | | | | | | | | | |
RESTAURANTS 0.1% | |
BC ULC/New Red Finance, Inc.(b) | |
01/15/22 | | | 4.625% | | | | 406,000 | | | | 408,030 | |
04/01/22 | | | 6.000% | | | | 850,000 | | | | 875,500 | |
|
NPC International, Inc./Operating Co., Inc. | |
01/15/20 | | | 10.500% | | | | 275,000 | | | | 288,062 | |
| | | |
Yum! Brands, Inc. | | | | | | | | | | | | |
11/01/43 | | | 5.350% | | | | 1,440,000 | | | | 1,369,740 | |
| | | | | | | | | | | | | |
Total | | | | | | | | | | | 2,941,332 | |
| | | |
| | | | | | | | | | | | |
RETAIL REIT 0.2% | |
ARC Properties Operating Partnership LP/Clark Acquisition LLC | |
02/06/17 | | | 2.000% | | | | 5,320,000 | | | | 5,193,650 | |
| | | |
Equity One, Inc. | | | | | | | | | | | | |
11/15/22 | | | 3.750% | | | | 1,400,000 | | | | 1,395,779 | |
| | | |
Kimco Realty Corp. | | | | | | | | | | | | |
03/15/16 | | | 5.783% | | | | 1,392,000 | | | | 1,425,001 | |
| | | |
Tanger Properties LP | | | | | | | | | | | | |
12/01/23 | | | 3.875% | | | | 865,000 | | | | 859,580 | |
| | | | | | | | | | | | | |
Total | | | | | | | | | | | 8,874,010 | |
| | | |
| | | | | | | | | | | | |
| | | | | | | | | | | | |
| Corporate Bonds & Notes(a) (continued) | |
| Issuer | | Coupon
Rate | | | Principal
Amount ($) | | | Value ($) | |
RETAILERS 0.6% | |
Advance Auto Parts, Inc. | | | | | | | | | | | | |
12/01/23 | | | 4.500% | | | | 1,000,000 | | | | 1,035,404 | |
|
Asbury Automotive Group, Inc. | |
12/15/24 | | | 6.000% | | | | 79,000 | | | | 82,160 | |
|
AutoZone, Inc. | |
01/13/17 | | | 1.300% | | | | 775,000 | | | | 774,398 | |
|
Bed Bath & Beyond, Inc. | |
08/01/44 | | | 5.165% | | | | 2,200,000 | | | | 2,114,939 | |
|
CVS Health Corp. | |
06/01/17 | | | 5.750% | | | | 283,000 | | | | 303,532 | |
12/05/23 | | | 4.000% | | | | 515,000 | | | | 537,051 | |
07/20/25 | | | 3.875% | | | | 990,000 | | | | 1,013,441 | |
07/20/45 | | | 5.125% | | | | 2,130,000 | | | | 2,276,408 | |
|
CVS Pass-Through Trust(b) | |
01/10/36 | | | 4.704% | | | | 135,943 | | | | 141,142 | |
08/11/36 | | | 4.163% | | | | 2,368,799 | | | | 2,368,787 | |
|
Caleres, Inc.(b) | |
08/15/23 | | | 6.250% | | | | 45,000 | | | | 45,506 | |
|
Dollar Tree, Inc.(b) | |
03/01/23 | | | 5.750% | | | | 383,000 | | | | 401,193 | |
|
Group 1 Automotive, Inc. | |
06/01/22 | | | 5.000% | | | | 152,000 | | | | 150,860 | |
|
InRetail Consumer(b) | |
10/10/21 | | | 5.250% | | | | 200,000 | | | | 205,840 | |
|
Jo-Ann Stores Holdings, Inc.
PIK(b) | |
10/15/19 | | | 9.750% | | | | 200,000 | | | | 168,000 | |
|
Jo-Ann Stores LLC(b) | |
03/15/19 | | | 8.125% | | | | 75,000 | | | | 69,844 | |
|
L Brands, Inc. | |
06/15/19 | | | 8.500% | | | | 180,000 | | | | 211,950 | |
02/15/22 | | | 5.625% | | | | 250,000 | | | | 267,813 | |
|
Macy’s Retail Holdings, Inc. | |
07/15/27 | | | 6.790% | | | | 6,445,000 | | | | 7,777,562 | |
|
Michaels Stores, Inc.(b) | |
12/15/20 | | | 5.875% | | | | 525,000 | | | | 549,937 | |
|
Neiman Marcus Group Ltd. LLC(b) | |
10/15/21 | | | 8.000% | | | | 25,000 | | | | 26,375 | |
PIK | |
10/15/21 | | | 8.750% | | | | 300,000 | | | | 321,000 | |
|
PVH Corp. | |
12/15/22 | | | 4.500% | | | | 200,000 | | | | 199,500 | |
|
Penske Automotive Group, Inc. | |
12/01/24 | | | 5.375% | | | | 175,000 | | | | 175,438 | |
|
PetCo Animal Supplies, Inc.(b) | |
12/01/18 | | | 9.250% | | | | 150,000 | | | | 155,250 | |
|
PetCo Holdings, Inc.(b) | |
10/15/17 | | | 8.500% | | | | 425,000 | | | | 432,437 | |
|
PetSmart, Inc.(b) | |
03/15/23 | | | 7.125% | | | | 784,000 | | | | 821,240 | |
|
Rite Aid Corp. | |
02/15/27 | | | 7.700% | | | | 55,000 | | | | 64,350 | |
The accompanying Notes to Financial Statements are an integral part of this statement.
| | |
| |
| | ACTIVE PORTFOLIOS® MULTI-MANAGER CORE PLUS BOND FUND |
PORTFOLIO OF INVESTMENTS (continued)
August 31, 2015
| | | | | | | | | | | | |
| Corporate Bonds & Notes(a) (continued) | |
| Issuer | | Coupon
Rate | | | Principal
Amount ($) | | | Value ($) | |
Rite Aid Corp.(b) | |
04/01/23 | | | 6.125% | | | | 650,000 | | | | 667,062 | |
|
Sally Holdings LLC/Capital, Inc. | |
06/01/22 | | | 5.750% | | | | 540,000 | | | | 560,250 | |
|
Tiffany & Co. | |
10/01/24 | | | 3.800% | | | | 625,000 | | | | 614,491 | |
|
Vista Outdoor, Inc.(b) | |
10/01/23 | | | 5.875% | | | | 250,000 | | | | 254,375 | |
|
Wal-Mart Stores, Inc. | |
04/11/23 | | | 2.550% | | | | 1,455,000 | | | | 1,400,739 | |
04/22/24 | | | 3.300% | | | | 2,100,000 | | | | 2,120,324 | |
| | | | | | | | | | | | | |
Total | | | | | | | | | | | 28,308,598 | |
| | | |
| | | | | | | | | | | | |
SUPERMARKETS 0.1% | |
Kroger Co. (The) | | | | | | | | | | | | |
12/15/18 | | | 6.800% | | | | 3,060,000 | | | | 3,497,213 | |
| | | |
| | | | | | | | | | | | |
TECHNOLOGY 0.9% | |
Adobe Systems, Inc. | | | | | | | | | | | | |
02/01/25 | | | 3.250% | | | | 1,120,000 | | | | 1,075,871 | |
|
Advanced Micro Devices, Inc. | |
08/15/22 | | | 7.500% | | | | 100,000 | | | | 64,500 | |
07/01/24 | | | 7.000% | | | | 300,000 | | | | 193,500 | |
|
Alliance Data Systems Corp.(b) | |
12/01/17 | | | 5.250% | | | | 178,000 | | | | 183,785 | |
04/01/20 | | | 6.375% | | | | 41,000 | | | | 42,333 | |
08/01/22 | | | 5.375% | | | | 386,000 | | | | 381,175 | |
|
Ancestry.com, Inc. | |
12/15/20 | | | 11.000% | | | | 123,000 | | | | 136,684 | |
|
Apple, Inc. | |
02/09/22 | | | 2.150% | | | | 2,000,000 | | | | 1,927,134 | |
05/06/44 | | | 4.450% | | | | 550,000 | | | | 543,066 | |
|
Audatex North America, Inc.(b) | |
06/15/21 | | | 6.000% | | | | 708,000 | | | | 691,334 | |
11/01/23 | | | 6.125% | | | | 329,000 | | | | 326,085 | |
|
Autodesk, Inc. | |
06/15/25 | | | 4.375% | | | | 360,000 | | | | 360,679 | |
|
BMC Software Finance, Inc.(b) | |
07/15/21 | | | 8.125% | | | | 400,000 | | | | 327,000 | |
|
Blackboard, Inc.(b) | |
11/15/19 | | | 7.750% | | | | 225,000 | | | | 201,375 | |
|
Blue Coat Systems, Inc.(b) | |
06/01/23 | | | 8.375% | | | | 375,000 | | | | 375,750 | |
|
Boxer Parent Co, Inc.
PIK(b) | |
10/15/19 | | | 9.000% | | | | 350,000 | | | | 259,000 | |
|
CDW LLC/Finance Corp. | |
08/15/22 | | | 6.000% | | | | 300,000 | | | | 314,625 | |
09/01/23 | | | 5.000% | | | | 175,000 | | | | 172,813 | |
12/01/24 | | | 5.500% | | | | 300,000 | | | | 297,000 | |
|
CommScope Holdings Co., Inc.
PIK(b) | |
06/01/20 | | | 6.625% | | | | 400,000 | | | | 415,500 | |
| | | | | | | | | | | | |
| Corporate Bonds & Notes(a) (continued) | |
| Issuer | | Coupon
Rate | | | Principal
Amount ($) | | | Value ($) | |
CommScope Technologies Finance LLC(b) | |
06/15/25 | | | 6.000% | | | | 175,000 | | | | 170,188 | |
|
CommScope, Inc.(b) | |
06/15/24 | | | 5.500% | | | | 250,000 | | | | 242,812 | |
|
CompuCom Systems, Inc.(b)(f) | |
05/01/21 | | | 7.000% | | | | 275,000 | | | | 185,625 | |
|
Equinix, Inc. | |
04/01/20 | | | 4.875% | | | | 234,000 | | | | 239,265 | |
01/01/22 | | | 5.375% | | | | 125,000 | | | | 126,250 | |
|
Fidelity National Information Services, Inc. | |
04/15/23 | | | 3.500% | | | | 2,500,000 | | | | 2,319,132 | |
|
First Data Corp. | |
01/15/21 | | | 11.250% | | | | 37,000 | | | | 40,885 | |
06/15/21 | | | 10.625% | | | | 110,000 | | | | 121,688 | |
|
First Data Corp.(b) | |
08/15/20 | | | 8.875% | | | | 27,000 | | | | 28,218 | |
11/01/20 | | | 6.750% | | | | 134,000 | | | | 141,035 | |
01/15/21 | | | 8.250% | | | | 189,000 | | | | 198,923 | |
01/15/22 | | | 8.750% | | | | 1,350,000 | | | | 1,420,875 | |
08/15/23 | | | 5.375% | | | | 499,000 | | | | 505,237 | |
|
Fiserv, Inc. | |
06/01/25 | | | 3.850% | | | | 2,250,000 | | | | 2,223,000 | |
|
Flextronics International Ltd.(b) | |
06/15/25 | | | 4.750% | | | | 385,000 | | | | 372,453 | |
|
Freescale Semiconductor, Inc.(b) | |
01/15/22 | | | 6.000% | | | | 175,000 | | | | 182,875 | |
|
Goodman Networks, Inc. | |
07/01/18 | | | 12.125% | | | | 63,000 | | | | 23,940 | |
|
Igloo Holdings Corp.
PIK(b) | |
12/15/17 | | | 8.250% | | | | 325,000 | | | | 327,437 | |
|
Infor Software Parent LLC, Inc.
PIK(b) | |
05/01/21 | | | 7.125% | | | | 625,000 | | | | 567,187 | |
|
Infor US, Inc.(b) | |
08/15/20 | | | 5.750% | | | | 158,000 | | | | 158,395 | |
05/15/22 | | | 6.500% | | | | 700,000 | | | | 656,250 | |
|
Ingram Micro, Inc. | |
08/10/22 | | | 5.000% | | | | 1,030,000 | | | | 1,061,321 | |
12/15/24 | | | 4.950% | | | | 695,000 | | | | 709,936 | |
|
Intel Corp. | |
07/29/25 | | | 3.700% | | | | 1,200,000 | | | | 1,213,684 | |
07/29/45 | | | 4.900% | | | | 780,000 | | | | 803,020 | |
|
Interactive Data Corp.(b) | |
04/15/19 | | | 5.875% | | | | 525,000 | | | | 531,562 | |
|
International Business Machines Corp. | |
01/05/16 | | | 2.000% | | | | 1,500,000 | | | | 1,507,905 | |
|
Iron Mountain, Inc. | |
08/15/24 | | | 5.750% | | | | 250,000 | | | | 250,937 | |
|
Italics Merger Sub, Inc.(b) | |
07/15/23 | | | 7.125% | | | | 425,000 | | | | 411,098 | |
|
Keysight Technologies, Inc.(b) | |
10/30/24 | | | 4.550% | | | | 2,560,000 | | | | 2,470,513 | |
The accompanying Notes to Financial Statements are an integral part of this statement.
| | |
| |
| ACTIVE PORTFOLIOS® MULTI-MANAGER CORE PLUS BOND FUND | | |
PORTFOLIO OF INVESTMENTS (continued)
August 31, 2015
| | | | | | | | | | | | |
| Corporate Bonds & Notes(a) (continued) | |
| Issuer | | Coupon
Rate | | | Principal
Amount ($) | | | Value ($) | |
MSCI, Inc.(b) | |
11/15/24 | | | 5.250% | | | | 216,000 | | | | 219,780 | |
08/15/25 | | | 5.750% | | | | 375,000 | | | | 382,500 | |
|
Micron Technology, Inc.(b) | |
08/01/23 | | | 5.250% | | | | 225,000 | | | | 209,813 | |
01/15/24 | | | 5.250% | | | | 125,000 | | | | 115,938 | |
|
Molex Electronic Technologies LLC(b) | |
04/15/25 | | | 3.900% | | | | 960,000 | | | | 922,886 | |
|
NCR Corp. | |
02/15/21 | | | 4.625% | | | | 600,000 | | | | 582,000 | |
07/15/22 | | | 5.000% | | | | 50,000 | | | | 48,625 | |
12/15/23 | | | 6.375% | | | | 93,000 | | | | 95,441 | |
|
NXP BV/Funding LLC(b) | |
06/15/22 | | | 4.625% | | | | 118,000 | | | | 116,820 | |
03/15/23 | | | 5.750% | | | | 200,000 | | | | 207,000 | |
|
Nuance Communications, Inc.(b) | |
08/15/20 | | | 5.375% | | | | 425,000 | | | | 428,187 | |
|
Open Text Corp.(b) | |
01/15/23 | | | 5.625% | | | | 175,000 | | | | 175,000 | |
|
Oracle Corp. | |
10/08/19 | | | 2.250% | | | | 3,000,000 | | | | 3,014,280 | |
05/15/22 | | | 2.500% | | | | 2,467,000 | | | | 2,400,929 | |
05/15/45 | | | 4.125% | | | | 243,000 | | | | 229,436 | |
05/15/55 | | | 4.375% | | | | 995,000 | | | | 930,032 | |
|
Plantronics, Inc.(b) | |
05/31/23 | | | 5.500% | | | | 86,000 | | | | 86,430 | |
|
Qualitytech LP/Finance Corp. | |
08/01/22 | | | 5.875% | | | | 120,000 | | | | 121,200 | |
|
Riverbed Technology, Inc.(b) | |
03/01/23 | | | 8.875% | | | | 190,000 | | | | 172,900 | |
|
SS&C Technologies Holdings, Inc.(b) | |
07/15/23 | | | 5.875% | | | | 225,000 | | | | 232,020 | |
|
Sensata Technologies BV(b) | |
11/01/24 | | | 5.625% | | | | 175,000 | | | | 179,375 | |
10/01/25 | | | 5.000% | | | | 150,000 | | | | 145,500 | |
|
SunGard Data Systems, Inc. | |
11/01/19 | | | 6.625% | | | | 600,000 | | | | 622,500 | |
|
Syniverse Holdings, Inc. | |
01/15/19 | | | 9.125% | | | | 400,000 | | | | 347,000 | |
|
Telefonaktiebolaget LM Ericsson | |
05/15/22 | | | 4.125% | | | | 3,270,000 | | | | 3,388,966 | |
|
Tencent Holdings Ltd.(b) | |
02/11/25 | | | 3.800% | | | | 200,000 | | | | 193,174 | |
|
VeriSign, Inc. | |
05/01/23 | | | 4.625% | | | | 573,000 | | | | 558,675 | |
04/01/25 | | | 5.250% | | | | 174,000 | | | | 175,305 | |
|
Verisk Analytics, Inc. | |
09/12/22 | | | 4.125% | | | | 3,000,000 | | | | 3,031,827 | |
|
Zebra Technologies Corp.(b) | |
10/15/22 | | | 7.250% | | | | 640,000 | | | | 684,800 | |
| | | | | | | | | | | | | |
Total | | | | | | | | | | | 47,519,194 | |
| | | |
| | | | | | | | | | | | |
| | | | | | | | | | | | |
| Corporate Bonds & Notes(a) (continued) | |
| Issuer | | Coupon
Rate | | | Principal
Amount ($) | | | Value ($) | |
TOBACCO 0.3% | |
Altria Group, Inc. | |
01/31/24 | | | 4.000% | | | | 4,240,000 | | | | 4,310,778 | |
|
BAT International Finance PLC(b) | |
06/15/25 | | | 3.950% | | | | 1,485,000 | | | | 1,516,341 | |
|
Imperial Tobacco Finance PLC(b) | |
07/20/18 | | | 2.050% | | | | 2,569,000 | | | | 2,557,293 | |
|
Reynolds American, Inc. | |
06/12/25 | | | 4.450% | | | | 1,325,000 | | | | 1,361,565 | |
08/15/45 | | | 5.850% | | | | 1,450,000 | | | | 1,561,379 | |
|
Reynolds American, Inc.(b) | |
08/04/41 | | | 7.000% | | | | 1,170,000 | | | | 1,341,119 | |
| | | | | | | | | | | | | |
Total | | | | | | | | | | | 12,648,475 | |
| | | |
| | | | | | | | | | | | |
TRANSPORTATION SERVICES 0.2% | |
ERAC U.S.A. Finance LLC(b) | |
10/01/20 | | | 5.250% | | | | 2,500,000 | | | | 2,788,567 | |
11/15/24 | | | 3.850% | | | | 2,500,000 | | | | 2,513,792 | |
02/15/45 | | | 4.500% | | | | 1,512,000 | | | | 1,387,293 | |
|
Hertz Corp. (The) | |
04/15/19 | | | 6.750% | | | | 175,000 | | | | 178,938 | |
10/15/20 | | | 5.875% | | | | 125,000 | | | | 126,295 | |
10/15/22 | | | 6.250% | | | | 225,000 | | | | 228,938 | |
|
Penske Truck Leasing Co. LP/Finance Corp.(b) | |
02/01/22 | | | 3.375% | | | | 1,200,000 | | | | 1,169,850 | |
|
Ryder System, Inc. | |
06/01/17 | | | 3.500% | | | | 1,000,000 | | | | 1,031,801 | |
11/15/18 | | | 2.450% | | | | 660,000 | | | | 662,941 | |
06/01/19 | | | 2.550% | | | | 1,500,000 | | | | 1,497,531 | |
|
Topaz Marine SA(b) | |
11/01/18 | | | 8.625% | | | | 200,000 | | | | 187,500 | |
| | | | | | | | | | | | | |
Total | | | | | | | | | | | 11,773,446 | |
| | | |
| | | | | | | | | | | | |
WIRELESS 0.4% | |
Altice Luxembourg SA(b) | |
05/15/22 | | | 7.750% | | | | 502,000 | | | | 489,450 | |
02/15/25 | | | 7.625% | | | | 400,000 | | | | 380,000 | |
|
Altice US Finance I Corp.(b) | |
07/15/23 | | | 5.375% | | | | 400,000 | | | | 396,000 | |
|
Altice US Finance II Corp.(b) | |
07/15/25 | | | 7.750% | | | | 429,000 | | | | 418,275 | |
|
American Tower Corp. | |
01/15/18 | | | 4.500% | | | | 1,000,000 | | | | 1,049,368 | |
02/15/24 | | | 5.000% | | | | 665,000 | | | | 694,261 | |
|
Crown Castle International Corp. | |
04/15/22 | | | 4.875% | | | | 390,000 | | | | 400,237 | |
|
Digicel Group Ltd.(b) | |
09/30/20 | | | 8.250% | | | | 600,000 | | | | 555,000 | |
|
Numericable-SFR(b) | |
05/15/19 | | | 4.875% | | | | 60,000 | | | | 60,375 | |
05/15/22 | | | 6.000% | | | | 664,000 | | | | 664,000 | |
05/15/24 | | | 6.250% | | | | 200,000 | | | | 199,938 | |
The accompanying Notes to Financial Statements are an integral part of this statement.
| | |
| |
| | ACTIVE PORTFOLIOS® MULTI-MANAGER CORE PLUS BOND FUND |
PORTFOLIO OF INVESTMENTS (continued)
August 31, 2015
| | | | | | | | | | | | |
| Corporate Bonds & Notes(a) (continued) | |
| Issuer | | Coupon
Rate | | | Principal
Amount ($) | | | Value ($) | |
SBA Telecommunications, Inc. | |
07/15/20 | | | 5.750% | | | | 339,000 | | | | 353,831 | |
|
Sprint Capital Corp. | |
11/15/28 | | | 6.875% | | | | 625,000 | | | | 537,500 | |
|
Sprint Communications, Inc. | |
08/15/20 | | | 7.000% | | | | 138,000 | | | | 136,275 | |
11/15/21 | | | 11.500% | | | | 83,000 | | | | 94,828 | |
04/15/22 | | | 9.250% | | | | 3,650,000 | | | | 3,796,000 | |
11/15/22 | | | 6.000% | | | | 694,000 | | | | 624,600 | |
|
Sprint Communications, Inc.(b) | |
11/15/18 | | | 9.000% | | | | 2,479,000 | | | | 2,760,986 | |
03/01/20 | | | 7.000% | | | | 57,000 | | | | 60,545 | |
| | | |
Sprint Corp. | | | | | | | | | | | | |
09/15/21 | | | 7.250% | | | | 100,000 | | | | 97,250 | |
09/15/23 | | | 7.875% | | | | 400,000 | | | | 384,500 | |
06/15/24 | | | 7.125% | | | | 510,000 | | | | 471,592 | |
|
T-Mobile USA, Inc. | |
04/28/21 | | | 6.633% | | | | 339,000 | | | | 354,255 | |
01/15/22 | | | 6.125% | | | | 139,000 | | | | 143,344 | |
04/28/22 | | | 6.731% | | | | 328,000 | | | | 344,400 | |
03/01/23 | | | 6.000% | | | | 122,000 | | | | 124,378 | |
04/01/23 | | | 6.625% | | | | 721,000 | | | | 752,003 | |
04/28/23 | | | 6.836% | | | | 50,000 | | | | 52,375 | |
01/15/24 | | | 6.500% | | | | 300,000 | | | | 308,250 | |
03/01/25 | | | 6.375% | | | | 218,000 | | | | 222,796 | |
|
Wind Acquisition Finance SA(b) | |
04/30/20 | | | 6.500% | | | | 136,000 | | | | 143,140 | |
07/15/20 | | | 4.750% | | | | 185,000 | | | | 186,388 | |
04/23/21 | | | 7.375% | | | | 179,000 | | | | 183,028 | |
| | | | | | | | | | | | | |
Total | | | | | | | | | | | 17,439,168 | |
| | | |
| | | | | | | | | | | | |
WIRELINES 0.9% | |
AT&T, Inc. | |
06/30/22 | | | 3.000% | | | | 1,541,000 | | | | 1,479,785 | |
12/15/42 | | | 4.300% | | | | 1,140,000 | | | | 971,239 | |
06/15/44 | | | 4.800% | | | | 4,500,000 | | | | 4,136,202 | |
05/15/46 | | | 4.750% | | | | 2,215,000 | | | | 2,019,008 | |
|
Bharti Airtel International Netherlands BV(b) | |
05/20/24 | | | 5.350% | | | | 100,000 | | | | 106,804 | |
|
CenturyLink, Inc. | |
06/15/21 | | | 6.450% | | | | 4,590,000 | | | | 4,583,574 | |
03/15/22 | | | 5.800% | | | | 124,000 | | | | 117,645 | |
12/01/23 | | | 6.750% | | | | 137,000 | | | | 133,233 | |
|
CenturyLink, Inc.(b) | |
04/01/25 | | | 5.625% | | | | 71,000 | | | | 63,403 | |
|
Colombia Telecomunicaciones SA ESP(b)(c) | |
12/31/49 | | | 8.500% | | | | 200,000 | | | | 200,750 | |
|
Frontier Communications Corp. | |
07/01/21 | | | 9.250% | | | | 43,000 | | | | 44,183 | |
04/15/22 | | | 8.750% | | | | 259,000 | | | | 255,115 | |
01/15/23 | | | 7.125% | | | | 88,000 | | | | 79,464 | |
04/15/24 | | | 7.625% | | | | 68,000 | | | | 60,690 | |
01/15/25 | | | 6.875% | | | | 99,000 | | | | 83,779 | |
|
Level 3 Communications, Inc. | |
12/01/22 | | | 5.750% | | | | 315,000 | | | | 314,213 | |
| | | | | | | | | | | | |
| Corporate Bonds & Notes(a) (continued) | |
| Issuer | | Coupon
Rate | | | Principal
Amount ($) | | | Value ($) | |
Level 3 Financing, Inc. | |
06/01/20 | | | 7.000% | | | | 224,000 | | | | 235,760 | |
07/15/20 | | | 8.625% | | | | 150,000 | | | | 158,925 | |
01/15/21 | | | 6.125% | | | | 66,000 | | | | 69,135 | |
08/15/22 | | | 5.375% | | | | 146,000 | | | | 146,517 | |
|
Level 3 Financing, Inc.(b) | |
05/01/25 | | | 5.375% | | | | 625,000 | | | | 604,687 | |
|
Ooredoo International Finance Ltd.(b) | |
10/19/25 | | | 5.000% | | | | 200,000 | | | | 216,056 | |
|
Qwest Corp. | |
09/15/25 | | | 7.250% | | | | 3,978,000 | | | | 4,378,107 | |
|
Telecom Italia SpA(b) | |
05/30/24 | | | 5.303% | | | | 90,000 | | | | 91,406 | |
|
Telefonica Emisiones SAU | |
04/27/18 | | | 3.192% | | | | 870,000 | | | | 891,392 | |
04/27/23 | | | 4.570% | | | | 1,250,000 | | | | 1,310,741 | |
|
Telemar Norte Leste SA | |
10/23/20 | | | 5.500% | | | | 100,000 | | | | 79,720 | |
|
Verizon Communications, Inc. | |
03/15/21 | | | 3.450% | | | | 487,000 | | | | 497,702 | |
11/01/21 | | | 3.000% | | | | 3,459,000 | | | | 3,409,429 | |
09/15/23 | | | 5.150% | | | | 7,978,000 | | | | 8,746,353 | |
03/15/24 | | | 4.150% | | | | 750,000 | | | | 766,354 | |
11/01/24 | | | 3.500% | | | | 268,000 | | | | 261,884 | |
03/15/34 | | | 5.050% | | | | 1,952,000 | | | | 1,942,792 | |
11/01/41 | | | 4.750% | | | | 2,000,000 | | | | 1,842,188 | |
09/15/43 | | | 6.550% | | | | 3,665,000 | | | | 4,341,156 | |
08/21/46 | | | 4.862% | | | | 3,000,000 | | | | 2,827,170 | |
|
Windstream Services LLC | |
10/15/20 | | | 7.750% | | | | 32,000 | | | | 28,480 | |
|
Zayo Group LLC/Capital, Inc.(b) | |
04/01/23 | | | 6.000% | | | | 407,000 | | | | 406,471 | |
05/15/25 | | | 6.375% | | | | 59,000 | | | | 58,410 | |
| | | | | | | | | | | | | |
Total | | | | | | | | | | | 47,959,922 | |
| | | | | | | | | | | | | |
Total Corporate Bonds & Notes | | | | | |
(Cost: $1,566,983,251) | | | | | | | | 1,556,223,298 | |
| | | |
| | | | | | | | | | | | |
| Residential Mortgage-Backed Securities — Agency 23.6% | |
Federal Home Loan Mortgage Corp. Multifamily
Structured Pass-Through Certificates
Series K151 Class A3 | |
04/25/30 | | | 3.511% | | | | 4,290,000 | | | | 4,384,966 | |
|
Federal Home Loan Mortgage Corp. | |
03/01/17 - 08/01/22 | | | 8.500% | | | | 13,887 | | | | 15,448 | |
06/01/19 - 07/01/41 | | | 4.500% | | | | 6,722,238 | | | | 7,257,590 | |
02/01/20 - 07/01/42 | | | 4.000% | | | | 27,177,949 | | | | 29,170,189 | |
04/01/21 | | | 9.000% | | | | 915 | | | | 927 | |
01/01/22 - 09/01/39 | | | 5.500% | | | | 3,764,282 | | | | 4,207,481 | |
07/01/23 - 05/01/41 | | | 5.000% | | | | 3,165,330 | | | | 3,453,836 | |
08/01/24 - 02/01/25 | | | 8.000% | | | | 44,279 | | | | 51,893 | |
10/01/28 - 07/01/32 | | | 7.000% | | | | 503,427 | | | | 590,882 | |
10/01/31 - 09/01/37 | | | 6.000% | | | | 1,880,515 | | | | 2,145,785 | |
11/01/36 - 10/01/37 | | | 6.500% | | | | 715,043 | | | | 821,107 | |
05/01/43 - 06/01/45 | | | 3.500% | | | | 67,514,248 | | | | 70,176,551 | |
The accompanying Notes to Financial Statements are an integral part of this statement.
| | |
| |
| ACTIVE PORTFOLIOS® MULTI-MANAGER CORE PLUS BOND FUND | | |
PORTFOLIO OF INVESTMENTS (continued)
August 31, 2015
| | | | | | | | | | | | |
| Residential Mortgage-Backed Securities — Agency (continued) | |
| Issuer | | Coupon
Rate | | | Principal
Amount ($) | | | Value ($) | |
CMO STRIPS Series 276 Class 30 | |
09/15/42 | | | 3.000% | | | | 10,171,607 | | | | 10,228,168 | |
CMO STRIPS Series 277 Class 30 | |
09/15/42 | | | 3.000% | | | | 11,184,271 | | | | 11,068,414 | |
CMO Series 4037 Class CA | |
04/15/27 | | | 3.000% | | | | 5,475,491 | | | | 5,384,373 | |
|
Federal Home Loan Mortgage Corp.(c)
CMO Series 3085 Class FV | |
08/15/35 | | | 0.898% | | | | 2,824,538 | | | | 2,871,106 | |
|
Federal Home Loan Mortgage Corp.(c)(i)
CMO IO Series 3404 Class AS | |
01/15/38 | | | 5.697% | | | | 7,427,327 | | | | 1,236,374 | |
|
Federal Home Loan Mortgage Corp.(e) | |
09/17/30 | | | 2.500% | | | | 4,000,000 | | | | 4,060,312 | |
09/14/45 | | | 3.500% | | | | 7,000,000 | | | | 7,246,437 | |
|
Federal Home Loan Mortgage Corp.(i)
CMO IO Series 329 Class C5 | |
06/15/43 | | | 3.500% | | | | 10,525,726 | | | | 2,247,239 | |
CMO IO Series 4120 Class IA | |
10/15/42 | | | 3.500% | | | | 4,290,469 | | | | 738,547 | |
CMO IO Series 4176 Class BI | |
03/15/43 | | | 3.500% | | | | 1,822,959 | | | | 319,529 | |
|
Federal National Mortgage Association | |
04/01/23 | | | 8.500% | | | | 8,657 | | | | 9,163 | |
06/01/24 | | | 9.000% | | | | 12,041 | | | | 13,141 | |
02/01/25 - 08/01/27 | | | 8.000% | | | | 68,858 | | | | 80,034 | |
10/01/25 - 07/01/45 | | | 3.500% | | | | 114,142,275 | | | | 119,158,404 | |
03/01/26 - 07/01/38 | | | 7.000% | | | | 1,490,862 | | | | 1,791,253 | |
11/01/26 - 12/01/43 | | | 3.000% | | | | 56,010,810 | | | | 57,103,232 | |
04/01/27 - 06/01/32 | | | 7.500% | | | | 135,818 | | | | 159,002 | |
09/01/27 - 01/01/30 | | | 2.500% | | | | 12,082,143 | | | | 12,343,029 | |
05/01/29 - 10/01/40 | | | 6.000% | | | | 6,491,370 | | | | 7,398,640 | |
05/01/32 - 10/01/38 | | | 6.500% | | | | 553,660 | | | | 638,317 | |
09/01/32 - 06/01/45 | | | 4.000% | | | | 117,352,105 | | | | 125,865,242 | |
03/01/33 - 04/01/41 | | | 5.500% | | | | 4,076,627 | | | | 4,619,450 | |
07/01/34 - 10/01/41 | | | 5.000% | | | | 14,573,211 | | | | 16,108,392 | |
10/01/40 - 10/01/44 | | | 4.500% | | | | 22,191,993 | | | | 24,114,705 | |
CMO Series 2009-111 Class DA | |
12/25/39 | | | 5.000% | | | | 866,936 | | | | 929,694 | |
CMO Series 2013-121 Class KD | |
08/25/41 | | | 3.500% | | | | 2,127,707 | | | | 2,231,516 | |
|
Federal National Mortgage Association(c) | |
01/01/44 | | | 3.013% | | | | 2,673,592 | | | | 2,760,908 | |
CMO Series 2003-134 Class FC | |
12/25/32 | | | 0.799% | | | | 4,056,096 | | | | 4,111,802 | |
CMO Series 2007-W7 Class 1A4 | |
07/25/37 | | | 37.984% | | | | 350,012 | | | | 553,215 | |
CMO Series 2012-1 Class FA | |
02/25/42 | | | 0.699% | | | | 4,819,237 | | | | 4,870,933 | |
CMO Series 2012-110 Class CF | |
10/25/42 | | | 0.699% | | | | 14,120,002 | | | | 14,192,649 | |
Series 2014-M8 Class FA | |
05/25/18 | | | 0.450% | | | | 6,253,534 | | | | 6,250,558 | |
|
Federal National Mortgage Association(e) | |
09/17/30 | | | 2.500% | | | | 16,105,000 | | | | 16,353,921 | |
09/17/30 - 09/14/45 | | | 3.000% | | | | 68,165,000 | | | | 69,513,810 | |
09/17/30 - 09/14/45 | | | 3.500% | | | | 72,715,000 | | | | 75,491,129 | |
| | | | | | | | | | | | |
| Residential Mortgage-Backed Securities — Agency (continued) | |
| Issuer | | Coupon
Rate | | | Principal
Amount ($) | | | Value ($) | |
10/14/44 - 09/14/45 | | | 4.000% | | | | 106,624,562 | | | | 113,346,193 | |
10/14/44 - 09/14/45 | | | 4.500% | | | | 47,750,000 | | | | 51,722,828 | |
09/14/45 | | | 5.000% | | | | 8,000,000 | | | | 8,824,218 | |
|
Federal National Mortgage Association(i)
CMO IO Series 2012-148 Class BI | |
01/25/43 | | | 3.500% | | | | 7,417,711 | | | | 1,259,724 | |
|
Federal National Mortgage Association(k)
CMO PO STRIPS Series 43 Class 1 | |
09/25/18 | | | 0.000% | | | | 696 | | | | 687 | |
|
Government National Mortgage Association | |
03/15/38 - 09/20/41 | | | 4.500% | | | | 9,876,358 | | | | 10,767,317 | |
03/15/40 - 05/15/40 | | | 5.000% | | | | 2,074,265 | | | | 2,303,481 | |
09/15/41 - 07/20/45 | | | 3.500% | | | | 41,605,546 | | | | 43,461,226 | |
11/20/41 - 12/20/44 | | | 4.000% | | | | 9,370,430 | | | | 9,993,933 | |
05/15/42 - 08/20/45 | | | 3.000% | | | | 22,461,452 | | | | 22,831,832 | |
CMO Series 2013-53 Class AD | |
12/20/26 | | | 1.500% | | | | 8,958,863 | | | | 8,770,290 | |
|
Government National Mortgage Association(c)
CMO Series 2013-H19 Class FC | |
08/20/63 | | | 0.788% | | | | 5,734,678 | | | | 5,765,771 | |
|
Government National Mortgage Association(e) | |
09/18/44 - 09/21/45 | | | 4.000% | | | | 36,005,000 | | | | 38,251,408 | |
09/18/44 - 09/21/45 | | | 4.500% | | | | 5,000,000 | | | | 5,405,717 | |
07/20/45 - 09/21/45 | | | 3.000% | | | | 32,038,941 | | | | 32,539,005 | |
09/21/45 | | | 3.500% | | | | 110,755,000 | | | | 115,454,465 | |
| | | | | | | | | | | | | |
Total Residential Mortgage-Backed Securities — Agency | |
(Cost: $1,199,051,685) | | | | 1,205,037,388 | |
| | | |
| | | | | | | | | | | | |
| Residential Mortgage-Backed Securities — Non-Agency 4.1% | |
ASG Resecuritization Trust(b)(c)
CMO Series 2009-2 Class G70 | |
05/24/36 | | | 4.822% | | | | 1,925,000 | | | | 1,947,983 | |
CMO Series 2009-2 Class G75 | |
05/24/36 | | | 4.822% | | | | 1,925,000 | | | | 1,945,666 | |
|
BCAP LLC Trust(b)(c) | |
08/26/36 | | | 0.311% | | | | 918,228 | | | | 904,172 | |
09/26/36 | | | 3.500% | | | | 1,807,340 | | | | 1,822,258 | |
CMO Series 2012-RR10 Class 9A1 | |
10/26/35 | | | 2.733% | | | | 431,477 | | | | 436,466 | |
CMO Series 2013-RR5 Class 1A1 | |
10/26/36 | | | 3.500% | | | | 1,541,340 | | | | 1,557,982 | |
CMO Series 2015-RR2 Class 23A1 | |
03/28/37 | | | 0.396% | | | | 7,388,494 | | | | 7,187,889 | |
|
BCAP LLC Trust(c)
CMO Series 2007-AA1 Class 1A2 | |
02/25/47 | | | 0.359% | | | | 2,269,350 | | | | 2,100,614 | |
|
BCAP LLC
Series 2013-RR2 Class 7A1(b)(c) | |
07/26/36 | | | 3.000% | | | | 981,569 | | | | 984,642 | |
|
Banc of America Funding Trust
CMO Series 2006-3 Class 4A14 | |
03/25/36 | | | 6.000% | | | | 2,607,694 | | | | 2,628,626 | |
The accompanying Notes to Financial Statements are an integral part of this statement.
| | |
| |
| | ACTIVE PORTFOLIOS® MULTI-MANAGER CORE PLUS BOND FUND |
PORTFOLIO OF INVESTMENTS (continued)
August 31, 2015
| | | | | | | | | | | | |
| Residential Mortgage-Backed Securities — Non-Agency (continued) | |
| Issuer | | Coupon
Rate | | | Principal
Amount ($) | | | Value ($) | |
CMO Series 2006-3 Class 5A3 | |
03/25/36 | | | 5.500% | | | | 2,327,129 | | | | 2,179,712 | |
|
Banc of America Funding Trust(b)(c)
CMO Series 2012-R5 Class A | |
10/03/39 | | | 0.449% | | | | 1,146,176 | | | | 1,137,838 | |
|
Banc of America Funding Trust(c)
CMO Series 2006-D Class 3A1 | |
05/20/36 | | | 2.848% | | | | 3,323,027 | | | | 2,948,575 | |
|
Bayview Opportunity Master Fund Trust
Series 2014-16RP Class A(b)(c) | |
11/28/29 | | | 3.844% | | | | 1,674,659 | | | | 1,673,373 | |
|
Citicorp Mortgage Securities Trust
CMO Series 2007-8 Class 1A3 | |
09/25/37 | | | 6.000% | | | | 1,724,423 | | | | 1,795,064 | |
|
Citigroup Mortgage Loan Trust, Inc.(b)
CMO Series 2012-A Class A | |
06/25/51 | | | 2.500% | | | | 1,099,793 | | | | 1,081,650 | |
|
Citigroup Mortgage Loan Trust, Inc.(b)(c)
CMO Series 2012-7 Class 12A1 | |
03/25/36 | | | 2.631% | | | | 641,439 | | | | 641,876 | |
CMO Series 2012-9 Class 1A1 | |
02/20/36 | | | 4.809% | | | | 1,044,934 | | | | 1,036,320 | |
CMO Series 2013-2 Class 1A1 | |
11/25/37 | | | 2.639% | | | | 1,132,285 | | | | 1,135,427 | |
CMO Series 2014-12 Class 3A1 | |
10/25/35 | | | 2.592% | | | | 4,316,451 | | | | 4,381,125 | |
|
Citigroup Mortgage Loan Trust, Inc.(c)
CMO Series 2005-8 Class 1A1A | |
10/25/35 | | | 2.528% | | | | 4,079,657 | | | | 3,543,814 | |
CMO Series 2015-A Class A4 | |
06/25/58 | | | 4.250% | | | | 2,355,893 | | | | 2,450,303 | |
|
Countrywide Home Loan Mortgage Pass-Through Trust
CMO Series 2007-HY5 Class 1A1(c) | |
09/25/47 | | | 2.842% | | | | 1,688,054 | | | | 1,486,429 | |
|
Credit Suisse Mortgage Capital Certificates(b)(c)
CMO Series 2009-14R Class 4A9 | |
10/26/35 | | | 2.733% | | | | 3,776,000 | | | | 3,825,244 | |
CMO Series 2011-12R Class 3A1 | |
07/27/36 | | | 2.367% | | | | 6,070,813 | | | | 6,000,853 | |
CMO Series 2011-16R Class 7A3 | |
12/27/36 | | | 3.500% | | | | 288,556 | | | | 290,190 | |
CMO Series 2011-17R Class 3A1 | |
10/27/35 | | | 2.346% | | | | 509,420 | | | | 507,599 | |
CMO Series 2013-IVR3 Class A2 | |
05/25/43 | | | 3.000% | | | | 2,626,210 | | | | 2,582,846 | |
CMO Series 2014-RPL4 Class A1 | |
08/25/62 | | | 3.625% | | | | 3,298,476 | | | | 3,264,631 | |
CMO Series 2015-WIN1 Class A6 | |
12/25/44 | | | 3.500% | | | | 2,518,272 | | | | 2,555,300 | |
|
Credit Suisse Securities (USA) LLC(b)(c) | |
02/25/54 | | | 3.074% | | | | 2,717,553 | | | | 2,684,243 | |
|
Downey Savings & Loan Association Mortgage Loan Trust(c)
CMO Series 2005-AR6 Class 2A1A | |
10/19/45 | | | 0.495% | | | | 3,305,640 | | | | 2,803,070 | |
CMO Series 2006-AR2 Class 2A1A | |
10/19/36 | | | 0.405% | | | | 3,901,550 | | | | 3,156,998 | |
| | | | | | | | | | | | |
| Residential Mortgage-Backed Securities — Non-Agency (continued) | |
| Issuer | | Coupon
Rate | | | Principal
Amount ($) | | | Value ($) | |
First Horizon Mortgage Pass-Through Trust
CMO Series 2007-AR1 Class 1A1(c) | |
05/25/37 | | | 2.701% | | | | 1,044,755 | | | | 831,375 | |
|
Freddie Mac Structured Agency Credit Risk Debt Notes
CMO Series 2015-DNA1 Class M1(c) | |
10/25/27 | | | 1.091% | | | | 2,274,244 | | | | 2,261,639 | |
|
GSR Mortgage Loan Trust CMO
Series 2006-AR2 Class 2A1(c) | |
04/25/36 | | | 2.588% | | | | 4,016,576 | | | | 3,616,782 | |
|
GreenPoint Mortgage Funding Trust
CMO Series 2006-AR8 Class 1A2A(c) | |
01/25/47 | | | 0.379% | | | | 1,967,589 | | | | 1,889,605 | |
|
IndyMac Index Mortgage Loan Trust
CMO Series 2006-AR3 Class 1A1(c) | |
12/25/36 | | | 2.661% | | | | 3,491,220 | | | | 3,051,448 | |
|
JPMorgan Mortgage Trust
CMO Series 2006-S2 Class 2A2 | |
06/25/21 | | | 5.875% | | | | 1,789,872 | | | | 1,699,897 | |
CMO Series 2007-S1 Class 1A2 | |
03/25/22 | | | 5.500% | | | | 771,667 | | | | 770,955 | |
|
JPMorgan Resecuritization Trust(b)
CMO Series 2014-5 Class 6A | |
09/27/36 | | | 4.000% | | | | 1,422,453 | | | | 1,425,186 | |
|
JPMorgan Resecuritization Trust(b)(c)
CMO Series 2014-1 Class 1016 | |
03/26/36 | | | 2.615% | | | | 4,000,000 | | | | 4,009,120 | |
|
Jefferies Resecuritization Trust
CMO Series 2010-R7 Class 7A4(b)(c) | |
10/26/36 | | | 3.250% | | | | 291,733 | | | | 288,850 | |
|
Lehman XS Trust(c)
CMO Series 2006-10N Class 1A3A | |
07/25/46 | | | 0.409% | | | | 4,095,675 | | | | 3,222,744 | |
Series 2005-4 Class 1A3 | |
10/25/35 | | | 0.999% | | | | 2,961,542 | | | | 2,757,284 | |
Series 2005-5N Class 3A1A | |
11/25/35 | | | 0.499% | | | | 5,072,570 | | | | 4,497,747 | |
|
MASTR Adjustable Rate Mortgages Trust
CMO Series 2006-OA1 Class 1A1(c) | |
04/25/46 | | | 0.409% | | | | 2,698,334 | | | | 2,035,353 | |
|
MASTR Alternative Loan Trust CMO
Series 2004-12 Class 4A1 | |
12/25/34 | | | 5.500% | | | | 1,681,656 | | | | 1,800,865 | |
|
Morgan Stanley Mortgage Loan Trust
CMO Series 2005-2AR Class A(c) | |
04/25/35 | | | 0.459% | | | | 7,052,311 | | | | 6,548,437 | |
|
Morgan Stanley Re-Remic Trust(b)(c)
CMO Series 2013-R3 Class 10A | |
10/26/35 | | | 2.733% | | | | 491,271 | | | | 496,366 | |
|
Morgan Stanley Re-Remic Trust(b)(c)(h) | |
09/26/35 | | | 2.794% | | | | 2,646,853 | | | | 2,745,316 | |
|
Morgan Stanley Resecuritization Trust(b)(c)
CMO Series 2013-R9 Class 2A | |
06/26/46 | | | 2.736% | | | | 775,461 | | | | 781,954 | |
The accompanying Notes to Financial Statements are an integral part of this statement.
| | |
| |
| ACTIVE PORTFOLIOS® MULTI-MANAGER CORE PLUS BOND FUND | | |
PORTFOLIO OF INVESTMENTS (continued)
August 31, 2015
| | | | | | | | | | | | |
| Residential Mortgage-Backed Securities — Non-Agency (continued) | |
| Issuer | | Coupon
Rate | | | Principal
Amount ($) | | | Value ($) | |
CMO Series 2013-R9 Class 4A | |
06/26/46 | | | 2.481% | | | | 1,188,057 | | | | 1,186,025 | |
|
MortgageIT Trust CMO
Series 2005-5 Class A1(c) | |
12/25/35 | | | 0.459% | | | | 3,876,335 | | | | 3,511,805 | |
|
Nomura Asset Acceptance Corp. Alternative Loan Trust(c)
CMO Series 2007-1 Class 1A3 (AGM) | |
03/25/47 | | | 5.957% | | | | 105,441 | | | | 106,287 | |
CMO Series 2007-1 Class 1A4 (AGM) | |
03/25/47 | | | 6.138% | | | | 667,790 | | | | 673,044 | |
|
Nomura Resecuritization Trust(b)(c)
CMO Series 2012-3R Class 1A1 | |
01/26/37 | | | 0.363% | | | | 1,011,210 | | | | 973,614 | |
CMO Series 2014-6R Class 3A1 | |
01/26/36 | | | 0.451% | | | | 2,594,483 | | | | 2,428,422 | |
CMO Series 2015-2R Class 2A1 | |
03/26/36 | | | 0.359% | | | | 9,633,978 | | | | 9,009,605 | |
|
RALI Trust(c)
CMO Series 2005-QA4 Class A41 | |
04/25/35 | | | 2.991% | | | | 2,330,323 | | | | 2,302,198 | |
|
RALI Trust(c)(f)(i)
CMO IO Series 2006-QS18 Class 1AV | |
12/25/36 | | | 0.414% | | | | 84,148,456 | | | | 1,472,093 | |
CMO IO Series 2006-QS9 Class 1AV | |
07/25/36 | | | 0.616% | | | | 38,875,112 | | | | 888,996 | |
CMO IO Series 2007-QS1 Class 2AV | |
01/25/37 | | | 0.169% | | | | 83,831,879 | | | | 593,865 | |
|
RFMSI Trust(c)
CMO Series 2005-SA5 Class 1A | |
11/25/35 | | | 2.836% | | | | 3,283,063 | | | | 2,691,498 | |
CMO Series 2006-SA4 Class 2A1 | |
11/25/36 | | | 3.499% | | | | 958,615 | | | | 828,973 | |
|
Sequoia Mortgage Trust(b)(c)
CMO Series 2014-4 Class A5 | |
11/25/44 | | | 3.500% | | | | 3,458,893 | | | | 3,509,655 | |
|
Sequoia Mortgage Trust(c)
CMO Series 2013-2 Class A1 | |
02/25/43 | | | 1.874% | | | | 4,475,721 | | | | 4,114,687 | |
CMO Series 2013-6 Class A2 | |
05/25/43 | | | 3.000% | | | | 2,482,301 | | | | 2,454,110 | |
|
Structured Adjustable Rate Mortgage Loan Trust(c)
CMO Series 2004-20 Class 1A2 | |
01/25/35 | | | 2.451% | | | | 1,749,184 | | | | 1,676,068 | |
CMO Series 2006-5 Class 1A1 | |
06/25/36 | | | 2.604% | | | | 3,790,185 | | | | 3,168,955 | |
CMO Series 2007-5 Class 2A1 | |
06/25/37 | | | 2.617% | | | | 1,586,239 | | | | 1,398,167 | |
|
Structured Asset Securities Corp. Mortgage Pass-Through Certificates
CMO Series 2004-21XS Class 2A6A(c) | |
12/25/34 | | | 4.740% | | | | 14,349 | | | | 14,641 | |
|
VML LLC
CMO Series 2014-NPL1 Class A1(b)(c) | |
04/27/54 | | | 3.875% | | | | 836,043 | | | | 837,395 | |
|
WaMu Mortgage Pass-Through Certificates(c)
CMO Series 2003-AR8 Class A | |
08/25/33 | | | 2.488% | | | | 1,344,359 | | | | 1,378,607 | |
| | | | | | | | | | | | |
| Residential Mortgage-Backed Securities — Non-Agency (continued) | |
| Issuer | | Coupon
Rate | | | Principal
Amount ($) | | | Value ($) | |
CMO Series 2005-AR11 Class A1A | |
08/25/45 | | | 0.519% | | | | 3,091,530 | | | | 2,902,969 | |
CMO Series 2005-AR17 Class A1A1 | |
12/25/45 | | | 0.469% | | | | 7,139,671 | | | | 6,686,841 | |
CMO Series 2005-AR19 Class A1A1 | |
12/25/45 | | | 0.469% | | | | 3,564,628 | | | | 3,365,225 | |
CMO Series 2005-AR2 Class 2A1A | |
01/25/45 | | | 0.509% | | | | 3,200,306 | | | | 3,011,447 | |
CMO Series 2005-AR8 Class 2A1A | |
07/25/45 | | | 0.489% | | | | 2,708,535 | | | | 2,536,316 | |
CMO Series 2005-AR9 Class A1A | |
07/25/45 | | | 0.519% | | | | 2,551,706 | | | | 2,443,159 | |
CMO Series 2006-AR4 Class 1A1A | |
05/25/46 | | | 1.138% | | | | 4,309,553 | | | | 4,008,578 | |
CMO Series 2006-AR5 Class A12A | |
06/25/46 | | | 1.178% | | | | 1,319,570 | | | | 1,227,564 | |
CMO Series 2007-HY1 Class 4A1 | |
02/25/37 | | | 2.382% | | | | 3,290,261 | | | | 2,879,169 | |
CMO Series 2007-HY3 Class 1A1 | |
03/25/37 | | | 2.093% | | | | 1,298,837 | | | | 1,069,269 | |
CMO Series 2007-OA3 Class 5A | |
04/25/47 | | | 1.909% | | | | 2,555,165 | | | | 1,943,302 | |
CMO Series 2007-OC2 Class A3 | |
06/25/37 | | | 0.509% | | | | 5,626,272 | | | | 4,549,674 | |
|
Wells Fargo Mortgage-Backed Securities Trust(c)
CMO Series 2006-AR17 Class A1 | |
10/25/36 | | | 2.653% | | | | 2,527,915 | | | | 2,396,815 | |
CMO Series 2006-AR2 Class 2A1 | |
03/25/36 | | | 2.631% | | | | 2,819,336 | | | | 2,804,898 | |
| | | | | | | | | | | | | |
Total Residential Mortgage-Backed Securities — Non-Agency | |
(Cost: $194,681,359) | | | | | | | | 206,453,637 | |
| | | |
| | | | | | | | | | | | |
| Commercial Mortgage-Backed Securities — Agency 2.1% | |
FREMF Mortgage Trust
Series 2014-K715 Class B(b)(c) | |
02/25/46 | | | 4.118% | | | | 3,516,000 | | | | 3,628,150 | |
|
Federal Home Loan Mortgage Corp. Multifamily Structured Pass-Through Certificates
Series KSCT Class A2 | |
01/25/20 | | | 4.285% | | | | 2,585,000 | | | | 2,846,227 | |
|
Federal Home Loan Mortgage Corp. Multifamily Structured Pass-Through Certificates(c)
Series KF05 Class A | |
09/25/21 | | | 0.537% | | | | 11,472,536 | | | | 11,479,638 | |
|
Federal National Mortgage Association | |
05/01/18 | | | 3.840% | | | | 2,110,000 | | | | 2,241,948 | |
07/01/20 | | | 3.950% | | | | 3,955,000 | | | | 4,311,308 | |
09/01/20 | | | 3.584% | | | | 5,360,815 | | | | 5,692,375 | |
10/01/20 | | | 3.426% | | | | 3,900,000 | | | | 4,182,404 | |
11/01/20 | | | 3.266% | | | | 5,165,346 | | | | 5,496,145 | |
12/01/20 | | | 3.523% | | | | 5,430,054 | | | | 5,809,308 | |
12/01/20 | | | 3.763% | | | | 6,682,736 | | | | 7,222,288 | |
01/01/21 | | | 4.456% | | | | 5,562,497 | | | | 6,169,450 | |
04/01/21 | | | 4.242% | | | | 5,390,771 | | | | 5,946,578 | |
04/01/21 | | | 4.250% | | | | 3,730,000 | | | | 4,136,391 | |
The accompanying Notes to Financial Statements are an integral part of this statement.
| | |
| |
| | ACTIVE PORTFOLIOS® MULTI-MANAGER CORE PLUS BOND FUND |
PORTFOLIO OF INVESTMENTS (continued)
August 31, 2015
| | | | | | | | | | | | |
| Commercial Mortgage-Backed Securities — Agency (continued) | |
| Issuer | | Coupon
Rate | | | Principal
Amount ($) | | | Value ($) | |
05/01/21 | | | 4.394% | | | | 1,869,317 | | | | 2,092,609 | |
06/01/21 | | | 4.426% | | | | 6,822,301 | | | | 7,522,200 | |
10/01/22 | | | 2.646% | | | | 4,546,025 | | | | 4,658,635 | |
09/01/23 | | | 3.650% | | | | 2,509,212 | | | | 2,689,244 | |
05/01/27 | | | 2.966% | | | | 6,972,474 | | | | 6,969,862 | |
|
Federal National Mortgage Association(c)
Series 2012-M12 Class 1A | |
08/25/22 | | | 2.935% | | | | 5,875,849 | | | | 6,040,960 | |
Series 2014-M12 Class FA | |
10/25/21 | | | 0.501% | | | | 6,236,632 | | | | 6,262,955 | |
| | | | | | | | | | | | | |
Total Commercial Mortgage-Backed Securities — Agency | |
(Cost: $105,309,156) | | | | | | | | 105,398,675 | |
| | | |
| | | | | | | | | | | | |
| Commercial Mortgage-Backed Securities — Non-Agency 4.0% | |
Banc of America Commercial Mortgage Trust
Series 2007-4 Class AM(c) | |
02/10/51 | | | 6.002% | | | | 2,300,000 | | | | 2,451,858 | |
|
Banc of America Merrill Lynch Commercial Mortgage Securities Trust
Series 2015-200P Class A(b) | |
04/14/33 | | | 3.218% | | | | 3,000,000 | | | | 2,991,375 | |
|
Banc of America Merrill Lynch Commercial Mortgage, Inc.
Series 2005-6 Class A4(c) | |
09/10/47 | | | 5.327% | | | | 2,511,629 | | | | 2,510,163 | |
|
COBALT CMBS Commercial Mortgage Trust
Series 2007-C3 Class A4(c) | |
05/15/46 | | | 5.960% | | | | 2,048,990 | | | | 2,178,773 | |
|
Citigroup Commercial Mortgage Trust
Series 2013-GC11 Class AS | |
04/10/46 | | | 3.422% | | | | 2,200,000 | | | | 2,208,956 | |
|
Commercial Mortgage Trust
Series 2013-LC6 Class AM | |
01/10/46 | | | 3.282% | | | | 1,235,000 | | | | 1,244,182 | |
Series 2015-CR22 Class A5 | |
03/10/48 | | | 3.309% | | | | 3,830,000 | | | | 3,820,158 | |
Series 2015-CR23 Class A3 | |
05/10/48 | | | 3.230% | | | | 5,000,000 | | | | 4,975,455 | |
Series 2015-LC19 Class A4 | |
02/10/48 | | | 3.183% | | | | 835,000 | | | | 828,284 | |
|
Commercial Mortgage Trust(b)(c)
Series 2013-CR8 Class B | |
06/10/46 | | | 4.100% | | | | 5,500,000 | | | | 5,611,963 | |
|
Commercial Mortgage Trust(c)
Series 2014-LC17 Class B | |
10/10/47 | | | 4.490% | | | | 1,100,000 | | | | 1,130,381 | |
|
Credit Suisse Commercial Mortgage Trust(c)
Series 2007-C2 Class A1A | |
01/15/49 | | | 5.526% | | | | 5,233,555 | | | | 5,449,534 | |
Series 2007-C3 Class A4 | | | | | | | | | | | | |
06/15/39 | | | 5.889% | | | | 1,614,049 | | | | 1,691,829 | |
|
Credit Suisse Mortgage Capital Certificates
Series 2010-RR4 Class 2A(b)(c) | |
09/18/39 | | | 5.467% | | | | 1,153,578 | | | | 1,175,382 | |
| | | | | | | | | | | | |
| Commercial Mortgage-Backed Securities — Non-Agency (continued) | |
| Issuer | | Coupon
Rate | | | Principal
Amount ($) | | | Value ($) | |
DBRR Trust
Series 2013-EZ2 Class A(b)(c) | |
02/25/45 | | | 0.853% | | | | 79,390 | | | | 79,372 | |
|
DBUBS Mortgage Trust
Series 2011-LC3A Class A2 | |
08/10/44 | | | 3.642% | | | | 7,487,413 | | | | 7,581,874 | |
|
DBUBS Mortgage Trust(b)
Series 2011-LC2A Class A4 | |
07/10/44 | | | 4.537% | | | | 6,840,000 | | | | 7,522,967 | |
|
FREMF Mortgage Trust(b)(c)
Series 2014-K714 Class B | |
01/25/47 3.987% | | | | | | | 1,000,000 | | | | 1,030,506 | |
Series 2014-K717 Class B | | | | | | | | | |
11/25/47 | | | 3.754% | | | | 2,400,000 | | | | 2,423,237 | |
|
GS Mortgage Securities Trust
Series 2014-GC24 Class B(c) | |
09/10/47 | | | 4.640% | | | | 1,725,000 | | | | 1,770,033 | |
|
General Electric Capital Assurance Co.
Series 2003-1 Class A5(b)(c) | |
05/12/35 | | | 5.743% | | | | 1,666,310 | | | | 1,823,019 | |
|
Greenwich Capital Commercial Funding Corp.
Series 2007-GG9 Class A4 | |
03/10/39 | | | 5.444% | | | | 1,612,327 | | | | 1,682,433 | |
|
Invitation Homes Trust
Series 2015-SFR3 Class A(b)(c) | |
08/17/32 | | | 1.498% | | | | 5,079,019 | | | | 5,043,117 | |
|
JPMBB Commercial Mortgage Securities Trust
Series 2014-C26 Class A3 | |
01/15/48 | | | 3.231% | | | | 360,000 | | | | 358,913 | |
Series 2014-C26 Class A4 | | | | | | | | | |
01/15/48 | | | 3.494% | | | | 4,875,000 | | | | 4,904,401 | |
Series 2015-C27 Class A4 | | | | | | | | | |
02/15/48 | | | 3.179% | | | | 2,220,000 | | | | 2,180,457 | |
Series 2015-C28 Class A3 | | | | | | | | | |
10/15/48 | | | 2.912% | | | | 4,525,000 | | | | 4,379,630 | |
Series 2015-C28 Class A4 | | | | | | | | | |
10/15/48 | | | 3.227% | | | | 3,900,000 | | | | 3,848,400 | |
Series 2015-C28 Class AS | | | | | | | | | |
10/15/48 | | | 3.532% | | | | 4,500,000 | | | | 4,410,183 | |
|
JPMorgan Chase Commercial Mortgage Securities Trust
Series 2006-CB16 Class A4 | |
05/12/45 | | | 5.552% | | | | 7,570,491 | | | | 7,698,780 | |
|
JPMorgan Chase Commercial Mortgage Securities Trust(b)
Series 2011-C3 Class A2 | |
02/15/46 | | | 3.673% | | | | 1,407,090 | | | | 1,429,089 | |
Series 2011-C3 Class A3 | | | | | | | | | | | | |
02/15/46 | | | 4.388% | | | | 7,715,000 | | | | 8,165,581 | |
Series 2011-C4 Class A3 | | | | | | | | | | | | |
07/15/46 | | | 4.106% | | | | 8,745,000 | | | | 9,199,521 | |
|
LB Commercial Mortgage Trust
Series 2007-C3 Class AM(c) | |
07/15/44 | | | 6.097% | | | | 1,415,000 | | | | 1,509,614 | |
|
LB-UBS Commercial Mortgage Trust
Series 2006-C1 Class A4 | |
02/15/31 | | | 5.156% | | | | 474,075 | | | | 475,217 | |
The accompanying Notes to Financial Statements are an integral part of this statement.
| | |
| |
| ACTIVE PORTFOLIOS® MULTI-MANAGER CORE PLUS BOND FUND | | |
PORTFOLIO OF INVESTMENTS (continued)
August 31, 2015
| | | | | | | | | | | | |
| Commercial Mortgage-Backed Securities — Non-Agency (continued) | |
| Issuer | | Coupon
Rate | | | Principal
Amount ($) | | | Value ($) | |
Series 2007-C2 Class A3 | | | | | | | | | |
02/15/40 | | | 5.430% | | | | 3,749,891 | | | | 3,920,211 | |
|
LB-UBS Commercial Mortgage Trust(c)
Series 2006-C4 Class AM | |
06/15/38 | | | 6.048% | | | | 700,000 | | | | 720,406 | |
|
Merrill Lynch/Countrywide Commercial Mortgage Trust
Series 2007-8 Class A3(c) | |
08/12/49 | | | 6.077% | | | | 3,675,000 | | | | 3,911,560 | |
|
Morgan Stanley Bank of America Merrill Lynch Trust
Series 2015-C20 Class A3 | |
02/15/48 | | | 2.988% | | | | 1,125,000 | | | | 1,094,433 | |
Series 2015-C21 Class A3 | | | | | | | | | |
03/15/48 | | | 3.077% | | | | 525,000 | | | | 514,348 | |
Series 2015-C22 Class A3 | | | | | | | | | |
04/15/48 | | | 3.046% | | | | 2,940,000 | | | | 2,844,203 | |
|
Morgan Stanley Capital I Trust
Series 2007-IQ14 Class A2 | |
04/15/49 | | | 5.610% | | | | 6,519,577 | | | | 6,528,724 | |
|
Morgan Stanley Capital I Trust(c)
Series 2007-HQ12 Class A5 | |
04/12/49 | | | 5.861% | | | | 766,374 | | | | 765,025 | |
Series 2007-IQ16 Class AM | | | | | | | | | |
12/12/49 | | | 6.277% | | | | 3,000,000 | | | | 3,235,920 | |
|
Morgan Stanley Capital I, Inc.
Series 2012-C4 Class A2 | |
03/15/45 | | | 2.111% | | | | 4,000,000 | | | | 4,036,180 | |
|
Morgan Stanley Re-Remic Trust(b)(c)
Series 2009-GG10 Class A4A | |
08/12/45 | | | 5.989% | | | | 1,819,276 | | | | 1,914,631 | |
Series 2009-GG10 Class A4B | | | | | | | | | |
08/12/45 | | | 5.997% | | | | 1,770,000 | | | | 1,875,494 | |
Series 2010-GG10 Class A4A | | | | | | | | | |
08/15/45 | | | 5.989% | | | | 171,226 | | | | 180,201 | |
Series 2010-GG10 Class A4B | | | | | | | | | |
08/15/45 | | | 5.796% | | | | 1,410,000 | | | | 1,487,540 | |
|
ORES NPL LLC
Series 2014-LV3 Class A(b) | |
03/27/24 | | | 3.000% | | | | 1,256,906 | | | | 1,256,906 | |
|
Rialto Real Estate Fund LLC
Series 2014-LT6 Class A(b) | |
09/15/24 | | | 2.750% | | | | 522,073 | | | | 522,028 | |
|
Rialto Real Estate Fund LP(b)
Series 2013-LT3 Class A | |
06/20/28 | | | 2.500% | | | | 54,883 | | | | 54,883 | |
Series 2014-LT5 Class A | | | | | | | | | | | | |
05/15/24 | | | 2.850% | | | | 215,112 | | | | 215,172 | |
|
UBS-Barclays Commercial Mortgage Trust
Series 2013-C6 Class AS | |
04/10/46 | | | 3.469% | | | | 800,000 | | | | 819,720 | |
|
UBS-Citigroup Commercial Mortgage Trust
Series 2011-C1
Class AS(b) | |
01/10/45 | | | 5.154% | | | | 3,600,000 | | | | 4,019,515 | |
|
VFC LLC
Series 2014-2 Class A(b) | |
07/20/30 | | | 2.750% | | | | 281,282 | | | | 281,349 | |
| | | | | | | | | | | | |
| Commercial Mortgage-Backed Securities — Non-Agency (continued) | |
| Issuer | | Coupon
Rate | | | Principal
Amount ($) | | | Value ($) | |
WF-RBS Commercial Mortgage Trust
Series 2011-C5 Class A4 | |
11/15/44 | | | 3.667% | | | | 4,885,000 | | | | 5,130,408 | |
Series 2012-C6 Class AS | |
04/15/45 | | | 3.835% | | | | 5,500,000 | | | | 5,742,396 | |
Series 2012-C7 Class A2 | |
06/15/45 | | | 3.431% | | | | 3,995,000 | | | | 4,139,394 | |
Series 2012-C8 Class A3 | |
08/15/45 | | | 3.001% | | | | 2,880,000 | | | | 2,905,178 | |
Series 2013-C18 Class A2 | |
12/15/46 | | | 3.027% | | | | 1,440,000 | | | | 1,488,701 | |
Series 2014-C24 Class A5 | |
11/15/47 | | | 3.607% | | | | 1,300,000 | | | | 1,326,153 | |
|
WF-RBS Commercial Mortgage Trust(b)
Series 2011-C4 Class A3 | |
06/15/44 | | | 4.394% | | | | 6,491,000 | | | | 6,926,273 | |
|
WF-RBS Commercial Mortgage Trust(c)
Series 2014-C25 Class AS | |
11/15/47 | | | 3.984% | | | | 1,675,000 | | | | 1,705,665 | |
|
Wachovia Bank Commercial Mortgage Trust
Series 2006-C23 Class A4(c) | |
01/15/45 | | | 5.418% | | | | 2,201,397 | | | | 2,203,658 | |
|
Wells Fargo Commercial Mortgage Trust
Series 2015-C26 Class A4 | |
02/15/48 | | | 3.166% | | | | 2,430,000 | | | | 2,388,471 | |
Series 2015-C27 Class A4 | |
02/15/48 | | | 3.190% | | | | 3,450,000 | | | | 3,411,778 | |
Series 2015-C28 Class AS | |
05/15/48 | | | 3.872% | | | | 750,000 | | | | 760,364 | |
Series 2015-LC20 Class A4 | |
04/15/50 | | | 2.925% | | | | 1,965,000 | | | | 1,899,303 | |
Series 2015-LC20 Class A5 | |
04/15/50 | | | 3.184% | | | | 4,310,000 | | | | 4,234,187 | |
|
Wells Fargo Commercial Mortgage Trust(c)
Series 2013-LC12 Class A4 | |
07/15/46 | | | 4.218% | | | | 5,090,000 | | | | 5,489,051 | |
| | | | | | | | | | | | | |
Total Commercial Mortgage-Backed Securities — Non-Agency | |
(Cost: $209,853,474) | | | | | | | | | | | 205,734,066 | |
| | | |
| | | | | | | | | | | | |
| Asset-Backed Securities — Agency 0.8% | |
United States Small Business Administration
Series 2012-20C Class 1 | |
03/01/32 | | | 2.510% | | | | 473,474 | | | | 475,546 | |
Series 2012-20G Class 1 | |
07/01/32 | | | 2.380% | | | | 1,304,285 | | | | 1,297,272 | |
Series 2012-20I Class 1 | |
09/01/32 | | | 2.200% | | | | 1,316,919 | | | | 1,306,748 | |
Series 2012-20J Class 1 | |
10/01/32 | | | 2.180% | | | | 11,050,546 | | | | 10,948,701 | |
Series 2012-20L Class 1 | |
12/01/32 | | | 1.930% | | | | 569,007 | | | | 551,943 | |
Series 2013-20C Class 1 | |
03/01/33 | | | 2.220% | | | | 441,267 | | | | 437,085 | |
Series 2013-20D Class 1 | |
04/01/33 | | | 2.080% | | | | 4,222,917 | | | | 4,119,580 | |
The accompanying Notes to Financial Statements are an integral part of this statement.
| | |
| |
| | ACTIVE PORTFOLIOS® MULTI-MANAGER CORE PLUS BOND FUND |
PORTFOLIO OF INVESTMENTS (continued)
August 31, 2015
| | | | | | | | | | | | |
| Asset-Backed Securities — Agency (continued) | |
| Issuer | | Coupon
Rate | | | Principal
Amount ($) | | | Value ($) | |
Series 2013-20E Class 1 | |
05/01/33 | | | 2.070% | | | | 1,718,319 | | | | 1,674,629 | |
Series 2013-20L Class 1 | |
12/01/33 | | | 3.380% | | | | 846,867 | | | | 880,281 | |
Series 2014-20D Class 1 | |
04/01/34 | | | 3.110% | | | | 2,804,718 | | | | 2,895,556 | |
Series 2014-20E Class 1 | |
05/01/34 | | | 3.000% | | | | 2,995,187 | | | | 3,082,145 | |
Series 2014-20F Class 1 | |
06/01/34 | | | 2.990% | | | | 2,077,121 | | | | 2,142,174 | |
Series 2014-20G Class 1 | |
07/01/34 | | | 2.870% | | | | 1,580,629 | | | | 1,604,720 | |
Series 2014-20H Class 1 | |
08/01/34 | | | 2.880% | | | | 5,358,301 | | | | 5,437,473 | |
Series 2014-20I Class 1 | |
09/01/34 | | | 2.920% | | | | 357,133 | | | | 364,862 | |
Series 2015-20C Class 1 | |
03/01/35 | | | 2.720% | | | | 835,000 | | | | 842,717 | |
Series 2015-20E Class 1 | |
05/01/35 | | | 2.770% | | | | 1,620,000 | | | | 1,640,972 | |
| | | | | | | | | | | | | |
Total Asset-Backed Securities — Agency | |
(Cost: $39,149,536) | | | | | | | | | | | 39,702,404 | |
| | | |
| | | | | | | | | | | | |
| Asset-Backed Securities — Non-Agency 12.5% | |
A Voce CLO Ltd.(b)(c)
Series 2014-1A Class A1B | |
07/15/26 | | | 1.749% | | | | 2,290,000 | | | | 2,278,479 | |
Series 2014-1A Class A2A | |
07/15/26 | | | 2.289% | | | | 925,000 | | | | 916,752 | |
|
ALM XIV Ltd.
Series 2014-14A Class A1(b)(c) | |
07/28/26 | | | 1.724% | | | | 3,070,000 | | | | 3,058,626 | |
|
ARI Fleet Lease Trust
Series 2014-A Class A2(b) | |
11/15/22 | | | 0.810% | | | | 485,803 | | | | 485,333 | |
|
Academic Loan Funding Trust
Series 2012-1A Class A2(b)(c) | |
12/27/44 | | | 1.299% | | | | 3,500,000 | | | | 3,374,037 | |
|
Access Group, Inc.
Series 2005-2 Class A3(c) | |
11/22/24 | | | 0.509% | | | | 1,226,937 | | | | 1,200,561 | |
|
Ally Auto Receivables Trust
Series 2015-SN1 Class A2B(c) | |
06/20/17 | | | 0.583% | | | | 2,925,000 | | | | 2,925,064 | |
|
Ally Master Owner Trust
Series 2014-2 Class A(c) | |
01/16/18 | | | 0.568% | | | | 1,825,000 | | | | 1,825,658 | |
|
AmeriCredit Automobile Receivables Trust
Series 2015-2 Class D | |
06/08/21 | | | 3.000% | | | | 1,920,000 | | | | 1,911,108 | |
Series 2015-3 Class D | |
08/08/21 | | | 3.340% | | | | 1,000,000 | | | | 1,005,929 | |
|
AmeriCredit Automobile Receivables Trust(c)
Series 2014-2 Class A2B | |
10/10/17 | | | 0.472% | | | | 1,173,531 | | | | 1,173,016 | |
Series 2015-1 Class A2B | |
04/09/18 | | | 0.612% | | | | 8,284,912 | | | | 8,285,637 | |
| | | | | | | | | | | | |
| Asset-Backed Securities — Non-Agency (continued) | |
| Issuer | | Coupon
Rate | | | Principal
Amount ($) | | | Value ($) | |
American Money Management Corp.
Series 2015-16A Class A1(b)(c) | |
04/14/27 | | | 1.774% | | | | 5,000,000 | | | | 4,978,730 | |
|
Apidos CDO V(b)(c)
Series 2007-5A Class A1 | |
04/15/21 | | | 0.529% | | | | 1,823,561 | | | | 1,815,913 | |
Series 2007-5A Class A1S | |
04/15/21 | | | 0.519% | | | | 1,326,632 | | | | 1,318,507 | |
|
Apidos CLO XVIII
Series 2014-18A Class A1(b)(c) | |
07/22/26 | | | 1.707% | | | | 4,550,000 | | | | 4,530,835 | |
|
Ares XXX CLO Ltd.
Series 2014-30A Class A2(b)(c) | |
04/20/23 | | | 1.137% | | | | 1,487,985 | | | | 1,477,003 | |
|
Ascentium Equipment Receivables
Series 2015-1A
Class A2(b) | |
07/10/17 | | | 1.150% | | | | 1,345,000 | | | | 1,345,831 | |
|
Asset-Backed Funding Certificates Trust
Series 2005-WF1 Class A2C(c) | |
12/25/34 | | | 0.819% | | | | 6,551,153 | | | | 6,517,585 | |
|
Asset-Backed Securities Corp. Home Equity Loan Trust
Series 2006-HE1 Class A4(c) | |
01/25/36 | | | 0.499% | | | | 3,230,000 | | | | 2,885,097 | |
|
Avis Budget Rental Car Funding AESOP LLC
Series 2015-2A Class A(b) | |
12/20/21 | | | 2.630% | | | | 3,125,000 | | | | 3,129,813 | |
|
BA Credit Card Trust
Series 2014-A2 Class A(c) | |
09/16/19 | | | 0.468% | | | | 3,660,000 | | | | 3,657,004 | |
|
BMW Vehicle Owner Trust
Series 2013-A Class A3 | |
11/27/17 | | | 0.670% | | | | 1,643,960 | | | | 1,644,527 | |
|
Babson CLO Ltd.(b)(c)
Series 2006-2A Class A2 | |
10/16/20 | | | 0.529% | | | | 1,786,347 | | | | 1,765,119 | |
Series 2015-IA Class A | |
04/20/27 | | | 1.709% | | | | 5,000,000 | | | | 4,980,920 | |
|
Barclays Dryrock Issuance Trust(c)
Series 2014-1 Class A | |
12/16/19 | | | 0.558% | | | | 4,160,000 | | | | 4,155,420 | |
Series 2014-2 Class A | |
03/16/20 | | | 0.538% | | | | 3,990,000 | | | | 3,982,826 | |
|
Brazos Higher Education Authority, Inc.
Series 2005-1 Class 1A3(c) | |
09/26/22 | | | 0.391% | | | | 1,638,901 | | | | 1,630,895 | |
|
CIT Education Loan Trust
Series 2007-1 Class B(b)(c) | |
06/25/42 | | | 0.581% | | | | 1,074,254 | | | | 884,072 | |
|
CNH Equipment Trust
Series 2015-B Class A2A | |
08/15/18 | | | 0.840% | | | | 1,970,000 | | | | 1,967,023 | |
|
CNH Equipment Trust(c)
Series 2015-B Class A2B | |
08/15/18 | | | 0.488% | | | | 2,650,000 | | | | 2,647,154 | |
The accompanying Notes to Financial Statements are an integral part of this statement.
| | |
| |
| ACTIVE PORTFOLIOS® MULTI-MANAGER CORE PLUS BOND FUND | | |
PORTFOLIO OF INVESTMENTS (continued)
August 31, 2015
| | | | | | | | | | | | |
| Asset-Backed Securities — Non-Agency (continued) | |
| Issuer | | Coupon
Rate | | | Principal
Amount ($) | | | Value ($) | |
CWABS Asset-Backed Certificates Trust
Series 2005-1 Class MV3(c) | |
07/25/35 | | | 0.679% | | | | 2,500,694 | | | | 2,484,604 | |
|
Cabela’s Credit Card Master Note Trust
Series 2015-2 Class A1 | |
07/17/23 | | | 2.250% | | | | 2,675,000 | | | | 2,677,707 | |
|
Cabela’s Credit Card Master Note Trust(b)(c)
Series 2012-1A Class A2 | |
02/18/20 | | | 0.728% | | | | 1,570,000 | | | | 1,570,718 | |
|
Cabela’s Master Credit Card Trust
Series 2014-1 Class A(c) | |
03/16/20 | | | 0.548% | | | | 540,000 | | | | 539,291 | |
|
California Republic Auto Receivables Trust
Series 2014-2 Class A2 | |
03/15/17 | | | 0.540% | | | | 131,333 | | | | 131,281 | |
|
Capital Auto Receivables Asset Trust
Series 2015-2 Class D | |
11/20/20 | | | 3.160% | | | | 2,108,000 | | | | 2,107,776 | |
Series 2015-3 Class D | |
03/22/21 | | | 3.340% | | | | 1,100,000 | | | | 1,103,003 | |
|
Capital Auto Receivables Asset Trust(c)
Series 2015-2 Class A1B | |
10/20/17 | | | 0.600% | | | | 750,000 | | | | 749,474 | |
|
Capital One Multi-Asset Execution Trust
Series 2013-A3 Class A3 | |
09/16/19 | | | 0.960% | | | | 8,215,000 | | | | 8,220,127 | |
Series 2014-A2 Class A2 | |
01/15/20 | | | 1.260% | | | | 1,415,000 | | | | 1,419,296 | |
|
CarMax Auto Owner Trust
Series 2015-3 Class A3 | |
05/15/20 | | | 1.630% | | | | 3,570,000 | | | | 3,573,279 | |
|
Carlyle Global Market Strategies CLO
Series 2014-3A Class A1B(b)(c) | |
07/27/26 | | | 1.630% | | | | 3,700,000 | | | | 3,738,269 | |
|
Carlyle Global Market Strategies
Series 2012-2AR Class A1R(b)(c) | |
07/20/23 | | | 1.587% | | | | 3,070,000 | | | | 3,064,529 | |
|
Carrington Mortgage Loan Trust
Series 2006-NC3 Class A3(c) | |
08/25/36 | | | 0.349% | | | | 3,800,000 | | | | 2,341,085 | |
|
Cedar Funding III CLO Ltd.
Series 2014-3A Class A1(b)(c) | |
05/20/26 | | | 1.863% | | | | 5,350,000 | | | | 5,327,193 | |
|
Chase Issuance Trust
Series 2012-A4 Class A4 | |
08/16/21 | | | 1.580% | | | | 2,020,000 | | | | 2,001,709 | |
Series 2015-A4 Class A4 | | | | | | | | | | | | |
04/15/22 | | | 1.840% | | | | 8,735,000 | | | | 8,643,876 | |
|
Chase Issuance Trust(c)
Series 2007-A5 Class A5 | |
03/15/19 | | | 0.238% | | | | 8,025,000 | | | | 7,993,117 | |
Series 2012-A10 Class A10 | | | | | | | | | |
12/16/19 | | | 0.458% | | | | 3,380,000 | | | | 3,375,144 | |
Series 2012-A2 Class A2 | | | | | | | | | | | | |
05/15/19 | | | 0.468% | | | | 3,990,000 | | | | 3,983,616 | |
Series 2014-A3 Class A3 | | | | | | | | | | | | |
05/15/18 | | | 0.398% | | | | 5,225,000 | | | | 5,225,000 | |
| | | | | | | | | | | | |
| Asset-Backed Securities — Non-Agency (continued) | |
| Issuer | | Coupon
Rate | | | Principal
Amount ($) | | | Value ($) | |
Chesapeake Funding LLC(b)(c)
Series 2011-2A Class A | |
04/07/24 | | | 1.444% | | | | 1,182,927 | | | | 1,191,965 | |
Series 2012-1A Class A | | | | | | | | | | | | |
11/07/23 | | | 0.944% | | | | 89,643 | | | | 89,659 | |
Series 2012-2A Class A | | | | | | | | | | | | |
05/07/24 | | | 0.644% | | | | 422,376 | | | | 422,439 | |
Series 2013-1A Class A | | | | | | | | | | | | |
01/07/25 | | | 0.644% | | | | 1,349,455 | | | | 1,349,991 | |
Series 2014-1A Class A | | | | | | | | | | | | |
03/07/26 | | | 0.614% | | | | 4,359,830 | | | | 4,352,107 | |
|
Citibank Credit Card Issuance Trust
Series 2006-A3 Class A3 | |
03/15/18 | | | 5.300% | | | | 2,975,000 | | | | 3,047,290 | |
Series 2013-A6 Class A6 | | | | | | | | | | | | |
09/07/18 | | | 1.320% | | | | 1,165,000 | | | | 1,166,999 | |
Series 2014-A5 Class A5 | | | | | | | | | | | | |
06/07/23 | | | 2.680% | | | | 1,940,000 | | | | 1,976,575 | |
|
Citibank Credit Card Issuance Trust(c)
Series 2013-A2 Class A2 | |
05/26/20 | | | 0.480% | | | | 1,450,000 | | | | 1,445,711 | |
Series 2014-A3 Class A3 | | | | | | | | | | | | |
05/09/18 | | | 0.392% | | | | 5,245,000 | | | | 5,243,447 | |
|
Countrywide Home Equity Loan Trust(c)
Series 2007-S2 Class A3 (NPFGC) | |
05/25/37 | | | 5.813% | | | | 507,184 | | | | 503,860 | |
Series 2007-S2 Class A6 (NPFGC) | |
05/25/37 | | | 5.779% | | | | 560,750 | | | | 556,874 | |
|
Credit-Based Asset Servicing and Securitization LLC(c)
Series 2005-CB7 Class AF3 | |
11/25/35 | | | 4.005% | | | | 2,198,820 | | | | 2,138,691 | |
Series 2007-CB1 Class AF3 | |
01/25/37 | | | 4.020% | | | | 5,000,129 | | | | 2,652,338 | |
|
Crown Castle Towers LLC(b) | |
01/15/37 | | | 5.495% | | | | 2,000,000 | | | | 2,056,334 | |
|
Discover Card Execution Note Trust
Series 2015-A2 Class A | |
10/17/22 | | | 1.900% | | | | 4,590,000 | | | | 4,550,286 | |
|
Dryden Senior Loan Fund
Series 2014-33A Class B(b)(c) | |
07/15/26 | | | 2.289% | | | | 1,400,000 | | | | 1,381,689 | |
|
Dryden XXIV Senior Loan Fund
Series 2012-24RA Class AR(b)(c) | |
11/15/23 | | | 1.611% | | | | 2,560,000 | | | | 2,550,034 | |
|
EFS Volunteer No. 2 LLC
Series 2012-1 Class A2(b)(c) | |
03/25/36 | | | 1.549% | | | | 2,700,000 | | | | 2,633,523 | |
|
Education Loan Asset-Backed Trust I
Series 2013-1 Class A2(b)(c) | |
04/26/32 | | | 0.999% | | | | 4,650,000 | | | | 4,488,301 | |
|
Educational Funding of the South, Inc.
Series 2011-1 Class A2(c) | |
04/25/35 | | | 0.945% | | | | 5,227,391 | | | | 5,073,549 | |
|
Educational Services of America, Inc.
Series 2012-2 Class A(b)(c) | |
04/25/39 | | | 0.929% | | | | 2,278,537 | | | | 2,251,219 | |
The accompanying Notes to Financial Statements are an integral part of this statement.
| | |
| |
| | ACTIVE PORTFOLIOS® MULTI-MANAGER CORE PLUS BOND FUND |
PORTFOLIO OF INVESTMENTS (continued)
August 31, 2015
| | | | | | | | | | | | |
| Asset-Backed Securities — Non-Agency (continued) | |
| Issuer | | Coupon
Rate | | | Principal
Amount ($) | | | Value ($) | |
Enterprise Fleet Financing LLC(b)
Series 2013-2 Class A2 | |
03/20/19 | | | 1.060% | | | | 2,038,395 | | | | 2,039,204 | |
Series 2015-1 Class A2 | | | | | | | | | | | | |
09/20/20 | | | 1.300% | | | | 3,000,000 | | | | 2,984,817 | |
Series 2015-2 Class A2 | | | | | | | | | | | | |
02/22/21 | | | 1.590% | | | | 2,310,000 | | | | 2,314,691 | |
|
First Franklin Mortgage Loan Trust(c)
Series 2006-FF18 Class A2D | |
12/25/37 | | | 0.409% | | | | 4,581,951 | | | | 3,117,582 | |
Series 2007-FF2 Class A2B | |
03/25/37 | | | 0.299% | | | | 6,572,570 | | | | 4,204,467 | |
|
Flagship CLO VIII Ltd.
Series 2014-8A Class A(b)(c) | |
01/16/26 | | | 1.849% | | | | 2,445,000 | | | | 2,434,929 | |
|
Flatiron CLO Ltd.
Series 2015-1A Class A(b)(c) | |
04/15/27 | | | 1.689% | | | | 5,050,000 | | | | 5,039,208 | |
|
Ford Credit Auto Owner Trust
Series 2013-B Class A3 | |
10/15/17 | | | 0.570% | | | | 200,861 | | | | 200,854 | |
Series 2013-D Class A3 | | | | | | | | | | | | |
04/15/18 | | | 0.670% | | | | 3,122,305 | | | | 3,122,374 | |
Series 2015-A Class A3 | | | | | | | | | | | | |
09/15/19 | | | 1.280% | | | | 2,915,000 | | | | 2,914,926 | |
|
Ford Credit Auto Owner Trust(b)
Series 2014-2 Class A | |
04/15/26 | | | 2.310% | | | | 5,760,000 | | | | 5,806,587 | |
Series 2015-1 Class A | | | | | | | | | | | | |
07/15/26 | | | 2.120% | | | | 8,805,000 | | | | 8,784,555 | |
Series 2015-2 Class A | | | | | | | | | | | | |
01/15/27 | | | 2.440% | | | | 2,655,000 | | | | 2,677,284 | |
|
Ford Credit Floorplan Master Owner Trust
Series 2013-1 Class A1 | |
01/15/18 | | | 0.850% | | | | 4,475,000 | | | | 4,478,194 | |
|
Ford Credit Floorplan Master Owner Trust(b)
Series 2013-2 Class A | |
03/15/22 | | | 2.090% | | | | 3,775,000 | | | | 3,744,925 | |
|
GE Business Loan Trust
Series 2004-2A Class A(b)(c) | |
12/15/32 | | | 0.418% | | | | 598,015 | | | | 580,796 | |
|
GE Dealer Floorplan Master Note Trust(c)
Series 2014-1 Class A | |
07/20/19 | | | 0.583% | | | | 2,770,000 | | | | 2,740,695 | |
Series 2015-1 Class A | | | | | | | | | | | | |
01/20/20 | | | 0.703% | | | | 5,840,000 | | | | 5,796,172 | |
|
GE Equipment Small Ticket LLC
Series 2014-1A Class A2(b) | |
08/24/16 | | | 0.590% | | | | 448,717 | | | | 448,553 | |
|
GE Equipment Transportation LLC
Series 2014-1 Class A2 | |
12/23/16 | | | 0.550% | | | | 395,452 | | | | 395,185 | |
|
GFT Mortgage Loan Trust
Series 2015-GFT1 Class A(b)(c) | |
01/25/55 | | | 3.721% | | | | 2,279,815 | | | | 2,257,017 | |
| | | | | | | | | | | | |
| Asset-Backed Securities — Non-Agency (continued) | |
| Issuer | | Coupon
Rate | | | Principal
Amount ($) | | | Value ($) | |
GM Financial Automobile Leasing Trust
Series 2015-1 Class A2 | |
12/20/17 | | | 1.100% | | | | 6,970,000 | | | | 6,986,451 | |
Series 2015-2 Class A3 | |
12/20/18 | | | 1.680% | | | | 5,800,000 | | | | 5,840,222 | |
|
GM Financial Automobile Leasing Trust(c)
Series 2015-2 Class A2B | |
04/20/18 | | | 0.623% | | | | 3,385,000 | | | | 3,371,632 | |
|
GMF Floorplan Owner Revolving Trust
Series 2015-1 Class A2(b)(c) | |
05/15/20 | | | 0.698% | | | | 680,000 | | | | 679,080 | |
|
Global SC Finance II SRL
Series 2014-1A Class A2(b) | |
07/17/29 | | | 3.090% | | | | 3,419,542 | | | | 3,412,367 | |
|
Goal Capital Funding Trust
Series 2006-1 Class B(c) | |
08/25/42 | | | 0.779% | | | | 1,398,492 | | | | 1,248,898 | |
|
Golden Credit Card Trust
Series 2015-3A Class A(b)(c) | |
07/15/19 | | | 0.640% | | | | 2,035,000 | | | | 2,032,280 | |
|
Goldentree Loan Opportunities VIII Ltd.
Series 2014-8A Class A(b)(c) | |
04/19/26 | | | 1.737% | | | | 12,035,000 | | | | 11,998,883 | |
|
GreatAmerica Leasing Receivables
Series 2015-1 Class A2(b) | |
06/20/17 | | | 1.120% | | | | 1,615,000 | | | | 1,616,435 | |
|
HSBC Home Equity Loan Trust
Series 2007-3 Class APT(c) | |
11/20/36 | | | 1.403% | | | | 3,337,652 | | | | 3,328,681 | |
|
Harley-Davidson Motorcycle Trust
Series 2015-1 Class A2B(c) | |
01/15/19 | | | 0.498% | | | | 9,362,019 | | | | 9,348,551 | |
|
Henderson Receivables LLC(b)
Series 2013-3A Class A | |
01/17/73 | | | 4.080% | | | | 2,710,560 | | | | 2,828,312 | |
Series 2014-2A Class A | |
01/17/73 | | | 3.610% | | | | 3,344,421 | | | | 3,409,839 | |
|
Hertz Fleet Lease Funding LP(b)(c)
Series 2013-3 Class A | |
12/10/27 | | | 0.742% | | | | 5,199,035 | | | | 5,205,975 | |
Series 2014-1 Class A | |
04/10/28 | | | 0.592% | | | | 3,023,873 | | | | 3,025,946 | |
Series 2015-1 Class A | |
07/10/29 | | | 0.759% | | | | 4,175,000 | | | | 4,172,914 | |
|
Higher Education Funding I
Series 2014-1 Class A(b)(c) | |
05/25/34 | | | 1.249% | | | | 3,892,470 | | | | 3,780,045 | |
|
Honda Auto Receivables Owner Trust
Series 2013-4 Class A3 | |
09/18/17 | | | 0.690% | | | | 1,117,508 | | | | 1,116,948 | |
Series 2015-2 Class A2 | |
08/21/17 | | | 0.690% | | | | 1,150,000 | | | | 1,148,273 | |
Series 2015-3 Class A3 | |
04/18/19 | | | 1.270% | | | | 5,300,000 | | | | 5,294,323 | |
The accompanying Notes to Financial Statements are an integral part of this statement.
| | |
| |
| ACTIVE PORTFOLIOS® MULTI-MANAGER CORE PLUS BOND FUND | | |
PORTFOLIO OF INVESTMENTS (continued)
August 31, 2015
| | | | | | | | | | | | |
| Asset-Backed Securities — Non-Agency (continued) | |
| Issuer | | Coupon
Rate | | | Principal
Amount ($) | | | Value ($) | |
Huntington Auto Trust
Series 2015-1 Class A2 | |
10/16/17 | | | 0.760% | | | | 2,035,000 | | | | 2,033,125 | |
|
Hyundai Auto Lease Securitization Trust
Series 2015-B Class A2A(b) | |
12/15/17 | | | 0.950% | | | | 4,699,000 | | | | 4,692,810 | |
|
Hyundai Auto Receivables Trust
Series 2015-B Class A2B(c) | |
04/16/18 | | | 0.418% | | | | 2,450,000 | | | | 2,446,731 | |
|
Hyundai Floorplan Master Owner Trust
Series 2013-1A Class A(b)(c) | |
05/15/18 | | | 0.548% | | | | 3,370,000 | | | | 3,371,817 | |
|
Invitation Homes Trust
Series 2014-SFR1 Class C(b)(c) | |
06/17/31 | | | 2.298% | | | | 1,750,000 | | | | 1,738,612 | |
|
JPMorgan Mortgage Acquisition Corp.
Series 2007-CH1 Class AV4(c) | |
11/25/36 | | | 0.329% | | | | 1,023,753 | | | | 1,021,426 | |
|
MMAF Equipment Finance LLC
Series 2014-AA Class A2(b) | |
04/10/17 | | | 0.520% | | | | 1,607,046 | | | | 1,606,144 | |
|
Magnetite IX Ltd.
Series 2014-9A Class A1(b)(c) | |
07/25/26 | | | 1.715% | | | | 5,205,000 | | | | 5,178,527 | |
|
Magnetite XI Ltd.
Series 2014-11A Class A1(b)(c) | |
01/18/27 | | | 1.737% | | | | 5,000,000 | | | | 4,981,580 | |
|
Mercedes-Benz Auto Lease Trust
Series 2013-B Class A3 | |
07/15/16 | | | 0.620% | | | | 1,472,774 | | | | 1,473,088 | |
|
Mercedes-Benz Master Owner Trust
Series 2015-AA Class A(b)(c) | |
04/15/19 | | | 0.518% | | | | 4,310,000 | | | | 4,306,685 | |
|
Mid-State Capital Corp. Trust
Series 2006-1 Class A(b) | |
10/15/40 | | | 5.787% | | | | 1,489,785 | | | | 1,597,580 | |
|
Mid-State Trust VII
Series 7 Class A | |
10/15/36 | | | 6.340% | | | | 1,939,337 | | | | 2,093,243 | |
|
Montana Higher Education Student Assistance Corp.
Series 2012-1 Class A3(c) | |
07/20/43 | | | 1.253% | | | | 3,000,000 | | | | 2,821,282 | |
|
Mountain View Funding CLO
Series 2007-3A Class A1(b)(c) | |
04/16/21 | | | 0.504% | | | | 4,511,682 | | | | 4,496,486 | |
|
NRZ Advance Receivables Trust
Series 2015-T1 Class AT1(b) | |
08/15/46 | | | 2.315% | | | | 3,910,000 | | | | 3,909,998 | |
|
Nationstar Home Equity Loan Trust
Series 2007-B Class 2AV3(c) | |
04/25/37 | | | 0.449% | | | | 7,509,000 | | | | 6,439,373 | |
|
Navient Student Loan Trust(c)
Series 2014-2 Class A | |
03/25/43 | | | 0.839% | | | | 8,412,641 | | | | 7,982,712 | |
Series 2014-3 Class A | |
03/25/43 | | | 0.819% | | | | 8,439,717 | | | | 8,025,029 | |
| | | | | | | | | | | | |
| Asset-Backed Securities — Non-Agency (continued) | |
| Issuer | | Coupon
Rate | | | Principal
Amount ($) | | | Value ($) | |
Series 2014-4 Class A | |
03/25/43 | | | 0.819% | | | | 3,875,062 | | | | 3,688,715 | |
Series 2015-2 Class A3 | |
11/26/40 | | | 0.769% | | | | 5,400,000 | | | | 5,189,722 | |
|
Nelnet Student Loan Trust(b)(c)
Series 2012-5A Class A | |
10/27/36 | | | 0.799% | | | | 2,899,660 | | | | 2,797,694 | |
Series 2014-2A Class A1 | |
06/25/21 | | | 0.479% | | | | 1,464,122 | | | | 1,456,489 | |
Series 2014-4A Class A2 | |
11/25/43 | | | 1.149% | | | | 4,210,000 | | | | 3,973,120 | |
Series 2015-1A Class A | |
04/25/41 | | | 0.789% | | | | 9,500,191 | | | | 9,215,013 | |
|
Nelnet Student Loan Trust(c)
Series 2008-3 Class A4 | |
11/25/24 | | | 1.979% | | | | 6,570,000 | | | | 6,593,343 | |
|
New York City Tax Lien Trust(b)
Series 2014-A Class A | |
11/10/27 | | | 1.030% | | | | 273,476 | | | | 273,200 | |
Series 2015-A Class A | |
11/10/28 | | | 1.340% | | | | 1,205,000 | | | | 1,205,000 | |
|
Nissan Auto Lease Trust
Series 2013-B Class A3 | |
06/15/16 | | | 0.750% | | | | 949,572 | | | | 949,892 | |
|
Nissan Auto Receivables Owner Trust
Series 2015-A Class A1(c) | |
01/15/20 | | | 0.598% | | | | 6,655,000 | | | | 6,656,112 | |
|
OZLM VII Ltd.(b)(c)
Series 2014-7A Class A1B | |
07/17/26 | | | 1.779% | | | | 2,870,000 | | | | 2,858,718 | |
Series 2014-7A Class A2A | |
07/17/26 | | | 2.339% | | | | 2,025,000 | | | | 1,993,560 | |
|
Oak Hill Credit Partners X Ltd.(b)(c)
Series 2014-10A Class A | |
07/20/26 | | | 1.757% | | | | 2,720,000 | | | | 2,711,932 | |
Series 2014-10A Class B | | | | | | | | | | | | |
07/20/26 | | | 2.387% | | | | 3,110,000 | | | | 3,087,204 | |
|
Octagon Investment Partners XIX Ltd.
Series 2014-A Class 1A(b)(c) | |
04/15/26 | | | 1.809% | | | | 3,110,000 | | | | 3,096,353 | |
|
Octagon Investment Partners XXI Ltd.
Series 2014-1A Class A1B(b)(c) | |
11/14/26 | | | 1.629% | | | | 3,635,000 | | | | 3,627,574 | |
|
Ocwen Freddie Advance Funding LLC Advance
Receivables Backed Notes
Series 2015-T2 Class AT2(b) | |
09/15/45 | | | 2.014% | | | | 2,010,000 | | | | 2,009,980 | |
|
Ocwen Freddie Advance Funding LLC
Series 2015-T1 Class AT1(b) | |
11/15/45 | | | 2.062% | | | | 750,000 | | | | 749,918 | |
|
OneMain Financial Issuance Trust
Series 2015-2A Class A(b) | |
07/18/25 | | | 2.570% | | | | 3,625,000 | | | | 3,623,867 | |
|
Option One Mortgage Loan Trust
Series 2005-2 Class M1(c) | |
05/25/35 | | | 0.859% | | | | 10,770,000 | | | | 10,333,707 | |
The accompanying Notes to Financial Statements are an integral part of this statement.
| | |
| |
| | ACTIVE PORTFOLIOS® MULTI-MANAGER CORE PLUS BOND FUND |
PORTFOLIO OF INVESTMENTS (continued)
August 31, 2015
| | | | | | | | | | | | |
| Asset-Backed Securities — Non-Agency (continued) | |
| Issuer | | Coupon
Rate | | | Principal
Amount ($) | | | Value ($) | |
Park Place Securities, Inc. Asset-Backed Pass-Through Certificates
Series 2004-WWF1 Class M2(c) | |
12/25/34 | | | 1.219% | | | | 809,299 | | | | 809,846 | |
|
Porsche Innovative Lease Owner Trust
Series 2015-1 Class A2(b) | |
11/21/17 | | | 0.790% | | | | 990,000 | | | | 987,762 | |
|
Residential Asset Mortgage Products Trust(c)
Series 2006-RS3 Class A3 | |
05/25/36 | | | 0.399% | | | | 251,133 | | | | 248,363 | |
Series 2006-RZ3 Class A3 | | | | | |
08/25/36 | | | 0.489% | | | | 4,781,000 | | | | 4,351,222 | |
|
SG Mortgage Securities Trust
Series 2005-OPT1 Class A3(c) | |
10/25/35 | | | 0.549% | | | | 1,644,975 | | | | 1,608,377 | |
|
SLC Student Loan Trust
Series 2006-2 Class A5(c) | |
09/15/26 | | | 0.386% | | | | 4,000,000 | | | | 3,886,816 | |
|
SLM Private Education Loan Trust
Series 2013-B Class A2B(b)(c) | |
06/17/30 | | | 1.298% | | | | 1,200,000 | | | | 1,203,630 | |
|
SLM Student Loan Trust(b)(c)
Series 2003-12 Class A5 | |
09/15/22 | | | 0.566% | | | | 5,680,186 | | | | 5,649,036 | |
|
SLM Student Loan Trust(c)
Series 2004-8 Class B | |
01/25/40 | | | 0.755% | | | | 699,419 | | | | 594,704 | |
Series 2005-4 Class A3 | | | | | | | | | | | | |
01/25/27 | | | 0.415% | | | | 8,352,036 | | | | 7,938,836 | |
Series 2007-6 Class B | | | | | | | | | | | | |
04/27/43 | | | 1.145% | | | | 1,020,384 | | | | 841,977 | |
Series 2008-2 Class B | | | | | | | | | | | | |
01/25/29 | | | 1.495% | | | | 1,165,000 | | | | 934,773 | |
Series 2008-3 Class B | | | | | | | | | | | | |
04/25/29 | | | 1.495% | | | | 1,165,000 | | | | 960,426 | |
Series 2008-4 Class A4 | | | | | | | | | | | | |
07/25/22 | | | 1.945% | | | | 4,250,000 | | | | 4,270,736 | |
Series 2008-4 Class B | | | | | | | | | | | | |
04/25/29 | | | 2.145% | | | | 1,165,000 | | | | 1,055,722 | |
Series 2008-5 Class B | | | | | | | | | | | | |
07/25/29 | | | 2.145% | | | | 1,165,000 | | | | 1,080,315 | |
Series 2008-6 Class B | | | | | | | | | | | | |
07/25/29 | | | 2.145% | | | | 1,165,000 | | | | 1,019,177 | |
Series 2008-7 Class B | | | | | | | | | | | | |
07/25/29 | | | 2.145% | | | | 1,165,000 | | | | 1,017,383 | |
Series 2008-8 Class B | | | | | | | | | | | | |
10/25/29 | | | 2.545% | | | | 1,165,000 | | | | 1,110,586 | |
Series 2008-9 Class B | | | | | | | | | | | | |
10/25/29 | | | 2.545% | | | | 1,165,000 | | | | 1,120,404 | |
Series 2011-1 Class A2 | | | | | | | | | | | | |
10/25/34 | | | 1.349% | | | | 3,285,000 | | | | 3,211,764 | |
Series 2012-7 Class A3 | | | | | | | | | | | | |
05/26/26 | | | 0.849% | | | | 4,000,000 | | | | 3,861,636 | |
Series 2013-2 Class A | | | | | | | | | | | | |
09/25/26 | | | 0.649% | | | | 7,775,931 | | | | 7,546,666 | |
Series 2014-2 Class A1 | | | | | | | | | | | | |
07/25/19 | | | 0.449% | | | | 733,349 | | | | 731,007 | |
| | | | | | | | | | | | |
| Asset-Backed Securities — Non-Agency (continued) | |
| Issuer | | Coupon
Rate | | | Principal
Amount ($) | | | Value ($) | |
SMART Trust
Series 2013-1US Class A3A | |
09/14/16 | | | 0.840% | | | | 73,991 | | | | 73,982 | |
|
SMART Trust(b)
Series 2012-1USA Class A4A | |
12/14/17 | | | 2.010% | | | | 1,109,463 | | | | 1,118,338 | |
|
SMART Trust(c)
Series 2013-1US Class A3B | |
09/14/16 | | | 0.644% | | | | 75,698 | | | | 75,684 | |
|
Santander Drive Auto Receivables Trust
Series 2015-1 Class D | |
04/15/21 | | | 3.240% | | | | 3,140,000 | | | | 3,151,699 | |
Series 2015-2 Class D | | | | | | | | | | | | |
04/15/21 | | | 3.020% | | | | 2,800,000 | | | | 2,779,809 | |
Series 2015-3 Class D | | | | | | | | | | | | |
05/17/21 | | | 3.490% | | | | 2,300,000 | | | | 2,314,119 | |
|
Santander Drive Auto Receivables Trust(c)
Series 2014-2 Class A2B | |
07/17/17 | | | 0.518% | | | | 284,969 | | | | 284,970 | |
Series 2014-3 Class A2B | | | | | | | | | | | | |
08/15/17 | | | 0.478% | | | | 395,759 | | | | 395,761 | |
Series 2015-2 Class A2B | | | | | | | | | | | | |
09/17/18 | | | 0.648% | | | | 7,075,000 | | | | 7,074,999 | |
|
Scholar Funding Trust
Series 2011-A Class A(b)(c) | |
10/28/43 | | | 1.194% | | | | 1,111,526 | | | | 1,105,711 | |
|
Selene Non-Performing Loans LLC
Series 2014-1A Class A(b)(c) | |
05/25/54 | | | 2.981% | | | | 561,532 | | | | 556,292 | |
|
SpringCastle America Funding LLC
Series 2014-AA Class A(b) | |
05/25/23 | | | 2.700% | | | | 1,894,427 | | | | 1,901,429 | |
|
Structured Asset Investment Loan Trust
Series 2005-8 Class A4(c) | |
10/25/35 | | | 0.559% | | | | 2,919,055 | | | | 2,864,273 | |
|
Symphony CLO Ltd.
Series 2014-14A Class B1(b)(c) | |
07/14/26 | | | 2.336% | | | | 2,040,000 | | | | 2,027,291 | |
|
Symphony CLO V Ltd.
Series 2007-5A Class A1(b)(c) | |
01/15/24 | | | 1.039% | | | | 3,415,001 | | | | 3,385,687 | |
|
TAL Advantage V LLC
Series 2014-2A Class A1(b) | |
05/20/39 | | | 1.700% | | | | 806,923 | | | | 801,341 | |
|
TCF Auto Receivables Owner Trust
Series 2014-1A Class A2(b) | |
05/15/17 | | | 0.590% | | | | 413,802 | | | | 413,812 | |
|
Toyota Auto Receivables Owner Trust
Series 2015-C Class A3 | |
06/17/19 | | | 1.340% | | | | 5,655,000 | | | | 5,654,174 | |
|
Toyota Auto Receivables Owner Trust(c)
Series 2015-B Class A2B | |
11/15/17 | | | 0.408% | | | | 2,030,000 | | | | 2,030,166 | |
|
Truman Capital Mortgage Loan Trust
Series 2014-NPL2 Class A1(b)(c) | |
06/25/54 | | | 3.125% | | | | 239,439 | | | | 238,748 | |
The accompanying Notes to Financial Statements are an integral part of this statement.
| | |
| |
| ACTIVE PORTFOLIOS® MULTI-MANAGER CORE PLUS BOND FUND | | |
PORTFOLIO OF INVESTMENTS (continued)
August 31, 2015
| | | | | | | | | | | | |
| Asset-Backed Securities — Non-Agency (continued) | |
| Issuer | | Coupon
Rate | | | Principal
Amount ($) | | | Value ($) | |
USAA Auto Owner Trust
Series 2015-1 Class A2 | |
03/15/18 | | | 0.820% | | | | 3,090,000 | | | | 3,086,335 | |
Series 2015-1 Class A3 | | | | | | | | | | | | |
06/17/19 | | | 1.200% | | | | 2,040,000 | | | | 2,037,339 | |
|
Venture XI CLO Ltd.
Series 2012-11AR Class AR(b)(c) | |
11/14/22 | | | 1.609% | | | | 4,350,000 | | | | 4,337,041 | |
|
Volkswagen Auto Lease Trust
Series 2015-A Class A2B(c) | |
06/20/17 | | | 0.523% | | | | 1,514,658 | | | | 1,513,113 | |
|
Volkswagen Auto Loan Enhanced Trust
Series 2013-1 Class A3 | |
08/21/17 | | | 0.560% | | | | 356,793 | | | | 356,478 | |
Series 2013-2 Class A3 | | | | | | | | | | | | |
04/20/18 | | | 0.700% | | | | 3,208,830 | | | | 3,201,021 | |
|
Voya CLO Ltd.
Series 2014-2A Class A1(b)(c) | |
07/17/26 | | | 1.739% | | | | 5,000,000 | | | | 4,985,200 | |
|
WaMu Asset-Backed Certificates
Series 2007-HE1 Class 2A3(c) | |
01/25/37 | | | 0.349% | | | | 6,271,768 | | | | 3,715,376 | |
|
Wachovia Student Loan Trust
Series 2006-1 Class A6(b)(c) | |
04/25/40 | | | 0.465% | | | | 9,000,000 | | | | 8,109,567 | |
|
Westlake Automobile Receivables Trust
Series 2014-1A Class A2(b) | |
05/15/17 | | | 0.700% | | | | 344,446 | | | | 344,559 | |
|
Wheels SPV 2 LLC
Series 2015-1A Class A2(b) | |
04/22/24 | | | 1.270% | | | | 1,500,000 | | | | 1,500,216 | |
|
World Financial Network Credit Card Master Trust
Series 2012-D Class A | |
04/17/23 | | | 2.150% | | | | 2,150,000 | | | | 2,154,784 | |
Series 2015-B Class A | | | | | | | | | | | | |
06/17/24 | | | 2.550% | | | | 5,030,000 | | | | 5,029,189 | |
|
World Financial Network Credit Card Master Trust(c) | |
Series 2014-A Class A | | | | | | | | | | | | |
12/15/19 | | | 0.578% | | | | 1,880,000 | | | | 1,873,535 | |
|
World Omni Automobile Lease Securitization Trust
Series 2015-A Class A3 | |
10/15/18 | | | 1.540% | | | | 2,280,000 | | | | 2,283,839 | |
|
World Omni Automobile Lease Securitization Trust(c)
Series 2015-A Class A2B | |
05/15/18 | | | 0.578% | | | | 1,360,000 | | | | 1,358,386 | |
| | | | | | | | | | | | | |
Total Asset-Backed Securities — Non-Agency | |
(Cost: $635,513,901) | | | | | | | | 637,559,307 | |
| | | |
| | | | | | | | | | | | |
| Inflation-Indexed Bonds 2.9% | |
UNITED STATES 2.9% | |
U.S. Treasury Inflation-Indexed Bond | |
04/15/16 | | | 0.125% | | | | 6,108,384 | | | | 6,049,768 | |
04/15/17 | | | 0.125% | | | | 16,926,133 | | | | 16,865,080 | |
| | | | | | | | | | | | |
| Inflation-Indexed Bonds (continued) | |
| Issuer | | Coupon
Rate | | | Principal
Amount ($) | | | Value ($) | |
04/15/19 | | | 0.125% | | | | 10,387,986 | | | | 10,369,454 | |
04/15/20 | | | 0.125% | | | | 7,133,210 | | | | 7,105,069 | |
01/15/22 | | | 0.125% | | | | 316,308 | | | | 309,220 | |
07/15/22 | | | 0.125% | | | | 8,509,304 | | | | 8,318,287 | |
01/15/24 | | | 0.625% | | | | 12,273,000 | | | | 12,296,650 | |
07/15/24 | | | 0.125% | | | | 16,778,809 | | | | 16,118,143 | |
01/15/25 | | | 0.250% | | | | 27,339,327 | | | | 26,370,339 | |
07/15/25 | | | 0.375% | | | | 387,426 | | | | 380,056 | |
02/15/43 | | | 0.625% | | | | 5,750,298 | | | | 5,024,996 | |
02/15/44 | | | 1.375% | | | | 28,757,355 | | | | 30,248,769 | |
02/15/45 | | | 0.750% | | | | 11,415,951 | | | | 10,280,452 | |
| | | | | | | | | | | | | |
Total | | | | | | | | | | | 149,736,283 | |
| | | | | | | | | | | | | |
Total Inflation-Indexed Bonds | | | | | |
(Cost: $154,704,422) | | | | | | | | | | | 149,736,283 | |
| | | |
| | | | | | | | | | | | |
| U.S. Treasury Obligations 18.3% | |
U.S. Treasury | | | | | | | | | | | | |
11/15/15 | | | 0.375% | | | | 77,041,000 | | | | 77,076,131 | |
07/15/17 | | | 0.875% | | | | 2,000,000 | | | | 2,005,390 | |
08/31/17 | | | 0.625% | | | | 133,138,000 | | | | 132,829,386 | |
03/15/18 | | | 1.000% | | | | 15,000,000 | | | | 15,017,580 | |
06/15/18 | | | 1.125% | | | | 3,748,000 | | | | 3,758,296 | |
08/15/18 | | | 1.000% | | | | 5,407,000 | | | | 5,399,396 | |
09/30/19 | | | 1.000% | | | | 4,000,000 | | | | 3,935,728 | |
10/31/19 | | | 1.250% | | | | 18,400,000 | | | | 18,275,414 | |
12/31/19 | | | 1.625% | | | | 4,200,000 | | | | 4,230,299 | |
03/31/20 | | | 1.375% | | | | 12,000,000 | | | | 11,940,000 | |
06/30/20 | | | 1.625% | | | | 10,000,000 | | | | 10,043,750 | |
07/31/20 | | | 1.625% | | | | 84,240,000 | | | | 84,555,900 | |
08/31/21 | | | 2.000% | | | | 500,000 | | | | 505,260 | |
05/31/22 | | | 1.875% | | | | 320,000 | | | | 319,192 | |
08/31/22 | | | 1.875% | | | | 33,313,000 | | | | 33,187,210 | |
05/15/24 | | | 2.500% | | | | 500,000 | | | | 514,232 | |
08/15/24 | | | 2.375% | | | | 15,400,000 | | | | 15,659,274 | |
02/15/25 | | | 2.000% | | | | 17,990,000 | | | | 17,674,941 | |
05/15/25 | | | 2.125% | | | | 71,500,000 | | | | 70,938,582 | |
02/15/36 | | | 4.500% | | | | 2,700,000 | | | | 3,487,325 | |
05/15/43 | | | 2.875% | | | | 9,900,000 | | | | 9,756,141 | |
11/15/43 | | | 3.750% | | | | 13,500,000 | | | | 15,690,591 | |
05/15/44 | | | 3.375% | | | | 1,890,000 | | | | 2,049,518 | |
08/15/44 | | | 3.125% | | | | 2,110,000 | | | | 2,182,806 | |
11/15/44 | | | 3.000% | | | | 2,500,000 | | | | 2,523,437 | |
02/15/45 | | | 2.500% | | | | 265,000 | | | | 241,067 | |
08/15/45 | | | 2.875% | | | | 40,480,000 | | | | 40,011,970 | |
| | | |
U.S. Treasury(j)
STRIPS | | | | | | | | | | | | |
05/15/43 | | | 0.000% | | | | 33,927,000 | | | | 14,539,823 | |
| | | |
U.S. Treasury(l) | | | | | | | | | | | | |
09/30/15 | | | 0.250% | | | | 46,545,000 | | | | 46,549,370 | |
04/30/17 | | | 0.875% | | | | 35,000,000 | | | | 35,116,200 | |
08/31/20 | | | 1.375% | | | | 114,549,000 | | | | 113,636,188 | |
08/15/25 | | | 2.000% | | | | 64,120,300 | | | | 62,976,458 | |
05/15/45 | | | 3.000% | | | | 72,934,000 | | | | 73,777,263 | |
| | | | | | | | | | | | | |
Total U.S. Treasury Obligations | | | | | |
(Cost: $927,477,746) | | | | | | | | | | | 930,404,118 | |
| | | |
| | | | | | | | | | | | |
The accompanying Notes to Financial Statements are an integral part of this statement.
| | |
| |
| | ACTIVE PORTFOLIOS® MULTI-MANAGER CORE PLUS BOND FUND |
PORTFOLIO OF INVESTMENTS (continued)
August 31, 2015
| | | | | | | | | | | | |
| U.S. Government & Agency Obligations 1.1% | |
| Issuer | | Coupon
Rate | | | Principal
Amount ($) | | | Value ($) | |
Federal Farm Credit Banks | |
10/22/25 | | | 2.730% | | | | 3,855,000 | | | | 3,753,949 | |
|
Federal Home Loan Banks(c) | |
06/28/30 | | | 1.250% | | | | 10,395,000 | | | | 10,358,586 | |
|
Federal National Mortgage Association | |
02/12/18 | | | 8.950% | | | | 9,612,000 | | | | 11,446,085 | |
|
Residual Funding Corp.(j)
STRIPS | |
10/15/19 | | | 0.000% | | | | 18,559,000 | | | | 17,309,441 | |
01/15/21 | | | 0.000% | | | | 11,946,000 | | | | 10,664,505 | |
01/15/30 | | | 0.000% | | | | 6,390,000 | | | | 4,088,910 | |
| | | | | | | | | | | | | |
Total U.S. Government & Agency Obligations | | | | | |
(Cost: $57,589,070) | | | | | | | | | | | 57,621,476 | |
| | | |
| | | | | | | | | | | | |
| Foreign Government Obligations(a)(m) 1.5% | |
ARGENTINA —% | |
Argentina Republic Government International Bond(d) | |
12/31/33 | | | 8.280% | | | | 168,245 | | | | 167,067 | |
12/31/33 | | | 8.280% | | | | 112,163 | | | | 114,967 | |
| | | |
City of Buenos Aires(b) | | | | | | | | | | | | |
02/19/21 | | | 8.950% | | | | 200,000 | | | | 206,500 | |
|
Provincia de Buenos Aires | |
01/26/21 | | | 10.875% | | | | 400,000 | | | | 408,000 | |
| | | | | | | | | | | | | |
Total | | | | | | | | | | | 896,534 | |
| | | |
| | | | | | | | | | | | |
ARMENIA —% | |
Republic of Armenia(b) | | | | | | | | | | | | |
09/30/20 | | | 6.000% | | | | 200,000 | | | | 190,580 | |
03/26/25 | | | 7.150% | | | | 200,000 | | | | 193,000 | |
| | | | | | | | | | | | | |
Total | | | | | | | | | | | 383,580 | |
| | | |
| | | | | | | | | | | | |
BRAZIL 0.2% | |
Brazilian Government International Bond | |
01/17/17 | | | 6.000% | | | | 4,000,000 | | | | 4,210,000 | |
01/22/21 | | | 4.875% | | | | 2,060,000 | | | | 2,089,905 | |
01/05/23 | | | 2.625% | | | | 200,000 | | | | 171,500 | |
01/20/34 | | | 8.250% | | | | 923,000 | | | | 1,082,217 | |
01/07/41 | | | 5.625% | | | | 1,009,000 | | | | 906,839 | |
01/27/45 | | | 5.000% | | | | 250,000 | | | | 201,250 | |
|
Petrobras Global Finance BV | |
03/15/19 | | | 7.875% | | | | 200,000 | | | | 201,556 | |
01/20/20 | | | 5.750% | | | | 400,000 | | | | 363,852 | |
05/20/23 | | | 4.375% | | | | 1,950,000 | | | | 1,532,115 | |
| | | | | | | | | | | | | |
Total | | | | | | | | | | | 10,759,234 | |
| | | |
| | | | | | | | | | | | |
CHILE —% | |
Chile Government International Bond | |
10/30/22 | | | 2.250% | | | | 730,000 | | | | 707,370 | |
| | | |
Codelco(b) | | | | | | | | | | | | |
07/17/22 | | | 3.000% | | | | 200,000 | | | | 185,794 | |
|
Empresa Nacional del Petroleo(b) | |
08/10/20 | | | 5.250% | | | | 100,000 | | | | 104,947 | |
| | | | | | | | | | | | | |
Total | | | | | | | | | | | 998,111 | |
| | | | | | | | | | | | |
| Foreign Government Obligations(a)(m) (continued) | |
| Issuer | | Coupon
Rate | | | Principal
Amount ($) | | | Value ($) | |
CHINA —% | | | | | | | | | | | | |
Bank of China Ltd. | | | | | | | | | | | | |
11/13/24 | | | 5.000% | | | | 200,000 | | | | 202,776 | |
| | | |
Bank of China Ltd.(b) | | | | | | | | | | | | |
11/13/24 | | | 5.000% | | | | 200,000 | | | | 202,776 | |
| | | | | | | | | | | | | |
Total | | | | | | | | | | | 405,552 | |
| | | |
| | | | | | | | | | | | |
COLOMBIA 0.1% | |
Colombia Government International Bond | |
07/12/21 | | | 4.375% | | | | 700,000 | | | | 715,750 | |
01/18/41 | | | 6.125% | | | | 1,441,000 | | | | 1,496,202 | |
06/15/45 | | | 5.000% | | | | 600,000 | | | | 533,250 | |
|
Corporación Andina de Fomento | |
06/04/19 | | | 8.125% | | | | 1,400,000 | | | | 1,705,717 | |
06/15/22 | | | 4.375% | | | | 400,000 | | | | 433,510 | |
| | | | | | | | | | | | | |
Total | | | | | | | | | | | 4,884,429 | |
| | | |
| | | | | | | | | | | | |
CROATIA —% | |
Croatia Government International Bond | |
01/26/24 | | | 6.000% | | | | 300,000 | | | | 320,064 | |
|
Croatia Government International Bond(b) | |
01/26/24 | | | 6.000% | | | | 1,000,000 | | | | 1,066,880 | |
| | | | | | | | | | | | | |
Total | | | | | | | | | | | 1,386,944 | |
| | | |
| | | | | | | | | | | | |
DENMARK 0.1% | |
Danske Bank A/S(c) | | | | | | | | | | | | |
12/31/49 | | | 5.750% | | | EUR | 2,817,000 | | | | 3,207,023 | |
| | | |
| | | | | | | | | | | | |
DOMINICAN REPUBLIC —% | |
Dominican Republic International Bond | |
05/06/21 | | | 7.500% | | | | 100,000 | | | | 110,375 | |
| | | |
| | | | | | | | | | | | |
ECUADOR —% | |
Ecuador Government International Bond | |
06/20/24 | | | 7.950% | | | | 200,000 | | | | 146,000 | |
| | | |
| | | | | | | | | | | | |
EGYPT —% | |
Egypt Government International Bond | |
04/30/40 | | | 6.875% | | | | 150,000 | | | | 142,530 | |
|
Egypt Government International Bond(b) | |
06/11/25 | | | 5.875% | | | | 200,000 | | | | 193,000 | |
| | | | | | | | | | | | | |
Total | | | | 335,530 | |
| | | |
| | | | | | | | | | | | |
EL SALVADOR —% | |
El Salvador Government International Bond | | | | | |
02/01/41 | | | 7.625% | | | | 500,000 | | | | 473,250 | |
| | | |
| | | | | | | | | | | | |
FRANCE 0.2% | |
Electricite de France SA(b) | |
01/27/40 | | | 5.600% | | | | 1,500,000 | | | | 1,704,663 | |
The accompanying Notes to Financial Statements are an integral part of this statement.
| | |
| |
| ACTIVE PORTFOLIOS® MULTI-MANAGER CORE PLUS BOND FUND | | |
PORTFOLIO OF INVESTMENTS (continued)
August 31, 2015
| | | | | | | | | | | | |
| Foreign Government Obligations(a)(m) (continued) | |
| Issuer | | Coupon
Rate | | | Principal
Amount ($) | | | Value ($) | |
Electricite de France SA(b)(c) | |
12/31/49 | | | 5.250% | | | | 2,470,000 | | | | 2,494,700 | |
12/31/49 | | | 5.625% | | | | 2,700,000 | | | | 2,737,800 | |
| | | | | | | | | | | | | |
Total | | | | | | | | | | | 6,937,163 | |
| | | |
| | | | | | | | | | | | |
GABON —% | |
Gabonese Republic(b) | |
06/16/25 | | | 6.950% | | | | 200,000 | | | | 178,700 | |
| | | |
| | | | | | | | | | | | |
GHANA —% | |
Republic of Ghana | | | | | | | | | | | | |
10/04/17 | | | 8.500% | | | | 220,000 | | | | 226,050 | |
08/07/23 | | | 7.875% | | | | 200,000 | | | | 179,000 | |
| | | | | | | | | | | | | |
Total | | | | | | | | | | | 405,050 | |
| | | |
| | | | | | | | | | | | |
HUNGARY 0.1% | |
Hungary Government International Bond | |
02/19/18 | | | 4.125% | | | | 70,000 | | | | 72,824 | |
03/29/21 | | | 6.375% | | | | 546,000 | | | | 623,526 | |
|
Magyar Export-Import Bank Zrt.(b) | |
01/30/20 | | | 4.000% | | | | 1,000,000 | | | | 1,010,000 | |
| | | | | | | | | | | | | |
Total | | | | | | | | | | | 1,706,350 | |
| | | |
| | | | | | | | | | | | |
INDONESIA 0.1% | |
Indonesia Government International Bond | |
01/17/18 | | | 6.875% | | | | 100,000 | | | | 110,000 | |
03/04/19 | | | 11.625% | | | | 200,000 | | | | 257,000 | |
10/17/23 | | | 5.375% | | | | 200,000 | | | | 210,000 | |
04/15/43 | | | 4.625% | | | | 200,000 | | | | 171,000 | |
|
Indonesia Government International Bond(b) | |
04/15/23 | | | 3.375% | | | | 500,000 | | | | 462,500 | |
|
PT Pertamina Persero | |
05/20/43 | | | 5.625% | | | | 250,000 | | | | 207,187 | |
|
PT Pertamina Persero(b) | |
05/30/44 | | | 6.450% | | | | 200,000 | | | | 184,000 | |
| | | | | | | | | | | | | |
Total | | | | | | | | | | | 1,601,687 | |
| | | |
| | | | | | | | | | | | |
IVORY COAST —% | |
Ivory Coast Government International Bond(b) | |
07/23/24 | | | 5.375% | | | | 200,000 | | | | 181,000 | |
| | | |
| | | | | | | | | | | | |
KAZAKHSTAN —% | |
KazMunayGas National Co. JSC | |
04/30/23 | | | 4.400% | | | | 200,000 | | | | 175,940 | |
|
Kazakhstan Government International Bond | |
10/14/44 | | | 4.875% | | | | 200,000 | | | | 161,248 | |
| | | | | | | | | | | | | |
Total | | | | | | | | | | | 337,188 | |
| | | |
| | | | | | | | | | | | |
LEBANON —% | |
Lebanon Government International Bond | |
02/26/30 | | | 6.650% | | | | 400,000 | | | | 400,488 | |
| | | |
| | | | | | | | | | | | |
| | | | | | | | | | | | |
| Foreign Government Obligations(a)(m) (continued) | |
| Issuer | | Coupon
Rate | | | Principal
Amount ($) | | | Value ($) | |
MEXICO 0.3% | |
Comision Federal de Electricidad | |
01/15/24 | | | 4.875% | | | | 200,000 | | | | 204,750 | |
|
Mexico Government International Bond | |
01/21/21 | | | 3.500% | | | | 1,300,000 | | | | 1,317,875 | |
03/15/22 | | | 3.625% | | | | 1,974,000 | | | | 1,978,935 | |
01/30/25 | | | 3.600% | | | | 200,000 | | | | 196,000 | |
01/11/40 | | | 6.050% | | | | 260,000 | | | | 291,200 | |
03/08/44 | | | 4.750% | | | | 5,667,000 | | | | 5,284,478 | |
|
Pemex Project Funding Master Trust | |
03/05/20 | | | 6.000% | | | | 5,965,000 | | | | 6,498,867 | |
06/15/38 | | | 6.625% | | | | 150,000 | | | | 151,125 | |
|
Petroleos Mexicanos | |
07/18/18 | | | 3.500% | | | | 55,000 | | | | 56,045 | |
|
Petroleos Mexicanos(b) | |
01/15/25 | | | 4.250% | | | | 300,000 | | | | 283,770 | |
01/23/26 | | | 4.500% | | | | 300,000 | | | | 286,302 | |
| | | | | | | | | | | | | |
Total | | | | | | | | | | | 16,549,347 | |
| | | |
| | | | | | | | | | | | |
MOROCCO —% | |
OCP SA | |
04/25/24 | | | 5.625% | | | | 500,000 | | | | 511,250 | |
| | | |
| | | | | | | | | | | | |
NETHERLANDS —% | |
EMATUM Via Mozambique Finance 2020 BV | |
09/11/20 | | | 6.305% | | | | 200,000 | | | | 179,796 | |
|
Petrobras Global Finance BV | |
05/20/43 | | | 5.625% | | | | 60,000 | | | | 41,502 | |
| | | | | | | | | | | | | |
Total | | | | | | | | | | | 221,298 | |
| | | |
| | | | | | | | | | | | |
NIGERIA —% | |
Africa Finance Corp.(b) | | | | | | | | | | | | |
04/29/20 | | | 4.375% | | | | 200,000 | | | | 199,500 | |
|
Nigeria Government International Bond | |
07/12/23 | | | 6.375% | | | | 200,000 | | | | 185,028 | |
| | | | | | | | | | | | | |
Total | | | | | | | | | | | 384,528 | |
| | | |
| | | | | | | | | | | | |
PAKISTAN —% | |
Pakistan Government International Bond(b) | |
12/03/19 | | | 6.750% | | | | 200,000 | | | | 204,250 | |
| | | |
| | | | | | | | | | | | |
PANAMA —% | |
Panama Government International Bond | |
01/30/20 | | | 5.200% | | | | 630,000 | | | | 689,063 | |
| | | |
| | | | | | | | | | | | |
PARAGUAY —% | |
Republic of Paraguay(b) | |
08/11/44 | | | 6.100% | | | | 200,000 | | | | 201,000 | |
| | | |
| | | | | | | | | | | | |
The accompanying Notes to Financial Statements are an integral part of this statement.
| | |
| |
| | ACTIVE PORTFOLIOS® MULTI-MANAGER CORE PLUS BOND FUND |
PORTFOLIO OF INVESTMENTS (continued)
August 31, 2015
| | | | | | | | | | | | |
| Foreign Government Obligations(a)(m) (continued) | |
| Issuer | | Coupon
Rate | | | Principal
Amount ($) | | | Value ($) | |
PERU —% | |
Corporacion Financiera de Desarrollo SA(b) | |
07/15/19 | | | 3.250% | | | | 920,000 | | | | 923,450 | |
|
Peruvian Government International Bond | |
11/18/50 | | | 5.625% | | | | 200,000 | | | | 215,000 | |
| | | | | | | | | | | | | |
Total | | | | | | | | | | | 1,138,450 | |
| | | |
| | | | | | | | | | | | |
PHILIPPINES 0.1% | |
Philippine Government International Bond | |
01/21/24 | | | 4.200% | | | | 630,000 | | | | 693,000 | |
01/15/32 | | | 6.375% | | | | 200,000 | | | | 261,250 | |
10/23/34 | | | 6.375% | | | | 275,000 | | | | 365,750 | |
|
Power Sector Assets & Liabilities Management Corp | |
12/02/24 | | | 7.390% | | | | 250,000 | | | | 327,500 | |
| | | | | | | | | | | | | |
Total | | | | | | | | | | | 1,647,500 | |
| | | |
| | | | | | | | | | | | |
QATAR —% | |
Nakilat, Inc.(b) | | | | | | | | | | | | |
12/31/33 | | | 6.067% | | | | 1,164,000 | | | | 1,329,870 | |
| | | |
| | | | | | | | | | | | |
ROMANIA —% | |
Romanian Government International Bond | |
08/22/23 | | | 4.375% | | | | 150,000 | | | | 156,345 | |
01/22/24 | | | 4.875% | | | | 630,000 | | | | 679,613 | |
| | | | | | | | | | | | | |
Total | | | | | | | | | | | 835,958 | |
| | | |
| | | | | | | | | | | | |
RUSSIAN FEDERATION 0.1% | |
Gazprom OAO Via Gaz Capital SA | |
08/16/37 | | | 7.288% | | | | 200,000 | | | | 185,900 | |
|
Russian Agricultural Bank OJSC Via RSHB Capital SA(b) | |
07/25/18 | | | 5.100% | | | | 200,000 | | | | 192,500 | |
|
Russian Foreign Bond — Eurobond | |
04/29/20 | | | 5.000% | | | | 400,000 | | | | 402,968 | |
04/04/22 | | | 4.500% | | | | 1,400,000 | | | | 1,336,905 | |
09/16/23 | | | 4.875% | | | | 800,000 | | | | 765,104 | |
| | | | | | | | | | | | | |
Total | | | | | | | | | | | 2,883,377 | |
| | | |
| | | | | | | | | | | | |
SENEGAL —% | |
Senegal Government International Bond | |
07/30/24 | | | 6.250% | | | | 200,000 | | | | 184,892 | |
| | | |
| | | | | | | | | | | | |
SOUTH AFRICA —% | |
South Africa Government International Bond | |
01/17/24 | | | 4.665% | | | | 325,000 | | | | 325,715 | |
| | | |
| | | | | | | | | | | | |
SOUTH KOREA —% | |
Export-Import Bank of Korea | |
12/30/20 | | | 2.625% | | | | 200,000 | | | | 200,340 | |
|
Industrial Bank of Korea(b) | |
04/23/20 | | | 2.000% | | | | 600,000 | | | | 585,213 | |
| | | | | | | | | | | | |
| Foreign Government Obligations(a)(m) (continued) | |
| Issuer | | Coupon
Rate | | | Principal
Amount ($) | | | Value ($) | |
Korea Development Bank (The) | |
09/14/22 | | | 3.000% | | | | 200,000 | | | | 198,488 | |
| | | | | | | | | | | | | |
Total | | | | | | | | | | | 984,041 | |
| | | |
| | | | | | | | | | | | |
SRI LANKA —% | |
Sri Lanka Government International Bond | |
01/14/19 | | | 6.000% | | | | 550,000 | | | | 558,250 | |
| | | |
| | | | | | | | | | | | |
TURKEY 0.1% | |
Hazine Mustesarligi Varlik Kiralam AS(b) | |
10/10/18 | | | 4.557% | | | | 1,150,000 | | | | 1,196,575 | |
|
Turkey Government International Bond | |
03/23/23 | | | 3.250% | | | | 600,000 | | | | 546,000 | |
04/14/26 | | | 4.250% | | | | 500,000 | | | | 468,490 | |
01/14/41 | | | 6.000% | | | | 1,290,000 | | | | 1,315,150 | |
| | | | | | | | | | | | | |
Total | | | | | | | | | | | 3,526,215 | |
| | | |
| | | | | | | | | | | | |
UNITED ARAB EMIRATES —% | |
DP World Ltd.(b) | |
07/02/37 | | | 6.850% | | | | 300,000 | | | | 322,875 | |
|
Emirate of Dubai Government Bonds | |
01/30/43 | | | 5.250% | | | | 200,000 | | | | 177,208 | |
| | | | | | | | | | | | | |
Total | | | | | | | | | | | 500,083 | |
| | | |
| | | | | | | | | | | | |
UNITED KINGDOM 0.1% | |
Lloyds Banking Group PLC(c) | |
12/31/49 | | | 7.500% | | | | 2,496,000 | | | | 2,605,200 | |
| | | |
| | | | | | | | | | | | |
URUGUAY —% | |
Uruguay Government International Bond | |
06/18/50 | | | 5.100% | | | | 200,000 | | | | 183,250 | |
| | | |
| | | | | | | | | | | | |
VENEZUELA —% | |
Petroleos de Venezuela SA | |
11/02/17 | | | 8.500% | | | | 700,000 | | | | 481,110 | |
|
Venezuela Government International Bond | |
05/07/23 | | | 9.000% | | | | 350,000 | | | | 127,925 | |
04/21/25 | | | 7.650% | | | | 350,000 | | | | 123,550 | |
03/31/38 | | | 7.000% | | | | 850,000 | | | | 294,525 | |
| | | | | | | | | | | | | |
Total | | | | | | | | | | | 1,027,110 | |
| | | |
| | | | | | | | | | | | |
VIRGIN ISLANDS —% | |
Franshion Brilliant Ltd. | |
03/19/19 | | | 5.750% | | | | 400,000 | | | | 416,000 | |
|
Huarong Finance II Co., Ltd. | |
01/16/20 | | | 4.500% | | | | 1,060,000 | | | | 1,086,701 | |
| | | | | | | | | | | | | |
Total | | | | | | | | | | | 1,502,701 | |
| | | |
| | | | | | | | | | | | |
The accompanying Notes to Financial Statements are an integral part of this statement.
| | |
| |
| ACTIVE PORTFOLIOS® MULTI-MANAGER CORE PLUS BOND FUND | | |
PORTFOLIO OF INVESTMENTS (continued)
August 31, 2015
| | | | | | | | | | | | |
| Foreign Government Obligations(a)(m) (continued) | |
| Issuer | | Coupon
Rate | | | Principal
Amount ($) | | | Value ($) | |
ZAMBIA —% | |
Zambia Government International Bond(b) | |
07/30/27 | | | 8.970% | | | | 200,000 | | | | 182,250 | |
| | | | | | | | | | | | | |
Total Foreign Government Obligations (Cost: $76,575,507) | | | | 73,909,786 | |
| | | |
| | | | | | | | | | | | |
| Municipal Bonds 0.4% | |
CALIFORNIA 0.1% | |
Los Angeles Unified School District
Unlimited General Obligation Bonds
Taxable Build America Bonds
Series 2009 | |
07/01/34 | | | 5.750% | | | | 655,000 | | | | 781,448 | |
|
State of California
Unlimited General Obligation Bonds
Build America Bonds
Series 2010 | |
03/01/40 | | | 7.625% | | | | 800,000 | | | | 1,156,104 | |
|
Taxable-Various Purpose | |
Series 2010 | | | | | | | | | | | | |
03/01/19 | | | 6.200% | | | | 2,700,000 | | | | 3,086,505 | |
| | | | | | | | | | | | | |
Total | | | | | | | | | | | 5,024,057 | |
| | | |
| | | | | | | | | | | | |
ILLINOIS 0.1% | |
City of Chicago Waterworks
Revenue Bonds
Build America Bonds
Series 2010 | |
11/01/40 | | | 6.742% | | | | 425,000 | | | | 473,306 | |
|
City of Chicago
Unlimited General Obligation Bonds
Taxable Project
Series 2011-C1 | |
01/01/35 | | | 7.781% | | | | 535,000 | | | | 530,008 | |
|
Unlimited General Obligation Refunding Bonds
Taxable
Series 2014B | |
01/01/44 | | | 6.314% | | | | 1,240,000 | | | | 1,062,420 | |
|
Unlimited General Obligation Taxable Bonds
Series 2015B | |
01/01/33 | | | 7.375% | | | | 945,000 | | | | 918,332 | |
|
State of Illinois
Revenue Bonds
Taxable Sales Tax
Series 2013 | |
06/15/28 | | | 3.350% | | | | 2,500,000 | | | | 2,326,550 | |
| | | | | | | | | | | | | |
Total | | | | | | | | | | | 5,310,616 | |
| | | |
| | | | | | | | | | | | |
KENTUCKY 0.1% | |
Kentucky Asset Liability Commission
Taxable Revenue Bonds
Series 2010 | |
04/01/18 | | | 3.165% | | | | 3,464,634 | | | | 3,545,187 | |
| | | | | | | | | | | | |
| Municipal Bonds (continued) | |
| Issuer | | Coupon
Rate | | | Principal
Amount ($) | | | Value ($) | |
NEW YORK 0.1% | |
New York State Urban Development Corp.
Revenue Bonds
Taxable State Personal Income Tax
Series 2013 | |
03/15/22 | | | 3.200% | | | | 2,650,000 | | | | 2,745,029 | |
| | | |
| | | | | | | | | | | | |
OHIO —% | |
JobsOhio Beverage System
Taxable Revenue Bonds
Series 2013-B | |
01/01/35 | | | 4.532% | | | | 2,160,000 | | | | 2,258,280 | |
| | | |
| | | | | | | | | | | | |
PUERTO RICO —% | |
Puerto Rico Sales Tax Financing Corp.(n)
Revenue Bonds
1st Subordinated Series 2009A-1 | |
08/01/43 | | | 5.250% | | | | 705,000 | | | | 267,900 | |
1st Subordinated Series 2009B | |
08/01/44 | | | 6.500% | | | | 285,000 | | | | 112,575 | |
1st Subordinated Series 2010C | |
08/01/41 | | | 5.250% | | | | 2,160,000 | | | | 823,521 | |
| | | | | | | | | | | | | |
Total | | | | | | | | | | | 1,203,996 | |
| | | | | | | | | | | | | |
Total Municipal Bonds
(Cost: $21,122,015) | | | | 20,087,165 | |
| | | |
| | | | | | | | | | | | |
| Preferred Debt 0.4% | |
| Issuer | | Coupon
Rate | | | Shares | | | Value ($) | |
BANKING 0.3% | |
Citigroup Capital XIII(c) | |
10/30/40 | | | 7.875% | | | | 225,745 | | | | 5,767,785 | |
|
HSBC Holdings PLC | |
12/31/49 | | | 8.000% | | | | 46,285 | | | | 1,182,119 | |
|
M&T Bank Corp.(c) | |
12/31/49 | | | 6.375% | | | | 435 | | | | 459,812 | |
12/31/49 | | | 6.375% | | | | 2,703 | | | | 2,851,665 | |
|
PNC Financial Services Group, Inc. (The)(c) | |
12/31/49 | | | 6.175% | | | | 57,630 | | | | 1,581,943 | |
|
State Street Corp.(c) | |
12/31/49 | | | 5.900% | | | | 39,555 | | | | 1,029,617 | |
|
U.S. Bancorp(c) | |
12/31/49 | | | 6.500% | | | | 80,200 | | | | 2,297,730 | |
| | | | | | | | | | | | | |
Total | | | | | | | | | | | 15,170,671 | |
| | | |
| | | | | | | | | | | | |
BROKERAGE/ASSET MANAGERS/EXCHANGES —% | |
Merrill Lynch Capital Trust I(c) | |
12/15/66 | | | 6.450% | | | | 40,000 | | | | 1,017,600 | |
| | | |
| | | | | | | | | | | | |
BUILDING MATERIALS 0.1% | |
Stanley Black & Decker, Inc. | |
07/25/52 | | | 5.750% | | | | 90,250 | | | | 2,336,572 | |
| | | |
| | | | | | | | | | | | |
The accompanying Notes to Financial Statements are an integral part of this statement.
| | |
| |
| | ACTIVE PORTFOLIOS® MULTI-MANAGER CORE PLUS BOND FUND |
PORTFOLIO OF INVESTMENTS (continued)
August 31, 2015
| | | | | | | | | | | | |
| Preferred Debt (continued) | |
| Issuer | | Coupon
Rate | | | Principal
Amount ($) | | | Value ($) | |
PROPERTY & CASUALTY —% | |
Allstate Corp. (The)(c) | |
01/15/53 | | | 5.100% | | | | 42,755 | | | | 1,099,659 | |
| | | | | | | | | | | | | |
Total Preferred Debt
(Cost: $19,623,326) | | | | 19,624,502 | |
| | | |
| | | | | | | | | | | | |
| Senior Loans 0.3% | |
| Borrower | | Weighted
Average
Coupon | | | Principal
Amount ($) | | | Value ($) | |
ELECTRIC 0.1% | |
Calpine Corp.
Term Loan(c)(o) | |
05/27/22 | | | 3.500% | | | | 3,000,000 | | | | 2,957,820 | |
| | | |
| | | | | | | | | | | | |
ENVIRONMENTAL —% | |
STI Infrastructure SARL
Term Loan(c)(o) | |
08/22/20 | | | 6.250% | | | | 673,372 | | | | 612,769 | |
| | | |
| | | | | | | | | | | | |
GAMING 0.1% | |
Golden Nugget, Inc.(c)(o)
Term Loan | |
11/21/19 | | | 5.500% | | | | 289,500 | | | | 289,682 | |
11/21/19 | | | 5.500% | | | | 675,500 | | | | 675,926 | |
|
Twin River Management Group, Inc.
Term Loan(c)(o) | |
07/10/20 | | | 5.250% | | | | 1,430,537 | | | | 1,427,677 | |
| | | | | | | | | | | | | |
Total | | | | | | | | | | | 2,393,285 | |
| | | |
| | | | | | | | | | | | |
HEALTH CARE —% | |
American Renal Holdings, Inc.
2nd Lien Term Loan(c)(o) | |
03/20/20 | | | 8.500% | | | | 90,000 | | | | 89,325 | |
|
U.S. Renal Care, Inc.
2nd Lien Term Loan(c)(o) | |
01/03/20 | | | 10.250% | | | | 193,000 | | | | 193,241 | |
| | | | | | | | | | | | | |
Total | | | | | | | | | | | 282,566 | |
| | | |
| | | | | | | | | | | | |
INDEPENDENT ENERGY 0.1% | |
EMG Utica LLC
Term Loan(c)(o) | |
03/27/20 | | | 4.750% | | | | 1,403,524 | | | | 1,336,856 | |
|
MEG Energy Corp.
Term Loan(c)(o) | |
03/31/20 | | | 3.750% | | | | 1,473,293 | | | | 1,370,855 | |
| | | | | | | | | | | | | |
Total | | | | | | | | | | | 2,707,711 | |
| | | |
| | | | | | | | | | | | |
| | | | | | | | | | | | |
| Senior Loans (continued) | |
| Borrower | | Weighted
Average
Coupon | | | Principal
Amount ($) | | | Value ($) | |
MIDSTREAM —% | |
Power Buyer LLC 1st Lien
Term Loan(c)(o) | |
05/06/20 | | | 4.250% | | | | 1,379,860 | | | | 1,367,206 | |
| | | |
| | | | | | | | | | | | |
OIL FIELD SERVICES —% | |
Drillships Ocean Ventures, Inc.
Term Loan(c)(o) | |
07/25/21 | | | 5.500% | | | | 1,485,000 | | | | 1,143,450 | |
| | | |
| | | | | | | | | | | | |
| | | | | | | | | | | | |
OTHER INDUSTRY —% | |
GIM Channelview Cogeneration LLC
Term Loan(c)(o) | |
05/08/20 | | | 4.250% | | | | 828,000 | | | | 816,615 | |
| | | |
| | | | | | | | | | | | |
RETAILERS —% | |
Rite Aid Corp.
Tranche 1 2nd Lien Term Loan(c)(o) | |
08/21/20 | | | 5.750% | | | | 148,000 | | | | 149,388 | |
| | | |
| | | | | | | | | | | | |
TECHNOLOGY —% | |
Applied Systems, Inc.
2nd Lien Term Loan(c)(o) | |
01/24/22 | | | 7.500% | | | | 15,000 | | | | 14,902 | |
|
First Data Corp.
Term Loan(c)(o) | |
09/24/18 | | | 3.700% | | | | 1,500,000 | | | | 1,487,625 | |
|
Riverbed Technology, Inc.
Term Loan(c)(o) | |
04/25/22 | | | 6.000% | | | | 137,475 | | | | 137,418 | |
| | | | | | | | | | | | | |
Total | | | | | | | | | | | 1,639,945 | |
| | | |
| | | | | | | | | | | | |
TRANSPORTATION SERVICES —% | |
OSG International, Inc.
Term Loan(c)(o) | |
08/05/19 | | | 5.750% | | | | 1,485,000 | | | | 1,477,575 | |
| | | |
| | | | | | | | | | | | |
WIRELINES —% | |
Level 3 Financing, Inc.
Tranche B3 Term Loan(c)(o) | |
08/01/19 | | | 4.000% | | | | 1,500,000 | | | | 1,497,750 | |
| | | | | | | | | | | | | |
Total Senior Loans
(Cost: $17,707,548) | | | | | | | | | | | 17,046,080 | |
| | | |
| | | | | | | | | | | | |
The accompanying Notes to Financial Statements are an integral part of this statement.
| | |
| |
| ACTIVE PORTFOLIOS® MULTI-MANAGER CORE PLUS BOND FUND | | |
PORTFOLIO OF INVESTMENTS (continued)
August 31, 2015
| | | | | | | | | | |
| Common Stocks —% | |
| Issuer | | | | Shares | | | Value ($) | |
ENERGY —% | |
Oil, Gas & Consumable Fuels —% | |
Lone Pine Resources Canada Ltd.(f)(h)(p) | | | 3,118 | | | | 5,675 | |
| | |
Lone Pine Resources, Inc., Class A(f)(g)(h)(p) | | | 3,118 | | | | — | |
| | | | | | | | | | | |
Total | | | | | | | | | 5,675 | |
| | | | | | | | | | | |
Total Energy | | | | | | | | | 5,675 | |
| | | | | | | | | | | |
Total Common Stocks
(Cost: $7,499) | | | | | | | | | 5,675 | |
| | | |
| | | | | | | | | | |
| Fixed-Income Funds 0.6% | |
INVESTMENT GRADE 0.6% | |
Columbia Mortgage Opportunities Fund, Class I Shares(q) | | | | | 3,283,222 | | | | 32,733,725 | |
| | | | | | | | | | | |
Total Fixed-Income Funds
(Cost: $32,906,862) | | | | 32,733,725 | |
| | | | | | | | | | | | |
| Treasury Bills —% | |
| Issuer | | Effective
Yield | | | Principal
Amount ($) | | | Value ($) | |
UNITED STATES —% | |
U.S. Treasury Bills(l) | |
10/15/15 | | | 0.020% | | | | 275,000 | | | | 274,994 | |
| | | | | | | | | | | | | |
Total Treasury Bills
(Cost: $274,994) | | | | 274,994 | |
| | | |
| | | | | | | | | | | | |
| Money Market Funds 7.1% | |
| | | | | | Shares | | | Value ($) | |
Columbia Short-Term Cash Fund, 0.150%(q)(r) | | | | 360,589,788 | | | | 360,589,788 | |
| | | | | | | | | | | | | |
Total Money Market Funds
(Cost: $360,589,788) | | | | 360,589,788 | |
| | | | | | | | | | | | | |
Total Investments
(Cost: $5,619,121,139) | | | | 5,618,142,367 | |
| | | | | | | | | | | | | |
Other Assets & Liabilities, Net | | | | (520,684,562 | ) |
| | | | | | | | | | | | | |
Net Assets | | | | 5,097,457,805 | |
| | | | | | | | | | | | | |
At August 31, 2015, securities and cash totaling $12,175,971 were pledged as collateral.
Investments in Derivatives
Forward Foreign Currency Exchange Contracts Open at August 31, 2015
| | | | | | | | | | | | | | | | | | | | |
| Counterparty | | Exchange
Date | | | Currency to
be Delivered | | | Currency to
be Received | | | Unrealized
Appreciation ($) | | | Unrealized
Depreciation ($) | |
| | | | | |
UBS Securities | | | 10/7/2015 | | | | 4,941,000 EUR | | | | 5,547,508 USD | | | | 76 | | | | — | |
Futures Contracts Outstanding at August 31, 2015
Long Futures Contracts Outstanding
| | | | | | | | | | | | | | | | | | | | | | | | |
| Contract Description | | Number of
Contracts | | | Trading
Currency | | | Notional Market
Value ($) | | | Expiration Date | | | Unrealized
Appreciation ($) | | | Unrealized
Depreciation ($) | |
US 2YR NOTE | | | 1,437 | | | | USD | | | | 313,939,594 | | | | 12/2015 | | | | — | | | | (624,055 | ) |
US 5YR NOTE | | | 1,486 | | | | USD | | | | 177,484,125 | | | | 12/2015 | | | | — | | | | (1,072,943 | ) |
US 10YR NOTE | | | 184 | | | | USD | | | | 23,379,501 | | | | 12/2015 | | | | — | | | | (178,262 | ) |
US ULTRA BOND | | | 345 | | | | USD | | | | 54,650,156 | | | | 12/2015 | | | | — | | | | (1,253,641 | ) |
| | | | | | | | | | | | | | | | | | | | | | | | | |
Total | | | | | | | | | | | 569,453,376 | | | | | | | | — | | | | (3,128,901 | ) |
| | | | | | | | | | | | | | | | | | | | | | | | | |
Short Futures Contracts Outstanding
| | | | | | | | | | | | | | | | | | | | | | | | |
| Contract Description | | Number of
Contracts | | | Trading
Currency | | | Notional Market
Value ($) | | | Expiration Date | | | Unrealized
Appreciation ($) | | | Unrealized
Depreciation ($) | |
EURO-BOBL | | | (44 | ) | | | EUR | | | | (6,420,183 | ) | | | 09/2015 | | | | 11,546 | | | | — | |
US 10YR NOTE | | | (2,714 | ) | | | USD | | | | (344,847,625 | ) | | | 12/2015 | | | | 3,070,425 | | | | — | |
US LONG BOND | | | (253 | ) | | | USD | | | | (39,120,125 | ) | | | 12/2015 | | | | 1,012,701 | | | | — | |
US ULTRA BOND | | | (15 | ) | | | USD | | | | (2,376,094 | ) | | | 12/2015 | | | | 35,715 | | | | — | |
| | | | | | | | | | | | | | | | | | | | | | | | | |
Total | | | | | | | | | | | (392,764,027 | ) | | | | | | | 4,130,387 | | | | — | |
| | | | | | | | | | | | | | | | | | | | | | | | | |
The accompanying Notes to Financial Statements are an integral part of this statement.
| | |
| |
| | ACTIVE PORTFOLIOS® MULTI-MANAGER CORE PLUS BOND FUND |
PORTFOLIO OF INVESTMENTS (continued)
August 31, 2015
Credit Default Swap Contracts Outstanding at August 31, 2015
Buy Protection
| | | | | | | | | | | | | | | | | | | | | | | | | | | | | | | | | | |
| Counterparty | | Reference
Entity | | Expiration
Date | | Pay
Fixed
Rate
(%) | | | | | Notional
Amount
($) | | | Market
Value
($) | | | Unamortized
Premium
(Paid)
Received
($) | | | Periodic
Payments
Receivable
(Payable)
($) | | | Unrealized
Appreciation
($) | | | Unrealized
Depreciation
($) | |
Barclays | | Weatherford International PLC | | 9/20/2020 | | | 1.000 | | | | | | 775,000 | | | | 124,927 | | | | (100,310 | ) | | | (1,571 | ) | | | 23,046 | | | | — | |
| | | | | | | | | | |
Citibank | | Campbell Soup Co. | | 3/20/2020 | | | 1.000 | | | | | | 4,645,000 | | | | (112,785 | ) | | | 66,438 | | | | (9,161 | ) | | | — | | | | (55,508 | ) |
| | | | | | | | | | |
Citibank | | Campbell Soup Co. | | 9/20/2020 | | | 1.000 | | | | | | 2,720,000 | | | | (64,887 | ) | | | 53,688 | | | | (5,364 | ) | | | — | | | | (16,563 | ) |
| | | | | | | | | | |
Citibank | | CDX Emerging Markets Index
23-V1 | | 6/20/2020 | | | 1.000 | | | | | | 6,235,000 | | | | 656,162 | | | | (568,300 | ) | | | (12,296 | ) | | | 75,566 | | | | — | |
| | | | | | | | | | |
Citibank | | D.R. Horton, Inc. | | 3/20/2020 | | | 1.000 | | | | | | 4,180,000 | | | | 42,429 | | | | (107,838 | ) | | | (8,244 | ) | | | — | | | | (73,653 | ) |
| | | | | | | | | | |
Citibank | | Energy Transfer Partners, LP | | 6/20/2020 | | | 1.000 | | | | | | 1,960,000 | | | | 83,436 | | | | (64,001 | ) | | | (3,866 | ) | | | 15,569 | | | | — | |
| | | | | | | | | | |
Citibank | | Home Depot, Inc. | | 9/20/2020 | | | 1.000 | | | | | | 18,530,000 | | | | (683,873 | ) | | | 646,898 | | | | (36,545 | ) | | | — | | | | (73,520 | ) |
| | | | | | | | | | |
Citibank | | International Business Machines
Corp. | | 6/20/2020 | | | 1.000 | | | | | | 1,535,000 | | | | (39,759 | ) | | | 36,161 | | | | (3,027 | ) | | | — | | | | (6,625 | ) |
| | | | | | | | | | |
Citibank | | Marriott International, Inc. | | 6/20/2020 | | | 1.000 | | | | | | 6,605,000 | | | | (161,839 | ) | | | 161,933 | | | | (13,027 | ) | | | — | | | | (12,933 | ) |
| | | | | | | | | | |
Citibank | | McDonald’s Corp. | | 6/20/2020 | | | 1.000 | | | | | | 3,890,000 | | | | (117,003 | ) | | | 108,238 | | | | (7,672 | ) | | | — | | | | (16,437 | ) |
| | | | | | | | | | |
Citibank | | Morgan Stanley | | 6/20/2020 | | | 1.000 | | | | | | 3,900,000 | | | | (23,051 | ) | | | 30,133 | | | | (7,692 | ) | | | — | | | | (610 | ) |
| | | | | | | | | | |
Citibank | | Nordstrom, Inc. | | 3/20/2020 | | | 1.000 | | | | | | 1,955,000 | | | | (51,713 | ) | | | 49,766 | | | | (3,856 | ) | | | — | | | | (5,803 | ) |
| | | | | | | | | | |
Citibank | | Toll Brothers, Inc. | | 9/20/2020 | | | 1.000 | | | | | | 1,795,000 | | | | 37,721 | | | | (37,721 | ) | | | — | | | | — | | | | — | |
| | | | | | | | | | |
Goldman Sachs International | | Bank of America Corp. | | 6/20/2020 | | | 1.000 | | | | | | 12,565,000 | | | | (132,280 | ) | | | 172,380 | | | | (24,781 | ) | | | 15,319 | | | | — | |
| | | | | | | | | | |
Goldman Sachs International | | Barclays Bank, PLC | | 6/20/2020 | | | 1.000 | | | | | | 7,850,000 | | | | (113,306 | ) | | | 111,541 | | | | (15,482 | ) | | | — | | | | (17,247 | ) |
| | | | | | | | | | |
Goldman Sachs International | | Beazer Homes USA, Inc. | | 6/20/2020 | | | 5.000 | | | | | | 3,625,000 | | | | 33,988 | | | | 50,818 | | | | (35,746 | ) | | | 49,060 | | | | — | |
| | | | | | | | | | |
Goldman Sachs International | | CDX Emerging Markets Index
23-V1 | | 6/20/2020 | | | 1.000 | | | | | | 4,650,000 | | | | 489,359 | | | | (387,032 | ) | | | (9,171 | ) | | | 93,156 | | | | — | |
| | | | | | | | | | |
Goldman Sachs International | | Citigroup, Inc. | | 6/20/2020 | | | 1.000 | | | | | | 10,258,000 | | | | (62,757 | ) | | | 93,361 | | | | (20,231 | ) | | | 10,373 | | | | — | |
| | | | | | | | | | |
Goldman Sachs International | | ConocoPhillips | | 6/20/2020 | | | 1.000 | | | | | | 3,075,000 | | | | (53,517 | ) | | | 78,451 | | | | (6,065 | ) | | | 18,869 | | | | — | |
| | | | | | | | | | |
Goldman Sachs International | | ConocoPhillips | | 9/20/2020 | | | 1.000 | | | | | | 1,555,000 | | | | (25,866 | ) | | | 15,684 | | | | (3,153 | ) | | | — | | | | (13,335 | ) |
| | | | | | | | | | |
Goldman Sachs International | | Costco Wholesale Corp. | | 3/20/2020 | | | 1.000 | | | | | | 1,770,000 | | | | (63,491 | ) | | | 60,890 | | | | (3,491 | ) | | | — | | | | (6,092 | ) |
| | | | | | | | | | |
Goldman Sachs International | | Eaton Corp. PLC | | 6/20/2020 | | | 1.000 | | | | | | 1,535,000 | | | | (38,535 | ) | | | 31,198 | | | | (3,027 | ) | | | — | | | | (10,364 | ) |
| | | | | | | | | | |
Goldman Sachs International | | McDonald’s Corp. | | 3/20/2020 | | | 1.000 | | | | | | 4,675,000 | | | | (138,402 | ) | | | 110,712 | | | | (9,220 | ) | | | — | | | | (36,910 | ) |
| | | | | | | | | | |
Goldman Sachs International | | McDonald’s Corp. | | 6/20/2020 | | | 1.000 | | | | | | 3,405,000 | | | | (102,415 | ) | | | 94,614 | | | | (6,715 | ) | | | — | | | | (14,516 | ) |
The accompanying Notes to Financial Statements are an integral part of this statement.
| | |
| |
| ACTIVE PORTFOLIOS® MULTI-MANAGER CORE PLUS BOND FUND | | |
PORTFOLIO OF INVESTMENTS (continued)
August 31, 2015
Credit Default Swap Contracts Outstanding at August 31, 2015 (continued)
Buy Protection (continued)
| | | | | | | | | | | | | | | | | | | | | | | | | | | | | | | | | | |
| Counterparty | | Reference
Entity | | Expiration
Date | | Pay
Fixed
Rate
(%) | | | | | Notional
Amount
($) | | | Market
Value
($) | | | Unamortized
Premium
(Paid)
Received
($) | | | Periodic
Payments
Receivable
(Payable)
($) | | | Unrealized
Appreciation
($) | | | Unrealized
Depreciation
($) | |
Goldman Sachs International | | Morgan Stanley | | 6/20/2020 | | | 1.000 | | | | | | 4,210,000 | | | | (24,883 | ) | | | 32,528 | | | | (8,303 | ) | | | — | | | | (658 | ) |
| | | | | | | | | | |
Goldman Sachs International | | Textron, Inc. | | 9/20/2020 | | | 1.000 | | | | | | 7,090,000 | | | | (69,228 | ) | | | 31,893 | | | | (13,983 | ) | | | — | | | | (51,318 | ) |
| | | | | | | | | | |
Goldman Sachs International | | Toll Brothers, Inc. | | 3/20/2020 | | | 1.000 | | | | | | 7,125,000 | | | | 77,320 | | | | (108,221 | ) | | | (14,052 | ) | | | — | | | | (44,953 | ) |
| | | | | | | | | | |
JPMorgan | | Anadarko Petroleum Corp. | | 6/20/2020 | | | 1.000 | | | | | | 1,960,000 | | | | 21,525 | | | | (6,150 | ) | | | (3,865 | ) | | | 11,510 | | | | — | |
| | | | | | | | | | |
JPMorgan | | Barclays Bank, PLC | | 6/20/2020 | | | 1.000 | | | | | | 2,335,000 | | | | 83,458 | | | | (53,379 | ) | | | (4,605 | ) | | | 25,474 | | | | — | |
| | | | | | | | | | |
JPMorgan | | CDX Emerging Markets Index
23-V1 | | 6/20/2020 | | | 1.000 | | | | | | 7,900,000 | | | | 831,384 | | | | (661,253 | ) | | | (15,580 | ) | | | 154,551 | | | | — | |
| | | | | | | | | | |
JPMorgan | | Citigroup, Inc. | | 9/20/2020 | | | 1.000 | | | | | | 6,255,000 | | | | (28,829 | ) | | | 8,951 | | | | (12,336 | ) | | | — | | | | (32,214 | ) |
| | | | | | | | | | |
JPMorgan | | ConocoPhillips | | 9/20/2020 | | | 1.000 | | | | | | 2,320,000 | | | | (38,590 | ) | | | 43,608 | | | | (4,704 | ) | | | 314 | | | | — | |
| | | | | | | | | | |
JPMorgan | | D.R. Horton, Inc. | | 6/20/2020 | | | 1.000 | | | | | | 4,100,000 | | | | 60,413 | | | | (96,197 | ) | | | (8,086 | ) | | | — | | | | (43,870 | ) |
| | | | | | | | | | |
JPMorgan | | D.R. Horton, Inc. | | 6/20/2020 | | | 1.000 | | | | | | 4,100,000 | | | | 60,413 | | | | (96,006 | ) | | | (8,086 | ) | | | — | | | | (43,679 | ) |
| | | | | | | | | | |
JPMorgan | | Energy Transfer Partners, LP | | 9/20/2020 | | | 1.000 | | | | | | 2,320,000 | | | | 113,037 | | | | (90,217 | ) | | | (4,704 | ) | | | 18,116 | | | | — | |
| | | | | | | | | | |
JPMorgan | | Goldman Sachs Group, Inc. | | 6/20/2020 | | | 1.000 | | | | | | 6,625,000 | | | | (13,272 | ) | | | 25,502 | | | | (13,066 | ) | | | — | | | | (836 | ) |
| | | | | | | | | | |
JPMorgan | | Kinder Morgan, Inc. | | 6/20/2020 | | | 1.000 | | | | | | 1,960,000 | | | | 106,168 | | | | (30,381 | ) | | | (3,866 | ) | | | 71,921 | | | | — | |
| | | | | | | | | | |
JPMorgan | | L Brands, Inc. | | 6/20/2020 | | | 1.000 | | | | | | 7,430,000 | | | | 188,164 | | | | (128,512 | ) | | | (14,654 | ) | | | 44,998 | | | | — | |
| | | | | | | | | | |
JPMorgan | | McDonald’s Corp. | | 6/20/2020 | | | 1.000 | | | | | | 1,975,000 | | | | (59,404 | ) | | | 54,954 | | | | (3,895 | ) | | | — | | | | (8,345 | ) |
| | | | | | | | | | |
JPMorgan | | Weatherford International PLC | | 9/20/2020 | | | 1.000 | | | | | | 2,320,000 | | | | 373,974 | | | | (321,025 | ) | | | (4,704 | ) | | | 48,245 | | | | — | |
| | | | | | | | | | |
Morgan Stanley | | ConocoPhillips | | 6/20/2020 | | | 1.000 | | | | | | 1,970,000 | | | | (34,286 | ) | | �� | 51,092 | | | | (3,885 | ) | | | 12,921 | | | | — | |
| | | | | | | | | | |
Morgan Stanley | | ConocoPhillips | | 6/20/2020 | | | 1.000 | | | | | | 987,500 | | | | (17,186 | ) | | | 25,133 | | | | (1,948 | ) | | | 5,999 | | | | — | |
| | | | | | | | | | |
Morgan Stanley | | ConocoPhillips | | 6/20/2020 | | | 1.000 | | | | | | 987,500 | | | | (17,186 | ) | | | 25,671 | | | | (1,948 | ) | | | 6,537 | | | | — | |
| | | | | | | | | | |
Morgan Stanley | | General Mills, Inc. | | 6/20/2020 | | | 1.000 | | | | | | 1,535,000 | | | | (51,938 | ) | | | 49,478 | | | | (3,027 | ) | | | — | | | | (5,487 | ) |
| | | | | | | | | | |
Morgan Stanley | | Goldman Sachs Group, Inc. | | 9/20/2020 | | | 1.000 | | | | | | 9,845,000 | | | | (2,379 | ) | | | 46,854 | | | | (19,417 | ) | | | 25,058 | | | | — | |
| | | | | | | | | | |
Morgan Stanley | | Newmont Mining Corp. | | 6/20/2020 | | | 1.000 | | | | | | 1,535,000 | | | | 78,178 | | | | (13,362 | ) | | | (3,027 | ) | | | 61,789 | | | | — | |
| | | | | | | | | | |
Morgan Stanley | | Nucor Corp. | | 9/20/2020 | | | 1.000 | | | | | | 4,980,000 | | | | (28,825 | ) | | | 56,949 | | | | (9,822 | ) | | | 18,302 | | | | — | |
| | | | | | | | | | |
Morgan Stanley | | Textron, Inc. | | 9/20/2020 | | | 1.000 | | | | | | 1,950,000 | | | | (19,040 | ) | | | 16,839 | | | | (3,846 | ) | | | — | | | | (6,047 | ) |
| | | | | | | | | | |
Morgan Stanley | | Time Warner, Inc. | | 9/20/2020 | | | 1.000 | | | | | | 1,545,000 | | | | (15,474 | ) | | | 22,314 | | | | (3,133 | ) | | | 3,707 | | | | — | |
| | | | | | | | | | |
Morgan Stanley | | Viacom, Inc. | | 9/20/2020 | | | 1.000 | | | | | | 1,545,000 | | | | 71,823 | | | | (77,207 | ) | | | (3,133 | ) | | | — | | | | (8,517 | ) |
| | | | | | | | | | |
Morgan Stanley* | | CDX North America High
Yield 24-V1 | | 6/20/2020 | | | 5.000 | | | | | | 126,531,900 | | | | 952,085 | | | | — | | | | (1,247,745 | ) | | | — | | | | (295,660 | ) |
The accompanying Notes to Financial Statements are an integral part of this statement.
| | |
| |
| | ACTIVE PORTFOLIOS® MULTI-MANAGER CORE PLUS BOND FUND |
PORTFOLIO OF INVESTMENTS (continued)
August 31, 2015
Credit Default Swap Contracts Outstanding at August 31, 2015 (continued)
Buy Protection (continued)
| | | | | | | | | | | | | | | | | | | | | | | | | | | | | | | | | | |
| Counterparty | | Reference
Entity | | Expiration
Date | | Pay
Fixed
Rate
(%) | | | | | Notional
Amount
($) | | | Market
Value
($) | | | Unamortized
Premium
(Paid)
Received
($) | | | Periodic
Payments
Receivable
(Payable)
($) | | | Unrealized
Appreciation
($) | | | Unrealized
Depreciation
($) | |
Morgan Stanley* | | CDX North America Investment
Grade 24-V1 | | 6/20/2020 | | | 1.000 | | | | | | 67,157,916 | | | | 326,004 | | | | — | | | | (174,488 | ) | | | 151,516 | | | | — | |
| | | | | | | | | | |
Total | | | | | | | | | | | | | | | | | | | | | | | | | | | | | 961,916 | | | | (901,700 | ) |
| | * | Centrally cleared swap contract |
Credit Default Swap Contracts Outstanding at August 31, 2015
Sell Protection
| | | | | | | | | | | | | | | | | | | | | | | | | | | | | | | | | | | | |
| Counterparty | | Reference
Entity | | Expiration
Date | | Receive
Fixed
Rate
(%) | | | Implied
Credit
Spread
(%)** | | | Notional
Amount
($) | | | Market
Value
($) | | | Unamortized
Premium
(Paid)
Received
($) | | | Periodic
Payments
Receivable
(Payable)
($) | | | Unrealized
Appreciation
($) | | | Unrealized
Depreciation
($) | |
Citibank | | FedEx Corp. | | 6/20/2020 | | | 1.000 | | | | 0.458% | | | | 1,535,000 | | | | 39,087 | | | | (36,185 | ) | | | 3,027 | | | | 5,929 | | | | — | |
| | | | | | | | | | |
Goldman Sachs International | | Barrick Gold Corp. | | 6/20/2020 | | | 1.000 | | | | 2.809% | | | | 1,535,000 | | | | (123,288 | ) | | | 40,695 | | | | 3,027 | | | | — | | | | (79,566 | ) |
| | | | | | | | | | |
Goldman Sachs International | | Canadian Natural
Resources Ltd. | | 6/20/2020 | | | 1.000 | | | | 2.391% | | | | 1,535,000 | | | | (95,236 | ) | | | (9,708 | ) | | | 3,027 | | | | — | | | | (101,917 | ) |
| | | | | | | | | | |
Morgan Stanley | | Mondelez International, Inc. | | 6/20/2020 | | | 1.000 | | | | 0.373% | | | | 1,535,000 | | | | 45,290 | | | | (49,331 | ) | | | 3,027 | | | | — | | | | (1,014 | ) |
Total | | | | | | | | | | | | | | | | | | | | | | | | | | | | | | | 5,929 | | | | (182,497 | ) |
| | ** | Implied credit spreads, represented in absolute terms, utilized in determining the market value of credit default swap agreements on corporate or sovereign issues as of period end serve as an indicator of the current status of the payment/performance risk and represent the likelihood or risk of default for the credit derivative. The implied credit spread of a particular referenced entity reflects the cost of buying/ selling protection and may include upfront payments required to be made to enter into the agreement. Wider credit spreads represent a deterioration of the referenced entity’s credit soundness and a greater likelihood or risk of default or other credit event occurring as defined under the terms of the agreement. |
Notes to Portfolio of Investments
| (a) | Principal amounts are denominated in United States Dollars unless otherwise noted. |
| (b) | Security exempt from registration pursuant to Rule 144A under the Securities Act of 1933. This security may be resold in transactions exempt from registration, normally to qualified institutional buyers. At August 31, 2015, the value of these securities amounted to $739,947,542 or 14.52% of net assets. |
| (c) | Variable rate security. |
| (d) | Represents securities that have defaulted on payment of interest. The Fund has stopped accruing interest on these securities. At August 31, 2015, the value of these securities amounted to $342,484, which represents 0.01% of net assets. |
| (e) | Security, or a portion thereof, has been purchased on a when-issued or delayed delivery basis. |
The accompanying Notes to Financial Statements are an integral part of this statement.
| | |
| |
| ACTIVE PORTFOLIOS® MULTI-MANAGER CORE PLUS BOND FUND | | |
PORTFOLIO OF INVESTMENTS (continued)
August 31, 2015
Notes to Portfolio of Investments (continued)
| (f) | Identifies securities considered by the Investment Manager to be illiquid and may be difficult to sell. The aggregate value of such securities at August 31, 2015 was $3,152,254, which represents 0.06% of net assets. Information concerning such security holdings at August 31, 2015 is as follows: |
| | | | | | | | |
| Security Description | | Acquisition Dates | | | Cost ($) | |
Afren PLC
12/09/20 0.000% | | | 11/26/2013 | | | | 200,000 | |
| | |
CompuCom Systems, Inc.
05/01/21 7.000% | | | 05/02/2013 - 07/02/2013 | | | | 274,500 | |
| | |
Lone Pine Resources Canada Ltd.
02/15/17 10.375% | | | 2/5/2014 | | | | — | |
| | |
Lone Pine Resources Canada Ltd. | | | 2/5/2014 | | | | 7,499 | |
| | |
Lone Pine Resources, Inc., Class A | | | 2/5/2014 | | | | — | |
| | |
RALI Trust
CMO IO Series 2006-QS18 Class 1AV
12/25/36 0.414% | | | 5/4/2012 | | | | 995,895 | |
| | |
RALI Trust
CMO IO Series 2006-QS9 Class 1AV
07/25/36 0.616% | | | 5/9/2012 | | | | 822,269 | |
| | |
RALI Trust
CMO IO Series 2007-QS1 Class 2AV
01/25/37 0.169% | | | 5/7/2012 | | | | 457,820 | |
| (g) | Negligible market value. |
| (h) | Represents fair value as determined in good faith under procedures approved by the Board of Trustees. At August 31, 2015, the value of these securities amounted to $2,750,991, which represents 0.05% of net assets. |
| (i) | Interest Only (IO) represents the right to receive the monthly interest payments on an underlying pool of mortgage loans. |
| (k) | Principal Only (PO) represents the right to receive the principal portion only on an underlying pool of mortgage loans. |
| (l) | This security or a portion of this security has been pledged as collateral in connection with derivative contracts. |
| (m) | Principal and interest may not be guaranteed by the government. |
| (n) | Municipal obligations include debt obligations issued by or on behalf of territories, possessions, or sovereign nations within the territorial boundaries of the United States. At August 31, 2015, the value of these securities amounted to $1,203,996 or 0.02% of net assets. |
| (o) | Senior loans have interest rates that float periodically based primarily on the London Interbank Offered Rate (“LIBOR”) and other short-term rates. The interest rate shown reflects the weighted average coupon as of August 31, 2015. The interest rate shown for senior loans purchased on a when-issued or delayed delivery basis, if any, reflects an estimated average coupon. Remaining maturities of senior loans may be less than the stated maturities shown as a result of contractual or optional prepayments by the borrower. Such prepayments cannot be predicted. |
| (p) | Non-income producing investment. |
| (q) | As defined in the Investment Company Act of 1940, an affiliated company is one in which the Fund owns 5% or more of the company’s outstanding voting securities, or a company which is under common ownership or control with the Fund. Holdings and transactions in these affiliated companies during the year ended August 31, 2015 are as follows: |
| | | | | | | | | | | | | | | | | | | | | | | | | | | | | | | | |
| Issuer | | Beginning
Cost ($) | | | Purchase
Cost ($) | | | Proceeds From
Sales ($) | | | Realized
Gain (Loss) ($) | | | Ending
Cost ($) | | | Dividends —
Affiliated
Issuers ($) | | | Capital Gain
Distribution ($) | | | Value ($) | |
Columbia Short-Term Cash Fund | | | 321,626,587 | | | | 2,428,477,047 | | | | (2,389,513,846 | ) | | | — | | | | 360,589,788 | | | | 394,018 | | | | — | | | | 360,589,788 | |
| | | | | | | | |
Columbia Mortgage Opportunites Fund, Class I Shares | | | — | | | | 32,906,862 | | | | — | | | | — | | | | 32,906,862 | | | | 708,106 | | | | 68,959 | | | | 32,733,725 | |
| | | | | | | | | | | | | | | | | | | | | | | | | | | | | | | | | |
Total | | | 321,626,587 | | | | 2,461,383,909 | | | | (2,389,513,846 | ) | | | — | | | | 393,496,650 | | | | 1,102,124 | | | | 68,959 | | | | 393,323,513 | |
| | | | | | | | | | | | | | | | | | | | | | | | | | | | | | | | | |
| (r) | The rate shown is the seven-day current annualized yield at August 31, 2015. |
The accompanying Notes to Financial Statements are an integral part of this statement.
| | |
| |
| | ACTIVE PORTFOLIOS® MULTI-MANAGER CORE PLUS BOND FUND |
PORTFOLIO OF INVESTMENTS (continued)
August 31, 2015
Abbreviation Legend
| | |
| AGM | | Assured Guaranty Municipal Corporation |
| CMO | | Collateralized Mortgage Obligation |
| NPFGC | | National Public Finance Guarantee Corporation |
| PIK | | Payment-in-Kind |
| STRIPS | | Separate Trading of Registered Interest and Principal Securities |
Currency Legend
Fair Value Measurements
The Fund categorizes its fair value measurements according to a three-level hierarchy that maximizes the use of observable inputs and minimizes the use of unobservable inputs by prioritizing that the most observable input be used when available. Observable inputs are those that market participants would use in pricing an investment based on market data obtained from sources independent of the reporting entity. Unobservable inputs are those that reflect the Fund’s assumptions about the information market participants would use in pricing an investment. An investment’s level within the fair value hierarchy is based on the lowest level of any input that is deemed significant to the asset’s or liability’s fair value measurement. The input levels are not necessarily an indication of the risk or liquidity associated with investments at that level. For example, certain U.S. government securities are generally high quality and liquid, however, they are reflected as Level 2 because the inputs used to determine fair value may not always be quoted prices in an active market.
Fair value inputs are summarized in the three broad levels listed below:
| n | | Level 1 — Valuations based on quoted prices for investments in active markets that the Fund has the ability to access at the measurement date (including NAV for open-end mutual funds). Valuation adjustments are not applied to Level 1 investments. |
| n | | Level 2 — Valuations based on other significant observable inputs (including quoted prices for similar securities, interest rates, prepayment speeds, credit risks, etc.). |
| n | | Level 3 — Valuations based on significant unobservable inputs (including the Fund’s own assumptions and judgment in determining the fair value of investments). |
Inputs that are used in determining fair value of an investment may include price information, credit data, volatility statistics, and other factors. These inputs can be either observable or unobservable. The availability of observable inputs can vary between investments, and is affected by various factors such as the type of investment, and the volume and level of activity for that investment or similar investments in the marketplace. The inputs will be considered by the Investment Manager, along with any other relevant factors in the calculation of an investment’s fair value. The Fund uses prices and inputs that are current as of the measurement date, which may include periods of market dislocations. During these periods, the availability of prices and inputs may be reduced for many investments. This condition could cause an investment to be reclassified between the various levels within the hierarchy.
Investments falling into the Level 3 category are primarily supported by quoted prices from brokers and dealers participating in the market for those investments. However, these may be classified as Level 3 investments due to lack of market transparency and corroboration to support these quoted prices. Additionally, valuation models may be used as the pricing source for any remaining investments classified as Level 3. These models may rely on one or more significant unobservable inputs and/or significant assumptions by the Investment Manager. Inputs used in valuations may include, but are not limited to, financial statement analysis, capital account balances, discount rates and estimated cash flows, and comparable company data.
Under the direction of the Fund’s Board of Trustees (the Board), the Investment Manager’s Valuation Committee (the Committee) is responsible for overseeing the valuation procedures approved by the Board. The Committee consists of voting and non-voting members from various groups within the Investment Manager’s organization, including operations and accounting, trading and investments, compliance, risk management and legal.
The Committee meets at least monthly to review and approve valuation matters, which may include a description of specific valuation determinations, data regarding pricing information received from approved pricing vendors and brokers and the results of Board-approved valuation control policies and procedures (the Policies). The Policies address, among other things, instances when market quotations are or are not readily available, including recommendations of third party pricing vendors and a determination of appropriate pricing methodologies; events that require specific valuation determinations and assessment of fair value techniques; securities with a potential for stale pricing, including those that are illiquid, restricted, or in default; and the effectiveness of third party pricing vendors, including periodic reviews of vendors. The Committee meets more frequently, as needed, to discuss additional valuation matters, which may include the need to review back-testing results, review time-sensitive information or approve related valuation actions. The Committee reports to the Board, with members of the Committee meeting with the Board at each of its regularly scheduled meetings to discuss valuation matters and actions during the period, similar to those described earlier.
For investments categorized as Level 3, the Committee monitors information similar to that described above, which may include: (i) data specific to the issuer or comparable issuers, (ii) general market or specific sector news and (iii) quoted prices and specific or similar security transactions. The Committee considers this data and any changes from prior periods in order to assess the reasonableness of observable and unobservable inputs, any assumptions or internal models used to value those securities and changes in fair value. This data is also used to corroborate, when available, information received from approved pricing vendors and brokers. Various factors impact the frequency of monitoring this information (which may occur as often as daily). However, the Committee may determine that changes to inputs, assumptions and models are not required as a result of the monitoring procedures performed.
The accompanying Notes to Financial Statements are an integral part of this statement.
| | |
| |
| ACTIVE PORTFOLIOS® MULTI-MANAGER CORE PLUS BOND FUND | | |
PORTFOLIO OF INVESTMENTS (continued)
August 31, 2015
Fair Value Measurements (continued)
The following table is a summary of the inputs used to value the Fund’s investments at August 31, 2015:
| | | | | | | | | | | | | | | | |
| | | Level 1
Quoted Prices in Active
Markets for Identical
Assets ($) | | | Level 2
Other Significant
Observable Inputs ($) | | | Level 3 Significant
Unobservable Inputs ($) | | | Total ($) | |
Investments | | | | | | | | | | | | | | | | |
| | | | |
Corporate Bonds & Notes | | | — | | | | 1,556,223,298 | | | | — | | | | 1,556,223,298 | |
| | | | |
Residential Mortgage-Backed Securities — Agency | | | — | | | | 1,205,037,388 | | | | — | | | | 1,205,037,388 | |
| | | | |
Residential Mortgage-Backed Securities — Non-Agency | | | — | | | | 202,723,679 | | | | 3,729,958 | | | | 206,453,637 | |
| | | | |
Commercial Mortgage-Backed Securities — Agency | | | — | | | | 105,398,675 | | | | — | | | | 105,398,675 | |
| | | | |
Commercial Mortgage-Backed Securities — Non-Agency | | | — | | | | 205,679,183 | | | | 54,883 | | | | 205,734,066 | |
| | | | |
Asset-Backed Securities — Agency | | | — | | | | 39,702,404 | | | | — | | | | 39,702,404 | |
| | | | |
Asset-Backed Securities — Non-Agency | | | — | | | | 632,542,392 | | | | 5,016,915 | | | | 637,559,307 | |
| | | | |
Inflation-Indexed Bonds | | | — | | | | 149,736,283 | | | | — | | | | 149,736,283 | |
| | | | |
U.S. Treasury Obligations | | | 915,864,295 | | | | 14,539,823 | | | | — | | | | 930,404,118 | |
| | | | |
U.S. Government & Agency Obligations | | | — | | | | 57,621,476 | | | | — | | | | 57,621,476 | |
| | | | |
Foreign Government Obligations | | | — | | | | 73,909,786 | | | | — | | | | 73,909,786 | |
| | | | |
Municipal Bonds | | | — | | | | 20,087,165 | | | | — | | | | 20,087,165 | |
| | | | |
Preferred Debt | | | 19,624,502 | | | | — | | | | — | | | | 19,624,502 | |
| | | | |
Senior Loans | | | — | | | | 16,240,070 | | | | 806,010 | | | | 17,046,080 | |
| | | | |
Common Stocks | | | | | | | | | | | | | | | | |
| | | | |
Energy | | | — | | | | — | | | | 5,675 | | | | 5,675 | |
| | | | |
Fixed-Income Funds | | | 32,733,725 | | | | — | | | | — | | | | 32,733,725 | |
| | | | |
Treasury Bills | | | 274,994 | | | | — | | | | — | | | | 274,994 | |
| | | | |
Money Market Funds | | | — | | | | 360,589,788 | | | | — | | | | 360,589,788 | |
| | | | | | | | | | | | | | | | | |
Total Investments | | | 968,497,516 | | | | 4,640,031,410 | | | | 9,613,441 | | | | 5,618,142,367 | |
| | | | | | | | | | | | | | | | | |
Derivatives | | | | | | | | | | | | | | | | |
| | | | |
Assets | | | | | | | | | | | | | | | | |
| | | | |
Forward Foreign Currency Exchange Contracts | | | — | | | | 76 | | | | — | | | | 76 | |
| | | | |
Futures Contracts | | | 4,130,387 | | | | — | | | | — | | | | 4,130,387 | |
| | | | |
Swap Contracts | | | — | | | | 967,845 | | | | — | | | | 967,845 | |
| | | | |
Liabilities | | | | | | | | | | | | | | | | |
| | | | |
Futures Contracts | | | (3,128,901 | ) | | | — | | | | — | | | | (3,128,901 | ) |
| | | | |
Swap Contracts | | | — | | | | (1,084,197 | ) | | | — | | | | (1,084,197 | ) |
| | | | | | | | | | | | | | | | | |
Total | | | 969,499,002 | | | | 4,639,915,134 | | | | 9,613,441 | | | | 5,619,027,577 | |
| | | | | | | | | | | | | | | | | |
See the Portfolio of Investments for all investment classifications not indicated in the table.
The Fund’s assets assigned to the Level 2 input category are generally valued using the market approach, in which a security’s value is determined through reference to prices and information from market transactions for similar or identical assets.
Financial assets were transferred from Level 1 to Level 2 as the market for these assets is not considered publicly available. Fund per share market values were obtained using observable market inputs.
The accompanying Notes to Financial Statements are an integral part of this statement.
| | |
| |
| | ACTIVE PORTFOLIOS® MULTI-MANAGER CORE PLUS BOND FUND |
PORTFOLIO OF INVESTMENTS (continued)
August 31, 2015
Fair Value Measurements (continued)
The following table shows transfers between Level 1 and Level 2 of the fair value hierarchy:
| | | | | | |
| Transfers In | | Transfers Out |
| Level 1 ($) | | Level 2 ($) | | Level 1 ($) | | Level 2 ($) |
| — | | 321,626,587 | | 321,626,587 | | — |
| | | | | | | |
Transfers between Level 1 and Level 2 are determined based on the fair value at the beginning of the period for security positions held throughout the period.
Derivative instruments are valued at unrealized appreciation (depreciation).
The Fund does not hold any significant investments (greater than one percent of net assets) categorized as Level 3.
The Fund’s assets assigned to the Level 3 category are valued utilizing the valuation technique deemed the most appropriate in the circumstances.
Certain common stock classified as Level 3 securities are valued using the market approach. To determine fair value for these securities, management considered various factors which may have included, but were not limited to, the closing prices of similar securities from the issuer and quoted bids from market participants.
Certain senior loans, residential, commercial and asset backed securities classified as Level 3 securities are valued using the market approach and utilize single market quotations from broker dealers which may have included, but not limited to, observable transactions for identical or similar assets in the market and the distressed nature of the security. The appropriateness of fair values for these securities is monitored on an ongoing basis which may include results of back testing, manual price reviews and other control procedures. Significant increases (decreases) to any of these inputs would result in a significantly lower (higher) valuation measurement.
Financial Assets were transferred from Level 2 to Level 3 due to utilizing a single market quotation from a broker dealer. As a result, Management concluded that the market input(s) were generally unobservable.
Financial assets were transferred from Level 3 to Level 2 as observable market inputs were utilized and management determination that there was sufficient, reliable and observable market data to value these assets as of period end.
| | | | | | |
| Transfers In | | Transfers Out |
| Level 2 ($) | | Level 3 ($) | | Level 2 ($) | | Level 3 ($) |
| 17,443,436 | | 981,334 | | 981,334 | | 17,443,436 |
| | | | | | | |
Transfers in and/or out of Level 3 are determined based on the fair value at the beginning of the period for security positions held throughout the period.
The accompanying Notes to Financial Statements are an integral part of this statement.
| | |
| |
| ACTIVE PORTFOLIOS® MULTI-MANAGER CORE PLUS BOND FUND | | |
STATEMENT OF ASSETS AND LIABILITIES
August 31, 2015
| | | | |
Assets | | | | |
Investments, at value | | | | |
Unaffiliated issuers (identified cost $5,225,624,489) | | | $5,224,818,854 | |
Affiliated issuers (identified cost $393,496,650) | | | 393,323,513 | |
| |
Total investments (identified cost $5,619,121,139) | | | 5,618,142,367 | |
Foreign currency (identified cost $45,857) | | | 34,677 | |
Margin deposits | | | 32,988 | |
Unrealized appreciation on forward foreign currency exchange contracts | | | 76 | |
Unrealized appreciation on swap contracts | | | 816,329 | |
Premiums paid on outstanding swap contracts | | | 3,042,336 | |
Receivable for: | | | | |
Investments sold | | | 138,573,146 | |
Investments sold on a delayed delivery basis | | | 51,046,452 | |
Capital shares sold | | | 18,780,045 | |
Dividends | | | 68,228 | |
Interest | | | 27,977,371 | |
Foreign tax reclaims | | | 60,147 | |
Variation margin | | | 1,185,288 | |
Prepaid expenses | | | 49,976 | |
Trustees’ deferred compensation plan | | | 56,673 | |
| |
Total assets | | | 5,859,866,099 | |
| |
| |
Liabilities | | | | |
Unrealized depreciation on swap contracts | | | 788,537 | |
Premiums received on outstanding swap contracts | | | 2,505,365 | |
Payable for: | | | | |
Investments purchased | | | 210,565,755 | |
Investments purchased on a delayed delivery basis | | | 530,482,826 | |
Capital shares purchased | | | 9,931,472 | |
Dividend distributions to shareholders | | | 6,714,519 | |
Variation margin | | | 581,139 | |
Investment management fees | | | 170,479 | |
Distribution and/or service fees | | | 104,654 | |
Transfer agent fees | | | 233,410 | |
Administration fees | | | 23,932 | |
Compensation of board members | | | 1,552 | |
Chief compliance officer expenses | | | 404 | |
Other expenses | | | 190,507 | |
Trustees’ deferred compensation plan | | | 56,673 | |
Other liabilities | | | 57,070 | |
| |
Total liabilities | | | 762,408,294 | |
| |
Net assets applicable to outstanding capital stock | | | $5,097,457,805 | |
| |
| |
Represented by | | | | |
Paid-in capital | | | $5,091,226,025 | |
Undistributed net investment income | | | 4,382,995 | |
Accumulated net realized gain | | | 1,952,269 | |
Unrealized appreciation (depreciation) on: | | | | |
Investments — unaffiliated issuers | | | (805,635 | ) |
Investments — affiliated issuers | | | (173,137 | ) |
Foreign currency translations | | | (9,922 | ) |
Forward foreign currency exchange contracts | | | 76 | |
Futures contracts | | | 1,001,486 | |
Swap contracts | | | (116,352 | ) |
| |
Total — representing net assets applicable to outstanding capital stock | | | $5,097,457,805 | |
| |
| |
Class A | | | | |
Net assets | | | $5,097,457,805 | |
Shares outstanding | | | 506,683,975 | |
Net asset value per share | | | $10.06 | |
| |
The accompanying Notes to Financial Statements are an integral part of this statement.
| | |
| |
| | ACTIVE PORTFOLIOS® MULTI-MANAGER CORE PLUS BOND FUND |
STATEMENT OF OPERATIONS
Year Ended August 31, 2015
| | | | |
Net investment income | | | | |
| |
Income: | | | | |
| |
Dividends — unaffiliated issuers | | | $1,627,338 | |
| |
Dividends — affiliated issuers | | | 1,102,124 | |
| |
Interest | | | 126,883,370 | |
| |
Total income | | | 129,612,832 | |
| |
| |
Expenses: | | | | |
| |
Investment management fees | | | 19,958,476 | |
| |
Distribution and/or service fees | | | | |
| |
Class A | | | 12,159,835 | |
| |
Transfer agent fees | | | | |
| |
Class A | | | 3,161,564 | |
| |
Administration fees | | | 2,809,022 | |
| |
Compensation of board members | | | 108,982 | |
| |
Custodian fees | | | 114,027 | |
| |
Printing and postage fees | | | 245,977 | |
| |
Registration fees | | | 138,494 | |
| |
Professional fees | | | 185,565 | |
| |
Chief compliance officer expenses | | | 2,411 | |
| |
Other | | | 87,865 | |
| |
Total expenses | | | 38,972,218 | |
| |
Fees waived or expenses reimbursed by Investment Manager and its affiliates | | | (66,602 | ) |
| |
Total net expenses | | | 38,905,616 | |
| |
Net investment income | | | 90,707,216 | |
| |
| |
Realized and unrealized gain (loss) — net | | | | |
| |
Net realized gain (loss) on: | | | | |
| |
Investments — unaffiliated issuers | | | 31,557,157 | |
| |
Investments — affiliated issuers | | | 54,572 | |
| |
Capital gain distributions from underlying affiliated funds | | | 68,959 | |
| |
Foreign currency translations | | | (50,580 | ) |
| |
Forward foreign currency exchange contracts | | | 1,535,700 | |
| |
Futures contracts | | | (11,997,736 | ) |
| |
Swap contracts | | | (3,950,229 | ) |
| |
Net realized gain | | | 17,217,843 | |
| |
Net change in unrealized appreciation (depreciation) on: | | | | |
| |
Investments — unaffiliated issuers | | | (97,084,414 | ) |
| |
Investments — affiliated issuers | | | (173,137 | ) |
| |
Foreign currency translations | | | (7,034 | ) |
| |
Forward foreign currency exchange contracts | | | (98,038 | ) |
| |
Futures contracts | | | 2,987,988 | |
| |
Swap contracts | | | 2,407,838 | |
| |
Net change in unrealized depreciation | | | (91,966,797 | ) |
| |
Net realized and unrealized loss | | | (74,748,954 | ) |
| |
Net increase in net assets resulting from operations | | | $15,958,262 | |
| |
The accompanying Notes to Financial Statements are an integral part of this statement.
| | |
| |
| ACTIVE PORTFOLIOS® MULTI-MANAGER CORE PLUS BOND FUND | | |
STATEMENT OF CHANGES IN NET ASSETS
| | | | | | | | |
| | | Year Ended
August 31, 2015 | | | Year Ended
August 31, 2014 | |
Operations | | | | | | | | |
| | |
Net investment income | | | $90,707,216 | | | | $86,262,083 | |
| | |
Net realized gain (loss) | | | 17,217,843 | | | | (5,117,692 | ) |
| | |
Net change in unrealized appreciation (depreciation) | | | (91,966,797 | ) | | | 156,981,309 | |
| |
Net increase in net assets resulting from operations | | | 15,958,262 | | | | 238,125,700 | |
| |
| | |
Distributions to shareholders | | | | | | | | |
| | |
Net investment income | | | | | | | | |
| | |
Class A | | | (95,037,479 | ) | | | (82,851,418 | ) |
| | |
Net realized gains | | | | | | | | |
| | |
Class A | | | — | | | | (12,839,330 | ) |
| |
Total distributions to shareholders | | | (95,037,479 | ) | | | (95,690,748 | ) |
| |
Increase in net assets from capital stock activity | | | 520,316,679 | | | | 499,907,214 | |
| |
Total increase in net assets | | | 441,237,462 | | | | 642,342,166 | |
| | |
Net assets at beginning of year | | | 4,656,220,343 | | | | 4,013,878,177 | |
| |
Net assets at end of year | | | $5,097,457,805 | | | | $4,656,220,343 | |
| |
Undistributed net investment income | | | $4,382,995 | | | | $6,841,300 | |
| |
The accompanying Notes to Financial Statements are an integral part of this statement.
| | |
| |
| | ACTIVE PORTFOLIOS® MULTI-MANAGER CORE PLUS BOND FUND |
STATEMENT OF CHANGES IN NET ASSETS (continued)
| | | | | | | | | | | | | | | | |
| | | Year Ended
August 31, 2015 | | | Year Ended
August 31, 2014 | |
| | | Shares | | | Dollars ($) | | | Shares | | | Dollars ($) | |
Capital stock activity | | | | | | | | | | | | | | | | |
| | | | |
Class A shares | | | | | | | | | | | | | | | | |
| | | | |
Subscriptions | | | 147,095,790 | | | | 1,501,600,269 | | | | 166,652,463 | | | | 1,676,617,283 | |
| | | | |
Distributions reinvested | | | 9,334,150 | | | | 95,037,274 | | | | 9,531,789 | | | | 95,690,368 | |
| | | | |
Redemptions | | | (105,705,717 | ) | | | (1,076,320,864 | ) | | | (127,035,349 | ) | | | (1,272,400,437 | ) |
| |
Net increase | | | 50,724,223 | | | | 520,316,679 | | | | 49,148,903 | | | | 499,907,214 | |
| |
Total net increase | | | 50,724,223 | | | | 520,316,679 | | | | 49,148,903 | | | | 499,907,214 | |
| |
The accompanying Notes to Financial Statements are an integral part of this statement.
| | |
| |
| ACTIVE PORTFOLIOS® MULTI-MANAGER CORE PLUS BOND FUND | | |
FINANCIAL HIGHLIGHTS
The following table is intended to help you understand the Fund’s financial performance. Certain information reflects financial results for a single share of a class held for the periods shown. Per share net investment income (loss) amounts are calculated based on average shares outstanding during the period. Total return assumes reinvestment of all dividends and distributions, if any. Total return does not reflect payment of sales charges, if any. Total return and portfolio turnover are not annualized for periods of less than one year. The portfolio turnover rate is calculated without regard to purchase and sales transactions of short-term instruments and certain derivatives, if any. If such transactions were included, the Fund’s portfolio turnover rate may be higher.
| | | | | | | | | | | | | | | | |
| | | Year Ended August 31, | |
Class A | | | 2015 | | | | 2014 | | | | 2013 | | | | 2012(a) | |
Per share data | | | | | | | | | | | | | | | | |
Net asset value, beginning of period | | | $10.21 | | | | $9.87 | | | | $10.24 | | | | $10.00 | |
| | | | | | | | | | | | | | | | | |
Income from investment operations: | | | | | | | | | | | | | | | | |
| | | | |
Net investment income | | | 0.19 | | | | 0.21 | | | | 0.19 | | | | 0.08 | |
| | | | | | | | | | | | | | | | | |
Net realized and unrealized gain (loss) | | | (0.14 | ) | | | 0.36 | | | | (0.30 | ) | | | 0.24 | |
| | | | | | | | | | | | | | | | | |
Total from investment operations | | | 0.05 | | | | 0.57 | | | | (0.11 | ) | | | 0.32 | |
| | | | | | | | | | | | | | | | | |
Less distributions to shareholders: | | | | | | | | | | | | | | | | |
| | | | |
Net investment income | | | (0.20 | ) | | | (0.20 | ) | | | (0.19 | ) | | | (0.08 | ) |
| | | | | | | | | | | | | | | | | |
Net realized gains | | | — | | | | (0.03 | ) | | | (0.07 | ) | | | — | |
| | | | | | | | | | | | | | | | | |
Total distributions to shareholders | | | (0.20 | ) | | | (0.23 | ) | | | (0.26 | ) | | | (0.08 | ) |
| | | | | | | | | | | | | | | | | |
Net asset value, end of period | | | $10.06 | | | | $10.21 | | | | $9.87 | | | | $10.24 | |
| | | | | | | | | | | | | | | | | |
Total return | | | 0.49 | % | | | 5.86 | % | | | (1.16 | %) | | | 3.17 | % |
| | | | | | | | | | | | | | | | | |
Ratios to average net assets(b) | | | | | | | | | | | | | | | | |
| | | | |
Total gross expenses | | | 0.80 | % | | | 0.80 | % | | | 0.79 | % | | | 0.81 | %(c) |
| | | | | | | | | | | | | | | | | |
Total net expenses(d) | | | 0.80 | % | | | 0.80 | % | | | 0.79 | % | | | 0.81 | %(c) |
| | | | | | | | | | | | | | | | | |
Net investment income | | | 1.86 | % | | | 2.09 | % | | | 1.88 | % | | | 2.09 | %(c) |
| | | | | | | | | | | | | | | | | |
Supplemental data | | | | | | | | | | | | | | | | |
| | | | |
Net assets, end of period (in thousands) | | | $5,097,458 | | | | $4,656,220 | | | | $4,013,878 | | | | $4,741,043 | |
| | | | | | | | | | | | | | | | | |
Portfolio turnover | | | 269 | % | | | 207 | % | | | 213 | % | | | 78 | % |
| | | | | | | | | | | | | | | | | |
Notes to Financial Highlights
| (a) | Based on operations from April 20, 2012 (commencement of operations) through the stated period end. |
| (b) | In addition to the fees and expenses that the Fund bears directly, the Fund indirectly bears a pro rata share of the fees and expenses of any other funds in which it invests. Such indirect expenses are not included in the Fund’s reported expense ratios. |
| (d) | Total net expenses include the impact of certain fee waivers/expense reimbursements made by the Investment Manager and certain of its affiliates, if applicable. |
The accompanying Notes to Financial Statements are an integral part of this statement.
| | |
| |
| | ACTIVE PORTFOLIOS® MULTI-MANAGER CORE PLUS BOND FUND |
NOTES TO FINANCIAL STATEMENTS
August 31, 2015
Note 1. Organization
Active Portfolios® Multi-Manager Core Plus Bond Fund (the Fund), a series of Columbia Funds Series Trust I (the Trust), is a diversified fund. The Trust is registered under the Investment Company Act of 1940, as amended (the 1940 Act), as an open-end management investment company organized as a Massachusetts business trust.
Fund Shares
The Trust may issue an unlimited number of shares (without par value). The Fund only offers Class A shares that are available only to certain eligible investors through certain wrap fee programs sponsored and/or managed by Ameriprise Financial, Inc. (Ameriprise Financial) or its affiliates.
Class A shares are not subject to any front-end sales charge or contingent deferred sales charge.
Note 2. Summary of Significant Accounting Policies
Basis of Preparation
The Fund is an investment company that applies the accounting and reporting guidance in the Financial Accounting Standards Board (FASB) Accounting Standards Codification Topic 946, Financial Services — Investment Companies (ASC 946). The financial statements are prepared in accordance with U.S. generally accepted accounting principles (GAAP), which requires management to make certain estimates and assumptions that affect the reported amounts of assets and liabilities, the disclosure of contingent assets and liabilities at the date of the financial statements and the reported amounts of income and expenses during the reporting period. Actual results could differ from those estimates.
The following is a summary of significant accounting policies followed by the Fund in the preparation of its financial statements.
Security Valuation
Debt securities generally are valued by pricing services approved by the Board of Trustees (the Board) based upon market transactions for normal, institutional-size trading units of similar securities. The services may use various pricing techniques that take into account, as applicable, factors such as yield, quality, coupon rate, maturity, type of issue, trading characteristics and other data, as well as broker quotes. Debt securities for which quotations are not readily available or not believed to be
reflective of market value may also be valued based upon a bid quote from an approved independent broker-dealer. Debt securities maturing in 60 days or less are valued primarily at amortized cost value, unless this method results in a valuation that management believes does not approximate market value.
Asset- and mortgage-backed securities are generally valued by pricing services, which utilize pricing models that incorporate the securities’ cash flow and loan performance data. These models also take into account available market data, including trades, market quotations, and benchmark yield curves for identical or similar securities. Factors used to identify similar securities may include, but are not limited to, issuer, collateral type, vintage, prepayment speeds, collateral performance, credit ratings, credit enhancement and expected life. Asset-backed securities for which quotations are readily available may also be valued based upon an over-the-counter or exchange bid quote from an approved independent broker-dealer.
Senior loan securities for which reliable market quotations are readily available are generally valued by pricing services at the average of the bids received.
All equity securities are valued at the close of business of the New York Stock Exchange (NYSE). Equity securities are valued at the last quoted sales price on the principal exchange or market on which they trade, except for securities traded on the NASDAQ Stock Market, which are valued at the NASDAQ official close price. Unlisted securities or listed securities for which there were no sales during the day are valued at the mean of the latest quoted bid and ask prices on such exchanges or markets.
Investments in open-end investment companies, including money market funds, are valued at their latest net asset value.
Forward foreign currency exchange contracts are marked-to-market based upon foreign currency exchange rates provided by a pricing service.
Futures and options on futures contracts are valued based upon the settlement price at the close of regular trading on their principal exchanges or, in the absence of transactions, at the mean of the latest quoted bid and ask prices.
Swap transactions are valued through an independent pricing service or broker, or if neither is available, through an internal model based upon observable inputs.
| | |
| |
| ACTIVE PORTFOLIOS® MULTI-MANAGER CORE PLUS BOND FUND | | |
NOTES TO FINANCIAL STATEMENTS (continued)
August 31, 2015
Investments for which market quotations are not readily available, or that have quotations which management believes are not reflective of market value or reliable, are valued at fair value as determined in good faith under procedures approved by and under the general supervision of the Board. If a security or class of securities (such as foreign securities) is valued at fair value, such value is likely to be different from the quoted or published price for the security.
The determination of fair value often requires significant judgment. To determine fair value, management may use assumptions including but not limited to future cash flows and estimated risk premiums. Multiple inputs from various sources may be used to determine fair value.
GAAP requires disclosure regarding the inputs and valuation techniques used to measure fair value and any changes in valuation inputs or techniques. In addition, investments shall be disclosed by major category. This information is disclosed following the Fund’s Portfolio of Investments.
Foreign Currency Transactions and Translations
The values of all assets and liabilities denominated in foreign currencies are generally translated into U.S. dollars at exchange rates determined at the close of the NYSE. Net realized and unrealized gains (losses) on foreign currency transactions and translations include gains (losses) arising from the fluctuation in exchange rates between trade and settlement dates on securities transactions, gains (losses) arising from the disposition of foreign currency and currency gains (losses) between the accrual and payment dates on dividends, interest income and foreign withholding taxes.
For financial statement purposes, the Fund does not distinguish that portion of gains (losses) on investments which is due to changes in foreign exchange rates from that which is due to changes in market prices of the investments. Such fluctuations are included with the net realized and unrealized gains (losses) on investments in the Statement of Operations.
Derivative Instruments
The Fund invests in certain derivative instruments, as detailed below, to meet its investment objectives. Derivatives are instruments whose values depend on, or are derived from, in whole or in part, the value of one or more securities, currencies, commodities, indices, or other assets or instruments. Derivatives may be used to increase investment flexibility (including to maintain cash reserves while maintaining desired exposure to certain
assets), for risk management (hedging) purposes, to facilitate trading, to reduce transaction costs and to pursue higher investment returns. The Fund may also use derivative instruments to mitigate certain investment risks, such as foreign currency exchange rate risk, interest rate risk and credit risk. Derivatives may involve various risks, including the potential inability of the counterparty to fulfill its obligation under the terms of the contract, the potential for an illiquid secondary market (making it difficult for the Fund to sell, including at favorable prices) and the potential for market movements which may expose the Fund to gains or losses in excess of the amount shown in the Statement of Assets and Liabilities. The notional amounts of derivative instruments, if applicable, are not recorded in the financial statements.
A derivative instrument may suffer a marked-to-market loss if the value of the contract decreases due to an unfavorable change in the market rates or values of the underlying instrument. Losses can also occur if the counterparty does not perform under the contract. The Fund’s risk of loss from counterparty credit risk on over-the-counter derivatives is generally limited to the aggregate unrealized gain netted against any collateral held by the Fund and the amount of any variation margin held by the counterparty. With exchange-traded or centrally cleared derivatives, there is reduced counterparty credit risk to the Fund since the exchange’s clearinghouse, as counterparty to such instruments, guarantees against a possible default. The clearinghouse stands between the buyer and the seller of the contract; therefore, the counterparty credit risk is failure of the clearinghouse. However, credit risk still exists in exchange-traded or centrally cleared derivatives with respect to initial and variation margin that is held in a broker’s customer account. While brokers are required to segregate customer margin from their own assets, in the event that a broker becomes insolvent or goes into bankruptcy and at that time there is a shortfall in the aggregate amount of margin held by the broker for all its clients, U.S. bankruptcy laws will typically allocate that shortfall on a pro-rata basis across all the broker’s customers (including the Fund), potentially resulting in losses to the Fund.
In order to better define its contractual rights and to secure rights that will help the Fund mitigate its counterparty risk, the Fund may enter into an International Swaps and Derivatives Association, Inc. Master Agreement (ISDA Master Agreement) or similar agreement with its derivatives contract counterparties.
| | |
| |
| | ACTIVE PORTFOLIOS® MULTI-MANAGER CORE PLUS BOND FUND |
NOTES TO FINANCIAL STATEMENTS (continued)
August 31, 2015
An ISDA Master Agreement is an agreement between the Fund and a counterparty that governs over-the-counter derivatives and forward foreign currency exchange contracts and typically contains, among other things, collateral posting terms and netting provisions in the event of a default and/or termination event. Under an ISDA Master Agreement, the Fund may, under certain circumstances, offset with the counterparty certain derivative instrument’s payables and/or receivables with collateral held and/or posted and create one single net payment. The provisions of the ISDA Master Agreement typically permit a single net payment in the event of default (close-out netting) including the bankruptcy or insolvency of the counterparty. Note, however, that bankruptcy or insolvency laws of a particular jurisdiction may impose restrictions on or prohibitions against the right of offset in bankruptcy, insolvency or other events.
Collateral (margin) requirements differ by type of derivative. Margin requirements are established by the exchange or clearinghouse for exchange-traded and centrally cleared derivatives. Brokers can ask for margin in excess of the minimum in certain circumstances. Collateral terms are contract specific for over-the-counter derivatives. For over-the-counter derivatives traded under an ISDA Master Agreement, the collateral requirements are typically calculated by netting the marked-to-market amount for each transaction under such agreement and comparing that amount to the value of any variation margin currently pledged by the Fund and/or the counterparty. Generally, the amount of collateral due from or to a party has to exceed a minimum transfer amount threshold (e.g., $500,000) before a transfer has to be made. To the extent amounts due to the Fund from its counterparties are not fully collateralized, contractually or otherwise, the Fund bears the risk of loss from counterparty nonperformance. The Fund attempts to mitigate counterparty risk by only entering into agreements with counterparties that it believes have the financial resources to honor their obligations and by monitoring the financial stability of those counterparties.
Certain ISDA Master Agreements allow counterparties to over-the-counter derivatives transactions to terminate derivatives contracts prior to maturity in the event the Fund’s net asset value declines by a stated percentage over a specified time period or if the Fund fails to meet certain terms of the ISDA Master Agreement, which would cause the Fund to accelerate payment of any net liability owed to the counterparty. The Fund also has termination rights if the counterparty fails to meet certain terms of the ISDA Master Agreement. In addition to
considering counterparty credit risk, the Fund would consider terminating the derivatives contracts based on whether termination would result in a net liability owed from the counterparty.
For financial reporting purposes, the Fund does not offset derivative assets and derivative liabilities that are subject to netting arrangements in the Statement of Assets and Liabilities.
Forward Foreign Currency Exchange Contracts
Forward foreign currency exchange contracts are over-the-counter agreements between two parties to buy and sell a currency at a set price on a future date. The Fund utilized forward foreign currency exchange contracts to hedge the currency exposure associated with some or all of the Fund’s securities, and to shift foreign currency exposure back to U.S. dollars. These instruments may be used for other purposes in future periods.
The values of forward foreign currency exchange contracts fluctuate daily with changes in foreign currency exchange rates. Changes in the value of these contracts are recorded as unrealized appreciation or depreciation until the contract is exercised or has expired. The Fund will realize a gain or loss when the forward foreign currency exchange contract is closed or expires.
The use of forward foreign currency exchange contracts does not eliminate fluctuations in the prices of the Fund’s portfolio securities. The risks of forward foreign currency exchange contracts include movement in the values of the foreign currencies relative to the U.S. dollar (or other foreign currencies) and the possibility that counterparties will not complete their contractual obligations, which may be in excess of the amount reflected, if any, in the Statement of Assets and Liabilities.
Futures Contracts
Futures contracts are exchange traded and represent commitments for the future purchase or sale of an asset at a specified price on a specified date. The Fund bought and sold futures contracts to produce incremental earnings, manage the duration and yield curve exposure of the Fund versus the benchmark, and to manage exposure to movements in interest rates. These instruments may be used for other purposes in future periods. Upon entering into futures contracts, the Fund bears risks that it may not achieve the anticipated benefits of the futures contracts and may realize a loss. Additional risks include counterparty credit risk, the possibility of an illiquid market, and that a change in the
| | |
| |
| ACTIVE PORTFOLIOS® MULTI-MANAGER CORE PLUS BOND FUND | | |
NOTES TO FINANCIAL STATEMENTS (continued)
August 31, 2015
value of the contract or option may not correlate with changes in the value of the underlying asset.
Upon entering into a futures contract, the Fund pledges cash or securities with the broker in an amount sufficient to meet the initial margin requirement. The initial margin deposit must be maintained at an established level over the life of the contract. Cash deposited as initial margin is recorded in the Statement of Assets and Liabilities as margin deposits. Securities deposited as initial margin are designated in the Portfolio of Investments. Subsequent payments (variation margin) are made or received by the Fund each day. The variation margin payments are equal to the daily change in the contract value and are recorded as variation margin receivable or payable and are offset in unrealized gains or losses. The Fund recognizes a realized gain or loss when the contract is closed or expires. Futures contracts involve, to varying degrees, risk of loss in excess of the variation margin disclosed in the Statement of Assets and Liabilities.
Swap Contracts
Swap contracts are negotiated in the over-the-counter market and may be entered into as a bilateral contract or centrally cleared (centrally cleared swap contract). In a centrally cleared swap contract, immediately following execution of the swap contract with a broker, the swap contract is novated to a central counterparty (the CCP) and the CCP becomes the Fund’s counterparty to the centrally cleared swap contract. The Fund is required to deposit initial margin with the broker in the form of cash or securities in an amount that varies depending on the size and risk profile of the particular swap contract. Securities deposited as initial margin are designated in the Portfolio of Investments and cash deposited is recorded in the Statement of Assets and Liabilities as margin deposits. Unlike a bilateral swap contract, for centrally cleared swap contracts, the Fund has minimal credit exposure to the counterparty because the CCP stands between the Fund and the counterparty. Swap contracts are marked-to-market daily and changes in value are recorded as unrealized appreciation (depreciation). The daily change in valuation of centrally cleared swap contracts, if any, is recorded as a receivable or payable for variation margin in the Statement of Assets and Liabilities.
Credit Default Swap Contracts
The Fund entered into credit default swap contracts to increase or decrease its credit exposure to an index, increase or decrease its credit exposure to a single issuer of debt securities, and to hedge the Fund’s
exposure on a debt security that it owns or in lieu of selling such debt security. These instruments may be used for other purposes in future periods. Credit default swap contracts are agreements in which one party pays fixed periodic payments to a counterparty in consideration for a guarantee from the counterparty to make a specific payment should a specified credit event(s) take place. Although specified credit events are contract specific, credit events are generally defined as bankruptcy, failure to pay, restructuring, obligation acceleration, obligation default, or repudiation/moratorium.
As the purchaser of a credit default swap contract, the Fund purchases protection by paying a periodic interest rate on the notional amount to the counterparty. The interest amount is accrued daily as a component of unrealized appreciation (depreciation) and is recorded as a realized loss upon payment. If a credit event as specified in the contract occurs, the Fund may have the option either to deliver the reference obligation to the seller in exchange for a cash payment of its par amount, or to receive a net cash settlement equal to the par amount less an agreed-upon value of the reference obligation as of the date of the credit event. The difference between the value of the obligation or cash delivered and the notional amount received will be recorded as a realized gain (loss).
As the seller of a credit default swap contract, the Fund sells protection to a buyer and will generally receive a periodic interest rate on the notional amount. The interest amount is accrued daily as a component of unrealized appreciation (depreciation) and is recorded as a realized gain upon receipt of the payment. If a credit event as specified in the contract with the counterparty occurs, the Fund may either be required to accept the reference obligation from the buyer in exchange for a cash payment of its notional amount, or to pay the buyer a net cash settlement equal to the notional amount less an agreed-upon value of the reference obligation (recovery value) as of the date of the credit event. The difference between the value of the obligation or cash received and the notional amount paid will be recorded as a realized gain (loss). The maximum potential amount of undiscounted future payments the Fund could be required to make as the seller of protection under a credit default swap contract is equal to the notional amount of the reference obligation. These potential amounts may be partially offset by any recovery values of the respective reference obligations or premiums received upon entering into the agreement. The notional
| | |
| |
| | ACTIVE PORTFOLIOS® MULTI-MANAGER CORE PLUS BOND FUND |
NOTES TO FINANCIAL STATEMENTS (continued)
August 31, 2015
amounts and market values of all credit default swap contracts in which the Fund is the seller of protection, if any, are disclosed in the Credit Default Swap Contracts Outstanding schedule following the Portfolio of Investments.
As a protection seller, the Fund bears the risk of loss from the credit events specified in the contract with the counterparty. For credit default swap contracts on credit indices, quoted market prices and resulting market values serve as an indicator of the current status of the payment/performance risk. Increasing market values, in absolute terms when compared to the notional amount of the swap, represent a deterioration of the reference entity’s credit soundness and a greater likelihood or risk of default or other credit event occurring as defined under the terms of the contract.
Any premium paid or received by the Fund upon entering into a credit default swap contract is recorded as an asset or liability, respectively, and amortized daily as a component of realized gain (loss) in the Statement of Operations. Credit default swap contracts are valued daily, and the change in value is recorded as unrealized appreciation (depreciation) until the termination of the swap, at which time a realized gain (loss) is recorded.
Credit default swap contracts can involve greater risks than if a fund had invested in the reference obligation directly since, in addition to general market risks, credit default swaps are subject to counterparty credit risk, leverage risk, hedging risk, correlation risk and liquidity risk. The Fund will enter into credit default swap transactions only with counterparties that meet certain standards of creditworthiness, as determined by the Investment Manager.
Interest Rate Swap Contracts
The Fund entered into interest rate swap transactions to manage the duration and yield curve exposure of the fund versus the benchmark. These instruments may be used for other purposes in future periods. Interest rate swaps are agreements between two parties that involve the exchange of one type of interest rate for another type of interest rate cash flow on specified dates in the future, based on a predetermined, specified notional amount. Certain interest rate swaps are considered forward-starting, whereby the accrual for the exchange of cash flows does not begin until a specified date in the future (the effective date). The net cash flow for a standard interest rate swap transaction is generally the difference between a floating market interest rate versus a fixed interest rate.
Interest rate swaps are valued daily and unrealized appreciation (depreciation) is recorded. Certain interest rate swaps may accrue periodic interest on a daily basis as a component of unrealized appreciation (depreciation); the Fund will realize a gain or loss upon the payment or receipt of accrued interest. The Fund will realize a gain or a loss when the interest rate swap is terminated.
Risks of entering into interest rate swaps include a lack of correlation between the swaps and the portfolio of bonds the swaps are designed to hedge or replicate. A lack of correlation may cause the interest rate swaps to experience adverse changes in value relative to expectations. In addition, interest rate swaps are subject to the risk of default of a counterparty, and the risk of adverse movements in market interest rates relative to the interest rate swap positions taken. The Fund’s maximum risk of loss from counterparty credit risk is the discounted net value of the cash flows to be received from/paid to the counterparty over the contract’s remaining life to the extent that such amount is positive, plus the cost of entering into a similar transaction with another counterparty.
The Fund attempts to mitigate counterparty credit risk by entering into interest rate swap transactions only with counterparties that meet prescribed levels of creditworthiness, as determined by the Investment Manager. The Fund and any counterparty are required to maintain an agreement that requires the Fund and that counterparty to monitor (on a daily basis) the net market value of all derivative transactions entered into pursuant to the agreement between the Fund and such counterparty. If the net market value of such derivatives transactions between the Fund and that counterparty exceeds a certain threshold (as defined in the agreement), the Fund or the counterparty is required to post cash and/or securities as collateral. Market values of derivatives transactions presented in the financial statements are not netted with the market values of other derivatives transactions or with any collateral amounts posted by the Fund or any counterparty.
Effects of Derivative Transactions in the Financial Statements
The following tables are intended to provide additional information about the effect of derivatives on the financial statements of the Fund, including: the fair value of derivatives by risk category and the location of those fair values in the Statement of Assets and Liabilities; and the impact of derivative transactions over the period in
| | |
| |
| ACTIVE PORTFOLIOS® MULTI-MANAGER CORE PLUS BOND FUND | | |
NOTES TO FINANCIAL STATEMENTS (continued)
August 31, 2015
the Statement of Operations, including realized and unrealized gains (losses). The derivative instrument schedules following the Portfolio of Investments present additional information regarding derivative instruments outstanding at the end of the period, if any.
The following table is a summary of the fair value of derivative instruments (not considered to be hedging instruments for accounting disclosure purposes) at August 31, 2015:
| | | | | | |
| | | | | | | |
| | Asset Derivatives | |
Risk Exposure
Category | | Statement of Assets and Liabilities Location | | | Fair Value ($) | |
Credit risk | | Net assets — unrealized appreciation on swap contracts | | | 967,845 | * |
Credit risk | | Premiums paid on outstanding swap contracts | | | 3,042,336 | |
Foreign exchange risk | | Unrealized appreciation on forward foreign currency exchange contracts | | | 76 | |
Interest rate risk | | Net assets — unrealized appreciation on futures contracts | | | 4,130,387 | * |
Total | | | | | 8,140,644 | |
| |
| | Liability Derivatives | |
Risk Exposure
Category | | Statement of Assets and Liabilities Location | | | Fair Value ($) | |
Credit risk | | Net assets — unrealized depreciation on swap contracts | | | 1,084,197 | * |
Credit risk | | Premiums received on outstanding swap contracts | | | 2,505,365 | |
Interest rate risk | | Net assets — unrealized depreciation on futures contracts | | | 3,128,901 | * |
Total | | | | | 6,718,463 | |
| * | Includes cumulative appreciation (depreciation) as reported in the tables following the Portfolio of Investments. Only the current day’s variation margin is reported in receivables or payables in the Statement of Assets and Liabilities. |
The following table indicates the effect of derivative instruments (not considered to be hedging instruments for accounting disclosure purposes) in the Statement of Operations for the year ended August 31, 2015:
| | | | | | | | | | | | | | | | |
| Amount of Realized Gain (Loss) on Derivatives Recognized in Income | |
Risk Exposure
Category | | Forward
Foreign
Currency
Exchange
Contracts
($) | | | Futures
Contracts ($) | | | Swap
Contracts
($) | | | Total
($) | |
Credit risk | | | — | | | | — | | | | (4,618,608 | ) | | | (4,618,608 | ) |
| | | | | | | | | | | | | | | | | |
Foreign exchange risk | | | 1,535,700 | | | | — | | | | — | | | | 1,535,700 | |
| | | | | | | | | | | | | | | | | |
Interest rate risk | | | — | | | | (11,997,736 | ) | | | 668,379 | | | | (11,329,357 | ) |
| | | | | | | | | | | | | | | | | |
Total | | | 1,535,700 | | | | (11,997,736 | ) | | | (3,950,229 | ) | | | (14,412,265 | ) |
| | | | | | | | | | | | | | | | | |
Change in Unrealized Appreciation (Depreciation) on Derivatives Recognized in
Income | |
Risk Exposure
Category | | Forward
Foreign
Currency
Exchange
Contracts
($) | | | Futures
Contracts ($) | | | Swap
Contracts
($) | | | Total
($) | |
Credit risk | | | — | | | | — | | | | 2,407,087 | | | | 2,407,087 | |
| | | | | | | | | | | | | | | | | |
Foreign exchange risk | | | (98,038 | ) | | | — | | | | — | | | | (98,038 | ) |
| | | | | | | | | | | | | | | | | |
Interest rate risk | | | — | | | | 2,987,988 | | | | 751 | | | | 2,988,739 | |
| | | | | | | | | | | | | | | | | |
Total | | | (98,038 | ) | | | 2,987,988 | | | | 2,407,838 | | | | 5,297,788 | |
| | | | | | | | | | | | | | | | | |
The following table is a summary of the average outstanding volume by derivative instrument for the year ended August 31, 2015:
| | | | |
| | | | | |
| Derivative Instrument | | Average Notional Amounts ($)* | |
Futures contracts — Long | | | 346,467,729 | |
Futures contracts — Short | | | 349,220,403 | |
Credit default swap contracts — buy protection | | | 400,061,524 | |
Credit default swap contracts — sell protection | | | 4,051,250 | |
| | | | | | | | |
| | |
| Derivative Instrument | | Average
Unrealized
Appreciation ($)* | | | Average
Unrealized
Depreciation ($)* | |
Forward foreign currency exchange contracts | | | 55,712 | | | | (1,828 | ) |
Interest rate swap contracts | | | 378,126 | | | | (320,229 | ) |
| * | Based on the ending quarterly outstanding amounts for the year ended August 31, 2015. |
Investments in Senior Loans
The Fund may invest in senior loan assignments. When the Fund purchases an assignment of a senior loan, the Fund typically has direct rights against the borrower; provided, however, that the Fund’s rights may be more limited than the lender from which it acquired the
| | |
| |
| | ACTIVE PORTFOLIOS® MULTI-MANAGER CORE PLUS BOND FUND |
NOTES TO FINANCIAL STATEMENTS (continued)
August 31, 2015
assignment and the Fund may be able to enforce its rights only through an administrative agent. Although certain senior loan assignments are secured by collateral, the Fund could experience delays or limitations in realizing such collateral or have its interest subordinated to other indebtedness of the obligor. In the event that the administrator or collateral agent of a loan becomes insolvent, enters into receivership or bankruptcy, the Fund may incur costs and delays in realizing payment or may suffer a loss of principal and/or interest. The risk of loss is greater for unsecured or subordinated loans. In addition, senior loan assignments are vulnerable to market, economic or other conditions or events that may reduce the demand for senior loan assignments and certain senior loan assignments which were liquid, when purchased, may become illiquid.
The Fund may enter into senior loan assignments where all or a portion of the loan may be unfunded. The Fund is obligated to fund these commitments at the borrower’s discretion. These commitments are generally traded and priced in the same manner as other senior loan securities and are disclosed as unfunded senior loan commitments in the Fund’s Portfolio of Investments with a corresponding payable for investments purchased. The Fund designates cash or liquid securities to cover these commitments.
Asset- and Mortgage-Backed Securities
The Fund may invest in asset-backed and mortgage-backed securities. The maturity dates shown represent the original maturity of the underlying obligation. Actual maturity may vary based upon prepayment activity on these obligations. All, or a portion, of the obligation may be prepaid at any time because the underlying asset may be prepaid. As a result, decreasing market interest rates could result in an increased level of prepayment. An increased prepayment rate will have the effect of shortening the maturity of the security. Unless otherwise noted, the coupon rates presented are fixed rates.
Delayed Delivery Securities
The Fund may trade securities on other than normal settlement terms, including securities purchased or sold on a “when-issued” basis. This may increase risk to the Fund since the other party to the transaction may fail to deliver, which could cause the Fund to subsequently invest at less advantageous prices. The Fund designates cash or liquid securities in an amount equal to the delayed delivery commitment.
Mortgage Dollar Roll Transactions
The Fund may enter into mortgage “dollar rolls” in which the Fund sells securities for delivery in the current month and simultaneously contracts with the same counterparty to repurchase similar but not identical securities (same type, coupon and maturity) on a specified future date. During the roll period, the Fund loses the right to receive principal and interest paid on the securities sold. However, the Fund will benefit because it receives negotiated amounts in the form of reductions of the purchase price for the future purchase plus the interest earned on the cash proceeds of the securities sold until the settlement date of the forward purchase. The Fund records the incremental difference between the forward purchase and sale of each forward roll as a realized gain or loss. Unless any realized gains exceed the income, capital appreciation, and gain or loss due to mortgage prepayments that would have been realized on the securities sold as part of the mortgage dollar roll, the use of this technique will diminish the investment performance of the Fund compared to what the performance would have been without the use of mortgage dollar rolls. All cash proceeds will be invested in instruments that are permissible investments for the Fund. The Fund identifies cash or liquid securities in an amount equal to the forward purchase price.
For financial reporting and tax purposes, the Fund treats “to be announced” mortgage dollar rolls as two separate transactions, one involving the purchase of a security and a separate transaction involving a sale. These transactions may increase the Fund’s portfolio turnover rate. The Fund does not currently enter into mortgage dollar rolls that are accounted for as financing transactions.
Mortgage dollar rolls involve the risk that the market value of the securities the Fund is obligated to repurchase may decline below the repurchase price, or that the counterparty may default on its obligations.
Treasury Inflation Protected Securities
The Fund may invest in treasury inflation protected securities (TIPS). The principal amount of TIPS is adjusted periodically and is increased for inflation or decreased for deflation based on a monthly published index. These adjustments are recorded as interest income in the Statement of Operations. Coupon payments are based on the adjusted principal at the time the interest is paid.
| | |
| |
| ACTIVE PORTFOLIOS® MULTI-MANAGER CORE PLUS BOND FUND | | |
NOTES TO FINANCIAL STATEMENTS (continued)
August 31, 2015
Interest Only and Principal Only Securities
The Fund may invest in Interest Only (IO) or Principal Only (PO) securities. IOs are stripped securities entitled to receive all of the security’s interest, but none of its principal. IOs are particularly sensitive to changes in interest rates and therefore subject to greater fluctuations in price than typical interest bearing debt securities. IOs are also subject to credit risk because the Fund may not receive all or part of the interest payments if the issuer, obligor, guarantor or counterparty defaults on its obligation. Payments received for IOs are included in interest income on the Statement of Operations. Because
no principal will be received at the maturity of an IO, adjustments are made to the cost of the security on a monthly basis until maturity. POs are stripped securities entitled to receive the principal from the underlying obligation, but not the interest. POs are particularly sensitive to changes in interest rates and therefore are subject to fluctuations in price. POs are also subject to credit risk because the Fund may not receive all or part of its principal if the issuer, obligor, guarantor or counterparty defaults on its obligation. The Fund may also invest in IO or PO stripped mortgage-backed securities. Payments received for POs are treated as reductions to the cost and par value of the securities.
Offsetting of Assets and Liabilities
The following table presents the Fund’s gross and net amount of assets and liabilities available for offset under netting arrangements as well as any related collateral received or pledged by the Fund as of August 31, 2015:
| | | | | | | | | | | | | | | | | | | | | | | | | | | | | | | | |
| | | | | | | | | | | | | | | | | | | | | | | | | | | | | | | | | |
| | | Barclays ($) | | | Citibank ($) | | | Goldman Sachs
& Co. ($) | | | J.P. Morgan
Securities,
Inc. ($) | | | Morgan
Stanley ($)(a) | | | Morgan
Stanley ($)(a) | | | UBS
Securities ($) | | | Total ($) | |
Assets | | | | | | | | | | | | | | | | | | | | | | | | | | | | | | | | |
Centrally cleared credit default swap contracts(b) | | | — | | | | — | | | | — | | | | — | | | | — | | | | 594,086 | | | | — | | | | 594,086 | |
Forward foreign currency exchange contracts | | | — | | | | — | | | | — | | | | — | | | | — | | | | — | | | | 76 | | | | 76 | |
OTC credit default swap contracts(c) | | | 123,356 | | | | 837,456 | | | | 543,456 | | | | 1,770,386 | | | | 192,158 | | | | — | | | | — | | | | 3,466,812 | |
Total Assets | | | 123,356 | | | | 837,456 | | | | 543,456 | | | | 1,770,386 | | | | 192,158 | | | | 594,086 | | | | 76 | | | | 4,060,974 | |
Liabilities | | | | | | | | | | | | | | | | | | | | | | | | | | | | | | | | |
OTC credit default swap contracts(c) | | | — | | | | 1,341,254 | | | | 1,153,359 | | | | 174,096 | | | | 233,340 | | | | — | | | | — | | | | 2,902,049 | |
Total Liabilities | | | — | | | | 1,341,254 | | | | 1,153,359 | | | | 174,096 | | | | 233,340 | | | | — | | | | — | | | | 2,902,049 | |
Total Financial and Derivative Net Assets | | | 123,356 | | | | (503,798 | ) | | | (609,903 | ) | | | 1,596,290 | | | | (41,182 | ) | | | 594,086 | | | | 76 | | | | 1,158,925 | |
Total collateral received (pledged)(d) | | | — | | | | (503,798 | ) | | | (452,977 | ) | | | 1,596,290 | | | | (41,182 | ) | | | — | | | | — | | | | 598,333 | |
Net Amount(e) | | | 123,356 | | | | — | | | | (156,926 | ) | | | — | | | | — | | | | 594,086 | | | | 76 | | | | 560,592 | |
| (a) | Exposure can only be netted across transactions governed under the same master agreement with the same legal entity. |
| (b) | Centrally cleared swaps are included within payable/receivable for variation margin on the Statement of Assets and Liabilities. |
| (c) | Over-the-Counter Swap Contracts are presented at market value plus periodic payments receivable (payable), which is comprised of unrealized appreciation, unrealized depreciation, premiums paid and premiums received. |
| (d) | In some instances, the actual collateral received and/or pledged may be more than the amount shown due to overcollateralization. |
| (e) | Represents the net amount due from/ (to) counterparties in the event of default. |
Security Transactions
Security transactions are accounted for on the trade date. Cost is determined and gains (losses) are based upon the specific identification method for both financial statement and federal income tax purposes.
Trade date for senior loans purchased in the primary market is the date on which the loan is allocated. Trade date for senior loans purchased in the secondary market is the date on which the transaction is entered into.
Income Recognition
Interest income is recorded on an accrual basis. Market premiums and discounts, including original issue discounts, are amortized and accreted, respectively, over the expected life of the security on all debt securities, unless otherwise noted. The Fund classifies gains and losses realized on prepayments received on mortgage-backed securities as adjustments to interest income.
The Fund may place a debt security on non-accrual status and reduce related interest income when it becomes probable that the interest will not be collected and the
| | |
| |
| | ACTIVE PORTFOLIOS® MULTI-MANAGER CORE PLUS BOND FUND |
NOTES TO FINANCIAL STATEMENTS (continued)
August 31, 2015
amount of uncollectible interest can be reasonably estimated. A defaulted debt security is removed from non-accrual status when the issuer resumes interest payments or when collectability of interest is reasonably assured.
Corporate actions and dividend income are recorded on the ex-dividend date.
Income and capital gain distributions from the Underlying Funds, if any, are recorded on the ex-dividend date.
Awards from class action litigation are recorded as a reduction of cost basis if the Fund still owns the applicable securities on the payment date. If the Fund no longer owns the applicable securities, the proceeds are recorded as realized gains.
The value of additional securities received as an income payment is recorded as income and increases the cost basis of such securities.
The Fund may receive other income from senior loans, including amendment fees, consent fees and commitment fees. These fees are recorded as income when received by the Fund. These amounts are included in Interest Income in the Statement of Operations.
Expenses
General expenses of the Trust are allocated to the Fund and other funds of the Trust based upon relative net assets or other expense allocation methodologies determined by the nature of the expense. Expenses directly attributable to the Fund are charged to the Fund.
Federal Income Tax Status
The Fund intends to qualify each year as a regulated investment company under Subchapter M of the Internal Revenue Code, as amended, and will distribute substantially all of its taxable income (including net short-term capital gains), if any, for its tax year, and as such will not be subject to federal income taxes. In addition, the Fund intends to distribute in each calendar year substantially all of its net investment income, capital gains and certain other amounts, if any, such that the Fund should not be subject to federal excise tax. Therefore, no federal income or excise tax provision is recorded.
Distributions to Shareholders
Distributions from net investment income, if any, are declared daily and paid monthly. Net realized capital gains, if any, are distributed at least annually. Income distributions and capital gain distributions are
determined in accordance with federal income tax regulations, which may differ from GAAP.
Guarantees and Indemnifications
Under the Trust’s organizational documents and, in some cases, by contract, its officers and trustees are indemnified against certain liabilities arising out of the performance of their duties to the Trust or its funds. In addition, certain of the Fund’s contracts with its service providers contain general indemnification clauses. The Fund’s maximum exposure under these arrangements is unknown since the amount of any future claims that may be made against the Fund cannot be determined, and the Fund has no historical basis for predicting the likelihood of any such claims.
Recent Accounting Pronouncement
Fair Value Measurement (Topic 820), Disclosure for Investments in Certain Entities That Calculate Net Asset Value per Share (or Its Equivalent)
In May 2015, the Financial Accounting Standards Board (FASB) issued Accounting Standards Update (ASU) No. 2015-07, Fair Value Measurement (Topic 820), Disclosure for Investments in Certain Entities That Calculate Net Asset Value per Share (or Its Equivalent). ASU No. 2015-07 changes the disclosure requirements for investments for which fair value is measured using the net asset value per share practical expedient. The disclosure requirements are effective for annual periods beginning after December 15, 2015 and interim periods within those fiscal years. At this time, management is evaluating the implications of this guidance and the impact it will have on the financial statement amounts and footnote disclosures, if any.
Note 3. Fees and Other Transactions with Affiliates
Investment Management Fees
Under an Investment Management Services Agreement, Columbia Management Investment Advisers, LLC (the Investment Manager), a wholly-owned subsidiary of Ameriprise Financial, Inc. (Ameriprise Financial), is responsible for the ultimate oversight of investments made by the Fund. The Fund’s subadvisers (see Subadvisory Agreements below) have the primary responsibility for the day-to-day portfolio management of the Fund. The investment management fee is an annual fee that is equal to a percentage of the Fund’s average daily net assets that declines from 0.43% to 0.30% as the Fund’s net assets increase. The effective investment
| | |
| |
| ACTIVE PORTFOLIOS® MULTI-MANAGER CORE PLUS BOND FUND | | |
NOTES TO FINANCIAL STATEMENTS (continued)
August 31, 2015
management fee rate for the year ended August 31, 2015 was 0.41% of the Fund’s average daily net assets.
Effective September 24, 2014, the Investment Manager has voluntarily agreed to waive the investment management fee charged to the Fund on its assets that are invested in affiliated mutual funds, exchange-traded funds and closed-end funds that pay an investment management services fee to the Investment Manager. The Investment Manager, in its discretion, may revise or discontinue this arrangement at any time.
Subadvisory Agreement
The Investment Manager has entered into Subadvisory Agreements with Federated Investment Management Company and TCW Investment Management Company, each of which subadvises a portion of the assets of the Fund. New investments in the Fund, net of any redemptions, are allocated in accordance with the Investment Manager’s determination, subject to the oversight of the Fund’s Board. Each subadviser’s proportionate share of investments in the Fund may also vary due to market fluctuations. The Investment Manager compensates each subadviser to manage the investment of the Fund’s assets.
Administration Fees
Under an Administrative Services Agreement, the Investment Manager also serves as the Fund Administrator. The Fund pays the Fund Administrator an annual fee for administration and accounting services equal to a percentage of the Fund’s average daily net assets that declines from 0.07% to 0.04% as the Fund’s net assets increase. The effective administration fee rate for the year ended August 31, 2015 was 0.06% of the Fund’s average daily net assets.
Effective September 24, 2014, the Investment Manager has voluntarily agreed to waive the administration fee charged to the Fund on its assets that are invested in affiliated mutual funds, exchange-traded funds and closed-end funds that pay an investment management services fee to the Investment Manager. The Investment Manager, in its discretion, may revise or discontinue this arrangement at any time.
Compensation of Board Members
Board members, who are not officers or employees of the Investment Manager or Ameriprise Financial, are compensated for their services to the Fund as disclosed in the Statement of Operations. These Board members may participate in a Deferred Compensation Plan (the
Plan) which may be terminated at any time. Obligations of the Plan will be paid solely out of the Fund’s assets, and all amounts payable under the Plan constitute a general unsecured obligation of the Fund.
Compensation of Chief Compliance Officer
The Board has appointed a Chief Compliance Officer to the Fund in accordance with federal securities regulations. The Fund is allocated a portion of the expenses associated with the Chief Compliance Officer based on relative net assets of the Trust.
Transactions with Affiliated Funds
For the year ended August 31, 2015, the Fund engaged in purchase and/or sales transactions with funds that have a common investment manager (or affiliated investment managers), common directors/trustees, and/or common officers. Those purchase and sale transactions complied with provisions of Rule 17a-7 under the 1940 Act and were $39,539,834, and $20,728,433, respectively. The sale transactions resulted in a net realized gain of $166,720.
Transfer Agency Fees
Under a Transfer and Dividend Disbursing Agent Agreement, Columbia Management Investment Services Corp. (the Transfer Agent), an affiliate of the Investment Manager and a wholly-owned subsidiary of Ameriprise Financial, is responsible for providing transfer agency services to the Fund. The Transfer Agent has contracted with Boston Financial Data Services (BFDS) to serve as sub-transfer agent.
Effective November 1, 2014, the Transfer Agent receives a monthly transfer agency fee based on the number or the average value of accounts, depending on the type of account. Prior to November 1, 2014, the Transfer Agent received a monthly account-based service fee based on the number of open accounts. In addition, the Transfer Agent also receives sub-transfer agency fees based on a percentage of the average aggregate value of the Fund’s shares maintained in omnibus accounts (other than omnibus accounts for which American Enterprise Investment Services Inc. is the broker of record or accounts where the beneficial shareholder is a customer of Ameriprise Financial Services, Inc., for which the Transfer Agent receives a per account fee). The Transfer Agent pays the fees of BFDS for services as sub-transfer agent and is not entitled to reimbursement for such fees from the Fund (with the exception of out-of-pocket fees).
| | |
| |
| | ACTIVE PORTFOLIOS® MULTI-MANAGER CORE PLUS BOND FUND |
NOTES TO FINANCIAL STATEMENTS (continued)
August 31, 2015
The Transfer Agent also receives compensation from the Fund for various shareholder services and reimbursements for certain out-of-pocket fees.
For the year ended August 31, 2015, the Fund’s effective transfer agency fee rates as a percentage of average daily net assets of Class A shares was 0.07%.
Distribution and Service Fees
The Fund has an agreement with Columbia Management Investment Distributors, Inc. (the Distributor), an affiliate of the Investment Manager and a wholly-owned subsidiary of Ameriprise Financial, for distribution and shareholder services. The Board has approved, and the Fund has adopted, distribution and shareholder service plans (the Plans) applicable to certain share classes, which set the distribution and service fees for the Fund. These fees are calculated daily and are intended to compensate the Distributor and/or eligible selling and/or servicing agents for selling shares of the Fund and providing services to investors.
The Fund may pay a distribution fee of up to 0.25% of the Fund’s average daily net assets attributable to Class A shares and a service fee of up to 0.25% of the Fund’s average daily net assets attributable to Class A shares, provided, however, that the aggregate fee shall not exceed 0.25% of the Fund’s average daily net assets attributable to Class A shares.
Expenses Waived/Reimbursed by the Investment Manager and its Affiliates
The Fund’s expense ratio is subject to an expense reimbursement arrangement pursuant to which fees will be waived and/or expenses reimbursed (excluding certain fees and expenses described below), so that the Fund’s net operating expenses, after giving effect to fees waived/expenses reimbursed and any balance credits and/or overdraft charges from the Fund’s custodian, do not exceed the annual rates of:
| | | | | | | | |
| | | Voluntary Expense Cap Effective January 1, 2015 | | | Contractual Expense Cap Prior to January 1, 2015 | |
Class A | | | 0.86 | % | | | 0.84 | % |
The voluntary expense cap arrangement may be revised or discontinued at any time. Under the arrangements, the following fees and expenses are excluded from the waiver/reimbursement commitment, and therefore will be paid by the Fund, if applicable: taxes (including foreign transaction taxes), expenses associated with investments
in affiliated and non-affiliated pooled investment vehicles (including mutual funds and exchange-traded funds), transaction costs and brokerage commissions, costs related to any securities lending program, dividend and interest expenses associated with securities sold short, inverse floater program fees and expenses, transaction charges and interest on borrowed money, interest and extraordinary expenses. Any fees waived and/or expenses reimbursed under the expense reimbursement arrangements described above are not recoverable by the Investment Manager or its affiliates in future periods.
Note 4. Federal Tax Information
The timing and character of income and capital gain distributions are determined in accordance with income tax regulations, which may differ from GAAP because of temporary or permanent book to tax differences.
At August 31, 2015, these differences are primarily due to differing treatment for principal and/or interest from fixed income securities, deferral/reversal of wash sale losses, Trustees’ deferred compensation, distributions, foreign currency transactions, non-deductible expenses, re-characterization of distributions for investments, derivative investments, tax straddles and adjustments on certain convertible preferred securities. To the extent these differences are permanent, reclassifications are made among the components of the Fund’s net assets in the Statement of Assets and Liabilities. Temporary differences do not require reclassifications. In the Statement of Assets and Liabilities the following reclassifications were made:
| | | | |
Undistributed net investment income | | | $1,871,958 | |
Accumulated net realized gain | | | (1,871,958 | ) |
Net investment income (loss) and net realized gains (losses), as disclosed in the Statement of Operations, and net assets were not affected by this reclassification.
The tax character of distributions paid during the years indicated was as follows:
| | | | | | | | |
| | | Year Ended August 31, 2015 ($) | | | Year Ended August 31, 2014 ($) | |
Ordinary income | | | 95,037,479 | | | | 83,652,263 | |
Long-term capital gains | | | — | | | | 12,038,485 | |
Total | | | 95,037,479 | | | | 95,690,748 | |
Short-term capital gain distributions, if any, are considered ordinary income distributions for tax purposes.
| | |
| |
| ACTIVE PORTFOLIOS® MULTI-MANAGER CORE PLUS BOND FUND | | |
NOTES TO FINANCIAL STATEMENTS (continued)
August 31, 2015
At August 31, 2015, the components of distributable earnings on a tax basis were as follows:
| | | | |
Undistributed ordinary income | | | $21,592,043 | |
Net unrealized depreciation | | | (4,966,916 | ) |
At August 31, 2015, the cost of investments for federal income tax purposes was $5,623,109,283 and the aggregate gross unrealized appreciation and depreciation based on that cost was:
| | | | |
Unrealized appreciation | | | $59,800,586 | |
Unrealized depreciation | | | (64,767,502 | ) |
Net unrealized depreciation | | | $(4,966,916 | ) |
For the year ended August 31, 2015, $10,235,782 of capital loss carryforward was utilized.
Management of the Fund has concluded that there are no significant uncertain tax positions in the Fund that would require recognition in the financial statements. However, management’s conclusion may be subject to review and adjustment at a later date based on factors including, but not limited to, new tax laws, regulations, and administrative interpretations (including relevant court decisions). Generally, the Fund’s federal tax returns for the prior three fiscal years remain subject to examination by the Internal Revenue Service.
Note 5. Portfolio Information
The cost of purchases and proceeds from sales of securities, excluding short-term investments and derivatives, if any, aggregated to $13,854,765,792 and $13,093,921,846, respectively, for the year ended August 31, 2015, of which $11,472,808,133 and $11,109,124,340, respectively, were U.S. government securities. The amount of purchase and sale activity impacts the portfolio turnover rate reported in the Financial Highlights.
Note 6. Affiliated Money Market Fund
The Fund invests in Columbia Short-Term Cash Fund, an affiliated money market fund established for the exclusive use by the Fund and other affiliated funds. The income earned by the Fund from such investments is included as Dividends — affiliated issuers in the Statement of Operations. As an investing fund, the Fund indirectly bears its proportionate share of the expenses of Columbia Short-Term Cash Fund.
Note 7. Line of Credit
The Fund has entered into a revolving credit facility with a syndicate of banks led by JPMorgan Chase Bank, N.A. whereby the Fund may borrow for the temporary funding of shareholder redemptions or for other temporary or emergency purposes. Pursuant to a December 9, 2014 amendment, the credit facility agreement, which is a collective agreement between the Fund and certain other funds managed by the Investment Manager, severally and not jointly, permits collective borrowings up to $550 million. Interest is charged to each participating fund based on its borrowings at a rate equal to the higher of (i) the overnight federal funds rate plus 1.00% or (ii) the one-month LIBOR rate plus 1.00%. Each borrowing under the credit facility matures no later than 60 days after the date of borrowing. The Fund also pays a commitment fee equal to its pro rata share of the amount of the credit facility at a rate of 0.075% per annum. The commitment fee is included in other expenses in the Statement of Operations. Prior to the December 9, 2014 amendment, the credit facility agreement permitted borrowings up to $500 million under the same terms and interest rates as described above.
The Fund had no borrowings during the year ended August 31, 2015.
Note 8. Significant Risks
Credit Risk
Credit risk is the risk that the value of debt securities in the Fund’s portfolio may decline because the issuer may default and fail to pay interest or repay principal when due. Rating agencies assign credit ratings to debt securities to indicate their credit risk. Lower rated or unrated debt securities held by the Fund may present increased credit risk as compared to higher-rated debt securities.
Interest Rate Risk
Interest rate risk is the risk of losses attributable to changes in interest rates. In general, if prevailing interest rates rise, the values of debt securities tend to fall, and if interest rates fall, the values of debt securities tend to rise. Actions by governments and central banking authorities can result in increases in interest rates. Increasing interest rates may negatively affect the value of debt securities held by the Fund, resulting in a negative impact on the Fund’s performance and net asset value per share. In general, the longer the maturity or duration of a debt security, the greater its sensitivity to changes in interest rates.
| | |
| |
| | ACTIVE PORTFOLIOS® MULTI-MANAGER CORE PLUS BOND FUND |
NOTES TO FINANCIAL STATEMENTS (continued)
August 31, 2015
Liquidity Risk
Liquidity risk is the risk associated with a lack of marketability of investments which may make it difficult to sell the investment at a desirable time or price. Changing regulatory, market or other conditions or environments (for example, the interest rate or credit environments) may adversely affect the liquidity of the Fund’s investments. The Fund may have to accept a lower selling price for the holding, sell other investments, or forego another, more appealing investment opportunity. Generally, the less liquid the market at the time the Fund sells a portfolio investment, the greater the risk of loss or decline of value to the Fund. A less liquid market can lead to an increase in Fund redemptions, which may negatively impact Fund performance and net asset value per share, including, for example, if the Fund is forced to sell securities in a down market.
Mortgage- and Other Asset-Backed Securities Risk
The value of any mortgage-backed and other asset-backed securities held by the Fund may be affected by, among other things, changes or perceived changes in: interest rates; factors concerning the interests in and structure of the issuer or the originator of the mortgages or other assets; the creditworthiness of the entities that provide any supporting letters of credit, surety bonds or other credit enhancements; or the market’s assessment of the quality of underlying assets. Payment of principal and interest on some mortgage-backed securities (but not the market value of the securities themselves) may be guaranteed by the full faith and credit of a particular U.S. Government agency, authority, enterprise or instrumentality, and some, but not all, are also insured or guaranteed by the U.S. Government. Mortgage-backed securities issued by non-governmental issuers (such as commercial banks, savings and loan institutions, private mortgage insurance companies, mortgage bankers and other secondary market issuers) may entail greater risk than obligations guaranteed by the U.S. Government. Mortgage- and other asset-backed securities are subject to prepayment risk, which is the possibility that the underlying mortgage or other asset may be refinanced or prepaid prior to maturity during periods of declining or low interest rates, causing the Fund to have to reinvest the money received in securities that have lower yields. Rising or high interest rates tend to extend the duration of mortgage- and other asset-backed securities, making their prices more volatile and more sensitive to changes in interest rates.
Shareholder Concentration Risk
At August 31, 2015, affiliated shareholders of record owned 100.00% of the outstanding shares of the Fund in one or more accounts. Subscription and redemption activity by concentrated accounts may have a significant effect on the operations of the Fund. In the case of a large redemption, the Fund may be forced to sell investments at inopportune times, including its liquid or more liquid positions, resulting in Fund losses and the Fund holding a higher percentage of less liquid or illiquid securities. Large redemptions could result in decreased economies of scale and increased operating expenses for non-redeeming Fund shareholders.
Note 9. Subsequent Events
Management has evaluated the events and transactions that have occurred through the date the financial statements were issued and noted no items requiring adjustment of the financial statements or additional disclosure.
Note 10. Information Regarding Pending and Settled Legal Proceedings
In December 2005, without admitting or denying the allegations, American Express Financial Corporation (AEFC, which is now known as Ameriprise Financial, Inc. (Ameriprise Financial)) entered into settlement agreements with the Securities and Exchange Commission (SEC) and Minnesota Department of Commerce (MDOC) related to market timing activities. As a result, AEFC was censured and ordered to cease and desist from committing or causing any violations of certain provisions of the Investment Advisers Act of 1940, the Investment Company Act of 1940, and various Minnesota laws. AEFC agreed to pay disgorgement of $10 million and civil money penalties of $7 million. AEFC also agreed to retain an independent distribution consultant to assist in developing a plan for distribution of all disgorgement and civil penalties ordered by the SEC in accordance with various undertakings detailed at http://www.sec.gov/litigation/admin/ia-2451.pdf. Ameriprise Financial and its affiliates have cooperated with the SEC and the MDOC in these legal proceedings, and have made regular reports to the Funds’ Boards of Trustees.
Ameriprise Financial and certain of its affiliates have historically been involved in a number of legal, arbitration and regulatory proceedings, including routine litigation, class actions, and governmental actions, concerning matters arising in connection with the conduct of their
| | |
| |
| ACTIVE PORTFOLIOS® MULTI-MANAGER CORE PLUS BOND FUND | | |
NOTES TO FINANCIAL STATEMENTS (continued)
August 31, 2015
business activities. Ameriprise Financial believes that the Funds are not currently the subject of, and that neither Ameriprise Financial nor any of its affiliates are the subject of, any pending legal, arbitration or regulatory proceedings that are likely to have a material adverse effect on the Funds or the ability of Ameriprise Financial or its affiliates to perform under their contracts with the Funds. Ameriprise Financial is required to make quarterly (10-Q), annual (10-K) and, as necessary, 8-K filings with the SEC on legal and regulatory matters that relate to Ameriprise Financial and its affiliates. Copies of these filings may be obtained by accessing the SEC website at www.sec.gov.
There can be no assurance that these matters, or the adverse publicity associated with them, will not result in increased fund redemptions, reduced sale of fund shares or other adverse consequences to the Funds. Further, although we believe proceedings are not likely to have a material adverse effect on the Funds or the ability of Ameriprise Financial or its affiliates to perform under their contracts with the Funds, these proceedings are subject to uncertainties and, as such, we are unable to estimate the possible loss or range of loss that may result. An adverse outcome in one or more of these proceedings could result in adverse judgments, settlements, fines, penalties or other relief that could have a material adverse effect on the consolidated financial condition or results of operations of Ameriprise Financial.
| | |
| |
| | ACTIVE PORTFOLIOS® MULTI-MANAGER CORE PLUS BOND FUND |
REPORT OF INDEPENDENT REGISTERED PUBLIC ACCOUNTING FIRM
To the Trustees of Columbia Funds Series Trust I and the Shareholders of
Active Portfolios® Multi-Manager Core Plus Bond Fund
In our opinion, the accompanying statement of assets and liabilities, including the portfolio of investments, and the related statements of operations and of changes in net assets and the financial highlights present fairly, in all material respects, the financial position of Active Portfolios® Multi-Manager Core Plus Bond Fund (the “Fund,” a series of Columbia Funds Series Trust I) at August 31, 2015, and the results of its operations, the changes in its net assets and the financial highlights for each of the periods indicated, in conformity with accounting principles generally accepted in the United States of America. These financial statements and financial highlights (hereafter referred to as “financial statements”) are the responsibility of the Fund’s management. Our responsibility is to express an opinion on these financial statements based on our audits. We conducted our audits of these financial statements in accordance with the standards of the Public Company Accounting Oversight Board (United States). Those standards require that we plan and perform the audit to obtain reasonable assurance about whether the financial statements are free of material misstatement. An audit includes examining, on a test basis, evidence supporting the amounts and disclosures in the financial statements, assessing the accounting principles used and significant estimates made by management, and evaluating the overall financial statement presentation. We believe that our audits, which included confirmation of securities at August 31, 2015 by correspondence with the custodian, brokers and transfer agent, and the application of alternative auditing procedures where such confirmations had not been received, provide a reasonable basis for our opinion.
PricewaterhouseCoopers LLP
Minneapolis, MN
October 22, 2015
| | |
| |
| ACTIVE PORTFOLIOS® MULTI-MANAGER CORE PLUS BOND FUND | | |
FEDERAL INCOME TAX INFORMATION
(Unaudited)
The Fund hereby designates the following tax attributes for the fiscal year ended August 31, 2015. Shareholders will be notified in early 2016 of the amounts for use in preparing 2015 income tax returns.
Tax Designations
| | | | |
Qualified Dividend Income | | | 0.87 | % |
Dividends Received Deduction | | | 0.75 | % |
Qualified Dividend Income. For taxable, non-corporate shareholders, the percentage of ordinary income distributed during the fiscal year that represents qualified dividend income subject to reduced tax rates.
Dividends Received Deduction. The percentage of ordinary income distributed during the fiscal year that qualifies for the corporate dividends received deduction.
| | |
| |
| | ACTIVE PORTFOLIOS® MULTI-MANAGER CORE PLUS BOND FUND |
TRUSTEES AND OFFICERS
The Trustees serve terms of indefinite duration. The names and birth years of the Trustees and Officers of the Funds in Columbia Funds Series Trust I, the year each was first elected or appointed to office, their principal business occupations during at least the last five years, the number of Funds overseen by each Trustee and other directorships they hold are shown below. Each officer listed below serves as an officer of each Fund in Columbia Funds Series Trust I. The mailing address of each Trustee is: c/o Columbia Management Investment Advisers, LLC, 225 Franklin Street, Mail Drop BX32 05228, Boston, MA 02110.
| | | | | | | | |
| Independent Trustees |
Name, Year of Birth
and Position Held
with the Trust | | Year First Appointed or Elected as Trustee to any Fund Currently in the Columbia Funds Complex or a Predecessor Thereof | | Principal Occupation(s)
During the Past Five Years | | Number of
Funds in the
Columbia
Funds
Complex
Overseen | | Other Directorships
Held by Trustee During the Past Five Years |
Janet Langford Carrig
(Born 1957)
Trustee | | 1996 | | Senior Vice President, General Counsel and Corporate Secretary, ConocoPhillips (integrated energy company) since September 2007; Deputy General Counsel — Corporate Legal Services, ConocoPhillips from August 2006 to August 2007; Partner, Zelle, Hofmann, Voelbel, Mason & Gette LLP (law firm) from March 2005 to July 2006; Adjunct Professor of Law, Northwestern University from September 2004 to June 2006; Director, UAL Corporation (airline) from February 2006 to July 2006; Chief Administrative Officer and Senior Vice President, Kmart Holding Corporation (consumer goods) from September 2003 to March 2004 | | 60 | | None |
Douglas A. Hacker
(Born 1955)
Trustee and Chairman
of the Board | | 1996 | | Independent business executive since May 2006; Executive Vice President — Strategy of United Airlines from December 2002 to May 2006; President of UAL Loyalty Services (airline marketing company) from September 2001 to December 2002; Executive Vice President and Chief Financial Officer of United Airlines from July 1999 to September 2001 | | 60 | | Spartan Nash Company, (food distributor); Nash Finch Company (food distributor) from 2005 to 2013; Aircastle Limited (aircraft leasing); SeaCube Container Leasing Ltd. (container leasing) from 2010 to 2013; and Travelport Worldwide Limited (travel information technology) |
Nancy T. Lukitsh
(Born 1956)
Trustee | | 2011 | | Senior Vice President, Partner and Director of Marketing, Wellington Management Company, LLP (investment adviser) from 1997 to 2010; Chair, Wellington Management Investment Portfolios (commingled non-U.S. investment pools) from 2007 to 2010; Director, Wellington Trust Company, NA and other Wellington affiliates from 1997 to 2010 | | 60 | | None |
William E. Mayer
(Born 1940)
Trustee | | 1991 | | Partner, Park Avenue Equity Partners (private equity) since February 1999 | | 60 | | DynaVox Inc. (speech creation); Lee Enterprises (print media); WR Hambrecht + Co. (financial service provider) from 2000 to 2012; BlackRock Kelso Capital Corporation (investment company); and Premier, Inc. (healthcare) |
| | |
| |
| ACTIVE PORTFOLIOS® MULTI-MANAGER CORE PLUS BOND FUND | | |
TRUSTEES AND OFFICERS (continued)
| | | | | | | | |
| Independent Trustees (continued) |
Name, Year of Birth
and Position Held
with the Trust | | Year First Appointed or Elected as Trustee to any Fund Currently in the Columbia Funds Complex or a Predecessor Thereof | | Principal Occupation(s)
During the Past Five Years | | Number of
Funds in the
Columbia
Funds
Complex
Overseen | | Other Directorships
Held by Trustee During the Past Five Years |
David M. Moffett
(Born 1952)
Trustee | | 2011 | | Retired. Consultant to Bridgewater and Associates; Chief Executive Officer, Federal Home Loan Mortgage Corporation, from 2008 to 2009; Senior Adviser, Global Financial Services Group, Carlyle Group, Inc., from 2007 to 2008; Vice Chairman and Chief Financial Officer, U.S. Bancorp, from 1993 to 2007 | | 60 | | Building Materials Holding Corp. (building materials and construction services); CIT Group Inc. (commercial and consumer finance); eBay Inc. (online trading community); E.W. Scripps Co. (print and television media); Genworth Financial, Inc. (financial and insurance products and services); MBIA Inc. (financial service provider); Paypal Holdings Inc. (payment and data processing services); and University of Oklahoma Foundation |
Charles R. Nelson
(Born 1942)
Trustee | | 1981 | | Retired. Professor Emeritus, University of Washington since 2011; Professor of Economics, University of Washington from 1976 to 2011; Ford and Louisa Van Voorhis Professor of Political Economy, University of Washington from 1993 to 2011; Adjunct Professor of Statistics, University of Washington from 1980 to 2011; Associate Editor, Journal of Money, Credit and Banking from September 1993 to 2008; consultant on econometric and statistical matters | | 60 | | None |
John J. Neuhauser
(Born 1943)
Trustee | | 1984 | | President, Saint Michael’s College since August 2007; Director or Trustee of several non- profit organizations, including Fletcher Allen Health Care, Inc.; Academic Vice President and Dean of Faculties, Boston College from August 1999 to October 2005; University Professor, Boston College from November 2005 to August 2007 | | 60 | | Liberty All-Star Equity Fund and Liberty All-Star Growth Fund (closed-end funds) |
Patrick J. Simpson
(Born 1944)
Trustee | | 2000 | | Partner, Perkins Coie LLP (law firm) | | 60 | | None |
Anne-Lee Verville
(Born 1945)
Trustee | | 1998 | | Retired. General Manager, Global Education Industry from 1994 to 1997, President — Application Systems Division from 1991 to 1994, Chief Financial Officer — US Marketing & Services from 1988 to 1991, and Chief Information Officer from 1987 to 1988, IBM Corporation (computer and technology) | | 60 | | Enesco Group, Inc. (producer of giftware and home and garden decor products) from 2001 to 2006 |
| | |
| |
| | ACTIVE PORTFOLIOS® MULTI-MANAGER CORE PLUS BOND FUND |
TRUSTEES AND OFFICERS (continued)
| | | | | | | | |
| Interested Trustee Affiliate with Investment Manager* |
Name, Year of Birth
and Position Held
with the Trust | | Year First Appointed or Elected as Trustee to any Fund Currently in the Columbia Funds Complex or a Predecessor Thereof | | Principal Occupation(s)
During the Past Five Years | | Number of
Funds in the
Columbia
Funds
Complex
Overseen | | Other Directorships
Held by Trustee During the Past Five Years |
William F. Truscott
(Born 1960)
Trustee | | 2012 | | Chairman of the Board and President, Columbia Management Investment Advisers, LLC since May 2010 and February 2012, respectively (previously President and Chief Investment Officer, 2001-April 2010); Chief Executive Officer, Global Asset Management, Ameriprise Financial, Inc. since September 2012 (previously Chief Executive Officer, U.S. Asset Management & President, Annuities, May 2010-September 2012 and President — U.S. Asset Management and Chief Investment Officer, 2005-April 2010); Director and Chief Executive Officer, Columbia Management Investment Distributors, Inc. since May 2010 and February 2012, respectively (previously Chairman of the Board and Chief Executive Officer, 2006-April 2010); Chairman of the Board and Chief Executive Officer, RiverSource Distributors, Inc. since 2006; Director, Threadneedle Asset Management Holdings, SARL since 2014; President and Chief Executive Officer, Ameriprise Certificate Company, 2006-August 2012 | | 187 | | Chairman of the Board, Columbia Management Investment Advisers, LLC since May 2010; Director, Columbia Management Investment Distributors, Inc. since May 2010; Director, Ameriprise Certificate Company, 2006 to January 2013 |
| * | Interested person (as defined under the 1940 Act) by reason of being an officer, director, security holder and/or employee of the Investment Manager or Ameriprise Financial. |
The Statement of Additional Information has additional information about the Fund’s Board members and is available, without charge, upon request by calling 800.345.6611; contacting your financial intermediary; or visiting columbiathreadneedle.com/us.
The Board has appointed officers who are responsible for day-to-day business decisions based on policies it has established. The officers serve at the pleasure of the Board. In addition to Mr. Truscott, who is Senior Vice President, the Funds’ other officers are:
| | | | |
| Fund Officers |
Name, Address and
Year of Birth | | Position and Year
First Appointed to
Position for any Fund in the Columbia Funds Complex or a Predecessor Thereof | | Principal Occupation(s) During Past Five Years |
Christopher O. Petersen
5228 Ameriprise
Financial Center
Minneapolis, MN 55474
Born 1970 | | President and Principal Executive Officer (2015) | | Vice President and Lead Chief Counsel, Ameriprise Financial, Inc. since January 2015 (previously, Vice President and Chief Counsel January 2010-December 2014; and Vice President and Group Counsel or Counsel 2004-January 2010); officer of Columbia Funds and affiliated funds since 2007. |
Michael G. Clarke
225 Franklin Street
Boston, MA 02110
Born 1969 | | Treasurer (2011) and Chief Financial Officer (2009) | | Vice President — Mutual Fund Administration, Columbia Management Investment Advisers, LLC, since May 2010; Managing Director of Fund Administration, Columbia Management Advisors, LLC, September 2004-April 2010; senior officer of Columbia Funds and affiliated funds since 2002. |
Paul B. Goucher
100 Park Avenue
New York, NY 10017
Born 1968 | | Senior Vice President (2011), Chief Legal Officer (2015) and Assistant Secretary (2008) | | Vice President and Lead Chief Counsel, Ameriprise Financial, Inc. since November 2008 and January 2013, respectively (previously Chief Counsel, January 2010-January 2013 and Group Counsel, November 2008-January 2010). |
| | |
| |
| ACTIVE PORTFOLIOS® MULTI-MANAGER CORE PLUS BOND FUND | | |
TRUSTEES AND OFFICERS (continued)
| | | | |
| Fund Officers (continued) |
Name, Address and
Year of Birth | | Position and Year
First Appointed to
Position for any Fund in the Columbia Funds Complex or a Predecessor Thereof | | Principal Occupation(s) During Past Five Years |
Thomas P. McGuire
225 Franklin Street
Boston, MA 02110
Born 1972 | | Vice President and Chief Compliance Officer (2012) | | Vice President — Asset Management Compliance, Ameriprise Financial, Inc., since May 2010; Chief Compliance Officer, Ameriprise Certificate Company since September 2010; Compliance Executive, Bank of America, 2005-April 2010. |
Colin Moore
225 Franklin Street
Boston, MA 02110
Born 1958 | | Senior Vice President (2010) | | Executive Vice President and Global Chief Investment Officer, Ameriprise Financial, Inc., since July 2013; Director and Global Chief Investment Officer, Columbia Management Investment Advisers, LLC since May 2010; Manager, Managing Director and Chief Investment Officer, Columbia Management Advisors, LLC, 2007-April 2010. |
Michael E. DeFao
225 Franklin Street
Boston, MA 02110
Born 1968 | | Vice President (2011) and Assistant Secretary (2010) | | Vice President and Chief Counsel, Ameriprise Financial, Inc. since May 2010; Associate General Counsel, Bank of America, 2005-April 2010. |
Joseph F. DiMaria
225 Franklin Street
Boston, MA 02110
Born 1968 | | Vice President (2011), Assistant Treasurer (2012) and Chief Accounting Officer (2008) | | Vice President — Mutual Fund Treasurer, Columbia Management Investment Advisers, LLC since May 2010; Director of Fund Administration, Columbia Management Advisors, LLC, 2006-April 2010. |
Amy Johnson
5228 Ameriprise
Financial Center
Minneapolis, MN 55474
Born 1965 | | Vice President (2006) | | Managing Director and Chief Operating Officer, Columbia Management Investment Advisers, LLC since May 2010 (previously Chief Administrative Officer, 2009-April 2010, and Vice President — Asset Management and Trust Company Services, 2006-2009). |
Lyn Kephart-Strong
5228 Ameriprise
Financial Center
Minneapolis, MN 55474
Born 1960 | | Vice President (2015) | | President, Columbia Management Investment Services Corp. since October 2014; Vice President & Resolution Officer, Ameriprise Trust Company since August 2009; President, RiverSource Service Corporation 2004-2010. |
Ryan C. Larrenaga
225 Franklin Street
Boston, MA 02110
Born 1970 | | Vice President and Secretary (2015) | | Vice President and Group Counsel, Ameriprise Financial, Inc. since August 2011 (previously, Counsel from May 2010 to August 2011); Assistant General Counsel, Bank of America, 2005-April 2010; officer of Columbia Funds and affiliated funds since 2005. |
| | |
| |
| | ACTIVE PORTFOLIOS® MULTI-MANAGER CORE PLUS BOND FUND |
BOARD CONSIDERATION AND APPROVAL OF ADVISORY AGREEMENT AND SUBADVISORY AGREEMENTS
On June 10, 2015, the Board of Trustees (the Board) and the Trustees who are not interested persons (as defined in the Investment Company Act of 1940) (the Independent Trustees) of Columbia Funds Series Trust I (the Trust) unanimously approved the continuation of the Investment Management Services Agreement (the Advisory Agreement) with Columbia Management Investment Advisers, LLC (the Investment Manager) and the Subadvisory Agreements (the Subadvisory Agreements) between the Investment Manager and Federated Investment Management Company and TCW Investment Management Company (the Subadvisers) with respect to Active Portfolios® Multi-Manager Core Plus Bond Fund (the Fund), a series of the Trust. The Board and the Independent Trustees also unanimously approved an agreement (the Management Agreement) combining the Advisory Agreement and the Fund’s existing administrative services agreement (the Administrative Services Agreement) in a single agreement. The Board and the Independent Trustees approved the restatement of the Advisory Agreement with the Management Agreement to be effective for the Fund on January 1, 2016, the Fund’s next annual prospectus update. As detailed below, the Board’s Advisory Fees and Expenses Committee (the Committee) and the Board met on multiple occasions to review and discuss, both among themselves and with the management team of the Investment Manager, materials provided by the Investment Manager and others before determining to approve the Management Agreement and the continuation of the Advisory Agreement and the Subadvisory Agreements (collectively, the Agreements).
In connection with their deliberations regarding the approval of the Management Agreement and the continuation of the Advisory Agreement and the Subadvisory Agreements, the Committee and the Board evaluated materials requested from the Investment Manager regarding the Fund and the Agreements, and discussed these materials with representatives of the Investment Manager at Committee meetings held on March 3, 2015, April 29, 2015 and June 9, 2015 and at Board meetings held on March 4, 2015 and June 10, 2015. In addition, the Board considers matters bearing on the Agreements at most of its other meetings throughout the year and meets regularly with senior management of the Trust and the Investment Manager. Through the Board’s Investment Oversight Committees, Trustees also meet with selected portfolio managers of the funds the Trustees oversee and other investment personnel at various times throughout the year. The Committee and the Board also consulted with its independent fee consultant, Fund counsel and with the Independent Trustees’ independent legal counsel, who advised on various matters with respect to the Committee’s and the Board’s considerations and otherwise assisted the Committee and the Board in their deliberations. On June 9, 2015, the Committee recommended that the Board approve the Management Agreement and the continuation of the Advisory Agreement and the Subadvisory Agreements. On June 10, 2015, the Board, including the Independent Trustees, voting separately, unanimously approved the Management Agreement and the continuation of the Advisory Agreement and the Subadvisory Agreements for the Fund.
The Committee and the Board considered all information that they, their legal counsel or the Investment Manager believed reasonably necessary to evaluate and to determine whether to approve the Management Agreement and the continuation of the Advisory Agreement and the Subadvisory Agreements. The information and factors considered by the Committee and the Board in recommending for approval or approving the Management Agreement and the continuation of the Advisory Agreement and the Subadvisory Agreements for the Fund included the following:
| • | | Information on the investment performance of the Fund relative to the performance of a group of mutual funds determined to be comparable to the Fund by an independent third-party data provider, as well as performance relative to benchmarks; |
| • | | Information on the Fund’s advisory fees and total expenses, including information comparing the Fund’s expenses to those of a group of comparable mutual funds, as determined by the independent third-party data provider; |
| • | | The Investment Manager’s agreement to contractually limit or cap total operating expenses for the Fund so that total operating expenses (excluding certain fees and expenses, such as portfolio transaction costs and certain other investment related expenses, interest, taxes, acquired fund fees and expenses, and extraordinary expenses) would not exceed a specified percentage of the Fund’s average annual net assets from January 1, 2016 through December 31, 2016; |
| • | | The terms and conditions of the Agreements; |
| | |
| |
| ACTIVE PORTFOLIOS® MULTI-MANAGER CORE PLUS BOND FUND | | |
BOARD CONSIDERATION AND APPROVAL OF ADVISORY AGREEMENT AND SUBADVISORY AGREEMENTS (continued)
| • | | The current and proposed terms and conditions of other agreements and arrangements with affiliates of the Investment Manager relating to the operations of the Fund, including the Administrative Services Agreement1 and agreements with respect to the provision of distribution and transfer agency services to the Fund; |
| • | | Descriptions of various functions performed by the Investment Manager and the Subadvisers under the Agreements, including portfolio management and portfolio trading practices; |
| • | | Information regarding the management fees and investment performance of similarly-managed portfolios of other clients of the Investment Manager, including institutional separate accounts; |
| • | | Information regarding the reputation, regulatory history and resources of the Investment Manager, including information regarding senior management, portfolio managers and other personnel; |
| • | | Information regarding the capabilities of the Investment Manager with respect to compliance monitoring services, including an assessment of the Investment Manager’s and the Subadvisers’ compliance system by the Fund’s Chief Compliance Officer; and |
| • | | The profitability to the Investment Manager and its affiliates from their relationships with the Fund. |
Nature, Extent and Quality of Services Provided under the Agreements
The Committee and the Board considered the nature, extent and quality of services provided to the Fund by the Investment Manager, the Subadvisers and the Investment Manager’s affiliates under the Agreements and under separate agreements for the provision of transfer agency and administrative services, and the resources dedicated to the Fund and the other Columbia Funds by the Investment Manager, the Subadvisers and the Investment Manager’s affiliates. The Committee and the Board also determined that the nature and level of the services to be provided under the Management Agreement would not decrease relative to the services provided under the Advisory Agreement and the Administrative Services Agreement. The Committee and the Board considered, among other things, the Investment Manager’s ability to attract, motivate and retain highly qualified research, advisory and supervisory investment professionals (including personnel and other resources, compensation programs for personnel involved in fund management, reputation and other attributes), the portfolio management services provided by those investment professionals, and the quality of the Investment Manager’s investment research capabilities and trade execution services. The Committee and the Board also considered the potential benefits to shareholders of investing in a mutual fund that is part of a fund complex offering exposure to a variety of asset classes and investment disciplines and providing a variety of fund and shareholder services.
The Committee and the Board also considered the professional experience and qualifications of the senior personnel of the Investment Manager and the Subadvisers, which included consideration of the Investment Manager’s and the Subadvisers’ experience with similarly-structured funds. The Committee and the Board noted the compliance programs of and the compliance-related resources provided to the Fund by the Investment Manager and its affiliates, and considered the Investment Manager’s ability to provide administrative services to the Fund and coordinate the activities of the Fund’s other service providers. The Committee and the Board also noted that the Board had approved each Subadviser’s code of ethics and compliance program, and that the Chief Compliance Officer of the Funds reports to the Trustees on each Subadviser’s compliance program. In evaluating the nature, extent and quality of services provided under the Agreements, the Committee and the Board considered that these services were provided to the Fund, rather than directly to Fund shareholders. The Committee and the Board accordingly affirmed, after considering various other matters, including the potential benefits to the Fund and its shareholders of the Independent Trustees’ important role as pre-suit gatekeepers with respect to claims that they may determine are meritless or contrary to the Fund’s best interests, that it was not the intention of the Board or the Investment Manager that there be any third-party beneficiaries of the Agreements.
The Committee and the Board considered the diligence and selection process undertaken by the Investment Manager to select each Subadviser, including the Investment Manager’s rationale for recommending the continuation of the
| 1 | Like the Advisory Agreement, the Administrative Services Agreement will terminate with respect to the Fund once the Management Agreement is effective for the Fund. |
| | |
| |
| | ACTIVE PORTFOLIOS® MULTI-MANAGER CORE PLUS BOND FUND |
BOARD CONSIDERATION AND APPROVAL OF ADVISORY AGREEMENT AND SUBADVISORY AGREEMENTS (continued)
Subadvisory Agreements, and the process for monitoring the Subadvisers’ ongoing performance of services for the Fund. As part of these deliberations, the Committee and the Board considered the ability of the Investment Manager, subject to the approval of the Board, to modify or enter into new subadvisory agreements without a shareholder vote pursuant to an exemptive order of the Securities and Exchange Commission. The Committee and the Board also considered the scope of services provided to the Fund by the Investment Manager that are distinct from and in addition to those provided by the Subadvisers, including cash flow management, treasury services, risk oversight, investment oversight and Subadviser selection, oversight and transition management. After reviewing these and related factors, the Committee and the Board concluded, within the context of their overall conclusions, that the nature, extent and quality of the services provided to the Fund under the Agreements supported the approval of the Management Agreement and the continuation of the Advisory Agreement and the Subadvisory Agreements.
Investment Performance
The Committee and the Board reviewed information about the performance of the Fund over various time periods, including performance information relative to benchmarks and information based on reports of the independent third-party data provider that compared the performance of the Fund to the performance of a group of comparable mutual funds, and data provided by the independent fee consultant. The Committee and the Board also reviewed a description of the third party’s methodology for identifying the Fund’s peer groups for purposes of performance and expense comparisons. Although the Fund’s performance lagged that of a relevant peer group for certain (although not necessarily all) periods, the Committee and the Board concluded that other factors relevant to performance were sufficient, in light of other considerations, to warrant continuation of the Advisory Agreement and the Subadvisory Agreements and approval of the Management Agreement. Those factors included one or more of the following: (i) that the Fund’s performance, although lagging in certain recent periods, was stronger over the longer term; (ii) that the underperformance was attributable, to a significant extent, to investment decisions that were reasonable and consistent with the Fund’s investment strategy and policies and that the Fund was performing within a reasonable range of expectations, given those investment decisions, market conditions and the Fund’s investment strategy; (iii) that the Fund’s performance was competitive when compared to other relevant performance benchmarks or peer groups; and (iv) that the Investment Manager had taken or was taking steps designed to help improve the Fund’s investment performance, including, but not limited to, replacing portfolio managers, enhancing the resources supporting the portfolio managers, or modifying investment strategies.
The Committee and the Board noted that, through December 31, 2014, the Fund’s performance was in the sixty-second percentile (where the best performance would be in the first percentile) of its category selected by the independent third-party data provider for the purposes of performance comparisons for the one-year period.
The Committee and the Board also considered the Investment Manager’s performance and reputation generally, the Investment Manager’s historical responsiveness to Board concerns about performance, and the Investment Manager’s willingness to take steps intended to improve performance. After reviewing these and related factors, the Committee and the Board concluded, within the context of their overall conclusions, that the performance of the Fund, the Investment Manager and the Subadvisers were sufficient, in light of other considerations, to warrant the continuation of the Advisory Agreement and the Subadvisory Agreements and the approval of the Management Agreement.
Investment Advisory Fee Rates and Other Expenses
The Committee and the Board considered the advisory fees charged to the Fund under the Advisory Agreement and the Subadvisory Agreement, as well as the total expenses incurred by the Fund. In assessing the reasonableness of the fees under the Advisory Agreement, the Committee and the Board considered, among other information, the Fund’s advisory fee and its total expense ratio as a percentage of average daily net assets. The Committee and the Board also considered that the proposed management fee would not exceed the sum of the fee rates payable under the Advisory Agreement and the Administrative Services Agreement. The Committee and the Board considered data provided by the independent fee consultant. The Committee and the Board noted that, as of December 31, 2014, the Fund’s actual management fee and net expense ratio are both ranked in the fourth quintile (where the lowest fees and expenses would be in the first quintile) against the Fund’s expense universe as determined by the independent third-party data provider for purposes of expense comparison. The Committee and the Board also considered the fees that
| | |
| |
| ACTIVE PORTFOLIOS® MULTI-MANAGER CORE PLUS BOND FUND | | |
BOARD CONSIDERATION AND APPROVAL OF ADVISORY AGREEMENT AND SUBADVISORY AGREEMENTS (continued)
each Subadviser charges to its other clients, and noted that the Investment Manager pays the fees of the Subadvisers. The Committee and the Board also took into account the fee waiver and expense limitation arrangements agreed to by the Investment Manager, as noted above.
The Committee and the Board also received and considered information about the advisory fees charged by the Investment Manager to institutional separate accounts. In considering the fees charged to those accounts, the Committee and the Board took into account, among other things, the Investment Manager’s representations about the differences between managing mutual funds as compared to other types of accounts, including differences in the services provided, differences in the risk profile of such business for the Investment Manager and the additional resources required to manage mutual funds effectively. The Committee and the Board received and considered information about the fees charged by the Investment Manager for sub-advisory services provided to comparable unaffiliated funds. In evaluating the Fund’s advisory fees, the Committee and the Board also took into account the demands, complexity and quality of the investment management of the Fund.
After reviewing these and related factors, the Committee and the Board concluded, within the context of their overall conclusions, that the advisory/management fee rates and expenses of the Fund were sufficient, in light of other considerations, to warrant the approval of the Management Agreement and continuation of the Advisory Agreement and the Subadvisory Agreements.
Costs of Services Provided and Profitability
The Committee and the Board also took note of the costs the Investment Manager and its affiliates incur in connection with the services provided (both on an absolute and relative basis) and the profitability to the Investment Manager and its affiliates in connection with their relationships with the Fund.
The Committee and the Board also considered the compensation directly or indirectly received by the Investment Manager’s affiliates in connection with their relationships with the Fund. The Committee and the Board reviewed information provided by management as to the profitability to the Investment Manager and its affiliates of their relationships with the Fund, information about the allocation of expenses used to calculate profitability, and comparisons of profitability levels realized in 2014 to profitability levels realized in 2013. When reviewing profitability, the Committee and the Board also considered court cases in which adviser profitability was an issue in whole or in part, the performance of similarly managed funds, the performance of the Fund, and the expense ratio of the Fund. The Committee and the Board also considered information provided by the Investment Manager regarding its financial condition and comparing its profitability to that of other asset management firms that are, or are subsidiaries of, publicly traded companies. Because the Subadvisory Agreements were negotiated at arms-length by the Investment Manager, which is responsible for payments to each Subadviser thereunder, the Committee and the Board did not consider the profitability to each Subadviser of its relationship with the Fund.
After reviewing these and related factors, the Committee and the Board concluded, within the context of their overall conclusions, that the costs of services provided and the profitability to the Investment Manager and its affiliates from their relationships with the Fund supported the approval of the Management Agreement and the continuation of the Advisory Agreement and the Subadvisory Agreements.
Economies of Scale
The Committee and the Board considered the potential existence of economies of scale in the provision by the Investment Manager of services to the Fund, to groups of related funds, and to the Investment Manager’s investment advisory clients as a whole, and whether those economies of scale were shared with the Fund through breakpoints in investment advisory fees or other means, such as expense limitation arrangements and additional investments by the Investment Manager in investment, trading and compliance resources. The Committee and the Board noted that the investment advisory and management fee schedules for the Fund contained breakpoints that would reduce the fee rate on assets above specified threshold levels.
The Committee and the Board noted that the breakpoints in the Advisory Agreement did not occur at the same levels as the breakpoints in the Subadvisory Agreements. The Committee and the Board noted that absent a shareholder vote, the Investment Manager would bear any increase in fees payable under the Subadvisory Agreements. The
| | |
| |
| | ACTIVE PORTFOLIOS® MULTI-MANAGER CORE PLUS BOND FUND |
BOARD CONSIDERATION AND APPROVAL OF ADVISORY AGREEMENT AND SUBADVISORY AGREEMENTS (continued)
Committee and the Board also noted the potential challenges of seeking to tailor the Advisory Agreement breakpoints to those of a subadvisory agreement in this context, and the effect that capacity constraints on a subadviser’s ability to manage assets could potentially have on the ability of the Investment Manager to achieve economies of scale, as new subadvisers may need to be added as the Fund grows, increasing the Investment Manager’s cost of compensating and overseeing the Fund’s subadvisers.
In considering these matters, the Committee and the Board also considered the costs of the services provided and the profitability to the Investment Manager and its affiliates from their relationships with the Fund, as discussed above. After reviewing these and related factors, the Committee and the Board concluded, within the context of their overall conclusions, that the extent to which any economies of scale were expected to be shared with the Fund supported the approval of the Management Agreement and the continuation of the Advisory Agreement and the Subadvisory Agreements.
Other Benefits to the Investment Manager
The Committee and the Board received and considered information regarding “fall-out” or ancillary benefits received by the Investment Manager and its affiliates as a result of their relationships with the Fund, such as the engagement of the Investment Manager to provide administrative services to the Fund and the engagement of the Investment Manager’s affiliates to provide distribution and transfer agency services to the Fund. In this regard, among other matters, the Committee and the Board considered that the Fund’s distributor retains a portion of the distribution fees from the Fund and receives a portion of the sales charges on sales or redemptions of certain classes of shares of the Fund. The Committee and the Board also considered the benefits of research made available to the Investment Manager by reason of brokerage commissions generated by the Fund’s securities transactions, and reviewed information about the Investment Manager’s practices with respect to allocating portfolio transactions for brokerage and research services. The Committee and the Board considered the possible conflicts of interest associated with certain fall-out or other ancillary benefits and the reporting, disclosure and other processes that are in place to address such possible conflicts of interest. The Committee and the Board recognized that the Investment Manager’s profitability would be somewhat lower without these benefits.
Conclusion
The Committee and the Board reviewed all of the above considerations in reaching their decisions to recommend or approve the Management Agreement and the continuation of the Advisory Agreement and the Subadvisory Agreements. In their deliberations, the Trustees did not identify any particular information that was all-important or controlling, and individual Trustees may have attributed different weights to the various factors. Based on their evaluation of all factors that they deemed to be material, including those factors described above, and assisted by the advice of independent legal counsel, the Board, including the Independent Trustees, voting separately, unanimously approved the Management Agreement and the continuation of the Advisory Agreement and the Subadvisory Agreements.
| | |
| |
| ACTIVE PORTFOLIOS® MULTI-MANAGER CORE PLUS BOND FUND | | |
IMPORTANT INFORMATION ABOUT THIS REPORT
Each fund mails one shareholder report to each shareholder address. If you would like more than one report, please call shareholder services at 800.345.6611 and additional reports will be sent to you.
The policy of the Board is to vote the proxies of the companies in which each fund holds investments consistent with the procedures as stated in the Statement of Additional Information (SAI). You may obtain a copy of the SAI without charge by calling 800.345.6611; contacting your financial intermediary; visiting columbiathreadneedle.com/us; or searching the website of the Securities and Exchange Commission (SEC) at sec.gov. Information regarding how each fund voted proxies relating to portfolio securities is filed with the SEC by August 31st for the most recent 12-month period ending June 30th of that year, and is available without charge by visiting columbiathreadneedle.com/us, or searching the website of the SEC at sec.gov.
Each fund files a complete schedule of portfolio holdings with the SEC for the first and third quarters of each fiscal year on Form N-Q. Each fund’s Form N-Q is available on the SEC’s website at sec.gov and may be reviewed and copied at the SEC’s Public Reference Room in Washington, D.C. Information on the operation of the Public Reference Room may be obtained by calling 800.SEC.0330. Each fund’s complete schedule of portfolio holdings, as filed on Form N-Q, can also be obtained without charge, upon request, by calling 800.345.6611.
Active Portfolios® Multi-Manager Core Plus Bond Fund
P.O. Box 8081
Boston, MA 02266-8081
This information is for use with concurrent or prior delivery of a fund prospectus. Please read and consider the investment objectives, risks, charges and expenses for any fund carefully before investing. For a prospectus and summary prospectus, which contains this and other important information about the Fund, go to columbiathreadneedle.com/us. The Fund is distributed by Columbia Management Investment Distributors, Inc., member FINRA, and managed by Columbia Management Investment Advisers, LLC.
Columbia Threadneedle Investments (Columbia Threadneedle) is the global brand name of the Columbia and Threadneedle group of companies. All rights reserved. Columbia Management Investment Distributors, Inc., 225 Franklin Street, Boston, MA 02110-2804
© 2015 Columbia Management Investment Advisers, LLC.
columbiathreadneedle.com/us
ANN101_08_E01_(10/15)

ANNUAL REPORT
August 31, 2015

ACTIVE PORTFOLIOS® MULTI-MANAGER SMALL CAP EQUITY FUND

PRESIDENT’S MESSAGE

Dear Shareholder,
Today’s investors are typically focused on outcomes, like living a certain retirement lifestyle, paying for college education or building a legacy. But in today’s complex global investment landscape, even simple goals are not easily achieved.
At Columbia Threadneedle Investments, we aspire to help satisfy five core needs of today’s investors:
| | n | | Generate an appropriate stream of income in retirement |
Traditional approaches to generating income may not provide the diversification benefits they once did, and they may actually introduce unwanted risk in today’s market. To seek to improve your potential to live comfortably long term, we endeavor to pursue investments that explore less traveled paths to income.
| n | | Navigate a changing interest rate environment |
Today’s uncertain market environment includes the prospect of a rise in interest rates. Blending traditional investments with non-traditional or alternative products may help protect your wealth during periods of volatility. We can attempt to help strengthen your portfolio with agile products designed to take on the market’s ups and downs.
| n | | Maximize after-tax returns |
In an environment where what you keep may be more important than what you earn, municipal bonds can help mitigate high tax burdens while providing potentially attractive yields. Our state and federal tax-exempt products are aimed at helping investors manage risk, minimize the fluctuation of capital and grow wealth on a more tax-efficient basis.
| n | | Grow assets to achieve financial goals |
We believe that finding and protecting growth comes from a disciplined security selection process designed to create excess return. Our goal is to provide investment solutions built to help you face today’s market challenges and grow your assets at each crossroad of your journey.
| n | | Ease the impact of volatile markets |
Despite a bull market run that has benefited many investors over the past several years, it’s important to remember the lessons of 2008 and the value that a well-diversified portfolio may provide through times of market volatility. We are here to help you hold onto the savings you have worked tirelessly to amass, and to provide you the best opportunity to maintain your standard of living regardless of market conditions.
Find out today how we can help you confidently invest to realize your dreams. Please visit us at blog.columbiathreadneedleus.com/our-best-ideas to learn more about our unique investment solutions.
The world is constantly changing, but our priority remains the same: to help you secure your finances, meet your goals and achieve success. Thank you for your continued investment with us.
Sincerely,

Christopher O. Petersen
President, Columbia Funds
Investors should consider the investment objectives, risks, charges and expenses of a mutual fund carefully before investing. For a free prospectus and summary prospectus, which contains this and other important information about a fund, visit columbiathreadneedle.com/us. The prospectus should be read carefully before investing.
Columbia Funds are distributed by Columbia Management Investment Distributors, Inc., member FINRA, and managed by Columbia Management Investment Advisers, LLC.
© 2015 Columbia Management Investment Advisers, LLC. All rights reserved.
Annual Report 2015
| | |
| |
| ACTIVE PORTFOLIOS® MULTI-MANAGER SMALL CAP EQUITY FUND | | |
TABLE OF CONTENTS
Fund Investment Manager
Columbia Management Investment
Advisers, LLC
225 Franklin Street
Boston, MA 02110
Fund Distributor
Columbia Management Investment
Distributors, Inc.
225 Franklin Street
Boston, MA 02110
Fund Transfer Agent
Columbia Management Investment
Services Corp.
P.O. Box 8081
Boston, MA 02266-8081
For more information about any of the funds, please visit columbiathreadneedle.com/us or call 800.345.6611. Customer Service Representatives are available to answer your questions Monday through Friday from 8 a.m. to 7 p.m. Eastern time.
The views expressed in this report reflect the current views of the respective parties. These views are not guarantees of future performance and involve certain risks, uncertainties and assumptions that are difficult to predict, so actual outcomes and results may differ significantly from the views expressed. These views are subject to change at any time based upon economic, market or other conditions and the respective parties disclaim any responsibility to update such views. These views may not be relied on as investment advice and, because investment decisions for a Columbia fund are based on numerous factors, may not be relied on as an indication of trading intent on behalf of any particular Columbia fund. References to specific securities should not be construed as a recommendation or investment advice.
Annual Report 2015
| | |
| |
| | ACTIVE PORTFOLIOS® MULTI-MANAGER SMALL CAP EQUITY FUND |
PERFORMANCE OVERVIEW
Performance Summary
| n | | Active Portfolios® Multi-Manager Small Cap Equity Fund (the Fund) Class A shares returned 1.90% for the 12-month period that ended August 31, 2015. |
| n | | The Fund outperformed its benchmark, the Russell 2000 Index, which returned 0.03% over the same period. |
| n | | The Fund’s relative outperformance was driven by individual stock selection from the advisor and each of the Fund’s three subadvisers. |
| | | | | | | | | | |
Average Annual Total Returns (%) (for period ended August 31, 2015) | |
| | | Inception | | 1 Year | | | Life | |
Class A | | 04/20/12 | | | 1.90 | | | | 12.59 | |
Russell 2000 Index | | | | | 0.03 | | | | 13.01 | |
All results shown assume reinvestment of distributions during the period. Returns do not reflect the deduction of taxes that a shareholder may pay on Fund distributions or on the redemption of Fund shares. Performance results reflect the effect of any fee waivers or reimbursements of Fund expenses by Columbia Management Investment Advisers, LLC and/or any of its affiliates. Absent these fee waivers or expense reimbursement arrangements, performance results would have been lower.
The performance information shown represents past performance and is not a guarantee of future results. The investment return and principal value of your investment will fluctuate so that your shares, when redeemed, may be worth more or less than their original cost. Current performance may be lower or higher than the performance information shown. You may obtain performance information current to the most recent month-end by contacting your financial intermediary, visiting columbiathreadneedle.com/us or calling 800.345.6611.
The Russell 2000 Index measures the performance of the small-cap segment of the U.S. equity universe. The Russell 2000 is a subset of the Russell 3000 Index representing approximately 10% of the total market capitalization of that index. It includes approximately 2000 of the smallest securities based on a combination of their market cap and current index membership.
Indices are not available for investment, are not professionally managed and do not reflect sales charges, fees, brokerage commissions, taxes or other expenses of investing. Securities in the Fund may not match those in an index.
| | |
| |
| ACTIVE PORTFOLIOS® MULTI-MANAGER SMALL CAP EQUITY FUND | | |
PERFORMANCE OVERVIEW (continued)
|
Performance of a Hypothetical $10,000 Investment (April 20, 2012 — August 31, 2015) |
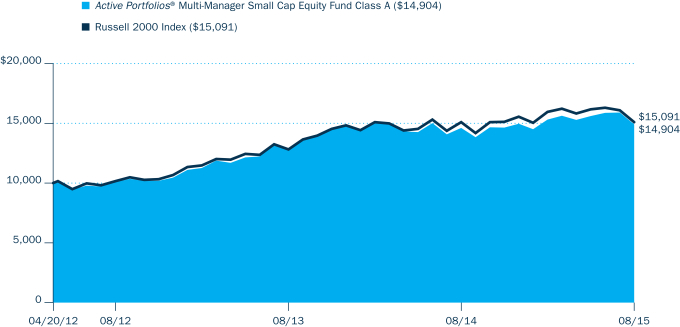
The chart above shows the change in value of a hypothetical $10,000 investment in Class A shares of Active Portfolios® Multi-Manager Small Cap Equity Fund during the stated time period, and does not reflect the deduction of taxes that a shareholder may pay on Fund distributions or on the redemption of Fund shares.
| | |
| |
| | ACTIVE PORTFOLIOS® MULTI-MANAGER SMALL CAP EQUITY FUND |
MANAGER DISCUSSION OF FUND PERFORMANCE
Portfolio Management
Columbia Management Investment Advisers, LLC
Christian Stadlinger, Ph.D., CFA
Jarl Ginsberg, CFA, CAIA
Conestoga Capital Advisors, LLC
Robert Mitchell
Joseph Monahan
Dalton, Greiner, Hartman, Maher & Co., LLC
Bruce Geller, CFA
Jeffery Baker, CFA
Peter Gulli, CFA
Edward Turville, CFA
EAM Investors, LLC
Montie Weisenberger
Morningstar Style Box™
The Morningstar Style Box™ is based on a fund’s portfolio holdings. For equity funds, the vertical axis shows the market capitalization of the stocks owned, and the horizontal axis shows investment style (value, blend, or growth). Information shown is based on the most recent data provided by Morningstar.
© 2015 Morningstar, Inc. All rights reserved. The Morningstar information contained herein: (1) is proprietary to Morningstar and/or its content providers; (2) may not be copied or distributed; and (3) is not warranted to be accurate, complete or timely. Neither Morningstar nor its content providers are responsible for any damages or losses arising from any use of this information.
| | | | |
Top Ten Holdings (%) (at August 31, 2015) | |
iShares Russell 2000 ETF | | | 5.5 | |
iShares Russell 2000 Value ETF | | | 4.1 | |
Vanguard Russell 2000 ETF | | | 1.4 | |
SPS Commerce, Inc. | | | 1.0 | |
Omnicell, Inc. | | | 0.9 | |
Radian Group, Inc. | | | 0.9 | |
Stamps.com, Inc. | | | 0.8 | |
AAON, Inc. | | | 0.8 | |
PDC Energy, Inc. | | | 0.7 | |
Proto Labs, Inc. | | | 0.7 | |
Percentages indicated are based upon total investments (excluding Money Market Funds.)
The Fund is managed by three independent money management firms and by Columbia Management Investment Advisers, LLC (CMIA) with each investing a portion of the portfolio’s assets. As of August 31, 2015, Dalton, Greiner, Hartman, Maher & Co., LLC (DGHM), EAM Investors, LLC (EAM), Conestoga Capital Advisors LLC (Conestoga) and CMIA managed approximately 20%, 20%, 20% and 20% of the portfolio, respectively. CMIA also manages a liquidity sleeve to help manage cash flow, which accounted for 20% of the portfolio.
On October 20, 2015, the Fund’s Board of Trustees approved the addition of BMO Asset Management Corp. to manage a portion of the Fund’s assets, effective on or about October 26, 2015.
For the 12-month period that ended August 31, 2015, the Fund’s Class A shares returned 1.90%. The Fund outperformed its benchmark, the Russell 2000 Index, which returned 0.03% over the same period. The Fund’s relative outperformance was driven by individual stock selection from each of the Fund’s four managers.
Heightened Volatility Left Small-Cap Equities Generally Flat
U.S. small cap equities began the fiscal period with a precipitous six-week drop, driven in large part by double-digit declines in dozens of energy stocks that fell in concert with falling oil prices. But despite lower oil prices — as well as worries that included the end of quantitative easing in the U.S. — speculation about higher interest rates, geopolitical unrest and slowing global economic growth, U.S. equity markets, including small cap equities, rebounded as investors seemed to shrug off the mounting concerns. In addition, persistently low interest rates supported equities, especially utilities stocks, which benefited as investors seeking income allocated capital to the sector. The strong U.S. dollar further bolstered U.S. companies with greater domestic focus, which generally was reflected in the decisive outperformance of small-cap stocks over their larger cap counterparts. Indeed, the benchmark reached an all-time high approximately midway through the period.
As the period progressed, severe winter weather in the Northeast and a West Coast port strike significantly affected many U.S. businesses, particularly those in the consumer sectors. Markets also saw a distinct divergence between investment styles, as growth-oriented stocks began to significantly outperform value-oriented stocks, reflecting, we believe, a continuation of investors’ appetite for risk despite increasing volatility. Prospects for a strengthening U.S. economy likely were the impetus. Encouraging signs of economic recovery became more apparent, including increased merger and acquisition activity, more robust hiring by employers that brought the U.S. unemployment rate down to 5.1%, rising disposable income, a slight weakening of the U.S. dollar and rising sales of new and existing homes. Not even long-simmering worries about Greece, which reached full boil and overshadowed declining energy prices as a key investor concern, could sidetrack positive investor sentiment. In mid-June 2015, the benchmark yet again reached intraday and closing record highs.
Equity markets abruptly reversed course as the period came to a close, with major indices pulling back by 10% or more. Key factors driving the correction were increased concerns about slowing global economic growth, especially in China, and a continuing plunge in oil prices. Markets staged brief rallies,
| | |
| |
| ACTIVE PORTFOLIOS® MULTI-MANAGER SMALL CAP EQUITY FUND | | |
MANAGER DISCUSSION OF FUND PERFORMANCE (continued)
based primarily on economic data such as an upward revision in U.S. GDP, jobless claims remaining near a four-decade low, and homebuilder confidence climbing to near decade highs. However, most U.S. equity
indices finished the 12-month period ended August 31, 2015 with flat or negative returns.
Individual Stock Selection Impacted Fund Performance Most
DGHM: Our portion of the Fund underperformed the benchmark during the period, attributable primarily to an underweight allocation to the strongly performing health care sector and an overweight exposure to the poorly performing energy sector. Stock selection in the consumer durables and technology industries also detracted. Still, stock selection overall added to relative results, proving particularly effective in the basic materials, consumer services and miscellaneous financials market segments.
The individual positions in our portion of the Fund’s portfolio that contributed most positively were Entravision Communications, Molina Healthcare and Global Brass and Copper Holdings. Entravision Communications, an owner and operator of television and radio stations primarily serving the Spanish language markets, benefited from stronger than expected earnings and increasing value of the spectrum it owns, as reflected in auctions held during the period. Molina Healthcare, a Medicaid and managed care company, benefited from improving fundamentals. Global Brass and Copper Holdings, a converter, fabricator and distributor of specialized brass and copper products, performed well, as restructuring during the economic downturn had positively positioned the company to capitalize on the upturn in its end markets, especially building and housing.
Individual positions that disappointed most during the period were LB Foster, Precision Drilling and Bill Barrett. Shares of LB Foster, a manufacturer of products for the railroad, construction and energy markets, declined due to an ongoing dispute with Union Pacific about defective concrete railroad ties and the loss of future business with Union Pacific. Both Precision Drilling, an oil services company that produces land-based drilling rigs, and Bill Barrett, an exploration and production energy company, saw their respective shares decline due mainly to dropping oil and gas prices. We sold our portion of the Fund’s position in Bill Barrett by the end of the period.
EAM: Our portion of the Fund outperformed the benchmark due primarily to a sizable overweight to and strong stock selection within the health care sector, the best performing sector within the benchmark during the period. Relative performance was also enhanced, but to a lesser extent, by effective stock selection in the materials & processing, energy and consumer discretionary sectors. Having an underweight allocation to energy, by far the worst performing sector in the benchmark during the period, also helped. Such positive contributors were only partially offset by an underweight in financial services, which outpaced the benchmark during the period, and weak stock selection in technology, utilities and consumer staples, which detracted. At a process-driven level, exposure to medium-term momentum added value, as did our inherent growth bias, while market volatility was a negative hurdle.
Positions in three biotechnology companies were top contributors to our portion of the Fund’s results, namely Receptos, Agios Pharmaceuticals and
For further detail about these holdings, please refer to the section entitled “Portfolio of Investments.”
Fund holdings are as of the date given, are subject to change at any time, and are not recommendations to buy or sell any security.
Investment Risks
Market risk may affect a single issuer, sector of the economy, industry or the market as a whole. Foreign investments subject the fund to risks, including political, economic, market, social and others within a particular country, as well as to currency instabilities and less stringent financial and accounting standards generally applicable to U.S. issuers. Investments in small-cap companies involve risks and volatility greater than investments in larger, more established companies. The Fund may invest significantly in issuers within a particular sector, which may be negatively affected by market, economic or other conditions, making the Fund more vulnerable to unfavorable developments in the sector. The Fund is managed by multiple advisers independently of one another, which may result in contradicting trades (i.e., with no net benefit to the Fund), while increasing transaction costs. Market or other (e.g., interest rate) environments may adversely affect the liquidity of fund investments, negatively impacting their price. Generally, the less liquid the market at the time the Fund sells a holding, the greater the risk of loss or decline of value to the Fund. See the Fund’s prospectus for information on these and other risks.
| | | | |
Portfolio Breakdown (%) (at August 31, 2015) | |
Common Stocks | | | 78.2 | |
Exchange-Traded Funds | | | 9.7 | |
Money Market Funds | | | 12.1 | |
Total | | | 100.0 | |
Percentages indicated are based upon total investments. The Fund’s portfolio composition is subject to change.
| | |
| |
| | ACTIVE PORTFOLIOS® MULTI-MANAGER SMALL CAP EQUITY FUND |
MANAGER DISCUSSION OF FUND PERFORMANCE (continued)
| | | | |
Equity Sector Breakdown (%) (at August 31, 2015) | |
Consumer Discretionary | | | 11.9 | |
Consumer Staples | | | 1.8 | |
Energy | | | 3.1 | |
Financials | | | 21.9 | |
Health Care | | | 19.0 | |
Industrials | | | 15.1 | |
Information Technology | | | 20.6 | |
Materials | | | 3.8 | |
Telecommunication Services | | | 0.1 | |
Utilities | | | 2.7 | |
Total | | | 100.0 | |
Percentages indicated are based upon total equity investments. The Fund’s portfolio composition is subject to change.
Esperion Therapeutics. Receptos announced better than expected Phase II results for its lead multiple sclerosis drug and differentiated itself from its competition with a superior cardiac and hepatic safety profile. Agios Pharmaceuticals announced an earlier than expected readout for Phase I data on a treatment for mutant hematologic malignancies, which, when presented, was positive, validating its technology platform and opening opportunities for the company in cancer metabolism. Esperion Therapeutics saw its stock soar after its announcement of positive results from its Phase 2b study of a product designed to target known lipid and carbohydrate metabolic pathways to lower cholesterol and to avoid many of the side effects associated with existing therapies.
The biggest individual detractors from our portion of the Fund’s results during the period were oncology-focused pharmaceuticals company Sunesis Pharmaceuticals, crude oil producer Callon Petroleum and low-carbon renewable fuels producer Pacific Ethanol. Sunesis Pharmaceuticals reported that its key pipeline drug, Valor, missed its primary endpoint indication in Phase III testing, leading us to sell the position. Callon Petroleum issued positive guidance and executed well but saw its shares decline on the impact of falling oil prices on crude producers. Shares of Pacific Ethanol declined, as the benefit of the drop in corn prices was not enough to offset the impact of falling ethanol prices and increased transportations costs.
Conestoga: Our portion of the Fund outperformed the benchmark during the period due primarily to an emphasis on growth stocks, which significantly outpaced value stocks. Stock selection also added to relative returns, as did sector allocation.
More specifically, stock selection was strongest in the information technology and materials sectors. Sector allocation was strongest in health care, as the Fund had an overweight position in what was the only sector in the benchmark to post double-digit positive returns during the period. Performance by the biotechnology and pharmaceutical industries led the sector’s results. Only partially offsetting these positive contributors was the detracting effect of having underweight allocations to financials and consumer discretionary, and having no exposure to consumer staples. Each of these three sectors outpaced the benchmark during the period.
The biggest individual contributors to our portion of the Fund’s results were Stamps.com, a shipping and postage solutions provider; Repligen, a biotechnology firm; and Tyler Technologies, a provider of software services to municipal governments. Stamps.com delivered strong earnings results through most of the period, and, at the end of the first quarter of 2015, announced its intent to purchase Endicia, another shipping service company, from Newell Rubbermaid, an acquisition viewed favorably by the market. Repligen performed strongly along with stocks in the biotechnology and pharmaceutical industries broadly. Tyler Technologies enjoyed revenue and earnings growth, as adoption of its financial and judicial management software systems has remained steady as municipalities seek to improve efficiencies in their operations.
Positions in oil and gas exploration and production company Contango Oil & Gas, 3D printer and production systems provider Stratasys and mini-conglomerate Raven Industries detracted most from our portion of the Fund’s results. Contango Oil & Gas operates offshore in the shallow water of the Gulf of Mexico and in the onshore Gulf Coast region of the U.S. During
| | |
| |
| ACTIVE PORTFOLIOS® MULTI-MANAGER SMALL CAP EQUITY FUND | | |
MANAGER DISCUSSION OF FUND PERFORMANCE (continued)
the period, we saw a sizable decline in the company’s onshore production
and lackluster results in its exploration program. We sold our portion of the Fund’s position in the company. Stratasys encountered an intensifying competitive environment during the period and also announced a multi-year spending initiative, and we opted to sell our portion of the Fund’s position in the company. Raven Industries experienced disappointing results due to weakness in its applied technology business segment. This segment, which manufactures and sells farming technologies, was negatively impacted by the cyclical downturn in agricultural spending during the past few years. Raven Industries implemented cost reductions across two of its divisions as a result. We trimmed our portion of the Fund’s position in Raven Industries but continue to monitor developments closely.
CMIA: During the period, our portion of the Fund outperformed the Russell 2000 Value Index, against which our portion of the Fund is managed. Stock selection was the primary driver of outperformance relative to the Russell 2000 Value Index in our portion of the Fund — particularly in the financials, energy and consumer discretionary sectors. Within financials, banks and insurers delivered double-digit positive returns, driven to a large degree by prospects of an interest rate hike. In energy, contrary to broad sector results, several of our portion of the Fund’s holdings produced gains based on strong fundamentals. In consumer discretionary, stock selection in the textiles, apparel and luxury goods industry proved especially effective. Sector allocation, particularly an overweight to health care, and having a cash position amidst such volatility in the U.S. equity market, also added value. Only partially offsetting these positive contributors was stock selection and positioning in materials, consumer staples and information technology, which detracted.
From an individual holdings perspective, the top three positive contributors to our portion of the Fund’s results were footwear designer and marketer Skechers U.S.A., drug delivery technologies provider Catalent and veterinary hospitals operator VCA, each of which produced substantial gains during the annual period. Shares of Skechers U.S.A. advanced strongly on robust athletic and apparel trends in the U.S. as well as on product innovation combined with a sound marketing strategy and broad expansion internationally. Catalent experienced strong growth in its products distribution and saw its shares rise on strong fundamentals despite foreign-exchange headwinds in some of its business segments. VCA’s shares rose as the company showed better comparative sales across its veterinary clinics. We took some profits during the period by trimming our portion of the Fund’s position in Skechers U.S.A. We added to our portion of the Fund’s positions in Catalent and VCA during the period.
The biggest individual detractors from our portion of the Fund’s results were Goodrich Petroleum, an oil and gas exploration and production company; AK Steel Holding, a steel producer; and Trinity Industries, a machinery company — each of which posted double-digit negative returns during the period. Shares of Goodrich Petroleum declined in concert with falling oil prices. Shares of AK Steel fell on weak forward guidance due to declining steel prices. Trinity Industries’ shares dropped on competitive pressures from the trucking industry and on concerns that falling energy prices may reduce the need for the company’s rail tank cars used to transport oil within the U.S. We exited our portion of the Fund’s positions in Goodrich Petroleum
| | |
| |
| | ACTIVE PORTFOLIOS® MULTI-MANAGER SMALL CAP EQUITY FUND |
MANAGER DISCUSSION OF FUND PERFORMANCE (continued)
and AK Steel Holding during the period and added to its position in Trinity Industries based on our outlook for improving order volume.
Changes Driven By Bottom-Up Stock Selection
DGHM: We initiated a position in our portion of the Fund during the period in Patterson-UTI Energy, a North American oil service company providing drilling and pressure pumping. Both businesses are capital intensive and deeply cyclical. Patterson-UTI Energy is a leading provider of “Tier 1” rigs, which have the capability to drill the deep horizontal wells required in most shale plays. The company has also been the beneficiary of increasing fracking intensity and well count. Its stock had been weak due to the decline in oil prices, which affected demand for its services, but we believe that once the price of oil stabilizes and begins to recover, Patterson-UTI Energy may well begin to see an increase in demand, supporting a stock price recovery. We established a position in our portion of the Fund in Merit Medical Systems, a medical technology company producing a variety of single use products, primarily for interventional cardiology. The company also has products for radiology, endoscopy and pulmonology. The company has had a poor track record, as its margins have been in a decade-long decline with sales growing in the low double-digits. However, we believe that its management is now focused on returns and that its operating margins are poised to expand should sales growth continue as anticipated. In turn, this should lead to multiple expansion. In addition to the sale of Bill Barrett, already mentioned, we sold our portion of the Fund’s position in Spirit Airlines, an ultra-low cost, point-to-point airline serving the leisure market in the U.S. and the Caribbean, as it reached what we considered full valuation. We also exited our portion of the Fund’s position in Gray Television, a television owner/operator, due to its share price reaching our valuation estimate, its high leverage and some difficult fundamental trends.
We do not engage in significant sector timing activities. Based on individual stock selection, our portion of the Fund was overweight relative to the benchmark in financials, industrials and utilities and was underweight in non-cyclicals, technology and consumer cyclicals at the end of the period.
EAM: We initiated a Fund position in Eagle Pharmaceuticals, a specialty pharmaceutical company focused on developing and commercializing injectable products primarily in the critical care and oncology areas, utilizing a streamlined regulatory pathway available from the FDA for companies making different methods for delivering existing and approved drugs. We established a position in Abiomed, a manufacturer of medical implant devices on news that one of its devices used in certain high risk coronary procedures, including stenting and angioplasty, had cleared a significant regulatory hurdle.
We sold our portion of the Fund’s position in Sanchez Energy, an independent exploration and production company, after new guidance pointed to a change in its production mix. We exited our portion of the Fund’s position in metal producer Century Aluminum after estimates revised down on lowered base metal price forecasts from a JP Morgan metal strategist.
Changes in sector allocation are a by-product of our purely bottom-up investment process. That said, overall, we increased our portion of the
| | |
| |
| ACTIVE PORTFOLIOS® MULTI-MANAGER SMALL CAP EQUITY FUND | | |
MANAGER DISCUSSION OF FUND PERFORMANCE (continued)
Fund’s exposure relative to the benchmark in health care and technology during the period. We decreased relative allocations to producer durables and energy. As of August 31, 2015, our portion of the Fund was overweight relative to the benchmark in health care, technology and materials & processing and underweight relative to the benchmark in financial services, producer durables, utilities, and consumer discretionary. Our portion of the Fund was rather neutrally weighted to the benchmark in consumer staples and had no exposure to energy at the end of the period.
Conestoga: During the period, we established new positions in our portion of the Fund in Mobile Mini, the world’s leading provider of portable storage solutions; Rogers, a supplier of specialty materials products across a wide range of end markets; and Vascular Solutions, a medical device developer focused on clinical solutions for coronary and peripheral vascular procedures.
We sold our portion of the Fund’s positions in Acacia Research, which acquires, develops and enforces patented technologies. Our decision was based on the fact that its revenue stream has been increasingly difficult to analyze and predict. We exited Geospace Technologies, a company that designs and manufactures instruments and equipment used in the acquisition and processing of seismic data as well as in the characterization and monitoring of producing oil and gas reservoirs. Given that we believe there may be an extended down cycle in the seismic industry, we opted to sell. We began selling our portion of the Fund’s position in Profire Energy late in the first quarter of 2015 and completed all sales early in the second calendar quarter. Profire Energy is the leading manufacturer of burner management systems for the upstream and midstream constituents of the oil and gas industry. During the period, Profire Energy was negatively affected by the sharp drop in oil prices and by the lowering of exploration and production capital expenditure budgets by its clients.
At Conestoga, sector allocations are driven more by our bottom-up stock selection process than by any top-down or sector level research. Based on individual stock selection decisions, our portion of the Fund’s weighting in the energy sector decreased during the period and its exposures to the industrials and health care sectors modestly increased. At the end of August 2015, our portion of the Fund was overweight relative to the benchmark in health care, industrials and information technology; underweight in consumer discretionary, consumer staples, financials, materials and utilities; and relatively neutral in energy and telecommunication services.
CMIA: During the period, we established a position in First American Financial, a California-based real estate and mortgage insurer that has been exhibiting strong revenue and margin trends. We also initiated a position in Beacon Roofing Supply, based on our positive long-term outlook for residential roofing trends. In addition to those sales already mentioned, we exited our portion of the Fund’s position in Del Frisco’s Restaurant Group, which experienced operational issues, putting pressure on its comparative results. The company also missed targets on earnings and lowered its guidance.
Based on our individual fundamental, bottom-up stock selection process, notable sector shifts in our portion of the Fund included increased allocations to financials, consumer discretionary and industrials and decreased exposure to materials, information technology and energy.
| | |
| |
| | ACTIVE PORTFOLIOS® MULTI-MANAGER SMALL CAP EQUITY FUND |
MANAGER DISCUSSION OF FUND PERFORMANCE (continued)
At the end of the period, our portion of the Fund was overweight relative to the Russell 2000 Value Index in the health care and consumer discretionary sectors. Our portion of the Fund was underweight relative to the Russell 2000 Value Index in financials, information technology, utilities and telecommunication services and was rather neutrally weighted to the Russell 2000 Value Index in consumer staples, materials, energy and industrials at the end of August 2015.
Looking Ahead
DGHM: We do not employ macroeconomic analysis in a conventional fashion. Each sector specialist includes a global perspective, featuring a risk/reward assessment, in his or her stock selection. With that understanding, our approach in light of the global macroeconomic issues has been to emphasize our focus on strength of balance sheet and to proceed with some caution by favoring high quality companies.
EAM: Going forward, we intend to continue to execute our disciplined, bottom-up investment process, which seeks to capitalize on companies benefiting from positive fundamental change, in a timely fashion. That said, we also intend to continue to position our portion of the Fund in securities with characteristics we believe may enable them to outperform their small cap peers over our typical investment horizon. Key characteristics we look for include positive changes in relative price strength confirmed by above average volume; better than expected financial performance (i.e., positive financial surprise, positive estimate revision, increases in financial guidance, etc.); robust fundamental developments and strategies that may lead to future financial surprise and accelerating growth rates; and attractive relative valuations (i.e., trading at a discount to expected growth rates, historical multiples and/or peer multiples). We believe securities with these characteristics are best positioned to perform well, as stock price appreciation may be driven by rising financial performance and related expectations and/or valuation multiple expansion.
Conestoga: At this time, we expect the U.S. equity market to be driven in the near term by the timing and pace of Federal Reserve (Fed) interest rate increases as well as by ongoing developments in overseas markets. Clearly, economic and employment growth in the U.S. will impact the equity market as well. Regardless of economic and market conditions, we intend, in managing our portion of the Fund, to remain focused on companies that we believe have sustainable earnings growth and higher earnings stability. During the past few years, the equity market has been supported in large part by loss-making companies. We do not think this trend is sustainable. With increased volatility and the Fed poised to increase interest rates, we believe our portion of the Fund is well positioned going forward.
CMIA: We believe our focus on small-cap value companies with what we consider to be strong underlying earnings prospects and attractively priced shares has the potential to reward investors over the long term. We remain disciplined in our research of those companies where we believe the valuation gap is likely to shrink in the near term and look for a company’s upward inflection point — that is, we seek stocks that are, in our view, both inexpensive and demonstrating improving operating performance and operating metrics. As we do this, three categories of opportunity typically come to light: 1) companies with compressed near-term operating
| | |
| |
| ACTIVE PORTFOLIOS® MULTI-MANAGER SMALL CAP EQUITY FUND | | |
MANAGER DISCUSSION OF FUND PERFORMANCE (continued)
fundamentals, which managers believe are poised to expand within a reasonable timeframe; 2) companies in industries that may be out of favor; and 3) “out of the limelight” companies missed by the Wall Street research community. Going forward, we expect our portion of the Fund’s performance to continue to be driven by our bottom-up stock selection process and for this process to continue to drive sector allocations.
| | |
| |
| | ACTIVE PORTFOLIOS® MULTI-MANAGER SMALL CAP EQUITY FUND |
UNDERSTANDING YOUR FUND’S EXPENSES
(Unaudited)
As an investor, you incur two types of costs. There are transaction costs, which generally include sales charges on purchases and may include redemption fees. There are also ongoing costs, which generally include management fees, distribution and/or service fees, and other fund expenses. The following information is intended to help you understand your ongoing costs (in dollars) of investing in the Fund and to help you compare these costs with the ongoing costs of investing in other mutual funds.
Analyzing Your Fund’s Expenses
To illustrate these ongoing costs, we have provided examples and calculated the expenses paid by investors in each share class of the Fund during the period. The actual and hypothetical information in the table is based on an initial investment of $1,000 at the beginning of the period indicated and held for the entire period. Expense information is calculated two ways and each method provides you with different information. The amount listed in the “Actual” column is calculated using the Fund’s actual operating expenses and total return for the period. You may use the Actual information, together with the amount invested, to estimate the expenses that you paid over the period. Simply divide your account value by $1,000 (for example, an $8,600 account value divided by $1,000 = 8.6), then multiply the results by the expenses paid during the period under the “Actual” column. The amount listed in the “Hypothetical” column assumes a 5% annual rate of return before expenses (which is not the Fund’s actual return) and then applies the Fund’s actual expense ratio for the period to the hypothetical return. You should not use the hypothetical account values and expenses to estimate either your actual account balance at the end of the period or the expenses you paid during the period. See “Compare With Other Funds” below for details on how to use the hypothetical data.
Compare With Other Funds
Since all mutual funds are required to include the same hypothetical calculations about expenses in shareholder reports, you can use this information to compare the ongoing cost of investing in the Fund with other funds. To do so, compare the hypothetical example with the 5% hypothetical examples that appear in the shareholder reports of other funds. As you compare hypothetical examples of other funds, it is important to note that hypothetical examples are meant to highlight the ongoing costs of investing in a fund only and do not reflect any transaction costs, such as sales charges, or redemption or exchange fees. Therefore, the hypothetical calculations are useful in comparing ongoing costs only, and will not help you determine the relative total costs of owning different funds. If transaction costs were included in these calculations, your costs would be higher.
March 1, 2015 – August 31, 2015
| | | | | | | | | | | | | | | | | | | | | | | | | | | | |
| | | Account Value at the Beginning of the Period ($) | | | Account Value at the End of the Period ($) | | | Expenses Paid During the Period ($) | | | Fund’s Annualized Expense Ratio (%) | |
| | | | Actual | | | | Hypothetical | | | | Actual | | | | Hypothetical | | | | Actual | | | | Hypothetical | | | | Actual | |
Class A | | | 1,000.00 | | | | 1,000.00 | | | | 974.10 | | | | 1,018.35 | | | | 6.90 | | | | 7.06 | | | | 1.38 | |
Expenses paid during the period are equal to the annualized expense ratio for each class as indicated above, multiplied by the average account value over the period and then multiplied by the number of days in the Fund’s most recent fiscal half year and divided by 365.
Expenses do not include fees and expenses incurred indirectly by the Fund from its investment in underlying funds, including affiliated and non-affiliated pooled investment vehicles, such as mutual funds and exchange-traded funds.
Had Columbia Management Investment Advisers, LLC and/or certain of its affiliates not waived/reimbursed certain fees and expenses, account value at the end of the period would have been reduced.
Class A shares of the Fund are available only to certain eligible investors through certain wrap fee programs sponsored and/or managed by Ameriprise Financial, Inc. or its affiliates. Fund shares are sold in accordance with the terms of the account through which you invest in the Fund. Participants in wrap fee programs pay an asset-based fee that is not included in the above table. Please read the wrap program documents for information regarding fees charged.
| | |
| |
| ACTIVE PORTFOLIOS® MULTI-MANAGER SMALL CAP EQUITY FUND | | |
PORTFOLIO OF INVESTMENTS
August 31, 2015
(Percentages represent value of investments compared to net assets)
| | | | | | | | |
| Common Stocks 78.1% | |
| Issuer | | Shares | | | Value ($) | |
CONSUMER DISCRETIONARY 9.3% | |
Auto Components 1.2% | |
| | |
American Axle & Manufacturing Holdings, Inc.(a) | | | 58,100 | | | | 1,173,620 | |
| | |
Dorman Products, Inc.(a) | | | 149,525 | | | | 7,528,584 | |
| | |
Tenneco, Inc.(a) | | | 29,200 | | | | 1,373,860 | |
| | |
Tower International, Inc.(a) | | | 251,088 | | | | 6,139,101 | |
| | | | | | | | | |
Total | | | | | | | 16,215,165 | |
|
Automobiles 0.3% | |
| | |
Thor Industries, Inc. | | | 80,543 | | | | 4,396,037 | |
|
Diversified Consumer Services 1.1% | |
| | |
2U, Inc.(a) | | | 56,031 | | | | 1,959,404 | |
| | |
Grand Canyon Education, Inc.(a) | | | 115,600 | | | | 4,272,576 | |
| | |
Nord Anglia Education, Inc.(a) | | | 111,200 | | | | 2,284,048 | |
| | |
ServiceMaster Global Holdings, Inc.(a) | | | 160,839 | | | | 5,658,316 | |
| | | | | | | | | |
Total | | | | | | | 14,174,344 | |
|
Hotels, Restaurants & Leisure 1.5% | |
| | |
Bloomin’ Brands, Inc. | | | 88,000 | | | | 1,821,600 | |
| | |
ClubCorp Holdings, Inc. | | | 102,090 | | | | 2,298,046 | |
| | |
Dave & Buster’s Entertainment, Inc.(a) | | | 107,332 | | | | 3,696,514 | |
| | |
Del Taco Restaurants, Inc.(a) | | | 124,234 | | | | 1,576,529 | |
| | |
Diamond Resorts International, Inc.(a) | | | 54,874 | | | | 1,393,251 | |
| | |
Penn National Gaming, Inc.(a) | | | 150,000 | | | | 2,724,000 | |
| | |
Red Robin Gourmet Burgers, Inc.(a) | | | 32,000 | | | | 2,521,280 | |
| | |
Six Flags Entertainment Corp. | | | 50,576 | | | | 2,274,403 | |
| | |
Sonic Corp. | | | 54,386 | | | | 1,468,422 | |
| | | | | | | | | |
Total | | | | | | | 19,774,045 | |
|
Household Durables 0.9% | |
| | |
Helen of Troy Ltd.(a) | | | 40,000 | | | | 3,405,600 | |
| | |
Installed Building Products, Inc.(a) | | | 69,106 | | | | 1,846,512 | |
| | |
LGI Homes, Inc.(a) | | | 84,145 | | | | 2,191,136 | |
| | |
Libbey, Inc. | | | 45,373 | | | | 1,598,945 | |
| | |
Ryland Group, Inc. (The) | | | 63,000 | | | | 2,724,120 | |
| | | | | | | | | |
Total | | | | | | | 11,766,313 | |
|
Internet & Catalog Retail 0.2% | |
| | |
Nutrisystem, Inc. | | | 62,200 | | | | 1,740,356 | |
| | |
Wayfair, Inc., Class A(a) | | | 25,326 | | | | 944,660 | |
| | | | | | | | | |
Total | | | | | | | 2,685,016 | |
|
Leisure Products 0.2% | |
| | |
Callaway Golf Co. | | | 252,285 | | | | 2,232,722 | |
| | | | | | | | |
| Common Stocks (continued) | |
| Issuer | | Shares | | | Value ($) | |
Media 1.2% | |
| | |
AMC Entertainment Holdings, Inc., Class A | | | 48,000 | | | | 1,391,040 | |
| | |
Entravision Communications Corp., Class A | | | 631,707 | | | | 5,085,241 | |
| | |
Gray Television, Inc.(a) | | | 146,533 | | | | 1,698,318 | |
| | |
Media General, Inc.(a) | | | 121,207 | | | | 1,424,182 | |
| | |
Morningstar, Inc. | | | 31,500 | | | | 2,513,070 | |
| | |
Nexstar Broadcasting Group, Inc., Class A | | | 43,112 | | | | 2,003,846 | |
| | |
Sinclair Broadcast Group, Inc., Class A | | | 79,500 | | | | 2,129,010 | |
| | | | | | | | | |
Total | | | | | | | 16,244,707 | |
|
Specialty Retail 1.9% | |
| | |
American Eagle Outfitters, Inc. | | | 184,000 | | | | 3,131,680 | |
| | |
Cato Corp. (The), Class A | | | 86,836 | | | | 3,050,549 | |
| | |
Children’s Place, Inc. (The) | | | 36,000 | | | | 2,157,120 | |
| | |
Express, Inc.(a) | | | 101,671 | | | | 2,074,088 | |
| | |
Genesco, Inc.(a) | | | 53,361 | | | | 3,195,790 | |
| | |
Guess?, Inc. | | | 64,500 | | | | 1,426,095 | |
| | |
Hibbett Sports, Inc.(a) | | | 63,800 | | | | 2,520,100 | |
| | |
Kirkland’s, Inc. | | | 215,364 | | | | 4,806,925 | |
| | |
Party City Holdco, Inc.(a) | | | 118,000 | | | | 1,998,920 | |
| | |
TravelCenters of America LLC(a) | | | 147,000 | | | | 1,733,130 | |
| | | | | | | | | |
Total | | | | | | | 26,094,397 | |
|
Textiles, Apparel & Luxury Goods 0.8% | |
| | |
G-III Apparel Group Ltd.(a) | | | 37,753 | | | | 2,617,415 | |
| | |
Oxford Industries, Inc. | | | 21,367 | | | | 1,798,247 | |
| | |
Sequential Brands Group, Inc.(a) | | | 159,200 | | | | 2,606,104 | |
| | |
Skechers U.S.A., Inc., Class A(a) | | | 25,258 | | | | 3,554,811 | |
| | | | | | | | | |
Total | | | | | | | 10,576,577 | |
| | | | | | | | | |
Total Consumer Discretionary | | | | | | | 124,159,323 | |
| | |
| | | | | | | | |
CONSUMER STAPLES 1.4% | |
Food & Staples Retailing 0.6% | |
| | |
SpartanNash Co. | | | 70,000 | | | | 1,981,000 | |
| | |
SUPERVALU, Inc.(a) | | | 246,100 | | | | 2,027,864 | |
| | |
Weis Markets, Inc. | | | 99,969 | | | | 4,063,740 | |
| | | | | | | | | |
Total | | | | | | | 8,072,604 | |
|
Food Products 0.7% | |
| | |
John B. Sanfilippo & Son, Inc. | | | 34,725 | | | | 1,794,935 | |
| | |
Pinnacle Foods, Inc. | | | 45,002 | | | | 2,017,890 | |
| | |
Post Holdings, Inc.(a) | | | 29,532 | | | | 1,927,849 | |
| | |
TreeHouse Foods, Inc.(a) | | | 37,000 | | | | 2,936,690 | |
| | | | | | | | | |
Total | | | | | | | 8,677,364 | |
The accompanying Notes to Financial Statements are an integral part of this statement.
| | |
| |
| | ACTIVE PORTFOLIOS® MULTI-MANAGER SMALL CAP EQUITY FUND |
PORTFOLIO OF INVESTMENTS (continued)
August 31, 2015
| | | | | | | | |
| Common Stocks (continued) | |
| Issuer | | Shares | | | Value ($) | |
Personal Products 0.1% | |
| | |
Nu Skin Enterprises, Inc., Class A | | | 39,000 | | | | 1,781,520 | |
| | | | | | | | | |
Total Consumer Staples | | | | | | | 18,531,488 | |
| | |
| | | | | | | | |
ENERGY 2.4% | |
Energy Equipment & Services 0.7% | |
| | |
Patterson-UTI Energy, Inc. | | | 403,720 | | | | 6,572,561 | |
| | |
Precision Drilling Corp. | | | 687,391 | | | | 3,306,351 | |
| | | | | | | | | |
Total | | | | | | | 9,878,912 | |
|
Oil, Gas & Consumable Fuels 1.7% | |
| | |
Aegean Marine Petroleum Network, Inc. | | | 113,100 | | | | 956,826 | |
| | |
Carrizo Oil & Gas, Inc.(a) | | | 19,500 | | | | 710,385 | |
| | |
Delek U.S. Holdings, Inc. | | | 54,600 | | | | 1,679,496 | |
| | |
Matador Resources Co.(a) | | | 361,000 | | | | 8,270,510 | |
| | |
Parsley Energy, Inc., Class A(a) | | | 41,300 | | | | 710,360 | |
| | |
PDC Energy, Inc.(a) | | | 152,014 | | | | 8,540,147 | |
| | |
Teekay Tankers Ltd., Class A | | | 259,500 | | | | 1,525,860 | |
| | | | | | | | | |
Total | | | | | | | 22,393,584 | |
| | | | | | | | | |
Total Energy | | | | | | | 32,272,496 | |
| | |
| | | | | | | | |
FINANCIALS 17.1% | |
Banks 7.0% | |
| | |
Ameris Bancorp | | | 76,500 | | | | 2,086,155 | |
| | |
Associated Banc-Corp. | | | 238,783 | | | | 4,384,056 | |
| | |
Bank of the Ozarks, Inc. | | | 65,600 | | | | 2,742,080 | |
| | |
Capital Bank Financial Corp.
Class A(a) | | | 31,295 | | | | 962,947 | |
| | |
Cathay General Bancorp | | | 58,000 | | | | 1,718,540 | |
| | |
Community Bank System, Inc. | | | 94,400 | | | | 3,366,304 | |
| | |
Community Trust Bancorp, Inc. | | | 89,323 | | | | 3,135,237 | |
| | |
Customers Bancorp, Inc.(a) | | | 84,000 | | | | 2,058,840 | |
| | |
FCB Financial Holdings, Inc.,
Class A(a) | | | 57,224 | | | | 1,887,248 | |
| | |
First Midwest Bancorp, Inc. | | | 279,852 | | | | 4,936,589 | |
| | |
FirstMerit Corp. | | | 158,000 | | | | 2,837,680 | |
| | |
Fulton Financial Corp. | | | 331,606 | | | | 4,032,329 | |
| | |
Great Western Bancorp, Inc. | | | 71,317 | | | | 1,795,049 | |
| | |
Hancock Holding Co. | | | 144,352 | | | | 4,053,404 | |
| | |
Hilltop Holdings, Inc.(a) | | | 108,700 | | | | 2,244,655 | |
| | |
Independent Bank Corp. | | | 76,400 | | | | 3,460,156 | |
| | |
LegacyTexas Financial Group, Inc. | | | 60,600 | | | | 1,716,192 | |
| | |
National Penn Bancshares, Inc. | | | 434,431 | | | | 5,219,688 | |
| | |
Old National Bancorp | | | 338,624 | | | | 4,673,011 | |
| | |
PrivateBancorp, Inc. | | | 89,400 | | | | 3,383,790 | |
| | | | | | | | |
| Common Stocks (continued) | |
| Issuer | | Shares | | | Value ($) | |
Prosperity Bancshares, Inc. | | | 21,500 | | | | 1,110,905 | |
| | |
Renasant Corp. | | | 119,300 | | | | 3,738,862 | |
| | |
Sandy Spring Bancorp, Inc. | | | 245,662 | | | | 6,306,144 | |
| | |
Sterling Bancorp | | | 242,200 | | | | 3,398,066 | |
| | |
Umpqua Holdings Corp. | | | 164,100 | | | | 2,742,111 | |
| | |
Union Bankshares Corp. | | | 135,800 | | | | 3,204,880 | |
| | |
WesBanco, Inc. | | | 106,592 | | | | 3,281,968 | |
| | |
Western Alliance Bancorp(a) | | | 109,900 | | | | 3,354,148 | |
| | |
Wilshire Bancorp, Inc. | | | 250,200 | | | | 2,672,136 | |
| | |
Wintrust Financial Corp. | | | 60,100 | | | | 3,065,100 | |
| | | | | | | | | |
Total | | | | | | | 93,568,270 | |
|
Capital Markets 0.7% | |
| | |
Triplepoint Venture Growth BDC Corp. | | | 37,666 | | | | 448,978 | |
| | |
Virtu Financial, Inc. Class A | | | 93,700 | | | | 2,205,698 | |
| | |
Westwood Holdings Group, Inc. | | | 108,700 | | | | 6,033,937 | |
| | |
WisdomTree Investments, Inc. | | | 67,077 | | | | 1,257,694 | |
| | | | | | | | | |
Total | | | | | | | 9,946,307 | |
|
Diversified Financial Services 0.1% | |
| | |
AgroFresh Solutions, Inc.(a) | | | 146,452 | | | | 1,427,907 | |
|
Insurance 3.0% | |
| | |
American Equity Investment Life Holding Co. | | | 231,390 | | | | 5,613,521 | |
| | |
AMERISAFE, Inc. | | | 70,300 | | | | 3,285,822 | |
| | |
Amtrust Financial Services, Inc. | | | 42,000 | | | | 2,442,300 | |
| | |
Argo Group International Holdings Ltd. | | | 65,500 | | | | 3,666,690 | |
| | |
CNO Financial Group, Inc. | | | 150,800 | | | | 2,697,812 | |
| | |
Crawford & Co., Class B | | | 225,299 | | | | 1,437,408 | |
| | |
First American Financial Corp. | | | 184,728 | | | | 7,178,530 | |
| | |
Horace Mann Educators Corp. | | | 101,563 | | | | 3,373,923 | |
| | |
Maiden Holdings Ltd. | | | 218,244 | | | | 3,127,437 | |
| | |
National General Holdings Corp. | | | 82,573 | | | | 1,513,563 | |
| | |
Symetra Financial Corp. | | | 91,000 | | | | 2,863,770 | |
| | |
United Fire Group, Inc. | | | 87,551 | | | | 2,906,693 | |
| | | | | | | | | |
Total | | | | | | | 40,107,469 | |
|
Real Estate Investment Trusts (REITs) 4.1% | |
| | |
American Assets Trust, Inc. | | | 84,100 | | | | 3,239,532 | |
| | |
BioMed Realty Trust, Inc. | | | 232,950 | | | | 4,309,575 | |
| | |
Brandywine Realty Trust | | | 519,563 | | | | 6,297,103 | |
| | |
Chatham Lodging Trust | | | 37,000 | | | | 849,150 | |
| | |
Colony Capital, Inc. | | | 226,036 | | | | 4,907,242 | |
| | |
Cousins Properties, Inc. | | | 284,380 | | | | 2,607,765 | |
| | |
CubeSmart | | | 122,400 | | | | 3,095,496 | |
The accompanying Notes to Financial Statements are an integral part of this statement.
| | |
| |
| ACTIVE PORTFOLIOS® MULTI-MANAGER SMALL CAP EQUITY FUND | | |
PORTFOLIO OF INVESTMENTS (continued)
August 31, 2015
| | | | | | | | |
| Common Stocks (continued) | |
| Issuer | | Shares | | | Value ($) | |
First Industrial Realty Trust, Inc. | | | 135,000 | | | | 2,617,650 | |
| | |
Geo Group, Inc. (The) | | | 22,741 | | | | 682,912 | |
| | |
Hersha Hospitality Trust | | | 183,741 | | | | 4,490,630 | |
| | |
Highwoods Properties, Inc. | | | 65,000 | | | | 2,466,100 | |
| | |
Kilroy Realty Corp. | | | 33,700 | | | | 2,185,782 | |
| | |
Kite Realty Group Trust | | | 188,914 | | | | 4,441,368 | |
| | |
LaSalle Hotel Properties | | | 39,000 | | | | 1,226,940 | |
| | |
Mack-Cali Realty Corp. | | | 95,000 | | | | 1,779,350 | |
| | |
RLJ Lodging Trust | | | 50,000 | | | | 1,377,000 | |
| | |
Sovran Self Storage, Inc. | | | 17,773 | | | | 1,594,771 | |
| | |
Strategic Hotels & Resorts, Inc.(a) | | | 107,000 | | | | 1,443,430 | |
| | |
Sun Communities, Inc. | | | 79,080 | | | | 5,156,807 | |
| | | | | | | | | |
Total | | | | | | | 54,768,603 | |
|
Real Estate Management & Development 0.3% | |
| | |
Kennedy-Wilson Holdings, Inc. | | | 171,032 | | | | 4,097,927 | |
|
Thrifts & Mortgage Finance 1.9% | |
| | |
BofI Holding, Inc.(a) | | | 18,564 | | | | 2,150,454 | |
| | |
EverBank Financial Corp. | | | 150,900 | | | | 2,984,802 | |
| | |
HomeStreet, Inc.(a) | | | 80,804 | | | | 1,798,697 | |
| | |
LendingTree, Inc.(a) | | | 16,260 | | | | 1,722,747 | |
| | |
MGIC Investment Corp.(a) | | | 165,300 | | | | 1,745,568 | |
| | |
Provident Financial Services, Inc. | | | 270,744 | | | | 5,127,891 | |
| | |
Radian Group, Inc. | | | 557,995 | | | | 10,032,750 | |
| | | | | | | | | |
Total | | | | | | | 25,562,909 | |
| | | | | | | | | |
Total Financials | | | | | | | 229,479,392 | |
| | |
| | | | | | | | |
HEALTH CARE 14.8% | |
Biotechnology 3.4% | |
| | |
Agenus, Inc.(a) | | | 230,375 | | | | 1,637,966 | |
| | |
Amicus Therapeutics, Inc.(a) | | | 146,798 | | | | 2,110,955 | |
| | |
BioSpecifics Technologies Corp.(a) | | | 34,464 | | | | 1,711,482 | |
| | |
Bluebird Bio, Inc.(a) | | | 9,718 | | | | 1,293,174 | |
| | |
Cara Therapeutics, Inc.(a) | | | 94,320 | | | | 1,788,307 | |
| | |
Cepheid(a) | | | 39,687 | | | | 1,934,344 | |
| | |
Clovis Oncology, Inc.(a) | | | 27,334 | | | | 2,128,225 | |
| | |
Dynavax Technologies Corp.(a) | | | 85,113 | | | | 2,413,805 | |
| | |
Eagle Pharmaceuticals, Inc.(a) | | | 22,766 | | | | 1,788,269 | |
| | |
Ligand Pharmaceuticals, Inc.(a) | | | 65,484 | | | | 6,020,599 | |
| | |
Momenta Pharmaceuticals, Inc.(a) | | | 63,950 | | | | 1,247,665 | |
| | |
Neurocrine Biosciences, Inc.(a) | | | 40,460 | | | | 1,876,535 | |
| | |
Novavax, Inc.(a) | | | 201,959 | | | | 2,175,099 | |
| | |
Ophthotech Corp.(a) | | | 29,309 | | | | 1,290,475 | |
| | |
Progenics Pharmaceuticals, Inc.(a) | | | 202,736 | | | | 1,486,055 | |
| | |
Prothena Corp. PLC(a) | | | 40,136 | | | | 2,309,024 | |
| | | | | | | | |
| Common Stocks (continued) | |
| Issuer | | Shares | | | Value ($) | |
Repligen Corp.(a) | | | 145,250 | | | | 4,950,120 | |
| | |
Sage Therapeutics, Inc.(a) | | | 26,643 | | | | 1,438,989 | |
| | |
Synergy Pharmaceuticals, Inc.(a) | | | 266,154 | | | | 1,863,078 | |
| | |
TESARO, Inc.(a) | | | 22,134 | | | | 1,139,458 | |
| | |
TG Therapeutics, Inc.(a) | | | 114,134 | | | | 1,401,566 | |
| | |
ZIOPHARM Oncology, Inc.(a) | | | 160,355 | | | | 1,396,692 | |
| | | | | | | | | |
Total | | | | | | | 45,401,882 | |
|
Health Care Equipment & Supplies 4.8% | |
| | |
Abaxis, Inc. | | | 53,925 | | | | 2,535,553 | |
| | |
ABIOMED, Inc.(a) | | | 20,758 | | | | 1,990,692 | |
| | |
Align Technology, Inc.(a) | | | 87,800 | | | | 4,969,480 | |
| | |
Analogic Corp. | | | 53,565 | | | | 4,316,268 | |
| | |
AtriCure, Inc.(a) | | | 77,111 | | | | 1,886,135 | |
| | |
Cantel Medical Corp. | | | 157,350 | | | | 7,809,280 | |
| | |
Globus Medical, Inc., Class A(a) | | | 115,000 | | | | 2,808,300 | |
| | |
Greatbatch, Inc.(a) | | | 31,408 | | | | 1,784,603 | |
| | |
Hill-Rom Holdings, Inc. | | | 33,938 | | | | 1,793,284 | |
| | |
LDR Holding Corp.(a) | | | 54,577 | | | | 2,036,814 | |
| | |
Masimo Corp.(a) | | | 47,440 | | | | 1,927,487 | |
| | |
Merit Medical Systems, Inc.(a) | | | 265,510 | | | | 6,040,352 | |
| | |
Neogen Corp.(a) | | | 163,662 | | | | 8,451,506 | |
| | |
Nevro Corp.(a) | | | 42,503 | | | | 1,913,910 | |
| | |
NxStage Medical, Inc.(a) | | | 103,576 | | | | 1,799,115 | |
| | |
Rockwell Medical, Inc.(a) | | | 115,577 | | | | 1,383,457 | |
| | |
Syneron Medical Ltd.(a) | | | 419,751 | | | | 3,962,449 | |
| | |
Vascular Solutions, Inc.(a) | | | 156,107 | | | | 5,395,058 | |
| | |
Zeltiq Aesthetics, Inc.(a) | | | 52,636 | | | | 1,698,564 | |
| | | | | | | | | |
Total | | | | | | | 64,502,307 | |
|
Health Care Providers & Services 2.9% | |
| | |
Acadia Healthcare Co., Inc.(a) | | | 26,538 | | | | 1,938,070 | |
| | |
Adeptus Health, Inc., Class A(a) | | | 18,139 | | | | 1,807,370 | |
| | |
AMN Healthcare Services, Inc.(a) | | | 76,381 | | | | 2,566,402 | |
| | |
Amsurg Corp.(a) | | | 31,873 | | | | 2,499,481 | |
| | |
Kindred Healthcare, Inc. | | | 102,000 | | | | 2,048,160 | |
| | |
LHC Group, Inc.(a) | | | 56,600 | | | | 2,450,780 | |
| | |
LifePoint Health, Inc.(a) | | | 55,853 | | | | 4,363,795 | |
| | |
Molina Healthcare, Inc.(a) | | | 95,004 | | | | 7,086,348 | |
| | |
National Research Corp., Class A | | | 199,500 | | | | 2,543,625 | |
| | |
National Research Corp., Class B | | | 92,579 | | | | 3,042,146 | |
| | |
PharMerica Corp.(a) | | | 101,000 | | | | 3,304,720 | |
| | |
U.S. Physical Therapy, Inc. | | | 37,559 | | | | 1,725,836 | |
| | |
VCA, Inc.(a) | | | 68,000 | | | | 3,765,840 | |
| | | | | | | | | |
Total | | | | | | | 39,142,573 | |
The accompanying Notes to Financial Statements are an integral part of this statement.
| | |
| |
| | ACTIVE PORTFOLIOS® MULTI-MANAGER SMALL CAP EQUITY FUND |
PORTFOLIO OF INVESTMENTS (continued)
August 31, 2015
| | | | | | | | |
| Common Stocks (continued) | |
| Issuer | | Shares | | | Value ($) | |
Health Care Technology 1.7% | |
| | |
HealthStream, Inc.(a) | | | 242,375 | | | | 6,023,019 | |
| | |
MedAssets, Inc.(a) | | | 65,000 | | | | 1,372,800 | |
| | |
Medidata Solutions, Inc.(a) | | | 117,369 | | | | 5,636,059 | |
| | |
Omnicell, Inc.(a) | | | 297,400 | | | | 10,105,652 | |
| | | | | | | | | |
Total | | | | | | | 23,137,530 | |
|
Life Sciences Tools & Services 0.7% | |
| | |
Bio-Rad Laboratories, Inc., Class A(a) | | | 13,402 | | | | 1,867,301 | |
| | |
Bio-Techne Corp. | | | 30,400 | | | | 2,872,192 | |
| | |
Cambrex Corp.(a) | | | 45,621 | | | | 2,181,140 | |
| | |
PAREXEL International Corp.(a) | | | 33,000 | | | | 2,168,760 | |
| | | | | | | | | |
Total | | | | | | | 9,089,393 | |
|
Pharmaceuticals 1.3% | |
| | |
Catalent, Inc.(a) | | | 108,700 | | | | 3,455,573 | |
| | |
Cempra, Inc.(a) | | | 40,341 | | | | 1,387,730 | |
| | |
Intersect ENT, Inc.(a) | | | 66,921 | | | | 1,703,809 | |
| | |
Intra-Cellular Therapies, Inc.(a) | | | 57,002 | | | | 1,527,084 | |
| | |
Lipocine, Inc.(a) | | | 120,867 | | | | 1,779,162 | |
| | |
Medicines Co. (The)(a) | | | 44,178 | | | | 1,811,298 | |
| | |
Supernus Pharmaceuticals, Inc.(a) | | | 102,576 | | | | 1,861,754 | |
| | |
Tetraphase Pharmaceuticals, Inc.(a) | | | 36,641 | | | | 1,590,586 | |
| | |
Zogenix, Inc.(a) | | | 110,328 | | | | 2,120,504 | |
| | | | | | | | | |
Total | | | | | | | 17,237,500 | |
| | | | | | | | | |
Total Health Care | | | | | | | 198,511,185 | |
| | |
| | | | | | | | |
INDUSTRIALS 11.8% | | | | | | | | |
Aerospace & Defense 0.1% | |
| | |
Hexcel Corp. | | | 36,614 | | | | 1,766,992 | |
|
Air Freight & Logistics 0.1% | |
| | |
XPO Logistics, Inc.(a) | | | 47,033 | | | | 1,650,858 | |
| | |
Airlines 0.3% | | | | | | | | |
| | |
Alaska Air Group, Inc. | | | 20,700 | | | | 1,549,602 | |
| | |
JetBlue Airways Corp.(a) | | | 78,000 | | | | 1,740,960 | |
| | | | | | | | | |
Total | | | | | | | 3,290,562 | |
|
Building Products 1.9% | |
| | |
AAON, Inc. | | | 435,750 | | | | 9,011,310 | |
| | |
Apogee Enterprises, Inc. | | | 32,403 | | | | 1,689,816 | |
| | |
Builders FirstSource, Inc.(a) | | | 177,731 | | | | 2,632,196 | |
| | |
Patrick Industries, Inc.(a) | | | 33,610 | | | | 1,270,122 | |
| | |
Simpson Manufacturing Co., Inc. | | | 198,525 | | | | 6,930,508 | |
| | |
Trex Co., Inc.(a) | | | 109,125 | | | | 4,235,141 | |
| | | | | | | | | |
Total | | | | | | | 25,769,093 | |
| | | | | | | | |
| Common Stocks (continued) | |
| Issuer | | Shares | | | Value ($) | |
Commercial Services & Supplies 2.4% | |
| | |
ABM Industries, Inc. | | | 65,800 | | | | 2,106,258 | |
| | |
Deluxe Corp. | | | 50,200 | | | | 2,912,102 | |
| | |
Essendant, Inc. | | | 4,061 | | | | 140,105 | |
| | |
Healthcare Services Group, Inc. | | | 165,350 | | | | 5,529,304 | |
| | |
Interface, Inc. | | | 92,627 | | | | 2,245,278 | |
| | |
Knoll, Inc. | | | 74,332 | | | | 1,778,021 | |
| | |
Mobile Mini, Inc. | | | 146,850 | | | | 4,994,369 | |
| | |
Rollins, Inc. | | | 164,925 | | | | 4,604,706 | |
| | |
Steelcase, Inc., Class A | | | 341,948 | | | | 6,028,543 | |
| | |
West Corp. | | | 95,800 | | | | 2,331,772 | |
| | | | | | | | | |
Total | | | | | | | 32,670,458 | |
|
Construction & Engineering 1.1% | |
| | |
Comfort Systems U.S.A., Inc. | | | 63,011 | | | | 1,746,665 | |
| | |
Dycom Industries, Inc.(a) | | | 30,889 | | | | 2,195,899 | |
| | |
EMCOR Group, Inc. | | | 159,521 | | | | 7,352,323 | |
| | |
MYR Group, Inc.(a) | | | 58,007 | | | | 1,664,221 | |
| | |
Tutor Perini Corp.(a) | | | 75,678 | | | | 1,339,500 | |
| | | | | | | | | |
Total | | | | | | | 14,298,608 | |
|
Electrical Equipment 0.3% | |
| | |
Acuity Brands, Inc. | | | 10,410 | | | | 2,028,597 | |
| | |
Energy Focus, Inc.(a) | | | 80,111 | | | | 1,754,431 | |
| | | | | | | | | |
Total | | | | | | | 3,783,028 | |
|
Industrial Conglomerates 0.2% | |
| | |
Raven Industries, Inc. | | | 150,716 | | | | 2,730,974 | |
|
Machinery 2.4% | |
| | |
Global Brass & Copper Holdings, Inc. | | | 320,081 | | | | 6,286,391 | |
| | |
John Bean Technologies Corp. | | | 59,180 | | | | 1,960,042 | |
| | |
LB Foster Co., Class A | | | 80,647 | | | | 1,446,001 | |
| | |
Mueller Industries, Inc. | | | 131,092 | | | | 4,170,036 | |
| | |
Proto Labs, Inc.(a) | | | 116,400 | | | | 8,477,412 | |
| | |
Sun Hydraulics Corp. | | | 206,400 | | | | 6,658,464 | |
| | |
Trinity Industries, Inc. | | | 68,900 | | | | 1,859,611 | |
| | |
Wabash National Corp.(a) | | | 127,237 | | | | 1,556,108 | |
| | | | | | | | | |
Total | | | | | | | 32,414,065 | |
|
Professional Services 1.6% | |
| | |
Advisory Board Co. (The)(a) | | | 129,360 | | | | 6,290,777 | |
| | |
Kforce, Inc. | | | 79,361 | | | | 2,126,081 | |
| | |
Korn/Ferry International | | | 126,506 | | | | 4,310,059 | |
| | |
On Assignment, Inc.(a) | | | 84,000 | | | | 3,022,320 | |
| | |
TrueBlue, Inc.(a) | | | 238,363 | | | | 5,720,712 | |
| | | | | | | | | |
Total | | | | | | | 21,469,949 | |
The accompanying Notes to Financial Statements are an integral part of this statement.
| | |
| |
| ACTIVE PORTFOLIOS® MULTI-MANAGER SMALL CAP EQUITY FUND | | |
PORTFOLIO OF INVESTMENTS (continued)
August 31, 2015
| | | | | | | | |
| Common Stocks (continued) | |
| Issuer | | Shares | | | Value ($) | |
Road & Rail 0.8% | |
| | |
Knight Transportation, Inc. | | | 147,467 | | | | 4,011,103 | |
| | |
Old Dominion Freight Line, Inc.(a) | | | 80,590 | | | | 5,358,429 | |
| | |
Swift Transportation Co.(a) | | | 65,000 | | | | 1,266,850 | |
| | | | | | | | | |
Total | | | | | | | 10,636,382 | |
|
Trading Companies & Distributors 0.6% | |
| | |
Beacon Roofing Supply, Inc.(a) | | | 142,095 | | | | 5,150,944 | |
| | |
Neff Corp. Class A(a) | | | 120,815 | | | | 796,171 | |
| | |
Watsco, Inc. | | | 14,574 | | | | 1,784,732 | |
| | | | | | | | | |
Total | | | | | | | 7,731,847 | |
| | | | | | | | | |
Total Industrials | | | | | | | 158,212,816 | |
| | |
| | | | | | | | |
INFORMATION TECHNOLOGY 16.1% | | | | | | | | |
Communications Equipment 0.9% | |
| | |
Applied Optoelectronics, Inc.(a) | | | 124,355 | | | | 2,562,957 | |
| | |
Ciena Corp.(a) | | | 72,610 | | | | 1,623,560 | |
| | |
CommScope Holding Co., Inc.(a) | | | 53,727 | | | | 1,738,068 | |
| | |
Infinera Corp.(a) | | | 92,298 | | | | 2,013,942 | |
| | |
Netscout Systems, Inc.(a) | | | 101,267 | | | | 3,701,309 | |
| | | | | | | | | |
Total | | | | | | | 11,639,836 | |
|
Electronic Equipment, Instruments & Components 1.2% | |
| | |
II-VI, Inc.(a) | | | 155,000 | | | | 2,617,950 | |
| | |
Mesa Laboratories, Inc. | | | 71,517 | | | | 7,752,443 | |
| | |
Rogers Corp.(a) | | | 116,100 | | | | 6,462,126 | |
| | | | | | | | | |
Total | | | | | | | 16,832,519 | |
|
Internet Software & Services 3.3% | |
| | |
comScore, Inc.(a) | | | 31,336 | | | | 1,636,053 | |
| | |
CoStar Group, Inc.(a) | | | 28,325 | | | | 5,014,658 | |
| | |
Endurance International Group Holdings, Inc.(a) | | | 67,700 | | | | 1,035,133 | |
| | |
j2 Global, Inc. | | | 25,877 | | | | 1,800,522 | |
| | |
LogMeIn, Inc.(a) | | | 33,230 | | | | 2,071,558 | |
| | |
NIC, Inc. | | | 343,400 | | | | 6,469,656 | |
| | |
Q2 Holdings, Inc.(a) | | | 75,691 | | | | 1,980,076 | |
| | |
SciQuest, Inc.(a) | | | 281,650 | | | | 3,092,517 | |
| | |
SPS Commerce, Inc.(a) | | | 169,443 | | | | 11,525,513 | |
| | |
Stamps.com, Inc.(a) | | | 112,750 | | | | 9,283,835 | |
| | | | | | | | | |
Total | | | | | | | 43,909,521 | |
|
IT Services 0.6% | |
| | |
CACI International, Inc., Class A(a) | | | 51,860 | | | | 4,066,861 | |
| | |
Euronet Worldwide, Inc.(a) | | | 34,299 | | | | 2,211,257 | |
| | |
MAXIMUS, Inc. | | | 22,457 | | | | 1,359,771 | |
| | | | | | | | | |
Total | | | | | | | 7,637,889 | |
| | | | | | | | |
| Common Stocks (continued) | |
| Issuer | | Shares | | | Value ($) | |
Semiconductors & Semiconductor Equipment 2.4% | |
| | |
Advanced Energy Industries, Inc.(a) | | | 66,394 | | | | 1,611,382 | |
| | |
Cavium, Inc.(a) | | | 20,437 | | | | 1,390,125 | |
| | |
Cirrus Logic, Inc.(a) | | | 61,150 | | | | 1,844,284 | |
| | |
Cypress Semiconductor Corp. | | | 167,000 | | | | 1,670,000 | |
| | |
Fairchild Semiconductor International, Inc.(a) | | | 90,000 | | | | 1,224,000 | |
| | |
Inphi Corp.(a) | | | 94,320 | | | | 2,239,157 | |
| | |
Integrated Device Technology, Inc.(a) | | | 211,418 | | | | 4,014,828 | |
| | |
IXYS Corp. | | | 115,800 | | | | 1,365,282 | |
| | |
Kulicke & Soffa Industries, Inc.(a) | | | 171,675 | | | | 1,812,888 | |
| | |
MaxLinear, Inc., Class A(a) | | | 183,409 | | | | 1,824,919 | |
| | |
NeoPhotonics Corp.(a) | | | 185,169 | | | | 1,340,624 | |
| | |
NVE Corp. | | | 71,075 | | | | 3,732,859 | |
| | |
Photronics, Inc.(a) | | | 190,064 | | | | 1,731,483 | |
| | |
Rudolph Technologies, Inc.(a) | | | 189,421 | | | | 2,417,012 | |
| | |
Sigma Designs, Inc.(a) | | | 209,818 | | | | 2,066,707 | |
| | |
Silicon Laboratories, Inc.(a) | | | 34,602 | | | | 1,504,495 | |
| | | | | | | | | |
Total | | | | | | | 31,790,045 | |
|
Software 7.4% | |
| | |
ACI Worldwide, Inc.(a) | | | 355,000 | | | | 7,572,150 | |
| | |
AVG Technologies NV(a) | | | 255,452 | | | | 5,908,605 | |
| | |
Blackbaud, Inc. | | | 148,025 | | | | 8,458,149 | |
| | |
Bottomline Technologies de, Inc.(a) | | | 296,500 | | | | 7,928,410 | |
| | |
BroadSoft, Inc.(a) | | | 56,072 | | | | 1,769,632 | |
| | |
Ellie Mae, Inc.(a) | | | 34,362 | | | | 2,488,840 | |
| | |
Exa Corp.(a) | | | 281,607 | | | | 3,094,861 | |
| | |
Fair Isaac Corp. | | | 15,317 | | | | 1,310,676 | |
| | |
FleetMatics Group PLC(a) | | | 155,900 | | | | 6,978,084 | |
| | |
Gigamon, Inc.(a) | | | 74,589 | | | | 1,699,137 | |
| | |
Guidewire Software, Inc.(a) | | | 42,025 | | | | 2,349,618 | |
| | |
HubSpot, Inc.(a) | | | 45,665 | | | | 2,159,498 | |
| | |
Imperva, Inc.(a) | | | 36,356 | | | | 2,166,090 | |
| | |
Infoblox, Inc.(a) | | | 71,877 | | | | 1,382,913 | |
| | |
Mentor Graphics Corp. | | | 112,600 | | | | 2,909,584 | |
| | |
MicroStrategy, Inc., Class A(a) | | | 8,762 | | | | 1,741,009 | |
| | |
Paycom Software, Inc.(a) | | | 66,597 | | | | 2,566,648 | |
| | |
Pegasystems, Inc. | | | 156,344 | | | | 3,831,991 | |
| | |
Proofpoint, Inc.(a) | | | 38,488 | | | | 2,168,414 | |
| | |
PROS Holdings, Inc.(a) | | | 346,423 | | | | 7,662,877 | |
| | |
PTC, Inc.(a) | | | 128,698 | | | | 4,262,478 | |
| | |
QLIK Technologies, Inc.(a) | | | 39,037 | | | | 1,477,941 | |
| | |
RingCentral, Inc., Class A(a) | | | 129,098 | | | | 2,221,777 | |
| | |
Rubicon Project, Inc. (The)(a) | | | 99,583 | | | | 1,433,995 | |
The accompanying Notes to Financial Statements are an integral part of this statement.
| | |
| |
| | ACTIVE PORTFOLIOS® MULTI-MANAGER SMALL CAP EQUITY FUND |
PORTFOLIO OF INVESTMENTS (continued)
August 31, 2015
| | | | | | | | |
| Common Stocks (continued) | |
| Issuer | | Shares | | | Value ($) | |
Tableau Software, Inc., Class A(a) | | | 13,267 | | | | 1,249,353 | |
| | |
Take-Two Interactive Software, Inc.(a) | | | 46,000 | | | | 1,339,980 | |
| | |
Tyler Technologies, Inc.(a) | | | 59,875 | | | | 8,265,145 | |
| | |
Ultimate Software Group, Inc. (The)(a) | | | 8,688 | | | | 1,530,739 | |
| | |
Verint Systems, Inc.(a) | | | 26,503 | | | | 1,413,405 | |
| | | | | | | | | |
Total | | | | | | | 99,341,999 | |
|
Technology Hardware, Storage & Peripherals 0.3% | |
| | |
Immersion Corp.(a) | | | 161,874 | | | | 1,876,119 | |
| | |
Nimble Storage, Inc.(a) | | | 60,424 | | | | 1,610,904 | |
| | |
Super Micro Computer, Inc.(a) | | | 52,900 | | | | 1,446,815 | |
| | | | | | | | | |
Total | | | | | | | 4,933,838 | |
| | | | | | | | | |
Total Information Technology | | | | | | | 216,085,647 | |
| | |
| | | | | | | | |
MATERIALS 3.0% | |
Chemicals 1.6% | |
| | |
A. Schulman, Inc. | | | 118,888 | | | | 4,081,425 | |
| | |
Balchem Corp. | | | 118,450 | | | | 6,932,878 | |
| | |
Cytec Industries, Inc. | | | 58,480 | | | | 4,339,216 | |
| | |
Orion Engineered Carbons SA | | | 263,730 | | | | 4,325,172 | |
| | |
Sensient Technologies Corp. | | | 26,018 | | | | 1,695,073 | |
| | | | | | | | | |
Total | | | | | | | 21,373,764 | |
|
Construction Materials 0.2% | |
| | |
US Concrete, Inc.(a) | | | 61,600 | | | | 3,189,648 | |
|
Metals & Mining 0.6% | |
| | |
Carpenter Technology Corp. | | | 48,193 | | | | 1,879,527 | |
| | |
Kaiser Aluminum Corp. | | | 50,929 | | | | 4,256,646 | |
| | |
Materion Corp. | | | 63,500 | | | | 1,965,960 | |
| | | | | | | | | |
Total | | | | | | | 8,102,133 | |
|
Paper & Forest Products 0.6% | |
| | |
Clearwater Paper Corp.(a) | | | 66,662 | | | | 3,737,072 | |
| | |
KapStone Paper and Packaging Corp. | | | 31,000 | | | | 675,490 | |
| | |
Neenah Paper, Inc. | | | 48,900 | | | | 2,822,508 | |
| | | | | | | | | |
Total | | | | | | | 7,235,070 | |
| | | | | | | | | |
Total Materials | | | | | | | 39,900,615 | |
| | |
| | | | | | | | |
TELECOMMUNICATION SERVICES 0.1% | |
Wireless Telecommunication Services 0.1% | |
| | |
Boingo Wireless, Inc.(a) | | | 192,116 | | | | 1,450,476 | |
| | | | | | | | | |
Total Telecommunication Services | | | | | | | 1,450,476 | |
| | | | | | | | |
| Common Stocks (continued) | |
| Issuer | | Shares | | | Value ($) | |
UTILITIES 2.1% | |
Electric Utilities 0.4% | |
| | |
Portland General Electric Co. | | | 161,299 | | | | 5,571,268 | |
|
Gas Utilities 0.6% | |
| | |
New Jersey Resources Corp. | | | 96,000 | | | | 2,713,920 | |
| | |
South Jersey Industries, Inc. | | | 97,124 | | | | 2,340,688 | |
| | |
Southwest Gas Corp. | | | 56,000 | | | | 3,085,040 | |
| | | | | | | | | |
Total | | | | | | | 8,139,648 | |
|
Independent Power and Renewable Electricity Producers —% | |
| | |
TerraForm Power, Inc., Class A | | | 15,700 | | | | 353,250 | |
|
Multi-Utilities 1.1% | |
| | |
Avista Corp. | | | 268,811 | | | | 8,437,977 | |
| | |
Vectren Corp. | | | 133,950 | | | | 5,388,809 | |
| | | | | | | | | |
Total | | | | | | | 13,826,786 | |
| | | | | | | | | |
Total Utilities | | | | | | | 27,890,952 | |
| | | | | | | | | |
Total Common Stocks | | | | | | | | |
(Cost: $995,042,795) | | | | | | | 1,046,494,390 | |
| | |
| | | | | | | | |
| Exchange-Traded Funds 9.7% | |
Vanguard Russell 2000 ETF | | | 183,409 | | | | 17,031,360 | |
| | |
iShares Russell 2000 ETF | | | 560,883 | | | | 64,613,722 | |
| | |
iShares Russell 2000 Value ETF | | | 512,475 | | | | 48,018,907 | |
| | | | | | | | | |
Total Exchange-Traded Funds | | | | | | | | |
(Cost: $140,734,306) | | | | | | | 129,663,989 | |
| | |
| | | | | | | | |
| Money Market Funds 12.1% | |
| | | Shares | | | Value ($) | |
| | |
Columbia Short-Term Cash Fund, 0.150%(b)(c) | | | 162,568,889 | | | | 162,568,889 | |
| | | | | | | | | |
Total Money Market Funds | | | | | | | | |
(Cost: $162,568,889) | | | | | | | 162,568,889 | |
| | | | | | | | | |
Total Investments | | | | | | | | |
(Cost: $1,298,345,990) | | | | | | | 1,338,727,268 | |
| | | | | | | | | |
Other Assets & Liabilities, Net | | | | | | | 1,547,345 | |
| | | | | | | | | |
Net Assets | | | | | | | 1,340,274,613 | |
| | | | | | | | | |
The accompanying Notes to Financial Statements are an integral part of this statement.
| | |
| |
| ACTIVE PORTFOLIOS® MULTI-MANAGER SMALL CAP EQUITY FUND | | |
PORTFOLIO OF INVESTMENTS (continued)
August 31, 2015
At August 31, 2015, cash totaling $5,681,400 was pledged as collateral.
Investments in Derivatives
Futures Contracts Outstanding at August 31, 2015
Long Futures Contracts Outstanding
| | | | | | | | | | | | | | | | | | | | | | | | |
| Contract Description | | Number of
Contracts | | | Trading
Currency | | | Notional Market
Value ($) | | | Expiration Date | | | Unrealized
Appreciation ($) | | | Unrealized
Depreciation ($) | |
RUSSELL 2000 MINI | | | 1,114 | | | | USD | | | | 128,945,500 | | | | 09/2015 | | | | — | | | | (12,077,786 | ) |
Notes to Portfolio of Investments
| (a) | Non-income producing investment. |
| (b) | The rate shown is the seven-day current annualized yield at August 31, 2015. |
| (c) | As defined in the Investment Company Act of 1940, an affiliated company is one in which the Fund owns 5% or more of the company’s outstanding voting securities, or a company which is under common ownership or control with the Fund. Holdings and transactions in these affiliated companies during the year ended August 31, 2015 are as follows: |
| | | | | | | | | | | | | | | | | | | | | | | | |
| Issuer | | Beginning
Cost ($) | | | Purchase
Cost ($) | | | Proceeds
From Sales ($) | | | Ending
Cost ($) | | | Dividends —
Affiliated
Issuers ($) | | | Value ($) | |
Columbia Short-Term Cash Fund | | | 17,307,999 | | | | 639,635,244 | | | | (494,374,354 | ) | | | 162,568,889 | | | | 51,201 | | | | 162,568,889 | |
Currency Legend
Fair Value Measurements
The Fund categorizes its fair value measurements according to a three-level hierarchy that maximizes the use of observable inputs and minimizes the use of unobservable inputs by prioritizing that the most observable input be used when available. Observable inputs are those that market participants would use in pricing an investment based on market data obtained from sources independent of the reporting entity. Unobservable inputs are those that reflect the Fund’s assumptions about the information market participants would use in pricing an investment. An investment’s level within the fair value hierarchy is based on the lowest level of any input that is deemed significant to the asset’s or liability’s fair value measurement. The input levels are not necessarily an indication of the risk or liquidity associated with investments at that level. For example, certain U.S. government securities are generally high quality and liquid, however, they are reflected as Level 2 because the inputs used to determine fair value may not always be quoted prices in an active market.
Fair value inputs are summarized in the three broad levels listed below:
| n | | Level 1 — Valuations based on quoted prices for investments in active markets that the Fund has the ability to access at the measurement date (including NAV for open-end mutual funds). Valuation adjustments are not applied to Level 1 investments. |
| n | | Level 2 — Valuations based on other significant observable inputs (including quoted prices for similar securities, interest rates, prepayment speeds, credit risks, etc.). |
| n | | Level 3 — Valuations based on significant unobservable inputs (including the Fund’s own assumptions and judgment in determining the fair value of investments). |
Inputs that are used in determining fair value of an investment may include price information, credit data, volatility statistics, and other factors. These inputs can be either observable or unobservable. The availability of observable inputs can vary between investments, and is affected by various factors such as the type of investment, and the volume and level of activity for that investment or similar investments in the marketplace. The inputs will be considered by the Investment Manager, along with any other relevant factors in the calculation of an investment’s fair value. The Fund uses prices and inputs that are current as of the measurement date, which may include periods of market dislocations. During these periods, the availability of prices and inputs may be reduced for many investments. This condition could cause an investment to be reclassified between the various levels within the hierarchy.
Investments falling into the Level 3 category are primarily supported by quoted prices from brokers and dealers participating in the market for those investments. However, these may be classified as Level 3 investments due to lack of market transparency and corroboration to support these quoted prices. Additionally, valuation models may be used as the pricing source for any remaining investments classified as Level 3. These models may rely on one or more significant unobservable inputs and/or significant assumptions by the Investment Manager. Inputs used in valuations may include, but are not limited to, financial statement analysis, capital account balances, discount rates and estimated cash flows, and comparable company data.
Under the direction of the Fund’s Board of Trustees (the Board), the Investment Manager’s Valuation Committee (the Committee) is responsible for overseeing the valuation procedures approved by the Board. The Committee consists of voting and non-voting members from various groups within the Investment Manager’s organization, including operations and accounting, trading and investments, compliance, risk management and legal.
The Committee meets at least monthly to review and approve valuation matters, which may include a description of specific valuation determinations, data regarding pricing information received from approved pricing vendors and brokers and the results of Board-approved valuation
The accompanying Notes to Financial Statements are an integral part of this statement.
| | |
| |
| | ACTIVE PORTFOLIOS® MULTI-MANAGER SMALL CAP EQUITY FUND |
PORTFOLIO OF INVESTMENTS (continued)
August 31, 2015
Fair Value Measurements (continued)
control policies and procedures (the Policies). The Policies address, among other things, instances when market quotations are or are not readily available, including recommendations of third party pricing vendors and a determination of appropriate pricing methodologies; events that require specific valuation determinations and assessment of fair value techniques; securities with a potential for stale pricing, including those that are illiquid, restricted, or in default; and the effectiveness of third party pricing vendors, including periodic reviews of vendors. The Committee meets more frequently, as needed, to discuss additional valuation matters, which may include the need to review back-testing results, review time-sensitive information or approve related valuation actions. The Committee reports to the Board, with members of the Committee meeting with the Board at each of its regularly scheduled meetings to discuss valuation matters and actions during the period, similar to those described earlier.
For investments categorized as Level 3, the Committee monitors information similar to that described above, which may include: (i) data specific to the issuer or comparable issuers, (ii) general market or specific sector news and (iii) quoted prices and specific or similar security transactions. The Committee considers this data and any changes from prior periods in order to assess the reasonableness of observable and unobservable inputs, any assumptions or internal models used to value those securities and changes in fair value. This data is also used to corroborate, when available, information received from approved pricing vendors and brokers. Various factors impact the frequency of monitoring this information (which may occur as often as daily). However, the Committee may determine that changes to inputs, assumptions and models are not required as a result of the monitoring procedures performed.
The following table is a summary of the inputs used to value the Fund’s investments at August 31, 2015:
| | | | | | | | | | | | | | | | |
| | | Level 1
Quoted Prices in Active
Markets for Identical
Assets ($) | | | Level 2
Other Significant
Observable Inputs ($) | | | Level 3
Significant
Unobservable Inputs ($) | | | Total ($) | |
Investments | | | | | | | | | | | | | | | | |
| | | | |
Common Stocks | | | | | | | | | | | | | | | | |
| | | | |
Consumer Discretionary | | | 124,159,323 | | | | — | | | | — | | | | 124,159,323 | |
| | | | |
Consumer Staples | | | 18,531,488 | | | | — | | | | — | | | | 18,531,488 | |
| | | | |
Energy | | | 32,272,496 | | | | — | | | | — | | | | 32,272,496 | |
| | | | |
Financials | | | 229,479,392 | | | | — | | | | — | | | | 229,479,392 | |
| | | | |
Health Care | | | 198,511,185 | | | | — | | | | — | | | | 198,511,185 | |
| | | | |
Industrials | | | 158,212,816 | | | | — | | | | — | | | | 158,212,816 | |
| | | | |
Information Technology | | | 216,085,647 | | | | — | | | | — | | | | 216,085,647 | |
| | | | |
Materials | | | 39,900,615 | | | | — | | | | — | | | | 39,900,615 | |
| | | | |
Telecommunication Services | | | 1,450,476 | | | | — | | | | — | | | | 1,450,476 | |
| | | | |
Utilities | | | 27,890,952 | | | | — | | | | — | | | | 27,890,952 | |
| | | | | | | | | | | | | | | | | |
Total Common Stocks | | | 1,046,494,390 | | | | — | | | | — | | | | 1,046,494,390 | |
| | | | | | | | | | | | | | | | | |
Exchange-Traded Funds | | | 129,663,989 | | | | — | | | | — | | | | 129,663,989 | |
| | | | |
Money Market Funds | | | — | | | | 162,568,889 | | | | — | | | | 162,568,889 | |
| | | | | | | | | | | | | | | | | |
Total Investments | | | 1,176,158,379 | | | | 162,568,889 | | | | — | | | | 1,338,727,268 | |
| | | | | | | | | | | | | | | | | |
Derivatives | | | | | | | | | | | | | | | | |
| | | | |
Liabilities | | | | | | | | | | | | | | | | |
| | | | |
Futures Contracts | | | (12,077,786 | ) | | | — | | | | — | | | | (12,077,786 | ) |
| | | | | | | | | | | | | | | | | |
Total | | | 1,164,080,593 | | | | 162,568,889 | | | | — | | | | 1,326,649,482 | |
| | | | | | | | | | | | | | | | | |
See the Portfolio of Investments for all investment classifications not indicated in the table.
The Fund’s assets assigned to the Level 2 input category are generally valued using the market approach, in which a security’s value is determined through reference to prices and information from market transactions for similar or identical assets.
Financial assets were transferred from Level 1 to Level 2 as the market for these assets is not considered publicly available. Fund per share market values were obtained using observable market inputs.
The following table shows transfers between Level 1 and Level 2 of the fair value hierarchy:
| | | | | | |
| Transfers In | | Transfers Out |
| Level 1 ($) | | Level 2 ($) | | Level 1 ($) | | Level 2 ($) |
| — | | 17,307,999 | | 17,307,999 | | — |
| | | | | | | |
Transfers between Level 1 and Level 2 are determined based on the fair value at the beginning of the period for security positions held throughout the period.
There were no transfers of financial assets between Levels 2 and 3 during the period.
Derivative instruments are valued at unrealized appreciation (depreciation).
The accompanying Notes to Financial Statements are an integral part of this statement.
| | |
| |
| ACTIVE PORTFOLIOS® MULTI-MANAGER SMALL CAP EQUITY FUND | | |
STATEMENT OF ASSETS AND LIABILITIES
August 31, 2015
| | | | |
Assets | |
| |
Investments, at value | | | | |
| |
Unaffiliated issuers (identified cost $1,135,777,101) | | | $1,176,158,379 | |
| |
Affiliated issuers (identified cost $162,568,889) | | | 162,568,889 | |
| |
Total investments (identified cost $1,298,345,990) | | | 1,338,727,268 | |
| |
Margin deposits | | | 5,681,400 | |
| |
Receivable for: | | | | |
| |
Investments sold | | | 4,739,276 | |
| |
Capital shares sold | | | 3,523,516 | |
| |
Dividends | | | 535,668 | |
| |
Expense reimbursement due from Investment Manager | | | 17,270 | |
| |
Prepaid expenses | | | 9,548 | |
| |
Trustees’ deferred compensation plan | | | 13,966 | |
| |
Total assets | | | 1,353,247,912 | |
| |
| |
Liabilities | | | | |
| |
Payable for: | | | | |
| |
Investments purchased | | | 9,585,882 | |
| |
Capital shares purchased | | | 2,101,918 | |
| |
Variation margin | | | 724,100 | |
| |
Investment management fees | | | 91,441 | |
| |
Distribution and/or service fees | | | 27,612 | |
| |
Transfer agent fees | | | 313,194 | |
| |
Administration fees | | | 8,348 | |
| |
Compensation of board members | | | 406 | |
| |
Chief compliance officer expenses | | | 71 | |
| |
Other expenses | | | 106,361 | |
| |
Trustees’ deferred compensation plan | | | 13,966 | |
| |
Total liabilities | | | 12,973,299 | |
| |
Net assets applicable to outstanding capital stock | | | $1,340,274,613 | |
| |
|
Represented by | |
| |
Paid-in capital | | | $1,278,200,377 | |
| |
Excess of distributions over net investment income | | | (3,145,324 | ) |
| |
Accumulated net realized gain | | | 36,916,068 | |
| |
Unrealized appreciation (depreciation) on: | | | | |
| |
Investments | | | 40,381,278 | |
| |
Futures contracts | | | (12,077,786 | ) |
| |
Total — representing net assets applicable to outstanding capital stock | | | $1,340,274,613 | |
| |
| |
Class A | | | | |
| |
Net assets | | | $1,340,274,613 | |
| |
Shares outstanding | | | 104,794,034 | |
| |
Net asset value per share | | | $12.79 | |
| |
The accompanying Notes to Financial Statements are an integral part of this statement.
| | |
| |
| | ACTIVE PORTFOLIOS® MULTI-MANAGER SMALL CAP EQUITY FUND |
STATEMENT OF OPERATIONS
Year Ended August 31, 2015
| | | | |
Net investment income | | | | |
| |
Income: | | | | |
| |
Dividends — unaffiliated issuers | | | $8,100,249 | |
| |
Dividends — affiliated issuers | | | 51,201 | |
| |
Foreign taxes withheld | | | (40,229 | ) |
| |
Total income | | | 8,111,221 | |
| |
| |
Expenses: | | | | |
| |
Investment management fees | | | 6,947,679 | |
| |
Distribution and/or service fees | | | | |
| |
Class A | | | 2,053,320 | |
| |
Transfer agent fees | | | | |
| |
Class A | | | 2,830,955 | |
| |
Administration fees | | | 638,594 | |
| |
Compensation of board members | | | 29,974 | |
| |
Custodian fees | | | 49,007 | |
| |
Printing and postage fees | | | 209,432 | |
| |
Registration fees | | | 120,595 | |
| |
Professional fees | | | 44,739 | |
| |
Line of credit interest expense | | | 294 | |
| |
Chief compliance officer expenses | | | 363 | |
| |
Other | | | 17,469 | |
| |
Total expenses | | | 12,942,421 | |
| |
Fees waived or expenses reimbursed by Investment Manager and its affiliates | | | (1,694,733 | ) |
| |
Total net expenses | | | 11,247,688 | |
| |
Net investment loss | | | (3,136,467 | ) |
| |
| |
Realized and unrealized gain (loss) — net | | | | |
| |
Net realized gain (loss) on: | | | | |
| |
Investments | | | 38,704,927 | |
| |
Net realized gain | | | 38,704,927 | |
| |
Net change in unrealized appreciation (depreciation) on: | | | | |
| |
Investments | | | (56,442,853 | ) |
| |
Futures contracts | | | (12,077,786 | ) |
| |
Net change in unrealized depreciation | | | (68,520,639 | ) |
| |
Net realized and unrealized loss | | | (29,815,712 | ) |
| |
Net decrease in net assets from operations | | | $(32,952,179 | ) |
| |
The accompanying Notes to Financial Statements are an integral part of this statement.
| | |
| |
| ACTIVE PORTFOLIOS® MULTI-MANAGER SMALL CAP EQUITY FUND | | |
STATEMENT OF CHANGES IN NET ASSETS
| | | | | | | | |
| | | Year Ended
August 31, 2015 | | | Year Ended
August 31, 2014 | |
Operations | | | | | | | | |
| | |
Net investment loss | | | $(3,136,467 | ) | | | $(3,173,957 | ) |
| | |
Net realized gain | | | 38,704,927 | | | | 75,536,134 | |
| | |
Net change in unrealized appreciation (depreciation) | | | (68,520,639 | ) | | | 11,034,502 | |
| |
Net increase (decrease) in net assets resulting from operations | | | (32,952,179 | ) | | | 83,396,679 | |
| |
| | |
Distributions to shareholders | | | | | | | | |
| | |
Net realized gains | | | | | | | | |
| | |
Class A | | | (54,289,860 | ) | | | (39,466,321 | ) |
| |
Total distributions to shareholders | | | (54,289,860 | ) | | | (39,466,321 | ) |
| |
Increase in net assets from capital stock activity | | | 799,416,389 | | | | 13,383,784 | |
| |
Total increase in net assets | | | 712,174,350 | | | | 57,314,142 | |
| | |
Net assets at beginning of year | | | 628,100,263 | | | | 570,786,121 | |
| |
Net assets at end of year | | | $1,340,274,613 | | | | $628,100,263 | |
| |
Excess of distributions over net investment income | | | $(3,145,324 | ) | | | $(12,432 | ) |
| |
The accompanying Notes to Financial Statements are an integral part of this statement.
| | |
| |
| | ACTIVE PORTFOLIOS® MULTI-MANAGER SMALL CAP EQUITY FUND |
STATEMENT OF CHANGES IN NET ASSETS (continued)
| | | | | | | | | | | | | | | | |
| | | Year Ended
August 31, 2015 | | | Year Ended
August 31, 2014 | |
| | | Shares | | | Dollars ($) | | | Shares | | | Dollars ($) | |
Capital stock activity | | | | | | | | | | | | | | | | |
| | | | |
Class A shares | | | | | | | | | | | | | | | | |
| | | | |
Subscriptions | | | 67,126,100 | | | | 911,201,063 | | | | 16,754,569 | | | | 229,473,554 | |
| | | | |
Distributions reinvested | | | 4,374,668 | | | | 54,289,632 | | | | 2,976,217 | | | | 39,464,640 | |
| | | | |
Redemptions | | | (12,620,702 | ) | | | (166,074,306 | ) | | | (18,645,862 | ) | | | (255,554,410 | ) |
| |
Net increase | | | 58,880,066 | | | | 799,416,389 | | | | 1,084,924 | | | | 13,383,784 | |
| |
Total net increase | | | 58,880,066 | | | | 799,416,389 | | | | 1,084,924 | | | | 13,383,784 | |
| |
The accompanying Notes to Financial Statements are an integral part of this statement.
| | |
| |
| ACTIVE PORTFOLIOS® MULTI-MANAGER SMALL CAP EQUITY FUND | | |
FINANCIAL HIGHLIGHTS
The following table is intended to help you understand the Fund’s financial performance. Certain information reflects financial results for a single share of a class held for the periods shown. Per share net investment income (loss) amounts are calculated based on average shares outstanding during the period. Total return assumes reinvestment of all dividends and distributions, if any. Total return does not reflect payment of sales charges, if any. Total return and portfolio turnover are not annualized for periods of less than one year. The portfolio turnover rate is calculated without regard to purchase and sales transactions of short-term instruments and certain derivatives, if any. If such transactions were included, the Fund’s portfolio turnover rate may be higher.
| | | | | | | | | | | | | | | | |
| | | Year Ended August 31, | |
Class A | | | 2015 | | | | 2014 | | | | 2013 | | | | 2012(a) | |
Per share data | | | | | | | | | | | | | | | | |
Net asset value, beginning of period | | | $13.68 | | | | $12.73 | | | | $10.07 | | | | $10.00 | |
| | | | | | | | | | | | | | | | | |
Income from investment operations: | | | | | | | | | | | | | | | | |
| | | | |
Net investment income (loss) | | | (0.05 | ) | | | (0.07 | ) | | | 0.03 | | | | (0.01 | ) |
| | | | | | | | | | | | | | | | | |
Net realized and unrealized gain | | | 0.28 | (b) | | | 1.86 | | | | 2.69 | | | | 0.08 | (b) |
| | | | | | | | | | | | | | | | | |
Total from investment operations | | | 0.23 | | | | 1.79 | | | | 2.72 | | | | 0.07 | |
| | | | | | | | | | | | | | | | | |
Less distributions to shareholders: | | | | | | | | | | | | | | | | |
| | | | |
Net investment income | | | — | | | | — | | | | (0.06 | ) | | | — | |
| | | | | | | | | | | | | | | | | |
Net realized gains | | | (1.12 | ) | | | (0.84 | ) | | | — | | | | — | |
| | | | | | | | | | | | | | | | | |
Total distributions to shareholders | | | (1.12 | ) | | | (0.84 | ) | | | (0.06 | ) | | | — | |
| | | | | | | | | | | | | | | | | |
Net asset value, end of period | | | $12.79 | | | | $13.68 | | | | $12.73 | | | | $10.07 | |
| | | | | | | | | | | | | | | | | |
Total return | | | 1.90 | % | | | 14.28 | % | | | 27.11 | % | | | 0.70 | % |
| | | | | | | | | | | | | | | | | |
Ratios to average net assets(c) | | | | | | | | | | | | | | | | |
| | | | |
Total gross expenses | | | 1.58 | %(d) | | | 1.57 | % | | | 1.63 | % | | | 1.77 | %(e) |
| | | | | | | | | | | | | | | | | |
Total net expenses(f) | | | 1.37 | %(d) | | | 1.34 | % | | | 1.34 | % | | | 1.34 | %(e) |
| | | | | | | | | | | | | | | | | |
Net investment income (loss) | | | (0.38 | %) | | | (0.48 | %) | | | 0.30 | % | | | (0.21 | %)(e) |
| | | | | | | | | | | | | | | | | |
Supplemental data | | | | | | | | | | | | | | | | |
| | | | |
Net assets, end of period (in thousands) | | | $1,340,275 | | | | $628,100 | | | | $570,786 | | | | $405,992 | |
| | | | | | | | | | | | | | | | | |
Portfolio turnover | | | 75 | % | | | 73 | % | | | 97 | % | | | 26 | % |
| | | | | | | | | | | | | | | | | |
Notes to Financial Highlights
| (a) | Based on operations from April 20, 2012 (commencement of operations) through the stated period end. |
| (b) | Calculation of the net gain (loss) per share (both realized and unrealized) does not correlate to the aggregate realized and unrealized gain (loss) presented in the Statement of Operations due to the timing of subscriptions and redemptions of Fund shares in relation to fluctuations in the market value of the portfolio. |
| (c) | In addition to the fees and expenses that the Fund bears directly, the Fund indirectly bears a pro rata share of the fees and expenses of any other funds in which it invests. Such indirect expenses are not included in the Fund’s reported expense ratios. |
| (d) | Ratios include line of credit interest expense which is less than 0.01%. |
| (f) | Total net expenses include the impact of certain fee waivers/expense reimbursements made by the Investment Manager and certain of its affiliates, if applicable. |
The accompanying Notes to Financial Statements are an integral part of this statement.
| | |
| |
| | ACTIVE PORTFOLIOS® MULTI-MANAGER SMALL CAP EQUITY FUND |
NOTES TO FINANCIAL STATEMENTS
August 31, 2015
Note 1. Organization
Active Portfolios® Multi-Manager Small Cap Equity Fund (the Fund), a series of Columbia Funds Series Trust I (the Trust), is a diversified fund. The Trust is registered under the Investment Company Act of 1940, as amended (the 1940 Act), as an open-end management investment company organized as a Massachusetts business trust.
Fund Shares
The Trust may issue an unlimited number of shares (without par value). The Fund only offers Class A shares that are available only to certain eligible investors through certain wrap fee programs sponsored and/or managed by Ameriprise Financial, Inc. (Ameriprise Financial) or its affiliates.
Class A shares are not subject to any front-end sales charge or contingent deferred sales charge.
Note 2. Summary of Significant Accounting Policies
Basis of Preparation
The Fund is an investment company that applies the accounting and reporting guidance in the Financial Accounting Standards Board (FASB) Accounting Standards Codification Topic 946, Financial Services —Investment Companies (ASC 946). The financial statements are prepared in accordance with U.S. generally accepted accounting principles (GAAP), which requires management to make certain estimates and assumptions that affect the reported amounts of assets and liabilities, the disclosure of contingent assets and liabilities at the date of the financial statements and the reported amounts of income and expenses during the reporting period. Actual results could differ from those estimates.
The following is a summary of significant accounting policies followed by the Fund in the preparation of its financial statements.
Security Valuation
All equity securities and exchange-traded funds are valued at the close of business of the New York Stock Exchange (NYSE). Equity securities and exchange-traded funds are valued at the last quoted sales price on the principal exchange or market on which they trade, except for securities traded on the NASDAQ Stock Market, which are valued at the NASDAQ official close price. Unlisted securities or listed securities for which there were no
sales during the day are valued at the mean of the latest quoted bid and ask prices on such exchanges or markets.
Foreign equity securities are valued based on the closing price on the foreign exchange in which such securities are primarily traded. If any foreign equity security closing prices are not readily available, the securities are valued at the mean of the latest quoted bid and ask prices on such exchanges or markets. Foreign currency exchange rates are generally determined at 4:00 p.m. Eastern (U.S.) time. Many securities markets and exchanges outside the U.S. close prior to the close of the NYSE; therefore, the closing prices for securities in such markets or on such exchanges may not fully reflect events that occur after such close but before the close of the NYSE. In those situations, foreign securities will be fair valued pursuant to a policy adopted by the Board of Trustees (the Board), including, if available, utilizing a third party pricing service to determine these fair values. The third party pricing service takes into account multiple factors, including, but not limited to, movements in the U.S. securities markets, certain depositary receipts, futures contracts and foreign exchange rates that have occurred subsequent to the close of the foreign exchange or market, to determine a good faith estimate that reasonably reflects the current market conditions as of the close of the NYSE. The fair value of a security is likely to be different from the quoted or published price, if available.
Investments in open-end investment companies, including money market funds, are valued at their latest net asset value.
Investments for which market quotations are not readily available, or that have quotations which management believes are not reflective of market value or reliable, are valued at fair value as determined in good faith under procedures approved by and under the general supervision of the Board. If a security or class of securities (such as foreign securities) is valued at fair value, such value is likely to be different from the quoted or published price for the security.
Futures and options on futures contracts are valued based upon the settlement price at the close of regular trading on their principal exchanges or, in the absence of transactions, at the mean of the latest quoted bid and ask prices.
The determination of fair value often requires significant judgment. To determine fair value, management may use assumptions including but not limited to future cash flows and estimated risk premiums. Multiple inputs from various sources may be used to determine fair value.
| | |
| |
| ACTIVE PORTFOLIOS® MULTI-MANAGER SMALL CAP EQUITY FUND | | |
NOTES TO FINANCIAL STATEMENTS (continued)
August 31, 2015
GAAP requires disclosure regarding the inputs and valuation techniques used to measure fair value and any
changes in valuation inputs or techniques. In addition, investments shall be disclosed by major category. This information is disclosed following the Fund’s Portfolio of Investments.
Derivative Instruments
The Fund invests in certain derivative instruments, as detailed below, to meet its investment objectives. Derivatives are instruments whose values depend on, or are derived from, in whole or in part, the value of one or more securities, currencies, commodities, indices, or other assets or instruments. Derivatives may be used to increase investment flexibility (including to maintain cash reserves while maintaining desired exposure to certain assets), for risk management (hedging) purposes, to facilitate trading, to reduce transaction costs and to pursue higher investment returns. The Fund may also use derivative instruments to mitigate certain investment risks, such as foreign currency exchange rate risk, interest rate risk and credit risk. Derivatives may involve various risks, including the potential inability of the counterparty to fulfill its obligation under the terms of the contract, the potential for an illiquid secondary market (making it difficult for the Fund to sell, including at favorable prices) and the potential for market movements which may expose the Fund to gains or losses in excess of the amount shown in the Statement of Assets and Liabilities. The notional amounts of derivative instruments, if applicable, are not recorded in the financial statements.
A derivative instrument may suffer a marked-to-market loss if the value of the contract decreases due to an unfavorable change in the market rates or values of the underlying instrument. Losses can also occur if the counterparty does not perform under the contract. The Fund’s risk of loss from counterparty credit risk on over-the-counter derivatives is generally limited to the aggregate unrealized gain netted against any collateral held by the Fund and the amount of any variation margin held by the counterparty. With exchange-traded or centrally cleared derivatives, there is reduced counterparty credit risk to the Fund since the exchange’s clearinghouse, as counterparty to such instruments, guarantees against a possible default. The clearinghouse stands between the buyer and the seller of the contract; therefore, the counterparty credit risk is failure of the clearinghouse. However, credit risk still exists in exchange-traded or centrally cleared derivatives with respect to initial and variation margin that is held in a
broker’s customer account. While brokers are required to segregate customer margin from their own assets, in the event that a broker becomes insolvent or goes into bankruptcy and at that time there is a shortfall in the aggregate amount of margin held by the broker for all its clients, U.S. bankruptcy laws will typically allocate that shortfall on a pro-rata basis across all the broker’s customers (including the Fund), potentially resulting in losses to the Fund.
In order to better define its contractual rights and to secure rights that will help the Fund mitigate its counterparty risk, the Fund may enter into an International Swaps and Derivatives Association, Inc. Master Agreement (ISDA Master Agreement) or similar agreement with its derivatives contract counterparties. An ISDA Master Agreement is an agreement between the Fund and a counterparty that governs over-the-counter derivatives and forward foreign currency exchange contracts and typically contains, among other things, collateral posting terms and netting provisions in the event of a default and/or termination event. Under an ISDA Master Agreement, the Fund may, under certain circumstances, offset with the counterparty certain derivative instrument’s payables and/or receivables with collateral held and/or posted and create one single net payment. The provisions of the ISDA Master Agreement typically permit a single net payment in the event of default (close-out netting) including the bankruptcy or insolvency of the counterparty. Note, however, that bankruptcy or insolvency laws of a particular jurisdiction may impose restrictions on or prohibitions against the right of offset in bankruptcy, insolvency or other events.
Collateral (margin) requirements differ by type of derivative. Margin requirements are established by the exchange or clearinghouse for exchange-traded and centrally cleared derivatives. Brokers can ask for margin in excess of the minimum in certain circumstances. Collateral terms are contract specific for over-the-counter derivatives. For over-the-counter derivatives traded under an ISDA Master Agreement, the collateral requirements are typically calculated by netting the marked-to-market amount for each transaction under such agreement and comparing that amount to the value of any variation margin currently pledged by the Fund and/or the counterparty. Generally, the amount of collateral due from or to a party has to exceed a minimum transfer amount threshold (e.g., $500,000) before a transfer has to be made. To the extent amounts due to the Fund from its counterparties are not fully collateralized, contractually or otherwise, the Fund bears the risk of loss from
| | |
| |
| | ACTIVE PORTFOLIOS® MULTI-MANAGER SMALL CAP EQUITY FUND |
NOTES TO FINANCIAL STATEMENTS (continued)
August 31, 2015
counterparty nonperformance. The Fund attempts to mitigate counterparty risk by only entering into agreements with counterparties that it believes have the financial resources to honor their obligations and by monitoring the financial stability of those counterparties.
Certain ISDA Master Agreements allow counterparties to over-the-counter derivatives transactions to terminate derivatives contracts prior to maturity in the event the Fund’s net asset value declines by a stated percentage over a specified time period or if the Fund fails to meet certain terms of the ISDA Master Agreement, which would cause the Fund to accelerate payment of any net liability owed to the counterparty. The Fund also has termination rights if the counterparty fails to meet certain terms of the ISDA Master Agreement. In addition to considering counterparty credit risk, the Fund would consider terminating the derivatives contracts based on whether termination would result in a net liability owed from the counterparty.
For financial reporting purposes, the Fund does not offset derivative assets and derivative liabilities that are subject to netting arrangements in the Statement of Assets and Liabilities.
Futures Contracts
Futures contracts are exchange traded and represent commitments for the future purchase or sale of an asset at a specified price on a specified date. The Fund bought and sold futures contracts to manage exposure to movements in interest rates and manage exposure to the securities market and maintain appropriate equity market exposure while keeping sufficient cash to accommodate daily redemptions. These instruments may be used for other purposes in future periods. Upon entering into futures contracts, the Fund bears risks that it may not achieve the anticipated benefits of the futures contracts and may realize a loss. Additional risks include counterparty credit risk, the possibility of an illiquid market, and that a change in the value of the contract or option may not correlate with changes in the value of the underlying asset.
Effects of Derivative Transactions in the Financial Statements
The following tables are intended to provide additional information about the effect of derivatives on the financial statements of the Fund, including: the fair value of derivatives by risk category and the location of those fair values in the Statement of Assets and Liabilities; and the impact of derivative transactions over the period in
the Statement of Operations, including realized and unrealized gains (losses). The derivative instrument schedules following the Portfolio of Investments present additional information regarding derivative instruments outstanding at the end of the period, if any.
The following table provides a summary of the fair value of derivative instruments (not considered to be hedging instruments for accounting disclosure purposes) at August 31, 2015:
| | | | | | |
| | | | | | | |
| | Liability Derivatives | |
Risk Exposure
Category | | Statement of Assets and Liabilities Location | | | Fair Value ($) | |
Equity risk | | Net assets — unrealized depreciation on futures contracts | | | 12,077,786 | * |
| * | Includes cumulative appreciation (depreciation) as reported in the tables following the Portfolio of Investments. Only the current day’s variation margin is reported in receivables or payables in the Statement of Assets and Liabilities. |
The following table indicates the effect of derivative instruments (not considered to be hedging instruments for accounting disclosure purposes) in the Statement of Operations for the year ended August 31, 2015:
| | | | |
| | | | | |
Change in Unrealized Appreciation (Depreciation) on Derivatives
Recognized in Income | |
| Risk Exposure Category | | Futures Contracts ($) | |
Equity risk | | | (12,077,786 | ) |
The following table provides a summary of the average outstanding volume by derivative instrument for the year ended August 31, 2015:
| | | | |
| | | | | |
| Derivative Instrument | | Average notional amounts ($)* | |
Futures contracts — Long | | | 32,236,375 | |
| * | Based on the ending quarterly outstanding amounts for the year ended August 31, 2015. |
Security Transactions
Security transactions are accounted for on the trade date. Cost is determined and gains (losses) are based upon the specific identification method for both financial statement and federal income tax purposes.
Income Recognition
Corporate actions and dividend income are generally recorded net of any non-reclaimable tax withholdings, on the ex-dividend date or upon receipt of ex-dividend notification in the case of certain foreign securities.
The Fund may receive distributions from holdings in equity securities, business development companies
| | |
| |
| ACTIVE PORTFOLIOS® MULTI-MANAGER SMALL CAP EQUITY FUND | | |
NOTES TO FINANCIAL STATEMENTS (continued)
August 31, 2015
(BDCs), exchange-traded funds, other regulated investment companies (RICs), and real estate investment trusts (REITs), which report information on the tax character of their distributions annually. These distributions are allocated to dividend income, capital gain and return of capital based on actual information reported. Return of capital is recorded as a reduction of the cost basis of securities held. If the Fund no longer owns the applicable securities, return of capital is recorded as a realized gain. With respect to REITs, to the extent actual information has not yet been reported, estimates for return of capital are made by the Fund’s management. Management’s estimates are subsequently adjusted when the actual character of the distributions is disclosed by the REITs, which could result in a proportionate change in return of capital to shareholders.
The value of additional securities received as an income payment is recorded as income and increases the cost basis of such securities.
Expenses
General expenses of the Trust are allocated to the Fund and other funds of the Trust based upon relative net assets or other expense allocation methodologies determined by the nature of the expense. Expenses directly attributable to the Fund are charged to the Fund.
Federal Income Tax Status
The Fund intends to qualify each year as a regulated investment company under Subchapter M of the Internal Revenue Code, as amended, and will distribute substantially all of its taxable income (including net short-term capital gains), if any, for its tax year, and as such will not be subject to federal income taxes. In addition, the Fund intends to distribute in each calendar year substantially all of its net investment income, capital gains and certain other amounts, if any, such that the Fund should not be subject to federal excise tax. Therefore, no federal income or excise tax provision is recorded.
Foreign Taxes
The Fund may be subject to foreign taxes on income, gains on investments or currency repatriation, a portion of which may be recoverable. The Fund will accrue such taxes and recoveries, as applicable, based upon its current interpretation of tax rules and regulations that exist in the markets in which it invests.
Realized gains in certain countries may be subject to foreign taxes at the Fund level, based on statutory rates.
The Fund accrues for such foreign taxes on realized and unrealized gains at the appropriate rate for each jurisdiction, as applicable. The amount, if any, is disclosed as a liability on the Statement of Assets and Liabilities.
Distributions to Shareholders
Distributions from net investment income, if any, are declared and paid annually. Net realized capital gains, if any, are distributed along with the income distribution. Income distributions and capital gain distributions are determined in accordance with federal income tax regulations, which may differ from GAAP.
Guarantees and Indemnifications
Under the Trust’s organizational documents and, in some cases, by contract, its officers and trustees are indemnified against certain liabilities arising out of the performance of their duties to the Trust or its funds. In addition, certain of the Fund’s contracts with its service providers contain general indemnification clauses. The Fund’s maximum exposure under these arrangements is unknown since the amount of any future claims that may be made against the Fund cannot be determined, and the Fund has no historical basis for predicting the likelihood of any such claims.
Recent Accounting Pronouncement
Fair Value Measurement (Topic 820), Disclosure for Investments in Certain Entities That Calculate Net Asset Value per Share (or Its Equivalent)
In May 2015, the Financial Accounting Standards Board (FASB) issued Accounting Standards Update (ASU) No. 2015-07, Fair Value Measurement (Topic 820), Disclosure for Investments in Certain Entities That Calculate Net Asset Value per Share (or Its Equivalent). ASU No. 2015-07 changes the disclosure requirements for investments for which fair value is measured using the net asset value per share practical expedient. The disclosure requirements are effective for annual periods beginning after December 15, 2015 and interim periods within those fiscal years. At this time, management is evaluating the implications of this guidance and the impact it will have on the financial statement amounts and footnote disclosures, if any.
Note 3. Fees and Other Transactions with Affiliates
Investment Management Fees
Under an Investment Management Services Agreement, Columbia Management Investment Advisers, LLC (the
| | |
| |
| | ACTIVE PORTFOLIOS® MULTI-MANAGER SMALL CAP EQUITY FUND |
NOTES TO FINANCIAL STATEMENTS (continued)
August 31, 2015
Investment Manager), a wholly-owned subsidiary of Ameriprise Financial, Inc. (Ameriprise Financial), is responsible for the ultimate oversight of investments made by the Fund. The Fund’s subadvisers (see Subadvisory Agreements below) have the primary responsibility for the day-to-day portfolio management of the Fund. The investment management fee is an annual fee that is equal to a percentage of the Fund’s average daily net assets that declines from 0.90% to 0.80% as the Fund’s net assets increase. The effective investment management fee rate for the year ended August 31, 2015 was 0.85% of the Fund’s average daily net assets.
Subadvisory Agreement
The Investment Manager has entered into Subadvisory Agreements with Conestoga Capital Advisors, LLC (Conestoga), Dalton, Greiner, Hartman, Maher & Co., LLC (DGHM) and EAM Investors, LLC, with each serving as a subadviser to the Fund. In addition, Real Estate Management Services Group, LLC provides advisory services with respect to REITs in DGHM’s sleeve of investments. New investments in the Fund, net of any redemptions, are allocated in accordance with the Investment Manager’s determination, subject to the oversight of the Fund’s Board. Each subadviser’s proportionate share of investments in the Fund will vary due to market fluctuations. The Investment Manager compensates each subadviser to manage the investment of the Fund’s assets.
Administration Fees
Under an Administrative Services Agreement, the Investment Manager also serves as the Fund Administrator. The Fund pays the Fund Administrator an annual fee for administration and accounting services equal to a percentage of the Fund’s average daily net assets that declines from 0.08% to 0.05% as the Fund’s net assets increase. The effective administration fee rate for the year ended August 31, 2015 was 0.08% of the Fund’s average daily net assets.
Compensation of Board Members
Board members, who are not officers or employees of the Investment Manager or Ameriprise Financial, are compensated for their services to the Fund as disclosed in the Statement of Operations. These Board members may participate in a Deferred Compensation Plan (the Plan) which may be terminated at any time. Obligations of the Plan will be paid solely out of the Fund’s assets, and all amounts payable under the Plan constitute a general unsecured obligation of the Fund.
Compensation of Chief Compliance Officer
The Board has appointed a Chief Compliance Officer to the Fund in accordance with federal securities regulations. The Fund is allocated a portion of the expenses associated with the Chief Compliance Officer based on relative net assets of the Trust.
Transactions with Affiliated Funds
For the year ended August 31, 2015, the Fund engaged in purchase and/or sales transactions with funds that have a common investment manager (or affiliated investment managers), common directors/trustees, and/or common officers. Those purchase transactions complied with provisions of Rule 17a-7 under the 1940 Act and were $50,664,531.
Transfer Agency Fees
Under a Transfer and Dividend Disbursing Agent Agreement, Columbia Management Investment Services Corp. (the Transfer Agent), an affiliate of the Investment Manager and a wholly-owned subsidiary of Ameriprise Financial, is responsible for providing transfer agency services to the Fund. The Transfer Agent has contracted with Boston Financial Data Services (BFDS) to serve as sub-transfer agent.
Effective November 1, 2014, the Transfer Agent receives a monthly transfer agency fee based on the number or the average value of accounts, depending on the type of account. Prior to November 1, 2014, the Transfer Agent received a monthly account-based service fee based on the number of open accounts. In addition, the Transfer Agent also receives sub-transfer agency fees based on a percentage of the average aggregate value of the Fund’s shares maintained in omnibus accounts (other than omnibus accounts for which American Enterprise Investment Services Inc. is the broker of record or accounts where the beneficial shareholder is a customer of Ameriprise Financial Services, Inc., for which the Transfer Agent receives a per account fee). The Transfer Agent pays the fees of BFDS for services as sub-transfer agent and is not entitled to reimbursement for such fees from the Fund (with the exception of out-of-pocket fees).
The Transfer Agent also receives compensation from the Fund for various shareholder services and reimbursements for certain out-of-pocket fees.
For the year ended August 31, 2015, the Fund’s effective transfer agency fee rates as a percentage of average daily net assets for Class A shares was 0.34%.
| | |
| |
| ACTIVE PORTFOLIOS® MULTI-MANAGER SMALL CAP EQUITY FUND | | |
NOTES TO FINANCIAL STATEMENTS (continued)
August 31, 2015
Distribution and Service Fees
The Fund has an agreement with Columbia Management Investment Distributors, Inc. (the Distributor), an affiliate of the Investment Manager and a wholly-owned subsidiary of Ameriprise Financial, for distribution and shareholder services. The Board has approved, and the Fund has adopted, distribution and shareholder service plans (the Plans) applicable to certain share classes, which set the distribution and service fees for the Fund. These fees are calculated daily and are intended to compensate the Distributor and/or eligible selling and/or servicing agents for selling shares of the Fund and providing services to investors.
The Fund may pay a distribution fee of up to 0.25% of the Fund’s average daily net assets attributable to Class A shares and a service fee of up to 0.25% of the Fund’s average daily net assets attributable to Class A shares, provided that the aggregate fee shall not exceed 0.25% of Fund’s average daily net assets attributable to Class A shares.
Expenses Waived/Reimbursed by the Investment Manager and its Affiliates
The Fund’s expense ratio is subject to an expense reimbursement arrangement pursuant to which fees will be waived and/or expenses reimbursed (excluding certain fees and expenses described below), so that the Fund’s net operating expenses, after giving effect to fees waived/expenses reimbursed and any balance credits and/or overdraft charges from the Fund’s custodian, do not exceed the annual rates of:
| | | | | | | | |
| | | Voluntary Expense Cap Effective January 1, 2015 | | | Contractual Expense Cap Prior to January 1, 2015 | |
Class A | | | 1.38 | % | | | 1.34 | % |
The voluntary expense cap arrangement may be revised or discontinued at any time. Under the arrangements, the following fees and expenses are excluded from the waiver/reimbursement commitment, and therefore will be paid by the Fund, if applicable: taxes (including foreign transaction taxes), expenses associated with investments in affiliated and non-affiliated pooled investment vehicles (including mutual funds and exchange-traded funds), transaction costs and brokerage commissions, costs related to any securities lending program, dividend and interest expenses associated with securities sold short, inverse floater program fees and expenses, transaction charges and interest on borrowed
money, interest and extraordinary expenses. Any fees waived and/or expenses reimbursed under the expense reimbursement arrangements described above are not recoverable by the Investment Manager or its affiliates in future periods.
Note 4. Federal Tax Information
The timing and character of income and capital gain distributions are determined in accordance with income tax regulations, which may differ from GAAP because of temporary or permanent book to tax differences.
At August 31, 2015, these differences are primarily due to differing treatment for deferral/reversal of wash sale losses, Trustees’ deferred compensation, net operating loss reclassification, late-year ordinary losses, re-characterization of distributions for investments, derivative investments and earnings and profits distributed to shareholders on the redemption of shares. To the extent these differences are permanent, reclassifications are made among the components of the Fund’s net assets in the Statement of Assets and Liabilities. Temporary differences do not require reclassifications. In the Statement of Assets and Liabilities the following reclassifications were made:
| | | | |
Excess of distributions over net investment income | | | $3,575 | |
Accumulated net realized gain | | | (590,623 | ) |
Paid-in capital | | | 587,048 | |
Net investment income (loss) and net realized gains (losses), as disclosed in the Statement of Operations, and net assets were not affected by this reclassification.
The tax character of distributions paid during the years indicated was as follows:
| | | | | | | | |
| | | Year Ended
August 31,
2015 ($) | | | Year Ended
August 31,
2014 ($) | |
Ordinary income | | | 6,439,032 | | | | 18,800,595 | |
Long-term capital gains | | | 47,850,828 | | | | 20,665,726 | |
Total | | | 54,289,860 | | | | 39,466,321 | |
Short-term capital gain distributions, if any, are considered ordinary income distributions for tax purposes.
At August 31, 2015, the components of distributable earnings on a tax basis were as follows:
| | | | |
Undistributed long-term capital gains | | | 28,089,931 | |
Net unrealized appreciation | | | 49,207,415 | |
At August 31, 2015, the cost of investments for federal income tax purposes was $1,301,597,639 and the
| | |
| |
| | ACTIVE PORTFOLIOS® MULTI-MANAGER SMALL CAP EQUITY FUND |
NOTES TO FINANCIAL STATEMENTS (continued)
August 31, 2015
aggregate gross unrealized appreciation and depreciation based on that cost was:
| | | | |
Unrealized appreciation | | | $94,598,729 | |
Unrealized depreciation | | | (57,469,100 | ) |
Net unrealized appreciation | | | $37,129,629 | |
Under current tax rules, regulated investment companies can elect to treat certain late-year ordinary losses incurred and post-October capital losses (capital losses realized after October 31) as arising on the first day of the following taxable year. As of August 31, 2015, the Fund will elect to treat late-year ordinary losses of $3,130,122 as arising on September 1, 2015.
Management of the Fund has concluded that there are no significant uncertain tax positions in the Fund that would require recognition in the financial statements. However, management’s conclusion may be subject to review and adjustment at a later date based on factors including, but not limited to, new tax laws, regulations, and administrative interpretations (including relevant court decisions). Generally, the Fund’s federal tax returns for the prior three fiscal years remain subject to examination by the Internal Revenue Service.
Note 5. Portfolio Information
The cost of purchases and proceeds from sales of securities, excluding short-term investments and derivatives, if any, aggregated to $1,174,783,822 and $588,279,762, respectively, for the year ended August 31, 2015. The amount of purchase and sale activity impacts the portfolio turnover rate reported in the Financial Highlights.
Note 6. Affiliated Money Market Fund
The Fund invests in Columbia Short-Term Cash Fund, an affiliated money market fund established for the exclusive use by the Fund and other affiliated funds. The income earned by the Fund from such investments is included as Dividends — affiliated issuers in the Statement of Operations. As an investing fund, the Fund indirectly bears its proportionate share of the expenses of Columbia Short-Term Cash Fund.
Note 7. Line of Credit
The Fund has entered into a revolving credit facility with a syndicate of banks led by JPMorgan Chase Bank, N.A. whereby the Fund may borrow for the temporary funding of shareholder redemptions or for other temporary or emergency purposes. Pursuant to a December 9, 2014
amendment, the credit facility agreement, which is a collective agreement between the Fund and certain other funds managed by the Investment Manager, severally and not jointly, permits collective borrowings up to $550 million. Interest is charged to each participating fund based on its borrowings at a rate equal to the higher of (i) the overnight federal funds rate plus 1.00% or (ii) the one-month LIBOR rate plus 1.00%. Each borrowing under the credit facility matures no later than 60 days after the date of borrowing. The Fund also pays a commitment fee equal to its pro rata share of the amount of the credit facility at a rate of 0.075% per annum. The commitment fee is included in other expenses in the Statement of Operations. Prior to the December 9, 2014 amendment, the credit facility agreement permitted borrowings up to $500 million under the same terms and interest rates as described above.
For the year ended August 31, 2015, the average daily loan balance outstanding on days when borrowing existed was $8,900,000 at a weighted average interest rate of 1.19%. Interest expense incurred by the Fund is recorded as a line of credit interest expense in the Statement of Operations.
Note 8. Significant Risks
Shareholder Concentration Risk
At August 31, 2015, one affiliated shareholder of record owned 100.0% of the outstanding shares of the Fund in one or more accounts. The Fund has no knowledge about whether any portion of those shares was owned beneficially. Subscription and redemption activity by concentrated accounts may have a significant effect on the operations of the Fund. In the case of a large redemption, the Fund may be forced to sell investments at inopportune times, including its liquid or more liquid positions, resulting in Fund losses and the Fund holding a higher percentage of less liquid or illiquid securities. Large redemptions could result in decreased economies of scale and increased operating expenses for non-redeeming Fund shareholders.
Note 9. Subsequent Events
Management has evaluated the events and transactions that have occurred through the date the financial statements were issued. Other than as noted below, there were no items requiring adjustment of the financial statements or additional disclosure.
On October 20, 2015, the Investment Manager has entered into a Subadvisory Agreement with BMO Asset
| | |
| |
| ACTIVE PORTFOLIOS® MULTI-MANAGER SMALL CAP EQUITY FUND | | |
NOTES TO FINANCIAL STATEMENTS (continued)
August 31, 2015
Management Corp. to serve as a subadviser to the Fund, effective on or about October 26, 2015.
Note 10. Information Regarding Pending and Settled Legal Proceedings
In December 2005, without admitting or denying the allegations, American Express Financial Corporation (AEFC, which is now known as Ameriprise Financial, Inc. (Ameriprise Financial)) entered into settlement agreements with the Securities and Exchange Commission (SEC) and Minnesota Department of Commerce (MDOC) related to market timing activities. As a result, AEFC was censured and ordered to cease and desist from committing or causing any violations of certain provisions of the Investment Advisers Act of 1940, the Investment Company Act of 1940, and various Minnesota laws. AEFC agreed to pay disgorgement of $10 million and civil money penalties of $7 million. AEFC also agreed to retain an independent distribution consultant to assist in developing a plan for distribution of all disgorgement and civil penalties ordered by the SEC in accordance with various undertakings detailed at http://www.sec.gov/litigation/admin/ia-2451.pdf. Ameriprise Financial and its affiliates have cooperated with the SEC and the MDOC in these legal proceedings, and have made regular reports to the Funds’ Boards of Trustees.
Ameriprise Financial and certain of its affiliates have historically been involved in a number of legal, arbitration and regulatory proceedings, including routine litigation, class actions, and governmental actions, concerning matters arising in connection with the conduct of their business activities. Ameriprise Financial believes that the Funds are not currently the subject of, and that neither Ameriprise Financial nor any of its affiliates are the subject of, any pending legal, arbitration or regulatory proceedings that are likely to have a material adverse effect on the Funds or the ability of Ameriprise Financial or its affiliates to perform under their contracts with the Funds. Ameriprise Financial is required to make quarterly (10-Q), annual (10-K) and, as necessary, 8-K filings with the SEC on legal and regulatory matters that relate to Ameriprise Financial and its affiliates. Copies of these filings may be obtained by accessing the SEC website at www.sec.gov.
There can be no assurance that these matters, or the adverse publicity associated with them, will not result in increased fund redemptions, reduced sale of fund shares or other adverse consequences to the Funds. Further, although we believe proceedings are not likely to have a
material adverse effect on the Funds or the ability of Ameriprise Financial or its affiliates to perform under their contracts with the Funds, these proceedings are subject to uncertainties and, as such, we are unable to estimate the possible loss or range of loss that may result. An adverse outcome in one or more of these proceedings could result in adverse judgments, settlements, fines, penalties or other relief that could have a material adverse effect on the consolidated financial condition or results of operations of Ameriprise Financial.
| | |
| |
| | ACTIVE PORTFOLIOS® MULTI-MANAGER SMALL CAP EQUITY FUND |
REPORT OF INDEPENDENT REGISTERED PUBLIC ACCOUNTING FIRM
To the Trustees of Columbia Funds Series Trust I and the Shareholders of
Active Portfolios® Multi-Manager Small Cap Equity Fund
In our opinion, the accompanying statement of assets and liabilities, including the portfolio of investments, and the related statements of operations and of changes in net assets and the financial highlights present fairly, in all material respects, the financial position of Active Portfolios® Multi-Manager Small Cap Equity Fund (the “Fund,” a series of Columbia Funds Series Trust I) at August 31, 2015, and the results of its operations, the changes in its net assets and the financial highlights for each of the periods indicated, in conformity with accounting principles generally accepted in the United States of America. These financial statements and financial highlights (hereafter referred to as “financial statements”) are the responsibility of the Fund’s management. Our responsibility is to express an opinion on these financial statements based on our audits. We conducted our audits of these financial statements in accordance with the standards of the Public Company Accounting Oversight Board (United States). Those standards require that we plan and perform the audit to obtain reasonable assurance about whether the financial statements are free of material misstatement. An audit includes examining, on a test basis, evidence supporting the amounts and disclosures in the financial statements, assessing the accounting principles used and significant estimates made by management, and evaluating the overall financial statement presentation. We believe that our audits, which included confirmation of securities at August 31, 2015 by correspondence with the custodian, brokers and transfer agent, and the application of alternative auditing procedures where such confirmations had not been received, provide a reasonable basis for our opinion.
PricewaterhouseCoopers LLP
Minneapolis, MN
October 22, 2015
| | |
| |
| ACTIVE PORTFOLIOS® MULTI-MANAGER SMALL CAP EQUITY FUND | | |
FEDERAL INCOME TAX INFORMATION
(Unaudited)
The Fund hereby designates the following tax attributes for the fiscal year ended August 31, 2015. Shareholders will be notified in early 2016 of the amounts for use in preparing 2015 income tax returns.
Tax Designations
| | | | |
Capital Gain Dividend | | | $30,300,411 | |
Capital Gain Dividend. The Fund designates as a capital gain dividend the amount reflected above, or if subsequently determined to be different, the net capital gain of such fiscal period.
| | |
| |
| | ACTIVE PORTFOLIOS® MULTI-MANAGER SMALL CAP EQUITY FUND |
TRUSTEES AND OFFICERS
The Trustees serve terms of indefinite duration. The names and birth years of the Trustees and Officers of the Funds in Columbia Funds Series Trust I, the year each was first elected or appointed to office, their principal business occupations during at least the last five years, the number of Funds overseen by each Trustee and other directorships they hold are shown below. Each officer listed below serves as an officer of each Fund in Columbia Funds Series Trust I. The mailing address of each Trustee is: c/o Columbia Management Investment Advisers, LLC, 225 Franklin Street, Mail Drop BX32 05228, Boston, MA 02110.
| | | | | | | | |
| Independent Trustees |
Name, Year of Birth
and Position Held
with the Trust | | Year First Appointed or Elected as
Trustee to any Fund Currently
in the Columbia Funds Complex
or a Predecessor Thereof | | Principal Occupation(s)
During the Past Five Years | | Number of
Funds in the
Columbia
Funds
Complex
Overseen | | Other Directorships Held by Trustee During the Past Five Years |
Janet Langford Carrig
(Born 1957)
Trustee | | 1996 | | Senior Vice President, General Counsel and Corporate Secretary, ConocoPhillips (integrated energy company) since September 2007; Deputy General Counsel — Corporate Legal Services, ConocoPhillips from August 2006 to August 2007; Partner, Zelle, Hofmann, Voelbel, Mason & Gette LLP (law firm) from March 2005 to July 2006; Adjunct Professor of Law, Northwestern University from September 2004 to June 2006; Director, UAL Corporation (airline) from February 2006 to July 2006; Chief Administrative Officer and Senior Vice President, Kmart Holding Corporation (consumer goods) from September 2003 to March 2004 | | 60 | | None |
Douglas A. Hacker
(Born 1955)
Trustee and Chairman
of the Board | | 1996 | | Independent business executive since May 2006; Executive Vice President — Strategy of United Airlines from December 2002 to May 2006; President of UAL Loyalty Services (airline marketing company) from September 2001 to December 2002; Executive Vice President and Chief Financial Officer of United Airlines from July 1999 to September 2001 | | 60 | | Spartan Nash Company, (food distributor); Nash Finch Company (food distributor) from 2005 to 2013; Aircastle Limited (aircraft leasing); SeaCube Container Leasing Ltd. (container leasing) from 2010 to 2013; and Travelport Worldwide Limited (travel information technology) |
Nancy T. Lukitsh
(Born 1956)
Trustee | | 2011 | | Senior Vice President, Partner and Director of Marketing, Wellington Management Company, LLP (investment adviser) from 1997 to 2010; Chair, Wellington Management Investment Portfolios (commingled non-U.S. investment pools) from 2007 to 2010; Director, Wellington Trust Company, NA and other Wellington affiliates from 1997 to 2010 | | 60 | | None |
William E. Mayer
(Born 1940)
Trustee | | 1991 | | Partner, Park Avenue Equity Partners (private equity) since February 1999 | | 60 | | DynaVox Inc. (speech creation); Lee Enterprises (print media); WR Hambrecht + Co. (financial service provider) from 2000 to 2012; BlackRock Kelso Capital Corporation (investment company); and Premier, Inc. (healthcare) |
| | |
| |
| ACTIVE PORTFOLIOS® MULTI-MANAGER SMALL CAP EQUITY FUND | | |
TRUSTEES AND OFFICERS (continued)
| | | | | | | | |
| Independent Trustees (continued) |
Name, Year of Birth
and Position Held
with the Trust | | Year First Appointed or Elected as Trustee to any Fund Currently in the Columbia Funds Complex or a Predecessor Thereof | | Principal Occupation(s)
During the Past Five Years | | Number of
Funds in the
Columbia
Funds
Complex
Overseen | | Other Directorships Held by Trustee During the Past Five Years |
David M. Moffett
(Born 1952)
Trustee | | 2011 | | Retired. Consultant to Bridgewater and Associates; Chief Executive Officer, Federal Home Loan Mortgage Corporation, from 2008 to 2009; Senior Adviser, Global Financial Services Group, Carlyle Group, Inc., from 2007 to 2008; Vice Chairman and Chief Financial Officer, U.S. Bancorp, from 1993 to 2007 | | 60 | | Building Materials Holding Corp. (building materials and construction services); CIT Group Inc. (commercial and consumer finance); eBay Inc. (online trading community); E.W. Scripps Co. (print and television media); Genworth Financial, Inc. (financial and insurance products and services); MBIA Inc. (financial service provider); Paypal Holdings Inc. (payment and data processing services); and University of Oklahoma Foundation |
Charles R. Nelson
(Born 1942)
Trustee | | 1981 | | Retired. Professor Emeritus, University of Washington since 2011; Professor of Economics, University of Washington from 1976 to 2011; Ford and Louisa Van Voorhis Professor of Political Economy, University of Washington from 1993 to 2011; Adjunct Professor of Statistics, University of Washington from 1980 to 2011; Associate Editor, Journal of Money, Credit and Banking from September 1993 to 2008; consultant on econometric and statistical matters | | 60 | | None |
John J. Neuhauser
(Born 1943)
Trustee | | 1984 | | President, Saint Michael’s College since August 2007; Director or Trustee of several non- profit organizations, including Fletcher Allen Health Care, Inc.; Academic Vice President and Dean of Faculties, Boston College from August 1999 to October 2005; University Professor, Boston College from November 2005 to August 2007 | | 60 | | Liberty All-Star Equity Fund and Liberty All-Star Growth Fund (closed-end funds) |
Patrick J. Simpson
(Born 1944)
Trustee | | 2000 | | Partner, Perkins Coie LLP (law firm) | | 60 | | None |
Anne-Lee Verville
(Born 1945)
Trustee | | 1998 | | Retired. General Manager, Global Education Industry from 1994 to 1997, President — Application Systems Division from 1991 to 1994, Chief Financial Officer — US Marketing & Services from 1988 to 1991, and Chief Information Officer from 1987 to 1988, IBM Corporation (computer and technology) | | 60 | | Enesco Group, Inc. (producer of giftware and home and garden decor products) from 2001 to 2006 |
| | |
| |
| | ACTIVE PORTFOLIOS® MULTI-MANAGER SMALL CAP EQUITY FUND |
TRUSTEES AND OFFICERS (continued)
| | | | | | | | |
| Independent Trustee Affiliate with Investment Manager* |
Name, Year of Birth
and Position Held
with the Trust | | Year First Appointed or Elected as
Trustee to any Fund Currently
in the Columbia Funds Complex
or a Predecessor Thereof | | Principal Occupation(s)
During the Past Five Years | | Number of
Funds in the
Columbia
Funds
Complex
Overseen | | Other Directorships Held by Trustee During the Past Five Years |
William F. Truscott
(Born 1960)
Trustee | | 2012 | | Chairman of the Board and President, Columbia Management Investment Advisers, LLC since May 2010 and February 2012, respectively (previously President and Chief Investment Officer, 2001-April 2010); Chief Executive Officer, Global Asset Management, Ameriprise Financial, Inc. since September 2012 (previously Chief Executive Officer, U.S. Asset Management & President, Annuities, May 2010-September 2012 and President — U.S. Asset Management and Chief Investment Officer, 2005-April 2010); Director and Chief Executive Officer, Columbia Management Investment Distributors, Inc. since May 2010 and February 2012, respectively (previously Chairman of the Board and Chief Executive Officer, 2006-April 2010); Chairman of the Board and Chief Executive Officer, RiverSource Distributors, Inc. since 2006; Director, Threadneedle Asset Management Holdings, SARL since 2014; President and Chief Executive Officer, Ameriprise Certificate Company, 2006-August 2012 | | 187 | | Chairman of the Board, Columbia Management Investment Advisers, LLC since May 2010; Director, Columbia Management Investment Distributors, Inc. since May 2010; Director, Ameriprise Certificate Company, 2006 to January 2013 |
| * | Interested person (as defined under the 1940 Act) by reason of being an officer, director, security holder and/or employee of the Investment Manager or Ameriprise Financial. |
The Statement of Additional Information has additional information about the Fund’s Board members and is available, without charge, upon request by calling 800.345.6611; contacting your financial intermediary; or visiting columbiathreadneedle.com/us.
The Board has appointed officers who are responsible for day-to-day business decisions based on policies it has established. The officers serve at the pleasure of the Board. In addition to Mr. Truscott, who is Senior Vice President, the Funds’ other officers are:
| | | | |
| Fund Officers |
Name,
Address and
Year of Birth | | Position and Year First Appointed to Position for any Fund in the Columbia Funds Complex or a Predecessor Thereof | | Principal Occupation(s) During Past Five Years |
Christopher O. Petersen
5228 Ameriprise
Financial Center
Minneapolis, MN 55474 Born 1970 | | President and Principal Executive Officer (2015) | | Vice President and Lead Chief Counsel, Ameriprise Financial, Inc. since January 2015 (previously, Vice President and Chief Counsel January 2010-December 2014; and Vice President and Group Counsel or Counsel 2004-January 2010); officer of Columbia Funds and affiliated funds since 2007. |
Michael G. Clarke
225 Franklin Street Boston, MA 02110 Born 1969 | | Treasurer (2011) and Chief Financial Officer (2009) | | Vice President — Mutual Fund Administration, Columbia Management Investment Advisers, LLC, since May 2010; Managing Director of Fund Administration, Columbia Management Advisors, LLC, September 2004-April 2010; senior officer of Columbia Funds and affiliated funds since 2002. |
Paul B. Goucher
100 Park Avenue
New York, NY 10017
Born 1968 | | Senior Vice President (2011), Chief Legal Officer (2015) and Assistant Secretary (2008) | | Vice President and Lead Chief Counsel, Ameriprise Financial, Inc. since November 2008 and January 2013, respectively (previously Chief Counsel, January 2010-January 2013 and Group Counsel, November 2008-January 2010). |
| | |
| |
| ACTIVE PORTFOLIOS® MULTI-MANAGER SMALL CAP EQUITY FUND | | |
TRUSTEES AND OFFICERS (continued)
| | | | |
| Fund Officers (continued) |
Name, Address and
Year of Birth | | Position and Year
First Appointed to
Position for any Fund in the Columbia Funds Complex or a Predecessor Thereof | | Principal Occupation(s) During Past Five Years |
Thomas P. McGuire
225 Franklin Street
Boston, MA 02110
Born 1972 | | Vice President and Chief Compliance Officer (2012) | | Vice President — Asset Management Compliance, Ameriprise Financial, Inc., since May 2010; Chief Compliance Officer, Ameriprise Certificate Company since September 2010; Compliance Executive, Bank of America, 2005-April 2010. |
Colin Moore
225 Franklin Street
Boston, MA 02110
Born 1958 | | Senior Vice President (2010) | | Executive Vice President and Global Chief Investment Officer, Ameriprise Financial, Inc., since July 2013; Director and Global Chief Investment Officer, Columbia Management Investment Advisers, LLC since May 2010; Manager, Managing Director and Chief Investment Officer, Columbia Management Advisors, LLC, 2007-April 2010. |
Michael E. DeFao
225 Franklin Street
Boston, MA 02110
Born 1968 | | Vice President (2011) and Assistant Secretary (2010) | | Vice President and Chief Counsel, Ameriprise Financial, Inc. since May 2010; Associate General Counsel, Bank of America, 2005-April 2010. |
Joseph F. DiMaria
225 Franklin Street
Boston, MA 02110
Born 1968 | | Vice President (2011), Assistant Treasurer (2012) and Chief Accounting Officer (2008) | | Vice President — Mutual Fund Treasurer, Columbia Management Investment Advisers, LLC since May 2010; Director of Fund Administration, Columbia Management Advisors, LLC, 2006-April 2010. |
Amy Johnson
5228 Ameriprise
Financial Center
Minneapolis, MN 55474
Born 1965 | | Vice President (2006) | | Managing Director and Chief Operating Officer, Columbia Management Investment Advisers, LLC since May 2010 (previously Chief Administrative Officer, 2009-April 2010, and Vice President — Asset Management and Trust Company Services, 2006-2009). |
Lyn Kephart-Strong
5228 Ameriprise
Financial Center
Minneapolis, MN 55474
Born 1960 | | Vice President (2015) | | President, Columbia Management Investment Services Corp. since October 2014; Vice President & Resolution Officer, Ameriprise Trust Company since August 2009; President, RiverSource Service Corporation 2004-2010. |
Ryan C. Larrenaga
225 Franklin Street
Boston, MA 02110
Born 1970 | | Vice President and Secretary (2015) | | Vice President and Group Counsel, Ameriprise Financial, Inc. since August 2011 (previously, Counsel from May 2010 to August 2011); Assistant General Counsel, Bank of America, 2005-April 2010; officer of Columbia Funds and affiliated funds since 2005. |
| | |
| |
| | ACTIVE PORTFOLIOS® MULTI-MANAGER SMALL CAP EQUITY FUND |
BOARD CONSIDERATION AND APPROVAL OF ADVISORY AGREEMENT AND SUBADVISORY AGREEMENTS
On June 10, 2015, the Board of Trustees (the Board) and the Trustees who are not interested persons (as defined in the Investment Company Act of 1940) (the Independent Trustees) of Columbia Funds Series Trust I (the Trust) unanimously approved the continuation of the Investment Management Services Agreement (the Advisory Agreement) with Columbia Management Investment Advisers, LLC (the Investment Manager) and the Subadvisory Agreements (the Subadvisory Agreements) between the Investment Manager and Conestoga Capital Advisors, LLC, Dalton, Greiner, Hartman, Maher & Co., LLC and EAM Investors, LLC (the Subadvisers) with respect to Active Portfolios® Multi-Manager Small Cap Equity Fund (the Fund), a series of the Trust. The Board and the Independent Trustees also unanimously approved an agreement (the Management Agreement) combining the Advisory Agreement and the Fund’s existing administrative services agreement (the Administrative Services Agreement) in a single agreement. The Board and the Independent Trustees approved the restatement of the Advisory Agreement with the Management Agreement to be effective for the Fund on January 1, 2016, the Fund’s next annual prospectus update. As detailed below, the Board’s Advisory Fees and Expenses Committee (the Committee) and the Board met on multiple occasions to review and discuss, both among themselves and with the management team of the Investment Manager, materials provided by the Investment Manager and others before determining to approve the Management Agreement and the continuation of the Advisory Agreement and the Subadvisory Agreements (collectively, the Agreements).
In connection with their deliberations regarding the approval of the Management Agreement and the continuation of the Advisory Agreement and the Subadvisory Agreements, the Committee and the Board evaluated materials requested from the Investment Manager regarding the Fund and the Agreements, and discussed these materials with representatives of the Investment Manager at Committee meetings held on March 3, 2015, April 29, 2015 and June 9, 2015 and at Board meetings held on March 4, 2015 and June 10, 2015. In addition, the Board considers matters bearing on the Agreements at most of its other meetings throughout the year and meets regularly with senior management of the Trust and the Investment Manager. Through the Board’s Investment Oversight Committees, Trustees also meet with selected portfolio managers of the funds the Trustees oversee and other investment personnel at various times throughout the year. The Committee and the Board also consulted with its independent fee consultant, Fund counsel and with the Independent Trustees’ independent legal counsel, who advised on various matters with respect to the Committee’s and the Board’s considerations and otherwise assisted the Committee and the Board in their deliberations. On June 9, 2015, the Committee recommended that the Board approve the Management Agreement and the continuation of the Advisory Agreement and the Subadvisory Agreements. On June 10, 2015, the Board, including the Independent Trustees, voting separately, unanimously approved the Management Agreement and the continuation of the Advisory Agreement and the Subadvisory Agreements for the Fund.
The Committee and the Board considered all information that they, their legal counsel or the Investment Manager believed reasonably necessary to evaluate and to determine whether to approve the Management Agreement and the continuation of the Advisory Agreement and the Subadvisory Agreements. The information and factors considered by the Committee and the Board in recommending for approval or approving the Management Agreement and the continuation of the Advisory Agreement and the Subadvisory Agreements for the Fund included the following:
| • | | Information on the investment performance of the Fund relative to the performance of a group of mutual funds determined to be comparable to the Fund by an independent third-party data provider, as well as performance relative to benchmarks; |
| • | | Information on the Fund’s advisory fees and total expenses, including information comparing the Fund’s expenses to those of a group of comparable mutual funds, as determined by the independent third-party data provider; |
| • | | The Investment Manager’s agreement to contractually limit or cap total operating expenses for the Fund so that total operating expenses (excluding certain fees and expenses, such as portfolio transaction costs and certain other investment related expenses, interest, taxes, acquired fund fees and expenses, and extraordinary expenses) would not exceed a specified percentage of the Fund’s average annual net assets from January 1, 2016 through December 31, 2016; |
| • | | The terms and conditions of the Agreements; |
| | |
| |
| ACTIVE PORTFOLIOS® MULTI-MANAGER SMALL CAP EQUITY FUND | | |
BOARD CONSIDERATION AND APPROVAL OF ADVISORY AGREEMENT AND SUBADVISORY AGREEMENTS (continued)
| • | | The current and proposed terms and conditions of other agreements and arrangements with affiliates of the Investment Manager relating to the operations of the Fund, including the Administrative Services Agreement1 and agreements with respect to the provision of distribution and transfer agency services to the Fund; |
| • | | Descriptions of various functions performed by the Investment Manager and the Subadvisers under the Agreements, including portfolio management and portfolio trading practices; |
| • | | Information regarding the management fees and investment performance of similarly-managed portfolios of other clients of the Investment Manager, including institutional separate accounts; |
| • | | Information regarding the reputation, regulatory history and resources of the Investment Manager, including information regarding senior management, portfolio managers and other personnel; |
| • | | Information regarding the capabilities of the Investment Manager with respect to compliance monitoring services, including an assessment of the Investment Manager’s and the Subadvisers’ compliance system by the Fund’s Chief Compliance Officer; and |
| • | | The profitability to the Investment Manager and its affiliates from their relationships with the Fund. |
Nature, Extent and Quality of Services Provided under the Agreements
The Committee and the Board considered the nature, extent and quality of services provided to the Fund by the Investment Manager, the Subadvisers and the Investment Manager’s affiliates under the Agreements and under separate agreements for the provision of transfer agency and administrative services, and the resources dedicated to the Fund and the other Columbia Funds by the Investment Manager, the Subadvisers and the Investment Manager’s affiliates. The Committee and the Board also determined that the nature and level of the services to be provided under the Management Agreement would not decrease relative to the services provided under the Advisory Agreement and the Administrative Services Agreement. The Committee and the Board considered, among other things, the Investment Manager’s ability to attract, motivate and retain highly qualified research, advisory and supervisory investment professionals (including personnel and other resources, compensation programs for personnel involved in fund management, reputation and other attributes), the portfolio management services provided by those investment professionals, and the quality of the Investment Manager’s investment research capabilities and trade execution services. The Committee and the Board also considered the potential benefits to shareholders of investing in a mutual fund that is part of a fund complex offering exposure to a variety of asset classes and investment disciplines and providing a variety of fund and shareholder services.
The Committee and the Board also considered the professional experience and qualifications of the senior personnel of the Investment Manager and the Subadvisers, which included consideration of the Investment Manager’s and the Subadvisers’ experience with similarly-structured funds. The Committee and the Board noted the compliance programs of and the compliance-related resources provided to the Fund by the Investment Manager and its affiliates, and considered the Investment Manager’s ability to provide administrative services to the Fund and coordinate the activities of the Fund’s other service providers. The Committee and the Board also noted that the Board had approved each Subadviser’s code of ethics and compliance program, and that the Chief Compliance Officer of the Funds reports to the Trustees on each Subadviser’s compliance program. In evaluating the nature, extent and quality of services provided under the Agreements, the Committee and the Board considered that these services were provided to the Fund, rather than directly to Fund shareholders. The Committee and the Board accordingly affirmed, after considering various other matters, including the potential benefits to the Fund and its shareholders of the Independent Trustees’ important role as pre-suit gatekeepers with respect to claims that they may determine are meritless or contrary to the Fund’s best interests, that it was not the intention of the Board or the Investment Manager that there be any third-party beneficiaries of the Agreements.
The Committee and the Board considered the diligence and selection process undertaken by the Investment Manager to select each Subadviser, including the Investment Manager’s rationale for recommending the continuation of the Subadvisory Agreements, and the process for monitoring the Subadvisers’ ongoing performance of services for the
| 1 | Like the Advisory Agreement, the Administrative Services Agreement will terminate with respect to the Fund once the Management Agreement is effective for the Fund. |
| | |
| |
| | ACTIVE PORTFOLIOS® MULTI-MANAGER SMALL CAP EQUITY FUND |
BOARD CONSIDERATION AND APPROVAL OF ADVISORY AGREEMENT AND SUBADVISORY AGREEMENTS (continued)
Fund. As part of these deliberations, the Committee and the Board considered the ability of the Investment Manager, subject to the approval of the Board, to modify or enter into new subadvisory agreements without a shareholder vote pursuant to an exemptive order of the Securities and Exchange Commission. The Committee and the Board also considered the scope of services provided to the Fund by the Investment Manager that are distinct from and in addition to those provided by the Subadvisers, including cash flow management, treasury services, risk oversight, investment oversight and Subadviser selection, oversight and transition management. After reviewing these and related factors, the Committee and the Board concluded, within the context of their overall conclusions, that the nature, extent and quality of the services provided to the Fund under the Agreements supported the approval of the Management Agreement and the continuation of the Advisory Agreement and the Subadvisory Agreements.
Investment Performance
The Committee and the Board reviewed information about the performance of the Fund over various time periods, including performance information relative to benchmarks and information based on reports of the independent third-party data provider that compared the performance of the Fund to the performance of a group of comparable mutual funds, and data provided by the independent fee consultant. The Committee and the Board also reviewed a description of the third party’s methodology for identifying the Fund’s peer groups for purposes of performance and expense comparisons. Although the Fund’s performance lagged that of a relevant peer group for certain (although not necessarily all) periods, the Committee and the Board concluded that other factors relevant to performance were sufficient, in light of other considerations, to warrant continuation of the Advisory Agreement and the Subadvisory Agreements and approval of the Management Agreement. Those factors included one or more of the following: (i) that the Fund’s performance, although lagging in certain recent periods, was stronger over the longer term; (ii) that the underperformance was attributable, to a significant extent, to investment decisions that were reasonable and consistent with the Fund’s investment strategy and policies and that the Fund was performing within a reasonable range of expectations, given those investment decisions, market conditions and the Fund’s investment strategy; (iii) that the Fund’s performance was competitive when compared to other relevant performance benchmarks or peer groups; and (iv) that the Investment Manager had taken or was taking steps designed to help improve the Fund’s investment performance, including, but not limited to, replacing portfolio managers, enhancing the resources supporting the portfolio managers, or modifying investment strategies.
The Committee and the Board noted that, through December 31, 2014, the Fund’s performance was in the sixty-seventh percentile (where the best performance would be in the first percentile) of its category selected by the independent third-party data provider for the purposes of performance comparisons for the one-year period.
The Committee and the Board also considered the Investment Manager’s performance and reputation generally, the Investment Manager’s historical responsiveness to Board concerns about performance, and the Investment Manager’s willingness to take steps intended to improve performance. After reviewing these and related factors, the Committee and the Board concluded, within the context of their overall conclusions, that the performance of the Fund, the Investment Manager and the Subadvisers were sufficient, in light of other considerations, to warrant the continuation of the Advisory Agreement and the Subadvisory Agreements and the approval of the Management Agreement.
Investment Advisory Fee Rates and Other Expenses
The Committee and the Board considered the advisory fees charged to the Fund under the Advisory Agreement and the Subadvisory Agreement, as well as the total expenses incurred by the Fund. In assessing the reasonableness of the fees under the Advisory Agreement, the Committee and the Board considered, among other information, the Fund’s advisory fee and its total expense ratio as a percentage of average daily net assets. The Committee and the Board also considered that the proposed management fee would not exceed the sum of the fee rates payable under the Advisory Agreement and the Administrative Services Agreement. The Committee and the Board considered data provided by the independent fee consultant. The Committee and the Board noted that, as of December 31, 2014, the Fund’s actual management fee and net expense ratio are ranked in the second and fourth quintiles, respectively, (where the lowest fees and expenses would be in the first quintile) against the Fund’s expense universe as determined by the independent third party data provider for purposes of expense comparison. The Committee and the Board also considered the fees that each Subadviser charges to its other clients, and noted that the Investment Manager pays
| | |
| |
| ACTIVE PORTFOLIOS® MULTI-MANAGER SMALL CAP EQUITY FUND | | |
BOARD CONSIDERATION AND APPROVAL OF ADVISORY AGREEMENT AND SUBADVISORY AGREEMENTS (continued)
the fees of the Subadvisers. The Committee and the Board also took into account the fee waiver and expense limitation arrangements agreed to by the Investment Manager, as noted above.
The Committee and the Board also received and considered information about the advisory fees charged by the Investment Manager to institutional separate accounts. In considering the fees charged to those accounts, the Committee and the Board took into account, among other things, the Investment Manager’s representations about the differences between managing mutual funds as compared to other types of accounts, including differences in the services provided, differences in the risk profile of such business for the Investment Manager and the additional resources required to manage mutual funds effectively. The Committee and the Board received and considered information about the fees charged by the Investment Manager for sub-advisory services provided to comparable unaffiliated funds. In evaluating the Fund’s advisory fees, the Committee and the Board also took into account the demands, complexity and quality of the investment management of the Fund.
After reviewing these and related factors, the Committee and the Board concluded, within the context of their overall conclusions, that the advisory/management fee rates and expenses of the Fund were sufficient, in light of other considerations, to warrant the approval of the Management Agreement and continuation of the Advisory Agreement and the Subadvisory Agreements.
Costs of Services Provided and Profitability
The Committee and the Board also took note of the costs the Investment Manager and its affiliates incur in connection with the services provided (both on an absolute and relative basis) and the profitability to the Investment Manager and its affiliates in connection with their relationships with the Fund.
The Committee and the Board also considered the compensation directly or indirectly received by the Investment Manager’s affiliates in connection with their relationships with the Fund. The Committee and the Board reviewed information provided by management as to the profitability to the Investment Manager and its affiliates of their relationships with the Fund, information about the allocation of expenses used to calculate profitability, and comparisons of profitability levels realized in 2014 to profitability levels realized in 2013. When reviewing profitability, the Committee and the Board also considered court cases in which adviser profitability was an issue in whole or in part, the performance of similarly managed funds, the performance of the Fund, and the expense ratio of the Fund. The Committee and the Board also considered information provided by the Investment Manager regarding its financial condition and comparing its profitability to that of other asset management firms that are, or are subsidiaries of, publicly traded companies. Because the Subadvisory Agreements were negotiated at arms-length by the Investment Manager, which is responsible for payments to each Subadviser thereunder, the Committee and the Board did not consider the profitability to each Subadviser of its relationship with the Fund.
After reviewing these and related factors, the Committee and the Board concluded, within the context of their overall conclusions, that the costs of services provided and the profitability to the Investment Manager and its affiliates from their relationships with the Fund supported the approval of the Management Agreement and the continuation of the Advisory Agreement and the Subadvisory Agreements.
Economies of Scale
The Committee and the Board considered the potential existence of economies of scale in the provision by the Investment Manager of services to the Fund, to groups of related funds, and to the Investment Manager’s investment advisory clients as a whole, and whether those economies of scale were shared with the Fund through breakpoints in investment advisory fees or other means, such as expense limitation arrangements and additional investments by the Investment Manager in investment, trading and compliance resources. The Committee and the Board noted that the investment advisory and management fee schedules for the Fund contained breakpoints that would reduce the fee rate on assets above specified threshold levels.
The Committee and the Board noted that the breakpoints in the Advisory Agreement did not occur at the same levels as the breakpoints in the Subadvisory Agreements. The Committee and the Board noted that absent a shareholder vote, the Investment Manager would bear any increase in fees payable under the Subadvisory Agreements. The Committee and the Board also noted the potential challenges of seeking to tailor the Advisory Agreement breakpoints
| | |
| |
| | ACTIVE PORTFOLIOS® MULTI-MANAGER SMALL CAP EQUITY FUND |
BOARD CONSIDERATION AND APPROVAL OF ADVISORY AGREEMENT AND SUBADVISORY AGREEMENTS (continued)
to those of a subadvisory agreement in this context, and the effect that capacity constraints on a subadviser’s ability to manage assets could potentially have on the ability of the Investment Manager to achieve economies of scale, as new subadvisers may need to be added as the Fund grows, increasing the Investment Manager’s cost of compensating and overseeing the Fund’s subadvisers.
In considering these matters, the Committee and the Board also considered the costs of the services provided and the profitability to the Investment Manager and its affiliates from their relationships with the Fund, as discussed above. After reviewing these and related factors, the Committee and the Board concluded, within the context of their overall conclusions, that the extent to which any economies of scale were expected to be shared with the Fund supported the approval of the Management Agreement and the continuation of the Advisory Agreement and the Subadvisory Agreements.
Other Benefits to the Investment Manager
The Committee and the Board received and considered information regarding “fall-out” or ancillary benefits received by the Investment Manager and its affiliates as a result of their relationships with the Fund, such as the engagement of the Investment Manager to provide administrative services to the Fund and the engagement of the Investment Manager’s affiliates to provide distribution and transfer agency services to the Fund. In this regard, among other matters, the Committee and the Board considered that the Fund’s distributor retains a portion of the distribution fees from the Fund and receives a portion of the sales charges on sales or redemptions of certain classes of shares of the Fund. The Committee and the Board also considered the benefits of research made available to the Investment Manager by reason of brokerage commissions generated by the Fund’s securities transactions, and reviewed information about the Investment Manager’s practices with respect to allocating portfolio transactions for brokerage and research services. The Committee and the Board considered the possible conflicts of interest associated with certain fall-out or other ancillary benefits and the reporting, disclosure and other processes that are in place to address such possible conflicts of interest. The Committee and the Board recognized that the Investment Manager’s profitability would be somewhat lower without these benefits.
Conclusion
The Committee and the Board reviewed all of the above considerations in reaching their decisions to recommend or approve the Management Agreement and the continuation of the Advisory Agreement and the Subadvisory Agreements. In their deliberations, the Trustees did not identify any particular information that was all-important or controlling, and individual Trustees may have attributed different weights to the various factors. Based on their evaluation of all factors that they deemed to be material, including those factors described above, and assisted by the advice of independent legal counsel, the Board, including the Independent Trustees, voting separately, unanimously approved the Management Agreement and the continuation of the Advisory Agreement and the Subadvisory Agreements.
| | |
| |
| ACTIVE PORTFOLIOS® MULTI-MANAGER SMALL CAP EQUITY FUND | | |
IMPORTANT INFORMATION ABOUT THIS REPORT
Each fund mails one shareholder report to each shareholder address. If you would like more than one report, please call shareholder services at 800.345.6611 and additional reports will be sent to you.
The policy of the Board is to vote the proxies of the companies in which each fund holds investments consistent with the procedures as stated in the Statement of Additional Information (SAI). You may obtain a copy of the SAI without charge by calling 800.345.6611; contacting your financial intermediary; visiting columbiathreadneedle.com/us; or searching the website of the Securities and Exchange Commission (SEC) at sec.gov. Information regarding how each fund voted proxies relating to portfolio securities is filed with the SEC by August 31st for the most recent 12-month period ending June 30th of that year, and is available without charge by visiting columbiathreadneedle.com/us, or searching the website of the SEC at sec.gov.
Each fund files a complete schedule of portfolio holdings with the SEC for the first and third quarters of each fiscal year on Form N-Q. Each fund’s Form N-Q is available on the SEC’s website at sec.gov and may be reviewed and copied at the SEC’s Public Reference Room in Washington, D.C. Information on the operation of the Public Reference Room may be obtained by calling 800.SEC.0330. Each fund’s complete schedule of portfolio holdings, as filed on Form N-Q, can also be obtained without charge, upon request, by calling 800.345.6611.
Active Portfolios® Multi-Manager Small Cap Equity Fund
P.O. Box 8081
Boston, MA 02266-8081
This information is for use with concurrent or prior delivery of a fund prospectus. Please read and consider the investment objectives, risks, charges and expenses for any fund carefully before investing. For a prospectus and summary prospectus, which contains this and other important information about the Fund, go to columbiathreadneedle.com/us. The Fund is distributed by Columbia Management Investment Distributors, Inc., member FINRA, and managed by Columbia Management Investment Advisers, LLC.
Columbia Threadneedle Investments (Columbia Threadneedle) is the global brand name of the Columbia and Threadneedle group of companies. All rights reserved. Columbia Management Investment Distributors, Inc., 225 Franklin Street, Boston, MA 02110-2804
© 2015 Columbia Management Investment Advisers, LLC.
columbiathreadneedle.com/us
ANN102_08_E01_(10/15)

ANNUAL REPORT
August 31, 2015

ACTIVE PORTFOLIOS® MULTI-MANAGER ALTERNATIVE STRATEGIES FUND

PRESIDENT’S MESSAGE

Dear Shareholder,
Today’s investors are typically focused on outcomes, like living a certain retirement lifestyle, paying for college education or building a legacy. But in today’s complex global investment landscape, even simple goals are not easily achieved.
At Columbia Threadneedle Investments, we aspire to help satisfy five core needs of today’s investors:
| | n | | Generate an appropriate stream of income in retirement |
Traditional approaches to generating income may not provide the diversification benefits they once did, and they may actually introduce unwanted risk in today’s market. To seek to improve your potential to live comfortably long term, we endeavor to pursue investments that explore less traveled paths to income.
| n | | Navigate a changing interest rate environment |
Today’s uncertain market environment includes the prospect of a rise in interest rates. Blending traditional investments with non-traditional or alternative products may help protect your wealth during periods of volatility. We can attempt to help strengthen your portfolio with agile products designed to take on the market’s ups and downs.
| n | | Maximize after-tax returns |
In an environment where what you keep may be more important than what you earn, municipal bonds can help mitigate high tax burdens while providing potentially attractive yields. Our state and federal tax-exempt products are aimed at helping investors manage risk, minimize the fluctuation of capital and grow wealth on a more tax-efficient basis.
| n | | Grow assets to achieve financial goals |
We believe that finding and protecting growth comes from a disciplined security selection process designed to create excess return. Our goal is to provide investment solutions built to help you face today’s market challenges and grow your assets at each crossroad of your journey.
| n | | Ease the impact of volatile markets |
Despite a bull market run that has benefited many investors over the past several years, it’s important to remember the lessons of 2008 and the value that a well-diversified portfolio may provide through times of market volatility. We are here to help you hold onto the savings you have worked tirelessly to amass, and to provide you the best opportunity to maintain your standard of living regardless of market conditions.
Find out today how we can help you confidently invest to realize your dreams. Please visit us at blog.columbiathreadneedleus.com/our-best-ideas to learn more about our unique investment solutions.
The world is constantly changing, but our priority remains the same: to help you secure your finances, meet your goals and achieve success. Thank you for your continued investment with us.
Sincerely,

Christopher O. Petersen
President, Columbia Funds
Investors should consider the investment objectives, risks, charges and expenses of a mutual fund carefully before investing. For a free prospectus and summary prospectus, which contains this and other important information about a fund, visit columbiathreadneedle.com/us. The prospectus should be read carefully before investing.
Columbia Funds are distributed by Columbia Management Investment Distributors, Inc., member FINRA, and managed by Columbia Management Investment Advisers, LLC.
© 2015 Columbia Management Investment Advisers, LLC. All rights reserved.
Annual Report 2015
| | |
| |
| ACTIVE PORTFOLIOS® MULTI-MANAGER ALTERNATIVE STRATEGIES FUND | | |
TABLE OF CONTENTS
Fund Investment Manager
Columbia Management Investment
Advisers, LLC
225 Franklin Street
Boston, MA 02110
Fund Distributor
Columbia Management Investment
Distributors, Inc.
225 Franklin Street
Boston, MA 02110
Fund Transfer Agent
Columbia Management Investment
Services Corp.
P.O. Box 8081
Boston, MA 02266-8081
For more information about any of the funds, please visit columbiathreadneedle.com/us or call 800.345.6611. Customer Service Representatives are available to answer your questions Monday through Friday from 8 a.m. to 7 p.m. Eastern time.
The views expressed in this report reflect the current views of the respective parties. These views are not guarantees of future performance and involve certain risks, uncertainties and assumptions that are difficult to predict, so actual outcomes and results may differ significantly from the views expressed. These views are subject to change at any time based upon economic, market or other conditions and the respective parties disclaim any responsibility to update such views. These views may not be relied on as investment advice and, because investment decisions for a Columbia fund are based on numerous factors, may not be relied on as an indication of trading intent on behalf of any particular Columbia fund. References to specific securities should not be construed as a recommendation or investment advice.
Annual Report 2015
| | |
| |
| | ACTIVE PORTFOLIOS® MULTI-MANAGER ALTERNATIVE STRATEGIES FUND |
PERFORMANCE OVERVIEW
Performance Summary
| n | | Active Portfolios® Multi-Manager Alternative Strategies Fund (the Fund) Class A shares returned -2.30% for the 12-month period that ended August 31, 2015. |
| n | | The Fund underperformed its benchmark, the Citi Three-Month U.S. Treasury Bill Index, which returned 0.02% over the same period. |
| n | | The Fund’s underperformance can be attributed primarily to implementation of various alternative strategies. |
| | | | | | | | | | |
Average Annual Total Returns (%) (for period ended August 31, 2015) | | | | | | | | | | |
| | | Inception | | 1 Year | | | Life | |
Class A | | 04/23/12 | | | -2.30 | | | | 2.81 | |
Citi Three-Month U.S. Treasury Bill Index | | | | | 0.02 | | | | 0.05 | |
All results shown assume reinvestment of distributions during the period. Returns do not reflect the deduction of taxes that a shareholder may pay on Fund distributions or on the redemption of Fund shares. Performance results reflect the effect of any fee waivers or reimbursements of Fund expenses by Columbia Management Investment Advisers, LLC and/or any of its affiliates. Absent these fee waivers or expense reimbursement arrangements, performance results would have been lower.
The performance information shown represents past performance and is not a guarantee of future results. The investment return and principal value of your investment will fluctuate so that your shares, when redeemed, may be worth more or less than their original cost. Current performance may be lower or higher than the performance information shown. You may obtain performance information current to the most recent month-end by contacting your financial intermediary, visiting columbiathreadneedle.com/us or calling 800.345.6611.
The Citi Three-Month U.S. Treasury Bill Index, an unmanaged index, is representative of the performance of three-month Treasury bills.
Indices are not available for investment, are not professionally managed and do not reflect sales charges, fees, brokerage commissions, taxes or other expenses of investing. Securities in the Fund may not match those in an index.
| | |
| |
| ACTIVE PORTFOLIOS® MULTI-MANAGER ALTERNATIVE STRATEGIES FUND | | |
PERFORMANCE OVERVIEW (continued)
|
Performance of a Hypothetical $10,000 Investment (April 23, 2012 — August 31, 2015) |
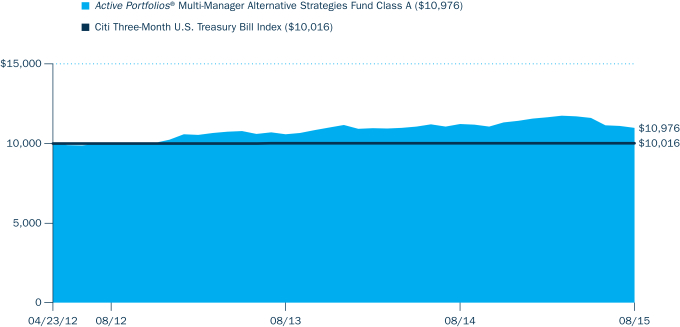
The chart above shows the change in value of a hypothetical $10,000 investment in Class A shares of Active Portfolios® Multi-Manager Alternative Strategies Fund during the stated time period, and does not reflect the deduction of taxes that a shareholder may pay on Fund distributions or on the redemption of Fund shares.
| | |
| |
| | ACTIVE PORTFOLIOS® MULTI-MANAGER ALTERNATIVE STRATEGIES FUND |
MANAGER DISCUSSION OF FUND PERFORMANCE
Portfolio Management
AQR Capital Management, LLC
Clifford Asness, Ph.D., M.B.A.
Brian Hurst
John Liew, Ph.D., M.B.A.
Yao Hua Ooi
Ari Levine, M.S.
Wasatch Advisors, Inc.
Michael Shinnick
Ralph Shive, CFA
Water Island Capital, LLC
Edward Chen
Roger Foltynowicz, CAIA
Gregg Loprete
Todd Munn
| | | | |
Portfolio Breakdown — Long Positions (%) (at August 31, 2015) | |
Common Stocks | | | 51.6 | |
Convertible Bonds | | | 0.2 | |
Corporate Bonds & Notes | | | 3.5 | |
Exchange-Traded Funds | | | 0.2 | |
Limited Partnerships | | | 0.8 | |
Options Purchased Calls | | | 0.2 | |
Options Purchased Puts | | | 0.4 | |
Treasury Bills | | | 13.5 | |
Short-Term Investments Segregated in Connection with Open Derivatives Contracts(a) | | | 46.0 | |
Total | | | 116.4 | |
Percentages indicated are based upon total investments. The Fund’s portfolio composition is subject to change.
| (a) | Includes investments in Money Market Funds (amounting to $301.4 million) which have been segregated to cover obligations relating to the Fund’s investment in derivatives which provide exposure to multiple markets. For a description of the Fund’s investments in derivatives, see Investments in Derivatives following the Consolidated Portfolio of Investments and Note 2 to the Notes to Consolidated Financial Statements. |
| | | | |
Portfolio Breakdown — Short Positions (%) (at August 31, 2015) | |
Common Stocks | | | (12.1 | ) |
Corporate Bonds & Notes | | | (0.4 | ) |
Exchange-Traded Funds | | | (3.6 | ) |
Limited Partnerships | | | (0.3 | ) |
Total | | | (16.4 | ) |
Percentages indicated are based upon total investments. The Fund’s portfolio composition is subject to change.
The Fund is managed by three independent money management firms and each invests a portion of the portfolio’s assets. As of August 31, 2015, AQR Capital Management, LLC (AQR), Wasatch Advisors, Inc. (Wasatch) and Water Island Capital, LLC (Water Island) managed approximately 40%, 29% and 31% of the portfolio, respectively. While the Fund’s benchmark is the Citi Three-Month U.S. Treasury Bill Index, Wasatch also compares the performance of its portion of the Fund to the S&P 500 Index.
For the 12-month period that ended August 31, 2015, the Fund’s Class A shares returned -2.30%. The Fund underperformed its benchmark, the Citi Three-Month U.S. Treasury Bill Index, which returned 0.02% over the same period. The Fund’s underperformance can be attributed primarily to implementation of various alternative strategies.
Challenging Financial Markets
Both global equity and bond markets struggled during the fiscal period, as central bank policy, currency movements and sharply falling oil prices each had a great impact. Both the European Central Bank and the Bank of Japan employed easier monetary policy in an effort to stimulate economic growth. With interest rates near zero in both regions, the Euro and the Yen fell against the U.S. dollar, which helped increase exports, an important source of revenue to companies in Europe and Japan. At the same time, the weak currencies reduced returns denominated in U.S. dollars. Meanwhile, U.S. equity and bond markets were focused on the timing of the first interest rate increase by the Federal Reserve (the Fed) since 2006. While early expectations had been for a June 2015 rate hike, significant market volatility and uncertainty in the global markets pushed expectations to the Fed’s September or December 2015 meetings.
Global financial market volatility surged in the summer months. Greece teetered on the brink of financial collapse, while the domestic Chinese equity market began a dramatic correction. Weakening Chinese economic data and the devaluation of the yuan weighed on global markets, and also led to concerns regarding the demand for many commodities, including oil, which saw a precipitous drop in price. In turn, U.S. equities posted their biggest monthly decline since 2012, in August 2015 and European and emerging markets equities saw steep losses as well. Volatility in currencies also spiked in August. In fixed income, increased financial market volatility discouraged investors from holding “risk assets.” Instead, investors sought relative safety in U.S. Treasury securities, widening investment-grade and high-yield credit spreads
Contributors and Detractors
AQR: Our portion of the Fund, which pursues an active managed futures strategy through investments primarily in futures contracts and futures-related instruments, outperformed the benchmark during the fiscal period. We invest in futures and forward contracts, both long and short, across the global equity, fixed-income, commodity and currency markets. We implement our strategy by using these derivative instruments because we believe they offer the most liquid, low cost and efficient way to gain market exposure. We utilize both short-term and long-term trend-following signals to attempt to profit from different types of trends that occur in each of these markets. Trend following can be simply described as taking long positions in markets
| | |
| |
| ACTIVE PORTFOLIOS® MULTI-MANAGER ALTERNATIVE STRATEGIES FUND | | |
MANAGER DISCUSSION OF FUND PERFORMANCE (continued)
that are rising in price and taking short positions in markets that are falling in price. In addition to trend-following signals, we also incorporate signals that seek to identify over-extended trends and seek to reduce risk when the chance of a reversal is perceived as higher than normal, since market reversals generally cause losses for trend-following strategies.
By asset class, equities detracted from our portion of the Fund’s performance during the period, while fixed income, commodities and currencies contributed positively. By signal, short-term trend following signals, long-term trend-following signals and over-extended trend signals, the latter of which attempt to identify trends that have gone too far and are due for reversals, each contributed positively. Trend following in commodities was the largest positive contributor to performance in our portion of the Fund during the period. During the latter months of 2014, the majority of gains came from short positions in energy commodities, which fell as supply increased relative to demand. On the other hand, short positions in agricultural commodities detracted amid significant market reversals. Many of these trends continued into 2015, as declines in energies and sell-offs in base metals and some agricultural softs, such as sugar, benefited the strategy. (Soft commodities are those that are grown rather than mined.) Over-extended signals were strong contributors to our portion of the Fund’s performance in 2015, as a number of over-extended trends reversed. In February 2015, the rally in commodities interrupted the strong bearish trend from late 2014 and into early 2015. Bearish commodity strategies, particularly in energies, performed strongly through the middle of 2015.
Currencies also contributed positively to our portion of the Fund’s performance during the period. Toward the end of 2014, the U.S. dollar rallied against most major developed and emerging currencies, driven by central bank divergences. The Federal Reserve (the Fed) ended quantitative easing, while the Bank of Japan launched massive stimulus measures, and the European Central Bank commenced stimulus, starting with its covered bond purchase program and ultimately its version of quantitative easing. These divergences helped create a strong bullish trend in the U.S. dollar, which carried over to 2015.
Equities detracted from our portion of the Fund’s performance during the period. Toward the end of 2014, global equities experienced a sharp correction as quantitative easing ended in the U.S. and the possibility of a spreading Ebola virus and weakening global economic growth increased risk aversion. When equity markets snapped back, long-term signals did not respond as quickly as short-term signals, causing them to hold onto their losses. In early 2015, developed equities experienced historic rallies, as the European Central Bank launched its quantitative easing program. However, a pullback in the second quarter of 2015, on worries about a Greek exit from the Eurozone, led to reversals and losses. Global equities continued to decline into the summer of 2015, as weakness in China led to a correction in emerging markets broadly. Toward the end of the period, our strategy became net short in both emerging and developed market equities.
Wasatch: Our portion of the Fund, which implements a long/short equity strategy, underperformed the benchmark during the period. The performance of our portion of the Fund can be attributed primarily to a sizable overweight to and weak stock selection within the energy sector relative to the S&P 500
| | | | |
Equity Sector Breakdown —Long Positions (%) (at August 31, 2015) | |
Consumer Discretionary | | | 9.4 | |
Consumer Staples | | | 4.0 | |
Energy | | | 11.3 | |
Financials | | | 17.9 | |
Health Care | | | 15.4 | |
Industrials | | | 15.3 | |
Information Technology | | | 17.6 | |
Materials | | | 5.7 | |
Telecommunication Services | | | 2.7 | |
Utilities | | | 0.7 | |
Total | | | 100.0 | |
Percentages indicated are based upon total long equity investments. The Fund’s portfolio composition is subject to change.
| | | | |
Equity Sector Breakdown — Short Positions (%) (at August 31, 2015) | |
Consumer Discretionary | | | (27.7 | ) |
Consumer Staples | | | (11.1 | ) |
Energy | | | (7.1 | ) |
Financials | | | (10.5 | ) |
Health Care | | | (6.6 | ) |
Industrials | | | (12.1 | ) |
Information Technology | | | (18.8 | ) |
Materials | | | (0.9 | ) |
Telecommunication Services | | | (1.8 | ) |
Utilities | | | (3.4 | ) |
Total | | | (100.0 | ) |
Percentages indicated are based upon total short equity investments. The Fund’s portfolio composition is subject to change.
| | |
| |
| | ACTIVE PORTFOLIOS® MULTI-MANAGER ALTERNATIVE STRATEGIES FUND |
MANAGER DISCUSSION OF FUND PERFORMANCE (continued)
| | | | |
Market Exposure Through Derivatives Investments (% of notional exposure) (at August 31, 2015) (a) | |
Fixed Income Derivative Contracts | | | 56.1 | |
Commodities Derivative Contracts | | | (6.1 | ) |
Equity Derivative Contracts | | | (2.9 | ) |
Forward Foreign Currency Exchange Contracts | | | 52.9 | |
Total Notional Market Value of Derivative Contracts | | | 100.0 | |
| (a) | The Fund has market exposure to fixed income, equity and commodities asset classes through its investments in futures and swap contracts, and market exposure to foreign currencies through its investments in forward foreign currency exchange contracts. Futures and swap contracts and forward foreign currency exchange contracts are derivative instruments. The Fund may have long or short market exposures. Reflects notional market value of futures and swap contracts and forward foreign currency exchange contracts. The notional exposure of a financial instrument is the nominal or face amount that is used to calculate payments made on that instrument and/or changes in value for the instrument. The notional exposure is a hypothetical underlying quantity upon which payment obligations are computed. Notional exposures provide a gauge for how the Fund may behave given changes in individual markets. Notional amounts for each derivative contract are shown in the Consolidated Portfolio of Investments. At period end, the notional amount of all outstanding derivative contracts is $1,308,801,984. For a description of the Fund’s investments in derivatives, see Investments in Derivatives following the Consolidated Portfolio of Investments, and Note 2 to the consolidated financial statements. At period end, the Fund held investments in money market funds (amounting to $301,435,396), which have been segregated to cover obligations relating to the Fund’s investment in derivatives. For further information on these holdings, see the Portfolio Holdings table below and the Consolidated Portfolio of Investments. |
Index. During the period, there was a sharp decline in the price of oil, which impacted energy-related equities. Our expectation that OPEC would cut production to maintain a price floor did not come to fruition. The energy companies in our portion of the Fund were selected for what we considered to be their ability to navigate a pullback in commodity prices on the basis of their significant cash flow generation with reduced capital plans and no near-term debt maturities. Yet, we believe the market penalized the sector as if some of these companies were impaired or would not be able to make it through the downturn. We reduced our portion of the Fund’s exposure to the energy sector during the period and repositioned holdings to focus on companies that we believe may benefit when energy prices begin moving up as a result of growing worldwide demand and reduced supply. Relative to the S&P 500 Index, long and short positions in industrials, long positions in financials and short positions in materials and health care further detracted, albeit more modestly, from our portion of the Fund’s results.
The strongest contributing sectors on the long side of the portfolio on a relative basis to the S&P 500 Index were telecommunication services, utilities and materials. On the short side of the portfolio, the strongest contributing sectors were consumer staples, information technology and consumer discretionary. Equity market concerns and risks regarding equity valuation levels after a six-year cyclical recovery resulted in more short opportunities for our portion of the Fund than we had seen in the prior fiscal year.
Positions in three oil and gas exploration and production companies detracted most from our portion of the Fund’s relative results — Denbury Resources, Bill Barrett and Unit, each of which were impacted by lower energy prices. We maintained our portion of the Fund’s positions in all three of these companies, as we believe each maintains healthy fundamentals and is well positioned to benefit from longer-term strengthening in energy prices.
The biggest individual contributors to our portion of the Fund’s results were specialty supermarket operator Sprouts Farmers Markets, cloud-based analytics and business intelligence software provider TIBCO Software and retailer Target. A short position in Sprouts Farmers Markets proved beneficial, as the company faced a difficult environment fueled by weak same-store sales comparisons and pressure on produce margins. Shares of TIBCO Software gained on the announcement of the company’s acquisition at a premium by a private equity firm in the fourth quarter of 2014. Target performed well, as the retailer regained its footing after a 2013 customer data breach stunted its revenue and earnings.
We held two covered call positions — one on Apple and one on TIBCO Software — during the period. Both positions were small, held for a short period and had minimal impact on the portfolio.
Water Island: We invest our portion of the Fund in equity and debt securities of companies whose prices we believe are being or will be impacted by a corporate event. Our investment strategies are designed to capture price movements generated by publicly announced or anticipated corporate events such as mergers, acquisitions, asset sales, restructurings, refinancings, recapitalizations, reorganizations or other special situations. Our portion of the Fund underperformed the benchmark during the period. Merger arbitrage
| | |
| |
| ACTIVE PORTFOLIOS® MULTI-MANAGER ALTERNATIVE STRATEGIES FUND | | |
MANAGER DISCUSSION OF FUND PERFORMANCE (continued)
was our top performing sub-strategy during the period, while both the equity special situations and credit opportunities sub-strategies detracted from results. Our portion of the Fund’s results were driven primarily by the movements of its investments in specific idiosyncratic events. A number of our equity special situations holdings experienced heightened volatility amid macroeconomic uncertainties, including geopolitical concerns in Europe and Asia, such as the Greek debt crisis and fears of an economic slowdown in China. At the end of the period, we retained our conviction in most of these situations and felt that much of the impact was simply mark-to-market movement. (Mark-to-market is the accounting act of recording the price or value of a security to reflect its current market value rather than its book value.)
The largest detractors from our portion of the Fund’s results during the period were an equity special situations investment in Genworth Financial, a credit opportunities investment in NII Holdings and the merger between Sabine Oil & Gas and Forest Oil. Following surprisingly poor third quarter 2014 earnings, shares of Genworth Financial, a life insurance and mortgage insurance company, fell significantly. Despite our view that its mortgage insurance division would be its key driver of shareholder value, we were disappointed by the results of the company’s struggling long-term care division and believed the overhang would slow the positive momentum from its mortgage insurance business. We therefore exited the position. NII Holdings is a wireless telecommunications service provider, focusing on markets in Mexico, Brazil and Argentina. The company filed for bankruptcy protection in September 2014. We established a position in its debt early in 2015 after a group of its largest creditors agreed on a reorganization plan that we believed offered the company’s creditors attractive risk-adjusted returns upon emergence from Chapter 11. However, during the second quarter of 2015, the company exited bankruptcy proceedings and restricted holders were permitted to sell part of their holdings, thereby pressuring prices. Our investment thesis for the merger between Sabine Oil & Gas and Forest Oil was that Sabine Oil & Gas would refinance its 2017 9.75% bonds to extend the runway for the post-merger company. While the deal closed in December 2014, due to lower oil prices and a lack of cheaper financing, the company chose instead to leave those bonds outstanding. Consequently, we were subject to the high yield market’s lack of liquidity and widening price action for this position.
The largest contributors to our portion of the Fund’s performance during the period were investments in Teva Pharmaceuticals Industries (Teva), T-Mobile and the merger between Allergan and Actavis. During the period, Perrigo, Mylan and Teva jostled to either begin an acquisition or to prevent themselves from being acquired. Mylan launched an unsolicited offer for Perrigo, while simultaneously warding off an unsolicited offer it received from Teva. We believed Teva could afford to bide its time, while Mylan was under certain time pressures. Teva ultimately abandoned its pursuit of Mylan and opted instead to acquire Allergan’s generic drug division for $41 billion. Teva shares rose during the course of the saga, and our portion of the Fund profited. Positive sentiment based on increasing subscriber growth and rumors that Deutsche Telekom, the largest shareholder of T-Mobile, was looking to sell its stake contributed to a rise in T-Mobile’s share price during the period. In November 2014, Actavis made a bid worth $65 billion for Allergan, which sports a robust portfolio of medical aesthetic drugs and
Investment Risks
Market risk may affect a single issuer, sector of the economy, industry or the market as a whole. Investing in derivatives is a specialized activity that involves special risks that subject the fund to significant loss potential, including when used as leverage, and may result in greater fluctuation in fund value. Commodity investments may be affected by the overall market and industry- and commodity-specific factors, and may be more volatile and less liquid than other investments. Fixed-income securities present issuer default risk. Non-investment-grade (high-yield or junk) securities present greater price volatility and more risk to principal and income than higher rated securities. A rise in interest rates may result in a price decline of fixed-income instruments held by the Fund, negatively impacting its performance and NAV. Falling rates may result in the Fund investing in lower yielding debt instruments, lowering the Fund’s income and yield. These risks may be heightened for longer maturity and duration securities. International investing involves certain risks and volatility due to potential political, economic or currency instabilities and different financial and accounting standards. Certain issuer events, including initial public offerings, business consolidation or restructuring, may present heightened risks to securities from the high degree of uncertainty associated with such events. Short positions (where the underlying asset is not owned) can create unlimited risk. Risks are enhanced for emerging market and sovereign debt issuers. The Fund is managed by multiple advisers independently of one another, which may result in contradicting trades (i.e., with no net benefit to the Fund), while increasing transaction costs. As a non-diversified fund, fewer investments could have a greater affect on performance. Market or other (e.g., interest rate) environments may adversely affect the liquidity of fund investments, negatively impacting their price. Generally, the less liquid the market at the time the Fund sells a holding, the greater the risk of loss or decline of value to the Fund. See the Fund’s prospectus for information on these and other risks.
| | |
| |
| | ACTIVE PORTFOLIOS® MULTI-MANAGER ALTERNATIVE STRATEGIES FUND |
MANAGER DISCUSSION OF FUND PERFORMANCE (continued)
products, the most well-known being Botox. The deal closed in March 2015, and our portion of the Fund profited by holding a core position in Allergan.
From a country perspective, positions in the U.S., Canada and Greece detracted most from relative results. Countries that made the strongest positive contribution to results were Israel, the Netherlands and the United Arab Emirates.
During the period, our portion of the Fund employed total return equity swaps, equity options and currency forwards for four core purposes: to hedge currency risk, to invest outside the U.S. more efficiently, to create income and optionality, and to limit volatility and correlation. During the period ended August 31, 2015, these derivatives modestly detracted from our portion of the Fund’s performance.
Changes Based On Strategy Implementation
The Fund’s portfolio turnover rate for the 12-month period was 304%.
AQR: Our portion of the Fund entered 2015 long in developed bond and short-term interest rate futures markets, with over-extended signals mitigating the sizes of those positions. In currencies, U.S. dollar exposures were reduced during the first quarter of 2015, as they looked expensive and were further reduced in the second calendar quarter of 2015 due to significant reversals leading to signal disagreement. As of the end of August 2015, our portion of the Fund was slightly long in the U.S. dollar vs. most other currencies, short in the Japanese yen vs. other currencies and flat to slightly long in the euro vs. other currencies. In commodities, our portion of the portfolio ended August 2015 with a short position in the asset class. We reduced short exposures in energies, grains and softs but increased short exposures in base and precious metals. The largest short positions as of the end of August 2015 were in gold, corn and natural gas. The strategy has recently become net short in both emerging and developed equities.
Wasatch: During the period, we increased our portion of the Fund’s allocation to industrials, initiating a new long position in United Continental Holdings. We also established long positions in United Parcel Service and Emerson Electric. We sold our portion of the Fund’s position in Southwest Airlines, which had performed well for the portfolio. Across the sector spectrum, historically high valuations for equities created more company-specific opportunities to increase our portion of the Fund’s short exposure. The portfolio’s short exposure increased from 12% of net assets across 14 positions at the start of the annual period to 21% of net assets across 19 names as of August 31, 2015.
Our portion of the Fund’s allocation to the energy sector declined, in large part due to stock depreciation, though it still remained overweight relative to the S&P 500 Index. At the same time, we worked to reposition the energy weighting in companies that we believe are most attractively valued and best suited to benefit as energy prices increase over time. We sold our portion of the Fund’s position in Occidental Petroleum. While we like the company, our view was that there was a better opportunity to rotate capital into other existing energy positions. Our portion of the Fund’s allocation to the financials sector was also reduced, as we trimmed holdings in real estate investment trusts as interest rates declined. We also eliminated a number of insurance and bank positions during the first half of 2015 on a
| | |
| |
| ACTIVE PORTFOLIOS® MULTI-MANAGER ALTERNATIVE STRATEGIES FUND | | |
MANAGER DISCUSSION OF FUND PERFORMANCE (continued)
view that U.S. long-term interest rates would likely stay lower for longer given the more aggressive central bank bond market interventions in Europe and Japan. Elsewhere, we sold our portion of the Fund’s position in information technology giant Apple. Apple had been a successful holding for the portfolio, but we sold the position primarily due to valuation.
Water Island: During the period, we established positions in the mergers between Martha Stewart Omnimedia and Sequential Brands Group, and between Kythera Biopharmaceutical and Allergan. Upon successful deal closings, our portion of the Fund no longer held a position in the acquisition of TRW Automotive Holdings by ZF Friedrichshafen or in the merger between Life Time Fitness and Leonard Green & Partners LP. Any shifts in sector exposure were largely the result of the available opportunity set in terms of corporate activity and the subset of events that met our risk/reward criteria. That said, one of the sectors that saw the most significant increase in corporate activity during the period was health care. As always, we seek returns driven by the outcomes of specific, idiosyncratic corporate events, rather than by the overall market. Our strategy is agnostic in terms of capitalization, style, sector or country weighting.
Looking Ahead
AQR: At the end of the period, our portion of the Fund was positioned long in equities driven by longer-term signals, while short-term signals were varied due to market reversals. Based on bullish trends in Asian markets, the largest long positions in our portion of the Fund as of August 31, 2015 included the Hang Seng Index, Japan Topix and the Russell 2000 Index. In fixed income, exposures at the end of August 2015 decreased significantly, as our signals model turned short several bond markets during the sell-off, and there was disagreement between long-term and short-term signals. Within this asset class, the largest long positions in our portion of the Fund at the end of the annual period included those in the two-year U.S. Treasury, Eurodollar futures and Euro Buxl 30-Year Bond.
Wasatch: Overall, at the end of the period, we believed the key macro considerations likely to impact the equity market in the year ahead would be the timing and pace of Fed short-term interest rate increases, the amount of slowdown in economic growth in China and whether there will be additional or new quantitative easing efforts in the developed market economies of the U.S., Europe and Japan. We have consciously and explicitly maintained our portion of the Fund’s overweight to the energy sector. We currently believe there is the most upside opportunity at this time in the energy sector, with modest interest rate increases and continued aggressive stimulus measures within China and the larger developed economies to sustain growth. Related renewed focus on tangible asset values as digital currency continues to be created to fund government debt purchases further supports our stance, in our view. While we currently do not anticipate more pronounced slowing or recession in the U.S. and other parts of the world, the likelihood or risk of such could cause us to further reduce our net long stance through additional short positions.
| | |
| |
| | ACTIVE PORTFOLIOS® MULTI-MANAGER ALTERNATIVE STRATEGIES FUND |
MANAGER DISCUSSION OF FUND PERFORMANCE (continued)
Water Island: Within the mergers and acquisitions space, we were witnessing not only record levels of deal flow toward the end of the period but also a broadening of activity across sectors and market capitalizations. With what we consider to be this healthy environment as well as a more optimal spread environment than we have seen in years, we expect that our merger arbitrage team should be able to focus on constructing a portfolio that avoids deals at the riskiest end of the spectrum yet still offers favorable rates of return. On the equity special situations side, mergers and acquisitions are delivering both pre-arbitrage and post-deal re-rating situations. Combined with a flood of shareholder activism and spin-off activity, we currently see ample opportunity in the equity markets. While a number of our equity special situations trades experienced elevated levels of volatility relative to our other sub-strategies, we maintain high conviction in these names. We believe our theses are sound, and we feel patience is warranted as we wait for these situations to play out. For our credit opportunities team, we foresee opportunity looming in the energy and commodities space following the dislocation in oil prices. Capital structures for many companies in these sectors have been severely weakened. At the other end of the spectrum, however, we believe the increase in merger and acquisition activity may translate into more merger-related debt opportunities. We also expect activist pressure on corporate managements to translate into more spin-offs and asset sales, which in turn, could lead to more refinancing and deleveraging activity from which to choose. We are particularly fond of these types of investments, as their firmer catalysts and shorter durations can help produce lower correlated and less volatile returns.
Finally, as the Fed will begin to ratchet interest rates upward at some point, we continue to take steps to reduce potential liquidity risks, particularly by focusing on the aforementioned firmer, shorter dated catalysts, increasing the number of short credit ideas we implement, tempering the pace at which we build positions in bonds with high exchange-traded fund ownership, maintaining higher cash levels and increasing our opportunistic hedging programs. We intend to stay true to our discipline of capitalizing on corporate actions by understanding the rationale and underlying complexities of each event, sharing insights between our teams, dynamically allocating among our sub-strategies, using hedging to mitigate market influence and building a well-diversified portfolio. We maintain a focus on risk management with a keen eye toward downside protection.
| | |
| |
| ACTIVE PORTFOLIOS® MULTI-MANAGER ALTERNATIVE STRATEGIES FUND | | |
UNDERSTANDING YOUR FUND’S EXPENSES
(Unaudited)
As an investor, you incur two types of costs. There are transaction costs, which generally include sales charges on purchases and may include redemption fees. There are also ongoing costs, which generally include management fees, distribution and/or service fees, and other fund expenses. The following information is intended to help you understand your ongoing costs (in dollars) of investing in the Fund and to help you compare these costs with the ongoing costs of investing in other mutual funds.
Analyzing Your Fund’s Expenses
To illustrate these ongoing costs, we have provided examples and calculated the expenses paid by investors of the Fund during the period. The actual and hypothetical information in the table is based on an initial investment of $1,000 at the beginning of the period indicated and held for the entire period. Expense information is calculated two ways and each method provides you with different information. The amount listed in the “Actual” column is calculated using the Fund’s actual operating expenses and total return for the period. You may use the Actual information, together with the amount invested, to estimate the expenses that you paid over the period. Simply divide your account value by $1,000 (for example, an $8,600 account value divided by $1,000 = 8.6), then multiply the results by the expenses paid during the period under the “Actual” column. The amount listed in the “Hypothetical” column assumes a 5% annual rate of return before expenses (which is not the Fund’s actual return) and then applies the Fund’s actual expense ratio for the period to the hypothetical return. You should not use the hypothetical account values and expenses to estimate either your actual account balance at the end of the period or the expenses you paid during the period. See “Compare With Other Funds” below for details on how to use the hypothetical data.
Compare With Other Funds
Since all mutual funds are required to include the same hypothetical calculations about expenses in shareholder reports, you can use this information to compare the ongoing cost of investing in the Fund with other funds. To do so, compare the hypothetical example with the 5% hypothetical examples that appear in the shareholder reports of other funds. As you compare hypothetical examples of other funds, it is important to note that hypothetical examples are meant to highlight the ongoing costs of investing in a fund only and do not reflect any transaction costs, such as sales charges, or redemption or exchange fees. Therefore, the hypothetical calculations are useful in comparing ongoing costs only, and will not help you determine the relative total costs of owning different funds. If transaction costs were included in these calculations, your costs would be higher.
March 1, 2015 – August 31, 2015
| | | | | | | | | | | | | | | | | | | | | | | | | | | | |
| | | Account Value at the
Beginning of the
Period ($) | | | Account Value at the
End of the
Period ($) | | | Expenses Paid During
the Period ($) | | | Fund’s Annualized
Expense Ratio (%) | |
| | | | Actual | | | | Hypothetical | | | | Actual | | | | Hypothetical | | | | Actual | | | | Hypothetical | | | | Actual | |
Class A | | | 1,000.00 | | | | 1,000.00 | | | | 942.90 | | | | 1,016.02 | | | | 9.06 | | | | 9.40 | | | | 1.84 | |
Expenses paid during the period are equal to the annualized expense ratio as indicated above, multiplied by the average account value over the period and then multiplied by the number of days in the Fund’s most recent fiscal half year and divided by 365.
Expenses do not include fees and expenses incurred indirectly by the Fund from its investment in underlying funds, including affiliated and non-affiliated pooled investment vehicles, such as mutual funds and exchange-traded funds.
| | |
| |
| | ACTIVE PORTFOLIOS® MULTI-MANAGER ALTERNATIVE STRATEGIES FUND |
CONSOLIDATED PORTFOLIO OF INVESTMENTS
August 31, 2015
(Percentages represent value of investments compared to net assets)
| | | | | | | | |
| Common Stocks 43.0% | |
| Issuer | | Shares | | | Value ($) | |
CONSUMER DISCRETIONARY 4.1% | | | | | | | | |
Auto Components 0.5% | | | | | | | | |
| | |
Visteon Corp.(a)(b) | | | 39,407 | | | | 3,927,301 | |
| | |
Automobiles 0.5% | | | | | | | | |
| | |
General Motors Co. | | | 115,429 | | | | 3,398,230 | |
|
Hotels, Restaurants & Leisure 0.8% | |
| | |
McDonald’s Corp.(b) | | | 23,172 | | | | 2,201,803 | |
| | |
MGM Resorts International(a)(b)(c) | | | 139,339 | | | | 2,846,696 | |
| | |
Starwood Hotels & Resorts Worldwide, Inc.(c) | | | 18,908 | | | | 1,351,355 | |
| | | | | | | | | |
Total | | | | | | | 6,399,854 | |
| | |
Media 1.0% | | | | | | | | |
| | |
DISH Network Corp., Class A(a)(b) | | | 23,872 | | | | 1,414,893 | |
| | |
Interpublic Group of Companies, Inc. (The) | | | 219,071 | | | | 4,136,060 | |
| | |
Martha Stewart Living Omnimedia, Inc., Class A(a) | | | 10,850 | | | | 65,643 | |
| | |
Media General, Inc.(a) | | | 179,949 | | | | 2,114,401 | |
| | | | | | | | | |
Total | | | | | | | 7,730,997 | |
| | |
Multiline Retail 0.6% | | | | | | | | |
| | |
Macy’s, Inc.(c) | | | 11,884 | | | | 696,521 | |
| | |
Target Corp.(b) | | | 54,280 | | | | 4,218,099 | |
| | | | | | | | | |
Total | | | | | | | 4,914,620 | |
| | |
Specialty Retail 0.7% | | | | | | | | |
| | |
CST Brands, Inc.(b) | | | 112,292 | | | | 3,898,778 | |
| | |
Staples, Inc.(c) | | | 129,674 | | | | 1,842,668 | |
| | | | | | | | | |
Total | | | | | | | 5,741,446 | |
| | | | | | | | | |
Total Consumer Discretionary | | | | | | | 32,112,448 | |
| | |
| | | | | | | | |
CONSUMER STAPLES 1.7% | | | | | | | | |
Beverages 0.3% | | | | | | | | |
| | |
Molson Coors Brewing Co., Class B(b) | | | 39,613 | | | | 2,697,249 | |
| | |
Food & Staples Retailing 1.3% | | | | | | | | |
| | |
Safeway, Inc. Casa Ley CVR(a)(d)(e) | | | 287,209 | | | | 291,488 | |
| | |
Safeway, Inc. PDC CVR(a)(d)(e) | | | 287,209 | | | | 14,016 | |
| | |
Wal-Mart Stores, Inc. | | | 128,078 | | | | 8,290,489 | |
| | |
Whole Foods Market, Inc.(b) | | | 47,644 | | | | 1,560,818 | |
| | | | | | | | | |
Total | | | | | | | 10,156,811 | |
| | |
Food Products 0.1% | | | | | | | | |
| | |
Nomad Foods Ltd.(a) | | | 6,424 | | | | 127,259 | |
| | |
Nomad Foods Ltd.(a) | | | 36,880 | | | | 736,678 | |
| | | | | | | | | |
Total | | | | | | | 863,937 | |
| | | | | | | | | |
Total Consumer Staples | | | | | | | 13,717,997 | |
| | | | | | | | |
| Common Stocks (continued) | |
| Issuer | | Shares | | | Value ($) | |
ENERGY 4.3% | | | | | | | | |
Energy Equipment & Services 1.8% | | | | | | | | |
| | |
Cameron International Corp.(a) | | | 27,828 | | | | 1,857,797 | |
| | |
Exterran Holdings, Inc.(b) | | | 125,120 | | | | 2,792,678 | |
| | |
Halliburton Co. | | | 156,596 | | | | 6,162,053 | |
| | |
Unit Corp.(a) | | | 200,403 | | | | 3,046,126 | |
| | | | | | | | | |
Total | | | | | | | 13,858,654 | |
| | |
Oil, Gas & Consumable Fuels 2.5% | | | | | | | | |
| | |
Bill Barrett Corp.(a) | | | 678,553 | | | | 3,711,685 | |
| | |
Cloud Peak Energy, Inc.(a) | | | 62,776 | | | | 300,069 | |
| | |
CONSOL Energy, Inc. | | | 57,494 | | | | 875,634 | |
| | |
Denbury Resources, Inc. | | | 1,178,939 | | | | 5,116,595 | |
| | |
Peabody Energy Corp. | | | 36,289 | | | | 97,980 | |
| | |
Southwestern Energy Co.(a) | | | 213,271 | | | | 3,463,521 | |
| | |
Williams Companies, Inc. (The)(b) | | | 124,514 | | | | 6,001,575 | |
| | |
Yancoal Australia Ltd.(a) | | | 57,345 | | | | 4,897 | |
| | | | | | | | | |
Total | | | | | | | 19,571,956 | |
| | | | | | | | | |
Total Energy | | | | | | | 33,430,610 | |
| | |
| | | | | | | | |
FINANCIALS 7.8% | | | | | | | | |
Banks 0.3% | | | | | | | | |
| | |
Citigroup, Inc.(b) | | | 52,276 | | | | 2,795,720 | |
| | |
Diversified Financial Services 0.1% | | | | | | | | |
| | |
Leucadia National Corp. | | | 35,120 | | | | 753,675 | |
| | |
Insurance 4.4% | | | | | | | | |
| | |
Aon PLC(b) | | | 28,116 | | | | 2,627,159 | |
| | |
Chubb Corp. (The)(b) | | | 56,796 | | | | 6,861,525 | |
| | |
CNA Financial Corp.(b) | | | 29,622 | | | | 1,065,800 | |
| | |
Loews Corp. | | | 252,671 | | | | 9,209,858 | |
| | |
PartnerRe Ltd.(b) | | | 52,009 | | | | 7,198,566 | |
| | |
Symetra Financial Corp. | | | 154,418 | | | | 4,859,534 | |
| | |
XL Group PLC | | | 68,676 | | | | 2,560,928 | |
| | | | | | | | | |
Total | | | | | | | 34,383,370 | |
|
Real Estate Investment Trusts (REITs) 2.6% | |
| | |
American Campus Communities, Inc.(b) | | | 94,127 | | | | 3,223,850 | |
| | |
Care Capital Properties, Inc.(a)(f) | | | 1 | | | | 8 | |
| | |
InfraREIT, Inc.(a)(b) | | | 63,008 | | | | 1,775,566 | |
| | |
Investors Real Estate Trust | | | 327,336 | | | | 2,189,878 | |
| | |
Iron Mountain, Inc. | | | 293,060 | | | | 8,305,320 | |
| | |
Outfront Media, Inc. | | | 109,359 | | | | 2,474,794 | |
| | |
Ventas, Inc. | | | 38,503 | | | | 2,118,435 | |
| | | | | | | | | |
Total | | | | | | | 20,087,851 | |
The accompanying Notes to Consolidated Financial Statements are an integral part of this statement.
| | |
| |
| ACTIVE PORTFOLIOS® MULTI-MANAGER ALTERNATIVE STRATEGIES FUND | | |
CONSOLIDATED PORTFOLIO OF INVESTMENTS (continued)
August 31, 2015
| | | | | | | | |
| Common Stocks (continued) | |
| Issuer | | Shares | | | Value ($) | |
Real Estate Management & Development 0.4% | |
| | |
Forest City Enterprises, Inc., Class A(a) | | | 155,355 | | | | 3,344,793 | |
| | | | | | | | | |
Total Financials | | | | | | | 61,365,409 | |
| | |
| | | | | | | | |
HEALTH CARE 6.7% | |
Biotechnology 0.9% | | | | | | | | |
| | |
Kythera Biopharmaceuticals, Inc.(a) | | | 98,510 | | | | 7,360,667 | |
| | |
Prosensa Holdings CVR(a)(e)(g) | | | 16,099 | | | | — | |
| | |
Trius Therapeutics, Inc.(a)(d)(e)(h) | | | 186,725 | | | | 16,245 | |
| | | | | | | | | |
Total | | | | | | | 7,376,912 | |
|
Health Care Equipment & Supplies 1.4% | |
| | |
Arthrocare Corp.(a)(d)(e) | | | 82,114 | | | | 27,722 | |
| | |
Medtronic PLC(b) | | | 39,900 | | | | 2,884,371 | |
| | |
Stryker Corp.(b) | | | 24,000 | | | | 2,367,600 | |
| | |
Thoratec Corp.(a) | | | 85,658 | | | | 5,381,035 | |
| | | | | | | | | |
Total | | | | | | | 10,660,728 | |
|
Health Care Providers & Services 1.8% | |
| | |
Express Scripts Holding Co.(a) | | | 77,636 | | | | 6,490,369 | |
| | |
IPC Healthcare, Inc.(a) | | | 77,584 | | | | 6,160,170 | |
| | |
Synergy Health PLC(a) | | | 65,079 | | | | 1,622,786 | |
| | | | | | | | | |
Total | | | | | | | 14,273,325 | |
|
Health Care Technology 0.2% | |
| | |
Merge Healthcare, Inc.(a) | | | 209,915 | | | | 1,488,298 | |
|
Pharmaceuticals 2.4% | |
| | |
Hospira, Inc.(a)(b) | | | 121,052 | | | | 10,891,048 | |
| | |
Mylan NV(a) | | | 38,518 | | | | 1,910,108 | |
| | |
Novartis AG, ADR(b) | | | 31,543 | | | | 3,066,610 | |
| | |
Zoetis, Inc. | | | 73,841 | | | | 3,313,246 | |
| | | | | | | | | |
Total | | | | | | | 19,181,012 | |
| | | | | | | | | |
Total Health Care | | | | | | | 52,980,275 | |
| | |
| | | | | | | | |
INDUSTRIALS 6.7% | |
Aerospace & Defense 2.3% | | | | | | | | |
| | |
B/E Aerospace, Inc.(b) | | | 40,131 | | | | 1,956,386 | |
| | |
BWX Technologies, Inc. | | | 24,339 | | | | 645,470 | |
| | |
KLX, Inc.(a)(b)(c) | | | 63,495 | | | | 2,482,655 | |
| | |
Precision Castparts Corp. | | | 55,307 | | | | 12,734,437 | |
| | | | | | | | | |
Total | | | | | | | 17,818,948 | |
|
Air Freight & Logistics 0.7% | |
| | |
TNT Express NV | | | 169,424 | | | | 1,432,739 | |
| | |
United Parcel Service, Inc., Class B(b) | | | 45,110 | | | | 4,404,991 | |
| | | | | | | | | |
Total | | | | | | | 5,837,730 | |
|
Airlines 0.7% | |
| | |
United Continental Holdings, Inc.(a) | | | 96,521 | | | | 5,498,801 | |
| | | | | | | | |
| Common Stocks (continued) | |
| Issuer | | Shares | | | Value ($) | |
Commercial Services & Supplies 0.3% | |
| | |
Republic Services, Inc. | | | 65,921 | | | | 2,701,442 | |
| | |
Construction & Engineering 0.2% | | | | | | | | |
| | |
HC2 Holdings, Inc.(a) | | | 222,509 | | | | 1,677,718 | |
|
Electrical Equipment 0.3% | |
| | |
Emerson Electric Co.(b) | | | 42,853 | | | | 2,044,945 | |
|
Machinery 0.6% | |
| | |
SPX Corp. | | | 77,893 | | | | 4,574,656 | |
|
Marine 0.7% | |
| | |
Kirby Corp.(a)(b) | | | 76,115 | | | | 5,368,391 | |
|
Trading Companies & Distributors 0.7% | |
| | |
NOW, Inc.(a)(b) | | | 326,797 | | | | 5,575,157 | |
|
Transportation Infrastructure 0.2% | |
| | |
Ansaldo STS SpA | | | 141,277 | | | | 1,503,696 | |
| | | | | | | | | |
Total Industrials | | | | | | | 52,601,484 | |
| | |
| | | | | | | | |
INFORMATION TECHNOLOGY 7.7% | | | | | | | | |
Communications Equipment 2.0% | |
| | |
Cisco Systems, Inc. | | | 127,842 | | | | 3,308,551 | |
| | |
Harris Corp.(b) | | | 48,153 | | | | 3,699,114 | |
| | |
QUALCOMM, Inc.(b) | | | 157,171 | | | | 8,892,735 | |
| | | | | | | | | |
Total | | | | | | | 15,900,400 | |
|
Internet Software & Services 1.4% | |
| | |
Dealertrack Technologies, Inc.(a) | | | 126,461 | | | | 7,936,693 | |
| | |
Yahoo!, Inc.(a)(b) | | | 104,139 | | | | 3,357,441 | |
| | | | | | | | | |
Total | | | | | | | 11,294,134 | |
|
Semiconductors & Semiconductor Equipment 0.7% | |
| | |
Altera Corp.(c) | | | 7,400 | | | | 359,270 | |
| | |
Avago Technologies Ltd.(c) | | | 9,155 | | | | 1,153,256 | |
| | |
Broadcom Corp., Class A(b) | | | 70,154 | | | | 3,624,857 | |
| | | | | | | | | |
Total | | | | | | | 5,137,383 | |
|
Software 1.6% | |
| | |
Microsoft Corp. | | | 93,539 | | | | 4,070,817 | |
| | |
Oracle Corp. | | | 188,231 | | | | 6,981,488 | |
| | |
VMware, Inc., Class A(a)(c) | | | 14,376 | | | | 1,137,860 | |
| | | | | | | | | |
Total | | | | | | | 12,190,165 | |
|
Technology Hardware, Storage & Peripherals 2.0% | |
| | |
Dot Hill Systems Corp.(a) | | | 158,925 | | | | 1,536,805 | |
| | |
EMC Corp.(b)(c) | | | 404,366 | | | | 10,056,582 | |
| | |
Hewlett-Packard Co.(b)(c) | | | 90,745 | | | | 2,546,305 | |
| | |
NCR Corp.(a) | | | 24,004 | | | | 602,260 | |
| | |
Silicon Graphics International Corp.(a) | | | 235,377 | | | | 1,176,885 | |
| | | | | | | | | |
Total | | | | | | | 15,918,837 | |
| | | | | | | | | |
Total Information Technology | | | | | | | 60,440,919 | |
| | |
| | | | | | | | |
The accompanying Notes to Consolidated Financial Statements are an integral part of this statement.
| | |
| |
| | ACTIVE PORTFOLIOS® MULTI-MANAGER ALTERNATIVE STRATEGIES FUND |
CONSOLIDATED PORTFOLIO OF INVESTMENTS (continued)
August 31, 2015
| | | | | | | | |
| Common Stocks (continued) | |
| Issuer | | Shares | | | Value ($) | |
MATERIALS 2.5% | | | | | | | | |
Chemicals 2.1% | |
| | |
Axalta Coating Systems Ltd.(a)(c) | | | 50,674 | | | | 1,479,174 | |
| | |
Cytec Industries, Inc. | | | 86,407 | | | | 6,411,400 | |
| | |
Mosaic Co. (The) | | | 203,688 | | | | 8,316,581 | |
| | | | | | | | | |
Total | | | | | | | 16,207,155 | |
|
Metals & Mining 0.4% | |
| | |
Steel Dynamics, Inc. | | | 171,598 | | | | 3,342,729 | |
| | | | | | | | | |
Total Materials | | | | | | | 19,549,884 | |
| | |
| | | | | | | | |
TELECOMMUNICATION SERVICES 1.2% | | | | | | | | |
Diversified Telecommunication Services 1.0% | |
| | |
Frontier Communications Corp.(b) | | | 435,308 | | | | 2,207,012 | |
| | |
Verizon Communications, Inc. | | | 126,927 | | | | 5,839,911 | |
| | | | | | | | | |
Total | | | | | | | 8,046,923 | |
|
Wireless Telecommunication Services 0.2% | |
| | |
NII Holdings, Inc.(a) | | | 161,602 | | | | 1,388,161 | |
| | | | | | | | | |
Total Telecommunication Services | | | | | | | 9,435,084 | |
| | |
| | | | | | | | |
UTILITIES 0.3% | | | | | | | | |
Independent Power and Renewable Electricity Producers 0.3% | |
| | |
Dynegy, Inc.(a) | | | 91,728 | | | | 2,361,996 | |
| | | | | | | | | |
Total Utilities | | | | | | | 2,361,996 | |
| | | | | | | | | |
Total Common Stocks
(Cost: $374,498,044) | | | | | | | 337,996,106 | |
| | | | | | | | | | | | |
|
| Corporate Bonds & Notes(i) 2.9% | |
| Issuer | | Coupon
Rate | | | Principal
Amount ($) | | | Value ($) | |
Banking 0.1% | | | | | | | | | | | | |
Ally Financial, Inc. | | | | | | | | | | | | |
03/15/20 | | | 8.000% | | | | 130,000 | | | | 152,100 | |
| | | |
Wells Fargo Capital X | | | | | | | | | | | | |
12/15/36 | | | 5.950% | | | | 615,000 | | | | 618,075 | |
| | | | | | | | | | | | | |
Total | | | | | | | | | | | 770,175 | |
| | | |
Chemicals 0.4% | | | | | | | | | | | | |
Ashland, Inc. | | | | | | | | | | | | |
04/15/18 | | | 3.875% | | | | 773,000 | | | | 790,640 | |
| | | |
LSB Industries, Inc. | | | | | | | | | | | | |
08/01/19 | | | 7.750% | | | | 2,281,000 | | | | 2,298,107 | |
| | | | | | | | | | | | | |
Total | | | | | | | | | | | 3,088,747 | |
|
Diversified Manufacturing 0.2% | |
Manitowoc Co., Inc. (The) | | | | | | | | | | | | |
10/15/22 | | | 5.875% | | | | 1,504,000 | | | | 1,604,186 | |
|
Electric 0.2% | |
Energy Future Intermediate Holding Co. LLC/Finance, Inc.(h)(j) | |
03/01/22 | | | 11.750% | | | | 1,587,594 | | | | 1,696,741 | |
| | | | | | | | | | | | |
| Corporate Bonds & Notes(i) (continued) | |
| Issuer | | Coupon
Rate | | | Principal
Amount ($) | | | Value ($) | |
Food and Beverage 0.6% | |
Bumble Bee Holdings, Inc.(h) | |
12/15/17 | | | 9.000% | | | | 145,000 | | | | 149,133 | |
| | | |
Kraft Heinz Co. (The)(h) | | | | | | | | | | | | |
02/15/25 | | | 4.875% | | | | 882,000 | | | | 952,027 | |
| | | |
U.S. Foods, Inc.(b) | | | | | | | | | | | | |
06/30/19 | | | 8.500% | | | | 3,184,000 | | | | 3,319,320 | |
| | | | | | | | | | | | | |
Total | | | | | | | | | | | 4,420,480 | |
|
Gaming 0.4% | |
Pinnacle Entertainment, Inc. | |
05/15/20 | | | 8.750% | | | | 1,810,000 | | | | 1,895,975 | |
04/01/22 | | | 7.750% | | | | 1,519,000 | | | | 1,678,495 | |
| | | | | | | | | | | | | |
Total | | | | | | | | | | | 3,574,470 | |
|
Health Care 0.4% | |
MedImpact Holdings, Inc.(h) | |
02/01/18 | | | 10.500% | | | | 2,743,000 | | | | 2,876,721 | |
|
Independent Energy 0.1% | |
RKI Exploration & Production LLC/Finance Corp.(h) | |
08/01/21 | | | 8.500% | | | | 349,000 | | | | 391,753 | |
|
Southern Pacific Resource Corp.(h)(j) | |
01/25/18 | | | 8.750% | | | | CAD 1,734,000 | | | | 46,131 | |
| | | | | | | | | | | | | |
Total | | | | | | | | | | | 437,884 | |
|
Media and Entertainment 0.2% | |
Univision Communications, Inc.(h) | |
05/15/21 | | | 8.500% | | | | 1,359,000 | | | | 1,416,757 | |
|
Oil Field Services —% | |
Exterran Holdings, Inc. | | | | | | | | | | | | |
12/01/18 | | | 7.250% | | | | 126,000 | | | | 123,480 | |
|
Other Financial Institutions 0.1% | |
Prospect Holding Co. LLC/Finance Co.(h) | |
10/01/18 | | | 10.250% | | | | 1,944,000 | | | | 1,223,554 | |
|
Property & Casualty 0.1% | |
Ambac Assurance Corp.(h)(k) | |
08/28/39 | | | 0.000% | | | | 756,000 | | | | 544,320 | |
|
Wirelines 0.1% | |
AT&T, Inc. | | | | | | | | | | | | |
08/15/16 | | | 2.400% | | | | 987,000 | | | | 998,633 | |
| | | | | | | | | | | | | |
Total Corporate Bonds & Notes
| | | | | |
(Cost: $25,006,650) | | | | | | | | | | | 22,776,148 | |
| | | |
| | | | | | | | | | | | |
| Convertible Bonds(i) 0.2% | |
Building Materials 0.1% | |
Aecon Group, Inc. | | | | | | | | | | | | |
10/31/15 | | | 6.250% | | | | CAD 697,000 | | | | 532,339 | |
|
Metals 0.1% | |
Primero Mining Corp. | | | | | | | | | | | | |
03/31/16 | | | 6.500% | | | | 769,000 | | | | 772,845 | |
|
Oil Field Services —% | |
Cal Dive International, Inc.(j) | |
07/15/17 | | | 5.000% | | | | 1,749,000 | | | | 8,745 | |
| | | | | | | | | | | | | |
Total Convertible Bonds | | | | | | | | | | | | |
(Cost: $2,614,460) | | | | | | | | | | | 1,313,929 | |
The accompanying Notes to Consolidated Financial Statements are an integral part of this statement.
| | |
| |
| ACTIVE PORTFOLIOS® MULTI-MANAGER ALTERNATIVE STRATEGIES FUND | | |
CONSOLIDATED PORTFOLIO OF INVESTMENTS (continued)
August 31, 2015
| | | | | | | | |
| Exchange-Traded Funds 0.2% | |
| | | Shares | | | Value ($) | |
iShares Russell 2000 Growth ETF | | | 9,500 | | | | 1,360,305 | |
| | | | | | | | | |
Total Exchange-Traded Funds | | | | | | | | |
(Cost: $1,456,426) | | | | | | | 1,360,305 | |
| | |
| | | | | | | | |
| Limited Partnerships 0.7% | |
| Issuer | | Shares | | | Value ($) | |
ENERGY 0.7% | | | | | | | | |
Oil, Gas & Consumable Fuels 0.7% | | | | | | | | |
| | |
CNX Coal Resources LP(a) | | | 103,839 | | | | 1,541,905 | |
| | |
MarkWest Energy Partners LP(b) | | | 21,033 | | | | 1,185,630 | |
| | |
Williams Partners LP | | | 63,413 | | | | 2,527,008 | |
| | | | | | | | | |
Total | | | | | | | 5,254,543 | |
| | | | | | | | | |
Total Energy | | | | | | | 5,254,543 | |
| | | | | | | | | |
Total Limited Partnerships
(Cost: $5,787,865) | | | | | | | 5,254,543 | |
| | | | | | | | | | | | |
| | | |
| | | | | | | | | | | | |
| Treasury Bills 11.3% | |
| Issuer | | Effective
Yield | | | Principal
Amount ($) | | | Value ($) | |
UNITED STATES 11.3% | | | | | | | | | | | | |
U.S. Treasury Bills | | | | | | | | | | | | |
10/01/15 | | | 0.040% | | | | 1,988,000 | | | | 1,987,925 | |
10/08/15 | | | 0.020% | | | | 1,988,000 | | | | 1,987,959 | |
12/03/15 | | | 0.040% | | | | 8,950,000 | | | | 8,948,989 | |
01/28/16 | | | 0.140% | | | | 53,038,000 | | | | 53,006,442 | |
02/04/16 | | | 0.160% | | | | 11,167,000 | | | | 11,159,407 | |
02/11/16 | | | 0.180% | | | | 9,210,000 | | | | 9,202,549 | |
03/03/16 | | | 0.260% | | | | 2,220,000 | | | | 2,217,094 | |
| | | | | | | | | | | | | |
Total | | | | | | | | | | | 88,510,365 | |
| | | | | | | | | | | | | |
Total Treasury Bills
(Cost: $88,507,217) | | | | | | | | | | | 88,510,365 | |
| | | | | | | | | | | | | | | | |
| | | | |
| | | | | | | | | | | | | | | | |
| Options Purchased Calls 0.1% | | | | | |
| Issuer | | Notional ($)/
Contracts | | | Exercise
Price ($) | | | Expiration
Date | | | Value ($) | |
ACE Ltd. | | | | | | | | | |
| | | 80 | | | | 115.00 | | | | 11/20/15 | | | | 4,000 | |
| | | 61 | | | | 110.00 | | | | 11/20/15 | | | | 7,778 | |
| | |
Applied Materials, Inc. | | | | | | | | | |
| | | 222 | | | | 22.00 | | | | 01/15/16 | | | | 1,776 | |
| | |
Avago Technologies Ltd. | | | | | | | | | |
| | | 272 | | | | 130.00 | | | | 09/18/15 | | | | 80,920 | |
| | | 38 | | | | 140.00 | | | | 10/16/15 | | | | 9,310 | |
| | | 277 | | | | 120.00 | | | | 01/15/16 | | | | 479,210 | |
| | |
Axalta Coating Systems Ltd. | | | | | | | | | |
| | | 26 | | | | 30.00 | | | | 01/15/16 | | | | 6,565 | |
| | |
B/E Aerospace, Inc. | | | | | | | | | |
| | | 683 | | | | 55.00 | | | | 01/15/16 | | | | 83,667 | |
| | | | | | | | | | | | | | | | |
| Options Purchased Calls (continued) | | | | | |
| Issuer | | Notional ($)/
Contracts | | | Exercise
Price ($) | | | Expiration
Date | | | Value ($) | |
Dynegy, Inc. | | | | | | | | | | | | | | | | |
| | | 638 | | | | 35.00 | | | | 09/18/15 | | | | 9,570 | |
| | | 544 | | | | 30.00 | | | | 09/18/15 | | | | 21,760 | |
| | | | |
Expedia, Inc. | | | | | | | | | | | | | | | | |
| | | 83 | | | | 120.00 | | | | 10/16/15 | | | | 33,200 | |
| | |
Hewlett-Packard Co. | | | | | | | | | |
| | | 1,262 | | | | 30.00 | | | | 10/16/15 | | | | 52,373 | |
| | |
Kythera Biopharmaceuticals, Inc. | | | | | | | | | |
| | | 7 | | | | 75.00 | | | | 09/18/15 | | | | 18 | |
| | | | |
Macy’s, Inc. | | | | | | | | | | | | | | | | |
| | | 281 | | | | 70.00 | | | | 01/15/16 | | | | 25,150 | |
| | | |
Media General, Inc. | | | | | | | | | | | | | |
| | | 16 | | | | 12.50 | | | | 02/19/16 | | | | 2,040 | |
| | | 308 | | | | 15.00 | | | | 02/19/16 | | | | 19,250 | |
| | | | |
STERIS Corp. | | | | | | | | | | | | | | | | |
| | | 66 | | | | 70.00 | | | | 09/18/15 | | | | 2,805 | |
| | | | |
Staples, Inc. | | | | | | | | | | | | | | | | |
| | | 557 | | | | 16.00 | | | | 12/18/15 | | | | 36,205 | |
| | | 990 | | | | 17.00 | | | | 01/15/16 | | | | 51,975 | |
| |
Starwood Hotels & Resorts Worldwide, Inc. | | | | | |
| | | 297 | | | | 75.00 | | | | 10/16/15 | | | | 84,793 | |
| | |
VMware, Inc., Class A | | | | | | | | | |
| | | 284 | | | | 85.00 | | | | 09/18/15 | | | | 34,790 | |
| | | 67 | | | | 95.00 | | | | 10/16/15 | | | | 6,030 | |
| | | 148 | | | | 100.00 | | | | 10/16/15 | | | | 8,140 | |
| | | 284 | | | | 85.00 | | | | 10/16/15 | | | | 70,290 | |
| | | 288 | | | | 85.00 | | | | 01/15/16 | | | | 129,600 | |
| | |
Williams Companies, Inc. (The) | | | | | | | | | |
| | | 86 | | | | 60.00 | | | | 11/20/15 | | | | 8,127 | |
| | | | | | | | | | | | | | | | | |
Total Options Purchased Calls
(Cost: $1,248,970) | | | | 1,269,342 | |
| | | | |
| | | | | | | | | | | | | | | | |
| Options Purchased Puts 0.3% | | | | | | | | | |
Altera Corp. | | | | | | | | | | | | | | | | |
| | | 52 | | | | 45.00 | | | | 02/19/16 | | | | 14,560 | |
| | |
Axalta Coating Systems Ltd. | | | | | | | | | |
| | | 568 | | | | 25.00 | | | | 10/16/15 | | | | 41,180 | |
| |
Axis Capital Holdings Ltd. | | | | | |
| | | 57 | | | | 50.00 | | | | 09/18/15 | | | | 1,425 | |
| | | 65 | | | | 50.00 | | | | 12/18/15 | | | | 7,150 | |
| |
B/E Aerospace, Inc. | | | | | |
| | | 313 | | | | 45.00 | | | | 10/16/15 | | | | 29,735 | |
| |
BWX Technologies, Inc. | | | | | |
| | | 138 | | | | 22.50 | | | | 09/18/15 | | | | 2,415 | |
| |
Chubb Corp. (The) | | | | | |
| | | 218 | | | | 110.00 | | | | 10/16/15 | | | | 17,113 | |
| |
DISH Network Corp., Class A | | | | | |
| | | 139 | | | | 62.50 | | | | 09/18/15 | | | | 58,380 | |
| | | 139 | | | | 60.00 | | | | 12/18/15 | | | | 72,280 | |
| |
Dynegy, Inc. | | | | | |
| | | 831 | | | | 22.50 | | | | 09/18/15 | | | | 49,860 | |
The accompanying Notes to Consolidated Financial Statements are an integral part of this statement.
| | |
| |
| | ACTIVE PORTFOLIOS® MULTI-MANAGER ALTERNATIVE STRATEGIES FUND |
CONSOLIDATED PORTFOLIO OF INVESTMENTS (continued)
August 31, 2015
| | | | | | | | | | | | | | | | |
| Options Purchased Puts (continued) | | | | | |
| Issuer | | Notional ($)/
Contracts | | | Exercise
Price ($) | | | Expiration
Date | | | Value ($) | |
EMC Corp. | | | | | |
| | | 1,272 | | | | 21.00 | | | | 09/18/15 | | | | 6,360 | |
| |
Hewlett-Packard Co. | | | | | |
| | | 212 | | | | 27.00 | | | | 09/18/15 | | | | 11,024 | |
| |
KLX, Inc. | | | | | |
| | | 557 | | | | 35.00 | | | | 09/18/15 | | | | 13,925 | |
| |
Kraft Foods Group, Inc. | | | | | |
| | | 39 | | | | 82.50 | | | | 09/18/15 | | | | 780 | |
| |
Kraft Heinz Co. (The) | | | | | |
| | | 153 | | | | 75.00 | | | | 12/18/15 | | | | 78,030 | |
| |
MGM Resorts International | | | | | |
| | | 853 | | | | 19.00 | | | | 10/16/15 | | | | 70,373 | |
| |
Molson Coors Brewing Co., Class B | | | | | |
| | | 254 | | | | 65.00 | | | | 09/18/15 | | | | 30,480 | |
| |
Receptos, Inc.(d)(e)(g) | | | | | |
| | | 4 | | | | 180.00 | | | | 09/18/15 | | | | — | |
| | | 50 | | | | 190.00 | | | | 09/18/15 | | | | — | |
| | | 71 | | | | 190.00 | | | | 09/18/15 | | | | — | |
| |
Schlumberger Ltd. | | | | | |
| | | 45 | | | | 65.00 | | | | 09/18/15 | | | | 990 | |
| | | 90 | | | | 70.00 | | | | 09/18/15 | | | | 5,040 | |
| | | | |
Visteon Corp. | | | | | | | | | | | | | | | | |
| | | 288 | | | | 90.00 | | | | 12/18/15 | | | | 72,720 | |
| |
Williams Companies, Inc. (The) | | | | | |
| | | 509 | | | | 52.50 | | | | 09/18/15 | | | | 324,487 | |
| | | 200 | | | | 45.00 | | | | 09/18/15 | | | | 41,500 | |
| |
Williams Partners LP | | | | | |
| | | 321 | | | | 35.00 | | | | 09/18/15 | | | | 20,865 | |
| |
XPO Logistics, Inc. | | | | | |
| | | 283 | | | | 30.00 | | | | 10/16/15 | | | | 29,715 | |
| |
iShares Russell 2000 Growth ETF | | | | | |
| | | 2,299 | | | | 147.00 | | | | 09/18/15 | | | | 1,241,460 | |
| | | | | | | | | | | | | | | | | |
Total Options Purchased Puts
(Cost: $1,610,815) | | | | 2,241,847 | |
| |
| | | | | |
| | | | | | | | |
| Money Market Funds 38.4% | |
| | | Shares | | | Value ($) | |
Columbia Short-Term Cash Fund, 0.150%(l)(m)(n) | | | 300,974,302 | | | | 300,974,302 | |
| | |
JPMorgan Prime Money Market Fund, 0.010%(b)(l) | | | 461,094 | | | | 461,094 | |
| | | | | | | | | |
Total Money Market Funds
(Cost: $301,435,396) | | | | | | | 301,435,396 | |
| | | | | | | | | |
Total Investments
(Cost: $802,165,843) | | | | | | | 762,157,981 | |
| | | | | | | | |
| Investments Sold Short (13.6)% | |
| Common Stocks (10.1)% | |
| Issuer | | Shares | | | Value ($) | |
CONSUMER DISCRETIONARY (2.8)% | | | | | | | | |
Auto Components (0.3)% | | | | | | | | |
| | |
Autoliv, Inc. | | | (9,536 | ) | | | (974,102 | ) |
| | |
BorgWarner, Inc. | | | (17,930 | ) | | | (782,465 | ) |
| | |
Delphi Automotive PLC | | | (10,167 | ) | | | (767,812 | ) |
| | | | | | | | | |
Total | | | | | | | (2,524,379 | ) |
|
Hotels, Restaurants & Leisure (0.2)% | |
| | |
Choice Hotels International, Inc. | | | (4,313 | ) | | | (219,963 | ) |
| | |
Diamond Resorts International, Inc.(a) | | | (1,887 | ) | | | (47,911 | ) |
| | |
Marriott International, Inc., Class A | | | (8,993 | ) | | | (635,446 | ) |
| | |
Marriott Vacations World | | | (656 | ) | | | (46,583 | ) |
| | |
MGM China Holdings Ltd. | | | (239,824 | ) | | | (397,282 | ) |
| | |
Wynn Resorts Ltd. | | | (5,546 | ) | | | (416,227 | ) |
| | | | | | | | | |
Total | | | | | | | (1,763,412 | ) |
| | |
Household Durables (0.6)% | | | | | | | | |
| | |
Harman International Industries, Inc. | | | (9,300 | ) | | | (908,982 | ) |
| | |
Jarden Corp.(a) | | | (70,578 | ) | | | (3,623,474 | ) |
| | | | | | | | | |
Total | | | | | | | (4,532,456 | ) |
|
Internet & Catalog Retail (0.1)% | |
| | |
Expedia, Inc. | | | (8,098 | ) | | | (931,189 | ) |
|
Media (0.2)% | |
| | |
Nexstar Broadcasting Group, Inc., Class A | | | (11,661 | ) | | | (542,003 | ) |
| | |
Sinclair Broadcast Group, Inc., Class A | | | (13,570 | ) | | | (363,405 | ) |
| | |
Tegna, Inc. | | | (15,889 | ) | | | (377,999 | ) |
| | | | | | | | | |
Total | | | | | | | (1,283,407 | ) |
|
Multiline Retail (0.5)% | |
| | |
JCPenney Co., Inc.(a) | | | (437,480 | ) | | | (3,985,443 | ) |
|
Specialty Retail (0.9)% | |
| | |
Five Below, Inc.(a) | | | (73,952 | ) | | | (2,859,724 | ) |
| | |
Men’s Wearhouse, Inc. (The) | | | (39,074 | ) | | | (2,205,727 | ) |
| | |
Tiffany & Co. | | | (26,991 | ) | | | (2,220,010 | ) |
| | | | | | | | | |
Total | | | | | | | (7,285,461 | ) |
| | | | | | | | | |
Total Consumer Discretionary | | | | | | | (22,305,747 | ) |
| | |
| | | | | | | | |
CONSUMER STAPLES (1.1)% | |
Beverages (0.1)% | |
| | |
Anheuser-Busch InBev NV, ADR | | | (3,498 | ) | | | (380,967 | ) |
| | |
Boston Beer Co., Inc. (The), Class A(a) | | | (982 | ) | | | (201,379 | ) |
| | | | | | | | | |
Total | | | | | | | (582,346 | ) |
|
Food & Staples Retailing (0.8)% | |
| | |
Kroger Co. | | | (116,798 | ) | | | (4,029,531 | ) |
| | |
SYSCO Corp. | | | (67,268 | ) | | | (2,681,975 | ) |
| | | | | | | | | |
Total | | | | | | | (6,711,506 | ) |
The accompanying Notes to Consolidated Financial Statements are an integral part of this statement.
| | |
| |
| ACTIVE PORTFOLIOS® MULTI-MANAGER ALTERNATIVE STRATEGIES FUND | | |
CONSOLIDATED PORTFOLIO OF INVESTMENTS (continued)
August 31, 2015
| | | | | | | | |
| Common Stocks (continued) | |
| Issuer | | Shares | | | Value ($) | |
Household Products (0.2)% | |
| | |
Procter & Gamble Co. (The) | | | (22,944 | ) | | | (1,621,453 | ) |
| | | | | | | | | |
Total Consumer Staples | | | | | | | (8,915,305 | ) |
| | |
| | | | | | | | |
ENERGY (0.5)% | |
Energy Equipment & Services (0.4)% | |
| | |
Enerflex Ltd. | | | (36,774 | ) | | | (353,596 | ) |
| | |
Exterran Holdings, Inc. | | | (54,400 | ) | | | (1,214,208 | ) |
| | |
RPC, Inc. | | | (51,937 | ) | | | (603,508 | ) |
| | |
Schlumberger Ltd. | | | (7,688 | ) | | | (594,821 | ) |
| | |
Superior Energy Services, Inc. | | | (6,867 | ) | | | (109,254 | ) |
| | | | | | | | | |
Total | | | | | | | (2,875,387 | ) |
|
Oil, Gas & Consumable Fuels (0.1)% | |
| | |
Synergy Resources Corp.(a) | | | (114,768 | ) | | | (1,232,608 | ) |
| | | | | | | | | |
Total Energy | | | | | | | (4,107,995 | ) |
| | |
| | | | | | | | |
FINANCIALS (1.1)% | |
Insurance (0.7)% | |
| | |
ACE Ltd. | | | (34,167 | ) | | | (3,490,501 | ) |
| | |
First American Financial | | | (47,516 | ) | | | (1,846,472 | ) |
| | | | | | | | | |
Total | | | | | | | (5,336,973 | ) |
|
Real Estate Investment Trusts (REITs) (0.4)% | |
| | |
American Tower Corp. | | | (29,274 | ) | | | (2,698,770 | ) |
| | |
LaSalle Hotel Properties | | | (7,503 | ) | | | (236,044 | ) |
| | |
Pebblebrook Hotel Trust | | | (6,128 | ) | | | (233,232 | ) |
| | | | | | | | | |
Total | | | | | | | (3,168,046 | ) |
| | | | | | | | | |
Total Financials | | | | | | | (8,505,019 | ) |
| | |
| | | | | | | | |
HEALTH CARE (0.7)% | |
Health Care Equipment & Supplies (0.4)% | |
| | |
STERIS Corp. | | | (17,919 | ) | | | (1,147,712 | ) |
| | |
Zeltiq Aesthetics, Inc.(a) | | | (69,578 | ) | | | (2,245,282 | ) |
| | | | | | | | | |
Total | | | | | | | (3,392,994 | ) |
|
Health Care Technology (0.3)% | |
| | |
Veeva Systems Inc., Class A(a) | | | (74,301 | ) | | | (1,924,396 | ) |
| | | | | | | | | |
Total Health Care | | | | | | | (5,317,390 | ) |
| | |
| | | | | | | | |
INDUSTRIALS (1.3)% | |
Aerospace & Defense (0.6)% | |
| | |
Boeing Co. (The) | | | (1,127 | ) | | | (147,276 | ) |
| | |
General Dynamics Corp. | | | (5,657 | ) | | | (803,464 | ) |
| | |
Hexcel Corp. | | | (3,399 | ) | | | (164,036 | ) |
| | |
L-3 Communications Holdings, Inc. | | | (6,249 | ) | | | (659,082 | ) |
| | |
Lockheed Martin Corp. | | | (4,315 | ) | | | (868,092 | ) |
| | |
Raytheon Co. | | | (8,387 | ) | | | (860,171 | ) |
| | |
Rockwell Collins, Inc. | | | (10,390 | ) | | | (850,421 | ) |
| | |
Spirit AeroSystems Holdings, Inc., Class A(a) | | | (3,335 | ) | | | (170,452 | ) |
| | | | | | | | |
| Common Stocks (continued) | |
| Issuer | | Shares | | | Value ($) | |
TransDigm Group, Inc.(a) | | | (762 | ) | | | (175,130 | ) |
| | |
Triumph Group, Inc. | | | (2,144 | ) | | | (105,892 | ) |
| | | | | | | | | |
Total | | | | | | | (4,804,016 | ) |
|
Commercial Services & Supplies (0.1)% | |
| | |
Healthcare Services Group, Inc. | | | (14,824 | ) | | | (495,715 | ) |
|
Machinery (0.5)% | |
| | |
Colfax Corp.(a) | | | (20,718 | ) | | | (803,651 | ) |
| | |
Dover Corp. | | | (13,475 | ) | | | (834,776 | ) |
| | |
Flowserve Corp. | | | (15,890 | ) | | | (717,116 | ) |
| | |
ITT Corp. | | | (21,495 | ) | | | (804,128 | ) |
| | |
Pentair PLC | | | (12,229 | ) | | | (676,141 | ) |
| | | | | | | | | |
Total | | | | | | | (3,835,812 | ) |
|
Trading Companies & Distributors (0.1)% | |
| | |
WESCO International, Inc.(a) | | | (8,246 | ) | | | (461,529 | ) |
|
Transportation Infrastructure —% | |
| | |
Wesco Aircraft Holdings, Inc.(a) | | | (12,356 | ) | | | (173,478 | ) |
| | | | | | | | | |
Total Industrials | | | | | | | (9,770,550 | ) |
| | |
| | | | | | | | |
INFORMATION TECHNOLOGY (1.9)% | | | | | | | | |
Communications Equipment (0.5)% | | | | | | | | |
| | |
Arista Networks, Inc.(a) | | | (57,880 | ) | | | (4,328,845 | ) |
|
Electronic Equipment, Instruments & Components (0.1)% | |
| | |
Cognex Corp. | | | (27,644 | ) | | | (983,021 | ) |
|
Internet Software & Services (0.4)% | |
| | |
Alibaba Group Holding Ltd., ADR(a) | | | (42,112 | ) | | | (2,784,445 | ) |
|
IT Services (0.4)% | |
| | |
International Business Machines Corp. | | | (3,239 | ) | | | (479,016 | ) |
| | |
Syntel, Inc.(a) | | | (54,620 | ) | | | (2,427,859 | ) |
| | |
Xerox Corp. | | | (48,467 | ) | | | (492,909 | ) |
| | | | | | | | | |
Total | | | | | | | (3,399,784 | ) |
|
Semiconductors & Semiconductor Equipment (0.1)% | |
| | |
Avago Technologies Ltd. | | | (531 | ) | | | (66,890 | ) |
| | |
Intel Corp. | | | (18,158 | ) | | | (518,229 | ) |
| | | | | | | | | |
Total | | | | | | | (585,119 | ) |
|
Software (0.3)% | |
| | |
Electronic Arts, Inc.(a) | | | (37,839 | ) | | | (2,503,050 | ) |
|
Technology Hardware, Storage & Peripherals (0.1)% | |
| | |
Seagate Technology | | | (10,744 | ) | | | (552,242 | ) |
| | | | | | | | | |
Total Information Technology | | | | | | | (15,136,506 | ) |
| | |
| | | | | | | | |
MATERIALS (0.1)% | | | | | | | | |
Chemicals (0.1)% | | | | | | | | |
| | |
PPG Industries, Inc. | | | (2,614 | ) | | | (249,088 | ) |
| | |
RPM International, Inc. | | | (6,541 | ) | | | (286,823 | ) |
| | |
Valspar Corp. | | | (3,143 | ) | | | (230,382 | ) |
| | | | | | | | | |
Total | | | | | | | (766,293 | ) |
| | | | | | | | | |
Total Materials | | | | | | | (766,293 | ) |
The accompanying Notes to Consolidated Financial Statements are an integral part of this statement.
| | |
| |
| | ACTIVE PORTFOLIOS® MULTI-MANAGER ALTERNATIVE STRATEGIES FUND |
CONSOLIDATED PORTFOLIO OF INVESTMENTS (continued)
August 31, 2015
| | | | | | | | |
| Common Stocks (continued) | |
| Issuer | | Shares | | | Value ($) | |
TELECOMMUNICATION SERVICES (0.2)% | |
Diversified Telecommunication Services (0.1)% | |
| | |
CenturyLink, Inc. | | | (36,682 | ) | | | (991,881 | ) |
|
Wireless Telecommunication Services (0.1)% | |
| | |
T-Mobile USA, Inc.(a) | | | (11,662 | ) | | | (461,932 | ) |
| | | | | | | | | |
Total Telecommunication Services | | | | | | | (1,453,813 | ) |
| | |
| | | | | | | | |
UTILITIES (0.4)% | | | | | | | | |
Electric Utilities (0.4)% | | | | | | | | |
| | |
Exelon Corp. | | | (88,692 | ) | | | (2,728,166 | ) |
| | | | | | | | | |
Total Utilities | | | | | | | (2,728,166 | ) |
| | | | | | | | | |
Total Common Stocks
(Proceeds: $82,488,201) | | | | | | | (79,006,784 | ) |
| | | | | | | | | | | | |
| | | |
| | | | | | | | | | | | |
| Corporate Bonds & Notes (0.3)% | |
| Issuer | | Coupon
Rate | | | Principal
Amount ($) | | | Value ($) | |
CHEMICALS —% | |
Ashland, Inc. | | | | | | | | | | | | |
08/15/22 | | | 4.750% | | | | (296,000 | ) | | | (293,780 | ) |
| | | |
| | | | | | | | | | | | |
FOOD AND BEVERAGE (0.1)% | |
Kraft Foods Group, Inc. | | | | | | | | | | | | |
06/06/22 | | | 3.500% | | | | (359,000 | ) | | | (362,216 | ) |
| | | |
| | | | | | | | | | | | |
OIL FIELD SERVICES (0.1)% | |
Ensco PLC | | | | | | | | | | | | |
03/15/21 | | | 4.700% | | | | (646,000 | ) | | | (591,801 | ) |
|
National Oilwell Varco, Inc. | |
12/01/22 | | | 2.600% | | | | (565,000 | ) | | | (513,213 | ) |
| | | | | | | | | | | | | |
Total | | | | | | | | | | | (1,105,014 | ) |
| | | |
| | | | | | | | | | | | |
WIRELINES (0.1)% | |
AT&T, Inc. | | | | | | | | | | | | |
03/11/24 | | | 3.900% | | | | (911,000 | ) | | | (909,469 | ) |
| | | | | | | | | | | | | |
Total Corporate Bonds & Notes | | | | | |
(Proceeds: $2,829,244) | | | | | | | | | | | (2,670,479 | ) |
| | | | | | | | |
| Exchange-Traded Funds (3.0)% | |
| Issuer | | Shares | | | Value ($) | |
Alerian MLP ETF | | | (17,114 | ) | | | (247,126 | ) |
| | |
Consumer Staples Select Sector SPDR Fund | | | (29,468 | ) | | | (1,394,131 | ) |
| | |
Health Care Select Sector SPDR Fund | | | (18,142 | ) | | | (1,278,830 | ) |
| | |
Industrial Select Sector SPDR Fund | | | (21,265 | ) | | | (1,090,682 | ) |
| | |
Market Vectors Semiconductor ETF | | | (102,773 | ) | | | (5,092,402 | ) |
| | |
SPDR S&P 500 ETF Trust | | | (8,326 | ) | | | (1,645,800 | ) |
| | |
SPDR S&P Retail ETF | | | (32,387 | ) | | | (3,029,804 | ) |
| | |
Technology Select Sector SPDR Fund | | | (95,938 | ) | | | (3,859,586 | ) |
| | |
Utilities Select Sector SPDR Fund | | | (53,303 | ) | | | (2,263,245 | ) |
| | |
Vanguard REIT ETF | | | (34,489 | ) | | | (2,553,221 | ) |
| | |
iShares Russell 2000 Growth ETF | | | (9,441 | ) | | | (1,351,857 | ) |
| | | | | | | | | |
Total Exchange-Traded Funds | | | | | | | | |
(Proceeds: $24,170,137) | | | | | | | (23,806,684 | ) |
| | |
| | | | | | | | |
| Limited Partnerships (0.2)% | |
ENERGY (0.2)% | |
Energy Equipment & Services (0.1)% | |
| | |
Exterran Partners LP | | | (37,269 | ) | | | (810,228 | ) |
|
Oil, Gas & Consumable Fuels (0.1)% | |
| | |
Alliance Resource Partners | | | (31,152 | ) | | | (796,868 | ) |
| | |
Energy Transfer Equity LP | | | (1,134 | ) | | | (31,809 | ) |
| | | | | | | | | |
Total | | | | | | | (828,677 | ) |
| | | | | | | | | |
Total Energy | | | | | | | (1,638,905 | ) |
| | | | | | | | | |
Total Limited Partnerships | | | | | | | | |
(Proceeds: $1,631,671) | | | | | | | (1,638,905 | ) |
| | | | | | | | | |
Total Investments Sold Short | | | | | | | | |
(Proceeds: $111,119,253) | | | | | | | (107,122,852 | ) |
| | | | | | | | | |
Total Investments, Net of Investments Sold Short | | | | 655,035,129 | |
| | | | | | | | | |
Other Assets & Liabilities, Net | | | | 129,905,161 | |
| | | | | | | | | |
Net Assets | | | | | | | 784,940,290 | |
| | | | | | | | | |
At August 31, 2015, securities and cash totaling $213,234,082 were pledged as collateral.
Investments in Derivatives
Forward Foreign Currency Exchange Contracts Open at August 31, 2015
| | | | | | | | | | | | | | | | | | | | |
| Counterparty | | Exchange
Date | | | Currency to
be Delivered | | | Currency to
be Received | | | Unrealized
Appreciation ($) | | | Unrealized
Depreciation ($) | |
| | | | | |
Citibank | | | 09/16/2015 | | | | 95,544,000 AUD | | | | 71,734,516 USD | | | | 3,789,231 | | | | — | |
| | | | | |
Citibank | | | 09/16/2015 | | | | 1,860,000 AUD | | | | 1,432,727 USD | | | | 110,004 | | | | — | |
| | | | | |
Citibank | | | 09/16/2015 | | | | 39,380,000 BRL | | | | 11,992,402 USD | | | | 1,187,604 | | | | — | |
The accompanying Notes to Consolidated Financial Statements are an integral part of this statement.
| | |
| |
| ACTIVE PORTFOLIOS® MULTI-MANAGER ALTERNATIVE STRATEGIES FUND | | |
CONSOLIDATED PORTFOLIO OF INVESTMENTS (continued)
August 31, 2015
Forward Foreign Currency Exchange Contracts Open at August 31, 2015 (continued)
| | | | | | | | | | | | | | | | | | | | | | | | | | |
| Counterparty | | Exchange
Date | | | Currency to
be Delivered | | Currency to
be Received | | | Unrealized
Appreciation ($) | | | Unrealized
Depreciation ($) | |
Citibank | | | 09/16/2015 | | | | 92,978,000 | | | CAD | | | 73,396,222 | | | | USD | | | | 2,725,522 | | | | — | |
| | | | | | | |
Citibank | | | 09/16/2015 | | | | 264,000 | | | CAD | | | 213,878 | | | | USD | | | | 13,217 | | | | — | |
| | | | | | | |
Citibank | | | 09/16/2015 | | | | 491,000 | | | CAD | | | 370,580 | | | | USD | | | | — | | | | (2,619 | ) |
| | | | | | | |
Citibank | | | 09/16/2015 | | | | 1,003,000 | | | CHF | | | 1,062,535 | | | | USD | | | | 24,455 | | | | — | |
| | | | | | | |
Citibank | | | 09/16/2015 | | | | 319,000 | | | CHF | | | 341,940 | | | | USD | | | | 11,783 | | | | — | |
| | | | | | | |
Citibank | | | 09/16/2015 | | | | 1,415,000,000 | | | CLP | | | 2,216,093 | | | | USD | | | | 176,497 | | | | — | |
| | | | | | | |
Citibank | | | 09/16/2015 | | | | 70,000,000 | | | CLP | | | 109,426 | | | | USD | | | | 8,527 | | | | — | |
| | | | | | | |
Citibank | | | 09/16/2015 | | | | 30,000,000 | | | CLP | | | 47,026 | | | | USD | | | | 3,784 | | | | — | |
| | | | | | | |
Citibank | | | 09/16/2015 | | | | 3,340,000,000 | | | COP | | | 1,265,978 | | | | USD | | | | 172,796 | | | | — | |
| | | | | | | |
Citibank | | | 09/16/2015 | | | | 53,000,000 | | | CZK | | | 2,249,815 | | | | USD | | | | 49,108 | | | | — | |
| | | | | | | |
Citibank | | | 09/16/2015 | | | | 145,000,000 | | | CZK | | | 5,887,701 | | | | USD | | | | — | | | | (133,098 | ) |
| | | | | | | |
Citibank | | | 09/16/2015 | | | | 95,239,948 | | | EUR | | | 107,667,934 | | | | USD | | | | 772,645 | | | | — | |
| | | | | | | |
Citibank | | | 09/16/2015 | | | | 118,705,052 | | | EUR | | | 131,375,056 | | | | USD | | | | — | | | | (1,856,965 | ) |
| | | | | | | |
Citibank | | | 09/16/2015 | | | | 3,000 | | | EUR | | | 3,353 | | | | USD | | | | — | | | | (14 | ) |
| | | | | | | |
Citibank | | | 09/16/2015 | | | | 2,818,000 | | | EUR | | | 3,160,322 | | | | USD | | | | — | | | | (2,541 | ) |
| | | | | | | |
Citibank | | | 09/16/2015 | | | | 17,261,999 | | | GBP | | | 26,964,865 | | | | USD | | | | 478,430 | | | | — | |
| | | | | | | |
Citibank | | | 09/16/2015 | | | | 28,662,000 | | | GBP | | | 44,192,520 | | | | USD | | | | 214,170 | | | | — | |
| | | | | | | |
Citibank | | | 09/16/2015 | | | | 511,000 | | | GBP | | | 807,329 | | | | USD | | | | 23,261 | | | | — | |
| | | | | | | |
Citibank | | | 09/16/2015 | | | | 8,713,000 | | | GBP | | | 13,329,332 | | | | USD | | | | — | | | | (39,706 | ) |
| | | | | | | |
Citibank | | | 09/16/2015 | | | | 21,000 | | | HKD | | | 2,709 | | | | USD | | | | 1 | | | | — | |
| | | | | | | |
Citibank | | | 09/16/2015 | | | | 7,798,000 | | | HKD | | | 1,005,753 | | | | USD | | | | — | | | | (425 | ) |
| | | | | | | |
Citibank | | | 09/16/2015 | | | | 1,620,000,000 | | | HUF | | | 5,849,494 | | | | USD | | | | 50,371 | | | | — | |
| | | | | | | |
Citibank | | | 09/16/2015 | | | | 1,360,000,000 | | | HUF | | | 4,812,990 | | | | USD | | | | — | | | | (55,412 | ) |
| | | | | | | |
Citibank | | | 09/16/2015 | | | | 63,600,000,000 | | | IDR | | | 4,672,616 | | | | USD | | | | 178,512 | | | | — | |
| | | | | | | |
Citibank | | | 09/16/2015 | | | | 14,400,000 | | | ILS | | | 3,751,407 | | | | USD | | | | 80,963 | | | | — | |
| | | | | | | |
Citibank | | | 09/16/2015 | | | | 654,200,000 | | | INR | | | 9,991,747 | | | | USD | | | | 171,771 | | | | — | |
| | | | | | | |
Citibank | | | 09/16/2015 | | | | 98,000,000 | | | INR | | | 1,466,889 | | | | USD | | | | — | | | | (4,156 | ) |
| | | | | | | |
Citibank | | | 09/16/2015 | | | | 208,512,843 | | | JPY | | | 1,720,680 | | | | USD | | | | 364 | | | | — | |
| | | | | | | |
Citibank | | | 09/16/2015 | | | | 23,770,855,999 | | | JPY | | | 191,735,104 | | | | USD | | | | — | | | | (4,384,112 | ) |
| | | | | | | |
Citibank | | | 09/16/2015 | | | | 325,631,000 | | | JPY | | | 2,634,720 | | | | USD | | | | — | | | | (51,868 | ) |
| | | | | | | |
Citibank | | | 09/16/2015 | | | | 33,290,000,000 | | | KRW | | | 29,440,616 | | | | USD | | | | 1,304,874 | | | | — | |
| | | | | | | |
Citibank | | | 09/16/2015 | | | | 770,000,000 | | | KRW | | | 649,109 | | | | USD | | | | — | | | | (1,672 | ) |
| | | | | | | |
Citibank | | | 09/16/2015 | | | | 429,290,000 | | | NOK | | | 54,086,369 | | | | USD | | | | 2,206,177 | | | | — | |
| | | | | | | |
Citibank | | | 09/16/2015 | | | | 4,556,000 | | | NOK | | | 581,428 | | | | USD | | | | 30,831 | | | | — | |
| | | | | | | |
Citibank | | | 09/16/2015 | | | | 116,057,000 | | | NZD | | | 79,835,027 | | | | USD | | | | 6,360,430 | | | | — | |
| | | | | | | |
Citibank | | | 09/16/2015 | | | | 1,512,000 | | | NZD | | | 1,030,610 | | | | USD | | | | 73,377 | | | | — | |
| | | | | | | |
Citibank | | | 09/16/2015 | | | | 881,000 | | | NZD | | | 600,216 | | | | USD | | | | 42,463 | | | | — | |
| | | | | | | |
Citibank | | | 09/16/2015 | | | | 389,200,000 | | | PHP | | | 8,565,398 | | | | USD | | | | 251,080 | | | | — | |
| | | | | | | |
Citibank | | | 09/16/2015 | | | | 35,900,000 | | | PLN | | | 9,596,132 | | | | USD | | | | 92,758 | | | | — | |
| | | | | | | |
Citibank | | | 09/16/2015 | | | | 2,200,000 | | | PLN | | | 592,924 | | | | USD | | | | 10,545 | | | | — | |
| | | | | | | |
Citibank | | | 09/16/2015 | | | | 36,500,000 | | | PLN | | | 9,588,262 | | | | USD | | | | — | | | | (73,943 | ) |
| | | | | | | |
Citibank | | | 09/16/2015 | | | | 257,819,000 | | | SEK | | | 30,739,450 | | | | USD | | | | 276,363 | | | | — | |
The accompanying Notes to Consolidated Financial Statements are an integral part of this statement.
| | |
| |
| | ACTIVE PORTFOLIOS® MULTI-MANAGER ALTERNATIVE STRATEGIES FUND |
CONSOLIDATED PORTFOLIO OF INVESTMENTS (continued)
August 31, 2015
Forward Foreign Currency Exchange Contracts Open at August 31, 2015 (continued)
| | | | | | | | | | | | | | | | | | | | | | | | |
| Counterparty | | Exchange
Date | | | Currency to
be Delivered | | Currency to
be Received | | Unrealized
Appreciation ($) | | | Unrealized
Depreciation ($) | |
Citibank | | | 09/16/2015 | | | | 583,312,000 | | | SEK | | | 67,998,968 | | | USD | | | — | | | | (923,353 | ) |
| | | | | | | |
Citibank | | | 09/16/2015 | | | | 39,830,000 | | | SGD | | | 29,191,918 | | | USD | | | 984,659 | | | | — | |
| | | | | | | |
Citibank | | | 09/16/2015 | | | | 900,000 | | | SGD | | | 636,701 | | | USD | | | — | | | | (671 | ) |
| | | | | | | |
Citibank | | | 09/16/2015 | | | | 50,830,000 | | | TRY | | | 18,127,815 | | | USD | | | 735,778 | | | | — | |
| | | | | | | |
Citibank | | | 09/16/2015 | | | | 900,000 | | | TRY | | | 305,531 | | | USD | | | — | | | | (2,413 | ) |
| | | | | | | |
Citibank | | | 09/16/2015 | | | | 604,000,000 | | | TWD | | | 19,461,585 | | | USD | | | 885,265 | | | | — | |
| | | | | | | |
Citibank | | | 09/16/2015 | | | | 2,000,000 | | | TWD | | | 61,364 | | | USD | | | — | | | | (147 | ) |
| | | | | | | |
Citibank | | | 09/16/2015 | | | | 51,292,310 | | | USD | | | 67,751,852 | | | AUD | | | — | | | | (3,111,171 | ) |
| | | | | | | |
Citibank | | | 09/16/2015 | | | | 17,101,509 | | | USD | | | 23,040,000 | | | AUD | | | — | | | | (716,815 | ) |
| | | | | | | |
Citibank | | | 09/16/2015 | | | | 893,608 | | | USD | | | 1,161,000 | | | AUD | | | — | | | | (67,973 | ) |
| | | | | | | |
Citibank | | | 09/16/2015 | | | | 8,212,329 | | | USD | | | 26,800,000 | | | BRL | | | — | | | | (859,139 | ) |
| | | | | | | |
Citibank | | | 09/16/2015 | | | | 31,366 | | | USD | | | 100,000 | | | BRL | | | — | | | | (3,929 | ) |
| | | | | | | |
Citibank | | | 09/16/2015 | | | | 189,821 | | | USD | | | 600,000 | | | BRL | | | — | | | | (25,197 | ) |
| | | | | | | |
Citibank | | | 09/16/2015 | | | | 4,408,466 | | | USD | | | 5,856,000 | | | CAD | | | 42,562 | | | | — | |
| | | | | | | |
Citibank | | | 09/16/2015 | | | | 49,433,831 | | | USD | | | 61,596,000 | | | CAD | | | — | | | | (2,615,956 | ) |
| | | | | | | |
Citibank | | | 09/16/2015 | | | | 20,611,822 | | | USD | | | 26,281,000 | | | CAD | | | — | | | | (636,164 | ) |
| | | | | | | |
Citibank | | | 09/16/2015 | | | | 12,294 | | | USD | | | 12,000 | | | CHF | | | 126 | | | | — | |
| | | | | | | |
Citibank | | | 09/16/2015 | | | | 625,431 | | | USD | | | 597,000 | | | CHF | | | — | | | | (7,551 | ) |
| | | | | | | |
Citibank | | | 09/16/2015 | | | | 28,289 | | | USD | | | 20,000,000 | | | CLP | | | 540 | | | | — | |
| | | | | | | |
Citibank | | | 09/16/2015 | | | | 2,155,745 | | | USD | | | 1,495,000,000 | | | CLP | | | — | | | | (835 | ) |
| | | | | | | |
Citibank | | | 09/16/2015 | | | | 742,355 | | | USD | | | 1,900,000,000 | | | COP | | | — | | | | (120,484 | ) |
| | | | | | | |
Citibank | | | 09/16/2015 | | | | 117,648 | | | USD | | | 300,000,000 | | | COP | | | — | | | | (19,458 | ) |
| | | | | | | |
Citibank | | | 09/16/2015 | | | | 14,836,162 | | | USD | | | 361,700,000 | | | CZK | | | 182,621 | | | | — | |
| | | | | | | |
Citibank | | | 09/16/2015 | | | | 949,686 | | | USD | | | 23,000,000 | | | CZK | | | 5,337 | | | | — | |
| | | | | | | |
Citibank | | | 09/16/2015 | | | | 952,949 | | | USD | | | 23,000,000 | | | CZK | | | 2,074 | | | | — | |
| | | | | | | |
Citibank | | | 09/16/2015 | | | | 3,258,252 | | | USD | | | 78,000,000 | | | CZK | | | — | | | | (19,476 | ) |
| | | | | | | |
Citibank | | | 09/16/2015 | | | | 138,905,656 | | | USD | | | 125,527,000 | | | EUR | | | 1,983,172 | | | | — | |
| | | | | | | |
Citibank | | | 09/16/2015 | | | | 99,549,145 | | | USD | | | 88,058,000 | | | EUR | | | — | | | | (714,722 | ) |
| | | | | | | |
Citibank | | | 09/16/2015 | | | | 3,599,671 | | | USD | | | 3,192,000 | | | EUR | | | — | | | | (17,038 | ) |
| | | | | | | |
Citibank | | | 09/16/2015 | | | | 33,441,524 | | | USD | | | 21,962,999 | | | GBP | | | 258,024 | | | | — | |
| | | | | | | |
Citibank | | | 09/16/2015 | | | | 51,922,364 | | | USD | | | 33,083,000 | | | GBP | | | — | | | | (1,160,531 | ) |
| | | | | | | |
Citibank | | | 09/16/2015 | | | | 93,127 | | | USD | | | 59,000 | | | GBP | | | — | | | | (2,599 | ) |
| | | | | | | |
Citibank | | | 09/16/2015 | | | | 1,008,609 | | | USD | | | 7,819,000 | | | HKD | | | 280 | | | | — | |
| | | | | | | |
Citibank | | | 09/16/2015 | | | | 11,063,932 | | | USD | | | 3,118,055,986 | | | HUF | | | 97,794 | | | | — | |
| | | | | | | |
Citibank | | | 09/16/2015 | | | | 816,275 | | | USD | | | 226,944,014 | | | HUF | | | — | | | | (3,882 | ) |
| | | | | | | |
Citibank | | | 09/16/2015 | | | | 2,251,298 | | | USD | | | 31,020,994,083 | | | IDR | | | — | | | | (59,292 | ) |
| | | | | | | |
Citibank | | | 09/16/2015 | | | | 1,693,002 | | | USD | | | 6,500,000 | | | ILS | | | — | | | | (36,203 | ) |
| | | | | | | |
Citibank | | | 09/16/2015 | | | | 8,688,090 | | | USD | | | 562,327,106 | | | INR | | | — | | | | (247,186 | ) |
| | | | | | | |
Citibank | | | 09/16/2015 | | | | 1,178,886 | | | USD | | | 76,000,000 | | | INR | | | — | | | | (38,076 | ) |
| | | | | | | |
Citibank | | | 09/16/2015 | | | | 1,178,054 | | | USD | | | 76,000,000 | | | INR | | | — | | | | (37,243 | ) |
| | | | | | | |
Citibank | | | 09/16/2015 | | | | 181,702,002 | | | USD | | | 22,259,106,000 | | | JPY | | | 1,944,658 | | | | — | |
The accompanying Notes to Consolidated Financial Statements are an integral part of this statement.
| | |
| |
| ACTIVE PORTFOLIOS® MULTI-MANAGER ALTERNATIVE STRATEGIES FUND | | |
CONSOLIDATED PORTFOLIO OF INVESTMENTS (continued)
August 31, 2015
Forward Foreign Currency Exchange Contracts Open at August 31, 2015 (continued)
| | | | | | | | | | | | | | | | | | | | | | | | |
| Counterparty | | Exchange
Date | | | Currency to
be Delivered | | Currency to
be Received | | Unrealized
Appreciation ($) | | | Unrealized
Depreciation ($) | |
Citibank | | | 09/16/2015 | | | | 21,367,815 | | | USD | | | 2,633,999,999 | | | JPY | | | 363,755 | | | | — | |
| | | | | | | |
Citibank | | | 09/16/2015 | | | | 16,828,902 | | | USD | | | 2,010,048,000 | | | JPY | | | — | | | | (245,190 | ) |
| | | | | | | |
Citibank | | | 09/16/2015 | | | | 803,159 | | | USD | | | 950,452,182 | | | KRW | | | 136 | | | | — | |
| | | | | | | |
Citibank | | | 09/16/2015 | | | | 19,358,442 | | | USD | | | 21,610,000,000 | | | KRW | | | — | | | | (1,094,295 | ) |
| | | | | | | |
Citibank | | | 09/16/2015 | | | | 2,583,915 | | | USD | | | 2,860,000,000 | | | KRW | | | — | | | | (166,726 | ) |
| | | | | | | |
Citibank | | | 09/16/2015 | | | | 864,365 | | | USD | | | 960,000,000 | | | KRW | | | — | | | | (53,001 | ) |
| | | | | | | |
Citibank | | | 09/16/2015 | | | | 22,343,427 | | | USD | | | 178,511,000 | | | NOK | | | — | | | | (770,168 | ) |
| | | | | | | |
Citibank | | | 09/16/2015 | | | | 61,771,970 | | | USD | | | 93,991,633 | | | NZD | | | — | | | | (2,266,755 | ) |
| | | | | | | |
Citibank | | | 09/16/2015 | | | | 5,872,266 | | | USD | | | 8,800,000 | | | NZD | | | — | | | | (301,069 | ) |
| | | | | | | |
Citibank | | | 09/16/2015 | | | | 2,275,301 | | | USD | | | 103,000,000 | | | PHP | | | — | | | | (74,954 | ) |
| | | | | | | |
Citibank | | | 09/16/2015 | | | | 1,124,633 | | | USD | | | 51,000,000 | | | PHP | | | — | | | | (35,140 | ) |
| | | | | | | |
Citibank | | | 09/16/2015 | | | | 2,284,951 | | | USD | | | 8,675,503 | | | PLN | | | 11,611 | | | | — | |
| | | | | | | |
Citibank | | | 09/16/2015 | | | | 14,851,392 | | | USD | | | 55,524,497 | | | PLN | | | — | | | | (153,063 | ) |
| | | | | | | |
Citibank | | | 09/16/2015 | | | | 5,812,972 | | | USD | | | 49,336,000 | | | SEK | | | 16,415 | | | | — | |
| | | | | | | |
Citibank | | | 09/16/2015 | | | | 56,731,118 | | | USD | | | 465,249,000 | | | SEK | | | — | | | | (1,758,752 | ) |
| | | | | | | |
Citibank | | | 09/16/2015 | | | | 2,442,430 | | | USD | | | 19,933,000 | | | SEK | | | — | | | | (87,209 | ) |
| | | | | | | |
Citibank | | | 09/16/2015 | | | | 2,920,927 | | | USD | | | 24,047,000 | | | SEK | | | — | | | | (79,609 | ) |
| | | | | | | |
Citibank | | | 09/16/2015 | | | | 25,659,452 | | | USD | | | 34,710,000 | | | SGD | | | — | | | | (1,078,135 | ) |
| | | | | | | |
Citibank | | | 09/16/2015 | | | | 290,958 | | | USD | | | 390,000 | | | SGD | | | — | | | | (14,763 | ) |
| | | | | | | |
Citibank | | | 09/16/2015 | | | | 13,724,999 | | | USD | | | 37,300,000 | | | TRY | | | — | | | | (962,399 | ) |
| | | | | | | |
Citibank | | | 09/16/2015 | | | | 109,646 | | | USD | | | 300,000 | | | TRY | | | — | | | | (6,998 | ) |
| | | | | | | |
Citibank | | | 09/16/2015 | | | | 510,963 | | | USD | | | 1,400,000 | | | TRY | | | — | | | | (31,938 | ) |
| | | | | | | |
Citibank | | | 09/16/2015 | | | | 3,708,879 | | | USD | | | 121,100,000 | | | TWD | | | 15,611 | | | | — | |
| | | | | | | |
Citibank | | | 09/16/2015 | | | | 15,616,410 | | | USD | | | 481,900,000 | | | TWD | | | — | | | | (795,337 | ) |
| | | | | | | |
Citibank | | | 09/16/2015 | | | | 97,658 | | | USD | | | 3,000,000 | | | TWD | | | — | | | | (5,392 | ) |
| | | | | | | |
Citibank | | | 09/16/2015 | | | | 6,725,381 | | | USD | | | 84,100,000 | | | ZAR | | | — | | | | (398,488 | ) |
| | | | | | | |
Citibank | | | 09/16/2015 | | | | 665,479 | | | USD | | | 8,200,000 | | | ZAR | | | — | | | | (48,588 | ) |
| | | | | | | |
Citibank | | | 09/16/2015 | | | | 125,000,000 | | | ZAR | | | 9,865,910 | | | USD | | | 462,086 | | | | — | |
| | | | | | | |
Citibank | | | 09/17/2015 | | | | 332,100,000 | | | MXN | | | 21,246,622 | | | USD | | | 1,391,549 | | | | — | |
| | | | | | | |
Citibank | | | 09/17/2015 | | | | 20,400,000 | | | MYR | | | 5,450,264 | | | USD | | | 574,183 | | | | — | |
| | | | | | | |
Citibank | | | 09/17/2015 | | | | 3,360,738 | | | USD | | | 56,924,636 | | | MXN | | | 42,581 | | | | — | |
| | | | | | | |
Citibank | | | 09/17/2015 | | | | 15,034,534 | | | USD | | | 239,000,000 | | | MXN | | | — | | | | (745,577 | ) |
| | | | | | | |
Citibank | | | 09/17/2015 | | | | 47,248 | | | USD | | | 200,000 | | | MYR | | | 556 | | | | — | |
| | | | | | | |
Citibank | | | 09/17/2015 | | | | 4,230,740 | | | USD | | | 16,310,000 | | | MYR | | | — | | | | (332,262 | ) |
| | | | | | | |
Citibank | | | 09/17/2015 | | | | 344,500 | | | USD | | | 1,300,000 | | | MYR | | | — | | | | (33,769 | ) |
| | | | | | | |
Citibank | | | 12/16/2015 | | | | 2,686,852 | | | AUD | | | 1,907,577 | | | USD | | | 5,554 | | | | — | |
| | | | | | | |
Citibank | | | 12/16/2015 | | | | 116,000 | | | CHF | | | 120,904 | | | USD | | | 441 | | | | — | |
| | | | | | | |
Citibank | | | 12/16/2015 | | | | 1,495,000,000 | | | CLP | | | 2,137,534 | | | USD | | | 134 | | | | — | |
| | | | | | | |
Citibank | | | 12/16/2015 | | | | 24,000,000 | | | CZK | | | 1,002,579 | | | USD | | | 3,755 | | | | — | |
| | | | | | | |
Citibank | | | 12/16/2015 | | | | 9,000,000 | | | CZK | | | 374,071 | | | USD | | | — | | | | (488 | ) |
| | | | | | | |
Citibank | | | 12/16/2015 | | | | 1,475,000 | | | GBP | | | 2,282,273 | | | USD | | | 20,136 | | | | — | |
The accompanying Notes to Consolidated Financial Statements are an integral part of this statement.
| | |
| |
| | ACTIVE PORTFOLIOS® MULTI-MANAGER ALTERNATIVE STRATEGIES FUND |
CONSOLIDATED PORTFOLIO OF INVESTMENTS (continued)
August 31, 2015
Forward Foreign Currency Exchange Contracts Open at August 31, 2015 (continued)
| | | | | | | | | | | | | | | | | | | | | | | | |
| Counterparty | | Exchange
Date | | | Currency to
be Delivered | | Currency to
be Received | | Unrealized
Appreciation ($) | | | Unrealized
Depreciation ($) | |
Citibank | | | 12/16/2015 | | | | 210,000,000 | | | HUF | | | 752,425 | | | USD | | | 617 | | | | — | |
| | | | | | | |
Citibank | | | 12/16/2015 | | | | 12,720,994,083 | | | IDR | | | 869,509 | | | USD | | | 3,019 | | | | — | |
| | | | | | | |
Citibank | | | 12/16/2015 | | | | 200,000 | | | ILS | | | 50,980 | | | USD | | | — | | | | (90 | ) |
| | | | | | | |
Citibank | | | 12/16/2015 | | | | 53,000,000 | | | INR | | | 786,827 | | | USD | | | 2,834 | | | | — | |
| | | | | | | |
Citibank | | | 12/16/2015 | | | | 4,327,106 | | | INR | | | 63,967 | | | USD | | | — | | | | (40 | ) |
| | | | | | | |
Citibank | | | 12/16/2015 | | | | 1,010,452,182 | | | KRW | | | 851,891 | | | USD | | | — | | | | (330 | ) |
| | | | | | | |
Citibank | | | 12/16/2015 | | | | 32,924,636 | | | MXN | | | 1,939,685 | | | USD | | | — | | | | (15,259 | ) |
| | | | | | | |
Citibank | | | 12/16/2015 | | | | 22,398,633 | | | NZD | | | 14,273,382 | | | USD | | | 183,933 | | | | — | |
| | | | | | | |
Citibank | | | 12/16/2015 | | | | 130,000 | | | SGD | | | 91,577 | | | USD | | | — | | | | (172 | ) |
| | | | | | | |
Citibank | | | 12/16/2015 | | | | 1,200,000 | | | TRY | | | 399,091 | | | USD | | | — | | | | (366 | ) |
| | | | | | | |
Citibank | | | 12/16/2015 | | | | 103,100,000 | | | TWD | | | 3,164,301 | | | USD | | | — | | | | (10,856 | ) |
| | | | | | | |
Citibank | | | 12/16/2015 | | | | 1,577,724 | | | USD | | | 2,225,000 | | | AUD | | | — | | | | (2,647 | ) |
| | | | | | | |
Citibank | | | 12/16/2015 | | | | 52,913 | | | USD | | | 200,000 | | | BRL | | | 310 | | | | — | |
| | | | | | | |
Citibank | | | 12/16/2015 | | | | 134,622 | | | USD | | | 500,000 | | | BRL | | | — | | | | (1,565 | ) |
| | | | | | | |
Citibank | | | 12/16/2015 | | | | 772,987 | | | USD | | | 740,000 | | | CHF | | | — | | | | (4,518 | ) |
| | | | | | | |
Citibank | | | 12/16/2015 | | | | 143,860 | | | USD | | | 100,000,000 | | | CLP | | | — | | | | (890 | ) |
| | | | | | | |
Citibank | | | 12/16/2015 | | | | 8,121,853 | | | USD | | | 977,819,843 | | | JPY | | | — | | | | (42,363 | ) |
| | | | | | | |
Citibank | | | 12/16/2015 | | | | 75,872 | | | USD | | | 90,000,000 | | | KRW | | | 35 | | | | — | |
| | | | | | | |
Citibank | | | 12/16/2015 | | | | 413,818 | | | USD | | | 7,000,000 | | | MXN | | | 1,817 | | | | — | |
| | | | | | | |
Citibank | | | 12/16/2015 | | | | 23,810 | | | USD | | | 100,000 | | | MYR | | | 60 | | | | — | |
| | | | | | | |
Citibank | | | 12/16/2015 | | | | 1,132,874 | | | USD | | | 9,438,000 | | | NOK | | | 6,232 | | | | — | |
| | | | | | | |
Citibank | | | 12/16/2015 | | | | 1,609,061 | | | USD | | | 2,511,000 | | | NZD | | | — | | | | (29,562 | ) |
| | | | | | | |
Citibank | | | 12/16/2015 | | | | 524,290 | | | USD | | | 17,000,000 | | | TWD | | | — | | | | (743 | ) |
| | | | | | | |
Citibank | | | 12/17/2015 | | | | 2,400,000 | | | ZAR | | | 179,905 | | | USD | | | 2,315 | | | | — | |
| | | | | | | |
Citibank | | | 12/17/2015 | | | | 100,000 | | | ZAR | | | 7,397 | | | USD | | | — | | | | (2 | ) |
| | | | | | | |
Goldman, Sachs & Co. | | | 09/15/2015 | | | | 14,350 | | | AUD | | | 10,955 | | | USD | | | 748 | | | | — | |
| | | | | | | |
Goldman, Sachs & Co. | | | 09/15/2015 | | | | 567,400 | | | CAD | | | 451,757 | | | USD | | | 20,487 | | | | — | |
| | | | | | | |
Goldman, Sachs & Co. | | | 09/15/2015 | | | | 263,300 | | | CAD | | | 199,790 | | | USD | | | — | | | | (338 | ) |
| | | | | | | |
Goldman, Sachs & Co. | | | 09/15/2015 | | | | 2,161,400 | | | EUR | | | 2,454,342 | | | USD | | | 28,467 | | | | — | |
| | | | | | | |
Goldman, Sachs & Co. | | | 09/15/2015 | | | | 530,000 | | | EUR | | | 581,004 | | | USD | | | — | | | | (13,847 | ) |
| | | | | | | |
Goldman, Sachs & Co. | | | 09/15/2015 | | | | 334,677 | | | GBP | | | 518,896 | | | USD | | | 5,373 | | | | — | |
| | | | | | | |
Goldman, Sachs & Co. | | | 09/15/2015 | | | | 38,400 | | | HKD | | | 4,954 | | | USD | | | 1 | | | | — | |
| | | | | | | |
Goldman, Sachs & Co. | | | 09/15/2015 | | | | 4,651,900 | | | HKD | | | 599,976 | | | USD | | | — | | | | (259 | ) |
| | | | | | | |
Goldman, Sachs & Co. | | | 09/15/2015 | | | | 4,944 | | | USD | | | 6,600 | | | AUD | | | — | | | | (250 | ) |
| | | | | | | |
Goldman, Sachs & Co. | | | 09/15/2015 | | | | 106,689 | | | USD | | | 141,100 | | | CAD | | | 559 | | | | — | |
| | | | | | | |
Goldman, Sachs & Co. | | | 09/15/2015 | | | | 335,647 | | | USD | | | 429,200 | | | CAD | | | — | | | | (9,421 | ) |
| | | | | | | |
Goldman, Sachs & Co. | | | 09/15/2015 | | | | 74,699 | | | USD | | | 48,300 | | | GBP | | | — | | | | (589 | ) |
| | | | | | | |
Goldman, Sachs & Co. | | | 09/15/2015 | | | | 976,206 | | | USD | | | 7,568,200 | | | HKD | | | 323 | | | | — | |
| | | | | | | |
Goldman, Sachs & Co. | | | 09/15/2015 | | | | 25,369 | | | USD | | | 196,600 | | | HKD | | | — | | | | (1 | ) |
| | | | | | | | | | | | | | | | | | | | | | | | | |
Total | | | | | | | | | | | | | | | | | | | 31,180,437 | | | | (29,728,208 | ) |
| | | | | | | | | | | | | | | | | | | | | | | | | |
The accompanying Notes to Consolidated Financial Statements are an integral part of this statement.
| | |
| |
| ACTIVE PORTFOLIOS® MULTI-MANAGER ALTERNATIVE STRATEGIES FUND | | |
CONSOLIDATED PORTFOLIO OF INVESTMENTS (continued)
August 31, 2015
Futures Contracts Outstanding at August 31, 2015
Long Futures Contracts Outstanding
| | | | | | | | | | | | | | | | | | | | | | | | |
| Contract Description | | Number of
Contracts | | | Trading
Currency | | | Notional Market
Value ($) | | | Expiration Date | | | Unrealized
Appreciation ($) | | | Unrealized
Depreciation ($) | |
10YR MINI JGB | | | 418 | | | | JPY | | | | 50,997,138 | | | | 09/2015 | | | | 137,117 | | | | — | |
| | | | | | |
3MO EURO EURIBOR | | | 84 | | | | EUR | | | | 23,573,410 | | | | 12/2015 | | | | 2,761 | | | | — | |
| | | | | | |
3MO EURO EURIBOR | | | 76 | | | | EUR | | | | 21,327,257 | | | | 03/2016 | | | | 2,321 | | | | — | |
| | | | | | |
3MO EURO EURIBOR | | | 88 | | | | EUR | | | | 24,692,250 | | | | 06/2016 | | | | 3,230 | | | | — | |
| | | | | | |
3MO EURO EURIBOR | | | 99 | | | | EUR | | | | 27,773,227 | | | | 09/2016 | | | | 3,852 | | | | — | |
| | | | | | |
3MO EURO EURIBOR | | | 123 | | | | EUR | | | | 34,495,778 | | | | 12/2016 | | | | 2,452 | | | | — | |
| | | | | | |
3MO EURO EURIBOR | | | 133 | | | | EUR | | | | 37,285,392 | | | | 03/2017 | | | | — | | | | (2,095 | ) |
| | | | | | |
3MO EURO EURIBOR | | | 129 | | | | EUR | | | | 36,147,738 | | | | 06/2017 | | | | — | | | | (4,778 | ) |
| | | | | | |
90DAY EURO $ | | | 326 | | | | USD | | | | 81,108,800 | | | | 12/2015 | | | | — | | | | (3,059 | ) |
| | | | | | |
90DAY EURO $ | | | 311 | | | | USD | | | | 77,267,950 | | | | 03/2016 | | | | 11,743 | | | | — | |
| | | | | | |
90DAY EURO $ | | | 272 | | | | USD | | | | 67,459,393 | | | | 06/2016 | | | | 39,851 | | | | — | |
| | | | | | |
90DAY EURO $ | | | 248 | | | | USD | | | | 61,386,194 | | | | 09/2016 | | | | 59,984 | | | | — | |
| | | | | | |
90DAY EURO $ | | | 235 | | | | USD | | | | 58,050,875 | | | | 12/2016 | | | | 64,481 | | | | — | |
| | | | | | |
90DAY EURO $ | | | 222 | | | | USD | | | | 54,745,200 | | | | 03/2017 | | | | 57,902 | | | | — | |
| | | | | | |
90DAY EURO $ | | | 212 | | | | USD | | | | 52,194,400 | | | | 06/2017 | | | | 45,434 | | | | — | |
| | | | | | |
90DAY STERLING | | | 218 | | | | GBP | | | | 41,543,335 | | | | 12/2015 | | | | 22,862 | | | | — | |
| | | | | | |
90DAY STERLING | | | 216 | | | | GBP | | | | 41,124,911 | | | | 03/2016 | | | | 37,630 | | | | — | |
| | | | | | |
90DAY STERLING | | | 151 | | | | GBP | | | | 28,717,499 | | | | 06/2016 | | | | 30,763 | | | | — | |
| | | | | | |
90DAY STERLING | | | 309 | | | | GBP | | | | 58,695,155 | | | | 09/2016 | | | | 87,476 | | | | — | |
| | | | | | |
90DAY STERLING | | | 287 | | | | GBP | | | | 54,439,142 | | | | 12/2016 | | | | 93,097 | | | | — | |
| | | | | | |
90DAY STERLING | | | 262 | | | | GBP | | | | 49,636,745 | | | | 03/2017 | | | | 86,260 | | | | — | |
| | | | | | |
90DAY STERLING | | | 250 | | | | GBP | | | | 47,300,972 | | | | 06/2017 | | | | 79,319 | | | | — | |
| | | | | | |
AUST 10Y BOND | | | 158 | | | | AUD | | | | 14,482,623 | | | | 09/2015 | | | | 140,164 | | | | — | |
| | | | | | |
AUST 3YR BOND | | | 669 | | | | AUD | | | | 53,468,211 | | | | 09/2015 | | | | 162,074 | | | | — | |
| | | | | | |
BANK ACCEPT | | | 260 | | | | CAD | | | | 49,098,320 | | | | 12/2015 | | | | 37,301 | | | | — | |
| | | | | | |
BANK ACCEPT | | | 249 | | | | CAD | | | | 47,025,811 | | | | 03/2016 | | | | 55,982 | | | | — | |
| | | | | | |
CAN 10YR BOND | | | 151 | | | | CAD | | | | 16,231,697 | | | | 12/2015 | | | | — | | | | (231,268 | ) |
| | | | | | |
COTTON NO.2 | | | 17 | | | | USD | | | | 535,500 | | | | 12/2015 | | | | — | | | | (5,312 | ) |
| | | | | | |
EURO BUXL 30Y BND | | | 18 | | | | EUR | | | | 3,061,721 | | | | 09/2015 | | | | — | | | | (107,967 | ) |
| | | | | | |
Euro CHF 3MO ICE | | | 9 | | | | CHF | | | | 2,345,084 | | | | 12/2015 | | | | — | | | | (2,620 | ) |
| | | | | | |
Euro CHF 3MO ICE | | | 16 | | | | CHF | | | | 4,169,865 | | | | 03/2016 | | | | — | | | | (4,928 | ) |
| | | | | | |
Euro CHF 3MO ICE | | | 21 | | | | CHF | | | | 5,472,948 | | | | 06/2016 | | | | — | | | | (4,889 | ) |
| | | | | | |
EURO FX CURR | | | 295 | | | | USD | | | | 41,443,813 | | | | 09/2015 | | | | 429,780 | | | | — | |
| | | | | | |
EURO-BOBL | | | 90 | | | | EUR | | | | 13,132,192 | | | | 09/2015 | | | | — | | | | (32,470 | ) |
| | | | | | |
EURO-BUND | | | 64 | | | | EUR | | | | 10,994,562 | | | | 09/2015 | | | | — | | | | (105,667 | ) |
| | | | | | |
JPN YEN CURR | | | 231 | | | | USD | | | | 23,844,975 | | | | 09/2015 | | | | 351,731 | | | | — | |
| | | | | | |
LONG GILT | | | 111 | | | | GBP | | | | 19,960,916 | | | | 12/2015 | | | | — | | | | (120,961 | ) |
| | | | | | |
US 10YR NOTE (CBT) | | | 177 | | | | USD | | | | 22,490,063 | | | | 12/2015 | | | | — | | | | (153,920 | ) |
| | | | | | |
US 2YR NOTE (CBT) | | | 523 | | | | USD | | | | 114,259,156 | | | | 12/2015 | | | | — | | | | (217,489 | ) |
| | | | | | |
US 5YR NOTE (CBT) | | | 358 | | | | USD | | | | 42,758,625 | | | | 12/2015 | | | | — | | | | (242,562 | ) |
| | | | | | |
US LONG BOND (CBT) | | | 67 | | | | USD | | | | 10,359,875 | | | | 12/2015 | | | | — | | | | (222,515 | ) |
| | | | | | | | | | | | | | | | | | | | | | | | | |
Total | | | | | | | | | | | 1,525,098,718 | | | | | | | | 2,045,567 | | | | (1,462,500 | ) |
| | | | | | | | | | | | | | | | | | | | | | | | | |
The accompanying Notes to Consolidated Financial Statements are an integral part of this statement.
| | |
| |
| | ACTIVE PORTFOLIOS® MULTI-MANAGER ALTERNATIVE STRATEGIES FUND |
CONSOLIDATED PORTFOLIO OF INVESTMENTS (continued)
August 31, 2015
Futures Contracts Outstanding at August 31, 2015 (continued)
Short Futures Contracts Outstanding
| | | | | | | | | | | | | | | | | | | | | | | | |
| Contract Description | | Number of
Contracts | | | Trading
Currency | | | Notional Market
Value ($) | | | Expiration Date | | | Unrealized
Appreciation ($) | | | Unrealized
Depreciation ($) | |
AMSTERDAM IDX | | | (3 | ) | | | EUR | | | | (299,446 | ) | | | 09/2015 | | | | 3,113 | | | | — | |
| | | | | | |
AUDUSD Crncy | | | (294 | ) | | | USD | | | | (20,926,920 | ) | | | 09/2015 | | | | 706,641 | | | | — | |
| | | | | | |
BRENT CRUDE | | | (29 | ) | | | USD | | | | (1,570,350 | ) | | | 09/2015 | | | | — | | | | (106,232 | ) |
| | | | | | |
C$ CURRENCY | | | (335 | ) | | | USD | | | | (25,419,800 | ) | | | 09/2015 | | | | 721,037 | | | | — | |
| | | | | | |
CAC40 10 EURO | | | (5 | ) | | | EUR | | | | (261,012 | ) | | | 09/2015 | | | | — | | | | (1,028 | ) |
| | | | | | |
COCOA | | | (22 | ) | | | USD | | | | (681,780 | ) | | | 12/2015 | | | | — | | | | (1,717 | ) |
| | | | | | |
COFFEE ‘C’ | | | (23 | ) | | | USD | | | | (1,072,088 | ) | | | 12/2015 | | | | 49,719 | | | | — | |
| | | | | | |
COPPER | | | (81 | ) | | | USD | | | | (4,733,438 | ) | | | 12/2015 | | | | — | | | | (170,902 | ) |
| | | | | | |
CORN | | | (119 | ) | | | USD | | | | (2,232,738 | ) | | | 12/2015 | | | | 79,329 | | | | — | |
| | | | | | |
DAX INDEX | | | (1 | ) | | | EUR | | | | (287,467 | ) | | | 09/2015 | | | | — | | | | (592 | ) |
| | | | | | |
DJIA MINI e-CBOT | | | (48 | ) | | | USD | | | | (3,961,920 | ) | | | 09/2015 | | | | 153,289 | | | | — | |
| | | | | | |
EURO STOXX 50 | | | (24 | ) | | | EUR | | | | (880,394 | ) | | | 09/2015 | | | | — | | | | (1,708 | ) |
| | | | | | |
FTSE 100 IDX | | | (45 | ) | | | GBP | | | | (4,292,994 | ) | | | 09/2015 | | | | 227,060 | | | | — | |
| | | | | | |
FTSE/JSE TOP 40 | | | (48 | ) | | | ZAR | | | | (1,600,163 | ) | | | 09/2015 | | | | 27,516 | | | | — | |
| | | | | | |
FTSE/MIB IDX | | | (3 | ) | | | EUR | | | | (369,317 | ) | | | 09/2015 | | | | — | | | | (2,528 | ) |
| | | | | | |
GASOLINE RBOB | | | (71 | ) | | | USD | | | | (4,470,316 | ) | | | 09/2015 | | | | — | | | | (18,066 | ) |
| | | | | | |
GBP CURRENCY | | | (1 | ) | | | USD | | | | (95,925 | ) | | | 09/2015 | | | | 540 | | | | — | |
| | | | | | |
HANG SENG IDX | | | (16 | ) | | | HKD | | | | (2,215,624 | ) | | | 09/2015 | | | | — | | | | (8,174 | ) |
| | | | | | |
H-SHARES IDX | | | (6 | ) | | | HKD | | | | (374,785 | ) | | | 09/2015 | | | | — | | | | (3,839 | ) |
| | | | | | |
IBEX 35 INDX | | | (10 | ) | | | EUR | | | | (1,150,047 | ) | | | 09/2015 | | | | 27,925 | | | | — | |
| | | | | | |
KC HRW WHEAT | | | (22 | ) | | | USD | | | | (536,525 | ) | | | 12/2015 | | | | 18,038 | | | | — | |
| | | | | | |
KOSPI2 INX | | | (36 | ) | | | KRW | | | | (3,516,297 | ) | | | 09/2015 | | | | 254,703 | | | | — | |
| | | | | | |
LEAN HOGS | | | (66 | ) | | | USD | | | | (1,795,860 | ) | | | 10/2015 | | | | — | | | | (90,577 | ) |
| | | | | | |
LME COPPER | | | (37 | ) | | | USD | | | | (4,760,975 | ) | | | 09/2015 | | | | 544,430 | | | | — | |
| | | | | | |
LME COPPER | | | (16 | ) | | | USD | | | | (2,053,400 | ) | | | 12/2015 | | | | — | | | | (28,639 | ) |
| | | | | | |
LME NICKEL | | | (9 | ) | | | USD | | | | (542,052 | ) | | | 09/2015 | | | | 157,662 | | | | — | |
| | | | | | |
LME NICKEL | | | (10 | ) | | | USD | | | | (603,780 | ) | | | 12/2015 | | | | — | | | | (10,943 | ) |
| | | | | | |
LME ZINC | | | (37 | ) | | | USD | | | | (1,673,788 | ) | | | 12/2015 | | | | — | | | | (107,622 | ) |
| | | | | | |
Low Su Gasoil G | | | (101 | ) | | | USD | | | | (4,959,100 | ) | | | 10/2015 | | | | — | | | | (63,948 | ) |
| | | | | | |
MSCI SING IX ETS | | | (54 | ) | | | SGD | | | | (2,472,202 | ) | | | 09/2015 | | | | 6,510 | | | | — | |
| | | | | | |
MSCI TAIWAN INDEX | | | (45 | ) | | | USD | | | | (1,354,500 | ) | | | 09/2015 | | | | — | | | | (56,177 | ) |
| | | | | | |
NASDAQ 100 E-MINI | | | (5 | ) | | | USD | | | | (427,175 | ) | | | 09/2015 | | | | 3,777 | | | | — | |
| | | | | | |
NATURAL GAS | | | (96 | ) | | | USD | | | | (2,581,440 | ) | | | 09/2015 | | | | 137,012 | | | | — | |
| | | | | | |
NEW ZEALAND $ | | | (163 | ) | | | USD | | | | (10,326,050 | ) | | | 09/2015 | | | | 489,686 | | | | — | |
| | | | | | |
NY Harb ULSD | | | (67 | ) | | | USD | | | | (4,787,177 | ) | | | 09/2015 | | | | — | | | | (341,373 | ) |
| | | | | | |
Russell 2000 Mini | | | (25 | ) | | | USD | | | | (2,893,750 | ) | | | 09/2015 | | | | — | | | | (45,257 | ) |
| | | | | | |
S&P MID 400 EMINI | | | (20 | ) | | | USD | | | | (2,829,000 | ) | | | 09/2015 | | | | — | | | | (64,987 | ) |
| | | | | | |
S&P/TSX 60 IX | | | (57 | ) | | | CAD | | | | (7,054,378 | ) | | | 09/2015 | | | | 151,304 | | | | — | |
| | | | | | |
S&P500 EMINI | | | (32 | ) | | | USD | | | | (3,150,720 | ) | | | 09/2015 | | | | — | | | | (71,495 | ) |
| | | | | | |
SGX CNX NIFTY | | | (50 | ) | | | USD | | | | (800,000 | ) | | | 09/2015 | | | | — | | | | (3,276 | ) |
| | | | | | |
SOYBEAN | | | (151 | ) | | | USD | | | | (6,700,625 | ) | | | 11/2015 | | | | 213,615 | | | | — | |
| | | | | | |
SOYBEAN OIL | | | (124 | ) | | | USD | | | | (2,101,800 | ) | | | 12/2015 | | | | 205,032 | | | | — | |
| | | | | | |
SPI 200 | | | (51 | ) | | | AUD | | | | (4,688,297 | ) | | | 09/2015 | | | | 109,819 | | | | — | |
The accompanying Notes to Consolidated Financial Statements are an integral part of this statement.
| | |
| |
| ACTIVE PORTFOLIOS® MULTI-MANAGER ALTERNATIVE STRATEGIES FUND | | |
CONSOLIDATED PORTFOLIO OF INVESTMENTS (continued)
August 31, 2015
Futures Contracts Outstanding at August 31, 2015 (continued)
Short Futures Contracts Outstanding (continued)
| | | | | | | | | | | | | | | | | | | | | | | | |
| Contract Description | | Number of
Contracts | | | Trading
Currency | | | Notional Market
Value ($) | | | Expiration Date | | | Unrealized
Appreciation ($) | | | Unrealized
Depreciation ($) | |
SUGAR #11 (WORLD) | | | (535 | ) | | | USD | | | | (6,405,448 | ) | | | 09/2015 | | | | 797,316 | | | | — | |
| | | | | | |
TOPIX INDX | | | (5 | ) | | | JPY | | | | (632,449 | ) | | | 09/2015 | | | | 5,421 | | | | — | |
| | | | | | |
WHEAT FUTURE (CBT) | | | (172 | ) | | | USD | | | | (4,171,000 | ) | | | 12/2015 | | | | 149,289 | | | | — | |
| | | | | | |
WTI CRUDE | | | (13 | ) | | | USD | | | | (639,600 | ) | | | 09/2015 | | | | — | | | | (67,458 | ) |
| | | | | | | | | | | | | | | | | | | | | | | | | |
Total | | | | | | | | | | | (161,353,912 | ) | | | | | | | 5,239,783 | | | | (1,266,538 | ) |
| | | | | | | | | | | | | | | | | | | | | | | | | |
Open Options Contracts Written at August 31, 2015
| | | | | | | | | | | | | | | | | | | | | | | | |
| Issuer | | Puts/Calls | | | Number of
Contracts | | | Exercise
Price ($) | | | Premium
Received ($) | | | Expiration
Date | | | Value ($) | |
ACE Ltd. | | | Put | | | | 9 | | | | 100.00 | | | | 2,148 | | | | 11/2015 | | | | 3,285 | |
| | | | | | |
Altera Corp. | | | Call | | | | 74 | | | | 50.00 | | | | 7,605 | | | | 09/2015 | | | | 3,330 | |
| | | | | | |
Avago Technologies Ltd. | | | Call | | | | 17 | | | | 130.00 | | | | 3,044 | | | | 09/2015 | | | | 5,058 | |
| | | | | | |
Avago Technologies Ltd. | | | Call | | | | 8 | | | | 135.00 | | | | 1,684 | | | | 09/2015 | | | | 1,160 | |
| | | | | | |
Avago Technologies Ltd. | | | Call | | | | 17 | | | | 125.00 | | | | 6,869 | | | | 09/2015 | | | | 9,010 | |
| | | | | | |
Avago Technologies Ltd. | | | Call | | | | 7 | | | | 120.00 | | | | 2,974 | | | | 09/2015 | | | | 6,125 | |
| | | | | | |
Avago Technologies Ltd. | | | Put | | | | 38 | | | | 125.00 | | | | 23,525 | | | | 10/2015 | | | | 28,120 | |
| | | | | | |
Avago Technologies Ltd. | | | Call | | | | 277 | | | | 130.00 | | | | 140,425 | | | | 01/2016 | | | | 343,480 | |
| | | | | | |
Axalta Coating Systems Ltd. | | | Call | | | | 142 | | | | 30.00 | | | | 10,502 | | | | 09/2015 | | | | 12,780 | |
| | | | | | |
Axalta Coating Systems Ltd. | | | Call | | | | 142 | | | | 30.00 | | | | 22,288 | | | | 10/2015 | | | | 21,655 | |
| | | | | | |
EMC Corp. | | | Call | | | | 1,773 | | | | 30.00 | | | | 15,886 | | | | 09/2015 | | | | 6,206 | |
| | | | | | |
EMC Corp. | | | Put | | | | 87 | | | | 25.00 | | | | 5,756 | | | | 10/2015 | | | | 11,178 | |
| | | | | | |
Energy Transfer Equity LP | | | Call | | | | 7 | | | | 32.50 | | | | 520 | | | | 09/2015 | | | | 158 | |
| | | | | | |
Energy Transfer Equity LP | | | Call | | | | 22 | | | | 31.25 | | | | 2,499 | | | | 09/2015 | | | | 715 | |
| | | | | | |
Energy Transfer Equity LP | | | Call | | | | 62 | | | | 30.00 | | | | 11,643 | | | | 09/2015 | | | | 3,255 | |
| | | | | | |
Energy Transfer Equity LP | | | Call | | | | 201 | | | | 28.75 | | | | 17,256 | | | | 09/2015 | | | | 20,100 | |
| | | | | | |
Energy Transfer Equity LP | | | Call | | | | 201 | | | | 27.50 | | | | 28,186 | | | | 09/2015 | | | | 33,165 | |
| | | | | | |
Expedia, Inc. | | | Put | | | | 83 | | | | 105.00 | | | | 25,668 | | | | 09/2015 | | | | 10,998 | |
| | | | | | |
Hewlett-Packard Co. | | | Call | | | | 71 | | | | 31.00 | | | | 867 | | | | 09/2015 | | | | 675 | |
| | | | | | |
Hewlett-Packard Co. | | | Put | | | | 420 | | | | 25.00 | | | | 17,795 | | | | 10/2015 | | | | 15,120 | |
| | | | | | |
iShares Russell 2000 Growth ETF | | | Put | | | | 2,299 | | | | 140.00 | | | | 314,865 | | | | 09/2015 | | | | 574,750 | |
| | | | | | |
KLX, Inc. | | | Call | | | | 279 | | | | 40.00 | | | | 27,051 | | | | 09/2015 | | | | 20,925 | |
| | | | | | |
Macy’s, Inc. | | | Put | | | | 281 | | | | 55.00 | | | | 4,760 | | | | 09/2015 | | | | 17,281 | |
| | | | | | |
Macy’s, Inc. | | | Call | | | | 281 | | | | 75.00 | | | | 17,424 | | | | 01/2016 | | | | 13,909 | |
| | | | | | |
MGM Resorts International | | | Call | | | | 427 | | | | 25.00 | | | | 8,117 | | | | 09/2015 | | | | 2,562 | |
| | | | | | |
Receptos, Inc.(d)(e) | | | Call | | | | 54 | | | | 240.00 | | | | 3,433 | | | | 09/2015 | | | | 0 | |
| | | | | | |
Receptos, Inc.(d)(e) | | | Call | | | | 46 | | | | 240.00 | | | | 3,934 | | | | 09/2015 | | | | 0 | |
| | | | | | |
Schlumberger Ltd. | | | Call | | | | 45 | | | | 70.50 | | | | 14,541 | | | | 09/2015 | | | | 33,862 | |
| | | | | | |
Schlumberger Ltd. | | | Call | | | | 90 | | | | 74.00 | | | | 20,045 | | | | 09/2015 | | | | 42,525 | |
| | | | | | |
Staples, Inc. | | | Put | | | | 557 | | | | 12.50 | | | | 16,687 | | | | 09/2015 | | | | 6,963 | |
| | | | | | |
Staples, Inc. | | | Call | | | | 248 | | | | 22.00 | | | | 13,396 | | | | 01/2016 | | | | 1,860 | |
| | | | | | |
Starwood Hotels & Resorts Worldwide, Inc. | | | Put | | | | 148 | | | | 65.00 | | | | 14,350 | | | | 09/2015 | | | | 10,434 | |
| | | | | | |
Starwood Hotels & Resorts Worldwide, Inc. | | | Call | | | | 297 | | | | 80.00 | | | | 37,706 | | | | 10/2015 | | | | 46,035 | |
| | | | | | |
STERIS Corp. | | | Put | | | | 66 | | | | 65.00 | | | | 10,369 | | | | 09/2015 | | | | 16,005 | |
The accompanying Notes to Consolidated Financial Statements are an integral part of this statement.
| | |
| |
| | ACTIVE PORTFOLIOS® MULTI-MANAGER ALTERNATIVE STRATEGIES FUND |
CONSOLIDATED PORTFOLIO OF INVESTMENTS (continued)
August 31, 2015
Open Options Contracts Written at August 31, 2015 (continued)
| | | | | | | | | | | | | | | | | | | | | | | | |
| Issuer | | Puts/Calls | | | Number of
Contracts | | | Exercise
Price ($) | | | Premium
Received ($) | | | Expiration
Date | | | Value ($) | |
VMware, Inc., Class A | | | Call | | | | 284 | | | | 90.00 | | | | 27,536 | | | | 10/2015 | | | | 39,760 | |
| | | | | | |
VMware, Inc., Class A | | | Call | | | | 288 | | | | 95.00 | | | | 33,972 | | | | 01/2016 | | | | 58,320 | |
| | | | | | | | | | | | | | | | | | | | | | | | | |
Total | | | | | | | | | | | | | | | | | | | | | | | 1,420,764 | |
Total Return Swap Contracts Outstanding at August 31, 2015
| | | | | | | | | | | | | | | | | | | | | | | | | | | | |
| Counterparty | | Fund Receives | | Fund Pays | | Expiration
Date | | | Notional
Currency | | | Notional
Amount | | | Unamortized
Premium
(Paid)
Received ($) | | | Unrealized
Appreciation
($) | | | Unrealized
Depreciation
($) | |
Goldman Sachs | | Total return on Hellermanntyton Group PLC | | Floating rate based on 1-month GBP LIBOR-BBA plus 0.45% | | | 8/27/2016 | | | | GBP | | | | 4,509 | | | | — | | | | 114 | | | | — | |
| | | | | | | | |
Goldman Sachs | | Total return on Hellermanntyton Group PLC | | Floating rate based on 1-month GBP LIBOR-BBA plus 0.45% | | | 8/27/2016 | | | | GBP | | | | 769,352 | | | | — | | | | 18,785 | | | | — | |
Total | | | | | | | | | | | | | | | | | | | — | | | | 18,899 | | | | — | |
Total Return Swap Contracts on Futures at August 31, 2015
| | | | | | | | | | | | | | | | | | | | | | |
| Counterparty | | Reference Instrument | | Expiration
Date | | | Trading
Currency | | | Notional
Amount | | | Unrealized
Appreciation
($) | | | Unrealized
(Depreciation)
($) | |
Barclays | | EURO-BOBL | | | 09/2015 | | | | EUR | | | | 19,844,201 | | | | — | | | | (81,293 | ) |
| | | | | | |
Barclays | | EURO-SCHATZ | | | 09/2015 | | | | EUR | | | | 40,699,425 | | | | — | | | | (55,157 | ) |
| | | | | | |
Citibank | | COCOA FUTURE (LIFFE) | | | 12/2015 | | | | GBP | | | | 64,480 | | | | 2,035 | | | | — | |
| | | | | | |
Citibank | | COFFEE | | | 12/2015 | | | | USD | | | | (419,513 | ) | | | 21,516 | | | | — | |
| | | | | | |
Citibank | | COPPER | | | 12/2015 | | | | USD | | | | (1,928,438 | ) | | | — | | | | (32,439 | ) |
| | | | | | |
Citibank | | GASOLINE RBOB | | | 09/2015 | | | | USD | | | | (377,773 | ) | | | — | | | | (9,702 | ) |
| | | | | | |
Citibank | | GOLD 100 OZ | | | 12/2015 | | | | USD | | | | (4,983,000 | ) | | | — | | | | (161,260 | ) |
| | | | | | |
Citibank | | LME PRI ALUM | | | 12/2015 | | | | USD | | | | (2,297,100 | ) | | | — | | | | (66,263 | ) |
| | | | | | |
Citibank | | PLATINUM | | | 10/2015 | | | | USD | | | | (1,364,175 | ) | | | 69,660 | | | | — | |
| | | | | | |
Citibank | | SILVER | | | 12/2015 | | | | USD | | | | (3,500,640 | ) | | | 180,720 | | | | — | |
| | | | | | |
Citibank | | SOYBEAN | | | 11/2015 | | | | USD | | | | (443,750 | ) | | | 27,293 | | | | — | |
| | | | | | |
Citibank | | SOYBEAN MEAL (CBT) | | | 12/2015 | | | | USD | | | | 1,338,590 | | | | — | | | | (160,519 | ) |
| | | | | | |
Citibank | | SOYBEAN OIL | | | 12/2015 | | | | USD | | | | (881,400 | ) | | | 149,604 | | | | — | |
| | | | | | |
Citibank | | WHEAT KCBT | | | 12/2015 | | | | USD | | | | (73,162 | ) | | | 3,806 | | | | — | |
| | | | | | |
Citibank | | WTI CRUDE | | | 09/2015 | | | | USD | | | | (688,800 | ) | | | — | | | | (67,816 | ) |
| | | | | | |
Deutsche | | COCOA FUTURE (LIFFE) | | | 12/2015 | | | | GBP | | | | 322,398 | | | | 5,334 | | | | — | |
| | | | | | |
Deutsche | | GOLD 100 OZ | | | 12/2015 | | | | USD | | | | (4,756,500 | ) | | | — | | | | (138,600 | ) |
| | | | | | |
Deutsche | | PLATINUM | | | 10/2015 | | | | USD | | | | (1,919,950 | ) | | | 108,378 | | | | — | |
| | | | | | |
Deutsche | | SILVER | | | 12/2015 | | | | USD | | | | (437,580 | ) | | | 28,650 | | | | — | |
| | | | | | |
Deutsche | | SOYBEAN MEAL (CBT) | | | 12/2015 | | | | USD | | | | 1,245,200 | | | | — | | | | (117,343 | ) |
| | | | | | |
Deutsche | | WHEAT KCBT | | | 12/2015 | | | | USD | | | | (609,688 | ) | | | 28,488 | | | | — | |
| | | | | | |
J.P. Morgan | | MSCI TAIWAN INDEX | | | 09/2015 | | | | USD | | | | (1,234,100 | ) | | | — | | | | (60,680 | ) |
| | | | | | |
J.P. Morgan | | SWISS MKT IX | | | 09/2015 | | | | CHF | | | | (1,995,055 | ) | | | — | | | | (23,918 | ) |
| | | | | | |
J.P. Morgan | | TAIEX | | | 09/2015 | | | | TWD | | | | (196,041 | ) | | | 5,439 | | | | — | |
| | | | | | | | | | | | | | | | | | | | | | | |
Total | | | | | | | | | | | | | | | | | 630,923 | | | | (974,990 | ) |
| | | | | | | | | | | | | | | | | | | | | | | |
The accompanying Notes to Consolidated Financial Statements are an integral part of this statement.
| | |
| |
| ACTIVE PORTFOLIOS® MULTI-MANAGER ALTERNATIVE STRATEGIES FUND | | |
CONSOLIDATED PORTFOLIO OF INVESTMENTS (continued)
August 31, 2015
Notes to Consolidated Portfolio of Investments
| (a) | Non-income producing investment. |
| (b) | This security or a portion of this security has been pledged as collateral in connection with derivative contracts and securities sold short. |
| (c) | At August 31, 2015, securities valued at $20,516,204 were held to cover open call options written. |
| (d) | Identifies investments considered by the Investment Manager to be illiquid and may be difficult to sell. The aggregate value of such investments at August 31, 2015 was $349,471, which represents 0.04% of net assets. Information concerning such holdings at August 31, 2015 is as follows: |
| | | | | | | | |
| Security Description | | Acquisition/Issue Dates | | | Cost/Premium Received ($) | |
Arthrocare Corp. | | | 06/09/2014 | | | | — | |
| | |
Receptos, Inc. | | | 07/28/2015 - 08/10/2015 | | | | 17,900 | |
| | |
Receptos, Inc. (Option Written) | | | 07/28/2015 - 08/18/2015 | | | | 3,433 | |
| | |
Receptos, Inc. (Option Written) | | | 07/28/2015 - 08/18/2015 | | | | 3,934 | |
| | |
Receptos, Inc. | | | 07/28/2015 - 08/18/2015 | | | | 16,024 | |
| | |
Receptos, Inc. | | | 07/30/2015 - 08/03/2015 | | | | 1,381 | |
| | |
Safeway, Inc. Casa Ley CVR | | | 06/23/2014 - 01/29/2015 | | | | 49,139 | |
| | |
Safeway, Inc. PDC CVR | | | 06/23/2014 - 01/29/2015 | | | | 2,169 | |
| | |
Trius Therapeutics, Inc. | | | 08/01/2013 - 08/08/2013 | | | | 24,524 | |
| (e) | Represents fair value as determined in good faith under procedures approved by the Board of Trustees. At August 31, 2015, the value of these investments amounted to $349,471, which represents 0.04% of net assets. |
| (f) | Represents fractional shares. |
| (g) | Negligible market value. |
| (h) | Security exempt from registration pursuant to Rule 144A under the Securities Act of 1933. This security may be resold in transactions exempt from registration, normally to qualified institutional buyers. At August 31, 2015, the value of these securities amounted to $9,313,382 or 1.19% of net assets. |
| (i) | Principal amounts are denominated in United States Dollars unless otherwise noted. |
| (j) | Represents securities that have defaulted on payment of interest. The Fund has stopped accruing interest on these securities. At August 31, 2015, the value of these securities amounted to $1,751,617, which represents 0.22% of net assets. |
| (k) | Variable rate security. |
| (l) | The rate shown is the seven-day current annualized yield at August 31, 2015. |
| (m) | As defined in the Investment Company Act of 1940, an affiliated company is one in which the Fund owns 5% or more of the company’s outstanding voting securities, or a company which is under common ownership or control with the Fund. Holdings and transactions in these affiliated companies during the year ended August 31, 2015 are as follows: |
| | | | | | | | | | | | | | | | | | | | | | | | |
| Issuer | | Beginning
Cost ($) | | | Purchase
Cost ($) | | | Proceeds
From Sales ($) | | | Ending
Cost ($) | | | Dividends —
Affiliated
Issuers ($) | | | Value ($) | |
Columbia Short-Term Cash Fund | | | 235,765,378 | | | | 890,987,238 | | | | (825,778,314 | ) | | | 300,974,302 | | | | 293,632 | | | | 300,974,302 | |
| (n) | At August 31, 2015, cash or short-term securities were designated to cover open put and/or call options written. |
Abbreviation Legend
| | |
| ADR | | American Depositary Receipt |
Currency Legend
| | |
| AUD | | Australian Dollar |
| BRL | | Brazilian Real |
| CAD | | Canadian Dollar |
| CHF | | Swiss Franc |
| CLP | | Chilean Peso |
| COP | | Colombian Peso |
| CZK | | Czech Koruna |
| EUR | | Euro |
| GBP | | British Pound |
| HKD | | Hong Kong Dollar |
| HUF | | Hungarian Forint |
| IDR | | Indonesian Rupiah |
| ILS | | Israeli Shekel |
| INR | | Indian Rupee |
| JPY | | Japanese Yen |
| KRW | | Korean Won |
The accompanying Notes to Consolidated Financial Statements are an integral part of this statement.
| | |
| |
| | ACTIVE PORTFOLIOS® MULTI-MANAGER ALTERNATIVE STRATEGIES FUND |
CONSOLIDATED PORTFOLIO OF INVESTMENTS (continued)
August 31, 2015
Currency Legend (continued)
| | |
| MXN | | Mexican Peso |
| MYR | | Malaysia Ringgits |
| NOK | | Norwegian Krone |
| NZD | | New Zealand Dollar |
| PHP | | Philippine Peso |
| PLN | | Polish Zloty |
| SEK | | Swedish Krona |
| SGD | | Singapore Dollar |
| TRY | | Turkish Lira |
| TWD | | Taiwan Dollar |
| USD | | US Dollar |
| ZAR | | South African Rand |
Fair Value Measurements
The Fund categorizes its fair value measurements according to a three-level hierarchy that maximizes the use of observable inputs and minimizes the use of unobservable inputs by prioritizing that the most observable input be used when available. Observable inputs are those that market participants would use in pricing an investment based on market data obtained from sources independent of the reporting entity. Unobservable inputs are those that reflect the Fund’s assumptions about the information market participants would use in pricing an investment. An investment’s level within the fair value hierarchy is based on the lowest level of any input that is deemed significant to the asset’s or liability’s fair value measurement. The input levels are not necessarily an indication of the risk or liquidity associated with investments at that level. For example, certain U.S. government securities are generally high quality and liquid, however, they are reflected as Level 2 because the inputs used to determine fair value may not always be quoted prices in an active market.
Fair value inputs are summarized in the three broad levels listed below:
| n | | Level 1 — Valuations based on quoted prices for investments in active markets that the Fund has the ability to access at the measurement date (including NAV for open-end mutual funds). Valuation adjustments are not applied to Level 1 investments. |
| n | | Level 2 — Valuations based on other significant observable inputs (including quoted prices for similar securities, interest rates, prepayment speeds, credit risks, etc.). |
| n | | Level 3 — Valuations based on significant unobservable inputs (including the Fund’s own assumptions and judgment in determining the fair value of investments). |
Inputs that are used in determining fair value of an investment may include price information, credit data, volatility statistics, and other factors. These inputs can be either observable or unobservable. The availability of observable inputs can vary between investments, and is affected by various factors such as the type of investment, and the volume and level of activity for that investment or similar investments in the marketplace. The inputs will be considered by the Investment Manager, along with any other relevant factors in the calculation of an investment’s fair value. The Fund uses prices and inputs that are current as of the measurement date, which may include periods of market dislocations. During these periods, the availability of prices and inputs may be reduced for many investments. This condition could cause an investment to be reclassified between the various levels within the hierarchy.
Foreign equity securities actively traded in markets where there is a significant delay in the local close relative to the New York Stock Exchange (NYSE) are classified as Level 2. The values of these securities may include an adjustment to reflect the impact of significant market movements following the close of local trading, as described in Note 2 to the financial statements — Security Valuation.
Investments falling into the Level 3 category are primarily supported by quoted prices from brokers and dealers participating in the market for those investments. However, these may be classified as Level 3 investments due to lack of market transparency and corroboration to support these quoted prices. Additionally, valuation models may be used as the pricing source for any remaining investments classified as Level 3. These models may rely on one or more significant unobservable inputs and/or significant assumptions by the Investment Manager. Inputs used in valuations may include, but are not limited to, financial statement analysis, capital account balances, discount rates and estimated cash flows, and comparable company data.
Under the direction of the Fund’s Board of Trustees (the Board), the Investment Manager’s Valuation Committee (the Committee) is responsible for overseeing the valuation procedures approved by the Board. The Committee consists of voting and non-voting members from various groups within the Investment Manager’s organization, including operations and accounting, trading and investments, compliance, risk management and legal.
The Committee meets at least monthly to review and approve valuation matters, which may include a description of specific valuation determinations, data regarding pricing information received from approved pricing vendors and brokers and the results of Board-approved valuation control policies and procedures (the Policies). The Policies address, among other things, instances when market quotations are or are not readily available, including recommendations of third party pricing vendors and a determination of appropriate pricing methodologies; events that require specific valuation determinations and assessment of fair value techniques; securities with a potential for stale pricing, including those that are illiquid, restricted, or in default; and the effectiveness of third party pricing vendors, including periodic reviews of vendors. The Committee meets more frequently, as needed, to discuss additional valuation matters, which may include the need to review back-testing results, review time-sensitive information or approve related valuation actions. The Committee reports to the Board, with members of the Committee meeting with the Board at each of its regularly scheduled meetings to discuss valuation matters and actions during the period, similar to those described earlier.
For investments categorized as Level 3, the Committee monitors information similar to that described above, which may include: (i) data specific to the issuer or comparable issuers, (ii) general market or specific sector news and (iii) quoted prices and specific or similar security transactions. The Committee considers this data and any changes from prior periods in order to assess the reasonableness of observable and unobservable inputs, any assumptions or internal models used to value those securities and changes in fair value. This data is also used to corroborate, when available, information received from approved pricing vendors and brokers. Various factors impact the frequency of monitoring this information (which may occur as often as daily). However, the Committee may determine that changes to inputs, assumptions and models are not required as a result of the monitoring procedures performed.
The accompanying Notes to Consolidated Financial Statements are an integral part of this statement.
| | |
| |
| ACTIVE PORTFOLIOS® MULTI-MANAGER ALTERNATIVE STRATEGIES FUND | | |
CONSOLIDATED PORTFOLIO OF INVESTMENTS (continued)
August 31, 2015
Fair Value Measurements (continued)
The following table is a summary of the inputs used to value the Fund’s investments at August 31, 2015:
| | | | | | | | | | | | | | | | |
| | | Level 1
Quoted Prices in Active
Markets for Identical
Assets ($) | | | Level 2
Other Significant
Observable Inputs ($) | | | Level 3
Significant
Unobservable Inputs ($) | | | Total ($) | |
Investments | | | | | | | | | | | | | | | | |
| | | | |
Common Stocks | | | | | | | | | | | | | | | | |
| | | | |
Consumer Discretionary | | | 32,112,448 | | | | — | | | | — | | | | 32,112,448 | |
| | | | |
Consumer Staples | | | 12,548,556 | | | | 863,937 | | | | 305,504 | | | | 13,717,997 | |
| | | | |
Energy | | | 33,425,713 | | | | 4,897 | | | | — | | | | 33,430,610 | |
| | | | |
Financials | | | 61,365,409 | | | | — | | | | — | | | | 61,365,409 | |
| | | | |
Health Care | | | 51,313,522 | | | | 1,622,786 | | | | 43,967 | | | | 52,980,275 | |
| | | | |
Industrials | | | 49,665,049 | | | | 2,936,435 | | | | — | | | | 52,601,484 | |
| | | | |
Information Technology | | | 60,440,919 | | | | — | | | | — | | | | 60,440,919 | |
| | | | |
Materials | | | 19,549,884 | | | | — | | | | — | | | | 19,549,884 | |
| | | | |
Telecommunication Services | | | 8,046,923 | | | | 1,388,161 | | | | — | | | | 9,435,084 | |
| | | | |
Utilities | | | 2,361,996 | | | | — | | | | — | | | | 2,361,996 | |
| | | | | | | | | | | | | | | | | |
Total Common Stocks | | | 330,830,419 | | | | 6,816,216 | | | | 349,471 | | | | 337,996,106 | |
| | | | | | | | | | | | | | | | | |
| | | | |
Corporate Bonds & Notes | | | — | | | | 22,776,148 | | | | — | | | | 22,776,148 | |
| | | | |
Convertible Bonds | | | — | | | | 1,313,929 | | | | — | | | | 1,313,929 | |
| | | | |
Exchange-Traded Funds | | | 1,360,305 | | | | — | | | | — | | | | 1,360,305 | |
| | | | |
Limited Partnerships | | | 5,254,543 | | | | — | | | | — | | | | 5,254,543 | |
| | | | |
Treasury Bills | | | 88,510,365 | | | | — | | | | — | | | | 88,510,365 | |
| | | | |
Options Purchased Calls | | | 1,269,342 | | | | — | | | | — | | | | 1,269,342 | |
| | | | |
Options Purchased Puts | | | 2,241,847 | | | | — | | | | 0(a | ) | | | 2,241,847 | |
| | | | |
Money Market Funds | | | 461,094 | | | | 300,974,302 | | | | — | | | | 301,435,396 | |
| | | | | | | | | | | | | | | | | |
Total Investments | | | 429,927,915 | | | | 331,880,595 | | | | 349,471 | | | | 762,157,981 | |
| | | | | | | | | | | | | | | | | |
Investments Sold Short | | | | | | | | | | | | | | | | |
| | | | |
Common Stocks | | | | | | | | | | | | | | | | |
| | | | |
Consumer Discretionary | | | (21,908,465 | ) | | | (397,282 | ) | | | — | | | | (22,305,747 | ) |
| | | | |
Consumer Staples | | | (8,915,305 | ) | | | — | | | | — | | | | (8,915,305 | ) |
| | | | |
Energy | | | (4,107,995 | ) | | | — | | | | — | | | | (4,107,995 | ) |
| | | | |
Financials | | | (8,505,019 | ) | | | — | | | | — | | | | (8,505,019 | ) |
| | | | |
Health Care | | | (5,317,390 | ) | | | — | | | | — | | | | (5,317,390 | ) |
| | | | |
Industrials | | | (9,770,550 | ) | | | — | | | | — | | | | (9,770,550 | ) |
| | | | |
Information Technology | | | (15,136,506 | ) | | | — | | | | — | | | | (15,136,506 | ) |
| | | | |
Materials | | | (766,293 | ) | | | — | | | | — | | | | (766,293 | ) |
| | | | |
Telecommunication Services | | | (1,453,813 | ) | | | — | | | | — | | | | (1,453,813 | ) |
| | | | |
Utilities | | | (2,728,166 | ) | | | — | | | | — | | | | (2,728,166 | ) |
| | | | | | | | | | | | | | | | | |
Total Common Stocks | | | (78,609,502 | ) | | | (397,282 | ) | | | — | | | | (79,006,784 | ) |
| | | | | | | | | | | | | | | | | |
Corporate Bonds & Notes | | | — | | | | (2,670,479 | ) | | | — | | | | (2,670,479 | ) |
| | | | |
Exchange-Traded Funds | | | (23,806,684 | ) | | | — | | | | — | | | | (23,806,684 | ) |
| | | | |
Limited Partnerships | | | (1,638,905 | ) | | | — | | | | — | | | | (1,638,905 | ) |
| | | | | | | | | | | | | | | | | |
Total Investments Sold Short | | | (104,055,091 | ) | | | (3,067,761 | ) | | | — | | | | (107,122,852 | ) |
| | | | | | | | | | | | | | | | | |
Total Investments, Net of Investments Sold Short | | | 325,872,824 | | | | 328,812,834 | | | | 349,471 | | | | 655,035,129 | |
| | | | | | | | | | | | | | | | | |
The accompanying Notes to Consolidated Financial Statements are an integral part of this statement.
| | |
| |
| | ACTIVE PORTFOLIOS® MULTI-MANAGER ALTERNATIVE STRATEGIES FUND |
CONSOLIDATED PORTFOLIO OF INVESTMENTS (continued)
August 31, 2015
Fair Value Measurements (continued)
| | | | | | | | | | | | | | | | |
| | | Level 1
Quoted Prices in Active
Markets for Identical
Assets ($) | | | Level 2
Other Significant
Observable Inputs ($) | | | Level 3
Significant
Unobservable Inputs ($) | | | Total ($) | |
Derivatives | | | | | | | | | | | | | | | | |
| | | | |
Assets | | | | | | | | | | | | | | | | |
| | | | |
Forward Foreign Currency Exchange Contracts | | | — | | | | 31,180,437 | | | | — | | | | 31,180,437 | |
| | | | |
Futures Contracts | | | 7,285,350 | | | | — | | | | — | | | | 7,285,350 | |
| | | | |
Swap Contracts | | | — | | | | 649,822 | | | | — | | | | 649,822 | |
| | | | |
Liabilities | | | | | | | | | | | | | | | | |
| | | | |
Forward Foreign Currency Exchange Contracts | | | — | | | | (29,728,208 | ) | | | — | | | | (29,728,208 | ) |
| | | | |
Futures Contracts | | | (2,729,038 | ) | | | — | | | | — | | | | (2,729,038 | ) |
| | | | |
Options Contracts Written | | | (1,420,764 | ) | | | — | | | | (0 | ) | | | (1,420,764 | ) |
| | | | |
Swap Contracts | | | — | | | | (974,990 | ) | | | — | | | | (974,990 | ) |
| | | | | | | | | | | | | | | | | |
Total | | | 329,008,372 | | | | 329,939,895 | | | | 349,471 | | | | 659,297,738 | |
| | | | | | | | | | | | | | | | | |
See the Consolidated Portfolio of Investments for all investment classifications not indicated in the table.
The Fund’s assets assigned to the Level 2 input category are generally valued using the market approach, in which a security’s value is determined through reference to prices and information from market transactions for similar or identical assets. These assets include certain foreign securities for which a third party statistical pricing service may be employed for purposes of fair market valuation. The model utilized by such third party statistical pricing service takes into account a security’s correlation to available market data including, but not limited to, intraday index, ADR, and exchange-traded fund movements.
Financial assets were transferred from Level 1 to Level 2 as the market for these assets is not considered publicly available. Fund per share market values were obtained using observable market inputs.
The following table shows transfers between Level 1 and Level 2 of the fair value hierarchy:
| | | | | | |
| Transfers In | | Transfers Out |
| Level 1 ($) | | Level 2 ($) | | Level 1 ($) | | Level 2 ($) |
| — | | 235,765,378 | | 235,765,378 | | — |
Transfers between Level 1 and Level 2 are determined based on the fair value at the beginning of the period for security positions held throughout the period.
Forward foreign currency exchange contracts, futures contracts and swap contracts are valued at unrealized appreciation (depreciation).
The Fund does not hold any significant investments (greater than one percent of net assets) categorized as Level 3.
The Fund’s assets assigned to the Level 3 category are valued utilizing the valuation technique deemed the most appropriate in the circumstances. Certain common stocks and options classified as Level 3 are valued using the market approach. To determine fair value for these securities, management considered various factors which may have included, but were not limited to, estimated cash flows of the securities, observed yields on securities deemed comparable, the subscription price of the security, closing prices of similar securities from the issuer. Significant increases (decreases) to any of these inputs would result in a significantly lower (higher) fair value measurement.
Financial assets were transferred from Level 3 to Level 2 as observable market inputs were utilized and management determined that there was sufficient, reliable and observable market data to value these assets as of period end.
| | | | | | |
| Transfers In | | Transfers Out |
| Level 2 ($) | | Level 3 ($) | | Level 2 ($) | | Level 3 ($) |
| 3,460,222 | | — | | — | | 3,460,222 |
Transfers in and/or out of Level 3 are determined based on the fair value at the beginning of the period for security positions held throughout the period.
The accompanying Notes to Consolidated Financial Statements are an integral part of this statement.
| | |
| |
| ACTIVE PORTFOLIOS® MULTI-MANAGER ALTERNATIVE STRATEGIES FUND | | |
CONSOLIDATED STATEMENT OF ASSETS AND LIABILITIES
August 31, 2015
| | | | |
Assets | | | | |
| |
Investments, at value | | | | |
| |
Unaffiliated issuers (identified cost $498,331,756) | | | $457,672,490 | |
| |
Affiliated issuers (identified cost $300,974,302) | | | 300,974,302 | |
| |
Options purchased (identified cost $2,859,785) | | | 3,511,189 | |
| |
Total investments (identified cost $802,165,843) | | | 762,157,981 | |
| |
Cash | | | 7,706,295 | |
| |
Foreign currency (identified cost $337,442) | | | 339,157 | |
| |
Cash collateral held at broker | | | 122,461,427 | |
| |
Margin deposits | | | 15,975,338 | |
| |
Unrealized appreciation on forward foreign currency exchange contracts | | | 31,180,437 | |
| |
Unrealized appreciation on swap contracts | | | 649,822 | |
| |
Receivable for: | | | | |
| |
Investments sold | | | 15,008,813 | |
| |
Capital shares sold | | | 2,353,749 | |
| |
Dividends | | | 510,971 | |
| |
Interest | | | 405,393 | |
| |
Foreign tax reclaims | | | 6,741 | |
| |
Variation margin | | | 1,349,516 | |
| |
Prepaid expenses | | | 7,477 | |
| |
Trustees’ deferred compensation plan | | | 17,956 | |
| |
Total assets | | | 960,131,073 | |
| |
| |
Liabilities | | | | |
| |
Securities sold short, at value (proceeds $111,119,253) | | | 107,122,852 | |
| |
Option contracts written, at value (premiums received $915,326) | | | 1,420,764 | |
| |
Unrealized depreciation on forward foreign currency exchange contracts | | | 29,728,208 | |
| |
Unrealized depreciation on swap contracts | | | 974,990 | |
| |
Payable for: | | | | |
| |
Investments purchased | | | 32,582,885 | |
| |
Capital shares purchased | | | 1,429,065 | |
| |
Dividends and interest on securities sold short | | | 124,856 | |
| |
Variation margin | | | 1,553,563 | |
| |
Investment management fees | | | 64,596 | |
| |
Distribution and/or service fees | | | 16,089 | |
| |
Transfer agent fees | | | 60,022 | |
| |
Administration fees | | | 5,032 | |
| |
Compensation of board members | | | 584 | |
| |
Chief compliance officer expenses | | | 63 | |
| |
Other expenses | | | 89,258 | |
| |
Trustees’ deferred compensation plan | | | 17,956 | |
| |
Total liabilities | | | 175,190,783 | |
| |
Net assets applicable to outstanding capital stock | | | $784,940,290 | |
| |
The accompanying Notes to Consolidated Financial Statements are an integral part of this statement.
| | |
| |
| | ACTIVE PORTFOLIOS® MULTI-MANAGER ALTERNATIVE STRATEGIES FUND |
CONSOLIDATED STATEMENT OF ASSETS AND LIABILITIES (continued)
August 31, 2015
| | | | |
| |
Represented by | | | | |
| |
Paid-in capital | | | $794,007,265 | |
| |
Undistributed net investment income | | | 15,226,126 | |
| |
Accumulated net realized gain | | | 6,608,533 | |
| |
Unrealized appreciation (depreciation) on: | | | | |
| |
Investments | | | (40,659,266 | ) |
| |
Foreign currency translations | | | (68,108 | ) |
| |
Forward foreign currency exchange contracts | | | 1,452,229 | |
| |
Futures contracts | | | 4,556,312 | |
| |
Options purchased | | | 651,404 | |
| |
Options contracts written | | | (505,438 | ) |
| |
Securities sold short | | | 3,996,401 | |
| |
Swap contracts | | | (325,168 | ) |
| |
Total — representing net assets applicable to outstanding capital stock | | | $784,940,290 | |
| |
| |
Class A | | | | |
| |
Net assets | | | $784,940,290 | |
| |
Shares outstanding | | | 77,937,828 | |
| |
Net asset value per share | | | $10.07 | |
| |
The accompanying Notes to Consolidated Financial Statements are an integral part of this statement.
| | |
| |
| ACTIVE PORTFOLIOS® MULTI-MANAGER ALTERNATIVE STRATEGIES FUND | | |
CONSOLIDATED STATEMENT OF OPERATIONS
Year Ended August 31, 2015
| | | | |
Net investment income | | | | |
Income: | | | | |
Dividends — unaffiliated issuers | | | $12,208,354 | |
Dividends — affiliated issuers | | | 293,632 | |
Interest | | | 3,840,501 | |
Foreign taxes withheld | | | (42,587 | ) |
| |
Total income | | | 16,299,900 | |
| |
Expenses: | | | | |
Investment management fees | | | 7,820,583 | |
Distribution and/or service fees | | | | |
Class A | | | 1,947,269 | |
Transfer agent fees | | | | |
Class A | | | 776,399 | |
Administration fees | | | 609,318 | |
Compensation of board members | | | 31,435 | |
Custodian fees | | | 96,160 | |
Printing and postage fees | | | 78,832 | |
Registration fees | | | 51,058 | |
Professional fees | | | 67,142 | |
Dividends and interest on securities sold short | | | 2,708,179 | |
Chief compliance officer expenses | | | 382 | |
Other | | | 44,649 | |
| |
Total expenses | | | 14,231,406 | |
| |
Net investment income | | | 2,068,494 | |
| |
| |
Realized and unrealized gain (loss) — net | | | | |
Net realized gain (loss) on: | | | | |
Investments | | | 8,909,808 | |
Foreign currency translations | | | (549,181 | ) |
Forward foreign currency exchange contracts | | | 22,201,701 | |
Futures contracts | | | 35,498,152 | |
Options purchased | | | (4,984,544 | ) |
Options contracts written | | | 1,846,335 | |
Securities sold short | | | (11,856,197 | ) |
Swap contracts | | | (223,274 | ) |
| |
Net realized gain | | | 50,842,800 | |
Net change in unrealized appreciation (depreciation) on: | | | | |
Investments | | | (77,653,737 | ) |
Foreign currency translations | | | 27,988 | |
Forward foreign currency exchange contracts | | | 525,289 | |
Futures contracts | | | (4,620,407 | ) |
Options purchased | | | 1,638,760 | |
Options contracts written | | | (291,057 | ) |
Securities sold short | | | 10,486,255 | |
Swap contracts | | | (1,393,200 | ) |
| |
Net change in unrealized depreciation | | | (71,280,109 | ) |
| |
Net realized and unrealized loss | | | (20,437,309 | ) |
| |
Net decrease in net assets from operations | | | $(18,368,815 | ) |
| |
The accompanying Notes to Consolidated Financial Statements are an integral part of this statement.
| | |
| |
| | ACTIVE PORTFOLIOS® MULTI-MANAGER ALTERNATIVE STRATEGIES FUND |
CONSOLIDATED STATEMENT OF CHANGES IN NET ASSETS
| | | | | | | | |
| | | Year Ended
August 31, 2015 | | | Year Ended
August 31, 2014 | |
Operations | | | | | | | | |
| | |
Net investment income (loss) | | | $2,068,494 | | | | $(2,023,532 | ) |
| | |
Net realized gain | | | 50,842,800 | | | | 20,939,725 | |
| | |
Net change in unrealized appreciation (depreciation) | | | (71,280,109 | ) | | | 24,908,735 | |
| |
Net increase (decrease) in net assets resulting from operations | | | (18,368,815 | ) | | | 43,824,928 | |
| |
| | |
Distributions to shareholders | | | | | | | | |
| | |
Net investment income | | | | | | | | |
| | |
Class A | | | (7,150,893 | ) | | | (9,075,353 | ) |
| | |
Net realized gains | | | | | | | | |
| | |
Class A | | | (33,605,548 | ) | | | (7,925,989 | ) |
| |
Total distributions to shareholders | | | (40,756,441 | ) | | | (17,001,342 | ) |
| |
Increase in net assets from capital stock activity | | | 66,254,197 | | | | 84,760,190 | |
| |
Total increase in net assets | | | 7,128,941 | | | | 111,583,776 | |
| | |
Net assets at beginning of year | | | 777,811,349 | | | | 666,227,573 | |
| |
Net assets at end of year | | | $784,940,290 | | | | $777,811,349 | |
| |
Undistributed (excess of distributions over) net investment income | | | $15,226,126 | | | | $(5,612,483 | ) |
| |
The accompanying Notes to Consolidated Financial Statements are an integral part of this statement.
| | |
| |
| ACTIVE PORTFOLIOS® MULTI-MANAGER ALTERNATIVE STRATEGIES FUND | | |
CONSOLIDATED STATEMENT OF CHANGES IN NET ASSETS (continued)
| | | | | | | | | | | | | | | | |
| | | Year Ended
August 31, 2015 | | | Year Ended
August 31, 2014 | |
| | | Shares | | | Dollars ($) | | | Shares | | | Dollars ($) | |
Capital stock activity | | | | | | | | | | | | | | | | |
| | | | |
Class A shares | | | | | | | | | | | | | | | | |
| | | | |
Subscriptions | | | 18,474,845 | | | | 194,295,243 | | | | 22,677,044 | | | | 242,230,834 | |
| | | | |
Distributions reinvested | | | 3,896,396 | | | | 40,756,301 | | | | 1,590,350 | | | | 17,000,842 | |
| | | | |
Redemptions | | | (15,908,226 | ) | | | (168,797,347 | ) | | | (16,300,039 | ) | | | (174,471,486 | ) |
| |
Net increase | | | 6,463,015 | | | | 66,254,197 | | | | 7,967,355 | | | | 84,760,190 | |
| |
Total net increase | | | 6,463,015 | | | | 66,254,197 | | | | 7,967,355 | | | | 84,760,190 | |
| |
The accompanying Notes to Consolidated Financial Statements are an integral part of this statement.
| | |
| |
| | ACTIVE PORTFOLIOS® MULTI-MANAGER ALTERNATIVE STRATEGIES FUND |
CONSOLIDATED FINANCIAL HIGHLIGHTS
The following table is intended to help you understand the Fund’s financial performance. Certain information reflects financial results for a single share of a class held for the periods shown. Per share net investment income (loss) amounts are calculated based on average shares outstanding during the period. Total return assumes reinvestment of all dividends and distributions, if any. Total return does not reflect payment of sales charges, if any. Total return and portfolio turnover are not annualized for periods of less than one year. The portfolio turnover rate is calculated without regard to purchase and sales transactions of short-term instruments and certain derivatives, if any. If such transactions were included, the Fund’s portfolio turnover rate may be higher.
| | | | | | | | | | | | | | | | |
| | | Year Ended August 31, | |
Class A | | | 2015 | | | | 2014 | | | | 2013 | | | | 2012(a) | |
Per share data | | | | | | | | | | | | | | | | |
Net asset value, beginning of period | | | $10.88 | | | | $10.49 | | | | $10.03 | | | | $10.00 | |
| | | | | | | | | | | | | | | | | |
Income from investment operations: | | | | | | | | | | | | | | | | |
| | | | |
Net investment income (loss) | | | 0.03 | (f) | | | (0.03 | ) | | | 0.02 | | | | 0.01 | |
| | | | | | | | | | | | | | | | | |
Net realized and unrealized gain (loss) | | | (0.26 | ) | | | 0.67 | | | | 0.53 | | | | 0.02 | |
| | | | | | | | | | | | | | | | | |
Total from investment operations | | | (0.23 | ) | | | 0.64 | | | | 0.55 | | | | 0.03 | |
| | | | | | | | | | | | | | | | | |
Less distributions to shareholders: | | | | | | | | | | | | | | | | |
| | | | |
Net investment income | | | (0.10 | ) | | | (0.13 | ) | | | (0.08 | ) | | | — | |
| | | | | | | | | | | | | | | | | |
Net realized gains | | | (0.48 | ) | | | (0.12 | ) | | | (0.01 | ) | | | — | |
| | | | | | | | | | | | | | | | | |
Total distributions to shareholders | | | (0.58 | ) | | | (0.25 | ) | | | (0.09 | ) | | | — | |
| | | | | | | | | | | | | | | | | |
Net asset value, end of period | | | $10.07 | | | | $10.88 | | | | $10.49 | | | | $10.03 | |
| | | | | | | | | | | | | | | | | |
Total return | | | (2.30 | %) | | | 6.15 | % | | | 5.53 | % | | | 0.30 | % |
| | | | | | | | | | | | | | | | | |
Ratios to average net assets(b) | | | | | | | | | | | | | | | | |
| | | | |
Total gross expenses | | | 1.83 | %(c) | | | 1.79 | %(c) | | | 1.70 | %(c) | | | 1.73 | %(c)(d) |
| | | | | | | | | | | | | | | | | |
Total net expenses(e) | | | 1.83 | %(c) | | | 1.79 | %(c) | | | 1.67 | %(c) | | | 1.63 | %(c)(d) |
| | | | | | | | | | | | | | | | | |
Net investment income (loss) | | | 0.27 | % | | | (0.27 | %) | | | 0.17 | % | | | 0.31 | %(d) |
| | | | | | | | | | | | | | | | | |
Supplemental data | | | | | | | | | | | | | | | | |
| | | | |
Net assets, end of period (in thousands) | | | $784,940 | | | | $777,811 | | | | $666,228 | | | | $476,520 | |
| | | | | | | | | | | | | | | | | |
Portfolio turnover | | | 304 | % | | | 246 | % | | | 239 | % | | | 141 | % |
| | | | | | | | | | | | | | | | | |
Notes to Consolidated Financial Highlights
| (a) | Based on operations from April 23, 2012 (commencement of operations) through the stated period end. |
| (b) | In addition to the fees and expenses that the Fund bears directly, the Fund indirectly bears a pro rata share of the fees and expenses of any other funds in which it invests. Such indirect expenses are not included in the Fund’s reported expense ratios. |
| (c) | Ratios include dividends and interest on securities sold short. If dividends and interest on securities sold short had been excluded, expenses would have been lower by 0.35%, 0.31%, 0.17% and 0.13% for the years ended August 31, 2015, 2014, 2013 and 2012, respectively. |
| (e) | Total net expenses include the impact of certain fee waivers/expense reimbursements made by the Investment Manager and certain of its affiliates, if applicable. |
| (f) | Net investment income per share includes special dividends. The effect of these dividends amounted to $0.08 per share. |
The accompanying Notes to Consolidated Financial Statements are an integral part of this statement.
| | |
| |
| ACTIVE PORTFOLIOS® MULTI-MANAGER ALTERNATIVE STRATEGIES FUND | | |
NOTES TO CONSOLIDATED FINANCIAL STATEMENTS
August 31, 2015
Note 1. Organization
Active Portfolios® Multi-Manager Alternative Strategies Fund (the Fund), a series of Columbia Funds Series Trust I (the Trust), is a non-diversified fund. The Trust is registered under the Investment Company Act of 1940, as amended (the 1940 Act), as an open-end management investment company organized as a Massachusetts business trust.
Basis for Consolidation
ASGM Offshore Fund, Ltd. and ASMF Offshore Fund, Ltd. (each, a Subsidiary) are each a Cayman Islands exempted company and wholly-owned subsidiary of the Fund. Each Subsidiary operates as an investment vehicle to provide the Fund with exposure to the commodities markets consistent with the Fund’s investment objective and policies as stated in its current prospectus and statement of additional information. In accordance with the Memorandum and Articles of Association of the Subsidiary (the Articles), the Fund owns the sole issued share of each Subsidiary and retains all rights associated with such share, including the right to receive notice of, attend and vote at general meetings of the Subsidiaries, rights in a winding-up or repayment of capital and the right to participate in the profits or assets of the Subsidiaries. At August 31, 2015, the net assets of ASGM Offshore Fund, Ltd. were $58,430 or 0.01% of the Fund’s consolidated net assets and the net assets of ASMF Offshore Fund, Ltd. were $38,474,751 or 4.90% of the Fund’s consolidated net assets. All intercompany transactions and balances have been eliminated in the consolidation process.
The consolidated financial statements (financial statements) present the portfolio holdings, financial position and results of operations of the Fund and the Subsidiary on a consolidated basis.
Fund Shares
The Trust may issue an unlimited number of shares (without par value). The Fund only offers Class A shares that are available only to certain eligible investors through certain wrap fee programs sponsored and/or managed by Ameriprise Financial, Inc. (Ameriprise Financial) or its affiliates.
Class A shares are not subject to any front-end sales charge or contingent deferred sales charge.
Note 2. Summary of Significant Accounting Policies
Basis of Preparation
The Fund is an investment company that applies the accounting and reporting guidance in the Financial Accounting Standards Board (FASB) Accounting Standards Codification Topic 946, Financial Services—Investment Companies (ASC 946). The financial statements are prepared in accordance with U.S. generally accepted accounting principles (GAAP), which requires management to make certain estimates and assumptions that affect the reported amounts of assets and liabilities, the disclosure of contingent assets and liabilities at the date of the financial statements and the reported amounts of income and expenses during the reporting period. Actual results could differ from those estimates.
The following is a summary of significant accounting policies followed by the Fund in the preparation of its financial statements.
Security Valuation
All equity securities and exchange-traded funds are valued at the close of business of the New York Stock Exchange (NYSE). Equity securities and exchange-traded funds are valued at the last quoted sales price on the principal exchange or market on which they trade, except for securities traded on the NASDAQ Stock Market, which are valued at the NASDAQ official close price. Unlisted securities or listed securities for which there were no sales during the day are valued at the mean of the latest quoted bid and ask prices on such exchanges or markets.
Debt securities generally are valued by pricing services approved by the Board of Trustees (the Board) based upon market transactions for normal, institutional-size trading units of similar securities. The services may use various pricing techniques that take into account, as applicable, factors such as yield, quality, coupon rate, maturity, type of issue, trading characteristics and other data, as well as broker quotes. Debt securities for which quotations are not readily available or not believed to be reflective of market value may also be valued based upon a bid quote from an approved independent broker-dealer. Debt securities maturing in 60 days or less are valued primarily at amortized cost value, unless this method results in a valuation that management believes does not approximate market value.
| | |
| |
| | ACTIVE PORTFOLIOS® MULTI-MANAGER ALTERNATIVE STRATEGIES FUND |
NOTES TO CONSOLIDATED FINANCIAL STATEMENTS (continued)
August 31, 2015
Foreign equity securities are valued based on the closing price on the foreign exchange in which such securities are primarily traded. If any foreign equity security closing prices are not readily available, the securities are valued at the mean of the latest quoted bid and ask prices on such exchanges or markets. Foreign currency exchange rates are generally determined at 4:00 p.m. Eastern (U.S.) time. Many securities markets and exchanges outside the U.S. close prior to the close of the NYSE; therefore, the closing prices for securities in such markets or on such exchanges may not fully reflect events that occur after such close but before the close of the NYSE. In those situations, foreign securities will be fair valued pursuant to a policy adopted by the Board, including, if available, utilizing a third party pricing service to determine these fair values. The third party pricing service takes into account multiple factors, including, but not limited to, movements in the U.S. securities markets, certain depositary receipts, futures contracts and foreign exchange rates that have occurred subsequent to the close of the foreign exchange or market, to determine a good faith estimate that reasonably reflects the current market conditions as of the close of the NYSE. The fair value of a security is likely to be different from the quoted or published price, if available.
Investments in open-end investment companies, including money market funds, are valued at their latest net asset value.
Forward foreign currency exchange contracts are marked-to-market based upon foreign currency exchange rates provided by a pricing service.
Futures and options on futures contracts are valued based upon the settlement price at the close of regular trading on their principal exchanges or, in the absence of transactions, at the mean of the latest quoted bid and ask prices.
Option contracts are valued at the mean of the latest quoted bid and ask prices on their primary exchanges. Option contracts, including over-the-counter option contracts, with no readily available market quotations are valued using quotes obtained from independent brokers as of the close of the NYSE.
Swap transactions are valued through an independent pricing service or broker, or if neither is available, through an internal model based upon observable inputs.
Investments for which market quotations are not readily available, or that have quotations which management believes are not reflective of market value or reliable, are
valued at fair value as determined in good faith under procedures approved by and under the general supervision of the Board. If a security or class of securities (such as foreign securities) is valued at fair value, such value is likely to be different from the quoted or published price for the security.
The determination of fair value often requires significant judgment. To determine fair value, management may use assumptions including but not limited to future cash flows and estimated risk premiums. Multiple inputs from various sources may be used to determine fair value.
GAAP requires disclosure regarding the inputs and valuation techniques used to measure fair value and any changes in valuation inputs or techniques. In addition, investments shall be disclosed by major category. This information is disclosed following the Fund’s Consolidated Portfolio of Investments.
Foreign Currency Transactions and Translations
The values of all assets and liabilities denominated in foreign currencies are generally translated into U.S. dollars at exchange rates determined at the close of the NYSE. Net realized and unrealized gains (losses) on foreign currency transactions and translations include gains (losses) arising from the fluctuation in exchange rates between trade and settlement dates on securities transactions, gains (losses) arising from the disposition of foreign currency and currency gains (losses) between the accrual and payment dates on dividends, interest income and foreign withholding taxes.
For financial statement purposes, the Fund does not distinguish that portion of gains (losses) on investments which is due to changes in foreign exchange rates from that which is due to changes in market prices of the investments. Such fluctuations are included with the net realized and unrealized gains (losses) on investments in the Consolidated Statement of Operations.
Derivative Instruments
The Fund invests in certain derivative instruments, as detailed below, to meet its investment objectives. Derivatives are instruments whose values depend on, or are derived from, in whole or in part, the value of one or more securities, currencies, commodities, indices, or other assets or instruments. Derivatives may be used to increase investment flexibility (including to maintain cash reserves while maintaining desired exposure to certain assets), for risk management (hedging) purposes, to facilitate trading, to reduce transaction costs and to
| | |
| |
| ACTIVE PORTFOLIOS® MULTI-MANAGER ALTERNATIVE STRATEGIES FUND | | |
NOTES TO CONSOLIDATED FINANCIAL STATEMENTS (continued)
August 31, 2015
pursue higher investment returns. The Fund may also use derivative instruments to mitigate certain investment risks, such as foreign currency exchange rate risk, interest rate risk and credit risk. Derivatives may involve various risks, including the potential inability of the counterparty to fulfill its obligation under the terms of the contract, the potential for an illiquid secondary market (making it difficult for the Fund to sell, including at favorable prices) and the potential for market movements which may expose the Fund to gains or losses in excess of the amount shown in the Consolidated Statement of Assets and Liabilities. The notional amounts of derivative instruments, if applicable, are not recorded in the financial statements.
A derivative instrument may suffer a marked-to-market loss if the value of the contract decreases due to an unfavorable change in the market rates or values of the underlying instrument. Losses can also occur if the counterparty does not perform under the contract. The Fund’s risk of loss from counterparty credit risk on over-the-counter derivatives is generally limited to the aggregate unrealized gain netted against any collateral held by the Fund and the amount of any variation margin held by the counterparty. With exchange-traded or centrally cleared derivatives, there is reduced counterparty credit risk to the Fund since the exchange’s clearinghouse, as counterparty to such instruments, guarantees against a possible default. The clearinghouse stands between the buyer and the seller of the contract; therefore, the counterparty credit risk is failure of the clearinghouse. However, credit risk still exists in exchange-traded or centrally cleared derivatives with respect to initial and variation margin that is held in a broker’s customer account. While brokers are required to segregate customer margin from their own assets, in the event that a broker becomes insolvent or goes into bankruptcy and at that time there is a shortfall in the aggregate amount of margin held by the broker for all its clients, U.S. bankruptcy laws will typically allocate that shortfall on a pro-rata basis across all the broker’s customers (including the Fund), potentially resulting in losses to the Fund.
In order to better define its contractual rights and to secure rights that will help the Fund mitigate its counterparty risk, the Fund may enter into an International Swaps and Derivatives Association, Inc. Master Agreement (ISDA Master Agreement) or similar agreement with its derivatives contract counterparties. An ISDA Master Agreement is an agreement between the Fund and a counterparty that governs over-the-counter
derivatives and forward foreign currency exchange contracts and typically contains, among other things, collateral posting terms and netting provisions in the event of a default and/or termination event. Under an ISDA Master Agreement, the Fund may, under certain circumstances, offset with the counterparty certain derivative instrument’s payables and/or receivables with collateral held and/or posted and create one single net payment. The provisions of the ISDA Master Agreement typically permit a single net payment in the event of default (close-out netting) including the bankruptcy or insolvency of the counterparty. Note, however, that bankruptcy or insolvency laws of a particular jurisdiction may impose restrictions on or prohibitions against the right of offset in bankruptcy, insolvency or other events.
Collateral (margin) requirements differ by type of derivative. Margin requirements are established by the exchange or clearinghouse for exchange-traded and centrally cleared derivatives. Brokers can ask for margin in excess of the minimum in certain circumstances. Collateral terms are contract specific for over-the-counter derivatives. For over-the-counter derivatives traded under an ISDA Master Agreement, the collateral requirements are typically calculated by netting the marked-to-market amount for each transaction under such agreement and comparing that amount to the value of any variation margin currently pledged by the Fund and/or the counterparty. Generally, the amount of collateral due from or to a party has to exceed a minimum transfer amount threshold (e.g., $500,000) before a transfer has to be made. To the extent amounts due to the Fund from its counterparties are not fully collateralized, contractually or otherwise, the Fund bears the risk of loss from counterparty nonperformance. The Fund attempts to mitigate counterparty risk by only entering into agreements with counterparties that it believes have the financial resources to honor their obligations and by monitoring the financial stability of those counterparties.
Certain ISDA Master Agreements allow counterparties to over-the-counter derivatives transactions to terminate derivatives contracts prior to maturity in the event the Fund’s net asset value declines by a stated percentage over a specified time period or if the Fund fails to meet certain terms of the ISDA Master Agreement, which would cause the Fund to accelerate payment of any net liability owed to the counterparty. The Fund also has termination rights if the counterparty fails to meet certain terms of the ISDA Master Agreement. In addition to considering counterparty credit risk, the Fund would consider terminating the derivatives contracts based on
| | |
| |
| | ACTIVE PORTFOLIOS® MULTI-MANAGER ALTERNATIVE STRATEGIES FUND |
NOTES TO CONSOLIDATED FINANCIAL STATEMENTS (continued)
August 31, 2015
whether termination would result in a net liability owed from the counterparty.
For financial reporting purposes, the Fund does not offset derivative assets and derivative liabilities that are subject to netting arrangements in the Consolidated Statement of Assets and Liabilities.
Forward Foreign Currency Exchange Contracts
Forward foreign currency exchange contracts are over-the-counter agreements between two parties to buy and sell a currency at a set price on a future date. The Fund utilized forward foreign currency exchange contracts to hedge the currency exposure associated with some or all of the Fund’s securities, to shift foreign currency exposure back to U.S. dollars and to generate total return through long and short currency positions versus the U.S. dollar. These instruments may be used for other purposes in future periods.
The values of forward foreign currency exchange contracts fluctuate daily with changes in foreign currency exchange rates. Changes in the value of these contracts are recorded as unrealized appreciation or depreciation until the contract is exercised or has expired. The Fund will realize a gain or loss when the forward foreign currency exchange contract is closed or expires.
The use of forward foreign currency exchange contracts does not eliminate fluctuations in the prices of the Fund’s portfolio securities. The risks of forward foreign currency exchange contracts include movement in the values of the foreign currencies relative to the U.S. dollar (or other foreign currencies) and the possibility that counterparties will not complete their contractual obligations, which may be in excess of the amount reflected, if any, in the Consolidated Statement of Assets and Liabilities.
Futures Contracts
Futures contracts are exchange traded and represent commitments for the future purchase or sale of an asset at a specified price on a specified date. The Fund bought and sold futures contracts to produce incremental earnings, to manage exposure to movements in interest rates and to manage exposure to the securities market. These instruments may be used for other purposes in future periods. Upon entering into futures contracts, the Fund bears risks that it may not achieve the anticipated benefits of the futures contracts and may realize a loss. Additional risks include counterparty credit risk, the possibility of an illiquid market, and that a change in the value of the contract or option may not correlate with changes in the value of the underlying asset.
Upon entering into a futures contract, the Fund pledges cash or securities with the broker in an amount sufficient to meet the initial margin requirement. The initial margin deposit must be maintained at an established level over the life of the contract. Cash deposited as initial margin is recorded in the Consolidated Statement of Assets and Liabilities as margin deposits. Securities deposited as initial margin are designated in the Consolidated Portfolio of Investments. Subsequent payments (variation margin) are made or received by the Fund each day. The variation margin payments are equal to the daily change in the contract value and are recorded as variation margin receivable or payable and are offset in unrealized gains or losses. The Fund recognizes a realized gain or loss when the contract is closed or expires. Futures contracts involve, to varying degrees, risk of loss in excess of the variation margin disclosed in the Consolidated Statement of Assets and Liabilities.
Options Contracts
Options are contracts which entitle the holder to purchase or sell securities or other identified assets at a specified price, or in the case of index option contracts, to receive or pay the difference between the index value and the strike price of the index option contract. Option contracts can be either exchange-traded or over-the-counter. The Fund purchased and wrote option contracts to decrease the Fund’s exposure to equity market risk and to increase return on investments and to protect gains and facilitate buying and selling of securities for investments. These instruments may be used for other purposes in future periods. Completion of transactions for option contracts traded in the over-the-counter market depends upon the performance of the other party. Cash collateral may be collected or posted by the Fund to secure certain over-the-counter option contract trades. Cash collateral held or posted by the Fund for such option contract trades must be returned to the counterparty or the Fund upon closure, exercise or expiration of the contract.
Options contracts purchased are recorded as investments. When the Fund writes an options contract, the premium received is recorded as an asset and an amount equivalent to the premium is recorded as a liability in the Consolidated Statement of Assets and Liabilities and is subsequently adjusted to reflect the current fair value of the option written. Changes in the fair value of the written option are recorded as unrealized appreciation or depreciation until the contract is exercised or has expired. The Fund will realize a gain or loss when the option contract is closed or expires. When
| | |
| |
| ACTIVE PORTFOLIOS® MULTI-MANAGER ALTERNATIVE STRATEGIES FUND | | |
NOTES TO CONSOLIDATED FINANCIAL STATEMENTS (continued)
August 31, 2015
option contracts are exercised, the proceeds on sales for a written call or purchased put option contract, or the purchase cost for a written put or purchased call option contract, is adjusted by the amount of premium received or paid.
For over-the-counter options purchased, the Fund bears the risk of loss of the amount of the premiums paid plus the positive change in market values net of any collateral held by the Fund should the counterparty fail to perform under the contracts. Option contracts written by the Fund do not typically give rise to counterparty credit risk, as options written generally obligate the Fund and not the counterparty to perform. The risk in writing a call option contract is that the Fund gives up the opportunity for profit if the market price of the security increases above the strike price and the option contract is exercised. The risk in writing a put option contract is that the Fund may incur a loss if the market price of the security decreases below the strike price and the option contract is exercised. Exercise of a written option could result in the Fund purchasing or selling a security or foreign currency when it otherwise would not, or at a price different from the current market value. In purchasing and writing options, the Fund bears the risk of an unfavorable change in the value of the underlying instrument or the risk that the Fund may not be able to enter into a closing transaction due to an illiquid market.
Contracts and premiums associated with options contracts written for the year ended August 31, 2015 are as follows:
| | | | | | | | | | | | | | | | |
| | | | Calls | | | | Puts | |
| | | | Contracts | | | | Premiums ($) | | | | Contracts | | | | Premiums ($) | |
Balance at August 31, 2014 | | | 2,902 | | | | 349,311 | | | | 514 | | | | 43,620 | |
Opened | | | 40,666 | | | | 3,468,717 | | | | 24,161 | | | | 2,286,284 | |
Closed | | | 17,789 | | | | 1,840,526 | | | | 8,724 | | | | 1,036,831 | |
Expired | | | 14,080 | | | | 961,360 | | | | 5,469 | | | | 364,904 | |
Exercised | | | 6,339 | | | | 536,739 | | | | 6,494 | | | | 492,246 | |
| | | | | | | | | | | | | | | | | |
Balance at August 31, 2015 | | | 5,360 | | | | 479,403 | | | | 3,988 | | | | 435,923 | |
| | | | | | | | | | | | | | | | | |
Swap Contracts
Swap contracts are negotiated in the over-the-counter market and may be entered into as a bilateral contract or centrally cleared (centrally cleared swap contract). In a centrally cleared swap contract, immediately following execution of the swap contract with a broker, the swap contract is novated to a central counterparty (the CCP) and the CCP becomes the Fund’s counterparty to the centrally cleared swap contract. The Fund is required to deposit initial margin with the broker in the form of cash
or securities in an amount that varies depending on the size and risk profile of the particular swap contract. Securities deposited as initial margin are designated in the Consolidated Portfolio of Investments and cash deposited is recorded in the Consolidated Statement of Assets and Liabilities as margin deposits. Unlike a bilateral swap contract, for centrally cleared swap contracts, the Fund has minimal credit exposure to the counterparty because the CCP stands between the Fund and the counterparty. Swap contracts are marked-to-market daily and changes in value are recorded as unrealized appreciation (depreciation). The daily change in valuation of centrally cleared swap contracts, if any, is recorded as a receivable or payable for variation margin in the Consolidated Statement of Assets and Liabilities.
Total Return Swap Contracts
The Fund entered into total return swap contracts to manage long or short exposure to the total return on a specified reference security in return for periodic payments based on a fixed or variable interest rate and to get synthetic exposure to bond, commodity and equity index futures. These instruments may be used for other purposes in future periods. Total return swap contracts may be used to obtain exposure to an underlying reference security, instrument, or other asset or index or market without owning, taking physical custody of, or short selling any such security, instrument or asset in a market.
Total return swap contracts are valued daily, and the change in value is recorded as unrealized appreciation (depreciation) until the termination of the swap, at which time the Fund will realize a gain (loss). Periodic payments received (or made) by the Fund over the term of the contract are recorded as realized gains (losses).
Total return swap contracts may be subject to liquidity risk, which exists when a particular swap contract is difficult to purchase or sell. It may not be possible for the Fund to initiate a transaction or liquidate a position at an advantageous time or price, which may result in significant losses. Total return swap contracts are subject to the risk associated with the investment in the underlying reference security, instrument or asset. The risk in the case of short total return swap contracts is unlimited based on the potential for unlimited increases in the market value of the underlying reference security, instrument or asset. This risk may be offset if the Fund holds any of the underlying reference security, instrument or asset. The risk in the case of long total return swap contracts is limited to the current notional amount of the total return swap contract.
| | |
| |
| | ACTIVE PORTFOLIOS® MULTI-MANAGER ALTERNATIVE STRATEGIES FUND |
NOTES TO CONSOLIDATED FINANCIAL STATEMENTS (continued)
August 31, 2015
Total return swap contracts are also subject to the risk of the counterparty not fulfilling its obligations under the contract (counterparty credit risk). The Fund attempts to mitigate counterparty credit risk by entering into total return swap contracts only with counterparties that meet prescribed levels of creditworthiness, as determined by the Investment Manager.
Effects of Derivative Transactions in the Financial Statements
The following tables are intended to provide additional information about the effect of derivatives on the financial statements of the Fund, including: the fair value of derivatives by risk category and the location of those fair values in the Consolidated Statement of Assets and Liabilities; and the impact of derivative transactions over the period in the Consolidated Statement of Operations, including realized and unrealized gains (losses). The derivative instrument schedules following the Consolidated Portfolio of Investments present additional information regarding derivative instruments outstanding at the end of the period, if any.
The following table provides a summary of the average outstanding volume by derivative instrument for the year ended August 31, 2015:
| | | | |
| | | | | |
| Derivative Instrument | | Average
Notional
Amounts ($)* | |
Futures contracts — Long | | | 1,336,620,408 | |
Futures contracts — Short | | | 107,478,570 | |
| Derivative Instrument | | Average
Market
Value ($)* | |
Options contracts — Purchased | | | 1,563,410 | |
Options contracts — Written | | | (622,982 | ) |
| | | | | | | | |
| Derivative Instrument | | Average
Unrealized
Appreciation ($)* | | | Average
Unrealized
Depreciation ($)* | |
Forward foreign currency exchange contracts | | | 35,124,826 | | | | (31,043,882 | ) |
Total return swap contracts | | | 1,765,277 | | | | (792,021 | ) |
| * | Based on the ending quarterly outstanding amounts for the year ended August 31, 2015. |
The following table provides a summary of the fair value of derivative instruments (not considered to be hedging instruments for accounting disclosure purposes) at August 31, 2015:
| | | | | | |
| | | Asset Derivatives | |
Risk Exposure
Category | | Consolidated Statement of Assets and Liabilities Location | | | Fair Value ($) | |
Equity risk | | Net assets — unrealized appreciation on futures contracts | | | 970,436 | * |
Equity risk | | Investments, at value — Options purchased | | | 3,511,189 | |
Equity risk | | Net assets — unrealized appreciation on swap contracts | | | 24,338 | * |
Foreign exchange risk | | Unrealized appreciation on forward foreign currency exchange contracts | | | 31,180,437 | |
Foreign exchange risk | | Net assets — unrealized appreciation on futures contracts | | | 540 | * |
Interest rate risk | | Net assets — unrealized appreciation on futures contracts | | | 3,876,672 | * |
Commodity-related investment risk | | Net assets — unrealized appreciation on futures contracts | | | 2,437,702 | * |
Commodity-related investment risk | | Net assets — unrealized appreciation on swap contracts | | | 625,484 | * |
Total | | | | | 42,626,798 | |
| |
| | Liability Derivatives | |
Risk Exposure
Category | | Consolidated Statement of Assets and Liabilities Location | | | Fair Value ($) | |
Equity risk | | Net assets — unrealized depreciation on futures contracts | | | 259,062 | * |
Equity risk | | Options contracts written, at value | | | 1,420,764 | |
Equity risk | | Net assets — unrealized depreciation on swap contracts | | | 23,918 | * |
Foreign exchange risk | | Unrealized depreciation on forward foreign currency exchange contracts | | | 29,728,208 | |
Interest rate risk | | Net assets — unrealized depreciation on futures contracts | | | 1,457,186 | * |
Interest rate risk | | Net assets — unrealized depreciation on swap contracts | | | 263,392 | * |
Commodity-related investment risk | | Net assets — unrealized depreciation on futures contracts | | | 1,012,790 | * |
Commodity-related investment risk | | Net assets — unrealized depreciation on swap contracts | | | 687,680 | * |
Total | | | | | 34,853,000 | |
| * | Includes cumulative appreciation (depreciation) as reported in the tables following the Consolidated Portfolio of Investments. Only the current day’s variation margin is reported in receivables or payables in the Consolidated Statement of Assets and Liabilities. |
| | |
| |
| ACTIVE PORTFOLIOS® MULTI-MANAGER ALTERNATIVE STRATEGIES FUND | | |
NOTES TO CONSOLIDATED FINANCIAL STATEMENTS (continued)
August 31, 2015
The following table indicates the effect of derivative instruments (not considered to be hedging instruments for accounting disclosure purposes) in the Consolidated Statement of Operations for the year ended August 31, 2015:
| | | | | | | | | | | | | | | | | | | | |
| Amount of Realized Gain (Loss) on Derivatives Recognized in Income | |
Risk
Exposure
Category | | Forward Foreign
Currency
Exchange
Contracts ($) | | | Futures
Contracts
($) | | | Options Contracts Written and Purchased
($) | | | Swap Contracts
($) | | | Total ($) | |
Commodity- related investment risk | | | — | | | | 28,014,777 | | | | — | | | | 3,368,417 | | | | 31,383,194 | |
| | | | | | | | | | | | | | | | | | | | | |
Equity risk | | | — | | | | (6,108,859 | ) | | | (3,138,209 | ) | | | (3,199,511 | ) | | | (12,446,579 | ) |
| | | | | | | | | | | | | | | | | | | | | |
Foreign exchange risk | | | 22,201,701 | | | | (94,784 | ) | | | — | | | | — | | | | 22,106,917 | |
| | | | | | | | | | | | | | | | | | | | | |
Interest rate risk | | | — | | | | 13,687,018 | | | | — | | | | (392,180 | ) | | | 13,294,838 | |
| | | | | | | | | | | | | | | | | | | | | |
Total | | | 22,201,701 | | | | 35,498,152 | | | | (3,138,209 | ) | | | (223,274 | ) | | | 54,338,370 | |
| | | | | | | | | | | | | | | | | | | | | |
Change in Unrealized Appreciation (Depreciation) on Derivatives Recognized in
Income | |
Risk
Exposure
Category | | Forward Foreign
Currency
Exchange
Contracts ($) | | | Futures
Contracts ($) | | | Options Contracts
Written and
Purchased
($) | | | Swap Contracts ($) | | | Total ($) | |
Commodity- related investment risk | | | — | | | | (577,513 | ) | | | — | | | | (921,308 | ) | | | (1,498,821 | ) |
| | | | | | | | | | | | | | | | | | | | | |
Equity risk | | | — | | | | (2,469,098 | ) | | | 1,346,931 | | | | 78,306 | | | | (1,043,861 | ) |
| | | | | | | | | | | | | | | | | | | | | |
Foreign exchange risk | | | 525,289 | | | | 9,881 | | | | — | | | | — | | | | 535,170 | |
| | | | | | | | | | | | | | | | | | | | | |
Interest rate risk | | | — | | | | (1,583,677 | ) | | | 772 | | | | (550,198 | ) | | | (2,133,103 | ) |
| | | | | | | | | | | | | | | | | | | | | |
Total | | | 525,289 | | | | (4,620,407 | ) | | | 1,347,703 | | | | (1,393,200 | ) | | | (4,140,615 | ) |
| | | | | | | | | | | | | | | | | | | | | |
Short Sales
The Fund may sell a security it does not own in anticipation of a decline in the fair value of the security. When the Fund sells a security short, it must borrow the security sold short and deliver it to the broker-dealer through which it made the short sale. The Fund is required to maintain a margin account with the broker and to pledge assets to the broker as collateral for the borrowed security. Securities pledged as collateral are designated in the Consolidated Portfolio of Investments. In addition, cash collateral is recorded as cash collateral held at broker in the Consolidated Statement of Assets and Liabilities. The Fund can purchase the same security at the current market price and deliver it to the broker to close out the short sale. The Fund is obligated to pay the broker a fee for borrowing the security. The fee is included in “Dividends and interest on securities sold short” in the Consolidated Statement of Operations and a short position is reported as a liability at fair value in the Consolidated Statement of Assets and Liabilities. The Fund must also pay the broker for any dividends accrued (recognized on ex-date) on the borrowed security. This amount is recorded as an expense in the Consolidated Statement of Operations. The Fund will record a gain if the security declines in value, and will realize a loss if the security appreciates. Such gain, limited to the price at which the Fund sold the security short, or such loss, potentially unlimited in size because the short position loses value as the market price of the security sold short increases, will be recognized upon the termination of a short sale.
| | |
| |
| | ACTIVE PORTFOLIOS® MULTI-MANAGER ALTERNATIVE STRATEGIES FUND |
NOTES TO CONSOLIDATED FINANCIAL STATEMENTS (continued)
August 31, 2015
Offsetting of Assets and Liabilities
The following table presents the Fund’s gross and net amount of assets and liabilities available for offset under netting arrangements as well as any related collateral received or pledged by the Fund as of August 31, 2015:
| | | | | | | | | | | | | | | | | | | | | | | | | | | | | | | | | | | | |
| | | Barclays ($) | | | Citibank ($)(d) | | | Citibank ($)(d) | | | Deutsche Bank
Securities Inc. ($) | | | Goldman Sachs
& Co. ($)(d) | | | Goldman Sachs
& Co. ($)(d) | | | J.P. Morgan
Securities,
Inc. ($)(d) | | | J.P. Morgan
Securities,
Inc. ($)(d) | | | Total ($) | |
Assets | | | | | | | | | | | | | | | | | | | | | | | | | | | | | | | | | | | | |
Forward foreign currency exchange contracts | | | — | | | | 31,124,479 | | | | — | | | | — | | | | 55,958 | | | | — | | | | — | | | | — | | | | 31,180,437 | |
Options purchased calls | | | — | | | | — | | | | — | | | | — | | | | 1,269,342 | | | | — | | | | — | | | | — | | | | 1,269,342 | |
Options purchased puts | | | — | | | | — | | | | — | | | | — | | | | 2,241,847 | | | | — | | | | — | | | | — | | | | 2,241,847 | |
OTC total return swap contracts(a) | | | — | | | | — | | | | — | | | | — | | | | — | | | | 18,899 | | | | — | | | | — | | | | 18,899 | |
OTC total return swap contracts on futures(a) | | | — | | | | — | | | | 454,634 | | | | 170,850 | | | | — | | | | — | | | | 5,439 | | | | — | | | | 630,923 | |
Total Assets | | | — | | | | 31,124,479 | | | | 454,634 | | | | 170,850 | | | | 3,567,147 | | | | 18,899 | | | | 5,439 | | | | — | | | | 35,341,448 | |
Liabilities | | | | | | | | | | | | | | | | | | | | | | | | | | | | | | | | | | | | |
Forward foreign currency exchange contracts | | | — | | | | 29,703,503 | | | | — | | | | — | | | | 24,705 | | | | — | | | | — | | | | — | | | | 29,728,208 | |
Options contracts written | | | — | | | | — | | | | — | | | | — | | | | 1,420,764 | | | | — | | | | — | | | | — | | | | 1,420,764 | |
OTC total return swap contracts on futures(a) | | | 136,450 | | | | — | | | | 497,999 | | | | 255,943 | | | | — | | | | — | | | | 84,598 | | | | — | | | | 974,990 | |
Securities borrowed | | | — | | | | — | | | | — | | | | — | | | | 60,481,332 | | | | — | | | | — | | | | 46,641,520 | | | | 107,122,852 | |
Total Liabilities | | | 136,450 | | | | 29,703,503 | | | | 497,999 | | | | 255,943 | | | | 61,926,801 | | | | — | | | | 84,598 | | | | 46,641,520 | | | | 139,246,814 | |
Total Financial and Derivative Net Assets | | | (136,450 | ) | | | 1,420,976 | | | | (43,365 | ) | | | (85,093 | ) | | | (58,359,654 | ) | | | 18,899 | | | | (79,159 | ) | | | (46,641,520 | ) | | | (103,905,366 | ) |
Total collateral received (pledged)(b) | | | (110,000 | ) | | | — | | | | (43,365 | ) | | | (85,093 | ) | | | (58,359,654 | ) | | | — | | | | (79,159 | ) | | | (46,641,520 | ) | | | (105,318,791 | ) |
Net Amount(c) | | | (26,450 | ) | | | 1,420,976 | | | | — | | | | — | | | | — | | | | 18,899 | | | | — | | | | — | | | | 1,413,425 | |
| (a) | Over-the-Counter Swap Contracts are presented at market value plus periodic payments receivable (payable), which is comprised of unrealized appreciation, unrealized depreciation, premiums paid and premiums received. |
| (b) | In some instances, the actual collateral received and/or pledged may be more than the amount shown due to overcollateralization. |
| (c) | Represents the net amount due from/ (to) counterparties in the event of default. |
| (d) | Exposure can only be netted across transactions governed under the same master agreement with the same legal entity. |
Security Transactions
Security transactions are accounted for on the trade date. Cost is determined and gains (losses) are based upon the specific identification method for both financial statement and federal income tax purposes.
Income Recognition
Corporate actions and dividend income are generally recorded net of any non-reclaimable tax withholdings, on the ex-dividend date or upon receipt of ex-dividend notification in the case of certain foreign securities.
Interest income is recorded on an accrual basis. Market premiums and discounts, including original issue discounts, are amortized and accreted, respectively, over the expected life of the security on all debt securities, unless otherwise noted.
The Fund may place a debt security on non-accrual status and reduce related interest income when it becomes probable that the interest will not be collected and the amount of uncollectible interest can be reasonably estimated. A defaulted debt security is removed from non-accrual status when the issuer resumes interest payments or when collectibility of interest is reasonably assured.
| | |
| |
| ACTIVE PORTFOLIOS® MULTI-MANAGER ALTERNATIVE STRATEGIES FUND | | |
NOTES TO CONSOLIDATED FINANCIAL STATEMENTS (continued)
August 31, 2015
The Fund may receive distributions from holdings in equity securities, business development companies (BDCs), exchange-traded funds, other regulated investment companies (RICs), and real estate investment trusts (REITs), which report information on the tax character of their distributions annually. These distributions are allocated to dividend income, capital gain and return of capital based on actual information reported. Return of capital is recorded as a reduction of the cost basis of securities held. If the Fund no longer owns the applicable securities, return of capital is recorded as a realized gain. With respect to REITs, to the extent actual information has not yet been reported, estimates for return of capital are made by the Fund’s management. Management’s estimates are subsequently adjusted when the actual character of the distributions is disclosed by the REITs, which could result in a proportionate change in return of capital to shareholders.
Awards from class action litigation are recorded as a reduction of cost basis if the Fund still owns the applicable securities on the payment date. If the Fund no longer owns the applicable securities, the proceeds are recorded as realized gains.
Expenses
General expenses of the Trust are allocated to the Fund and other funds of the Trust based upon relative net assets or other expense allocation methodologies determined by the nature of the expense. Expenses directly attributable to the Fund are charged to the Fund.
Federal Income Tax Status
The Fund intends to qualify each year as a regulated investment company under Subchapter M of the Internal Revenue Code, as amended, and will distribute substantially all of its taxable income (including net short-term capital gains), if any, for its tax year, and as such will not be subject to federal income taxes. In addition, the Fund intends to distribute in each calendar year substantially all of its net investment income, capital gains and certain other amounts, if any, such that the Fund should not be subject to federal excise tax. Therefore, no federal income or excise tax provision is recorded.
Foreign Taxes
The Fund may be subject to foreign taxes on income, gains on investments or currency repatriation, a portion of which may be recoverable. The Fund will accrue such taxes and recoveries, as applicable, based upon its
current interpretation of tax rules and regulations that exist in the markets in which it invests.
Realized gains in certain countries may be subject to foreign taxes at the Fund level, based on statutory rates. The Fund accrues for such foreign taxes on realized and unrealized gains at the appropriate rate for each jurisdiction, as applicable. The amount, if any, is disclosed as a liability on the Consolidated Statement of Assets and Liabilities.
Distributions to Shareholders
Distributions from net investment income, if any, are declared and paid annually. Net realized capital gains, if any, are distributed along with the income distribution. Income distributions and capital gain distributions are determined in accordance with federal income tax regulations, which may differ from GAAP.
Guarantees and Indemnifications
Under the Trust’s organizational documents and, in some cases, by contract, its officers and trustees are indemnified against certain liabilities arising out of the performance of their duties to the Trust or its funds. In addition, certain of the Fund’s contracts with its service providers contain general indemnification clauses. The Fund’s maximum exposure under these arrangements is unknown since the amount of any future claims that may be made against the Fund cannot be determined, and the Fund has no historical basis for predicting the likelihood of any such claims.
Recent Accounting Pronouncement
Fair Value Measurement (Topic 820), Disclosure for Investments in Certain Entities That Calculate Net Asset Value per Share (or Its Equivalent)
In May 2015, the Financial Accounting Standards Board (FASB) issued Accounting Standards Update (ASU) No. 2015-07, Fair Value Measurement (Topic 820), Disclosure for Investments in Certain Entities That Calculate Net Asset Value per Share (or Its Equivalent). ASU No. 2015-07 changes the disclosure requirements for investments for which fair value is measured using the net asset value per share practical expedient. The disclosure requirements are effective for annual periods beginning after December 15, 2015 and interim periods within those fiscal years. At this time, management is evaluating the implications of this guidance and the impact it will have on the financial statement amounts and footnote disclosures, if any.
| | |
| |
| | ACTIVE PORTFOLIOS® MULTI-MANAGER ALTERNATIVE STRATEGIES FUND |
NOTES TO CONSOLIDATED FINANCIAL STATEMENTS (continued)
August 31, 2015
Note 3. Fees and Other Transactions with Affiliates
Investment Management Fees
Columbia Management Investment Advisers, LLC (the Investment Manager), a wholly-owned subsidiary of Ameriprise Financial, Inc. (Ameriprise Financial), is responsible for the Subsidiary’s day-to-day business pursuant to an Investment Management Services Agreement between the Subsidiary and the Investment Manager. Under the Investment Management Services Agreement, the Investment Manager is responsible for the ultimate oversight of investments made by the Fund. The Fund’s subadvisers (see Subadvisory Agreements below) have the primary responsibility for the day-to-day portfolio management of the Fund. The investment management fee is an annual fee that is equal to a percentage of the Fund’s average daily net assets that declines from 1.02% to 0.90% as the Fund’s net assets increase. The effective investment management fee rate for the year ended August 31, 2015 was 1.00% of the Fund’s average daily net assets.
Subadvisory Agreement
The Investment Manager has entered into Subadvisory Agreements with AQR Capital Management, LLC, Wasatch Advisors, Inc. and Water Island Capital, LLC, each of which subadvises a portion of the assets of the Fund. New investments in the Fund, net of any redemptions, are allocated in accordance with the Investment Manager’s determination, subject to the oversight of the Fund’s Board. Each subadviser’s proportionate share of investments in the Fund may also vary due to market fluctuations. The Investment Manager compensates each subadviser to manage the investment of the Fund’s assets.
Administration Fees
Under an Administrative Services Agreement, the Investment Manager also serves as the Fund Administrator. The Fund pays the Fund Administrator an annual fee for administration and accounting services equal to a percentage of the Fund’s average daily net assets that declines from 0.08% to 0.05% as the Fund’s net assets increase. The effective administration fee rate for the year ended August 31, 2015 was 0.08% of the Fund’s average daily net assets.
Compensation of Board Members
Board members, who are not officers or employees of the Investment Manager or Ameriprise Financial, are
compensated for their services to the Fund as disclosed in the Consolidated Statement of Operations. These Board members may participate in a Deferred Compensation Plan (the Plan) which may be terminated at any time. Obligations of the Plan will be paid solely out of the Fund’s assets, and all amounts payable under the Plan constitute a general unsecured obligation of the Fund.
Compensation of Chief Compliance Officer
The Board has appointed a Chief Compliance Officer to the Fund in accordance with federal securities regulations. The Fund is allocated a portion of the expenses associated with the Chief Compliance Officer based on relative net assets of the Trust.
Transfer Agency Fees
Under a Transfer and Dividend Disbursing Agent Agreement, Columbia Management Investment Services Corp. (the Transfer Agent), an affiliate of the Investment Manager and a wholly-owned subsidiary of Ameriprise Financial, is responsible for providing transfer agency services to the Fund. The Transfer Agent has contracted with Boston Financial Data Services (BFDS) to serve as sub-transfer agent.
Effective November 1, 2014, the Transfer Agent receives a monthly transfer agency fee based on the number or the average value of accounts, depending on the type of account. Prior to November 1, 2014, the Transfer Agent received a monthly account-based service fee based on the number of open accounts. In addition, the Transfer Agent also receives sub-transfer agency fees based on a percentage of the average aggregate value of the Fund’s shares maintained in omnibus accounts (other than omnibus accounts for which American Enterprise Investment Services Inc. is the broker of record or accounts where the beneficial shareholder is a customer of Ameriprise Financial Services, Inc., for which the Transfer Agent receives a per account fee). The Transfer Agent pays the fees of BFDS for services as sub-transfer agent and is not entitled to reimbursement for such fees from the Fund (with the exception of out-of-pocket fees).
The Transfer Agent also receives compensation from the Fund for various shareholder services and reimbursements for certain out-of-pocket fees.
For the year ended August 31, 2015, the Fund’s effective transfer agency fee rates as a percentage of average daily net assets for Class A shares was 0.10%.
Distribution and Service Fees
The Fund has an agreement with Columbia Management Investment Distributors, Inc. (the Distributor), an affiliate
| | |
| |
| ACTIVE PORTFOLIOS® MULTI-MANAGER ALTERNATIVE STRATEGIES FUND | | |
NOTES TO CONSOLIDATED FINANCIAL STATEMENTS (continued)
August 31, 2015
of the Investment Manager and a wholly-owned subsidiary of Ameriprise Financial, for distribution and shareholder services. The Board has approved, and the Fund has adopted, distribution and shareholder service plans (the Plans) applicable to certain share classes, which set the distribution and service fees for the Fund. These fees are calculated daily and are intended to compensate the Distributor and/or eligible selling and/or servicing agents for selling shares of the Fund and providing services to investors.
The Fund may pay a distribution fee of up to 0.25% of the Fund’s average daily net assets attributable to Class A shares and a service fee of up to 0.25% of the Fund’s average daily net assets attributable to Class A shares, provided, that the aggregate fee shall not exceed 0.25% of the Fund’s average daily net assets attributable to Class A shares.
Expenses Waived/Reimbursed by the Investment Manager and its Affiliates
The Fund’s expense ratio is subject to an expense reimbursement arrangement pursuant to which fees will be waived and/or expenses reimbursed (excluding certain fees and expenses described below), so that the Fund’s net operating expenses, after giving effect to fees waived/expenses reimbursed and any balance credits and/or overdraft charges from the Fund’s custodian, do not exceed the annual rates of:
| | | | | | | | |
| | | Voluntary
Expense Cap
Effective
January 1, 2015 | | | Contractual
Expense Cap
Prior to January 1, 2015 | |
Class A | | | 1.52 | % | | | 1.50 | % |
The voluntary expense cap arrangement may be revised or discontinued at any time. Under the arrangements, the following fees and expenses are excluded from the waiver/reimbursement commitment, and therefore will be paid by the Fund, if applicable: taxes (including foreign transaction taxes), expenses associated with investments in affiliated and non-affiliated pooled investment vehicles (including mutual funds and exchange-traded funds), transaction costs and brokerage commissions, costs related to any securities lending program, dividend and interest expenses associated with securities sold short, inverse floater program fees and expenses, transaction charges and interest on borrowed money, interest and extraordinary expenses. Any fees waived and/or expenses reimbursed under the expense reimbursement arrangements described above are not recoverable by the Investment Manager or its affiliates in future periods.
Note 4. Federal Tax Information
The timing and character of income and capital gain distributions are determined in accordance with income tax regulations, which may differ from GAAP because of temporary or permanent book to tax differences.
At August 31, 2015, these differences are primarily due to differing treatment for principal and/or interest from fixed income securities, deferral/reversal of wash sale losses, swap mark to market, Trustees’ deferred compensation, distribution reclassifications, foreign currency transactions, investments in partnerships, non-deductible expenses, passive foreign investment company (PFIC) holdings, post-October capital losses, re-characterization of distributions for investments, derivative investments, tax straddles and investments in commodity subsidiaries. To the extent these differences are permanent, reclassifications are made among the components of the Fund’s net assets in the Consolidated Statement of Assets and Liabilities. Temporary differences do not require reclassifications. In the Consolidated Statement of Assets and Liabilities the following reclassifications were made:
| | | | |
Undistributed net investment income | | | $25,921,008 | |
Accumulated net realized gain | | | (26,118,439 | ) |
Paid-in capital | | | 197,431 | |
Net investment income (loss) and net realized gains (losses), as disclosed in the Consolidated Statement of Operations, and net assets were not affected by this reclassification.
The tax character of distributions paid during the years indicated was as follows:
| | | | | | | | |
| | | Year Ended
August 31, 2015 ($) | | | Year Ended
August 31,
2014 ($) | |
Ordinary income | | | 25,062,490 | | | | 14,428,181 | |
Long-term capital gains | | | 15,693,951 | | | | 2,573,161 | |
Total | | | 40,756,441 | | | | 17,001,342 | |
Short-term capital gain distributions, if any, are considered ordinary income distributions for tax purposes.
At August 31, 2015, the components of distributable earnings on a tax basis were as follows:
| | | | |
Undistributed ordinary income | | | $52,004,236 | |
Net unrealized depreciation | | | (53,897,288 | ) |
| | |
| |
| | ACTIVE PORTFOLIOS® MULTI-MANAGER ALTERNATIVE STRATEGIES FUND |
NOTES TO CONSOLIDATED FINANCIAL STATEMENTS (continued)
August 31, 2015
At August 31, 2015, the cost of investments for federal income tax purposes was $818,862,493 and the aggregate gross unrealized appreciation and depreciation based on that cost was:
| | | | |
Unrealized appreciation | | | $13,866,192 | |
Unrealized depreciation | | | (67,763,480 | ) |
Net unrealized depreciation | | | $(53,897,288) | |
Under current tax rules, regulated investment companies can elect to treat certain late-year ordinary losses incurred and post-October capital losses (capital losses realized after October 31) as arising on the first day of the following taxable year. As of August 31, 2015, the Fund will elect to treat post-October capital losses of $7,289,571 as arising on September 1, 2015.
Management of the Fund has concluded that there are no significant uncertain tax positions in the Fund that would require recognition in the financial statements. However, management’s conclusion may be subject to review and adjustment at a later date based on factors including, but not limited to, new tax laws, regulations, and administrative interpretations (including relevant court decisions). Generally, the Fund’s federal tax returns for the prior three fiscal years remain subject to examination by the Internal Revenue Service.
Note 5. Portfolio Information
The cost of purchases and proceeds from sales of securities, excluding short-term investments and derivatives, if any, aggregated to $1,550,237,213 and $1,529,775,085, respectively, for the year ended August 31, 2015, of which $40,466,932 and $29,067,000, respectively, were U.S. government securities. The amount of purchase and sale activity impacts the portfolio turnover rate reported in the Consolidated Financial Highlights.
Note 6. Affiliated Money Market Fund
The Fund significantly invests in Columbia Short-Term Cash Fund, an affiliated money market fund established for the exclusive use by the Fund and other affiliated funds. The income earned by the Fund from such investments is included as Dividends — affiliated issuers in the Consolidated Statement of Operations. As an investing fund, the Fund indirectly bears its proportionate share of the expenses of Columbia Short-Term Cash Fund.
Note 7. Line of Credit
The Fund has entered into a revolving credit facility with a syndicate of banks led by JPMorgan Chase Bank, N.A. whereby the Fund may borrow for the temporary funding of shareholder redemptions or for other temporary or emergency purposes. Pursuant to a December 9, 2014 amendment, the credit facility agreement, which is a collective agreement between the Fund and certain other funds managed by the Investment Manager, severally and not jointly, permits collective borrowings up to $550 million. Interest is charged to each participating fund based on its borrowings at a rate equal to the higher of (i) the overnight federal funds rate plus 1.00% or (ii) the one-month LIBOR rate plus 1.00%. Each borrowing under the credit facility matures no later than 60 days after the date of borrowing. The Fund also pays a commitment fee equal to its pro rata share of the amount of the credit facility at a rate of 0.075% per annum. The commitment fee is included in other expenses in the Consolidated Statement of Operations. Prior to the December 9, 2014 amendment, the credit facility agreement permitted borrowings up to $500 million under the same terms and interest rates as described above.
The Fund had no borrowings during the year ended August 31, 2015.
Note 8. Significant Risks
Non-Diversification Risk
A non-diversified fund is permitted to invest a greater percentage of its total assets in fewer issuers than a diversified fund. The Fund may, therefore, have a greater risk of loss from a few issuers than a similar fund that invests more broadly.
Shareholder Concentration Risk
At August 31, 2015, affiliated shareholders of record owned 100.0% of the outstanding shares of the Fund in one or more accounts. Subscription and redemption activity by concentrated accounts may have a significant effect on the operations of the Fund. In the case of a large redemption, the Fund may be forced to sell investments at inopportune times, including its liquid or more liquid positions, resulting in Fund losses and the Fund holding a higher percentage of less liquid or illiquid securities. Large redemptions could result in decreased economies of scale and increased operating expenses for non-redeeming Fund shareholders.
| | |
| |
| ACTIVE PORTFOLIOS® MULTI-MANAGER ALTERNATIVE STRATEGIES FUND | | |
NOTES TO CONSOLIDATED FINANCIAL STATEMENTS (continued)
August 31, 2015
Short Selling Risk
Leverage occurs when the Fund increases its assets available for investment using borrowings, short sales, derivatives, or similar instruments or techniques. Because short sales involve borrowing securities and then selling them, the Fund’s short sales effectively leverage the Fund’s assets. The Fund’s assets that are used as collateral to secure the Fund’s obligations to return the securities sold short may decrease in value while the short positions are outstanding, which may force the Fund to use its other assets to increase the collateral. Leverage can create an interest expense that may lower the Fund’s overall returns. Leverage presents the opportunity for increased net income and capital gains, but may also exaggerate the Fund’s volatility and risk of loss. There can be no guarantee that a leveraging strategy will be successful.
Derivatives Risk
Losses involving derivative instruments may be substantial, because a relatively small price movement in the underlying security(ies), commodity, currency or index or other instrument or asset may result in a substantial loss for the Fund. In addition to the potential for increased losses, the use of derivative instruments may lead to increased volatility within the Fund. Derivatives will typically increase the Fund’s exposure to principal risks to which it is otherwise exposed, and may expose the Fund to additional risks, including correlation risk, counterparty risk, hedging risk, leverage risk and liquidity risk.
Note 9. Subsequent Events
Management has evaluated the events and transactions that have occurred through the date the financial statements were issued and noted no items requiring adjustment of the financial statements or additional disclosure.
Note 10. Information Regarding Pending and Settled Legal Proceedings
In December 2005, without admitting or denying the allegations, American Express Financial Corporation (AEFC, which is now known as Ameriprise Financial, Inc. (Ameriprise Financial)) entered into settlement agreements with the Securities and Exchange Commission (SEC) and Minnesota Department of Commerce (MDOC) related to market timing activities. As a result, AEFC was censured and ordered to cease and desist from committing or causing any violations of
certain provisions of the Investment Advisers Act of 1940, the Investment Company Act of 1940, and various Minnesota laws. AEFC agreed to pay disgorgement of $10 million and civil money penalties of $7 million. AEFC also agreed to retain an independent distribution consultant to assist in developing a plan for distribution of all disgorgement and civil penalties ordered by the SEC in accordance with various undertakings detailed at http://www.sec.gov/litigation/admin/ia-2451.pdf. Ameriprise Financial and its affiliates have cooperated with the SEC and the MDOC in these legal proceedings, and have made regular reports to the Funds’ Boards of Trustees.
Ameriprise Financial and certain of its affiliates have historically been involved in a number of legal, arbitration and regulatory proceedings, including routine litigation, class actions, and governmental actions, concerning matters arising in connection with the conduct of their business activities. Ameriprise Financial believes that the Funds are not currently the subject of, and that neither Ameriprise Financial nor any of its affiliates are the subject of, any pending legal, arbitration or regulatory proceedings that are likely to have a material adverse effect on the Funds or the ability of Ameriprise Financial or its affiliates to perform under their contracts with the Funds. Ameriprise Financial is required to make quarterly (10-Q), annual (10-K) and, as necessary, 8-K filings with the SEC on legal and regulatory matters that relate to Ameriprise Financial and its affiliates. Copies of these filings may be obtained by accessing the SEC website at www.sec.gov.
There can be no assurance that these matters, or the adverse publicity associated with them, will not result in increased fund redemptions, reduced sale of fund shares or other adverse consequences to the Funds. Further, although we believe proceedings are not likely to have a material adverse effect on the Funds or the ability of Ameriprise Financial or its affiliates to perform under their contracts with the Funds, these proceedings are subject to uncertainties and, as such, we are unable to estimate the possible loss or range of loss that may result. An adverse outcome in one or more of these proceedings could result in adverse judgments, settlements, fines, penalties or other relief that could have a material adverse effect on the consolidated financial condition or results of operations of Ameriprise Financial.
| | |
| |
| | ACTIVE PORTFOLIOS® MULTI-MANAGER ALTERNATIVE STRATEGIES FUND |
REPORT OF INDEPENDENT REGISTERED PUBLIC ACCOUNTING FIRM
To the Trustees of Columbia Funds Series Trust I and the Shareholders of
Active Portfolios® Multi-Manager Alternative Strategies Fund
In our opinion, the accompanying statement of assets and liabilities, including the portfolio of investments, and the related statements of operations and of changes in net assets and the financial highlights present fairly, in all material respects, the financial position of Active Portfolios® Multi-Manager Alternative Strategies Fund (the “Fund,” a series of Columbia Funds Series Trust I) at August 31, 2015, and the results of its operations, the changes in its net assets and the financial highlights for each of the periods indicated, in conformity with accounting principles generally accepted in the United States of America. These financial statements and financial highlights (hereafter referred to as “financial statements”) are the responsibility of the Fund’s management. Our responsibility is to express an opinion on these financial statements based on our audits. We conducted our audits of these financial statements in accordance with the standards of the Public Company Accounting Oversight Board (United States). Those standards require that we plan and perform the audit to obtain reasonable assurance about whether the financial statements are free of material misstatement. An audit includes examining, on a test basis, evidence supporting the amounts and disclosures in the financial statements, assessing the accounting principles used and significant estimates made by management, and evaluating the overall financial statement presentation. We believe that our audits, which included confirmation of securities at August 31, 2015 by correspondence with the custodian, brokers and transfer agent, and the application of alternative auditing procedures where such confirmations had not been received, provide a reasonable basis for our opinion.
PricewaterhouseCoopers LLP
Minneapolis, MN
October 26, 2015
| | |
| |
| ACTIVE PORTFOLIOS® MULTI-MANAGER ALTERNATIVE STRATEGIES FUND | | |
FEDERAL INCOME TAX INFORMATION
(Unaudited)
The Fund hereby designates the following tax attributes for the fiscal year ended August 31, 2015. Shareholders will be notified in early 2016 of the amounts for use in preparing 2015 income tax returns.
Tax Designations
| | | | |
Qualified Dividend Income | | | 26.48 | % |
Dividends Received Deduction | | | 17.74 | % |
Capital Gain Dividend | | | $148,661 | |
Qualified Dividend Income. For taxable, non-corporate shareholders, the percentage of ordinary income distributed during the fiscal year that represents qualified dividend income subject to reduced tax rates.
Dividends Received Deduction. The percentage of ordinary income distributed during the fiscal year that qualifies for the corporate dividends received deduction.
Capital Gain Dividend. The Fund designates as a capital gain dividend the amount reflected above, or if subsequently determined to be different, the net capital gain of such fiscal period.
| | |
| |
| | ACTIVE PORTFOLIOS® MULTI-MANAGER ALTERNATIVE STRATEGIES FUND |
TRUSTEES AND OFFICERS
The Trustees serve terms of indefinite duration. The names and birth years of the Trustees and Officers of the Funds in Columbia Funds Series Trust I, the year each was first elected or appointed to office, their principal business occupations during at least the last five years, the number of Funds overseen by each Trustee and other directorships they hold are shown below. Each officer listed below serves as an officer of each Fund in Columbia Funds Series Trust I. The mailing address of each Trustee is: c/o Columbia Management Investment Advisers, LLC, 225 Franklin Street, Mail Drop BX32 05228, Boston, MA 02110.
| | | | | | | | |
| Independent Trustees |
Name, Year of Birth and Position Held
with the Trust | | Year First Appointed or Elected as Trustee to any Fund Currently in the Columbia Funds Complex or a Predecessor Thereof | | Principal Occupation(s)
during the Past Five Years | | Number
of Funds
in the
Columbia
Funds
Complex
Overseen | | Other Directorships Held by Trustee During the Past Five Years |
Janet Langford Carrig
(Born 1957)
Trustee | | 1996 | | Senior Vice President, General Counsel and Corporate Secretary, ConocoPhillips (integrated energy company) since September 2007; Deputy General Counsel — Corporate Legal Services, ConocoPhillips from August 2006 to August 2007; Partner, Zelle, Hofmann, Voelbel, Mason & Gette LLP (law firm) from March 2005 to July 2006; Adjunct Professor of Law, Northwestern University from September 2004 to June 2006; Director, UAL Corporation (airline) from February 2006 to July 2006; Chief Administrative Officer and Senior Vice President, Kmart Holding Corporation (consumer goods) from September 2003 to March 2004 | | 60 | | None |
Douglas A. Hacker
(Born 1955)
Trustee and Chairman
of the Board | | 1996 | | Independent business executive since May 2006; Executive Vice President — Strategy of United Airlines from December 2002 to May 2006; President of UAL Loyalty Services (airline marketing company) from September 2001 to December 2002; Executive Vice President and Chief Financial Officer of United Airlines from July 1999 to September 2001 | | 60 | | Spartan Nash Company, (food distributor); Nash Finch Company (food distributor) from 2005 to 2013; Aircastle Limited (aircraft leasing); SeaCube Container Leasing Ltd. (container leasing) from 2010 to 2013; and Travelport Worldwide Limited (travel information technology) |
Nancy T. Lukitsh
(Born 1956)
Trustee | | 2011 | | Senior Vice President, Partner and Director of Marketing, Wellington Management Company, LLP (investment adviser) from 1997 to 2010; Chair, Wellington Management Investment Portfolios (commingled non-U.S. investment pools) from 2007 to 2010; Director, Wellington Trust Company, NA and other Wellington affiliates from 1997 to 2010 | | 60 | | None |
William E. Mayer
(Born 1940)
Trustee | | 1991 | | Partner, Park Avenue Equity Partners (private equity) since February 1999 | | 60 | | DynaVox Inc. (speech creation); Lee Enterprises (print media); WR Hambrecht + Co. (financial service provider) from 2000 to 2012; BlackRock Kelso Capital Corporation (investment company); and Premier, Inc. (healthcare) |
| | |
| |
| ACTIVE PORTFOLIOS® MULTI-MANAGER ALTERNATIVE STRATEGIES FUND | | |
TRUSTEES AND OFFICERS (continued)
| | | | | | | | |
| Independent Trustees (continued) |
Name, Year of Birth and Position Held
with the Trust | | Year First Appointed or Elected as Trustee to any Fund Currently in the Columbia Funds Complex or a Predecessor Thereof | | Principal Occupation(s)
during the Past Five Years | | Number
of Funds
in the
Columbia
Funds
Complex
Overseen | | Other Directorships Held by Trustee During the Past Five Years |
David M. Moffett
(Born 1952)
Trustee | | 2011 | | Retired. Consultant to Bridgewater and Associates; Chief Executive Officer, Federal Home Loan Mortgage Corporation, from 2008 to 2009; Senior Adviser, Global Financial Services Group, Carlyle Group, Inc., from 2007 to 2008; Vice Chairman and Chief Financial Officer, U.S. Bancorp, from 1993 to 2007 | | 60 | | Building Materials Holding Corp. (building materials and construction services); CIT Group Inc. (commercial and consumer finance); eBay Inc. (online trading community); E.W. Scripps Co. (print and television media); Genworth Financial, Inc. (financial and insurance products and services); MBIA Inc. (financial service provider); Paypal Holdings Inc. (payment and data processing services); and University of Oklahoma Foundation |
Charles R. Nelson
(Born 1942)
Trustee | | 1981 | | Retired. Professor Emeritus, University of Washington since 2011; Professor of Economics, University of Washington from 1976 to 2011; Ford and Louisa Van Voorhis Professor of Political Economy, University of Washington from 1993 to 2011; Adjunct Professor of Statistics, University of Washington from 1980 to 2011; Associate Editor, Journal of Money, Credit and Banking from September 1993 to 2008; consultant on econometric and statistical matters | | 60 | | None |
John J. Neuhauser
(Born 1943)
Trustee | | 1984 | | President, Saint Michael’s College since August 2007; Director or Trustee of several non-profit organizations, including Fletcher Allen Health Care, Inc.; Academic Vice President and Dean of Faculties, Boston College from August 1999 to October 2005; University Professor, Boston College from November 2005 to August 2007 | | 60 | | Liberty All-Star Equity Fund and Liberty All-Star Growth Fund (closed-end funds) |
Patrick J. Simpson
(Born 1944)
Trustee | | 2000 | | Partner, Perkins Coie LLP (law firm) | | 60 | | None |
Anne-Lee Verville
(Born 1945)
Trustee | | 1998 | | Retired. General Manager, Global Education Industry from 1994 to 1997, President —Application Systems Division from 1991 to 1994, Chief Financial Officer — US Marketing & Services from 1988 to 1991, and Chief Information Officer from 1987 to 1988, IBM Corporation (computer and technology) | | 60 | | Enesco Group, Inc. (producer of giftware and home and garden decor products) from 2001 to 2006 |
| | |
| |
| | ACTIVE PORTFOLIOS® MULTI-MANAGER ALTERNATIVE STRATEGIES FUND |
TRUSTEES AND OFFICERS (continued)
| | | | | | | | |
Interested Trustee Affiliate with Investment Manager* |
Name, Year of Birth and Position Held
with the Trust | | Year First Appointed or Elected as Trustee to any Fund Currently in the Columbia Funds Complex or a Predecessor Thereof | | Principal Occupation(s)
during the Past Five Years | | Number
of Funds
in the
Columbia
Funds
Complex
Overseen | | Other Directorships Held by Trustee During the Past Five Years |
William F. Truscott
(Born 1960)
Trustee | | 2012 | | Chairman of the Board and President, Columbia Management Investment Advisers, LLC since May 2010 and February 2012, respectively (previously President and Chief Investment Officer, 2001-April 2010); Chief Executive Officer, Global Asset Management, Ameriprise Financial, Inc. since September 2012 (previously Chief Executive Officer, U.S. Asset Management & President, Annuities, May 2010-September 2012 and President — U.S. Asset Management and Chief Investment Officer, 2005-April 2010); Director and Chief Executive Officer, Columbia Management Investment Distributors, Inc. since May 2010 and February 2012, respectively (previously Chairman of the Board and Chief Executive Officer, 2006-April 2010); Chairman of the Board and Chief Executive Officer, RiverSource Distributors, Inc. since 2006; Director, Threadneedle Asset Management Holdings, SARL since 2014; President and Chief Executive Officer, Ameriprise Certificate Company, 2006-August 2012 | | 187 | | Chairman of the Board, Columbia Management Investment Advisers, LLC since May 2010; Director, Columbia Management Investment Distributors, Inc. since May 2010; Director, Ameriprise Certificate Company, 2006 to January 2013 |
| * | Interested person (as defined under the 1940 Act) by reason of being an officer, director, security holder and/or employee of the Investment Manager or Ameriprise Financial. |
The Statement of Additional Information has additional information about the Fund’s Board members and is available, without charge, upon request by calling 800.345.6611; contacting your financial intermediary; or visiting columbiathreadneedle.com/us.
The Board has appointed officers who are responsible for day-to-day business decisions based on policies it has established. The officers serve at the pleasure of the Board. In addition to Mr. Truscott, who is Senior Vice President, the Funds’ other officers are:
| | | | |
| Fund Officers |
Name,
Address and
Year of Birth | | Position and Year First Appointed to Position for any Fund in the Columbia Funds Complex or a Predecessor Thereof | | Principal Occupation(s) During Past Five Years |
Christopher O. Petersen
5228 Ameriprise
Financial Center
Minneapolis, MN 55474
Born 1970 | | President and Principal Executive Officer (2015) | | Vice President and Lead Chief Counsel, Ameriprise Financial, Inc. since January 2015 (previously, Vice President and Chief Counsel January 2010-December 2014; and Vice President and Group Counsel or Counsel 2004-January 2010); officer of Columbia Funds and affiliated funds since 2007. |
Michael G. Clarke
225 Franklin Street
Boston, MA 02110
Born 1969 | | Treasurer (2011) and Chief Financial Officer (2009) | | Vice President — Mutual Fund Administration, Columbia Management Investment Advisers, LLC, since May 2010; Managing Director of Fund Administration, Columbia Management Advisors, LLC, September 2004-April 2010; senior officer of Columbia Funds and affiliated funds since 2002. |
| | |
| |
| ACTIVE PORTFOLIOS® MULTI-MANAGER ALTERNATIVE STRATEGIES FUND | | |
TRUSTEES AND OFFICERS (continued)
| | | | |
| Fund Officers (continued) |
Name,
Address and
Year of Birth | | Position and Year
First Appointed to
Position for any Fund in the Columbia Funds Complex or a Predecessor Thereof | | Principal Occupation(s) During Past Five Years |
Paul B. Goucher
100 Park Avenue
New York, NY 10017
Born 1968 | | Senior Vice President (2011), Chief Legal Officer (2015) and Assistant Secretary (2008) | | Vice President and Lead Chief Counsel, Ameriprise Financial, Inc. since November 2008 and January 2013, respectively (previously Chief Counsel, January 2010-January 2013 and Group Counsel, November 2008-January 2010). |
Thomas P. McGuire
225 Franklin Street
Boston, MA 02110
Born 1972 | | Vice President and Chief Compliance Officer (2012) | | Vice President — Asset Management Compliance, Ameriprise Financial, Inc., since May 2010; Chief Compliance Officer, Ameriprise Certificate Company since September 2010; Compliance Executive, Bank of America, 2005-April 2010. |
Colin Moore
225 Franklin Street
Boston, MA 02110
Born 1958 | | Senior Vice President (2010) | | Executive Vice President and Global Chief Investment Officer, Ameriprise Financial, Inc., since July 2013; Director and Global Chief Investment Officer, Columbia Management Investment Advisers, LLC since May 2010; Manager, Managing Director and Chief Investment Officer, Columbia Management Advisors, LLC, 2007-April 2010. |
Michael E. DeFao
225 Franklin Street
Boston, MA 02110
Born 1968 | | Vice President (2011) and Assistant Secretary (2010) | | Vice President and Chief Counsel, Ameriprise Financial, Inc. since May 2010; Associate General Counsel, Bank of America, 2005-April 2010. |
Joseph F. DiMaria
225 Franklin Street
Boston, MA 02110
Born 1968 | | Vice President (2011), Assistant Treasurer (2012) and Chief Accounting Officer (2008) | | Vice President — Mutual Fund Treasurer, Columbia Management Investment Advisers, LLC since May 2010; Director of Fund Administration, Columbia Management Advisors, LLC, 2006-April 2010. |
Amy Johnson
5228 Ameriprise
Financial Center
Minneapolis, MN 55474
Born 1965 | | Vice President (2006) | | Managing Director and Chief Operating Officer, Columbia Management Investment Advisers, LLC since May 2010 (previously Chief Administrative Officer, 2009-April 2010, and Vice President — Asset Management and Trust Company Services, 2006-2009). |
Lyn Kephart-Strong
5228 Ameriprise
Financial Center
Minneapolis, MN 55474
Born 1960 | | Vice President (2015) | | President, Columbia Management Investment Services Corp. since October 2014; Vice President & Resolution Officer, Ameriprise Trust Company since August 2009; President, RiverSource Service Corporation 2004-2010. |
Ryan C. Larrenaga
225 Franklin Street
Boston, MA 02110
Born 1970 | | Vice President and Secretary (2015) | | Vice President and Group Counsel, Ameriprise Financial, Inc. since August 2011 (previously, Counsel from May 2010 to August 2011); Assistant General Counsel, Bank of America, 2005-April 2010; officer of Columbia Funds and affiliated funds since 2005. |
| | |
| |
| | ACTIVE PORTFOLIOS® MULTI-MANAGER ALTERNATIVE STRATEGIES FUND |
BOARD CONSIDERATION AND APPROVAL OF ADVISORY AGREEMENT AND SUBADVISORY AGREEMENTS
On June 10, 2015, the Board of Trustees (the Board) and the Trustees who are not interested persons (as defined in the Investment Company Act of 1940) (the Independent Trustees) of Columbia Funds Series Trust I (the Trust) unanimously approved the continuation of the Investment Management Services Agreement (the Advisory Agreement) with Columbia Management Investment Advisers, LLC (the Investment Manager) and the Subadvisory Agreements (the Subadvisory Agreements) between the Investment Manager and AQR Capital Management, LLC, Wasatch Advisors, Inc. and Water Island Capital, LLC (the Subadvisers) with respect to Active Portfolios® Multi-Manager Alternative Strategies Fund (the Fund), a series of the Trust. The Board and the Independent Trustees also unanimously approved an agreement (the Management Agreement) combining the Advisory Agreement and the Fund’s existing administrative services agreement (the Administrative Services Agreement) in a single agreement. The Board and the Independent Trustees approved the restatement of the Advisory Agreement with the Management Agreement to be effective for the Fund on January 1, 2016, the Fund’s next annual prospectus update. As detailed below, the Board’s Advisory Fees and Expenses Committee (the Committee) and the Board met on multiple occasions to review and discuss, both among themselves and with the management team of the Investment Manager, materials provided by the Investment Manager and others before determining to approve the Management Agreement and the continuation of the Advisory Agreement and the Subadvisory Agreements (collectively, the Agreements).
In connection with their deliberations regarding the approval of the Management Agreement and the continuation of the Advisory Agreement and the Subadvisory Agreements, the Committee and the Board evaluated materials requested from the Investment Manager regarding the Fund and the Agreements, and discussed these materials with representatives of the Investment Manager at Committee meetings held on March 3, 2015, April 29, 2015 and June 9, 2015 and at Board meetings held on March 4, 2015 and June 10, 2015. In addition, the Board considers matters bearing on the Agreements at most of its other meetings throughout the year and meets regularly with senior management of the Trust and the Investment Manager. Through the Board’s Investment Oversight Committees, Trustees also meet with selected portfolio managers of the funds the Trustees oversee and other investment personnel at various times throughout the year. The Committee and the Board also consulted with its independent fee consultant, Fund counsel and with the Independent Trustees’ independent legal counsel, who advised on various matters with respect to the Committee’s and the Board’s considerations and otherwise assisted the Committee and the Board in their deliberations. On June 9, 2015, the Committee recommended that the Board approve the Management Agreement and the continuation of the Advisory Agreement and the Subadvisory Agreements. On June 10, 2015, the Board, including the Independent Trustees, voting separately, unanimously approved the Management Agreement and the continuation of the Advisory Agreement and the Subadvisory Agreements for the Fund.
The Committee and the Board considered all information that they, their legal counsel or the Investment Manager believed reasonably necessary to evaluate and to determine whether to approve the Management Agreement and the continuation of the Advisory Agreement and the Subadvisory Agreements. The information and factors considered by the Committee and the Board in recommending for approval or approving the Management Agreement and the continuation of the Advisory Agreement and the Subadvisory Agreements for the Fund included the following:
| • | | Information on the investment performance of the Fund relative to the performance of a group of mutual funds determined to be comparable to the Fund by an independent third-party data provider, as well as performance relative to benchmarks; |
| • | | Information on the Fund’s advisory fees and total expenses, including information comparing the Fund’s expenses to those of a group of comparable mutual funds, as determined by the independent third-party data provider; |
| • | | The Investment Manager’s agreement to contractually limit or cap total operating expenses for the Fund so that total operating expenses (excluding certain fees and expenses, such as portfolio transaction costs and certain other investment related expenses, interest, taxes, acquired fund fees and expenses, and extraordinary expenses) would not exceed a specified percentage of the Fund’s average annual net assets from January 1, 2016 through December 31, 2016; |
| | |
| |
| ACTIVE PORTFOLIOS® MULTI-MANAGER ALTERNATIVE STRATEGIES FUND | | |
BOARD CONSIDERATION AND APPROVAL OF ADVISORY AGREEMENT AND SUBADVISORY AGREEMENTS (continued)
| • | | The terms and conditions of the Agreements; |
| • | | The current and proposed terms and conditions of other agreements and arrangements with affiliates of the Investment Manager relating to the operations of the Fund, including the Administrative Services Agreement1 and agreements with respect to the provision of distribution and transfer agency services to the Fund; |
| • | | Descriptions of various functions performed by the Investment Manager and the Subadvisers under the Agreements, including portfolio management and portfolio trading practices; |
| • | | Information regarding the management fees and investment performance of similarly-managed portfolios of other clients of the Investment Manager, including institutional separate accounts; |
| • | | Information regarding the reputation, regulatory history and resources of the Investment Manager, including information regarding senior management, portfolio managers and other personnel; |
| • | | Information regarding the capabilities of the Investment Manager with respect to compliance monitoring services, including an assessment of the Investment Manager’s and the Subadvisers’ compliance system by the Fund’s Chief Compliance Officer; and |
| • | | The profitability to the Investment Manager and its affiliates from their relationships with the Fund. |
Nature, Extent and Quality of Services Provided under the Agreements
The Committee and the Board considered the nature, extent and quality of services provided to the Fund by the Investment Manager, the Subadvisers and the Investment Manager’s affiliates under the Agreements and under separate agreements for the provision of transfer agency and administrative services, and the resources dedicated to the Fund and the other Columbia Funds by the Investment Manager, the Subadvisers and the Investment Manager’s affiliates. The Committee and the Board also determined that the nature and level of the services to be provided under the Management Agreement would not decrease relative to the services provided under the Advisory Agreement and the Administrative Services Agreement. The Committee and the Board considered, among other things, the Investment Manager’s ability to attract, motivate and retain highly qualified research, advisory and supervisory investment professionals (including personnel and other resources, compensation programs for personnel involved in fund management, reputation and other attributes), the portfolio management services provided by those investment professionals, and the quality of the Investment Manager’s investment research capabilities and trade execution services. The Committee and the Board also considered the potential benefits to shareholders of investing in a mutual fund that is part of a fund complex offering exposure to a variety of asset classes and investment disciplines and providing a variety of fund and shareholder services.
The Committee and the Board also considered the professional experience and qualifications of the senior personnel of the Investment Manager and the Subadvisers, which included consideration of the Investment Manager’s and the Subadvisers’ experience with similarly-structured funds. The Committee and the Board noted the compliance programs of and the compliance-related resources provided to the Fund by the Investment Manager and its affiliates, and considered the Investment Manager’s ability to provide administrative services to the Fund and coordinate the activities of the Fund’s other service providers. The Committee and the Board also noted that the Board had approved each Subadviser’s code of ethics and compliance program, and that the Chief Compliance Officer of the Funds reports to the Trustees on each Subadviser’s compliance program. In evaluating the nature, extent and quality of services provided under the Agreements, the Committee and the Board considered that these services were provided to the Fund, rather than directly to Fund shareholders. The Committee and the Board accordingly affirmed, after considering various other matters, including the potential benefits to the Fund and its shareholders of the Independent Trustees’ important role as pre-suit gatekeepers with respect to claims that they may determine are meritless or contrary to the Fund’s best interests, that it was not the intention of the Board or the Investment Manager that there be any third-party beneficiaries of the Agreements.
| 1 | Like the Advisory Agreement, the Administrative Services Agreement will terminate with respect to the Fund once the Management Agreement is effective for the Fund. |
| | |
| |
| | ACTIVE PORTFOLIOS® MULTI-MANAGER ALTERNATIVE STRATEGIES FUND |
BOARD CONSIDERATION AND APPROVAL OF ADVISORY AGREEMENT AND SUBADVISORY AGREEMENTS (continued)
The Committee and the Board considered the diligence and selection process undertaken by the Investment Manager to select the Subadvisers, including the Investment Manager’s rationale for recommending the continuation of the Subadvisory Agreements, and the process for monitoring the Subadvisers’ ongoing performance of services for the Fund. As part of these deliberations, the Committee and the Board considered the ability of the Investment Manager, subject to the approval of the Board, to modify or enter into new subadvisory agreements without a shareholder vote pursuant to an exemptive order of the Securities and Exchange Commission. The Committee and the Board also considered the scope of services provided to the Fund by the Investment Manager that are distinct from and in addition to those provided by the Subadvisers, including cash flow management, treasury services, risk oversight, investment oversight and Subadviser selection, oversight and transition management. After reviewing these and related factors, the Committee and the Board concluded, within the context of their overall conclusions, that the nature, extent and quality of the services provided to the Fund under the Agreements supported the approval of the Management Agreement and the continuation of the Advisory Agreement and the Subadvisory Agreements.
Investment Performance
The Committee and the Board reviewed information about the performance of the Fund over various time periods, including performance information relative to benchmarks and information based on reports of the independent third-party data provider that compared the performance of the Fund to the performance of a group of comparable mutual funds, and data provided by the independent fee consultant. The Committee and the Board also reviewed a description of the third party’s methodology for identifying the Fund’s peer groups for purposes of performance and expense comparisons. Although the Fund’s performance lagged that of a relevant peer group for certain (although not necessarily all) periods, the Committee and the Board concluded that other factors relevant to performance were sufficient, in light of other considerations, to warrant continuation of the Advisory Agreement and the Subadvisory Agreements and approval of the Management Agreement. Those factors included one or more of the following: (i) that the Fund’s performance, although lagging in certain recent periods, was stronger over the longer term; (ii) that the underperformance was attributable, to a significant extent, to investment decisions that were reasonable and consistent with the Fund’s investment strategy and policies and that the Fund was performing within a reasonable range of expectations, given those investment decisions, market conditions and the Fund’s investment strategy; (iii) that the Fund’s performance was competitive when compared to other relevant performance benchmarks or peer groups; and (iv) that the Investment Manager had taken or was taking steps designed to help improve the Fund’s investment performance, including, but not limited to, replacing portfolio managers, enhancing the resources supporting the portfolio managers, or modifying investment strategies.
The Committee and the Board noted that, through December 31, 2014, the Fund’s performance was in the fifty-fifth percentile (where the best performance would be in the first percentile) of its category selected by the independent third-party data provider for the purposes of performance comparisons for the one-year period.
The Committee and the Board also considered the Investment Manager’s performance and reputation generally, the Investment Manager’s historical responsiveness to Board concerns about performance, and the Investment Manager’s willingness to take steps intended to improve performance. After reviewing these and related factors, the Committee and the Board concluded, within the context of their overall conclusions, that the performance of the Fund, the Investment Manager and the Subadvisers were sufficient, in light of other considerations, to warrant the continuation of the Advisory Agreement and the Subadvisory Agreements and the approval of the Management Agreement.
Investment Advisory Fee Rates and Other Expenses
The Committee and the Board considered the advisory fees charged to the Fund under the Advisory Agreement and the Subadvisory Agreements, as well as the total expenses incurred by the Fund. In assessing the reasonableness of the fees under the Advisory Agreement, the Committee and the Board considered, among other information, the Fund’s advisory fee and its total expense ratio as a percentage of average daily net assets. The Committee and the Board also considered that the proposed management fee would not exceed the sum of the fee rates payable under the Advisory Agreement and the Administrative Services Agreement. The Committee and the Board considered data provided by the independent fee consultant. The Committee and the Board noted that, as of December 31, 2014, the Fund’s actual management fee and net expense ratio are ranked in the third and second quintiles, respectively, (where
| | |
| |
| ACTIVE PORTFOLIOS® MULTI-MANAGER ALTERNATIVE STRATEGIES FUND | | |
BOARD CONSIDERATION AND APPROVAL OF ADVISORY AGREEMENT AND SUBADVISORY AGREEMENTS (continued)
the lowest fees and expenses would be in the first quintile) against the Fund’s expense universe as determined by the Investment Manager for purposes of expense comparison. The Committee and the Board also considered the fees that the Subadvisers charge to its other clients, and noted that the Investment Manager pays the fees of the Subadvisers. The Committee and the Board also took into account the fee waiver and expense limitation arrangements agreed to by the Investment Manager, as noted above.
The Committee and the Board also received and considered information about the advisory fees charged by the Investment Manager to institutional separate accounts. In considering the fees charged to those accounts, the Committee and the Board took into account, among other things, the Investment Manager’s representations about the differences between managing mutual funds as compared to other types of accounts, including differences in the services provided, differences in the risk profile of such business for the Investment Manager and the additional resources required to manage mutual funds effectively. The Committee and the Board received and considered information about the fees charged by the Investment Manager for sub-advisory services provided to comparable unaffiliated funds. In evaluating the Fund’s advisory fees, the Committee and the Board also took into account the demands, complexity and quality of the investment management of the Fund.
After reviewing these and related factors, the Committee and the Board concluded, within the context of their overall conclusions, that the advisory/management fee rates and expenses of the Fund were sufficient, in light of other considerations, to warrant the approval of the Management Agreement and continuation of the Advisory Agreement and the Subadvisory Agreements.
Costs of Services Provided and Profitability
The Committee and the Board also took note of the costs the Investment Manager and its affiliates incur in connection with the services provided (both on an absolute and relative basis) and the profitability to the Investment Manager and its affiliates in connection with their relationships with the Fund.
The Committee and the Board also considered the compensation directly or indirectly received by the Investment Manager’s affiliates in connection with their relationships with the Fund. The Committee and the Board reviewed information provided by management as to the profitability to the Investment Manager and its affiliates of their relationships with the Fund, information about the allocation of expenses used to calculate profitability, and comparisons of profitability levels realized in 2014 to profitability levels realized in 2013. When reviewing profitability, the Committee and the Board also considered court cases in which adviser profitability was an issue in whole or in part, the performance of similarly managed funds, the performance of the Fund, and the expense ratio of the Fund. The Committee and the Board also considered information provided by the Investment Manager regarding its financial condition and comparing its profitability to that of other asset management firms that are, or are subsidiaries of, publicly traded companies. Because the Subadvisory Agreements were negotiated at arms-length by the Investment Manager, which is responsible for payments to the Subadviser thereunder, the Committee and the Board did not consider the profitability to each Subadviser of its relationship with the Fund.
After reviewing these and related factors, the Committee and the Board concluded, within the context of their overall conclusions, that the costs of services provided and the profitability to the Investment Manager and its affiliates from their relationships with the Fund supported the approval of the Management Agreement and the continuation of the Advisory Agreement and the Subadvisory Agreements.
Economies of Scale
The Committee and the Board considered the potential existence of economies of scale in the provision by the Investment Manager of services to the Fund, to groups of related funds, and to the Investment Manager’s investment advisory clients as a whole, and whether those economies of scale were shared with the Fund through breakpoints in investment advisory fees or other means, such as expense limitation arrangements and additional investments by the Investment Manager in investment, trading and compliance resources. The Committee and the Board noted that the investment advisory and management fee schedules for the Fund contained breakpoints that would reduce the fee rate on assets above specified threshold levels.
| | |
| |
| | ACTIVE PORTFOLIOS® MULTI-MANAGER ALTERNATIVE STRATEGIES FUND |
BOARD CONSIDERATION AND APPROVAL OF ADVISORY AGREEMENT AND SUBADVISORY AGREEMENTS (continued)
The Committee and the Board noted that the breakpoints in the Advisory Agreement did not occur at the same levels as the breakpoints in the Subadvisory Agreements. The Committee and the Board noted that absent a shareholder vote, the Investment Manager would bear any increase in fees payable under the Subadvisory Agreements. The Committee and the Board also noted the potential challenges of seeking to tailor the Advisory Agreement breakpoints to those of a subadvisory agreement in this context, and the effect that capacity constraints on a subadviser’s ability to manage assets could potentially have on the ability of the Investment Manager to achieve economies of scale, as new subadvisers may need to be added as the Fund grows, increasing the Investment Manager’s cost of compensating and overseeing the Fund’s subadvisers.
In considering these matters, the Committee and the Board also considered the costs of the services provided and the profitability to the Investment Manager and its affiliates from their relationships with the Fund, as discussed above. After reviewing these and related factors, the Committee and the Board concluded, within the context of their overall conclusions, that the extent to which any economies of scale were expected to be shared with the Fund supported the approval of the Management Agreement and the continuation of the Advisory Agreement and the Subadvisory Agreements.
Other Benefits to the Investment Manager
The Committee and the Board received and considered information regarding “fall-out” or ancillary benefits received by the Investment Manager and its affiliates as a result of their relationships with the Fund, such as the engagement of the Investment Manager to provide administrative services to the Fund and the engagement of the Investment Manager’s affiliates to provide distribution and transfer agency services to the Fund. In this regard, among other matters, the Committee and the Board considered that the Fund’s distributor retains a portion of the distribution fees from the Fund and receives a portion of the sales charges on sales or redemptions of certain classes of shares of the Fund. The Committee and the Board also considered the benefits of research made available to the Investment Manager by reason of brokerage commissions generated by the Fund’s securities transactions, and reviewed information about the Investment Manager’s practices with respect to allocating portfolio transactions for brokerage and research services. The Committee and the Board considered the possible conflicts of interest associated with certain fall-out or other ancillary benefits and the reporting, disclosure and other processes that are in place to address such possible conflicts of interest. The Committee and the Board recognized that the Investment Manager’s profitability would be somewhat lower without these benefits.
Conclusion
The Committee and the Board reviewed all of the above considerations in reaching their decisions to recommend or approve the Management Agreement and the continuation of the Advisory Agreement and the Subadvisory Agreements. In their deliberations, the Trustees did not identify any particular information that was all-important or controlling, and individual Trustees may have attributed different weights to the various factors. Based on their evaluation of all factors that they deemed to be material, including those factors described above, and assisted by the advice of independent legal counsel, the Board, including the Independent Trustees, voting separately, unanimously approved the Management Agreement and the continuation of the Advisory Agreement and the Subadvisory Agreements.
| | |
| |
| ACTIVE PORTFOLIOS® MULTI-MANAGER ALTERNATIVE STRATEGIES FUND | | |
IMPORTANT INFORMATION ABOUT THIS REPORT
Each fund mails one shareholder report to each shareholder address. If you would like more than one report, please call shareholder services at 800.345.6611 and additional reports will be sent to you.
The policy of the Board is to vote the proxies of the companies in which each fund holds investments consistent with the procedures as stated in the Statement of Additional Information (SAI). You may obtain a copy of the SAI without charge by calling 800.345.6611; contacting your financial intermediary; visiting columbiathreadneedle.com/us; or searching the website of the Securities and Exchange Commission (SEC) at sec.gov. Information regarding how each fund voted proxies relating to portfolio securities is filed with the SEC by August 31st for the most recent 12-month period ending June 30th of that year, and is available without charge by visiting columbiathreadneedle.com/us, or searching the website of the SEC at sec.gov.
Each fund files a complete schedule of portfolio holdings with the SEC for the first and third quarters of each fiscal year on Form N-Q. Each fund’s Form N-Q is available on the SEC’s website at sec.gov and may be reviewed and copied at the SEC’s Public Reference Room in Washington, D.C. Information on the operation of the Public Reference Room may be obtained by calling 800.SEC.0330. Each fund’s complete schedule of portfolio holdings, as filed on Form N-Q, can also be obtained without charge, upon request, by calling 800.345.6611.
You may obtain the current net asset value (NAV) of Fund shares at no cost by calling 800.345.6611 or by sending an e-mail to serviceinquiries@columbiathreadneedle.com.
Active Portfolios® Multi-Manager Alternative Strategies Fund
P.O. Box 8081
Boston, MA 02266-8081
This information is for use with concurrent or prior delivery of a fund prospectus. Please read and consider the investment objectives, risks, charges and expenses for any fund carefully before investing. For a prospectus and summary prospectus, which contains this and other important information about the Fund, go to columbiathreadneedle.com/us. The Fund is distributed by Columbia Management Investment Distributors, Inc., member FINRA, and managed by Columbia Management Investment Advisers, LLC.
Columbia Threadneedle Investments (Columbia Threadneedle) is the global brand name of the Columbia and Threadneedle group of companies. All rights reserved. Columbia Management Investment Distributors, Inc., 225 Franklin Street, Boston, MA 02110-2804
© 2015 Columbia Management Investment Advisers, LLC.
columbiathreadneedle.com/us
ANN100_08_E01_(10/15)
Item 2. Code of Ethics.
(a) The registrant has adopted a code of ethics that applies to the registrant’s principal executive officer, principal financial officer, principal accounting officer or controller, or persons performing similar functions, regardless of whether these individuals are employed by the registrant or a third party.
(b) During the period covered by this report, there were not any amendments to a provision of the code of ethics adopted in 2(a) above.
(c) During the period covered by this report, there were no waivers, including any implicit waivers, from a provision of the code of ethics described in 2(a) above that relates to one or more of the items set forth in paragraph (b) of this item’s instructions.
Item 3. Audit Committee Financial Expert.
The registrant’s Board of Trustees has determined that Douglas A. Hacker, David M. Moffett and Anne-Lee Verville, each of whom are members of the registrant’s Board of Trustees and Audit Committee, each qualify as an audit committee financial expert. Mr. Hacker, Mr. Moffett and Ms. Verville are each independent trustees, as defined in paragraph (a)(2) of this item’s instructions.
Item 4. Principal Accountant Fees and Services.
Fee information below is disclosed for the fourteen series of the registrant whose reports to stockholders are included in this annual filing.
(a) Audit Fees. Aggregate Audit Fees billed by the principal accountant for professional services rendered during the fiscal years ended August 31, 2015 and August 31, 2014 are approximately as follows:
2015 | | 2014 | |
$ | 318,500 | | $ | 293,400 | |
| | | | | |
Audit Fees include amounts related to the audit of the registrant’s annual financial statements or services that are normally provided by the accountant in connection with statutory and regulatory filings or engagements for those fiscal years.
(b) Audit-Related Fees. Aggregate Audit-Related Fees billed to the registrant by the principal accountant for professional services rendered during the fiscal years ended August 31, 2015 and August 31, 2014 are approximately as follows:
Audit-Related Fees include amounts for assurance and related services by the principal accountant that are reasonably related to the performance of the audit of the registrant’s financial statements and are not reported in Audit Fees above. In fiscal years 2015 and 2014, Audit-Related Fees consist of agreed-upon procedures performed for semi-annual shareholder reports.
During the fiscal years ended August 31, 2015 and August 31, 2014, there were no Audit-Related Fees billed by the registrant’s principal accountant to the registrant’s investment adviser (not including any sub-adviser whose role is primarily portfolio management and is subcontracted with or overseen by another investment adviser) and any entity controlling, controlled by, or under common control with the adviser that provides ongoing services to the registrant for an engagement that related directly to the operations and financial reporting of the registrant.
(c) Tax Fees. Aggregate Tax Fees billed by the principal accountant to the registrant for professional services rendered during the fiscal years ended August 31, 2015 and August 31, 2014 are approximately as follows:
2015 | | 2014 | |
$ | 83,000 | | $ | 68,100 | |
| | | | | |
Tax Fees include amounts for the review of annual tax returns, the review of required shareholder distribution calculations and typically include amounts for professional services by the principal accountant for tax compliance, tax advice and tax planning. Fiscal years 2015 and 2014 also include Tax Fees for the review of foreign tax filings.
During the fiscal years ended August 31, 2015 and August 31, 2014, there were no Tax Fees billed by the registrant’s principal accountant to the registrant’s investment adviser (not including any sub-adviser whose role is primarily portfolio management and is subcontracted with or overseen by another investment adviser) and any entity controlling, controlled by, or under common control with the adviser that provides ongoing services to the registrant for an engagement that related directly to the operations and financial reporting of the registrant.
(d) All Other Fees. Aggregate All Other Fees billed by the principal accountant to the registrant for professional services rendered during the fiscal years ended August 31, 2015 and August 31, 2014 are approximately as follows:
All Other Fees include amounts for products and services provided by the principal accountant, other than the services reported in paragraphs (a) through (c) above.
Aggregate All Other Fees billed by the registrant’s principal accountant to the registrant’s investment adviser (not including any sub-adviser whose role is primarily portfolio management and is subcontracted with or overseen by another investment adviser) and any entity controlling, controlled by, or under common control with the adviser that provides ongoing services to the registrant for an engagement that related directly to the operations and financial reporting of the registrant during the fiscal years ended August 31, 2015 and August 31, 2014 are approximately as follows:
2015 | | 2014 | |
$ | 225,000 | | $ | 345,000 | |
| | | | | |
In fiscal years 2015 and 2014, All Other Fees primarily consists of fees billed for internal control examinations of the registrant’s transfer agent and investment adviser.
(e)(1) Audit Committee Pre-Approval Policies and Procedures
The registrant’s Audit Committee is required to pre-approve the engagement of the registrant’s independent auditors to provide audit and non-audit services to the registrant and non-audit services to its investment adviser (excluding any sub-adviser whose role is primarily portfolio management and is sub-contracted or overseen by another investment adviser (the “Adviser”) or any entity controlling, controlled by or under common control with the Adviser that provides ongoing services to the Fund (a “Control Affiliate”) if the engagement relates directly to the operations and financial reporting of the registrant.
The Audit Committee has adopted a Policy for Engagement of Independent Auditors for Audit and Non-Audit Services (the “Policy”). The Policy sets forth the understanding of the Audit Committee regarding the engagement of the registrant’s independent accountants to provide (i) audit and permissible audit-related, tax and other services to the registrant (“Fund Services”); (ii) non-audit services to the registrant’s Adviser and any Control Affiliates, that relates directly to the operations and financial reporting of a Fund (“Fund-related Adviser Services”); and (iii) certain other audit and non-audit services to the registrant’s Adviser and its Control Affiliates. A service will require specific pre-approval by the Audit Committee if it is to be provided by the Fund’s independent auditor; provided, however, that pre-approval of non-audit services to the Fund, the Adviser or Control Affiliates may be waived if certain de minimis requirements set forth in the SEC’s rules are met.
Under the Policy, the Audit Committee may delegate pre-approval authority to any pre-designated member or members who are independent board members. The member(s) to whom such authority is delegated must report, for informational purposes only, any pre-approval decisions to the Audit Committee at its next regular meeting. The Audit
Committee’s responsibilities with respect to the pre-approval of services performed by the independent auditor may not be delegated to management.
On an annual basis, at a regularly scheduled Audit Committee meeting, the Fund’s Treasurer or other Fund officer shall submit to the Audit Committee a schedule of the types of Fund Services and Fund-related Adviser Services that are subject to specific pre-approval. This schedule will provide a description of each type of service that is subject to specific pre-approval, along with total projected fees for each service. The pre-approval will generally cover a one-year period. The Audit Committee will review and approve the types of services and the projected fees for the next one-year period and may add to, or subtract from, the list of pre-approved services from time to time, based on subsequent determinations. This specific approval acknowledges that the Audit Committee is in agreement with the specific types of services that the independent auditor will be permitted to perform and the projected fees for each service.
The Fund’s Treasurer or other Fund officer shall report to the Audit Committee at each of its regular meetings regarding all Fund Services or Fund-related Adviser Services provided since the last such report was rendered, including a description of the services, by category, with forecasted fees for the annual reporting period, proposed changes requiring specific pre-approval and a description of services provided by the independent auditor, by category, with actual fees during the current reporting period.
*****
(e)(2) 100% of the services performed for items (b) through (d) above during 2015 and 2014 were pre-approved by the registrant’s Audit Committee.
(f) Not applicable.
(g) The aggregate non-audit fees billed by the registrant’s accountant for services rendered to the registrant, and rendered to the registrant’s investment adviser (not including any sub-adviser whose role is primarily portfolio management and is subcontracted with or overseen by another investment adviser), and any entity controlling, controlled by, or under common control with the adviser that provides ongoing services to the registrant during the fiscal years ended August 31, 2015 and August 31, 2014 are approximately as follows:
2015 | | 2014 | |
$ | 313,600 | | $ | 418,700 | |
| | | | | |
(h) The registrant’s Audit Committee of the Board of Directors has considered whether the provision of non-audit services that were rendered to the registrant’s adviser (not including any sub-adviser whose role is primarily portfolio management and is subcontracted with or overseen by another investment adviser), and any entity controlling, controlled by, or under common control with the investment adviser that provides ongoing services to the registrant that were not pre-approved pursuant to
paragraph (c)(7)(ii) of Rule 2-01 of Regulation S-X, is compatible with maintaining the principal accountant’s independence.
Item 5. Audit Committee of Listed Registrants.
Not applicable.
Item 6. Investments
(a) The registrant’s “Schedule I — Investments in securities of unaffiliated issuers” (as set forth in 17 CFR 210.12-12) is included in Item 1 of this Form N-CSR.
(b) Not applicable.
Item 7. Disclosure of Proxy Voting Policies and Procedures for Closed-End Management Investment Companies.
Not applicable.
Item 8. Portfolio Managers of Closed-End Management Investment Companies.
Not applicable.
Item 9. Purchases of Equity Securities by Closed-End Management Investment Company and Affiliated Purchasers.
Not applicable.
Item 10. Submission of Matters to a Vote of Security Holders.
There were no material changes to the procedures by which shareholders may recommend nominees to the registrant’s board of directors.
Item 11. Controls and Procedures.
(a) The registrant’s principal executive officer and principal financial officers, based on their evaluation of the registrant’s disclosure controls and procedures as of a date within 90 days of the filing of this report, have concluded that such controls and procedures are adequately designed to ensure that material information required to be disclosed by the registrant in Form N-CSR is accumulated and communicated to the registrant’s management, including the principal executive officer and principal financial officer, or persons performing similar functions, as appropriate to allow timely decisions regarding required disclosure.
(b) There was no change in the registrant’s internal control over financial reporting that occurred during the registrant’s second fiscal quarter of the period covered by
this report that has materially affected, or is reasonably likely to materially affect, the registrant’s internal control over financial reporting.
Item 12. Exhibits.
(a)(1) Code of ethics required to be disclosed under Item 2 of Form N-CSR attached hereto as Exhibit 99.CODE ETH.
(a)(2) Certifications pursuant to Rule 30a-2(a) under the Investment Company Act of 1940 (17 CFR 270.30a-2(a)) attached hereto as Exhibit 99.CERT.
(a)(3) Not applicable.
(b) Certification pursuant to Rule 30a-2(b) under the Investment Company Act of 1940 (17 CFR 270.30a-2(b)) attached hereto as Exhibit 99.906CERT.
SIGNATURES
Pursuant to the requirements of the Securities Exchange Act of 1934 and the Investment Company Act of 1940, the registrant has duly caused this report to be signed on its behalf by the undersigned, thereunto duly authorized.
(registrant) | | Columbia Funds Series Trust I | |
| | | |
| | | |
By (Signature and Title) | | /s/ Christopher O. Petersen | |
| Christopher O. Petersen, President and Principal Executive Officer | |
| | | |
| | | |
Date | | October 26, 2015 | |
| | | | | |
Pursuant to the requirements of the Securities Exchange Act of 1934 and the Investment Company Act of 1940, this report has been signed below by the following persons on behalf of the registrant and in the capacities and on the dates indicated.
By (Signature and Title) | | /s/ Christopher O. Petersen | |
| Christopher O. Petersen, President and Principal Executive Officer | |
| | | |
| | | |
Date | | October 26, 2015 | |
| | |
| | |
By (Signature and Title) | | /s/ Michael G. Clarke | |
| | Michael G. Clarke, Treasurer and Chief Financial Officer | |
| | |
| | |
Date | | October 26, 2015 | |
| | | | | |