UNITED STATES
SECURITIES AND EXCHANGE COMMISSION
Washington, D.C. 20549
FORM N-CSR
CERTIFIED SHAREHOLDER REPORT OF REGISTERED MANAGEMENT INVESTMENT COMPANIES
Investment Company Act file number 811-04367
Columbia Funds Series Trust I
(Exact name of registrant as specified in charter)
290 Congress Street
Boston, MA 02210
(Address of principal executive offices) (Zip code)
Daniel J. Beckman
c/o Columbia Management Investment Advisers, LLC
290 Congress Street
Boston, MA 02210
Ryan C. Larrenaga, Esq.
c/o Columbia Management Investment Advisers, LLC
290 Congress Street
Boston, MA 02210
(Name and address of agent for service)
Registrant's telephone number, including area code: (800) 345-6611
Date of fiscal year end: March 31
Date of reporting period: March 31, 2023
Form N-CSR is to be used by management investment companies to file reports with the Commission not later than 10 days after the transmission to stockholders of any report that is required to be transmitted to stockholders under Rule 30e-1 under the Investment Company Act of 1940 (17 CFR 270.30e-1). The Commission may use the information provided on Form N-CSR in its regulatory, disclosure review, inspection, and policymaking roles.
A registrant is required to disclose the information specified by Form N-CSR, and the Commission will make this information public. A registrant is not required to respond to the collection of information contained in Form N-CSR unless the Form displays a currently valid Office of Management and Budget ("OMB") control number. Please direct comments concerning the accuracy of the information collection burden estimate and any suggestions for reducing the burden to Secretary, Securities and Exchange Commission, 100 F Street, NE, Washington, DC 20549. The OMB has reviewed this collection of information under the clearance requirements of 44 U.S.C. § 3507.
Item 1. Reports to Stockholders.

Annual Report
March 31, 2023
Columbia Select Large Cap Growth Fund
Not FDIC or NCUA Insured • No Financial Institution Guarantee • May Lose Value
If you elect to receive the shareholder report for Columbia Select Large Cap Growth Fund (the Fund) in paper, mailed to you, the Fund mails one shareholder report to each shareholder address, unless such shareholder elects to receive shareholder reports from the Fund electronically via e-mail or by having a paper notice mailed to you (Postcard Notice) that your Fund’s shareholder report is available at the Columbia funds’ website (columbiathreadneedleus.com/investor/). If you would like more than one report in paper to be mailed to you, or would like to elect to receive reports via e-mail or access them through Postcard Notice, please call shareholder services at 800.345.6611 and additional reports will be sent to you.
Proxy voting policies and procedures
The policy of the Board of Trustees is to vote the proxies of the companies in which the Fund holds investments consistent with the procedures as stated in the Statement of Additional Information (SAI). You may obtain a copy of the SAI without charge by calling 800.345.6611; contacting your financial intermediary; visiting columbiathreadneedleus.com/investor/; or searching the website of the Securities and Exchange Commission (SEC) at sec.gov. Information regarding how the Fund voted proxies relating to portfolio securities is filed with the SEC by August 31st for the most recent 12-month period ending June 30th of that year, and is available without charge by visiting columbiathreadneedleus.com/investor/, or searching the website of the SEC at sec.gov.
Quarterly schedule of investments
The Fund files a complete schedule of portfolio holdings with the SEC for the first and third quarters of each fiscal year on Form N-PORT. The Fund’s Form N-PORT filings are available on the SEC’s website at sec.gov. The Fund’s complete schedule of portfolio holdings, as filed on Form N-PORT, is available on columbiathreadneedleus.com/investor/ or can also be obtained without charge, upon request, by calling 800.345.6611.
Additional Fund information
For more information about the Fund, please visit columbiathreadneedleus.com/investor/ or call 800.345.6611. Customer Service Representatives are available to answer your questions Monday through Friday from 8 a.m. to 7 p.m. Eastern time.
Fund investment manager
Columbia Management Investment Advisers, LLC (the Investment Manager)
290 Congress Street
Boston, MA 02210
Fund distributor
Columbia Management Investment Distributors, Inc.
290 Congress Street
Boston, MA 02210
Fund transfer agent
Columbia Management Investment Services Corp.
P.O. Box 219104
Kansas City, MO 64121-9104
Columbia Select Large Cap Growth Fund | Annual Report 2023
Fund at a Glance
(Unaudited)
Investment objective
The Fund seeks long-term capital appreciation.
Portfolio management
Thomas Galvin, CFA
Lead Portfolio Manager
Managed Fund since 2003
Richard Carter
Portfolio Manager
Managed Fund since 2009
Todd Herget
Portfolio Manager
Managed Fund since 2009
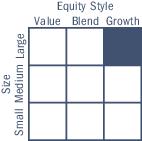
Morningstar style boxTM
The Morningstar Style Box is based on a fund’s portfolio holdings. For equity funds, the vertical axis shows the market capitalization of the stocks owned, and the horizontal axis shows investment style (value, blend, or growth). Information shown is based on the most recent data provided by Morningstar.
© 2023 Morningstar, Inc. All rights reserved. The Morningstar information contained herein: (1) is proprietary to Morningstar and/or its content providers; (2) may not be copied or distributed; and (3) is not warranted to be accurate, complete or timely. Neither Morningstar nor its content providers are responsible for any damages or losses arising from any use of this information.
| Average annual total returns (%) (for the period ended March 31, 2023) |
| | | Inception | 1 Year | 5 Years | 10 Years | |
| Class A | Excluding sales charges | 09/28/07 | -10.01 | 8.91 | 11.62 | |
| | Including sales charges | | -15.18 | 7.63 | 10.96 | |
| Advisor Class | 11/08/12 | -9.72 | 9.18 | 11.89 | |
| Class C | Excluding sales charges | 09/28/07 | -10.67 | 8.09 | 10.79 | |
| | Including sales charges | | -11.35 | 8.09 | 10.79 | |
| Institutional Class | 10/01/97 | -9.67 | 9.20 | 11.90 | |
| Institutional 2 Class | 11/08/12 | -9.61 | 9.31 | 12.03 | |
| Institutional 3 Class | 11/08/12 | -9.59 | 9.35 | 12.07 | |
| Class R | 12/31/04 | -10.19 | 8.65 | 11.34 | |
| Russell 1000 Growth Index | | -10.90 | 13.66 | 14.59 | |
Returns for Class A shares are shown with and without the maximum initial sales charge of 5.75%. Returns for Class C shares are shown with and without the 1.00% contingent deferred sales charge for the first year only. The Fund’s other share classes are not subject to sales charges and have limited eligibility. Please see the Fund’s prospectus for details. Performance for different share classes will vary based on differences in sales charges and fees associated with each share class. All results shown assume reinvestment of distributions during the period. Returns do not reflect the deduction of taxes that a shareholder may pay on Fund distributions or on the redemption of Fund shares. Performance results reflect the effect of any fee waivers or reimbursements of Fund expenses by Columbia Management Investment Advisers, LLC and/or any of its affiliates. Absent these fee waivers or expense reimbursement arrangements, performance results would have been lower.
The performance information shown represents past performance and is not a guarantee of future results. The investment return and principal value of your investment will fluctuate so that your shares, when redeemed, may be worth more or less than their original cost. Current performance may be lower or higher than the performance information shown. You may obtain performance information current to the most recent month-end by contacting your financial intermediary, visiting columbiathreadneedleus.com/investor/ or calling 800.345.6611.
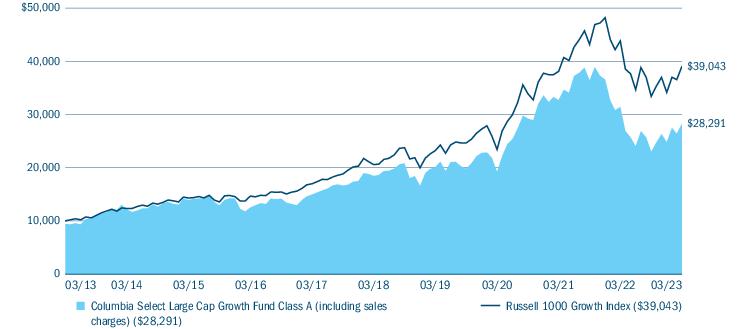
The Russell 1000 Growth Index, an unmanaged index, measures the performance of those Russell 1000 Index companies with higher price-to-book ratios and higher forecasted growth values.
Indices are not available for investment, are not professionally managed and do not reflect sales charges, fees, brokerage commissions, taxes or other expenses of investing. Securities in the Fund may not match those in an index.
Columbia Select Large Cap Growth Fund | Annual Report 2023
| 3 |
Fund at a Glance (continued)
(Unaudited)
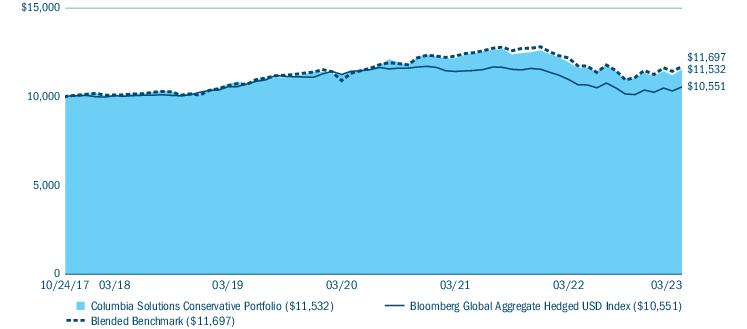
Performance of a hypothetical $10,000 investment (March 31, 2013 — March 31, 2023)
The chart above shows the change in value of a hypothetical $10,000 investment in Class A shares of Columbia Select Large Cap Growth Fund during the stated time period, and does not reflect the deduction of taxes that a shareholder may pay on Fund distributions or on the redemption of Fund shares.
| Portfolio breakdown (%) (at March 31, 2023) |
| Common Stocks | 99.4 |
| Money Market Funds | 0.6 |
| Total | 100.0 |
Percentages indicated are based upon total investments excluding investments in derivatives, if any. The Fund’s portfolio composition is subject to change.
| Equity sector breakdown (%) (at March 31, 2023) |
| Communication Services | 1.8 |
| Consumer Discretionary | 18.0 |
| Consumer Staples | 7.4 |
| Financials | 8.0 |
| Health Care | 24.7 |
| Industrials | 10.0 |
| Information Technology | 30.1 |
| Total | 100.0 |
Percentages indicated are based upon total equity investments. The Fund’s portfolio composition is subject to change.
| 4 | Columbia Select Large Cap Growth Fund | Annual Report 2023 |
Manager Discussion of Fund Performance
(Unaudited)
For the 12-month period that ended March 31, 2023, Class A shares of Columbia Select Large Cap Growth Fund returned -10.01% excluding sales charges. The Fund outperformed its benchmark, the Russell 1000 Growth Index, which returned -10.90% for the same time period.
Market overview
Driven by a series of interest rate hikes by the U.S. Federal Reserve (Fed), decades-high inflation, persistent recession worries, climbing U.S. Treasury yields, supply-chain disruptions, volatile commodity prices, geopolitical tensions resulting from the Russian invasion of Ukraine, and elevated concerns around China’s zero-COVID policy, the U.S. equity market, as measured by the S&P 500 Index, posted negative returns during the annual period ended March 31, 2023. On slowing yet relatively resilient corporate earnings reports, a still-tight U.S. labor market, an economic reopening in China, hopes that Fed interest rate hikes would be smaller and soon pause, and warming notions of a soft economic landing, there were brief respites of equity market rallies, such as those in July into early August 2022, in October and November 2022, and then in January 2023. However, as the realization that interest rates could remain higher for longer set in with investors even as inflation decreased, albeit from high levels, stocks ticked lower again in February 2023. March brought new concerns as regulators shut down tech-focused Silicon Valley Bank and crypto-focused Signature Bank following runs on their deposits. In the days following, several banks, including First Republic and Credit Suisse, were rescued by competitors. At the March Federal Open Market Committee meeting, the Fed raised the federal funds rate by 0.25% to a range of 4.75-5.00%, but also suggested future rate increases this year may be limited. With the Fed taking a less hawkish tone and global banking jitters easing, U.S. equities climbed in March.
The Fund’s notable contributors during the period
| • | The Fund benefited most, relative to the benchmark, from its security selection within the consumer discretionary sector. |
| • | Security selection, along with overweight positioning in, the industrials and health care sectors, also contributed to the Fund’s relative performance during the period. |
| • | An overweighted allocation to the financials sector also aided relative performance during the period. |
| • | Top individual holdings that contributed to performance during the period included biotechnology company BioMarin Pharmaceutical, Inc., heating and cooling manufacturer Trane Technologies PLC, online travel and restaurant reservation company Booking Holdings, Inc., investment data services provider MSCI, Inc. and manufacturer of insulin delivery systems Insulet Corp. |
The Fund’s notable detractors during the period
| • | The information technology sector was the area of largest detraction for the Fund, relative to the benchmark, during the period, due to a combination of security selection and allocation. |
| • | Security selection within the communication services and consumer staples sectors also weighed on relative results. |
| • | Holdings that detracted most from performance, relative to the benchmark, included online dating app provider Match Group, Inc., orthodontic products manufacturer Align Technology, Inc., cloud-based cybersecurity provider Crowdstrike Holdings, Inc., medical devices company Edwards Lifesciences Corp. and cloud-based communications company RingCentral, Inc. The Fund’s holdings in Align Technology and RingCentral were sold during the period. |
Market risk may affect a single issuer, sector of the economy, industry or the market as a whole. Growth securities, at times, may not perform as well as value securities or the stock market in general and may be out of favor with investors. Foreign investments subject the Fund to risks, including political, economic, market, social and others within a particular country, as well as to currency instabilities and less stringent financial and accounting standards generally applicable to U.S. issuers. Investments in a limited number of companies or sectors subject the Fund to greater risk of loss. The Fund may invest significantly in issuers within a particular sector, which may be negatively affected by market, economic or other conditions, making the Fund more vulnerable to unfavorable developments in the sector. See the Fund’s prospectus for more information on these and other risks.
The views expressed in this report reflect the current views of the respective parties who have contributed to this report. These views are not guarantees of future performance and involve certain risks, uncertainties and assumptions that are difficult to predict, so actual outcomes and results may differ significantly from the views expressed. These views are subject to change at any time based upon economic, market or other conditions and the respective
Columbia Select Large Cap Growth Fund | Annual Report 2023
| 5 |
Manager Discussion of Fund Performance (continued)
(Unaudited)
parties disclaim any responsibility to update such views. These views may not be relied on as investment advice and, because investment decisions for a Columbia fund are based on numerous factors, may not be relied on as an indication of trading intent on behalf of any particular Columbia fund. References to specific securities should not be construed as a recommendation or investment advice.
| 6 | Columbia Select Large Cap Growth Fund | Annual Report 2023 |
Understanding Your Fund’s Expenses
(Unaudited)
As an investor, you incur two types of costs. There are shareholder transaction costs, which generally include sales charges on purchases and may include redemption fees. There are also ongoing fund costs, which generally include management fees, distribution and/or service fees, and other fund expenses. The following information is intended to help you understand your ongoing costs (in dollars) of investing in the Fund and to help you compare these costs with the ongoing costs of investing in other mutual funds.
Analyzing your Fund’s expenses
To illustrate these ongoing costs, we have provided examples and calculated the expenses paid by investors in each share class of the Fund during the period. The actual and hypothetical information in the table is based on an initial investment of $1,000 at the beginning of the period indicated and held for the entire period. Expense information is calculated two ways and each method provides you with different information. The amount listed in the “Actual” column is calculated using the Fund’s actual operating expenses and total return for the period. You may use the Actual information, together with the amount invested, to estimate the expenses that you paid over the period. Simply divide your account value by $1,000 (for example, an $8,600 account value divided by $1,000 = 8.6), then multiply the results by the expenses paid during the period under the “Actual” column. The amount listed in the “Hypothetical” column assumes a 5% annual rate of return before expenses (which is not the Fund’s actual return) and then applies the Fund’s actual expense ratio for the period to the hypothetical return. You should not use the hypothetical account values and expenses to estimate either your actual account balance at the end of the period or the expenses you paid during the period. See “Compare with other funds” below for details on how to use the hypothetical data.
Compare with other funds
Since all mutual funds are required to include the same hypothetical calculations about expenses in shareholder reports, you can use this information to compare the ongoing cost of investing in the Fund with other funds. To do so, compare the hypothetical example with the 5% hypothetical examples that appear in the shareholder reports of other funds. As you compare hypothetical examples of other funds, it is important to note that hypothetical examples are meant to highlight the ongoing costs of investing in a fund only and do not reflect any transaction costs, such as sales charges, or redemption or exchange fees. Therefore, the hypothetical calculations are useful in comparing ongoing costs only, and will not help you determine the relative total costs of owning different funds. If transaction costs were included in these calculations, your costs would be higher.
| October 1, 2022 — March 31, 2023 |
| | Account value at the
beginning of the
period ($) | Account value at the
end of the
period ($) | Expenses paid during
the period ($) | Fund’s annualized
expense ratio (%) |
| | Actual | Hypothetical | Actual | Hypothetical | Actual | Hypothetical | Actual |
| Class A | 1,000.00 | 1,000.00 | 1,229.80 | 1,019.70 | 5.84 | 5.29 | 1.05 |
| Advisor Class | 1,000.00 | 1,000.00 | 1,231.00 | 1,020.94 | 4.45 | 4.03 | 0.80 |
| Class C | 1,000.00 | 1,000.00 | 1,224.90 | 1,015.96 | 9.98 | 9.05 | 1.80 |
| Institutional Class | 1,000.00 | 1,000.00 | 1,232.20 | 1,020.94 | 4.45 | 4.03 | 0.80 |
| Institutional 2 Class | 1,000.00 | 1,000.00 | 1,232.70 | 1,021.39 | 3.95 | 3.58 | 0.71 |
| Institutional 3 Class | 1,000.00 | 1,000.00 | 1,231.40 | 1,021.64 | 3.67 | 3.33 | 0.66 |
| Class R | 1,000.00 | 1,000.00 | 1,228.00 | 1,018.45 | 7.22 | 6.54 | 1.30 |
Expenses paid during the period are equal to the annualized expense ratio for each class as indicated above, multiplied by the average account value over the period and then multiplied by the number of days in the Fund’s most recent fiscal half year and divided by 365.
Expenses do not include fees and expenses incurred indirectly by the Fund from its investment in underlying funds, including affiliated and non-affiliated pooled investment vehicles, such as mutual funds and exchange-traded funds.
Had Columbia Management Investment Advisers, LLC and/or certain of its affiliates not waived/reimbursed certain fees and expenses, account value at the end of the period would have been reduced.
Columbia Select Large Cap Growth Fund | Annual Report 2023
| 7 |
Portfolio of Investments
March 31, 2023
(Percentages represent value of investments compared to net assets)
Investments in securities
| Common Stocks 99.5% |
| Issuer | Shares | Value ($) |
| Communication Services 1.8% |
| Interactive Media & Services 1.8% |
| Match Group, Inc.(a) | 513,910 | 19,729,005 |
| Total Communication Services | 19,729,005 |
| Consumer Discretionary 18.0% |
| Auto Components 1.4% |
| Aptiv PLC(a) | 143,490 | 16,098,143 |
| Broadline Retail 4.0% |
| Amazon.com, Inc.(a) | 431,078 | 44,526,047 |
| Hotels, Restaurants & Leisure 6.5% |
| Booking Holdings, Inc.(a) | 14,336 | 38,024,950 |
| Chipotle Mexican Grill, Inc.(a) | 19,981 | 34,133,342 |
| Total | | 72,158,292 |
| Textiles, Apparel & Luxury Goods 6.1% |
| lululemon athletica, Inc.(a) | 65,499 | 23,854,081 |
| NIKE, Inc., Class B | 362,713 | 44,483,122 |
| Total | | 68,337,203 |
| Total Consumer Discretionary | 201,119,685 |
| Consumer Staples 7.3% |
| Consumer Staples Distribution & Retail 3.5% |
| Costco Wholesale Corp. | 80,154 | 39,826,118 |
| Personal Care Products 3.8% |
| Estee Lauder Companies, Inc. (The), Class A | 170,964 | 42,135,787 |
| Total Consumer Staples | 81,961,905 |
| Financials 8.0% |
| Capital Markets 3.8% |
| MSCI, Inc. | 77,005 | 43,098,928 |
| Financial Services 4.2% |
| Visa, Inc., Class A | 206,312 | 46,515,104 |
| Total Financials | 89,614,032 |
| Common Stocks (continued) |
| Issuer | Shares | Value ($) |
| Health Care 24.6% |
| Biotechnology 7.5% |
| BioMarin Pharmaceutical, Inc.(a) | 393,292 | 38,243,714 |
| Exact Sciences Corp.(a) | 452,363 | 30,674,735 |
| Sarepta Therapeutics, Inc.(a) | 112,025 | 15,440,406 |
| Total | | 84,358,855 |
| Health Care Equipment & Supplies 11.1% |
| Edwards Lifesciences Corp.(a) | 458,847 | 37,960,412 |
| Insulet Corp.(a) | 141,916 | 45,265,527 |
| Intuitive Surgical, Inc.(a) | 161,286 | 41,203,735 |
| Total | | 124,429,674 |
| Life Sciences Tools & Services 2.5% |
| Illumina, Inc.(a) | 119,183 | 27,716,007 |
| Pharmaceuticals 3.5% |
| Eli Lilly & Co. | 114,432 | 39,298,237 |
| Total Health Care | 275,802,773 |
| Industrials 9.9% |
| Building Products 2.6% |
| Trane Technologies PLC | 157,259 | 28,932,511 |
| Construction & Engineering 2.6% |
| Quanta Services, Inc. | 176,282 | 29,375,632 |
| Electrical Equipment 1.2% |
| Bloom Energy Corp., Class A(a) | 707,984 | 14,110,121 |
| Professional Services 3.5% |
| CoStar Group, Inc.(a) | 566,406 | 38,997,053 |
| Total Industrials | 111,415,317 |
| Information Technology 29.9% |
| Semiconductors & Semiconductor Equipment 6.9% |
| Advanced Micro Devices, Inc.(a) | 200,150 | 19,616,701 |
| Applied Materials, Inc. | 51,408 | 6,314,445 |
| NVIDIA Corp. | 185,065 | 51,405,505 |
| Total | | 77,336,651 |
The accompanying Notes to Financial Statements are an integral part of this statement.
| 8 | Columbia Select Large Cap Growth Fund | Annual Report 2023 |
Portfolio of Investments (continued)
March 31, 2023
| Common Stocks (continued) |
| Issuer | Shares | Value ($) |
| Software 23.0% |
| Adobe, Inc.(a) | 118,585 | 45,699,102 |
| Crowdstrike Holdings, Inc., Class A(a) | 197,777 | 27,146,871 |
| Intuit, Inc. | 107,587 | 47,965,512 |
| Microsoft Corp. | 170,371 | 49,117,960 |
| Palo Alto Networks, Inc.(a) | 194,126 | 38,774,727 |
| ServiceNow, Inc.(a) | 105,099 | 48,841,607 |
| Total | | 257,545,779 |
| Total Information Technology | 334,882,430 |
Total Common Stocks
(Cost $642,924,108) | 1,114,525,147 |
|
| Money Market Funds 0.6% |
| | Shares | Value ($) |
| Columbia Short-Term Cash Fund, 4.983%(b),(c) | 6,435,192 | 6,433,905 |
Total Money Market Funds
(Cost $6,432,841) | 6,433,905 |
Total Investments in Securities
(Cost: $649,356,949) | 1,120,959,052 |
| Other Assets & Liabilities, Net | | (806,823) |
| Net Assets | 1,120,152,229 |
Notes to Portfolio of Investments
| (a) | Non-income producing investment. |
| (b) | The rate shown is the seven-day current annualized yield at March 31, 2023. |
| (c) | As defined in the Investment Company Act of 1940, as amended, an affiliated company is one in which the Fund owns 5% or more of the company’s outstanding voting securities, or a company which is under common ownership or control with the Fund. The value of the holdings and transactions in these affiliated companies during the year ended March 31, 2023 are as follows: |
| Affiliated issuers | Beginning
of period($) | Purchases($) | Sales($) | Net change in
unrealized
appreciation
(depreciation)($) | End of
period($) | Realized gain
(loss)($) | Dividends($) | End of
period shares |
| Columbia Short-Term Cash Fund, 4.983% |
| | 6,975,429 | 375,685,873 | (376,228,455) | 1,058 | 6,433,905 | (726) | 288,708 | 6,435,192 |
Fair value measurements
The Fund categorizes its fair value measurements according to a three-level hierarchy that maximizes the use of observable inputs and minimizes the use of unobservable inputs by prioritizing that the most observable input be used when available. Observable inputs are those that market participants would use in pricing an investment based on market data obtained from sources independent of the reporting entity. Unobservable inputs are those that reflect the Fund’s assumptions about the information market participants would use in pricing an investment. An investment’s level within the fair value hierarchy is based on the lowest level of any input that is deemed significant to the asset’s or liability’s fair value measurement. The input levels are not necessarily an indication of the risk or liquidity associated with investments at that level. For example, certain U.S. government securities are generally high quality and liquid, however, they are reflected as Level 2 because the inputs used to determine fair value may not always be quoted prices in an active market.
Fair value inputs are summarized in the three broad levels listed below:
| ■ | Level 1 — Valuations based on quoted prices for investments in active markets that the Fund has the ability to access at the measurement date. Valuation adjustments are not applied to Level 1 investments. |
| ■ | Level 2 — Valuations based on other significant observable inputs (including quoted prices for similar securities, interest rates, prepayment speeds, credit risks, etc.). |
| ■ | Level 3 — Valuations based on significant unobservable inputs (including the Fund’s own assumptions and judgment in determining the fair value of investments). |
Inputs that are used in determining fair value of an investment may include price information, credit data, volatility statistics, and other factors. These inputs can be either observable or unobservable. The availability of observable inputs can vary between investments, and is affected by various factors such as the type of investment, and the volume and level of activity for that investment or similar investments in the marketplace. The inputs will be considered by the Investment Manager, along with any other relevant factors in the calculation of an investment’s fair value. The Fund uses prices and inputs that are current as of the measurement date, which may include periods of market dislocations. During these periods, the availability of prices and inputs may be reduced for many investments. This condition could cause an investment to be reclassified between the various levels within the hierarchy.
Investments falling into the Level 3 category are primarily supported by quoted prices from brokers and dealers participating in the market for those investments. However, these may be classified as Level 3 investments due to lack of market transparency and corroboration to support these quoted prices. Additionally, valuation models may be used as the pricing source for any remaining investments classified as Level 3. These models may rely on one or more significant unobservable inputs and/or significant assumptions by the Investment Manager. Inputs used in valuations may include, but are not limited to, financial statement analysis, capital account balances, discount rates and estimated cash flows, and comparable company data.
The accompanying Notes to Financial Statements are an integral part of this statement.
Columbia Select Large Cap Growth Fund | Annual Report 2023
| 9 |
Portfolio of Investments (continued)
March 31, 2023
Fair value measurements (continued)
The Fund’s Board of Trustees (the Board) has designated the Investment Manager, through its Valuation Committee (the Committee), as valuation designee, responsible for determining the fair value of the assets of the Fund for which market quotations are not readily available using valuation procedures approved by the Board. The Committee consists of voting and non-voting members from various groups within the Investment Manager’s organization, including operations and accounting, trading and investments, compliance, risk management and legal.
The Committee meets at least monthly to review and approve valuation matters, which may include a description of specific valuation determinations, data regarding pricing information received from approved pricing vendors and brokers and the results of Board-approved valuation policies and procedures (the Policies). The Policies address, among other things, instances when market quotations are or are not readily available, including recommendations of third party pricing vendors and a determination of appropriate pricing methodologies; events that require specific valuation determinations and assessment of fair value techniques; securities with a potential for stale pricing, including those that are illiquid, restricted, or in default; and the effectiveness of third party pricing vendors, including periodic reviews of vendors. The Committee meets more frequently, as needed, to discuss additional valuation matters, which may include the need to review back-testing results, review time-sensitive information or approve related valuation actions. Representatives of Columbia Management Investment Advisers, LLC report to the Board at each of its regularly scheduled meetings to discuss valuation matters and actions during the period, similar to those described earlier.
The following table is a summary of the inputs used to value the Fund’s investments at March 31, 2023:
| | Level 1 ($) | Level 2 ($) | Level 3 ($) | Total ($) |
| Investments in Securities | | | | |
| Common Stocks | | | | |
| Communication Services | 19,729,005 | — | — | 19,729,005 |
| Consumer Discretionary | 201,119,685 | — | — | 201,119,685 |
| Consumer Staples | 81,961,905 | — | — | 81,961,905 |
| Financials | 89,614,032 | — | — | 89,614,032 |
| Health Care | 275,802,773 | — | — | 275,802,773 |
| Industrials | 111,415,317 | — | — | 111,415,317 |
| Information Technology | 334,882,430 | — | — | 334,882,430 |
| Total Common Stocks | 1,114,525,147 | — | — | 1,114,525,147 |
| Money Market Funds | 6,433,905 | — | — | 6,433,905 |
| Total Investments in Securities | 1,120,959,052 | — | — | 1,120,959,052 |
See the Portfolio of Investments for all investment classifications not indicated in the table.
The accompanying Notes to Financial Statements are an integral part of this statement.
| 10 | Columbia Select Large Cap Growth Fund | Annual Report 2023 |
Statement of Assets and Liabilities
March 31, 2023
| Assets | |
| Investments in securities, at value | |
| Unaffiliated issuers (cost $642,924,108) | $1,114,525,147 |
| Affiliated issuers (cost $6,432,841) | 6,433,905 |
| Cash | 6,842 |
| Receivable for: | |
| Capital shares sold | 647,482 |
| Dividends | 164,615 |
| Expense reimbursement due from Investment Manager | 3,916 |
| Prepaid expenses | 15,364 |
| Trustees’ deferred compensation plan | 411,223 |
| Total assets | 1,122,208,494 |
| Liabilities | |
| Payable for: | |
| Capital shares purchased | 1,388,187 |
| Management services fees | 22,297 |
| Distribution and/or service fees | 1,732 |
| Transfer agent fees | 145,187 |
| Compensation of board members | 31,000 |
| Other expenses | 56,639 |
| Trustees’ deferred compensation plan | 411,223 |
| Total liabilities | 2,056,265 |
| Net assets applicable to outstanding capital stock | $1,120,152,229 |
| Represented by | |
| Paid in capital | 599,872,255 |
| Total distributable earnings (loss) | 520,279,974 |
| Total - representing net assets applicable to outstanding capital stock | $1,120,152,229 |
The accompanying Notes to Financial Statements are an integral part of this statement.
Columbia Select Large Cap Growth Fund | Annual Report 2023
| 11 |
Statement of Assets and Liabilities (continued)
March 31, 2023
| Class A | |
| Net assets | $158,840,588 |
| Shares outstanding | 22,143,416 |
| Net asset value per share | $7.17 |
| Maximum sales charge | 5.75% |
| Maximum offering price per share (calculated by dividing the net asset value per share by 1.0 minus the maximum sales charge for Class A shares) | $7.61 |
| Advisor Class | |
| Net assets | $9,550,326 |
| Shares outstanding | 1,073,200 |
| Net asset value per share | $8.90 |
| Class C | |
| Net assets | $20,478,444 |
| Shares outstanding | 4,945,320 |
| Net asset value per share | $4.14 |
| Institutional Class | |
| Net assets | $680,663,194 |
| Shares outstanding | 83,829,003 |
| Net asset value per share | $8.12 |
| Institutional 2 Class | |
| Net assets | $88,679,957 |
| Shares outstanding | 9,737,980 |
| Net asset value per share | $9.11 |
| Institutional 3 Class | |
| Net assets | $154,171,055 |
| Shares outstanding | 16,360,161 |
| Net asset value per share | $9.42 |
| Class R | |
| Net assets | $7,768,665 |
| Shares outstanding | 1,428,015 |
| Net asset value per share | $5.44 |
The accompanying Notes to Financial Statements are an integral part of this statement.
| 12 | Columbia Select Large Cap Growth Fund | Annual Report 2023 |
Statement of Operations
Year Ended March 31, 2023
| Net investment income | |
| Income: | |
| Dividends — unaffiliated issuers | $4,074,286 |
| Dividends — affiliated issuers | 288,708 |
| Interfund lending | 145 |
| Total income | 4,363,139 |
| Expenses: | |
| Management services fees | 8,865,863 |
| Distribution and/or service fees | |
| Class A | 388,172 |
| Class C | 237,792 |
| Class R | 36,214 |
| Transfer agent fees | |
| Class A | 252,840 |
| Advisor Class | 20,797 |
| Class C | 38,639 |
| Institutional Class | 1,104,080 |
| Institutional 2 Class | 76,263 |
| Institutional 3 Class | 15,073 |
| Class R | 11,809 |
| Compensation of board members | 33,257 |
| Custodian fees | 8,120 |
| Printing and postage fees | 99,842 |
| Registration fees | 130,484 |
| Accounting services fees | 30,090 |
| Legal fees | 29,947 |
| Interest on interfund lending | 234 |
| Compensation of chief compliance officer | 206 |
| Other | 31,700 |
| Total expenses | 11,411,422 |
| Fees waived or expenses reimbursed by Investment Manager and its affiliates | (1,359,968) |
| Fees waived by transfer agent | |
| Institutional 2 Class | (3,580) |
| Institutional 3 Class | (5,838) |
| Expense reduction | (660) |
| Total net expenses | 10,041,376 |
| Net investment loss | (5,678,237) |
| Realized and unrealized gain (loss) — net | |
| Net realized gain (loss) on: | |
| Investments — unaffiliated issuers | 53,109,562 |
| Investments — affiliated issuers | (726) |
| Net realized gain | 53,108,836 |
| Net change in unrealized appreciation (depreciation) on: | |
| Investments — unaffiliated issuers | (246,446,103) |
| Investments — affiliated issuers | 1,058 |
| Net change in unrealized appreciation (depreciation) | (246,445,045) |
| Net realized and unrealized loss | (193,336,209) |
| Net decrease in net assets resulting from operations | $(199,014,446) |
The accompanying Notes to Financial Statements are an integral part of this statement.
Columbia Select Large Cap Growth Fund | Annual Report 2023
| 13 |
Statement of Changes in Net Assets
| | Year Ended
March 31, 2023 | Year Ended
March 31, 2022 |
| Operations | | |
| Net investment loss | $(5,678,237) | $(11,986,440) |
| Net realized gain | 53,108,836 | 391,699,775 |
| Net change in unrealized appreciation (depreciation) | (246,445,045) | (406,069,309) |
| Net decrease in net assets resulting from operations | (199,014,446) | (26,355,974) |
| Distributions to shareholders | | |
| Net investment income and net realized gains | | |
| Class A | (20,833,919) | (78,918,906) |
| Advisor Class | (1,533,659) | (5,028,694) |
| Class C | (5,334,510) | (22,203,505) |
| Institutional Class | (81,719,629) | (296,318,314) |
| Institutional 2 Class | (18,375,074) | (60,103,958) |
| Institutional 3 Class | (25,431,479) | (142,927,250) |
| Class R | (1,188,225) | (4,419,902) |
| Total distributions to shareholders | (154,416,495) | (609,920,529) |
| Increase (decrease) in net assets from capital stock activity | (208,345,130) | 196,206,640 |
| Total decrease in net assets | (561,776,071) | (440,069,863) |
| Net assets at beginning of year | 1,681,928,300 | 2,121,998,163 |
| Net assets at end of year | $1,120,152,229 | $1,681,928,300 |
The accompanying Notes to Financial Statements are an integral part of this statement.
| 14 | Columbia Select Large Cap Growth Fund | Annual Report 2023 |
Statement of Changes in Net Assets (continued)
| | Year Ended | Year Ended |
| | March 31, 2023 | March 31, 2022 |
| | Shares | Dollars ($) | Shares | Dollars ($) |
| Capital stock activity |
| Class A | | | | |
| Subscriptions | 3,357,425 | 22,303,218 | 4,408,568 | 53,070,071 |
| Distributions reinvested | 3,117,950 | 18,052,933 | 5,903,906 | 68,734,746 |
| Redemptions | (5,674,645) | (38,655,560) | (6,974,948) | (81,960,563) |
| Net increase | 800,730 | 1,700,591 | 3,337,526 | 39,844,254 |
| Advisor Class | | | | |
| Subscriptions | 299,458 | 2,437,018 | 810,379 | 10,528,998 |
| Distributions reinvested | 195,174 | 1,399,397 | 332,848 | 4,605,905 |
| Redemptions | (945,901) | (7,883,136) | (819,183) | (11,819,817) |
| Net increase (decrease) | (451,269) | (4,046,721) | 324,044 | 3,315,086 |
| Class C | | | | |
| Subscriptions | 772,782 | 3,029,175 | 631,043 | 5,136,991 |
| Distributions reinvested | 1,551,314 | 5,212,415 | 2,772,252 | 21,681,443 |
| Redemptions | (3,146,181) | (12,763,486) | (3,566,921) | (29,913,884) |
| Net decrease | (822,085) | (4,521,896) | (163,626) | (3,095,450) |
| Institutional Class | | | | |
| Subscriptions | 24,459,307 | 183,304,188 | 19,023,932 | 235,113,589 |
| Distributions reinvested | 11,390,689 | 74,495,107 | 20,576,626 | 263,755,395 |
| Redemptions | (36,797,775) | (280,958,674) | (23,407,683) | (306,619,566) |
| Net increase (decrease) | (947,779) | (23,159,379) | 16,192,875 | 192,249,418 |
| Institutional 2 Class | | | | |
| Subscriptions | 3,026,069 | 26,540,782 | 2,997,315 | 39,457,069 |
| Distributions reinvested | 2,505,349 | 18,364,209 | 4,271,244 | 60,086,113 |
| Redemptions | (13,095,935) | (111,098,657) | (3,273,010) | (46,922,281) |
| Net increase (decrease) | (7,564,517) | (66,193,666) | 3,995,549 | 52,620,901 |
| Institutional 3 Class | | | | |
| Subscriptions | 2,367,315 | 20,786,761 | 2,758,862 | 39,965,558 |
| Distributions reinvested | 895,294 | 6,786,325 | 1,870,089 | 27,028,771 |
| Redemptions | (15,932,180) | (140,729,914) | (11,226,988) | (157,002,278) |
| Net decrease | (12,669,571) | (113,156,828) | (6,598,037) | (90,007,949) |
| Class R | | | | |
| Subscriptions | 188,326 | 975,719 | 113,760 | 1,059,632 |
| Distributions reinvested | 270,051 | 1,188,224 | 467,350 | 4,419,902 |
| Redemptions | (213,969) | (1,131,174) | (443,850) | (4,199,154) |
| Net increase | 244,408 | 1,032,769 | 137,260 | 1,280,380 |
| Total net increase (decrease) | (21,410,083) | (208,345,130) | 17,225,591 | 196,206,640 |
The accompanying Notes to Financial Statements are an integral part of this statement.
Columbia Select Large Cap Growth Fund | Annual Report 2023
| 15 |
The following table is intended to help you understand the Fund’s financial performance. Certain information reflects financial results for a single share of a class held for the periods shown. Per share net investment income (loss) amounts are calculated based on average shares outstanding during the period. Total return assumes reinvestment of all dividends and distributions, if any. Total return does not reflect payment of sales charges, if any. Total return and portfolio turnover are not annualized for periods of less than one year. The ratios of expenses and net investment income are annualized for periods of less than one year. The portfolio turnover rate is calculated without regard to purchase and sales transactions of short-term instruments and certain derivatives, if any. If such transactions were included, the Fund’s portfolio turnover rate may be higher.
| | Net asset value,
beginning of
period | Net
investment
income
(loss) | Net
realized
and
unrealized
gain (loss) | Total from
investment
operations | Distributions
from net
realized
gains | Total
distributions to
shareholders |
| Class A |
| Year Ended 3/31/2023 | $9.36 | (0.05) | (1.13) | (1.18) | (1.01) | (1.01) |
| Year Ended 3/31/2022 | $13.58 | (0.10) | 0.11(e) | 0.01 | (4.23) | (4.23) |
| Year Ended 3/31/2021 | $10.37 | (0.09) | 6.94 | 6.85 | (3.64) | (3.64) |
| Year Ended 3/31/2020 | $15.01 | (0.09) | (0.20) | (0.29) | (4.35) | (4.35) |
| Year Ended 3/31/2019 | $16.93 | (0.11) | 1.34 | 1.23 | (3.15) | (3.15) |
| Advisor Class |
| Year Ended 3/31/2023 | $11.25 | (0.04) | (1.30) | (1.34) | (1.01) | (1.01) |
| Year Ended 3/31/2022 | $15.53 | (0.08) | 0.04(e) | (0.04) | (4.24) | (4.24) |
| Year Ended 3/31/2021 | $11.50 | (0.06) | 7.76 | 7.70 | (3.67) | (3.67) |
| Year Ended 3/31/2020 | $16.16 | (0.07) | (0.24) | (0.31) | (4.35) | (4.35) |
| Year Ended 3/31/2019 | $17.96 | (0.07) | 1.43 | 1.36 | (3.16) | (3.16) |
| Class C |
| Year Ended 3/31/2023 | $6.03 | (0.06) | (0.82) | (0.88) | (1.01) | (1.01) |
| Year Ended 3/31/2022 | $10.15 | (0.13) | 0.21(e) | 0.08 | (4.20) | (4.20) |
| Year Ended 3/31/2021 | $8.37 | (0.15) | 5.52 | 5.37 | (3.59) | (3.59) |
| Year Ended 3/31/2020 | $13.00 | (0.16) | (0.12) | (0.28) | (4.35) | (4.35) |
| Year Ended 3/31/2019 | $15.16 | (0.20) | 1.16 | 0.96 | (3.12) | (3.12) |
| Institutional Class |
| Year Ended 3/31/2023 | $10.38 | (0.03) | (1.22) | (1.25) | (1.01) | (1.01) |
| Year Ended 3/31/2022 | $14.63 | (0.07) | 0.06(e) | (0.01) | (4.24) | (4.24) |
| Year Ended 3/31/2021 | $10.97 | (0.06) | 7.39 | 7.33 | (3.67) | (3.67) |
| Year Ended 3/31/2020 | $15.61 | (0.06) | (0.23) | (0.29) | (4.35) | (4.35) |
| Year Ended 3/31/2019 | $17.45 | (0.07) | 1.39 | 1.32 | (3.16) | (3.16) |
| Institutional 2 Class |
| Year Ended 3/31/2023 | $11.47 | (0.03) | (1.32) | (1.35) | (1.01) | (1.01) |
| Year Ended 3/31/2022 | $15.75 | (0.07) | 0.04(e) | (0.03) | (4.25) | (4.25) |
| Year Ended 3/31/2021 | $11.62 | (0.04) | 7.85 | 7.81 | (3.68) | (3.68) |
| Year Ended 3/31/2020 | $16.27 | (0.05) | (0.25) | (0.30) | (4.35) | (4.35) |
| Year Ended 3/31/2019 | $18.05 | (0.06) | 1.45 | 1.39 | (3.17) | (3.17) |
The accompanying Notes to Financial Statements are an integral part of this statement.
| 16 | Columbia Select Large Cap Growth Fund | Annual Report 2023 |
Financial Highlights (continued)
| | Net
asset
value,
end of
period | Total
return | Total gross
expense
ratio to
average
net assets(a) | Total net
expense
ratio to
average
net assets(a),(b) | Net investment
income (loss)
ratio to
average
net assets | Portfolio
turnover | Net
assets,
end of
period
(000’s) |
| Class A |
| Year Ended 3/31/2023 | $7.17 | (10.01%) | 1.18%(c) | 1.06%(c),(d) | (0.69%) | 26% | $158,841 |
| Year Ended 3/31/2022 | $9.36 | (3.91%) | 1.10% | 1.06%(d) | (0.82%) | 32% | $199,667 |
| Year Ended 3/31/2021 | $13.58 | 70.22% | 1.11%(c) | 1.07%(c),(d) | (0.63%) | 31% | $244,546 |
| Year Ended 3/31/2020 | $10.37 | (4.31%) | 1.12%(c) | 1.12%(c),(d) | (0.71%) | 22% | $151,807 |
| Year Ended 3/31/2019 | $15.01 | 8.79% | 1.07%(c) | 1.07%(c),(d) | (0.67%) | 27% | $220,858 |
| Advisor Class |
| Year Ended 3/31/2023 | $8.90 | (9.72%) | 0.92%(c) | 0.81%(c),(d) | (0.45%) | 26% | $9,550 |
| Year Ended 3/31/2022 | $11.25 | (3.73%) | 0.85% | 0.81%(d) | (0.56%) | 32% | $17,145 |
| Year Ended 3/31/2021 | $15.53 | 70.74% | 0.86%(c) | 0.83%(c),(d) | (0.39%) | 31% | $18,638 |
| Year Ended 3/31/2020 | $11.50 | (4.10%) | 0.87%(c) | 0.87%(c),(d) | (0.46%) | 22% | $19,707 |
| Year Ended 3/31/2019 | $16.16 | 9.04% | 0.82%(c) | 0.82%(c),(d) | (0.42%) | 27% | $33,403 |
| Class C |
| Year Ended 3/31/2023 | $4.14 | (10.67%) | 1.92%(c) | 1.81%(c),(d) | (1.45%) | 26% | $20,478 |
| Year Ended 3/31/2022 | $6.03 | (4.66%) | 1.85% | 1.81%(d) | (1.56%) | 32% | $34,758 |
| Year Ended 3/31/2021 | $10.15 | 69.06% | 1.86%(c) | 1.83%(c),(d) | (1.39%) | 31% | $60,193 |
| Year Ended 3/31/2020 | $8.37 | (5.04%) | 1.88%(c) | 1.88%(c),(d) | (1.46%) | 22% | $55,584 |
| Year Ended 3/31/2019 | $13.00 | 7.93% | 1.83%(c) | 1.83%(c),(d) | (1.42%) | 27% | $90,268 |
| Institutional Class |
| Year Ended 3/31/2023 | $8.12 | (9.67%) | 0.93%(c) | 0.81%(c),(d) | (0.45%) | 26% | $680,663 |
| Year Ended 3/31/2022 | $10.38 | (3.77%) | 0.85% | 0.81%(d) | (0.56%) | 32% | $880,232 |
| Year Ended 3/31/2021 | $14.63 | 70.79% | 0.86%(c) | 0.83%(c),(d) | (0.39%) | 31% | $1,003,322 |
| Year Ended 3/31/2020 | $10.97 | (4.12%) | 0.87%(c) | 0.87%(c),(d) | (0.46%) | 22% | $744,099 |
| Year Ended 3/31/2019 | $15.61 | 9.08% | 0.83%(c) | 0.83%(c),(d) | (0.42%) | 27% | $1,311,174 |
| Institutional 2 Class |
| Year Ended 3/31/2023 | $9.11 | (9.61%) | 0.81%(c) | 0.72%(c) | (0.36%) | 26% | $88,680 |
| Year Ended 3/31/2022 | $11.47 | (3.65%) | 0.77% | 0.72% | (0.48%) | 32% | $198,407 |
| Year Ended 3/31/2021 | $15.75 | 71.00% | 0.77%(c) | 0.73%(c) | (0.29%) | 31% | $209,540 |
| Year Ended 3/31/2020 | $11.62 | (4.00%) | 0.77%(c) | 0.75%(c) | (0.34%) | 22% | $144,651 |
| Year Ended 3/31/2019 | $16.27 | 9.14% | 0.73%(c) | 0.72%(c) | (0.32%) | 27% | $166,669 |
The accompanying Notes to Financial Statements are an integral part of this statement.
Columbia Select Large Cap Growth Fund | Annual Report 2023
| 17 |
Financial Highlights (continued)
| | Net asset value,
beginning of
period | Net
investment
income
(loss) | Net
realized
and
unrealized
gain (loss) | Total from
investment
operations | Distributions
from net
realized
gains | Total
distributions to
shareholders |
| Institutional 3 Class |
| Year Ended 3/31/2023 | $11.81 | (0.03) | (1.35) | (1.38) | (1.01) | (1.01) |
| Year Ended 3/31/2022 | $16.10 | (0.06) | 0.02(e) | (0.04) | (4.25) | (4.25) |
| Year Ended 3/31/2021 | $11.83 | (0.04) | 8.00 | 7.96 | (3.69) | (3.69) |
| Year Ended 3/31/2020 | $16.48 | (0.04) | (0.26) | (0.30) | (4.35) | (4.35) |
| Year Ended 3/31/2019 | $18.23 | (0.05) | 1.47 | 1.42 | (3.17) | (3.17) |
| Class R |
| Year Ended 3/31/2023 | $7.45 | (0.05) | (0.95) | (1.00) | (1.01) | (1.01) |
| Year Ended 3/31/2022 | $11.61 | (0.11) | 0.17(e) | 0.06 | (4.22) | (4.22) |
| Year Ended 3/31/2021 | $9.21 | (0.10) | 6.12 | 6.02 | (3.62) | (3.62) |
| Year Ended 3/31/2020 | $13.83 | (0.11) | (0.16) | (0.27) | (4.35) | (4.35) |
| Year Ended 3/31/2019 | $15.87 | (0.14) | 1.24 | 1.10 | (3.14) | (3.14) |
| Notes to Financial Highlights |
| (a) | In addition to the fees and expenses that the Fund bears directly, the Fund indirectly bears a pro rata share of the fees and expenses of any other funds in which it invests. Such indirect expenses are not included in the Fund’s reported expense ratios. |
| (b) | Total net expenses include the impact of certain fee waivers/expense reimbursements made by the Investment Manager and certain of its affiliates, if applicable. |
| (c) | Ratios include interfund lending expense which is less than 0.01%. |
| (d) | The benefits derived from expense reductions had an impact of less than 0.01%. |
| (e) | Calculation of the net gain (loss) per share (both realized and unrealized) does not correlate to the aggregate realized and unrealized gain (loss) presented in the Statement of Operations due to the timing of subscriptions and redemptions of Fund shares in relation to fluctuations in the market value of the portfolio. |
The accompanying Notes to Financial Statements are an integral part of this statement.
| 18 | Columbia Select Large Cap Growth Fund | Annual Report 2023 |
Financial Highlights (continued)
| | Net
asset
value,
end of
period | Total
return | Total gross
expense
ratio to
average
net assets(a) | Total net
expense
ratio to
average
net assets(a),(b) | Net investment
income (loss)
ratio to
average
net assets | Portfolio
turnover | Net
assets,
end of
period
(000’s) |
| Institutional 3 Class |
| Year Ended 3/31/2023 | $9.42 | (9.59%) | 0.77%(c) | 0.67%(c) | (0.31%) | 26% | $154,171 |
| Year Ended 3/31/2022 | $11.81 | (3.63%) | 0.72% | 0.67% | (0.43%) | 32% | $342,904 |
| Year Ended 3/31/2021 | $16.10 | 70.96% | 0.72%(c) | 0.69%(c) | (0.24%) | 31% | $573,613 |
| Year Ended 3/31/2020 | $11.83 | (3.93%) | 0.72%(c) | 0.71%(c) | (0.30%) | 22% | $550,287 |
| Year Ended 3/31/2019 | $16.48 | 9.24% | 0.69%(c) | 0.68%(c) | (0.27%) | 27% | $835,068 |
| Class R |
| Year Ended 3/31/2023 | $5.44 | (10.19%) | 1.43%(c) | 1.31%(c),(d) | (0.94%) | 26% | $7,769 |
| Year Ended 3/31/2022 | $7.45 | (4.20%) | 1.35% | 1.31%(d) | (1.06%) | 32% | $8,814 |
| Year Ended 3/31/2021 | $11.61 | 69.94% | 1.36%(c) | 1.32%(c),(d) | (0.88%) | 31% | $12,146 |
| Year Ended 3/31/2020 | $9.21 | (4.59%) | 1.38%(c) | 1.38%(c),(d) | (0.97%) | 22% | $8,892 |
| Year Ended 3/31/2019 | $13.83 | 8.53% | 1.33%(c) | 1.33%(c),(d) | (0.92%) | 27% | $9,830 |
The accompanying Notes to Financial Statements are an integral part of this statement.
Columbia Select Large Cap Growth Fund | Annual Report 2023
| 19 |
Notes to Financial Statements
March 31, 2023
Note 1. Organization
Columbia Select Large Cap Growth Fund (the Fund), a series of Columbia Funds Series Trust I (the Trust), is a diversified fund. The Trust is registered under the Investment Company Act of 1940, as amended (the 1940 Act), as an open-end management investment company organized as a Massachusetts business trust.
Fund shares
The Trust may issue an unlimited number of shares (without par value). The Fund offers each of the share classes listed in the Statement of Assets and Liabilities. Although all share classes generally have identical voting, dividend and liquidation rights, each share class votes separately when required by the Trust’s organizational documents or by law. Each share class has its own expense and sales charge structure. Different share classes may have different minimum initial investment amounts and pay different net investment income distribution amounts to the extent the expenses of distributing such share classes vary. Distributions to shareholders in a liquidation will be proportional to the net asset value of each share class.
As described in the Fund’s prospectus, Class A and Class C shares are offered to the general public for investment. Class C shares automatically convert to Class A shares after 8 years. Advisor Class, Institutional Class, Institutional 2 Class, Institutional 3 Class and Class R shares are available for purchase through authorized investment professionals to omnibus retirement plans or to institutional investors and to certain other investors as also described in the Fund’s prospectus.
Note 2. Summary of significant accounting policies
Basis of preparation
The Fund is an investment company that applies the accounting and reporting guidance in the Financial Accounting Standards Board (FASB) Accounting Standards Codification Topic 946, Financial Services - Investment Companies (ASC 946). The financial statements are prepared in accordance with U.S. generally accepted accounting principles (GAAP), which requires management to make certain estimates and assumptions that affect the reported amounts of assets and liabilities, the disclosure of contingent assets and liabilities at the date of the financial statements and the reported amounts of income and expenses during the reporting period. Actual results could differ from those estimates.
The following is a summary of significant accounting policies followed by the Fund in the preparation of its financial statements.
Security valuation
Equity securities listed on an exchange are valued at the closing price or last trade price on their primary exchange at the close of business of the New York Stock Exchange. Securities with a closing price not readily available or not listed on any exchange are valued at the mean between the closing bid and ask prices. Listed preferred stocks convertible into common stocks are valued using an evaluated price from a pricing service.
Foreign equity securities are valued based on the closing price or last trade price on their primary exchange at the close of business of the New York Stock Exchange. If any foreign equity security closing prices are not readily available, the securities are valued at the mean of the latest quoted bid and ask prices on such exchanges or markets. Foreign currency exchange rates are determined at the scheduled closing time of the New York Stock Exchange. Many securities markets and exchanges outside the U.S. close prior to the close of the New York Stock Exchange; therefore, the closing prices for securities in such markets or on such exchanges may not fully reflect events that occur after such close but before the close of the New York Stock Exchange. In those situations, foreign securities will be fair valued pursuant to a policy approved by the Board of Trustees. Under the policy, the Fund may utilize a third-party pricing service to determine these fair values. The third-party pricing service takes into account multiple factors, including, but not limited to, movements in the U.S. securities markets, certain depositary receipts, futures contracts and foreign exchange rates that have occurred subsequent to the close of the foreign exchange or market, to determine a good faith estimate that reasonably reflects the current market conditions as of the close of the New York Stock Exchange. The fair value of a security is likely to be different from the quoted or published price, if available.
Investments in open-end investment companies (other than exchange-traded funds (ETFs)), are valued at the latest net asset value reported by those companies as of the valuation time.
| 20 | Columbia Select Large Cap Growth Fund | Annual Report 2023 |
Notes to Financial Statements (continued)
March 31, 2023
Investments for which market quotations are not readily available, or that have quotations which management believes are not reflective of market value or reliable, are valued at fair value as determined in good faith under procedures approved by the Board of Trustees. If a security or class of securities (such as foreign securities) is valued at fair value, such value is likely to be different from the quoted or published price for the security, if available.
The determination of fair value often requires significant judgment. To determine fair value, management may use assumptions including but not limited to future cash flows and estimated risk premiums. Multiple inputs from various sources may be used to determine fair value.
GAAP requires disclosure regarding the inputs and valuation techniques used to measure fair value and any changes in valuation inputs or techniques. In addition, investments shall be disclosed by major category. This information is disclosed following the Fund’s Portfolio of Investments.
Security transactions
Security transactions are accounted for on the trade date. Cost is determined and gains (losses) are based upon the specific identification method for both financial statement and federal income tax purposes.
Income recognition
Corporate actions and dividend income are generally recorded net of any non-reclaimable tax withholdings, on the ex-dividend date or upon receipt of an ex-dividend notification in the case of certain foreign securities.
The Fund may receive distributions from holdings in equity securities, business development companies (BDCs), exchange-traded funds (ETFs), limited partnerships (LPs), other regulated investment companies (RICs), and real estate investment trusts (REITs), which report information as to the tax character of their distributions annually. These distributions are allocated to dividend income, capital gain and return of capital based on actual information reported. Return of capital is recorded as a reduction of the cost basis of securities held. If the Fund no longer owns the applicable securities, return of capital is recorded as a realized gain. With respect to REITs, to the extent actual information has not yet been reported, estimates for return of capital are made by Columbia Management Investment Advisers, LLC (the Investment Manager), a wholly-owned subsidiary of Ameriprise Financial, Inc. (Ameriprise Financial). The Investment Manager’s estimates are subsequently adjusted when the actual character of the distributions is disclosed by the REITs, which could result in a proportionate change in return of capital to shareholders.
Awards from class action litigation are recorded as a reduction of cost basis if the Fund still owns the applicable securities on the payment date. If the Fund no longer owns the applicable securities on the payment date, the proceeds are recorded as realized gains.
Expenses
General expenses of the Trust are allocated to the Fund and other funds of the Trust based upon relative net assets or other expense allocation methodologies determined by the nature of the expense. Expenses directly attributable to the Fund are charged to the Fund. Expenses directly attributable to a specific class of shares are charged to that share class.
Determination of class net asset value
All income, expenses (other than class-specific expenses, which are charged to that share class, as shown in the Statement of Operations) and realized and unrealized gains (losses) are allocated to each class of the Fund on a daily basis, based on the relative net assets of each class, for purposes of determining the net asset value of each class.
Federal income tax status
The Fund intends to qualify each year as a regulated investment company under Subchapter M of the Internal Revenue Code, as amended, and will distribute substantially all of its investment company taxable income and net capital gain, if any, for its tax year, and as such will not be subject to federal income taxes. In addition, the Fund intends to distribute in each calendar year substantially all of its ordinary income, capital gain net income and certain other amounts, if any, such that the Fund should not be subject to federal excise tax. Therefore, no federal income or excise tax provision is recorded.
Columbia Select Large Cap Growth Fund | Annual Report 2023
| 21 |
Notes to Financial Statements (continued)
March 31, 2023
Distributions to shareholders
Distributions from net investment income, if any, are declared and paid each calendar quarter. Net realized capital gains, if any, are distributed at least annually. Income distributions and capital gain distributions are determined in accordance with federal income tax regulations, which may differ from GAAP.
Guarantees and indemnifications
Under the Trust’s organizational documents and, in some cases, by contract, its officers and trustees are indemnified against certain liabilities arising out of the performance of their duties to the Trust or its funds. In addition, certain of the Fund’s contracts with its service providers contain general indemnification clauses. The Fund’s maximum exposure under these arrangements is unknown since the amount of any future claims that may be made against the Fund cannot be determined, and the Fund has no historical basis for predicting the likelihood of any such claims.
Recent accounting pronouncement
Tailored Shareholder Reports
In October 2022, the Securities and Exchange Commission (SEC) adopted a final rule relating to Tailored Shareholder Reports for Mutual Funds and Exchange-Traded Funds; Fee Information in Investment Company Advertisements. The rule and form amendments will, among other things, require the Fund to transmit concise and visually engaging shareholder reports that highlight key information. The amendments will require that funds tag information in a structured data format and that certain more in-depth information be made available online and available for delivery free of charge to investors on request. The amendments became effective January 24, 2023. There is an 18-month transition period after the effective date of the amendment.
Note 3. Fees and other transactions with affiliates
Management services fees
The Fund has entered into a Management Agreement with Columbia Management Investment Advisers, LLC (the Investment Manager), a wholly-owned subsidiary of Ameriprise Financial, Inc. (Ameriprise Financial). Under the Management Agreement, the Investment Manager provides the Fund with investment research and advice, as well as administrative and accounting services. The management services fee is an annual fee that is equal to a percentage of the Fund’s daily net assets that declines from 0.77% to 0.57% as the Fund’s net assets increase. The effective management services fee rate for the year ended March 31, 2023 was 0.73% of the Fund’s average daily net assets.
Compensation of board members
Members of the Board of Trustees who are not officers or employees of the Investment Manager or Ameriprise Financial are compensated for their services to the Fund as disclosed in the Statement of Operations. Under a Deferred Compensation Plan (the Deferred Plan), these members of the Board of Trustees may elect to defer payment of up to 100% of their compensation. Deferred amounts are treated as though equivalent dollar amounts had been invested in shares of certain funds managed by the Investment Manager. The Fund’s liability for these amounts is adjusted for market value changes and remains in the Fund until distributed in accordance with the Deferred Plan. All amounts payable under the Deferred Plan constitute a general unsecured obligation of the Fund. The expense for the Deferred Plan, which includes Trustees’ fees deferred during the current period as well as any gains or losses on the Trustees’ deferred compensation balances as a result of market fluctuations, is included in "Compensation of board members" in the Statement of Operations.
Compensation of Chief Compliance Officer
The Board of Trustees has appointed a Chief Compliance Officer for the Fund in accordance with federal securities regulations. As disclosed in the Statement of Operations, a portion of the Chief Compliance Officer’s total compensation is allocated to the Fund, along with other allocations to affiliated registered investment companies managed by the Investment Manager and its affiliates, based on relative net assets.
| 22 | Columbia Select Large Cap Growth Fund | Annual Report 2023 |
Notes to Financial Statements (continued)
March 31, 2023
Transfer agency fees
Under a Transfer and Dividend Disbursing Agent Agreement, Columbia Management Investment Services Corp. (the Transfer Agent), an affiliate of the Investment Manager and a wholly-owned subsidiary of Ameriprise Financial, is responsible for providing transfer agency services to the Fund. The Transfer Agent has contracted with SS&C GIDS, Inc. (SS&C GIDS) to serve as sub-transfer agent. Prior to January 1, 2023, SS&C GIDS was known as DST Asset Manager Solutions, Inc. The Transfer Agent pays the fees of SS&C GIDS for services as sub-transfer agent and SS&C GIDS is not entitled to reimbursement for such fees from the Fund (with the exception of out-of-pocket fees).
The Fund pays the Transfer Agent a monthly transfer agency fee based on the number or the average value of accounts, depending on the type of account. In addition, the Fund pays the Transfer Agent a fee for shareholder services based on the number of accounts or on a percentage of the average aggregate value of the Fund’s shares maintained in omnibus accounts up to the lesser of the amount charged by the financial intermediary or a cap established by the Board of Trustees from time to time.
The Transfer Agent also receives compensation from the Fund for various shareholder services and reimbursements for certain out-of-pocket fees. Total transfer agency fees for Institutional 2 Class and Institutional 3 Class shares are subject to an annual limitation of not more than 0.07% and 0.02%, respectively, of the average daily net assets attributable to each share class. In addition, prior to August 1, 2022, Institutional 2 Class shares were subject to a contractual transfer agency fee annual limitation of not more than 0.05% and Institutional 3 Class shares were subject to a contractual transfer agency fee annual limitation of not more than 0.00% of the average daily net assets attributable to each share class.
For the year ended March 31, 2023, the Fund’s effective transfer agency fee rates as a percentage of average daily net assets of each class were as follows:
| | Effective rate (%) |
| Class A | 0.16 |
| Advisor Class | 0.16 |
| Class C | 0.16 |
| Institutional Class | 0.16 |
| Institutional 2 Class | 0.05 |
| Institutional 3 Class | 0.00 |
| Class R | 0.16 |
An annual minimum account balance fee of $20 may apply to certain accounts with a value below the applicable share class’s initial minimum investment requirements to reduce the impact of small accounts on transfer agency fees. These minimum account balance fees are remitted to the Fund and recorded as part of expense reductions in the Statement of Operations. For the year ended March 31, 2023, these minimum account balance fees reduced total expenses of the Fund by $660.
Distribution and service fees
The Fund has entered into an agreement with Columbia Management Investment Distributors, Inc. (the Distributor), an affiliate of the Investment Manager and a wholly-owned subsidiary of Ameriprise Financial, for distribution and shareholder services. The Board of Trustees has approved, and the Fund has adopted, distribution and shareholder service plans (the Plans) applicable to certain share classes, which set the distribution and service fees for the Fund. These fees are calculated daily and are intended to compensate the Distributor and/or eligible selling and/or servicing agents for selling shares of the Fund and providing services to investors.
Under the Plans, the Fund pays a monthly service fee to the Distributor at the maximum annual rate of 0.25% of the average daily net assets attributable to Class A and Class C shares of the Fund. Also under the Plans, the Fund pays a monthly distribution fee to the Distributor at the maximum annual rates of 0.75% and 0.50% of the average daily net assets attributable to Class C and Class R shares of the Fund, respectively.
Columbia Select Large Cap Growth Fund | Annual Report 2023
| 23 |
Notes to Financial Statements (continued)
March 31, 2023
Sales charges (unaudited)
Sales charges, including front-end charges and contingent deferred sales charges (CDSCs), received by the Distributor for distributing Fund shares for the year ended March 31, 2023, if any, are listed below:
| | Front End (%) | CDSC (%) | Amount ($) |
| Class A | 5.75 | 0.50 - 1.00(a) | 95,668 |
| Class C | — | 1.00(b) | 2,084 |
| (a) | This charge is imposed on certain investments of between $1 million and $50 million redeemed within 18 months after purchase, as follows: 1.00% if redeemed within 12 months after purchase, and 0.50% if redeemed more than 12, but less than 18, months after purchase, with certain limited exceptions. |
| (b) | This charge applies to redemptions within 12 months after purchase, with certain limited exceptions. |
The Fund’s other share classes are not subject to sales charges.
Expenses waived/reimbursed by the Investment Manager and its affiliates
The Investment Manager and certain of its affiliates have contractually agreed to waive fees and/or reimburse expenses (excluding certain fees and expenses described below) for the period(s) disclosed below, unless sooner terminated at the sole discretion of the Board of Trustees, so that the Fund’s net operating expenses, after giving effect to fees waived/expenses reimbursed and any balance credits and/or overdraft charges from the Fund’s custodian, do not exceed the following annual rate(s) as a percentage of the classes’ average daily net assets:
| | August 1, 2022
through
July 31, 2023 | Prior to
August 1, 2022 |
| Class A | 1.05% | 1.07% |
| Advisor Class | 0.80 | 0.82 |
| Class C | 1.80 | 1.82 |
| Institutional Class | 0.80 | 0.82 |
| Institutional 2 Class | 0.71 | 0.73 |
| Institutional 3 Class | 0.66 | 0.68 |
| Class R | 1.30 | 1.32 |
Under the agreement governing these fee waivers and/or expense reimbursement arrangements, the following fees and expenses are excluded from the waiver/reimbursement commitment, and therefore will be paid by the Fund, if applicable: taxes (including foreign transaction taxes), expenses associated with investments in affiliated and non-affiliated pooled investment vehicles (including mutual funds and exchange-traded funds), transaction costs and brokerage commissions, costs related to any securities lending program, dividend expenses associated with securities sold short, inverse floater program fees and expenses, transaction charges and interest on borrowed money, interest, costs associated with shareholder meetings, infrequent and/or unusual expenses and any other expenses the exclusion of which is specifically approved by the Board of Trustees. This agreement may be modified or amended only with approval from the Investment Manager, certain of its affiliates and the Fund. Reflected in the contractual cap commitment, prior to August 1, 2022, is the Transfer Agent’s contractual agreement to limit total transfer agency fees to an annual rate of not more than 0.05% for Institutional 2 Class and 0.00% for Institutional 3 Class of the average daily net assets attributable to each share class. Any fees waived and/or expenses reimbursed under the expense reimbursement arrangements described above are not recoverable by the Investment Manager or its affiliates in future periods.
Note 4. Federal tax information
The timing and character of income and capital gain distributions are determined in accordance with income tax regulations, which may differ from GAAP because of temporary or permanent book to tax differences.
At March 31, 2023, these differences were primarily due to differing treatment for deferral/reversal of wash sale losses, late-year ordinary losses, trustees’ deferred compensation and net operating loss reclassification. To the extent these differences were permanent, reclassifications were made among the components of the Fund’s net assets. Temporary differences do not require reclassifications.
| 24 | Columbia Select Large Cap Growth Fund | Annual Report 2023 |
Notes to Financial Statements (continued)
March 31, 2023
The following reclassifications were made:
Excess of distributions
over net investment
income ($) | Accumulated
net realized
gain ($) | Paid in
capital ($) |
| 6,976,712 | — | (6,976,712) |
Net investment income (loss) and net realized gains (losses), as disclosed in the Statement of Operations, and net assets were not affected by this reclassification.
The tax character of distributions paid during the years indicated was as follows:
| Year Ended March 31, 2023 | Year Ended March 31, 2022 |
Ordinary
income ($) | Long-term
capital gains ($) | Total ($) | Ordinary
income ($) | Long-term
capital gains ($) | Total ($) |
| — | 154,416,495 | 154,416,495 | 48,181,003 | 561,739,526 | 609,920,529 |
Short-term capital gain distributions, if any, are considered ordinary income distributions for tax purposes.
At March 31, 2023, the components of distributable earnings on a tax basis were as follows:
Undistributed
ordinary income ($) | Undistributed
long-term
capital gains ($) | Capital loss
carryforwards ($) | Net unrealized
appreciation ($) |
| — | 51,425,762 | — | 470,417,955 |
At March 31, 2023, the cost of all investments for federal income tax purposes along with the aggregate gross unrealized appreciation and depreciation based on that cost was:
Federal
tax cost ($) | Gross unrealized
appreciation ($) | Gross unrealized
(depreciation) ($) | Net unrealized
appreciation ($) |
| 650,541,097 | 475,476,110 | (5,058,155) | 470,417,955 |
Tax cost of investments and unrealized appreciation/(depreciation) may also include timing differences that do not constitute adjustments to tax basis.
Under current tax rules, regulated investment companies can elect to treat certain late-year ordinary losses incurred and post-October capital losses (capital losses realized after October 31) as arising on the first day of the following taxable year. As of March 31, 2023, the Fund will elect to treat the following late-year ordinary losses and post-October capital losses as arising on April 1, 2023.
Late year
ordinary losses ($) | Post-October
capital losses ($) |
| 1,140,844 | — |
Management of the Fund has concluded that there are no significant uncertain tax positions in the Fund that would require recognition in the financial statements. However, management’s conclusion may be subject to review and adjustment at a later date based on factors including, but not limited to, new tax laws, regulations, and administrative interpretations (including relevant court decisions). Generally, the Fund’s federal tax returns for the prior three fiscal years remain subject to examination by the Internal Revenue Service.
Note 5. Portfolio information
The cost of purchases and proceeds from sales of securities, excluding short-term investments and derivatives, if any, aggregated to $316,099,365 and $684,647,892, respectively, for the year ended March 31, 2023. The amount of purchase and sale activity impacts the portfolio turnover rate reported in the Financial Highlights.
Columbia Select Large Cap Growth Fund | Annual Report 2023
| 25 |
Notes to Financial Statements (continued)
March 31, 2023
Note 6. Affiliated money market fund
The Fund invests in Columbia Short-Term Cash Fund, an affiliated money market fund established for the exclusive use by the Fund and other affiliated funds (the Affiliated MMF). The income earned by the Fund from such investments is included as Dividends - affiliated issuers in the Statement of Operations. As an investing fund, the Fund indirectly bears its proportionate share of the expenses of the Affiliated MMF. The Affiliated MMF prices its shares with a floating net asset value. In addition, the Board of Trustees of the Affiliated MMF may impose a fee on redemptions (sometimes referred to as a liquidity fee) or temporarily suspend redemptions (sometimes referred to as imposing a redemption gate) in the event its liquidity falls below regulatory limits.
Note 7. Interfund lending
Pursuant to an exemptive order granted by the Securities and Exchange Commission, the Fund participates in a program (the Interfund Program) allowing each participating Columbia Fund (each, a Participating Fund) to lend money directly to and, except for closed-end funds and money market funds, borrow money directly from other Participating Funds for temporary purposes. The amounts eligible for borrowing and lending under the Interfund Program are subject to certain restrictions.
Interfund loans are subject to the risk that the borrowing fund could be unable to repay the loan when due, and a delay in repayment to the lending fund could result in lost opportunities and/or additional lending costs. The exemptive order is subject to conditions intended to mitigate conflicts of interest arising from the Investment Manager’s relationship with each Participating Fund.
The Fund’s activity in the Interfund Program during the year ended March 31, 2023 was as follows:
| Borrower or lender | Average loan
balance ($) | Weighted average
interest rate (%) | Number of days
with outstanding loans |
| Borrower | 4,100,000 | 2.06 | 1 |
| Lender | 2,500,000 | 2.08 | 1 |
Interest income earned and interest expense incurred by the Fund is recorded as Interfund lending in the Statement of Operations. The Fund had no outstanding interfund loans at March 31, 2023.
Note 8. Line of credit
The Fund has access to a revolving credit facility with a syndicate of banks led by JPMorgan Chase Bank, N.A., Citibank, N.A. and Wells Fargo Bank, N.A. whereby the Fund may borrow for the temporary funding of shareholder redemptions or for other temporary or emergency purposes. Pursuant to an October 27, 2022 amendment and restatement, the credit facility, which is an agreement between the Fund and certain other funds managed by the Investment Manager or an affiliated investment manager, severally and not jointly, permits aggregate borrowings up to $950 million. Interest is currently charged to each participating fund based on its borrowings at a rate equal to the higher of (i) the federal funds effective rate, (ii) the secured overnight financing rate plus 0.10% and (iii) the overnight bank funding rate, plus in each case, 1.00%. Each borrowing under the credit facility matures no later than 60 days after the date of borrowing. The Fund also pays a commitment fee equal to its pro rata share of the unused amount of the credit facility at a rate of 0.15% per annum. The commitment fee is included in other expenses in the Statement of Operations. This agreement expires annually in October unless extended or renewed. Prior to the October 27, 2022 amendment and restatement, the Fund had access to a revolving credit facility with a syndicate of banks led by JPMorgan Chase Bank, N.A., Citibank, N.A. and Wells Fargo Bank, N.A. which permitted collective borrowings up to $950 million. Interest was charged to each participating fund based on its borrowings at a rate equal to the higher of (i) the federal funds effective rate, (ii) the secured overnight financing rate plus 0.11448% and (iii) the overnight bank funding rate, plus in each case, 1.00%.
The Fund had no borrowings during the year ended March 31, 2023.
| 26 | Columbia Select Large Cap Growth Fund | Annual Report 2023 |
Notes to Financial Statements (continued)
March 31, 2023
Note 9. Significant risks
Health care sector risk
The Fund is more susceptible to the particular risks that may affect companies in the health care sector than if it were invested in a wider variety of companies in unrelated sectors. Companies in the health care sector are subject to certain risks, including restrictions on government reimbursement for medical expenses, government approval of medical products and services, competitive pricing pressures, and the rising cost of medical products and services (especially for companies dependent upon a relatively limited number of products or services). Performance of such companies may be affected by factors including government regulation, obtaining and protecting patents (or the failure to do so), product liability and other similar litigation as well as product obsolescence.
Information technology sector risk
The Fund is more susceptible to the particular risks that may affect companies in the information technology sector than if it were invested in a wider variety of companies in unrelated sectors. Companies in the information technology sector are subject to certain risks, including the risk that new services, equipment or technologies will not be accepted by consumers and businesses or will become rapidly obsolete. Performance of such companies may be affected by factors including obtaining and protecting patents (or the failure to do so) and significant competitive pressures, including aggressive pricing of their products or services, new market entrants, competition for market share and short product cycles due to an accelerated rate of technological developments. Such competitive pressures may lead to limited earnings and/or falling profit margins. As a result, the value of their securities may fall or fail to rise. In addition, many information technology sector companies have limited operating histories and prices of these companies’ securities historically have been more volatile than other securities, especially over the short term. Some companies in the information technology sector are facing increased government and regulatory scrutiny and may be subject to adverse government or regulatory action, which could negatively impact the value of their securities.
Market risk
The Fund may incur losses due to declines in the value of one or more securities in which it invests. These declines may be due to factors affecting a particular issuer, or the result of, among other things, political, regulatory, market, economic or social developments affecting the relevant market(s) more generally. In addition, turbulence in financial markets and reduced liquidity in equity, credit and/or fixed income markets may negatively affect many issuers, which could adversely affect the Fund’s ability to price or value hard-to-value assets in thinly traded and closed markets and could cause significant redemptions and operational challenges. Global economies and financial markets are increasingly interconnected, and conditions and events in one country, region or financial market may adversely impact issuers in a different country, region or financial market. These risks may be magnified if certain events or developments adversely interrupt the global supply chain; in these and other circumstances, such risks might affect companies worldwide. As a result, local, regional or global events such as terrorism, war, natural disasters, disease/virus outbreaks and epidemics or other public health issues, recessions, depressions or other events – or the potential for such events – could have a significant negative impact on global economic and market conditions.
The large-scale invasion of Ukraine by Russia in February 2022 has resulted in sanctions and market disruptions, including declines in regional and global stock markets, unusual volatility in global commodity markets and significant devaluations of Russian currency. The extent and duration of the military action are impossible to predict but could be significant. Market disruption caused by the Russian military action, and any counter-measures or responses thereto (including international sanctions, a downgrade in the country’s credit rating, purchasing and financing restrictions, boycotts, tariffs, changes in consumer or purchaser preferences, cyberattacks and espionage) could have severe adverse impacts on regional and/or global securities and commodities markets, including markets for oil and natural gas. These impacts may include reduced market liquidity, distress in credit markets, further disruption of global supply chains, increased risk of inflation, and limited access to investments in certain international markets and/or issuers. These developments and other related events could negatively impact Fund performance.
Columbia Select Large Cap Growth Fund | Annual Report 2023
| 27 |
Notes to Financial Statements (continued)
March 31, 2023
Shareholder concentration risk
At March 31, 2023, two unaffiliated shareholders of record owned 26.5% of the outstanding shares of the Fund in one or more accounts. The Fund has no knowledge about whether any portion of those shares was owned beneficially. Affiliated shareholders of record owned 34.9% of the outstanding shares of the Fund in one or more accounts. Subscription and redemption activity by concentrated accounts may have a significant effect on the operations of the Fund. In the case of a large redemption, the Fund may be forced to sell investments at inopportune times, including its liquid positions, which may result in Fund losses and the Fund holding a higher percentage of less liquid positions. Large redemptions could result in decreased economies of scale and increased operating expenses for non-redeeming Fund shareholders.
Note 10. Subsequent events
Management has evaluated the events and transactions that have occurred through the date the financial statements were issued and noted no items requiring adjustment of the financial statements or additional disclosure.
Note 11. Information regarding pending and settled legal proceedings
Ameriprise Financial and certain of its affiliates are involved in the normal course of business in legal proceedings which include regulatory inquiries, arbitration and litigation, including class actions concerning matters arising in connection with the conduct of their activities as part of a diversified financial services firm. Ameriprise Financial believes that the Fund is not currently the subject of, and that neither Ameriprise Financial nor any of its affiliates are the subject of, any pending legal, arbitration or regulatory proceedings that are likely to have a material adverse effect on the Fund or the ability of Ameriprise Financial or its affiliates to perform under their contracts with the Fund. Ameriprise Financial is required to make quarterly (10-Q), annual (10-K) and, as necessary, 8-K filings with the Securities and Exchange Commission (SEC) on legal and regulatory matters that relate to Ameriprise Financial and its affiliates. Copies of these filings may be obtained by accessing the SEC website at www.sec.gov.
There can be no assurance that these matters, or the adverse publicity associated with them, will not result in increased Fund redemptions, reduced sale of Fund shares or other adverse consequences to the Fund. Further, although we believe proceedings are not likely to have a material adverse effect on the Fund or the ability of Ameriprise Financial or its affiliates to perform under their contracts with the Fund, these proceedings are subject to uncertainties and, as such, we are unable to estimate the possible loss or range of loss that may result. An adverse outcome in one or more of these proceedings could result in adverse judgments, settlements, fines, penalties or other relief that could have a material adverse effect on the consolidated financial condition or results of operations of Ameriprise Financial or one or more of its affiliates that provides services to the Fund.
| 28 | Columbia Select Large Cap Growth Fund | Annual Report 2023 |
Report of Independent Registered Public Accounting Firm
To the Board of Trustees of Columbia Funds Series Trust I and Shareholders of Columbia Select Large Cap Growth Fund
Opinion on the Financial Statements
We have audited the accompanying statement of assets and liabilities, including the portfolio of investments, of Columbia Select Large Cap Growth Fund (one of the funds constituting Columbia Funds Series Trust I, referred to hereafter as the "Fund") as of March 31, 2023, the related statement of operations for the year ended March 31, 2023, the statement of changes in net assets for each of the two years in the period ended March 31, 2023, including the related notes, and the financial highlights for each of the five years in the period ended March 31, 2023 (collectively referred to as the "financial statements"). In our opinion, the financial statements present fairly, in all material respects, the financial position of the Fund as of March 31, 2023, the results of its operations for the year then ended, the changes in its net assets for each of the two years in the period ended March 31, 2023 and the financial highlights for each of the five years in the period ended March 31, 2023 in conformity with accounting principles generally accepted in the United States of America.
Basis for Opinion
These financial statements are the responsibility of the Fund’s management. Our responsibility is to express an opinion on the Fund’s financial statements based on our audits. We are a public accounting firm registered with the Public Company Accounting Oversight Board (United States) (PCAOB) and are required to be independent with respect to the Fund in accordance with the U.S. federal securities laws and the applicable rules and regulations of the Securities and Exchange Commission and the PCAOB.
We conducted our audits of these financial statements in accordance with the standards of the PCAOB. Those standards require that we plan and perform the audit to obtain reasonable assurance about whether the financial statements are free of material misstatement, whether due to error or fraud.
Our audits included performing procedures to assess the risks of material misstatement of the financial statements, whether due to error or fraud, and performing procedures that respond to those risks. Such procedures included examining, on a test basis, evidence regarding the amounts and disclosures in the financial statements. Our audits also included evaluating the accounting principles used and significant estimates made by management, as well as evaluating the overall presentation of the financial statements. Our procedures included confirmation of securities owned as of March 31, 2023 by correspondence with the custodian and transfer agent. We believe that our audits provide a reasonable basis for our opinion.
/s/PricewaterhouseCoopers LLP
Minneapolis, Minnesota
May 23, 2023
We have served as the auditor of one or more investment companies within the Columbia Funds Complex since 1977.
Columbia Select Large Cap Growth Fund | Annual Report 2023
| 29 |
Federal Income Tax Information
(Unaudited)
The Fund hereby designates the following tax attributes for the fiscal year ended March 31, 2023. Shareholders will be notified in early 2024 of the amounts for use in preparing 2023 income tax returns.
Capital
gain
dividend | |
| $54,364,057 | |
Capital gain dividend. The Fund designates as a capital gain dividend the amount reflected above, or if subsequently determined to be different, the net capital gain of such fiscal period.
TRUSTEES AND OFFICERS
(Unaudited)
The Board oversees the Fund’s operations and appoints officers who are responsible for day-to-day business decisions based on policies set by the Board. The following table provides basic biographical information about the Fund’s Trustees as of the printing of this report, including their principal occupations during the past five years, although specific titles for individuals may have varied over the period. The year set forth beneath Length of Service in the table below is the year in which the Trustee was first appointed or elected as Trustee to any Fund currently in the Columbia Funds Complex or a predecessor thereof. Under current Board policy, each Trustee generally serves until December 31 of the year such Trustee turns seventy-five (75).
Independent trustees
Name,
address,
year of birth | Position held
with the Columbia Funds and
length of service | Principal occupation(s)
during past five years
and other relevant
professional experience | Number of
Funds in the
Columbia Funds
Complex*
overseen | Other directorships
held by Trustee
during the past five years
and other relevant Board experience |
George S. Batejan
c/o Columbia Management
Investment Advisers, LLC
290 Congress Street
Boston, MA 02210
1954 | Trustee since 2017 | Executive Vice President, Global Head of Technology and Operations, Janus Capital Group, Inc., 2010-2016 | 177 | Former Chairman of the Board, NICSA (National Investment Company Services Association) (Executive Committee, Nominating Committee and Governance Committee), 2014-2016; former Director, Intech Investment Management, 2011-2016; former Board Member, Metro Denver Chamber of Commerce, 2015-2016; former Advisory Board Member, University of Colorado Business School, 2015-2018; former Board Member, Chase Bank International, 1993-1994 |
| 30 | Columbia Select Large Cap Growth Fund | Annual Report 2023 |
TRUSTEES AND OFFICERS (continued)
(Unaudited)
Independent trustees (continued)
Name,
address,
year of birth | Position held
with the Columbia Funds and
length of service | Principal occupation(s)
during past five years
and other relevant
professional experience | Number of
Funds in the
Columbia Funds
Complex*
overseen | Other directorships
held by Trustee
during the past five years
and other relevant Board experience |
Kathleen Blatz
c/o Columbia Management
Investment Advisers, LLC
290 Congress Street
Boston, MA 02210
1954 | Trustee since 2006 | Attorney, specializing in arbitration and mediation; Chief Justice, Minnesota Supreme Court, 1998-2006; Associate Justice, Minnesota Supreme Court, 1996-1998; Fourth Judicial District Court Judge, Hennepin County, 1994-1996; Attorney in private practice and public service, 1984-1993; State Representative, Minnesota House of Representatives, 1979-1993, which included service on the Tax and Financial Institutions and Insurance Committees; Member and Interim Chair, Minnesota Sports Facilities Authority, January-July 2017; Interim President and Chief Executive Officer, Blue Cross and Blue Shield of Minnesota (health care insurance), February-July 2018, April-October 2021 | 177 | Former Trustee, Blue Cross and Blue Shield of Minnesota, 2009-2021 (Chair of the Business Development Committee, 2014-2017; Chair of the Governance Committee, 2017-2019); former Member and Chair of the Board, Minnesota Sports Facilities Authority, January 2017-July 2017; former Director, Robina Foundation, 2009-2020 (Chair, 2014-2020); Director, Richard M. Schulze Family Foundation, since 2021 |
Pamela G. Carlton
c/o Columbia Management
Investment Advisers, LLC
290 Congress Street
Boston, MA 02210
1954 | Chair since 2023; Trustee since 2007 | President, Springboard — Partners in Cross Cultural Leadership (consulting company), since 2003; Managing Director of US Equity Research, JP Morgan Chase, 1999-2003; Director of US Equity Research, Chase Asset Management, 1996-1999; Co-Director Latin America Research, 1993-1996, COO Global Research, 1992-1996, Co-Director of US Research, 1991-1992, Investment Banker, 1982-1991, Morgan Stanley; Attorney, Cleary Gottlieb Steen & Hamilton LLP, 1980-1982 | 177 | Trustee, New York Presbyterian Hospital Board, since 1996; Director, DR Bank (Audit Committee) since 2017; Director, Evercore Inc. (Audit Committee, Nominating and Governance Committee), since 2019; Director, Apollo Commercial Real Estate Finance, Inc. (Chair, Nominating and Governance Committee) (financial services), since 2021; the Governing Council of the Independent Directors Council (IDC), since 2021 |
Janet Langford Carrig
c/o Columbia Management
Investment Advisers, LLC
290 Congress Street
Boston, MA 02210
1957 | Trustee since 1996 | Senior Vice President, General Counsel and Corporate Secretary, ConocoPhillips (independent energy company), September 2007-October 2018 | 175 | Director, EQT Corporation (natural gas producer), since 2019; former Director, Whiting Petroleum Corporation (independent oil and gas company), 2020-2022 |
J. Kevin Connaughton
c/o Columbia Management
Investment Advisers, LLC
290 Congress Street
Boston, MA 02210
1964 | Trustee since 2020 | CEO and President, RhodeWay Financial (non-profit financial planning firm), since December 2022; Member, FINRA National Adjudicatory Council, since January 2020; Adjunct Professor of Finance, Bentley University since January 2018; Consultant to Independent Trustees of CFVIT and CFST I from March 2016 to June 2020 with respect to CFVIT and to December 2020 with respect to CFST I; Managing Director and General Manager of Mutual Fund Products, Columbia Management Investment Advisers, LLC, May 2010-February 2015; President, Columbia Funds, 2008-2015; and senior officer of Columbia Funds and affiliated funds, 2003-2015 | 175 | Former Director, The Autism Project, March 2015-December 2021; former Member of the Investment Committee, St. Michael’s College, November 2015-February 2020; former Trustee, St. Michael’s College, June 2017-September 2019; former Trustee, New Century Portfolios (former mutual fund complex), January 2015-December 2017 |
Columbia Select Large Cap Growth Fund | Annual Report 2023
| 31 |
TRUSTEES AND OFFICERS (continued)
(Unaudited)
Independent trustees (continued)
Name,
address,
year of birth | Position held
with the Columbia Funds and
length of service | Principal occupation(s)
during past five years
and other relevant
professional experience | Number of
Funds in the
Columbia Funds
Complex*
overseen | Other directorships
held by Trustee
during the past five years
and other relevant Board experience |
Olive M. Darragh
c/o Columbia Management
Investment Advisers, LLC
290 Congress Street
Boston, MA 02210
1962 | Trustee since 2020 | Managing Director of Darragh Inc. (strategy and talent management consulting firm), since 2010; Founder and CEO, Zolio, Inc. (investment management talent identification platform), since 2004; Consultant to Independent Trustees of CFVIT and CFST I from June 2019 to June 2020 with respect to CFVIT and to December 2020 with respect to CFST I; Partner, Tudor Investments, 2004-2010; Senior Partner, McKinsey & Company (consulting), 1990-2004; Touche Ross CPA, 1985-1988 | 175 | Treasurer, Edinburgh University US Trust Board, since January 2023; Member, HBS Community Action Partners Board, since September 2022; former Director, University of Edinburgh Business School (Member of US Board), 2004-2019; former Director, Boston Public Library Foundation, 2008-2017 |
Patricia M. Flynn
c/o Columbia Management
Investment Advisers, LLC
290 Congress Street
Boston, MA 02210
1950 | Trustee since 2004 | Professor of Economics and Management, Bentley University, since 2002; Dean, McCallum Graduate School of Business, Bentley University, 1992-2002 | 177 | Former Trustee, MA Taxpayers Foundation, 1997-2022; former Director, The MA Business Roundtable, 2003-2019; former Chairperson, Innovation Index Advisory Committee, MA Technology Collaborative, 1997-2020 |
Brian J. Gallagher
c/o Columbia Management
Investment Advisers, LLC
290 Congress Street
Boston, MA 02210
1954 | Trustee since 2017 | Retired; Partner with Deloitte & Touche LLP and its predecessors, 1977-2016 | 177 | Trustee, Catholic Schools Foundation, since 2004 |
Douglas A. Hacker
c/o Columbia Management
Investment Advisers, LLC
290 Congress Street
Boston, MA 02210
1955 | Trustee since 1996 | Independent business executive, since May 2006; Executive Vice President – Strategy of United Airlines, December 2002 - May 2006; President of UAL Loyalty Services (airline marketing company), September 2001-December 2002; Executive Vice President and Chief Financial Officer of United Airlines, July 1999-September 2001 | 177 | Director, SpartanNash Company (Chair of the Board) (food distributor), since May 2021; Director, Aircastle Limited (Chair of Audit Committee) (aircraft leasing), since August 2006; former Director, Nash Finch Company (food distributor), 2005-2013; former Director, SeaCube Container Leasing Ltd. (container leasing), 2010-2013; and former Director, Travelport Worldwide Limited (travel information technology), 2014-2019 |
Nancy T. Lukitsh
c/o Columbia Management
Investment Advisers, LLC
290 Congress Street
Boston, MA 02210
1956 | Trustee since 2011 | Senior Vice President, Partner and Director of Marketing, Wellington Management Company, LLP (investment adviser), 1997-2010; Chair, Wellington Management Portfolios (commingled non-U.S. investment pools), 2007-2010; Director, Wellington Trust Company, NA and other Wellington affiliates, 1997-2010 | 175 | None |
| 32 | Columbia Select Large Cap Growth Fund | Annual Report 2023 |
TRUSTEES AND OFFICERS (continued)
(Unaudited)
Independent trustees (continued)
Name,
address,
year of birth | Position held
with the Columbia Funds and
length of service | Principal occupation(s)
during past five years
and other relevant
professional experience | Number of
Funds in the
Columbia Funds
Complex*
overseen | Other directorships
held by Trustee
during the past five years
and other relevant Board experience |
David M. Moffett
c/o Columbia Management
Investment Advisers, LLC
290 Congress Street
Boston, MA 02210
1952 | Trustee since 2011 | Retired; former Chief Executive Officer of Freddie Mac and Chief Financial Officer of U.S. Bank | 175 | Director, CSX Corporation (transportation suppliers); Director, PayPal Holdings Inc. (payment and data processing services); Trustee, University of Oklahoma Foundation; former Director, eBay Inc. (online trading community), 2007-2015; and former Director, CIT Bank, CIT Group Inc. (commercial and consumer finance), 2010-2016; former Senior Adviser to The Carlyle Group (financial services), March 2008-September 2008; former Governance Consultant to Bridgewater Associates, January 2013-December 2015 |
Catherine James Paglia
c/o Columbia Management
Investment Advisers, LLC
290 Congress Street
Boston, MA 02210
1952 | Trustee since 2004 | Director, Enterprise Asset Management, Inc. (private real estate and asset management company), since September 1998; Managing Director and Partner, Interlaken Capital, Inc., 1989-1997; Vice President, 1982-1985, Principal, 1985-1987, Managing Director, 1987-1989, Morgan Stanley; Vice President, Investment Banking, 1980-1982, Associate, Investment Banking, 1976-1980, Dean Witter Reynolds, Inc. | 177 | Director, Valmont Industries, Inc. (irrigation systems manufacturer), since 2012; Trustee, Carleton College (on the Investment Committee), since 1987; Trustee, Carnegie Endowment for International Peace (on the Investment Committee), since 2009 |
Natalie A. Trunow
c/o Columbia Management
Investment Advisers, LLC
290 Congress Street
Boston, MA 02210
1967 | Trustee since 2020 | Chief Executive Officer, Millennial Portfolio Solutions LLC (asset management and consulting services), January 2016-January 2021; Non-executive Member of the Investment Committee and Valuation Committee, Sarona Asset Management Inc. (private equity firm) since September 2019; Advisor, Horizon Investments (asset management and consulting services), August 2018-January 2022; Advisor, Paradigm Asset Management, November 2016-January 2022; Consultant to Independent Trustees of CFVIT and CFST I from September 2016 to June 2020 with respect to CFVIT and to December 2020 with respect to CFST I; Director of Investments/Consultant, Casey Family Programs, April 2016-November 2016; Senior Vice President and Chief Investment Officer, Calvert Investments, August 2008-January 2016; Section Head and Portfolio Manager, General Motors Asset Management, June 1997-August 2008 | 175 | Independent Director, Investment Committee, Health Services for Children with Special Needs, Inc., 2010-2021; Independent Director, (Executive Committee and Chair, Audit Committee), Consumer Credit Counseling Services (formerly Guidewell Financial Solutions), since 2016; Independent Director, (Investment Committee), Sarona Asset Management, since 2019 |
Columbia Select Large Cap Growth Fund | Annual Report 2023
| 33 |
TRUSTEES AND OFFICERS (continued)
(Unaudited)
Independent trustees (continued)
Name,
address,
year of birth | Position held
with the Columbia Funds and
length of service | Principal occupation(s)
during past five years
and other relevant
professional experience | Number of
Funds in the
Columbia Funds
Complex*
overseen | Other directorships
held by Trustee
during the past five years
and other relevant Board experience |
Sandra L. Yeager
c/o Columbia Management
Investment Advisers, LLC
290 Congress Street
Boston, MA 02210
1964 | Trustee since 2017 | Retired; President and founder, Hanoverian Capital, LLC (SEC registered investment advisor firm), 2008-2016; Managing Director, DuPont Capital, 2006-2008; Managing Director, Morgan Stanley Investment Management, 2004-2006; Senior Vice President, Alliance Bernstein, 1990-2004 | 177 | Former Director, NAPE (National Alliance for Partnerships in Equity) Education Foundation, October 2016-October 2020; Advisory Board, Jennersville YMCA, since 2022 |
Interested trustee affiliated with Investment Manager**
Name,
address,
year of birth | Position held with the Columbia Funds and length of service | Principal occupation(s) during the
past five years and other relevant
professional experience | Number of
Funds in the
Columbia Funds
Complex overseen | Other directorships
held by Trustee
during the past
five years and
other relevant Board experience |
Daniel J. Beckman
c/o Columbia Management
Investment Advisers, LLC
290 Congress Street
Boston, MA 02210
1962 | Trustee since November 2021 and President since June 2021 | Vice President – Head of North America Product, Columbia Management Investment Advisers, LLC, since April 2015; President and Principal Executive Officer of the Columbia Funds, since June 2021; officer of Columbia Funds and affiliated funds, 2020-2021 | 177 | Director, Ameriprise Trust Company, since October 2016; Director, Columbia Management Investment Distributors, Inc. since November 2018; Board of Governors, Columbia Wanger Asset Management, LLC since, January 2022; Director, Columbia Threadneedle Canada, Inc., since December 2022 |
| * | The term “Columbia Funds Complex” as used herein includes Columbia Seligman Premium Technology Growth Fund, Tri-Continental Corporation and each series of Columbia Funds Series Trust (CFST), Columbia Funds Series Trust I (CFST I), Columbia Funds Series Trust II (CFST II), Columbia ETF Trust I (CET I), Columbia ETF Trust II (CET II), Columbia Funds Variable Insurance Trust (CFVIT) and Columbia Funds Variable Series Trust II (CFVST II).Messrs. Batejan, Beckman, Gallagher and Hacker and Mses. Blatz, Carlton, Carrig, Flynn, Paglia and Yeager serve as Directors of Columbia Seligman Premium Technology Growth Fund and Tri-Continental Corporation. |
| ** | Interested person (as defined under the 1940 Act) by reason of being an officer, director, security holder and/or employee of the Investment Manager or Ameriprise Financial. |
The Statement of Additional Information has additional information about the Fund’s Board members and is available, without charge, upon request by calling 800.345.6611, visiting columbiathreadneedleus.com/investor/ or contacting your financial intermediary.
| 34 | Columbia Select Large Cap Growth Fund | Annual Report 2023 |
TRUSTEES AND OFFICERS (continued)
(Unaudited)
The Board has appointed officers who are responsible for day-to-day business decisions based on policies it has established. The officers serve at the pleasure of the Board. The following table provides basic information about the Officers of the Fund as of the printing of this report, including principal occupations during the past five years, although their specific titles may have varied over the period. In addition to Mr. Beckman, who is President and Principal Executive Officer, the Fund’s other officers are:
Fund officers
Name,
address and
year of birth | Position and year
first appointed to
position for any Fund
in the Columbia
Funds Complex or a
predecessor thereof | Principal occupation(s) during past five years |
Michael G. Clarke
290 Congress Street
Boston, MA 02210
1969 | Chief Financial Officer and Principal Financial Officer (2009) and Senior Vice President (2019) | Senior Vice President and Head of Global Operations & Investor Services, Columbia Management Investment Advisers, LLC, since March 2022 (previously Vice President, Head of North American Operations, and Co-Head of Global Operations, June 2019 to February 2022 and Vice President – Accounting and Tax, May 2010 - May 2019); senior officer of Columbia Funds and affiliated funds, since 2002. |
Joseph Beranek
5890 Ameriprise Financial Center
Minneapolis, MN 55474
1965 | Treasurer and Chief Accounting Officer (Principal Accounting Officer) (2019) and Principal Financial Officer (2020), CFST, CFST I, CFST II, CFVIT and CFVST II; Assistant Treasurer, CET I and CET II | Vice President – Mutual Fund Accounting and Financial Reporting, Columbia Management Investment Advisers, LLC, since December 2018 and March 2017, respectively. |
Marybeth Pilat
290 Congress Street
Boston, MA 02210
1968 | Treasurer and Chief Accounting Officer (Principal Accounting Officer) and Principal Financial Officer (2020) for CET I and CET II; Assistant Treasurer, CFST, CFST I, CFST II, CFVIT and CFVST II | Vice President – Product Pricing and Administration, Columbia Management Investment Advisers, LLC, since May 2017. |
William F. Truscott
290 Congress Street
Boston, MA 02210
1960 | Senior Vice President (2001) | Formerly, Trustee/Director of Columbia Funds Complex or legacy funds, November 2001-January 1, 2021; Chief Executive Officer, Global Asset Management, Ameriprise Financial, Inc., since September 2012; Chairman of the Board and President, Columbia Management Investment Advisers, LLC, since July 2004 and February 2012, respectively; Chairman of the Board and Chief Executive Officer, Columbia Management Investment Distributors, Inc., since November 2008 and February 2012, respectively; Chairman of the Board and Director, Threadneedle Asset Management Holdings, Sàrl, since March 2013 and December 2008, respectively; senior executive of various entities affiliated with Columbia Threadneedle. |
Christopher O. Petersen
5228 Ameriprise Financial Center
Minneapolis, MN 55474
1970 | Senior Vice President and Assistant Secretary (2021) | Formerly, Trustee/Director of funds within the Columbia Funds Complex, July 1, 2020 - November 22, 2021; Senior Vice President and Assistant General Counsel, Ameriprise Financial, Inc., since September 2021 (previously Vice President and Lead Chief Counsel, January 2015 - September 2021); formerly, President and Principal Executive Officer of the Columbia Funds, 2015 - 2021; officer of Columbia Funds and affiliated funds, since 2007. |
Thomas P. McGuire
290 Congress Street
Boston, MA 02210
1972 | Senior Vice President and Chief Compliance Officer (2012) | Vice President – Asset Management Compliance, Ameriprise Financial, Inc., since May 2010; Chief Compliance Officer, Columbia Acorn/Wanger Funds, since December 2015; formerly, Chief Compliance Officer, Ameriprise Certificate Company, September 2010 – September 2020. |
Ryan C. Larrenaga
290 Congress Street
Boston, MA 02210
1970 | Senior Vice President (2017), Chief Legal Officer (2017), and Secretary (2015) | Vice President and Chief Counsel, Ameriprise Financial, Inc., since August 2018 (previously Vice President and Group Counsel, August 2011 - August 2018); Chief Legal Officer, Columbia Acorn/Wanger Funds, since September 2020; officer of Columbia Funds and affiliated funds, since 2005. |
Columbia Select Large Cap Growth Fund | Annual Report 2023
| 35 |
TRUSTEES AND OFFICERS (continued)
(Unaudited)
Fund officers (continued)
Name,
address and
year of birth | Position and year
first appointed to
position for any Fund
in the Columbia
Funds Complex or a
predecessor thereof | Principal occupation(s) during past five years |
Michael E. DeFao
290 Congress Street
Boston, MA 02210
1968 | Vice President (2011) and Assistant Secretary (2010) | Vice President and Chief Counsel, Ameriprise Financial, Inc., since May 2010; Vice President, Chief Legal Officer and Assistant Secretary, Columbia Management Investment Advisers, LLC, since October 2021 (previously Vice President and Assistant Secretary, May 2010 – September 2021). |
Lyn Kephart-Strong
5228 Ameriprise Financial Center
Minneapolis, MN 55474
1960 | Vice President (2015) | Vice President, Global Investment Operations Services, Columbia Management Investment Advisers, LLC, since 2010; President, Columbia Management Investment Services Corp., since October 2014; President, Ameriprise Trust Company, since January 2017. |
Liquidity Risk Management Program
(Unaudited)
Pursuant to Rule 22e-4 under the 1940 Act, the Fund has adopted a liquidity risk management program (Program). The Program’s principal objectives include assessing, managing and periodically reviewing the Fund’s liquidity risk. Liquidity risk is defined as the risk that the Fund could not meet redemption requests without significant dilution of remaining investors’ interests in the Fund.
The Board has appointed the Investment Manager as the program administrator for the Fund’s Program. The Investment Manager has delegated oversight of the Program to its Liquidity Risk Management Committee (the Committee). At a board meeting during the fiscal period, the Committee provided the Board with a report addressing the operations of the program and assessing its adequacy and effectiveness of implementation for the period January 1, 2022, through December 31, 2022, including:
| • | the Fund had sufficient liquidity to both meet redemptions and operate effectively on behalf of shareholders; |
| • | there were no material changes to the Program during the period; |
| • | the implementation of the Program was effective to manage the Fund’s liquidity risk; and |
| • | the Program operated adequately during the period. |
There can be no assurance that the Program will achieve its objectives in the future. Please refer to the Fund’s prospectus for more information regarding the Fund’s exposure to liquidity risk and other principal risks to which an investment in the Fund may be subject.
| 36 | Columbia Select Large Cap Growth Fund | Annual Report 2023 |
[THIS PAGE INTENTIONALLY LEFT BLANK]
[THIS PAGE INTENTIONALLY LEFT BLANK]
[THIS PAGE INTENTIONALLY LEFT BLANK]
Columbia Select Large Cap Growth Fund
P.O. Box 219104
Kansas City, MO 64121-9104
Please read and consider the investment objectives, risks, charges and expenses for any fund carefully before investing. For a prospectus and summary prospectus, which contains this and other important information about the Fund, go to
columbiathreadneedleus.com/investor/. The Fund is distributed by Columbia Management Investment Distributors, Inc., member FINRA, and managed by Columbia Management Investment Advisers, LLC.
Columbia Threadneedle Investments (Columbia Threadneedle) is the global brand name of the Columbia and Threadneedle group of companies. All rights reserved.
© 2023 Columbia Management Investment Advisers, LLC.
columbiathreadneedleus.com/investor/

Annual Report
March 31, 2023
Multi-Manager Growth Strategies Fund
Not FDIC or NCUA Insured • No Financial Institution Guarantee • May Lose Value
If you elect to receive the shareholder report for Multi-Manager Growth Strategies Fund (the Fund) in paper, mailed to you, the Fund mails one shareholder report to each shareholder address, unless such shareholder elects to receive shareholder reports from the Fund electronically via e-mail or by having a paper notice mailed to you (Postcard Notice) that your Fund’s shareholder report is available at the Columbia funds’ website (columbiathreadneedleus.com/investor/). If you would like more than one report in paper to be mailed to you, or would like to elect to receive reports via e-mail or access them through Postcard Notice, please call shareholder services at 800.345.6611 and additional reports will be sent to you.
Proxy voting policies and procedures
The policy of the Board of Trustees is to vote the proxies of the companies in which the Fund holds investments consistent with the procedures as stated in the Statement of Additional Information (SAI). You may obtain a copy of the SAI without charge by calling 800.345.6611; contacting your financial intermediary; visiting columbiathreadneedleus.com/investor/; or searching the website of the Securities and Exchange Commission (SEC) at sec.gov. Information regarding how the Fund voted proxies relating to portfolio securities is filed with the SEC by August 31st for the most recent 12-month period ending June 30th of that year, and is available without charge by visiting columbiathreadneedleus.com/investor/, or searching the website of the SEC at sec.gov.
Quarterly schedule of investments
The Fund files a complete schedule of portfolio holdings with the SEC for the first and third quarters of each fiscal year on Form N-PORT. The Fund’s Form N-PORT filings are available on the SEC’s website at sec.gov. The Fund’s complete schedule of portfolio holdings, as filed on Form N-PORT, is available on columbiathreadneedleus.com/investor/ or can also be obtained without charge, upon request, by calling 800.345.6611.
Additional Fund information
For more information about the Fund, please visit columbiathreadneedleus.com/investor/ or call 800.345.6611. Customer Service Representatives are available to answer your questions Monday through Friday from 8 a.m. to 7 p.m. Eastern time.
Fund investment manager
Columbia Management Investment Advisers, LLC (the Investment Manager)
290 Congress Street
Boston, MA 02210
Fund distributor
Columbia Management Investment Distributors, Inc.
290 Congress Street
Boston, MA 02210
Fund transfer agent
Columbia Management Investment Services Corp.
P.O. Box 219104
Kansas City, MO 64121-9104
Multi-Manager Growth Strategies Fund | Annual Report 2023
Fund at a Glance
(Unaudited)
Investment objective
The Fund seeks long-term capital appreciation.
Portfolio management
Loomis, Sayles & Company, L.P.
Aziz Hamzaogullari, CFA
Los Angeles Capital Management LLC
Thomas Stevens, CFA
Hal Reynolds, CFA
Daniel Allen, CFA
Daniel Arche, CFA
J.P. Morgan Investment Management Inc.
Giri Devulapally, CFA
Holly Fleiss
Larry Lee
Robert Maloney, CFA
Joseph Wilson
Morningstar style boxTM
The Morningstar Style Box is based on a fund’s portfolio holdings. For equity funds, the vertical axis shows the market capitalization of the stocks owned, and the horizontal axis shows investment style (value, blend, or growth). Information shown is based on the most recent data provided by Morningstar.
© 2023 Morningstar, Inc. All rights reserved. The Morningstar information contained herein: (1) is proprietary to Morningstar and/or its content providers; (2) may not be copied or distributed; and (3) is not warranted to be accurate, complete or timely. Neither Morningstar nor its content providers are responsible for any damages or losses arising from any use of this information.
| Average annual total returns (%) (for the period ended March 31, 2023) |
| | | Inception | 1 Year | 5 Years | 10 Years | |
| Institutional Class* | 01/03/17 | -9.89 | 11.02 | 12.70 | |
| Institutional 3 Class* | 12/18/19 | -9.78 | 11.09 | 12.73 | |
| Russell 1000 Growth Index | | -10.90 | 13.66 | 14.59 | |
All results shown assume reinvestment of distributions during the period. Returns do not reflect the deduction of taxes that a shareholder may pay on Fund distributions or on the redemption of Fund shares. Performance results reflect the effect of any fee waivers or reimbursements of Fund expenses by Columbia Management Investment Advisers, LLC and/or any of its affiliates. Absent these fee waivers or expense reimbursement arrangements, performance results would have been lower.
The performance information shown represents past performance and is not a guarantee of future results. The investment return and principal value of your investment will fluctuate so that your shares, when redeemed, may be worth more or less than their original cost. Current performance may be lower or higher than the performance information shown. You may obtain performance information current to the most recent month-end by contacting your financial intermediary, visiting columbiathreadneedleus.com/investor/ or calling 800.345.6611.
| * | The returns shown for periods prior to the share class inception date (including returns for the Life of the Fund, if shown, which are since Fund inception) include the returns of the Fund’s oldest share class. Returns shown for periods prior to the inception date of the Fund’s Institutional Class shares include the returns of the Fund’s Class A shares for the period from April 20, 2012 (the inception date of the Fund) through January 2, 2017. Returns shown for periods prior to the inception date of the Fund’s Institutional 3 Class shares include the returns of the Fund’s Class A shares for the period from April 20, 2012 through January 2, 2017 and the returns of the Institutional Class shares from January 3, 2017 through December 17, 2019. Class A shares were offered prior to the Fund’s Institutional Class shares but have since been merged into the Fund’s Institutional Class shares. These returns are adjusted to reflect any higher class-related operating expenses of the newer share classes, as applicable. Please visit columbiathreadneedleus.com/investor/investment-products/mutual-funds/appended-performance for more information. |
The Russell 1000 Growth Index, an unmanaged index, measures the performance of those Russell 1000 Index companies with higher price-to-book ratios and higher forecasted growth values.
Indices are not available for investment, are not professionally managed and do not reflect sales charges, fees, brokerage commissions, taxes or other expenses of investing. Securities in the Fund may not match those in an index.
Multi-Manager Growth Strategies Fund | Annual Report 2023
| 3 |
Fund at a Glance (continued)
(Unaudited)
Performance of a hypothetical $10,000 investment (March 31, 2013 — March 31, 2023)
The chart above shows the change in value of a hypothetical $10,000 investment in Institutional Class shares of Multi-Manager Growth Strategies Fund during the stated time period, and does not reflect the deduction of taxes that a shareholder may pay on Fund distributions or on the redemption of Fund shares.
| Portfolio breakdown (%) (at March 31, 2023) |
| Common Stocks | 98.8 |
| Money Market Funds | 1.2 |
| Total | 100.0 |
Percentages indicated are based upon total investments excluding investments in derivatives, if any. The Fund’s portfolio composition is subject to change.
| Equity sector breakdown (%) (at March 31, 2023) |
| Communication Services | 11.7 |
| Consumer Discretionary | 16.2 |
| Consumer Staples | 4.1 |
| Energy | 0.7 |
| Financials | 9.1 |
| Health Care | 12.1 |
| Industrials | 8.7 |
| Information Technology | 36.3 |
| Materials | 0.9 |
| Real Estate | 0.2 |
| Total | 100.0 |
Percentages indicated are based upon total equity investments. The Fund’s portfolio composition is subject to change.
| 4 | Multi-Manager Growth Strategies Fund | Annual Report 2023 |
Manager Discussion of Fund Performance
(Unaudited)
Columbia Management Investment Advisers, LLC (CMIA) serves as the investment manager for the Fund and attempts to achieve the Fund’s objective by selecting one or more subadvisers to manage sleeves of the Fund independently of each other. CMIA managed a portion of the Fund until September 30, 2022. Effective October 3, 2022, J.P. Morgan Investment Management Inc. (JPMIM) assumed responsibility for managing a portion of the Fund’s assets. As of March 31, 2023, JPMIM, Loomis, Sayles & Company, L.P. (Loomis Sayles) and Los Angeles Capital Management LLC (Los Angeles Capital) managed approximately 27.37%, 35.39% and 37.24% of the portfolio, respectively.
For the 12-month period that ended March 31, 2023, Institutional Class shares of Multi-Manager Growth Strategies Fund returned -9.89%. The Fund outperformed its benchmark, the Russell 1000 Growth Index, which returned -10.90% for the same time period.
Market overview
Driven by a series of interest rate hikes by the U.S. Federal Reserve (Fed), decades-high inflation, persistent recession worries, climbing U.S. Treasury yields, supply-chain disruptions, volatile commodity prices, geopolitical tensions resulting from Russia’s invasion of Ukraine, and elevated concerns around China’s zero-COVID policy, the U.S. equity market, as measured by the S&P 500 Index, posted negative returns during the annual period ended March 31, 2023. On slowing yet relatively resilient corporate earnings reports, a still-tight U.S. labor market, an economic reopening in China, hopes that Fed interest rate hikes would be smaller and soon pause, and warming notions of a soft economic landing, there were brief respites of equity market rallies, such as those in July into early August 2022, in October and November 2022, and then in January 2023. However, as the realization that interest rates could remain higher for longer set in with investors even as inflation decreased, albeit from high levels, stocks ticked lower again in February 2023. March brought new concerns as regulators shut down tech-focused Silicon Valley Bank and crypto-focused Signature Bank following runs on their deposits. In the days following, several banks, including First Republic and Credit Suisse, were rescued by competitors. At the March Federal Open Market Committee meeting, the Fed raised the federal funds rate by 0.25% to a range of 4.75-5.00%, but also suggested future rate increases this year may be limited. With the Fed taking a less hawkish tone and global banking jitters easing, U.S. equities climbed in March.
While risky assets initially rallied in the opening weeks of 2023, market participants turned their focus to higher quality, larger capitalization growth businesses, which had their strongest period of outperformance since the early stages of the pandemic in the second quarter of 2020.
Two observations have been particularly noteworthy for the equity market. First, while growth-oriented equities trailed their value counterparts in 2022, investor preferences have more recently favored growth. Value generally requires a stable or improving economic environment to generate excess returns. When economic conditions weaken, investors often turn to higher quality growth stocks, particularly those with the strongest long-term growth prospects. Value stocks that benefited from positive operating leverage in 2022 now face headwinds, as costs are projected to grow faster than revenues. The second notable event is the failure of Silicon Valley Bank and Signature Bank. While each bank had idiosyncratic characteristics which contributed to its downfall, regional banks have felt the pressures of an inverted yield curve. Borrowing short and lending long is a profitable strategy for banks during normal times when inflation is under control and the yield curve maintains a positive slope. However, the strategy faces significant risks when central banks feel compelled to raise short-term rates to combat inflation, even at the expense of economic growth.
Unwinding stimulative monetary policies may be more difficult than initiating them. Guaranteeing deposits and creating new lending programs are designed to constrain current risks in the banking system. However, in our view, these programs, like others which preceded them, create new risks to manage. It remains to be seen whether the Fed’s current efforts to subdue inflation can be fulfilled without leading to a rise in credit problems.
Loomis Sayles
Our portion of the Fund outperformed the benchmark during the 12-month period that ended March 31, 2023.
Multi-Manager Growth Strategies Fund | Annual Report 2023
| 5 |
Manager Discussion of Fund Performance (continued)
(Unaudited)
Notable contributors in our portion of the Fund during the period
| • | Stock selection contributed most to performance in our portion of the Fund, particularly within the communication services, industrials, health care, consumer staples, consumer discretionary, information technology and financials sectors. |
| • | Allocations to the health care, consumer discretionary and industrials sectors contributed positively to relative performance. |
| • | Individual holdings that contributed most to performance during the period included commercial and defense aerospace company Boeing Co., energy drink company Monster Beverage Corp. and online entertainment streaming platform Netflix, Inc. |
Notable detractors in our portion of the Fund during the period
| • | Allocations to the communication services, information technology and financials sectors detracted from relative performance. |
| • | Individual securities that detracted most from performance in our portion of the Fund during the period included online retailing giant Amazon.com, Inc., Google-parent Alphabet, Inc. and electric vehicle company Tesla, Inc. |
Los Angeles Capital
Our portion of the Fund outperformed the benchmark for the twelve-month period that ended March 31, 2023.
Notable contributors in our portion of the Fund during the period
| • | The financials, communication services and retail sectors were among the three strongest contributing sectors to the portfolio’s performance on a relative basis. The financials sector returned a positive absolute return, while communication services and retail returned negative absolute returns for the portfolio. |
| ○ | Positive contribution within the financials sector was driven by strong selection within the sector. |
| ○ | Positive contributions within the communication services and retail sectors were driven by both sector allocation and stock selection. |
| ○ | As economic conditions softened during the period, investors penalized economically-sensitive segments, such as retail and communication services, and the portfolio’s average underweight to both sectors contributed positively to excess return. |
| • | An average overweight to insurance company Arch Capital Group Ltd. and average underweights to online retailer Amazon.com and electric vehicle company Tesla provided the strongest positive contributions to the portfolio’s relative performance over the period. |
Notable detractors in our portion of the Fund during the period
| • | Capital goods, technology and business services were among the three sectors that detracted most from the portfolio’s performance on a relative basis. |
| ○ | All three sectors generated negative absolute returns for the portfolio. |
| ○ | Stock selection across the three sector groupings held performance back during the period. |
| • | An average underweight in semiconductor company NVIDIA Corp. and overweights in semiconductor company QUALCOMM, Inc. and cybersecurity software firm Crowdstrike Holdings, Inc. held performance back in our portion of the fund during the period. |
JPMIM
We began managing a portion of the Fund’s assets on October 3, 2022. From that time through the close of the reporting period, our portion of the Fund underperformed the benchmark.
| 6 | Multi-Manager Growth Strategies Fund | Annual Report 2023 |
Manager Discussion of Fund Performance (continued)
(Unaudited)
Notable detractors in our portion of the Fund
| • | Stock selection in the financials sector was the largest detractor to performance during our reporting period. We were overweight in the sector, which also detracted from relative returns. |
| • | Stock selection in the industrials sector also weighed on results, along with an underweighting to the sector, relative to the benchmark. |
| • | An overweight position in energy also detracted, as did stock selection within the sector. |
| • | Individual positions that detracted most from performance in our portion of the Fund during our reporting period included financial services companies SVB Financial Group and Charles Schwab Corp. and oil and gas exploration and production company ConocoPhillips Co. |
Notable contributors in our portion of the Fund
| • | Stock selection in the health care sector contributed during our reporting period. (Our overweight allocation to the sector detracted somewhat, however.) |
| • | Stock selection within the consumer discretionary sector, as well as an overweight position to the sector, added to performance in our portion of the Fund during our reporting period. |
| • | Stock selection within the basic materials sector was a contributor. (Our overweight position was a marginal detractor, however.) |
| • | Individual holdings that contributed most to performance in our portion of the Fund during our reporting period included electric vehicle company Tesla, online retail giant Amazon.com and software company Oracle Corp. |
| • | Our underweight positions, relative to the benchmark, in Tesla and Amazon drove their respective contributions as both companies returned disappointing results during our reporting period. |
CMIA
We managed a portion of the Fund from April 1, 2022 through September 30, 2022. During that period, our portion of the Fund underperformed the benchmark.
Notable detractors in our portion of the Fund
| • | Stock selection drove our underperformance of the benchmark during our reporting period, particularly within the information technology, health care, consumer discretionary and communication services sectors. |
| • | Top individual detractors during the period included online dating app provider Match Group, Inc., health care screening and diagnostics company Exact Sciences Corp., orthodontic products manufacturer Align Technology, Inc., cloud-based communications company RingCentral, Inc. and biotechnology company Illumina, Inc. |
Notable contributors in our portion of the Fund
| • | Sector allocations overall contributed to relative performance during our reporting period, most notably overweighted positions within the health care and industrials sectors and an underweight in the communication services sector. |
| • | Top individual contributors to performance during the period included an out-of-benchmark position in biotechnology companies BioMarin Pharmaceutical, Inc. and Sarepta Therapeutics, Inc., real estate services company CoStar Group, Inc., heating and cooling manufacturer Trane Technologies PLC and pharmaceutical giant Eli Lilly and Company. |
Market risk may affect a single issuer, sector of the economy, industry or the market as a whole. Foreign investments subject the Fund to risks, including political, economic, market, social and others within a particular country, as well as to currency instabilities and less stringent financial and accounting standards generally applicable to U.S. issuers. Risks are enhanced for emerging market issuers. The Fund’s use of leverage allows for investment exposure in excess of net assets, thereby magnifying volatility of returns and risk of loss. Non-investment-grade (high-yield or junk) securities present greater price volatility and more risk to principal and income than higher rated securities. Convertible securities are subject to issuer default risk. A rise in interest rates may result in a price decline of convertible securities held by the Fund. Falling rates may result in the Fund investing in lower yielding securities, lowering the
Multi-Manager Growth Strategies Fund | Annual Report 2023
| 7 |
Manager Discussion of Fund Performance (continued)
(Unaudited)
Fund’s income and yield. The Fund may also be forced to convert a convertible security at an inopportune time, which may decrease the Fund’s return. Investing in derivatives is a specialized activity that involves special risks, which may result in significant losses. See the Fund’s prospectus for more information on these and other risks.
The views expressed in this report reflect the current views of the respective parties who have contributed to this report. These views are not guarantees of future performance and involve certain risks, uncertainties and assumptions that are difficult to predict, so actual outcomes and results may differ significantly from the views expressed. These views are subject to change at any time based upon economic, market or other conditions and the respective parties disclaim any responsibility to update such views. These views may not be relied on as investment advice and, because investment decisions for a Columbia fund are based on numerous factors, may not be relied on as an indication of trading intent on behalf of any particular Columbia fund. References to specific securities should not be construed as a recommendation or investment advice.
| 8 | Multi-Manager Growth Strategies Fund | Annual Report 2023 |
Understanding Your Fund’s Expenses
(Unaudited)
As an investor, you incur two types of costs. There are shareholder transaction costs, which may include redemption fees. There are also ongoing fund costs, which generally include management fees, distribution and/or service fees, and other fund expenses. The following information is intended to help you understand your ongoing costs (in dollars) of investing in the Fund and to help you compare these costs with the ongoing costs of investing in other mutual funds.
Analyzing your Fund’s expenses
To illustrate these ongoing costs, we have provided examples and calculated the expenses paid by investors in each share class of the Fund during the period. The actual and hypothetical information in the table is based on an initial investment of $1,000 at the beginning of the period indicated and held for the entire period. Expense information is calculated two ways and each method provides you with different information. The amount listed in the “Actual” column is calculated using the Fund’s actual operating expenses and total return for the period. You may use the Actual information, together with the amount invested, to estimate the expenses that you paid over the period. Simply divide your account value by $1,000 (for example, an $8,600 account value divided by $1,000 = 8.6), then multiply the results by the expenses paid during the period under the “Actual” column. The amount listed in the “Hypothetical” column assumes a 5% annual rate of return before expenses (which is not the Fund’s actual return) and then applies the Fund’s actual expense ratio for the period to the hypothetical return. You should not use the hypothetical account values and expenses to estimate either your actual account balance at the end of the period or the expenses you paid during the period. See “Compare with other funds” below for details on how to use the hypothetical data.
Compare with other funds
Since all mutual funds are required to include the same hypothetical calculations about expenses in shareholder reports, you can use this information to compare the ongoing cost of investing in the Fund with other funds. To do so, compare the hypothetical example with the 5% hypothetical examples that appear in the shareholder reports of other funds. As you compare hypothetical examples of other funds, it is important to note that hypothetical examples are meant to highlight the ongoing costs of investing in a fund only and do not reflect any transaction costs, such as redemption or exchange fees. Therefore, the hypothetical calculations are useful in comparing ongoing costs only, and will not help you determine the relative total costs of owning different funds. If transaction costs were included in these calculations, your costs would be higher.
| October 1, 2022 — March 31, 2023 |
| | Account value at the
beginning of the
period ($) | Account value at the
end of the
period ($) | Expenses paid during
the period ($) | Fund’s annualized
expense ratio (%) |
| | Actual | Hypothetical | Actual | Hypothetical | Actual | Hypothetical | Actual |
| Institutional Class | 1,000.00 | 1,000.00 | 1,192.40 | 1,021.24 | 4.04 | 3.73 | 0.74 |
| Institutional 3 Class | 1,000.00 | 1,000.00 | 1,192.40 | 1,021.64 | 3.61 | 3.33 | 0.66 |
Expenses paid during the period are equal to the annualized expense ratio for each class as indicated above, multiplied by the average account value over the period and then multiplied by the number of days in the Fund’s most recent fiscal half year and divided by 365.
Expenses do not include fees and expenses incurred indirectly by the Fund from its investment in underlying funds, including affiliated and non-affiliated pooled investment vehicles, such as mutual funds and exchange-traded funds.
Had Columbia Management Investment Advisers, LLC and/or certain of its affiliates not waived/reimbursed certain fees and expenses, account value at the end of the period would have been reduced.
The Fund is offered only through certain wrap fee programs sponsored and/or managed by Ameriprise Financial, Inc. or its affiliates. Participants in wrap fee programs pay other fees that are not included in the above table. Please refer to the wrap program documents for information about the fees charged.
Multi-Manager Growth Strategies Fund | Annual Report 2023
| 9 |
Portfolio of Investments
March 31, 2023
(Percentages represent value of investments compared to net assets)
Investments in securities
| Common Stocks 98.9% |
| Issuer | Shares | Value ($) |
| Communication Services 11.6% |
| Entertainment 3.1% |
| Netflix, Inc.(a) | 229,533 | 79,299,061 |
| Walt Disney Co. (The)(a) | 370,772 | 37,125,400 |
| Total | | 116,424,461 |
| Interactive Media & Services 8.2% |
| Alphabet, Inc., Class A(a) | 893,442 | 92,676,739 |
| Alphabet, Inc., Class C(a) | 832,381 | 86,567,624 |
| Match Group, Inc.(a) | 37,300 | 1,431,947 |
| Meta Platforms, Inc., Class A(a) | 608,426 | 128,949,807 |
| Snap, Inc., Class A(a) | 279,906 | 3,137,746 |
| Total | | 312,763,863 |
| Media 0.3% |
| Trade Desk, Inc. (The), Class A(a) | 181,265 | 11,040,851 |
| Total Communication Services | 440,229,175 |
| Consumer Discretionary 16.0% |
| Automobiles 3.2% |
| Tesla, Inc.(a) | 586,585 | 121,692,924 |
| Broadline Retail 5.8% |
| Alibaba Group Holding Ltd., ADR(a) | 178,240 | 18,212,563 |
| Amazon.com, Inc.(a) | 1,708,309 | 176,451,237 |
| Etsy, Inc.(a) | 61,972 | 6,899,343 |
| MercadoLibre, Inc.(a) | 13,639 | 17,977,020 |
| Total | | 219,540,163 |
| Diversified Consumer Services 0.2% |
| H&R Block, Inc. | 252,597 | 8,904,044 |
| Hotels, Restaurants & Leisure 3.9% |
| Airbnb, Inc., Class A(a) | 125,106 | 15,563,186 |
| Booking Holdings, Inc.(a) | 5,624 | 14,917,154 |
| Boyd Gaming Corp. | 13,475 | 864,017 |
| Chipotle Mexican Grill, Inc.(a) | 8,918 | 15,234,530 |
| Hilton Worldwide Holdings, Inc. | 5,121 | 721,395 |
| Marriott International, Inc., Class A | 81,672 | 13,560,819 |
| McDonald’s Corp. | 25,104 | 7,019,330 |
| Six Flags Entertainment Corp.(a) | 77,227 | 2,062,733 |
| Starbucks Corp. | 365,195 | 38,027,755 |
| Common Stocks (continued) |
| Issuer | Shares | Value ($) |
| Travel + Leisure Co. | 156,058 | 6,117,474 |
| Wendy’s Co. (The) | 133,402 | 2,905,496 |
| Yum China Holdings, Inc. | 174,258 | 11,046,215 |
| Yum! Brands, Inc. | 148,927 | 19,670,278 |
| Total | | 147,710,382 |
| Household Durables 0.5% |
| PulteGroup, Inc. | 40,592 | 2,365,702 |
| Toll Brothers, Inc. | 212,489 | 12,755,715 |
| TopBuild Corp.(a) | 17,345 | 3,610,188 |
| Total | | 18,731,605 |
| Specialty Retail 2.0% |
| AutoZone, Inc.(a) | 10,001 | 24,583,958 |
| Home Depot, Inc. (The) | 3,835 | 1,131,785 |
| Lowe’s Companies, Inc. | 164,047 | 32,804,479 |
| O’Reilly Automotive, Inc.(a) | 4,949 | 4,201,602 |
| TJX Companies, Inc. (The) | 50,476 | 3,955,299 |
| Ulta Beauty, Inc.(a) | 16,815 | 9,175,441 |
| Total | | 75,852,564 |
| Textiles, Apparel & Luxury Goods 0.4% |
| Columbia Sportswear Co. | 25,575 | 2,307,888 |
| lululemon athletica, Inc.(a) | 152 | 55,357 |
| NIKE, Inc., Class B | 70,338 | 8,626,252 |
| Tapestry, Inc. | 157,098 | 6,772,495 |
| Total | | 17,761,992 |
| Total Consumer Discretionary | 610,193,674 |
| Consumer Staples 4.1% |
| Beverages 2.7% |
| Brown-Forman Corp., Class B | 94,586 | 6,079,042 |
| Coca-Cola Co. (The) | 336,307 | 20,861,123 |
| Monster Beverage Corp.(a) | 1,156,208 | 62,446,794 |
| PepsiCo, Inc. | 77,395 | 14,109,109 |
| Total | | 103,496,068 |
| Consumer Staples Distribution & Retail 0.5% |
| Costco Wholesale Corp. | 21,198 | 10,532,650 |
| Target Corp. | 55,931 | 9,263,852 |
| Total | | 19,796,502 |
The accompanying Notes to Financial Statements are an integral part of this statement.
| 10 | Multi-Manager Growth Strategies Fund | Annual Report 2023 |
Portfolio of Investments (continued)
March 31, 2023
| Common Stocks (continued) |
| Issuer | Shares | Value ($) |
| Food Products 0.4% |
| Hershey Co. (The) | 39,033 | 9,930,386 |
| Lamb Weston Holdings, Inc. | 56,956 | 5,953,041 |
| Total | | 15,883,427 |
| Household Products 0.2% |
| Procter & Gamble Co. (The) | 53,670 | 7,980,192 |
| Personal Care Products 0.1% |
| Estee Lauder Companies, Inc. (The), Class A | 9,483 | 2,337,180 |
| Tobacco 0.2% |
| Altria Group, Inc. | 123,770 | 5,522,617 |
| Total Consumer Staples | 155,015,986 |
| Energy 0.7% |
| Oil, Gas & Consumable Fuels 0.7% |
| Cheniere Energy, Inc. | 43,397 | 6,839,367 |
| ConocoPhillips Co. | 184,260 | 18,280,435 |
| PDC Energy, Inc. | 2,955 | 189,652 |
| Total | | 25,309,454 |
| Total Energy | 25,309,454 |
| Financials 9.0% |
| Capital Markets 2.5% |
| Blackstone, Inc. | 97,831 | 8,593,475 |
| Charles Schwab Corp. (The) | 132,265 | 6,928,041 |
| FactSet Research Systems, Inc. | 56,701 | 23,536,018 |
| MarketAxess Holdings, Inc. | 10,150 | 3,971,594 |
| Morgan Stanley | 148,863 | 13,070,171 |
| MSCI, Inc. | 31,459 | 17,607,288 |
| SEI Investments Co. | 322,993 | 18,588,247 |
| Tradeweb Markets, Inc., Class A | 60,795 | 4,804,021 |
| Total | | 97,098,855 |
| Consumer Finance 0.2% |
| American Express Co. | 18,277 | 3,014,791 |
| Capital One Financial Corp. | 47,414 | 4,559,330 |
| Total | | 7,574,121 |
| Common Stocks (continued) |
| Issuer | Shares | Value ($) |
| Financial Services 5.5% |
| Block, Inc., Class A(a) | 349,701 | 24,006,974 |
| FleetCor Technologies, Inc.(a) | 82 | 17,290 |
| MasterCard, Inc., Class A | 111,609 | 40,559,827 |
| PayPal Holdings, Inc.(a) | 399,977 | 30,374,253 |
| Visa, Inc., Class A | 498,147 | 112,312,222 |
| Western Union Co. (The) | 287,829 | 3,209,293 |
| Total | | 210,479,859 |
| Insurance 0.8% |
| Aon PLC, Class A | 12,607 | 3,974,861 |
| Arch Capital Group Ltd.(a) | 80,787 | 5,483,014 |
| Everest Re Group Ltd. | 14,009 | 5,015,502 |
| Marsh & McLennan Companies, Inc. | 13,132 | 2,187,135 |
| Progressive Corp. (The) | 60,288 | 8,624,801 |
| RenaissanceRe Holdings Ltd. | 18,905 | 3,787,428 |
| Total | | 29,072,741 |
| Total Financials | 344,225,576 |
| Health Care 11.9% |
| Biotechnology 4.8% |
| AbbVie, Inc. | 201,817 | 32,163,575 |
| Alnylam Pharmaceuticals, Inc.(a) | 16,157 | 3,236,570 |
| Amgen, Inc. | 30,771 | 7,438,889 |
| Exact Sciences Corp.(a) | 132,217 | 8,965,635 |
| Exelixis, Inc.(a) | 234,130 | 4,544,463 |
| Horizon Therapeutics PLC(a) | 6,162 | 672,521 |
| Incyte Corp.(a) | 40,501 | 2,927,007 |
| Moderna, Inc.(a) | 14,627 | 2,246,415 |
| Neurocrine Biosciences, Inc.(a) | 24,107 | 2,440,111 |
| Regeneron Pharmaceuticals, Inc.(a) | 73,347 | 60,267,029 |
| Sarepta Therapeutics, Inc.(a) | 32,502 | 4,479,751 |
| Seagen, Inc.(a) | 32,295 | 6,538,769 |
| Vertex Pharmaceuticals, Inc.(a) | 146,642 | 46,202,495 |
| Total | | 182,123,230 |
The accompanying Notes to Financial Statements are an integral part of this statement.
Multi-Manager Growth Strategies Fund | Annual Report 2023
| 11 |
Portfolio of Investments (continued)
March 31, 2023
| Common Stocks (continued) |
| Issuer | Shares | Value ($) |
| Health Care Equipment & Supplies 1.4% |
| Align Technology, Inc.(a) | 40,700 | 13,599,498 |
| DexCom, Inc.(a) | 68,482 | 7,956,239 |
| Globus Medical, Inc., Class A(a) | 6,676 | 378,128 |
| Intuitive Surgical, Inc.(a) | 109,937 | 28,085,605 |
| Stryker Corp. | 19,119 | 5,457,901 |
| Total | | 55,477,371 |
| Health Care Providers & Services 1.8% |
| CVS Health Corp. | 68,591 | 5,096,997 |
| Encompass Health Corp. | 27,920 | 1,510,472 |
| Enhabit, Inc.(a) | 20,001 | 278,214 |
| HCA Healthcare, Inc. | 54,313 | 14,321,252 |
| Humana, Inc. | 277 | 134,472 |
| McKesson Corp. | 39,557 | 14,084,270 |
| Molina Healthcare, Inc.(a) | 19,810 | 5,298,977 |
| UnitedHealth Group, Inc. | 57,752 | 27,293,018 |
| Total | | 68,017,672 |
| Health Care Technology 0.1% |
| Veeva Systems Inc., Class A(a) | 24,780 | 4,554,316 |
| Life Sciences Tools & Services 1.3% |
| Agilent Technologies, Inc. | 83,495 | 11,550,698 |
| Illumina, Inc.(a) | 112,040 | 26,054,902 |
| IQVIA Holdings, Inc.(a) | 11,098 | 2,207,281 |
| Mettler-Toledo International, Inc.(a) | 1,511 | 2,312,147 |
| Thermo Fisher Scientific, Inc. | 4,753 | 2,739,487 |
| Waters Corp.(a) | 6,530 | 2,021,884 |
| West Pharmaceutical Services, Inc. | 9,480 | 3,284,536 |
| Total | | 50,170,935 |
| Pharmaceuticals 2.5% |
| Eli Lilly & Co. | 66,127 | 22,709,334 |
| Novartis AG, ADR | 215,235 | 19,801,620 |
| Novo Nordisk A/S, ADR | 161,756 | 25,741,850 |
| Roche Holding AG, ADR | 489,562 | 17,558,141 |
| Zoetis, Inc. | 46,534 | 7,745,119 |
| Total | | 93,556,064 |
| Total Health Care | 453,899,588 |
| Common Stocks (continued) |
| Issuer | Shares | Value ($) |
| Industrials 8.6% |
| Aerospace & Defense 2.1% |
| Boeing Co. (The)(a) | 372,886 | 79,212,173 |
| Lockheed Martin Corp. | 2,450 | 1,158,188 |
| Total | | 80,370,361 |
| Air Freight & Logistics 1.2% |
| Expeditors International of Washington, Inc. | 215,196 | 23,697,383 |
| United Parcel Service, Inc., Class B | 111,626 | 21,654,328 |
| Total | | 45,351,711 |
| Building Products 0.3% |
| Allegion PLC | 32,015 | 3,416,961 |
| Carlisle Companies, Inc. | 2,195 | 496,224 |
| Trane Technologies PLC | 52,421 | 9,644,415 |
| Total | | 13,557,600 |
| Commercial Services & Supplies 0.3% |
| Cintas Corp. | 17,122 | 7,922,007 |
| Tetra Tech, Inc. | 15,471 | 2,272,845 |
| Total | | 10,194,852 |
| Construction & Engineering 0.1% |
| AECOM | 43,943 | 3,705,274 |
| Electrical Equipment 0.2% |
| Rockwell Automation, Inc. | 24,762 | 7,266,409 |
| Ground Transportation 0.6% |
| Landstar System, Inc. | 18,534 | 3,322,405 |
| Uber Technologies, Inc.(a) | 600,531 | 19,036,832 |
| Total | | 22,359,237 |
| Industrial Conglomerates 0.2% |
| Honeywell International, Inc. | 40,173 | 7,677,864 |
| Machinery 1.8% |
| Allison Transmission Holdings, Inc. | 70,165 | 3,174,265 |
| Caterpillar, Inc. | 44,627 | 10,212,443 |
| Deere & Co. | 121,132 | 50,012,980 |
| Donaldson Co., Inc. | 32,195 | 2,103,621 |
| Illinois Tool Works, Inc. | 11,122 | 2,707,651 |
| Otis Worldwide Corp. | 15,418 | 1,301,279 |
| Xylem, Inc. | 6,214 | 650,606 |
| Total | | 70,162,845 |
The accompanying Notes to Financial Statements are an integral part of this statement.
| 12 | Multi-Manager Growth Strategies Fund | Annual Report 2023 |
Portfolio of Investments (continued)
March 31, 2023
| Common Stocks (continued) |
| Issuer | Shares | Value ($) |
| Professional Services 1.1% |
| Automatic Data Processing, Inc. | 38,945 | 8,670,325 |
| Equifax, Inc. | 16,181 | 3,282,154 |
| Paychex, Inc. | 156,904 | 17,979,630 |
| Paycom Software, Inc.(a) | 37,288 | 11,335,925 |
| Total | | 41,268,034 |
| Trading Companies & Distributors 0.7% |
| Core & Main, Inc., Class A(a) | 200,124 | 4,622,864 |
| Fastenal Co. | 77,711 | 4,191,731 |
| United Rentals, Inc. | 6,479 | 2,564,129 |
| W.W. Grainger, Inc. | 17,913 | 12,338,654 |
| WESCO International, Inc. | 12,142 | 1,876,425 |
| Total | | 25,593,803 |
| Total Industrials | 327,507,990 |
| Information Technology 35.9% |
| Communications Equipment 0.3% |
| Arista Networks, Inc.(a) | 66,392 | 11,144,561 |
| Electronic Equipment, Instruments & Components 0.4% |
| Amphenol Corp., Class A | 163,427 | 13,355,254 |
| Vontier Corp. | 46,511 | 1,271,611 |
| Total | | 14,626,865 |
| IT Services 2.1% |
| Accenture PLC, Class A | 114,226 | 32,646,933 |
| Cognizant Technology Solutions Corp., Class A | 107,365 | 6,541,749 |
| Gartner, Inc.(a) | 2,497 | 813,448 |
| MongoDB, Inc.(a) | 22,348 | 5,209,766 |
| Shopify, Inc., Class A(a) | 642,522 | 30,802,505 |
| VeriSign, Inc.(a) | 10,108 | 2,136,124 |
| Wix.com Ltd.(a) | 9,942 | 992,211 |
| Total | | 79,142,736 |
| Semiconductors & Semiconductor Equipment 9.8% |
| Advanced Micro Devices, Inc.(a) | 194,200 | 19,033,542 |
| Allegro MicroSystems, Inc.(a) | 42,048 | 2,017,883 |
| Applied Materials, Inc. | 91,414 | 11,228,382 |
| ASML Holding NV | 14,359 | 9,774,315 |
| Broadcom, Inc. | 80,279 | 51,502,190 |
| Enphase Energy, Inc.(a) | 11,707 | 2,461,748 |
| KLA Corp. | 1,178 | 470,222 |
| Common Stocks (continued) |
| Issuer | Shares | Value ($) |
| Lam Research Corp. | 22,686 | 12,026,302 |
| Lattice Semiconductor Corp.(a) | 20,196 | 1,928,718 |
| Micron Technology, Inc. | 1,665 | 100,466 |
| Monolithic Power Systems, Inc. | 33,843 | 16,939,775 |
| NVIDIA Corp. | 660,350 | 183,425,419 |
| QUALCOMM, Inc. | 364,365 | 46,485,687 |
| Texas Instruments, Inc. | 41,281 | 7,678,679 |
| Universal Display Corp. | 43,814 | 6,796,866 |
| Total | | 371,870,194 |
| Software 17.2% |
| Adobe, Inc.(a) | 72,739 | 28,031,428 |
| Alteryx, Inc., Class A(a) | 61,068 | 3,593,241 |
| ANSYS, Inc.(a) | 10,662 | 3,548,314 |
| Atlassian Corp., Class A(a) | 3,231 | 553,050 |
| Autodesk, Inc.(a) | 217,025 | 45,175,924 |
| Cadence Design Systems, Inc.(a) | 30,268 | 6,359,004 |
| Datadog, Inc., Class A(a) | 15,081 | 1,095,786 |
| DoubleVerify Holdings, Inc.(a) | 75,573 | 2,278,526 |
| Dynatrace, Inc.(a) | 168,013 | 7,106,950 |
| Fair Isaac Corp.(a) | 5,634 | 3,958,956 |
| Fortinet, Inc.(a) | 13,345 | 886,909 |
| HubSpot, Inc.(a) | 28,346 | 12,153,348 |
| Intuit, Inc. | 32,998 | 14,711,498 |
| Manhattan Associates, Inc.(a) | 46,293 | 7,168,471 |
| Microsoft Corp. | 994,706 | 286,773,740 |
| New Relic, Inc.(a) | 86,106 | 6,482,921 |
| Oracle Corp. | 904,671 | 84,062,029 |
| Palo Alto Networks, Inc.(a) | 55,637 | 11,112,934 |
| Paylocity Holding Corp.(a) | 1,844 | 366,550 |
| Pegasystems, Inc. | 78,962 | 3,828,078 |
| Salesforce, Inc.(a) | 308,796 | 61,691,265 |
| ServiceNow, Inc.(a) | 30,163 | 14,017,349 |
| Smartsheet, Inc., Class A(a) | 24,128 | 1,153,318 |
| Synopsys, Inc.(a) | 31,856 | 12,304,380 |
| Teradata Corp.(a) | 161,374 | 6,500,145 |
| Workday, Inc., Class A(a) | 136,743 | 28,242,899 |
| Total | | 653,157,013 |
The accompanying Notes to Financial Statements are an integral part of this statement.
Multi-Manager Growth Strategies Fund | Annual Report 2023
| 13 |
Portfolio of Investments (continued)
March 31, 2023
| Common Stocks (continued) |
| Issuer | Shares | Value ($) |
| Technology Hardware, Storage & Peripherals 6.1% |
| Apple, Inc. | 1,421,668 | 234,433,053 |
| Total Information Technology | 1,364,374,422 |
| Materials 0.9% |
| Chemicals 0.1% |
| Sherwin-Williams Co. (The) | 22,257 | 5,002,706 |
| Construction Materials 0.1% |
| Eagle Materials, Inc. | 25,220 | 3,701,035 |
| Containers & Packaging 0.1% |
| Graphic Packaging Holding Co. | 68,432 | 1,744,332 |
| Metals & Mining 0.6% |
| Freeport-McMoRan, Inc. | 431,071 | 17,635,114 |
| Southern Copper Corp. | 68,043 | 5,188,279 |
| Total | | 22,823,393 |
| Total Materials | 33,271,466 |
| Common Stocks (continued) |
| Issuer | Shares | Value ($) |
| Real Estate 0.2% |
| Specialized REITs 0.2% |
| SBA Communications Corp. | 25,633 | 6,692,007 |
| Total Real Estate | 6,692,007 |
Total Common Stocks
(Cost $3,249,960,644) | 3,760,719,338 |
|
| Money Market Funds 1.2% |
| | Shares | Value ($) |
| Columbia Short-Term Cash Fund, 4.983%(b),(c) | 44,936,611 | 44,927,624 |
Total Money Market Funds
(Cost $44,923,394) | 44,927,624 |
Total Investments in Securities
(Cost: $3,294,884,038) | 3,805,646,962 |
| Other Assets & Liabilities, Net | | (1,911,491) |
| Net Assets | 3,803,735,471 |
Notes to Portfolio of Investments
| (a) | Non-income producing investment. |
| (b) | The rate shown is the seven-day current annualized yield at March 31, 2023. |
| (c) | As defined in the Investment Company Act of 1940, as amended, an affiliated company is one in which the Fund owns 5% or more of the company’s outstanding voting securities, or a company which is under common ownership or control with the Fund. The value of the holdings and transactions in these affiliated companies during the year ended March 31, 2023 are as follows: |
| Affiliated issuers | Beginning
of period($) | Purchases($) | Sales($) | Net change in
unrealized
appreciation
(depreciation)($) | End of
period($) | Realized gain
(loss)($) | Dividends($) | End of
period shares |
| Columbia Short-Term Cash Fund, 4.983% |
| | 49,935,449 | 1,144,464,143 | (1,149,476,421) | 4,453 | 44,927,624 | (12,607) | 1,584,361 | 44,936,611 |
Abbreviation Legend
| ADR | American Depositary Receipt |
Fair value measurements
The Fund categorizes its fair value measurements according to a three-level hierarchy that maximizes the use of observable inputs and minimizes the use of unobservable inputs by prioritizing that the most observable input be used when available. Observable inputs are those that market participants would use in pricing an investment based on market data obtained from sources independent of the reporting entity. Unobservable inputs are those that reflect the Fund’s assumptions about the information market participants would use in pricing an investment. An investment’s level within the fair value hierarchy is based on the lowest level of any input that is deemed significant to the asset’s or liability’s fair value measurement. The input levels are not necessarily an indication of the risk or liquidity associated with investments at that level. For example, certain U.S. government securities are generally high quality and liquid, however, they are reflected as Level 2 because the inputs used to determine fair value may not always be quoted prices in an active market.
Fair value inputs are summarized in the three broad levels listed below:
| ■ | Level 1 — Valuations based on quoted prices for investments in active markets that the Fund has the ability to access at the measurement date. Valuation adjustments are not applied to Level 1 investments. |
| ■ | Level 2 — Valuations based on other significant observable inputs (including quoted prices for similar securities, interest rates, prepayment speeds, credit risks, etc.). |
| ■ | Level 3 — Valuations based on significant unobservable inputs (including the Fund’s own assumptions and judgment in determining the fair value of investments). |
The accompanying Notes to Financial Statements are an integral part of this statement.
| 14 | Multi-Manager Growth Strategies Fund | Annual Report 2023 |
Portfolio of Investments (continued)
March 31, 2023
Fair value measurements (continued)
Inputs that are used in determining fair value of an investment may include price information, credit data, volatility statistics, and other factors. These inputs can be either observable or unobservable. The availability of observable inputs can vary between investments, and is affected by various factors such as the type of investment, and the volume and level of activity for that investment or similar investments in the marketplace. The inputs will be considered by the Investment Manager, along with any other relevant factors in the calculation of an investment’s fair value. The Fund uses prices and inputs that are current as of the measurement date, which may include periods of market dislocations. During these periods, the availability of prices and inputs may be reduced for many investments. This condition could cause an investment to be reclassified between the various levels within the hierarchy.
Foreign equity securities actively traded in markets where there is a significant delay in the local close relative to the New York Stock Exchange are classified as Level 2. The values of these securities may include an adjustment to reflect the impact of market movements following the close of local trading, as described in Note 2 to the financial statements – Security valuation.
Investments falling into the Level 3 category are primarily supported by quoted prices from brokers and dealers participating in the market for those investments. However, these may be classified as Level 3 investments due to lack of market transparency and corroboration to support these quoted prices. Additionally, valuation models may be used as the pricing source for any remaining investments classified as Level 3. These models may rely on one or more significant unobservable inputs and/or significant assumptions by the Investment Manager. Inputs used in valuations may include, but are not limited to, financial statement analysis, capital account balances, discount rates and estimated cash flows, and comparable company data.
The Fund’s Board of Trustees (the Board) has designated the Investment Manager, through its Valuation Committee (the Committee), as valuation designee, responsible for determining the fair value of the assets of the Fund for which market quotations are not readily available using valuation procedures approved by the Board. The Committee consists of voting and non-voting members from various groups within the Investment Manager’s organization, including operations and accounting, trading and investments, compliance, risk management and legal.
The Committee meets at least monthly to review and approve valuation matters, which may include a description of specific valuation determinations, data regarding pricing information received from approved pricing vendors and brokers and the results of Board-approved valuation policies and procedures (the Policies). The Policies address, among other things, instances when market quotations are or are not readily available, including recommendations of third party pricing vendors and a determination of appropriate pricing methodologies; events that require specific valuation determinations and assessment of fair value techniques; securities with a potential for stale pricing, including those that are illiquid, restricted, or in default; and the effectiveness of third party pricing vendors, including periodic reviews of vendors. The Committee meets more frequently, as needed, to discuss additional valuation matters, which may include the need to review back-testing results, review time-sensitive information or approve related valuation actions. Representatives of Columbia Management Investment Advisers, LLC report to the Board at each of its regularly scheduled meetings to discuss valuation matters and actions during the period, similar to those described earlier.
The following table is a summary of the inputs used to value the Fund’s investments at March 31, 2023:
| | Level 1 ($) | Level 2 ($) | Level 3 ($) | Total ($) |
| Investments in Securities | | | | |
| Common Stocks | | | | |
| Communication Services | 440,229,175 | — | — | 440,229,175 |
| Consumer Discretionary | 610,193,674 | — | — | 610,193,674 |
| Consumer Staples | 155,015,986 | — | — | 155,015,986 |
| Energy | 25,309,454 | — | — | 25,309,454 |
| Financials | 344,225,576 | — | — | 344,225,576 |
| Health Care | 436,341,447 | 17,558,141 | — | 453,899,588 |
| Industrials | 327,507,990 | — | — | 327,507,990 |
| Information Technology | 1,364,374,422 | — | — | 1,364,374,422 |
| Materials | 33,271,466 | — | — | 33,271,466 |
| Real Estate | 6,692,007 | — | — | 6,692,007 |
| Total Common Stocks | 3,743,161,197 | 17,558,141 | — | 3,760,719,338 |
| Money Market Funds | 44,927,624 | — | — | 44,927,624 |
| Total Investments in Securities | 3,788,088,821 | 17,558,141 | — | 3,805,646,962 |
See the Portfolio of Investments for all investment classifications not indicated in the table.
The Fund’s assets assigned to the Level 2 input category are generally valued using the market approach, in which a security’s value is determined through reference to prices and information from market transactions for similar or identical assets. These assets include certain foreign securities for which a third party statistical pricing service may be employed for purposes of fair market valuation. The model utilized by such third party statistical pricing service takes into account a security’s correlation to available market data including, but not limited to, intraday index, ADR, and exchange-traded fund movements.
The accompanying Notes to Financial Statements are an integral part of this statement.
Multi-Manager Growth Strategies Fund | Annual Report 2023
| 15 |
Statement of Assets and Liabilities
March 31, 2023
| Assets | |
| Investments in securities, at value | |
| Unaffiliated issuers (cost $3,249,960,644) | $3,760,719,338 |
| Affiliated issuers (cost $44,923,394) | 44,927,624 |
| Cash | 191 |
| Receivable for: | |
| Investments sold | 3,951,590 |
| Capital shares sold | 2,997,148 |
| Dividends | 1,077,686 |
| Foreign tax reclaims | 299,561 |
| Expense reimbursement due from Investment Manager | 4,473 |
| Prepaid expenses | 26,998 |
| Trustees’ deferred compensation plan | 178,479 |
| Total assets | 3,814,183,088 |
| Liabilities | |
| Payable for: | |
| Investments purchased | 5,617,215 |
| Capital shares purchased | 4,096,627 |
| Management services fees | 67,185 |
| Transfer agent fees | 273,863 |
| Compensation of board members | 54,654 |
| Other expenses | 159,594 |
| Trustees’ deferred compensation plan | 178,479 |
| Total liabilities | 10,447,617 |
| Net assets applicable to outstanding capital stock | $3,803,735,471 |
| Represented by | |
| Paid in capital | 3,275,221,318 |
| Total distributable earnings (loss) | 528,514,153 |
| Total - representing net assets applicable to outstanding capital stock | $3,803,735,471 |
| Institutional Class | |
| Net assets | $3,803,733,047 |
| Shares outstanding | 262,355,342 |
| Net asset value per share | $14.50 |
| Institutional 3 Class | |
| Net assets | $2,424 |
| Shares outstanding | 167 |
| Net asset value per share(a) | $14.49 |
| (a) | Net asset value per share rounds to this amount due to fractional shares outstanding. |
The accompanying Notes to Financial Statements are an integral part of this statement.
| 16 | Multi-Manager Growth Strategies Fund | Annual Report 2023 |
Statement of Operations
Year Ended March 31, 2023
| Net investment income | |
| Income: | |
| Dividends — unaffiliated issuers | $32,416,602 |
| Dividends — affiliated issuers | 1,584,361 |
| Interfund lending | 764 |
| Foreign taxes withheld | (506,374) |
| Total income | 33,495,353 |
| Expenses: | |
| Management services fees | 24,510,241 |
| Transfer agent fees | |
| Institutional Class | 3,671,487 |
| Compensation of board members | 70,746 |
| Custodian fees | 40,492 |
| Printing and postage fees | 356,794 |
| Registration fees | 89,871 |
| Accounting services fees | 57,840 |
| Legal fees | 66,063 |
| Compensation of chief compliance officer | 717 |
| Other | 105,798 |
| Total expenses | 28,970,049 |
| Fees waived or expenses reimbursed by Investment Manager and its affiliates | (1,366,707) |
| Total net expenses | 27,603,342 |
| Net investment income | 5,892,011 |
| Realized and unrealized gain (loss) — net | |
| Net realized gain (loss) on: | |
| Investments — unaffiliated issuers | 86,830,031 |
| Investments — affiliated issuers | (12,607) |
| Net realized gain | 86,817,424 |
| Net change in unrealized appreciation (depreciation) on: | |
| Investments — unaffiliated issuers | (424,943,121) |
| Investments — affiliated issuers | 4,453 |
| Net change in unrealized appreciation (depreciation) | (424,938,668) |
| Net realized and unrealized loss | (338,121,244) |
| Net decrease in net assets resulting from operations | $(332,229,233) |
The accompanying Notes to Financial Statements are an integral part of this statement.
Multi-Manager Growth Strategies Fund | Annual Report 2023
| 17 |
Statement of Changes in Net Assets
| | Year Ended
March 31, 2023 | Year Ended
March 31, 2022 |
| Operations | | |
| Net investment income (loss) | $5,892,011 | $(7,896,979) |
| Net realized gain | 86,817,424 | 714,284,136 |
| Net change in unrealized appreciation (depreciation) | (424,938,668) | (355,864,640) |
| Net increase (decrease) in net assets resulting from operations | (332,229,233) | 350,522,517 |
| Distributions to shareholders | | |
| Net investment income and net realized gains | | |
| Institutional Class | (355,197,806) | (584,937,031) |
| Institutional 3 Class | (222) | (509) |
| Total distributions to shareholders | (355,198,028) | (584,937,540) |
| Increase in net assets from capital stock activity | 431,364,681 | 429,863,077 |
| Total increase (decrease) in net assets | (256,062,580) | 195,448,054 |
| Net assets at beginning of year | 4,059,798,051 | 3,864,349,997 |
| Net assets at end of year | $3,803,735,471 | $4,059,798,051 |
| | Year Ended | Year Ended |
| | March 31, 2023 | March 31, 2022 |
| | Shares | Dollars ($) | Shares | Dollars ($) |
| Capital stock activity |
| Institutional Class | | | | |
| Subscriptions | 92,317,235 | 1,302,089,222 | 67,391,020 | 1,289,814,755 |
| Distributions reinvested | 28,368,497 | 355,197,806 | 29,487,010 | 584,937,031 |
| Redemptions | (86,223,408) | (1,225,922,347) | (68,815,072) | (1,444,888,709) |
| Net increase | 34,462,324 | 431,364,681 | 28,062,958 | 429,863,077 |
| Total net increase | 34,462,324 | 431,364,681 | 28,062,958 | 429,863,077 |
The accompanying Notes to Financial Statements are an integral part of this statement.
| 18 | Multi-Manager Growth Strategies Fund | Annual Report 2023 |
[THIS PAGE INTENTIONALLY LEFT BLANK]
Multi-Manager Growth Strategies Fund | Annual Report 2023
| 19 |
The following table is intended to help you understand the Fund’s financial performance. Certain information reflects financial results for a single share of a class held for the periods shown. Per share net investment income (loss) amounts are calculated based on average shares outstanding during the period. Total return assumes reinvestment of all dividends and distributions, if any. Total return does not reflect payment of sales charges, if any. Total return and portfolio turnover are not annualized for periods of less than one year. The ratios of expenses and net investment income are annualized for periods of less than one year. The portfolio turnover rate is calculated without regard to purchase and sales transactions of short-term instruments and certain derivatives, if any. If such transactions were included, the Fund’s portfolio turnover rate may be higher.
| | Net asset value,
beginning of
period | Net
investment
income
(loss) | Net
realized
and
unrealized
gain (loss) | Total from
investment
operations | Distributions
from net
investment
income | Distributions
from net
realized
gains | Total
distributions to
shareholders |
| Institutional Class |
| Year Ended 3/31/2023 | $17.81 | 0.02 | (2.01) | (1.99) | (0.02) | (1.30) | (1.32) |
| Year Ended 3/31/2022 | $19.34 | (0.04) | 1.52 | 1.48 | — | (3.01) | (3.01) |
| Year Ended 3/31/2021 | $13.05 | (0.00)(d) | 7.78 | 7.78 | (0.00)(d) | (1.49) | (1.49) |
| Year Ended 3/31/2020 | $14.09 | 0.03 | (0.23) | (0.20) | (0.02) | (0.82) | (0.84) |
| Year Ended 3/31/2019 | $14.86 | 0.00(d) | 1.50 | 1.50 | — | (2.27) | (2.27) |
| Institutional 3 Class |
| Year Ended 3/31/2023 | $17.79 | 0.03 | (2.00) | (1.97) | (0.03) | (1.30) | (1.33) |
| Year Ended 3/31/2022 | $19.32 | (0.02) | 1.54 | 1.52 | — | (3.05) | (3.05) |
| Year Ended 3/31/2021 | $13.03 | 0.01 | 7.77 | 7.78 | (0.00)(d) | (1.49) | (1.49) |
| Year Ended 3/31/2020(e) | $14.94 | 0.02 | (1.92) | (1.90) | (0.01) | — | (0.01) |
| Notes to Financial Highlights |
| (a) | In addition to the fees and expenses that the Fund bears directly, the Fund indirectly bears a pro rata share of the fees and expenses of any other funds in which it invests. Such indirect expenses are not included in the Fund’s reported expense ratios. |
| (b) | Total net expenses include the impact of certain fee waivers/expense reimbursements made by the Investment Manager and certain of its affiliates, if applicable. |
| (c) | Ratios include interfund lending expense which is less than 0.01%. |
| (d) | Rounds to zero. |
| (e) | Institutional 3 Class shares commenced operations on December 18, 2019. Per share data and total return reflect activity from that date. |
The accompanying Notes to Financial Statements are an integral part of this statement.
| 20 | Multi-Manager Growth Strategies Fund | Annual Report 2023 |
Financial Highlights (continued)
| | Net
asset
value,
end of
period | Total
return | Total gross
expense
ratio to
average
net assets(a) | Total net
expense
ratio to
average
net assets(a),(b) | Net investment
income (loss)
ratio to
average
net assets | Portfolio
turnover | Net
assets,
end of
period
(000’s) |
| Institutional Class |
| Year Ended 3/31/2023 | $14.50 | (9.89%) | 0.78% | 0.74% | 0.16% | 83% | $3,803,733 |
| Year Ended 3/31/2022 | $17.81 | 6.57% | 0.75%(c) | 0.74%(c) | (0.19%) | 53% | $4,059,795 |
| Year Ended 3/31/2021 | $19.34 | 61.13% | 0.78% | 0.69% | (0.02%) | 45% | $3,864,347 |
| Year Ended 3/31/2020 | $13.05 | (1.88%) | 0.86%(c) | 0.76%(c) | 0.19% | 42% | $2,164,853 |
| Year Ended 3/31/2019 | $14.09 | 11.09% | 0.88%(c) | 0.88%(c) | 0.02% | 41% | $1,957,462 |
| Institutional 3 Class |
| Year Ended 3/31/2023 | $14.49 | (9.78%) | 0.67% | 0.66% | 0.23% | 83% | $2 |
| Year Ended 3/31/2022 | $17.79 | 6.76% | 0.66%(c) | 0.63%(c) | (0.09%) | 53% | $3 |
| Year Ended 3/31/2021 | $19.32 | 61.23% | 0.69% | 0.60% | 0.07% | 45% | $3 |
| Year Ended 3/31/2020(e) | $13.03 | (12.69%) | 0.74%(c) | 0.60%(c) | 0.44% | 42% | $2 |
The accompanying Notes to Financial Statements are an integral part of this statement.
Multi-Manager Growth Strategies Fund | Annual Report 2023
| 21 |
Notes to Financial Statements
March 31, 2023
Note 1. Organization
Multi-Manager Growth Strategies Fund (the Fund), a series of Columbia Funds Series Trust I (the Trust), is a diversified fund. The Trust is registered under the Investment Company Act of 1940, as amended (the 1940 Act), as an open-end management investment company organized as a Massachusetts business trust.
Fund shares
The Trust may issue an unlimited number of shares (without par value). The Fund is offered only through certain wrap fee programs sponsored and/or managed by Ameriprise Financial, Inc. (Ameriprise Financial) or its affiliates. The Fund offers each of the share classes listed in the Statement of Assets and Liabilities which are not subject to any front-end sales charge or contingent deferred sales charge.
Note 2. Summary of significant accounting policies
Basis of preparation
The Fund is an investment company that applies the accounting and reporting guidance in the Financial Accounting Standards Board (FASB) Accounting Standards Codification Topic 946, Financial Services - Investment Companies (ASC 946). The financial statements are prepared in accordance with U.S. generally accepted accounting principles (GAAP), which requires management to make certain estimates and assumptions that affect the reported amounts of assets and liabilities, the disclosure of contingent assets and liabilities at the date of the financial statements and the reported amounts of income and expenses during the reporting period. Actual results could differ from those estimates.
The following is a summary of significant accounting policies followed by the Fund in the preparation of its financial statements.
Security valuation
Equity securities listed on an exchange are valued at the closing price or last trade price on their primary exchange at the close of business of the New York Stock Exchange. Securities with a closing price not readily available or not listed on any exchange are valued at the mean between the closing bid and ask prices. Listed preferred stocks convertible into common stocks are valued using an evaluated price from a pricing service.
Foreign equity securities are valued based on the closing price or last trade price on their primary exchange at the close of business of the New York Stock Exchange. If any foreign equity security closing prices are not readily available, the securities are valued at the mean of the latest quoted bid and ask prices on such exchanges or markets. Foreign currency exchange rates are determined at the scheduled closing time of the New York Stock Exchange. Many securities markets and exchanges outside the U.S. close prior to the close of the New York Stock Exchange; therefore, the closing prices for securities in such markets or on such exchanges may not fully reflect events that occur after such close but before the close of the New York Stock Exchange. In those situations, foreign securities will be fair valued pursuant to a policy approved by the Board of Trustees. Under the policy, the Fund may utilize a third-party pricing service to determine these fair values. The third-party pricing service takes into account multiple factors, including, but not limited to, movements in the U.S. securities markets, certain depositary receipts, futures contracts and foreign exchange rates that have occurred subsequent to the close of the foreign exchange or market, to determine a good faith estimate that reasonably reflects the current market conditions as of the close of the New York Stock Exchange. The fair value of a security is likely to be different from the quoted or published price, if available.
Investments in open-end investment companies (other than exchange-traded funds (ETFs)), are valued at the latest net asset value reported by those companies as of the valuation time.
Investments for which market quotations are not readily available, or that have quotations which management believes are not reflective of market value or reliable, are valued at fair value as determined in good faith under procedures approved by the Board of Trustees. If a security or class of securities (such as foreign securities) is valued at fair value, such value is likely to be different from the quoted or published price for the security, if available.
| 22 | Multi-Manager Growth Strategies Fund | Annual Report 2023 |
Notes to Financial Statements (continued)
March 31, 2023
The determination of fair value often requires significant judgment. To determine fair value, management may use assumptions including but not limited to future cash flows and estimated risk premiums. Multiple inputs from various sources may be used to determine fair value.
GAAP requires disclosure regarding the inputs and valuation techniques used to measure fair value and any changes in valuation inputs or techniques. In addition, investments shall be disclosed by major category. This information is disclosed following the Fund’s Portfolio of Investments.
Security transactions
Security transactions are accounted for on the trade date. Cost is determined and gains (losses) are based upon the specific identification method for both financial statement and federal income tax purposes.
Income recognition
Corporate actions and dividend income are generally recorded net of any non-reclaimable tax withholdings, on the ex-dividend date or upon receipt of an ex-dividend notification in the case of certain foreign securities.
The Fund may receive distributions from holdings in equity securities, business development companies (BDCs), exchange-traded funds (ETFs), limited partnerships (LPs), other regulated investment companies (RICs), and real estate investment trusts (REITs), which report information as to the tax character of their distributions annually. These distributions are allocated to dividend income, capital gain and return of capital based on actual information reported. Return of capital is recorded as a reduction of the cost basis of securities held. If the Fund no longer owns the applicable securities, return of capital is recorded as a realized gain. With respect to REITs, to the extent actual information has not yet been reported, estimates for return of capital are made by Columbia Management Investment Advisers, LLC (the Investment Manager), a wholly-owned subsidiary of Ameriprise Financial, Inc. (Ameriprise Financial). The Investment Manager’s estimates are subsequently adjusted when the actual character of the distributions is disclosed by the REITs, which could result in a proportionate change in return of capital to shareholders.
Awards from class action litigation are recorded as a reduction of cost basis if the Fund still owns the applicable securities on the payment date. If the Fund no longer owns the applicable securities on the payment date, the proceeds are recorded as realized gains.
Expenses
General expenses of the Trust are allocated to the Fund and other funds of the Trust based upon relative net assets or other expense allocation methodologies determined by the nature of the expense. Expenses directly attributable to the Fund are charged to the Fund. Expenses directly attributable to a specific class of shares are charged to that share class.
Determination of class net asset value
All income, expenses (other than class-specific expenses, which are charged to that share class, as shown in the Statement of Operations) and realized and unrealized gains (losses) are allocated to each class of the Fund on a daily basis, based on the relative net assets of each class, for purposes of determining the net asset value of each class.
Federal income tax status
The Fund intends to qualify each year as a regulated investment company under Subchapter M of the Internal Revenue Code, as amended, and will distribute substantially all of its investment company taxable income and net capital gain, if any, for its tax year, and as such will not be subject to federal income taxes. In addition, the Fund intends to distribute in each calendar year substantially all of its ordinary income, capital gain net income and certain other amounts, if any, such that the Fund should not be subject to federal excise tax. Therefore, no federal income or excise tax provision is recorded.
Foreign taxes
The Fund may be subject to foreign taxes on income, gains on investments or currency repatriation, a portion of which may be recoverable. The Fund will accrue such taxes and recoveries, as applicable, based upon its current interpretation of tax rules and regulations that exist in the markets in which it invests.
Multi-Manager Growth Strategies Fund | Annual Report 2023
| 23 |
Notes to Financial Statements (continued)
March 31, 2023
Realized gains in certain countries may be subject to foreign taxes at the Fund level, based on statutory rates. The Fund accrues for such foreign taxes on realized and unrealized gains at the appropriate rate for each jurisdiction, as applicable. The amount, if any, is disclosed as a liability in the Statement of Assets and Liabilities.
Distributions to shareholders
Distributions from net investment income, if any, are declared and paid each calendar quarter. Net realized capital gains, if any, are distributed at least annually. Income distributions and capital gain distributions are determined in accordance with federal income tax regulations, which may differ from GAAP.
Guarantees and indemnifications
Under the Trust’s organizational documents and, in some cases, by contract, its officers and trustees are indemnified against certain liabilities arising out of the performance of their duties to the Trust or its funds. In addition, certain of the Fund’s contracts with its service providers contain general indemnification clauses. The Fund’s maximum exposure under these arrangements is unknown since the amount of any future claims that may be made against the Fund cannot be determined, and the Fund has no historical basis for predicting the likelihood of any such claims.
Recent accounting pronouncement
Tailored Shareholder Reports
In October 2022, the Securities and Exchange Commission (SEC) adopted a final rule relating to Tailored Shareholder Reports for Mutual Funds and Exchange-Traded Funds; Fee Information in Investment Company Advertisements. The rule and form amendments will, among other things, require the Fund to transmit concise and visually engaging shareholder reports that highlight key information. The amendments will require that funds tag information in a structured data format and that certain more in-depth information be made available online and available for delivery free of charge to investors on request. The amendments became effective January 24, 2023. There is an 18-month transition period after the effective date of the amendment.
Note 3. Fees and other transactions with affiliates
Management services fees
The Fund has entered into a Management Agreement with Columbia Management Investment Advisers, LLC (the Investment Manager), a wholly-owned subsidiary of Ameriprise Financial, Inc. (Ameriprise Financial). Under the Management Agreement, the Investment Manager provides the Fund with investment research and advice, as well as administrative and accounting services. The Investment Manager is responsible for the ultimate oversight of investments made by the Fund. The Fund’s subadvisers (see Subadvisory agreements below) have the primary responsibility for the day-to-day portfolio management of their portion of the Fund. The management services fee is an annual fee that is equal to a percentage of the Fund’s daily net assets that declines from 0.77% to 0.57% as the Fund’s net assets increase. The effective management services fee rate for the year ended March 31, 2023 was 0.66% of the Fund’s average daily net assets.
Subadvisory agreements
The Investment Manager has entered into Subadvisory Agreements with Loomis, Sayles & Company, L.P. and Los Angeles Capital Management LLC, each of which subadvises a portion of the assets of the Fund. Effective October 3, 2022, the Investment Manager has entered into a Subadvisory Agreement with J.P. Morgan Investment Management Inc. to serve as a subadviser to a portion of the assets of the Fund. New investments in the Fund, net of any redemptions, are allocated in accordance with the Investment Manager’s determination. Each subadviser’s proportionate share of investments in the Fund will vary due to market fluctuations. The Investment Manager compensates each subadviser to manage the investment of the Fund’s assets.
Compensation of board members
Members of the Board of Trustees who are not officers or employees of the Investment Manager or Ameriprise Financial are compensated for their services to the Fund as disclosed in the Statement of Operations. Under a Deferred Compensation Plan (the Deferred Plan), these members of the Board of Trustees may elect to defer payment of up to 100% of their
| 24 | Multi-Manager Growth Strategies Fund | Annual Report 2023 |
Notes to Financial Statements (continued)
March 31, 2023
compensation. Deferred amounts are treated as though equivalent dollar amounts had been invested in shares of certain funds managed by the Investment Manager. The Fund’s liability for these amounts is adjusted for market value changes and remains in the Fund until distributed in accordance with the Deferred Plan. All amounts payable under the Deferred Plan constitute a general unsecured obligation of the Fund. The expense for the Deferred Plan, which includes Trustees’ fees deferred during the current period as well as any gains or losses on the Trustees’ deferred compensation balances as a result of market fluctuations, is included in "Compensation of board members" in the Statement of Operations.
Compensation of Chief Compliance Officer
The Board of Trustees has appointed a Chief Compliance Officer for the Fund in accordance with federal securities regulations. As disclosed in the Statement of Operations, a portion of the Chief Compliance Officer’s total compensation is allocated to the Fund, along with other allocations to affiliated registered investment companies managed by the Investment Manager and its affiliates, based on relative net assets.
Transfer agency fees
Under a Transfer and Dividend Disbursing Agent Agreement, Columbia Management Investment Services Corp. (the Transfer Agent), an affiliate of the Investment Manager and a wholly-owned subsidiary of Ameriprise Financial, is responsible for providing transfer agency services to the Fund. The Transfer Agent has contracted with SS&C GIDS, Inc. (SS&C GIDS) to serve as sub-transfer agent. Prior to January 1, 2023, SS&C GIDS was known as DST Asset Manager Solutions, Inc. The Transfer Agent pays the fees of SS&C GIDS for services as sub-transfer agent and SS&C GIDS is not entitled to reimbursement for such fees from the Fund (with the exception of out-of-pocket fees).
The Fund pays the Transfer Agent a monthly transfer agency fee based on the number or the average value of accounts, depending on the type of account. In addition, the Fund pays the Transfer Agent a fee for shareholder services based on the number of accounts or on a percentage of the average aggregate value of the Fund’s shares maintained in omnibus accounts up to the lesser of the amount charged by the financial intermediary or a cap established by the Board of Trustees from time to time.
The Transfer Agent also receives compensation from the Fund for various shareholder services and reimbursements for certain out-of-pocket fees. Total transfer agency fees for Institutional 3 Class shares are subject to an annual limitation of not more than 0.02% of the average daily net assets attributable to Institutional 3 Class. In addition, prior to August 1, 2022, Institutional 3 Class shares were subject to a contractual transfer agency fee annual limitation of not more than 0.00% of the average daily net assets attributable to that share class.
For the year ended March 31, 2023, the Fund’s effective transfer agency fee rates as a percentage of average daily net assets of each class were as follows:
| | Effective rate (%) |
| Institutional Class | 0.10 |
| Institutional 3 Class | 0.01 |
Distribution and service fees
The Fund has an agreement with Columbia Management Investment Distributors, Inc. (the Distributor), an affiliate of the Investment Manager and a wholly-owned subsidiary of Ameriprise Financial, for distribution and shareholder services. The Fund does not pay the Distributor a fee for the distribution services it provides to the Fund.
Multi-Manager Growth Strategies Fund | Annual Report 2023
| 25 |
Notes to Financial Statements (continued)
March 31, 2023
Expenses waived/reimbursed by the Investment Manager and its affiliates
The Investment Manager and certain of its affiliates have contractually agreed to waive fees and/or reimburse expenses (excluding certain fees and expenses described below) for the period(s) disclosed below, unless sooner terminated at the sole discretion of the Board of Trustees, so that the Fund’s net operating expenses, after giving effect to fees waived/expenses reimbursed and any balance credits and/or overdraft charges from the Fund’s custodian, do not exceed the following annual rate(s) as a percentage of the classes’ average daily net assets:
| | August 1, 2022
through
July 31, 2023 | Prior to
August 1, 2022 |
| Institutional Class | 0.74% | 0.74% |
| Institutional 3 Class | 0.66 | 0.65 |
Under the agreement governing these fee waivers and/or expense reimbursement arrangements, the following fees and expenses are excluded from the waiver/reimbursement commitment, and therefore will be paid by the Fund, if applicable: taxes (including foreign transaction taxes), expenses associated with investments in affiliated and non-affiliated pooled investment vehicles (including mutual funds and exchange-traded funds), transaction costs and brokerage commissions, costs related to any securities lending program, dividend expenses associated with securities sold short, inverse floater program fees and expenses, transaction charges and interest on borrowed money, interest, costs associated with shareholder meetings, infrequent and/or unusual expenses and any other expenses the exclusion of which is specifically approved by the Board of Trustees. This agreement may be modified or amended only with approval from the Investment Manager, certain of its affiliates and the Fund. Reflected in the contractual cap commitment, prior to August 1, 2022, is the Transfer Agent’s contractual agreement to limit total transfer agency fees to an annual rate of not more than 0.00% for Institutional 3 Class of the average daily net assets attributable to that share class. Any fees waived and/or expenses reimbursed under the expense reimbursement arrangements described above are not recoverable by the Investment Manager or its affiliates in future periods.
Note 4. Federal tax information
The timing and character of income and capital gain distributions are determined in accordance with income tax regulations, which may differ from GAAP because of temporary or permanent book to tax differences.
At March 31, 2023, these differences were primarily due to differing treatment for deferral/reversal of wash sale losses, trustees’ deferred compensation, non-deductible expenses, passive foreign investment company (pfic) holdings and earnings and profits distributed to shareholders on the redemption of shares. To the extent these differences were permanent, reclassifications were made among the components of the Fund’s net assets. Temporary differences do not require reclassifications.
The following reclassifications were made:
Undistributed net
investment
income ($) | Accumulated
net realized
gain ($) | Paid in
capital ($) |
| 128,622 | (3,294,617) | 3,165,995 |
Net investment income (loss) and net realized gains (losses), as disclosed in the Statement of Operations, and net assets were not affected by this reclassification.
The tax character of distributions paid during the years indicated was as follows:
| Year Ended March 31, 2023 | Year Ended March 31, 2022 |
Ordinary
income ($) | Long-term
capital gains ($) | Total ($) | Ordinary
income ($) | Long-term
capital gains ($) | Total ($) |
| 4,427,764 | 350,770,264 | 355,198,028 | 103,122,560 | 481,814,980 | 584,937,540 |
Short-term capital gain distributions, if any, are considered ordinary income distributions for tax purposes.
| 26 | Multi-Manager Growth Strategies Fund | Annual Report 2023 |
Notes to Financial Statements (continued)
March 31, 2023
At March 31, 2023, the components of distributable earnings on a tax basis were as follows:
Undistributed
ordinary income ($) | Undistributed
long-term
capital gains ($) | Capital loss
carryforwards ($) | Net unrealized
appreciation ($) |
| 1,568,130 | 58,552,298 | — | 468,611,369 |
At March 31, 2023, the cost of all investments for federal income tax purposes along with the aggregate gross unrealized appreciation and depreciation based on that cost was:
Federal
tax cost ($) | Gross unrealized
appreciation ($) | Gross unrealized
(depreciation) ($) | Net unrealized
appreciation ($) |
| 3,337,035,593 | 558,810,897 | (90,199,528) | 468,611,369 |
Tax cost of investments and unrealized appreciation/(depreciation) may also include timing differences that do not constitute adjustments to tax basis.
Management of the Fund has concluded that there are no significant uncertain tax positions in the Fund that would require recognition in the financial statements. However, management’s conclusion may be subject to review and adjustment at a later date based on factors including, but not limited to, new tax laws, regulations, and administrative interpretations (including relevant court decisions). Generally, the Fund’s federal tax returns for the prior three fiscal years remain subject to examination by the Internal Revenue Service.
Note 5. Portfolio information
The cost of purchases and proceeds from sales of securities, excluding short-term investments and derivatives, if any, aggregated to $3,157,410,710 and $3,065,933,711, respectively, for the year ended March 31, 2023. The amount of purchase and sale activity impacts the portfolio turnover rate reported in the Financial Highlights.
Note 6. Affiliated money market fund
The Fund invests in Columbia Short-Term Cash Fund, an affiliated money market fund established for the exclusive use by the Fund and other affiliated funds (the Affiliated MMF). The income earned by the Fund from such investments is included as Dividends - affiliated issuers in the Statement of Operations. As an investing fund, the Fund indirectly bears its proportionate share of the expenses of the Affiliated MMF. The Affiliated MMF prices its shares with a floating net asset value. In addition, the Board of Trustees of the Affiliated MMF may impose a fee on redemptions (sometimes referred to as a liquidity fee) or temporarily suspend redemptions (sometimes referred to as imposing a redemption gate) in the event its liquidity falls below regulatory limits.
Note 7. Interfund lending
Pursuant to an exemptive order granted by the Securities and Exchange Commission, the Fund participates in a program (the Interfund Program) allowing each participating Columbia Fund (each, a Participating Fund) to lend money directly to and, except for closed-end funds and money market funds, borrow money directly from other Participating Funds for temporary purposes. The amounts eligible for borrowing and lending under the Interfund Program are subject to certain restrictions.
Interfund loans are subject to the risk that the borrowing fund could be unable to repay the loan when due, and a delay in repayment to the lending fund could result in lost opportunities and/or additional lending costs. The exemptive order is subject to conditions intended to mitigate conflicts of interest arising from the Investment Manager’s relationship with each Participating Fund.
The Fund’s activity in the Interfund Program during the year ended March 31, 2023 was as follows:
| Borrower or lender | Average loan
balance ($) | Weighted average
interest rate (%) | Number of days
with outstanding loans |
| Lender | 3,540,000 | 1.95 | 5 |
Multi-Manager Growth Strategies Fund | Annual Report 2023
| 27 |
Notes to Financial Statements (continued)
March 31, 2023
Interest income earned by the Fund is recorded as Interfund lending in the Statement of Operations. The Fund had no outstanding interfund loans at March 31, 2023.
Note 8. Line of credit
The Fund has access to a revolving credit facility with a syndicate of banks led by JPMorgan Chase Bank, N.A., Citibank, N.A. and Wells Fargo Bank, N.A. whereby the Fund may borrow for the temporary funding of shareholder redemptions or for other temporary or emergency purposes. Pursuant to an October 27, 2022 amendment and restatement, the credit facility, which is an agreement between the Fund and certain other funds managed by the Investment Manager or an affiliated investment manager, severally and not jointly, permits aggregate borrowings up to $950 million. Interest is currently charged to each participating fund based on its borrowings at a rate equal to the higher of (i) the federal funds effective rate, (ii) the secured overnight financing rate plus 0.10% and (iii) the overnight bank funding rate, plus in each case, 1.00%. Each borrowing under the credit facility matures no later than 60 days after the date of borrowing. The Fund also pays a commitment fee equal to its pro rata share of the unused amount of the credit facility at a rate of 0.15% per annum. The commitment fee is included in other expenses in the Statement of Operations. This agreement expires annually in October unless extended or renewed. Prior to the October 27, 2022 amendment and restatement, the Fund had access to a revolving credit facility with a syndicate of banks led by JPMorgan Chase Bank, N.A., Citibank, N.A. and Wells Fargo Bank, N.A. which permitted collective borrowings up to $950 million. Interest was charged to each participating fund based on its borrowings at a rate equal to the higher of (i) the federal funds effective rate, (ii) the secured overnight financing rate plus 0.11448% and (iii) the overnight bank funding rate, plus in each case, 1.00%.
The Fund had no borrowings during the year ended March 31, 2023.
Note 9. Significant risks
Information technology sector risk
The Fund is more susceptible to the particular risks that may affect companies in the information technology sector than if it were invested in a wider variety of companies in unrelated sectors. Companies in the information technology sector are subject to certain risks, including the risk that new services, equipment or technologies will not be accepted by consumers and businesses or will become rapidly obsolete. Performance of such companies may be affected by factors including obtaining and protecting patents (or the failure to do so) and significant competitive pressures, including aggressive pricing of their products or services, new market entrants, competition for market share and short product cycles due to an accelerated rate of technological developments. Such competitive pressures may lead to limited earnings and/or falling profit margins. As a result, the value of their securities may fall or fail to rise. In addition, many information technology sector companies have limited operating histories and prices of these companies’ securities historically have been more volatile than other securities, especially over the short term. Some companies in the information technology sector are facing increased government and regulatory scrutiny and may be subject to adverse government or regulatory action, which could negatively impact the value of their securities.
Market risk
The Fund may incur losses due to declines in the value of one or more securities in which it invests. These declines may be due to factors affecting a particular issuer, or the result of, among other things, political, regulatory, market, economic or social developments affecting the relevant market(s) more generally. In addition, turbulence in financial markets and reduced liquidity in equity, credit and/or fixed income markets may negatively affect many issuers, which could adversely affect the Fund’s ability to price or value hard-to-value assets in thinly traded and closed markets and could cause significant redemptions and operational challenges. Global economies and financial markets are increasingly interconnected, and conditions and events in one country, region or financial market may adversely impact issuers in a different country, region or financial market. These risks may be magnified if certain events or developments adversely interrupt the global supply chain; in these and other circumstances, such risks might affect companies worldwide. As a result, local, regional or global events such as terrorism, war, natural disasters, disease/virus outbreaks and epidemics or other public health issues, recessions, depressions or other events – or the potential for such events – could have a significant negative impact on global economic and market conditions.
| 28 | Multi-Manager Growth Strategies Fund | Annual Report 2023 |
Notes to Financial Statements (continued)
March 31, 2023
The large-scale invasion of Ukraine by Russia in February 2022 has resulted in sanctions and market disruptions, including declines in regional and global stock markets, unusual volatility in global commodity markets and significant devaluations of Russian currency. The extent and duration of the military action are impossible to predict but could be significant. Market disruption caused by the Russian military action, and any counter-measures or responses thereto (including international sanctions, a downgrade in the country’s credit rating, purchasing and financing restrictions, boycotts, tariffs, changes in consumer or purchaser preferences, cyberattacks and espionage) could have severe adverse impacts on regional and/or global securities and commodities markets, including markets for oil and natural gas. These impacts may include reduced market liquidity, distress in credit markets, further disruption of global supply chains, increased risk of inflation, and limited access to investments in certain international markets and/or issuers. These developments and other related events could negatively impact Fund performance.
Shareholder concentration risk
At March 31, 2023, affiliated shareholders of record owned 100.0% of the outstanding shares of the Fund in one or more accounts. Subscription and redemption activity by concentrated accounts may have a significant effect on the operations of the Fund. In the case of a large redemption, the Fund may be forced to sell investments at inopportune times, including its liquid positions, which may result in Fund losses and the Fund holding a higher percentage of less liquid positions. Large redemptions could result in decreased economies of scale and increased operating expenses for non-redeeming Fund shareholders.
Note 10. Subsequent events
Management has evaluated the events and transactions that have occurred through the date the financial statements were issued and noted no items requiring adjustment of the financial statements or additional disclosure.
Note 11. Information regarding pending and settled legal proceedings
Ameriprise Financial and certain of its affiliates are involved in the normal course of business in legal proceedings which include regulatory inquiries, arbitration and litigation, including class actions concerning matters arising in connection with the conduct of their activities as part of a diversified financial services firm. Ameriprise Financial believes that the Fund is not currently the subject of, and that neither Ameriprise Financial nor any of its affiliates are the subject of, any pending legal, arbitration or regulatory proceedings that are likely to have a material adverse effect on the Fund or the ability of Ameriprise Financial or its affiliates to perform under their contracts with the Fund. Ameriprise Financial is required to make quarterly (10-Q), annual (10-K) and, as necessary, 8-K filings with the Securities and Exchange Commission (SEC) on legal and regulatory matters that relate to Ameriprise Financial and its affiliates. Copies of these filings may be obtained by accessing the SEC website at www.sec.gov.
There can be no assurance that these matters, or the adverse publicity associated with them, will not result in increased Fund redemptions, reduced sale of Fund shares or other adverse consequences to the Fund. Further, although we believe proceedings are not likely to have a material adverse effect on the Fund or the ability of Ameriprise Financial or its affiliates to perform under their contracts with the Fund, these proceedings are subject to uncertainties and, as such, we are unable to estimate the possible loss or range of loss that may result. An adverse outcome in one or more of these proceedings could result in adverse judgments, settlements, fines, penalties or other relief that could have a material adverse effect on the consolidated financial condition or results of operations of Ameriprise Financial or one or more of its affiliates that provides services to the Fund.
Multi-Manager Growth Strategies Fund | Annual Report 2023
| 29 |
Report of Independent Registered Public Accounting Firm
To the Board of Trustees of Columbia Funds Series Trust I and Shareholders of Multi-Manager Growth Strategies Fund
Opinion on the Financial Statements
We have audited the accompanying statement of assets and liabilities, including the portfolio of investments, of Multi-Manager Growth Strategies Fund (one of the funds constituting Columbia Funds Series Trust I, referred to hereafter as the "Fund") as of March 31, 2023, the related statement of operations for the year ended March 31, 2023, the statement of changes in net assets for each of the two years in the period ended March 31, 2023, including the related notes, and the financial highlights for each of the periods indicated therein (collectively referred to as the "financial statements"). In our opinion, the financial statements present fairly, in all material respects, the financial position of the Fund as of March 31, 2023, the results of its operations for the year then ended, the changes in its net assets for each of the two years in the period ended March 31, 2023 and the financial highlights for each of the periods indicated therein in conformity with accounting principles generally accepted in the United States of America.
Basis for Opinion
These financial statements are the responsibility of the Fund’s management. Our responsibility is to express an opinion on the Fund’s financial statements based on our audits. We are a public accounting firm registered with the Public Company Accounting Oversight Board (United States) (PCAOB) and are required to be independent with respect to the Fund in accordance with the U.S. federal securities laws and the applicable rules and regulations of the Securities and Exchange Commission and the PCAOB.
We conducted our audits of these financial statements in accordance with the standards of the PCAOB. Those standards require that we plan and perform the audit to obtain reasonable assurance about whether the financial statements are free of material misstatement, whether due to error or fraud.
Our audits included performing procedures to assess the risks of material misstatement of the financial statements, whether due to error or fraud, and performing procedures that respond to those risks. Such procedures included examining, on a test basis, evidence regarding the amounts and disclosures in the financial statements. Our audits also included evaluating the accounting principles used and significant estimates made by management, as well as evaluating the overall presentation of the financial statements. Our procedures included confirmation of securities owned as of March 31, 2023 by correspondence with the custodian, transfer agent and brokers; when replies were not received from brokers, we performed other auditing procedures. We believe that our audits provide a reasonable basis for our opinion.
/s/PricewaterhouseCoopers LLP
Minneapolis, Minnesota
May 23, 2023
We have served as the auditor of one or more investment companies within the Columbia Funds Complex since 1977.
| 30 | Multi-Manager Growth Strategies Fund | Annual Report 2023 |
Federal Income Tax Information
(Unaudited)
The Fund hereby designates the following tax attributes for the fiscal year ended March 31, 2023. Shareholders will be notified in early 2024 of the amounts for use in preparing 2023 income tax returns.
Qualified
dividend
income | Dividends
received
deduction | Capital
gain
dividend |
| 100.00% | 100.00% | $121,358,281 |
Qualified dividend income. For taxable, non-corporate shareholders, the percentage of ordinary income distributed during the fiscal year that represents qualified dividend income subject to reduced tax rates.
Dividends received deduction. The percentage of ordinary income distributed during the fiscal year that qualifies for the corporate dividends received deduction.
Capital gain dividend. The Fund designates as a capital gain dividend the amount reflected above, or if subsequently determined to be different, the net capital gain of such fiscal period.
TRUSTEES AND OFFICERS
(Unaudited)
The Board oversees the Fund’s operations and appoints officers who are responsible for day-to-day business decisions based on policies set by the Board. The following table provides basic biographical information about the Fund’s Trustees as of the printing of this report, including their principal occupations during the past five years, although specific titles for individuals may have varied over the period. The year set forth beneath Length of Service in the table below is the year in which the Trustee was first appointed or elected as Trustee to any Fund currently in the Columbia Funds Complex or a predecessor thereof. Under current Board policy, each Trustee generally serves until December 31 of the year such Trustee turns seventy-five (75).
Independent trustees
Name,
address,
year of birth | Position held
with the Columbia Funds and
length of service | Principal occupation(s)
during past five years
and other relevant
professional experience | Number of
Funds in the
Columbia Funds
Complex*
overseen | Other directorships
held by Trustee
during the past five years
and other relevant Board experience |
George S. Batejan
c/o Columbia Management
Investment Advisers, LLC
290 Congress Street
Boston, MA 02210
1954 | Trustee since 2017 | Executive Vice President, Global Head of Technology and Operations, Janus Capital Group, Inc., 2010-2016 | 177 | Former Chairman of the Board, NICSA (National Investment Company Services Association) (Executive Committee, Nominating Committee and Governance Committee), 2014-2016; former Director, Intech Investment Management, 2011-2016; former Board Member, Metro Denver Chamber of Commerce, 2015-2016; former Advisory Board Member, University of Colorado Business School, 2015-2018; former Board Member, Chase Bank International, 1993-1994 |
Multi-Manager Growth Strategies Fund | Annual Report 2023
| 31 |
TRUSTEES AND OFFICERS (continued)
(Unaudited)
Independent trustees (continued)
Name,
address,
year of birth | Position held
with the Columbia Funds and
length of service | Principal occupation(s)
during past five years
and other relevant
professional experience | Number of
Funds in the
Columbia Funds
Complex*
overseen | Other directorships
held by Trustee
during the past five years
and other relevant Board experience |
Kathleen Blatz
c/o Columbia Management
Investment Advisers, LLC
290 Congress Street
Boston, MA 02210
1954 | Trustee since 2006 | Attorney, specializing in arbitration and mediation; Chief Justice, Minnesota Supreme Court, 1998-2006; Associate Justice, Minnesota Supreme Court, 1996-1998; Fourth Judicial District Court Judge, Hennepin County, 1994-1996; Attorney in private practice and public service, 1984-1993; State Representative, Minnesota House of Representatives, 1979-1993, which included service on the Tax and Financial Institutions and Insurance Committees; Member and Interim Chair, Minnesota Sports Facilities Authority, January-July 2017; Interim President and Chief Executive Officer, Blue Cross and Blue Shield of Minnesota (health care insurance), February-July 2018, April-October 2021 | 177 | Former Trustee, Blue Cross and Blue Shield of Minnesota, 2009-2021 (Chair of the Business Development Committee, 2014-2017; Chair of the Governance Committee, 2017-2019); former Member and Chair of the Board, Minnesota Sports Facilities Authority, January 2017-July 2017; former Director, Robina Foundation, 2009-2020 (Chair, 2014-2020); Director, Richard M. Schulze Family Foundation, since 2021 |
Pamela G. Carlton
c/o Columbia Management
Investment Advisers, LLC
290 Congress Street
Boston, MA 02210
1954 | Chair since 2023; Trustee since 2007 | President, Springboard — Partners in Cross Cultural Leadership (consulting company), since 2003; Managing Director of US Equity Research, JP Morgan Chase, 1999-2003; Director of US Equity Research, Chase Asset Management, 1996-1999; Co-Director Latin America Research, 1993-1996, COO Global Research, 1992-1996, Co-Director of US Research, 1991-1992, Investment Banker, 1982-1991, Morgan Stanley; Attorney, Cleary Gottlieb Steen & Hamilton LLP, 1980-1982 | 177 | Trustee, New York Presbyterian Hospital Board, since 1996; Director, DR Bank (Audit Committee) since 2017; Director, Evercore Inc. (Audit Committee, Nominating and Governance Committee), since 2019; Director, Apollo Commercial Real Estate Finance, Inc. (Chair, Nominating and Governance Committee) (financial services), since 2021; the Governing Council of the Independent Directors Council (IDC), since 2021 |
Janet Langford Carrig
c/o Columbia Management
Investment Advisers, LLC
290 Congress Street
Boston, MA 02210
1957 | Trustee since 1996 | Senior Vice President, General Counsel and Corporate Secretary, ConocoPhillips (independent energy company), September 2007-October 2018 | 175 | Director, EQT Corporation (natural gas producer), since 2019; former Director, Whiting Petroleum Corporation (independent oil and gas company), 2020-2022 |
J. Kevin Connaughton
c/o Columbia Management
Investment Advisers, LLC
290 Congress Street
Boston, MA 02210
1964 | Trustee since 2020 | CEO and President, RhodeWay Financial (non-profit financial planning firm), since December 2022; Member, FINRA National Adjudicatory Council, since January 2020; Adjunct Professor of Finance, Bentley University since January 2018; Consultant to Independent Trustees of CFVIT and CFST I from March 2016 to June 2020 with respect to CFVIT and to December 2020 with respect to CFST I; Managing Director and General Manager of Mutual Fund Products, Columbia Management Investment Advisers, LLC, May 2010-February 2015; President, Columbia Funds, 2008-2015; and senior officer of Columbia Funds and affiliated funds, 2003-2015 | 175 | Former Director, The Autism Project, March 2015-December 2021; former Member of the Investment Committee, St. Michael’s College, November 2015-February 2020; former Trustee, St. Michael’s College, June 2017-September 2019; former Trustee, New Century Portfolios (former mutual fund complex), January 2015-December 2017 |
| 32 | Multi-Manager Growth Strategies Fund | Annual Report 2023 |
TRUSTEES AND OFFICERS (continued)
(Unaudited)
Independent trustees (continued)
Name,
address,
year of birth | Position held
with the Columbia Funds and
length of service | Principal occupation(s)
during past five years
and other relevant
professional experience | Number of
Funds in the
Columbia Funds
Complex*
overseen | Other directorships
held by Trustee
during the past five years
and other relevant Board experience |
Olive M. Darragh
c/o Columbia Management
Investment Advisers, LLC
290 Congress Street
Boston, MA 02210
1962 | Trustee since 2020 | Managing Director of Darragh Inc. (strategy and talent management consulting firm), since 2010; Founder and CEO, Zolio, Inc. (investment management talent identification platform), since 2004; Consultant to Independent Trustees of CFVIT and CFST I from June 2019 to June 2020 with respect to CFVIT and to December 2020 with respect to CFST I; Partner, Tudor Investments, 2004-2010; Senior Partner, McKinsey & Company (consulting), 1990-2004; Touche Ross CPA, 1985-1988 | 175 | Treasurer, Edinburgh University US Trust Board, since January 2023; Member, HBS Community Action Partners Board, since September 2022; former Director, University of Edinburgh Business School (Member of US Board), 2004-2019; former Director, Boston Public Library Foundation, 2008-2017 |
Patricia M. Flynn
c/o Columbia Management
Investment Advisers, LLC
290 Congress Street
Boston, MA 02210
1950 | Trustee since 2004 | Professor of Economics and Management, Bentley University, since 2002; Dean, McCallum Graduate School of Business, Bentley University, 1992-2002 | 177 | Former Trustee, MA Taxpayers Foundation, 1997-2022; former Director, The MA Business Roundtable, 2003-2019; former Chairperson, Innovation Index Advisory Committee, MA Technology Collaborative, 1997-2020 |
Brian J. Gallagher
c/o Columbia Management
Investment Advisers, LLC
290 Congress Street
Boston, MA 02210
1954 | Trustee since 2017 | Retired; Partner with Deloitte & Touche LLP and its predecessors, 1977-2016 | 177 | Trustee, Catholic Schools Foundation, since 2004 |
Douglas A. Hacker
c/o Columbia Management
Investment Advisers, LLC
290 Congress Street
Boston, MA 02210
1955 | Trustee since 1996 | Independent business executive, since May 2006; Executive Vice President – Strategy of United Airlines, December 2002 - May 2006; President of UAL Loyalty Services (airline marketing company), September 2001-December 2002; Executive Vice President and Chief Financial Officer of United Airlines, July 1999-September 2001 | 177 | Director, SpartanNash Company (Chair of the Board) (food distributor), since May 2021; Director, Aircastle Limited (Chair of Audit Committee) (aircraft leasing), since August 2006; former Director, Nash Finch Company (food distributor), 2005-2013; former Director, SeaCube Container Leasing Ltd. (container leasing), 2010-2013; and former Director, Travelport Worldwide Limited (travel information technology), 2014-2019 |
Nancy T. Lukitsh
c/o Columbia Management
Investment Advisers, LLC
290 Congress Street
Boston, MA 02210
1956 | Trustee since 2011 | Senior Vice President, Partner and Director of Marketing, Wellington Management Company, LLP (investment adviser), 1997-2010; Chair, Wellington Management Portfolios (commingled non-U.S. investment pools), 2007-2010; Director, Wellington Trust Company, NA and other Wellington affiliates, 1997-2010 | 175 | None |
Multi-Manager Growth Strategies Fund | Annual Report 2023
| 33 |
TRUSTEES AND OFFICERS (continued)
(Unaudited)
Independent trustees (continued)
Name,
address,
year of birth | Position held
with the Columbia Funds and
length of service | Principal occupation(s)
during past five years
and other relevant
professional experience | Number of
Funds in the
Columbia Funds
Complex*
overseen | Other directorships
held by Trustee
during the past five years
and other relevant Board experience |
David M. Moffett
c/o Columbia Management
Investment Advisers, LLC
290 Congress Street
Boston, MA 02210
1952 | Trustee since 2011 | Retired; former Chief Executive Officer of Freddie Mac and Chief Financial Officer of U.S. Bank | 175 | Director, CSX Corporation (transportation suppliers); Director, PayPal Holdings Inc. (payment and data processing services); Trustee, University of Oklahoma Foundation; former Director, eBay Inc. (online trading community), 2007-2015; and former Director, CIT Bank, CIT Group Inc. (commercial and consumer finance), 2010-2016; former Senior Adviser to The Carlyle Group (financial services), March 2008-September 2008; former Governance Consultant to Bridgewater Associates, January 2013-December 2015 |
Catherine James Paglia
c/o Columbia Management
Investment Advisers, LLC
290 Congress Street
Boston, MA 02210
1952 | Trustee since 2004 | Director, Enterprise Asset Management, Inc. (private real estate and asset management company), since September 1998; Managing Director and Partner, Interlaken Capital, Inc., 1989-1997; Vice President, 1982-1985, Principal, 1985-1987, Managing Director, 1987-1989, Morgan Stanley; Vice President, Investment Banking, 1980-1982, Associate, Investment Banking, 1976-1980, Dean Witter Reynolds, Inc. | 177 | Director, Valmont Industries, Inc. (irrigation systems manufacturer), since 2012; Trustee, Carleton College (on the Investment Committee), since 1987; Trustee, Carnegie Endowment for International Peace (on the Investment Committee), since 2009 |
Natalie A. Trunow
c/o Columbia Management
Investment Advisers, LLC
290 Congress Street
Boston, MA 02210
1967 | Trustee since 2020 | Chief Executive Officer, Millennial Portfolio Solutions LLC (asset management and consulting services), January 2016-January 2021; Non-executive Member of the Investment Committee and Valuation Committee, Sarona Asset Management Inc. (private equity firm) since September 2019; Advisor, Horizon Investments (asset management and consulting services), August 2018-January 2022; Advisor, Paradigm Asset Management, November 2016-January 2022; Consultant to Independent Trustees of CFVIT and CFST I from September 2016 to June 2020 with respect to CFVIT and to December 2020 with respect to CFST I; Director of Investments/Consultant, Casey Family Programs, April 2016-November 2016; Senior Vice President and Chief Investment Officer, Calvert Investments, August 2008-January 2016; Section Head and Portfolio Manager, General Motors Asset Management, June 1997-August 2008 | 175 | Independent Director, Investment Committee, Health Services for Children with Special Needs, Inc., 2010-2021; Independent Director, (Executive Committee and Chair, Audit Committee), Consumer Credit Counseling Services (formerly Guidewell Financial Solutions), since 2016; Independent Director, (Investment Committee), Sarona Asset Management, since 2019 |
| 34 | Multi-Manager Growth Strategies Fund | Annual Report 2023 |
TRUSTEES AND OFFICERS (continued)
(Unaudited)
Independent trustees (continued)
Name,
address,
year of birth | Position held
with the Columbia Funds and
length of service | Principal occupation(s)
during past five years
and other relevant
professional experience | Number of
Funds in the
Columbia Funds
Complex*
overseen | Other directorships
held by Trustee
during the past five years
and other relevant Board experience |
Sandra L. Yeager
c/o Columbia Management
Investment Advisers, LLC
290 Congress Street
Boston, MA 02210
1964 | Trustee since 2017 | Retired; President and founder, Hanoverian Capital, LLC (SEC registered investment advisor firm), 2008-2016; Managing Director, DuPont Capital, 2006-2008; Managing Director, Morgan Stanley Investment Management, 2004-2006; Senior Vice President, Alliance Bernstein, 1990-2004 | 177 | Former Director, NAPE (National Alliance for Partnerships in Equity) Education Foundation, October 2016-October 2020; Advisory Board, Jennersville YMCA, since 2022 |
Interested trustee affiliated with Investment Manager**
Name,
address,
year of birth | Position held with the Columbia Funds and length of service | Principal occupation(s) during the
past five years and other relevant
professional experience | Number of
Funds in the
Columbia Funds
Complex overseen | Other directorships
held by Trustee
during the past
five years and
other relevant Board experience |
Daniel J. Beckman
c/o Columbia Management
Investment Advisers, LLC
290 Congress Street
Boston, MA 02210
1962 | Trustee since November 2021 and President since June 2021 | Vice President – Head of North America Product, Columbia Management Investment Advisers, LLC, since April 2015; President and Principal Executive Officer of the Columbia Funds, since June 2021; officer of Columbia Funds and affiliated funds, 2020-2021 | 177 | Director, Ameriprise Trust Company, since October 2016; Director, Columbia Management Investment Distributors, Inc. since November 2018; Board of Governors, Columbia Wanger Asset Management, LLC since, January 2022; Director, Columbia Threadneedle Canada, Inc., since December 2022 |
| * | The term “Columbia Funds Complex” as used herein includes Columbia Seligman Premium Technology Growth Fund, Tri-Continental Corporation and each series of Columbia Funds Series Trust (CFST), Columbia Funds Series Trust I (CFST I), Columbia Funds Series Trust II (CFST II), Columbia ETF Trust I (CET I), Columbia ETF Trust II (CET II), Columbia Funds Variable Insurance Trust (CFVIT) and Columbia Funds Variable Series Trust II (CFVST II).Messrs. Batejan, Beckman, Gallagher and Hacker and Mses. Blatz, Carlton, Carrig, Flynn, Paglia and Yeager serve as Directors of Columbia Seligman Premium Technology Growth Fund and Tri-Continental Corporation. |
| ** | Interested person (as defined under the 1940 Act) by reason of being an officer, director, security holder and/or employee of the Investment Manager or Ameriprise Financial. |
The Statement of Additional Information has additional information about the Fund’s Board members and is available, without charge, upon request by calling 800.345.6611, visiting columbiathreadneedleus.com/investor/ or contacting your financial intermediary.
Multi-Manager Growth Strategies Fund | Annual Report 2023
| 35 |
TRUSTEES AND OFFICERS (continued)
(Unaudited)
The Board has appointed officers who are responsible for day-to-day business decisions based on policies it has established. The officers serve at the pleasure of the Board. The following table provides basic information about the Officers of the Fund as of the printing of this report, including principal occupations during the past five years, although their specific titles may have varied over the period. In addition to Mr. Beckman, who is President and Principal Executive Officer, the Fund’s other officers are:
Fund officers
Name,
address and
year of birth | Position and year
first appointed to
position for any Fund
in the Columbia
Funds Complex or a
predecessor thereof | Principal occupation(s) during past five years |
Michael G. Clarke
290 Congress Street
Boston, MA 02210
1969 | Chief Financial Officer and Principal Financial Officer (2009) and Senior Vice President (2019) | Senior Vice President and Head of Global Operations & Investor Services, Columbia Management Investment Advisers, LLC, since March 2022 (previously Vice President, Head of North American Operations, and Co-Head of Global Operations, June 2019 to February 2022 and Vice President – Accounting and Tax, May 2010 - May 2019); senior officer of Columbia Funds and affiliated funds, since 2002. |
Joseph Beranek
5890 Ameriprise Financial Center
Minneapolis, MN 55474
1965 | Treasurer and Chief Accounting Officer (Principal Accounting Officer) (2019) and Principal Financial Officer (2020), CFST, CFST I, CFST II, CFVIT and CFVST II; Assistant Treasurer, CET I and CET II | Vice President – Mutual Fund Accounting and Financial Reporting, Columbia Management Investment Advisers, LLC, since December 2018 and March 2017, respectively. |
Marybeth Pilat
290 Congress Street
Boston, MA 02210
1968 | Treasurer and Chief Accounting Officer (Principal Accounting Officer) and Principal Financial Officer (2020) for CET I and CET II; Assistant Treasurer, CFST, CFST I, CFST II, CFVIT and CFVST II | Vice President – Product Pricing and Administration, Columbia Management Investment Advisers, LLC, since May 2017. |
William F. Truscott
290 Congress Street
Boston, MA 02210
1960 | Senior Vice President (2001) | Formerly, Trustee/Director of Columbia Funds Complex or legacy funds, November 2001-January 1, 2021; Chief Executive Officer, Global Asset Management, Ameriprise Financial, Inc., since September 2012; Chairman of the Board and President, Columbia Management Investment Advisers, LLC, since July 2004 and February 2012, respectively; Chairman of the Board and Chief Executive Officer, Columbia Management Investment Distributors, Inc., since November 2008 and February 2012, respectively; Chairman of the Board and Director, Threadneedle Asset Management Holdings, Sàrl, since March 2013 and December 2008, respectively; senior executive of various entities affiliated with Columbia Threadneedle. |
Christopher O. Petersen
5228 Ameriprise Financial Center
Minneapolis, MN 55474
1970 | Senior Vice President and Assistant Secretary (2021) | Formerly, Trustee/Director of funds within the Columbia Funds Complex, July 1, 2020 - November 22, 2021; Senior Vice President and Assistant General Counsel, Ameriprise Financial, Inc., since September 2021 (previously Vice President and Lead Chief Counsel, January 2015 - September 2021); formerly, President and Principal Executive Officer of the Columbia Funds, 2015 - 2021; officer of Columbia Funds and affiliated funds, since 2007. |
Thomas P. McGuire
290 Congress Street
Boston, MA 02210
1972 | Senior Vice President and Chief Compliance Officer (2012) | Vice President – Asset Management Compliance, Ameriprise Financial, Inc., since May 2010; Chief Compliance Officer, Columbia Acorn/Wanger Funds, since December 2015; formerly, Chief Compliance Officer, Ameriprise Certificate Company, September 2010 – September 2020. |
Ryan C. Larrenaga
290 Congress Street
Boston, MA 02210
1970 | Senior Vice President (2017), Chief Legal Officer (2017), and Secretary (2015) | Vice President and Chief Counsel, Ameriprise Financial, Inc., since August 2018 (previously Vice President and Group Counsel, August 2011 - August 2018); Chief Legal Officer, Columbia Acorn/Wanger Funds, since September 2020; officer of Columbia Funds and affiliated funds, since 2005. |
| 36 | Multi-Manager Growth Strategies Fund | Annual Report 2023 |
TRUSTEES AND OFFICERS (continued)
(Unaudited)
Fund officers (continued)
Name,
address and
year of birth | Position and year
first appointed to
position for any Fund
in the Columbia
Funds Complex or a
predecessor thereof | Principal occupation(s) during past five years |
Michael E. DeFao
290 Congress Street
Boston, MA 02210
1968 | Vice President (2011) and Assistant Secretary (2010) | Vice President and Chief Counsel, Ameriprise Financial, Inc., since May 2010; Vice President, Chief Legal Officer and Assistant Secretary, Columbia Management Investment Advisers, LLC, since October 2021 (previously Vice President and Assistant Secretary, May 2010 – September 2021). |
Lyn Kephart-Strong
5228 Ameriprise Financial Center
Minneapolis, MN 55474
1960 | Vice President (2015) | Vice President, Global Investment Operations Services, Columbia Management Investment Advisers, LLC, since 2010; President, Columbia Management Investment Services Corp., since October 2014; President, Ameriprise Trust Company, since January 2017. |
Liquidity Risk Management Program
(Unaudited)
Pursuant to Rule 22e-4 under the 1940 Act, the Fund has adopted a liquidity risk management program (Program). The Program’s principal objectives include assessing, managing and periodically reviewing the Fund’s liquidity risk. Liquidity risk is defined as the risk that the Fund could not meet redemption requests without significant dilution of remaining investors’ interests in the Fund.
The Board has appointed the Investment Manager as the program administrator for the Fund’s Program. The Investment Manager has delegated oversight of the Program to its Liquidity Risk Management Committee (the Committee). At a board meeting during the fiscal period, the Committee provided the Board with a report addressing the operations of the program and assessing its adequacy and effectiveness of implementation for the period January 1, 2022, through December 31, 2022, including:
| • | the Fund had sufficient liquidity to both meet redemptions and operate effectively on behalf of shareholders; |
| • | there were no material changes to the Program during the period; |
| • | the implementation of the Program was effective to manage the Fund’s liquidity risk; and |
| • | the Program operated adequately during the period. |
There can be no assurance that the Program will achieve its objectives in the future. Please refer to the Fund’s prospectus for more information regarding the Fund’s exposure to liquidity risk and other principal risks to which an investment in the Fund may be subject.
Multi-Manager Growth Strategies Fund | Annual Report 2023
| 37 |
[THIS PAGE INTENTIONALLY LEFT BLANK]
[THIS PAGE INTENTIONALLY LEFT BLANK]
Multi-Manager Growth Strategies Fund
P.O. Box 219104
Kansas City, MO 64121-9104
Please read and consider the investment objectives, risks, charges and expenses for any fund carefully before investing. For a prospectus and summary prospectus, which contains this and other important information about the Fund, go to
columbiathreadneedleus.com/investor/. The Fund is distributed by Columbia Management Investment Distributors, Inc., member FINRA, and managed by Columbia Management Investment Advisers, LLC.
Columbia Threadneedle Investments (Columbia Threadneedle) is the global brand name of the Columbia and Threadneedle group of companies. All rights reserved.
© 2023 Columbia Management Investment Advisers, LLC.
columbiathreadneedleus.com/investor/

Annual Report
March 31, 2023
Columbia Adaptive Retirement Funds
Columbia Adaptive Retirement 2020 Fund
Columbia Adaptive Retirement 2025 Fund
Columbia Adaptive Retirement 2030 Fund
Columbia Adaptive Retirement 2035 Fund
Columbia Adaptive Retirement 2040 Fund
Columbia Adaptive Retirement 2045 Fund
Columbia Adaptive Retirement 2050 Fund
Columbia Adaptive Retirement 2055 Fund
Columbia Adaptive Retirement 2060 Fund
Not FDIC or NCUA Insured • No Financial Institution Guarantee • May Lose Value
| 3 |
| 5 |
| 7 |
| 9 |
| 11 |
| 13 |
| 15 |
| 17 |
| 19 |
| 21 |
| 23 |
| 25 |
| 43 |
| 46 |
| 49 |
| 54 |
| 72 |
| 83 |
| 84 |
| 90 |
| 91 |
| 97 |
Columbia Adaptive Retirement Funds | Annual Report 2023
Fund at a Glance
Columbia Adaptive Retirement 2020 Fund (Unaudited)
Investment objective
Columbia Adaptive Retirement 2020 Fund (the Fund) seeks capital appreciation and current income.
Portfolio management
Joshua Kutin, CFA
Lead Portfolio Manager
Managed Fund since 2017
Alexander Wilkinson, CFA, CAIA
Portfolio Manager
Managed Fund since 2017
| Average annual total returns (%) (for the period ended March 31, 2023) |
| | | Inception | 1 Year | 5 Years | Life |
| Advisor Class | 10/24/17 | -4.30 | 3.29 | 3.16 |
| Institutional 3 Class | 10/24/17 | -4.23 | 3.31 | 3.18 |
| Dow Jones Target 2020 Index | | -6.25 | 1.36 | 1.62 |
All results shown assume reinvestment of distributions during the period. Returns do not reflect the deduction of taxes that a shareholder may pay on Fund distributions or on the redemption of Fund shares. Performance results reflect the effect of any fee waivers or reimbursements of Fund expenses by Columbia Management Investment Advisers, LLC and/or any of its affiliates. Absent these fee waivers or expense reimbursement arrangements, performance results would have been lower.
The performance information shown represents past performance and is not a guarantee of future results. The investment return and principal value of your investment will fluctuate so that your shares, when redeemed, may be worth more or less than their original cost. Current performance may be lower or higher than the performance information shown. You may obtain performance information current to the most recent month-end by contacting your financial intermediary, visiting columbiathreadneedleus.com/investor/ or calling 800.345.6611.
The Dow Jones Target 2020 Index is designed to measure total portfolios of stocks, bonds, and cash that automatically adjust over time to reduce potential risk as an investor’s target maturity date approaches.
Indices are not available for investment, are not professionally managed and do not reflect sales charges, fees, brokerage commissions, taxes or other expenses of investing. Securities in the Fund may not match those in an index.
Columbia Adaptive Retirement Funds | Annual Report 2023
| 3 |
Fund at a Glance (continued)
Columbia Adaptive Retirement 2020 Fund (Unaudited)
Performance of a hypothetical $10,000 investment (October 24, 2017 — March 31, 2023)
The chart above shows the change in value of a hypothetical $10,000 investment in Institutional 3 Class shares of Columbia Adaptive Retirement 2020 Fund during the stated time period, and does not reflect the deduction of taxes that a shareholder may pay on Fund distributions or on the redemption of Fund shares.
| Portfolio breakdown (%) (at March 31, 2023) |
| Alternative Strategies Funds | 4.0 |
| Exchange-Traded Equity Funds | 4.0 |
| Exchange-Traded Fixed Income Funds | 7.8 |
| Money Market Funds | 5.4 |
| Multi-Asset/Tactical Strategies Funds | 78.8 |
| Total | 100.0 |
Percentages indicated are based upon total investments excluding investments in derivatives, if any. The Fund’s portfolio composition is subject to change.
| 4 | Columbia Adaptive Retirement Funds | Annual Report 2023 |
Fund at a Glance
Columbia Adaptive Retirement 2025 Fund (Unaudited)
Investment objective
Columbia Adaptive Retirement 2025 Fund (the Fund) seeks capital appreciation and current income.
Portfolio management
Joshua Kutin, CFA
Lead Portfolio Manager
Managed Fund since 2018
Alexander Wilkinson, CFA, CAIA
Portfolio Manager
Managed Fund since 2018
| Average annual total returns (%) (for the period ended March 31, 2023) |
| | | Inception | 1 Year | Life |
| Advisor Class | 04/04/18 | -4.79 | 3.85 |
| Institutional 3 Class | 04/04/18 | -4.73 | 3.90 |
| Dow Jones Target 2025 Index | | -6.18 | 2.29 |
All results shown assume reinvestment of distributions during the period. Returns do not reflect the deduction of taxes that a shareholder may pay on Fund distributions or on the redemption of Fund shares. Performance results reflect the effect of any fee waivers or reimbursements of Fund expenses by Columbia Management Investment Advisers, LLC and/or any of its affiliates. Absent these fee waivers or expense reimbursement arrangements, performance results would have been lower.
The performance information shown represents past performance and is not a guarantee of future results. The investment return and principal value of your investment will fluctuate so that your shares, when redeemed, may be worth more or less than their original cost. Current performance may be lower or higher than the performance information shown. You may obtain performance information current to the most recent month-end by contacting your financial intermediary, visiting columbiathreadneedleus.com/investor/ or calling 800.345.6611.
The Dow Jones Target 2025 Index is designed to measure total portfolios of stocks, bonds, and cash that automatically adjust over time to reduce potential risk as an investor’s target maturity date approaches.
Indices are not available for investment, are not professionally managed and do not reflect sales charges, fees, brokerage commissions, taxes or other expenses of investing. Securities in the Fund may not match those in an index.
Columbia Adaptive Retirement Funds | Annual Report 2023
| 5 |
Fund at a Glance (continued)
Columbia Adaptive Retirement 2025 Fund (Unaudited)
Performance of a hypothetical $10,000 investment (April 04, 2018 — March 31, 2023)
The chart above shows the change in value of a hypothetical $10,000 investment in Institutional 3 Class shares of Columbia Adaptive Retirement 2025 Fund during the stated time period, and does not reflect the deduction of taxes that a shareholder may pay on Fund distributions or on the redemption of Fund shares.
| Portfolio breakdown (%) (at March 31, 2023) |
| Alternative Strategies Funds | 3.9 |
| Exchange-Traded Equity Funds | 4.0 |
| Exchange-Traded Fixed Income Funds | 7.9 |
| Money Market Funds | 5.7 |
| Multi-Asset/Tactical Strategies Funds | 78.5 |
| Total | 100.0 |
Percentages indicated are based upon total investments excluding investments in derivatives, if any. The Fund’s portfolio composition is subject to change.
| 6 | Columbia Adaptive Retirement Funds | Annual Report 2023 |
Fund at a Glance
Columbia Adaptive Retirement 2030 Fund (Unaudited)
Investment objective
Columbia Adaptive Retirement 2030 Fund (the Fund) seeks capital appreciation and current income.
Portfolio management
Joshua Kutin, CFA
Lead Portfolio Manager
Managed Fund since 2017
Alexander Wilkinson, CFA, CAIA
Portfolio Manager
Managed Fund since 2017
| Average annual total returns (%) (for the period ended March 31, 2023) |
| | | Inception | 1 Year | 5 Years | Life |
| Advisor Class | 10/24/17 | -5.40 | 4.36 | 4.17 |
| Institutional 3 Class | 10/24/17 | -5.34 | 4.46 | 4.26 |
| Dow Jones Target 2030 Index | | -6.35 | 3.22 | 3.49 |
All results shown assume reinvestment of distributions during the period. Returns do not reflect the deduction of taxes that a shareholder may pay on Fund distributions or on the redemption of Fund shares. Performance results reflect the effect of any fee waivers or reimbursements of Fund expenses by Columbia Management Investment Advisers, LLC and/or any of its affiliates. Absent these fee waivers or expense reimbursement arrangements, performance results would have been lower.
The performance information shown represents past performance and is not a guarantee of future results. The investment return and principal value of your investment will fluctuate so that your shares, when redeemed, may be worth more or less than their original cost. Current performance may be lower or higher than the performance information shown. You may obtain performance information current to the most recent month-end by contacting your financial intermediary, visiting columbiathreadneedleus.com/investor/ or calling 800.345.6611.
The Dow Jones Target 2030 Index is designed to measure total portfolios of stocks, bonds, and cash that automatically adjust over time to reduce potential risk as an investor’s target maturity date approaches.
Indices are not available for investment, are not professionally managed and do not reflect sales charges, fees, brokerage commissions, taxes or other expenses of investing. Securities in the Fund may not match those in an index.
Columbia Adaptive Retirement Funds | Annual Report 2023
| 7 |
Fund at a Glance (continued)
Columbia Adaptive Retirement 2030 Fund (Unaudited)
Performance of a hypothetical $10,000 investment (October 24, 2017 — March 31, 2023)
The chart above shows the change in value of a hypothetical $10,000 investment in Institutional 3 Class shares of Columbia Adaptive Retirement 2030 Fund during the stated time period, and does not reflect the deduction of taxes that a shareholder may pay on Fund distributions or on the redemption of Fund shares.
| Portfolio breakdown (%) (at March 31, 2023) |
| Alternative Strategies Funds | 4.0 |
| Exchange-Traded Equity Funds | 3.8 |
| Exchange-Traded Fixed Income Funds | 7.9 |
| Money Market Funds | 4.7 |
| Multi-Asset/Tactical Strategies Funds | 79.6 |
| Total | 100.0 |
Percentages indicated are based upon total investments excluding investments in derivatives, if any. The Fund’s portfolio composition is subject to change.
| 8 | Columbia Adaptive Retirement Funds | Annual Report 2023 |
Fund at a Glance
Columbia Adaptive Retirement 2035 Fund (Unaudited)
Investment objective
Columbia Adaptive Retirement 2035 Fund (the Fund) seeks capital appreciation and current income.
Portfolio management
Joshua Kutin, CFA
Lead Portfolio Manager
Managed Fund since 2018
Alexander Wilkinson, CFA, CAIA
Portfolio Manager
Managed Fund since 2018
| Average annual total returns (%) (for the period ended March 31, 2023) |
| | | Inception | 1 Year | Life |
| Advisor Class | 04/04/18 | -5.97 | 5.20 |
| Institutional 3 Class | 04/04/18 | -5.96 | 5.26 |
| Dow Jones Target 2035 Index | | -6.52 | 4.22 |
All results shown assume reinvestment of distributions during the period. Returns do not reflect the deduction of taxes that a shareholder may pay on Fund distributions or on the redemption of Fund shares. Performance results reflect the effect of any fee waivers or reimbursements of Fund expenses by Columbia Management Investment Advisers, LLC and/or any of its affiliates. Absent these fee waivers or expense reimbursement arrangements, performance results would have been lower.
The performance information shown represents past performance and is not a guarantee of future results. The investment return and principal value of your investment will fluctuate so that your shares, when redeemed, may be worth more or less than their original cost. Current performance may be lower or higher than the performance information shown. You may obtain performance information current to the most recent month-end by contacting your financial intermediary, visiting columbiathreadneedleus.com/investor/ or calling 800.345.6611.
The Dow Jones Target 2035 Index is designed to measure total portfolios of stocks, bonds, and cash that automatically adjust over time to reduce potential risk as an investor’s target maturity date approaches.
Indices are not available for investment, are not professionally managed and do not reflect sales charges, fees, brokerage commissions, taxes or other expenses of investing. Securities in the Fund may not match those in an index.
Columbia Adaptive Retirement Funds | Annual Report 2023
| 9 |
Fund at a Glance (continued)
Columbia Adaptive Retirement 2035 Fund (Unaudited)
Performance of a hypothetical $10,000 investment (April 04, 2018 — March 31, 2023)
The chart above shows the change in value of a hypothetical $10,000 investment in Institutional 3 Class shares of Columbia Adaptive Retirement 2035 Fund during the stated time period, and does not reflect the deduction of taxes that a shareholder may pay on Fund distributions or on the redemption of Fund shares.
| Portfolio breakdown (%) (at March 31, 2023) |
| Alternative Strategies Funds | 4.0 |
| Exchange-Traded Equity Funds | 4.0 |
| Exchange-Traded Fixed Income Funds | 7.9 |
| Money Market Funds | 4.8 |
| Multi-Asset/Tactical Strategies Funds | 79.3 |
| Total | 100.0 |
Percentages indicated are based upon total investments excluding investments in derivatives, if any. The Fund’s portfolio composition is subject to change.
| 10 | Columbia Adaptive Retirement Funds | Annual Report 2023 |
Fund at a Glance
Columbia Adaptive Retirement 2040 Fund (Unaudited)
Investment objective
Columbia Adaptive Retirement 2040 Fund (the Fund) seeks capital appreciation and current income.
Portfolio management
Joshua Kutin, CFA
Lead Portfolio Manager
Managed Fund since 2017
Alexander Wilkinson, CFA, CAIA
Portfolio Manager
Managed Fund since 2017
| Average annual total returns (%) (for the period ended March 31, 2023) |
| | | Inception | 1 Year | 5 Years | Life |
| Advisor Class | 10/24/17 | -6.82 | 5.87 | 5.57 |
| Institutional 3 Class | 10/24/17 | -6.73 | 5.93 | 5.63 |
| Dow Jones Target 2040 Index | | -6.78 | 5.00 | 5.25 |
All results shown assume reinvestment of distributions during the period. Returns do not reflect the deduction of taxes that a shareholder may pay on Fund distributions or on the redemption of Fund shares. Performance results reflect the effect of any fee waivers or reimbursements of Fund expenses by Columbia Management Investment Advisers, LLC and/or any of its affiliates. Absent these fee waivers or expense reimbursement arrangements, performance results would have been lower.
The performance information shown represents past performance and is not a guarantee of future results. The investment return and principal value of your investment will fluctuate so that your shares, when redeemed, may be worth more or less than their original cost. Current performance may be lower or higher than the performance information shown. You may obtain performance information current to the most recent month-end by contacting your financial intermediary, visiting columbiathreadneedleus.com/investor/ or calling 800.345.6611.
The Dow Jones Target 2040 Index is designed to measure total portfolios of stocks, bonds, and cash that automatically adjust over time to reduce potential risk as an investor’s target maturity date approaches.
Indices are not available for investment, are not professionally managed and do not reflect sales charges, fees, brokerage commissions, taxes or other expenses of investing. Securities in the Fund may not match those in an index.
Columbia Adaptive Retirement Funds | Annual Report 2023
| 11 |
Fund at a Glance (continued)
Columbia Adaptive Retirement 2040 Fund (Unaudited)
Performance of a hypothetical $10,000 investment (October 24, 2017 — March 31, 2023)
The chart above shows the change in value of a hypothetical $10,000 investment in Institutional 3 Class shares of Columbia Adaptive Retirement 2040 Fund during the stated time period, and does not reflect the deduction of taxes that a shareholder may pay on Fund distributions or on the redemption of Fund shares.
| Portfolio breakdown (%) (at March 31, 2023) |
| Alternative Strategies Funds | 3.9 |
| Exchange-Traded Equity Funds | 4.0 |
| Exchange-Traded Fixed Income Funds | 7.9 |
| Money Market Funds | 5.0 |
| Multi-Asset/Tactical Strategies Funds | 79.2 |
| Total | 100.0 |
Percentages indicated are based upon total investments excluding investments in derivatives, if any. The Fund’s portfolio composition is subject to change.
| 12 | Columbia Adaptive Retirement Funds | Annual Report 2023 |
Fund at a Glance
Columbia Adaptive Retirement 2045 Fund (Unaudited)
Investment objective
Columbia Adaptive Retirement 2045 Fund (the Fund) seeks capital appreciation and current income.
Portfolio management
Joshua Kutin, CFA
Lead Portfolio Manager
Managed Fund since 2018
Alexander Wilkinson, CFA, CAIA
Portfolio Manager
Managed Fund since 2018
| Average annual total returns (%) (for the period ended March 31, 2023) |
| | | Inception | 1 Year | Life |
| Advisor Class | 04/04/18 | -7.51 | 6.60 |
| Institutional 3 Class | 04/04/18 | -7.45 | 6.63 |
| Dow Jones Target 2045 Index | | -6.89 | 5.75 |
All results shown assume reinvestment of distributions during the period. Returns do not reflect the deduction of taxes that a shareholder may pay on Fund distributions or on the redemption of Fund shares. Performance results reflect the effect of any fee waivers or reimbursements of Fund expenses by Columbia Management Investment Advisers, LLC and/or any of its affiliates. Absent these fee waivers or expense reimbursement arrangements, performance results would have been lower.
The performance information shown represents past performance and is not a guarantee of future results. The investment return and principal value of your investment will fluctuate so that your shares, when redeemed, may be worth more or less than their original cost. Current performance may be lower or higher than the performance information shown. You may obtain performance information current to the most recent month-end by contacting your financial intermediary, visiting columbiathreadneedleus.com/investor/ or calling 800.345.6611.
The Dow Jones Target 2045 Index is designed to measure total portfolios of stocks, bonds, and cash that automatically adjust over time to reduce potential risk as an investor’s target maturity date approaches.
Indices are not available for investment, are not professionally managed and do not reflect sales charges, fees, brokerage commissions, taxes or other expenses of investing. Securities in the Fund may not match those in an index.
Columbia Adaptive Retirement Funds | Annual Report 2023
| 13 |
Fund at a Glance (continued)
Columbia Adaptive Retirement 2045 Fund (Unaudited)
Performance of a hypothetical $10,000 investment (April 04, 2018 — March 31, 2023)
The chart above shows the change in value of a hypothetical $10,000 investment in Institutional 3 Class shares of Columbia Adaptive Retirement 2045 Fund during the stated time period, and does not reflect the deduction of taxes that a shareholder may pay on Fund distributions or on the redemption of Fund shares.
| Portfolio breakdown (%) (at March 31, 2023) |
| Alternative Strategies Funds | 3.9 |
| Exchange-Traded Equity Funds | 4.0 |
| Exchange-Traded Fixed Income Funds | 7.8 |
| Money Market Funds | 5.2 |
| Multi-Asset/Tactical Strategies Funds | 79.1 |
| Total | 100.0 |
Percentages indicated are based upon total investments excluding investments in derivatives, if any. The Fund’s portfolio composition is subject to change.
| 14 | Columbia Adaptive Retirement Funds | Annual Report 2023 |
Fund at a Glance
Columbia Adaptive Retirement 2050 Fund (Unaudited)
Investment objective
Columbia Adaptive Retirement 2050 Fund (the Fund) seeks capital appreciation and current income.
Portfolio management
Joshua Kutin, CFA
Lead Portfolio Manager
Managed Fund since 2017
Alexander Wilkinson, CFA, CAIA
Portfolio Manager
Managed Fund since 2017
| Average annual total returns (%) (for the period ended March 31, 2023) |
| | | Inception | 1 Year | 5 Years | Life |
| Advisor Class | 10/24/17 | -8.17 | 6.96 | 6.59 |
| Institutional 3 Class | 10/24/17 | -8.04 | 6.98 | 6.62 |
| Dow Jones Target 2050 Index | | -6.95 | 6.12 | 6.34 |
All results shown assume reinvestment of distributions during the period. Returns do not reflect the deduction of taxes that a shareholder may pay on Fund distributions or on the redemption of Fund shares. Performance results reflect the effect of any fee waivers or reimbursements of Fund expenses by Columbia Management Investment Advisers, LLC and/or any of its affiliates. Absent these fee waivers or expense reimbursement arrangements, performance results would have been lower.
The performance information shown represents past performance and is not a guarantee of future results. The investment return and principal value of your investment will fluctuate so that your shares, when redeemed, may be worth more or less than their original cost. Current performance may be lower or higher than the performance information shown. You may obtain performance information current to the most recent month-end by contacting your financial intermediary, visiting columbiathreadneedleus.com/investor/ or calling 800.345.6611.
The Dow Jones Target 2050 Index is designed to measure total portfolios of stocks, bonds, and cash that automatically adjust over time to reduce potential risk as an investor’s target maturity date approaches.
Indices are not available for investment, are not professionally managed and do not reflect sales charges, fees, brokerage commissions, taxes or other expenses of investing. Securities in the Fund may not match those in an index.
Columbia Adaptive Retirement Funds | Annual Report 2023
| 15 |
Fund at a Glance (continued)
Columbia Adaptive Retirement 2050 Fund (Unaudited)
Performance of a hypothetical $10,000 investment (October 24, 2017 — March 31, 2023)
The chart above shows the change in value of a hypothetical $10,000 investment in Institutional 3 Class shares of Columbia Adaptive Retirement 2050 Fund during the stated time period, and does not reflect the deduction of taxes that a shareholder may pay on Fund distributions or on the redemption of Fund shares.
| Portfolio breakdown (%) (at March 31, 2023) |
| Alternative Strategies Funds | 3.9 |
| Exchange-Traded Equity Funds | 4.0 |
| Exchange-Traded Fixed Income Funds | 7.8 |
| Money Market Funds | 5.0 |
| Multi-Asset/Tactical Strategies Funds | 79.3 |
| Total | 100.0 |
Percentages indicated are based upon total investments excluding investments in derivatives, if any. The Fund’s portfolio composition is subject to change.
| 16 | Columbia Adaptive Retirement Funds | Annual Report 2023 |
Fund at a Glance
Columbia Adaptive Retirement 2055 Fund (Unaudited)
Investment objective
Columbia Adaptive Retirement 2055 Fund (the Fund) seeks capital appreciation and current income.
Portfolio management
Joshua Kutin, CFA
Lead Portfolio Manager
Managed Fund since 2018
Alexander Wilkinson, CFA, CAIA
Portfolio Manager
Managed Fund since 2018
| Average annual total returns (%) (for the period ended March 31, 2023) |
| | | Inception | 1 Year | Life |
| Advisor Class | 04/04/18 | -8.30 | 7.03 |
| Institutional 3 Class | 04/04/18 | -8.23 | 7.05 |
| Dow Jones Target 2055 Index | | -6.98 | 6.37 |
All results shown assume reinvestment of distributions during the period. Returns do not reflect the deduction of taxes that a shareholder may pay on Fund distributions or on the redemption of Fund shares. Performance results reflect the effect of any fee waivers or reimbursements of Fund expenses by Columbia Management Investment Advisers, LLC and/or any of its affiliates. Absent these fee waivers or expense reimbursement arrangements, performance results would have been lower.
The performance information shown represents past performance and is not a guarantee of future results. The investment return and principal value of your investment will fluctuate so that your shares, when redeemed, may be worth more or less than their original cost. Current performance may be lower or higher than the performance information shown. You may obtain performance information current to the most recent month-end by contacting your financial intermediary, visiting columbiathreadneedleus.com/investor/ or calling 800.345.6611.
The Dow Jones Target 2055 Index is designed to measure total portfolios of stocks, bonds, and cash that automatically adjust over time to reduce potential risk as an investor’s target maturity date approaches.
Indices are not available for investment, are not professionally managed and do not reflect sales charges, fees, brokerage commissions, taxes or other expenses of investing. Securities in the Fund may not match those in an index.
Columbia Adaptive Retirement Funds | Annual Report 2023
| 17 |
Fund at a Glance (continued)
Columbia Adaptive Retirement 2055 Fund (Unaudited)
Performance of a hypothetical $10,000 investment (April 04, 2018 — March 31, 2023)
The chart above shows the change in value of a hypothetical $10,000 investment in Institutional 3 Class shares of Columbia Adaptive Retirement 2055 Fund during the stated time period, and does not reflect the deduction of taxes that a shareholder may pay on Fund distributions or on the redemption of Fund shares.
| Portfolio breakdown (%) (at March 31, 2023) |
| Alternative Strategies Funds | 3.9 |
| Exchange-Traded Equity Funds | 4.0 |
| Exchange-Traded Fixed Income Funds | 7.9 |
| Money Market Funds | 4.9 |
| Multi-Asset/Tactical Strategies Funds | 79.3 |
| Total | 100.0 |
Percentages indicated are based upon total investments excluding investments in derivatives, if any. The Fund’s portfolio composition is subject to change.
| 18 | Columbia Adaptive Retirement Funds | Annual Report 2023 |
Fund at a Glance
Columbia Adaptive Retirement 2060 Fund (Unaudited)
Investment objective
Columbia Adaptive Retirement 2060 Fund (the Fund) seeks capital appreciation and current income.
Portfolio management
Joshua Kutin, CFA
Lead Portfolio Manager
Managed Fund since 2017
Alexander Wilkinson, CFA, CAIA
Portfolio Manager
Managed Fund since 2017
| Average annual total returns (%) (for the period ended March 31, 2023) |
| | | Inception | 1 Year | 5 Years | Life |
| Advisor Class | 10/24/17 | -8.31 | 7.03 | 6.67 |
| Institutional 3 Class | 10/24/17 | -8.28 | 7.07 | 6.71 |
| Dow Jones Target 2060 Index | | -6.97 | 6.29 | 6.50 |
All results shown assume reinvestment of distributions during the period. Returns do not reflect the deduction of taxes that a shareholder may pay on Fund distributions or on the redemption of Fund shares. Performance results reflect the effect of any fee waivers or reimbursements of Fund expenses by Columbia Management Investment Advisers, LLC and/or any of its affiliates. Absent these fee waivers or expense reimbursement arrangements, performance results would have been lower.
The performance information shown represents past performance and is not a guarantee of future results. The investment return and principal value of your investment will fluctuate so that your shares, when redeemed, may be worth more or less than their original cost. Current performance may be lower or higher than the performance information shown. You may obtain performance information current to the most recent month-end by contacting your financial intermediary, visiting columbiathreadneedleus.com/investor/ or calling 800.345.6611.
The Dow Jones Target 2060 Index is designed to measure total portfolios of stocks, bonds, and cash that automatically adjust over time to reduce potential risk as an investor’s target maturity date approaches.
Indices are not available for investment, are not professionally managed and do not reflect sales charges, fees, brokerage commissions, taxes or other expenses of investing. Securities in the Fund may not match those in an index.
Columbia Adaptive Retirement Funds | Annual Report 2023
| 19 |
Fund at a Glance (continued)
Columbia Adaptive Retirement 2060 Fund (Unaudited)
Performance of a hypothetical $10,000 investment (October 24, 2017 — March 31, 2023)
The chart above shows the change in value of a hypothetical $10,000 investment in Institutional 3 Class shares of Columbia Adaptive Retirement 2060 Fund during the stated time period, and does not reflect the deduction of taxes that a shareholder may pay on Fund distributions or on the redemption of Fund shares.
| Portfolio breakdown (%) (at March 31, 2023) |
| Alternative Strategies Funds | 3.9 |
| Exchange-Traded Equity Funds | 4.0 |
| Exchange-Traded Fixed Income Funds | 7.8 |
| Money Market Funds | 4.9 |
| Multi-Asset/Tactical Strategies Funds | 79.4 |
| Total | 100.0 |
Percentages indicated are based upon total investments excluding investments in derivatives, if any. The Fund’s portfolio composition is subject to change.
| 20 | Columbia Adaptive Retirement Funds | Annual Report 2023 |
Manager Discussion of Fund Performance
(Unaudited)
All returns listed below are for Institutional 3 Class shares for the 12-month period that ended March 31, 2023.
| • | Columbia Adaptive Retirement 2020 Fund returned -4.23% for the 12-month period ended March 31, 2023. The Fund outperformed the Dow Jones Target 2020 Index, which returned -6.25% for the same period. |
| • | Columbia Adaptive Retirement 2025 Fund returned -4.73% for the 12-month period ended March 31, 2023. The Fund outperformed the Dow Jones Target 2025 Index, which returned -6.18% for the same period. |
| • | Columbia Adaptive Retirement 2030 Fund returned -5.34% for the 12-month period ended March 31, 2023. The Fund outperformed the Dow Jones Target 2030 Index, which returned -6.35% for the same period. |
| • | Columbia Adaptive Retirement 2035 Fund returned -5.96% for the 12-month period ended March 31, 2023. The Fund outperformed the Dow Jones Target 2035 Index, which returned -6.52% for the same period. |
| • | Columbia Adaptive Retirement 2040 Fund returned -6.73% for the 12-month period ended March 31, 2023. The Fund outperformed the Dow Jones Target 2040 Index, which returned -6.78% for the same period. |
| • | Columbia Adaptive Retirement 2045 Fund returned -7.45% for the 12-month period ended March 31, 2023. The Fund underperformed the Dow Jones Target 2045 Index, which returned -6.89% for the same period. |
| • | Columbia Adaptive Retirement 2050 Fund returned -8.04% for the 12-month period ended March 31, 2023. The Fund underperformed the Dow Jones Target 2050 Index, which returned -6.95% for the same period. |
| • | Columbia Adaptive Retirement 2055 Fund returned -8.23% for the 12-month period ended March 31, 2023. The Fund underperformed the Dow Jones Target 2055 Index, which returned -6.98% for the same period. |
| • | Columbia Adaptive Retirement 2060 Fund returned -8.28% for the 12-month period ended March 31, 2023. The Fund underperformed the Dow Jones Target 2060 Index, which returned -6.97% for the same period. |
Market overview
Global equity markets delivered mixed results during the 12-month period, with most major benchmarks posting negative returns despite strong results in certain industry groups. Numerous concerns weighed on sentiment throughout the first half of the period, particularly a combination of geopolitical and financial market events that punished most asset returns except for “hard” assets such as oil, gold and other commodities. As a result of the Russian invasion of Ukraine, many western nations imposed punitive sanctions on Russia that limited its ability to transact in global markets and access assets held outside its borders. Combined, Russia and Ukraine provide a significant portion of many raw materials to the global economy, focused most prominently in Europe and the Middle East. Loss of these supplies disrupted access to basic necessities for many countries and raised the cost of such goods precipitously in some cases.
Despite occasional bursts of optimism that drove brief attempts at equity rallies, market momentum remained volatile and continued downward. Poor fixed-income returns, which typically have served as a safe-haven offset to declining equity markets, compounded the steep drawdowns in stocks. A steadily strengthening U.S. dollar over the first seven months of the reporting period (from the end of February 2022 through the end of September 2022) was an additional headwind for U.S. investors and eroded returns significantly.
Sentiment reversed abruptly later in the period, apparently fueled by hints that the global slowdown was beginning to moderate. Investors also were pleased that China scrapped its zero-COVID lockdown policy, even though that welcome news was followed by worries that a resulting surge in COVID infections would weigh on growth and make for a challenging reopening of the country’s economy. Those expectations helped weaken the U.S. dollar and buoy international equity returns for U.S. investors.
March 2023 brought new concerns as the failure of several U.S. banks, together with the collapse of the 167-year-old European financial giant Credit Suisse, ignited fears that a banking crisis similar to 2008-2009 could emerge. These worries rapidly dissipated, however, leading to a strong rally in the final week of March that added to equity and fixed-income returns.
Columbia Adaptive Retirement Funds | Annual Report 2023
| 21 |
Manager Discussion of Fund Performance (continued)
(Unaudited)
The Funds’ notable contributors during the period
| • | The Funds were underweight in equities compared to their corresponding benchmarks for the second and third quarter of 2022, which contributed positively to performance during periods of heightened equity volatility during the aforementioned quarters in 2022. |
| • | Exposure to Treasury Inflation-Protected Securities (TIPS) contributed positively to performance relative to the Funds’ corresponding benchmarks in the second half of the reporting period, as the Funds were overweight TIPS compared to their Dow Jones Target-Date benchmarks. |
The Funds’ notable detractors during the period
| • | Each Fund in the target-date lineup remained underweight in equities compared to their corresponding benchmark during the second half of the reporting period. Equities rebounded from increased volatility experienced during the beginning of 2022, and the Funds’ respective underweights in the asset class compared to their respective benchmarks detracted from overall performance. |
| • | The Funds were overweight in interest-rate sensitive securities compared to their benchmarks in the second and third quarter of 2022. Fixed income experienced periods of heavy volatility in the beginning of 2022, and the Funds’ overweight exposures to the asset class detracted from performance during the first half of the reporting period. |
Market risk may affect a single issuer, sector of the economy, industry or the market as a whole. The principal value of the Funds’ is not guaranteed at any time, including the target date. The Funds’ investment in other funds subjects it to the investment performance (positive or negative), risks and expenses of these underlying funds. Asset allocation does not assure a profit or protect against loss. Investing in derivatives is a specialized activity that involves special risks that subject the Funds’ to significant loss potential, including when used as leverage, and may result in greater fluctuation in fund value. Commodity investments may be affected by the overall market and industry- and commodity-specific factors, and may be more volatile and less liquid than other investments. Short positions (where the underlying asset is not owned) can create unlimited risk. International investing involves certain risks and volatility due to potential political, economic or currency instabilities and different financial and accounting standards. Risks are enhanced for emerging market issuers. Investments in small- and mid-cap companies involve risks and volatility greater than investments in larger, more established companies. Fixed-income securities present issuer default risk. Non-investment-grade (high-yield or junk) securities present greater price volatility and more risk to principal and income than higher rated securities. A rise in interest rates may result in a price decline of fixed-income instruments held by the Funds’, negatively impacting its performance and NAV. Falling rates may result in the Funds’ investing in lower yielding debt instruments, lowering the Funds income and yield. These risks may be heightened for longer maturity and duration securities. Interest payments on inflation-protected securities may be more volatile than interest payments on ordinary bonds. In periods of deflation, these securities may provide no income. Market or other (e.g., interest rate) environments may adversely affect the liquidity of fund investments, negatively impacting their price. Generally, the less liquid the market at the time the Funds sells a holding, the greater the risk of loss or decline of value to the fund. The Funds’ use of leverage allows for investment exposure in excess of net assets, thereby magnifying volatility of returns and risk of loss. Investments selected using quantitative methods may perform differently from the market as a whole and may not enable the Fund to achieve its objective. Like real estate, REITs are subject to illiquidity, valuation and financing complexities, taxes, default, bankruptcy and other economic, political or regulatory occurrences. See the Funds’ prospectus for more information on these and other risks.
The views expressed in this report reflect the current views of the respective parties who have contributed to this report. These views are not guarantees of future performance and involve certain risks, uncertainties and assumptions that are difficult to predict, so actual outcomes and results may differ significantly from the views expressed. These views are subject to change at any time based upon economic, market or other conditions and the respective parties disclaim any responsibility to update such views. These views may not be relied on as investment advice and, because investment decisions for a Columbia fund are based on numerous factors, may not be relied on as an indication of trading intent on behalf of any particular Columbia fund. References to specific securities should not be construed as a recommendation or investment advice.
| 22 | Columbia Adaptive Retirement Funds | Annual Report 2023 |
Understanding Your Fund’s Expenses
(Unaudited)
As an investor, you incur two types of costs. There are shareholder transaction costs, which may include redemption fees. There are also ongoing fund costs, which generally include management fees, distribution and/or service fees, and other fund expenses. The following information is intended to help you understand your ongoing costs (in dollars) of investing in the Fund and to help you compare these costs with the ongoing costs of investing in other mutual funds.
Analyzing your Fund’s expenses
To illustrate these ongoing costs, we have provided examples and calculated the expenses paid by investors in each share class of the Fund during the period. The actual and hypothetical information in the table is based on an initial investment of $1,000 at the beginning of the period indicated and held for the entire period. Expense information is calculated two ways and each method provides you with different information. The amount listed in the “Actual” column is calculated using the Fund’s actual operating expenses and total return for the period. You may use the Actual information, together with the amount invested, to estimate the expenses that you paid over the period. Simply divide your account value by $1,000 (for example, an $8,600 account value divided by $1,000 = 8.6), then multiply the results by the expenses paid during the period under the “Actual” column. The amount listed in the “Hypothetical” column assumes a 5% annual rate of return before expenses (which is not the Fund’s actual return) and then applies the Fund’s actual expense ratio for the period to the hypothetical return. You should not use the hypothetical account values and expenses to estimate either your actual account balance at the end of the period or the expenses you paid during the period. See “Compare with other funds” below for details on how to use the hypothetical data.
In addition to the ongoing expenses which the Fund bears directly, the Fund’s shareholders indirectly bear the Fund’s allocable share of the costs and expenses of each underlying fund in which the Fund invests. You can also estimate the effective expenses paid during the period, which includes the indirect fees associated with investing in the underlying funds, by using the amounts listed in the “Effective expenses paid during the period” column.
Compare with other funds
Since all mutual funds are required to include the same hypothetical calculations about expenses in shareholder reports, you can use this information to compare the ongoing cost of investing in the Fund with other funds. To do so, compare the hypothetical example with the 5% hypothetical examples that appear in the shareholder reports of other funds. As you compare hypothetical examples of other funds, it is important to note that hypothetical examples are meant to highlight the ongoing costs of investing in a fund only and do not reflect any transaction costs, such as redemption or exchange fees. Therefore, the hypothetical calculations are useful in comparing ongoing costs only, and will not help you determine the relative total costs of owning different funds. If transaction costs were included in these calculations, your costs would be higher.
| October 1, 2022 — March 31, 2023 |
| | Account value at the
beginning of the
period ($) | Account value at the
end of the
period ($) | Expenses paid during
the period ($) | Fund’s annualized
expense ratio (%) | Effective expenses
paid during the
period ($) | Fund’s effective
annualized
expense ratio (%) |
| | Actual | Hypothetical | Actual | Hypothetical | Actual | Hypothetical | Actual | Actual | Hypothetical | Actual |
| Columbia Adaptive Retirement 2020 Fund |
| Advisor Class | 1,000.00 | 1,000.00 | 1,043.50 | 1,022.59 | 2.39 | 2.37 | 0.47 | 2.60 | 2.57 | 0.51 |
| Institutional 3 Class | 1,000.00 | 1,000.00 | 1,042.70 | 1,022.99 | 1.99 | 1.97 | 0.39 | 2.19 | 2.17 | 0.43 |
| Columbia Adaptive Retirement 2025 Fund |
| Advisor Class | 1,000.00 | 1,000.00 | 1,044.10 | 1,022.74 | 2.24 | 2.22 | 0.44 | 2.45 | 2.42 | 0.48 |
| Institutional 3 Class | 1,000.00 | 1,000.00 | 1,044.60 | 1,022.99 | 1.99 | 1.97 | 0.39 | 2.19 | 2.17 | 0.43 |
| Columbia Adaptive Retirement 2030 Fund |
| Advisor Class | 1,000.00 | 1,000.00 | 1,046.60 | 1,022.24 | 2.76 | 2.72 | 0.54 | 2.96 | 2.92 | 0.58 |
| Institutional 3 Class | 1,000.00 | 1,000.00 | 1,045.90 | 1,022.99 | 1.99 | 1.97 | 0.39 | 2.19 | 2.17 | 0.43 |
| Columbia Adaptive Retirement 2035 Fund |
| Advisor Class | 1,000.00 | 1,000.00 | 1,050.60 | 1,022.44 | 2.56 | 2.52 | 0.50 | 2.76 | 2.72 | 0.54 |
| Institutional 3 Class | 1,000.00 | 1,000.00 | 1,050.70 | 1,022.99 | 1.99 | 1.97 | 0.39 | 2.20 | 2.17 | 0.43 |
Columbia Adaptive Retirement Funds | Annual Report 2023
| 23 |
Understanding Your Fund’s Expenses (continued)
(Unaudited)
| October 1, 2022 — March 31, 2023 |
| | Account value at the
beginning of the
period ($) | Account value at the
end of the
period ($) | Expenses paid during
the period ($) | Fund’s annualized
expense ratio (%) | Effective expenses
paid during the
period ($) | Fund’s effective
annualized
expense ratio (%) |
| | Actual | Hypothetical | Actual | Hypothetical | Actual | Hypothetical | Actual | Actual | Hypothetical | Actual |
| Columbia Adaptive Retirement 2040 Fund |
| Advisor Class | 1,000.00 | 1,000.00 | 1,053.20 | 1,022.49 | 2.51 | 2.47 | 0.49 | 2.71 | 2.67 | 0.53 |
| Institutional 3 Class | 1,000.00 | 1,000.00 | 1,054.10 | 1,022.99 | 2.00 | 1.97 | 0.39 | 2.20 | 2.17 | 0.43 |
| Columbia Adaptive Retirement 2045 Fund |
| Advisor Class | 1,000.00 | 1,000.00 | 1,056.60 | 1,022.59 | 2.41 | 2.37 | 0.47 | 2.61 | 2.57 | 0.51 |
| Institutional 3 Class | 1,000.00 | 1,000.00 | 1,057.30 | 1,022.99 | 2.00 | 1.97 | 0.39 | 2.21 | 2.17 | 0.43 |
| Columbia Adaptive Retirement 2050 Fund |
| Advisor Class | 1,000.00 | 1,000.00 | 1,058.90 | 1,022.84 | 2.16 | 2.12 | 0.42 | 2.36 | 2.32 | 0.46 |
| Institutional 3 Class | 1,000.00 | 1,000.00 | 1,059.50 | 1,022.99 | 2.00 | 1.97 | 0.39 | 2.21 | 2.17 | 0.43 |
| Columbia Adaptive Retirement 2055 Fund |
| Advisor Class | 1,000.00 | 1,000.00 | 1,060.40 | 1,022.59 | 2.41 | 2.37 | 0.47 | 2.62 | 2.57 | 0.51 |
| Institutional 3 Class | 1,000.00 | 1,000.00 | 1,060.10 | 1,022.99 | 2.00 | 1.97 | 0.39 | 2.21 | 2.17 | 0.43 |
| Columbia Adaptive Retirement 2060 Fund |
| Advisor Class | 1,000.00 | 1,000.00 | 1,060.10 | 1,022.44 | 2.57 | 2.52 | 0.50 | 2.77 | 2.72 | 0.54 |
| Institutional 3 Class | 1,000.00 | 1,000.00 | 1,060.20 | 1,022.99 | 2.00 | 1.97 | 0.39 | 2.21 | 2.17 | 0.43 |
Expenses paid during the period are equal to the annualized expense ratio for each class as indicated above, multiplied by the average account value over the period and then multiplied by the number of days in the Fund’s most recent fiscal half year and divided by 365.
Effective expenses paid during the period and the Fund’s effective annualized expense ratio include expenses borne directly to the class plus the Fund’s pro rata portion of the ongoing expenses charged by the underlying funds using the expense ratio of each class of the underlying funds as of the underlying fund’s most recent shareholder report.
Had Columbia Management Investment Advisers, LLC and/or certain of its affiliates not waived/reimbursed certain fees and expenses for each Fund, account value at the end of the period would have been reduced.
From time to time, the Investment Manager and its affiliates may waive fees and/or reimburse certain expenses of the Funds so that Fund level expenses (expenses directly attributable to the Funds and not to a specific share class) are waived proportionately across all share classes. This arrangement may be revised or terminated at any time without notice. Had the Investment Manager and its affiliates not waived fees and/or reimbursed the expenses of Columbia Adaptive Retirement 2020 Fund,Columbia Adaptive Retirement 2025 Fund,Columbia Adaptive Retirement 2030 Fund,Columbia Adaptive Retirement 2035 Fund, Columbia Adaptive Retirement 2040 Fund, Columbia Adaptive Retirement 2045 Fund, Columbia Adaptive Retirement 2050 Fund, Columbia Adaptive Retirement 2055 Fund and Columbia Adaptive Retirement 2060 Fund during the six months ended March 31, 2023, the annualized expense ratios would have been 0.62% for Advisor Class for each Fund. The actual expenses paid would have been $3.16, $3.16, $3.16, $3.17, $3.17, $3.18, $3.18, $3.18 and $3.18 for Advisor Class, respectively; the hypothetical expenses paid would have been $3.13 for Advisor Class for each Fund. The actual effective expenses paid would have been $3.36, $3.36, $3.37, $3.37, $3.38, $3.38, $3.39, $3.39 and $3.39 for Advisor Class, respectively; the hypothetical effective expenses paid would have been $3.33 for Advisor Class for each Fund.
Other share classes of the Funds may have had expense waiver/reimbursement changes; however, the changes were not considered material.
| 24 | Columbia Adaptive Retirement Funds | Annual Report 2023 |
Portfolio of Investments
Columbia Adaptive Retirement 2020 Fund, March 31, 2023
(Percentages represent value of investments compared to net assets)
Investments in securities
| Alternative Strategies Funds 4.0% |
| | Shares | Value ($) |
| Columbia Commodity Strategy Fund, Institutional 3 Class(a) | 5,273 | 53,468 |
Total Alternative Strategies Funds
(Cost $56,034) | 53,468 |
|
| Exchange-Traded Equity Funds 4.0% |
| | | |
| Real Estate 4.0% |
| iShares U.S. Real Estate ETF | 637 | 54,081 |
Total Exchange-Traded Equity Funds
(Cost $58,583) | 54,081 |
|
| Exchange-Traded Fixed Income Funds 8.0% |
| | | |
| Emerging Markets 1.0% |
| iShares JPMorgan USD Emerging Markets Bond ETF | 150 | 12,942 |
| Inflation Protected Securities 4.0% |
| iShares TIPS Bond ETF | 484 | 53,361 |
| Investment Grade 3.0% |
| Vanguard Mortgage-Backed Securities ETF | 856 | 39,847 |
Total Exchange-Traded Fixed Income Funds
(Cost $109,624) | 106,150 |
|
| Multi-Asset/Tactical Strategies Funds 80.0% |
| | Shares | Value ($) |
| Columbia Solutions Aggressive Portfolio(a) | 11,152 | 88,097 |
| Columbia Solutions Conservative Portfolio(a) | 110,241 | 978,938 |
Total Multi-Asset/Tactical Strategies Funds
(Cost $1,175,803) | 1,067,035 |
|
| Money Market Funds 5.5% |
| | |
| Columbia Short-Term Cash Fund, 4.983%(a),(b) | 72,842 | 72,828 |
Total Money Market Funds
(Cost $72,807) | 72,828 |
Total Investments in Securities
(Cost: $1,472,851) | 1,353,562 |
| Other Assets & Liabilities, Net | | (19,731) |
| Net Assets | 1,333,831 |
Notes to Portfolio of Investments
| (a) | As defined in the Investment Company Act of 1940, as amended, an affiliated company is one in which the Fund owns 5% or more of the company’s outstanding voting securities, or a company which is under common ownership or control with the Fund. The value of the holdings and transactions in these affiliated companies during the year ended March 31, 2023 are as follows: |
| Affiliated issuers | Beginning
of period($) | Purchases($) | Sales($) | Net change in
unrealized
appreciation
(depreciation)($) | End of
period($) | Capital gain
distributions($) | Realized gain
(loss)($) | Dividends —
affiliated
issuers ($) | End of
period shares |
| Columbia Commodity Strategy Fund, Institutional 3 Class |
| | 28,992 | 62,169 | (25,650) | (12,043) | 53,468 | — | 7,567 | — | 5,273 |
| Columbia Short-Term Cash Fund, 4.983% |
| | 164,665 | 717,441 | (809,314) | 36 | 72,828 | — | (15) | 3,675 | 72,842 |
| Columbia Solutions Aggressive Portfolio |
| | 112,863 | 25,579 | (38,177) | (12,168) | 88,097 | — | (5,082) | 7,274 | 11,152 |
| Columbia Solutions Conservative Portfolio |
| | 1,052,093 | 123,739 | (124,378) | (72,516) | 978,938 | — | (11,512) | 45,816 | 110,241 |
| Total | 1,358,613 | | | (96,691) | 1,193,331 | — | (9,042) | 56,765 | |
| (b) | The rate shown is the seven-day current annualized yield at March 31, 2023. |
The accompanying Notes to Financial Statements are an integral part of this statement.
Columbia Adaptive Retirement Funds | Annual Report 2023
| 25 |
Portfolio of Investments (continued)
Columbia Adaptive Retirement 2020 Fund, March 31, 2023
Fair value measurements
The Fund categorizes its fair value measurements according to a three-level hierarchy that maximizes the use of observable inputs and minimizes the use of unobservable inputs by prioritizing that the most observable input be used when available. Observable inputs are those that market participants would use in pricing an investment based on market data obtained from sources independent of the reporting entity. Unobservable inputs are those that reflect the Fund’s assumptions about the information market participants would use in pricing an investment. An investment’s level within the fair value hierarchy is based on the lowest level of any input that is deemed significant to the asset’s or liability’s fair value measurement. The input levels are not necessarily an indication of the risk or liquidity associated with investments at that level. For example, certain U.S. government securities are generally high quality and liquid, however, they are reflected as Level 2 because the inputs used to determine fair value may not always be quoted prices in an active market.
Fair value inputs are summarized in the three broad levels listed below:
| ■ | Level 1 — Valuations based on quoted prices for investments in active markets that the Fund has the ability to access at the measurement date. Valuation adjustments are not applied to Level 1 investments. |
| ■ | Level 2 — Valuations based on other significant observable inputs (including quoted prices for similar securities, interest rates, prepayment speeds, credit risks, etc.). |
| ■ | Level 3 — Valuations based on significant unobservable inputs (including the Fund’s own assumptions and judgment in determining the fair value of investments). |
Inputs that are used in determining fair value of an investment may include price information, credit data, volatility statistics, and other factors. These inputs can be either observable or unobservable. The availability of observable inputs can vary between investments, and is affected by various factors such as the type of investment, and the volume and level of activity for that investment or similar investments in the marketplace. The inputs will be considered by the Investment Manager, along with any other relevant factors in the calculation of an investment’s fair value. The Fund uses prices and inputs that are current as of the measurement date, which may include periods of market dislocations. During these periods, the availability of prices and inputs may be reduced for many investments. This condition could cause an investment to be reclassified between the various levels within the hierarchy.
Certain investments that have been measured at fair value using the net asset value (NAV) per share (or its equivalent) are not categorized in the fair value hierarchy. The fair value amounts presented in the table are intended to reconcile the fair value hierarchy to the amounts presented in the Portfolio of Investments. The Columbia Solutions Portfolios serve as investment vehicles for the Columbia Adaptive Retirement Funds and each pursues consistent total returns by seeking to allocate risks across multiple asset classes. Investments in the Columbia Solutions Portfolios may be redeemed on a daily basis without restriction.
Investments falling into the Level 3 category are primarily supported by quoted prices from brokers and dealers participating in the market for those investments. However, these may be classified as Level 3 investments due to lack of market transparency and corroboration to support these quoted prices. Additionally, valuation models may be used as the pricing source for any remaining investments classified as Level 3. These models may rely on one or more significant unobservable inputs and/or significant assumptions by the Investment Manager. Inputs used in valuations may include, but are not limited to, financial statement analysis, capital account balances, discount rates and estimated cash flows, and comparable company data.
The Fund’s Board of Trustees (the Board) has designated the Investment Manager, through its Valuation Committee (the Committee), as valuation designee, responsible for determining the fair value of the assets of the Fund for which market quotations are not readily available using valuation procedures approved by the Board. The Committee consists of voting and non-voting members from various groups within the Investment Manager’s organization, including operations and accounting, trading and investments, compliance, risk management and legal.
The Committee meets at least monthly to review and approve valuation matters, which may include a description of specific valuation determinations, data regarding pricing information received from approved pricing vendors and brokers and the results of Board-approved valuation policies and procedures (the Policies). The Policies address, among other things, instances when market quotations are or are not readily available, including recommendations of third party pricing vendors and a determination of appropriate pricing methodologies; events that require specific valuation determinations and assessment of fair value techniques; securities with a potential for stale pricing, including those that are illiquid, restricted, or in default; and the effectiveness of third party pricing vendors, including periodic reviews of vendors. The Committee meets more frequently, as needed, to discuss additional valuation matters, which may include the need to review back-testing results, review time-sensitive information or approve related valuation actions. Representatives of Columbia Management Investment Advisers, LLC report to the Board at each of its regularly scheduled meetings to discuss valuation matters and actions during the period, similar to those described earlier.
The following table is a summary of the inputs used to value the Fund’s investments at March 31, 2023:
| | Level 1 ($) | Level 2 ($) | Level 3 ($) | Assets at NAV ($) | Total ($) |
| Investments in Securities | | | | | |
| Alternative Strategies Funds | 53,468 | — | — | — | 53,468 |
| Exchange-Traded Equity Funds | 54,081 | — | — | — | 54,081 |
| Exchange-Traded Fixed Income Funds | 106,150 | — | — | — | 106,150 |
| Multi-Asset/Tactical Strategies Funds | — | — | — | 1,067,035 | 1,067,035 |
| Money Market Funds | 72,828 | — | — | — | 72,828 |
| Total Investments in Securities | 286,527 | — | — | 1,067,035 | 1,353,562 |
See the Portfolio of Investments for all investment classifications not indicated in the table.
The accompanying Notes to Financial Statements are an integral part of this statement.
| 26 | Columbia Adaptive Retirement Funds | Annual Report 2023 |
Portfolio of Investments
Columbia Adaptive Retirement 2025 Fund, March 31, 2023
(Percentages represent value of investments compared to net assets)
Investments in securities
| Alternative Strategies Funds 4.0% |
| | Shares | Value ($) |
| Columbia Commodity Strategy Fund, Institutional 3 Class(a) | 4,041 | 40,973 |
Total Alternative Strategies Funds
(Cost $42,959) | 40,973 |
|
| Exchange-Traded Equity Funds 4.1% |
| | | |
| Real Estate 4.1% |
| iShares U.S. Real Estate ETF | 488 | 41,431 |
Total Exchange-Traded Equity Funds
(Cost $44,909) | 41,431 |
|
| Exchange-Traded Fixed Income Funds 8.0% |
| | | |
| Emerging Markets 1.0% |
| iShares JPMorgan USD Emerging Markets Bond ETF | 115 | 9,922 |
| Inflation Protected Securities 4.0% |
| iShares TIPS Bond ETF | 374 | 41,233 |
| Investment Grade 3.0% |
| Vanguard Mortgage-Backed Securities ETF | 658 | 30,630 |
Total Exchange-Traded Fixed Income Funds
(Cost $84,833) | 81,785 |
|
| Multi-Asset/Tactical Strategies Funds 80.0% |
| | Shares | Value ($) |
| Columbia Solutions Aggressive Portfolio(a) | 18,262 | 144,275 |
| Columbia Solutions Conservative Portfolio(a) | 75,894 | 673,937 |
Total Multi-Asset/Tactical Strategies Funds
(Cost $915,000) | 818,212 |
|
| Money Market Funds 5.8% |
| | |
| Columbia Short-Term Cash Fund, 4.983%(a),(b) | 59,665 | 59,653 |
Total Money Market Funds
(Cost $59,632) | 59,653 |
Total Investments in Securities
(Cost: $1,147,333) | 1,042,054 |
| Other Assets & Liabilities, Net | | (19,395) |
| Net Assets | 1,022,659 |
Notes to Portfolio of Investments
| (a) | As defined in the Investment Company Act of 1940, as amended, an affiliated company is one in which the Fund owns 5% or more of the company’s outstanding voting securities, or a company which is under common ownership or control with the Fund. The value of the holdings and transactions in these affiliated companies during the year ended March 31, 2023 are as follows: |
| Affiliated issuers | Beginning
of period($) | Purchases($) | Sales($) | Net change in
unrealized
appreciation
(depreciation)($) | End of
period($) | Capital gain
distributions($) | Realized gain
(loss)($) | Dividends —
affiliated
issuers ($) | End of
period shares |
| Columbia Commodity Strategy Fund, Institutional 3 Class |
| | 21,694 | 46,786 | (18,431) | (9,076) | 40,973 | — | 5,711 | — | 4,041 |
| Columbia Short-Term Cash Fund, 4.983% |
| | 126,364 | 167,020 | (233,764) | 33 | 59,653 | — | (16) | 3,110 | 59,665 |
| Columbia Solutions Aggressive Portfolio |
| | 171,085 | 35,499 | (41,341) | (20,968) | 144,275 | — | (5,900) | 12,060 | 18,262 |
| Columbia Solutions Conservative Portfolio |
| | 699,230 | 63,245 | (35,556) | (52,982) | 673,937 | — | (3,268) | 31,929 | 75,894 |
| Total | 1,018,373 | | | (82,993) | 918,838 | — | (3,473) | 47,099 | |
| (b) | The rate shown is the seven-day current annualized yield at March 31, 2023. |
The accompanying Notes to Financial Statements are an integral part of this statement.
Columbia Adaptive Retirement Funds | Annual Report 2023
| 27 |
Portfolio of Investments (continued)
Columbia Adaptive Retirement 2025 Fund, March 31, 2023
Fair value measurements
The Fund categorizes its fair value measurements according to a three-level hierarchy that maximizes the use of observable inputs and minimizes the use of unobservable inputs by prioritizing that the most observable input be used when available. Observable inputs are those that market participants would use in pricing an investment based on market data obtained from sources independent of the reporting entity. Unobservable inputs are those that reflect the Fund’s assumptions about the information market participants would use in pricing an investment. An investment’s level within the fair value hierarchy is based on the lowest level of any input that is deemed significant to the asset’s or liability’s fair value measurement. The input levels are not necessarily an indication of the risk or liquidity associated with investments at that level. For example, certain U.S. government securities are generally high quality and liquid, however, they are reflected as Level 2 because the inputs used to determine fair value may not always be quoted prices in an active market.
Fair value inputs are summarized in the three broad levels listed below:
| ■ | Level 1 — Valuations based on quoted prices for investments in active markets that the Fund has the ability to access at the measurement date. Valuation adjustments are not applied to Level 1 investments. |
| ■ | Level 2 — Valuations based on other significant observable inputs (including quoted prices for similar securities, interest rates, prepayment speeds, credit risks, etc.). |
| ■ | Level 3 — Valuations based on significant unobservable inputs (including the Fund’s own assumptions and judgment in determining the fair value of investments). |
Inputs that are used in determining fair value of an investment may include price information, credit data, volatility statistics, and other factors. These inputs can be either observable or unobservable. The availability of observable inputs can vary between investments, and is affected by various factors such as the type of investment, and the volume and level of activity for that investment or similar investments in the marketplace. The inputs will be considered by the Investment Manager, along with any other relevant factors in the calculation of an investment’s fair value. The Fund uses prices and inputs that are current as of the measurement date, which may include periods of market dislocations. During these periods, the availability of prices and inputs may be reduced for many investments. This condition could cause an investment to be reclassified between the various levels within the hierarchy.
Certain investments that have been measured at fair value using the net asset value (NAV) per share (or its equivalent) are not categorized in the fair value hierarchy. The fair value amounts presented in the table are intended to reconcile the fair value hierarchy to the amounts presented in the Portfolio of Investments. The Columbia Solutions Portfolios serve as investment vehicles for the Columbia Adaptive Retirement Funds and each pursues consistent total returns by seeking to allocate risks across multiple asset classes. Investments in the Columbia Solutions Portfolios may be redeemed on a daily basis without restriction.
Investments falling into the Level 3 category are primarily supported by quoted prices from brokers and dealers participating in the market for those investments. However, these may be classified as Level 3 investments due to lack of market transparency and corroboration to support these quoted prices. Additionally, valuation models may be used as the pricing source for any remaining investments classified as Level 3. These models may rely on one or more significant unobservable inputs and/or significant assumptions by the Investment Manager. Inputs used in valuations may include, but are not limited to, financial statement analysis, capital account balances, discount rates and estimated cash flows, and comparable company data.
The Fund’s Board of Trustees (the Board) has designated the Investment Manager, through its Valuation Committee (the Committee), as valuation designee, responsible for determining the fair value of the assets of the Fund for which market quotations are not readily available using valuation procedures approved by the Board. The Committee consists of voting and non-voting members from various groups within the Investment Manager’s organization, including operations and accounting, trading and investments, compliance, risk management and legal.
The Committee meets at least monthly to review and approve valuation matters, which may include a description of specific valuation determinations, data regarding pricing information received from approved pricing vendors and brokers and the results of Board-approved valuation policies and procedures (the Policies). The Policies address, among other things, instances when market quotations are or are not readily available, including recommendations of third party pricing vendors and a determination of appropriate pricing methodologies; events that require specific valuation determinations and assessment of fair value techniques; securities with a potential for stale pricing, including those that are illiquid, restricted, or in default; and the effectiveness of third party pricing vendors, including periodic reviews of vendors. The Committee meets more frequently, as needed, to discuss additional valuation matters, which may include the need to review back-testing results, review time-sensitive information or approve related valuation actions. Representatives of Columbia Management Investment Advisers, LLC report to the Board at each of its regularly scheduled meetings to discuss valuation matters and actions during the period, similar to those described earlier.
The following table is a summary of the inputs used to value the Fund’s investments at March 31, 2023:
| | Level 1 ($) | Level 2 ($) | Level 3 ($) | Assets at NAV ($) | Total ($) |
| Investments in Securities | | | | | |
| Alternative Strategies Funds | 40,973 | — | — | — | 40,973 |
| Exchange-Traded Equity Funds | 41,431 | — | — | — | 41,431 |
| Exchange-Traded Fixed Income Funds | 81,785 | — | — | — | 81,785 |
| Multi-Asset/Tactical Strategies Funds | — | — | — | 818,212 | 818,212 |
| Money Market Funds | 59,653 | — | — | — | 59,653 |
| Total Investments in Securities | 223,842 | — | — | 818,212 | 1,042,054 |
See the Portfolio of Investments for all investment classifications not indicated in the table.
The accompanying Notes to Financial Statements are an integral part of this statement.
| 28 | Columbia Adaptive Retirement Funds | Annual Report 2023 |
Portfolio of Investments
Columbia Adaptive Retirement 2030 Fund, March 31, 2023
(Percentages represent value of investments compared to net assets)
Investments in securities
| Alternative Strategies Funds 4.0% |
| | Shares | Value ($) |
| Columbia Commodity Strategy Fund, Institutional 3 Class(a) | 9,302 | 94,323 |
Total Alternative Strategies Funds
(Cost $98,879) | 94,323 |
|
| Exchange-Traded Equity Funds 3.8% |
| | | |
| Real Estate 3.8% |
| iShares U.S. Real Estate ETF | 1,063 | 90,249 |
Total Exchange-Traded Equity Funds
(Cost $98,227) | 90,249 |
|
| Exchange-Traded Fixed Income Funds 8.0% |
| | | |
| Emerging Markets 1.0% |
| iShares JPMorgan USD Emerging Markets Bond ETF | 265 | 22,864 |
| Inflation Protected Securities 4.0% |
| iShares TIPS Bond ETF | 859 | 94,705 |
| Investment Grade 3.0% |
| Vanguard Mortgage-Backed Securities ETF | 1,515 | 70,523 |
Total Exchange-Traded Fixed Income Funds
(Cost $198,726) | 188,092 |
|
| Multi-Asset/Tactical Strategies Funds 80.0% |
| | Shares | Value ($) |
| Columbia Solutions Aggressive Portfolio(a) | 71,611 | 565,727 |
| Columbia Solutions Conservative Portfolio(a) | 148,608 | 1,319,645 |
Total Multi-Asset/Tactical Strategies Funds
(Cost $2,170,136) | 1,885,372 |
|
| Money Market Funds 4.7% |
| | |
| Columbia Short-Term Cash Fund, 4.983%(a),(b) | 110,102 | 110,080 |
Total Money Market Funds
(Cost $110,045) | 110,080 |
Total Investments in Securities
(Cost: $2,676,013) | 2,368,116 |
| Other Assets & Liabilities, Net | | (12,088) |
| Net Assets | 2,356,028 |
Notes to Portfolio of Investments
| (a) | As defined in the Investment Company Act of 1940, as amended, an affiliated company is one in which the Fund owns 5% or more of the company’s outstanding voting securities, or a company which is under common ownership or control with the Fund. The value of the holdings and transactions in these affiliated companies during the year ended March 31, 2023 are as follows: |
| Affiliated issuers | Beginning
of period($) | Purchases($) | Sales($) | Net change in
unrealized
appreciation
(depreciation)($) | End of
period($) | Capital gain
distributions($) | Realized gain
(loss)($) | Dividends —
affiliated
issuers ($) | End of
period shares |
| Columbia Commodity Strategy Fund, Institutional 3 Class |
| | 49,120 | 108,620 | (42,808) | (20,609) | 94,323 | — | 13,101 | — | 9,302 |
| Columbia Short-Term Cash Fund, 4.983% |
| | 267,519 | 385,967 | (543,469) | 63 | 110,080 | — | (28) | 6,127 | 110,102 |
| Columbia Solutions Aggressive Portfolio |
| | 644,705 | 148,133 | (148,315) | (78,796) | 565,727 | — | (23,332) | 46,996 | 71,611 |
| Columbia Solutions Conservative Portfolio |
| | 1,328,014 | 202,527 | (119,745) | (91,151) | 1,319,645 | — | (15,501) | 62,138 | 148,608 |
| Total | 2,289,358 | | | (190,493) | 2,089,775 | — | (25,760) | 115,261 | |
| (b) | The rate shown is the seven-day current annualized yield at March 31, 2023. |
The accompanying Notes to Financial Statements are an integral part of this statement.
Columbia Adaptive Retirement Funds | Annual Report 2023
| 29 |
Portfolio of Investments (continued)
Columbia Adaptive Retirement 2030 Fund, March 31, 2023
Fair value measurements
The Fund categorizes its fair value measurements according to a three-level hierarchy that maximizes the use of observable inputs and minimizes the use of unobservable inputs by prioritizing that the most observable input be used when available. Observable inputs are those that market participants would use in pricing an investment based on market data obtained from sources independent of the reporting entity. Unobservable inputs are those that reflect the Fund’s assumptions about the information market participants would use in pricing an investment. An investment’s level within the fair value hierarchy is based on the lowest level of any input that is deemed significant to the asset’s or liability’s fair value measurement. The input levels are not necessarily an indication of the risk or liquidity associated with investments at that level. For example, certain U.S. government securities are generally high quality and liquid, however, they are reflected as Level 2 because the inputs used to determine fair value may not always be quoted prices in an active market.
Fair value inputs are summarized in the three broad levels listed below:
| ■ | Level 1 — Valuations based on quoted prices for investments in active markets that the Fund has the ability to access at the measurement date. Valuation adjustments are not applied to Level 1 investments. |
| ■ | Level 2 — Valuations based on other significant observable inputs (including quoted prices for similar securities, interest rates, prepayment speeds, credit risks, etc.). |
| ■ | Level 3 — Valuations based on significant unobservable inputs (including the Fund’s own assumptions and judgment in determining the fair value of investments). |
Inputs that are used in determining fair value of an investment may include price information, credit data, volatility statistics, and other factors. These inputs can be either observable or unobservable. The availability of observable inputs can vary between investments, and is affected by various factors such as the type of investment, and the volume and level of activity for that investment or similar investments in the marketplace. The inputs will be considered by the Investment Manager, along with any other relevant factors in the calculation of an investment’s fair value. The Fund uses prices and inputs that are current as of the measurement date, which may include periods of market dislocations. During these periods, the availability of prices and inputs may be reduced for many investments. This condition could cause an investment to be reclassified between the various levels within the hierarchy.
Certain investments that have been measured at fair value using the net asset value (NAV) per share (or its equivalent) are not categorized in the fair value hierarchy. The fair value amounts presented in the table are intended to reconcile the fair value hierarchy to the amounts presented in the Portfolio of Investments. The Columbia Solutions Portfolios serve as investment vehicles for the Columbia Adaptive Retirement Funds and each pursues consistent total returns by seeking to allocate risks across multiple asset classes. Investments in the Columbia Solutions Portfolios may be redeemed on a daily basis without restriction.
Investments falling into the Level 3 category are primarily supported by quoted prices from brokers and dealers participating in the market for those investments. However, these may be classified as Level 3 investments due to lack of market transparency and corroboration to support these quoted prices. Additionally, valuation models may be used as the pricing source for any remaining investments classified as Level 3. These models may rely on one or more significant unobservable inputs and/or significant assumptions by the Investment Manager. Inputs used in valuations may include, but are not limited to, financial statement analysis, capital account balances, discount rates and estimated cash flows, and comparable company data.
The Fund’s Board of Trustees (the Board) has designated the Investment Manager, through its Valuation Committee (the Committee), as valuation designee, responsible for determining the fair value of the assets of the Fund for which market quotations are not readily available using valuation procedures approved by the Board. The Committee consists of voting and non-voting members from various groups within the Investment Manager’s organization, including operations and accounting, trading and investments, compliance, risk management and legal.
The Committee meets at least monthly to review and approve valuation matters, which may include a description of specific valuation determinations, data regarding pricing information received from approved pricing vendors and brokers and the results of Board-approved valuation policies and procedures (the Policies). The Policies address, among other things, instances when market quotations are or are not readily available, including recommendations of third party pricing vendors and a determination of appropriate pricing methodologies; events that require specific valuation determinations and assessment of fair value techniques; securities with a potential for stale pricing, including those that are illiquid, restricted, or in default; and the effectiveness of third party pricing vendors, including periodic reviews of vendors. The Committee meets more frequently, as needed, to discuss additional valuation matters, which may include the need to review back-testing results, review time-sensitive information or approve related valuation actions. Representatives of Columbia Management Investment Advisers, LLC report to the Board at each of its regularly scheduled meetings to discuss valuation matters and actions during the period, similar to those described earlier.
The following table is a summary of the inputs used to value the Fund’s investments at March 31, 2023:
| | Level 1 ($) | Level 2 ($) | Level 3 ($) | Assets at NAV ($) | Total ($) |
| Investments in Securities | | | | | |
| Alternative Strategies Funds | 94,323 | — | — | — | 94,323 |
| Exchange-Traded Equity Funds | 90,249 | — | — | — | 90,249 |
| Exchange-Traded Fixed Income Funds | 188,092 | — | — | — | 188,092 |
| Multi-Asset/Tactical Strategies Funds | — | — | — | 1,885,372 | 1,885,372 |
| Money Market Funds | 110,080 | — | — | — | 110,080 |
| Total Investments in Securities | 482,744 | — | — | 1,885,372 | 2,368,116 |
See the Portfolio of Investments for all investment classifications not indicated in the table.
The accompanying Notes to Financial Statements are an integral part of this statement.
| 30 | Columbia Adaptive Retirement Funds | Annual Report 2023 |
Portfolio of Investments
Columbia Adaptive Retirement 2035 Fund, March 31, 2023
(Percentages represent value of investments compared to net assets)
Investments in securities
| Alternative Strategies Funds 4.0% |
| | Shares | Value ($) |
| Columbia Commodity Strategy Fund, Institutional 3 Class(a) | 7,970 | 80,813 |
Total Alternative Strategies Funds
(Cost $84,724) | 80,813 |
|
| Exchange-Traded Equity Funds 4.1% |
| | | |
| Real Estate 4.1% |
| iShares U.S. Real Estate ETF | 963 | 81,759 |
Total Exchange-Traded Equity Funds
(Cost $88,609) | 81,759 |
|
| Exchange-Traded Fixed Income Funds 8.0% |
| | | |
| Emerging Markets 1.0% |
| iShares JPMorgan USD Emerging Markets Bond ETF | 227 | 19,586 |
| Inflation Protected Securities 4.0% |
| iShares TIPS Bond ETF | 737 | 81,254 |
| Investment Grade 3.0% |
| Vanguard Mortgage-Backed Securities ETF | 1,297 | 60,375 |
Total Exchange-Traded Fixed Income Funds
(Cost $164,770) | 161,215 |
|
| Multi-Asset/Tactical Strategies Funds 80.0% |
| | Shares | Value ($) |
| Columbia Solutions Aggressive Portfolio(a) | 93,288 | 736,979 |
| Columbia Solutions Conservative Portfolio(a) | 99,121 | 880,193 |
Total Multi-Asset/Tactical Strategies Funds
(Cost $1,781,357) | 1,617,172 |
|
| Money Market Funds 4.8% |
| | |
| Columbia Short-Term Cash Fund, 4.983%(a),(b) | 97,334 | 97,315 |
Total Money Market Funds
(Cost $97,285) | 97,315 |
Total Investments in Securities
(Cost: $2,216,745) | 2,038,274 |
| Other Assets & Liabilities, Net | | (17,854) |
| Net Assets | 2,020,420 |
Notes to Portfolio of Investments
| (a) | As defined in the Investment Company Act of 1940, as amended, an affiliated company is one in which the Fund owns 5% or more of the company’s outstanding voting securities, or a company which is under common ownership or control with the Fund. The value of the holdings and transactions in these affiliated companies during the year ended March 31, 2023 are as follows: |
| Affiliated issuers | Beginning
of period($) | Purchases($) | Sales($) | Net change in
unrealized
appreciation
(depreciation)($) | End of
period($) | Capital gain
distributions($) | Realized gain
(loss)($) | Dividends —
affiliated
issuers ($) | End of
period shares |
| Columbia Commodity Strategy Fund, Institutional 3 Class |
| | 29,342 | 90,827 | (25,851) | (13,505) | 80,813 | — | 7,760 | — | 7,970 |
| Columbia Short-Term Cash Fund, 4.983% |
| | 166,778 | 849,805 | (919,313) | 45 | 97,315 | — | (21) | 4,744 | 97,334 |
| Columbia Solutions Aggressive Portfolio |
| | 574,331 | 344,710 | (114,211) | (67,851) | 736,979 | — | (18,511) | 43,568 | 93,288 |
| Columbia Solutions Conservative Portfolio |
| | 604,737 | 371,916 | (61,627) | (34,833) | 880,193 | — | (8,888) | 29,493 | 99,121 |
| Total | 1,375,188 | | | (116,144) | 1,795,300 | — | (19,660) | 77,805 | |
| (b) | The rate shown is the seven-day current annualized yield at March 31, 2023. |
The accompanying Notes to Financial Statements are an integral part of this statement.
Columbia Adaptive Retirement Funds | Annual Report 2023
| 31 |
Portfolio of Investments (continued)
Columbia Adaptive Retirement 2035 Fund, March 31, 2023
Fair value measurements
The Fund categorizes its fair value measurements according to a three-level hierarchy that maximizes the use of observable inputs and minimizes the use of unobservable inputs by prioritizing that the most observable input be used when available. Observable inputs are those that market participants would use in pricing an investment based on market data obtained from sources independent of the reporting entity. Unobservable inputs are those that reflect the Fund’s assumptions about the information market participants would use in pricing an investment. An investment’s level within the fair value hierarchy is based on the lowest level of any input that is deemed significant to the asset’s or liability’s fair value measurement. The input levels are not necessarily an indication of the risk or liquidity associated with investments at that level. For example, certain U.S. government securities are generally high quality and liquid, however, they are reflected as Level 2 because the inputs used to determine fair value may not always be quoted prices in an active market.
Fair value inputs are summarized in the three broad levels listed below:
| ■ | Level 1 — Valuations based on quoted prices for investments in active markets that the Fund has the ability to access at the measurement date. Valuation adjustments are not applied to Level 1 investments. |
| ■ | Level 2 — Valuations based on other significant observable inputs (including quoted prices for similar securities, interest rates, prepayment speeds, credit risks, etc.). |
| ■ | Level 3 — Valuations based on significant unobservable inputs (including the Fund’s own assumptions and judgment in determining the fair value of investments). |
Inputs that are used in determining fair value of an investment may include price information, credit data, volatility statistics, and other factors. These inputs can be either observable or unobservable. The availability of observable inputs can vary between investments, and is affected by various factors such as the type of investment, and the volume and level of activity for that investment or similar investments in the marketplace. The inputs will be considered by the Investment Manager, along with any other relevant factors in the calculation of an investment’s fair value. The Fund uses prices and inputs that are current as of the measurement date, which may include periods of market dislocations. During these periods, the availability of prices and inputs may be reduced for many investments. This condition could cause an investment to be reclassified between the various levels within the hierarchy.
Certain investments that have been measured at fair value using the net asset value (NAV) per share (or its equivalent) are not categorized in the fair value hierarchy. The fair value amounts presented in the table are intended to reconcile the fair value hierarchy to the amounts presented in the Portfolio of Investments. The Columbia Solutions Portfolios serve as investment vehicles for the Columbia Adaptive Retirement Funds and each pursues consistent total returns by seeking to allocate risks across multiple asset classes. Investments in the Columbia Solutions Portfolios may be redeemed on a daily basis without restriction.
Investments falling into the Level 3 category are primarily supported by quoted prices from brokers and dealers participating in the market for those investments. However, these may be classified as Level 3 investments due to lack of market transparency and corroboration to support these quoted prices. Additionally, valuation models may be used as the pricing source for any remaining investments classified as Level 3. These models may rely on one or more significant unobservable inputs and/or significant assumptions by the Investment Manager. Inputs used in valuations may include, but are not limited to, financial statement analysis, capital account balances, discount rates and estimated cash flows, and comparable company data.
The Fund’s Board of Trustees (the Board) has designated the Investment Manager, through its Valuation Committee (the Committee), as valuation designee, responsible for determining the fair value of the assets of the Fund for which market quotations are not readily available using valuation procedures approved by the Board. The Committee consists of voting and non-voting members from various groups within the Investment Manager’s organization, including operations and accounting, trading and investments, compliance, risk management and legal.
The Committee meets at least monthly to review and approve valuation matters, which may include a description of specific valuation determinations, data regarding pricing information received from approved pricing vendors and brokers and the results of Board-approved valuation policies and procedures (the Policies). The Policies address, among other things, instances when market quotations are or are not readily available, including recommendations of third party pricing vendors and a determination of appropriate pricing methodologies; events that require specific valuation determinations and assessment of fair value techniques; securities with a potential for stale pricing, including those that are illiquid, restricted, or in default; and the effectiveness of third party pricing vendors, including periodic reviews of vendors. The Committee meets more frequently, as needed, to discuss additional valuation matters, which may include the need to review back-testing results, review time-sensitive information or approve related valuation actions. Representatives of Columbia Management Investment Advisers, LLC report to the Board at each of its regularly scheduled meetings to discuss valuation matters and actions during the period, similar to those described earlier.
The following table is a summary of the inputs used to value the Fund’s investments at March 31, 2023:
| | Level 1 ($) | Level 2 ($) | Level 3 ($) | Assets at NAV ($) | Total ($) |
| Investments in Securities | | | | | |
| Alternative Strategies Funds | 80,813 | — | — | — | 80,813 |
| Exchange-Traded Equity Funds | 81,759 | — | — | — | 81,759 |
| Exchange-Traded Fixed Income Funds | 161,215 | — | — | — | 161,215 |
| Multi-Asset/Tactical Strategies Funds | — | — | — | 1,617,172 | 1,617,172 |
| Money Market Funds | 97,315 | — | — | — | 97,315 |
| Total Investments in Securities | 421,102 | — | — | 1,617,172 | 2,038,274 |
See the Portfolio of Investments for all investment classifications not indicated in the table.
The accompanying Notes to Financial Statements are an integral part of this statement.
| 32 | Columbia Adaptive Retirement Funds | Annual Report 2023 |
Portfolio of Investments
Columbia Adaptive Retirement 2040 Fund, March 31, 2023
(Percentages represent value of investments compared to net assets)
Investments in securities
| Alternative Strategies Funds 4.0% |
| | Shares | Value ($) |
| Columbia Commodity Strategy Fund, Institutional 3 Class(a) | 5,954 | 60,375 |
Total Alternative Strategies Funds
(Cost $63,286) | 60,375 |
|
| Exchange-Traded Equity Funds 4.0% |
| | | |
| Real Estate 4.0% |
| iShares U.S. Real Estate ETF | 719 | 61,043 |
Total Exchange-Traded Equity Funds
(Cost $66,148) | 61,043 |
|
| Exchange-Traded Fixed Income Funds 8.0% |
| | | |
| Emerging Markets 1.0% |
| iShares JPMorgan USD Emerging Markets Bond ETF | 169 | 14,582 |
| Inflation Protected Securities 4.0% |
| iShares TIPS Bond ETF | 549 | 60,527 |
| Investment Grade 3.0% |
| Vanguard Mortgage-Backed Securities ETF | 969 | 45,106 |
Total Exchange-Traded Fixed Income Funds
(Cost $126,727) | 120,215 |
|
| Multi-Asset/Tactical Strategies Funds 80.1% |
| | Shares | Value ($) |
| Columbia Solutions Aggressive Portfolio(a) | 96,339 | 761,075 |
| Columbia Solutions Conservative Portfolio(a) | 50,528 | 448,695 |
Total Multi-Asset/Tactical Strategies Funds
(Cost $1,414,786) | 1,209,770 |
|
| Money Market Funds 5.1% |
| | |
| Columbia Short-Term Cash Fund, 4.983%(a),(b) | 77,039 | 77,023 |
Total Money Market Funds
(Cost $77,000) | 77,023 |
Total Investments in Securities
(Cost: $1,747,947) | 1,528,426 |
| Other Assets & Liabilities, Net | | (17,383) |
| Net Assets | 1,511,043 |
Notes to Portfolio of Investments
| (a) | As defined in the Investment Company Act of 1940, as amended, an affiliated company is one in which the Fund owns 5% or more of the company’s outstanding voting securities, or a company which is under common ownership or control with the Fund. The value of the holdings and transactions in these affiliated companies during the year ended March 31, 2023 are as follows: |
| Affiliated issuers | Beginning
of period($) | Purchases($) | Sales($) | Net change in
unrealized
appreciation
(depreciation)($) | End of
period($) | Capital gain
distributions($) | Realized gain
(loss)($) | Dividends —
affiliated
issuers ($) | End of
period shares |
| Columbia Commodity Strategy Fund, Institutional 3 Class |
| | 30,060 | 69,323 | (26,266) | (12,742) | 60,375 | — | 7,878 | — | 5,954 |
| Columbia Short-Term Cash Fund, 4.983% |
| | 169,453 | 247,110 | (339,577) | 37 | 77,023 | — | (13) | 3,978 | 77,039 |
| Columbia Solutions Aggressive Portfolio |
| | 799,949 | 180,519 | (104,324) | (115,069) | 761,075 | — | (17,303) | 62,893 | 96,339 |
| Columbia Solutions Conservative Portfolio |
| | 407,323 | 99,778 | (28,114) | (30,292) | 448,695 | — | (4,290) | 21,016 | 50,528 |
| Total | 1,406,785 | | | (158,066) | 1,347,168 | — | (13,728) | 87,887 | |
| (b) | The rate shown is the seven-day current annualized yield at March 31, 2023. |
The accompanying Notes to Financial Statements are an integral part of this statement.
Columbia Adaptive Retirement Funds | Annual Report 2023
| 33 |
Portfolio of Investments (continued)
Columbia Adaptive Retirement 2040 Fund, March 31, 2023
Fair value measurements
The Fund categorizes its fair value measurements according to a three-level hierarchy that maximizes the use of observable inputs and minimizes the use of unobservable inputs by prioritizing that the most observable input be used when available. Observable inputs are those that market participants would use in pricing an investment based on market data obtained from sources independent of the reporting entity. Unobservable inputs are those that reflect the Fund’s assumptions about the information market participants would use in pricing an investment. An investment’s level within the fair value hierarchy is based on the lowest level of any input that is deemed significant to the asset’s or liability’s fair value measurement. The input levels are not necessarily an indication of the risk or liquidity associated with investments at that level. For example, certain U.S. government securities are generally high quality and liquid, however, they are reflected as Level 2 because the inputs used to determine fair value may not always be quoted prices in an active market.
Fair value inputs are summarized in the three broad levels listed below:
| ■ | Level 1 — Valuations based on quoted prices for investments in active markets that the Fund has the ability to access at the measurement date. Valuation adjustments are not applied to Level 1 investments. |
| ■ | Level 2 — Valuations based on other significant observable inputs (including quoted prices for similar securities, interest rates, prepayment speeds, credit risks, etc.). |
| ■ | Level 3 — Valuations based on significant unobservable inputs (including the Fund’s own assumptions and judgment in determining the fair value of investments). |
Inputs that are used in determining fair value of an investment may include price information, credit data, volatility statistics, and other factors. These inputs can be either observable or unobservable. The availability of observable inputs can vary between investments, and is affected by various factors such as the type of investment, and the volume and level of activity for that investment or similar investments in the marketplace. The inputs will be considered by the Investment Manager, along with any other relevant factors in the calculation of an investment’s fair value. The Fund uses prices and inputs that are current as of the measurement date, which may include periods of market dislocations. During these periods, the availability of prices and inputs may be reduced for many investments. This condition could cause an investment to be reclassified between the various levels within the hierarchy.
Certain investments that have been measured at fair value using the net asset value (NAV) per share (or its equivalent) are not categorized in the fair value hierarchy. The fair value amounts presented in the table are intended to reconcile the fair value hierarchy to the amounts presented in the Portfolio of Investments. The Columbia Solutions Portfolios serve as investment vehicles for the Columbia Adaptive Retirement Funds and each pursues consistent total returns by seeking to allocate risks across multiple asset classes. Investments in the Columbia Solutions Portfolios may be redeemed on a daily basis without restriction.
Investments falling into the Level 3 category are primarily supported by quoted prices from brokers and dealers participating in the market for those investments. However, these may be classified as Level 3 investments due to lack of market transparency and corroboration to support these quoted prices. Additionally, valuation models may be used as the pricing source for any remaining investments classified as Level 3. These models may rely on one or more significant unobservable inputs and/or significant assumptions by the Investment Manager. Inputs used in valuations may include, but are not limited to, financial statement analysis, capital account balances, discount rates and estimated cash flows, and comparable company data.
The Fund’s Board of Trustees (the Board) has designated the Investment Manager, through its Valuation Committee (the Committee), as valuation designee, responsible for determining the fair value of the assets of the Fund for which market quotations are not readily available using valuation procedures approved by the Board. The Committee consists of voting and non-voting members from various groups within the Investment Manager’s organization, including operations and accounting, trading and investments, compliance, risk management and legal.
The Committee meets at least monthly to review and approve valuation matters, which may include a description of specific valuation determinations, data regarding pricing information received from approved pricing vendors and brokers and the results of Board-approved valuation policies and procedures (the Policies). The Policies address, among other things, instances when market quotations are or are not readily available, including recommendations of third party pricing vendors and a determination of appropriate pricing methodologies; events that require specific valuation determinations and assessment of fair value techniques; securities with a potential for stale pricing, including those that are illiquid, restricted, or in default; and the effectiveness of third party pricing vendors, including periodic reviews of vendors. The Committee meets more frequently, as needed, to discuss additional valuation matters, which may include the need to review back-testing results, review time-sensitive information or approve related valuation actions. Representatives of Columbia Management Investment Advisers, LLC report to the Board at each of its regularly scheduled meetings to discuss valuation matters and actions during the period, similar to those described earlier.
The following table is a summary of the inputs used to value the Fund’s investments at March 31, 2023:
| | Level 1 ($) | Level 2 ($) | Level 3 ($) | Assets at NAV ($) | Total ($) |
| Investments in Securities | | | | | |
| Alternative Strategies Funds | 60,375 | — | — | — | 60,375 |
| Exchange-Traded Equity Funds | 61,043 | — | — | — | 61,043 |
| Exchange-Traded Fixed Income Funds | 120,215 | — | — | — | 120,215 |
| Multi-Asset/Tactical Strategies Funds | — | — | — | 1,209,770 | 1,209,770 |
| Money Market Funds | 77,023 | — | — | — | 77,023 |
| Total Investments in Securities | 318,656 | — | — | 1,209,770 | 1,528,426 |
See the Portfolio of Investments for all investment classifications not indicated in the table.
The accompanying Notes to Financial Statements are an integral part of this statement.
| 34 | Columbia Adaptive Retirement Funds | Annual Report 2023 |
Portfolio of Investments
Columbia Adaptive Retirement 2045 Fund, March 31, 2023
(Percentages represent value of investments compared to net assets)
Investments in securities
| Alternative Strategies Funds 4.0% |
| | Shares | Value ($) |
| Columbia Commodity Strategy Fund, Institutional 3 Class(a) | 5,273 | 53,467 |
Total Alternative Strategies Funds
(Cost $56,027) | 53,467 |
|
| Exchange-Traded Equity Funds 4.0% |
| | | |
| Real Estate 4.0% |
| iShares U.S. Real Estate ETF | 637 | 54,081 |
Total Exchange-Traded Equity Funds
(Cost $58,571) | 54,081 |
|
| Exchange-Traded Fixed Income Funds 7.9% |
| | | |
| Emerging Markets 0.9% |
| iShares JPMorgan USD Emerging Markets Bond ETF | 149 | 12,855 |
| Inflation Protected Securities 4.0% |
| iShares TIPS Bond ETF | 483 | 53,251 |
| Investment Grade 3.0% |
| Vanguard Mortgage-Backed Securities ETF | 856 | 39,847 |
Total Exchange-Traded Fixed Income Funds
(Cost $111,128) | 105,953 |
|
| Multi-Asset/Tactical Strategies Funds 80.1% |
| | Shares | Value ($) |
| Columbia Solutions Aggressive Portfolio(a) | 108,522 | 857,323 |
| Columbia Solutions Conservative Portfolio(a) | 24,258 | 215,417 |
Total Multi-Asset/Tactical Strategies Funds
(Cost $1,267,577) | 1,072,740 |
|
| Money Market Funds 5.3% |
| | |
| Columbia Short-Term Cash Fund, 4.983%(a),(b) | 70,737 | 70,723 |
Total Money Market Funds
(Cost $70,700) | 70,723 |
Total Investments in Securities
(Cost: $1,564,003) | 1,356,964 |
| Other Assets & Liabilities, Net | | (17,414) |
| Net Assets | 1,339,550 |
Notes to Portfolio of Investments
| (a) | As defined in the Investment Company Act of 1940, as amended, an affiliated company is one in which the Fund owns 5% or more of the company’s outstanding voting securities, or a company which is under common ownership or control with the Fund. The value of the holdings and transactions in these affiliated companies during the year ended March 31, 2023 are as follows: |
| Affiliated issuers | Beginning
of period($) | Purchases($) | Sales($) | Net change in
unrealized
appreciation
(depreciation)($) | End of
period($) | Capital gain
distributions($) | Realized gain
(loss)($) | Dividends —
affiliated
issuers ($) | End of
period shares |
| Columbia Commodity Strategy Fund, Institutional 3 Class |
| | 25,667 | 61,320 | (22,569) | (10,951) | 53,467 | — | 6,714 | — | 5,273 |
| Columbia Short-Term Cash Fund, 4.983% |
| | 147,680 | 296,808 | (373,802) | 37 | 70,723 | — | (13) | 3,775 | 70,737 |
| Columbia Solutions Aggressive Portfolio |
| | 853,174 | 226,088 | (93,294) | (128,645) | 857,323 | — | (15,269) | 69,786 | 108,522 |
| Columbia Solutions Conservative Portfolio |
| | 175,753 | 67,467 | (14,595) | (13,208) | 215,417 | — | (2,281) | 9,939 | 24,258 |
| Total | 1,202,274 | | | (152,767) | 1,196,930 | — | (10,849) | 83,500 | |
| (b) | The rate shown is the seven-day current annualized yield at March 31, 2023. |
The accompanying Notes to Financial Statements are an integral part of this statement.
Columbia Adaptive Retirement Funds | Annual Report 2023
| 35 |
Portfolio of Investments (continued)
Columbia Adaptive Retirement 2045 Fund, March 31, 2023
Fair value measurements
The Fund categorizes its fair value measurements according to a three-level hierarchy that maximizes the use of observable inputs and minimizes the use of unobservable inputs by prioritizing that the most observable input be used when available. Observable inputs are those that market participants would use in pricing an investment based on market data obtained from sources independent of the reporting entity. Unobservable inputs are those that reflect the Fund’s assumptions about the information market participants would use in pricing an investment. An investment’s level within the fair value hierarchy is based on the lowest level of any input that is deemed significant to the asset’s or liability’s fair value measurement. The input levels are not necessarily an indication of the risk or liquidity associated with investments at that level. For example, certain U.S. government securities are generally high quality and liquid, however, they are reflected as Level 2 because the inputs used to determine fair value may not always be quoted prices in an active market.
Fair value inputs are summarized in the three broad levels listed below:
| ■ | Level 1 — Valuations based on quoted prices for investments in active markets that the Fund has the ability to access at the measurement date. Valuation adjustments are not applied to Level 1 investments. |
| ■ | Level 2 — Valuations based on other significant observable inputs (including quoted prices for similar securities, interest rates, prepayment speeds, credit risks, etc.). |
| ■ | Level 3 — Valuations based on significant unobservable inputs (including the Fund’s own assumptions and judgment in determining the fair value of investments). |
Inputs that are used in determining fair value of an investment may include price information, credit data, volatility statistics, and other factors. These inputs can be either observable or unobservable. The availability of observable inputs can vary between investments, and is affected by various factors such as the type of investment, and the volume and level of activity for that investment or similar investments in the marketplace. The inputs will be considered by the Investment Manager, along with any other relevant factors in the calculation of an investment’s fair value. The Fund uses prices and inputs that are current as of the measurement date, which may include periods of market dislocations. During these periods, the availability of prices and inputs may be reduced for many investments. This condition could cause an investment to be reclassified between the various levels within the hierarchy.
Certain investments that have been measured at fair value using the net asset value (NAV) per share (or its equivalent) are not categorized in the fair value hierarchy. The fair value amounts presented in the table are intended to reconcile the fair value hierarchy to the amounts presented in the Portfolio of Investments. The Columbia Solutions Portfolios serve as investment vehicles for the Columbia Adaptive Retirement Funds and each pursues consistent total returns by seeking to allocate risks across multiple asset classes. Investments in the Columbia Solutions Portfolios may be redeemed on a daily basis without restriction.
Investments falling into the Level 3 category are primarily supported by quoted prices from brokers and dealers participating in the market for those investments. However, these may be classified as Level 3 investments due to lack of market transparency and corroboration to support these quoted prices. Additionally, valuation models may be used as the pricing source for any remaining investments classified as Level 3. These models may rely on one or more significant unobservable inputs and/or significant assumptions by the Investment Manager. Inputs used in valuations may include, but are not limited to, financial statement analysis, capital account balances, discount rates and estimated cash flows, and comparable company data.
The Fund’s Board of Trustees (the Board) has designated the Investment Manager, through its Valuation Committee (the Committee), as valuation designee, responsible for determining the fair value of the assets of the Fund for which market quotations are not readily available using valuation procedures approved by the Board. The Committee consists of voting and non-voting members from various groups within the Investment Manager’s organization, including operations and accounting, trading and investments, compliance, risk management and legal.
The Committee meets at least monthly to review and approve valuation matters, which may include a description of specific valuation determinations, data regarding pricing information received from approved pricing vendors and brokers and the results of Board-approved valuation policies and procedures (the Policies). The Policies address, among other things, instances when market quotations are or are not readily available, including recommendations of third party pricing vendors and a determination of appropriate pricing methodologies; events that require specific valuation determinations and assessment of fair value techniques; securities with a potential for stale pricing, including those that are illiquid, restricted, or in default; and the effectiveness of third party pricing vendors, including periodic reviews of vendors. The Committee meets more frequently, as needed, to discuss additional valuation matters, which may include the need to review back-testing results, review time-sensitive information or approve related valuation actions. Representatives of Columbia Management Investment Advisers, LLC report to the Board at each of its regularly scheduled meetings to discuss valuation matters and actions during the period, similar to those described earlier.
The following table is a summary of the inputs used to value the Fund’s investments at March 31, 2023:
| | Level 1 ($) | Level 2 ($) | Level 3 ($) | Assets at NAV ($) | Total ($) |
| Investments in Securities | | | | | |
| Alternative Strategies Funds | 53,467 | — | — | — | 53,467 |
| Exchange-Traded Equity Funds | 54,081 | — | — | — | 54,081 |
| Exchange-Traded Fixed Income Funds | 105,953 | — | — | — | 105,953 |
| Multi-Asset/Tactical Strategies Funds | — | — | — | 1,072,740 | 1,072,740 |
| Money Market Funds | 70,723 | — | — | — | 70,723 |
| Total Investments in Securities | 284,224 | — | — | 1,072,740 | 1,356,964 |
See the Portfolio of Investments for all investment classifications not indicated in the table.
The accompanying Notes to Financial Statements are an integral part of this statement.
| 36 | Columbia Adaptive Retirement Funds | Annual Report 2023 |
Portfolio of Investments
Columbia Adaptive Retirement 2050 Fund, March 31, 2023
(Percentages represent value of investments compared to net assets)
Investments in securities
| Alternative Strategies Funds 4.0% |
| | Shares | Value ($) |
| Columbia Commodity Strategy Fund, Institutional 3 Class(a) | 6,149 | 62,356 |
Total Alternative Strategies Funds
(Cost $65,353) | 62,356 |
|
| Exchange-Traded Equity Funds 4.1% |
| | | |
| Real Estate 4.1% |
| iShares U.S. Real Estate ETF | 743 | 63,081 |
Total Exchange-Traded Equity Funds
(Cost $68,335) | 63,081 |
|
| Exchange-Traded Fixed Income Funds 7.9% |
| | | |
| Emerging Markets 0.9% |
| iShares JPMorgan USD Emerging Markets Bond ETF | 174 | 15,013 |
| Inflation Protected Securities 4.0% |
| iShares TIPS Bond ETF | 565 | 62,291 |
| Investment Grade 3.0% |
| Vanguard Mortgage-Backed Securities ETF | 999 | 46,503 |
Total Exchange-Traded Fixed Income Funds
(Cost $130,855) | 123,807 |
|
| Multi-Asset/Tactical Strategies Funds 80.1% |
| | Shares | Value ($) |
| Columbia Solutions Aggressive Portfolio(a) | 148,545 | 1,173,502 |
| Columbia Solutions Conservative Portfolio(a) | 8,851 | 78,601 |
Total Multi-Asset/Tactical Strategies Funds
(Cost $1,496,255) | 1,252,103 |
|
| Money Market Funds 5.0% |
| | |
| Columbia Short-Term Cash Fund, 4.983%(a),(b) | 78,661 | 78,645 |
Total Money Market Funds
(Cost $78,617) | 78,645 |
Total Investments in Securities
(Cost: $1,839,415) | 1,579,992 |
| Other Assets & Liabilities, Net | | (16,504) |
| Net Assets | 1,563,488 |
Notes to Portfolio of Investments
| (a) | As defined in the Investment Company Act of 1940, as amended, an affiliated company is one in which the Fund owns 5% or more of the company’s outstanding voting securities, or a company which is under common ownership or control with the Fund. The value of the holdings and transactions in these affiliated companies during the year ended March 31, 2023 are as follows: |
| Affiliated issuers | Beginning
of period($) | Purchases($) | Sales($) | Net change in
unrealized
appreciation
(depreciation)($) | End of
period($) | Capital gain
distributions($) | Realized gain
(loss)($) | Dividends —
affiliated
issuers ($) | End of
period shares |
| Columbia Commodity Strategy Fund, Institutional 3 Class |
| | 30,247 | 70,865 | (25,865) | (12,891) | 62,356 | — | 7,814 | — | 6,149 |
| Columbia Short-Term Cash Fund, 4.983% |
| | 169,766 | 392,113 | (483,277) | 43 | 78,645 | — | (20) | 4,037 | 78,661 |
| Columbia Solutions Aggressive Portfolio |
| | 1,158,872 | 322,839 | (130,521) | (177,688) | 1,173,502 | — | (20,817) | 95,989 | 148,545 |
| Columbia Solutions Conservative Portfolio |
| | 51,514 | 35,463 | (3,924) | (4,452) | 78,601 | — | (638) | 3,654 | 8,851 |
| Total | 1,410,399 | | | (194,988) | 1,393,104 | — | (13,661) | 103,680 | |
| (b) | The rate shown is the seven-day current annualized yield at March 31, 2023. |
The accompanying Notes to Financial Statements are an integral part of this statement.
Columbia Adaptive Retirement Funds | Annual Report 2023
| 37 |
Portfolio of Investments (continued)
Columbia Adaptive Retirement 2050 Fund, March 31, 2023
Fair value measurements
The Fund categorizes its fair value measurements according to a three-level hierarchy that maximizes the use of observable inputs and minimizes the use of unobservable inputs by prioritizing that the most observable input be used when available. Observable inputs are those that market participants would use in pricing an investment based on market data obtained from sources independent of the reporting entity. Unobservable inputs are those that reflect the Fund’s assumptions about the information market participants would use in pricing an investment. An investment’s level within the fair value hierarchy is based on the lowest level of any input that is deemed significant to the asset’s or liability’s fair value measurement. The input levels are not necessarily an indication of the risk or liquidity associated with investments at that level. For example, certain U.S. government securities are generally high quality and liquid, however, they are reflected as Level 2 because the inputs used to determine fair value may not always be quoted prices in an active market.
Fair value inputs are summarized in the three broad levels listed below:
| ■ | Level 1 — Valuations based on quoted prices for investments in active markets that the Fund has the ability to access at the measurement date. Valuation adjustments are not applied to Level 1 investments. |
| ■ | Level 2 — Valuations based on other significant observable inputs (including quoted prices for similar securities, interest rates, prepayment speeds, credit risks, etc.). |
| ■ | Level 3 — Valuations based on significant unobservable inputs (including the Fund’s own assumptions and judgment in determining the fair value of investments). |
Inputs that are used in determining fair value of an investment may include price information, credit data, volatility statistics, and other factors. These inputs can be either observable or unobservable. The availability of observable inputs can vary between investments, and is affected by various factors such as the type of investment, and the volume and level of activity for that investment or similar investments in the marketplace. The inputs will be considered by the Investment Manager, along with any other relevant factors in the calculation of an investment’s fair value. The Fund uses prices and inputs that are current as of the measurement date, which may include periods of market dislocations. During these periods, the availability of prices and inputs may be reduced for many investments. This condition could cause an investment to be reclassified between the various levels within the hierarchy.
Certain investments that have been measured at fair value using the net asset value (NAV) per share (or its equivalent) are not categorized in the fair value hierarchy. The fair value amounts presented in the table are intended to reconcile the fair value hierarchy to the amounts presented in the Portfolio of Investments. The Columbia Solutions Portfolios serve as investment vehicles for the Columbia Adaptive Retirement Funds and each pursues consistent total returns by seeking to allocate risks across multiple asset classes. Investments in the Columbia Solutions Portfolios may be redeemed on a daily basis without restriction.
Investments falling into the Level 3 category are primarily supported by quoted prices from brokers and dealers participating in the market for those investments. However, these may be classified as Level 3 investments due to lack of market transparency and corroboration to support these quoted prices. Additionally, valuation models may be used as the pricing source for any remaining investments classified as Level 3. These models may rely on one or more significant unobservable inputs and/or significant assumptions by the Investment Manager. Inputs used in valuations may include, but are not limited to, financial statement analysis, capital account balances, discount rates and estimated cash flows, and comparable company data.
The Fund’s Board of Trustees (the Board) has designated the Investment Manager, through its Valuation Committee (the Committee), as valuation designee, responsible for determining the fair value of the assets of the Fund for which market quotations are not readily available using valuation procedures approved by the Board. The Committee consists of voting and non-voting members from various groups within the Investment Manager’s organization, including operations and accounting, trading and investments, compliance, risk management and legal.
The Committee meets at least monthly to review and approve valuation matters, which may include a description of specific valuation determinations, data regarding pricing information received from approved pricing vendors and brokers and the results of Board-approved valuation policies and procedures (the Policies). The Policies address, among other things, instances when market quotations are or are not readily available, including recommendations of third party pricing vendors and a determination of appropriate pricing methodologies; events that require specific valuation determinations and assessment of fair value techniques; securities with a potential for stale pricing, including those that are illiquid, restricted, or in default; and the effectiveness of third party pricing vendors, including periodic reviews of vendors. The Committee meets more frequently, as needed, to discuss additional valuation matters, which may include the need to review back-testing results, review time-sensitive information or approve related valuation actions. Representatives of Columbia Management Investment Advisers, LLC report to the Board at each of its regularly scheduled meetings to discuss valuation matters and actions during the period, similar to those described earlier.
The following table is a summary of the inputs used to value the Fund’s investments at March 31, 2023:
| | Level 1 ($) | Level 2 ($) | Level 3 ($) | Assets at NAV ($) | Total ($) |
| Investments in Securities | | | | | |
| Alternative Strategies Funds | 62,356 | — | — | — | 62,356 |
| Exchange-Traded Equity Funds | 63,081 | — | — | — | 63,081 |
| Exchange-Traded Fixed Income Funds | 123,807 | — | — | — | 123,807 |
| Multi-Asset/Tactical Strategies Funds | — | — | — | 1,252,103 | 1,252,103 |
| Money Market Funds | 78,645 | — | — | — | 78,645 |
| Total Investments in Securities | 327,889 | — | — | 1,252,103 | 1,579,992 |
See the Portfolio of Investments for all investment classifications not indicated in the table.
The accompanying Notes to Financial Statements are an integral part of this statement.
| 38 | Columbia Adaptive Retirement Funds | Annual Report 2023 |
Portfolio of Investments
Columbia Adaptive Retirement 2055 Fund, March 31, 2023
(Percentages represent value of investments compared to net assets)
Investments in securities
| Alternative Strategies Funds 4.0% |
| | Shares | Value ($) |
| Columbia Commodity Strategy Fund, Institutional 3 Class(a) | 6,130 | 62,156 |
Total Alternative Strategies Funds
(Cost $65,161) | 62,156 |
|
| Exchange-Traded Equity Funds 4.0% |
| | | |
| Real Estate 4.0% |
| iShares U.S. Real Estate ETF | 740 | 62,826 |
Total Exchange-Traded Equity Funds
(Cost $68,092) | 62,826 |
|
| Exchange-Traded Fixed Income Funds 8.0% |
| | | |
| Emerging Markets 1.0% |
| iShares JPMorgan USD Emerging Markets Bond ETF | 174 | 15,013 |
| Inflation Protected Securities 4.0% |
| iShares TIPS Bond ETF | 567 | 62,512 |
| Investment Grade 3.0% |
| Vanguard Mortgage-Backed Securities ETF | 997 | 46,410 |
Total Exchange-Traded Fixed Income Funds
(Cost $131,403) | 123,935 |
|
| Multi-Asset/Tactical Strategies Funds 80.1% |
| | Shares | Value ($) |
| Columbia Solutions Aggressive Portfolio(a) | 158,083 | 1,248,855 |
Total Multi-Asset/Tactical Strategies Funds
(Cost $1,516,381) | 1,248,855 |
|
| Money Market Funds 5.0% |
| | |
| Columbia Short-Term Cash Fund, 4.983%(a),(b) | 77,694 | 77,679 |
Total Money Market Funds
(Cost $77,654) | 77,679 |
Total Investments in Securities
(Cost: $1,858,691) | 1,575,451 |
| Other Assets & Liabilities, Net | | (16,427) |
| Net Assets | 1,559,024 |
Notes to Portfolio of Investments
| (a) | As defined in the Investment Company Act of 1940, as amended, an affiliated company is one in which the Fund owns 5% or more of the company’s outstanding voting securities, or a company which is under common ownership or control with the Fund. The value of the holdings and transactions in these affiliated companies during the year ended March 31, 2023 are as follows: |
| Affiliated issuers | Beginning
of period($) | Purchases($) | Sales($) | Net change in
unrealized
appreciation
(depreciation)($) | End of
period($) | Capital gain
distributions($) | Realized gain
(loss)($) | Dividends —
affiliated
issuers ($) | End of
period shares |
| Columbia Commodity Strategy Fund, Institutional 3 Class |
| | 32,772 | 71,573 | (28,617) | (13,572) | 62,156 | — | 8,623 | — | 6,130 |
| Columbia Short-Term Cash Fund, 4.983% |
| | 180,485 | 392,200 | (495,044) | 38 | 77,679 | — | (13) | 4,375 | 77,694 |
| Columbia Solutions Aggressive Portfolio |
| | 1,302,586 | 282,644 | (152,627) | (183,748) | 1,248,855 | — | (31,987) | 104,325 | 158,083 |
| Total | 1,515,843 | | | (197,282) | 1,388,690 | — | (23,377) | 108,700 | |
| (b) | The rate shown is the seven-day current annualized yield at March 31, 2023. |
Fair value measurements
The Fund categorizes its fair value measurements according to a three-level hierarchy that maximizes the use of observable inputs and minimizes the use of unobservable inputs by prioritizing that the most observable input be used when available. Observable inputs are those that market participants would use in pricing an investment based on market data obtained from sources independent of the reporting entity. Unobservable inputs are those that reflect the Fund’s assumptions about the information market participants would use in
The accompanying Notes to Financial Statements are an integral part of this statement.
Columbia Adaptive Retirement Funds | Annual Report 2023
| 39 |
Portfolio of Investments (continued)
Columbia Adaptive Retirement 2055 Fund, March 31, 2023
Fair value measurements (continued)
pricing an investment. An investment’s level within the fair value hierarchy is based on the lowest level of any input that is deemed significant to the asset’s or liability’s fair value measurement. The input levels are not necessarily an indication of the risk or liquidity associated with investments at that level. For example, certain U.S. government securities are generally high quality and liquid, however, they are reflected as Level 2 because the inputs used to determine fair value may not always be quoted prices in an active market.
Fair value inputs are summarized in the three broad levels listed below:
| ■ | Level 1 — Valuations based on quoted prices for investments in active markets that the Fund has the ability to access at the measurement date. Valuation adjustments are not applied to Level 1 investments. |
| ■ | Level 2 — Valuations based on other significant observable inputs (including quoted prices for similar securities, interest rates, prepayment speeds, credit risks, etc.). |
| ■ | Level 3 — Valuations based on significant unobservable inputs (including the Fund’s own assumptions and judgment in determining the fair value of investments). |
Inputs that are used in determining fair value of an investment may include price information, credit data, volatility statistics, and other factors. These inputs can be either observable or unobservable. The availability of observable inputs can vary between investments, and is affected by various factors such as the type of investment, and the volume and level of activity for that investment or similar investments in the marketplace. The inputs will be considered by the Investment Manager, along with any other relevant factors in the calculation of an investment’s fair value. The Fund uses prices and inputs that are current as of the measurement date, which may include periods of market dislocations. During these periods, the availability of prices and inputs may be reduced for many investments. This condition could cause an investment to be reclassified between the various levels within the hierarchy.
Certain investments that have been measured at fair value using the net asset value (NAV) per share (or its equivalent) are not categorized in the fair value hierarchy. The fair value amounts presented in the table are intended to reconcile the fair value hierarchy to the amounts presented in the Portfolio of Investments. The Columbia Solutions Portfolios serve as investment vehicles for the Columbia Adaptive Retirement Funds and each pursues consistent total returns by seeking to allocate risks across multiple asset classes. Investments in the Columbia Solutions Portfolios may be redeemed on a daily basis without restriction.
Investments falling into the Level 3 category are primarily supported by quoted prices from brokers and dealers participating in the market for those investments. However, these may be classified as Level 3 investments due to lack of market transparency and corroboration to support these quoted prices. Additionally, valuation models may be used as the pricing source for any remaining investments classified as Level 3. These models may rely on one or more significant unobservable inputs and/or significant assumptions by the Investment Manager. Inputs used in valuations may include, but are not limited to, financial statement analysis, capital account balances, discount rates and estimated cash flows, and comparable company data.
The Fund’s Board of Trustees (the Board) has designated the Investment Manager, through its Valuation Committee (the Committee), as valuation designee, responsible for determining the fair value of the assets of the Fund for which market quotations are not readily available using valuation procedures approved by the Board. The Committee consists of voting and non-voting members from various groups within the Investment Manager’s organization, including operations and accounting, trading and investments, compliance, risk management and legal.
The Committee meets at least monthly to review and approve valuation matters, which may include a description of specific valuation determinations, data regarding pricing information received from approved pricing vendors and brokers and the results of Board-approved valuation policies and procedures (the Policies). The Policies address, among other things, instances when market quotations are or are not readily available, including recommendations of third party pricing vendors and a determination of appropriate pricing methodologies; events that require specific valuation determinations and assessment of fair value techniques; securities with a potential for stale pricing, including those that are illiquid, restricted, or in default; and the effectiveness of third party pricing vendors, including periodic reviews of vendors. The Committee meets more frequently, as needed, to discuss additional valuation matters, which may include the need to review back-testing results, review time-sensitive information or approve related valuation actions. Representatives of Columbia Management Investment Advisers, LLC report to the Board at each of its regularly scheduled meetings to discuss valuation matters and actions during the period, similar to those described earlier.
The following table is a summary of the inputs used to value the Fund’s investments at March 31, 2023:
| | Level 1 ($) | Level 2 ($) | Level 3 ($) | Assets at NAV ($) | Total ($) |
| Investments in Securities | | | | | |
| Alternative Strategies Funds | 62,156 | — | — | — | 62,156 |
| Exchange-Traded Equity Funds | 62,826 | — | — | — | 62,826 |
| Exchange-Traded Fixed Income Funds | 123,935 | — | — | — | 123,935 |
| Multi-Asset/Tactical Strategies Funds | — | — | — | 1,248,855 | 1,248,855 |
| Money Market Funds | 77,679 | — | — | — | 77,679 |
| Total Investments in Securities | 326,596 | — | — | 1,248,855 | 1,575,451 |
See the Portfolio of Investments for all investment classifications not indicated in the table.
The accompanying Notes to Financial Statements are an integral part of this statement.
| 40 | Columbia Adaptive Retirement Funds | Annual Report 2023 |
Portfolio of Investments
Columbia Adaptive Retirement 2060 Fund, March 31, 2023
(Percentages represent value of investments compared to net assets)
Investments in securities
| Alternative Strategies Funds 4.0% |
| | Shares | Value ($) |
| Columbia Commodity Strategy Fund, Institutional 3 Class(a) | 7,742 | 78,500 |
Total Alternative Strategies Funds
(Cost $82,253) | 78,500 |
|
| Exchange-Traded Equity Funds 4.0% |
| | | |
| Real Estate 4.0% |
| iShares U.S. Real Estate ETF | 935 | 79,381 |
Total Exchange-Traded Equity Funds
(Cost $85,958) | 79,381 |
|
| Exchange-Traded Fixed Income Funds 7.9% |
| | | |
| Emerging Markets 1.0% |
| iShares JPMorgan USD Emerging Markets Bond ETF | 216 | 18,637 |
| Inflation Protected Securities 4.0% |
| iShares TIPS Bond ETF | 708 | 78,057 |
| Investment Grade 2.9% |
| Vanguard Mortgage-Backed Securities ETF | 1,246 | 58,001 |
Total Exchange-Traded Fixed Income Funds
(Cost $164,113) | 154,695 |
|
| Multi-Asset/Tactical Strategies Funds 80.1% |
| | Shares | Value ($) |
| Columbia Solutions Aggressive Portfolio(a) | 199,675 | 1,577,433 |
Total Multi-Asset/Tactical Strategies Funds
(Cost $1,890,566) | 1,577,433 |
|
| Money Market Funds 4.9% |
| | |
| Columbia Short-Term Cash Fund, 4.983%(a),(b) | 96,776 | 96,757 |
Total Money Market Funds
(Cost $96,725) | 96,757 |
Total Investments in Securities
(Cost: $2,319,615) | 1,986,766 |
| Other Assets & Liabilities, Net | | (17,595) |
| Net Assets | 1,969,171 |
Notes to Portfolio of Investments
| (a) | As defined in the Investment Company Act of 1940, as amended, an affiliated company is one in which the Fund owns 5% or more of the company’s outstanding voting securities, or a company which is under common ownership or control with the Fund. The value of the holdings and transactions in these affiliated companies during the year ended March 31, 2023 are as follows: |
| Affiliated issuers | Beginning
of period($) | Purchases($) | Sales($) | Net change in
unrealized
appreciation
(depreciation)($) | End of
period($) | Capital gain
distributions($) | Realized gain
(loss)($) | Dividends —
affiliated
issuers ($) | End of
period shares |
| Columbia Commodity Strategy Fund, Institutional 3 Class |
| | 37,097 | 89,968 | (32,984) | (15,581) | 78,500 | — | 9,376 | — | 7,742 |
| Columbia Short-Term Cash Fund, 4.983% |
| | 206,841 | 461,907 | (572,038) | 47 | 96,757 | — | (18) | 4,994 | 96,776 |
| Columbia Solutions Aggressive Portfolio |
| | 1,508,051 | 429,460 | (119,977) | (240,101) | 1,577,433 | — | (19,667) | 128,602 | 199,675 |
| Total | 1,751,989 | | | (255,635) | 1,752,690 | — | (10,309) | 133,596 | |
| (b) | The rate shown is the seven-day current annualized yield at March 31, 2023. |
Fair value measurements
The Fund categorizes its fair value measurements according to a three-level hierarchy that maximizes the use of observable inputs and minimizes the use of unobservable inputs by prioritizing that the most observable input be used when available. Observable inputs are those that market participants would use in pricing an investment based on market data obtained from sources independent of the reporting entity. Unobservable inputs are those that reflect the Fund’s assumptions about the information market participants would use in
The accompanying Notes to Financial Statements are an integral part of this statement.
Columbia Adaptive Retirement Funds | Annual Report 2023
| 41 |
Portfolio of Investments (continued)
Columbia Adaptive Retirement 2060 Fund, March 31, 2023
Fair value measurements (continued)
pricing an investment. An investment’s level within the fair value hierarchy is based on the lowest level of any input that is deemed significant to the asset’s or liability’s fair value measurement. The input levels are not necessarily an indication of the risk or liquidity associated with investments at that level. For example, certain U.S. government securities are generally high quality and liquid, however, they are reflected as Level 2 because the inputs used to determine fair value may not always be quoted prices in an active market.
Fair value inputs are summarized in the three broad levels listed below:
| ■ | Level 1 — Valuations based on quoted prices for investments in active markets that the Fund has the ability to access at the measurement date. Valuation adjustments are not applied to Level 1 investments. |
| ■ | Level 2 — Valuations based on other significant observable inputs (including quoted prices for similar securities, interest rates, prepayment speeds, credit risks, etc.). |
| ■ | Level 3 — Valuations based on significant unobservable inputs (including the Fund’s own assumptions and judgment in determining the fair value of investments). |
Inputs that are used in determining fair value of an investment may include price information, credit data, volatility statistics, and other factors. These inputs can be either observable or unobservable. The availability of observable inputs can vary between investments, and is affected by various factors such as the type of investment, and the volume and level of activity for that investment or similar investments in the marketplace. The inputs will be considered by the Investment Manager, along with any other relevant factors in the calculation of an investment’s fair value. The Fund uses prices and inputs that are current as of the measurement date, which may include periods of market dislocations. During these periods, the availability of prices and inputs may be reduced for many investments. This condition could cause an investment to be reclassified between the various levels within the hierarchy.
Certain investments that have been measured at fair value using the net asset value (NAV) per share (or its equivalent) are not categorized in the fair value hierarchy. The fair value amounts presented in the table are intended to reconcile the fair value hierarchy to the amounts presented in the Portfolio of Investments. The Columbia Solutions Portfolios serve as investment vehicles for the Columbia Adaptive Retirement Funds and each pursues consistent total returns by seeking to allocate risks across multiple asset classes. Investments in the Columbia Solutions Portfolios may be redeemed on a daily basis without restriction.
Investments falling into the Level 3 category are primarily supported by quoted prices from brokers and dealers participating in the market for those investments. However, these may be classified as Level 3 investments due to lack of market transparency and corroboration to support these quoted prices. Additionally, valuation models may be used as the pricing source for any remaining investments classified as Level 3. These models may rely on one or more significant unobservable inputs and/or significant assumptions by the Investment Manager. Inputs used in valuations may include, but are not limited to, financial statement analysis, capital account balances, discount rates and estimated cash flows, and comparable company data.
The Fund’s Board of Trustees (the Board) has designated the Investment Manager, through its Valuation Committee (the Committee), as valuation designee, responsible for determining the fair value of the assets of the Fund for which market quotations are not readily available using valuation procedures approved by the Board. The Committee consists of voting and non-voting members from various groups within the Investment Manager’s organization, including operations and accounting, trading and investments, compliance, risk management and legal.
The Committee meets at least monthly to review and approve valuation matters, which may include a description of specific valuation determinations, data regarding pricing information received from approved pricing vendors and brokers and the results of Board-approved valuation policies and procedures (the Policies). The Policies address, among other things, instances when market quotations are or are not readily available, including recommendations of third party pricing vendors and a determination of appropriate pricing methodologies; events that require specific valuation determinations and assessment of fair value techniques; securities with a potential for stale pricing, including those that are illiquid, restricted, or in default; and the effectiveness of third party pricing vendors, including periodic reviews of vendors. The Committee meets more frequently, as needed, to discuss additional valuation matters, which may include the need to review back-testing results, review time-sensitive information or approve related valuation actions. Representatives of Columbia Management Investment Advisers, LLC report to the Board at each of its regularly scheduled meetings to discuss valuation matters and actions during the period, similar to those described earlier.
The following table is a summary of the inputs used to value the Fund’s investments at March 31, 2023:
| | Level 1 ($) | Level 2 ($) | Level 3 ($) | Assets at NAV ($) | Total ($) |
| Investments in Securities | | | | | |
| Alternative Strategies Funds | 78,500 | — | — | — | 78,500 |
| Exchange-Traded Equity Funds | 79,381 | — | — | — | 79,381 |
| Exchange-Traded Fixed Income Funds | 154,695 | — | — | — | 154,695 |
| Multi-Asset/Tactical Strategies Funds | — | — | — | 1,577,433 | 1,577,433 |
| Money Market Funds | 96,757 | — | — | — | 96,757 |
| Total Investments in Securities | 409,333 | — | — | 1,577,433 | 1,986,766 |
See the Portfolio of Investments for all investment classifications not indicated in the table.
The accompanying Notes to Financial Statements are an integral part of this statement.
| 42 | Columbia Adaptive Retirement Funds | Annual Report 2023 |
Statement of Assets and Liabilities
March 31, 2023
| | Columbia
Adaptive
Retirement
2020 Fund | Columbia
Adaptive
Retirement
2025 Fund | Columbia
Adaptive
Retirement
2030 Fund |
| Assets | | | |
| Investments in securities, at value | | | |
| Unaffiliated issuers (cost $168,207, $129,742, $296,953, respectively) | $160,231 | $123,216 | $278,341 |
| Affiliated issuers (cost $1,304,644, $1,017,591, $2,379,060, respectively) | 1,193,331 | 918,838 | 2,089,775 |
| Receivable for: | | | |
| Investments sold | 4,525 | 3,465 | 10,392 |
| Dividends | 279 | 222 | 434 |
| Expense reimbursement due from Investment Manager | 260 | 280 | 259 |
| Prepaid expenses | 925 | 923 | 937 |
| Trustees’ deferred compensation plan | 18,174 | 15,090 | 18,077 |
| Total assets | 1,377,725 | 1,062,034 | 2,398,215 |
| Liabilities | | | |
| Payable for: | | | |
| Investments purchased | 4,821 | 3,405 | 2,997 |
| Management services fees | 16 | 12 | 29 |
| Transfer agent fees | 37 | 21 | 178 |
| Compensation of board members | 12,349 | 12,343 | 12,356 |
| Accounting services fees | 5,610 | 5,610 | 5,610 |
| Legal fees | 2,874 | 2,872 | 2,877 |
| Other expenses | 13 | 22 | 63 |
| Trustees’ deferred compensation plan | 18,174 | 15,090 | 18,077 |
| Total liabilities | 43,894 | 39,375 | 42,187 |
| Net assets applicable to outstanding capital stock | $1,333,831 | $1,022,659 | $2,356,028 |
| Represented by | | | |
| Paid in capital | 1,492,077 | 1,144,007 | 2,723,463 |
| Total distributable earnings (loss) | (158,246) | (121,348) | (367,435) |
| Total - representing net assets applicable to outstanding capital stock | $1,333,831 | $1,022,659 | $2,356,028 |
| Advisor Class | | | |
| Net assets | $415,354 | $527,818 | $1,500,837 |
| Shares outstanding | 65,415 | 72,665 | 176,180 |
| Net asset value per share | $6.35 | $7.26 | $8.52 |
| Institutional 3 Class | | | |
| Net assets | $918,477 | $494,841 | $855,191 |
| Shares outstanding | 144,620 | 68,094 | 100,204 |
| Net asset value per share | $6.35 | $7.27 | $8.53 |
The accompanying Notes to Financial Statements are an integral part of this statement.
Columbia Adaptive Retirement Funds | Annual Report 2023
| 43 |
Statement of Assets and Liabilities (continued)
March 31, 2023
| | Columbia
Adaptive
Retirement
2035 Fund | Columbia
Adaptive
Retirement
2040 Fund | Columbia
Adaptive
Retirement
2045 Fund |
| Assets | | | |
| Investments in securities, at value | | | |
| Unaffiliated issuers (cost $253,379, $192,875, $169,699, respectively) | $242,974 | $181,258 | $160,034 |
| Affiliated issuers (cost $1,963,366, $1,555,072, $1,394,304, respectively) | 1,795,300 | 1,347,168 | 1,196,930 |
| Receivable for: | | | |
| Investments sold | 10,069 | 8,755 | 8,115 |
| Dividends | 374 | 300 | 270 |
| Expense reimbursement due from Investment Manager | 289 | 262 | 288 |
| Prepaid expenses | 927 | 927 | 924 |
| Trustees’ deferred compensation plan | 15,045 | 18,032 | 15,041 |
| Total assets | 2,064,978 | 1,556,702 | 1,381,602 |
| Liabilities | | | |
| Payable for: | | | |
| Investments purchased | 8,316 | 6,474 | 5,925 |
| Management services fees | 25 | 19 | 16 |
| Transfer agent fees | 68 | 44 | 28 |
| Compensation of board members | 12,347 | 12,346 | 12,345 |
| Accounting services fees | 5,610 | 5,610 | 5,610 |
| Legal fees | 2,876 | 2,874 | 2,873 |
| Other expenses | 271 | 260 | 214 |
| Trustees’ deferred compensation plan | 15,045 | 18,032 | 15,041 |
| Total liabilities | 44,558 | 45,659 | 42,052 |
| Net assets applicable to outstanding capital stock | $2,020,420 | $1,511,043 | $1,339,550 |
| Represented by | | | |
| Paid in capital | 2,246,563 | 1,792,421 | 1,620,286 |
| Total distributable earnings (loss) | (226,143) | (281,378) | (280,736) |
| Total - representing net assets applicable to outstanding capital stock | $2,020,420 | $1,511,043 | $1,339,550 |
| Advisor Class | | | |
| Net assets | $752,976 | $554,137 | $424,879 |
| Shares outstanding | 84,055 | 66,504 | 52,839 |
| Net asset value per share | $8.96 | $8.33 | $8.04 |
| Institutional 3 Class | | | |
| Net assets | $1,267,444 | $956,906 | $914,671 |
| Shares outstanding | 141,432 | 114,712 | 113,735 |
| Net asset value per share | $8.96 | $8.34 | $8.04 |
The accompanying Notes to Financial Statements are an integral part of this statement.
| 44 | Columbia Adaptive Retirement Funds | Annual Report 2023 |
Statement of Assets and Liabilities (continued)
March 31, 2023
| | Columbia
Adaptive
Retirement
2050 Fund | Columbia
Adaptive
Retirement
2055 Fund | Columbia
Adaptive
Retirement
2060 Fund |
| Assets | | | |
| Investments in securities, at value | | | |
| Unaffiliated issuers (cost $199,190, $199,495, $250,071, respectively) | $186,888 | $186,761 | $234,076 |
| Affiliated issuers (cost $1,640,225, $1,659,196, $2,069,544, respectively) | 1,393,104 | 1,388,690 | 1,752,690 |
| Receivable for: | | | |
| Investments sold | 9,073 | 8,830 | 11,243 |
| Dividends | 303 | 297 | 367 |
| Expense reimbursement due from Investment Manager | 263 | 286 | 263 |
| Prepaid expenses | 926 | 925 | 925 |
| Trustees’ deferred compensation plan | 18,030 | 15,041 | 18,030 |
| Total assets | 1,608,587 | 1,600,830 | 2,017,594 |
| Liabilities | | | |
| Payable for: | | | |
| Investments purchased | 6,122 | 5,829 | 9,187 |
| Management services fees | 19 | 19 | 24 |
| Transfer agent fees | 7 | 21 | 85 |
| Compensation of board members | 12,346 | 12,347 | 12,348 |
| Accounting services fees | 5,610 | 5,610 | 5,610 |
| Legal fees | 2,874 | 2,874 | 2,876 |
| Other expenses | 91 | 65 | 263 |
| Trustees’ deferred compensation plan | 18,030 | 15,041 | 18,030 |
| Total liabilities | 45,099 | 41,806 | 48,423 |
| Net assets applicable to outstanding capital stock | $1,563,488 | $1,559,024 | $1,969,171 |
| Represented by | | | |
| Paid in capital | 1,928,114 | 1,952,121 | 2,442,558 |
| Total distributable earnings (loss) | (364,626) | (393,097) | (473,387) |
| Total - representing net assets applicable to outstanding capital stock | $1,563,488 | $1,559,024 | $1,969,171 |
| Advisor Class | | | |
| Net assets | $232,306 | $339,250 | $987,377 |
| Shares outstanding | 29,173 | 42,133 | 118,009 |
| Net asset value per share | $7.96 | $8.05 | $8.37 |
| Institutional 3 Class | | | |
| Net assets | $1,331,182 | $1,219,774 | $981,794 |
| Shares outstanding | 167,242 | 151,450 | 117,288 |
| Net asset value per share | $7.96 | $8.05 | $8.37 |
The accompanying Notes to Financial Statements are an integral part of this statement.
Columbia Adaptive Retirement Funds | Annual Report 2023
| 45 |
Statement of Operations
Year Ended March 31, 2023
| | Columbia
Adaptive
Retirement
2020 Fund | Columbia
Adaptive
Retirement
2025 Fund | Columbia
Adaptive
Retirement
2030 Fund |
| Net investment income | | | |
| Income: | | | |
| Dividends — unaffiliated issuers | $5,530 | $4,081 | $9,205 |
| Dividends — affiliated issuers | 56,765 | 47,099 | 115,261 |
| Total income | 62,295 | 51,180 | 124,466 |
| Expenses: | | | |
| Management services fees | 6,327 | 4,699 | 10,663 |
| Transfer agent fees | | | |
| Advisor Class | 328 | 253 | 2,250 |
| Institutional 3 Class | 95 | 57 | 99 |
| Compensation of board members | 14,431 | 14,426 | 14,445 |
| Custodian fees | 1,459 | 1,405 | 1,525 |
| Printing and postage fees | 7,585 | 7,585 | 7,721 |
| Registration fees | 39,333 | 39,393 | 39,393 |
| Accounting services fees | 12,420 | 11,220 | 11,220 |
| Legal fees | 13,171 | 13,166 | 13,184 |
| Other | 6,677 | 6,673 | 6,690 |
| Total expenses | 101,826 | 98,877 | 107,190 |
| Fees waived or expenses reimbursed by Investment Manager and its affiliates | (96,145) | (94,649) | (95,910) |
| Total net expenses | 5,681 | 4,228 | 11,280 |
| Net investment income | 56,614 | 46,952 | 113,186 |
| Realized and unrealized gain (loss) — net | | | |
| Net realized gain (loss) on: | | | |
| Investments — unaffiliated issuers | (3,708) | (2,888) | (8,676) |
| Investments — affiliated issuers | (9,042) | (3,473) | (25,760) |
| Net realized loss | (12,750) | (6,361) | (34,436) |
| Net change in unrealized appreciation (depreciation) on: | | | |
| Investments — unaffiliated issuers | (13,149) | (9,493) | (19,135) |
| Investments — affiliated issuers | (96,691) | (82,993) | (190,493) |
| Net change in unrealized appreciation (depreciation) | (109,840) | (92,486) | (209,628) |
| Net realized and unrealized loss | (122,590) | (98,847) | (244,064) |
| Net decrease in net assets resulting from operations | $(65,976) | $(51,895) | $(130,878) |
The accompanying Notes to Financial Statements are an integral part of this statement.
| 46 | Columbia Adaptive Retirement Funds | Annual Report 2023 |
Statement of Operations (continued)
Year Ended March 31, 2023
| | Columbia
Adaptive
Retirement
2035 Fund | Columbia
Adaptive
Retirement
2040 Fund | Columbia
Adaptive
Retirement
2045 Fund |
| Net investment income | | | |
| Income: | | | |
| Dividends — unaffiliated issuers | $5,877 | $5,787 | $4,979 |
| Dividends — affiliated issuers | 77,805 | 87,887 | 83,500 |
| Total income | 83,682 | 93,674 | 88,479 |
| Expenses: | | | |
| Management services fees | 7,205 | 6,717 | 5,809 |
| Transfer agent fees | | | |
| Advisor Class | 832 | 538 | 328 |
| Institutional 3 Class | 114 | 104 | 98 |
| Compensation of board members | 14,433 | 14,433 | 14,430 |
| Custodian fees | 1,591 | 1,538 | 1,575 |
| Printing and postage fees | 7,867 | 7,867 | 7,796 |
| Registration fees | 39,393 | 39,333 | 39,393 |
| Accounting services fees | 12,420 | 11,220 | 12,420 |
| Legal fees | 13,174 | 13,172 | 13,169 |
| Other | 6,679 | 6,680 | 6,677 |
| Total expenses | 103,708 | 101,602 | 101,695 |
| Fees waived or expenses reimbursed by Investment Manager and its affiliates | (96,788) | (95,380) | (96,452) |
| Total net expenses | 6,920 | 6,222 | 5,243 |
| Net investment income | 76,762 | 87,452 | 83,236 |
| Realized and unrealized gain (loss) — net | | | |
| Net realized gain (loss) on: | | | |
| Investments — unaffiliated issuers | (6,173) | (5,515) | (4,673) |
| Investments — affiliated issuers | (19,660) | (13,728) | (10,849) |
| Net realized loss | (25,833) | (19,243) | (15,522) |
| Net change in unrealized appreciation (depreciation) on: | | | |
| Investments — unaffiliated issuers | (11,904) | (12,009) | (10,455) |
| Investments — affiliated issuers | (116,144) | (158,066) | (152,767) |
| Net change in unrealized appreciation (depreciation) | (128,048) | (170,075) | (163,222) |
| Net realized and unrealized loss | (153,881) | (189,318) | (178,744) |
| Net decrease in net assets resulting from operations | $(77,119) | $(101,866) | $(95,508) |
The accompanying Notes to Financial Statements are an integral part of this statement.
Columbia Adaptive Retirement Funds | Annual Report 2023
| 47 |
Statement of Operations (continued)
Year Ended March 31, 2023
| | Columbia
Adaptive
Retirement
2050 Fund | Columbia
Adaptive
Retirement
2055 Fund | Columbia
Adaptive
Retirement
2060 Fund |
| Net investment income | | | |
| Income: | | | |
| Dividends — unaffiliated issuers | $5,893 | $6,119 | $7,282 |
| Dividends — affiliated issuers | 103,680 | 108,700 | 133,596 |
| Total income | 109,573 | 114,819 | 140,878 |
| Expenses: | | | |
| Management services fees | 6,835 | 7,023 | 8,482 |
| Transfer agent fees | | | |
| Advisor Class | 71 | 257 | 1,081 |
| Institutional 3 Class | 116 | 112 | 88 |
| Compensation of board members | 14,433 | 14,434 | 14,438 |
| Custodian fees | 1,542 | 1,511 | 1,498 |
| Printing and postage fees | 7,586 | 7,585 | 7,867 |
| Registration fees | 39,393 | 39,333 | 39,335 |
| Accounting services fees | 12,420 | 12,420 | 11,220 |
| Legal fees | 13,172 | 13,173 | 13,178 |
| Other | 6,680 | 6,680 | 6,682 |
| Total expenses | 102,248 | 102,528 | 103,869 |
| Fees waived or expenses reimbursed by Investment Manager and its affiliates | (96,389) | (96,323) | (95,599) |
| Total net expenses | 5,859 | 6,205 | 8,270 |
| Net investment income | 103,714 | 108,614 | 132,608 |
| Realized and unrealized gain (loss) — net | | | |
| Net realized gain (loss) on: | | | |
| Investments — unaffiliated issuers | (5,886) | (6,685) | (7,246) |
| Investments — affiliated issuers | (13,661) | (23,377) | (10,309) |
| Net realized loss | (19,547) | (30,062) | (17,555) |
| Net change in unrealized appreciation (depreciation) on: | | | |
| Investments — unaffiliated issuers | (12,104) | (11,815) | (14,857) |
| Investments — affiliated issuers | (194,988) | (197,282) | (255,635) |
| Net change in unrealized appreciation (depreciation) | (207,092) | (209,097) | (270,492) |
| Net realized and unrealized loss | (226,639) | (239,159) | (288,047) |
| Net decrease in net assets resulting from operations | $(122,925) | $(130,545) | $(155,439) |
The accompanying Notes to Financial Statements are an integral part of this statement.
| 48 | Columbia Adaptive Retirement Funds | Annual Report 2023 |
Statement of Changes in Net Assets
| | Columbia Adaptive Retirement
2020 Fund | Columbia Adaptive Retirement
2025 Fund |
| | Year Ended
March 31, 2023 | Year Ended
March 31, 2022 | Year Ended
March 31, 2023 | Year Ended
March 31, 2022 |
| Operations | | | | |
| Net investment income | $56,614 | $38,700 | $46,952 | $27,415 |
| Net realized gain (loss) | (12,750) | 132,151 | (6,361) | 136,032 |
| Net change in unrealized appreciation (depreciation) | (109,840) | (139,117) | (92,486) | (129,173) |
| Net increase (decrease) in net assets resulting from operations | (65,976) | 31,734 | (51,895) | 34,274 |
| Distributions to shareholders | | | | |
| Net investment income and net realized gains | | | | |
| Advisor Class | (40,213) | (246,760) | (60,341) | (179,043) |
| Institutional 3 Class | (87,364) | (457,996) | (56,400) | (176,417) |
| Total distributions to shareholders | (127,577) | (704,756) | (116,741) | (355,460) |
| Increase in net assets from capital stock activity | 70,430 | 555,351 | 103,917 | 88,348 |
| Total decrease in net assets | (123,123) | (117,671) | (64,719) | (232,838) |
| Net assets at beginning of year | 1,456,954 | 1,574,625 | 1,087,378 | 1,320,216 |
| Net assets at end of year | $1,333,831 | $1,456,954 | $1,022,659 | $1,087,378 |
| | Columbia Adaptive Retirement
2020 Fund | Columbia Adaptive Retirement
2025 Fund |
| | Year Ended | Year Ended | Year Ended | Year Ended |
| | March 31, 2023 | March 31, 2022 | March 31, 2023 | March 31, 2022 |
| | Shares | Dollars ($) | Shares | Dollars ($) | Shares | Dollars ($) | Shares | Dollars ($) |
| Capital stock activity |
| Advisor Class | | | | | | | | |
| Subscriptions | 308 | 2,087 | 2,467 | 27,634 | 657 | 5,166 | 315 | 3,272 |
| Distributions reinvested | 6,434 | 40,213 | 32,089 | 246,760 | 8,439 | 60,341 | 19,806 | 179,043 |
| Redemptions | (31) | (210) | (53,492) | (461,631) | (19) | (148) | (21,838) | (194,585) |
| Net increase (decrease) | 6,711 | 42,090 | (18,936) | (187,237) | 9,077 | 65,359 | (1,717) | (12,270) |
| Institutional 3 Class | | | | | | | | |
| Subscriptions | 10,405 | 70,798 | 72,067 | 789,264 | 1,145 | 8,795 | 10,845 | 121,478 |
| Distributions reinvested | 13,978 | 87,363 | 59,557 | 457,996 | 7,888 | 56,400 | 19,515 | 176,417 |
| Redemptions | (19,056) | (129,821) | (58,858) | (504,672) | (3,290) | (26,637) | (22,069) | (197,277) |
| Net increase | 5,327 | 28,340 | 72,766 | 742,588 | 5,743 | 38,558 | 8,291 | 100,618 |
| Total net increase | 12,038 | 70,430 | 53,830 | 555,351 | 14,820 | 103,917 | 6,574 | 88,348 |
The accompanying Notes to Financial Statements are an integral part of this statement.
Columbia Adaptive Retirement Funds | Annual Report 2023
| 49 |
Statement of Changes in Net Assets (continued)
| | Columbia Adaptive Retirement
2030 Fund | Columbia Adaptive Retirement
2035 Fund |
| | Year Ended
March 31, 2023 | Year Ended
March 31, 2022 | Year Ended
March 31, 2023 | Year Ended
March 31, 2022 |
| Operations | | | | |
| Net investment income | $113,186 | $55,400 | $76,762 | $36,024 |
| Net realized gain (loss) | (34,436) | 315,788 | (25,833) | 254,868 |
| Net change in unrealized appreciation (depreciation) | (209,628) | (287,482) | (128,048) | (214,696) |
| Net increase (decrease) in net assets resulting from operations | (130,878) | 83,706 | (77,119) | 76,196 |
| Distributions to shareholders | | | | |
| Net investment income and net realized gains | | | | |
| Advisor Class | (172,798) | (181,978) | (78,288) | (115,438) |
| Institutional 3 Class | (95,731) | (113,059) | (131,953) | (103,539) |
| Total distributions to shareholders | (268,529) | (295,037) | (210,241) | (218,977) |
| Increase (decrease) in net assets from capital stock activity | 290,533 | 67,566 | 833,130 | (103,813) |
| Total increase (decrease) in net assets | (108,874) | (143,765) | 545,770 | (246,594) |
| Net assets at beginning of year | 2,464,902 | 2,608,667 | 1,474,650 | 1,721,244 |
| Net assets at end of year | $2,356,028 | $2,464,902 | $2,020,420 | $1,474,650 |
| | Columbia Adaptive Retirement
2030 Fund | Columbia Adaptive Retirement
2035 Fund |
| | Year Ended | Year Ended | Year Ended | Year Ended |
| | March 31, 2023 | March 31, 2022 | March 31, 2023 | March 31, 2022 |
| | Shares | Dollars ($) | Shares | Dollars ($) | Shares | Dollars ($) | Shares | Dollars ($) |
| Capital stock activity |
| Advisor Class | | | | | | | | |
| Subscriptions | — | — | — | — | 606 | 5,841 | 311 | 3,643 |
| Distributions reinvested | 20,620 | 172,797 | 16,976 | 181,978 | 8,896 | 78,287 | 10,261 | 115,438 |
| Redemptions | — | — | (46,372) | (501,000) | (22) | (211) | (32,196) | (363,625) |
| Net increase (decrease) | 20,620 | 172,797 | (29,396) | (319,022) | 9,480 | 83,917 | (21,624) | (244,544) |
| Institutional 3 Class | | | | | | | | |
| Subscriptions | 13,444 | 125,592 | 74,057 | 830,072 | 68,514 | 674,334 | 40,484 | 477,841 |
| Distributions reinvested | 11,410 | 95,731 | 10,526 | 113,058 | 14,995 | 131,953 | 9,204 | 103,539 |
| Redemptions | (10,537) | (103,587) | (51,106) | (556,542) | (5,744) | (57,074) | (38,754) | (440,649) |
| Net increase | 14,317 | 117,736 | 33,477 | 386,588 | 77,765 | 749,213 | 10,934 | 140,731 |
| Total net increase (decrease) | 34,937 | 290,533 | 4,081 | 67,566 | 87,245 | 833,130 | (10,690) | (103,813) |
The accompanying Notes to Financial Statements are an integral part of this statement.
| 50 | Columbia Adaptive Retirement Funds | Annual Report 2023 |
Statement of Changes in Net Assets (continued)
| | Columbia Adaptive Retirement
2040 Fund | Columbia Adaptive Retirement
2045 Fund |
| | Year Ended
March 31, 2023 | Year Ended
March 31, 2022 | Year Ended
March 31, 2023 | Year Ended
March 31, 2022 |
| Operations | | | | |
| Net investment income | $87,452 | $36,640 | $83,236 | $34,183 |
| Net realized gain (loss) | (19,243) | 289,863 | (15,522) | 306,758 |
| Net change in unrealized appreciation (depreciation) | (170,075) | (237,079) | (163,222) | (236,366) |
| Net increase (decrease) in net assets resulting from operations | (101,866) | 89,424 | (95,508) | 104,575 |
| Distributions to shareholders | | | | |
| Net investment income and net realized gains | | | | |
| Advisor Class | (95,131) | (100,364) | (89,349) | (91,037) |
| Institutional 3 Class | (159,837) | (141,814) | (182,434) | (155,103) |
| Total distributions to shareholders | (254,968) | (242,178) | (271,783) | (246,140) |
| Increase (decrease) in net assets from capital stock activity | 358,146 | 78,972 | 419,661 | (1,351) |
| Total increase (decrease) in net assets | 1,312 | (73,782) | 52,370 | (142,916) |
| Net assets at beginning of year | 1,509,731 | 1,583,513 | 1,287,180 | 1,430,096 |
| Net assets at end of year | $1,511,043 | $1,509,731 | $1,339,550 | $1,287,180 |
| | Columbia Adaptive Retirement
2040 Fund | Columbia Adaptive Retirement
2045 Fund |
| | Year Ended | Year Ended | Year Ended | Year Ended |
| | March 31, 2023 | March 31, 2022 | March 31, 2023 | March 31, 2022 |
| | Shares | Dollars ($) | Shares | Dollars ($) | Shares | Dollars ($) | Shares | Dollars ($) |
| Capital stock activity |
| Advisor Class | | | | | | | | |
| Subscriptions | 488 | 4,629 | 384 | 4,695 | 848 | 8,260 | 368 | 4,490 |
| Distributions reinvested | 11,630 | 95,131 | 8,743 | 100,364 | 11,325 | 89,348 | 7,735 | 91,037 |
| Redemptions | (16) | (150) | (33,521) | (387,698) | (7) | (73) | (33,718) | (399,298) |
| Net increase (decrease) | 12,102 | 99,610 | (24,394) | (282,639) | 12,166 | 97,535 | (25,615) | (303,771) |
| Institutional 3 Class | | | | | | | | |
| Subscriptions | 10,967 | 103,966 | 53,292 | 643,089 | 16,582 | 155,383 | 57,569 | 711,804 |
| Distributions reinvested | 19,516 | 159,837 | 12,342 | 141,814 | 23,122 | 182,434 | 13,178 | 155,103 |
| Redemptions | (526) | (5,267) | (36,672) | (423,292) | (1,553) | (15,691) | (47,766) | (564,487) |
| Net increase | 29,957 | 258,536 | 28,962 | 361,611 | 38,151 | 322,126 | 22,981 | 302,420 |
| Total net increase (decrease) | 42,059 | 358,146 | 4,568 | 78,972 | 50,317 | 419,661 | (2,634) | (1,351) |
The accompanying Notes to Financial Statements are an integral part of this statement.
Columbia Adaptive Retirement Funds | Annual Report 2023
| 51 |
Statement of Changes in Net Assets (continued)
| | Columbia Adaptive Retirement
2050 Fund | Columbia Adaptive Retirement
2055 Fund |
| | Year Ended
March 31, 2023 | Year Ended
March 31, 2022 | Year Ended
March 31, 2023 | Year Ended
March 31, 2022 |
| Operations | | | | |
| Net investment income | $103,714 | $33,851 | $108,614 | $36,086 |
| Net realized gain (loss) | (19,547) | 327,544 | (30,062) | 351,612 |
| Net change in unrealized appreciation (depreciation) | (207,092) | (258,926) | (209,097) | (277,797) |
| Net increase (decrease) in net assets resulting from operations | (122,925) | 102,469 | (130,545) | 109,901 |
| Distributions to shareholders | | | | |
| Net investment income and net realized gains | | | | |
| Advisor Class | (49,003) | (70,134) | (72,494) | (79,302) |
| Institutional 3 Class | (272,262) | (220,725) | (257,404) | (201,513) |
| Total distributions to shareholders | (321,265) | (290,859) | (329,898) | (280,815) |
| Increase in net assets from capital stock activity | 494,110 | 404,338 | 390,961 | 392,350 |
| Total increase (decrease) in net assets | 49,920 | 215,948 | (69,482) | 221,436 |
| Net assets at beginning of year | 1,513,568 | 1,297,620 | 1,628,506 | 1,407,070 |
| Net assets at end of year | $1,563,488 | $1,513,568 | $1,559,024 | $1,628,506 |
| | Columbia Adaptive Retirement
2050 Fund | Columbia Adaptive Retirement
2055 Fund |
| | Year Ended | Year Ended | Year Ended | Year Ended |
| | March 31, 2023 | March 31, 2022 | March 31, 2023 | March 31, 2022 |
| | Shares | Dollars ($) | Shares | Dollars ($) | Shares | Dollars ($) | Shares | Dollars ($) |
| Capital stock activity |
| Advisor Class | | | | | | | | |
| Subscriptions | 830 | 7,828 | 515 | 6,513 | 558 | 5,324 | 279 | 3,528 |
| Distributions reinvested | 6,274 | 49,003 | 5,949 | 70,134 | 9,188 | 72,494 | 6,614 | 79,302 |
| Redemptions | (32) | (306) | (37,293) | (452,800) | (15) | (149) | (36,841) | (451,085) |
| Net increase (decrease) | 7,072 | 56,525 | (30,829) | (376,153) | 9,731 | 77,669 | (29,948) | (368,255) |
| Institutional 3 Class | | | | | | | | |
| Subscriptions | 22,367 | 213,278 | 90,077 | 1,137,735 | 17,057 | 165,702 | 86,892 | 1,096,724 |
| Distributions reinvested | 34,906 | 272,262 | 18,721 | 220,725 | 32,624 | 257,404 | 16,807 | 201,512 |
| Redemptions | (4,722) | (47,955) | (46,808) | (577,969) | (10,683) | (109,814) | (43,722) | (537,631) |
| Net increase | 52,551 | 437,585 | 61,990 | 780,491 | 38,998 | 313,292 | 59,977 | 760,605 |
| Total net increase | 59,623 | 494,110 | 31,161 | 404,338 | 48,729 | 390,961 | 30,029 | 392,350 |
The accompanying Notes to Financial Statements are an integral part of this statement.
| 52 | Columbia Adaptive Retirement Funds | Annual Report 2023 |
Statement of Changes in Net Assets (continued)
| | Columbia Adaptive Retirement
2060 Fund |
| | Year Ended
March 31, 2023 | Year Ended
March 31, 2022 |
| Operations | | |
| Net investment income | $132,608 | $37,449 |
| Net realized gain (loss) | (17,555) | 342,067 |
| Net change in unrealized appreciation (depreciation) | (270,492) | (267,411) |
| Net increase (decrease) in net assets resulting from operations | (155,439) | 112,105 |
| Distributions to shareholders | | |
| Net investment income and net realized gains | | |
| Advisor Class | (194,159) | (146,687) |
| Institutional 3 Class | (186,356) | (138,628) |
| Total distributions to shareholders | (380,515) | (285,315) |
| Increase in net assets from capital stock activity | 619,770 | 486,252 |
| Total increase in net assets | 83,816 | 313,042 |
| Net assets at beginning of year | 1,885,355 | 1,572,313 |
| Net assets at end of year | $1,969,171 | $1,885,355 |
| | Columbia Adaptive Retirement
2060 Fund |
| | Year Ended | Year Ended |
| | March 31, 2023 | March 31, 2022 |
| | Shares | Dollars ($) | Shares | Dollars ($) |
| Capital stock activity |
| Advisor Class | | | | |
| Subscriptions | 3,036 | 26,058 | 32,763 | 414,013 |
| Distributions reinvested | 23,678 | 194,159 | 11,975 | 146,687 |
| Redemptions | (29) | (279) | (28,630) | (344,127) |
| Net increase | 26,685 | 219,938 | 16,108 | 216,573 |
| Institutional 3 Class | | | | |
| Subscriptions | 27,117 | 266,485 | 44,852 | 571,184 |
| Distributions reinvested | 22,726 | 186,356 | 11,316 | 138,627 |
| Redemptions | (5,424) | (53,009) | (36,098) | (440,132) |
| Net increase | 44,419 | 399,832 | 20,070 | 269,679 |
| Total net increase | 71,104 | 619,770 | 36,178 | 486,252 |
The accompanying Notes to Financial Statements are an integral part of this statement.
Columbia Adaptive Retirement Funds | Annual Report 2023
| 53 |
Financial Highlights
Columbia Adaptive Retirement 2020 Fund
The following tables are intended to help you understand the Funds’ financial performance. Certain information reflects financial results for a single share of a class held for the periods shown. Per share net investment income (loss) amounts are calculated based on average shares outstanding during the period. Total return assumes reinvestment of all dividends and distributions, if any. Total return does not reflect payment of sales charges, if any. Total return and portfolio turnover are not annualized for periods of less than one year. The ratios of expenses and net investment income are annualized for periods of less than one year. The portfolio turnover rate is calculated without regard to purchase and sales transactions of short-term instruments and certain derivatives, if any. If such transactions were included, a fund’s portfolio turnover rate may be higher.
| | Net asset value,
beginning of
period | Net
investment
income | Net
realized
and
unrealized
gain (loss) | Total from
investment
operations | Distributions
from net
investment
income | Distributions
from net
realized
gains | Total
distributions to
shareholders |
| Advisor Class |
| Year Ended 3/31/2023 | $7.36 | 0.29 | (0.62) | (0.33) | (0.27) | (0.41) | (0.68) |
| Year Ended 3/31/2022 | $10.92 | 0.20 | 0.07(c) | 0.27 | (0.48) | (3.35) | (3.83) |
| Year Ended 3/31/2021 | $10.12 | 0.11 | 1.02 | 1.13 | (0.26) | (0.07) | (0.33) |
| Year Ended 3/31/2020 | $10.17 | 0.21 | 0.19 | 0.40 | (0.41) | (0.04) | (0.45) |
| Year Ended 3/31/2019 | $10.04 | 0.33 | 0.18 | 0.51 | (0.35) | (0.03) | (0.38) |
| Institutional 3 Class |
| Year Ended 3/31/2023 | $7.36 | 0.28 | (0.60) | (0.32) | (0.28) | (0.41) | (0.69) |
| Year Ended 3/31/2022 | $10.92 | 0.20 | 0.08(c) | 0.28 | (0.49) | (3.35) | (3.84) |
| Year Ended 3/31/2021 | $10.12 | 0.11 | 1.02 | 1.13 | (0.26) | (0.07) | (0.33) |
| Year Ended 3/31/2020 | $10.17 | 0.21 | 0.19 | 0.40 | (0.41) | (0.04) | (0.45) |
| Year Ended 3/31/2019 | $10.04 | 0.33 | 0.18 | 0.51 | (0.35) | (0.03) | (0.38) |
| Notes to Financial Highlights |
| (a) | In addition to the fees and expenses that the Fund bears directly, the Fund indirectly bears a pro rata share of the fees and expenses of any other funds in which it invests. Such indirect expenses are not included in the Fund’s reported expense ratios. |
| (b) | Total net expenses include the impact of certain fee waivers/expense reimbursements made by the Investment Manager and certain of its affiliates, if applicable. |
| (c) | Calculation of the net gain (loss) per share (both realized and unrealized) does not correlate to the aggregate realized and unrealized gain (loss) presented in the Statement of Operations due to the timing of subscriptions and redemptions of Fund shares in relation to fluctuations in the market value of the portfolio. |
The accompanying Notes to Financial Statements are an integral part of this statement.
| 54 | Columbia Adaptive Retirement Funds | Annual Report 2023 |
Financial Highlights (continued)
Columbia Adaptive Retirement 2020 Fund
| | Net
asset
value,
end of
period | Total
return | Total gross
expense
ratio to
average
net assets(a) | Total net
expense
ratio to
average
net assets(a),(b) | Net investment
income
ratio to
average
net assets | Portfolio
turnover | Net
assets,
end of
period
(000’s) |
| Advisor Class |
| Year Ended 3/31/2023 | $6.35 | (4.30%) | 7.51% | 0.47% | 4.28% | 17% | $415 |
| Year Ended 3/31/2022 | $7.36 | 1.01% | 5.30% | 0.43% | 1.98% | 79% | $432 |
| Year Ended 3/31/2021 | $10.92 | 11.14% | 1.78% | 0.45% | 1.03% | 36% | $848 |
| Year Ended 3/31/2020 | $10.12 | 3.80% | 1.52% | 0.43% | 2.05% | 25% | $3,791 |
| Year Ended 3/31/2019 | $10.17 | 5.41% | 1.87% | 0.42% | 3.27% | 26% | $3,809 |
| Institutional 3 Class |
| Year Ended 3/31/2023 | $6.35 | (4.23%) | 7.41% | 0.39% | 4.08% | 17% | $918 |
| Year Ended 3/31/2022 | $7.36 | 1.04% | 5.32% | 0.39% | 2.00% | 79% | $1,025 |
| Year Ended 3/31/2021 | $10.92 | 11.14% | 1.73% | 0.44% | 1.02% | 36% | $727 |
| Year Ended 3/31/2020 | $10.12 | 3.80% | 1.52% | 0.42% | 2.05% | 25% | $3,791 |
| Year Ended 3/31/2019 | $10.17 | 5.41% | 1.87% | 0.42% | 3.27% | 26% | $3,809 |
The accompanying Notes to Financial Statements are an integral part of this statement.
Columbia Adaptive Retirement Funds | Annual Report 2023
| 55 |
Financial Highlights
Columbia Adaptive Retirement 2025 Fund
| | Net asset value,
beginning of
period | Net
investment
income | Net
realized
and
unrealized
gain (loss) | Total from
investment
operations | Distributions
from net
investment
income | Distributions
from net
realized
gains | Total
distributions to
shareholders |
| Advisor Class |
| Year Ended 3/31/2023 | $8.63 | 0.37 | (0.80) | (0.43) | (0.34) | (0.60) | (0.94) |
| Year Ended 3/31/2022 | $11.06 | 0.21 | 0.09 | 0.30 | (0.56) | (2.17) | (2.73) |
| Year Ended 3/31/2021 | $10.06 | 0.12 | 1.25 | 1.37 | (0.28) | (0.09) | (0.37) |
| Year Ended 3/31/2020 | $10.14 | 0.22 | 0.19 | 0.41 | (0.43) | (0.06) | (0.49) |
| Year Ended 3/31/2019(c) | $10.00 | 0.34 | 0.20 | 0.54 | (0.38) | (0.02) | (0.40) |
| Institutional 3 Class |
| Year Ended 3/31/2023 | $8.64 | 0.37 | (0.79) | (0.42) | (0.35) | (0.60) | (0.95) |
| Year Ended 3/31/2022 | $11.06 | 0.21 | 0.11 | 0.32 | (0.57) | (2.17) | (2.74) |
| Year Ended 3/31/2021 | $10.06 | 0.11 | 1.26 | 1.37 | (0.28) | (0.09) | (0.37) |
| Year Ended 3/31/2020 | $10.14 | 0.22 | 0.19 | 0.41 | (0.43) | (0.06) | (0.49) |
| Year Ended 3/31/2019(c) | $10.00 | 0.34 | 0.20 | 0.54 | (0.38) | (0.02) | (0.40) |
| Notes to Financial Highlights |
| (a) | In addition to the fees and expenses that the Fund bears directly, the Fund indirectly bears a pro rata share of the fees and expenses of any other funds in which it invests. Such indirect expenses are not included in the Fund’s reported expense ratios. |
| (b) | Total net expenses include the impact of certain fee waivers/expense reimbursements made by the Investment Manager and certain of its affiliates, if applicable. |
| (c) | The Fund commenced operations on April 4, 2018. Per share data and total return reflect activity from that date. |
The accompanying Notes to Financial Statements are an integral part of this statement.
| 56 | Columbia Adaptive Retirement Funds | Annual Report 2023 |
Financial Highlights (continued)
Columbia Adaptive Retirement 2025 Fund
| | Net
asset
value,
end of
period | Total
return | Total gross
expense
ratio to
average
net assets(a) | Total net
expense
ratio to
average
net assets(a),(b) | Net investment
income
ratio to
average
net assets | Portfolio
turnover | Net
assets,
end of
period
(000’s) |
| Advisor Class |
| Year Ended 3/31/2023 | $7.26 | (4.79%) | 9.76% | 0.44% | 4.62% | 12% | $528 |
| Year Ended 3/31/2022 | $8.63 | 1.63% | 7.09% | 0.43% | 1.90% | 48% | $549 |
| Year Ended 3/31/2021 | $11.06 | 13.63% | 3.10% | 0.45% | 1.09% | 40% | $722 |
| Year Ended 3/31/2020 | $10.06 | 3.89% | 2.78% | 0.42% | 2.13% | 29% | $1,761 |
| Year Ended 3/31/2019(c) | $10.14 | 5.71% | 3.75% | 0.42% | 3.50% | 28% | $1,775 |
| Institutional 3 Class |
| Year Ended 3/31/2023 | $7.27 | (4.73%) | 9.71% | 0.39% | 4.62% | 12% | $495 |
| Year Ended 3/31/2022 | $8.64 | 1.78% | 7.07% | 0.39% | 1.95% | 48% | $538 |
| Year Ended 3/31/2021 | $11.06 | 13.63% | 3.09% | 0.44% | 1.07% | 40% | $598 |
| Year Ended 3/31/2020 | $10.06 | 3.89% | 2.78% | 0.42% | 2.13% | 29% | $1,761 |
| Year Ended 3/31/2019(c) | $10.14 | 5.71% | 3.75% | 0.42% | 3.50% | 28% | $1,775 |
The accompanying Notes to Financial Statements are an integral part of this statement.
Columbia Adaptive Retirement Funds | Annual Report 2023
| 57 |
Financial Highlights
Columbia Adaptive Retirement 2030 Fund
| | Net asset value,
beginning of
period | Net
investment
income | Net
realized
and
unrealized
gain (loss) | Total from
investment
operations | Distributions
from net
investment
income | Distributions
from net
realized
gains | Total
distributions to
shareholders |
| Advisor Class |
| Year Ended 3/31/2023 | $10.20 | 0.45 | (1.02) | (0.57) | (0.43) | (0.68) | (1.11) |
| Year Ended 3/31/2022 | $10.99 | 0.20 | 0.08 | 0.28 | (0.65) | (0.42) | (1.07) |
| Year Ended 3/31/2021 | $9.82 | 0.08 | 1.53 | 1.61 | (0.29) | (0.15) | (0.44) |
| Year Ended 3/31/2020 | $9.91 | 0.31 | 0.07 | 0.38 | (0.45) | (0.02) | (0.47) |
| Year Ended 3/31/2019 | $10.05 | 0.35 | 0.20 | 0.55 | (0.41) | (0.28) | (0.69) |
| Institutional 3 Class |
| Year Ended 3/31/2023 | $10.22 | 0.47 | (1.03) | (0.56) | (0.45) | (0.68) | (1.13) |
| Year Ended 3/31/2022 | $11.00 | 0.22 | 0.09 | 0.31 | (0.67) | (0.42) | (1.09) |
| Year Ended 3/31/2021 | $9.83 | 0.10 | 1.52 | 1.62 | (0.30) | (0.15) | (0.45) |
| Year Ended 3/31/2020 | $9.92 | 0.23 | 0.16 | 0.39 | (0.46) | (0.02) | (0.48) |
| Year Ended 3/31/2019 | $10.05 | 0.34 | 0.22 | 0.56 | (0.41) | (0.28) | (0.69) |
| Notes to Financial Highlights |
| (a) | In addition to the fees and expenses that the Fund bears directly, the Fund indirectly bears a pro rata share of the fees and expenses of any other funds in which it invests. Such indirect expenses are not included in the Fund’s reported expense ratios. |
| (b) | Total net expenses include the impact of certain fee waivers/expense reimbursements made by the Investment Manager and certain of its affiliates, if applicable. |
The accompanying Notes to Financial Statements are an integral part of this statement.
| 58 | Columbia Adaptive Retirement Funds | Annual Report 2023 |
Financial Highlights (continued)
Columbia Adaptive Retirement 2030 Fund
| | Net
asset
value,
end of
period | Total
return | Total gross
expense
ratio to
average
net assets(a) | Total net
expense
ratio to
average
net assets(a),(b) | Net investment
income
ratio to
average
net assets | Portfolio
turnover | Net
assets,
end of
period
(000’s) |
| Advisor Class |
| Year Ended 3/31/2023 | $8.52 | (5.40%) | 4.70% | 0.54% | 4.83% | 16% | $1,501 |
| Year Ended 3/31/2022 | $10.20 | 2.11% | 3.68% | 0.52% | 1.75% | 70% | $1,587 |
| Year Ended 3/31/2021 | $10.99 | 16.43% | 3.87% | 0.55% | 0.77% | 25% | $2,032 |
| Year Ended 3/31/2020 | $9.82 | 3.65% | 5.30% | 0.52% | 3.00% | 41% | $1,738 |
| Year Ended 3/31/2019 | $9.91 | 6.19% | 8.55% | 0.45% | 3.40% | 23% | $645 |
| Institutional 3 Class |
| Year Ended 3/31/2023 | $8.53 | (5.34%) | 4.56% | 0.39% | 5.05% | 16% | $855 |
| Year Ended 3/31/2022 | $10.22 | 2.32% | 3.56% | 0.40% | 1.94% | 70% | $878 |
| Year Ended 3/31/2021 | $11.00 | 16.51% | 3.77% | 0.44% | 0.91% | 25% | $577 |
| Year Ended 3/31/2020 | $9.83 | 3.68% | 5.21% | 0.42% | 2.20% | 41% | $495 |
| Year Ended 3/31/2019 | $9.92 | 6.31% | 8.52% | 0.43% | 3.34% | 23% | $500 |
The accompanying Notes to Financial Statements are an integral part of this statement.
Columbia Adaptive Retirement Funds | Annual Report 2023
| 59 |
Financial Highlights
Columbia Adaptive Retirement 2035 Fund
| | Net asset value,
beginning of
period | Net
investment
income | Net
realized
and
unrealized
gain (loss) | Total from
investment
operations | Distributions
from net
investment
income | Distributions
from net
realized
gains | Total
distributions to
shareholders |
| Advisor Class |
| Year Ended 3/31/2023 | $10.66 | 0.52 | (1.18) | (0.66) | (0.36) | (0.68) | (1.04) |
| Year Ended 3/31/2022 | $11.56 | 0.21 | 0.20 | 0.41 | (0.82) | (0.49) | (1.31) |
| Year Ended 3/31/2021 | $9.99 | 0.10 | 1.92 | 2.02 | (0.32) | (0.13) | (0.45) |
| Year Ended 3/31/2020 | $10.13 | 0.31 | 0.13 | 0.44 | (0.52) | (0.06) | (0.58) |
| Year Ended 3/31/2019(c) | $10.00 | 0.40 | 0.18 | 0.58 | (0.43) | (0.02) | (0.45) |
| Institutional 3 Class |
| Year Ended 3/31/2023 | $10.67 | 0.43 | (1.08) | (0.65) | (0.38) | (0.68) | (1.06) |
| Year Ended 3/31/2022 | $11.56 | 0.23 | 0.20 | 0.43 | (0.83) | (0.49) | (1.32) |
| Year Ended 3/31/2021 | $10.00 | 0.11 | 1.91 | 2.02 | (0.33) | (0.13) | (0.46) |
| Year Ended 3/31/2020 | $10.13 | 0.25 | 0.20 | 0.45 | (0.52) | (0.06) | (0.58) |
| Year Ended 3/31/2019(c) | $10.00 | 0.40 | 0.18 | 0.58 | (0.43) | (0.02) | (0.45) |
| Notes to Financial Highlights |
| (a) | In addition to the fees and expenses that the Fund bears directly, the Fund indirectly bears a pro rata share of the fees and expenses of any other funds in which it invests. Such indirect expenses are not included in the Fund’s reported expense ratios. |
| (b) | Total net expenses include the impact of certain fee waivers/expense reimbursements made by the Investment Manager and certain of its affiliates, if applicable. |
| (c) | The Fund commenced operations on April 4, 2018. Per share data and total return reflect activity from that date. |
The accompanying Notes to Financial Statements are an integral part of this statement.
| 60 | Columbia Adaptive Retirement Funds | Annual Report 2023 |
Financial Highlights (continued)
Columbia Adaptive Retirement 2035 Fund
| | Net
asset
value,
end of
period | Total
return | Total gross
expense
ratio to
average
net assets(a) | Total net
expense
ratio to
average
net assets(a),(b) | Net investment
income
ratio to
average
net assets | Portfolio
turnover | Net
assets,
end of
period
(000’s) |
| Advisor Class |
| Year Ended 3/31/2023 | $8.96 | (5.97%) | 6.70% | 0.50% | 5.37% | 15% | $753 |
| Year Ended 3/31/2022 | $10.66 | 2.97% | 5.43% | 0.48% | 1.80% | 72% | $795 |
| Year Ended 3/31/2021 | $11.56 | 20.36% | 5.61% | 0.52% | 0.90% | 29% | $1,112 |
| Year Ended 3/31/2020 | $9.99 | 3.97% | 6.94% | 0.48% | 2.90% | 42% | $924 |
| Year Ended 3/31/2019(c) | $10.13 | 6.31% | 11.96% | 0.43% | 4.04% | 32% | $507 |
| Institutional 3 Class |
| Year Ended 3/31/2023 | $8.96 | (5.96%) | 6.61% | 0.39% | 4.52% | 15% | $1,267 |
| Year Ended 3/31/2022 | $10.67 | 3.14% | 5.36% | 0.40% | 1.94% | 72% | $679 |
| Year Ended 3/31/2021 | $11.56 | 20.32% | 5.56% | 0.44% | 1.03% | 29% | $610 |
| Year Ended 3/31/2020 | $10.00 | 4.09% | 6.89% | 0.42% | 2.37% | 42% | $500 |
| Year Ended 3/31/2019(c) | $10.13 | 6.31% | 11.96% | 0.43% | 4.04% | 32% | $507 |
The accompanying Notes to Financial Statements are an integral part of this statement.
Columbia Adaptive Retirement Funds | Annual Report 2023
| 61 |
Financial Highlights
Columbia Adaptive Retirement 2040 Fund
| | Net asset value,
beginning of
period | Net
investment
income | Net
realized
and
unrealized
gain (loss) | Total from
investment
operations | Distributions
from net
investment
income | Distributions
from net
realized
gains | Total
distributions to
shareholders |
| Advisor Class |
| Year Ended 3/31/2023 | $10.84 | 0.56 | (1.33) | (0.77) | (0.58) | (1.16) | (1.74) |
| Year Ended 3/31/2022 | $11.76 | 0.22 | 0.32 | 0.54 | (0.99) | (0.47) | (1.46) |
| Year Ended 3/31/2021 | $10.01 | 0.12 | 2.26 | 2.38 | (0.36) | (0.27) | (0.63) |
| Year Ended 3/31/2020 | $10.15 | 0.27 | 0.18 | 0.45 | (0.55) | (0.04) | (0.59) |
| Year Ended 3/31/2019 | $10.05 | 0.43 | 0.16 | 0.59 | (0.45) | (0.04) | (0.49) |
| Institutional 3 Class |
| Year Ended 3/31/2023 | $10.85 | 0.58 | (1.34) | (0.76) | (0.59) | (1.16) | (1.75) |
| Year Ended 3/31/2022 | $11.77 | 0.23 | 0.32 | 0.55 | (1.00) | (0.47) | (1.47) |
| Year Ended 3/31/2021 | $10.01 | 0.13 | 2.26 | 2.39 | (0.36) | (0.27) | (0.63) |
| Year Ended 3/31/2020 | $10.15 | 0.26 | 0.19 | 0.45 | (0.55) | (0.04) | (0.59) |
| Year Ended 3/31/2019 | $10.05 | 0.44 | 0.15 | 0.59 | (0.45) | (0.04) | (0.49) |
| Notes to Financial Highlights |
| (a) | In addition to the fees and expenses that the Fund bears directly, the Fund indirectly bears a pro rata share of the fees and expenses of any other funds in which it invests. Such indirect expenses are not included in the Fund’s reported expense ratios. |
| (b) | Total net expenses include the impact of certain fee waivers/expense reimbursements made by the Investment Manager and certain of its affiliates, if applicable. |
The accompanying Notes to Financial Statements are an integral part of this statement.
| 62 | Columbia Adaptive Retirement Funds | Annual Report 2023 |
Financial Highlights (continued)
Columbia Adaptive Retirement 2040 Fund
| | Net
asset
value,
end of
period | Total
return | Total gross
expense
ratio to
average
net assets(a) | Total net
expense
ratio to
average
net assets(a),(b) | Net investment
income
ratio to
average
net assets | Portfolio
turnover | Net
assets,
end of
period
(000’s) |
| Advisor Class |
| Year Ended 3/31/2023 | $8.33 | (6.82%) | 7.04% | 0.49% | 5.88% | 13% | $554 |
| Year Ended 3/31/2022 | $10.84 | 3.89% | 5.33% | 0.47% | 1.81% | 79% | $590 |
| Year Ended 3/31/2021 | $11.76 | 23.95% | 6.19% | 0.50% | 1.04% | 28% | $927 |
| Year Ended 3/31/2020 | $10.01 | 4.03% | 7.83% | 0.45% | 2.51% | 41% | $598 |
| Year Ended 3/31/2019 | $10.15 | 6.54% | 10.76% | 0.43% | 4.26% | 30% | $527 |
| Institutional 3 Class |
| Year Ended 3/31/2023 | $8.34 | (6.73%) | 6.97% | 0.39% | 6.11% | 13% | $957 |
| Year Ended 3/31/2022 | $10.85 | 3.94% | 5.31% | 0.40% | 1.92% | 79% | $920 |
| Year Ended 3/31/2021 | $11.77 | 24.10% | 6.15% | 0.44% | 1.15% | 28% | $657 |
| Year Ended 3/31/2020 | $10.01 | 4.05% | 7.84% | 0.42% | 2.45% | 41% | $513 |
| Year Ended 3/31/2019 | $10.15 | 6.55% | 10.75% | 0.43% | 4.34% | 30% | $508 |
The accompanying Notes to Financial Statements are an integral part of this statement.
Columbia Adaptive Retirement Funds | Annual Report 2023
| 63 |
Financial Highlights
Columbia Adaptive Retirement 2045 Fund
| | Net asset value,
beginning of
period | Net
investment
income | Net
realized
and
unrealized
gain (loss) | Total from
investment
operations | Distributions
from net
investment
income | Distributions
from net
realized
gains | Total
distributions to
shareholders |
| Advisor Class |
| Year Ended 3/31/2023 | $11.07 | 0.62 | (1.49) | (0.87) | (0.65) | (1.51) | (2.16) |
| Year Ended 3/31/2022 | $12.03 | 0.23 | 0.43 | 0.66 | (1.16) | (0.46) | (1.62) |
| Year Ended 3/31/2021 | $9.87 | 0.15 | 2.59 | 2.74 | (0.41) | (0.17) | (0.58) |
| Year Ended 3/31/2020 | $10.12 | 0.28 | 0.17 | 0.45 | (0.60) | (0.10) | (0.70) |
| Year Ended 3/31/2019(c) | $10.00 | 0.45 | 0.16 | 0.61 | (0.46) | (0.03) | (0.49) |
| Institutional 3 Class |
| Year Ended 3/31/2023 | $11.07 | 0.63 | (1.50) | (0.87) | (0.65) | (1.51) | (2.16) |
| Year Ended 3/31/2022 | $12.03 | 0.24 | 0.42 | 0.66 | (1.16) | (0.46) | (1.62) |
| Year Ended 3/31/2021 | $9.87 | 0.14 | 2.60 | 2.74 | (0.41) | (0.17) | (0.58) |
| Year Ended 3/31/2020 | $10.12 | 0.28 | 0.17 | 0.45 | (0.60) | (0.10) | (0.70) |
| Year Ended 3/31/2019(c) | $10.00 | 0.45 | 0.16 | 0.61 | (0.46) | (0.03) | (0.49) |
| Notes to Financial Highlights |
| (a) | In addition to the fees and expenses that the Fund bears directly, the Fund indirectly bears a pro rata share of the fees and expenses of any other funds in which it invests. Such indirect expenses are not included in the Fund’s reported expense ratios. |
| (b) | Total net expenses include the impact of certain fee waivers/expense reimbursements made by the Investment Manager and certain of its affiliates, if applicable. |
| (c) | The Fund commenced operations on April 4, 2018. Per share data and total return reflect activity from that date. |
The accompanying Notes to Financial Statements are an integral part of this statement.
| 64 | Columbia Adaptive Retirement Funds | Annual Report 2023 |
Financial Highlights (continued)
Columbia Adaptive Retirement 2045 Fund
| | Net
asset
value,
end of
period | Total
return | Total gross
expense
ratio to
average
net assets(a) | Total net
expense
ratio to
average
net assets(a),(b) | Net investment
income
ratio to
average
net assets | Portfolio
turnover | Net
assets,
end of
period
(000’s) |
| Advisor Class |
| Year Ended 3/31/2023 | $8.04 | (7.51%) | 8.12% | 0.47% | 6.48% | 13% | $425 |
| Year Ended 3/31/2022 | $11.07 | 4.67% | 5.72% | 0.45% | 1.81% | 89% | $450 |
| Year Ended 3/31/2021 | $12.03 | 27.94% | 7.06% | 0.48% | 1.29% | 18% | $797 |
| Year Ended 3/31/2020 | $9.87 | 3.92% | 8.27% | 0.43% | 2.60% | 35% | $494 |
| Year Ended 3/31/2019(c) | $10.12 | 6.89% | 11.97% | 0.43% | 4.59% | 30% | $506 |
| Institutional 3 Class |
| Year Ended 3/31/2023 | $8.04 | (7.45%) | 8.08% | 0.39% | 6.70% | 13% | $915 |
| Year Ended 3/31/2022 | $11.07 | 4.71% | 5.72% | 0.40% | 1.95% | 89% | $837 |
| Year Ended 3/31/2021 | $12.03 | 27.96% | 7.05% | 0.44% | 1.27% | 18% | $633 |
| Year Ended 3/31/2020 | $9.87 | 3.92% | 8.27% | 0.42% | 2.61% | 35% | $494 |
| Year Ended 3/31/2019(c) | $10.12 | 6.89% | 11.98% | 0.43% | 4.59% | 30% | $506 |
The accompanying Notes to Financial Statements are an integral part of this statement.
Columbia Adaptive Retirement Funds | Annual Report 2023
| 65 |
Financial Highlights
Columbia Adaptive Retirement 2050 Fund
| | Net asset value,
beginning of
period | Net
investment
income | Net
realized
and
unrealized
gain (loss) | Total from
investment
operations | Distributions
from net
investment
income | Distributions
from net
realized
gains | Total
distributions to
shareholders |
| Advisor Class |
| Year Ended 3/31/2023 | $11.07 | 0.65 | (1.60) | (0.95) | (0.68) | (1.48) | (2.16) |
| Year Ended 3/31/2022 | $12.28 | 0.23 | 0.53 | 0.76 | (1.30) | (0.67) | (1.97) |
| Year Ended 3/31/2021 | $9.93 | 0.15 | 2.83 | 2.98 | (0.41) | (0.22) | (0.63) |
| Year Ended 3/31/2020 | $10.15 | 0.28 | 0.17 | 0.45 | (0.61) | (0.06) | (0.67) |
| Year Ended 3/31/2019 | $10.06 | 0.47 | 0.15 | 0.62 | (0.49) | (0.04) | (0.53) |
| Institutional 3 Class |
| Year Ended 3/31/2023 | $11.06 | 0.66 | (1.59) | (0.93) | (0.69) | (1.48) | (2.17) |
| Year Ended 3/31/2022 | $12.29 | 0.23 | 0.51 | 0.74 | (1.30) | (0.67) | (1.97) |
| Year Ended 3/31/2021 | $9.93 | 0.16 | 2.84 | 3.00 | (0.42) | (0.22) | (0.64) |
| Year Ended 3/31/2020 | $10.15 | 0.28 | 0.17 | 0.45 | (0.61) | (0.06) | (0.67) |
| Year Ended 3/31/2019 | $10.06 | 0.47 | 0.15 | 0.62 | (0.49) | (0.04) | (0.53) |
| Notes to Financial Highlights |
| (a) | In addition to the fees and expenses that the Fund bears directly, the Fund indirectly bears a pro rata share of the fees and expenses of any other funds in which it invests. Such indirect expenses are not included in the Fund’s reported expense ratios. |
| (b) | Total net expenses include the impact of certain fee waivers/expense reimbursements made by the Investment Manager and certain of its affiliates, if applicable. |
The accompanying Notes to Financial Statements are an integral part of this statement.
| 66 | Columbia Adaptive Retirement Funds | Annual Report 2023 |
Financial Highlights (continued)
Columbia Adaptive Retirement 2050 Fund
| | Net
asset
value,
end of
period | Total
return | Total gross
expense
ratio to
average
net assets(a) | Total net
expense
ratio to
average
net assets(a),(b) | Net investment
income
ratio to
average
net assets | Portfolio
turnover | Net
assets,
end of
period
(000’s) |
| Advisor Class |
| Year Ended 3/31/2023 | $7.96 | (8.17%) | 6.93% | 0.42% | 6.91% | 13% | $232 |
| Year Ended 3/31/2022 | $11.07 | 5.20% | 5.51% | 0.41% | 1.82% | 89% | $245 |
| Year Ended 3/31/2021 | $12.28 | 30.31% | 6.59% | 0.49% | 1.29% | 37% | $650 |
| Year Ended 3/31/2020 | $9.93 | 3.91% | 8.16% | 0.43% | 2.60% | 31% | $501 |
| Year Ended 3/31/2019 | $10.15 | 7.01% | 11.02% | 0.43% | 4.73% | 27% | $508 |
| Institutional 3 Class |
| Year Ended 3/31/2023 | $7.96 | (8.04%) | 6.92% | 0.39% | 7.04% | 13% | $1,331 |
| Year Ended 3/31/2022 | $11.06 | 5.04% | 5.52% | 0.40% | 1.81% | 89% | $1,269 |
| Year Ended 3/31/2021 | $12.29 | 30.45% | 6.59% | 0.44% | 1.39% | 37% | $647 |
| Year Ended 3/31/2020 | $9.93 | 3.91% | 8.16% | 0.42% | 2.60% | 31% | $496 |
| Year Ended 3/31/2019 | $10.15 | 7.01% | 11.02% | 0.43% | 4.73% | 27% | $508 |
The accompanying Notes to Financial Statements are an integral part of this statement.
Columbia Adaptive Retirement Funds | Annual Report 2023
| 67 |
Financial Highlights
Columbia Adaptive Retirement 2055 Fund
| | Net asset value,
beginning of
period | Net
investment
income | Net
realized
and
unrealized
gain (loss) | Total from
investment
operations | Distributions
from net
investment
income | Distributions
from net
realized
gains | Total
distributions to
shareholders |
| Advisor Class |
| Year Ended 3/31/2023 | $11.24 | 0.67 | (1.65) | (0.98) | (0.58) | (1.63) | (2.21) |
| Year Ended 3/31/2022 | $12.25 | 0.23 | 0.53 | 0.76 | (1.35) | (0.42) | (1.77) |
| Year Ended 3/31/2021 | $9.83 | 0.17 | 2.83 | 3.00 | (0.41) | (0.17) | (0.58) |
| Year Ended 3/31/2020 | $10.12 | 0.29 | 0.16 | 0.45 | (0.63) | (0.11) | (0.74) |
| Year Ended 3/31/2019(c) | $10.00 | 0.47 | 0.15 | 0.62 | (0.47) | (0.03) | (0.50) |
| Institutional 3 Class |
| Year Ended 3/31/2023 | $11.24 | 0.69 | (1.66) | (0.97) | (0.59) | (1.63) | (2.22) |
| Year Ended 3/31/2022 | $12.26 | 0.23 | 0.52 | 0.75 | (1.35) | (0.42) | (1.77) |
| Year Ended 3/31/2021 | $9.83 | 0.16 | 2.85 | 3.01 | (0.41) | (0.17) | (0.58) |
| Year Ended 3/31/2020 | $10.12 | 0.29 | 0.16 | 0.45 | (0.63) | (0.11) | (0.74) |
| Year Ended 3/31/2019(c) | $10.00 | 0.47 | 0.15 | 0.62 | (0.47) | (0.03) | (0.50) |
| Notes to Financial Highlights |
| (a) | In addition to the fees and expenses that the Fund bears directly, the Fund indirectly bears a pro rata share of the fees and expenses of any other funds in which it invests. Such indirect expenses are not included in the Fund’s reported expense ratios. |
| (b) | Total net expenses include the impact of certain fee waivers/expense reimbursements made by the Investment Manager and certain of its affiliates, if applicable. |
| (c) | The Fund commenced operations on April 4, 2018. Per share data and total return reflect activity from that date. |
The accompanying Notes to Financial Statements are an integral part of this statement.
| 68 | Columbia Adaptive Retirement Funds | Annual Report 2023 |
Financial Highlights (continued)
Columbia Adaptive Retirement 2055 Fund
| | Net
asset
value,
end of
period | Total
return | Total gross
expense
ratio to
average
net assets(a) | Total net
expense
ratio to
average
net assets(a),(b) | Net investment
income
ratio to
average
net assets | Portfolio
turnover | Net
assets,
end of
period
(000’s) |
| Advisor Class |
| Year Ended 3/31/2023 | $8.05 | (8.30%) | 6.80% | 0.47% | 7.05% | 14% | $339 |
| Year Ended 3/31/2022 | $11.24 | 5.28% | 5.19% | 0.45% | 1.76% | 81% | $364 |
| Year Ended 3/31/2021 | $12.25 | 30.78% | 7.38% | 0.46% | 1.51% | 16% | $764 |
| Year Ended 3/31/2020 | $9.83 | 3.82% | 8.25% | 0.43% | 2.67% | 33% | $491 |
| Year Ended 3/31/2019(c) | $10.12 | 7.05% | 12.00% | 0.43% | 4.73% | 29% | $506 |
| Institutional 3 Class |
| Year Ended 3/31/2023 | $8.05 | (8.23%) | 6.74% | 0.39% | 7.18% | 14% | $1,220 |
| Year Ended 3/31/2022 | $11.24 | 5.22% | 5.19% | 0.40% | 1.82% | 81% | $1,264 |
| Year Ended 3/31/2021 | $12.26 | 30.89% | 7.38% | 0.44% | 1.37% | 16% | $643 |
| Year Ended 3/31/2020 | $9.83 | 3.83% | 8.25% | 0.42% | 2.68% | 33% | $491 |
| Year Ended 3/31/2019(c) | $10.12 | 7.05% | 12.00% | 0.43% | 4.73% | 29% | $506 |
The accompanying Notes to Financial Statements are an integral part of this statement.
Columbia Adaptive Retirement Funds | Annual Report 2023
| 69 |
Financial Highlights
Columbia Adaptive Retirement 2060 Fund
| | Net asset value,
beginning of
period | Net
investment
income | Net
realized
and
unrealized
gain (loss) | Total from
investment
operations | Distributions
from net
investment
income | Distributions
from net
realized
gains | Total
distributions to
shareholders |
| Advisor Class |
| Year Ended 3/31/2023 | $11.48 | 0.69 | (1.69) | (1.00) | (0.72) | (1.39) | (2.11) |
| Year Ended 3/31/2022 | $12.28 | 0.22 | 0.56 | 0.78 | (1.23) | (0.35) | (1.58) |
| Year Ended 3/31/2021 | $9.92 | 0.14 | 2.88 | 3.02 | (0.42) | (0.24) | (0.66) |
| Year Ended 3/31/2020 | $10.15 | 0.28 | 0.17 | 0.45 | (0.62) | (0.06) | (0.68) |
| Year Ended 3/31/2019 | $10.06 | 0.47 | 0.14 | 0.61 | (0.49) | (0.03) | (0.52) |
| Institutional 3 Class |
| Year Ended 3/31/2023 | $11.49 | 0.73 | (1.73) | (1.00) | (0.73) | (1.39) | (2.12) |
| Year Ended 3/31/2022 | $12.28 | 0.25 | 0.55 | 0.80 | (1.24) | (0.35) | (1.59) |
| Year Ended 3/31/2021 | $9.92 | 0.15 | 2.87 | 3.02 | (0.42) | (0.24) | (0.66) |
| Year Ended 3/31/2020 | $10.15 | 0.28 | 0.17 | 0.45 | (0.62) | (0.06) | (0.68) |
| Year Ended 3/31/2019 | $10.06 | 0.47 | 0.14 | 0.61 | (0.49) | (0.03) | (0.52) |
| Notes to Financial Highlights |
| (a) | In addition to the fees and expenses that the Fund bears directly, the Fund indirectly bears a pro rata share of the fees and expenses of any other funds in which it invests. Such indirect expenses are not included in the Fund’s reported expense ratios. |
| (b) | Total net expenses include the impact of certain fee waivers/expense reimbursements made by the Investment Manager and certain of its affiliates, if applicable. |
The accompanying Notes to Financial Statements are an integral part of this statement.
| 70 | Columbia Adaptive Retirement Funds | Annual Report 2023 |
Financial Highlights (continued)
Columbia Adaptive Retirement 2060 Fund
| | Net
asset
value,
end of
period | Total
return | Total gross
expense
ratio to
average
net assets(a) | Total net
expense
ratio to
average
net assets(a),(b) | Net investment
income
ratio to
average
net assets | Portfolio
turnover | Net
assets,
end of
period
(000’s) |
| Advisor Class |
| Year Ended 3/31/2023 | $8.37 | (8.31%) | 5.70% | 0.50% | 6.97% | 11% | $987 |
| Year Ended 3/31/2022 | $11.48 | 5.55% | 5.10% | 0.46% | 1.69% | 68% | $1,048 |
| Year Ended 3/31/2021 | $12.28 | 30.70% | 7.22% | 0.46% | 1.27% | 16% | $924 |
| Year Ended 3/31/2020 | $9.92 | 3.85% | 8.09% | 0.43% | 2.60% | 31% | $513 |
| Year Ended 3/31/2019 | $10.15 | 6.93% | 10.98% | 0.43% | 4.73% | 26% | $514 |
| Institutional 3 Class |
| Year Ended 3/31/2023 | $8.37 | (8.28%) | 5.62% | 0.39% | 7.52% | 11% | $982 |
| Year Ended 3/31/2022 | $11.49 | 5.68% | 5.03% | 0.40% | 1.93% | 68% | $837 |
| Year Ended 3/31/2021 | $12.28 | 30.72% | 7.19% | 0.44% | 1.35% | 16% | $649 |
| Year Ended 3/31/2020 | $9.92 | 3.86% | 8.09% | 0.42% | 2.61% | 31% | $496 |
| Year Ended 3/31/2019 | $10.15 | 6.93% | 10.97% | 0.43% | 4.73% | 26% | $508 |
The accompanying Notes to Financial Statements are an integral part of this statement.
Columbia Adaptive Retirement Funds | Annual Report 2023
| 71 |
Notes to Financial Statements
March 31, 2023
Note 1. Organization
Columbia Funds Series Trust I (the Trust) is registered under the Investment Company Act of 1940, as amended (the 1940 Act), as open-end management investment companies. Columbia Funds Series Trust I is organized as a Massachusetts business trust. Information presented in these financial statements pertains to the following series of the Trust (each, a Fund and collectively, the Funds): Columbia Adaptive Retirement 2020 Fund, Columbia Adaptive Retirement 2025 Fund, Columbia Adaptive Retirement 2030 Fund, Columbia Adaptive Retirement 2035 Fund, Columbia Adaptive Retirement 2040 Fund, Columbia Adaptive Retirement 2045 Fund, Columbia Adaptive Retirement 2050 Fund, Columbia Adaptive Retirement 2055 Fund and Columbia Adaptive Retirement 2060 Fund. Each Fund currently operates as a diversified fund.
Each Fund is a “fund-of-funds”, investing significantly in affiliated funds managed by Columbia Management Investment Advisers, LLC (the Investment Manager), a wholly-owned subsidiary of Ameriprise Financial, Inc. (Ameriprise Financial), or its affiliates, as well as third-party advised (unaffiliated) funds, including exchange-traded funds (collectively, Underlying Funds). Each Fund is exposed to the same risks as the Underlying Funds in direct proportion to the allocation of its assets among the Underlying Funds. For information on the investment strategies, operations and risks of the Underlying Funds, please refer to the Fund’s current prospectus as well as the prospectuses and shareholder reports of the Underlying Funds, which are available from the Securities and Exchange Commission’s website at www.sec.gov or on the Underlying Funds’ website at columbiathreadneedleus.com/investor/.
Fund shares
The Trust may issue an unlimited number of shares (without par value). The Funds offer each of the share classes listed in the Statement of Assets and Liabilities. Although all share classes generally have identical voting, dividend and liquidation rights, each share class votes separately when required by the Trust’s organizational documents or by law. Each share class has its own expense structure. Different share classes may have different minimum initial investment amounts and pay different distribution amounts to the extent the expenses of distributing such share classes vary. Distributions to shareholders in a liquidation will be proportional to the net asset value of each share class.
Advisor Class and Institutional 3 Class shares are available for purchase through authorized investment professionals, to omnibus retirement plans or to institutional and to certain other investors as described in the Fund’s prospectus.
Note 2. Summary of significant accounting policies
Basis of preparation
Each Fund is an investment company that applies the accounting and reporting guidance in the Financial Accounting Standards Board (FASB) Accounting Standards Codification Topic 946, Financial Services - Investment Companies (ASC 946). The financial statements are prepared in accordance with U.S. generally accepted accounting principles (GAAP), which requires management to make certain estimates and assumptions that affect the reported amounts of assets and liabilities, the disclosure of contingent assets and liabilities at the date of the financial statements and the reported amounts of income and expenses during the reporting period. Actual results could differ from those estimates.
The following is a summary of significant accounting policies followed by the Funds in the preparation of their financial statements.
Security valuation
Equity securities listed on an exchange are valued at the closing price or last trade price on their primary exchange at the close of business of the New York Stock Exchange. Securities with a closing price not readily available or not listed on any exchange are valued at the mean between the closing bid and ask prices. Listed preferred stocks convertible into common stocks are valued using an evaluated price from a pricing service.
Investments in the Underlying Funds (other than exchange-traded funds (ETFs)), are valued at the latest net asset value reported by those companies as of the valuation time.
| 72 | Columbia Adaptive Retirement Funds | Annual Report 2023 |
Notes to Financial Statements (continued)
March 31, 2023
Investments for which market quotations are not readily available, or that have quotations which management believes are not reflective of market value or reliable, are valued at fair value as determined in good faith under procedures approved by the Board of Trustees. If a security or class of securities (such as foreign securities) is valued at fair value, such value is likely to be different from the quoted or published price for the security, if available.
The determination of fair value often requires significant judgment. To determine fair value, management may use assumptions including but not limited to future cash flows and estimated risk premiums. Multiple inputs from various sources may be used to determine fair value.
GAAP requires disclosure regarding the inputs and valuation techniques used to measure fair value and any changes in valuation inputs or techniques. In addition, investments shall be disclosed by major category. This information is disclosed following the Funds’ Portfolio of Investments.
Security transactions
Security transactions are accounted for on the trade date. Cost is determined and gains (losses) are based upon the specific identification method for both financial statement and federal income tax purposes.
Income recognition
Corporate actions and dividend income are recorded on the ex-dividend date.
The Funds may receive distributions from holdings in equity securities, business development companies (BDCs), exchange-traded funds (ETFs), limited partnerships (LPs), other regulated investment companies (RICs), and real estate investment trusts (REITs), which report information as to the tax character of their distributions annually. These distributions are allocated to dividend income, capital gain and return of capital based on actual information reported. Return of capital is recorded as a reduction of the cost basis of securities held. If the Fund no longer owns the applicable securities, return of capital is recorded as a realized gain. With respect to REITs, to the extent actual information has not yet been reported, estimates for return of capital are made by Columbia Management Investment Advisers, LLC (the Investment Manager), a wholly-owned subsidiary of Ameriprise Financial, Inc. (Ameriprise Financial). The Investment Manager’s estimates are subsequently adjusted when the actual character of the distributions is disclosed by the REITs, which could result in a proportionate change in return of capital to shareholders.
Awards from class action litigation are recorded as a reduction of cost basis if the Fund still owns the applicable securities on the payment date. If the Fund no longer owns the applicable securities on the payment date, the proceeds are recorded as realized gains.
Income and capital gain distributions from the Underlying Funds, if any, are recorded on the ex-dividend date.
Expenses
General expenses of the Trust are allocated to the Funds and other funds of the Trust based upon relative net assets or other expense allocation methodologies determined by the nature of the expense. Expenses directly attributable to a Fund are charged to that Fund. Expenses directly attributable to a specific class of shares are charged to that share class.
Determination of class net asset value
All income, expenses (other than class-specific expenses which are charged directly to that share class, as shown in the Statement of Operations) and realized and unrealized gains (losses) are allocated to each class of a Fund on a daily basis, based on the relative net assets of each class, for purposes of determining the net asset value of each class.
Federal income tax status
For federal income tax purposes, each Fund is treated as a separate entity. The Funds intend to qualify each year as separate regulated investment companies under Subchapter M of the Internal Revenue Code, as amended, and will distribute substantially all of their investment company taxable income and net capital gain, if any, for their tax year, and as such will
Columbia Adaptive Retirement Funds | Annual Report 2023
| 73 |
Notes to Financial Statements (continued)
March 31, 2023
not be subject to federal income taxes. In addition, the Funds intend to distribute in each calendar year substantially all of their ordinary income, capital gain net income and certain other amounts, if any, such that the Funds should not be subject to federal excise tax. Therefore, no federal income or excise tax provisions are recorded.
Distributions to shareholders
Distributions from net investment income, if any, are declared and paid annually. Net realized capital gains, if any, are distributed at least annually. Income distributions and capital gain distributions are determined in accordance with federal income tax regulations, which may differ from GAAP.
Guarantees and indemnifications
Under the Trust’s organizational documents and, in some cases, by contract, its officers and trustees are indemnified against certain liabilities arising out of the performance of their duties to the Trust or its funds. In addition, certain of the Funds’ contracts with their service providers contain general indemnification clauses. The Funds’ maximum exposure under these arrangements is unknown since the amount of any future claims that may be made against the Funds cannot be determined, and the Funds have no historical basis for predicting the likelihood of any such claims.
Recent accounting pronouncement
Tailored Shareholder Reports
In October 2022, the Securities and Exchange Commission (SEC) adopted a final rule relating to Tailored Shareholder Reports for Mutual Funds and Exchange-Traded Funds; Fee Information in Investment Company Advertisements. The rule and form amendments will, among other things, require the Funds to transmit concise and visually engaging shareholder reports that highlight key information. The amendments will require that funds tag information in a structured data format and that certain more in-depth information be made available online and available for delivery free of charge to investors on request. The amendments became effective January 24, 2023. There is an 18-month transition period after the effective date of the amendment.
Note 3. Fees and other transactions with affiliates
Management services fees and underlying fund fees
The Funds have entered into a Management Agreement with Columbia Management Investment Advisers, LLC (the Investment Manager). Under the Management Agreement, the Investment Manager provides each Fund with investment research and advice, as well as administrative and accounting services. The management services fee is an annual fee that is a blend of (i) 0.02% on assets invested in affiliated Underlying Funds that pay a management or advisory fee to the Investment Manager and (ii) 0.47% on its assets that are invested in securities, instruments and other assets not described above, including without limitation affiliated funds that do not pay a management or advisory fee to the Investment Manager, third party funds, derivatives and individual securities.
The effective management services fee rates based on each Fund’s average daily net assets for the year ended March 31, 2023 were as follows:
| | Effective management services fee rate (%) |
| Columbia Adaptive Retirement 2020 Fund | 0.46 |
| Columbia Adaptive Retirement 2025 Fund | 0.46 |
| Columbia Adaptive Retirement 2030 Fund | 0.46 |
| Columbia Adaptive Retirement 2035 Fund | 0.46 |
| Columbia Adaptive Retirement 2040 Fund | 0.46 |
| Columbia Adaptive Retirement 2045 Fund | 0.46 |
| Columbia Adaptive Retirement 2050 Fund | 0.46 |
| Columbia Adaptive Retirement 2055 Fund | 0.46 |
| Columbia Adaptive Retirement 2060 Fund | 0.46 |
| 74 | Columbia Adaptive Retirement Funds | Annual Report 2023 |
Notes to Financial Statements (continued)
March 31, 2023
Effective June 1, 2023, the Funds have entered into an amended and restated Management Agreement with Columbia Management Investment Advisers, LLC (the Investment Manager). Pursuant to the Management Agreement, the Fund pays a unitary fee to the Investment Manager, which in turn pays the operating costs and expenses of the Fund other than taxes, interest, brokerage expenses, portfolio transaction expenses, fees pursuant to a 12b-1 plan, if any, and infrequent and/or unusual expenses, including but not limited to, litigation expenses. The unitary fee for Advisor Class is at an annual rate of 0.55% which is made up of a core advisory fee rate of 0.30%, plus a 0.25% class-specific administration fee which covers class-specific shareholder service-related expenses, including payment to intermediaries of up to 0.25% for sub-transfer agency services provided to the Advisor Class. The unitary fee for Institutional 3 Class is an annual rate of 0.30% which includes the 0.30% core advisory fee but is not subject to a class-specific shareholder service-related expense.
In addition to the fees and expenses which the Funds bear directly, the Funds indirectly bear a pro rata share of the fees and expenses of the Underlying Funds in which the Funds invest. Because the Underlying Funds have varied expense and fee levels and the Funds may own different proportions of Underlying Funds at different times, the amount of fees and expenses incurred indirectly by the Funds will vary. These expenses are not reflected in the expenses shown in Statement of Operations and are not included in the ratios to average net assets shown in the Financial Highlights.
Compensation of board members
Members of the Board of Trustees who are not officers or employees of the Investment Manager or Ameriprise Financial are compensated for their services to the Funds as disclosed in the Statement of Operations. Under a Deferred Compensation Plan (the Deferred Plan), these members of the Board of Trustees may elect to defer payment of up to 100% of their compensation. Deferred amounts are treated as though equivalent dollar amounts had been invested in shares of certain funds managed by the Investment Manager. Each Fund’s liability for these amounts is adjusted for market value changes and remains in the Funds until distributed in accordance with the Deferred Plan. All amounts payable under the Deferred Plan constitute a general unsecured obligation of the Funds. The expense for the Deferred Plan, which includes Trustees’ fees deferred during the current period as well as any gains or losses on the Trustees’ deferred compensation balances as a result of market fluctuations, is included in "Compensation of board members" in the Statement of Operations.
Compensation of Chief Compliance Officer
The Board of Trustees has appointed a Chief Compliance Officer for the Funds in accordance with federal securities regulations. As disclosed in the Statement of Operations, a portion of the Chief Compliance Officer’s total compensation is allocated to the Funds, along with other allocations to affiliated registered investment companies managed by the Investment Manager and its affiliates, based on relative net assets.
Transfer agency fees
Under a Transfer and Dividend Disbursing Agent Agreement, Columbia Management Investment Services Corp. (the Transfer Agent), an affiliate of the Investment Manager and a wholly-owned subsidiary of Ameriprise Financial, is responsible for providing transfer agency services to the Fund. The Transfer Agent has contracted with SS&C GIDS, Inc. (SS&C GIDS) to serve as sub-transfer agent. Prior to January 1, 2023, SS&C GIDS was known as DST Asset Manager Solutions, Inc. The Transfer Agent pays the fees of SS&C GIDS for services as sub-transfer agent and SS&C GIDS is not entitled to reimbursement for such fees from the Fund (with the exception of out-of-pocket fees).
The Fund pays the Transfer Agent a monthly transfer agency fee based on the number or the average value of accounts, depending on the type of account. In addition, the Fund pays the Transfer Agent a fee for shareholder services based on the number of accounts or on a percentage of the average aggregate value of the Fund’s shares maintained in omnibus accounts up to the lesser of the amount charged by the financial intermediary or a cap established by the Board of Trustees from time to time.
The Transfer Agent also receives compensation from the Fund for various shareholder services and reimbursements for certain out-of-pocket fees. Total transfer agency fees for Institutional 3 Class shares are subject to an annual limitation of not more than 0.02% of the average daily net assets attributable to Institutional 3 Class shares.
Columbia Adaptive Retirement Funds | Annual Report 2023
| 75 |
Notes to Financial Statements (continued)
March 31, 2023
For the year ended March 31, 2023, the Funds’ effective transfer agency fee rates as a percentage of average daily net assets of each class were as follows:
| Fund | Advisor
Class (%) | Institutional 3
Class (%) |
| Columbia Adaptive Retirement 2020 Fund | 0.08 | 0.01 |
| Columbia Adaptive Retirement 2025 Fund | 0.05 | 0.01 |
| Columbia Adaptive Retirement 2030 Fund | 0.15 | 0.01 |
| Columbia Adaptive Retirement 2035 Fund | 0.11 | 0.01 |
| Columbia Adaptive Retirement 2040 Fund | 0.10 | 0.01 |
| Columbia Adaptive Retirement 2045 Fund | 0.08 | 0.01 |
| Columbia Adaptive Retirement 2050 Fund | 0.03 | 0.01 |
| Columbia Adaptive Retirement 2055 Fund | 0.08 | 0.01 |
| Columbia Adaptive Retirement 2060 Fund | 0.11 | 0.01 |
Distribution and service fees
The Funds have an agreement with Columbia Management Investment Distributors, Inc. (the Distributor), an affiliate of the Investment Manager and a wholly-owned subsidiary of Ameriprise Financial, for distribution and shareholder services. The Funds do not pay the Distributor a fee for the distribution services it provides to the Funds.
Expenses waived/reimbursed by the Investment Manager and its affiliates
The Investment Manager and certain of its affiliates have contractually agreed to waive fees and/or reimburse expenses (excluding certain fees and expenses described below) for the period(s) disclosed below, unless sooner terminated at the sole discretion of the Board of Trustees, so that each Fund’s net operating expenses, including indirect expenses of the Underlying Funds, after giving effect to fees waived/expenses reimbursed and any balance credits and/or overdraft charges from the Funds’ custodian, do not exceed the following annual rate(s) as a percentage of the classes’ average daily net assets:
| | August 1, 2022 through May 31, 2023 | Prior to August 1, 2022 |
| | Advisor
Class (%) | Institutional 3
Class (%) | Advisor
Class (%) | Institutional 3
Class (%) |
| Columbia Adaptive Retirement 2020 Fund | 0.62 | 0.43 | 0.64 | 0.45 |
| Columbia Adaptive Retirement 2025 Fund | 0.62 | 0.43 | 0.64 | 0.45 |
| Columbia Adaptive Retirement 2030 Fund | 0.62 | 0.43 | 0.64 | 0.45 |
| Columbia Adaptive Retirement 2035 Fund | 0.62 | 0.43 | 0.64 | 0.45 |
| Columbia Adaptive Retirement 2040 Fund | 0.62 | 0.43 | 0.64 | 0.45 |
| Columbia Adaptive Retirement 2045 Fund | 0.62 | 0.43 | 0.64 | 0.45 |
| Columbia Adaptive Retirement 2050 Fund | 0.62 | 0.43 | 0.64 | 0.45 |
| Columbia Adaptive Retirement 2055 Fund | 0.62 | 0.43 | 0.64 | 0.45 |
| Columbia Adaptive Retirement 2060 Fund | 0.62 | 0.43 | 0.64 | 0.45 |
In addition, the Investment Manager and certain of its affiliates have contractually agreed to waive fees and/or reimburse expenses (excluding certain fees and expenses described below) for each Fund through July 31, 2023, unless sooner terminated at the sole discretion of the Board of Trustees, so that each Fund’s net operating expenses, including indirect expenses of the Underlying Funds, after giving effect to fees waived/expenses reimbursed and any balance credits and/or overdraft charges from the Funds’ custodian, will not exceed the annual rates of 0.68% for Advisor Class and 0.50% for Institutional 3 Class as a percentage of the classes’ average daily net assets. Effective May 31, 2023, this arrangement will be terminated.
Effective June 1, 2023, the Investment Manager and certain of its affiliates have contractually agreed to waive fees and/or reimburse expenses (excluding certain fees and expenses described below) for each Fund, for so long as the Investment Manager manages each Fund, unless sooner terminated at the sole discretion of the Board of Trustees, so that each Fund’s
| 76 | Columbia Adaptive Retirement Funds | Annual Report 2023 |
Notes to Financial Statements (continued)
March 31, 2023
net operating expenses, including indirect expenses of the Underlying Funds, after giving effect to fees waived/expenses reimbursed and any balance credits and/or overdraft charges from the Funds’ custodian, will not exceed the annual rates of 0.55% for Advisor Class and 0.30% for Institutional 3 Class as a percentage of the classes’ average daily net assets.
Under the agreements governing these fee waivers and/or expense reimbursement arrangements, the following fees and expenses are excluded from the waiver/reimbursement commitment, and therefore will be paid by the Fund, if applicable: taxes (including foreign transaction taxes), transaction costs and brokerage commissions, costs related to any securities lending program, dividend expenses associated with securities sold short, inverse floater program fees and expenses, transaction charges and interest on borrowed money, interest, costs associated with shareholder meetings, infrequent and/or unusual expenses and any other expenses the exclusion of which is specifically approved by the Board of Trustees. This agreement may be modified or amended only with approval from the Investment Manager, certain of its affiliates and the Fund. In addition to the contractual agreement, the Investment Manager and certain of its affiliates have voluntarily agreed to waive fees and/or reimburse Fund expenses (excluding certain fees and expenses described above) so that Fund level expenses (expenses directly attributable to the Fund and not to a specific share class) are waived proportionately across all share classes, but the Fund’s net operating expenses shall not exceed the contractual annual rates listed in the table above. This arrangement may be revised or discontinued at any time. Any fees waived and/or expenses reimbursed under the expense reimbursement arrangements described above are not recoverable by the Investment Manager or its affiliates in future periods.
Note 4. Federal tax information
The timing and character of income and capital gain distributions are determined in accordance with income tax regulations, which may differ from GAAP because of temporary or permanent book to tax differences.
At March 31, 2023, these differences were primarily due to differing treatment for deferral/reversal of wash sale losses, capital loss carryforwards, re-characterization of distributions for investments, distribution reclassifications and excess distributions. To the extent these differences were permanent, reclassifications were made among the components of the Fund’s net assets. Temporary differences do not require reclassifications.
The following reclassifications were made:
| Fund | Excess of distributions
over net investment
income ($) | Accumulated
net realized
gain (loss) ($) | Paid in capital
decrease ($) |
| Columbia Adaptive Retirement 2020 Fund | (352) | 352 | — |
| Columbia Adaptive Retirement 2025 Fund | (302) | 302 | — |
| Columbia Adaptive Retirement 2030 Fund | (504) | 504 | — |
| Columbia Adaptive Retirement 2035 Fund | (703) | 703 | — |
| Columbia Adaptive Retirement 2040 Fund | (459) | 502 | (43) |
| Columbia Adaptive Retirement 2045 Fund | (302) | 302 | — |
| Columbia Adaptive Retirement 2050 Fund | (501) | 501 | — |
| Columbia Adaptive Retirement 2055 Fund | (303) | 303 | — |
| Columbia Adaptive Retirement 2060 Fund | (203) | 203 | — |
Net investment income (loss) and net realized gains (losses), as disclosed in the Statement of Operations, and net assets were not affected by these reclassifications.
Columbia Adaptive Retirement Funds | Annual Report 2023
| 77 |
Notes to Financial Statements (continued)
March 31, 2023
The tax character of distributions paid during the years indicated was as follows:
| | Year Ended March 31, 2023 | Year Ended March 31, 2022 |
| Fund | Ordinary
income ($) | Long-term
capital gains ($) | Total ($) | Ordinary
income ($) | Long-term
capital gains ($) | Total ($) |
| Columbia Adaptive Retirement 2020 Fund | 50,979 | 76,598 | 127,577 | 163,011 | 541,745 | 704,756 |
| Columbia Adaptive Retirement 2025 Fund | 43,239 | 73,502 | 116,741 | 102,739 | 252,721 | 355,460 |
| Columbia Adaptive Retirement 2030 Fund | 106,357 | 162,172 | 268,529 | 196,340 | 98,697 | 295,037 |
| Columbia Adaptive Retirement 2035 Fund | 75,614 | 134,627 | 210,241 | 159,412 | 59,565 | 218,977 |
| Columbia Adaptive Retirement 2040 Fund | 86,420 | 168,548 | 254,968 | 178,142 | 64,036 | 242,178 |
| Columbia Adaptive Retirement 2045 Fund | 82,269 | 189,514 | 271,783 | 189,586 | 56,554 | 246,140 |
| Columbia Adaptive Retirement 2050 Fund | 102,193 | 219,072 | 321,265 | 217,072 | 73,787 | 290,859 |
| Columbia Adaptive Retirement 2055 Fund | 88,053 | 241,845 | 329,898 | 229,541 | 51,274 | 280,815 |
| Columbia Adaptive Retirement 2060 Fund | 131,262 | 249,253 | 380,515 | 236,824 | 48,491 | 285,315 |
Short-term capital gain distributions, if any, are considered ordinary income distributions for tax purposes.
At March 31, 2023, the components of distributable earnings on a tax basis were as follows:
| Fund | Undistributed
ordinary
income ($) | Undistributed
long-term
capital gains ($) | Capital loss
carryforwards ($) | Net unrealized
(depreciation) ($) |
| Columbia Adaptive Retirement 2020 Fund | 5,161 | — | (33,947) | (129,460) |
| Columbia Adaptive Retirement 2025 Fund | 3,711 | — | (12,282) | (112,778) |
| Columbia Adaptive Retirement 2030 Fund | 4,835 | — | (20,743) | (351,528) |
| Columbia Adaptive Retirement 2035 Fund | 61 | — | (14,623) | (211,581) |
| Columbia Adaptive Retirement 2040 Fund | — | — | (31,878) | (249,500) |
| Columbia Adaptive Retirement 2045 Fund | 147 | — | (45,503) | (235,381) |
| Columbia Adaptive Retirement 2050 Fund | 630 | — | (72,243) | (293,013) |
| Columbia Adaptive Retirement 2055 Fund | 19,646 | — | (87,193) | (325,550) |
| Columbia Adaptive Retirement 2060 Fund | 242 | — | (87,598) | (386,031) |
At March 31, 2023, the cost of all investments for federal income tax purposes along with the aggregate gross unrealized appreciation and depreciation based on that cost was:
| Fund | Tax cost ($) | Gross
unrealized
appreciation ($) | Gross
unrealized
(depreciation) ($) | Net unrealized
(depreciation) ($) |
| Columbia Adaptive Retirement 2020 Fund | 1,483,022 | 21 | (129,481) | (129,460) |
| Columbia Adaptive Retirement 2025 Fund | 1,154,831 | 20 | (112,798) | (112,778) |
| Columbia Adaptive Retirement 2030 Fund | 2,719,644 | 35 | (351,563) | (351,528) |
| Columbia Adaptive Retirement 2035 Fund | 2,249,855 | 30 | (211,611) | (211,581) |
| Columbia Adaptive Retirement 2040 Fund | 1,777,926 | 23 | (249,523) | (249,500) |
| Columbia Adaptive Retirement 2045 Fund | 1,592,345 | 22 | (235,403) | (235,381) |
| Columbia Adaptive Retirement 2050 Fund | 1,873,005 | 28 | (293,041) | (293,013) |
| Columbia Adaptive Retirement 2055 Fund | 1,901,001 | 25 | (325,575) | (325,550) |
| Columbia Adaptive Retirement 2060 Fund | 2,372,797 | 31 | (386,062) | (386,031) |
Tax cost of investments and unrealized appreciation/(depreciation) may also include timing differences that do not constitute adjustments to tax basis.
| 78 | Columbia Adaptive Retirement Funds | Annual Report 2023 |
Notes to Financial Statements (continued)
March 31, 2023
The following capital loss carryforwards, determined at March 31, 2023, may be available to reduce future net realized gains on investments, if any, to the extent permitted by the Internal Revenue Code. In addition, for the year ended March 31, 2023, capital loss carryforwards utilized, if any, were as follows:
| Fund | No expiration
short-term ($) | No expiration
long-term ($) | Total ($) | Utilized ($) |
| Columbia Adaptive Retirement 2020 Fund | (28,500) | (5,447) | (33,947) | — |
| Columbia Adaptive Retirement 2025 Fund | (12,071) | (211) | (12,282) | — |
| Columbia Adaptive Retirement 2030 Fund | (19,800) | (943) | (20,743) | — |
| Columbia Adaptive Retirement 2035 Fund | (13,763) | (860) | (14,623) | — |
| Columbia Adaptive Retirement 2040 Fund | (31,878) | — | (31,878) | — |
| Columbia Adaptive Retirement 2045 Fund | (45,503) | — | (45,503) | — |
| Columbia Adaptive Retirement 2050 Fund | (72,243) | — | (72,243) | — |
| Columbia Adaptive Retirement 2055 Fund | (84,880) | (2,313) | (87,193) | — |
| Columbia Adaptive Retirement 2060 Fund | (87,598) | — | (87,598) | — |
Management of the Funds has concluded that there are no significant uncertain tax positions in the Funds that would require recognition in the financial statements. However, management’s conclusion may be subject to review and adjustment at a later date based on factors including, but not limited to, new tax laws, regulations, and administrative interpretations (including relevant court decisions). Generally, the Funds’ federal tax returns for the prior three fiscal years remain subject to examination by the Internal Revenue Service.
Note 5. Portfolio information
For the year ended March 31, 2023, the cost of purchases and proceeds from sales of securities, excluding short-term investments and derivatives, if any, for each Fund aggregated to:
| | Purchases
($) | Proceeds
from sales
($) |
| Columbia Adaptive Retirement 2020 Fund | 303,014 | 209,560 |
| Columbia Adaptive Retirement 2025 Fund | 213,331 | 110,422 |
| Columbia Adaptive Retirement 2030 Fund | 616,280 | 331,690 |
| Columbia Adaptive Retirement 2035 Fund | 979,937 | 210,841 |
| Columbia Adaptive Retirement 2040 Fund | 454,212 | 171,486 |
| Columbia Adaptive Retirement 2045 Fund | 450,274 | 142,395 |
| Columbia Adaptive Retirement 2050 Fund | 541,357 | 174,538 |
| Columbia Adaptive Retirement 2055 Fund | 461,657 | 190,579 |
| Columbia Adaptive Retirement 2060 Fund | 660,159 | 177,174 |
The amount of purchase and sale activity impacts the portfolio turnover rate reported in the Financial Highlights.
Note 6. Affiliated money market fund
Each Fund may invest in Columbia Short-Term Cash Fund, an affiliated money market fund established for the exclusive use by each Fund and other affiliated funds (the Affiliated MMF). The income earned by the Funds from such investments is included as Dividends - affiliated issuers in the Statement of Operations. As an investing fund, each Fund indirectly bears its proportionate share of the expenses of the Affiliated MMF. The Affiliated MMF prices its shares with a floating net asset value. In addition, the Board of Trustees of the Affiliated MMF may impose a fee on redemptions (sometimes referred to as a liquidity fee) or temporarily suspend redemptions (sometimes referred to as imposing a redemption gate) in the event its liquidity falls below regulatory limits.
Columbia Adaptive Retirement Funds | Annual Report 2023
| 79 |
Notes to Financial Statements (continued)
March 31, 2023
Note 7. Interfund lending
Pursuant to an exemptive order granted by the Securities and Exchange Commission, each Fund participates in a program (the Interfund Program) allowing each participating Columbia Fund (each, a Participating Fund) to lend money directly to and, except for closed-end funds and money market funds, borrow money directly from other Participating Funds for temporary purposes. The amounts eligible for borrowing and lending under the Interfund Program are subject to certain restrictions.
Interfund loans are subject to the risk that the borrowing fund could be unable to repay the loan when due, and a delay in repayment to the lending fund could result in lost opportunities and/or additional lending costs. The exemptive order is subject to conditions intended to mitigate conflicts of interest arising from the Investment Manager’s relationship with each Participating Fund.
The Funds did not borrow or lend money under the Interfund Program during the year ended March 31, 2023.
Note 8. Line of credit
Each Fund has access to a revolving credit facility with a syndicate of banks led by JPMorgan Chase Bank, N.A., Citibank, N.A. and Wells Fargo Bank, N.A. whereby the Fund may borrow for the temporary funding of shareholder redemptions or for other temporary or emergency purposes. Pursuant to an October 27, 2022 amendment and restatement, the credit facility, which is an agreement between the Fund and certain other funds managed by the Investment Manager or an affiliated investment manager, severally and not jointly, permits aggregate borrowings up to $950 million. Interest is currently charged to each participating fund based on its borrowings at a rate equal to the higher of (i) the federal funds effective rate, (ii) the secured overnight financing rate plus 0.10% and (iii) the overnight bank funding rate, plus in each case, 1.00%. Each borrowing under the credit facility matures no later than 60 days after the date of borrowing. The Fund also pays a commitment fee equal to its pro rata share of the unused amount of the credit facility at a rate of 0.15% per annum. The commitment fee is included in other expenses in the Statement of Operations. This agreement expires annually in October unless extended or renewed. Prior to the October 27, 2022 amendment and restatement, the Fund had access to a revolving credit facility with a syndicate of banks led by JPMorgan Chase Bank, N.A., Citibank, N.A. and Wells Fargo Bank, N.A. which permitted collective borrowings up to $950 million. Interest was charged to each participating fund based on its borrowings at a rate equal to the higher of (i) the federal funds effective rate, (ii) the secured overnight financing rate plus 0.11448% and (iii) the overnight bank funding rate, plus in each case, 1.00%.
No Fund had borrowings during the year ended March 31, 2023.
Note 9. Significant risks
Alternative strategies investment and multi-asset/tactical strategies risk
An investment in alternative investment strategies and multi-asset/tactical strategies (the Strategies) involves risks, which may be significant. The Strategies may include strategies, instruments or other assets, such as derivatives, that seek investment returns uncorrelated with the broad equity and fixed income/debt markets, as well as those providing exposure to other markets (such as commodity markets), including but not limited to absolute (positive) return strategies. The Strategies may fail to achieve their desired performance, market or other exposure, or their returns (or lack thereof) may be more correlated with the broad equity and/or fixed income/debt markets than was anticipated, and the Funds may lose money.
Market risk
The Funds may incur losses due to declines in the value of one or more securities in which they invest. These declines may be due to factors affecting a particular issuer, or the result of, among other things, political, regulatory, market, economic or social developments affecting the relevant market(s) more generally. In addition, turbulence in financial markets and reduced liquidity in equity, credit and/or fixed income markets may negatively affect many issuers, which could adversely affect the Funds’ ability to price or value hard-to-value assets in thinly traded and closed markets and could cause significant redemptions and operational challenges. Global economies and financial markets are increasingly interconnected, and conditions and events in one country, region or financial market may adversely impact issuers in a different country, region or financial market. These risks may be magnified if certain events or developments adversely interrupt the global supply chain; in these and other circumstances, such risks might affect companies worldwide. As a result, local, regional or global events
| 80 | Columbia Adaptive Retirement Funds | Annual Report 2023 |
Notes to Financial Statements (continued)
March 31, 2023
such as terrorism, war, natural disasters, disease/virus outbreaks and epidemics or other public health issues, recessions, depressions or other events – or the potential for such events – could have a significant negative impact on global economic and market conditions.
The large-scale invasion of Ukraine by Russia in February 2022 has resulted in sanctions and market disruptions, including declines in regional and global stock markets, unusual volatility in global commodity markets and significant devaluations of Russian currency. The extent and duration of the military action are impossible to predict but could be significant. Market disruption caused by the Russian military action, and any counter-measures or responses thereto (including international sanctions, a downgrade in a country’s credit rating, purchasing and financing restrictions, boycotts, tariffs, changes in consumer or purchaser preferences, cyberattacks and espionage) could have severe adverse impacts on regional and/or global securities and commodities markets, including markets for oil and natural gas. These impacts may include reduced market liquidity, distress in credit markets, further disruption of global supply chains, increased risk of inflation, and limited access to investments in certain international markets and/or issuers. These developments and other related events could negatively impact Fund performance.
Shareholder concentration risk
At March 31, 2023, certain shareholder accounts owned more than 10% of the outstanding shares of one or more of the Funds. For unaffiliated shareholder accounts, the Funds have no knowledge about whether any portion of those shares were owned beneficially. Subscription and redemption activity of these accounts may have a significant effect on the operations of the Funds. In the case of a large redemption, the Fund may be forced to sell investments at inopportune times, including its liquid positions, which may result in Fund losses and the Fund holding a higher percentage of less liquid positions. Large redemptions could result in decreased economies of scale and increased operating expenses for non-redeeming Fund shareholders.
The number of accounts and aggregate percentages of shares outstanding held therein were as follows:
| Fund | Number of
unaffiliated
accounts | Percentage of
shares
outstanding
held —
unaffiliated (%) | Percentage of
shares
outstanding
held —
affiliated (%) |
| Columbia Adaptive Retirement 2020 Fund | 1 | 48.5 | 40.6 |
| Columbia Adaptive Retirement 2025 Fund | 1 | 11.8 | 78.2 |
| Columbia Adaptive Retirement 2030 Fund | 2 | 92.0 | — |
| Columbia Adaptive Retirement 2035 Fund | 3 | 74.3 | 24.8 |
| Columbia Adaptive Retirement 2040 Fund | 2 | 61.8 | 33.0 |
| Columbia Adaptive Retirement 2045 Fund | 2 | 61.2 | 38.2 |
| Columbia Adaptive Retirement 2050 Fund | 1 | 71.3 | 27.7 |
| Columbia Adaptive Retirement 2055 Fund | 1 | 64.5 | 27.5 |
| Columbia Adaptive Retirement 2060 Fund | 2 | 66.3 | 33.2 |
Note 10. Subsequent events
Management has evaluated the events and transactions that have occurred through the date the financial statements were issued. Other than as noted in Note 3 above, and below, there were no items requiring adjustment of the financial statements or additional disclosure.
Following the period end, shareholders of Columbia Adaptive Retirement 2035 Fund redeemed $595,554, which represented approximately 29.5% of the Fund’s net assets as of March 31, 2023.
Note 11. Information regarding pending and settled legal proceedings
Ameriprise Financial and certain of its affiliates are involved in the normal course of business in legal proceedings which include regulatory inquiries, arbitration and litigation, including class actions concerning matters arising in connection with the conduct of their activities as part of a diversified financial services firm. Ameriprise Financial believes that the Funds are
Columbia Adaptive Retirement Funds | Annual Report 2023
| 81 |
Notes to Financial Statements (continued)
March 31, 2023
not currently the subject of, and that neither Ameriprise Financial nor any of its affiliates are the subject of, any pending legal, arbitration or regulatory proceedings that are likely to have a material adverse effect on the Funds or the ability of Ameriprise Financial or its affiliates to perform under their contracts with the Funds. Ameriprise Financial is required to make quarterly (10-Q), annual (10-K) and, as necessary, 8-K filings with the Securities and Exchange Commission (SEC) on legal and regulatory matters that relate to Ameriprise Financial and its affiliates. Copies of these filings may be obtained by accessing the SEC website at www.sec.gov.
There can be no assurance that these matters, or the adverse publicity associated with them, will not result in increased Fund redemptions, reduced sale of Fund shares or other adverse consequences to the Funds. Further, although we believe proceedings are not likely to have a material adverse effect on the Funds or the ability of Ameriprise Financial or its affiliates to perform under their contracts with the Funds, these proceedings are subject to uncertainties and, as such, we are unable to estimate the possible loss or range of loss that may result. An adverse outcome in one or more of these proceedings could result in adverse judgments, settlements, fines, penalties or other relief that could have a material adverse effect on the consolidated financial condition or results of operations of Ameriprise Financial or one or more of its affiliates that provides services to the Funds.
| 82 | Columbia Adaptive Retirement Funds | Annual Report 2023 |
Report of Independent Registered Public Accounting Firm
To the Board of Trustees of Columbia Funds Series Trust I and Shareholders of Columbia Adaptive Retirement 2020 Fund, Columbia Adaptive Retirement 2025 Fund, Columbia Adaptive Retirement 2030 Fund, Columbia Adaptive Retirement 2035 Fund, Columbia Adaptive Retirement 2040 Fund, Columbia Adaptive Retirement 2045 Fund, Columbia Adaptive Retirement 2050 Fund, Columbia Adaptive Retirement 2055 Fund, and Columbia Adaptive Retirement 2060 Fund
Opinions on the Financial Statements
We have audited the accompanying statements of assets and liabilities, including the portfolios of investments, of Columbia Adaptive Retirement 2020 Fund, Columbia Adaptive Retirement 2025 Fund, Columbia Adaptive Retirement 2030 Fund, Columbia Adaptive Retirement 2035 Fund, Columbia Adaptive Retirement 2040 Fund, Columbia Adaptive Retirement 2045 Fund, Columbia Adaptive Retirement 2050 Fund, Columbia Adaptive Retirement 2055 Fund, and Columbia Adaptive Retirement 2060 Fund (nine of the funds constituting Columbia Funds Series Trust I, hereafter collectively referred to as the "Funds") as of March 31, 2023, the related statements of operations for the year ended March 31, 2023, the statements of changes in net assets for each of the two years in the period ended March 31, 2023, including the related notes, and the financial highlights for each of the periods indicated therein (collectively referred to as the “financial statements”). In our opinion, the financial statements present fairly, in all material respects, the financial position of each of the Funds as of March 31, 2023, the results of each of their operations for the year then ended, the changes in each of their net assets for each of the two years in the period ended March 31, 2023 and each of the financial highlights for each of the periods indicated therein in conformity with accounting principles generally accepted in the United States of America.
Basis for Opinions
These financial statements are the responsibility of the Funds’ management. Our responsibility is to express an opinion on the Funds’ financial statements based on our audits. We are a public accounting firm registered with the Public Company Accounting Oversight Board (United States) (PCAOB) and are required to be independent with respect to the Funds in accordance with the U.S. federal securities laws and the applicable rules and regulations of the Securities and Exchange Commission and the PCAOB.
We conducted our audits of these financial statements in accordance with the standards of the PCAOB. Those standards require that we plan and perform the audit to obtain reasonable assurance about whether the financial statements are free of material misstatement, whether due to error or fraud.
Our audits included performing procedures to assess the risks of material misstatement of the financial statements, whether due to error or fraud, and performing procedures that respond to those risks. Such procedures included examining, on a test basis, evidence regarding the amounts and disclosures in the financial statements. Our audits also included evaluating the accounting principles used and significant estimates made by management, as well as evaluating the overall presentation of the financial statements. Our procedures included confirmation of securities owned as of March 31, 2023 by correspondence with the custodian, transfer agent and broker. We believe that our audits provide a reasonable basis for our opinions.
/s/PricewaterhouseCoopers LLP
Minneapolis, Minnesota
May 23, 2023
We have served as the auditor of one or more investment companies within the Columbia Funds Complex since 1977.
Columbia Adaptive Retirement Funds | Annual Report 2023
| 83 |
TRUSTEES AND OFFICERS
(Unaudited)
The Board oversees the Funds’ operations and appoints officers who are responsible for day-to-day business decisions based on policies set by the Board. The following table provides basic biographical information about the Funds’ Trustees as of the printing of this report, including their principal occupations during the past five years, although specific titles for individuals may have varied over the period. The year set forth beneath Length of Service in the table below is the year in which the Trustee was first appointed or elected as Trustee to any Fund currently in the Columbia Funds Complex or a predecessor thereof. Under current Board policy, each Trustee generally serves until December 31 of the year such Trustee turns seventy-five (75).
Independent trustees
Name,
address,
year of birth | Position held
with the Columbia Funds and
length of service | Principal occupation(s)
during past five years
and other relevant
professional experience | Number of
Funds in the
Columbia Funds
Complex*
overseen | Other directorships
held by Trustee
during the past five years
and other relevant Board experience |
George S. Batejan
c/o Columbia Management
Investment Advisers, LLC
290 Congress Street
Boston, MA 02210
1954 | Trustee since 2017 | Executive Vice President, Global Head of Technology and Operations, Janus Capital Group, Inc., 2010-2016 | 177 | Former Chairman of the Board, NICSA (National Investment Company Services Association) (Executive Committee, Nominating Committee and Governance Committee), 2014-2016; former Director, Intech Investment Management, 2011-2016; former Board Member, Metro Denver Chamber of Commerce, 2015-2016; former Advisory Board Member, University of Colorado Business School, 2015-2018; former Board Member, Chase Bank International, 1993-1994 |
Kathleen Blatz
c/o Columbia Management
Investment Advisers, LLC
290 Congress Street
Boston, MA 02210
1954 | Trustee since 2006 | Attorney, specializing in arbitration and mediation; Chief Justice, Minnesota Supreme Court, 1998-2006; Associate Justice, Minnesota Supreme Court, 1996-1998; Fourth Judicial District Court Judge, Hennepin County, 1994-1996; Attorney in private practice and public service, 1984-1993; State Representative, Minnesota House of Representatives, 1979-1993, which included service on the Tax and Financial Institutions and Insurance Committees; Member and Interim Chair, Minnesota Sports Facilities Authority, January-July 2017; Interim President and Chief Executive Officer, Blue Cross and Blue Shield of Minnesota (health care insurance), February-July 2018, April-October 2021 | 177 | Former Trustee, Blue Cross and Blue Shield of Minnesota, 2009-2021 (Chair of the Business Development Committee, 2014-2017; Chair of the Governance Committee, 2017-2019); former Member and Chair of the Board, Minnesota Sports Facilities Authority, January 2017-July 2017; former Director, Robina Foundation, 2009-2020 (Chair, 2014-2020); Director, Richard M. Schulze Family Foundation, since 2021 |
| 84 | Columbia Adaptive Retirement Funds | Annual Report 2023 |
TRUSTEES AND OFFICERS (continued)
(Unaudited)
Independent trustees (continued)
Name,
address,
year of birth | Position held
with the Columbia Funds and
length of service | Principal occupation(s)
during past five years
and other relevant
professional experience | Number of
Funds in the
Columbia Funds
Complex*
overseen | Other directorships
held by Trustee
during the past five years
and other relevant Board experience |
Pamela G. Carlton
c/o Columbia Management
Investment Advisers, LLC
290 Congress Street
Boston, MA 02210
1954 | Chair since 2023; Trustee since 2007 | President, Springboard — Partners in Cross Cultural Leadership (consulting company), since 2003; Managing Director of US Equity Research, JP Morgan Chase, 1999-2003; Director of US Equity Research, Chase Asset Management, 1996-1999; Co-Director Latin America Research, 1993-1996, COO Global Research, 1992-1996, Co-Director of US Research, 1991-1992, Investment Banker, 1982-1991, Morgan Stanley; Attorney, Cleary Gottlieb Steen & Hamilton LLP, 1980-1982 | 177 | Trustee, New York Presbyterian Hospital Board, since 1996; Director, DR Bank (Audit Committee) since 2017; Director, Evercore Inc. (Audit Committee, Nominating and Governance Committee), since 2019; Director, Apollo Commercial Real Estate Finance, Inc. (Chair, Nominating and Governance Committee) (financial services), since 2021; the Governing Council of the Independent Directors Council (IDC), since 2021 |
Janet Langford Carrig
c/o Columbia Management
Investment Advisers, LLC
290 Congress Street
Boston, MA 02210
1957 | Trustee since 1996 | Senior Vice President, General Counsel and Corporate Secretary, ConocoPhillips (independent energy company), September 2007-October 2018 | 175 | Director, EQT Corporation (natural gas producer), since 2019; former Director, Whiting Petroleum Corporation (independent oil and gas company), 2020-2022 |
J. Kevin Connaughton
c/o Columbia Management
Investment Advisers, LLC
290 Congress Street
Boston, MA 02210
1964 | Trustee since 2020 | CEO and President, RhodeWay Financial (non-profit financial planning firm), since December 2022; Member, FINRA National Adjudicatory Council, since January 2020; Adjunct Professor of Finance, Bentley University since January 2018; Consultant to Independent Trustees of CFVIT and CFST I from March 2016 to June 2020 with respect to CFVIT and to December 2020 with respect to CFST I; Managing Director and General Manager of Mutual Fund Products, Columbia Management Investment Advisers, LLC, May 2010-February 2015; President, Columbia Funds, 2008-2015; and senior officer of Columbia Funds and affiliated funds, 2003-2015 | 175 | Former Director, The Autism Project, March 2015-December 2021; former Member of the Investment Committee, St. Michael’s College, November 2015-February 2020; former Trustee, St. Michael’s College, June 2017-September 2019; former Trustee, New Century Portfolios (former mutual fund complex), January 2015-December 2017 |
Olive M. Darragh
c/o Columbia Management
Investment Advisers, LLC
290 Congress Street
Boston, MA 02210
1962 | Trustee since 2020 | Managing Director of Darragh Inc. (strategy and talent management consulting firm), since 2010; Founder and CEO, Zolio, Inc. (investment management talent identification platform), since 2004; Consultant to Independent Trustees of CFVIT and CFST I from June 2019 to June 2020 with respect to CFVIT and to December 2020 with respect to CFST I; Partner, Tudor Investments, 2004-2010; Senior Partner, McKinsey & Company (consulting), 1990-2004; Touche Ross CPA, 1985-1988 | 175 | Treasurer, Edinburgh University US Trust Board, since January 2023; Member, HBS Community Action Partners Board, since September 2022; former Director, University of Edinburgh Business School (Member of US Board), 2004-2019; former Director, Boston Public Library Foundation, 2008-2017 |
Columbia Adaptive Retirement Funds | Annual Report 2023
| 85 |
TRUSTEES AND OFFICERS (continued)
(Unaudited)
Independent trustees (continued)
Name,
address,
year of birth | Position held
with the Columbia Funds and
length of service | Principal occupation(s)
during past five years
and other relevant
professional experience | Number of
Funds in the
Columbia Funds
Complex*
overseen | Other directorships
held by Trustee
during the past five years
and other relevant Board experience |
Patricia M. Flynn
c/o Columbia Management
Investment Advisers, LLC
290 Congress Street
Boston, MA 02210
1950 | Trustee since 2004 | Professor of Economics and Management, Bentley University, since 2002; Dean, McCallum Graduate School of Business, Bentley University, 1992-2002 | 177 | Former Trustee, MA Taxpayers Foundation, 1997-2022; former Director, The MA Business Roundtable, 2003-2019; former Chairperson, Innovation Index Advisory Committee, MA Technology Collaborative, 1997-2020 |
Brian J. Gallagher
c/o Columbia Management
Investment Advisers, LLC
290 Congress Street
Boston, MA 02210
1954 | Trustee since 2017 | Retired; Partner with Deloitte & Touche LLP and its predecessors, 1977-2016 | 177 | Trustee, Catholic Schools Foundation, since 2004 |
Douglas A. Hacker
c/o Columbia Management
Investment Advisers, LLC
290 Congress Street
Boston, MA 02210
1955 | Trustee since 1996 | Independent business executive, since May 2006; Executive Vice President – Strategy of United Airlines, December 2002 - May 2006; President of UAL Loyalty Services (airline marketing company), September 2001-December 2002; Executive Vice President and Chief Financial Officer of United Airlines, July 1999-September 2001 | 177 | Director, SpartanNash Company (Chair of the Board) (food distributor), since May 2021; Director, Aircastle Limited (Chair of Audit Committee) (aircraft leasing), since August 2006; former Director, Nash Finch Company (food distributor), 2005-2013; former Director, SeaCube Container Leasing Ltd. (container leasing), 2010-2013; and former Director, Travelport Worldwide Limited (travel information technology), 2014-2019 |
Nancy T. Lukitsh
c/o Columbia Management
Investment Advisers, LLC
290 Congress Street
Boston, MA 02210
1956 | Trustee since 2011 | Senior Vice President, Partner and Director of Marketing, Wellington Management Company, LLP (investment adviser), 1997-2010; Chair, Wellington Management Portfolios (commingled non-U.S. investment pools), 2007-2010; Director, Wellington Trust Company, NA and other Wellington affiliates, 1997-2010 | 175 | None |
| 86 | Columbia Adaptive Retirement Funds | Annual Report 2023 |
TRUSTEES AND OFFICERS (continued)
(Unaudited)
Independent trustees (continued)
Name,
address,
year of birth | Position held
with the Columbia Funds and
length of service | Principal occupation(s)
during past five years
and other relevant
professional experience | Number of
Funds in the
Columbia Funds
Complex*
overseen | Other directorships
held by Trustee
during the past five years
and other relevant Board experience |
David M. Moffett
c/o Columbia Management
Investment Advisers, LLC
290 Congress Street
Boston, MA 02210
1952 | Trustee since 2011 | Retired; former Chief Executive Officer of Freddie Mac and Chief Financial Officer of U.S. Bank | 175 | Director, CSX Corporation (transportation suppliers); Director, PayPal Holdings Inc. (payment and data processing services); Trustee, University of Oklahoma Foundation; former Director, eBay Inc. (online trading community), 2007-2015; and former Director, CIT Bank, CIT Group Inc. (commercial and consumer finance), 2010-2016; former Senior Adviser to The Carlyle Group (financial services), March 2008-September 2008; former Governance Consultant to Bridgewater Associates, January 2013-December 2015 |
Catherine James Paglia
c/o Columbia Management
Investment Advisers, LLC
290 Congress Street
Boston, MA 02210
1952 | Trustee since 2004 | Director, Enterprise Asset Management, Inc. (private real estate and asset management company), since September 1998; Managing Director and Partner, Interlaken Capital, Inc., 1989-1997; Vice President, 1982-1985, Principal, 1985-1987, Managing Director, 1987-1989, Morgan Stanley; Vice President, Investment Banking, 1980-1982, Associate, Investment Banking, 1976-1980, Dean Witter Reynolds, Inc. | 177 | Director, Valmont Industries, Inc. (irrigation systems manufacturer), since 2012; Trustee, Carleton College (on the Investment Committee), since 1987; Trustee, Carnegie Endowment for International Peace (on the Investment Committee), since 2009 |
Natalie A. Trunow
c/o Columbia Management
Investment Advisers, LLC
290 Congress Street
Boston, MA 02210
1967 | Trustee since 2020 | Chief Executive Officer, Millennial Portfolio Solutions LLC (asset management and consulting services), January 2016-January 2021; Non-executive Member of the Investment Committee and Valuation Committee, Sarona Asset Management Inc. (private equity firm) since September 2019; Advisor, Horizon Investments (asset management and consulting services), August 2018-January 2022; Advisor, Paradigm Asset Management, November 2016-January 2022; Consultant to Independent Trustees of CFVIT and CFST I from September 2016 to June 2020 with respect to CFVIT and to December 2020 with respect to CFST I; Director of Investments/Consultant, Casey Family Programs, April 2016-November 2016; Senior Vice President and Chief Investment Officer, Calvert Investments, August 2008-January 2016; Section Head and Portfolio Manager, General Motors Asset Management, June 1997-August 2008 | 175 | Independent Director, Investment Committee, Health Services for Children with Special Needs, Inc., 2010-2021; Independent Director, (Executive Committee and Chair, Audit Committee), Consumer Credit Counseling Services (formerly Guidewell Financial Solutions), since 2016; Independent Director, (Investment Committee), Sarona Asset Management, since 2019 |
Sandra L. Yeager
c/o Columbia Management
Investment Advisers, LLC
290 Congress Street
Boston, MA 02210
1964 | Trustee since 2017 | Retired; President and founder, Hanoverian Capital, LLC (SEC registered investment advisor firm), 2008-2016; Managing Director, DuPont Capital, 2006-2008; Managing Director, Morgan Stanley Investment Management, 2004-2006; Senior Vice President, Alliance Bernstein, 1990-2004 | 177 | Former Director, NAPE (National Alliance for Partnerships in Equity) Education Foundation, October 2016-October 2020; Advisory Board, Jennersville YMCA, since 2022 |
Columbia Adaptive Retirement Funds | Annual Report 2023
| 87 |
TRUSTEES AND OFFICERS (continued)
(Unaudited)
Interested trustee affiliated with Investment Manager**
Name,
address,
year of birth | Position held with the Columbia Funds and length of service | Principal occupation(s) during the
past five years and other relevant
professional experience | Number of
Funds in the
Columbia Funds
Complex overseen | Other directorships
held by Trustee
during the past
five years and
other relevant Board experience |
Daniel J. Beckman
c/o Columbia Management
Investment Advisers, LLC
290 Congress Street
Boston, MA 02210
1962 | Trustee since November 2021 and President since June 2021 | Vice President – Head of North America Product, Columbia Management Investment Advisers, LLC, since April 2015; President and Principal Executive Officer of the Columbia Funds, since June 2021; officer of Columbia Funds and affiliated funds, 2020-2021 | 177 | Director, Ameriprise Trust Company, since October 2016; Director, Columbia Management Investment Distributors, Inc. since November 2018; Board of Governors, Columbia Wanger Asset Management, LLC since, January 2022; Director, Columbia Threadneedle Canada, Inc., since December 2022 |
| * | The term “Columbia Funds Complex” as used herein includes Columbia Seligman Premium Technology Growth Fund, Tri-Continental Corporation and each series of Columbia Funds Series Trust (CFST), Columbia Funds Series Trust I (CFST I), Columbia Funds Series Trust II (CFST II), Columbia ETF Trust I (CET I), Columbia ETF Trust II (CET II), Columbia Funds Variable Insurance Trust (CFVIT) and Columbia Funds Variable Series Trust II (CFVST II).Messrs. Batejan, Beckman, Gallagher and Hacker and Mses. Blatz, Carlton, Carrig, Flynn, Paglia and Yeager serve as Directors of Columbia Seligman Premium Technology Growth Fund and Tri-Continental Corporation. |
| ** | Interested person (as defined under the 1940 Act) by reason of being an officer, director, security holder and/or employee of the Investment Manager or Ameriprise Financial. |
The Statement of Additional Information has additional information about the Funds’ Board members and is available, without charge, upon request by calling 800.345.6611, visiting columbiathreadneedleus.com/investor/ or contacting your financial intermediary.
The Board has appointed officers who are responsible for day-to-day business decisions based on policies it has established. The officers serve at the pleasure of the Board. The following table provides basic information about the Officers of the Trusts as of the printing of this report, including principal occupations during the past five years, although their specific titles may have varied over the period. In addition to Mr. Beckman, who is the President and Principal Executive Officer, the Funds’ other officers are:
Fund officers
Name,
address and
year of birth | Position and year
first appointed to
position for any Fund
in the Columbia
Funds Complex or a
predecessor thereof | Principal occupation(s) during past five years |
Michael G. Clarke
290 Congress Street
Boston, MA 02210
1969 | Chief Financial Officer and Principal Financial Officer (2009) and Senior Vice President (2019) | Senior Vice President and Head of Global Operations & Investor Services, Columbia Management Investment Advisers, LLC, since March 2022 (previously Vice President, Head of North American Operations, and Co-Head of Global Operations, June 2019 to February 2022 and Vice President – Accounting and Tax, May 2010 - May 2019); senior officer of Columbia Funds and affiliated funds, since 2002. |
Joseph Beranek
5890 Ameriprise Financial Center
Minneapolis, MN 55474
1965 | Treasurer and Chief Accounting Officer (Principal Accounting Officer) (2019) and Principal Financial Officer (2020), CFST, CFST I, CFST II, CFVIT and CFVST II; Assistant Treasurer, CET I and CET II | Vice President – Mutual Fund Accounting and Financial Reporting, Columbia Management Investment Advisers, LLC, since December 2018 and March 2017, respectively. |
| 88 | Columbia Adaptive Retirement Funds | Annual Report 2023 |
TRUSTEES AND OFFICERS (continued)
(Unaudited)
Fund officers (continued)
Name,
address and
year of birth | Position and year
first appointed to
position for any Fund
in the Columbia
Funds Complex or a
predecessor thereof | Principal occupation(s) during past five years |
Marybeth Pilat
290 Congress Street
Boston, MA 02210
1968 | Treasurer and Chief Accounting Officer (Principal Accounting Officer) and Principal Financial Officer (2020) for CET I and CET II; Assistant Treasurer, CFST, CFST I, CFST II, CFVIT and CFVST II | Vice President – Product Pricing and Administration, Columbia Management Investment Advisers, LLC, since May 2017. |
William F. Truscott
290 Congress Street
Boston, MA 02210
1960 | Senior Vice President (2001) | Formerly, Trustee/Director of Columbia Funds Complex or legacy funds, November 2001-January 1, 2021; Chief Executive Officer, Global Asset Management, Ameriprise Financial, Inc., since September 2012; Chairman of the Board and President, Columbia Management Investment Advisers, LLC, since July 2004 and February 2012, respectively; Chairman of the Board and Chief Executive Officer, Columbia Management Investment Distributors, Inc., since November 2008 and February 2012, respectively; Chairman of the Board and Director, Threadneedle Asset Management Holdings, Sàrl, since March 2013 and December 2008, respectively; senior executive of various entities affiliated with Columbia Threadneedle. |
Christopher O. Petersen
5228 Ameriprise Financial Center
Minneapolis, MN 55474
1970 | Senior Vice President and Assistant Secretary (2021) | Formerly, Trustee/Director of funds within the Columbia Funds Complex, July 1, 2020 - November 22, 2021; Senior Vice President and Assistant General Counsel, Ameriprise Financial, Inc., since September 2021 (previously Vice President and Lead Chief Counsel, January 2015 - September 2021); formerly, President and Principal Executive Officer of the Columbia Funds, 2015 - 2021; officer of Columbia Funds and affiliated funds, since 2007. |
Thomas P. McGuire
290 Congress Street
Boston, MA 02210
1972 | Senior Vice President and Chief Compliance Officer (2012) | Vice President – Asset Management Compliance, Ameriprise Financial, Inc., since May 2010; Chief Compliance Officer, Columbia Acorn/Wanger Funds, since December 2015; formerly, Chief Compliance Officer, Ameriprise Certificate Company, September 2010 – September 2020. |
Ryan C. Larrenaga
290 Congress Street
Boston, MA 02210
1970 | Senior Vice President (2017), Chief Legal Officer (2017), and Secretary (2015) | Vice President and Chief Counsel, Ameriprise Financial, Inc., since August 2018 (previously Vice President and Group Counsel, August 2011 - August 2018); Chief Legal Officer, Columbia Acorn/Wanger Funds, since September 2020; officer of Columbia Funds and affiliated funds, since 2005. |
Michael E. DeFao
290 Congress Street
Boston, MA 02210
1968 | Vice President (2011) and Assistant Secretary (2010) | Vice President and Chief Counsel, Ameriprise Financial, Inc., since May 2010; Vice President, Chief Legal Officer and Assistant Secretary, Columbia Management Investment Advisers, LLC, since October 2021 (previously Vice President and Assistant Secretary, May 2010 – September 2021). |
Lyn Kephart-Strong
5228 Ameriprise Financial Center
Minneapolis, MN 55474
1960 | Vice President (2015) | Vice President, Global Investment Operations Services, Columbia Management Investment Advisers, LLC, since 2010; President, Columbia Management Investment Services Corp., since October 2014; President, Ameriprise Trust Company, since January 2017. |
Columbia Adaptive Retirement Funds | Annual Report 2023
| 89 |
Liquidity Risk Management Program
(Unaudited)
Pursuant to Rule 22e-4 under the 1940 Act, each Fund has adopted a liquidity risk management program (Program). The Program’s principal objectives include assessing, managing and periodically reviewing each Fund’s liquidity risk. Liquidity risk is defined as the risk that the Fund could not meet redemption requests without significant dilution of remaining investors’ interests in the Fund.
The Board has appointed the Investment Manager as the program administrator for the Funds’ Program. The Investment Manager has delegated oversight of the Program to its Liquidity Risk Management Committee (the Committee). At a board meeting during the fiscal period, the Committee provided the Board with a report addressing the operations of the program and assessing its adequacy and effectiveness of implementation for the period January 1, 2021, through December 31, 2021, including:
| • | each Fund had sufficient liquidity to both meet redemptions and operate effectively on behalf of shareholders; |
| • | there were no material changes to the Program during the period; |
| • | the implementation of the Program was effective to manage each Fund’s liquidity risk; and |
| • | the Program operated adequately during the period. |
There can be no assurance that the Program will achieve its objectives in the future. Please refer to each Fund’s prospectus for more information regarding the Fund’s exposure to liquidity risk and other principal risks to which an investment in each Fund may be subject.
| 90 | Columbia Adaptive Retirement Funds | Annual Report 2023 |
Approval of Management Agreement Amendment
(Unaudited)
Columbia Management Investment Advisers, LLC (the Investment Manager, and together with its domestic and global affiliates, Columbia Threadneedle Investments), a wholly-owned subsidiary of Ameriprise Financial, Inc. (Ameriprise Financial), serves as the investment manager to Columbia Adaptive Retirement 2020 Fund, Columbia Adaptive Retirement 2025 Fund, Columbia Adaptive Retirement 2030 Fund, Columbia Adaptive Retirement 2035 Fund, Columbia Adaptive Retirement 2040 Fund, Columbia Adaptive Retirement 2045 Fund, Columbia Adaptive Retirement 2050 Fund, Columbia Adaptive Retirement 2055 Fund, and Columbia Adaptive Retirement 2060 Fund (the Funds). Under a management agreement (the Management Agreement), the Investment Manager provides investment advice and other services to the Funds and other funds distributed by Columbia Management Investment Distributors, Inc. (collectively, the Columbia Funds).
On March 10, 2023, the Funds’ Board of Trustees (the Board) and the Funds’ Trustees who are not “interested persons” of the Funds, as defined in the Investment Company Act of 1940 (the 1940 Act) (the Independent Trustees), unanimously approved the amendment to the Management Agreement with the Investment Manager with respect to each of the Funds. As detailed below, the Board’s Contracts Committee (the Committee) and the Board held meetings to review and discuss, among themselves and with the management team of the Investment Manager, materials provided by the Investment Manager before determining to approve the proposed changes to the fee structure payable by the Funds.
In connection with their deliberations regarding the proposed amendment to the Management Agreement, the Committee and the Board evaluated materials provided by the Investment Manager regarding the Funds and the Management Agreement and reviewed and discussed them with representatives of the Investment Manager at a Committee meeting held on March 9, 2023. The Board and its various committees considered matters bearing on the Management Agreement at other meetings throughout the year and meets regularly with senior management of the Investment Manager. Through the Board’s Investment Review Committee, Trustees also meet with selected portfolio managers of the Funds and with other investment personnel at various times throughout the year.
The Independent Trustees noted the discussion, which is described below under “General conclusions in connection with the Trustees’ previous approval of the continuance of the Funds’ existing advisory agreement,” relating to the renewal and approval of the Management Agreement for the Funds at the Contracts Committee and Board meetings in June 2022 (the June Meeting) and, in that connection, the discussion by independent legal counsel of the Board’s responsibilities pursuant to Sections 15(c) and 36(b) of the 1940 Act and the factors that should be considered in determining whether to approve or renew an investment management agreement. The Independent Trustees considered that they should apply these factors in considering the amendment to the Management Agreement. The Independent Trustees also considered that they should take into account the variety of written materials and oral presentations they received at their meetings in March 2022 as well as all of the information previously considered at the June Meeting regarding the proposed 15(c) renewal of the existing Funds’ advisory agreement. On March 9, 2023, the Contracts Committee recommended that the Board approve the amendment to the Management Agreement. On March 10, 2023, the Board, including the Independent Trustees, voting separately, unanimously approved the proposed amendment to the Management Agreement for each of the Funds.
The Trustees considered that the Proposal would bundle each Fund’s fees into a unified fee structure. The Board also considered the Investment Manager’s contractual agreement to cap the total Fund operating expenses borne by each Fund’s shareholders for so long as the Investment Manager manages the Fund (exclusive of the same fees and expenses that are excluded from the current expense cap but including any acquired fund fees and expenses that would otherwise be borne indirectly by Fund shareholders) to 0.55% and 0.30% of the Funds’ average daily net assets for the two share classes that each Fund offers, Class Advisor (Class Adv) and Class Institutional 3 (Class Inst3) shares, respectively.
The Committee and the Board considered all information that they, their legal counsel, and the Investment Manager believed reasonably necessary to evaluate and to determine whether to approve the proposed amendment to the Management Agreement and to recommend its approval by shareholders of the Funds. Among other things, the information and factors considered included the following:
| • | Information on the investment performance of each Fund relative to the performance of a group of mutual funds determined to be comparable to the Funds by an independent third-party data provider, Broadridge Financial Solutions, Inc. (Broadridge), as well as performance relative to benchmarks; |
| • | Information on the Funds’ management fees and total expenses, including information comparing each Fund’s expenses to those of a group of comparable mutual funds, as determined by Broadridge; |
Columbia Adaptive Retirement Funds | Annual Report 2023
| 91 |
Approval of Management Agreement Amendment (continued)
(Unaudited)
| • | The impact of the proposed changes in fee structures on the gross and net expense ratios of the Funds, and the willingness of the Investment Manager to contractually agree to limit total operating expenses for each Fund; |
| • | The terms of the Management Agreement, as proposed to be amended; |
| • | Descriptions of other agreements and arrangements with affiliates of the Investment Manager relating to the operations of the Funds, including agreements with respect to the provision of transfer agency services to the Funds; |
| • | Descriptions of various services performed by the Investment Manager under the Management Agreement, including portfolio management and portfolio trading practices; |
| • | Information regarding the resources of the Investment Manager, including information regarding senior management, portfolio managers and other personnel; |
| • | Information regarding the capabilities of the Investment Manager with respect to compliance monitoring services; and |
| • | The profitability to the Investment Manager and its affiliates from their relationships with the Funds, including current and projected profits to the Investment Manager, both under the current fee structure and the proposed fee structures of the Funds. |
Following an analysis and discussion of the foregoing, and the factors identified below, the Board, including all of the Independent Trustees, approved the proposed amendment to the Management Agreement for each Fund and recommended its approval by shareholders.
Nature, extent and quality of services provided under the Management Agreement
The Independent Trustees took into account various reports and presentations they had received detailing the services performed by the Investment Manager, as well as its history, expertise, resources and relative capabilities, and the qualifications of its personnel.
In connection with the Board’s evaluation of the overall package of services provided by the Investment Manager, the Trustees also considered the nature, quality and range of administrative services provided to the Funds by the Investment Manager.
In addition, the Board discussed the acceptability of the terms of the Management Agreement as proposed to be amended, noting that, other than with respect to the fees, no material changes were proposed from the form of agreement previously approved. It was also noted that there were no proposed changes in services to be provided to the Funds. In this regard, the Board also noted the wide array of legal and compliance services provided to the Funds under the Management Agreement.
After reviewing these and related factors (including investment performance as discussed below), the Board concluded, within the context of their overall conclusions, that the nature, extent and quality of the services provided to the Funds under the Management Agreement supported approval of the proposed amendment to the Management Agreement for each Fund.
Investment performance
In this connection, the Board reviewed the investment performance of the Funds. With respect to each of the Funds, the Board observed that performance was well within the range of that of its peers for certain periods.
The Board also considered the Investment Manager’s performance and reputation generally. After reviewing these and related factors, the Board concluded, within the context of their overall conclusions, that the performance of the Funds and the Investment Manager, in light of other considerations, supported approval of the proposed amendment to the Management Agreement for each Fund.
| 92 | Columbia Adaptive Retirement Funds | Annual Report 2023 |
Approval of Management Agreement Amendment (continued)
(Unaudited)
Comparative fees, costs of services provided and the profits realized by the Investment Manager and its affiliates from their relationships with the Funds
The Board reviewed comparative fees and the costs of services provided under the Management Agreement. The Board members considered information showing a comparison of the Funds’ expenses with median expenses paid by funds in their comparative peer universes, as well as data showing the Funds’ contribution to the Investment Manager’s profitability. The Trustees also reviewed, in detail, the various components of fees/expenses covered under the proposed unified fee structure, including the shareholder service component of the fee for the affected classes. The Trustees considered, in particular, that implementation of the amendment to the Management Agreement would result in lower total expenses for each class of shares of each Fund. They also considered that it was proposed that, given the higher proposed unified fee for Class Adv (reflective of the shareholder service component for that Class), that Class would vote separately on the proposed amendment.
The Board also took into account that each Fund’s total expense ratio (after considering the proposed amendment and the related expense caps/waivers) was below the peer universe’s median expense ratio.
After reviewing these and related factors, the Board concluded, within the context of their overall conclusions, that the levels of management fees and expenses of the Funds, in light of other considerations, supported approval of the proposed amendment to the Management Agreement for each Fund.
The Board also considered the profitability of the Investment Manager and its affiliates in connection with the Investment Manager providing management services to the Funds. With respect to the profitability of the Investment Manager and its affiliates, the Independent Trustees referred to information discussing the profitability to the Investment Manager and Ameriprise Financial from managing, operating and distributing the Columbia Funds. It was considered that implementation of the proposed amendment was projected to slightly reduce the profitability to the Investment Manager from the Funds. After reviewing these and related factors, the Board concluded, within the context of their overall conclusions, that the costs of services provided and the profitability to the Investment Manager and its affiliates from their relationships with the Funds supported approval of the proposed amendment to the Management Agreement for each Fund.
Economies of Scale
The Board considered the economies of scale that might be realized as the Funds’ net asset level grows. The Board took into account, however, that the proposed amendments to the Management Agreement would obligate Columbia Threadneedle to provide, or pay for the provision of, a greater range of services to the Funds irrespective of the asset level of each Fund. The Board observed that the proposed amendment to the Management Agreement provides for a relatively low flat fee.
Conclusion
The Board reviewed all of the above considerations in reaching its decision to approve the proposed amendment to the Management Agreement for each Fund. In reaching its conclusions, no single factor was determinative.
On March 10, 2023, the Board, including all of the Independent Trustees, determined, with respect to each Fund, that the proposed fees payable under the Management Agreement were fair and reasonable in light of the extent and quality of services provided and approved the proposed amendment to the Management Agreement.
General conclusions in connection with the Trustees’ previous approval of the continuance of the Funds’ existing advisory agreement
On an annual basis, the Board, including the Independent Trustees, considers renewal of the Management Agreement. The Investment Manager prepared detailed reports for the Board and its Contracts Committee (including its Contracts Subcommittee) in November 2021 and March, April and June 2022, including reports providing the results of analyses performed by an independent third-party data provider, Broadridge, and comprehensive responses to written requests for information by independent legal counsels to the Independent Trustees (Independent Legal Counsel) to the Investment Manager, to assist the Board in making this determination. In addition, throughout the year, the Board (or its committees or subcommittees) regularly meets with portfolio management teams and senior management personnel and reviews
Columbia Adaptive Retirement Funds | Annual Report 2023
| 93 |
Approval of Management Agreement Amendment (continued)
(Unaudited)
information prepared by the Investment Manager addressing the services the Investment Manager provides and Fund performance. The Board also accords appropriate weight to the work, deliberations and conclusions of the various committees, such as the Contracts Committee, the Investment Review Committee, the Audit Committee and the Compliance Committee in determining whether to continue the Management Agreement.
The Board, at its June 23, 2022 Board meeting, considered the renewal of the Management Agreement for an additional one-year term. At the June Meeting, Independent Legal Counsel reviewed with the Independent Trustees various factors relevant to the Board’s consideration of advisory agreements and the Board’s legal responsibilities related to such consideration. The Independent Trustees considered all information that they, their legal counsel or the Investment Manager believed reasonably necessary to evaluate and to approve the continuation of the Management Agreement. Among other things, the information and factors considered included the following:
| • | Information on the investment performance of the Funds relative to the performance of a group of mutual funds determined to be comparable to the Funds by Broadridge, as well as performance relative to benchmarks; |
| • | Information on the Funds’ management fees and total expenses, including information comparing the Funds’ expenses to those of a group of comparable mutual funds, as determined by Broadridge; |
| • | The Investment Manager’s agreement to contractually limit or cap total operating expenses for the Funds so that total operating expenses (excluding certain fees and expenses, such as transaction costs and certain other investment related expenses, interest, taxes and infrequent and/or unusual expenses) would not exceed a specified annual rate, as a percentage of the Funds’ net assets; |
| • | Terms of the Management Agreement; |
| • | Descriptions of other agreements and arrangements with affiliates of the Investment Manager relating to the operations of the Funds, including agreements with respect to the provision of transfer agency and shareholder services to the Funds; |
| • | Descriptions of various services performed by the Investment Manager under the Management Agreement, including portfolio management and portfolio trading practices; |
| • | Information regarding any recently negotiated management fees of similarly-managed portfolios of other institutional clients of the Investment Manager; |
| • | Information regarding the resources of the Investment Manager, including information regarding senior management, portfolio managers and other personnel; |
| • | Information regarding the capabilities of the Investment Manager with respect to compliance monitoring services; |
| • | The profitability to the Investment Manager and its affiliates from their relationships with the Funds; and |
| • | Report provided by the Board’s independent fee consultant, JDL Consultants, LLC (JDL). |
Following an analysis and discussion of the foregoing, and the factors identified below, the Board, including all of the Independent Trustees, approved the renewal of the Management Agreement for each Fund.
Nature, extent and quality of services provided by the Investment Manager
The Board analyzed various reports and presentations it had received detailing the services performed by the Investment Manager, as well as its history, expertise, resources and relative capabilities, and the qualifications of its personnel.
The Board specifically considered the many developments during recent years concerning the services provided by the Investment Manager. Among other things, the Board noted the organization and depth of the equity and credit research departments. The Board further observed the enhancements to the investment risk management department’s processes, systems and oversight, over the past several years, as well as planned 2022 initiatives in this regard. The Board also took into account the broad scope of services provided by the Investment Manager to the Funds, including, among other services,
| 94 | Columbia Adaptive Retirement Funds | Annual Report 2023 |
Approval of Management Agreement Amendment (continued)
(Unaudited)
investment, risk and compliance oversight. The Board also took into account the information it received concerning the Investment Manager’s ability to attract and retain key portfolio management personnel and that it has sufficient resources to provide competitive and adequate compensation to investment personnel. The Board also observed that the Investment Manager has been able to effectively manage, operate and distribute the Columbia Funds through the COVID-19 pandemic period with no disruptions in services provided. The Board also considered added personnel and resources obtained by Columbia Threadneedle through AmeripriseFinancial’s acquisition of BMO Financial Group’s Europe, Middle East, and Africa (EMEA) asset management business.
In connection with the Board’s evaluation of the overall package of services provided by the Investment Manager, the Board also considered the nature, quality and range of administrative services provided to the Funds by the Investment Manager, as well as the achievements in 2021 in the performance of administrative services, and noted the various enhancements anticipated for 2022. In evaluating the quality of services provided under the Management Agreement, the Board also took into account the organization and strength of the Funds’ and their service providers’ compliance programs. The Board also reviewed the financial condition of the Investment Manager and its affiliates and each entity’s ability to carry out its responsibilities under the Management Agreement and the Funds’ other service agreements.
In addition, the Board discussed the acceptability of the terms of the Management Agreement, noting that no changes were proposed from the form of agreement previously approved. The Board also noted the wide array of legal and compliance services provided to the Funds under the Management Agreement.
After reviewing these and related factors (including investment performance as discussed below), the Board concluded, within the context of their overall conclusions, that the nature, extent and quality of the services provided to the Funds under the Management Agreement supported the continuation of the Management Agreement for each Fund.
Investment performance
In this connection, the Board carefully reviewed the investment performance of the Funds, including detailed reports providing the results of analyses performed by each of the Investment Manager, Broadridge and JDL collectively showing, for various periods (including since manager inception): (i) the performance of the Funds, (ii) the performance of a benchmark index, (iii) the percentage ranking of the Funds among their comparison groups, (iv) the Funds’ performance relative to peers and benchmarks and (v) the net assets of the Funds. With respect to each of Columbia Adaptive Retirement 2050 Fund, Columbia Adaptive Retirement 2055 Fund and Columbia Adaptive Retirement 2060 Fund, the Board observed that the performance for certain periods ranked above median based on information provided by Broadridge. With respect to each of Columbia Adaptive Retirement 2020 Fund, Columbia Adaptive Retirement 2025 Fund, Columbia Adaptive Retirement 2030 Fund, Columbia Adaptive Retirement 2035 Fund and Columbia Adaptive Retirement 2040 Fund the Board observed the underperformance for certain periods, but noted the differentiated risk allocation process undertaken for these Funds compared to peers. With respect to Columbia Adaptive Retirement 2045 Fund, the Board observed that performance was well within the range of that of its peers.
The Board also reviewed a description of the third-party data provider’s methodology for identifying the Funds’ peer groups for purposes of performance and expense comparisons.
The Board also considered the Investment Manager’s performance and reputation generally. After reviewing these and related factors, the Board concluded, within the context of their overall conclusions, that the performance of the Funds and the Investment Manager, in light of other considerations, supported the continuation of the Management Agreement for each Fund.
Comparative fees, costs of services provided and the profits realized by the Investment Manager and its affiliates from their relationships with the Funds
The Board reviewed comparative fees and the costs of services provided under the Management Agreement. The Board members considered detailed comparative information set forth in an annual report on fees and expenses, including, among other things, data (based on analyses conducted by Broadridge and JDL) showing a comparison of the Funds’ expenses with median expenses paid by funds in their comparative peer universes, as well as data showing the Funds’ contribution to the Investment Manager’s profitability.
Columbia Adaptive Retirement Funds | Annual Report 2023
| 95 |
Approval of Management Agreement Amendment (continued)
(Unaudited)
The Board considered the reports of JDL, which assisted in the Board’s analysis of the Columbia Funds’ performance and expenses and the reasonableness of the Columbia Funds’ fee rates. The Board accorded particular weight to the notion that a primary objective of the level of fees is to achieve a rational pricing model applied consistently across the various product lines in the Fund family, while assuring that the overall fees for each Fund (with certain exceptions) are generally in line with the current "pricing philosophy" such that Fund total expense ratios, in general, approximate or are lower than the median expense ratios of funds in the same Lipper comparison universe. The Board took into account that each Fund’s total expense ratio (after considering proposed expense caps/waivers) approximated the peer universe’s median expense ratio.
After reviewing these and related factors, the Board concluded, within the context of their overall conclusions, that the levels of management fees and expenses of the Funds, in light of other considerations, supported the continuation of the Management Agreement for each Fund.
The Board also considered the profitability of the Investment Manager and its affiliates in connection with the Investment Manager providing management services to the Funds. With respect to the profitability of the Investment Manager and its affiliates, the Independent Trustees referred to information discussing the profitability to the Investment Manager and Ameriprise Financial from managing, operating and distributing the Columbia Funds. The Board considered that in 2021 the Board had considered 2020 profitability and that the 2022 information showed that the profitability generated by the Investment Manager in 2021 increased from 2020 levels, due to a variety of factors, including the increased assets under management of the Columbia Funds. It also took into account the indirect economic benefits flowing to the Investment Manager or its affiliates in connection with managing or distributing the Columbia Funds, such as the enhanced ability to offer various other financial products to Ameriprise Financial customers, soft dollar benefits and overall reputational advantages. The Board noted that the fees paid by the Funds should permit the Investment Manager to offer competitive compensation to its personnel, make necessary investments in its business and earn an appropriate profit. After reviewing these and related factors, the Board concluded, within the context of their overall conclusions, that the costs of services provided and the profitability to the Investment Manager and its affiliates from their relationships with the Funds supported the continuation of the Management Agreement for each Fund.
Economies of scale
The Board considered the economies of scale that might be realized as the Fund’s net asset level grows and took note of the extent to which Fund shareholders might also benefit from such growth. The Board took into account, however, that the Management Agreement already provides for relatively low flat fees for investments in affiliated funds and for other investments regardless of the Fund’s asset level, and requires Columbia Threadneedle to provide investment advice, as well as administrative, accounting and other services to the Fund. The Board observed that the Management Agreement provided for breakpoints in the management fee rate schedule that allow opportunities for shareholders to realize lower fees as Fund assets grow and that there are additional opportunities through other means for sharing economies of scale with shareholders.
Conclusion
The Board reviewed all of the above considerations in reaching its decision to approve the continuation of the Management Agreement for each Fund. In reaching its conclusions, no single factor was determinative.
On June 23, 2022, the Board, including all of the Independent Trustees, with respect to each Fund, determined that fees payable under the Management Agreement were fair and reasonable in light of the extent and quality of services provided and approved the renewal of the Management Agreement.
| 96 | Columbia Adaptive Retirement Funds | Annual Report 2023 |
If you elect to receive the shareholder report for the Funds in paper, mailed to you, the Funds mail one shareholder report to each shareholder address, unless such shareholder elects to receive shareholder reports from the Funds electronically via e-mail or by having a paper notice mailed to you (Postcard Notice) that your Funds’ shareholder report is available at the Funds’ website (columbiathreadneedleus.com/investor/). If you would like more than one report in paper to be mailed to you, or would like to elect to receive reports via e-mail or access them through Postcard Notice, please call shareholder services at 800.345.6611 and additional reports will be sent to you.
Proxy voting policies and procedures
The policy of the Board of Trustees is to vote the proxies of the companies in which the Funds hold investments consistent with the procedures as stated in the Statement of Additional Information (SAI). You may obtain a copy of the SAI without charge by calling 800.345.6611; contacting your financial intermediary; visiting columbiathreadneedleus.com/investor/; or searching the website of the Securities and Exchange Commission (SEC) at sec.gov. Information regarding how the Funds voted proxies relating to portfolio securities is filed with the SEC by August 31st for the most recent 12-month period ending June 30th of that year, and is available without charge by visiting columbiathreadneedleus.com/investor/, or searching the website of the SEC at sec.gov.
Quarterly schedule of investments
The Funds file a complete schedule of portfolio holdings with the SEC for the first and third quarters of each fiscal year on Form N-PORT. The Funds’ Form N-PORT filings are available on the SEC’s website at sec.gov. The Funds’ complete schedule of portfolio holdings, as filed on Form N-PORT, is available on columbiathreadneedleus.com/investor/ or can also be obtained without charge, upon request, by calling 800.345.6611.
Additional Fund information
For more information about the Funds, please visit columbiathreadneedleus.com/investor/ or call 800.345.6611. Customer Service Representatives are available to answer your questions Monday through Friday from 8 a.m. to 7 p.m. Eastern time.
Fund investment manager
Columbia Management Investment Advisers, LLC
290 Congress Street
Boston, MA 02210
Fund distributor
Columbia Management Investment Distributors, Inc.
290 Congress Street
Boston, MA 02210
Fund transfer agent
Columbia Management Investment Services Corp.
P.O. Box 219104
Kansas City, MO 64121-9104
Columbia Adaptive Retirement Funds | Annual Report 2023
| 97 |
[THIS PAGE INTENTIONALLY LEFT BLANK]
[THIS PAGE INTENTIONALLY LEFT BLANK]
Columbia Adaptive Retirement Funds
P.O. Box 219104
Kansas City, MO 64121-9104
Please read and consider the investment objectives, risks, charges and expenses for any fund carefully before investing. For a prospectus and summary prospectus, which contains this and other important information about the Funds, go to
columbiathreadneedleus.com/investor/. The Funds are distributed by Columbia Management Investment Distributors, Inc., member FINRA, and managed by Columbia Management Investment Advisers, LLC.
Columbia Threadneedle Investments (Columbia Threadneedle) is the global brand name of the Columbia and Threadneedle group of companies. All rights reserved.
© 2023 Columbia Management Investment Advisers, LLC.
columbiathreadneedleus.com/investor/

Annual Report
March 31, 2023
Columbia Solutions Aggressive Portfolio
Not FDIC or NCUA Insured • No Financial Institution Guarantee • May Lose Value
If you elect to receive the shareholder report for Columbia Solutions Aggressive Portfolio (the Fund) in paper, mailed to you, the Fund mails one shareholder report to each shareholder address, unless such shareholder elects to receive shareholder reports from the Fund electronically via e-mail or by having a paper notice mailed to you (Postcard Notice) that your Fund’s shareholder report is available at the Columbia funds’ website (columbiathreadneedleus.com/investor/). If you would like more than one report in paper to be mailed to you, or would like to elect to receive reports via e-mail or access them through Postcard Notice, please call shareholder services at 800.345.6611 and additional reports will be sent to you.
Proxy voting policies and procedures
The policy of the Board of Trustees is to vote the proxies of the companies in which the Fund holds investments consistent with the procedures as stated in the Statement of Additional Information (SAI). You may obtain a copy of the SAI without charge by calling 800.345.6611; contacting your financial intermediary; visiting columbiathreadneedleus.com/investor/; or searching the website of the Securities and Exchange Commission (SEC) at sec.gov. Information regarding how the Fund voted proxies relating to portfolio securities is filed with the SEC by August 31st for the most recent 12-month period ending June 30th of that year, and is available without charge by visiting columbiathreadneedleus.com/investor/, or searching the website of the SEC at sec.gov.
Quarterly schedule of investments
The Fund files a complete schedule of portfolio holdings with the SEC for the first and third quarters of each fiscal year on Form N-PORT. The Fund’s Form N-PORT filings are available on the SEC’s website at sec.gov. The Fund’s complete schedule of portfolio holdings, as filed on Form N-PORT, is available on columbiathreadneedleus.com/investor/or can also be obtained without charge, upon request, by calling 800.345.6611.
Additional Fund information
For more information about the Fund, please visit columbiathreadneedleus.com/investor/ or call 800.345.6611. Customer Service Representatives are available to answer your questions Monday through Friday from 8 a.m. to 7 p.m. Eastern time.
You may obtain the current net asset value (NAV) of Fund shares at no cost by calling 800.345.6611 or by sending an e-mail to serviceinquiries@columbiathreadneedle.com.
Fund investment manager
Columbia Management Investment Advisers, LLC (the Investment Manager)
290 Congress Street
Boston, MA 02210
Fund distributor
Columbia Management Investment Distributors, Inc.
290 Congress Street
Boston, MA 02210
Fund transfer agent
Columbia Management Investment Services Corp.
P.O. Box 219104
Kansas City, MO 64121-9104
Columbia Solutions Aggressive Portfolio | Annual Report 2023
Fund at a Glance
(Unaudited)
Investment objective
The Fund pursues consistent total returns by seeking to allocate risks across multiple asset classes.
Portfolio management
Joshua Kutin, CFA
Co-Portfolio Manager
Managed Fund since 2017
Alexander Wilkinson, CFA, CAIA
Co-Portfolio Manager
Managed Fund since 2017
| Average annual total returns (%) (for the period ended March 31, 2023) |
| | | Inception | 1 Year | 5 Years | Life |
| Columbia Solutions Aggressive Portfolio | 10/24/17 | -8.89 | 8.15 | 7.77 |
| MSCI ACWI with Developed Markets 100% Hedged to USD Index (Net) | | -5.25 | 8.38 | 8.03 |
All results shown assume reinvestment of distributions during the period. Returns do not reflect the deduction of taxes that a shareholder may pay on Fund distributions or on the redemption of Fund shares. Performance results reflect the effect of any fee waivers or reimbursements of Fund expenses by Columbia Management Investment Advisers, LLC and/or any of its affiliates. Absent these fee waivers or expense reimbursement arrangements, performance results would have been lower.
The performance information shown represents past performance and is not a guarantee of future results. The investment return and principal value of your investment will fluctuate so that your shares, when redeemed, may be worth more or less than their original cost. Current performance may be lower or higher than the performance information shown. You may obtain performance information current to the most recent month-end by contacting your financial intermediary, visiting columbiathreadneedleus.com/investor/ or calling 800.345.6611.
The MSCI ACWI with Developed Markets 100% Hedged to USD Index (Net) represents a close estimation of the performance that can be achieved by hedging the currency exposures of all developed market exposures of its parent index, the MSCI ACWI, to the USD, the “home” currency for the hedged index. The index is 100% hedged to the USD of developed market currencies by selling each foreign currency forward at the one-month Forward weight. The parent index is composed of large and mid-cap stocks across 23 Developed Markets (DM) countries and 27 Emerging Markets (EM) countries.
Indices are not available for investment, are not professionally managed and do not reflect sales charges, fees, brokerage commissions, taxes (except the MSCI ACWI with Developed Markets 100% Hedged to USD Index (Net), which reflects reinvested dividends net of withholding taxes) or other expenses of investing. Securities in the Fund may not match those in an index.
Columbia Solutions Aggressive Portfolio | Annual Report 2023
| 3 |
Fund at a Glance (continued)
(Unaudited)
Performance of a hypothetical $10,000 investment (October 24, 2017 — March 31, 2023)
The chart above shows the change in value of a hypothetical $10,000 investment in Columbia Solutions Aggressive Portfolio during the stated time period, and does not reflect the deduction of taxes that a shareholder may pay on Fund distributions or on the sale of Fund shares.
| Portfolio breakdown (%) (at March 31, 2023) |
| Foreign Government Obligations | 25.1 |
| Money Market Funds(a) | 32.6 |
| U.S. Treasury Obligations | 42.3 |
| Total | 100.0 |
| (a) | Includes investments in Money Market Funds, including investing for the purpose of covering obligations relating to the Fund’s investment in derivatives. For a description of the Fund’s investments in derivatives, see Investments in derivatives following the Portfolio of Investments and the derivative instruments discussion in Note 2 to the Notes to Financial Statements. |
Percentages indicated are based upon total investments excluding investments in derivatives, if any. The Fund’s portfolio composition is subject to change.
| Market exposure through derivatives investments (% of notional exposure) (at March 31, 2023)(a) |
| | Long | Short | Net |
| Fixed Income Derivative Contracts | 50.4 | (2.5) | 47.9 |
| Equity Derivative Contracts | 101.6 | — | 101.6 |
| Foreign Currency Derivative Contracts | 0.3 | (49.8) | (49.5) |
| Total Notional Market Value of Derivative Contracts | 152.3 | (52.3) | 100.0 |
(a) The Fund has market exposure (long and/or short) to fixed income, equity asset classes and foreign currency through its investments in derivatives. The notional exposure of a financial instrument is the nominal or face amount that is used to calculate payments made on that instrument and/or changes in value for the instrument. The notional exposure is a hypothetical underlying quantity upon which payment obligations are computed. Notional exposures provide a gauge for how the Fund may behave given changes in individual markets. For a description of the Fund’s investments in derivatives, see Investments in derivatives following the Portfolio of Investments, and Note 2 of the Notes to Financial Statements.
| 4 | Columbia Solutions Aggressive Portfolio | Annual Report 2023 |
Manager Discussion of Fund Performance
(Unaudited)
At March 31, 2023, approximately 99.91% of the Fund’s shares were owned in the aggregate by affiliated funds-of-funds managed by Columbia Management Investment Advisers, LLC (the Investment Manager). As a result of asset allocation decisions by the Investment Manager, it is possible that the Fund may experience relatively large purchases or redemptions from affiliated funds-of-funds. The Investment Manager seeks to minimize the impact of these transactions by structuring them over a reasonable period of time. The Fund may experience increased expenses as it buys and sells securities as a result of purchases or redemptions by affiliated funds-of-funds.
For the 12-month period that ended March 31, 2023, Columbia Solutions Aggressive Portfolio returned -8.89%. The Fund underperformed its benchmark, the MSCI ACWI with Developed Markets 100% Hedged to USD Index (Net), which returned -5.25% for the same period.
Market overview
Global equity markets delivered mixed results during the 12-month period, with most major benchmarks posting negative returns despite strong results in certain industry groups. Numerous concerns weighed on sentiment throughout the first half of the period, particularly a toxic combination of geopolitical and financial market events that punished most asset returns except for “hard” assets such as oil, gold and other commodities. As a result of Russia’s invasion of Ukraine, many western nations imposed punitive sanctions on Russia that limited its ability to transact in global markets and access assets held outside its borders. Combined, Russia and Ukraine provide a significant portion of many raw materials to the global economy, focused most prominently in Europe and the Middle East. Loss of these supplies disrupted access to basic necessities for many countries and raised the cost of such goods precipitously in some cases.
Despite occasional bursts of optimism that drove brief attempts at equity rallies, market momentum remained volatile and continued downward. Poor fixed-income returns, which typically have served as a safe-haven offset to declining equity markets, compounded the steep drawdowns in stocks. A steadily strengthening U.S. dollar over the first seven months of the reporting period (from the end of February 2022 through the end of September 2022) was an additional headwind for U.S. investors and eroded returns significantly.
Sentiment reversed abruptly though, apparently fueled by hints that the global slowdown was beginning to moderate. Investors also were pleased that China scrapped its zero-COVID-19 lockdown policy, even though that welcome news was followed by worries that a resulting surge in COVID-19 infections would weigh on growth and make for a challenging reopening of the country’s economy. Those expectations helped weaken the U.S. dollar and buoy international equity returns for U.S. investors.
March brought new concerns as the failure of several U.S. banks, together with the collapse of the 167-year-old European financial giant Credit Suisse, ignited fears that a banking crisis similar to 2008-2009 could emerge. These worries rapidly dissipated, however, leading to a strong rally in the final week of March that added to equity and fixed-income returns.
The Fund’s notable detractors during the period
| • | Overall, the Fund’s exposure to interest-rate-sensitive securities was the single largest detractor relative to the benchmark. Fixed-income investments faced increased volatility during the period and negative overall returns from the fixed-income market hurt Fund performance versus its benchmark. |
| • | Within equities, the Fund’s allocation to international developed securities detracted from overall performance against the benchmark. |
The Fund’s notable contributors during the period
| • | The Fund’s overall allocation to equity securities was the largest performance contributor relative to its benchmark. Within equities, the Fund benefited from an underweight to U.S. large-cap equities and strong security selection in both U.S. large-cap and emerging market equities. |
| • | The Fund’s cash position contributed positively to performance against the benchmark during a period of heightened volatility across both equity and fixed-income markets. |
Columbia Solutions Aggressive Portfolio | Annual Report 2023
| 5 |
Manager Discussion of Fund Performance (continued)
(Unaudited)
Derivatives usage
The Fund used derivative securities such as forward foreign currency exchange contracts, futures and swap contracts to gain exposure to the equity markets and to certain fixed-income sectors. On a stand-alone basis, the net effect on Fund performance was negative.
Market risk may affect a single issuer, sector of the economy, industry or the market as a whole. Investing in derivatives is a specialized activity that involves special risks that subject the Fund to significant loss potential, including when used as leverage, and may result in greater fluctuation in Fund value. Commodity investments may be affected by the overall market and industry- and commodity-specific factors, and may be more volatile and less liquid than other investments. Short positions (where the underlying asset is not owned) can create unlimited risk. International investing involves certain risks and volatility due to potential political, economic or currency instabilities and different financial and accounting standards. Risks are enhanced for emerging market issuers. Investments in small- and mid-cap companies involve risks and volatility greater than investments in larger, more established companies. Fixed-income securities present issuer default risk. Non-investment-grade (high-yield or junk) securities present greater price volatility and more risk to principal and income than higher rated securities. A rise in interest rates may result in a price decline of fixed-income instruments held by the Fund, negatively impacting its performance and NAV. Falling rates may result in the Fund investing in lower yielding debt instruments, lowering the Fund’s income and yield. These risks may be heightened for longer maturity and duration securities. Interest payments on inflation-protected securities may be more volatile than interest payments on ordinary bonds. In periods of deflation, these securities may provide no income. Market or other (e.g., interest rate) environments may adversely affect the liquidity of fund investments, negatively impacting their price. Generally, the less liquid the market at the time the fund sells a holding, the greater the risk of loss or decline of value to the Fund. The Fund’s use of leverage allows for investment exposure in excess of net assets, thereby magnifying volatility of returns and risk of loss. Investments selected using quantitative methods may perform differently from the market as a whole and may not enable the Fund to achieve its objective. Like real estate, REITs are subject to illiquidity, valuation and financing complexities, taxes, default, bankruptcy and other economic, political or regulatory occurrences. See the Fund’s prospectus for more information on these and other risks.
The views expressed in this report reflect the current views of the respective parties who have contributed to this report. These views are not guarantees of future performance and involve certain risks, uncertainties and assumptions that are difficult to predict, so actual outcomes and results may differ significantly from the views expressed. These views are subject to change at any time based upon economic, market or other conditions and the respective parties disclaim any responsibility to update such views. These views may not be relied on as investment advice and, because investment decisions for a Columbia fund are based on numerous factors, may not be relied on as an indication of trading intent on behalf of any particular Columbia fund. References to specific securities should not be construed as a recommendation or investment advice.
| 6 | Columbia Solutions Aggressive Portfolio | Annual Report 2023 |
Understanding Your Fund’s Expenses
(Unaudited)
As an investor, you incur two types of costs. There are shareholder transaction costs, which may include redemption fees. There are also ongoing fund costs, which generally include management fees, distribution and/or service fees, and other fund expenses. The following information is intended to help you understand your ongoing costs (in dollars) of investing in the Fund and to help you compare these costs with the ongoing costs of investing in other mutual funds.
Analyzing your Fund’s expenses
To illustrate these ongoing costs, we have provided examples and calculated the expenses paid by investors of the Fund during the period. The actual and hypothetical information in the table is based on an initial investment of $1,000 at the beginning of the period indicated and held for the entire period. Expense information is calculated two ways and each method provides you with different information. The amount listed in the “Actual” column is calculated using the Fund’s actual operating expenses and total return for the period. You may use the Actual information, together with the amount invested, to estimate the expenses that you paid over the period. Simply divide your account value by $1,000 (for example, an $8,600 account value divided by $1,000 = 8.6), then multiply the results by the expenses paid during the period under the “Actual” column. The amount listed in the “Hypothetical” column assumes a 5% annual rate of return before expenses (which is not the Fund’s actual return) and then applies the Fund’s actual expense ratio for the period to the hypothetical return. You should not use the hypothetical account values and expenses to estimate either your actual account balance at the end of the period or the expenses you paid during the period. See “Compare with other funds” below for details on how to use the hypothetical data.
Compare with other funds
Since all mutual funds are required to include the same hypothetical calculations about expenses in shareholder reports, you can use this information to compare the ongoing cost of investing in the Fund with other funds. To do so, compare the hypothetical example with the 5% hypothetical examples that appear in the shareholder reports of other funds. As you compare hypothetical examples of other funds, it is important to note that hypothetical examples are meant to highlight the ongoing costs of investing in a fund only and do not reflect any transaction costs, such as redemption or exchange fees. Therefore, the hypothetical calculations are useful in comparing ongoing costs only, and will not help you determine the relative total costs of owning different funds. If transaction costs were included in these calculations, your costs would be higher.
| October 1, 2022 — March 31, 2023 |
| | Account value at the
beginning of the
period ($) | Account value at the
end of the
period ($) | Expenses paid during
the period ($) | Fund’s annualized
expense ratio (%) |
| | Actual | Hypothetical | Actual | Hypothetical | Actual | Hypothetical | Actual |
| Columbia Solutions Aggressive Portfolio | 1,000.00 | 1,000.00 | 1,075.50 | 1,024.88 | 0.05 | 0.05 | 0.01 |
Expenses paid during the period are equal to the annualized expense ratio as indicated above, multiplied by the average account value over the period and then multiplied by the number of days in the Fund’s most recent fiscal half year and divided by 365.
Expenses do not include fees and expenses incurred indirectly by the Fund from its investment in underlying funds, including affiliated and non-affiliated pooled investment vehicles, such as mutual funds and exchange-traded funds.
Had Columbia Management Investment Advisers, LLC and/or certain of its affiliates not waived/reimbursed certain fees and expenses, account value at the end of the period would have been reduced.
Columbia Solutions Aggressive Portfolio | Annual Report 2023
| 7 |
Portfolio of Investments
March 31, 2023
(Percentages represent value of investments compared to net assets)
Investments in securities
| Foreign Government Obligations(a),(b) 23.5% |
| Issuer | Coupon
Rate | | Principal
Amount ($) | Value ($) |
| Austria 2.9% |
| Republic of Austria Government Bond(c) |
| 10/20/2026 | 0.750% | EUR | 186,000 | 189,115 |
| 05/23/2034 | 2.400% | EUR | 47,000 | 48,281 |
| Total | 237,396 |
| Belgium 2.0% |
| Kingdom of Belgium Government Bond(c) |
| 06/22/2031 | 1.000% | EUR | 113,000 | 106,463 |
| 04/22/2033 | 1.250% | EUR | 63,000 | 58,751 |
| Total | 165,214 |
| China 1.8% |
| China Development Bank |
| 07/18/2032 | 2.960% | CNY | 300,000 | 43,417 |
| China Government Bond |
| 11/21/2029 | 3.130% | CNY | 250,000 | 37,164 |
| 05/21/2030 | 2.680% | CNY | 200,000 | 28,785 |
| 05/15/2032 | 2.760% | CNY | 300,000 | 43,262 |
| Total | 152,628 |
| France 3.4% |
| French Republic Government Bond OAT(c) |
| 10/25/2027 | 2.750% | EUR | 159,000 | 173,386 |
| French Republic Government Bond OAT(c),(d) |
| 11/25/2030 | 0.000% | EUR | 122,000 | 108,175 |
| Total | 281,561 |
| Italy 0.3% |
| Italy Buoni Poliennali Del Tesoro(c) |
| 09/01/2046 | 3.250% | EUR | 26,000 | 23,880 |
| Japan 6.9% |
| Japan Government 10-Year Bond |
| 06/20/2031 | 0.100% | JPY | 15,000,000 | 110,940 |
| Japan Government 20-Year Bond |
| 06/20/2041 | 0.400% | JPY | 8,000,000 | 54,369 |
| 09/20/2041 | 0.500% | JPY | 10,500,000 | 72,550 |
| 03/20/2042 | 0.800% | JPY | 5,550,000 | 40,072 |
| Japan Government 30-Year Bond |
| 06/20/2050 | 0.600% | JPY | 6,300,000 | 40,166 |
| 06/20/2051 | 0.700% | JPY | 6,600,000 | 42,918 |
| 09/20/2051 | 0.700% | JPY | 5,600,000 | 36,369 |
| 12/20/2051 | 0.700% | JPY | 7,000,000 | 45,429 |
| 03/20/2052 | 1.000% | JPY | 4,000,000 | 28,059 |
| Japan Government Twenty-Year Bond |
| 06/20/2042 | 0.900% | JPY | 13,000,000 | 95,987 |
| Total | 566,859 |
| Foreign Government Obligations(a),(b) (continued) |
| Issuer | Coupon
Rate | | Principal
Amount ($) | Value ($) |
| Netherlands 2.9% |
| Netherlands Government Bond(c) |
| 07/15/2026 | 0.500% | EUR | 183,000 | 185,811 |
| Netherlands Government Bond(c),(d) |
| 07/15/2031 | 0.000% | EUR | 64,000 | 56,356 |
| Total | 242,167 |
| Spain 2.4% |
| Spain Government Bond(d) |
| 01/31/2028 | 0.000% | EUR | 65,000 | 61,316 |
| Spain Government Bond(c) |
| 04/30/2030 | 0.500% | EUR | 66,000 | 60,224 |
| 07/30/2035 | 1.850% | EUR | 66,000 | 60,294 |
| 07/30/2041 | 4.700% | EUR | 15,000 | 18,474 |
| Total | 200,308 |
| United Kingdom 0.9% |
| United Kingdom Gilt(c) |
| 10/22/2028 | 1.625% | GBP | 34,000 | 38,306 |
| 12/07/2042 | 4.500% | GBP | 26,000 | 35,089 |
| Total | 73,395 |
Total Foreign Government Obligations
(Cost $2,321,767) | 1,943,408 |
|
| U.S. Treasury Obligations 39.4% |
| | | | |
| U.S. Treasury |
| 10/31/2026 | 1.125% | | 235,000 | 214,382 |
| 03/31/2028 | 1.250% | | 251,000 | 223,900 |
| 06/30/2028 | 1.250% | | 243,000 | 215,701 |
| 09/30/2028 | 1.250% | | 675,000 | 595,582 |
| 10/31/2028 | 1.375% | | 540,000 | 479,166 |
| 11/30/2028 | 1.500% | | 175,000 | 156,119 |
| 04/30/2029 | 2.875% | | 320,000 | 307,250 |
| 05/15/2029 | 2.375% | | 128,000 | 119,430 |
| 08/15/2029 | 1.625% | | 129,000 | 115,092 |
| 02/15/2030 | 1.500% | | 123,000 | 107,836 |
| 08/15/2030 | 0.625% | | 196,000 | 159,740 |
| 02/15/2031 | 1.125% | | 132,000 | 111,148 |
| 08/15/2031 | 1.250% | | 550,000 | 461,313 |
Total U.S. Treasury Obligations
(Cost $3,680,092) | 3,266,659 |
The accompanying Notes to Financial Statements are an integral part of this statement.
| 8 | Columbia Solutions Aggressive Portfolio | Annual Report 2023 |
Portfolio of Investments (continued)
March 31, 2023
| Money Market Funds 30.4% |
| | Shares | Value ($) |
| Columbia Short-Term Cash Fund, 4.983%(e),(f) | 2,516,255 | 2,515,751 |
Total Money Market Funds
(Cost $2,515,150) | 2,515,751 |
Total Investments in Securities
(Cost: $8,517,009) | 7,725,818 |
| Other Assets & Liabilities, Net | | 555,968 |
| Net Assets | 8,281,786 |
At March 31, 2023, securities and/or cash totaling $558,953 were pledged as collateral.
Investments in derivatives
| Forward foreign currency exchange contracts |
Currency to
be sold | Currency to
be purchased | Counterparty | Settlement
date | Unrealized
appreciation ($) | Unrealized
depreciation ($) |
| 193,000 CHF | 212,111 USD | Citi | 04/19/2023 | 829 | — |
| 821,000 CNY | 120,020 USD | Citi | 04/19/2023 | 380 | — |
| 1,709,043 EUR | 1,837,189 USD | Citi | 04/19/2023 | — | (17,824) |
| 468,000 HKD | 59,749 USD | Citi | 04/19/2023 | 83 | — |
| 737,000 SEK | 70,508 USD | Citi | 04/19/2023 | — | (561) |
| 13,967 USD | 13,000 EUR | Citi | 04/19/2023 | 144 | — |
| 148,000 NOK | 14,068 USD | Goldman Sachs International | 04/19/2023 | — | (77) |
| 132,686,000 JPY | 992,119 USD | HSBC | 04/19/2023 | — | (9,668) |
| 37,000 SGD | 27,541 USD | HSBC | 04/19/2023 | — | (275) |
| 61,000 ZAR | 3,345 USD | HSBC | 04/19/2023 | — | (76) |
| 256,000 CNY | 37,498 USD | Standard Chartered | 04/19/2023 | 192 | — |
| 246,000 AUD | 164,247 USD | UBS | 04/19/2023 | — | (280) |
| 406,000 DKK | 58,625 USD | UBS | 04/19/2023 | — | (537) |
| 8,000 EUR | 8,600 USD | UBS | 04/19/2023 | — | (84) |
| 330,000 GBP | 401,095 USD | UBS | 04/19/2023 | — | (6,120) |
| 4,391 USD | 6,000 CAD | UBS | 04/19/2023 | 50 | — |
| 8,585 USD | 7,000 GBP | UBS | 04/19/2023 | 53 | — |
| Total | | | | 1,731 | (35,502) |
| Long futures contracts |
| Description | Number of
contracts | Expiration
date | Trading
currency | Notional
amount | Value/Unrealized
appreciation ($) | Value/Unrealized
depreciation ($) |
| Australian 10-Year Bond | 1 | 06/2023 | AUD | 122,886 | 2,495 | — |
| Euro-Bobl | 4 | 06/2023 | EUR | 471,520 | 11,244 | — |
| Euro-BTP | 2 | 06/2023 | EUR | 230,700 | 8,448 | — |
| Euro-OAT | 1 | 06/2023 | EUR | 130,230 | 4,501 | — |
| Long Gilt | 2 | 06/2023 | GBP | 206,700 | 5,959 | — |
| MSCI EAFE Index | 20 | 06/2023 | USD | 2,096,500 | 58,843 | — |
| MSCI Emerging Markets Index | 18 | 06/2023 | USD | 895,950 | 26,175 | — |
| Russell 2000 Index E-mini | 5 | 06/2023 | USD | 453,375 | — | (162) |
| S&P 500 Index E-mini | 22 | 06/2023 | USD | 4,551,525 | 200,102 | — |
| S&P/TSX 60 Index | 1 | 06/2023 | CAD | 241,840 | — | (63) |
| Short Term Euro-BTP | 1 | 06/2023 | EUR | 105,370 | 1,301 | — |
| U.S. Treasury 10-Year Note | 3 | 06/2023 | USD | 344,766 | 10,073 | — |
| U.S. Treasury 5-Year Note | 3 | 06/2023 | USD | 328,523 | 5,611 | — |
| U.S. Treasury Ultra 10-Year Note | 5 | 06/2023 | USD | 605,703 | 19,098 | — |
| Total | | | | | 353,850 | (225) |
The accompanying Notes to Financial Statements are an integral part of this statement.
Columbia Solutions Aggressive Portfolio | Annual Report 2023
| 9 |
Portfolio of Investments (continued)
March 31, 2023
| Short futures contracts |
| Description | Number of
contracts | Expiration
date | Trading
currency | Notional
amount | Value/Unrealized
appreciation ($) | Value/Unrealized
depreciation ($) |
| 10-Year Mini Japanese Government Bond | (1) | 06/2023 | JPY | (14,782,000) | — | (1,813) |
| Canadian Government 10-Year Bond | (1) | 06/2023 | CAD | (126,160) | — | (3,705) |
| Total | | | | | — | (5,518) |
| Cleared credit default swap contracts - sell protection |
Reference
entity | Counterparty | Maturity
date | Receive
fixed
rate
(%) | Payment
frequency | Implied
credit
spread
(%)* | Notional
currency | Notional
amount | Value
($) | Upfront
payments
($) | Upfront
receipts
($) | Unrealized
appreciation
($) | Unrealized
depreciation
($) |
| Markit CDX North America High Yield Index, Series 40 | Morgan Stanley | 06/20/2028 | 5.000 | Quarterly | 4.635 | USD | 913,000 | 14,356 | — | — | 14,356 | — |
| Markit CDX North America Investment Grade Index, Series 40 | Morgan Stanley | 06/20/2028 | 1.000 | Quarterly | 0.756 | USD | 505,000 | 3,233 | — | — | 3,233 | — |
| Total | | | | | | | | 17,589 | — | — | 17,589 | — |
| * | Implied credit spreads, represented in absolute terms, utilized in determining the market value of credit default swap agreements on corporate or sovereign issues as of period end serve as an indicator of the current status of the payment/performance risk and represent the likelihood or risk of default for the credit derivative. The implied credit spread of a particular referenced entity reflects the cost of buying/selling protection and may include upfront payments required to be made to enter into the agreement. Wider credit spreads represent a deterioration of the referenced entity’s credit soundness and a greater likelihood or risk of default or other credit event occurring as defined under the terms of the agreement. |
Notes to Portfolio of Investments
| (a) | Principal amounts are denominated in United States Dollars unless otherwise noted. |
| (b) | Principal and interest may not be guaranteed by a governmental entity. |
| (c) | Represents privately placed and other securities and instruments exempt from Securities and Exchange Commission registration (collectively, private placements), such as Section 4(a)(2) and Rule 144A eligible securities, which are often sold only to qualified institutional buyers. At March 31, 2023, the total value of these securities amounted to $1,162,605, which represents 14.04% of total net assets. |
| (d) | Zero coupon bond. |
| (e) | The rate shown is the seven-day current annualized yield at March 31, 2023. |
| (f) | As defined in the Investment Company Act of 1940, as amended, an affiliated company is one in which the Fund owns 5% or more of the company’s outstanding voting securities, or a company which is under common ownership or control with the Fund. The value of the holdings and transactions in these affiliated companies during the year ended March 31, 2023 are as follows: |
| Affiliated issuers | Beginning
of period($) | Purchases($) | Sales($) | Net change in
unrealized
appreciation
(depreciation)($) | End of
period($) | Realized gain
(loss)($) | Dividends($) | End of
period shares |
| Columbia Short-Term Cash Fund, 4.983% |
| | 1,836,867 | 9,063,073 | (8,384,976) | 787 | 2,515,751 | (268) | 55,388 | 2,516,255 |
Currency Legend
| AUD | Australian Dollar |
| CAD | Canada Dollar |
| CHF | Swiss Franc |
| CNY | China Yuan Renminbi |
| DKK | Danish Krone |
| EUR | Euro |
| GBP | British Pound |
| HKD | Hong Kong Dollar |
| JPY | Japanese Yen |
| NOK | Norwegian Krone |
| SEK | Swedish Krona |
The accompanying Notes to Financial Statements are an integral part of this statement.
| 10 | Columbia Solutions Aggressive Portfolio | Annual Report 2023 |
Portfolio of Investments (continued)
March 31, 2023
Currency Legend (continued)
| SGD | Singapore Dollar |
| USD | US Dollar |
| ZAR | South African Rand |
Fair value measurements
The Fund categorizes its fair value measurements according to a three-level hierarchy that maximizes the use of observable inputs and minimizes the use of unobservable inputs by prioritizing that the most observable input be used when available. Observable inputs are those that market participants would use in pricing an investment based on market data obtained from sources independent of the reporting entity. Unobservable inputs are those that reflect the Fund’s assumptions about the information market participants would use in pricing an investment. An investment’s level within the fair value hierarchy is based on the lowest level of any input that is deemed significant to the asset’s or liability’s fair value measurement. The input levels are not necessarily an indication of the risk or liquidity associated with investments at that level. For example, certain U.S. government securities are generally high quality and liquid, however, they are reflected as Level 2 because the inputs used to determine fair value may not always be quoted prices in an active market.
Fair value inputs are summarized in the three broad levels listed below:
| ■ | Level 1 — Valuations based on quoted prices for investments in active markets that the Fund has the ability to access at the measurement date. Valuation adjustments are not applied to Level 1 investments. |
| ■ | Level 2 — Valuations based on other significant observable inputs (including quoted prices for similar securities, interest rates, prepayment speeds, credit risks, etc.). |
| ■ | Level 3 — Valuations based on significant unobservable inputs (including the Fund’s own assumptions and judgment in determining the fair value of investments). |
Inputs that are used in determining fair value of an investment may include price information, credit data, volatility statistics, and other factors. These inputs can be either observable or unobservable. The availability of observable inputs can vary between investments, and is affected by various factors such as the type of investment, and the volume and level of activity for that investment or similar investments in the marketplace. The inputs will be considered by the Investment Manager, along with any other relevant factors in the calculation of an investment’s fair value. The Fund uses prices and inputs that are current as of the measurement date, which may include periods of market dislocations. During these periods, the availability of prices and inputs may be reduced for many investments. This condition could cause an investment to be reclassified between the various levels within the hierarchy.
Investments falling into the Level 3 category are primarily supported by quoted prices from brokers and dealers participating in the market for those investments. However, these may be classified as Level 3 investments due to lack of market transparency and corroboration to support these quoted prices. Additionally, valuation models may be used as the pricing source for any remaining investments classified as Level 3. These models may rely on one or more significant unobservable inputs and/or significant assumptions by the Investment Manager. Inputs used in valuations may include, but are not limited to, financial statement analysis, capital account balances, discount rates and estimated cash flows, and comparable company data.
The Fund’s Board of Trustees (the Board) has designated the Investment Manager, through its Valuation Committee (the Committee), as valuation designee, responsible for determining the fair value of the assets of the Fund for which market quotations are not readily available using valuation procedures approved by the Board. The Committee consists of voting and non-voting members from various groups within the Investment Manager’s organization, including operations and accounting, trading and investments, compliance, risk management and legal.
The Committee meets at least monthly to review and approve valuation matters, which may include a description of specific valuation determinations, data regarding pricing information received from approved pricing vendors and brokers and the results of Board-approved valuation policies and procedures (the Policies). The Policies address, among other things, instances when market quotations are or are not readily available, including recommendations of third party pricing vendors and a determination of appropriate pricing methodologies; events that require specific valuation determinations and assessment of fair value techniques; securities with a potential for stale pricing, including those that are illiquid, restricted, or in default; and the effectiveness of third party pricing vendors, including periodic reviews of vendors. The Committee meets more frequently, as needed, to discuss additional valuation matters, which may include the need to review back-testing results, review time-sensitive information or approve related valuation actions. Representatives of Columbia Management Investment Advisers, LLC report to the Board at each of its regularly scheduled meetings to discuss valuation matters and actions during the period, similar to those described earlier.
The following table is a summary of the inputs used to value the Fund’s investments at March 31, 2023:
| | Level 1 ($) | Level 2 ($) | Level 3 ($) | Total ($) |
| Investments in Securities | | | | |
| Foreign Government Obligations | — | 1,943,408 | — | 1,943,408 |
| U.S. Treasury Obligations | — | 3,266,659 | — | 3,266,659 |
| Money Market Funds | 2,515,751 | — | — | 2,515,751 |
| Total Investments in Securities | 2,515,751 | 5,210,067 | — | 7,725,818 |
| Investments in Derivatives | | | | |
| Asset | | | | |
| Forward Foreign Currency Exchange Contracts | — | 1,731 | — | 1,731 |
| Futures Contracts | 353,850 | — | — | 353,850 |
| Swap Contracts | — | 17,589 | — | 17,589 |
| Liability | | | | |
| Forward Foreign Currency Exchange Contracts | — | (35,502) | — | (35,502) |
| Futures Contracts | (5,743) | — | — | (5,743) |
| Total | 2,863,858 | 5,193,885 | — | 8,057,743 |
See the Portfolio of Investments for all investment classifications not indicated in the table.
The accompanying Notes to Financial Statements are an integral part of this statement.
Columbia Solutions Aggressive Portfolio | Annual Report 2023
| 11 |
Portfolio of Investments (continued)
March 31, 2023
Fair value measurements (continued)
The Fund’s assets assigned to the Level 2 input category are generally valued using the market approach, in which a security’s value is determined through reference to prices and information from market transactions for similar or identical assets.
Derivative instruments are valued at unrealized appreciation (depreciation).
The accompanying Notes to Financial Statements are an integral part of this statement.
| 12 | Columbia Solutions Aggressive Portfolio | Annual Report 2023 |
Statement of Assets and Liabilities
March 31, 2023
| Assets | |
| Investments in securities, at value | |
| Unaffiliated issuers (cost $6,001,859) | $5,210,067 |
| Affiliated issuers (cost $2,515,150) | 2,515,751 |
| Foreign currency (cost $12,617) | 12,729 |
| Margin deposits on: | |
| Futures contracts | 457,913 |
| Swap contracts | 101,040 |
| Unrealized appreciation on forward foreign currency exchange contracts | 1,731 |
| Receivable for: | |
| Dividends | 8,947 |
| Interest | 23,764 |
| Foreign tax reclaims | 830 |
| Variation margin for futures contracts | 91,045 |
| Variation margin for swap contracts | 5,483 |
| Expense reimbursement due from Investment Manager | 387 |
| Prepaid expenses | 973 |
| Trustees’ deferred compensation plan | 18,165 |
| Total assets | 8,448,825 |
| Liabilities | |
| Due to custodian | 73 |
| Unrealized depreciation on forward foreign currency exchange contracts | 35,502 |
| Payable for: | |
| Investments purchased | 643 |
| Capital shares purchased | 68,272 |
| Variation margin for futures contracts | 2,584 |
| Compensation of board members | 12,447 |
| Accounting services fees | 20,145 |
| Other expenses | 9,208 |
| Trustees’ deferred compensation plan | 18,165 |
| Total liabilities | 167,039 |
| Net assets applicable to outstanding capital stock | $8,281,786 |
| Represented by | |
| Paid in capital | 10,286,515 |
| Total distributable earnings (loss) | (2,004,729) |
| Total - representing net assets applicable to outstanding capital stock | $8,281,786 |
| Shares outstanding | 1,048,149 |
| Net asset value per share | 7.90 |
The accompanying Notes to Financial Statements are an integral part of this statement.
Columbia Solutions Aggressive Portfolio | Annual Report 2023
| 13 |
Statement of Operations
Year Ended March 31, 2023
| Net investment income | |
| Income: | |
| Dividends — affiliated issuers | $55,388 |
| Interest | 74,948 |
| Foreign taxes withheld | (83) |
| Total income | 130,253 |
| Expenses: | |
| Compensation of board members | 14,551 |
| Custodian fees | 27,041 |
| Printing and postage fees | 5,767 |
| Accounting services fees | 42,790 |
| Legal fees | 13,261 |
| Interest on collateral | 210 |
| Compensation of chief compliance officer | 2 |
| Other | 4,471 |
| Total expenses | 108,093 |
| Fees waived or expenses reimbursed by Investment Manager and its affiliates | (107,091) |
| Total net expenses | 1,002 |
| Net investment income | 129,251 |
| Realized and unrealized gain (loss) — net | |
| Net realized gain (loss) on: | |
| Investments — unaffiliated issuers | (242,969) |
| Investments — affiliated issuers | (268) |
| Foreign currency translations | (2,869) |
| Forward foreign currency exchange contracts | 266,423 |
| Futures contracts | (821,134) |
| Swap contracts | 7,663 |
| Net realized loss | (793,154) |
| Net change in unrealized appreciation (depreciation) on: | |
| Investments — unaffiliated issuers | (318,457) |
| Investments — affiliated issuers | 787 |
| Foreign currency translations | 633 |
| Forward foreign currency exchange contracts | (30,644) |
| Futures contracts | 287,481 |
| Swap contracts | 4,752 |
| Net change in unrealized appreciation (depreciation) | (55,448) |
| Net realized and unrealized loss | (848,602) |
| Net decrease in net assets resulting from operations | $(719,351) |
The accompanying Notes to Financial Statements are an integral part of this statement.
| 14 | Columbia Solutions Aggressive Portfolio | Annual Report 2023 |
Statement of Changes in Net Assets
| | Year Ended
March 31, 2023 | Year Ended
March 31, 2022 |
| Operations | | |
| Net investment income | $129,251 | $81,807 |
| Net realized gain (loss) | (793,154) | 803,778 |
| Net change in unrealized appreciation (depreciation) | (55,448) | (363,079) |
| Net increase (decrease) in net assets resulting from operations | (719,351) | 522,506 |
| Distributions to shareholders | | |
| Net investment income and net realized gains | (666,913) | (2,705,913) |
| Total distributions to shareholders | (666,913) | (2,705,913) |
| Increase in net assets from capital stock activity | 1,305,285 | 2,252,302 |
| Total increase (decrease) in net assets | (80,979) | 68,895 |
| Net assets at beginning of year | 8,362,765 | 8,293,870 |
| Net assets at end of year | $8,281,786 | $8,362,765 |
| | Year Ended | Year Ended |
| | March 31, 2023 | March 31, 2022 |
| | Shares | Dollars ($) | Shares | Dollars ($) |
| Capital stock activity |
| | | | | |
| Subscriptions | 172,619 | 1,424,019 | 342,226 | 4,154,573 |
| Distributions reinvested | 86,070 | 666,182 | 265,739 | 2,702,570 |
| Redemptions | (91,834) | (784,916) | (414,072) | (4,604,841) |
| Total net increase | 166,855 | 1,305,285 | 193,893 | 2,252,302 |
The accompanying Notes to Financial Statements are an integral part of this statement.
Columbia Solutions Aggressive Portfolio | Annual Report 2023
| 15 |
The following table is intended to help you understand the Fund’s financial performance. Certain information reflects financial results for a single share held for the periods shown. Per share net investment income (loss) amounts are calculated based on average shares outstanding during the period. Total return assumes reinvestment of all dividends and distributions, if any. Total return does not reflect payment of sales charges, if any. Total return and portfolio turnover are not annualized for periods of less than one year. The ratios of expenses and net investment income are annualized for periods of less than one year. The portfolio turnover rate is calculated without regard to purchase and sales transactions of short-term instruments and certain derivatives, if any. If such transactions were included, the Fund’s portfolio turnover rate may be higher.
| | Year Ended March 31, |
| 2023 | 2022 | 2021 | 2020 | 2019 |
| Per share data | | | | | |
| Net asset value, beginning of period | $9.49 | $12.07 | $9.57 | $10.12 | $10.07 |
| Income from investment operations: | | | | | |
| Net investment income | 0.14 | 0.10 | 0.11 | 0.21 | 0.21 |
| Net realized and unrealized gain (loss) | (1.00) | 0.66 | 3.33 | 0.45 | 0.50 |
| Total from investment operations | (0.86) | 0.76 | 3.44 | 0.66 | 0.71 |
| Less distributions to shareholders from: | | | | | |
| Net investment income | (0.73) | (0.11) | (0.21) | (0.35) | (0.51) |
| Net realized gains | — | (3.23) | (0.73) | (0.86) | (0.15) |
| Total distributions to shareholders | (0.73) | (3.34) | (0.94) | (1.21) | (0.66) |
| Net asset value, end of period | $7.90 | $9.49 | $12.07 | $9.57 | $10.12 |
| Total return | (8.89%) | 4.47% | 36.42% | 5.44% | 8.05% |
| Ratios to average net assets | | | | | |
| Total gross expenses(a) | 1.36%(b) | 1.02%(b),(c) | 1.19% | 1.33% | 1.78% |
| Total net expenses(a),(d) | 0.01%(b) | 0.01%(b),(c) | 0.01% | 0.01% | 0.01% |
| Net investment income | 1.63% | 0.79% | 1.04% | 2.01% | 2.08% |
| Supplemental data | | | | | |
| Portfolio turnover | 16% | 204% | 54% | 184% | 149% |
| Net assets, end of period (in thousands) | $8,282 | $8,363 | $8,294 | $6,668 | $6,434 |
| Notes to Financial Highlights |
| (a) | In addition to the fees and expenses that the Fund bears directly, the Fund indirectly bears a pro rata share of the fees and expenses of any other funds in which it invests. Such indirect expenses are not included in the Fund’s reported expense ratios. |
| (b) | Ratios include interest on collateral expense which is less than 0.01%. |
| (c) | Ratios include interfund lending expense which is less than 0.01%. |
| (d) | Total net expenses include the impact of certain fee waivers/expense reimbursements made by the Investment Manager and certain of its affiliates, if applicable. |
The accompanying Notes to Financial Statements are an integral part of this statement.
| 16 | Columbia Solutions Aggressive Portfolio | Annual Report 2023 |
Notes to Financial Statements
March 31, 2023
Note 1. Organization
Columbia Solutions Aggressive Portfolio (the Fund), a series of Columbia Funds Series Trust I (the Trust), is a diversified fund. The Trust is registered under the Investment Company Act of 1940, as amended (the 1940 Act), as an open-end management investment company organized as a Massachusetts business trust.
Fund shares
The Trust may issue an unlimited number of shares (without par value). The Fund is sold only to other Columbia Funds and certain collective investment trusts managed by Columbia Management Investment Advisers, LLC.
Note 2. Summary of significant accounting policies
Basis of preparation
The Fund is an investment company that applies the accounting and reporting guidance in the Financial Accounting Standards Board (FASB) Accounting Standards Codification Topic 946, Financial Services - Investment Companies (ASC 946). The financial statements are prepared in accordance with U.S. generally accepted accounting principles (GAAP), which requires management to make certain estimates and assumptions that affect the reported amounts of assets and liabilities, the disclosure of contingent assets and liabilities at the date of the financial statements and the reported amounts of income and expenses during the reporting period. Actual results could differ from those estimates.
The following is a summary of significant accounting policies followed by the Fund in the preparation of its financial statements.
Security valuation
Debt securities generally are valued based on prices obtained from pricing services, which are intended to reflect market transactions for normal, institutional-size trading units of similar securities. The services may use various pricing techniques that take into account, as applicable, factors such as yield, quality, coupon rate, maturity, type of issue, trading characteristics and other data, as well as approved independent broker-dealer quotes. Debt securities for which quotations are not readily available or not believed to be reflective of market value may also be valued based upon a bid quote from an approved independent broker-dealer. Debt securities maturing in 60 days or less are valued primarily at amortized market value, unless this method results in a valuation that management believes does not approximate fair value.
Investments in open-end investment companies (other than exchange-traded funds (ETFs)), are valued at the latest net asset value reported by those companies as of the valuation time.
Forward foreign currency exchange contracts are marked-to-market based upon foreign currency exchange rates provided by a pricing service.
Futures and options on futures contracts are valued based upon the settlement price at the close of regular trading on their principal exchanges or, in the absence of a settlement price, at the mean of the latest quoted bid and ask prices.
Swap transactions are valued through an independent pricing service or broker, or if neither is available, through an internal model based upon observable inputs.
Investments for which market quotations are not readily available, or that have quotations which management believes are not reflective of market value or reliable, are valued at fair value as determined in good faith under procedures approved by the Board of Trustees. If a security or class of securities (such as foreign securities) is valued at fair value, such value is likely to be different from the quoted or published price for the security, if available.
The determination of fair value often requires significant judgment. To determine fair value, management may use assumptions including but not limited to future cash flows and estimated risk premiums. Multiple inputs from various sources may be used to determine fair value.
Columbia Solutions Aggressive Portfolio | Annual Report 2023
| 17 |
Notes to Financial Statements (continued)
March 31, 2023
GAAP requires disclosure regarding the inputs and valuation techniques used to measure fair value and any changes in valuation inputs or techniques. In addition, investments shall be disclosed by major category. This information is disclosed following the Fund’s Portfolio of Investments.
Foreign currency transactions and translations
The values of all assets and liabilities denominated in foreign currencies are generally translated into U.S. dollars at exchange rates determined at the close of regular trading on the New York Stock Exchange. Net realized and unrealized gains (losses) on foreign currency transactions and translations include gains (losses) arising from the fluctuation in exchange rates between trade and settlement dates on securities transactions, gains (losses) arising from the disposition of foreign currency and currency gains (losses) between the accrual and payment dates on dividends, interest income and foreign withholding taxes.
For financial statement purposes, the Fund does not distinguish that portion of gains (losses) on investments which is due to changes in foreign exchange rates from that which is due to changes in market prices of the investments. Such fluctuations are included with the net realized and unrealized gains (losses) on investments in the Statement of Operations.
Derivative instruments
The Fund invests in certain derivative instruments, as detailed below, in seeking to meet its investment objectives. Derivatives are instruments whose values depend on, or are derived from, in whole or in part, the value of one or more securities, currencies, commodities, indices, or other assets or instruments. Derivatives may be used to increase investment flexibility (including to maintain cash reserves while maintaining desired exposure to certain assets), for risk management (hedging) purposes, to facilitate trading, to reduce transaction costs and to pursue higher investment returns. The Fund may also use derivative instruments to mitigate certain investment risks, such as foreign currency exchange rate risk, interest rate risk and credit risk. Derivatives may involve various risks, including the potential inability of the counterparty to fulfill its obligations under the terms of the contract, the potential for an illiquid secondary market (making it difficult for the Fund to sell or terminate, including at favorable prices) and the potential for market movements which may expose the Fund to gains or losses in excess of the amount shown in the Statement of Assets and Liabilities. The notional amounts of derivative instruments, if applicable, are not recorded in the financial statements.
A derivative instrument may suffer a marked-to-market loss if the value of the contract decreases due to an unfavorable change in the market rates or values of the underlying instrument. Losses can also occur if the counterparty does not perform its obligations under the contract. The Fund’s risk of loss from counterparty credit risk on over-the-counter derivatives is generally limited to the aggregate unrealized gain netted against any collateral held by the Fund and the amount of any variation margin held by the counterparty, plus any replacement costs or related amounts. With exchange-traded or centrally cleared derivatives, there is reduced counterparty credit risk to the Fund since the clearinghouse or central counterparty (CCP) provides some protection in the case of clearing member default. The clearinghouse or CCP stands between the buyer and the seller of the contract; therefore, failure of the clearinghouse or CCP may pose additional counterparty credit risk. However, credit risk still exists in exchange-traded or centrally cleared derivatives with respect to initial and variation margin that is held in a broker’s customer account. While clearing brokers are required to segregate customer margin from their own assets, in the event that a clearing broker becomes insolvent or goes into bankruptcy and at that time there is a shortfall in the aggregate amount of margin held by the clearing broker for all its clients and such shortfall is remedied by the CCP or otherwise, U.S. bankruptcy laws will typically allocate that shortfall on a pro-rata basis across all the clearing broker’s customers (including the Fund), potentially resulting in losses to the Fund.
In order to better define its contractual rights and to secure rights that will help the Fund mitigate its counterparty risk, the Fund may enter into an International Swaps and Derivatives Association, Inc. Master Agreement (ISDA Master Agreement) or similar agreement with its derivatives counterparties. An ISDA Master Agreement is an agreement between the Fund and a counterparty that governs over-the-counter derivatives and foreign exchange forward contracts and contains, among other things, collateral posting terms and netting provisions in the event of a default and/or termination event. Under an ISDA Master Agreement, the Fund may, under certain circumstances, offset with the counterparty certain derivative instruments’ payables and/or receivables with collateral held and/or posted and create one single net payment. The provisions of the
| 18 | Columbia Solutions Aggressive Portfolio | Annual Report 2023 |
Notes to Financial Statements (continued)
March 31, 2023
ISDA Master Agreement typically permit a single net payment in the event of default (close-out netting), including the bankruptcy or insolvency of the counterparty. Note, however, that bankruptcy or insolvency laws of a particular jurisdiction may impose restrictions on or prohibitions against the right of offset or netting in bankruptcy, insolvency or other events.
Collateral (margin) requirements differ by type of derivative. Margin requirements are established by the clearinghouse or CCP for exchange-traded and centrally cleared derivatives. Brokers can ask for margin in excess of the minimum in certain circumstances. Collateral terms for most over-the-counter derivatives are subject to regulatory requirements to exchange variation margin with trading counterparties and may have contract specific margin terms as well. For over-the-counter derivatives traded under an ISDA Master Agreement, the collateral requirements are typically calculated by netting the marked-to-market amount for each transaction under such agreement and comparing that amount to the value of any variation margin currently pledged by the Fund and/or the counterparty. Generally, the amount of collateral due from or to a party has to exceed a minimum transfer amount threshold (e.g., $250,000) before a transfer has to be made. To the extent amounts due to the Fund from its counterparties are not fully collateralized, contractually or otherwise, the Fund bears the risk of loss from counterparty nonperformance. The Fund may also pay interest expense on cash collateral received from the broker or receive interest income on cash collateral pledged to the broker. The Fund attempts to mitigate counterparty risk by only entering into agreements with counterparties that it believes have the financial resources to honor their obligations and by monitoring the financial stability of those counterparties.
Certain ISDA Master Agreements allow counterparties of over-the-counter derivatives transactions to terminate derivatives contracts prior to maturity in the event the Fund’s net asset value declines by a stated percentage over a specified time period or if the Fund fails to meet certain terms of the ISDA Master Agreement, which would cause the Fund to accelerate payment of any net liability owed to the counterparty. The Fund also has termination rights if the counterparty fails to meet certain terms of the ISDA Master Agreement. In determining whether to exercise such termination rights, the Fund would consider, in addition to counterparty credit risk, whether termination would result in a net liability owed from the counterparty.
For financial reporting purposes, the Fund does not offset derivative assets and derivative liabilities that are subject to netting arrangements in the Statement of Assets and Liabilities.
Forward foreign currency exchange contracts
Forward foreign currency exchange contracts are over-the-counter agreements between two parties to buy and sell a currency at a set price on a future date. The Fund utilized forward foreign currency exchange contracts to hedge the currency exposure associated with some or all of the Fund’s securities, to shift foreign currency exposure back to U.S. dollars, to shift U.S. dollar exposure to achieve a representative weighted mix of major currencies in its benchmark and to generate total return through long and short positions versus the U.S. dollar. These instruments may be used for other purposes in future periods.
The values of forward foreign currency exchange contracts fluctuate daily with changes in foreign currency exchange rates. Changes in the value of these contracts are recorded as unrealized appreciation or depreciation until the contract is exercised or has expired. The Fund will realize a gain or loss when the forward foreign currency exchange contract is closed or expires. Non-deliverable forward foreign currency exchange contracts are settled with the counterparty in U.S. dollars without delivery of foreign currency.
The use of forward foreign currency exchange contracts does not eliminate fluctuations in the prices of the Fund’s portfolio securities. The risks of forward foreign currency exchange contracts include movement in the values of the foreign currencies relative to the U.S. dollar (or other foreign currencies) and the possibility that counterparties will not complete their contractual obligations, which may be in excess of the amount reflected, if any, in the Statement of Assets and Liabilities.
Futures contracts
Futures contracts are exchange-traded and represent commitments for the future purchase or sale of an asset at a specified price on a specified date. The Fund bought and sold futures contracts to manage the duration and yield curve exposure of the Fund versus the benchmark, to manage exposure to movements in interest rates, to manage exposure to the securities market and to maintain appropriate equity market exposure while keeping sufficient cash to accommodate daily redemptions. These instruments may be used for other purposes in future periods. Upon entering into futures contracts, the Fund bears
Columbia Solutions Aggressive Portfolio | Annual Report 2023
| 19 |
Notes to Financial Statements (continued)
March 31, 2023
risks that it may not achieve the anticipated benefits of the futures contracts and may realize a loss. Additional risks include counterparty credit risk, the possibility of an illiquid market, and that a change in the value of the contract or option may not correlate with changes in the value of the underlying asset.
Upon entering into a futures contract, the Fund deposits cash or securities with the broker, known as a futures commission merchant (FCM), in an amount sufficient to meet the initial margin requirement. The initial margin deposit must be maintained at an established level over the life of the contract. Cash deposited as initial margin is recorded in the Statement of Assets and Liabilities as margin deposits. Securities deposited as initial margin are designated in the Portfolio of Investments. Subsequent payments (variation margin) are made or received by the Fund each day. The variation margin payments are equal to the daily change in the contract value and are recorded as variation margin receivable or payable and are offset in unrealized gains or losses. The Fund generally expects to earn interest income on its margin deposits. The Fund recognizes a realized gain or loss when the contract is closed or expires. Futures contracts involve, to varying degrees, risk of loss in excess of the variation margin disclosed in the Statement of Assets and Liabilities.
Swap contracts
Swap contracts are negotiated in the over-the-counter market and are entered into bilaterally or centrally cleared (centrally cleared swap contract). In a centrally cleared swap contract, immediately following execution of the swap contract with a broker, the swap contract is novated to a central counterparty (the CCP) and the CCP becomes the Fund’s counterparty to the centrally cleared swap contract. The Fund is required to deposit initial margin with the futures commission merchant (FCM), which pledges it through to the CCP in the form of cash or securities in an amount that varies depending on the size and risk profile of the particular swap contract. Securities deposited as initial margin are designated in the Portfolio of Investments and cash deposited is recorded in the Statement of Assets and Liabilities as margin deposits. For a bilateral swap contract, the Fund has credit exposure to the broker, but exchanges daily variation margin with the broker based on the mark-to-market value of the swap contract to minimize that exposure. For centrally cleared swap contracts, the Fund has minimal credit exposure to the FCM because the CCP stands between the Fund and the relevant buyer/seller on the other side of the contract. Swap contracts are marked-to-market daily and changes in value are recorded as unrealized appreciation (depreciation). The daily change in valuation of centrally cleared swap contracts, if any, is recorded as a receivable or payable for variation margin in the Statement of Assets and Liabilities.
Entering into these contracts involves, to varying degrees, elements of interest, liquidity and counterparty credit risk in excess of the amounts recognized in the Statement of Assets and Liabilities. Such risks involve the possibility that there may be unfavorable changes in interest rates, market conditions or other conditions, that it may be difficult to initiate a swap transaction or liquidate a position at an advantageous time or price which may result in significant losses, and that the bilateral counterparty, FCM or CCP, as applicable, may not fulfill its obligation under the contract.
Credit default swap contracts
The Fund entered into credit default swap contracts to increase or decrease its credit exposure to an index and to manage credit risk exposure. These instruments may be used for other purposes in future periods. Credit default swap contracts are transactions in which one party pays fixed periodic payments to a counterparty in consideration for an agreement from the counterparty to make a specific payment should a specified credit event(s) take place. Although specified credit events are contract specific, credit events are typically bankruptcy, failure to pay, restructuring, obligation acceleration, obligation default, or repudiation/moratorium.
As the purchaser of a credit default swap contract, the Fund purchases protection by paying a periodic interest rate on the notional amount to the counterparty. The interest amount is accrued daily as a component of unrealized appreciation (depreciation) and is recorded as a realized loss upon payment. If a credit event as specified in the contract occurs, the Fund may have the option either to deliver the reference obligation to the seller in exchange for a cash payment of its par amount, or to receive a net cash settlement equal to the par amount less an agreed-upon value of the reference obligation as of the date of the credit event. The difference between the value of the obligation or cash delivered and the notional amount received will be recorded as a realized gain (loss).
| 20 | Columbia Solutions Aggressive Portfolio | Annual Report 2023 |
Notes to Financial Statements (continued)
March 31, 2023
As the seller of a credit default swap contract, the Fund sells protection to a buyer and will generally receive a periodic interest rate on a notional amount. The interest amount is accrued daily as a component of unrealized appreciation (depreciation) and is recorded as a realized gain upon receipt of the payment. If a credit event as specified in the contract with the counterparty occurs, the Fund may either be required to accept the reference obligation from the buyer in exchange for a cash payment of its notional amount, or to pay the buyer a net cash settlement equal to the notional amount less an agreed-upon value of the reference obligation (recovery value) as of the date of the credit event. The difference between the value of the obligation or cash received and the notional amount paid will be recorded as a realized gain (loss). The maximum potential amount of undiscounted future payments the Fund could be required to make as the seller of protection under a credit default swap contract is equal to the notional amount of the reference obligation. These potential amounts may be partially offset by any recovery values of the respective reference obligations or upfront receipts upon entering into the agreement. The notional amounts and market values of all credit default swap contracts in which the Fund is the seller of protection, if any, are disclosed in the Credit Default Swap Contracts Outstanding schedule following the Portfolio of Investments.
As a protection seller, the Fund bears the risk of loss from the credit events specified in the contract with the counterparty. For credit default swap contracts on credit indices, quoted market prices and resulting market values serve as an indicator of the current status of the payment/performance risk. Increasing market values, in absolute terms when compared to the notional amount of the swap, represent a deterioration of the reference entity’s credit soundness and a greater likelihood or risk of default or other credit event occurring as defined under the terms of the contract.
Any upfront payment or receipt by the Fund upon entering into a credit default swap contract is recorded as an asset or liability, respectively, and amortized daily as a component of realized gain (loss) in the Statement of Operations. Credit default swap contracts are valued daily, and the change in value is recorded as unrealized appreciation (depreciation) until the termination of the swap, at which time a realized gain (loss) is recorded.
Credit default swap contracts can involve greater risks than if a fund had invested in the reference obligation directly since, in addition to general market risks, credit default swaps are subject to counterparty credit risk, leverage risk, hedging risk, correlation risk and liquidity risk.
Interest rate and inflation rate swap contracts
The Fund entered into interest rate swap transactions and/or inflation rate swap contracts to manage interest rate and market risk exposure to produce incremental earnings and to synthetically add or subtract principal exposure to a market. These instruments may be used for other purposes in future periods. An interest rate swap or inflation rate swap, as applicable, is an agreement between two parties where there are two flows and payments are made between the two counterparties and the payments are dependent upon changes in an interest rate, inflation rate or inflation index calculated on a nominal amount. Interest rate swaps are agreements between two parties that involve the exchange of one type of interest rate for another type of interest rate cash flow on specified dates in the future, based on a predetermined, specified notional amount. Certain interest rate swaps are considered forward-starting, whereby the accrual for the exchange of cash flows does not begin until a specified date in the future. The net cash flow for a standard interest rate swap transaction is generally the difference between a floating market interest rate versus a fixed interest rate.
Interest rate swaps are valued daily and unrealized appreciation (depreciation) is recorded. Certain interest rate swaps may accrue periodic interest on a daily basis as a component of unrealized appreciation (depreciation); the Fund will realize a gain or loss upon the payment or receipt of accrued interest. The Fund will realize a gain or a loss when the interest rate swap is terminated.
Effects of derivative transactions in the financial statements
The following tables are intended to provide additional information about the effect of derivatives on the financial statements of the Fund, including: the fair value of derivatives by risk category and the location of those fair values in the Statement of Assets and Liabilities; and the impact of derivative transactions over the period in the Statement of Operations, including realized and unrealized gains (losses). The derivative instrument schedules following the Portfolio of Investments present additional information regarding derivative instruments outstanding at the end of the period, if any.
Columbia Solutions Aggressive Portfolio | Annual Report 2023
| 21 |
Notes to Financial Statements (continued)
March 31, 2023
The following table is a summary of the fair value of derivative instruments (not considered to be hedging instruments for accounting disclosure purposes) at March 31, 2023:
| | Asset derivatives | |
Risk exposure
category | Statement
of assets and liabilities
location | Fair value ($) |
| Credit risk | Component of total distributable earnings (loss) — unrealized appreciation on swap contracts | 17,589* |
| Equity risk | Component of total distributable earnings (loss) — unrealized appreciation on futures contracts | 285,120* |
| Foreign exchange risk | Unrealized appreciation on forward foreign currency exchange contracts | 1,731 |
| Interest rate risk | Component of total distributable earnings (loss) — unrealized appreciation on futures contracts | 68,730* |
| Total | | 373,170 |
| | Liability derivatives | |
Risk exposure
category | Statement
of assets and liabilities
location | Fair value ($) |
| Equity risk | Component of total distributable earnings (loss) — unrealized depreciation on futures contracts | 225* |
| Foreign exchange risk | Unrealized depreciation on forward foreign currency exchange contracts | 35,502 |
| Interest rate risk | Component of total distributable earnings (loss) — unrealized depreciation on futures contracts | 5,518* |
| Total | | 41,245 |
| * | Includes cumulative appreciation (depreciation) as reported in the tables following the Portfolio of Investments. Only the current day’s variation margin is reported in receivables or payables in the Statement of Assets and Liabilities. |
The following table indicates the effect of derivative instruments (not considered to be hedging instruments for accounting disclosure purposes) in the Statement of Operations for the year ended March 31, 2023:
| Amount of realized gain (loss) on derivatives recognized in income |
| Risk exposure category | Forward
foreign
currency
exchange
contracts
($) | Futures
contracts
($) | Swap
contracts
($) | Total
($) |
| Credit risk | — | — | (2,832) | (2,832) |
| Equity risk | — | (451,983) | — | (451,983) |
| Foreign exchange risk | 266,423 | — | — | 266,423 |
| Interest rate risk | — | (369,151) | 10,495 | (358,656) |
| Total | 266,423 | (821,134) | 7,663 | (547,048) |
| |
| Change in unrealized appreciation (depreciation) on derivatives recognized in income |
| Risk exposure category | Forward
foreign
currency
exchange
contracts
($) | Futures
contracts
($) | Swap
contracts
($) | Total
($) |
| Credit risk | — | — | 12,045 | 12,045 |
| Equity risk | — | 140,583 | — | 140,583 |
| Foreign exchange risk | (30,644) | — | — | (30,644) |
| Interest rate risk | — | 146,898 | (7,293) | 139,605 |
| Total | (30,644) | 287,481 | 4,752 | 261,589 |
| 22 | Columbia Solutions Aggressive Portfolio | Annual Report 2023 |
Notes to Financial Statements (continued)
March 31, 2023
The following table is a summary of the average outstanding volume by derivative instrument for the year ended March 31, 2023:
| Derivative instrument | Average notional
amounts ($)* |
| Futures contracts — long | 6,496,421 |
| Futures contracts — short | 96,165 |
| Credit default swap contracts — sell protection | 870,505 |
| Derivative instrument | Average unrealized
appreciation ($) | Average unrealized
depreciation ($) |
| Forward foreign currency exchange contracts | 43,796* | (20,021)* |
| Interest rate swap contracts | 836** | — |
| * | Based on the ending quarterly outstanding amounts for the year ended March 31, 2023. |
| ** | Based on the ending daily outstanding amounts for the year ended March 31, 2023. |
Offsetting of assets and liabilities
The following table presents the Fund’s gross and net amount of assets and liabilities available for offset under netting arrangements as well as any related collateral received or pledged by the Fund as of March 31, 2023:
| | Citi ($) | Goldman
Sachs
International ($) | HSBC ($) | Morgan
Stanley ($) | Standard
Chartered ($) | UBS ($) | Total ($) | | |
| Assets | | | | | | | | | |
| Centrally cleared credit default swap contracts (a) | - | - | - | 5,483 | - | - | 5,483 | | |
| Forward foreign currency exchange contracts | 1,436 | - | - | - | 192 | 103 | 1,731 | | |
| Total assets | 1,436 | - | - | 5,483 | 192 | 103 | 7,214 | | |
| Liabilities | | | | | | | | | |
| Forward foreign currency exchange contracts | 18,385 | 77 | 10,019 | - | - | 7,021 | 35,502 | | |
| Total financial and derivative net assets | (16,949) | (77) | (10,019) | 5,483 | 192 | (6,918) | (28,288) | | |
| Total collateral received (pledged) (b) | - | - | - | - | - | - | - | | |
| Net amount (c) | (16,949) | (77) | (10,019) | 5,483 | 192 | (6,918) | (28,288) | | |
| (a) | Centrally cleared swaps are included within payable/receivable for variation margin in the Statement of Assets and Liabilities. |
| (b) | In some instances, the actual collateral received and/or pledged may be more than the amount shown due to overcollateralization. |
| (c) | Represents the net amount due from/(to) counterparties in the event of default. |
Security transactions
Security transactions are accounted for on the trade date. Cost is determined and gains (losses) are based upon the specific identification method for both financial statement and federal income tax purposes.
Income recognition
Interest income is recorded on an accrual basis. Market premiums and discounts, including original issue discounts, are amortized and accreted, respectively, over the expected life of the security on all debt securities, unless otherwise noted.
The Fund may place a debt security on non-accrual status and reduce related interest income when it becomes probable that the interest will not be collected and the amount of uncollectible interest can be reasonably estimated. The Fund may also adjust accrual rates when it becomes probable the full interest will not be collected and a partial payment will be received. A defaulted debt security is removed from non-accrual status when the issuer resumes interest payments or when collectability of interest is reasonably assured.
Dividend income is recorded on the ex-dividend date.
Columbia Solutions Aggressive Portfolio | Annual Report 2023
| 23 |
Notes to Financial Statements (continued)
March 31, 2023
Expenses
General expenses of the Trust are allocated to the Fund and other funds of the Trust based upon relative net assets or other expense allocation methodologies determined by the nature of the expense. Expenses directly attributable to the Fund are charged to the Fund.
Determination of net asset value
The net asset value per share of the Fund is computed by dividing the value of the net assets of the Fund by the total number of outstanding shares of that Fund, rounded to the nearest cent, at the close of regular trading (ordinarily 4:00 p.m. Eastern Time) every day the New York Stock Exchange is open.
Federal income tax status
The Fund intends to qualify each year as a regulated investment company under Subchapter M of the Internal Revenue Code, as amended, and will distribute substantially all of its investment company taxable income and net capital gain, if any, for its tax year, and as such will not be subject to federal income taxes. In addition, the Fund intends to distribute in each calendar year substantially all of its ordinary income, capital gain net income and certain other amounts, if any, such that the Fund should not be subject to federal excise tax. Therefore, no federal income or excise tax provision is recorded.
Foreign taxes
The Fund may be subject to foreign taxes on income, gains on investments or currency repatriation, a portion of which may be recoverable. The Fund will accrue such taxes and recoveries, as applicable, based upon its current interpretation of tax rules and regulations that exist in the markets in which it invests.
Realized gains in certain countries may be subject to foreign taxes at the Fund level, based on statutory rates. The Fund accrues for such foreign taxes on realized and unrealized gains at the appropriate rate for each jurisdiction, as applicable. The amount, if any, is disclosed as a liability in the Statement of Assets and Liabilities.
Distributions to shareholders
Distributions from net investment income, if any, are declared and paid annually. Net realized capital gains, if any, are distributed at least annually. Income distributions and capital gain distributions are determined in accordance with federal income tax regulations, which may differ from GAAP.
Guarantees and indemnifications
Under the Trust’s organizational documents and, in some cases, by contract, its officers and trustees are indemnified against certain liabilities arising out of the performance of their duties to the Trust or its funds. In addition, certain of the Fund’s contracts with its service providers contain general indemnification clauses. The Fund’s maximum exposure under these arrangements is unknown since the amount of any future claims that may be made against the Fund cannot be determined, and the Fund has no historical basis for predicting the likelihood of any such claims.
Recent accounting pronouncement
Tailored Shareholder Reports
In October 2022, the Securities and Exchange Commission (SEC) adopted a final rule relating to Tailored Shareholder Reports for Mutual Funds and Exchange-Traded Funds; Fee Information in Investment Company Advertisements. The rule and form amendments will, among other things, require the Fund to transmit concise and visually engaging shareholder reports that highlight key information. The amendments will require that funds tag information in a structured data format and that certain more in-depth information be made available online and available for delivery free of charge to investors on request. The amendments became effective January 24, 2023. There is an 18-month transition period after the effective date of the amendment.
| 24 | Columbia Solutions Aggressive Portfolio | Annual Report 2023 |
Notes to Financial Statements (continued)
March 31, 2023
Note 3. Fees and other transactions with affiliates
Management services fees
The Fund has entered into a Management Agreement with Columbia Management Investment Advisers, LLC (the Investment Manager), a wholly-owned subsidiary of Ameriprise Financial, Inc. (Ameriprise Financial). Under the Management Agreement, subject to the policies set by the Board of Trustees, the Investment Manager provides the Fund with investment research and advice, as well as administrative and accounting services. The Fund does not pay a management fee for the investment advisory or administrative services provided to the Fund, but it may pay taxes, brokerage commissions and nonadvisory expenses.
Compensation of board members
Members of the Board of Trustees who are not officers or employees of the Investment Manager or Ameriprise Financial are compensated for their services to the Fund as disclosed in the Statement of Operations. Under a Deferred Compensation Plan (the Deferred Plan), these members of the Board of Trustees may elect to defer payment of up to 100% of their compensation. Deferred amounts are treated as though equivalent dollar amounts had been invested in shares of certain funds managed by the Investment Manager. The Fund’s liability for these amounts is adjusted for market value changes and remains in the Fund until distributed in accordance with the Deferred Plan. All amounts payable under the Deferred Plan constitute a general unsecured obligation of the Fund. The expense for the Deferred Plan, which includes Trustees’ fees deferred during the current period as well as any gains or losses on the Trustees’ deferred compensation balances as a result of market fluctuations, is included in "Compensation of board members" in the Statement of Operations.
Compensation of Chief Compliance Officer
The Board of Trustees has appointed a Chief Compliance Officer for the Fund in accordance with federal securities regulations. As disclosed in the Statement of Operations, a portion of the Chief Compliance Officer’s total compensation is allocated to the Fund, along with other allocations to affiliated registered investment companies managed by the Investment Manager and its affiliates, based on relative net assets.
Transfer agency fees
The Fund has a Transfer and Dividend Disbursing Agent Agreement with Columbia Management Investment Services Corp. (the Transfer Agent), an affiliate of the Investment Manager and a wholly-owned subsidiary of Ameriprise Financial, under which the Fund does not pay an annual fee to the Transfer Agent.
Distribution and service fees
The Fund has an agreement with Columbia Management Investment Distributors, Inc. (the Distributor), an affiliate of the Investment Manager and a wholly-owned subsidiary of Ameriprise Financial, for distribution and shareholder services. The Fund does not pay the Distributor a fee for the distribution services it provides to the Fund.
Expenses waived/reimbursed by the Investment Manager and its affiliates
The Investment Manager and certain of its affiliates have contractually agreed to waive fees and/or reimburse expenses (excluding certain fees and expenses described below), through July 31, 2032, unless sooner terminated at the sole discretion of the Board of Trustees, so that the Fund’s net operating expenses, after giving effect to fees waived/expenses reimbursed and any balance credits and/or overdraft charges from the Fund’s custodian, do not exceed the annual rate of 0.01% of the Fund’s average daily net assets.
Under the agreement governing this fee waiver and/or expense reimbursement arrangement, the following fees and expenses are excluded from the waiver/reimbursement commitment, and therefore will be paid by the Fund, if applicable: taxes (including foreign transaction taxes), expenses associated with investments in affiliated and non-affiliated pooled investment vehicles (including mutual funds and exchange-traded funds), transaction costs and brokerage commissions, costs related to any securities lending program, dividend expenses associated with securities sold short, inverse floater program fees and expenses, transaction charges and interest on borrowed money, interest, costs associated with shareholder meetings, infrequent and/or unusual expenses and any other expenses the exclusion of which is specifically
Columbia Solutions Aggressive Portfolio | Annual Report 2023
| 25 |
Notes to Financial Statements (continued)
March 31, 2023
approved by the Board of Trustees. This agreement may be modified or amended only with approval from the Investment Manager, certain of its affiliates and the Fund. Any fees waived and/or expenses reimbursed under the expense reimbursement arrangements described above are not recoverable by the Investment Manager or its affiliates in future periods.
Note 4. Federal tax information
The timing and character of income and capital gain distributions are determined in accordance with income tax regulations, which may differ from GAAP because of temporary or permanent book to tax differences.
At March 31, 2023, these differences were primarily due to differing treatment for deferral/reversal of wash sale losses, foreign currency transactions, derivative investments, tax straddles, late-year ordinary losses, capital loss carryforwards and swap investments. To the extent these differences were permanent, reclassifications were made among the components of the Fund’s net assets. Temporary differences do not require reclassifications.
The following reclassifications were made:
Excess of distributions
over net investment
income ($) | Accumulated
net realized
(loss) ($) | Paid in
capital ($) |
| 219,656 | (219,656) | — |
Net investment income (loss) and net realized gains (losses), as disclosed in the Statement of Operations, and net assets were not affected by this reclassification.
The tax character of distributions paid during the years indicated was as follows:
| Year Ended March 31, 2023 | Year Ended March 31, 2022 |
Ordinary
income ($) | Long-term
capital gains ($) | Total ($) | Ordinary
income ($) | Long-term
capital gains ($) | Total ($) |
| 666,913 | — | 666,913 | 1,209,885 | 1,496,028 | 2,705,913 |
Short-term capital gain distributions, if any, are considered ordinary income distributions for tax purposes.
At March 31, 2023, the components of distributable earnings on a tax basis were as follows:
Undistributed
ordinary income ($) | Undistributed
long-term
capital gains ($) | Capital loss
carryforwards ($) | Net unrealized
(depreciation) ($) |
| — | — | (962,195) | (819,511) |
At March 31, 2023, the cost of all investments for federal income tax purposes along with the aggregate gross unrealized appreciation and depreciation based on that cost was:
Federal
tax cost ($) | Gross unrealized
appreciation ($) | Gross unrealized
(depreciation) ($) | Net unrealized
(depreciation) ($) |
| 8,877,254 | 10,090 | (829,601) | (819,511) |
Tax cost of investments and unrealized appreciation/(depreciation) may also include timing differences that do not constitute adjustments to tax basis.
The following capital loss carryforwards, determined at March 31, 2023, may be available to reduce future net realized gains on investments, if any, to the extent permitted by the Internal Revenue Code. In addition, for the year ended March 31, 2023, capital loss carryforwards utilized, if any, were as follows:
No expiration
short-term ($) | No expiration
long-term ($) | Total ($) | Utilized ($) |
| (597,291) | (364,904) | (962,195) | — |
| 26 | Columbia Solutions Aggressive Portfolio | Annual Report 2023 |
Notes to Financial Statements (continued)
March 31, 2023
Under current tax rules, regulated investment companies can elect to treat certain late-year ordinary losses incurred and post-October capital losses (capital losses realized after October 31) as arising on the first day of the following taxable year. As of March 31, 2023, the Fund will elect to treat the following late-year ordinary losses and post-October capital losses as arising on April 1, 2023.
Late year
ordinary losses ($) | Post-October
capital losses ($) |
| 223,424 | — |
Management of the Fund has concluded that there are no significant uncertain tax positions in the Fund that would require recognition in the financial statements. However, management’s conclusion may be subject to review and adjustment at a later date based on factors including, but not limited to, new tax laws, regulations, and administrative interpretations (including relevant court decisions). Generally, the Fund’s federal tax returns for the prior three fiscal years remain subject to examination by the Internal Revenue Service.
Note 5. Portfolio information
The cost of purchases and proceeds from sales of securities, excluding short-term investments and derivatives, if any, aggregated to $936,559 and $1,426,701, respectively, for the year ended March 31, 2023, of which $317,363 and $703,058, respectively, were U.S. government securities. The amount of purchase and sale activity impacts the portfolio turnover rate reported in the Financial Highlights.
Note 6. Affiliated money market fund
The Fund invests significantly in Columbia Short-Term Cash Fund, an affiliated money market fund established for the exclusive use by the Fund and other affiliated funds (the Affiliated MMF). The income earned by the Fund from such investments is included as Dividends - affiliated issuers in the Statement of Operations. As an investing fund, the Fund indirectly bears its proportionate share of the expenses of the Affiliated MMF. The Affiliated MMF prices its shares with a floating net asset value. In addition, the Board of Trustees of the Affiliated MMF may impose a fee on redemptions (sometimes referred to as a liquidity fee) or temporarily suspend redemptions (sometimes referred to as imposing a redemption gate) in the event its liquidity falls below regulatory limits.
Note 7. Interfund lending
Pursuant to an exemptive order granted by the Securities and Exchange Commission, the Fund participates in a program (the Interfund Program) allowing each participating Columbia Fund (each, a Participating Fund) to lend money directly to and, except for closed-end funds and money market funds, borrow money directly from other Participating Funds for temporary purposes. The amounts eligible for borrowing and lending under the Interfund Program are subject to certain restrictions.
Interfund loans are subject to the risk that the borrowing fund could be unable to repay the loan when due, and a delay in repayment to the lending fund could result in lost opportunities and/or additional lending costs. The exemptive order is subject to conditions intended to mitigate conflicts of interest arising from the Investment Manager’s relationship with each Participating Fund.
The Fund did not borrow or lend money under the Interfund Program during the year ended March 31, 2023.
Note 8. Line of credit
The Fund has access to a revolving credit facility with a syndicate of banks led by JPMorgan Chase Bank, N.A., Citibank, N.A. and Wells Fargo Bank, N.A. whereby the Fund may borrow for the temporary funding of shareholder redemptions or for other temporary or emergency purposes. Pursuant to an October 27, 2022 amendment and restatement, the credit facility, which is an agreement between the Fund and certain other funds managed by the Investment Manager or an affiliated investment manager, severally and not jointly, permits aggregate borrowings up to $950 million. Interest is currently charged to each participating fund based on its borrowings at a rate equal to the higher of (i) the federal funds effective rate, (ii) the secured overnight financing rate plus 0.10% and (iii) the overnight bank funding rate, plus in each case, 1.00%. Each borrowing under the credit facility matures no later than 60 days after the date of borrowing. The Fund also pays a commitment fee equal to
Columbia Solutions Aggressive Portfolio | Annual Report 2023
| 27 |
Notes to Financial Statements (continued)
March 31, 2023
its pro rata share of the unused amount of the credit facility at a rate of 0.15% per annum. The commitment fee is included in other expenses in the Statement of Operations. This agreement expires annually in October unless extended or renewed. Prior to the October 27, 2022 amendment and restatement, the Fund had access to a revolving credit facility with a syndicate of banks led by JPMorgan Chase Bank, N.A., Citibank, N.A. and Wells Fargo Bank, N.A. which permitted collective borrowings up to $950 million. Interest was charged to each participating fund based on its borrowings at a rate equal to the higher of (i) the federal funds effective rate, (ii) the secured overnight financing rate plus 0.11448% and (iii) the overnight bank funding rate, plus in each case, 1.00%.
The Fund had no borrowings during the year ended March 31, 2023.
Note 9. Significant risks
Credit risk
Credit risk is the risk that the value of debt instruments in the Fund’s portfolio may decline because the issuer defaults or otherwise becomes unable or unwilling, or is perceived to be unable or unwilling, to honor its financial obligations, such as making payments to the Fund when due. Credit rating agencies assign credit ratings to certain debt instruments to indicate their credit risk. Lower-rated or unrated debt instruments held by the Fund may present increased credit risk as compared to higher-rated debt instruments.
Derivatives risk
Losses involving derivative instruments may be substantial, because a relatively small movement in the underlying reference (which is generally the price, rate or other economic indicator associated with a security(ies), commodity, currency, index or other instrument or asset) may result in a substantial loss for the Fund. In addition to the potential for increased losses, the use of derivative instruments may lead to increased volatility within the Fund. Derivatives will typically increase the Fund’s exposure to principal risks to which it is otherwise exposed, and may expose the Fund to additional risks, including correlation risk, counterparty risk, hedging risk, leverage risk, liquidity risk and pricing risk.
Foreign currency risk
The performance of the Fund may be materially affected positively or negatively by foreign currency strength or weakness relative to the U.S. dollar, particularly if the Fund invests a significant percentage of its assets in foreign securities or other assets denominated in currencies other than the U.S. dollar. Currency rates in foreign countries may fluctuate significantly over short or long periods of time for a number of reasons, including changes in interest rates, imposition of currency controls and economic or political developments in the U.S. or abroad. The Fund may also incur currency conversion costs when converting foreign currencies into U.S. dollars and vice versa.
Foreign securities and emerging market countries risk
Investing in foreign securities may involve heightened risks relative to investments in U.S. securities. Investing in foreign securities subjects the Fund to the risks associated with the issuer’s country of organization and places of business operations, including risks associated with political, regulatory, economic, social, diplomatic and other conditions or events occurring in the country or region, which may result in significant market volatility. In addition, certain foreign securities may be more volatile and less liquid than U.S. securities. Investing in emerging markets may increase these risks and expose the Fund to elevated risks associated with increased inflation, deflation or currency devaluation. To the extent that the Fund concentrates its investment exposure to any one or a few specific countries, the Fund will be particularly susceptible to the risks associated with the conditions, events or other factors impacting those countries or regions and may, therefore, have a greater risk than that of a fund that is more geographically diversified. The financial information and disclosure made available by issuers of emerging market securities may be considerably less reliable than publicly available information about other foreign securities. The Public Company Accounting Oversight Board, which regulates auditors of U.S. public companies, is unable to inspect audit work papers in certain foreign countries. Investors in foreign countries often have limited rights and few practical remedies to pursue shareholder claims, including class actions or fraud claims, and the ability of the U.S. Securities and Exchange Commission, the U.S. Department of Justice and other authorities to bring and enforce actions against foreign issuers or foreign persons is limited.
| 28 | Columbia Solutions Aggressive Portfolio | Annual Report 2023 |
Notes to Financial Statements (continued)
March 31, 2023
Interest rate risk
Interest rate risk is the risk of losses attributable to changes in interest rates. In general, if interest rates rise, the values of debt instruments tend to fall, and if interest rates fall, the values of debt instruments tend to rise. Actions by governments and central banking authorities can result in increases or decreases in interest rates. Higher periods of inflation could lead such authorities to raise interest rates. Increasing interest rates may negatively affect the value of debt securities held by the Fund, resulting in a negative impact on the Fund’s performance and net asset value per share. In general, the longer the maturity or duration of a debt security, the greater its sensitivity to changes in interest rates. The Fund is subject to the risk that the income generated by its investments may not keep pace with inflation.
Leverage risk
Leverage occurs when the Fund increases its assets available for investment using borrowings, short sales, derivatives, or similar instruments or techniques. The use of leverage may produce volatility and may exaggerate changes in the Fund’s net asset value and in the return on the Fund’s portfolio, which may increase the risk that the Fund will lose more than it has invested. Because short sales involve borrowing securities and then selling them, the Fund’s short sales effectively leverage the Fund’s assets. The Fund’s assets that are used as collateral to secure the Fund’s obligations to return the securities sold short may decrease in value while the short positions are outstanding, which may force the Fund to use its other assets to increase the collateral. Leverage can create an interest expense that may lower the Fund’s overall returns. Leverage presents the opportunity for increased net income and capital gains, but may also exaggerate the Fund’s volatility and risk of loss. There can be no guarantee that a leveraging strategy will be successful.
Liquidity risk
Liquidity risk is the risk associated with a lack of marketability of investments which may make it difficult to sell the investment at a desirable time or price. Changing regulatory, market or other conditions or environments (for example, the interest rate or credit environments) may adversely affect the liquidity of the Fund’s investments. The Fund may have to accept a lower selling price for the holding, sell other investments, or forego another, more appealing investment opportunity. Generally, the less liquid the market at the time the Fund sells a portfolio investment, the greater the risk of loss or decline of value to the Fund. A less liquid market can lead to an increase in Fund redemptions, which may negatively impact Fund performance and net asset value per share, including, for example, if the Fund is forced to sell securities in a down market.
Market risk
The Fund may incur losses due to declines in the value of one or more securities in which it invests. These declines may be due to factors affecting a particular issuer, or the result of, among other things, political, regulatory, market, economic or social developments affecting the relevant market(s) more generally. In addition, turbulence in financial markets and reduced liquidity in equity, credit and/or fixed income markets may negatively affect many issuers, which could adversely affect the Fund’s ability to price or value hard-to-value assets in thinly traded and closed markets and could cause significant redemptions and operational challenges. Global economies and financial markets are increasingly interconnected, and conditions and events in one country, region or financial market may adversely impact issuers in a different country, region or financial market. These risks may be magnified if certain events or developments adversely interrupt the global supply chain; in these and other circumstances, such risks might affect companies worldwide. As a result, local, regional or global events such as terrorism, war, natural disasters, disease/virus outbreaks and epidemics or other public health issues, recessions, depressions or other events – or the potential for such events – could have a significant negative impact on global economic and market conditions.
The large-scale invasion of Ukraine by Russia in February 2022 has resulted in sanctions and market disruptions, including declines in regional and global stock markets, unusual volatility in global commodity markets and significant devaluations of Russian currency. The extent and duration of the military action are impossible to predict but could be significant. Market disruption caused by the Russian military action, and any counter-measures or responses thereto (including international sanctions, a downgrade in the country’s credit rating, purchasing and financing restrictions, boycotts, tariffs, changes in consumer or purchaser preferences, cyberattacks and espionage) could have severe adverse impacts on regional and/or global securities and commodities markets, including markets for oil and natural gas. These impacts may include reduced
Columbia Solutions Aggressive Portfolio | Annual Report 2023
| 29 |
Notes to Financial Statements (continued)
March 31, 2023
market liquidity, distress in credit markets, further disruption of global supply chains, increased risk of inflation, and limited access to investments in certain international markets and/or issuers. These developments and other related events could negatively impact Fund performance.
Money market fund investment risk
An investment in a money market fund is not a bank deposit and is not insured or guaranteed by any bank, the FDIC or any other government agency. Certain money market funds float their net asset value while others seek to preserve the value of investments at a stable net asset value (typically, $1.00 per share). An investment in a money market fund, even an investment in a fund seeking to maintain a stable net asset value per share, is not guaranteed and it is possible for the Fund to lose money by investing in these and other types of money market funds. If the liquidity of a money market fund’s portfolio deteriorates below certain levels, the money market fund may suspend redemptions (i.e., impose a redemption gate) and thereby prevent the Fund from selling its investment in the money market fund or impose a fee of up to 2% on amounts the Fund redeems from the money market fund (i.e., impose a liquidity fee). These measures may result in an investment loss or prohibit the Fund from redeeming shares when the Investment Manager would otherwise redeem shares. In addition to the fees and expenses that the Fund directly bears, the Fund indirectly bears the fees and expenses of any money market funds in which it invests, including affiliated money market funds. By investing in a money market fund, the Fund will be exposed to the investment risks of the money market fund in direct proportion to such investment. To the extent the Fund invests in instruments such as derivatives, the Fund may hold investments, which may be significant, in money market fund shares to cover its obligations resulting from the Fund’s investments in such instruments. Money market funds and the securities they invest in are subject to comprehensive regulations. The enactment of new legislation or regulations, as well as changes in interpretation and enforcement of current laws, may affect the manner of operation, performance and/or yield of money market funds.
Shareholder concentration risk
At March 31, 2023, affiliated shareholders of record owned 100.0% of the outstanding shares of the Fund in one or more accounts. Subscription and redemption activity by concentrated accounts may have a significant effect on the operations of the Fund. In the case of a large redemption, the Fund may be forced to sell investments at inopportune times, including its liquid positions, which may result in Fund losses and the Fund holding a higher percentage of less liquid positions. Large redemptions could result in decreased economies of scale and increased operating expenses for non-redeeming Fund shareholders.
Note 10. Subsequent events
Management has evaluated the events and transactions that have occurred through the date the financial statements were issued and noted no items requiring adjustment of the financial statements or additional disclosure.
Note 11. Information regarding pending and settled legal proceedings
Ameriprise Financial and certain of its affiliates are involved in the normal course of business in legal proceedings which include regulatory inquiries, arbitration and litigation, including class actions concerning matters arising in connection with the conduct of their activities as part of a diversified financial services firm. Ameriprise Financial believes that the Fund is not currently the subject of, and that neither Ameriprise Financial nor any of its affiliates are the subject of, any pending legal, arbitration or regulatory proceedings that are likely to have a material adverse effect on the Fund or the ability of Ameriprise Financial or its affiliates to perform under their contracts with the Fund. Ameriprise Financial is required to make quarterly (10-Q), annual (10-K) and, as necessary, 8-K filings with the Securities and Exchange Commission (SEC) on legal and regulatory matters that relate to Ameriprise Financial and its affiliates. Copies of these filings may be obtained by accessing the SEC website at www.sec.gov.
There can be no assurance that these matters, or the adverse publicity associated with them, will not result in increased Fund redemptions, reduced sale of Fund shares or other adverse consequences to the Fund. Further, although we believe proceedings are not likely to have a material adverse effect on the Fund or the ability of Ameriprise Financial or its affiliates to perform under their contracts with the Fund, these proceedings are subject to uncertainties and, as such, we are unable to estimate the possible loss or range of loss that may result. An adverse outcome in one or more of these proceedings could
| 30 | Columbia Solutions Aggressive Portfolio | Annual Report 2023 |
Notes to Financial Statements (continued)
March 31, 2023
result in adverse judgments, settlements, fines, penalties or other relief that could have a material adverse effect on the consolidated financial condition or results of operations of Ameriprise Financial or one or more of its affiliates that provides services to the Fund.
Columbia Solutions Aggressive Portfolio | Annual Report 2023
| 31 |
Report of Independent Registered Public Accounting Firm
To the Board of Trustees of Columbia Funds Series Trust I and Shareholders of Columbia Solutions Aggressive Portfolio
Opinion on the Financial Statements
We have audited the accompanying statement of assets and liabilities, including the portfolio of investments, of Columbia Solutions Aggressive Portfolio (one of the funds constituting Columbia Funds Series Trust I, referred to hereafter as the "Fund") as of March 31, 2023, the related statement of operations for the year ended March 31, 2023, the statement of changes in net assets for each of the two years in the period ended March 31, 2023, including the related notes, and the financial highlights for each of the five years in the period ended March 31, 2023 (collectively referred to as the "financial statements"). In our opinion, the financial statements present fairly, in all material respects, the financial position of the Fund as of March 31, 2023, the results of its operations for the year then ended, the changes in its net assets for each of the two years in the period ended March 31, 2023 and the financial highlights for each of the five years in the period ended March 31, 2023 in conformity with accounting principles generally accepted in the United States of America.
Basis for Opinion
These financial statements are the responsibility of the Fund’s management. Our responsibility is to express an opinion on the Fund’s financial statements based on our audits. We are a public accounting firm registered with the Public Company Accounting Oversight Board (United States) (PCAOB) and are required to be independent with respect to the Fund in accordance with the U.S. federal securities laws and the applicable rules and regulations of the Securities and Exchange Commission and the PCAOB.
We conducted our audits of these financial statements in accordance with the standards of the PCAOB. Those standards require that we plan and perform the audit to obtain reasonable assurance about whether the financial statements are free of material misstatement, whether due to error or fraud.
Our audits included performing procedures to assess the risks of material misstatement of the financial statements, whether due to error or fraud, and performing procedures that respond to those risks. Such procedures included examining, on a test basis, evidence regarding the amounts and disclosures in the financial statements. Our audits also included evaluating the accounting principles used and significant estimates made by management, as well as evaluating the overall presentation of the financial statements. Our procedures included confirmation of securities owned as of March 31, 2023 by correspondence with the custodian, transfer agent and brokers. We believe that our audits provide a reasonable basis for our opinion.
/s/PricewaterhouseCoopers LLP
Minneapolis, Minnesota
May 23, 2023
We have served as the auditor of one or more investment companies within the Columbia Funds Complex since 1977.
| 32 | Columbia Solutions Aggressive Portfolio | Annual Report 2023 |
TRUSTEES AND OFFICERS
(Unaudited)
The Board oversees the Fund’s operations and appoints officers who are responsible for day-to-day business decisions based on policies set by the Board. The following table provides basic biographical information about the Fund’s Trustees as of the printing of this report, including their principal occupations during the past five years, although specific titles for individuals may have varied over the period. The year set forth beneath Length of Service in the table below is the year in which the Trustee was first appointed or elected as Trustee to any Fund currently in the Columbia Funds Complex or a predecessor thereof. Under current Board policy, each Trustee generally serves until December 31 of the year such Trustee turns seventy-five (75).
Independent trustees
Name,
address,
year of birth | Position held
with the Columbia Funds and
length of service | Principal occupation(s)
during past five years
and other relevant
professional experience | Number of
Funds in the
Columbia Funds
Complex*
overseen | Other directorships
held by Trustee
during the past five years
and other relevant Board experience |
George S. Batejan
c/o Columbia Management
Investment Advisers, LLC
290 Congress Street
Boston, MA 02210
1954 | Trustee since 2017 | Executive Vice President, Global Head of Technology and Operations, Janus Capital Group, Inc., 2010-2016 | 177 | Former Chairman of the Board, NICSA (National Investment Company Services Association) (Executive Committee, Nominating Committee and Governance Committee), 2014-2016; former Director, Intech Investment Management, 2011-2016; former Board Member, Metro Denver Chamber of Commerce, 2015-2016; former Advisory Board Member, University of Colorado Business School, 2015-2018; former Board Member, Chase Bank International, 1993-1994 |
Kathleen Blatz
c/o Columbia Management
Investment Advisers, LLC
290 Congress Street
Boston, MA 02210
1954 | Trustee since 2006 | Attorney, specializing in arbitration and mediation; Chief Justice, Minnesota Supreme Court, 1998-2006; Associate Justice, Minnesota Supreme Court, 1996-1998; Fourth Judicial District Court Judge, Hennepin County, 1994-1996; Attorney in private practice and public service, 1984-1993; State Representative, Minnesota House of Representatives, 1979-1993, which included service on the Tax and Financial Institutions and Insurance Committees; Member and Interim Chair, Minnesota Sports Facilities Authority, January-July 2017; Interim President and Chief Executive Officer, Blue Cross and Blue Shield of Minnesota (health care insurance), February-July 2018, April-October 2021 | 177 | Former Trustee, Blue Cross and Blue Shield of Minnesota, 2009-2021 (Chair of the Business Development Committee, 2014-2017; Chair of the Governance Committee, 2017-2019); former Member and Chair of the Board, Minnesota Sports Facilities Authority, January 2017-July 2017; former Director, Robina Foundation, 2009-2020 (Chair, 2014-2020); Director, Richard M. Schulze Family Foundation, since 2021 |
Columbia Solutions Aggressive Portfolio | Annual Report 2023
| 33 |
TRUSTEES AND OFFICERS (continued)
(Unaudited)
Independent trustees (continued)
Name,
address,
year of birth | Position held
with the Columbia Funds and
length of service | Principal occupation(s)
during past five years
and other relevant
professional experience | Number of
Funds in the
Columbia Funds
Complex*
overseen | Other directorships
held by Trustee
during the past five years
and other relevant Board experience |
Pamela G. Carlton
c/o Columbia Management
Investment Advisers, LLC
290 Congress Street
Boston, MA 02210
1954 | Chair since 2023; Trustee since 2007 | President, Springboard — Partners in Cross Cultural Leadership (consulting company), since 2003; Managing Director of US Equity Research, JP Morgan Chase, 1999-2003; Director of US Equity Research, Chase Asset Management, 1996-1999; Co-Director Latin America Research, 1993-1996, COO Global Research, 1992-1996, Co-Director of US Research, 1991-1992, Investment Banker, 1982-1991, Morgan Stanley; Attorney, Cleary Gottlieb Steen & Hamilton LLP, 1980-1982 | 177 | Trustee, New York Presbyterian Hospital Board, since 1996; Director, DR Bank (Audit Committee) since 2017; Director, Evercore Inc. (Audit Committee, Nominating and Governance Committee), since 2019; Director, Apollo Commercial Real Estate Finance, Inc. (Chair, Nominating and Governance Committee) (financial services), since 2021; the Governing Council of the Independent Directors Council (IDC), since 2021 |
Janet Langford Carrig
c/o Columbia Management
Investment Advisers, LLC
290 Congress Street
Boston, MA 02210
1957 | Trustee since 1996 | Senior Vice President, General Counsel and Corporate Secretary, ConocoPhillips (independent energy company), September 2007-October 2018 | 175 | Director, EQT Corporation (natural gas producer), since 2019; former Director, Whiting Petroleum Corporation (independent oil and gas company), 2020-2022 |
J. Kevin Connaughton
c/o Columbia Management
Investment Advisers, LLC
290 Congress Street
Boston, MA 02210
1964 | Trustee since 2020 | CEO and President, RhodeWay Financial (non-profit financial planning firm), since December 2022; Member, FINRA National Adjudicatory Council, since January 2020; Adjunct Professor of Finance, Bentley University since January 2018; Consultant to Independent Trustees of CFVIT and CFST I from March 2016 to June 2020 with respect to CFVIT and to December 2020 with respect to CFST I; Managing Director and General Manager of Mutual Fund Products, Columbia Management Investment Advisers, LLC, May 2010-February 2015; President, Columbia Funds, 2008-2015; and senior officer of Columbia Funds and affiliated funds, 2003-2015 | 175 | Former Director, The Autism Project, March 2015-December 2021; former Member of the Investment Committee, St. Michael’s College, November 2015-February 2020; former Trustee, St. Michael’s College, June 2017-September 2019; former Trustee, New Century Portfolios (former mutual fund complex), January 2015-December 2017 |
Olive M. Darragh
c/o Columbia Management
Investment Advisers, LLC
290 Congress Street
Boston, MA 02210
1962 | Trustee since 2020 | Managing Director of Darragh Inc. (strategy and talent management consulting firm), since 2010; Founder and CEO, Zolio, Inc. (investment management talent identification platform), since 2004; Consultant to Independent Trustees of CFVIT and CFST I from June 2019 to June 2020 with respect to CFVIT and to December 2020 with respect to CFST I; Partner, Tudor Investments, 2004-2010; Senior Partner, McKinsey & Company (consulting), 1990-2004; Touche Ross CPA, 1985-1988 | 175 | Treasurer, Edinburgh University US Trust Board, since January 2023; Member, HBS Community Action Partners Board, since September 2022; former Director, University of Edinburgh Business School (Member of US Board), 2004-2019; former Director, Boston Public Library Foundation, 2008-2017 |
| 34 | Columbia Solutions Aggressive Portfolio | Annual Report 2023 |
TRUSTEES AND OFFICERS (continued)
(Unaudited)
Independent trustees (continued)
Name,
address,
year of birth | Position held
with the Columbia Funds and
length of service | Principal occupation(s)
during past five years
and other relevant
professional experience | Number of
Funds in the
Columbia Funds
Complex*
overseen | Other directorships
held by Trustee
during the past five years
and other relevant Board experience |
Patricia M. Flynn
c/o Columbia Management
Investment Advisers, LLC
290 Congress Street
Boston, MA 02210
1950 | Trustee since 2004 | Professor of Economics and Management, Bentley University, since 2002; Dean, McCallum Graduate School of Business, Bentley University, 1992-2002 | 177 | Former Trustee, MA Taxpayers Foundation, 1997-2022; former Director, The MA Business Roundtable, 2003-2019; former Chairperson, Innovation Index Advisory Committee, MA Technology Collaborative, 1997-2020 |
Brian J. Gallagher
c/o Columbia Management
Investment Advisers, LLC
290 Congress Street
Boston, MA 02210
1954 | Trustee since 2017 | Retired; Partner with Deloitte & Touche LLP and its predecessors, 1977-2016 | 177 | Trustee, Catholic Schools Foundation, since 2004 |
Douglas A. Hacker
c/o Columbia Management
Investment Advisers, LLC
290 Congress Street
Boston, MA 02210
1955 | Trustee since 1996 | Independent business executive, since May 2006; Executive Vice President – Strategy of United Airlines, December 2002 - May 2006; President of UAL Loyalty Services (airline marketing company), September 2001-December 2002; Executive Vice President and Chief Financial Officer of United Airlines, July 1999-September 2001 | 177 | Director, SpartanNash Company (Chair of the Board) (food distributor), since May 2021; Director, Aircastle Limited (Chair of Audit Committee) (aircraft leasing), since August 2006; former Director, Nash Finch Company (food distributor), 2005-2013; former Director, SeaCube Container Leasing Ltd. (container leasing), 2010-2013; and former Director, Travelport Worldwide Limited (travel information technology), 2014-2019 |
Nancy T. Lukitsh
c/o Columbia Management
Investment Advisers, LLC
290 Congress Street
Boston, MA 02210
1956 | Trustee since 2011 | Senior Vice President, Partner and Director of Marketing, Wellington Management Company, LLP (investment adviser), 1997-2010; Chair, Wellington Management Portfolios (commingled non-U.S. investment pools), 2007-2010; Director, Wellington Trust Company, NA and other Wellington affiliates, 1997-2010 | 175 | None |
Columbia Solutions Aggressive Portfolio | Annual Report 2023
| 35 |
TRUSTEES AND OFFICERS (continued)
(Unaudited)
Independent trustees (continued)
Name,
address,
year of birth | Position held
with the Columbia Funds and
length of service | Principal occupation(s)
during past five years
and other relevant
professional experience | Number of
Funds in the
Columbia Funds
Complex*
overseen | Other directorships
held by Trustee
during the past five years
and other relevant Board experience |
David M. Moffett
c/o Columbia Management
Investment Advisers, LLC
290 Congress Street
Boston, MA 02210
1952 | Trustee since 2011 | Retired; former Chief Executive Officer of Freddie Mac and Chief Financial Officer of U.S. Bank | 175 | Director, CSX Corporation (transportation suppliers); Director, PayPal Holdings Inc. (payment and data processing services); Trustee, University of Oklahoma Foundation; former Director, eBay Inc. (online trading community), 2007-2015; and former Director, CIT Bank, CIT Group Inc. (commercial and consumer finance), 2010-2016; former Senior Adviser to The Carlyle Group (financial services), March 2008-September 2008; former Governance Consultant to Bridgewater Associates, January 2013-December 2015 |
Catherine James Paglia
c/o Columbia Management
Investment Advisers, LLC
290 Congress Street
Boston, MA 02210
1952 | Trustee since 2004 | Director, Enterprise Asset Management, Inc. (private real estate and asset management company), since September 1998; Managing Director and Partner, Interlaken Capital, Inc., 1989-1997; Vice President, 1982-1985, Principal, 1985-1987, Managing Director, 1987-1989, Morgan Stanley; Vice President, Investment Banking, 1980-1982, Associate, Investment Banking, 1976-1980, Dean Witter Reynolds, Inc. | 177 | Director, Valmont Industries, Inc. (irrigation systems manufacturer), since 2012; Trustee, Carleton College (on the Investment Committee), since 1987; Trustee, Carnegie Endowment for International Peace (on the Investment Committee), since 2009 |
Natalie A. Trunow
c/o Columbia Management
Investment Advisers, LLC
290 Congress Street
Boston, MA 02210
1967 | Trustee since 2020 | Chief Executive Officer, Millennial Portfolio Solutions LLC (asset management and consulting services), January 2016-January 2021; Non-executive Member of the Investment Committee and Valuation Committee, Sarona Asset Management Inc. (private equity firm) since September 2019; Advisor, Horizon Investments (asset management and consulting services), August 2018-January 2022; Advisor, Paradigm Asset Management, November 2016-January 2022; Consultant to Independent Trustees of CFVIT and CFST I from September 2016 to June 2020 with respect to CFVIT and to December 2020 with respect to CFST I; Director of Investments/Consultant, Casey Family Programs, April 2016-November 2016; Senior Vice President and Chief Investment Officer, Calvert Investments, August 2008-January 2016; Section Head and Portfolio Manager, General Motors Asset Management, June 1997-August 2008 | 175 | Independent Director, Investment Committee, Health Services for Children with Special Needs, Inc., 2010-2021; Independent Director, (Executive Committee and Chair, Audit Committee), Consumer Credit Counseling Services (formerly Guidewell Financial Solutions), since 2016; Independent Director, (Investment Committee), Sarona Asset Management, since 2019 |
| 36 | Columbia Solutions Aggressive Portfolio | Annual Report 2023 |
TRUSTEES AND OFFICERS (continued)
(Unaudited)
Independent trustees (continued)
Name,
address,
year of birth | Position held
with the Columbia Funds and
length of service | Principal occupation(s)
during past five years
and other relevant
professional experience | Number of
Funds in the
Columbia Funds
Complex*
overseen | Other directorships
held by Trustee
during the past five years
and other relevant Board experience |
Sandra L. Yeager
c/o Columbia Management
Investment Advisers, LLC
290 Congress Street
Boston, MA 02210
1964 | Trustee since 2017 | Retired; President and founder, Hanoverian Capital, LLC (SEC registered investment advisor firm), 2008-2016; Managing Director, DuPont Capital, 2006-2008; Managing Director, Morgan Stanley Investment Management, 2004-2006; Senior Vice President, Alliance Bernstein, 1990-2004 | 177 | Former Director, NAPE (National Alliance for Partnerships in Equity) Education Foundation, October 2016-October 2020; Advisory Board, Jennersville YMCA, since 2022 |
Interested trustee affiliated with Investment Manager**
Name,
address,
year of birth | Position held with the Columbia Funds and length of service | Principal occupation(s) during the
past five years and other relevant
professional experience | Number of
Funds in the
Columbia Funds
Complex overseen | Other directorships
held by Trustee
during the past
five years and
other relevant Board experience |
Daniel J. Beckman
c/o Columbia Management
Investment Advisers, LLC
290 Congress Street
Boston, MA 02210
1962 | Trustee since November 2021 and President since June 2021 | Vice President – Head of North America Product, Columbia Management Investment Advisers, LLC, since April 2015; President and Principal Executive Officer of the Columbia Funds, since June 2021; officer of Columbia Funds and affiliated funds, 2020-2021 | 177 | Director, Ameriprise Trust Company, since October 2016; Director, Columbia Management Investment Distributors, Inc. since November 2018; Board of Governors, Columbia Wanger Asset Management, LLC since, January 2022; Director, Columbia Threadneedle Canada, Inc., since December 2022 |
| * | The term “Columbia Funds Complex” as used herein includes Columbia Seligman Premium Technology Growth Fund, Tri-Continental Corporation and each series of Columbia Funds Series Trust (CFST), Columbia Funds Series Trust I (CFST I), Columbia Funds Series Trust II (CFST II), Columbia ETF Trust I (CET I), Columbia ETF Trust II (CET II), Columbia Funds Variable Insurance Trust (CFVIT) and Columbia Funds Variable Series Trust II (CFVST II).Messrs. Batejan, Beckman, Gallagher and Hacker and Mses. Blatz, Carlton, Carrig, Flynn, Paglia and Yeager serve as Directors of Columbia Seligman Premium Technology Growth Fund and Tri-Continental Corporation. |
| ** | Interested person (as defined under the 1940 Act) by reason of being an officer, director, security holder and/or employee of the Investment Manager or Ameriprise Financial. |
The Statement of Additional Information has additional information about the Fund’s Board members and is available, without charge, upon request by calling 800.345.6611, visiting columbiathreadneedleus.com/investor/ or contacting your financial intermediary.
Columbia Solutions Aggressive Portfolio | Annual Report 2023
| 37 |
TRUSTEES AND OFFICERS (continued)
(Unaudited)
The Board has appointed officers who are responsible for day-to-day business decisions based on policies it has established. The officers serve at the pleasure of the Board. The following table provides basic information about the Officers of the Fund as of the printing of this report, including principal occupations during the past five years, although their specific titles may have varied over the period. In addition to Mr. Beckman, who is President and Principal Executive Officer, the Fund’s other officers are:
Fund officers
Name,
address and
year of birth | Position and year
first appointed to
position for any Fund
in the Columbia
Funds Complex or a
predecessor thereof | Principal occupation(s) during past five years |
Michael G. Clarke
290 Congress Street
Boston, MA 02210
1969 | Chief Financial Officer and Principal Financial Officer (2009) and Senior Vice President (2019) | Senior Vice President and Head of Global Operations & Investor Services, Columbia Management Investment Advisers, LLC, since March 2022 (previously Vice President, Head of North American Operations, and Co-Head of Global Operations, June 2019 to February 2022 and Vice President – Accounting and Tax, May 2010 - May 2019); senior officer of Columbia Funds and affiliated funds, since 2002. |
Joseph Beranek
5890 Ameriprise Financial Center
Minneapolis, MN 55474
1965 | Treasurer and Chief Accounting Officer (Principal Accounting Officer) (2019) and Principal Financial Officer (2020), CFST, CFST I, CFST II, CFVIT and CFVST II; Assistant Treasurer, CET I and CET II | Vice President – Mutual Fund Accounting and Financial Reporting, Columbia Management Investment Advisers, LLC, since December 2018 and March 2017, respectively. |
Marybeth Pilat
290 Congress Street
Boston, MA 02210
1968 | Treasurer and Chief Accounting Officer (Principal Accounting Officer) and Principal Financial Officer (2020) for CET I and CET II; Assistant Treasurer, CFST, CFST I, CFST II, CFVIT and CFVST II | Vice President – Product Pricing and Administration, Columbia Management Investment Advisers, LLC, since May 2017. |
William F. Truscott
290 Congress Street
Boston, MA 02210
1960 | Senior Vice President (2001) | Formerly, Trustee/Director of Columbia Funds Complex or legacy funds, November 2001-January 1, 2021; Chief Executive Officer, Global Asset Management, Ameriprise Financial, Inc., since September 2012; Chairman of the Board and President, Columbia Management Investment Advisers, LLC, since July 2004 and February 2012, respectively; Chairman of the Board and Chief Executive Officer, Columbia Management Investment Distributors, Inc., since November 2008 and February 2012, respectively; Chairman of the Board and Director, Threadneedle Asset Management Holdings, Sàrl, since March 2013 and December 2008, respectively; senior executive of various entities affiliated with Columbia Threadneedle. |
Christopher O. Petersen
5228 Ameriprise Financial Center
Minneapolis, MN 55474
1970 | Senior Vice President and Assistant Secretary (2021) | Formerly, Trustee/Director of funds within the Columbia Funds Complex, July 1, 2020 - November 22, 2021; Senior Vice President and Assistant General Counsel, Ameriprise Financial, Inc., since September 2021 (previously Vice President and Lead Chief Counsel, January 2015 - September 2021); formerly, President and Principal Executive Officer of the Columbia Funds, 2015 - 2021; officer of Columbia Funds and affiliated funds, since 2007. |
Thomas P. McGuire
290 Congress Street
Boston, MA 02210
1972 | Senior Vice President and Chief Compliance Officer (2012) | Vice President – Asset Management Compliance, Ameriprise Financial, Inc., since May 2010; Chief Compliance Officer, Columbia Acorn/Wanger Funds, since December 2015; formerly, Chief Compliance Officer, Ameriprise Certificate Company, September 2010 – September 2020. |
Ryan C. Larrenaga
290 Congress Street
Boston, MA 02210
1970 | Senior Vice President (2017), Chief Legal Officer (2017), and Secretary (2015) | Vice President and Chief Counsel, Ameriprise Financial, Inc., since August 2018 (previously Vice President and Group Counsel, August 2011 - August 2018); Chief Legal Officer, Columbia Acorn/Wanger Funds, since September 2020; officer of Columbia Funds and affiliated funds, since 2005. |
| 38 | Columbia Solutions Aggressive Portfolio | Annual Report 2023 |
TRUSTEES AND OFFICERS (continued)
(Unaudited)
Fund officers (continued)
Name,
address and
year of birth | Position and year
first appointed to
position for any Fund
in the Columbia
Funds Complex or a
predecessor thereof | Principal occupation(s) during past five years |
Michael E. DeFao
290 Congress Street
Boston, MA 02210
1968 | Vice President (2011) and Assistant Secretary (2010) | Vice President and Chief Counsel, Ameriprise Financial, Inc., since May 2010; Vice President, Chief Legal Officer and Assistant Secretary, Columbia Management Investment Advisers, LLC, since October 2021 (previously Vice President and Assistant Secretary, May 2010 – September 2021). |
Lyn Kephart-Strong
5228 Ameriprise Financial Center
Minneapolis, MN 55474
1960 | Vice President (2015) | Vice President, Global Investment Operations Services, Columbia Management Investment Advisers, LLC, since 2010; President, Columbia Management Investment Services Corp., since October 2014; President, Ameriprise Trust Company, since January 2017. |
Liquidity Risk Management Program
(Unaudited)
Pursuant to Rule 22e-4 under the 1940 Act, the Fund has adopted a liquidity risk management program (Program). The Program’s principal objectives include assessing, managing and periodically reviewing the Fund’s liquidity risk. Liquidity risk is defined as the risk that the Fund could not meet redemption requests without significant dilution of remaining investors’ interests in the Fund.
The Board has appointed the Investment Manager as the program administrator for the Fund’s Program. The Investment Manager has delegated oversight of the Program to its Liquidity Risk Management Committee (the Committee). At a board meeting during the fiscal period, the Committee provided the Board with a report addressing the operations of the program and assessing its adequacy and effectiveness of implementation for the period January 1, 2022, through December 31, 2022, including:
| • | the Fund had sufficient liquidity to both meet redemptions and operate effectively on behalf of shareholders; |
| • | there were no material changes to the Program during the period; |
| • | the implementation of the Program was effective to manage the Fund’s liquidity risk; and |
| • | the Program operated adequately during the period. |
There can be no assurance that the Program will achieve its objectives in the future. Please refer to the Fund’s prospectus for more information regarding the Fund’s exposure to liquidity risk and other principal risks to which an investment in the Fund may be subject.
Columbia Solutions Aggressive Portfolio | Annual Report 2023
| 39 |
Columbia Solutions Aggressive Portfolio
P.O. Box 219104
Kansas City, MO 64121-9104
Please read and consider the investment objectives, risks, charges and expenses for any fund carefully before investing. For a prospectus, which contains this and other important information about the Fund, go to columbiathreadneedleus.com/investor/. The Fund is distributed by Columbia Management Investment Distributors, Inc., member FINRA, and managed by Columbia Management Investment Advisers, LLC.
Columbia Threadneedle Investments (Columbia Threadneedle) is the global brand name of the Columbia and Threadneedle group of companies. All rights reserved.
© 2023 Columbia Management Investment Advisers, LLC.
columbiathreadneedleus.com/investor/

Annual Report
March 31, 2023
Columbia Solutions Conservative Portfolio
Not FDIC or NCUA Insured • No Financial Institution Guarantee • May Lose Value
If you elect to receive the shareholder report for Columbia Solutions Conservative Portfolio (the Fund) in paper, mailed to you, the Fund mails one shareholder report to each shareholder address, unless such shareholder elects to receive shareholder reports from the Fund electronically via e-mail or by having a paper notice mailed to you (Postcard Notice) that your Fund’s shareholder report is available at the Columbia funds’ website (columbiathreadneedleus.com/investor/). If you would like more than one report in paper to be mailed to you, or would like to elect to receive reports via e-mail or access them through Postcard Notice, please call shareholder services at 800.345.6611 and additional reports will be sent to you.
Proxy voting policies and procedures
The policy of the Board of Trustees is to vote the proxies of the companies in which the Fund holds investments consistent with the procedures as stated in the Statement of Additional Information (SAI). You may obtain a copy of the SAI without charge by calling 800.345.6611; contacting your financial intermediary; visiting columbiathreadneedleus.com/investor/; or searching the website of the Securities and Exchange Commission (SEC) at sec.gov. Information regarding how the Fund voted proxies relating to portfolio securities is filed with the SEC by August 31st for the most recent 12-month period ending June 30th of that year, and is available without charge by visiting columbiathreadneedleus.com/investor/, or searching the website of the SEC at sec.gov.
Quarterly schedule of investments
The Fund files a complete schedule of portfolio holdings with the SEC for the first and third quarters of each fiscal year on Form N-PORT. The Fund’s Form N-PORT filings are available on the SEC’s website at sec.gov. The Fund’s complete schedule of portfolio holdings, as filed on Form N-PORT, is available on columbiathreadneedleus.com/investor/ or can also be obtained without charge, upon request, by calling 800.345.6611.
Additional Fund information
For more information about the Fund, please visit columbiathreadneedleus.com/investor/ or call 800.345.6611. Customer Service Representatives are available to answer your questions Monday through Friday from 8 a.m. to 7 p.m. Eastern time.
Fund investment manager
Columbia Management Investment Advisers, LLC (the Investment Manager)
290 Congress Street
Boston, MA 02210
Fund distributor
Columbia Management Investment Distributors, Inc.
290 Congress Street
Boston, MA 02210
Fund transfer agent
Columbia Management Investment Services Corp.
P.O. Box 219104
Kansas City, MO 64121-9104
Columbia Solutions Conservative Portfolio | Annual Report 2023
Fund at a Glance
(Unaudited)
Investment objective
The Fund pursues consistent total returns by seeking to allocate risks across multiple asset classes.
Portfolio management
Joshua Kutin, CFA
Co-Portfolio Manager
Managed Fund since 2017
Alexander Wilkinson, CFA, CAIA
Co-Portfolio Manager
Managed Fund since 2017
| Average annual total returns (%) (for the period ended March 31, 2023) |
| | | Inception | 1 Year | 5 Years | Life |
| Columbia Solutions Conservative Portfolio | 10/24/17 | -3.44 | 2.71 | 2.66 |
| Bloomberg Global Aggregate Hedged USD Index | | -3.86 | 0.95 | 0.99 |
| Blended Benchmark | | -4.03 | 2.99 | 2.93 |
All results shown assume reinvestment of distributions during the period. Returns do not reflect the deduction of taxes that a shareholder may pay on Fund distributions or on the redemption of Fund shares. Performance results reflect the effect of any fee waivers or reimbursements of Fund expenses by Columbia Management Investment Advisers, LLC and/or any of its affiliates. Absent these fee waivers or expense reimbursement arrangements, performance results would have been lower.
The performance information shown represents past performance and is not a guarantee of future results. The investment return and principal value of your investment will fluctuate so that your shares, when redeemed, may be worth more or less than their original cost. Current performance may be lower or higher than the performance information shown. You may obtain performance information current to the most recent month-end by contacting your financial intermediary, visiting columbiathreadneedleus.com/investor/ or calling 800.345.6611.
The Bloomberg Global Aggregate Hedged USD Index is an unmanaged index that is comprised of several other Bloomberg indexes that measure fixed-income performance of regions around the world while hedging the currency back to the US dollar.
The Blended Benchmark consists of 25% MSCI ACWI with Developed Markets 100% Hedged to USD Index (Net) and 75% Bloomberg Global Aggregate Hedged USD Index. The MSCI ACWI with Developed Markets 100% Hedged to USD Index (Net) represents a close estimation of the performance that can be achieved by hedging the currency exposures of all developed market exposures of its parent index, the MSCI ACWI, to the USD, the “home” currency for the hedged index. The index is 100% hedged to the USD of developed market currencies by selling each foreign currency forward at the one-month Forward weight. The parent index is composed of large and mid-cap stocks across 23 Developed Markets (DM) countries and 27 Emerging Markets (EM) countries.
Indices are not available for investment, are not professionally managed and do not reflect sales charges, fees, brokerage commissions, taxes (except the MSCI ACWI with Developed Markets 100% Hedged to USD Index (Net), which reflects reinvested dividends net of withholding taxes) or other expenses of investing. Securities in the Fund may not match those in an index.
Columbia Solutions Conservative Portfolio | Annual Report 2023
| 3 |
Fund at a Glance (continued)
(Unaudited)
Performance of a hypothetical $10,000 investment (October 24, 2017 — March 31, 2023)
The chart above shows the change in value of a hypothetical $10,000 investment in Columbia Solutions Conservative Portfolio during the stated time period, and does not reflect the deduction of taxes that a shareholder may pay on Fund distributions or on the sale of Fund shares.
| Portfolio breakdown (%) (at March 31, 2023) |
| Foreign Government Obligations | 15.0 |
| Money Market Funds(a) | 58.1 |
| U.S. Treasury Obligations | 26.9 |
| Total | 100.0 |
| (a) | Includes investments in Money Market Funds, including investing for the purpose of covering obligations relating to the Fund’s investment in derivatives. For a description of the Fund’s investments in derivatives, see Investments in derivatives following the Portfolio of Investments and the derivative instruments discussion in Note 2 to the Notes to Financial Statements. |
Percentages indicated are based upon total investments excluding investments in derivatives, if any. The Fund’s portfolio composition is subject to change.
| Market exposure through derivatives investments (% of notional exposure) (at March 31, 2023)(a) |
| | Long | Short | Net |
| Fixed Income Derivative Contracts | 94.6 | (3.8) | 90.8 |
| Equity Derivative Contracts | 51.4 | — | 51.4 |
| Foreign Currency Derivative Contracts | 0.6 | (42.8) | (42.2) |
| Total Notional Market Value of Derivative Contracts | 146.6 | (46.6) | 100.0 |
(a) The Fund has market exposure (long and/or short) to fixed income, equity asset classes and foreign currency through its investments in derivatives. The notional exposure of a financial instrument is the nominal or face amount that is used to calculate payments made on that instrument and/or changes in value for the instrument. The notional exposure is a hypothetical underlying quantity upon which payment obligations are computed. Notional exposures provide a gauge for how the Fund may behave given changes in individual markets. For a description of the Fund’s investments in derivatives, see Investments in derivatives following the Portfolio of Investments, and Note 2 of the Notes to Financial Statements.
| 4 | Columbia Solutions Conservative Portfolio | Annual Report 2023 |
Manager Discussion of Fund Performance
(Unaudited)
At March 31, 2023, approximately 99.92% of the Fund’s shares were owned in the aggregate by affiliated funds-of-funds managed by Columbia Management Investment Advisers, LLC (the Investment Manager). As a result of asset allocation decisions by the Investment Manager, it is possible that the Fund may experience relatively large purchases or redemptions from affiliated funds-of-funds. The Investment Manager seeks to minimize the impact of these transactions by structuring them over a reasonable period of time. The Fund may experience increased expenses as it buys and sells securities as a result of purchases or redemptions by affiliated funds-of-funds.
For the 12-month period that ended March 31, 2023, Columbia Solutions Conservative Portfolio returned -3.44%. The Fund outperformed both the Bloomberg Global Aggregate Hedged USD Index, which returned -3.86%, and its Blended Benchmark, which returned -4.03% for the same period.
Market overview
Global equity markets delivered mixed results during the 12-month period, with most major benchmarks posting negative returns despite strong results in certain industry groups. Numerous concerns weighed on sentiment throughout the first half of the period, particularly a combination of geopolitical and financial market events that punished most asset returns except for “hard” assets such as oil, gold and other commodities. As a result of the Ukraine invasion, many western nations imposed punitive sanctions on Russia that limited its ability to transact in global markets and access assets held outside its borders. Combined, Russia and Ukraine provide a significant portion of many raw materials to the global economy, focused most prominently in Europe and the Middle East. Loss of these supplies disrupted access to basic necessities for many countries and raised the cost of such goods precipitously in some cases.
Despite occasional bursts of optimism that drove brief attempts at equity rallies, market momentum remained volatile and continued downward. Poor fixed-income returns, which typically have served as a safe-haven offset to declining equity markets, compounded the steep drawdowns in stocks. A steadily strengthening U.S. dollar over the first seven months of the reporting period (from the end of February 2022 through the end of September 2022) was an additional headwind for U.S. investors and eroded returns significantly.
Sentiment reversed abruptly though, apparently fueled by hints that the global slowdown was beginning to moderate. Investors also were pleased that China scrapped its zero-COVID lockdown policy, even though that welcome news was followed by worries that a resulting surge in COVID-19 infections would weigh on growth and make for a challenging reopening of the country’s economy. Those expectations helped weaken the U.S. dollar and buoy international equity returns for U.S. investors.
March brought new concerns as the failure of several U.S. banks, together with the collapse of the 167-year-old European financial giant Credit Suisse, ignited fears that a banking crisis similar to 2008-2009 could emerge. These worries rapidly dissipated, however, leading to a strong rally in the final week of March that added to equity and fixed-income returns.
The Fund’s notable contributors during the period
| • | The Fund’s largest contribution relative to the Blended Benchmark came from its allocation to credit-sensitive securities. The Fund was underweight credit securities overall, compared to the Blended Benchmark, and outperformed due to strong security selection within the asset class. |
| • | The Fund’s overweight in interest-rate-sensitive securities during the period contributed positively to performance, due in part to specific security selection within the sector. |
| • | The Fund’s overweighted cash exposure during a period of heightened equity and fixed-income volatility contributed positively to performance against the Blended Benchmark. |
The Fund’s notable detractors during the period
| • | Overall, the Fund’s exposure to equity securities, compared to its Blended Benchmark, was one of the largest detractors during the period. |
| • | The Fund’s exposure to U.S. small- and large-cap stocks, as well as international developed and emerging market equities, detracted from overall performance. |
Columbia Solutions Conservative Portfolio | Annual Report 2023
| 5 |
Manager Discussion of Fund Performance (continued)
(Unaudited)
| • | Unlike the benchmark, the Fund did not have any exposure to foreign currency exchanges, which detracted from overall performance. |
Derivatives usage
The Fund used derivative securities such as forward foreign currency exchange contracts, futures, and swap contracts to gain exposure to the equity markets and to certain fixed-income sectors. On a stand-alone basis, the net effect on Fund performance was negative.
Market risk may affect a single issuer, sector of the economy, industry or the market as a whole. Investing in derivatives is a specialized activity that involves special risks that subject the Fund to significant loss potential, including when used as leverage, and may result in greater fluctuation in Fund value. Commodity investments may be affected by the overall market and industry- and commodity-specific factors, and may be more volatile and less liquid than other investments. Short positions (where the underlying asset is not owned) can create unlimited risk. International investing involves certain risks and volatility due to potential political, economic or currency instabilities and different financial and accounting standards. Risks are enhanced for emerging market issuers. Investments in small- and mid-cap companies involve risks and volatility greater than investments in larger, more established companies. Fixed-income securities present issuer default risk. Non-investment-grade (high-yield or junk) securities present greater price volatility and more risk to principal and income than higher rated securities. A rise in interest rates may result in a price decline of fixed-income instruments held by the Fund, negatively impacting its performance and NAV. Falling rates may result in the Fund investing in lower yielding debt instruments, lowering the Fund’s income and yield. These risks may be heightened for longer maturity and duration securities. Interest payments on inflation-protected securities may be more volatile than interest payments on ordinary bonds. In periods of deflation, these securities may provide no income. Market or other (e.g., interest rate) environments may adversely affect the liquidity of fund investments, negatively impacting their price. Generally, the less liquid the market at the time the fund sells a holding, the greater the risk of loss or decline of value to the Fund. The Fund’s use of leverage allows for investment exposure in excess of net assets, thereby magnifying volatility of returns and risk of loss. Investments selected using quantitative methods may perform differently from the market as a whole and may not enable the Fund to achieve its objective. Like real estate, REITs are subject to illiquidity, valuation and financing complexities, taxes, default, bankruptcy and other economic, political or regulatory occurrences. See the Fund’s prospectus for more information on these and other risks.
The views expressed in this report reflect the current views of the respective parties who have contributed to this report. These views are not guarantees of future performance and involve certain risks, uncertainties and assumptions that are difficult to predict, so actual outcomes and results may differ significantly from the views expressed. These views are subject to change at any time based upon economic, market or other conditions and the respective parties disclaim any responsibility to update such views. These views may not be relied on as investment advice and, because investment decisions for a Columbia fund are based on numerous factors, may not be relied on as an indication of trading intent on behalf of any particular Columbia fund. References to specific securities should not be construed as a recommendation or investment advice.
| 6 | Columbia Solutions Conservative Portfolio | Annual Report 2023 |
Understanding Your Fund’s Expenses
(Unaudited)
As an investor, you incur two types of costs. There are shareholder transaction costs, which may include redemption fees. There are also ongoing fund costs, which generally include management fees, distribution and/or service fees, and other fund expenses. The following information is intended to help you understand your ongoing costs (in dollars) of investing in the Fund and to help you compare these costs with the ongoing costs of investing in other mutual funds.
Analyzing your Fund’s expenses
To illustrate these ongoing costs, we have provided examples and calculated the expenses paid by investors of the Fund during the period. The actual and hypothetical information in the table is based on an initial investment of $1,000 at the beginning of the period indicated and held for the entire period. Expense information is calculated two ways and each method provides you with different information. The amount listed in the “Actual” column is calculated using the Fund’s actual operating expenses and total return for the period. You may use the Actual information, together with the amount invested, to estimate the expenses that you paid over the period. Simply divide your account value by $1,000 (for example, an $8,600 account value divided by $1,000 = 8.6), then multiply the results by the expenses paid during the period under the “Actual” column. The amount listed in the “Hypothetical” column assumes a 5% annual rate of return before expenses (which is not the Fund’s actual return) and then applies the Fund’s actual expense ratio for the period to the hypothetical return. You should not use the hypothetical account values and expenses to estimate either your actual account balance at the end of the period or the expenses you paid during the period. See “Compare with other funds” below for details on how to use the hypothetical data.
Compare with other funds
Since all mutual funds are required to include the same hypothetical calculations about expenses in shareholder reports, you can use this information to compare the ongoing cost of investing in the Fund with other funds. To do so, compare the hypothetical example with the 5% hypothetical examples that appear in the shareholder reports of other funds. As you compare hypothetical examples of other funds, it is important to note that hypothetical examples are meant to highlight the ongoing costs of investing in a fund only and do not reflect any transaction costs, such as redemption or exchange fees. Therefore, the hypothetical calculations are useful in comparing ongoing costs only, and will not help you determine the relative total costs of owning different funds. If transaction costs were included in these calculations, your costs would be higher.
| October 1, 2022 — March 31, 2023 |
| | Account value at the
beginning of the
period ($) | Account value at the
end of the
period ($) | Expenses paid during
the period ($) | Fund’s annualized
expense ratio (%) |
| | Actual | Hypothetical | Actual | Hypothetical | Actual | Hypothetical | Actual |
| Columbia Solutions Conservative Portfolio | 1,000.00 | 1,000.00 | 1,049.20 | 1,024.88 | 0.05 | 0.05 | 0.01 |
Expenses paid during the period are equal to the annualized expense ratio as indicated above, multiplied by the average account value over the period and then multiplied by the number of days in the Fund’s most recent fiscal half year and divided by 365.
Expenses do not include fees and expenses incurred indirectly by the Fund from its investment in underlying funds, including affiliated and non-affiliated pooled investment vehicles, such as mutual funds and exchange-traded funds.
Had Columbia Management Investment Advisers, LLC and/or certain of its affiliates not waived/reimbursed certain fees and expenses, account value at the end of the period would have been reduced.
Columbia Solutions Conservative Portfolio | Annual Report 2023
| 7 |
Portfolio of Investments
March 31, 2023
(Percentages represent value of investments compared to net assets)
Investments in securities
| Foreign Government Obligations(a),(b) 14.5% |
| Issuer | Coupon
Rate | | Principal
Amount ($) | Value ($) |
| Austria 1.6% |
| Republic of Austria Government Bond(c) |
| 10/20/2026 | 0.750% | EUR | 73,000 | 74,223 |
| 05/23/2034 | 2.400% | EUR | 44,000 | 45,199 |
| Republic of Austria Government Bond(c),(d) |
| 02/20/2030 | 0.000% | EUR | 57,000 | 50,999 |
| Total | 170,421 |
| Belgium 1.2% |
| Kingdom of Belgium Government Bond(c) |
| 06/22/2031 | 1.000% | EUR | 57,000 | 53,702 |
| 04/22/2033 | 1.250% | EUR | 54,000 | 50,359 |
| 03/28/2035 | 5.000% | EUR | 17,000 | 21,936 |
| Total | 125,997 |
| China 1.1% |
| China Development Bank |
| 07/18/2032 | 2.960% | CNY | 250,000 | 36,181 |
| China Government Bond |
| 11/21/2029 | 3.130% | CNY | 100,000 | 14,865 |
| 05/21/2030 | 2.680% | CNY | 200,000 | 28,785 |
| 05/15/2032 | 2.760% | CNY | 250,000 | 36,052 |
| Total | 115,883 |
| France 1.1% |
| French Republic Government Bond OAT(c),(d) |
| 11/25/2031 | 0.000% | EUR | 39,000 | 33,548 |
| French Republic Government Bond OAT(c) |
| 05/25/2036 | 1.250% | EUR | 80,000 | 70,092 |
| 05/25/2045 | 3.250% | EUR | 20,000 | 21,926 |
| Total | 125,566 |
| Italy 1.6% |
| Italy Buoni Poliennali Del Tesoro(c) |
| 05/01/2031 | 6.000% | EUR | 73,000 | 91,182 |
| 02/01/2037 | 4.000% | EUR | 75,000 | 79,691 |
| Total | 170,873 |
| Japan 4.1% |
| Japan Government 10-Year Bond |
| 06/20/2031 | 0.100% | JPY | 22,000,000 | 162,711 |
| Japan Government 20-Year Bond |
| 06/20/2041 | 0.400% | JPY | 14,000,000 | 95,146 |
| 09/20/2041 | 0.500% | JPY | 3,000,000 | 20,729 |
| 03/20/2042 | 0.800% | JPY | 5,050,000 | 36,462 |
| Foreign Government Obligations(a),(b) (continued) |
| Issuer | Coupon
Rate | | Principal
Amount ($) | Value ($) |
| Japan Government 30-Year Bond |
| 06/20/2050 | 0.600% | JPY | 2,000,000 | 12,751 |
| 06/20/2051 | 0.700% | JPY | 8,000,000 | 52,021 |
| 03/20/2052 | 1.000% | JPY | 3,650,000 | 25,604 |
| Japan Government Twenty-Year Bond |
| 06/20/2042 | 0.900% | JPY | 6,000,000 | 44,302 |
| Total | 449,726 |
| Netherlands 1.8% |
| Netherlands Government Bond(c) |
| 07/15/2026 | 0.500% | EUR | 110,000 | 111,689 |
| Netherlands Government Bond(c),(d) |
| 07/15/2031 | 0.000% | EUR | 95,000 | 83,654 |
| Total | 195,343 |
| Spain 1.4% |
| Spain Government Bond(c) |
| 04/30/2030 | 0.500% | EUR | 90,000 | 82,123 |
| 07/30/2035 | 1.850% | EUR | 40,000 | 36,542 |
| 07/30/2041 | 4.700% | EUR | 25,000 | 30,790 |
| Total | 149,455 |
| United Kingdom 0.6% |
| United Kingdom Gilt(c) |
| 12/07/2042 | 4.500% | GBP | 52,000 | 70,178 |
Total Foreign Government Obligations
(Cost $1,919,329) | 1,573,442 |
|
| U.S. Treasury Obligations 25.9% |
| | | | |
| U.S. Treasury |
| 03/31/2028 | 1.250% | | 142,000 | 126,669 |
| 06/30/2028 | 1.250% | | 142,000 | 126,047 |
| 09/30/2028 | 1.250% | | 700,000 | 617,641 |
| 10/31/2028 | 1.375% | | 250,000 | 221,836 |
| 11/30/2028 | 1.500% | | 515,000 | 459,436 |
| 04/30/2029 | 2.875% | | 450,000 | 432,070 |
| 05/15/2029 | 2.375% | | 122,000 | 113,832 |
| 08/15/2029 | 1.625% | | 122,000 | 108,847 |
| 08/15/2030 | 0.625% | | 111,000 | 90,465 |
| 02/15/2031 | 1.125% | | 103,000 | 86,729 |
| 08/15/2031 | 1.250% | | 515,000 | 431,956 |
Total U.S. Treasury Obligations
(Cost $3,165,979) | 2,815,528 |
The accompanying Notes to Financial Statements are an integral part of this statement.
| 8 | Columbia Solutions Conservative Portfolio | Annual Report 2023 |
Portfolio of Investments (continued)
March 31, 2023
| Money Market Funds 56.0% |
| | Shares | Value ($) |
| Columbia Short-Term Cash Fund, 4.983%(e),(f) | 6,085,601 | 6,084,384 |
Total Money Market Funds
(Cost $6,083,239) | 6,084,384 |
Total Investments in Securities
(Cost: $11,168,547) | 10,473,354 |
| Other Assets & Liabilities, Net | | 389,232 |
| Net Assets | 10,862,586 |
At March 31, 2023, securities and/or cash totaling $349,463 were pledged as collateral.
Investments in derivatives
| Forward foreign currency exchange contracts |
Currency to
be sold | Currency to
be purchased | Counterparty | Settlement
date | Unrealized
appreciation ($) | Unrealized
depreciation ($) |
| 67,000 CHF | 73,634 USD | Citi | 04/19/2023 | 287 | — |
| 557,000 CNY | 81,427 USD | Citi | 04/19/2023 | 258 | — |
| 1,089,000 EUR | 1,170,654 USD | Citi | 04/19/2023 | — | (11,357) |
| 164,000 HKD | 20,938 USD | Citi | 04/19/2023 | 29 | — |
| 258,000 SEK | 24,683 USD | Citi | 04/19/2023 | — | (196) |
| 9,669 USD | 9,000 EUR | Citi | 04/19/2023 | 100 | — |
| 287 USD | 3,000 SEK | Citi | 04/19/2023 | 2 | — |
| 67,000 NOK | 6,369 USD | Goldman Sachs International | 04/19/2023 | — | (35) |
| 79,953,034 JPY | 597,824 USD | HSBC | 04/19/2023 | — | (5,825) |
| 7,000 SGD | 5,210 USD | HSBC | 04/19/2023 | — | (52) |
| 4,576 USD | 600,000 JPY | HSBC | 04/19/2023 | — | (46) |
| 40,000 ZAR | 2,194 USD | HSBC | 04/19/2023 | — | (50) |
| 266,000 CNY | 38,963 USD | Standard Chartered | 04/19/2023 | 200 | — |
| 92,000 AUD | 61,426 USD | UBS | 04/19/2023 | — | (105) |
| 6,000 CAD | 4,391 USD | UBS | 04/19/2023 | — | (50) |
| 142,000 DKK | 20,504 USD | UBS | 04/19/2023 | — | (188) |
| 6,000 EUR | 6,450 USD | UBS | 04/19/2023 | — | (63) |
| 162,000 GBP | 196,901 USD | UBS | 04/19/2023 | — | (3,004) |
| 5,861 USD | 8,000 CAD | UBS | 04/19/2023 | 59 | — |
| 9,812 USD | 8,000 GBP | UBS | 04/19/2023 | 60 | — |
| Total | | | | 995 | (20,971) |
| Long futures contracts |
| Description | Number of
contracts | Expiration
date | Trading
currency | Notional
amount | Value/Unrealized
appreciation ($) | Value/Unrealized
depreciation ($) |
| 10-Year Mini Japanese Government Bond | 2 | 06/2023 | JPY | 29,564,000 | 3,630 | — |
| Australian 10-Year Bond | 1 | 06/2023 | AUD | 122,886 | 2,495 | — |
| Euro-Bobl | 3 | 06/2023 | EUR | 353,640 | 8,433 | — |
| Euro-BTP | 1 | 06/2023 | EUR | 115,350 | 4,224 | — |
| Euro-OAT | 1 | 06/2023 | EUR | 130,230 | 4,501 | — |
| Long Gilt | 2 | 06/2023 | GBP | 206,700 | 5,959 | — |
| MSCI EAFE Index | 7 | 06/2023 | USD | 733,775 | 20,600 | — |
| MSCI Emerging Markets Index | 6 | 06/2023 | USD | 298,650 | 8,725 | — |
| Russell 2000 Index E-mini | 1 | 06/2023 | USD | 90,675 | — | (32) |
| S&P 500 Index E-mini | 8 | 06/2023 | USD | 1,655,100 | 72,764 | — |
| U.S. Treasury 10-Year Note | 4 | 06/2023 | USD | 459,688 | 13,727 | — |
The accompanying Notes to Financial Statements are an integral part of this statement.
Columbia Solutions Conservative Portfolio | Annual Report 2023
| 9 |
Portfolio of Investments (continued)
March 31, 2023
| Long futures contracts (continued) |
| Description | Number of
contracts | Expiration
date | Trading
currency | Notional
amount | Value/Unrealized
appreciation ($) | Value/Unrealized
depreciation ($) |
| U.S. Treasury 5-Year Note | 2 | 06/2023 | USD | 219,016 | 4,653 | — |
| U.S. Treasury Ultra 10-Year Note | 11 | 06/2023 | USD | 1,332,547 | 42,016 | — |
| Total | | | | | 191,727 | (32) |
| Short futures contracts |
| Description | Number of
contracts | Expiration
date | Trading
currency | Notional
amount | Value/Unrealized
appreciation ($) | Value/Unrealized
depreciation ($) |
| Canadian Government 10-Year Bond | (1) | 06/2023 | CAD | (126,160) | — | (3,705) |
| Short Term Euro-BTP | (1) | 06/2023 | EUR | (105,370) | — | (1,293) |
| Total | | | | | — | (4,998) |
| Cleared credit default swap contracts - sell protection |
Reference
entity | Counterparty | Maturity
date | Receive
fixed
rate
(%) | Payment
frequency | Implied
credit
spread
(%)* | Notional
currency | Notional
amount | Value
($) | Upfront
payments
($) | Upfront
receipts
($) | Unrealized
appreciation
($) | Unrealized
depreciation
($) |
| Markit CDX North America High Yield Index, Series 40 | Morgan Stanley | 06/20/2028 | 5.000 | Quarterly | 4.635 | USD | 1,218,000 | 19,367 | — | — | 19,367 | — |
| Markit CDX North America Investment Grade Index, Series 40 | Morgan Stanley | 06/20/2028 | 1.000 | Quarterly | 0.756 | USD | 676,000 | 4,328 | — | — | 4,328 | — |
| Total | | | | | | | | 23,695 | — | — | 23,695 | — |
| * | Implied credit spreads, represented in absolute terms, utilized in determining the market value of credit default swap agreements on corporate or sovereign issues as of period end serve as an indicator of the current status of the payment/performance risk and represent the likelihood or risk of default for the credit derivative. The implied credit spread of a particular referenced entity reflects the cost of buying/selling protection and may include upfront payments required to be made to enter into the agreement. Wider credit spreads represent a deterioration of the referenced entity’s credit soundness and a greater likelihood or risk of default or other credit event occurring as defined under the terms of the agreement. |
Notes to Portfolio of Investments
| (a) | Principal amounts are denominated in United States Dollars unless otherwise noted. |
| (b) | Principal and interest may not be guaranteed by a governmental entity. |
| (c) | Represents privately placed and other securities and instruments exempt from Securities and Exchange Commission registration (collectively, private placements), such as Section 4(a)(2) and Rule 144A eligible securities, which are often sold only to qualified institutional buyers. At March 31, 2023, the total value of these securities amounted to $1,007,833, which represents 9.28% of total net assets. |
| (d) | Zero coupon bond. |
| (e) | The rate shown is the seven-day current annualized yield at March 31, 2023. |
| (f) | As defined in the Investment Company Act of 1940, as amended, an affiliated company is one in which the Fund owns 5% or more of the company’s outstanding voting securities, or a company which is under common ownership or control with the Fund. The value of the holdings and transactions in these affiliated companies during the year ended March 31, 2023 are as follows: |
| Affiliated issuers | Beginning
of period($) | Purchases($) | Sales($) | Net change in
unrealized
appreciation
(depreciation)($) | End of
period($) | Realized gain
(loss)($) | Dividends($) | End of
period shares |
| Columbia Short-Term Cash Fund, 4.983% |
| | 5,767,626 | 5,726,262 | (5,411,876) | 2,372 | 6,084,384 | (1,137) | 157,478 | 6,085,601 |
Currency Legend
| AUD | Australian Dollar |
| CAD | Canada Dollar |
| CHF | Swiss Franc |
| CNY | China Yuan Renminbi |
The accompanying Notes to Financial Statements are an integral part of this statement.
| 10 | Columbia Solutions Conservative Portfolio | Annual Report 2023 |
Portfolio of Investments (continued)
March 31, 2023
Currency Legend (continued)
| DKK | Danish Krone |
| EUR | Euro |
| GBP | British Pound |
| HKD | Hong Kong Dollar |
| JPY | Japanese Yen |
| NOK | Norwegian Krone |
| SEK | Swedish Krona |
| SGD | Singapore Dollar |
| USD | US Dollar |
| ZAR | South African Rand |
Fair value measurements
The Fund categorizes its fair value measurements according to a three-level hierarchy that maximizes the use of observable inputs and minimizes the use of unobservable inputs by prioritizing that the most observable input be used when available. Observable inputs are those that market participants would use in pricing an investment based on market data obtained from sources independent of the reporting entity. Unobservable inputs are those that reflect the Fund’s assumptions about the information market participants would use in pricing an investment. An investment’s level within the fair value hierarchy is based on the lowest level of any input that is deemed significant to the asset’s or liability’s fair value measurement. The input levels are not necessarily an indication of the risk or liquidity associated with investments at that level. For example, certain U.S. government securities are generally high quality and liquid, however, they are reflected as Level 2 because the inputs used to determine fair value may not always be quoted prices in an active market.
Fair value inputs are summarized in the three broad levels listed below:
| ■ | Level 1 — Valuations based on quoted prices for investments in active markets that the Fund has the ability to access at the measurement date. Valuation adjustments are not applied to Level 1 investments. |
| ■ | Level 2 — Valuations based on other significant observable inputs (including quoted prices for similar securities, interest rates, prepayment speeds, credit risks, etc.). |
| ■ | Level 3 — Valuations based on significant unobservable inputs (including the Fund’s own assumptions and judgment in determining the fair value of investments). |
Inputs that are used in determining fair value of an investment may include price information, credit data, volatility statistics, and other factors. These inputs can be either observable or unobservable. The availability of observable inputs can vary between investments, and is affected by various factors such as the type of investment, and the volume and level of activity for that investment or similar investments in the marketplace. The inputs will be considered by the Investment Manager, along with any other relevant factors in the calculation of an investment’s fair value. The Fund uses prices and inputs that are current as of the measurement date, which may include periods of market dislocations. During these periods, the availability of prices and inputs may be reduced for many investments. This condition could cause an investment to be reclassified between the various levels within the hierarchy.
Investments falling into the Level 3 category are primarily supported by quoted prices from brokers and dealers participating in the market for those investments. However, these may be classified as Level 3 investments due to lack of market transparency and corroboration to support these quoted prices. Additionally, valuation models may be used as the pricing source for any remaining investments classified as Level 3. These models may rely on one or more significant unobservable inputs and/or significant assumptions by the Investment Manager. Inputs used in valuations may include, but are not limited to, financial statement analysis, capital account balances, discount rates and estimated cash flows, and comparable company data.
The Fund’s Board of Trustees (the Board) has designated the Investment Manager, through its Valuation Committee (the Committee), as valuation designee, responsible for determining the fair value of the assets of the Fund for which market quotations are not readily available using valuation procedures approved by the Board. The Committee consists of voting and non-voting members from various groups within the Investment Manager’s organization, including operations and accounting, trading and investments, compliance, risk management and legal.
The Committee meets at least monthly to review and approve valuation matters, which may include a description of specific valuation determinations, data regarding pricing information received from approved pricing vendors and brokers and the results of Board-approved valuation policies and procedures (the Policies). The Policies address, among other things, instances when market quotations are or are not readily available, including recommendations of third party pricing vendors and a determination of appropriate pricing methodologies; events that require specific valuation determinations and assessment of fair value techniques; securities with a potential for stale pricing, including those that are illiquid, restricted, or in default; and the effectiveness of third party pricing vendors, including periodic reviews of vendors. The Committee meets more frequently, as needed, to discuss additional valuation matters, which may include the need to review back-testing results, review time-sensitive information or approve related valuation actions. Representatives of Columbia Management Investment Advisers, LLC report to the Board at each of its regularly scheduled meetings to discuss valuation matters and actions during the period, similar to those described earlier.
The following table is a summary of the inputs used to value the Fund’s investments at March 31, 2023:
| | Level 1 ($) | Level 2 ($) | Level 3 ($) | Total ($) |
| Investments in Securities | | | | |
| Foreign Government Obligations | — | 1,573,442 | — | 1,573,442 |
| U.S. Treasury Obligations | — | 2,815,528 | — | 2,815,528 |
| Money Market Funds | 6,084,384 | — | — | 6,084,384 |
| Total Investments in Securities | 6,084,384 | 4,388,970 | — | 10,473,354 |
| Investments in Derivatives | | | | |
The accompanying Notes to Financial Statements are an integral part of this statement.
Columbia Solutions Conservative Portfolio | Annual Report 2023
| 11 |
Portfolio of Investments (continued)
March 31, 2023
Fair value measurements (continued)
| | Level 1 ($) | Level 2 ($) | Level 3 ($) | Total ($) |
| Asset | | | | |
| Forward Foreign Currency Exchange Contracts | — | 995 | — | 995 |
| Futures Contracts | 191,727 | — | — | 191,727 |
| Swap Contracts | — | 23,695 | — | 23,695 |
| Liability | | | | |
| Forward Foreign Currency Exchange Contracts | — | (20,971) | — | (20,971) |
| Futures Contracts | (5,030) | — | — | (5,030) |
| Total | 6,271,081 | 4,392,689 | — | 10,663,770 |
See the Portfolio of Investments for all investment classifications not indicated in the table.
The Fund’s assets assigned to the Level 2 input category are generally valued using the market approach, in which a security’s value is determined through reference to prices and information from market transactions for similar or identical assets.
Derivative instruments are valued at unrealized appreciation (depreciation).
The accompanying Notes to Financial Statements are an integral part of this statement.
| 12 | Columbia Solutions Conservative Portfolio | Annual Report 2023 |
Statement of Assets and Liabilities
March 31, 2023
| Assets | |
| Investments in securities, at value | |
| Unaffiliated issuers (cost $5,085,308) | $4,388,970 |
| Affiliated issuers (cost $6,083,239) | 6,084,384 |
| Foreign currency (cost $11,712) | 11,766 |
| Margin deposits on: | |
| Futures contracts | 213,246 |
| Swap contracts | 136,217 |
| Unrealized appreciation on forward foreign currency exchange contracts | 995 |
| Receivable for: | |
| Capital shares sold | 2,904 |
| Dividends | 23,967 |
| Interest | 23,310 |
| Foreign tax reclaims | 1,131 |
| Variation margin for futures contracts | 38,626 |
| Variation margin for swap contracts | 7,187 |
| Expense reimbursement due from Investment Manager | 384 |
| Prepaid expenses | 994 |
| Trustees’ deferred compensation plan | 18,205 |
| Total assets | 10,952,286 |
| Liabilities | |
| Unrealized depreciation on forward foreign currency exchange contracts | 20,971 |
| Payable for: | |
| Investments purchased | 643 |
| Capital shares purchased | 6,193 |
| Variation margin for futures contracts | 1,940 |
| Compensation of board members | 12,471 |
| Accounting services fees | 20,145 |
| Custodian fees | 7,407 |
| Other expenses | 1,725 |
| Trustees’ deferred compensation plan | 18,205 |
| Total liabilities | 89,700 |
| Net assets applicable to outstanding capital stock | $10,862,586 |
| Represented by | |
| Paid in capital | 12,397,238 |
| Total distributable earnings (loss) | (1,534,652) |
| Total - representing net assets applicable to outstanding capital stock | $10,862,586 |
| Shares outstanding | 1,223,279 |
| Net asset value per share | 8.88 |
The accompanying Notes to Portfolio of Investments are an integral part of this statement.
Columbia Solutions Conservative Portfolio | Annual Report 2023
| 13 |
Statement of Operations
Year Ended March 31, 2023
| Net investment income | |
| Income: | |
| Dividends — affiliated issuers | $157,478 |
| Interest | 64,428 |
| Foreign taxes withheld | (113) |
| Total income | 221,793 |
| Expenses: | |
| Compensation of board members | 14,588 |
| Custodian fees | 26,412 |
| Printing and postage fees | 5,766 |
| Accounting services fees | 40,290 |
| Legal fees | 13,297 |
| Interest on collateral | 49 |
| Compensation of chief compliance officer | 2 |
| Other | 4,505 |
| Total expenses | 104,909 |
| Fees waived or expenses reimbursed by Investment Manager and its affiliates | (104,340) |
| Total net expenses | 569 |
| Net investment income | 221,224 |
| Realized and unrealized gain (loss) — net | |
| Net realized gain (loss) on: | |
| Investments — unaffiliated issuers | (145,098) |
| Investments — affiliated issuers | (1,137) |
| Foreign currency translations | (1,650) |
| Forward foreign currency exchange contracts | 169,425 |
| Futures contracts | (553,754) |
| Swap contracts | 3,739 |
| Net realized loss | (528,475) |
| Net change in unrealized appreciation (depreciation) on: | |
| Investments — unaffiliated issuers | (292,097) |
| Investments — affiliated issuers | 2,372 |
| Foreign currency translations | 601 |
| Forward foreign currency exchange contracts | (18,100) |
| Futures contracts | 234,563 |
| Swap contracts | 10,811 |
| Net change in unrealized appreciation (depreciation) | (61,850) |
| Net realized and unrealized loss | (590,325) |
| Net decrease in net assets resulting from operations | $(369,101) |
The accompanying Notes to Financial Statements are an integral part of this statement.
| 14 | Columbia Solutions Conservative Portfolio | Annual Report 2023 |
Statement of Changes in Net Assets
| | Year Ended
March 31, 2023 | Year Ended
March 31, 2022 |
| Operations | | |
| Net investment income | $221,224 | $61,926 |
| Net realized gain (loss) | (528,475) | 58,760 |
| Net change in unrealized appreciation (depreciation) | (61,850) | (325,045) |
| Net decrease in net assets resulting from operations | (369,101) | (204,359) |
| Distributions to shareholders | | |
| Net investment income and net realized gains | (500,033) | (790,929) |
| Total distributions to shareholders | (500,033) | (790,929) |
| Increase in net assets from capital stock activity | 918,177 | 692,404 |
| Total increase (decrease) in net assets | 49,043 | (302,884) |
| Net assets at beginning of year | 10,813,543 | 11,116,427 |
| Net assets at end of year | $10,862,586 | $10,813,543 |
| | Year Ended | Year Ended |
| | March 31, 2023 | March 31, 2022 |
| | Shares | Dollars ($) | Shares | Dollars ($) |
| Capital stock activity |
| | | | | |
| Subscriptions | 84,443 | 760,150 | 198,052 | 2,113,253 |
| Distributions reinvested | 57,162 | 499,593 | 77,705 | 790,260 |
| Redemptions | (37,347) | (341,566) | (216,468) | (2,211,109) |
| Total net increase | 104,258 | 918,177 | 59,289 | 692,404 |
The accompanying Notes to Financial Statements are an integral part of this statement.
Columbia Solutions Conservative Portfolio | Annual Report 2023
| 15 |
The following table is intended to help you understand the Fund’s financial performance. Certain information reflects financial results for a single share held for the periods shown. Per share net investment income (loss) amounts are calculated based on average shares outstanding during the period. Total return assumes reinvestment of all dividends and distributions, if any. Total return does not reflect payment of sales charges, if any. Total return and portfolio turnover are not annualized for periods of less than one year. The ratios of expenses and net investment income are annualized for periods of less than one year. The portfolio turnover rate is calculated without regard to purchase and sales transactions of short-term instruments and certain derivatives, if any. If such transactions were included, the Fund’s portfolio turnover rate may be higher.
| | Year Ended March 31, |
| 2023 | 2022 | 2021 | 2020 | 2019 |
| Per share data | | | | | |
| Net asset value, beginning of period | $9.66 | $10.49 | $10.15 | $10.24 | $10.05 |
| Income from investment operations: | | | | | |
| Net investment income | 0.19 | 0.05 | 0.08 | 0.21 | 0.21 |
| Net realized and unrealized gain (loss) | (0.53) | (0.21) | 0.76 | 0.34 | 0.36 |
| Total from investment operations | (0.34) | (0.16) | 0.84 | 0.55 | 0.57 |
| Less distributions to shareholders from: | | | | | |
| Net investment income | (0.44) | (0.11) | (0.11) | (0.26) | (0.30) |
| Net realized gains | — | (0.56) | (0.39) | (0.38) | (0.08) |
| Total distributions to shareholders | (0.44) | (0.67) | (0.50) | (0.64) | (0.38) |
| Net asset value, end of period | $8.88 | $9.66 | $10.49 | $10.15 | $10.24 |
| Total return | (3.44%) | (1.85%) | 8.23% | 5.26% | 5.85% |
| Ratios to average net assets | | | | | |
| Total gross expenses(a) | 1.01%(b) | 0.87%(b) | 0.90% | 1.01% | 1.44% |
| Total net expenses(a),(c) | 0.01%(b) | 0.01%(b) | 0.01% | 0.01% | 0.01% |
| Net investment income | 2.13% | 0.51% | 0.73% | 1.98% | 2.11% |
| Supplemental data | | | | | |
| Portfolio turnover | 22% | 233% | 66% | 218% | 141% |
| Net assets, end of period (in thousands) | $10,863 | $10,814 | $11,116 | $9,356 | $8,363 |
| Notes to Financial Highlights |
| (a) | In addition to the fees and expenses that the Fund bears directly, the Fund indirectly bears a pro rata share of the fees and expenses of any other funds in which it invests. Such indirect expenses are not included in the Fund’s reported expense ratios. |
| (b) | Ratios include interest on collateral expense which is less than 0.01%. |
| (c) | Total net expenses include the impact of certain fee waivers/expense reimbursements made by the Investment Manager and certain of its affiliates, if applicable. |
The accompanying Notes to Financial Statements are an integral part of this statement.
| 16 | Columbia Solutions Conservative Portfolio | Annual Report 2023 |
Notes to Financial Statements
March 31, 2023
Note 1. Organization
Columbia Solutions Conservative Portfolio (the Fund), a series of Columbia Funds Series Trust I (the Trust), is a diversified fund. The Trust is registered under the Investment Company Act of 1940, as amended (the 1940 Act), as an open-end management investment company organized as a Massachusetts business trust.
Fund shares
The Trust may issue an unlimited number of shares (without par value). The Fund is sold only to other Columbia Funds and certain collective investment trusts managed by Columbia Management Investment Advisers, LLC.
Note 2. Summary of significant accounting policies
Basis of preparation
The Fund is an investment company that applies the accounting and reporting guidance in the Financial Accounting Standards Board (FASB) Accounting Standards Codification Topic 946, Financial Services - Investment Companies (ASC 946). The financial statements are prepared in accordance with U.S. generally accepted accounting principles (GAAP), which requires management to make certain estimates and assumptions that affect the reported amounts of assets and liabilities, the disclosure of contingent assets and liabilities at the date of the financial statements and the reported amounts of income and expenses during the reporting period. Actual results could differ from those estimates.
The following is a summary of significant accounting policies followed by the Fund in the preparation of its financial statements.
Security valuation
Debt securities generally are valued based on prices obtained from pricing services, which are intended to reflect market transactions for normal, institutional-size trading units of similar securities. The services may use various pricing techniques that take into account, as applicable, factors such as yield, quality, coupon rate, maturity, type of issue, trading characteristics and other data, as well as approved independent broker-dealer quotes. Debt securities for which quotations are not readily available or not believed to be reflective of market value may also be valued based upon a bid quote from an approved independent broker-dealer. Debt securities maturing in 60 days or less are valued primarily at amortized market value, unless this method results in a valuation that management believes does not approximate fair value.
Investments in open-end investment companies (other than exchange-traded funds (ETFs)), are valued at the latest net asset value reported by those companies as of the valuation time.
Forward foreign currency exchange contracts are marked-to-market based upon foreign currency exchange rates provided by a pricing service.
Futures and options on futures contracts are valued based upon the settlement price at the close of regular trading on their principal exchanges or, in the absence of a settlement price, at the mean of the latest quoted bid and ask prices.
Swap transactions are valued through an independent pricing service or broker, or if neither is available, through an internal model based upon observable inputs.
Investments for which market quotations are not readily available, or that have quotations which management believes are not reflective of market value or reliable, are valued at fair value as determined in good faith under procedures approved by the Board of Trustees. If a security or class of securities (such as foreign securities) is valued at fair value, such value is likely to be different from the quoted or published price for the security, if available.
The determination of fair value often requires significant judgment. To determine fair value, management may use assumptions including but not limited to future cash flows and estimated risk premiums. Multiple inputs from various sources may be used to determine fair value.
Columbia Solutions Conservative Portfolio | Annual Report 2023
| 17 |
Notes to Financial Statements (continued)
March 31, 2023
GAAP requires disclosure regarding the inputs and valuation techniques used to measure fair value and any changes in valuation inputs or techniques. In addition, investments shall be disclosed by major category. This information is disclosed following the Fund’s Portfolio of Investments.
Foreign currency transactions and translations
The values of all assets and liabilities denominated in foreign currencies are generally translated into U.S. dollars at exchange rates determined at the close of regular trading on the New York Stock Exchange. Net realized and unrealized gains (losses) on foreign currency transactions and translations include gains (losses) arising from the fluctuation in exchange rates between trade and settlement dates on securities transactions, gains (losses) arising from the disposition of foreign currency and currency gains (losses) between the accrual and payment dates on dividends, interest income and foreign withholding taxes.
For financial statement purposes, the Fund does not distinguish that portion of gains (losses) on investments which is due to changes in foreign exchange rates from that which is due to changes in market prices of the investments. Such fluctuations are included with the net realized and unrealized gains (losses) on investments in the Statement of Operations.
Derivative instruments
The Fund invests in certain derivative instruments, as detailed below, in seeking to meet its investment objectives. Derivatives are instruments whose values depend on, or are derived from, in whole or in part, the value of one or more securities, currencies, commodities, indices, or other assets or instruments. Derivatives may be used to increase investment flexibility (including to maintain cash reserves while maintaining desired exposure to certain assets), for risk management (hedging) purposes, to facilitate trading, to reduce transaction costs and to pursue higher investment returns. The Fund may also use derivative instruments to mitigate certain investment risks, such as foreign currency exchange rate risk, interest rate risk and credit risk. Derivatives may involve various risks, including the potential inability of the counterparty to fulfill its obligations under the terms of the contract, the potential for an illiquid secondary market (making it difficult for the Fund to sell or terminate, including at favorable prices) and the potential for market movements which may expose the Fund to gains or losses in excess of the amount shown in the Statement of Assets and Liabilities. The notional amounts of derivative instruments, if applicable, are not recorded in the financial statements.
A derivative instrument may suffer a marked-to-market loss if the value of the contract decreases due to an unfavorable change in the market rates or values of the underlying instrument. Losses can also occur if the counterparty does not perform its obligations under the contract. The Fund’s risk of loss from counterparty credit risk on over-the-counter derivatives is generally limited to the aggregate unrealized gain netted against any collateral held by the Fund and the amount of any variation margin held by the counterparty, plus any replacement costs or related amounts. With exchange-traded or centrally cleared derivatives, there is reduced counterparty credit risk to the Fund since the clearinghouse or central counterparty (CCP) provides some protection in the case of clearing member default. The clearinghouse or CCP stands between the buyer and the seller of the contract; therefore, failure of the clearinghouse or CCP may pose additional counterparty credit risk. However, credit risk still exists in exchange-traded or centrally cleared derivatives with respect to initial and variation margin that is held in a broker’s customer account. While clearing brokers are required to segregate customer margin from their own assets, in the event that a clearing broker becomes insolvent or goes into bankruptcy and at that time there is a shortfall in the aggregate amount of margin held by the clearing broker for all its clients and such shortfall is remedied by the CCP or otherwise, U.S. bankruptcy laws will typically allocate that shortfall on a pro-rata basis across all the clearing broker’s customers (including the Fund), potentially resulting in losses to the Fund.
In order to better define its contractual rights and to secure rights that will help the Fund mitigate its counterparty risk, the Fund may enter into an International Swaps and Derivatives Association, Inc. Master Agreement (ISDA Master Agreement) or similar agreement with its derivatives counterparties. An ISDA Master Agreement is an agreement between the Fund and a counterparty that governs over-the-counter derivatives and foreign exchange forward contracts and contains, among other things, collateral posting terms and netting provisions in the event of a default and/or termination event. Under an ISDA Master Agreement, the Fund may, under certain circumstances, offset with the counterparty certain derivative instruments’ payables and/or receivables with collateral held and/or posted and create one single net payment. The provisions of the
| 18 | Columbia Solutions Conservative Portfolio | Annual Report 2023 |
Notes to Financial Statements (continued)
March 31, 2023
ISDA Master Agreement typically permit a single net payment in the event of default (close-out netting), including the bankruptcy or insolvency of the counterparty. Note, however, that bankruptcy or insolvency laws of a particular jurisdiction may impose restrictions on or prohibitions against the right of offset or netting in bankruptcy, insolvency or other events.
Collateral (margin) requirements differ by type of derivative. Margin requirements are established by the clearinghouse or CCP for exchange-traded and centrally cleared derivatives. Brokers can ask for margin in excess of the minimum in certain circumstances. Collateral terms for most over-the-counter derivatives are subject to regulatory requirements to exchange variation margin with trading counterparties and may have contract specific margin terms as well. For over-the-counter derivatives traded under an ISDA Master Agreement, the collateral requirements are typically calculated by netting the marked-to-market amount for each transaction under such agreement and comparing that amount to the value of any variation margin currently pledged by the Fund and/or the counterparty. Generally, the amount of collateral due from or to a party has to exceed a minimum transfer amount threshold (e.g., $250,000) before a transfer has to be made. To the extent amounts due to the Fund from its counterparties are not fully collateralized, contractually or otherwise, the Fund bears the risk of loss from counterparty nonperformance. The Fund may also pay interest expense on cash collateral received from the broker or receive interest income on cash collateral pledged to the broker. The Fund attempts to mitigate counterparty risk by only entering into agreements with counterparties that it believes have the financial resources to honor their obligations and by monitoring the financial stability of those counterparties.
Certain ISDA Master Agreements allow counterparties of over-the-counter derivatives transactions to terminate derivatives contracts prior to maturity in the event the Fund’s net asset value declines by a stated percentage over a specified time period or if the Fund fails to meet certain terms of the ISDA Master Agreement, which would cause the Fund to accelerate payment of any net liability owed to the counterparty. The Fund also has termination rights if the counterparty fails to meet certain terms of the ISDA Master Agreement. In determining whether to exercise such termination rights, the Fund would consider, in addition to counterparty credit risk, whether termination would result in a net liability owed from the counterparty.
For financial reporting purposes, the Fund does not offset derivative assets and derivative liabilities that are subject to netting arrangements in the Statement of Assets and Liabilities.
Forward foreign currency exchange contracts
Forward foreign currency exchange contracts are over-the-counter agreements between two parties to buy and sell a currency at a set price on a future date. The Fund utilized forward foreign currency exchange contracts to hedge the currency exposure associated with some or all of the Fund’s securities, to shift U.S. dollar exposure to achieve a representative weighted mix of major currencies in its benchmark and to generate total return through long and short positions versus the U.S. dollar. These instruments may be used for other purposes in future periods.
The values of forward foreign currency exchange contracts fluctuate daily with changes in foreign currency exchange rates. Changes in the value of these contracts are recorded as unrealized appreciation or depreciation until the contract is exercised or has expired. The Fund will realize a gain or loss when the forward foreign currency exchange contract is closed or expires. Non-deliverable forward foreign currency exchange contracts are settled with the counterparty in U.S. dollars without delivery of foreign currency.
The use of forward foreign currency exchange contracts does not eliminate fluctuations in the prices of the Fund’s portfolio securities. The risks of forward foreign currency exchange contracts include movement in the values of the foreign currencies relative to the U.S. dollar (or other foreign currencies) and the possibility that counterparties will not complete their contractual obligations, which may be in excess of the amount reflected, if any, in the Statement of Assets and Liabilities.
Futures contracts
Futures contracts are exchange-traded and represent commitments for the future purchase or sale of an asset at a specified price on a specified date. The Fund bought and sold futures contracts to manage the duration and yield curve exposure of the Fund versus the benchmark, to manage exposure to movements in interest rates, to manage exposure to the securities market and to maintain appropriate equity market exposure while keeping sufficient cash to accommodate daily redemptions. These instruments may be used for other purposes in future periods. Upon entering into futures contracts, the Fund bears
Columbia Solutions Conservative Portfolio | Annual Report 2023
| 19 |
Notes to Financial Statements (continued)
March 31, 2023
risks that it may not achieve the anticipated benefits of the futures contracts and may realize a loss. Additional risks include counterparty credit risk, the possibility of an illiquid market, and that a change in the value of the contract or option may not correlate with changes in the value of the underlying asset.
Upon entering into a futures contract, the Fund deposits cash or securities with the broker, known as a futures commission merchant (FCM), in an amount sufficient to meet the initial margin requirement. The initial margin deposit must be maintained at an established level over the life of the contract. Cash deposited as initial margin is recorded in the Statement of Assets and Liabilities as margin deposits. Securities deposited as initial margin are designated in the Portfolio of Investments. Subsequent payments (variation margin) are made or received by the Fund each day. The variation margin payments are equal to the daily change in the contract value and are recorded as variation margin receivable or payable and are offset in unrealized gains or losses. The Fund generally expects to earn interest income on its margin deposits. The Fund recognizes a realized gain or loss when the contract is closed or expires. Futures contracts involve, to varying degrees, risk of loss in excess of the variation margin disclosed in the Statement of Assets and Liabilities.
Swap contracts
Swap contracts are negotiated in the over-the-counter market and are entered into bilaterally or centrally cleared (centrally cleared swap contract). In a centrally cleared swap contract, immediately following execution of the swap contract with a broker, the swap contract is novated to a central counterparty (the CCP) and the CCP becomes the Fund’s counterparty to the centrally cleared swap contract. The Fund is required to deposit initial margin with the futures commission merchant (FCM), which pledges it through to the CCP in the form of cash or securities in an amount that varies depending on the size and risk profile of the particular swap contract. Securities deposited as initial margin are designated in the Portfolio of Investments and cash deposited is recorded in the Statement of Assets and Liabilities as margin deposits. For a bilateral swap contract, the Fund has credit exposure to the broker, but exchanges daily variation margin with the broker based on the mark-to-market value of the swap contract to minimize that exposure. For centrally cleared swap contracts, the Fund has minimal credit exposure to the FCM because the CCP stands between the Fund and the relevant buyer/seller on the other side of the contract. Swap contracts are marked-to-market daily and changes in value are recorded as unrealized appreciation (depreciation). The daily change in valuation of centrally cleared swap contracts, if any, is recorded as a receivable or payable for variation margin in the Statement of Assets and Liabilities.
Entering into these contracts involves, to varying degrees, elements of interest, liquidity and counterparty credit risk in excess of the amounts recognized in the Statement of Assets and Liabilities. Such risks involve the possibility that there may be unfavorable changes in interest rates, market conditions or other conditions, that it may be difficult to initiate a swap transaction or liquidate a position at an advantageous time or price which may result in significant losses, and that the bilateral counterparty, FCM or CCP, as applicable, may not fulfill its obligation under the contract.
Credit default swap contracts
The Fund entered into credit default swap contracts to increase or decrease its credit exposure to an index and to manage credit risk exposure. These instruments may be used for other purposes in future periods. Credit default swap contracts are transactions in which one party pays fixed periodic payments to a counterparty in consideration for an agreement from the counterparty to make a specific payment should a specified credit event(s) take place. Although specified credit events are contract specific, credit events are typically bankruptcy, failure to pay, restructuring, obligation acceleration, obligation default, or repudiation/moratorium.
As the purchaser of a credit default swap contract, the Fund purchases protection by paying a periodic interest rate on the notional amount to the counterparty. The interest amount is accrued daily as a component of unrealized appreciation (depreciation) and is recorded as a realized loss upon payment. If a credit event as specified in the contract occurs, the Fund may have the option either to deliver the reference obligation to the seller in exchange for a cash payment of its par amount, or to receive a net cash settlement equal to the par amount less an agreed-upon value of the reference obligation as of the date of the credit event. The difference between the value of the obligation or cash delivered and the notional amount received will be recorded as a realized gain (loss).
| 20 | Columbia Solutions Conservative Portfolio | Annual Report 2023 |
Notes to Financial Statements (continued)
March 31, 2023
As the seller of a credit default swap contract, the Fund sells protection to a buyer and will generally receive a periodic interest rate on a notional amount. The interest amount is accrued daily as a component of unrealized appreciation (depreciation) and is recorded as a realized gain upon receipt of the payment. If a credit event as specified in the contract with the counterparty occurs, the Fund may either be required to accept the reference obligation from the buyer in exchange for a cash payment of its notional amount, or to pay the buyer a net cash settlement equal to the notional amount less an agreed-upon value of the reference obligation (recovery value) as of the date of the credit event. The difference between the value of the obligation or cash received and the notional amount paid will be recorded as a realized gain (loss). The maximum potential amount of undiscounted future payments the Fund could be required to make as the seller of protection under a credit default swap contract is equal to the notional amount of the reference obligation. These potential amounts may be partially offset by any recovery values of the respective reference obligations or upfront receipts upon entering into the agreement. The notional amounts and market values of all credit default swap contracts in which the Fund is the seller of protection, if any, are disclosed in the Credit Default Swap Contracts Outstanding schedule following the Portfolio of Investments.
As a protection seller, the Fund bears the risk of loss from the credit events specified in the contract with the counterparty. For credit default swap contracts on credit indices, quoted market prices and resulting market values serve as an indicator of the current status of the payment/performance risk. Increasing market values, in absolute terms when compared to the notional amount of the swap, represent a deterioration of the reference entity’s credit soundness and a greater likelihood or risk of default or other credit event occurring as defined under the terms of the contract.
Any upfront payment or receipt by the Fund upon entering into a credit default swap contract is recorded as an asset or liability, respectively, and amortized daily as a component of realized gain (loss) in the Statement of Operations. Credit default swap contracts are valued daily, and the change in value is recorded as unrealized appreciation (depreciation) until the termination of the swap, at which time a realized gain (loss) is recorded.
Credit default swap contracts can involve greater risks than if a fund had invested in the reference obligation directly since, in addition to general market risks, credit default swaps are subject to counterparty credit risk, leverage risk, hedging risk, correlation risk and liquidity risk.
Interest rate and inflation rate swap contracts
The Fund entered into interest rate swap transactions and/or inflation rate swap contracts to manage interest rate and market risk exposure to produce incremental earnings and to synthetically add or subtract principal exposure to a market. These instruments may be used for other purposes in future periods. An interest rate swap or inflation rate swap, as applicable, is an agreement between two parties where there are two flows and payments are made between the two counterparties and the payments are dependent upon changes in an interest rate, inflation rate or inflation index calculated on a nominal amount. Interest rate swaps are agreements between two parties that involve the exchange of one type of interest rate for another type of interest rate cash flow on specified dates in the future, based on a predetermined, specified notional amount. Certain interest rate swaps are considered forward-starting, whereby the accrual for the exchange of cash flows does not begin until a specified date in the future. The net cash flow for a standard interest rate swap transaction is generally the difference between a floating market interest rate versus a fixed interest rate.
Interest rate swaps are valued daily and unrealized appreciation (depreciation) is recorded. Certain interest rate swaps may accrue periodic interest on a daily basis as a component of unrealized appreciation (depreciation); the Fund will realize a gain or loss upon the payment or receipt of accrued interest. The Fund will realize a gain or a loss when the interest rate swap is terminated.
Effects of derivative transactions in the financial statements
The following tables are intended to provide additional information about the effect of derivatives on the financial statements of the Fund, including: the fair value of derivatives by risk category and the location of those fair values in the Statement of Assets and Liabilities; and the impact of derivative transactions over the period in the Statement of Operations, including realized and unrealized gains (losses). The derivative instrument schedules following the Portfolio of Investments present additional information regarding derivative instruments outstanding at the end of the period, if any.
Columbia Solutions Conservative Portfolio | Annual Report 2023
| 21 |
Notes to Financial Statements (continued)
March 31, 2023
The following table is a summary of the fair value of derivative instruments (not considered to be hedging instruments for accounting disclosure purposes) at March 31, 2023:
| | Asset derivatives | |
Risk exposure
category | Statement
of assets and liabilities
location | Fair value ($) |
| Credit risk | Component of total distributable earnings (loss) — unrealized appreciation on swap contracts | 23,695* |
| Equity risk | Component of total distributable earnings (loss) — unrealized appreciation on futures contracts | 102,089* |
| Foreign exchange risk | Unrealized appreciation on forward foreign currency exchange contracts | 995 |
| Interest rate risk | Component of total distributable earnings (loss) — unrealized appreciation on futures contracts | 89,638* |
| Total | | 216,417 |
| | Liability derivatives | |
Risk exposure
category | Statement
of assets and liabilities
location | Fair value ($) |
| Equity risk | Component of total distributable earnings (loss) — unrealized depreciation on futures contracts | 32* |
| Foreign exchange risk | Unrealized depreciation on forward foreign currency exchange contracts | 20,971 |
| Interest rate risk | Component of total distributable earnings (loss) — unrealized depreciation on futures contracts | 4,998* |
| Total | | 26,001 |
| * | Includes cumulative appreciation (depreciation) as reported in the tables following the Portfolio of Investments. Only the current day’s variation margin is reported in receivables or payables in the Statement of Assets and Liabilities. |
The following table indicates the effect of derivative instruments (not considered to be hedging instruments for accounting disclosure purposes) in the Statement of Operations for the year ended March 31, 2023:
| Amount of realized gain (loss) on derivatives recognized in income |
| Risk exposure category | Forward
foreign
currency
exchange
contracts
($) | Futures
contracts
($) | Swap
contracts
($) | Total
($) |
| Credit risk | — | — | (4,424) | (4,424) |
| Equity risk | — | (150,470) | — | (150,470) |
| Foreign exchange risk | 169,425 | — | — | 169,425 |
| Interest rate risk | — | (403,284) | 8,163 | (395,121) |
| Total | 169,425 | (553,754) | 3,739 | (380,590) |
| |
| Change in unrealized appreciation (depreciation) on derivatives recognized in income |
| Risk exposure category | Forward
foreign
currency
exchange
contracts
($) | Futures
contracts
($) | Swap
contracts
($) | Total
($) |
| Credit risk | — | — | 16,484 | 16,484 |
| Equity risk | — | 50,870 | — | 50,870 |
| Foreign exchange risk | (18,100) | — | — | (18,100) |
| Interest rate risk | — | 183,693 | (5,673) | 178,020 |
| Total | (18,100) | 234,563 | 10,811 | 227,274 |
| 22 | Columbia Solutions Conservative Portfolio | Annual Report 2023 |
Notes to Financial Statements (continued)
March 31, 2023
The following table is a summary of the average outstanding volume by derivative instrument for the year ended March 31, 2023:
| Derivative instrument | Average notional
amounts ($)* |
| Futures contracts — long | 4,317,721 |
| Futures contracts — short | 179,362 |
| Credit default swap contracts — sell protection | 1,147,380 |
| Derivative instrument | Average unrealized
appreciation ($) | Average unrealized
depreciation ($) |
| Forward foreign currency exchange contracts | 28,351* | (12,695)* |
| Interest rate swap contracts | 650** | — |
| * | Based on the ending quarterly outstanding amounts for the year ended March 31, 2023. |
| ** | Based on the ending daily outstanding amounts for the year ended March 31, 2023. |
Offsetting of assets and liabilities
The following table presents the Fund’s gross and net amount of assets and liabilities available for offset under netting arrangements as well as any related collateral received or pledged by the Fund as of March 31, 2023:
| | Citi ($) | Goldman
Sachs
International ($) | HSBC ($) | Morgan
Stanley ($) | Standard
Chartered ($) | UBS ($) | Total ($) | | |
| Assets | | | | | | | | | |
| Centrally cleared credit default swap contracts (a) | - | - | - | 7,187 | - | - | 7,187 | | |
| Forward foreign currency exchange contracts | 676 | - | - | - | 200 | 119 | 995 | | |
| Total assets | 676 | - | - | 7,187 | 200 | 119 | 8,182 | | |
| Liabilities | | | | | | | | | |
| Forward foreign currency exchange contracts | 11,553 | 35 | 5,973 | - | - | 3,410 | 20,971 | | |
| Total financial and derivative net assets | (10,877) | (35) | (5,973) | 7,187 | 200 | (3,291) | (12,789) | | |
| Total collateral received (pledged) (b) | - | - | - | - | - | - | - | | |
| Net amount (c) | (10,877) | (35) | (5,973) | 7,187 | 200 | (3,291) | (12,789) | | |
| (a) | Centrally cleared swaps are included within payable/receivable for variation margin in the Statement of Assets and Liabilities. |
| (b) | In some instances, the actual collateral received and/or pledged may be more than the amount shown due to overcollateralization. |
| (c) | Represents the net amount due from/(to) counterparties in the event of default. |
Security transactions
Security transactions are accounted for on the trade date. Cost is determined and gains (losses) are based upon the specific identification method for both financial statement and federal income tax purposes.
Income recognition
Interest income is recorded on an accrual basis. Market premiums and discounts, including original issue discounts, are amortized and accreted, respectively, over the expected life of the security on all debt securities, unless otherwise noted.
The Fund may place a debt security on non-accrual status and reduce related interest income when it becomes probable that the interest will not be collected and the amount of uncollectible interest can be reasonably estimated. The Fund may also adjust accrual rates when it becomes probable the full interest will not be collected and a partial payment will be received. A defaulted debt security is removed from non-accrual status when the issuer resumes interest payments or when collectability of interest is reasonably assured.
Dividend income is recorded on the ex-dividend date.
Columbia Solutions Conservative Portfolio | Annual Report 2023
| 23 |
Notes to Financial Statements (continued)
March 31, 2023
Expenses
General expenses of the Trust are allocated to the Fund and other funds of the Trust based upon relative net assets or other expense allocation methodologies determined by the nature of the expense. Expenses directly attributable to the Fund are charged to the Fund.
Determination of net asset value
The net asset value per share of the Fund is computed by dividing the value of the net assets of the Fund by the total number of outstanding shares of that Fund, rounded to the nearest cent, at the close of regular trading (ordinarily 4:00 p.m. Eastern Time) every day the New York Stock Exchange is open.
Federal income tax status
The Fund intends to qualify each year as a regulated investment company under Subchapter M of the Internal Revenue Code, as amended, and will distribute substantially all of its investment company taxable income and net capital gain, if any, for its tax year, and as such will not be subject to federal income taxes. In addition, the Fund intends to distribute in each calendar year substantially all of its ordinary income, capital gain net income and certain other amounts, if any, such that the Fund should not be subject to federal excise tax. Therefore, no federal income or excise tax provision is recorded.
Foreign taxes
The Fund may be subject to foreign taxes on income, gains on investments or currency repatriation, a portion of which may be recoverable. The Fund will accrue such taxes and recoveries, as applicable, based upon its current interpretation of tax rules and regulations that exist in the markets in which it invests.
Realized gains in certain countries may be subject to foreign taxes at the Fund level, based on statutory rates. The Fund accrues for such foreign taxes on realized and unrealized gains at the appropriate rate for each jurisdiction, as applicable. The amount, if any, is disclosed as a liability in the Statement of Assets and Liabilities.
Distributions to shareholders
Distributions from net investment income, if any, are declared and paid annually. Net realized capital gains, if any, are distributed at least annually. Income distributions and capital gain distributions are determined in accordance with federal income tax regulations, which may differ from GAAP.
Guarantees and indemnifications
Under the Trust’s organizational documents and, in some cases, by contract, its officers and trustees are indemnified against certain liabilities arising out of the performance of their duties to the Trust or its funds. In addition, certain of the Fund’s contracts with its service providers contain general indemnification clauses. The Fund’s maximum exposure under these arrangements is unknown since the amount of any future claims that may be made against the Fund cannot be determined, and the Fund has no historical basis for predicting the likelihood of any such claims.
Recent accounting pronouncement
Tailored Shareholder Reports
In October 2022, the Securities and Exchange Commission (SEC) adopted a final rule relating to Tailored Shareholder Reports for Mutual Funds and Exchange-Traded Funds; Fee Information in Investment Company Advertisements. The rule and form amendments will, among other things, require the Fund to transmit concise and visually engaging shareholder reports that highlight key information. The amendments will require that funds tag information in a structured data format and that certain more in-depth information be made available online and available for delivery free of charge to investors on request. The amendments became effective January 24, 2023. There is an 18-month transition period after the effective date of the amendment.
| 24 | Columbia Solutions Conservative Portfolio | Annual Report 2023 |
Notes to Financial Statements (continued)
March 31, 2023
Note 3. Fees and other transactions with affiliates
Management services fees
The Fund has entered into a Management Agreement with Columbia Management Investment Advisers, LLC (the Investment Manager), a wholly-owned subsidiary of Ameriprise Financial, Inc. (Ameriprise Financial). Under the Management Agreement, subject to the policies set by the Board of Trustees, the Investment Manager provides the Fund with investment research and advice, as well as administrative and accounting services. The Fund does not pay a management fee for the investment advisory or administrative services provided to the Fund, but it may pay taxes, brokerage commissions and nonadvisory expenses.
Compensation of board members
Members of the Board of Trustees who are not officers or employees of the Investment Manager or Ameriprise Financial are compensated for their services to the Fund as disclosed in the Statement of Operations. Under a Deferred Compensation Plan (the Deferred Plan), these members of the Board of Trustees may elect to defer payment of up to 100% of their compensation. Deferred amounts are treated as though equivalent dollar amounts had been invested in shares of certain funds managed by the Investment Manager. The Fund’s liability for these amounts is adjusted for market value changes and remains in the Fund until distributed in accordance with the Deferred Plan. All amounts payable under the Deferred Plan constitute a general unsecured obligation of the Fund. The expense for the Deferred Plan, which includes Trustees’ fees deferred during the current period as well as any gains or losses on the Trustees’ deferred compensation balances as a result of market fluctuations, is included in "Compensation of board members" in the Statement of Operations.
Compensation of Chief Compliance Officer
The Board of Trustees has appointed a Chief Compliance Officer for the Fund in accordance with federal securities regulations. As disclosed in the Statement of Operations, a portion of the Chief Compliance Officer’s total compensation is allocated to the Fund, along with other allocations to affiliated registered investment companies managed by the Investment Manager and its affiliates, based on relative net assets.
Transfer agency fees
The Fund has a Transfer and Dividend Disbursing Agent Agreement with Columbia Management Investment Services Corp. (the Transfer Agent), an affiliate of the Investment Manager and a wholly-owned subsidiary of Ameriprise Financial, under which the Fund does not pay an annual fee to the Transfer Agent.
Distribution and service fees
The Fund has an agreement with Columbia Management Investment Distributors, Inc. (the Distributor), an affiliate of the Investment Manager and a wholly-owned subsidiary of Ameriprise Financial, for distribution and shareholder services. The Fund does not pay the Distributor a fee for the distribution services it provides to the Fund.
Expenses waived/reimbursed by the Investment Manager and its affiliates
The Investment Manager and certain of its affiliates have contractually agreed to waive fees and/or reimburse expenses (excluding certain fees and expenses described below), through July 31, 2032, unless sooner terminated at the sole discretion of the Board of Trustees, so that the Fund’s net operating expenses, after giving effect to fees waived/expenses reimbursed and any balance credits and/or overdraft charges from the Fund’s custodian, do not exceed the annual rate of 0.01% of the Fund’s average daily net assets.
Under the agreement governing this fee waiver and/or expense reimbursement arrangement, the following fees and expenses are excluded from the waiver/reimbursement commitment, and therefore will be paid by the Fund, if applicable: taxes (including foreign transaction taxes), expenses associated with investments in affiliated and non-affiliated pooled investment vehicles (including mutual funds and exchange-traded funds), transaction costs and brokerage commissions, costs related to any securities lending program, dividend expenses associated with securities sold short, inverse floater program fees and expenses, transaction charges and interest on borrowed money, interest, costs associated with shareholder meetings, infrequent and/or unusual expenses and any other expenses the exclusion of which is specifically
Columbia Solutions Conservative Portfolio | Annual Report 2023
| 25 |
Notes to Financial Statements (continued)
March 31, 2023
approved by the Board of Trustees. This agreement may be modified or amended only with approval from the Investment Manager, certain of its affiliates and the Fund. Prior to August 1, 2022, expenses associated with investments in affiliated and non-affiliated pooled investment vehicles (including mutual funds and exchange-traded funds) were included with the waivers and/or expense reimbursement arrangement. Any fees waived and/or expenses reimbursed under the expense reimbursement arrangements described above are not recoverable by the Investment Manager or its affiliates in future periods.
Note 4. Federal tax information
The timing and character of income and capital gain distributions are determined in accordance with income tax regulations, which may differ from GAAP because of temporary or permanent book to tax differences.
At March 31, 2023, these differences were primarily due to differing treatment for deferral/reversal of wash sale losses, foreign currency transactions, derivative investments, tax straddles, late-year ordinary losses, capital loss carryforwards and swap investments. To the extent these differences were permanent, reclassifications were made among the components of the Fund’s net assets. Temporary differences do not require reclassifications.
The following reclassifications were made:
Excess of distributions
over net investment
income ($) | Accumulated
net realized
(loss) ($) | Paid in
capital ($) |
| 139,943 | (139,943) | — |
Net investment income (loss) and net realized gains (losses), as disclosed in the Statement of Operations, and net assets were not affected by this reclassification.
The tax character of distributions paid during the years indicated was as follows:
| Year Ended March 31, 2023 | Year Ended March 31, 2022 |
Ordinary
income ($) | Long-term
capital gains ($) | Total ($) | Ordinary
income ($) | Long-term
capital gains ($) | Total ($) |
| 500,033 | — | 500,033 | 414,368 | 376,561 | 790,929 |
Short-term capital gain distributions, if any, are considered ordinary income distributions for tax purposes.
At March 31, 2023, the components of distributable earnings on a tax basis were as follows:
Undistributed
ordinary income ($) | Undistributed
long-term
capital gains ($) | Capital loss
carryforwards ($) | Net unrealized
(depreciation) ($) |
| — | — | (746,794) | (694,677) |
At March 31, 2023, the cost of all investments for federal income tax purposes along with the aggregate gross unrealized appreciation and depreciation based on that cost was:
Federal
tax cost ($) | Gross unrealized
appreciation ($) | Gross unrealized
(depreciation) ($) | Net unrealized
(depreciation) ($) |
| 11,358,447 | 27,217 | (721,894) | (694,677) |
Tax cost of investments and unrealized appreciation/(depreciation) may also include timing differences that do not constitute adjustments to tax basis.
| 26 | Columbia Solutions Conservative Portfolio | Annual Report 2023 |
Notes to Financial Statements (continued)
March 31, 2023
The following capital loss carryforwards, determined at March 31, 2023, may be available to reduce future net realized gains on investments, if any, to the extent permitted by the Internal Revenue Code. In addition, for the year ended March 31, 2023, capital loss carryforwards utilized, if any, were as follows:
No expiration
short-term ($) | No expiration
long-term ($) | Total ($) | Utilized ($) |
| (446,929) | (299,865) | (746,794) | — |
Under current tax rules, regulated investment companies can elect to treat certain late-year ordinary losses incurred and post-October capital losses (capital losses realized after October 31) as arising on the first day of the following taxable year. As of March 31, 2023, the Fund will elect to treat the following late-year ordinary losses and post-October capital losses as arising on April 1, 2023.
Late year
ordinary losses ($) | Post-October
capital losses ($) |
| 93,554 | — |
Management of the Fund has concluded that there are no significant uncertain tax positions in the Fund that would require recognition in the financial statements. However, management’s conclusion may be subject to review and adjustment at a later date based on factors including, but not limited to, new tax laws, regulations, and administrative interpretations (including relevant court decisions). Generally, the Fund’s federal tax returns for the prior three fiscal years remain subject to examination by the Internal Revenue Service.
Note 5. Portfolio information
The cost of purchases and proceeds from sales of securities, excluding short-term investments and derivatives, if any, aggregated to $1,017,669 and $1,055,848, respectively, for the year ended March 31, 2023, of which $446,291 and $621,201, respectively, were U.S. government securities. The amount of purchase and sale activity impacts the portfolio turnover rate reported in the Financial Highlights.
Note 6. Affiliated money market fund
The Fund invests significantly in Columbia Short-Term Cash Fund, an affiliated money market fund established for the exclusive use by the Fund and other affiliated funds (the Affiliated MMF). The income earned by the Fund from such investments is included as Dividends - affiliated issuers in the Statement of Operations. As an investing fund, the Fund indirectly bears its proportionate share of the expenses of the Affiliated MMF. The Affiliated MMF prices its shares with a floating net asset value. In addition, the Board of Trustees of the Affiliated MMF may impose a fee on redemptions (sometimes referred to as a liquidity fee) or temporarily suspend redemptions (sometimes referred to as imposing a redemption gate) in the event its liquidity falls below regulatory limits.
Note 7. Interfund lending
Pursuant to an exemptive order granted by the Securities and Exchange Commission, the Fund participates in a program (the Interfund Program) allowing each participating Columbia Fund (each, a Participating Fund) to lend money directly to and, except for closed-end funds and money market funds, borrow money directly from other Participating Funds for temporary purposes. The amounts eligible for borrowing and lending under the Interfund Program are subject to certain restrictions.
Interfund loans are subject to the risk that the borrowing fund could be unable to repay the loan when due, and a delay in repayment to the lending fund could result in lost opportunities and/or additional lending costs. The exemptive order is subject to conditions intended to mitigate conflicts of interest arising from the Investment Manager’s relationship with each Participating Fund.
The Fund did not borrow or lend money under the Interfund Program during the year ended March 31, 2023.
Columbia Solutions Conservative Portfolio | Annual Report 2023
| 27 |
Notes to Financial Statements (continued)
March 31, 2023
Note 8. Line of credit
The Fund has access to a revolving credit facility with a syndicate of banks led by JPMorgan Chase Bank, N.A., Citibank, N.A. and Wells Fargo Bank, N.A. whereby the Fund may borrow for the temporary funding of shareholder redemptions or for other temporary or emergency purposes. Pursuant to an October 27, 2022 amendment and restatement, the credit facility, which is an agreement between the Fund and certain other funds managed by the Investment Manager or an affiliated investment manager, severally and not jointly, permits aggregate borrowings up to $950 million. Interest is currently charged to each participating fund based on its borrowings at a rate equal to the higher of (i) the federal funds effective rate, (ii) the secured overnight financing rate plus 0.10% and (iii) the overnight bank funding rate, plus in each case, 1.00%. Each borrowing under the credit facility matures no later than 60 days after the date of borrowing. The Fund also pays a commitment fee equal to its pro rata share of the unused amount of the credit facility at a rate of 0.15% per annum. The commitment fee is included in other expenses in the Statement of Operations. This agreement expires annually in October unless extended or renewed. Prior to the October 27, 2022 amendment and restatement, the Fund had access to a revolving credit facility with a syndicate of banks led by JPMorgan Chase Bank, N.A., Citibank, N.A. and Wells Fargo Bank, N.A. which permitted collective borrowings up to $950 million. Interest was charged to each participating fund based on its borrowings at a rate equal to the higher of (i) the federal funds effective rate, (ii) the secured overnight financing rate plus 0.11448% and (iii) the overnight bank funding rate, plus in each case, 1.00%.
The Fund had no borrowings during the year ended March 31, 2023.
Note 9. Significant risks
Credit risk
Credit risk is the risk that the value of debt instruments in the Fund’s portfolio may decline because the issuer defaults or otherwise becomes unable or unwilling, or is perceived to be unable or unwilling, to honor its financial obligations, such as making payments to the Fund when due. Credit rating agencies assign credit ratings to certain debt instruments to indicate their credit risk. Lower-rated or unrated debt instruments held by the Fund may present increased credit risk as compared to higher-rated debt instruments.
Derivatives risk
Losses involving derivative instruments may be substantial, because a relatively small movement in the underlying reference (which is generally the price, rate or other economic indicator associated with a security(ies), commodity, currency, index or other instrument or asset) may result in a substantial loss for the Fund. In addition to the potential for increased losses, the use of derivative instruments may lead to increased volatility within the Fund. Derivatives will typically increase the Fund’s exposure to principal risks to which it is otherwise exposed, and may expose the Fund to additional risks, including correlation risk, counterparty risk, hedging risk, leverage risk, liquidity risk and pricing risk.
Foreign currency risk
The performance of the Fund may be materially affected positively or negatively by foreign currency strength or weakness relative to the U.S. dollar, particularly if the Fund invests a significant percentage of its assets in foreign securities or other assets denominated in currencies other than the U.S. dollar. Currency rates in foreign countries may fluctuate significantly over short or long periods of time for a number of reasons, including changes in interest rates, imposition of currency controls and economic or political developments in the U.S. or abroad. The Fund may also incur currency conversion costs when converting foreign currencies into U.S. dollars and vice versa.
Interest rate risk
Interest rate risk is the risk of losses attributable to changes in interest rates. In general, if interest rates rise, the values of debt instruments tend to fall, and if interest rates fall, the values of debt instruments tend to rise. Actions by governments and central banking authorities can result in increases or decreases in interest rates. Higher periods of inflation could lead such authorities to raise interest rates. Increasing interest rates may negatively affect the value of debt securities held by the
| 28 | Columbia Solutions Conservative Portfolio | Annual Report 2023 |
Notes to Financial Statements (continued)
March 31, 2023
Fund, resulting in a negative impact on the Fund’s performance and net asset value per share. In general, the longer the maturity or duration of a debt security, the greater its sensitivity to changes in interest rates. The Fund is subject to the risk that the income generated by its investments may not keep pace with inflation.
Leverage risk
Leverage occurs when the Fund increases its assets available for investment using borrowings, short sales, derivatives, or similar instruments or techniques. The use of leverage may produce volatility and may exaggerate changes in the Fund’s net asset value and in the return on the Fund’s portfolio, which may increase the risk that the Fund will lose more than it has invested. Because short sales involve borrowing securities and then selling them, the Fund’s short sales effectively leverage the Fund’s assets. The Fund’s assets that are used as collateral to secure the Fund’s obligations to return the securities sold short may decrease in value while the short positions are outstanding, which may force the Fund to use its other assets to increase the collateral. Leverage can create an interest expense that may lower the Fund’s overall returns. Leverage presents the opportunity for increased net income and capital gains, but may also exaggerate the Fund’s volatility and risk of loss. There can be no guarantee that a leveraging strategy will be successful.
Liquidity risk
Liquidity risk is the risk associated with a lack of marketability of investments which may make it difficult to sell the investment at a desirable time or price. Changing regulatory, market or other conditions or environments (for example, the interest rate or credit environments) may adversely affect the liquidity of the Fund’s investments. The Fund may have to accept a lower selling price for the holding, sell other investments, or forego another, more appealing investment opportunity. Generally, the less liquid the market at the time the Fund sells a portfolio investment, the greater the risk of loss or decline of value to the Fund. A less liquid market can lead to an increase in Fund redemptions, which may negatively impact Fund performance and net asset value per share, including, for example, if the Fund is forced to sell securities in a down market.
Market risk
The Fund may incur losses due to declines in the value of one or more securities in which it invests. These declines may be due to factors affecting a particular issuer, or the result of, among other things, political, regulatory, market, economic or social developments affecting the relevant market(s) more generally. In addition, turbulence in financial markets and reduced liquidity in equity, credit and/or fixed income markets may negatively affect many issuers, which could adversely affect the Fund’s ability to price or value hard-to-value assets in thinly traded and closed markets and could cause significant redemptions and operational challenges. Global economies and financial markets are increasingly interconnected, and conditions and events in one country, region or financial market may adversely impact issuers in a different country, region or financial market. These risks may be magnified if certain events or developments adversely interrupt the global supply chain; in these and other circumstances, such risks might affect companies worldwide. As a result, local, regional or global events such as terrorism, war, natural disasters, disease/virus outbreaks and epidemics or other public health issues, recessions, depressions or other events – or the potential for such events – could have a significant negative impact on global economic and market conditions.
The large-scale invasion of Ukraine by Russia in February 2022 has resulted in sanctions and market disruptions, including declines in regional and global stock markets, unusual volatility in global commodity markets and significant devaluations of Russian currency. The extent and duration of the military action are impossible to predict but could be significant. Market disruption caused by the Russian military action, and any counter-measures or responses thereto (including international sanctions, a downgrade in the country’s credit rating, purchasing and financing restrictions, boycotts, tariffs, changes in consumer or purchaser preferences, cyberattacks and espionage) could have severe adverse impacts on regional and/or global securities and commodities markets, including markets for oil and natural gas. These impacts may include reduced market liquidity, distress in credit markets, further disruption of global supply chains, increased risk of inflation, and limited access to investments in certain international markets and/or issuers. These developments and other related events could negatively impact Fund performance.
Columbia Solutions Conservative Portfolio | Annual Report 2023
| 29 |
Notes to Financial Statements (continued)
March 31, 2023
Money market fund investment risk
An investment in a money market fund is not a bank deposit and is not insured or guaranteed by any bank, the FDIC or any other government agency. Certain money market funds float their net asset value while others seek to preserve the value of investments at a stable net asset value (typically, $1.00 per share). An investment in a money market fund, even an investment in a fund seeking to maintain a stable net asset value per share, is not guaranteed and it is possible for the Fund to lose money by investing in these and other types of money market funds. If the liquidity of a money market fund’s portfolio deteriorates below certain levels, the money market fund may suspend redemptions (i.e., impose a redemption gate) and thereby prevent the Fund from selling its investment in the money market fund or impose a fee of up to 2% on amounts the Fund redeems from the money market fund (i.e., impose a liquidity fee). These measures may result in an investment loss or prohibit the Fund from redeeming shares when the Investment Manager would otherwise redeem shares. In addition to the fees and expenses that the Fund directly bears, the Fund indirectly bears the fees and expenses of any money market funds in which it invests, including affiliated money market funds. By investing in a money market fund, the Fund will be exposed to the investment risks of the money market fund in direct proportion to such investment. To the extent the Fund invests in instruments such as derivatives, the Fund may hold investments, which may be significant, in money market fund shares to cover its obligations resulting from the Fund’s investments in such instruments. Money market funds and the securities they invest in are subject to comprehensive regulations. The enactment of new legislation or regulations, as well as changes in interpretation and enforcement of current laws, may affect the manner of operation, performance and/or yield of money market funds.
Shareholder concentration risk
At March 31, 2023, affiliated shareholders of record owned 100.0% of the outstanding shares of the Fund in one or more accounts. Subscription and redemption activity by concentrated accounts may have a significant effect on the operations of the Fund. In the case of a large redemption, the Fund may be forced to sell investments at inopportune times, including its liquid positions, which may result in Fund losses and the Fund holding a higher percentage of less liquid positions. Large redemptions could result in decreased economies of scale and increased operating expenses for non-redeeming Fund shareholders.
Note 10. Subsequent events
Management has evaluated the events and transactions that have occurred through the date the financial statements were issued and noted no items requiring adjustment of the financial statements or additional disclosure.
Note 11. Information regarding pending and settled legal proceedings
Ameriprise Financial and certain of its affiliates are involved in the normal course of business in legal proceedings which include regulatory inquiries, arbitration and litigation, including class actions concerning matters arising in connection with the conduct of their activities as part of a diversified financial services firm. Ameriprise Financial believes that the Fund is not currently the subject of, and that neither Ameriprise Financial nor any of its affiliates are the subject of, any pending legal, arbitration or regulatory proceedings that are likely to have a material adverse effect on the Fund or the ability of Ameriprise Financial or its affiliates to perform under their contracts with the Fund. Ameriprise Financial is required to make quarterly (10-Q), annual (10-K) and, as necessary, 8-K filings with the Securities and Exchange Commission (SEC) on legal and regulatory matters that relate to Ameriprise Financial and its affiliates. Copies of these filings may be obtained by accessing the SEC website at www.sec.gov.
There can be no assurance that these matters, or the adverse publicity associated with them, will not result in increased Fund redemptions, reduced sale of Fund shares or other adverse consequences to the Fund. Further, although we believe proceedings are not likely to have a material adverse effect on the Fund or the ability of Ameriprise Financial or its affiliates to perform under their contracts with the Fund, these proceedings are subject to uncertainties and, as such, we are unable to estimate the possible loss or range of loss that may result. An adverse outcome in one or more of these proceedings could result in adverse judgments, settlements, fines, penalties or other relief that could have a material adverse effect on the consolidated financial condition or results of operations of Ameriprise Financial or one or more of its affiliates that provides services to the Fund.
| 30 | Columbia Solutions Conservative Portfolio | Annual Report 2023 |
Report of Independent Registered Public Accounting Firm
To the Board of Trustees of Columbia Funds Series Trust I and Shareholders of Columbia Solutions Conservative Portfolio
Opinion on the Financial Statements
We have audited the accompanying statement of assets and liabilities, including the portfolio of investments, of Columbia Solutions Conservative Portfolio (one of the funds constituting Columbia Funds Series Trust I, referred to hereafter as the "Fund") as of March 31, 2023, the related statement of operations for the year ended March 31, 2023, the statement of changes in net assets for each of the two years in the period ended March 31, 2023, including the related notes, and the financial highlights for each of the five years in the period ended March 31, 2023 (collectively referred to as the "financial statements"). In our opinion, the financial statements present fairly, in all material respects, the financial position of the Fund as of March 31, 2023, the results of its operations for the year then ended, the changes in its net assets for each of the two years in the period ended March 31, 2023 and the financial highlights for each of the five years in the period ended March 31, 2023 in conformity with accounting principles generally accepted in the United States of America.
Basis for Opinion
These financial statements are the responsibility of the Fund’s management. Our responsibility is to express an opinion on the Fund’s financial statements based on our audits. We are a public accounting firm registered with the Public Company Accounting Oversight Board (United States) (PCAOB) and are required to be independent with respect to the Fund in accordance with the U.S. federal securities laws and the applicable rules and regulations of the Securities and Exchange Commission and the PCAOB.
We conducted our audits of these financial statements in accordance with the standards of the PCAOB. Those standards require that we plan and perform the audit to obtain reasonable assurance about whether the financial statements are free of material misstatement, whether due to error or fraud.
Our audits included performing procedures to assess the risks of material misstatement of the financial statements, whether due to error or fraud, and performing procedures that respond to those risks. Such procedures included examining, on a test basis, evidence regarding the amounts and disclosures in the financial statements. Our audits also included evaluating the accounting principles used and significant estimates made by management, as well as evaluating the overall presentation of the financial statements. Our procedures included confirmation of securities owned as of March 31, 2023 by correspondence with the custodian, transfer agent and brokers. We believe that our audits provide a reasonable basis for our opinion.
/s/PricewaterhouseCoopers LLP
Minneapolis, Minnesota
May 23, 2023
We have served as the auditor of one or more investment companies within the Columbia Funds Complex since 1977.
Columbia Solutions Conservative Portfolio | Annual Report 2023
| 31 |
TRUSTEES AND OFFICERS
(Unaudited)
The Board oversees the Fund’s operations and appoints officers who are responsible for day-to-day business decisions based on policies set by the Board. The following table provides basic biographical information about the Fund’s Trustees as of the printing of this report, including their principal occupations during the past five years, although specific titles for individuals may have varied over the period. The year set forth beneath Length of Service in the table below is the year in which the Trustee was first appointed or elected as Trustee to any Fund currently in the Columbia Funds Complex or a predecessor thereof. Under current Board policy, each Trustee generally serves until December 31 of the year such Trustee turns seventy-five (75).
Independent trustees
Name,
address,
year of birth | Position held
with the Columbia Funds and
length of service | Principal occupation(s)
during past five years
and other relevant
professional experience | Number of
Funds in the
Columbia Funds
Complex*
overseen | Other directorships
held by Trustee
during the past five years
and other relevant Board experience |
George S. Batejan
c/o Columbia Management
Investment Advisers, LLC
290 Congress Street
Boston, MA 02210
1954 | Trustee since 2017 | Executive Vice President, Global Head of Technology and Operations, Janus Capital Group, Inc., 2010-2016 | 177 | Former Chairman of the Board, NICSA (National Investment Company Services Association) (Executive Committee, Nominating Committee and Governance Committee), 2014-2016; former Director, Intech Investment Management, 2011-2016; former Board Member, Metro Denver Chamber of Commerce, 2015-2016; former Advisory Board Member, University of Colorado Business School, 2015-2018; former Board Member, Chase Bank International, 1993-1994 |
Kathleen Blatz
c/o Columbia Management
Investment Advisers, LLC
290 Congress Street
Boston, MA 02210
1954 | Trustee since 2006 | Attorney, specializing in arbitration and mediation; Chief Justice, Minnesota Supreme Court, 1998-2006; Associate Justice, Minnesota Supreme Court, 1996-1998; Fourth Judicial District Court Judge, Hennepin County, 1994-1996; Attorney in private practice and public service, 1984-1993; State Representative, Minnesota House of Representatives, 1979-1993, which included service on the Tax and Financial Institutions and Insurance Committees; Member and Interim Chair, Minnesota Sports Facilities Authority, January-July 2017; Interim President and Chief Executive Officer, Blue Cross and Blue Shield of Minnesota (health care insurance), February-July 2018, April-October 2021 | 177 | Former Trustee, Blue Cross and Blue Shield of Minnesota, 2009-2021 (Chair of the Business Development Committee, 2014-2017; Chair of the Governance Committee, 2017-2019); former Member and Chair of the Board, Minnesota Sports Facilities Authority, January 2017-July 2017; former Director, Robina Foundation, 2009-2020 (Chair, 2014-2020); Director, Richard M. Schulze Family Foundation, since 2021 |
| 32 | Columbia Solutions Conservative Portfolio | Annual Report 2023 |
TRUSTEES AND OFFICERS (continued)
(Unaudited)
Independent trustees (continued)
Name,
address,
year of birth | Position held
with the Columbia Funds and
length of service | Principal occupation(s)
during past five years
and other relevant
professional experience | Number of
Funds in the
Columbia Funds
Complex*
overseen | Other directorships
held by Trustee
during the past five years
and other relevant Board experience |
Pamela G. Carlton
c/o Columbia Management
Investment Advisers, LLC
290 Congress Street
Boston, MA 02210
1954 | Chair since 2023; Trustee since 2007 | President, Springboard — Partners in Cross Cultural Leadership (consulting company), since 2003; Managing Director of US Equity Research, JP Morgan Chase, 1999-2003; Director of US Equity Research, Chase Asset Management, 1996-1999; Co-Director Latin America Research, 1993-1996, COO Global Research, 1992-1996, Co-Director of US Research, 1991-1992, Investment Banker, 1982-1991, Morgan Stanley; Attorney, Cleary Gottlieb Steen & Hamilton LLP, 1980-1982 | 177 | Trustee, New York Presbyterian Hospital Board, since 1996; Director, DR Bank (Audit Committee) since 2017; Director, Evercore Inc. (Audit Committee, Nominating and Governance Committee), since 2019; Director, Apollo Commercial Real Estate Finance, Inc. (Chair, Nominating and Governance Committee) (financial services), since 2021; the Governing Council of the Independent Directors Council (IDC), since 2021 |
Janet Langford Carrig
c/o Columbia Management
Investment Advisers, LLC
290 Congress Street
Boston, MA 02210
1957 | Trustee since 1996 | Senior Vice President, General Counsel and Corporate Secretary, ConocoPhillips (independent energy company), September 2007-October 2018 | 175 | Director, EQT Corporation (natural gas producer), since 2019; former Director, Whiting Petroleum Corporation (independent oil and gas company), 2020-2022 |
J. Kevin Connaughton
c/o Columbia Management
Investment Advisers, LLC
290 Congress Street
Boston, MA 02210
1964 | Trustee since 2020 | CEO and President, RhodeWay Financial (non-profit financial planning firm), since December 2022; Member, FINRA National Adjudicatory Council, since January 2020; Adjunct Professor of Finance, Bentley University since January 2018; Consultant to Independent Trustees of CFVIT and CFST I from March 2016 to June 2020 with respect to CFVIT and to December 2020 with respect to CFST I; Managing Director and General Manager of Mutual Fund Products, Columbia Management Investment Advisers, LLC, May 2010-February 2015; President, Columbia Funds, 2008-2015; and senior officer of Columbia Funds and affiliated funds, 2003-2015 | 175 | Former Director, The Autism Project, March 2015-December 2021; former Member of the Investment Committee, St. Michael’s College, November 2015-February 2020; former Trustee, St. Michael’s College, June 2017-September 2019; former Trustee, New Century Portfolios (former mutual fund complex), January 2015-December 2017 |
Olive M. Darragh
c/o Columbia Management
Investment Advisers, LLC
290 Congress Street
Boston, MA 02210
1962 | Trustee since 2020 | Managing Director of Darragh Inc. (strategy and talent management consulting firm), since 2010; Founder and CEO, Zolio, Inc. (investment management talent identification platform), since 2004; Consultant to Independent Trustees of CFVIT and CFST I from June 2019 to June 2020 with respect to CFVIT and to December 2020 with respect to CFST I; Partner, Tudor Investments, 2004-2010; Senior Partner, McKinsey & Company (consulting), 1990-2004; Touche Ross CPA, 1985-1988 | 175 | Treasurer, Edinburgh University US Trust Board, since January 2023; Member, HBS Community Action Partners Board, since September 2022; former Director, University of Edinburgh Business School (Member of US Board), 2004-2019; former Director, Boston Public Library Foundation, 2008-2017 |
Columbia Solutions Conservative Portfolio | Annual Report 2023
| 33 |
TRUSTEES AND OFFICERS (continued)
(Unaudited)
Independent trustees (continued)
Name,
address,
year of birth | Position held
with the Columbia Funds and
length of service | Principal occupation(s)
during past five years
and other relevant
professional experience | Number of
Funds in the
Columbia Funds
Complex*
overseen | Other directorships
held by Trustee
during the past five years
and other relevant Board experience |
Patricia M. Flynn
c/o Columbia Management
Investment Advisers, LLC
290 Congress Street
Boston, MA 02210
1950 | Trustee since 2004 | Professor of Economics and Management, Bentley University, since 2002; Dean, McCallum Graduate School of Business, Bentley University, 1992-2002 | 177 | Former Trustee, MA Taxpayers Foundation, 1997-2022; former Director, The MA Business Roundtable, 2003-2019; former Chairperson, Innovation Index Advisory Committee, MA Technology Collaborative, 1997-2020 |
Brian J. Gallagher
c/o Columbia Management
Investment Advisers, LLC
290 Congress Street
Boston, MA 02210
1954 | Trustee since 2017 | Retired; Partner with Deloitte & Touche LLP and its predecessors, 1977-2016 | 177 | Trustee, Catholic Schools Foundation, since 2004 |
Douglas A. Hacker
c/o Columbia Management
Investment Advisers, LLC
290 Congress Street
Boston, MA 02210
1955 | Trustee since 1996 | Independent business executive, since May 2006; Executive Vice President – Strategy of United Airlines, December 2002 - May 2006; President of UAL Loyalty Services (airline marketing company), September 2001-December 2002; Executive Vice President and Chief Financial Officer of United Airlines, July 1999-September 2001 | 177 | Director, SpartanNash Company (Chair of the Board) (food distributor), since May 2021; Director, Aircastle Limited (Chair of Audit Committee) (aircraft leasing), since August 2006; former Director, Nash Finch Company (food distributor), 2005-2013; former Director, SeaCube Container Leasing Ltd. (container leasing), 2010-2013; and former Director, Travelport Worldwide Limited (travel information technology), 2014-2019 |
Nancy T. Lukitsh
c/o Columbia Management
Investment Advisers, LLC
290 Congress Street
Boston, MA 02210
1956 | Trustee since 2011 | Senior Vice President, Partner and Director of Marketing, Wellington Management Company, LLP (investment adviser), 1997-2010; Chair, Wellington Management Portfolios (commingled non-U.S. investment pools), 2007-2010; Director, Wellington Trust Company, NA and other Wellington affiliates, 1997-2010 | 175 | None |
| 34 | Columbia Solutions Conservative Portfolio | Annual Report 2023 |
TRUSTEES AND OFFICERS (continued)
(Unaudited)
Independent trustees (continued)
Name,
address,
year of birth | Position held
with the Columbia Funds and
length of service | Principal occupation(s)
during past five years
and other relevant
professional experience | Number of
Funds in the
Columbia Funds
Complex*
overseen | Other directorships
held by Trustee
during the past five years
and other relevant Board experience |
David M. Moffett
c/o Columbia Management
Investment Advisers, LLC
290 Congress Street
Boston, MA 02210
1952 | Trustee since 2011 | Retired; former Chief Executive Officer of Freddie Mac and Chief Financial Officer of U.S. Bank | 175 | Director, CSX Corporation (transportation suppliers); Director, PayPal Holdings Inc. (payment and data processing services); Trustee, University of Oklahoma Foundation; former Director, eBay Inc. (online trading community), 2007-2015; and former Director, CIT Bank, CIT Group Inc. (commercial and consumer finance), 2010-2016; former Senior Adviser to The Carlyle Group (financial services), March 2008-September 2008; former Governance Consultant to Bridgewater Associates, January 2013-December 2015 |
Catherine James Paglia
c/o Columbia Management
Investment Advisers, LLC
290 Congress Street
Boston, MA 02210
1952 | Trustee since 2004 | Director, Enterprise Asset Management, Inc. (private real estate and asset management company), since September 1998; Managing Director and Partner, Interlaken Capital, Inc., 1989-1997; Vice President, 1982-1985, Principal, 1985-1987, Managing Director, 1987-1989, Morgan Stanley; Vice President, Investment Banking, 1980-1982, Associate, Investment Banking, 1976-1980, Dean Witter Reynolds, Inc. | 177 | Director, Valmont Industries, Inc. (irrigation systems manufacturer), since 2012; Trustee, Carleton College (on the Investment Committee), since 1987; Trustee, Carnegie Endowment for International Peace (on the Investment Committee), since 2009 |
Natalie A. Trunow
c/o Columbia Management
Investment Advisers, LLC
290 Congress Street
Boston, MA 02210
1967 | Trustee since 2020 | Chief Executive Officer, Millennial Portfolio Solutions LLC (asset management and consulting services), January 2016-January 2021; Non-executive Member of the Investment Committee and Valuation Committee, Sarona Asset Management Inc. (private equity firm) since September 2019; Advisor, Horizon Investments (asset management and consulting services), August 2018-January 2022; Advisor, Paradigm Asset Management, November 2016-January 2022; Consultant to Independent Trustees of CFVIT and CFST I from September 2016 to June 2020 with respect to CFVIT and to December 2020 with respect to CFST I; Director of Investments/Consultant, Casey Family Programs, April 2016-November 2016; Senior Vice President and Chief Investment Officer, Calvert Investments, August 2008-January 2016; Section Head and Portfolio Manager, General Motors Asset Management, June 1997-August 2008 | 175 | Independent Director, Investment Committee, Health Services for Children with Special Needs, Inc., 2010-2021; Independent Director, (Executive Committee and Chair, Audit Committee), Consumer Credit Counseling Services (formerly Guidewell Financial Solutions), since 2016; Independent Director, (Investment Committee), Sarona Asset Management, since 2019 |
Columbia Solutions Conservative Portfolio | Annual Report 2023
| 35 |
TRUSTEES AND OFFICERS (continued)
(Unaudited)
Independent trustees (continued)
Name,
address,
year of birth | Position held
with the Columbia Funds and
length of service | Principal occupation(s)
during past five years
and other relevant
professional experience | Number of
Funds in the
Columbia Funds
Complex*
overseen | Other directorships
held by Trustee
during the past five years
and other relevant Board experience |
Sandra L. Yeager
c/o Columbia Management
Investment Advisers, LLC
290 Congress Street
Boston, MA 02210
1964 | Trustee since 2017 | Retired; President and founder, Hanoverian Capital, LLC (SEC registered investment advisor firm), 2008-2016; Managing Director, DuPont Capital, 2006-2008; Managing Director, Morgan Stanley Investment Management, 2004-2006; Senior Vice President, Alliance Bernstein, 1990-2004 | 177 | Former Director, NAPE (National Alliance for Partnerships in Equity) Education Foundation, October 2016-October 2020; Advisory Board, Jennersville YMCA, since 2022 |
Interested trustee affiliated with Investment Manager**
Name,
address,
year of birth | Position held with the Columbia Funds and length of service | Principal occupation(s) during the
past five years and other relevant
professional experience | Number of
Funds in the
Columbia Funds
Complex overseen | Other directorships
held by Trustee
during the past
five years and
other relevant Board experience |
Daniel J. Beckman
c/o Columbia Management
Investment Advisers, LLC
290 Congress Street
Boston, MA 02210
1962 | Trustee since November 2021 and President since June 2021 | Vice President – Head of North America Product, Columbia Management Investment Advisers, LLC, since April 2015; President and Principal Executive Officer of the Columbia Funds, since June 2021; officer of Columbia Funds and affiliated funds, 2020-2021 | 177 | Director, Ameriprise Trust Company, since October 2016; Director, Columbia Management Investment Distributors, Inc. since November 2018; Board of Governors, Columbia Wanger Asset Management, LLC since, January 2022; Director, Columbia Threadneedle Canada, Inc., since December 2022 |
| * | The term “Columbia Funds Complex” as used herein includes Columbia Seligman Premium Technology Growth Fund, Tri-Continental Corporation and each series of Columbia Funds Series Trust (CFST), Columbia Funds Series Trust I (CFST I), Columbia Funds Series Trust II (CFST II), Columbia ETF Trust I (CET I), Columbia ETF Trust II (CET II), Columbia Funds Variable Insurance Trust (CFVIT) and Columbia Funds Variable Series Trust II (CFVST II).Messrs. Batejan, Beckman, Gallagher and Hacker and Mses. Blatz, Carlton, Carrig, Flynn, Paglia and Yeager serve as Directors of Columbia Seligman Premium Technology Growth Fund and Tri-Continental Corporation. |
| ** | Interested person (as defined under the 1940 Act) by reason of being an officer, director, security holder and/or employee of the Investment Manager or Ameriprise Financial. |
The Statement of Additional Information has additional information about the Fund’s Board members and is available, without charge, upon request by calling 800.345.6611, visiting columbiathreadneedleus.com/investor/ or contacting your financial intermediary.
| 36 | Columbia Solutions Conservative Portfolio | Annual Report 2023 |
TRUSTEES AND OFFICERS (continued)
(Unaudited)
The Board has appointed officers who are responsible for day-to-day business decisions based on policies it has established. The officers serve at the pleasure of the Board. The following table provides basic information about the Officers of the Fund as of the printing of this report, including principal occupations during the past five years, although their specific titles may have varied over the period. In addition to Mr. Beckman, who is President and Principal Executive Officer, the Fund’s other officers are:
Fund officers
Name,
address and
year of birth | Position and year
first appointed to
position for any Fund
in the Columbia
Funds Complex or a
predecessor thereof | Principal occupation(s) during past five years |
Michael G. Clarke
290 Congress Street
Boston, MA 02210
1969 | Chief Financial Officer and Principal Financial Officer (2009) and Senior Vice President (2019) | Senior Vice President and Head of Global Operations & Investor Services, Columbia Management Investment Advisers, LLC, since March 2022 (previously Vice President, Head of North American Operations, and Co-Head of Global Operations, June 2019 to February 2022 and Vice President – Accounting and Tax, May 2010 - May 2019); senior officer of Columbia Funds and affiliated funds, since 2002. |
Joseph Beranek
5890 Ameriprise Financial Center
Minneapolis, MN 55474
1965 | Treasurer and Chief Accounting Officer (Principal Accounting Officer) (2019) and Principal Financial Officer (2020), CFST, CFST I, CFST II, CFVIT and CFVST II; Assistant Treasurer, CET I and CET II | Vice President – Mutual Fund Accounting and Financial Reporting, Columbia Management Investment Advisers, LLC, since December 2018 and March 2017, respectively. |
Marybeth Pilat
290 Congress Street
Boston, MA 02210
1968 | Treasurer and Chief Accounting Officer (Principal Accounting Officer) and Principal Financial Officer (2020) for CET I and CET II; Assistant Treasurer, CFST, CFST I, CFST II, CFVIT and CFVST II | Vice President – Product Pricing and Administration, Columbia Management Investment Advisers, LLC, since May 2017. |
William F. Truscott
290 Congress Street
Boston, MA 02210
1960 | Senior Vice President (2001) | Formerly, Trustee/Director of Columbia Funds Complex or legacy funds, November 2001-January 1, 2021; Chief Executive Officer, Global Asset Management, Ameriprise Financial, Inc., since September 2012; Chairman of the Board and President, Columbia Management Investment Advisers, LLC, since July 2004 and February 2012, respectively; Chairman of the Board and Chief Executive Officer, Columbia Management Investment Distributors, Inc., since November 2008 and February 2012, respectively; Chairman of the Board and Director, Threadneedle Asset Management Holdings, Sàrl, since March 2013 and December 2008, respectively; senior executive of various entities affiliated with Columbia Threadneedle. |
Christopher O. Petersen
5228 Ameriprise Financial Center
Minneapolis, MN 55474
1970 | Senior Vice President and Assistant Secretary (2021) | Formerly, Trustee/Director of funds within the Columbia Funds Complex, July 1, 2020 - November 22, 2021; Senior Vice President and Assistant General Counsel, Ameriprise Financial, Inc., since September 2021 (previously Vice President and Lead Chief Counsel, January 2015 - September 2021); formerly, President and Principal Executive Officer of the Columbia Funds, 2015 - 2021; officer of Columbia Funds and affiliated funds, since 2007. |
Thomas P. McGuire
290 Congress Street
Boston, MA 02210
1972 | Senior Vice President and Chief Compliance Officer (2012) | Vice President – Asset Management Compliance, Ameriprise Financial, Inc., since May 2010; Chief Compliance Officer, Columbia Acorn/Wanger Funds, since December 2015; formerly, Chief Compliance Officer, Ameriprise Certificate Company, September 2010 – September 2020. |
Ryan C. Larrenaga
290 Congress Street
Boston, MA 02210
1970 | Senior Vice President (2017), Chief Legal Officer (2017), and Secretary (2015) | Vice President and Chief Counsel, Ameriprise Financial, Inc., since August 2018 (previously Vice President and Group Counsel, August 2011 - August 2018); Chief Legal Officer, Columbia Acorn/Wanger Funds, since September 2020; officer of Columbia Funds and affiliated funds, since 2005. |
Columbia Solutions Conservative Portfolio | Annual Report 2023
| 37 |
TRUSTEES AND OFFICERS (continued)
(Unaudited)
Fund officers (continued)
Name,
address and
year of birth | Position and year
first appointed to
position for any Fund
in the Columbia
Funds Complex or a
predecessor thereof | Principal occupation(s) during past five years |
Michael E. DeFao
290 Congress Street
Boston, MA 02210
1968 | Vice President (2011) and Assistant Secretary (2010) | Vice President and Chief Counsel, Ameriprise Financial, Inc., since May 2010; Vice President, Chief Legal Officer and Assistant Secretary, Columbia Management Investment Advisers, LLC, since October 2021 (previously Vice President and Assistant Secretary, May 2010 – September 2021). |
Lyn Kephart-Strong
5228 Ameriprise Financial Center
Minneapolis, MN 55474
1960 | Vice President (2015) | Vice President, Global Investment Operations Services, Columbia Management Investment Advisers, LLC, since 2010; President, Columbia Management Investment Services Corp., since October 2014; President, Ameriprise Trust Company, since January 2017. |
Liquidity Risk Management Program
(Unaudited)
Pursuant to Rule 22e-4 under the 1940 Act, the Fund has adopted a liquidity risk management program (Program). The Program’s principal objectives include assessing, managing and periodically reviewing the Fund’s liquidity risk. Liquidity risk is defined as the risk that the Fund could not meet redemption requests without significant dilution of remaining investors’ interests in the Fund.
The Board has appointed the Investment Manager as the program administrator for the Fund’s Program. The Investment Manager has delegated oversight of the Program to its Liquidity Risk Management Committee (the Committee). At a board meeting during the fiscal period, the Committee provided the Board with a report addressing the operations of the program and assessing its adequacy and effectiveness of implementation for the period January 1, 2022, through December 31, 2022, including:
| • | the Fund had sufficient liquidity to both meet redemptions and operate effectively on behalf of shareholders; |
| • | there were no material changes to the Program during the period; |
| • | the implementation of the Program was effective to manage the Fund’s liquidity risk; and |
| • | the Program operated adequately during the period. |
There can be no assurance that the Program will achieve its objectives in the future. Please refer to the Fund’s prospectus for more information regarding the Fund’s exposure to liquidity risk and other principal risks to which an investment in the Fund may be subject.
| 38 | Columbia Solutions Conservative Portfolio | Annual Report 2023 |
[THIS PAGE INTENTIONALLY LEFT BLANK]
Columbia Solutions Conservative Portfolio
P.O. Box 219104
Kansas City, MO 64121-9104
Please read and consider the investment objectives, risks, charges and expenses for any fund carefully before investing. For a prospectus, which contains this and other important information about the Fund, go to columbiathreadneedleus.com/investor/. The Fund is distributed by Columbia Management Investment Distributors, Inc., member FINRA, and managed by Columbia Management Investment Advisers, LLC.
Columbia Threadneedle Investments (Columbia Threadneedle) is the global brand name of the Columbia and Threadneedle group of companies. All rights reserved.
© 2023 Columbia Management Investment Advisers, LLC.
columbiathreadneedleus.com/investor/
Item 2. Code of Ethics.
(a) | The registrant has adopted a code of ethics that applies to the registrant’s principal executive officer, principal financial officer, principal accounting officer or controller, or persons performing similar functions, regardless of whether these individuals are employed by the registrant or a third party. |
(b) | During the period covered by this report, there were not any amendments to a provision of the code of ethics that applies to the registrant’s principal executive officer, principal financial officer, principal accounting officer or controller, or persons performing similar functions, regardless of whether these individuals are employed by the registrant or a third party, and that relates to any element of the code of ethics definition enumerated in paragraph (b) of this Item. |
(c) | During the period covered by this report, there were no waivers, including any implicit waivers, from a provision of the code of ethics to the registrant’s principal executive officer, principal financial officer, principal accounting officer or controller, or persons performing similar functions, regardless of whether these individuals are employed by the registrant or a third party that relates to one or more of the items set forth in paragraph (b) of this Item. |
Item 3. Audit Committee Financial Expert.
The registrant’s Board of Trustees has determined that David M. Moffett, Brian J. Gallagher, J. Kevin Connaughton, Sandra L. Yeager, and Douglas A. Hacker, each of whom are members of the registrant’s Board of Trustees and Audit Committee, each qualify as an audit committee financial expert. Mr. Moffett, Mr. Gallagher, Mr. Connaughton, Ms. Yeager, and Mr. Hacker are each independent trustees, as defined in paragraph (a)(2) of this item’s instructions.
Item 4. Principal Accountant Fees and Services.
Fee information below is disclosed for the thirteen series of the registrant whose reports to stockholders are included in this annual filing.
(a) Audit Fees. Aggregate Audit Fees billed by the principal accountant for professional services rendered during the fiscal years ended March 31, 2023 and March 31, 2022 are approximately as follows:
| |
2023 | 2022 |
$241,700 | $245,800 |
Audit Fees include amounts related to the audit of the registrant’s annual financial statements or services that are normally provided by the accountant in connection with statutory and regulatory filings or engagements for those fiscal years.
(b) Audit-Related Fees. Aggregate Audit-Related Fees billed to the registrant by the principal accountant for professional services rendered during the fiscal years ended March 31, 2023 and March 31, 2022 are approximately as follows:
Audit-Related Fees include amounts for assurance and related services by the principal accountant that are reasonably related to the performance of the audit of the registrant’s financial statements and are not reported in Audit Fees above.
During the fiscal years ended March 31, 2023 and March 31, 2022, there were no Audit-Related Fees billed by the registrant’s principal accountant to the registrant’s investment adviser (not including any sub-adviser whose role is primarily portfolio management and is subcontracted with or overseen by another investment adviser) and any entity controlling, controlled by, or under common control with the adviser that provides ongoing services to the registrant for an engagement that related directly to the operations and financial reporting of the registrant.
(c) Tax Fees. Aggregate Tax Fees billed by the principal accountant to the registrant for professional services rendered during the fiscal years ended March 31, 2023 and March 31, 2022 are approximately as follows:
| |
2023 | 2022 |
$162,500 | $55,000 |
Tax Fees include amounts for the review of annual tax returns, the review of required shareholder distribution calculations and typically include amounts for professional services by the principal accountant for tax compliance, tax advice and tax planning.
During the fiscal years ended March 31, 2023 and March 31, 2022, there were no Tax Fees billed by the registrant’s principal accountant to the registrant’s investment adviser (not including any sub-adviser whose role is primarily portfolio management and is subcontracted with or overseen by another investment adviser) and any entity controlling, controlled by, or under common control with the adviser that provides ongoing services to the registrant for an engagement that related directly to the operations and financial reporting of the registrant.
(d) All Other Fees. Aggregate All Other Fees billed by the principal accountant to the registrant for professional services rendered during the fiscal years ended March 31, 2023 and March 31, 2022 are approximately as follows:
All Other Fees, if any, include amounts for products and services provided by the principal accountant, other than the services reported in paragraphs (a) through (c) above.
Aggregate All Other Fees billed by the registrant’s principal accountant to the registrant’s investment adviser (not including any sub-adviser whose role is primarily portfolio management and is subcontracted with or overseen by another investment adviser) and any entity controlling, controlled by, or under common control with the adviser that provides ongoing services to the registrant for an engagement that related directly to the operations and financial reporting of the registrant during the fiscal years ended March 31, 2023 and March 31, 2022 are approximately as follows:
| |
2023 | 2022 |
$541,000 | $535,000 |
In fiscal years 2023 and 2022, All Other Fees primarily consists of fees billed for internal control examinations of the registrant’s transfer agent and investment adviser.
(e)(1) Audit Committee Pre-Approval Policies and Procedures
The registrant’s Audit Committee is required to pre-approve the engagement of the registrant’s independent auditors to provide audit and non-audit services to the registrant and non-audit services to its investment adviser (excluding any sub-adviser whose role is primarily portfolio management and is sub-contracted or overseen by another investment adviser (the “Adviser”) or any entity controlling, controlled by or under common control with the Adviser that provides ongoing services to the Fund (a “Control Affiliate”) if the engagement relates directly to the operations and financial reporting of the registrant.
The Audit Committee has adopted a Policy for Engagement of Independent Auditors for Audit and Non-Audit Services (the “Policy”). The Policy sets forth the understanding of the Audit Committee regarding the engagement of the registrant’s independent accountants to provide (i) audit and permissible audit-related, tax and other services to the registrant (“Fund Services”); (ii) non-audit services to the registrant’s Adviser and any Control Affiliates, that relates directly to the operations and financial reporting of a Fund (“Fund-related Adviser Services”); and (iii) certain other audit and non-audit services to the registrant’s Adviser and its Control Affiliates. A service will require specific pre-approval by the Audit Committee if it is to be provided by the Fund’s independent auditor; provided, however, that pre-approval of non-audit services to the Fund, the Adviser or Control Affiliates may be waived if certain de minimis requirements set forth in the SEC’s rules are met.
Under the Policy, the Audit Committee may delegate pre-approval authority to any pre-designated member or members who are independent board members. The member(s) to whom such authority is delegated must report, for informational purposes only, any pre-approval decisions to the Audit Committee at its next regular meeting. The Audit Committee's responsibilities with respect to the pre-approval of services performed by the independent auditor may not be delegated to management.
On an annual basis, at a regularly scheduled Audit Committee meeting, the Fund’s Treasurer or other Fund officer shall submit to the Audit Committee a schedule of the types of Fund Services and Fund-related Adviser Services that are subject to specific pre-approval. This schedule will provide a description of each type of service that is subject to specific pre-approval, along with total projected fees for each service. The pre-approval will generally cover a one-year period. The Audit Committee will review and approve the types of services and the projected fees for the next one-year period and may add to, or subtract from, the list of pre-approved services from time to time, based on subsequent determinations. This specific approval acknowledges that the Audit Committee is in agreement with the specific types of services that the independent auditor will be permitted to perform and the projected fees for each service.
The Fund’s Treasurer or other Fund officer shall report to the Audit Committee at each of its regular meetings regarding all Fund Services or Fund-related Adviser Services provided since the last such report was rendered, including a description of the services, by category, with forecasted fees for the annual reporting period, proposed changes requiring specific pre-approval and a description of services provided by the independent auditor, by category, with actual fees during the current reporting period.
*****
(e)(2) None, or 0%, of the Audit-Related Fees, Tax Fees and All Other Fees paid by the Fund or affiliated entities relating directly to the operations and financial reporting of the Registrant disclosed above were approved by the audit committee pursuant to paragraphs (c)(7)(i)(C) of Rule 2-01 of Regulation S-X (which permits audit committee approval after the start of the engagement with respect to services other than audit, review or attest services, if certain conditions are satisfied).
(f) Not applicable.
(g) The aggregate non-audit fees billed by the registrant’s accountant for services rendered to the registrant, and rendered to the registrant’s investment adviser (not including any sub-adviser whose role is primarily portfolio management and is subcontracted with or overseen by another investment adviser), and any entity controlling, controlled by, or under common control with the adviser that provides ongoing services to the registrant for the fiscal years ended March 31, 2023 and March 31, 2022 are approximately as follows:
| |
2023 | 2022 |
$703,500 | $594,000 |
(h) The registrant’s Audit Committee of the Board of Directors has considered whether the provision of non-audit services that were rendered to the registrant’s adviser (not including any sub-adviser whose role is primarily portfolio management and is subcontracted with or overseen by another investment adviser), and any entity controlling, controlled by, or under common control with the investment adviser that provides ongoing services to the registrant that were not pre-approved pursuant to paragraph (c)(7)(ii) of Rule 2-01 of Regulation S-X, is compatible with maintaining the principal accountant’s independence.
Item 5. Audit Committee of Listed Registrants.
Not applicable.
Item 6. Investments
(a) | The registrant’s “Schedule I – Investments in securities of unaffiliated issuers” (as set forth in 17 CFR 210.12-12) is included in Item 1 of this Form N-CSR. |
Item 7. Disclosure of Proxy Voting Policies and Procedures for Closed-End Management Investment Companies.
Not applicable.
Item 8. Portfolio Managers of Closed-End Management Investment Companies.
Not applicable.
Item 9. Purchases of Equity Securities by Closed-End Management Investment Company and Affiliated Purchasers.
Not applicable.
Item 10. Submission of Matters to a Vote of Security Holders.
There were no material changes to the procedures by which shareholders may recommend nominees to the registrant's board of directors.
Item 11. Controls and Procedures.
(a) | The registrant’s principal executive officer and principal financial officer, based on their evaluation of the registrant’s disclosure controls and procedures as of a date within 90 days of the filing of this report, have concluded that such controls and procedures are adequately designed to ensure that information required to be disclosed by the registrant in Form N-CSR is accumulated and communicated to the registrant’s management, including the principal executive officer and principal financial officer, or persons performing similar functions, as appropriate to allow timely decisions regarding required disclosure. |
(b) | There was no change in the registrant's internal control over financial reporting that occurred during the period covered by this report that has materially affected, or is reasonably likely to materially affect, the registrant's internal control over financial reporting. |
Item 12. Disclosure of Securities Lending Activities for Closed-End Management Investment Companies
Not applicable.
Item 13. Exhibits.
(a)(1) Code of ethics required to be disclosed under Item 2 of Form N-CSR attached hereto as Exhibit 99.CODE ETH.
(a)(2) Certifications pursuant to Rule 30a-2(a) under the Investment Company Act of 1940 (17 CFR 270.30a-2(a)) attached hereto as Exhibit 99.CERT.
(b) Certification pursuant to Rule 30a-2(b) under the Investment Company Act of 1940 (17 CFR 270.30a-2(b)) attached hereto as Exhibit 99.906CERT.
SIGNATURES
Pursuant to the requirements of the Securities Exchange Act of 1934 and the Investment Company Act of 1940, the registrant has duly caused this report to be signed on its behalf by the undersigned, thereunto duly authorized.
(registrant) | Columbia Funds Series Trust I |
| |
By (Signature and Title) | /s/ Daniel J. Beckman |
| Daniel J. Beckman, President and Principal Executive Officer |
| |
Date | May 23, 2023 |
| |
| |
Pursuant to the requirements of the Securities Exchange Act of 1934 and the Investment Company Act of 1940, this report has been signed below by the following persons on behalf of the registrant and in the capacities and on the dates indicated.
By (Signature and Title) | /s/ Daniel J. Beckman |
| Daniel J. Beckman, President and Principal Executive Officer |
| |
Date | May 23, 2023 |
By (Signature and Title) | /s/ Michael G. Clarke |
| Michael G. Clarke, Chief Financial Officer, |
| Principal Financial Officer and Senior Vice President |
| |
Date | May 23, 2023 |
By (Signature and Title) | /s/ Joseph Beranek |
| Joseph Beranek, Treasurer, Chief Accounting |
| Officer and Principal Financial Officer |
| |
Date | May 23, 2023 |