UNITED STATES
SECURITIES AND EXCHANGE COMMISSION
Washington, D.C. 20549
FORM N-CSR
CERTIFIED SHAREHOLDER REPORT OF REGISTERED MANAGEMENT INVESTMENT COMPANIES
Investment Company Act file number 811-04367
Columbia Funds Series Trust I
(Exact name of registrant as specified in charter)
290 Congress Street
Boston, MA 02210
(Address of principal executive offices) (Zip code)
Daniel J. Beckman
c/o Columbia Management Investment Advisers, LLC
290 Congress Street
Boston, MA 02210
Ryan C. Larrenaga, Esq.
c/o Columbia Management Investment Advisers, LLC
290 Congress Street
Boston, MA 02210
(Name and address of agent for service)
Registrant's telephone number, including area code: (800) 345-6611
Date of fiscal year end: December 31
Date of reporting period: December 31, 2022
Form N-CSR is to be used by management investment companies to file reports with the Commission not later than 10 days after the transmission to stockholders of any report that is required to be transmitted to stockholders under Rule 30e-1 under the Investment Company Act of 1940 (17 CFR 270.30e-1). The Commission may use the information provided on Form N-CSR in its regulatory, disclosure review, inspection, and policymaking roles.
A registrant is required to disclose the information specified by Form N-CSR, and the Commission will make this information public. A registrant is not required to respond to the collection of information contained in Form N-CSR unless the Form displays a currently valid Office of Management and Budget ("OMB") control number. Please direct comments concerning the accuracy of the information collection burden estimate and any suggestions for reducing the burden to Secretary, Securities and Exchange Commission, 100 F Street, NE, Washington, DC 20549. The OMB has reviewed this collection of information under the clearance requirements of 44 U.S.C. § 3507.
Item 1. Reports to Stockholders.

Annual Report
December 31, 2022
Columbia Real Estate Equity Fund
Not FDIC or NCUA Insured • No Financial Institution Guarantee • May Lose Value
If you elect to receive the shareholder report for Columbia Real Estate Equity Fund (the Fund) in paper, mailed to you, the Fund mails one shareholder report to each shareholder address, unless such shareholder elects to receive shareholder reports from the Fund electronically via e-mail or by having a paper notice mailed to you (Postcard Notice) that your Fund’s shareholder report is available at the Columbia funds’ website (columbiathreadneedleus.com/investor/). If you would like more than one report in paper to be mailed to you, or would like to elect to receive reports via e-mail or access them through Postcard Notice, please call shareholder services at 800.345.6611 and additional reports will be sent to you.
Proxy voting policies and procedures
The policy of the Board of Trustees is to vote the proxies of the companies in which the Fund holds investments consistent with the procedures as stated in the Statement of Additional Information (SAI). You may obtain a copy of the SAI without charge by calling 800.345.6611; contacting your financial intermediary; visiting columbiathreadneedleus.com/investor/; or searching the website of the Securities and Exchange Commission (SEC) at sec.gov. Information regarding how the Fund voted proxies relating to portfolio securities is filed with the SEC by August 31st for the most recent 12-month period ending June 30th of that year, and is available without charge by visiting columbiathreadneedleus.com/investor/, or searching the website of the SEC at sec.gov.
Quarterly schedule of investments
The Fund files a complete schedule of portfolio holdings with the SEC for the first and third quarters of each fiscal year on Form N-PORT. The Fund’s Form N-PORT filings are available on the SEC’s website at sec.gov. The Fund’s complete schedule of portfolio holdings, as filed on Form N-PORT, is available on columbiathreadneedleus.com/investor/ or can also be obtained without charge, upon request, by calling 800.345.6611.
Additional Fund information
For more information about the Fund, please visit columbiathreadneedleus.com/investor/ or call 800.345.6611. Customer Service Representatives are available to answer your questions Monday through Friday from 8 a.m. to 7 p.m. Eastern time.
Fund investment manager
Columbia Management Investment Advisers, LLC (the Investment Manager)
290 Congress Street
Boston, MA 02210
Fund distributor
Columbia Management Investment Distributors, Inc.
290 Congress Street
Boston, MA 02210
Fund transfer agent
Columbia Management Investment Services Corp.
P.O. Box 219104
Kansas City, MO 64121-9104
Columbia Real Estate Equity Fund | Annual Report 2022
Fund at a Glance
(Unaudited)
Investment objective
The Fund seeks capital appreciation and above-average income by investing, under normal market conditions, at least 80% of its net assets (plus any borrowings for investment purposes) in the stocks of companies principally engaged in the real estate industry, including real estate investment trusts (REITs).
Portfolio management
Arthur Hurley, CFA
Portfolio Manager
Managed Fund since 2006
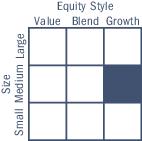
Morningstar style boxTM
The Morningstar Style Box is based on a fund’s portfolio holdings. For equity funds, the vertical axis shows the market capitalization of the stocks owned, and the horizontal axis shows investment style (value, blend, or growth). Information shown is based on the most recent data provided by Morningstar.
© 2023 Morningstar, Inc. All rights reserved. The Morningstar information contained herein: (1) is proprietary to Morningstar and/or its content providers; (2) may not be copied or distributed; and (3) is not warranted to be accurate, complete or timely. Neither Morningstar nor its content providers are responsible for any damages or losses arising from any use of this information.
| Average annual total returns (%) (for the period ended December 31, 2022) |
| | | Inception | 1 Year | 5 Years | 10 Years |
| Class A | Excluding sales charges | 11/01/02 | -25.33 | 3.84 | 5.98 |
| | Including sales charges | | -29.61 | 2.61 | 5.35 |
| Advisor Class | 11/08/12 | -25.15 | 4.08 | 6.23 |
| Class C | Excluding sales charges | 10/13/03 | -25.86 | 3.06 | 5.19 |
| | Including sales charges | | -26.57 | 3.06 | 5.19 |
| Institutional Class | 04/01/94 | -25.13 | 4.10 | 6.24 |
| Institutional 2 Class | 03/07/11 | -25.05 | 4.22 | 6.38 |
| Institutional 3 Class* | 03/01/17 | -25.00 | 4.29 | 6.36 |
| Class R | 09/27/10 | -25.50 | 3.58 | 5.71 |
| FTSE Nareit Equity REITs Index | | -24.37 | 3.68 | 6.53 |
Returns for Class A shares are shown with and without the maximum initial sales charge of 5.75%. Returns for Class C shares are shown with and without the 1.00% contingent deferred sales charge for the first year only. The Fund’s other share classes are not subject to sales charges and have limited eligibility. Please see the Fund’s prospectus for details. Performance for different share classes will vary based on differences in sales charges and fees associated with each share class. All results shown assume reinvestment of distributions during the period. Returns do not reflect the deduction of taxes that a shareholder may pay on Fund distributions or on the redemption of Fund shares. Performance results reflect the effect of any fee waivers or reimbursements of Fund expenses by Columbia Management Investment Advisers, LLC and/or any of its affiliates. Absent these fee waivers or expense reimbursement arrangements, performance results would have been lower.
The performance information shown represents past performance and is not a guarantee of future results. The investment return and principal value of your investment will fluctuate so that your shares, when redeemed, may be worth more or less than their original cost.
Current performance may be lower or higher than the performance information shown. You may obtain performance information current to the most recent month-end by contacting your financial intermediary, visiting columbiathreadneedleus.com/investor/ or calling 800.345.6611.
| * | The returns shown for periods prior to the share class inception date (including returns for the Life of the Fund, if shown, which are since Fund inception) include the returns of the Fund’s oldest share class. These returns are adjusted to reflect any higher class-related operating expenses of the newer share classes, as applicable. Please visit columbiathreadneedleus.com/investor/investment-products/mutual-funds/appended-performance for more information. |
The FTSE Nareit Equity REITs Index reflects performance of all publicly traded equity real estate investment trusts (REITs), other than those designated as timber REITs.
Indices are not available for investment, are not professionally managed and do not reflect sales charges, fees, brokerage commissions, taxes or other expenses of investing. Securities in the Fund may not match those in an index.
Columbia Real Estate Equity Fund | Annual Report 2022
| 3 |
Fund at a Glance (continued)
(Unaudited)
Performance of a hypothetical $10,000 investment (December 31, 2012 — December 31, 2022)
The chart above shows the change in value of a hypothetical $10,000 investment in Class A shares of Columbia Real Estate Equity Fund during the stated time period, and does not reflect the deduction of taxes that a shareholder may pay on Fund distributions or on the redemption of Fund shares.
| Portfolio breakdown (%) (at December 31, 2022) |
| Common Stocks | 99.7 |
| Money Market Funds | 0.3 |
| Total | 100.0 |
Percentages indicated are based upon total investments excluding investments in derivatives, if any. The Fund’s portfolio composition is subject to change.
| Equity sub-industry breakdown (%) (at December 31, 2022) |
| Real Estate | |
| Health Care REITs | 6.9 |
| Hotel & Resort REITs | 3.2 |
| Industrial REITs | 18.2 |
| Office REITs | 4.6 |
| Residential REITs | 23.4 |
| Retail REITs | 18.7 |
| Specialized REITs | 23.5 |
| Total | 98.5 |
Percentages indicated are based upon total equity investments. The Fund’s portfolio composition is subject to change.
| 4 | Columbia Real Estate Equity Fund | Annual Report 2022 |
Manager Discussion of Fund Performance
(Unaudited)
For the 12-month period that ended December 31, 2022, Class A shares of Columbia Real Estate Equity Fund returned -25.33% excluding sales charges. The Fund underperformed its benchmark, the FTSE Nareit Equity REITS Index, which returned -24.37% for the same period.
Market overview
Following a strong 2021, the U.S. real estate market, as measured by the benchmark, posted double-digit negative absolute returns that lagged the broad U.S. equity and fixed-income markets in 2022. The S&P 500 Index returned -18.11%, and the Bloomberg U.S. Aggregate Bond Index returned -13.01%, the first calendar year since 1994 that both indices posted negative returns in the same year.
Several factors led to the real estate sector’s negative annual performance, beginning with the emergence of new COVID-19 variants at the start of 2022, combined with intense geopolitical tensions resulting from Russia’s late-February invasion of Ukraine. Domestically, the U.S. Federal Reserve (Fed) began a tightening cycle in March 2022 in an effort to combat increased inflation in the U.S. What turned out to be seven interest rate hikes by the Fed during the year increased debt costs, severely impacting the volume of transactions in the commercial real estate market. Further, larger companies continued to explore hybrid work-from-home options that had emerged earlier in the COVID-19 pandemic, leading to less demand for commercial office space. Perhaps most dominant was the threat of a potential recession, which loomed large over the real estate market during the annual period, as investors were concerned about the Fed’s ability to navigate a soft landing and flooded toward what investors perceived as less risky pockets of the market. The combination of high interest rates and weak valuations resulted in a significant decline in capital raising by real estate investment trusts (REITs) in 2022.
All that said, it was not all bad news for the U.S. real estate market in 2022. Industrial, retail and apartment property types maintained elevated occupancy rates that were, on average, higher than their respective pre-pandemic levels. There was also an increase in travel activity, and hotel properties were able to combat inflation rather effectively, with an ability to change their rates daily, adjusting to the rising inflation levels during the annual period. Further, REIT balance sheets remained well-positioned overall, with leverage near historical lows, as well as low current interest costs, on average, due to proactive borrowing by management teams when rates were at historic lows.
Still, all sub-sectors of the benchmark posted negative absolute returns during the annual period. On a relative basis, however, certain sectors were able to navigate the challenging market conditions better than others. For example, an increase in travel and retail activity provided tailwinds to the lodging and shopping center sub-sectors. The specialty and free-standing sub-sectors were also among the least weak sub-sectors in the benchmark during the annual period. Conversely, office REITs suffered from an increased emphasis on hybrid work-from-home trends. Housing sub-sectors, like apartments and single-family homes, were also among the weakest sub-sectors in the benchmark.
At the end of the annual period, there was some optimism among real estate investors because, while past performance is no guarantee of future results and it is yet to be seen whether or not the U.S. does enter a recession, the REIT sector has, on average, outperformed both private real estate and the broader U.S. equity market during and after the last six recessions (Source: NBER; NAREIT; NCREIF). Despite economic headwinds, weakness in valuations and elevated volatility, equity REITs have historically proven to be quite resilient from an operational perspective.
The Fund’s notable detractors during the period
| • | Stock selection in the health care, self-storage and apartments sub-sectors hurt the Fund’s relative results most during the period. |
| • | Having an overweighted allocation to single-family homes, which was among the weakest sub-sectors in the benchmark during the annual period, and having underweighted allocations to the free-standing and specialty sub-sectors, which each significantly outperformed the benchmark during the period, detracted from performance. |
| • | Among individual holdings, the biggest disappointment was VICI Properties Inc., which the Fund did not own and posted a double-digit positive return during the annual period. VICI Properties owns a portfolio of gaming, hospitality and entertainment properties. Its stock benefited during the period from timely acquisitions and a lease clause in a portion of its portfolio that has an increasing rent component tied to inflation. |
Columbia Real Estate Equity Fund | Annual Report 2022
| 5 |
Manager Discussion of Fund Performance (continued)
(Unaudited)
| • | An overweight position in Centerspace, which was a strong performer for the Fund in 2021, detracted in 2022, as the stock of this apartment communities-focused real estate company was negatively affected by higher operating expenses and slower rent growth relative to its peers. |
| • | An underweight position in Realty Income Corp., which is a REIT that invests in free standing, single-tenant commercial properties, detracted from performance, as its stock outperformed the benchmark during the period. The company executed well on relatively high-yielding investments during 2022 and benefited from a rebound following underperformance in 2021. |
| • | Self-storage REIT Life Storage, Inc., along with the self-storage sub-sector broadly, fell out-of-favor during the period, as the historically high internal growth seen in the sub-sector during the height of the COVID-19 pandemic showed signs of slowing. |
| • | Medical Properties Trust, Inc. is a REIT that acquires and leases net-leased hospital facilities around the world. Its shares were negatively affected during the period by the financial health of some of the company’s largest tenants being called into question. The Fund was overweight its stock through much of the period but exited the position in the fourth quarter of 2022. |
The Fund’s notable contributors during the period
| • | Effective stock selection in the industrial and data centers sub-sectors boosted the Fund’s relative results. |
| • | Having an underweighted allocation to regional malls, which performed relatively in line with the benchmark during the period, also contributed positively. |
| • | Both stock selection and positioning within the office sub-sector further buoyed Fund results during the period. |
| • | Among individual holdings, positioning in Simon Property Group, Inc., the largest mall owner in the U.S., proved beneficial. The Fund established a new position in Simon Property Group mid-year, initially with an underweight exposure relative to the benchmark. However, the Fund moved to an overweight in the company in August 2022 after the company’s stock had underperformed in the first half of the year and its valuation was, in our view, attractive. Simon Property Group’s stock then outperformed during the second half of the period. |
| • | An overweight position in Gaming and Leisure Properties, Inc., which owns a portfolio of regional gaming, hospitality and entertainment properties, contributed positively. The company benefited from both timely acquisitions and solid performance of the largest gaming tenants in its portfolio. |
| • | An underweight position in Prologis, Inc., an industrial REIT, for most of the period proved beneficial, as the company’s shares declined on news that Amazon.com was reversing course and planning to reduce its future warehouse space needs. Seeking to take advantage of the stock’s volatility, we increased the Fund’s position in Prologis to an overweight by the end of the period. |
| • | Brixmor Property Group, Inc., a shopping mall REIT, benefited during the period from positive leasing in its shopping center portfolio and successful repositioning and active management of its portfolio. The Fund held an overweight position in Brixmor Property Group during the period. |
| • | Not holding a position in Digital Realty Trust, Inc., a data center REIT, added value because the company’s stock price fell during the period on lower-than-consensus expected top-line growth and on uncertainty around management changes in its executive ranks. |
Market risk may affect a single issuer, sector of the economy, industry or the market as a whole. Like real estate, real estate investment trusts (REITs) are subject to illiquidity, valuation and financing complexities, taxes, default, bankruptcy and other economic, political or regulatory occurrences. As a non-diversified fund, fewer investments could have a greater effect on performance. See the Fund’s prospectus for more information on these and other risks.
The views expressed in this report reflect the current views of the respective parties who have contributed to this report. These views are not guarantees of future performance and involve certain risks, uncertainties and assumptions that are difficult to predict, so actual outcomes and results may differ significantly from the views expressed. These views are subject to change at any time based upon economic, market or other conditions and the respective
| 6 | Columbia Real Estate Equity Fund | Annual Report 2022 |
Manager Discussion of Fund Performance (continued)
(Unaudited)
parties disclaim any responsibility to update such views. These views may not be relied on as investment advice and, because investment decisions for a Columbia fund are based on numerous factors, may not be relied on as an indication of trading intent on behalf of any particular Columbia fund. References to specific securities should not be construed as a recommendation or investment advice.
Columbia Real Estate Equity Fund | Annual Report 2022
| 7 |
Understanding Your Fund’s Expenses
(Unaudited)
As an investor, you incur two types of costs. There are shareholder transaction costs, which generally include sales charges on purchases and may include redemption fees. There are also ongoing fund costs, which generally include management fees, distribution and/or service fees, and other fund expenses. The following information is intended to help you understand your ongoing costs (in dollars) of investing in the Fund and to help you compare these costs with the ongoing costs of investing in other mutual funds.
Analyzing your Fund’s expenses
To illustrate these ongoing costs, we have provided examples and calculated the expenses paid by investors in each share class of the Fund during the period. The actual and hypothetical information in the table is based on an initial investment of $1,000 at the beginning of the period indicated and held for the entire period. Expense information is calculated two ways and each method provides you with different information. The amount listed in the “Actual” column is calculated using the Fund’s actual operating expenses and total return for the period. You may use the Actual information, together with the amount invested, to estimate the expenses that you paid over the period. Simply divide your account value by $1,000 (for example, an $8,600 account value divided by $1,000 = 8.6), then multiply the results by the expenses paid during the period under the “Actual” column. The amount listed in the “Hypothetical” column assumes a 5% annual rate of return before expenses (which is not the Fund’s actual return) and then applies the Fund’s actual expense ratio for the period to the hypothetical return. You should not use the hypothetical account values and expenses to estimate either your actual account balance at the end of the period or the expenses you paid during the period. See “Compare with other funds” below for details on how to use the hypothetical data.
Compare with other funds
Since all mutual funds are required to include the same hypothetical calculations about expenses in shareholder reports, you can use this information to compare the ongoing cost of investing in the Fund with other funds. To do so, compare the hypothetical example with the 5% hypothetical examples that appear in the shareholder reports of other funds. As you compare hypothetical examples of other funds, it is important to note that hypothetical examples are meant to highlight the ongoing costs of investing in a fund only and do not reflect any transaction costs, such as sales charges, or redemption or exchange fees. Therefore, the hypothetical calculations are useful in comparing ongoing costs only, and will not help you determine the relative total costs of owning different funds. If transaction costs were included in these calculations, your costs would be higher.
| July 1, 2022 — December 31, 2022 |
| | Account value at the
beginning of the
period ($) | Account value at the
end of the
period ($) | Expenses paid during
the period ($) | Fund’s annualized
expense ratio (%) |
| | Actual | Hypothetical | Actual | Hypothetical | Actual | Hypothetical | Actual |
| Class A | 1,000.00 | 1,000.00 | 959.40 | 1,018.75 | 6.19 | 6.38 | 1.26 |
| Advisor Class | 1,000.00 | 1,000.00 | 959.40 | 1,020.00 | 4.96 | 5.11 | 1.01 |
| Class C | 1,000.00 | 1,000.00 | 954.90 | 1,014.99 | 9.85 | 10.15 | 2.01 |
| Institutional Class | 1,000.00 | 1,000.00 | 959.90 | 1,020.00 | 4.96 | 5.11 | 1.01 |
| Institutional 2 Class | 1,000.00 | 1,000.00 | 960.20 | 1,020.51 | 4.47 | 4.61 | 0.91 |
| Institutional 3 Class | 1,000.00 | 1,000.00 | 961.10 | 1,020.81 | 4.18 | 4.31 | 0.85 |
| Class R | 1,000.00 | 1,000.00 | 958.10 | 1,017.50 | 7.41 | 7.64 | 1.51 |
Expenses paid during the period are equal to the annualized expense ratio for each class as indicated above, multiplied by the average account value over the period and then multiplied by the number of days in the Fund’s most recent fiscal half year and divided by 365.
Expenses do not include fees and expenses incurred indirectly by the Fund from its investment in underlying funds, including affiliated and non-affiliated pooled investment vehicles, such as mutual funds and exchange-traded funds.
Had Columbia Management Investment Advisers, LLC and/or certain of its affiliates not waived/reimbursed certain fees and expenses, account value at the end of the period would have been reduced.
| 8 | Columbia Real Estate Equity Fund | Annual Report 2022 |
Portfolio of Investments
December 31, 2022
(Percentages represent value of investments compared to net assets)
Investments in securities
| Common Stocks 99.5% |
| Issuer | Shares | Value ($) |
| Consumer Discretionary 1.5% |
| Hotels, Resorts & Cruise Lines 1.5% |
| Marriott International, Inc., Class A | 23,788 | 3,541,795 |
| Total Hotels, Resorts & Cruise Lines | 3,541,795 |
| Total Consumer Discretionary | 3,541,795 |
| Real Estate 98.0% |
| Health Care REITs 6.8% |
| Healthpeak Properties, Inc. | 151,762 | 3,804,674 |
| Welltower, Inc. | 183,695 | 12,041,207 |
| Total Health Care REITs | 15,845,881 |
| Hotel & Resort REITs 3.2% |
| Host Hotels & Resorts, Inc. | 467,009 | 7,495,494 |
| Total Hotel & Resort REITs | 7,495,494 |
| Industrial REITs 18.1% |
| First Industrial Realty Trust, Inc. | 163,636 | 7,897,073 |
| Prologis, Inc. | 302,228 | 34,070,163 |
| Total Industrial REITs | 41,967,236 |
| Office REITs 4.6% |
| Alexandria Real Estate Equities, Inc. | 72,723 | 10,593,559 |
| Total Office REITs | 10,593,559 |
| Residential REITs 23.3% |
| American Homes 4 Rent, Class A | 235,728 | 7,104,842 |
| AvalonBay Communities, Inc. | 64,569 | 10,429,185 |
| Camden Property Trust | 44,369 | 4,964,004 |
| Centerspace | 69,817 | 4,096,163 |
| Equity LifeStyle Properties, Inc. | 180,776 | 11,678,129 |
| Invitation Homes, Inc. | 330,340 | 9,791,278 |
| Sun Communities, Inc. | 41,564 | 5,943,652 |
| Total Residential REITs | 54,007,253 |
| Common Stocks (continued) |
| Issuer | Shares | Value ($) |
| Retail REITs 18.6% |
| Brixmor Property Group, Inc. | 371,858 | 8,430,021 |
| Federal Realty Investment Trust | 74,005 | 7,477,465 |
| Realty Income Corp. | 134,963 | 8,560,703 |
| Simon Property Group, Inc. | 94,553 | 11,108,087 |
| SITE Centers Corp. | 189,237 | 2,584,977 |
| Tanger Factory Outlet Centers, Inc. | 273,292 | 4,902,859 |
| Total Retail REITs | 43,064,112 |
| Specialized REITs 23.4% |
| American Tower Corp. | 32,607 | 6,908,119 |
| Equinix, Inc. | 20,348 | 13,328,550 |
| Extra Space Storage, Inc. | 55,185 | 8,122,128 |
| Gaming and Leisure Properties, Inc. | 172,898 | 9,006,257 |
| Lamar Advertising Co., Class A | 47,338 | 4,468,707 |
| Life Storage, Inc. | 104,281 | 10,271,679 |
| SBA Communications Corp. | 7,179 | 2,012,346 |
| Total Specialized REITs | 54,117,786 |
| Total Real Estate | 227,091,321 |
Total Common Stocks
(Cost: $157,936,367) | 230,633,116 |
|
| Money Market Funds 0.2% |
| | Shares | Value ($) |
| Columbia Short-Term Cash Fund, 4.318%(a),(b) | 589,228 | 589,051 |
Total Money Market Funds
(Cost: $589,033) | 589,051 |
Total Investments in Securities
(Cost $158,525,400) | 231,222,167 |
| Other Assets & Liabilities, Net | | 624,334 |
| Net Assets | $231,846,501 |
The accompanying Notes to Financial Statements are an integral part of this statement.
Columbia Real Estate Equity Fund | Annual Report 2022
| 9 |
Portfolio of Investments (continued)
December 31, 2022
Notes to Portfolio of Investments
| (a) | The rate shown is the seven-day current annualized yield at December 31, 2022. |
| (b) | As defined in the Investment Company Act of 1940, as amended, an affiliated company is one in which the Fund owns 5% or more of the company’s outstanding voting securities, or a company which is under common ownership or control with the Fund. The value of the holdings and transactions in these affiliated companies during the year ended December 31, 2022 are as follows: |
| Affiliated issuers | Beginning
of period($) | Purchases($) | Sales($) | Net change in
unrealized
appreciation
(depreciation)($) | End of
period($) | Realized gain
(loss)($) | Dividends($) | End of
period shares |
| Columbia Short-Term Cash Fund, 4.318% |
| | 339,665 | 38,490,503 | (38,241,135) | 18 | 589,051 | (185) | 15,927 | 589,228 |
Fair value measurements
The Fund categorizes its fair value measurements according to a three-level hierarchy that maximizes the use of observable inputs and minimizes the use of unobservable inputs by prioritizing that the most observable input be used when available. Observable inputs are those that market participants would use in pricing an investment based on market data obtained from sources independent of the reporting entity. Unobservable inputs are those that reflect the Fund’s assumptions about the information market participants would use in pricing an investment. An investment’s level within the fair value hierarchy is based on the lowest level of any input that is deemed significant to the asset’s or liability’s fair value measurement. The input levels are not necessarily an indication of the risk or liquidity associated with investments at that level. For example, certain U.S. government securities are generally high quality and liquid, however, they are reflected as Level 2 because the inputs used to determine fair value may not always be quoted prices in an active market.
Fair value inputs are summarized in the three broad levels listed below:
| ■ | Level 1 — Valuations based on quoted prices for investments in active markets that the Fund has the ability to access at the measurement date. Valuation adjustments are not applied to Level 1 investments. |
| ■ | Level 2 — Valuations based on other significant observable inputs (including quoted prices for similar securities, interest rates, prepayment speeds, credit risks, etc.). |
| ■ | Level 3 — Valuations based on significant unobservable inputs (including the Fund’s own assumptions and judgment in determining the fair value of investments). |
Inputs that are used in determining fair value of an investment may include price information, credit data, volatility statistics, and other factors. These inputs can be either observable or unobservable. The availability of observable inputs can vary between investments, and is affected by various factors such as the type of investment, and the volume and level of activity for that investment or similar investments in the marketplace. The inputs will be considered by the Investment Manager, along with any other relevant factors in the calculation of an investment’s fair value. The Fund uses prices and inputs that are current as of the measurement date, which may include periods of market dislocations. During these periods, the availability of prices and inputs may be reduced for many investments. This condition could cause an investment to be reclassified between the various levels within the hierarchy.
Investments falling into the Level 3 category are primarily supported by quoted prices from brokers and dealers participating in the market for those investments. However, these may be classified as Level 3 investments due to lack of market transparency and corroboration to support these quoted prices. Additionally, valuation models may be used as the pricing source for any remaining investments classified as Level 3. These models may rely on one or more significant unobservable inputs and/or significant assumptions by the Investment Manager. Inputs used in valuations may include, but are not limited to, financial statement analysis, capital account balances, discount rates and estimated cash flows, and comparable company data.
The Fund’s Board of Trustees (the Board) has designated the Investment Manager, through its Valuation Committee (the Committee), as valuation designee, responsible for determining the fair value of the assets of the Fund for which market quotations are not readily available using valuation procedures approved by the Board. The Committee consists of voting and non-voting members from various groups within the Investment Manager’s organization, including operations and accounting, trading and investments, compliance, risk management and legal.
The Committee meets at least monthly to review and approve valuation matters, which may include a description of specific valuation determinations, data regarding pricing information received from approved pricing vendors and brokers and the results of Board-approved valuation policies and procedures (the Policies). The Policies address, among other things, instances when market quotations are or are not readily available, including recommendations of third party pricing vendors and a determination of appropriate pricing methodologies; events that require specific valuation determinations and assessment of fair value techniques; securities with a potential for stale pricing, including those that are illiquid, restricted, or in default; and the effectiveness of third party pricing vendors, including periodic reviews of vendors. The Committee meets more frequently, as needed, to discuss additional valuation matters, which may include the need to review back-testing results, review time-sensitive information or approve related valuation actions. Representatives of Columbia Management Investment Advisers, LLC report to the Board at each of its regularly scheduled meetings to discuss valuation matters and actions during the period, similar to those described earlier.
The following table is a summary of the inputs used to value the Fund’s investments at December 31, 2022:
| | Level 1 ($) | Level 2 ($) | Level 3 ($) | Total ($) |
| Investments in Securities | | | | |
| Common Stocks | | | | |
| Consumer Discretionary | 3,541,795 | — | — | 3,541,795 |
| Real Estate | 227,091,321 | — | — | 227,091,321 |
| Total Common Stocks | 230,633,116 | — | — | 230,633,116 |
| Money Market Funds | 589,051 | — | — | 589,051 |
| Total Investments in Securities | 231,222,167 | — | — | 231,222,167 |
See the Portfolio of Investments for all investment classifications not indicated in the table.
The accompanying Notes to Financial Statements are an integral part of this statement.
| 10 | Columbia Real Estate Equity Fund | Annual Report 2022 |
Statement of Assets and Liabilities
December 31, 2022
| Assets | |
| Investments in securities, at value | |
| Unaffiliated issuers (cost $157,936,367) | $230,633,116 |
| Affiliated issuers (cost $589,033) | 589,051 |
| Cash | 344 |
| Receivable for: | |
| Capital shares sold | 114,604 |
| Dividends | 783,455 |
| Expense reimbursement due from Investment Manager | 80 |
| Prepaid expenses | 4,046 |
| Trustees’ deferred compensation plan | 111,498 |
| Total assets | 232,236,194 |
| Liabilities | |
| Payable for: | |
| Capital shares purchased | 203,231 |
| Management services fees | 4,809 |
| Distribution and/or service fees | 390 |
| Transfer agent fees | 22,945 |
| Compensation of board members | 13,758 |
| Compensation of chief compliance officer | 47 |
| Other expenses | 33,015 |
| Trustees’ deferred compensation plan | 111,498 |
| Total liabilities | 389,693 |
| Net assets applicable to outstanding capital stock | $231,846,501 |
| Represented by | |
| Paid in capital | 160,263,433 |
| Total distributable earnings (loss) | 71,583,068 |
| Total - representing net assets applicable to outstanding capital stock | $231,846,501 |
The accompanying Notes to Financial Statements are an integral part of this statement.
Columbia Real Estate Equity Fund | Annual Report 2022
| 11 |
Statement of Assets and Liabilities (continued)
December 31, 2022
| Class A | |
| Net assets | $47,507,156 |
| Shares outstanding | 4,121,416 |
| Net asset value per share | $11.53 |
| Maximum sales charge | 5.75% |
| Maximum offering price per share (calculated by dividing the net asset value per share by 1.0 minus the maximum sales charge for Class A shares) | $12.23 |
| Advisor Class | |
| Net assets | $1,419,796 |
| Shares outstanding | 119,476 |
| Net asset value per share | $11.88 |
| Class C | |
| Net assets | $1,310,361 |
| Shares outstanding | 113,575 |
| Net asset value per share | $11.54 |
| Institutional Class | |
| Net assets | $82,320,045 |
| Shares outstanding | 7,122,296 |
| Net asset value per share | $11.56 |
| Institutional 2 Class | |
| Net assets | $938,281 |
| Shares outstanding | 81,580 |
| Net asset value per share | $11.50 |
| Institutional 3 Class | |
| Net assets | $96,458,638 |
| Shares outstanding | 8,260,936 |
| Net asset value per share | $11.68 |
| Class R | |
| Net assets | $1,892,224 |
| Shares outstanding | 164,319 |
| Net asset value per share | $11.52 |
The accompanying Notes to Financial Statements are an integral part of this statement.
| 12 | Columbia Real Estate Equity Fund | Annual Report 2022 |
Statement of Operations
Year Ended December 31, 2022
| Net investment income | |
| Income: | |
| Dividends — unaffiliated issuers | $7,303,451 |
| Dividends — affiliated issuers | 15,927 |
| Total income | 7,319,378 |
| Expenses: | |
| Management services fees | 2,084,936 |
| Distribution and/or service fees | |
| Class A | 145,396 |
| Class C | 20,267 |
| Class R | 11,370 |
| Transfer agent fees | |
| Class A | 106,528 |
| Advisor Class | 3,128 |
| Class C | 3,686 |
| Institutional Class | 178,156 |
| Institutional 2 Class | 745 |
| Institutional 3 Class | 6,921 |
| Class R | 4,151 |
| Compensation of board members | 17,771 |
| Custodian fees | 4,235 |
| Printing and postage fees | 49,603 |
| Registration fees | 104,137 |
| Audit fees | 29,500 |
| Legal fees | 15,646 |
| Interest on interfund lending | 7 |
| Compensation of chief compliance officer | 97 |
| Other | 14,882 |
| Total expenses | 2,801,162 |
| Fees waived or expenses reimbursed by Investment Manager and its affiliates | (24,824) |
| Expense reduction | (788) |
| Total net expenses | 2,775,550 |
| Net investment income | 4,543,828 |
| Realized and unrealized gain (loss) — net | |
| Net realized gain (loss) on: | |
| Investments — unaffiliated issuers | 820,724 |
| Investments — affiliated issuers | (185) |
| Net realized gain | 820,539 |
| Net change in unrealized appreciation (depreciation) on: | |
| Investments — unaffiliated issuers | (90,219,195) |
| Investments — affiliated issuers | 18 |
| Net change in unrealized appreciation (depreciation) | (90,219,177) |
| Net realized and unrealized loss | (89,398,638) |
| Net decrease in net assets resulting from operations | $(84,854,810) |
The accompanying Notes to Financial Statements are an integral part of this statement.
Columbia Real Estate Equity Fund | Annual Report 2022
| 13 |
Statement of Changes in Net Assets
| | Year Ended
December 31, 2022 | Year Ended
December 31, 2021 |
| Operations | | |
| Net investment income | $4,543,828 | $2,597,335 |
| Net realized gain | 820,539 | 19,372,171 |
| Net change in unrealized appreciation (depreciation) | (90,219,177) | 82,573,664 |
| Net increase (decrease) in net assets resulting from operations | (84,854,810) | 104,543,170 |
| Distributions to shareholders | | |
| Net investment income and net realized gains | | |
| Class A | (2,827,858) | (4,424,202) |
| Advisor Class | (84,991) | (146,833) |
| Class C | (85,202) | (146,549) |
| Institutional Class | (4,981,091) | (7,806,269) |
| Institutional 2 Class | (60,657) | (79,583) |
| Institutional 3 Class | (6,153,625) | (8,413,828) |
| Class R | (103,359) | (183,711) |
| Total distributions to shareholders | (14,296,783) | (21,200,975) |
| Decrease in net assets from capital stock activity | (6,832,483) | (15,697,347) |
| Total increase (decrease) in net assets | (105,984,076) | 67,644,848 |
| Net assets at beginning of year | 337,830,577 | 270,185,729 |
| Net assets at end of year | $231,846,501 | $337,830,577 |
The accompanying Notes to Financial Statements are an integral part of this statement.
| 14 | Columbia Real Estate Equity Fund | Annual Report 2022 |
Statement of Changes in Net Assets (continued)
| | Year Ended | Year Ended |
| | December 31, 2022 | December 31, 2021 |
| | Shares | Dollars ($) | Shares | Dollars ($) |
| Capital stock activity |
| Class A | | | | |
| Subscriptions | 302,210 | 4,006,439 | 418,321 | 5,875,805 |
| Distributions reinvested | 220,434 | 2,641,125 | 281,203 | 4,132,727 |
| Redemptions | (894,622) | (11,488,012) | (731,255) | (10,224,970) |
| Net decrease | (371,978) | (4,840,448) | (31,731) | (216,438) |
| Advisor Class | | | | |
| Subscriptions | 14,846 | 212,417 | 31,930 | 457,375 |
| Distributions reinvested | 6,377 | 78,932 | 8,573 | 129,067 |
| Redemptions | (31,449) | (437,309) | (80,791) | (1,199,822) |
| Net decrease | (10,226) | (145,960) | (40,288) | (613,380) |
| Class C | | | | |
| Subscriptions | 20,320 | 293,629 | 41,320 | 602,037 |
| Distributions reinvested | 7,074 | 84,190 | 9,838 | 145,121 |
| Redemptions | (80,947) | (1,035,082) | (112,122) | (1,510,034) |
| Net decrease | (53,553) | (657,263) | (60,964) | (762,876) |
| Institutional Class | | | | |
| Subscriptions | 345,916 | 4,884,823 | 477,706 | 6,749,927 |
| Distributions reinvested | 394,064 | 4,743,745 | 483,411 | 7,120,375 |
| Redemptions | (1,026,566) | (13,501,262) | (6,360,555) | (85,370,742) |
| Net decrease | (286,586) | (3,872,694) | (5,399,438) | (71,500,440) |
| Institutional 2 Class | | | | |
| Subscriptions | 19,477 | 273,223 | 35,114 | 495,346 |
| Distributions reinvested | 5,044 | 60,520 | 5,416 | 79,374 |
| Redemptions | (24,194) | (319,384) | (34,246) | (459,128) |
| Net increase | 327 | 14,359 | 6,284 | 115,592 |
| Institutional 3 Class | | | | |
| Subscriptions | 2,302,023 | 32,216,477 | 5,071,153 | 69,142,179 |
| Distributions reinvested | 366,728 | 4,423,778 | 438,581 | 6,544,134 |
| Redemptions | (2,546,686) | (33,453,030) | (1,266,013) | (18,649,953) |
| Net increase | 122,065 | 3,187,225 | 4,243,721 | 57,036,360 |
| Class R | | | | |
| Subscriptions | 18,063 | 240,006 | 47,228 | 681,489 |
| Distributions reinvested | 8,626 | 103,074 | 11,601 | 171,198 |
| Redemptions | (62,366) | (860,782) | (44,533) | (608,852) |
| Net increase (decrease) | (35,677) | (517,702) | 14,296 | 243,835 |
| Total net decrease | (635,628) | (6,832,483) | (1,268,120) | (15,697,347) |
The accompanying Notes to Financial Statements are an integral part of this statement.
Columbia Real Estate Equity Fund | Annual Report 2022
| 15 |
The following table is intended to help you understand the Fund’s financial performance. Certain information reflects financial results for a single share of a class held for the periods shown. Per share net investment income (loss) amounts are calculated based on average shares outstanding during the period. Total return assumes reinvestment of all dividends and distributions, if any. Total return does not reflect payment of sales charges, if any. Total return and portfolio turnover are not annualized for periods of less than one year. The portfolio turnover rate is calculated without regard to purchase and sales transactions of short-term instruments and certain derivatives, if any. If such transactions were included, the Fund’s portfolio turnover rate may be higher.
| | Net asset value,
beginning of
period | Net
investment
income
(loss) | Net
realized
and
unrealized
gain (loss) | Total from
investment
operations | Distributions
from net
investment
income | Distributions
from net
realized
gains | Total
distributions to
shareholders |
| Class A |
| Year Ended 12/31/2022 | $16.29 | 0.18 | (4.29) | (4.11) | (0.18) | (0.47) | (0.65) |
| Year Ended 12/31/2021 | $12.30 | 0.09 | 4.91 | 5.00 | (0.17) | (0.84) | (1.01) |
| Year Ended 12/31/2020 | $13.77 | 0.13 | (0.71) | (0.58) | (0.16) | (0.73) | (0.89) |
| Year Ended 12/31/2019 | $12.07 | 0.21 | 3.11 | 3.32 | (0.21) | (1.41) | (1.62) |
| Year Ended 12/31/2018 | $14.02 | 0.18 | (1.17) | (0.99) | (0.19) | (0.77) | (0.96) |
| Advisor Class |
| Year Ended 12/31/2022 | $16.76 | 0.22 | (4.42) | (4.20) | (0.21) | (0.47) | (0.68) |
| Year Ended 12/31/2021 | $12.63 | 0.12 | 5.06 | 5.18 | (0.21) | (0.84) | (1.05) |
| Year Ended 12/31/2020 | $14.13 | 0.17 | (0.75) | (0.58) | (0.19) | (0.73) | (0.92) |
| Year Ended 12/31/2019 | $12.34 | 0.26 | 3.19 | 3.45 | (0.25) | (1.41) | (1.66) |
| Year Ended 12/31/2018 | $14.32 | 0.23 | (1.21) | (0.98) | (0.23) | (0.77) | (1.00) |
| Class C |
| Year Ended 12/31/2022 | $16.29 | 0.07 | (4.27) | (4.20) | (0.08) | (0.47) | (0.55) |
| Year Ended 12/31/2021 | $12.30 | (0.02) | 4.91 | 4.89 | (0.06) | (0.84) | (0.90) |
| Year Ended 12/31/2020 | $13.76 | 0.04 | (0.70) | (0.66) | (0.07) | (0.73) | (0.80) |
| Year Ended 12/31/2019 | $12.06 | 0.10 | 3.12 | 3.22 | (0.11) | (1.41) | (1.52) |
| Year Ended 12/31/2018 | $14.02 | 0.06 | (1.16) | (1.10) | (0.09) | (0.77) | (0.86) |
| Institutional Class |
| Year Ended 12/31/2022 | $16.33 | 0.22 | (4.31) | (4.09) | (0.21) | (0.47) | (0.68) |
| Year Ended 12/31/2021 | $12.33 | 0.12 | 4.93 | 5.05 | (0.21) | (0.84) | (1.05) |
| Year Ended 12/31/2020 | $13.81 | 0.17 | (0.73) | (0.56) | (0.19) | (0.73) | (0.92) |
| Year Ended 12/31/2019 | $12.10 | 0.25 | 3.12 | 3.37 | (0.25) | (1.41) | (1.66) |
| Year Ended 12/31/2018 | $14.05 | 0.22 | (1.17) | (0.95) | (0.23) | (0.77) | (1.00) |
| Institutional 2 Class |
| Year Ended 12/31/2022 | $16.25 | 0.23 | (4.28) | (4.05) | (0.23) | (0.47) | (0.70) |
| Year Ended 12/31/2021 | $12.28 | 0.14 | 4.89 | 5.03 | (0.22) | (0.84) | (1.06) |
| Year Ended 12/31/2020 | $13.75 | 0.17 | (0.70) | (0.53) | (0.21) | (0.73) | (0.94) |
| Year Ended 12/31/2019 | $12.06 | 0.22 | 3.15 | 3.37 | (0.27) | (1.41) | (1.68) |
| Year Ended 12/31/2018 | $14.01 | 0.24 | (1.18) | (0.94) | (0.24) | (0.77) | (1.01) |
| Institutional 3 Class |
| Year Ended 12/31/2022 | $16.49 | 0.24 | (4.34) | (4.10) | (0.24) | (0.47) | (0.71) |
| Year Ended 12/31/2021 | $12.44 | 0.16 | 4.96 | 5.12 | (0.23) | (0.84) | (1.07) |
| Year Ended 12/31/2020 | $13.92 | 0.19 | (0.72) | (0.53) | (0.22) | (0.73) | (0.95) |
| Year Ended 12/31/2019 | $12.19 | 0.26 | 3.16 | 3.42 | (0.28) | (1.41) | (1.69) |
| Year Ended 12/31/2018 | $14.15 | 0.25 | (1.19) | (0.94) | (0.25) | (0.77) | (1.02) |
The accompanying Notes to Financial Statements are an integral part of this statement.
| 16 | Columbia Real Estate Equity Fund | Annual Report 2022 |
Financial Highlights (continued)
| | Net
asset
value,
end of
period | Total
return | Total gross
expense
ratio to
average
net assets(a) | Total net
expense
ratio to
average
net assets(a),(b) | Net investment
income (loss)
ratio to
average
net assets | Portfolio
turnover | Net
assets,
end of
period
(000’s) |
| Class A |
| Year Ended 12/31/2022 | $11.53 | (25.33%) | 1.27%(c) | 1.25%(c),(d) | 1.36% | 28% | $47,507 |
| Year Ended 12/31/2021 | $16.29 | 41.74% | 1.26% | 1.26%(d) | 0.63% | 5% | $73,177 |
| Year Ended 12/31/2020 | $12.30 | (3.70%) | 1.28% | 1.27%(d) | 1.07% | 32% | $55,651 |
| Year Ended 12/31/2019 | $13.77 | 28.04% | 1.29% | 1.28%(d) | 1.47% | 20% | $73,522 |
| Year Ended 12/31/2018 | $12.07 | (7.48%) | 1.29% | 1.29%(d) | 1.35% | 18% | $63,934 |
| Advisor Class |
| Year Ended 12/31/2022 | $11.88 | (25.15%) | 1.02%(c) | 1.00%(c),(d) | 1.61% | 28% | $1,420 |
| Year Ended 12/31/2021 | $16.76 | 42.09% | 1.01% | 1.01%(d) | 0.85% | 5% | $2,174 |
| Year Ended 12/31/2020 | $12.63 | (3.56%) | 1.03% | 1.02%(d) | 1.34% | 32% | $2,148 |
| Year Ended 12/31/2019 | $14.13 | 28.47% | 1.04% | 1.04%(d) | 1.81% | 20% | $2,005 |
| Year Ended 12/31/2018 | $12.34 | (7.30%) | 1.03% | 1.03%(d) | 1.69% | 18% | $480 |
| Class C |
| Year Ended 12/31/2022 | $11.54 | (25.86%) | 2.01%(c) | 2.00%(c),(d) | 0.53% | 28% | $1,310 |
| Year Ended 12/31/2021 | $16.29 | 40.70% | 2.01% | 2.01%(d) | (0.13%) | 5% | $2,722 |
| Year Ended 12/31/2020 | $12.30 | (4.44%) | 2.03% | 2.02%(d) | 0.29% | 32% | $2,807 |
| Year Ended 12/31/2019 | $13.76 | 27.11% | 2.03% | 2.03%(d) | 0.68% | 20% | $4,623 |
| Year Ended 12/31/2018 | $12.06 | (8.24%) | 2.04% | 2.04%(d) | 0.47% | 18% | $4,795 |
| Institutional Class |
| Year Ended 12/31/2022 | $11.56 | (25.13%) | 1.02%(c) | 1.00%(c),(d) | 1.63% | 28% | $82,320 |
| Year Ended 12/31/2021 | $16.33 | 42.06% | 1.01% | 1.01%(d) | 0.88% | 5% | $120,982 |
| Year Ended 12/31/2020 | $12.33 | (3.49%) | 1.04% | 1.02%(d) | 1.36% | 32% | $157,929 |
| Year Ended 12/31/2019 | $13.81 | 28.38% | 1.03% | 1.03%(d) | 1.73% | 20% | $162,706 |
| Year Ended 12/31/2018 | $12.10 | (7.23%) | 1.04% | 1.04%(d) | 1.63% | 18% | $136,079 |
| Institutional 2 Class |
| Year Ended 12/31/2022 | $11.50 | (25.05%) | 0.90%(c) | 0.90%(c) | 1.73% | 28% | $938 |
| Year Ended 12/31/2021 | $16.25 | 42.15% | 0.90% | 0.89% | 1.02% | 5% | $1,321 |
| Year Ended 12/31/2020 | $12.28 | (3.30%) | 0.91% | 0.90% | 1.41% | 32% | $920 |
| Year Ended 12/31/2019 | $13.75 | 28.49% | 0.89% | 0.89% | 1.57% | 20% | $1,370 |
| Year Ended 12/31/2018 | $12.06 | (7.12%) | 0.89% | 0.89% | 1.81% | 18% | $7,700 |
| Institutional 3 Class |
| Year Ended 12/31/2022 | $11.68 | (25.00%) | 0.84%(c) | 0.84%(c) | 1.81% | 28% | $96,459 |
| Year Ended 12/31/2021 | $16.49 | 42.33% | 0.84% | 0.83% | 1.06% | 5% | $134,201 |
| Year Ended 12/31/2020 | $12.44 | (3.27%) | 0.85% | 0.84% | 1.55% | 32% | $48,451 |
| Year Ended 12/31/2019 | $13.92 | 28.58% | 0.84% | 0.84% | 1.84% | 20% | $44,827 |
| Year Ended 12/31/2018 | $12.19 | (7.07%) | 0.85% | 0.85% | 1.88% | 18% | $59,640 |
The accompanying Notes to Financial Statements are an integral part of this statement.
Columbia Real Estate Equity Fund | Annual Report 2022
| 17 |
Financial Highlights (continued)
| | Net asset value,
beginning of
period | Net
investment
income
(loss) | Net
realized
and
unrealized
gain (loss) | Total from
investment
operations | Distributions
from net
investment
income | Distributions
from net
realized
gains | Total
distributions to
shareholders |
| Class R |
| Year Ended 12/31/2022 | $16.27 | 0.14 | (4.27) | (4.13) | (0.15) | (0.47) | (0.62) |
| Year Ended 12/31/2021 | $12.29 | 0.06 | 4.90 | 4.96 | (0.14) | (0.84) | (0.98) |
| Year Ended 12/31/2020 | $13.75 | 0.10 | (0.70) | (0.60) | (0.13) | (0.73) | (0.86) |
| Year Ended 12/31/2019 | $12.05 | 0.16 | 3.13 | 3.29 | (0.18) | (1.41) | (1.59) |
| Year Ended 12/31/2018 | $14.01 | 0.15 | (1.18) | (1.03) | (0.16) | (0.77) | (0.93) |
| Notes to Financial Highlights |
| (a) | In addition to the fees and expenses that the Fund bears directly, the Fund indirectly bears a pro rata share of the fees and expenses of any other funds in which it invests. Such indirect expenses are not included in the Fund’s reported expense ratios. |
| (b) | Total net expenses include the impact of certain fee waivers/expense reimbursements made by the Investment Manager and certain of its affiliates, if applicable. |
| (c) | Ratios include interfund lending expense which is less than 0.01%. |
| (d) | The benefits derived from expense reductions had an impact of less than 0.01%. |
The accompanying Notes to Financial Statements are an integral part of this statement.
| 18 | Columbia Real Estate Equity Fund | Annual Report 2022 |
Financial Highlights (continued)
| | Net
asset
value,
end of
period | Total
return | Total gross
expense
ratio to
average
net assets(a) | Total net
expense
ratio to
average
net assets(a),(b) | Net investment
income (loss)
ratio to
average
net assets | Portfolio
turnover | Net
assets,
end of
period
(000’s) |
| Class R |
| Year Ended 12/31/2022 | $11.52 | (25.50%) | 1.52%(c) | 1.50%(c),(d) | 1.10% | 28% | $1,892 |
| Year Ended 12/31/2021 | $16.27 | 41.34% | 1.51% | 1.51%(d) | 0.41% | 5% | $3,253 |
| Year Ended 12/31/2020 | $12.29 | (3.90%) | 1.53% | 1.52%(d) | 0.78% | 32% | $2,282 |
| Year Ended 12/31/2019 | $13.75 | 27.77% | 1.53% | 1.53%(d) | 1.10% | 20% | $3,726 |
| Year Ended 12/31/2018 | $12.05 | (7.78%) | 1.54% | 1.54%(d) | 1.12% | 18% | $5,038 |
The accompanying Notes to Financial Statements are an integral part of this statement.
Columbia Real Estate Equity Fund | Annual Report 2022
| 19 |
Notes to Financial Statements
December 31, 2022
Note 1. Organization
Columbia Real Estate Equity Fund (the Fund), a series of Columbia Funds Series Trust I (the Trust), is a non-diversified fund. The Trust is registered under the Investment Company Act of 1940, as amended (the 1940 Act), as an open-end management investment company organized as a Massachusetts business trust.
Fund shares
The Trust may issue an unlimited number of shares (without par value). The Fund offers each of the share classes listed in the Statement of Assets and Liabilities. Although all share classes generally have identical voting, dividend and liquidation rights, each share class votes separately when required by the Trust’s organizational documents or by law. Each share class has its own expense and sales charge structure. Different share classes may have different minimum initial investment amounts and pay different net investment income distribution amounts to the extent the expenses of distributing such share classes vary. Distributions to shareholders in a liquidation will be proportional to the net asset value of each share class.
As described in the Fund’s prospectus, Class A and Class C shares are offered to the general public for investment. Class C shares automatically convert to Class A shares after 8 years. Advisor Class, Institutional Class, Institutional 2 Class, Institutional 3 Class and Class R shares are available for purchase through authorized investment professionals to omnibus retirement plans or to institutional investors and to certain other investors as also described in the Fund’s prospectus.
Note 2. Summary of significant accounting policies
Basis of preparation
The Fund is an investment company that applies the accounting and reporting guidance in the Financial Accounting Standards Board (FASB) Accounting Standards Codification Topic 946, Financial Services - Investment Companies (ASC 946). The financial statements are prepared in accordance with U.S. generally accepted accounting principles (GAAP), which requires management to make certain estimates and assumptions that affect the reported amounts of assets and liabilities, the disclosure of contingent assets and liabilities at the date of the financial statements and the reported amounts of income and expenses during the reporting period. Actual results could differ from those estimates.
The following is a summary of significant accounting policies followed by the Fund in the preparation of its financial statements.
Security valuation
Equity securities listed on an exchange are valued at the closing price or last trade price on their primary exchange at the close of business of the New York Stock Exchange. Securities with a closing price not readily available or not listed on any exchange are valued at the mean between the closing bid and ask prices. Listed preferred stocks convertible into common stocks are valued using an evaluated price from a pricing service.
Investments in open-end investment companies (other than exchange-traded funds (ETFs)), are valued at the latest net asset value reported by those companies as of the valuation time.
Investments for which market quotations are not readily available, or that have quotations which management believes are not reflective of market value or reliable, are valued at fair value as determined in good faith under procedures approved by the Board of Trustees. If a security or class of securities (such as foreign securities) is valued at fair value, such value is likely to be different from the quoted or published price for the security, if available.
The determination of fair value often requires significant judgment. To determine fair value, management may use assumptions including but not limited to future cash flows and estimated risk premiums. Multiple inputs from various sources may be used to determine fair value.
GAAP requires disclosure regarding the inputs and valuation techniques used to measure fair value and any changes in valuation inputs or techniques. In addition, investments shall be disclosed by major category. This information is disclosed following the Fund’s Portfolio of Investments.
| 20 | Columbia Real Estate Equity Fund | Annual Report 2022 |
Notes to Financial Statements (continued)
December 31, 2022
Security transactions
Security transactions are accounted for on the trade date. Cost is determined and gains (losses) are based upon the specific identification method for both financial statement and federal income tax purposes.
Income recognition
Corporate actions and dividend income are recorded on the ex-dividend date.
The Fund may receive distributions from holdings in equity securities, business development companies (BDCs), exchange-traded funds (ETFs), limited partnerships (LPs), other regulated investment companies (RICs), and real estate investment trusts (REITs), which report information as to the tax character of their distributions annually. These distributions are allocated to dividend income, capital gain and return of capital based on actual information reported. Return of capital is recorded as a reduction of the cost basis of securities held. If the Fund no longer owns the applicable securities, return of capital is recorded as a realized gain. With respect to REITs, to the extent actual information has not yet been reported, estimates for return of capital are made by Columbia Management Investment Advisers, LLC (the Investment Manager), a wholly-owned subsidiary of Ameriprise Financial, Inc. (Ameriprise Financial). The Investment Manager’s estimates are subsequently adjusted when the actual character of the distributions is disclosed by the REITs, which could result in a proportionate change in return of capital to shareholders.
Awards from class action litigation are recorded as a reduction of cost basis if the Fund still owns the applicable securities on the payment date. If the Fund no longer owns the applicable securities on the payment date, the proceeds are recorded as realized gains.
Expenses
General expenses of the Trust are allocated to the Fund and other funds of the Trust based upon relative net assets or other expense allocation methodologies determined by the nature of the expense. Expenses directly attributable to the Fund are charged to the Fund. Expenses directly attributable to a specific class of shares are charged to that share class.
Determination of class net asset value
All income, expenses (other than class-specific expenses, which are charged to that share class, as shown in the Statement of Operations) and realized and unrealized gains (losses) are allocated to each class of the Fund on a daily basis, based on the relative net assets of each class, for purposes of determining the net asset value of each class.
Federal income tax status
The Fund intends to qualify each year as a regulated investment company under Subchapter M of the Internal Revenue Code, as amended, and will distribute substantially all of its investment company taxable income and net capital gain, if any, for its tax year, and as such will not be subject to federal income taxes. In addition, the Fund intends to distribute in each calendar year substantially all of its ordinary income, capital gain net income and certain other amounts, if any, such that the Fund should not be subject to federal excise tax. Therefore, no federal income or excise tax provision is recorded.
Distributions to shareholders
Distributions from net investment income, if any, are declared and paid each calendar quarter. Net realized capital gains, if any, are distributed at least annually. Income distributions and capital gain distributions are determined in accordance with federal income tax regulations, which may differ from GAAP.
Guarantees and indemnifications
Under the Trust’s organizational documents and, in some cases, by contract, its officers and trustees are indemnified against certain liabilities arising out of the performance of their duties to the Trust or its funds. In addition, certain of the Fund’s contracts with its service providers contain general indemnification clauses. The Fund’s maximum exposure under these arrangements is unknown since the amount of any future claims that may be made against the Fund cannot be determined, and the Fund has no historical basis for predicting the likelihood of any such claims.
Columbia Real Estate Equity Fund | Annual Report 2022
| 21 |
Notes to Financial Statements (continued)
December 31, 2022
Recent accounting pronouncement
Tailored Shareholder Reports
In October 2022, the Securities and Exchange Commission (SEC) adopted a final rule relating to Tailored Shareholder Reports for Mutual Funds and Exchange-Traded Funds; Fee Information in Investment Company Advertisements. The rule and form amendments will, among other things, require the Fund to transmit concise and visually engaging shareholder reports that highlight key information. The amendments will require that funds tag information in a structured data format and that certain more in-depth information be made available online and available for delivery free of charge to investors on request. The amendments became effective January 24, 2023. There is an 18-month transition period after the effective date of the amendment.
Note 3. Fees and other transactions with affiliates
Management services fees
The Fund has entered into a Management Agreement with Columbia Management Investment Advisers, LLC (the Investment Manager), a wholly-owned subsidiary of Ameriprise Financial, Inc. (Ameriprise Financial). Under the Management Agreement, the Investment Manager provides the Fund with investment research and advice, as well as administrative and accounting services. The management services fee is an annual fee that is equal to a percentage of the Fund’s daily net assets that declines from 0.75% to 0.66% as the Fund’s net assets increase. The effective management services fee rate for the year ended December 31, 2022 was 0.75% of the Fund’s average daily net assets.
Compensation of board members
Members of the Board of Trustees who are not officers or employees of the Investment Manager or Ameriprise Financial are compensated for their services to the Fund as disclosed in the Statement of Operations. Under a Deferred Compensation Plan (the Deferred Plan), these members of the Board of Trustees may elect to defer payment of up to 100% of their compensation. Deferred amounts are treated as though equivalent dollar amounts had been invested in shares of certain funds managed by the Investment Manager. The Fund’s liability for these amounts is adjusted for market value changes and remains in the Fund until distributed in accordance with the Deferred Plan. All amounts payable under the Deferred Plan constitute a general unsecured obligation of the Fund. The expense for the Deferred Plan, which includes Trustees’ fees deferred during the current period as well as any gains or losses on the Trustees’ deferred compensation balances as a result of market fluctuations, is included in "Compensation of board members" in the Statement of Operations.
Compensation of Chief Compliance Officer
The Board of Trustees has appointed a Chief Compliance Officer for the Fund in accordance with federal securities regulations. As disclosed in the Statement of Operations, a portion of the Chief Compliance Officer’s total compensation is allocated to the Fund, along with other allocations to affiliated registered investment companies managed by the Investment Manager and its affiliates, based on relative net assets.
Transfer agency fees
Under a Transfer and Dividend Disbursing Agent Agreement, Columbia Management Investment Services Corp. (the Transfer Agent), an affiliate of the Investment Manager and a wholly-owned subsidiary of Ameriprise Financial, is responsible for providing transfer agency services to the Fund. The Transfer Agent has contracted with SS&C GIDS, Inc. (SS&C GIDS) to serve as sub-transfer agent. Prior to January 1, 2023, SS&C GIDS was known as DST Asset Manager Solutions, Inc. The Transfer Agent pays the fees of SS&C GIDS for services as sub-transfer agent and SS&C GIDS is not entitled to reimbursement for such fees from the Fund (with the exception of out-of-pocket fees).
The Fund pays the Transfer Agent a monthly transfer agency fee based on the number or the average value of accounts, depending on the type of account. In addition, the Fund pays the Transfer Agent a fee for shareholder services based on the number of accounts or on a percentage of the average aggregate value of the Fund’s shares maintained in omnibus accounts up to the lesser of the amount charged by the financial intermediary or a cap established by the Board of Trustees from time to time.
| 22 | Columbia Real Estate Equity Fund | Annual Report 2022 |
Notes to Financial Statements (continued)
December 31, 2022
The Transfer Agent also receives compensation from the Fund for various shareholder services and reimbursements for certain out-of-pocket fees. Total transfer agency fees for Institutional 2 Class and Institutional 3 Class shares are subject to an annual limitation of not more than 0.07% and 0.02%, respectively, of the average daily net assets attributable to each share class.
For the year ended December 31, 2022, the Fund’s effective transfer agency fee rates as a percentage of average daily net assets of each class were as follows:
| | Effective rate (%) |
| Class A | 0.18 |
| Advisor Class | 0.18 |
| Class C | 0.18 |
| Institutional Class | 0.18 |
| Institutional 2 Class | 0.07 |
| Institutional 3 Class | 0.01 |
| Class R | 0.18 |
An annual minimum account balance fee of $20 may apply to certain accounts with a value below the applicable share class’s initial minimum investment requirements to reduce the impact of small accounts on transfer agency fees. These minimum account balance fees are remitted to the Fund and recorded as part of expense reductions in the Statement of Operations. For the year ended December 31, 2022, these minimum account balance fees reduced total expenses of the Fund by $788.
Distribution and service fees
The Fund has entered into an agreement with Columbia Management Investment Distributors, Inc. (the Distributor), an affiliate of the Investment Manager and a wholly-owned subsidiary of Ameriprise Financial, for distribution and shareholder services. The Board of Trustees has approved, and the Fund has adopted, distribution and shareholder service plans (the Plans) applicable to certain share classes, which set the distribution and service fees for the Fund. These fees are calculated daily and are intended to compensate the Distributor and/or eligible selling and/or servicing agents for selling shares of the Fund and providing services to investors.
Under the Plans, the Fund pays a monthly service fee to the Distributor at the maximum annual rate of 0.25% of the average daily net assets attributable to Class A and Class C shares of the Fund. Also under the Plans, the Fund pays a monthly distribution fee to the Distributor at the maximum annual rates of 0.10%, 0.75% and 0.50% of the average daily net assets attributable to Class A, Class C and Class R shares of the Fund, respectively.
Although the Fund may pay distribution and service fees up to a maximum annual rate of 0.35% of the Fund’s average daily net assets attributable to Class A shares (comprised of up to 0.10% for distribution services and up to 0.25% for shareholder services), the Fund currently limits such fees to an aggregate fee of not more than 0.25% of the Fund’s average daily net assets attributable to Class A shares.
Sales charges (unaudited)
Sales charges, including front-end charges and contingent deferred sales charges (CDSCs), received by the Distributor for distributing Fund shares for the year ended December 31, 2022, if any, are listed below:
| | Front End (%) | CDSC (%) | Amount ($) |
| Class A | 5.75 | 0.50 - 1.00(a) | 22,900 |
| Class C | — | 1.00(b) | 343 |
| (a) | This charge is imposed on certain investments of between $1 million and $50 million redeemed within 18 months after purchase, as follows: 1.00% if redeemed within 12 months after purchase, and 0.50% if redeemed more than 12, but less than 18, months after purchase, with certain limited exceptions. |
| (b) | This charge applies to redemptions within 12 months after purchase, with certain limited exceptions. |
The Fund’s other share classes are not subject to sales charges.
Columbia Real Estate Equity Fund | Annual Report 2022
| 23 |
Notes to Financial Statements (continued)
December 31, 2022
Expenses waived/reimbursed by the Investment Manager and its affiliates
The Investment Manager and certain of its affiliates have contractually agreed to waive fees and/or reimburse expenses (excluding certain fees and expenses described below) for the period(s) disclosed below, unless sooner terminated at the sole discretion of the Board of Trustees, so that the Fund’s net operating expenses, after giving effect to fees waived/expenses reimbursed and any balance credits and/or overdraft charges from the Fund’s custodian, do not exceed the following annual rate(s) as a percentage of the classes’ average daily net assets:
| | Contractual
expense cap
May 1, 2022
through
April 30, 2023 | Voluntary
expense cap
May 1, 2022
through
June 30, 2022 | Contractual
expense cap
prior to
May 1, 2022 |
| Class A | 1.26% | 1.26% | 1.26% |
| Advisor Class | 1.01 | 1.01 | 1.01 |
| Class C | 2.01 | 2.01 | 2.01 |
| Institutional Class | 1.01 | 1.01 | 1.01 |
| Institutional 2 Class | 0.91 | 0.90 | 0.90 |
| Institutional 3 Class | 0.86 | 0.85 | 0.85 |
| Class R | 1.51 | 1.51 | 1.51 |
Under the agreement governing these fee waivers and/or expense reimbursement arrangements, the following fees and expenses are excluded from the waiver/reimbursement commitment, and therefore will be paid by the Fund, if applicable: taxes (including foreign transaction taxes), expenses associated with investments in affiliated and non-affiliated pooled investment vehicles (including mutual funds and exchange-traded funds), transaction costs and brokerage commissions, costs related to any securities lending program, dividend expenses associated with securities sold short, inverse floater program fees and expenses, transaction charges and interest on borrowed money, interest, costs associated with shareholder meetings, infrequent and/or unusual expenses and any other expenses the exclusion of which is specifically approved by the Board of Trustees. This agreement may be modified or amended only with approval from the Investment Manager, certain of its affiliates and the Fund. Any fees waived and/or expenses reimbursed under the expense reimbursement arrangements described above are not recoverable by the Investment Manager or its affiliates in future periods.
Note 4. Federal tax information
The timing and character of income and capital gain distributions are determined in accordance with income tax regulations, which may differ from GAAP because of temporary or permanent book to tax differences.
At December 31, 2022, these differences were primarily due to differing treatment for deferral/reversal of wash sale losses, post-October capital losses, trustees’ deferred compensation, distribution reclassifications and miscellaneous adjustments. To the extent these differences were permanent, reclassifications were made among the components of the Fund’s net assets. Temporary differences do not require reclassifications.
The following reclassifications were made:
Excess of distributions
over net investment
income ($) | Accumulated
net realized
(loss) ($) | Paid in
capital ($) |
| 1,288,154 | (1,288,349) | 195 |
Net investment income (loss) and net realized gains (losses), as disclosed in the Statement of Operations, and net assets were not affected by this reclassification.
| 24 | Columbia Real Estate Equity Fund | Annual Report 2022 |
Notes to Financial Statements (continued)
December 31, 2022
The tax character of distributions paid during the years indicated was as follows:
| Year Ended December 31, 2022 | Year Ended December 31, 2021 |
Ordinary
income ($) | Long-term
capital gains ($) | Total ($) | Ordinary
income ($) | Long-term
capital gains ($) | Total ($) |
| 4,518,900 | 9,777,883 | 14,296,783 | 4,879,366 | 16,321,609 | 21,200,975 |
Short-term capital gain distributions, if any, are considered ordinary income distributions for tax purposes.
At December 31, 2022, the components of distributable earnings on a tax basis were as follows:
Undistributed
ordinary income ($) | Undistributed
long-term
capital gains ($) | Capital loss
carryforwards ($) | Net unrealized
appreciation ($) |
| — | 361,141 | — | 72,134,011 |
At December 31, 2022, the cost of all investments for federal income tax purposes along with the aggregate gross unrealized appreciation and depreciation based on that cost was:
Federal
tax cost ($) | Gross unrealized
appreciation ($) | Gross unrealized
(depreciation) ($) | Net unrealized
appreciation ($) |
| 159,088,156 | 74,454,912 | (2,320,901) | 72,134,011 |
Tax cost of investments and unrealized appreciation/(depreciation) may also include timing differences that do not constitute adjustments to tax basis.
Under current tax rules, regulated investment companies can elect to treat certain late-year ordinary losses incurred and post-October capital losses (capital losses realized after October 31) as arising on the first day of the following taxable year. As of December 31, 2022, the Fund will elect to treat the following late-year ordinary losses and post-October capital losses as arising on January 1, 2023.
Late year
ordinary losses ($) | Post-October
capital losses ($) |
| — | 796,135 |
Management of the Fund has concluded that there are no significant uncertain tax positions in the Fund that would require recognition in the financial statements. However, management’s conclusion may be subject to review and adjustment at a later date based on factors including, but not limited to, new tax laws, regulations, and administrative interpretations (including relevant court decisions). Generally, the Fund’s federal tax returns for the prior three fiscal years remain subject to examination by the Internal Revenue Service.
Note 5. Portfolio information
The cost of purchases and proceeds from sales of securities, excluding short-term investments and derivatives, if any, aggregated to $78,403,879 and $93,621,167, respectively, for the year ended December 31, 2022. The amount of purchase and sale activity impacts the portfolio turnover rate reported in the Financial Highlights.
Note 6. Affiliated money market fund
The Fund invests in Columbia Short-Term Cash Fund, an affiliated money market fund established for the exclusive use by the Fund and other affiliated funds (the Affiliated MMF). The income earned by the Fund from such investments is included as Dividends - affiliated issuers in the Statement of Operations. As an investing fund, the Fund indirectly bears its proportionate share of the expenses of the Affiliated MMF. The Affiliated MMF prices its shares with a floating net asset value. In addition, the Board of Trustees of the Affiliated MMF may impose a fee on redemptions (sometimes referred to as a liquidity fee) or temporarily suspend redemptions (sometimes referred to as imposing a redemption gate) in the event its liquidity falls below regulatory limits.
Columbia Real Estate Equity Fund | Annual Report 2022
| 25 |
Notes to Financial Statements (continued)
December 31, 2022
Note 7. Interfund lending
Pursuant to an exemptive order granted by the Securities and Exchange Commission, the Fund participates in a program (the Interfund Program) allowing each participating Columbia Fund (each, a Participating Fund) to lend money directly to and, except for closed-end funds and money market funds, borrow money directly from other Participating Funds for temporary purposes. The amounts eligible for borrowing and lending under the Interfund Program are subject to certain restrictions.
Interfund loans are subject to the risk that the borrowing fund could be unable to repay the loan when due, and a delay in repayment to the lending fund could result in lost opportunities and/or additional lending costs. The exemptive order is subject to conditions intended to mitigate conflicts of interest arising from the Investment Manager’s relationship with each Participating Fund.
The Fund’s activity in the Interfund Program during the year ended December 31, 2022 was as follows:
| Borrower or lender | Average loan
balance ($) | Weighted average
interest rate (%) | Number of days
with outstanding loans |
| Borrower | 400,000 | 0.61 | 1 |
Interest expense incurred by the Fund is recorded as Interfund lending in the Statement of Operations. The Fund had no outstanding interfund loans at December 31, 2022.
Note 8. Line of credit
The Fund has access to a revolving credit facility with a syndicate of banks led by JPMorgan Chase Bank, N.A., Citibank, N.A. and Wells Fargo Bank, N.A. whereby the Fund may borrow for the temporary funding of shareholder redemptions or for other temporary or emergency purposes. Pursuant to an October 27, 2022 amendment and restatement, the credit facility, which is an agreement between the Fund and certain other funds managed by the Investment Manager or an affiliated investment manager, severally and not jointly, permits aggregate borrowings up to $950 million. Interest is currently charged to each participating fund based on its borrowings at a rate equal to the higher of (i) the federal funds effective rate, (ii) the secured overnight financing rate plus 0.10% and (iii) the overnight bank funding rate, plus in each case, 1.00%. Each borrowing under the credit facility matures no later than 60 days after the date of borrowing. The Fund also pays a commitment fee equal to its pro rata share of the unused amount of the credit facility at a rate of 0.15% per annum. The commitment fee is included in other expenses in the Statement of Operations. This agreement expires annually in October unless extended or renewed. Prior to the October 27, 2022 amendment and restatement, the Fund had access to a revolving credit facility with a syndicate of banks led by JPMorgan Chase Bank, N.A., Citibank, N.A. and Wells Fargo Bank, N.A. which permitted collective borrowings up to $950 million. Interest was charged to each participating fund based on its borrowings at a rate equal to the higher of (i) the federal funds effective rate, (ii) the secured overnight financing rate plus 0.11448% and (iii) the overnight bank funding rate, plus in each case, 1.00%.
The Fund had no borrowings during the year ended December 31, 2022.
Note 9. Significant risks
Market risk
The Fund may incur losses due to declines in the value of one or more securities in which it invests. These declines may be due to factors affecting a particular issuer, or the result of, among other things, political, regulatory, market, economic or social developments affecting the relevant market(s) more generally. In addition, turbulence in financial markets and reduced liquidity in equity, credit and/or fixed income markets may negatively affect many issuers, which could adversely affect the Fund’s ability to price or value hard-to-value assets in thinly traded and closed markets and could cause significant redemptions and operational challenges. Global economies and financial markets are increasingly interconnected, and conditions and events in one country, region or financial market may adversely impact issuers in a different country, region or financial market. These risks may be magnified if certain events or developments adversely interrupt the global supply chain; in these and other circumstances, such risks might affect companies worldwide. As a result, local, regional or global events
| 26 | Columbia Real Estate Equity Fund | Annual Report 2022 |
Notes to Financial Statements (continued)
December 31, 2022
such as terrorism, war, natural disasters, disease/virus outbreaks and epidemics or other public health issues, recessions, depressions or other events – or the potential for such events – could have a significant negative impact on global economic and market conditions.
The large-scale invasion of Ukraine by Russia in February 2022 has resulted in sanctions and market disruptions, including declines in regional and global stock markets, unusual volatility in global commodity markets and significant devaluations of Russian currency. The extent and duration of the military action are impossible to predict but could be significant. Market disruption caused by the Russian military action, and any counter-measures or responses thereto (including international sanctions, a downgrade in the country’s credit rating, purchasing and financing restrictions, boycotts, tariffs, changes in consumer or purchaser preferences, cyberattacks and espionage) could have severe adverse impacts on regional and/or global securities and commodities markets, including markets for oil and natural gas. These impacts may include reduced market liquidity, distress in credit markets, further disruption of global supply chains, increased risk of inflation, and limited access to investments in certain international markets and/or issuers. These developments and other related events could negatively impact Fund performance.
The pandemic caused by coronavirus disease 2019 and its variants (COVID-19) has resulted in, and may continue to result in, significant global economic and societal disruption and market volatility due to disruptions in market access, resource availability, facilities operations, imposition of tariffs, export controls and supply chain disruption, among others. Such disruptions may be caused, or exacerbated by, quarantines and travel restrictions, workforce displacement and loss in human and other resources. The uncertainty surrounding the magnitude, duration, reach, costs and effects of the global pandemic, as well as actions that have been or could be taken by governmental authorities or other third parties, present unknowns that are yet to unfold. The impacts, as well as the uncertainty over impacts to come, of COVID-19 – and any other infectious illness outbreaks, epidemics and pandemics that may arise in the future – could negatively affect global economies and markets in ways that cannot necessarily be foreseen. In addition, the impact of infectious illness outbreaks and epidemics in emerging market countries may be greater due to generally less established healthcare systems, governments and financial markets. Public health crises caused by the COVID-19 outbreak may exacerbate other pre-existing political, social and economic risks in certain countries or globally. The disruptions caused by COVID-19 could prevent the Fund from executing advantageous investment decisions in a timely manner and negatively impact the Fund’s ability to achieve its investment objective. Any such events could have a significant adverse impact on the value and risk profile of the Fund.
Non-diversification risk
A non-diversified fund is permitted to invest a greater percentage of its total assets in fewer issuers than a diversified fund. This increases the risk that a change in the value of any one investment held by the Fund could affect the overall value of the Fund more than it would affect that of a diversified fund holding a greater number of investments. Accordingly, the Fund’s value will likely be more volatile than the value of a more diversified fund.
Real estate sector risk
The risks associated with investments in real estate investment trusts (REITs) subject the Fund to risks similar to those of direct investments in real estate and the real estate industry in general. These include risks related to general and local economic conditions, possible lack of availability of financing and changes in interest rates or property values. The value of such investments may be affected by, among other factors, changes in the value of the underlying properties owned by the issuer, changes in the prospect for earnings and/or cash flow growth of the investment, defaults by borrowers or tenants, market saturation, decreases in market rates for rents, and other economic, political, or regulatory occurrences affecting the real estate industry, including REITs.
REITs depend upon specialized management skills, may have limited financial resources, may have less trading volume in their securities, and may be subject to more abrupt or erratic price movements than the overall securities markets. REITs are also subject to the risk of failing to qualify for favorable tax treatment. Some REITs (especially mortgage REITs) are affected by risks similar to those associated with investments in debt securities including changes in interest rates and the quality of credit extended.
Columbia Real Estate Equity Fund | Annual Report 2022
| 27 |
Notes to Financial Statements (continued)
December 31, 2022
Shareholder concentration risk
At December 31, 2022, one unaffiliated shareholder of record owned 21.4% of the outstanding shares of the Fund in one or more accounts. The Fund has no knowledge about whether any portion of those shares was owned beneficially. Affiliated shareholders of record owned 35.0% of the outstanding shares of the Fund in one or more accounts. Subscription and redemption activity by concentrated accounts may have a significant effect on the operations of the Fund. In the case of a large redemption, the Fund may be forced to sell investments at inopportune times, including its liquid positions, which may result in Fund losses and the Fund holding a higher percentage of less liquid positions. Large redemptions could result in decreased economies of scale and increased operating expenses for non-redeeming Fund shareholders.
Small- and mid-cap company risk
Investments in small- and mid-capitalization companies (small- and mid-cap companies) often involve greater risks than investments in larger, more established companies (larger companies) because small- and mid-cap companies tend to have less predictable earnings and may lack the management experience, financial resources, product diversification and competitive strengths of larger companies. Securities of small- and mid-cap companies may be less liquid and more volatile than the securities of larger companies.
Note 10. Subsequent events
Management has evaluated the events and transactions that have occurred through the date the financial statements were issued and noted no items requiring adjustment of the financial statements or additional disclosure.
Note 11. Information regarding pending and settled legal proceedings
Ameriprise Financial and certain of its affiliates are involved in the normal course of business in legal proceedings which include regulatory inquiries, arbitration and litigation, including class actions concerning matters arising in connection with the conduct of its activities as a diversified financial services firm. Ameriprise Financial believes that the Fund is not currently the subject of, and that neither Ameriprise Financial nor any of its affiliates are the subject of, any pending legal, arbitration or regulatory proceedings that are likely to have a material adverse effect on the Fund or the ability of Ameriprise Financial or its affiliates to perform under their contracts with the Fund. Ameriprise Financial is required to make quarterly (10-Q), annual (10-K) and, as necessary, 8-K filings with the Securities and Exchange Commission (SEC) on legal and regulatory matters that relate to Ameriprise Financial and its affiliates. Copies of these filings may be obtained by accessing the SEC website at www.sec.gov.
There can be no assurance that these matters, or the adverse publicity associated with them, will not result in increased Fund redemptions, reduced sale of Fund shares or other adverse consequences to the Fund. Further, although we believe proceedings are not likely to have a material adverse effect on the Fund or the ability of Ameriprise Financial or its affiliates to perform under their contracts with the Fund, these proceedings are subject to uncertainties and, as such, we are unable to estimate the possible loss or range of loss that may result. An adverse outcome in one or more of these proceedings could result in adverse judgments, settlements, fines, penalties or other relief that could have a material adverse effect on the consolidated financial condition or results of operations of Ameriprise Financial or one or more of its affiliates that provides services to the Fund.
| 28 | Columbia Real Estate Equity Fund | Annual Report 2022 |
Report of Independent Registered Public Accounting Firm
To the Board of Trustees of Columbia Funds Series Trust I and Shareholders of Columbia Real Estate Equity Fund
Opinion on the Financial Statements
We have audited the accompanying statement of assets and liabilities, including the portfolio of investments, of Columbia Real Estate Equity Fund (one of the funds constituting Columbia Funds Series Trust I, referred to hereafter as the "Fund") as of December 31, 2022, the related statement of operations for the year ended December 31, 2022, the statement of changes in net assets for each of the two years in the period ended December 31, 2022, including the related notes, and the financial highlights for each of the five years in the period ended December 31, 2022 (collectively referred to as the "financial statements"). In our opinion, the financial statements present fairly, in all material respects, the financial position of the Fund as of December 31, 2022, the results of its operations for the year then ended, the changes in its net assets for each of the two years in the period ended December 31, 2022 and the financial highlights for each of the five years in the period ended December 31, 2022 in conformity with accounting principles generally accepted in the United States of America.
Basis for Opinion
These financial statements are the responsibility of the Fund’s management. Our responsibility is to express an opinion on the Fund’s financial statements based on our audits. We are a public accounting firm registered with the Public Company Accounting Oversight Board (United States) (PCAOB) and are required to be independent with respect to the Fund in accordance with the U.S. federal securities laws and the applicable rules and regulations of the Securities and Exchange Commission and the PCAOB.
We conducted our audits of these financial statements in accordance with the standards of the PCAOB. Those standards require that we plan and perform the audit to obtain reasonable assurance about whether the financial statements are free of material misstatement, whether due to error or fraud.
Our audits included performing procedures to assess the risks of material misstatement of the financial statements, whether due to error or fraud, and performing procedures that respond to those risks. Such procedures included examining, on a test basis, evidence regarding the amounts and disclosures in the financial statements. Our audits also included evaluating the accounting principles used and significant estimates made by management, as well as evaluating the overall presentation of the financial statements. Our procedures included confirmation of securities owned as of December 31, 2022 by correspondence with the custodian and transfer agent. We believe that our audits provide a reasonable basis for our opinion.
/s/PricewaterhouseCoopers LLP
Minneapolis, Minnesota
February 22, 2023
We have served as the auditor of one or more investment companies within the Columbia Funds Complex since 1977.
Columbia Real Estate Equity Fund | Annual Report 2022
| 29 |
Federal Income Tax Information
(Unaudited)
The Fund hereby designates the following tax attributes for the fiscal year ended December 31, 2022. Shareholders will be notified in early 2023 of the amounts for use in preparing 2022 income tax returns.
Qualified
dividend
income | Dividends
received
deduction | Section
199A
dividends | Capital
gain
dividend | Section
897
dividends | Section
897
capital gain |
| 1.94% | 0.55% | 96.75% | $1,810,436 | 1.32% | 6.57% |
Qualified dividend income. For taxable, non-corporate shareholders, the percentage of ordinary income distributed during the fiscal year that represents qualified dividend income subject to reduced tax rates.
Dividends received deduction. The percentage of ordinary income distributed during the fiscal year that qualifies for the corporate dividends received deduction.
Section 199A dividends. For taxable, non-corporate shareholders, the percentage of ordinary income distributed during the fiscal year that represents Section 199A dividends potentially eligible for a 20% deduction.
Capital gain dividend. The Fund designates as a capital gain dividend the amount reflected above, or if subsequently determined to be different, the net capital gain of such fiscal period.
Section 897 dividends. For foreign shareholders, and for shareholders that are domestic (U.S.) trusts or partnerships with foreign owners, the percentage of ordinary income distributed during the fiscal year that represent Section 897 dividends.
Section 897 capital gain. For foreign shareholders, and for shareholders that are domestic (U.S.) trusts or partnerships with foreign owners, the percentage of capital gains distributed during the fiscal year that represent Section 897 capital gains.
TRUSTEES AND OFFICERS
(Unaudited)
The Board oversees the Fund’s operations and appoints officers who are responsible for day-to-day business decisions based on policies set by the Board. The following table provides basic biographical information about the Fund’s Trustees as of the printing of this report, including their principal occupations during the past five years, although specific titles for individuals may have varied over the period. The year set forth beneath Length of Service in the table below is the year in which the Trustee was first appointed or elected as Trustee to any Fund currently in the Columbia Funds Complex or a predecessor thereof. Under current Board policy, each Trustee generally serves until December 31 of the year such Trustee turns seventy-five (75).
| 30 | Columbia Real Estate Equity Fund | Annual Report 2022 |
TRUSTEES AND OFFICERS (continued)
(Unaudited)
Independent trustees
Name,
address,
year of birth | Position held
with the Columbia Funds and
length of service | Principal occupation(s)
during past five years
and other relevant
professional experience | Number of
Funds in the
Columbia Funds
Complex*
overseen | Other directorships
held by Trustee
during the past
five years |
George S. Batejan
c/o Columbia Management
Investment Advisers, LLC
290 Congress Street
Boston, MA 02210
1954 | Trustee since 2017 | Executive Vice President, Global Head of Technology and Operations, Janus Capital Group, Inc., 2010-2016 | 176 | Former Chairman of the Board, NICSA (National Investment Company Services Association) (Executive Committee, Nominating Committee and Governance Committee), 2014-2016; former Director, Intech Investment Management, 2011-2016; former Board Member, Metro Denver Chamber of Commerce, 2015-2016; former Advisory Board Member, University of Colorado Business School, 2015-2018; former Board Member, Chase Bank International, 1993-1994 |
Kathleen Blatz
c/o Columbia Management
Investment Advisers, LLC
290 Congress Street
Boston, MA 02210
1954 | Trustee since 2006 | Attorney, specializing in arbitration and mediation; Chief Justice, Minnesota Supreme Court, 1998-2006; Associate Justice, Minnesota Supreme Court, 1996-1998; Fourth Judicial District Court Judge, Hennepin County, 1994-1996; Attorney in private practice and public service, 1984-1993; State Representative, Minnesota House of Representatives, 1979-1993, which included service on the Tax and Financial Institutions and Insurance Committees; Member and Interim Chair, Minnesota Sports Facilities Authority, January-July 2017; Interim President and Chief Executive Officer, Blue Cross and Blue Shield of Minnesota (health care insurance), February-July 2018, April-October 2021 | 176 | Former Trustee, Blue Cross and Blue Shield of Minnesota, 2009-2021 (Chair of the Business Development Committee, 2014-2017; Chair of the Governance Committee, 2017-2019); former Member and Chair of the Board, Minnesota Sports Facilities Authority, January 2017-July 2017; former Director, Robina Foundation, 2009-2020 (Chair, 2014-2020); Director, Richard M. Schulze Family Foundation, since 2021 |
Pamela G. Carlton
c/o Columbia Management
Investment Advisers, LLC
290 Congress Street
Boston, MA 02210
1954 | Chair since 2023; Trustee since 2007 | President, Springboard — Partners in Cross Cultural Leadership (consulting company), since 2003; Managing Director of US Equity Research, JP Morgan Chase, 1999-2003; Director of US Equity Research, Chase Asset Management, 1996-1999; Co-Director Latin America Research, 1993-1996, COO Global Research, 1992-1996, Co-Director of US Research, 1991-1992, Investment Banker, 1982-1991, Morgan Stanley; Attorney, Cleary Gottlieb Steen & Hamilton LLP, 1980-1982 | 176 | Trustee, New York Presbyterian Hospital Board, since 1996; Director, DR Bank (Audit Committee) since 2017; Director, Evercore Inc. (Audit Committee, Nominating and Governance Committee), since 2019; Director, Apollo Commercial Real Estate Finance, Inc. (Chair, Nominating and Governance Committee), since 2021; the Governing Council of the Independent Directors Council (IDC), since 2021 |
Columbia Real Estate Equity Fund | Annual Report 2022
| 31 |
TRUSTEES AND OFFICERS (continued)
(Unaudited)
Independent trustees (continued)
Name,
address,
year of birth | Position held
with the Columbia Funds and
length of service | Principal occupation(s)
during past five years
and other relevant
professional experience | Number of
Funds in the
Columbia Funds
Complex*
overseen | Other directorships
held by Trustee
during the past
five years |
Janet Langford Carrig
c/o Columbia Management
Investment Advisers, LLC
290 Congress Street
Boston, MA 02210
1957 | Trustee since 1996 | Senior Vice President, General Counsel and Corporate Secretary, ConocoPhillips (independent energy company), September 2007-October 2018 | 174 | Director, EQT Corporation (natural gas producer), since 2019; former Director, Whiting Petroleum Corporation (independent oil and gas company), 2020-2022 |
J. Kevin Connaughton
c/o Columbia Management
Investment Advisers, LLC
290 Congress Street
Boston, MA 02210
1964 | Trustee since 2020 | CEO and President, RhodeWay Financial (non-profit financial planning firm), since December 2022; Member, FINRA National Adjudicatory Council, since January 2020; Adjunct Professor of Finance, Bentley University since January 2018; Consultant to Independent Trustees of CFVIT and CFST I from March 2016 to June 2020 with respect to CFVIT and to December 2020 with respect to CFST I; Managing Director and General Manager of Mutual Fund Products, Columbia Management Investment Advisers, LLC, May 2010-February 2015; President, Columbia Funds, 2008-2015; and senior officer of Columbia Funds and affiliated funds, 2003-2015 | 174 | Former Director, The Autism Project, March 2015-December 2021; former Member of the Investment Committee, St. Michael’s College, November 2015-February 2020; former Trustee, St. Michael’s College, June 2017-September 2019; former Trustee, New Century Portfolios, January 2015-December 2017 |
Olive M. Darragh
c/o Columbia Management
Investment Advisers, LLC
290 Congress Street
Boston, MA 02210
1962 | Trustee since 2020 | Managing Director of Darragh Inc. (strategy and talent management consulting firm), since 2010; Founder and CEO, Zolio, Inc. (investment management talent identification platform), since 2004; Consultant to Independent Trustees of CFVIT and CFST I from June 2019 to June 2020 with respect to CFVIT and to December 2020 with respect to CFST I; Partner, Tudor Investments, 2004-2010; Senior Partner, McKinsey & Company (consulting), 1990-2004; Touche Ross CPA, 1985-1988 | 174 | Treasurer, Edinburgh University US Trust Board; Member, HBS Community Action Partners Board; Former Director, University of Edinburgh Business School (Member of US Board); former Director, Boston Public Library Foundation |
Patricia M. Flynn
c/o Columbia Management
Investment Advisers, LLC
290 Congress Street
Boston, MA 02210
1950 | Trustee since 2004 | Professor of Economics and Management, Bentley University, since 2002; Dean, McCallum Graduate School of Business, Bentley University, 1992-2002 | 176 | Trustee, MA Taxpayers Foundation, since 1997-2002; Governing Board Member, MA Technology Collaborative, 2010-2020; Board of Directors, The MA Business Roundtable, 2003-2019 |
Brian J. Gallagher
c/o Columbia Management
Investment Advisers, LLC
290 Congress Street
Boston, MA 02210
1954 | Trustee since 2017 | Retired; Partner with Deloitte & Touche LLP and its predecessors, 1977-2016 | 176 | Trustee, Catholic Schools Foundation, since 2004 |
| 32 | Columbia Real Estate Equity Fund | Annual Report 2022 |
TRUSTEES AND OFFICERS (continued)
(Unaudited)
Independent trustees (continued)
Name,
address,
year of birth | Position held
with the Columbia Funds and
length of service | Principal occupation(s)
during past five years
and other relevant
professional experience | Number of
Funds in the
Columbia Funds
Complex*
overseen | Other directorships
held by Trustee
during the past
five years |
Douglas A. Hacker
c/o Columbia Management
Investment Advisers, LLC
290 Congress Street
Boston, MA 02210
1955 | Trustee since 1996 | Independent business executive, since May 2006; Executive Vice President – Strategy of United Airlines, December 2002 - May 2006; President of UAL Loyalty Services (airline marketing company), September 2001-December 2002; Executive Vice President and Chief Financial Officer of United Airlines, July 1999-September 2001 | 176 | Director, Spartan Nash Company (Chair of the Board) (food distributor); Director, Aircastle Limited (Chair of Audit Committee) (aircraft leasing); former Director, Nash Finch Company (food distributor), 2005-2013; former Director, SeaCube Container Leasing Ltd. (container leasing), 2010-2013; and former Director, Travelport Worldwide Limited (travel information technology), 2014-2019 |
Nancy T. Lukitsh
c/o Columbia Management
Investment Advisers, LLC
290 Congress Street
Boston, MA 02210
1956 | Trustee since 2011 | Senior Vice President, Partner and Director of Marketing, Wellington Management Company, LLP (investment adviser), 1997-2010; Chair, Wellington Management Portfolios (commingled non-U.S. investment pools), 2007-2010; Director, Wellington Trust Company, NA and other Wellington affiliates, 1997-2010 | 174 | None |
David M. Moffett
c/o Columbia Management
Investment Advisers, LLC
290 Congress Street
Boston, MA 02210
1952 | Trustee since 2011 | Retired; former Chief Executive Officer of Freddie Mac and Chief Financial Officer of U.S. Bank | 174 | Director, CSX Corporation (transportation suppliers); Director, PayPal Holdings Inc. (payment and data processing services); Trustee, University of Oklahoma Foundation; former Director, eBay Inc. (online trading community), 2007-2015; and former Director, CIT Bank, CIT Group Inc. (commercial and consumer finance), 2010-2016; former Advisor to Bridgewater Associates and The Carlyle Group |
Catherine James Paglia
c/o Columbia Management
Investment Advisers, LLC
290 Congress Street
Boston, MA 02210
1952 | Trustee since 2004 | Director, Enterprise Asset Management, Inc. (private real estate and asset management company), since September 1998; Managing Director and Partner, Interlaken Capital, Inc., 1989-1997; Vice President, 1982-1985, Principal, 1985-1987, Managing Director, 1987-1989, Morgan Stanley; Vice President, Investment Banking, 1980-1982, Associate, Investment Banking, 1976-1980, Dean Witter Reynolds, Inc. | 176 | Director, Valmont Industries, Inc. (irrigation systems manufacturer), since 2012; Trustee, Carleton College (on the Investment Committee); Trustee, Carnegie Endowment for International Peace (on the Investment Committee) |
Columbia Real Estate Equity Fund | Annual Report 2022
| 33 |
TRUSTEES AND OFFICERS (continued)
(Unaudited)
Independent trustees (continued)
Name,
address,
year of birth | Position held
with the Columbia Funds and
length of service | Principal occupation(s)
during past five years
and other relevant
professional experience | Number of
Funds in the
Columbia Funds
Complex*
overseen | Other directorships
held by Trustee
during the past
five years |
Natalie A. Trunow
c/o Columbia Management
Investment Advisers, LLC
290 Congress Street
Boston, MA 02210
1967 | Trustee since 2020 | Chief Executive Officer, Millennial Portfolio Solutions LLC (asset management and consulting services), January 2016-January 2021; Non-executive Member of the Investment Committee and Valuation Committee, Sarona Asset Management Inc. (private equity firm) since September 2019; Advisor, Horizon Investments (asset management and consulting services), August 2018-January 2022; Advisor, Paradigm Asset Management, November 2016-January 2022; Consultant to Independent Trustees of CFVIT and CFST I from September 2016 to June 2020 with respect to CFVIT and to December 2020 with respect to CFST I; Director of Investments/Consultant, Casey Family Programs, April 2016-November 2016; Senior Vice President and Chief Investment Officer, Calvert Investments, August 2008-January 2016; Section Head and Portfolio Manager, General Motors Asset Management, June 1997-August 2008 | 174 | Independent Director, Investment Committee, Health Services for Children with Special Needs, Inc., 2010-2021; Independent Director, (Executive Committee and Chair, Audit Committee), Consumer Credit Counseling Services (formerly Guidewell Financial Solutions), since 2016; Independent Director, (Investment Committee), Sarona Asset Management, since 2019 |
Sandra L. Yeager
c/o Columbia Management
Investment Advisers, LLC
290 Congress Street
Boston, MA 02210
1964 | Trustee since 2017 | Retired; President and founder, Hanoverian Capital, LLC (SEC registered investment advisor firm), 2008-2016; Managing Director, DuPont Capital, 2006-2008; Managing Director, Morgan Stanley Investment Management, 2004-2006; Senior Vice President, Alliance Bernstein, 1990-2004 | 176 | Former Director, NAPE Education Foundation, October 2016-October 2020; Advisory Board, Jennersville YMCA, since 2022 |
| * | The term “Columbia Funds Complex” as used herein includes Columbia Seligman Premium Technology Growth Fund, Tri-Continental Corporation and each series of Columbia Funds Series Trust (CFST), Columbia Funds Series Trust I (CFST I), Columbia Funds Series Trust II (CFST II), Columbia ETF Trust I (CET I), Columbia ETF Trust II (CET II), Columbia Funds Variable Insurance Trust (CFVIT) and Columbia Funds Variable Series Trust II (CFVST II). Messrs. Batejan, Beckman, Gallagher and Hacker and Mses. Blatz, Carlton, Carrig, Flynn, Paglia and Yeager serve as Directors of Columbia Seligman Premium Technology Growth Fund and Tri-Continental Corporation. |
Interested trustee affiliated with Investment Manager*
Name,
address,
year of birth | Position held with the Columbia Funds and length of service | Principal occupation(s) during the
past five years and other relevant
professional experience | Number of
Funds in the
Columbia Funds
Complex overseen | Other directorships
held by Trustee
during the past
five years |
Daniel J. Beckman
c/o Columbia Management
Investment Advisers, LLC
290 Congress Street
Boston, MA 02210
1962 | Trustee since November 2021 and President since June 2021 | Vice President – Head of North America Product, Columbia Management Investment Advisers, LLC, since April 2015; President and Principal Executive Officer of the Columbia Funds, since June 2021; officer of Columbia Funds and affiliated funds, 2020-2021 | 176 | Director, Ameriprise Trust Company, since October 2016; Director, Columbia Management Investment Distributors, Inc. since November 2018; Board of Governors, Columbia Wanger Asset Management, LLC since, January 2022; Director, Threadneedle Canada, since December 2022 |
| * | Interested person (as defined under the 1940 Act) by reason of being an officer, director, security holder and/or employee of the Investment Manager or Ameriprise Financial. |
| 34 | Columbia Real Estate Equity Fund | Annual Report 2022 |
TRUSTEES AND OFFICERS (continued)
(Unaudited)
The Statement of Additional Information has additional information about the Fund’s Board members and is available, without charge, upon request by calling 800.345.6611, visiting columbiathreadneedleus.com/investor/ or contacting your financial intermediary.
The Board has appointed officers who are responsible for day-to-day business decisions based on policies it has established. The officers serve at the pleasure of the Board. The following table provides basic information about the Officers of the Fund as of the printing of this report, including principal occupations during the past five years, although their specific titles may have varied over the period. In addition to Mr. Beckman, who is President and Principal Executive Officer, the Fund’s other officers are:
Fund officers
Name,
address and
year of birth | Position and year
first appointed to
position for any Fund
in the Columbia
Funds Complex or a
predecessor thereof | Principal occupation(s) during past five years |
Michael G. Clarke
290 Congress Street
Boston, MA 02210
1969 | Chief Financial Officer and Principal Financial Officer (2009) and Senior Vice President (2019) | Senior Vice President and Head of Global Operations & Investor Services, Columbia Management Investment Advisers, LLC, since March 2022 (previously Vice President, Head of North American Operations, and Co-Head of Global Operations, June 2019 to February 2022 and Vice President – Accounting and Tax, May 2010 - May 2019); senior officer of Columbia Funds and affiliated funds, since 2002. |
Joseph Beranek
5890 Ameriprise Financial Center
Minneapolis, MN 55474
1965 | Treasurer and Chief Accounting Officer (Principal Accounting Officer) (2019) and Principal Financial Officer (2020), CFST, CFST I, CFST II, CFVIT and CFVST II; Assistant Treasurer, CET I and CET II | Vice President – Mutual Fund Accounting and Financial Reporting, Columbia Management Investment Advisers, LLC, since December 2018 and March 2017, respectively. |
Marybeth Pilat
290 Congress Street
Boston, MA 02210
1968 | Treasurer and Chief Accounting Officer (Principal Accounting Officer) and Principal Financial Officer (2020) for CET I and CET II; Assistant Treasurer, CFST, CFST I, CFST II, CFVIT and CFVST II | Vice President – Product Pricing and Administration, Columbia Management Investment Advisers, LLC, since May 2017. |
William F. Truscott
290 Congress Street
Boston, MA 02210
1960 | Senior Vice President (2001) | Formerly, Trustee/Director of Columbia Funds Complex or legacy funds, November 2001-January 1, 2021; Chief Executive Officer, Global Asset Management, Ameriprise Financial, Inc., since September 2012; Chairman of the Board and President, Columbia Management Investment Advisers, LLC, since July 2004 and February 2012, respectively; Chairman of the Board and Chief Executive Officer, Columbia Management Investment Distributors, Inc., since November 2008 and February 2012, respectively; Chairman of the Board and Director, Threadneedle Asset Management Holdings, Sàrl, since March 2013 and December 2008, respectively; senior executive of various entities affiliated with Columbia Threadneedle. |
Christopher O. Petersen
5228 Ameriprise Financial Center
Minneapolis, MN 55474
1970 | Senior Vice President and Assistant Secretary (2021) | Formerly, Trustee/Director of funds within the Columbia Funds Complex, July 1, 2020 - November 22, 2021; Senior Vice President and Assistant General Counsel, Ameriprise Financial, Inc., since September 2021 (previously Vice President and Lead Chief Counsel, January 2015 - September 2021); formerly, President and Principal Executive Officer of the Columbia Funds, 2015 - 2021; officer of Columbia Funds and affiliated funds, since 2007. |
Thomas P. McGuire
290 Congress Street
Boston, MA 02210
1972 | Senior Vice President and Chief Compliance Officer (2012) | Vice President – Asset Management Compliance, Ameriprise Financial, Inc., since May 2010; Chief Compliance Officer, Columbia Acorn/Wanger Funds, since December 2015; formerly, Chief Compliance Officer, Ameriprise Certificate Company, September 2010 – September 2020. |
Columbia Real Estate Equity Fund | Annual Report 2022
| 35 |
TRUSTEES AND OFFICERS (continued)
(Unaudited)
Fund officers (continued)
Name,
address and
year of birth | Position and year
first appointed to
position for any Fund
in the Columbia
Funds Complex or a
predecessor thereof | Principal occupation(s) during past five years |
Ryan C. Larrenaga
290 Congress Street
Boston, MA 02210
1970 | Senior Vice President (2017), Chief Legal Officer (2017), and Secretary (2015) | Vice President and Chief Counsel, Ameriprise Financial, Inc., since August 2018 (previously Vice President and Group Counsel, August 2011 - August 2018); Chief Legal Officer, Columbia Acorn/Wanger Funds, since September 2020; officer of Columbia Funds and affiliated funds, since 2005. |
Michael E. DeFao
290 Congress Street
Boston, MA 02210
1968 | Vice President (2011) and Assistant Secretary (2010) | Vice President and Chief Counsel, Ameriprise Financial, Inc., since May 2010; Vice President, Chief Legal Officer and Assistant Secretary, Columbia Management Investment Advisers, LLC, since October 2021 (previously Vice President and Assistant Secretary, May 2010 – September 2021). |
Lyn Kephart-Strong
5228 Ameriprise Financial Center
Minneapolis, MN 55474
1960 | Vice President (2015) | Vice President, Global Investment Operations Services, Columbia Management Investment Advisers, LLC, since 2010; President, Columbia Management Investment Services Corp., since October 2014; President, Ameriprise Trust Company, since January 2017. |
| 36 | Columbia Real Estate Equity Fund | Annual Report 2022 |
[THIS PAGE INTENTIONALLY LEFT BLANK]
[THIS PAGE INTENTIONALLY LEFT BLANK]
[THIS PAGE INTENTIONALLY LEFT BLANK]
Columbia Real Estate Equity Fund
P.O. Box 219104
Kansas City, MO 64121-9104
Please read and consider the investment objectives, risks, charges and expenses for any fund carefully before investing. For a prospectus and summary prospectus, which contains this and other important information about the Fund, go to
columbiathreadneedleus.com/investor/. The Fund is distributed by Columbia Management Investment Distributors, Inc., member FINRA, and managed by Columbia Management Investment Advisers, LLC.
Columbia Threadneedle Investments (Columbia Threadneedle) is the global brand name of the Columbia and Threadneedle group of companies. All rights reserved.
© 2023 Columbia Management Investment Advisers, LLC.
columbiathreadneedleus.com/investor/
Item 2. Code of Ethics.
(a)The registrant has adopted a code of ethics that applies to the registrant's principal executive officer, principal financial officer, principal accounting officer or controller, or persons performing similar functions, regardless of whether these individuals are employed by the registrant or a third party.
(b)During the period covered by this report, there were not any amendments to a provision of the code of ethics that applies to the registrant's principal executive officer, principal financial officer, principal accounting officer or controller, or persons performing similar functions, regardless of whether these individuals are employed by the registrant or a third party, and that relates to any element of the code of ethics definition enumerated in paragraph (b) of this Item.
(c)During the period covered by this report, there were no waivers, including any implicit waivers, from a provision of the code of ethics to the registrant's principal executive officer, principal financial officer, principal accounting officer or controller, or persons performing similar functions, regardless of whether these individuals are employed by the registrant or a third party that relates to one or more of the items set forth in paragraph (b) of this Item.
Item 3. Audit Committee Financial Expert.
The registrant's Board of Trustees has determined that David M. Moffett, Brian J. Gallagher, J. Kevin Connaughton, Douglas A. Hacker and Sandra L. Yeager, each of whom are members of the registrant's Board of Trustees and Audit Committee, each qualify as an audit committee financial expert. Mr. Moffett, Mr. Gallagher, Mr. Connaughton, Mr. Hacker and Ms. Yeager are each independent trustees, as defined in paragraph (a)(2) of this item's instructions.
Item 4. Principal Accountant Fees and Services.
Fee information below is disclosed for the one series of the registrant whose reports to stockholders are included in this annual filing.
(a)Audit Fees. Aggregate Audit Fees billed by the principal accountant for professional services rendered during the fiscal years ended December 31, 2022 and December 31,
2021 are approximately as follows:
20222021
$29,500 $29,500
Audit Fees include amounts related to the audit of the registrant's annual financial statements or services that are normally provided by the accountant in connection with statutory and regulatory filings or engagements for those fiscal years.
(b)Audit-Related Fees. Aggregate Audit-Related Fees billed to the registrant by the principal accountant for professional services rendered during the fiscal years ended December 31, 2022 and December 31, 2021 are approximately as follows:
Audit-Related Fees, if any, include amounts for assurance and related services by the principal accountant that are reasonably related to the performance of the audit of the registrant's financial statements and are not reported in Audit Fees above.
During the fiscal years ended December 31, 2022 and December 31, 2021, there were no Audit-Related Fees billed by the registrant's principal accountant to the registrant's investment adviser (not including any sub-adviser whose role is primarily portfolio management and is subcontracted with or overseen by another investment adviser) and any entity controlling, controlled by, or under common control with the adviser that provides ongoing services to the registrant for an engagement that related directly to the operations and financial reporting of the registrant.
(c)Tax Fees. Aggregate Tax Fees billed by the principal accountant to the registrant for professional services rendered during the fiscal years ended December 31, 2022 and December 31, 2021 are approximately as follows:
Tax Fees include amounts for the review of annual tax returns, the review of required shareholder distribution calculations and typically include amounts for professional services by the principal accountant for tax compliance, tax advice and tax planning.
During the fiscal years ended December 31, 2022 and December 31, 2021, there were no Tax Fees billed by the registrant's principal accountant to the registrant's investment adviser (not including any sub-adviser whose role is primarily portfolio management and is subcontracted with or overseen by another investment adviser) and any entity controlling, controlled by, or under common control with the adviser that provides ongoing services to the registrant for an engagement that related directly to the operations and financial reporting of the registrant.
(d)All Other Fees. Aggregate All Other Fees billed by the principal accountant to the registrant for professional services rendered during the fiscal years ended December 31,
2022 and December 31, 2021 are approximately as follows:
All Other Fees, if any, include amounts for products and services provided by the principal accountant, other than the services reported in paragraphs (a) through (c) above.
Aggregate All Other Fees billed by the registrant's principal accountant to the registrant's investment adviser (not including any sub-adviser whose role is primarily portfolio management and is subcontracted with or overseen by another investment adviser) and any entity controlling, controlled by, or under common control with the adviser that provides ongoing services to the registrant for an engagement that related directly to the operations and financial reporting of the registrant during the fiscal years ended December 31, 2022 and December 31, 2021 are approximately as follows:
20222021
$535,000 $520,000
In fiscal years 2022 and 2021, All Other Fees primarily consists of fees billed for internal control examinations of the registrant's transfer agent and investment adviser.
(e)(1) Audit Committee Pre-Approval Policies and Procedures
The registrant's Audit Committee is required to pre-approve the engagement of the
registrant's independent auditors to provide audit and non-audit services to the registrant and non-audit services to its investment adviser (excluding any sub -adviser whose role is primarily portfolio management and is sub-contracted or overseen by another investment adviser (the "Adviser") or any entity controlling, controlled by or under common control with the Adviser that provides ongoing services to the Fund (a "Control Affiliate") if the engagement relates directly to the operations and financial reporting of the registrant.
The Audit Committee has adopted a Policy for Engagement of Independent Auditors for Audit and Non-Audit Services (the "Policy"). The Policy sets forth the understanding of the Audit Committee regarding the engagement of the registrant's independent accountants to provide (i) audit and permissible audit-related, tax and other services to the registrant ("Fund Services"); (ii) non-audit services to the registrant's Adviser and any Control Affiliates, that relates directly to the operations and financial reporting of a Fund ("Fund-related Adviser Services"); and (iii) certain other audit and non-audit services to the registrant's Adviser and its Control Affiliates. A service will require specific pre-approval by the Audit Committee if it is to be provided by the Fund's independent auditor; provided, however, that pre-approval of non-audit services to the Fund, the Adviser or Control Affiliates may be waived if certain de minimis requirements set forth in the SEC's rules are met.
Under the Policy, the Audit Committee may delegate pre-approval authority to any pre- designated member or members who are independent board members. The member(s) to whom such authority is delegated must report, for informational purposes only, any pre - approval decisions to the Audit Committee at its next regular meeting. The Audit Committee's responsibilities with respect to the pre-approval of services performed by the independent auditor may not be delegated to management.
On an annual basis, at a regularly scheduled Audit Committee meeting, the Fund's Treasurer or other Fund officer shall submit to the Audit Committee a schedule of the types of Fund Services and Fund-related Adviser Services that are subject to specific pre- approval. This schedule will provide a description of each type of service that is subject to specific pre-approval, along with total projected fees for each service. The pre- approval will generally cover a one-year period. The Audit Committee will review and approve the types of services and the projected fees for the next one-year period and may add to, or subtract from, the list of pre-approved services from time to time, based on subsequent determinations. This specific approval acknowledges that the Audit Committee is in agreement with the specific types of services that the independent auditor will be permitted to perform and the projected fees for each service.
The Fund's Treasurer or other Fund officer shall report to the Audit Committee at each of its regular meetings regarding all Fund Services or Fund-related Adviser Services provided since the last such report was rendered, including a description of the services, by category, with forecasted fees for the annual reporting period, proposed changes requiring specific pre-approval and a description of services provided by the independent auditor, by category, with actual fees during the current reporting period.
*****
(e)(2) None, or 0%, of the Audit-Related Fees, Tax Fees and All Other Fees paid by the Fund or affiliated entities relating directly to the operations and financial reporting of the Registrant disclosed above were approved by the audit committee pursuant to paragraphs (c)(7)(i)(C) of Rule 2-01 of Regulation S-X (which permits audit committee approval after the start of the engagement with respect to services other than audit, review or attest services, if certain conditions are satisfied).
(f)Not applicable.
(g)The aggregate non-audit fees billed by the registrant's accountant for services rendered to the registrant, and rendered to the registrant's investment adviser (not including any sub-adviser whose role is primarily portfolio management and is subcontracted with or overseen by another investment adviser), and any entity controlling, controlled by, or under common control with the adviser that provides ongoing services to the registrant for the fiscal years ended December 31, 2022 and December 31, 2021 are approximately as follows:
20222021
$550,600 $520,000
(h)The registrant's Audit Committee of the Board of Directors has considered whether the provision of non-audit services that were rendered to the registrant's adviser (not including any sub-adviser whose role is primarily portfolio management and is subcontracted with or overseen by another investment adviser), and any entity controlling, controlled by, or under common control with the investment adviser that provides ongoing services to the registrant that were not pre-approved pursuant to
paragraph (c)(7)(ii) of Rule 2-01 of Regulation S-X, is compatible with maintaining the principal accountant's independence.
Item 5. Audit Committee of Listed Registrants.
Not applicable.
Item 6. Investments
(a)The registrant's "Schedule I – Investments in securities of unaffiliated issuers" (as set forth in 17 CFR 210.12-12) is included in Item 1 of this Form N-CSR.
(b)Not applicable.
Item 7. Disclosure of Proxy Voting Policies and Procedures for Closed-End Management Investment Companies.
Not applicable.
Item 8. Portfolio Managers of Closed-End Management Investment Companies.
Not applicable.
Item 9. Purchases of Equity Securities by Closed-End Management Investment Company and Affiliated Purchasers.
Not applicable.
Item 10. Submission of Matters to a Vote of Security Holders.
There were no material changes to the procedures by which shareholders may recommend nominees to the registrant's board of directors.
Item 11. Controls and Procedures.
(a)The registrant's principal executive officer and principal financial officer, based on their evaluation of the registrant's disclosure controls and procedures as of a date within 90 days of the filing of this report, have concluded that such controls and procedures are adequately designed to ensure that information required to be disclosed by the registrant in Form N-CSR is accumulated and communicated to the registrant's management, including the principal executive officer and principal financial officer, or persons performing similar functions, as appropriate to allow timely decisions regarding required disclosure.
(b)There was no change in the registrant's internal control over financial reporting that occurred during the period covered by this report that has materially affected,
SIGNATURES
Pursuant to the requirements of the Securities Exchange Act of 1934 and the Investment Company Act of 1940, the registrant has duly caused this report to be signed on its behalf by the undersigned, thereunto duly authorized.
(registrant) | Columbia Funds Series Trust I |
| |
By (Signature and Title) | /s/ Daniel J. Beckman |
| Daniel J. Beckman, President and Principal Executive Officer |
| |
Date | February 22, 2023 |
| |
| |
Pursuant to the requirements of the Securities Exchange Act of 1934 and the Investment Company Act of 1940, this report has been signed below by the following persons on behalf of the registrant and in the capacities and on the dates indicated.
By (Signature and Title) | /s/ Daniel J. Beckman |
| Daniel J. Beckman, President and Principal Executive Officer |
| |
Date | February 22, 2023 |
By (Signature and Title) | /s/ Michael G. Clarke |
| Michael G. Clarke, Chief Financial Officer, |
| Principal Financial Officer and Senior Vice President |
| |
Date | February 22, 2023 |
By (Signature and Title) | /s/ Joseph Beranek |
| Joseph Beranek, Treasurer, Chief Accounting |
| Officer and Principal Financial Officer |
| |
Date | February 22, 2023 |