Exhibit (c)(6)
Goldman Sachs
DRAFT – HIGHLY CONFIDENTIAL
Project Periwinkle Discussion Materials
Goldman, Sachs & Co. April 28, 2009
Goldman Sachs
DRAFT – HIGHLY CONFIDENTIAL
Table of Contents
I. Public Market Update
II. Update on Financial Projections
III. Summary Financial Analysis
IV. Review of Potential Alternatives
V. Pro Forma Impact on Powder
Appendix A: Supplemental Materials
Goldman Sachs does not provide accounting, tax, or legal advice. Notwithstanding anything in this document to the contrary, and
except as required to enable compliance with applicable securities law, you (and each of your employees, representatives, and other
agents) may disclose to any and all persons the US federal income and state tax treatment and tax structure of the transaction and all
materials of any kind (including tax opinions and other tax analyses) that are provided to you relating to such tax treatment and tax
structure, without Goldman Sachs imposing any limitation of any kind.
Goldman Sachs
DRAFT – HIGHLY CONFIDENTIAL
Disclaimer
Goldman, Sachs & Co. (“GS”) has prepared and provided these materials and GS’s related presentation (the “Confidential Information”) solely for the
information and assistance of the Board of Directors (the "Board") and senior management of Aqua (the "Company") in connection with its
consideration of the matters referred to herein. Without GS’s prior written consent, the Confidential Information may not be circulated or referred to
publicly, disclosed to or relied upon by any other person, or used or relied upon for any other purpose. Notwithstanding anything hereinto the contrary,
the Company may disclose to any person the US federal income and state income tax treatment and tax structure of any transaction described herein
and all materials of any kind (including tax opinions and other tax analyses) that are provided to the Company relating to such tax treatment and tax
structure, without GS imposing any limitation of any kind. The Confidential Information, including this disclaimer, is subject to, and governed by, any
written agreement between the Company, the Board and/or any committee thereof, on the hand, and GS, on the other hand.
GS and its affiliates are engaged in investment banking, commercial banking and financial advisory services, securities trading, investment
management, principal investment, financial planning, benefits counseling, risk management, hedging, financing, brokerage activities and other
financial and non-financial activities and services for various persons and entities. In the ordinary course of these activities and services, GS and its
affiliates may at any time make or hold long or short positions and investments, as well as actively trade or effect transactions, in the equity, debt and
other securities (or related derivative securities) and financial instruments (including bank loans and other obligations) of third parties, the Company,
any other party to any transaction and any of their respective affiliates or any currency or commodity that may be involved in any transaction for their
own account and for the accounts of their customers.
The Confidential Information has been prepared and based on information obtained by GS from publicly available sources, the Company’s
management and/or other sources. In preparing the Confidential Information, GS has relied upon and assumed, without assuming any responsibility
for independent verification, the accuracy and completeness of all of the financial, legal, regulatory, tax, accounting and other information provided to,
discussed with or reviewed by GS, and GS does not assume any liability for any such information. GS does not provide accounting, tax, legal or
regulatory advice. GS’s role in any due diligence review is limited solely to performing such a review as it shall deem necessary to support its own
advice and analysis and shall not be on behalf of the Company. Analyses based upon forecasts of future results are not necessarily indicative of
actual future results, which may be significantly more or less favorable than suggested by these analyses, and GS does not assume responsibility if
future results are materially different from those forecast.
GS has not made an independent evaluation or appraisal of the assets and liabilities of the Company or any other person and has no obligation to
evaluate the solvency of the Company or any person under any law. The analyses in the Confidential Information are not appraisals nor do they
necessarily reflect the prices at which businesses or securities actually may be sold or purchased. The Confidential Information does not address the
underlying business decision of the Company to engage in any transaction, or the relative merits of any strategic alternative referred to herein as
compared to any other alternative that may be available to the Company. The Confidential Information is necessarily based on economic, monetary,
market and other conditions as in effect on, and the information made available to GS as of, the date of such Confidential Information and GS
assumes no responsibility for updating or revising the Confidential Information.
Goldman Sachs
DRAFT – HIGHLY CONFIDENTIAL
Public Market Update 4
I. Public Market Update
Goldman Sachs
DRAFT – HIGHLY CONFIDENTIAL
Public Market Update 5
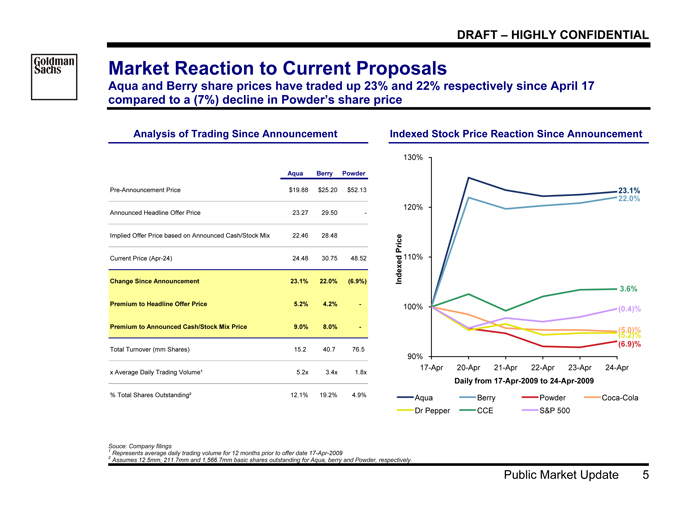
Market Reaction to Current Proposals
Aqua and Berry share prices have traded up 23% and 22% respectively since April 17
compared to a (7%) decline in Powder’s share price12
Analysis of Trading Since Announcement Indexed Stock Price Reaction Since Announcement
Aqua Berry Powder
Pre-Announcement Price $19.88 $25.20 $52.13
Announced Headline Offer Price 23.27 29.50 -
Implied Offer Price based on Announced Cash/Stock Mix 22.46 28.48
Current Price (Apr-24) 24.48 30.75 48.52
Change Since Announcement 23.1% 22.0% (6.9%)
Premium to Headline Offer Price 5.2% 4.2% -
Premium to Announced Cash/Stock Mix Price 9.0% 8.0% -
Total Turnover (mm Shares) 15.2 40.7 76.5
x Average Daily Trading Volume¹ 5.2x 3.4x 1.8x
% Total Shares Outstanding² 12.1% 19.2% 4.9%
90%
100%
110%
120%
130%
17-Apr 20-Apr 21-Apr 22-Apr 23-Apr 24-Apr
Daily from 17-Apr-2009 to 24-Apr-2009
Indexed Price Aqua Berry Powder Coca-Cola
Dr Pepper CCE S&P 500
23.1%
22.0%
(6.9)%
((55.02))%%
3.6%
(0.4)%
Source: Company filings
1 | | Represents average daily trading volume for 12 months prior to offer date 17-Apr-2009 |
2 | | Assumes 12.5mm, 211.7mm and 1,566.7mm basic shares outstanding for Aqua, berry and Powder, respectively. |
Goldman Sachs
DRAFT – HIGHLY CONFIDENTIAL
Public Market Update 6
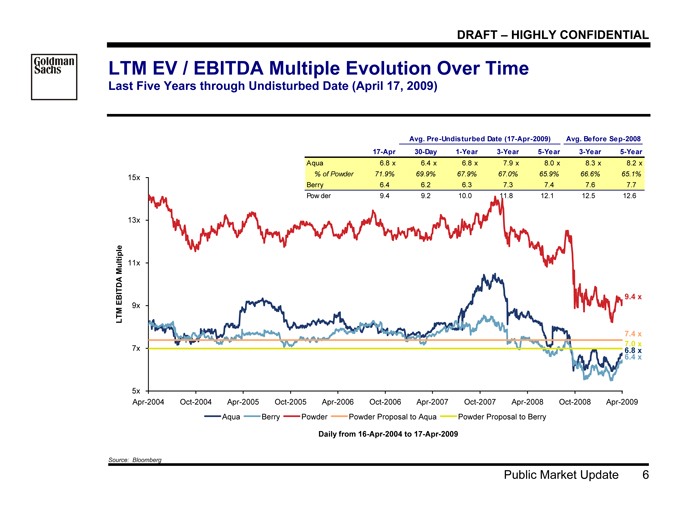
LTM EV / EBITDA Multiple Evolution Over Time
Last Five Years through Undisturbed Date (April 17, 2009)
5x
7x
9x
11x
13x
15x
Apr-2004 Oct-2004 Apr-2005 Oct-2005 Apr-2006 Oct-2006 Apr-2007 Oct-2007 Apr-2008 Oct-2008 Apr-2009
Daily from 16-Apr-2004 to 17-Apr-2009
LTM EBITDA Multiple
Aqua Berry Powder Powder Proposal to Aqua Powder Proposal to Berry
6.8 x
6.4 x
7.4 x
7.0 x
9.4 x
Avg. Pre-Undisturbed Date (17-Apr-2009) Avg. Before Sep-2008
17-Apr 30-Day 1-Year 3-Year 5-Year 3-Year 5-Year
Aqua 6.8 x 6.4 x 6.8 x 7.9 x 8.0 x 8.3 x 8.2 x
% of Powder 71.9% 69.9% 67.9% 67.0% 65.9% 66.6% 65.1%
Berry 6.4 6.2 6.3 7.3 7.4 7.6 7.7
Powder 9.4 9.2 10.0 11.8 12.1 12.5 12.6
Source: Bloomberg
Goldman Sachs
DRAFT – HIGHLY CONFIDENTIAL
Public Market Update 7
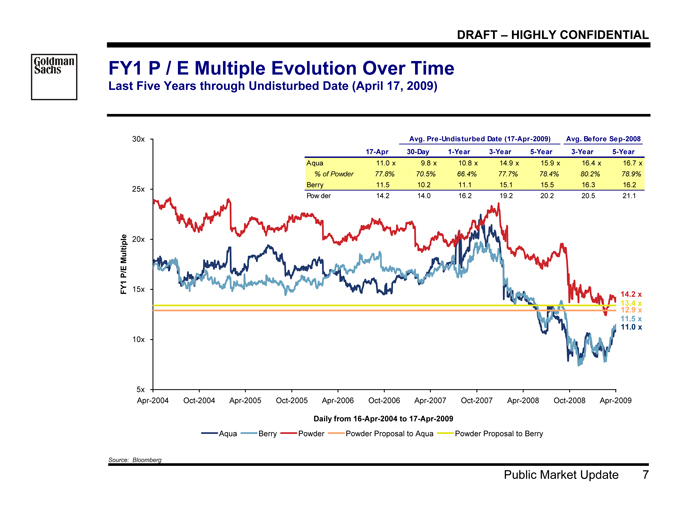
FY1 P / E Multiple Evolution Over Time
Last Five Years through Undisturbed Date (April 17, 2009)
5x
10x
15x
20x
25x
30x
Apr-2004 Oct-2004 Apr-2005 Oct-2005 Apr-2006 Oct-2006 Apr-2007 Oct-2007 Apr-2008 Oct-2008 Apr-2009
Daily from 16-Apr-2004 to 17-Apr-2009
FY1 P/E Multiple
Aqua Berry Powder Powder Proposal to Aqua Powder Proposal to Berry
11.0 x
11.5 x
14.2 x
12.9 x
13.4 x
Avg. Pre-Undisturbed Date (17-Apr-2009) Avg. Before Sep-2008
17-Apr 30-Day 1-Year 3-Year 5-Year 3-Year 5-Year
Aqua 11.0 x 9.8 x 10.8 x 14.9 x 15.9 x 16.4 x 16.7 x
% of Powder 77.8% 70.5% 66.4% 77.7% 78.4% 80.2% 78.9%
Berry 11.5 10.2 11.1 15.1 15.5 16.3 16.2
Powder 14.2 14.0 16.2 19.2 20.2 20.5 21.1
Source: Bloomberg
Goldman Sachs
DRAFT – HIGHLY CONFIDENTIAL
Public Market Update 8
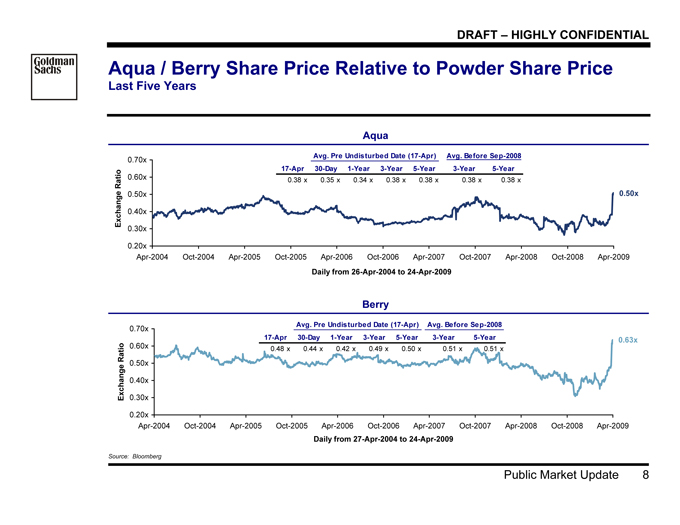
Aqua / Berry Share Price Relative to Powder Share Price
Last Five Years
Aqua
0.50x
0.20x
0.30x
0.40x
0.50x
0.60x
0.70x
Apr-2004 Oct-2004 Apr-2005 Oct-2005 Apr-2006 Oct-2006 Apr-2007 Oct-2007 Apr-2008 Oct-2008 Apr-2009
Daily from 26-Apr-2004 to 24-Apr-2009
Exchange Ratio
Avg. Pre Undisturbed Date (17-Apr) Avg. Before Sep-2008
17-Apr 30-Day 1-Year 3-Year 5-Year 3-Year 5-Year
0.38 x 0.35 x 0.34 x 0.38 x 0.38 x 0.38 x 0.38 x
Berry
0.63x
0.20x
0.30x
0.40x
0.50x
0.60x
0.70x
Apr-2004 Oct-2004 Apr-2005 Oct-2005 Apr-2006 Oct-2006 Apr-2007 Oct-2007 Apr-2008 Oct-2008 Apr-2009
Daily from 27-Apr-2004 to 24-Apr-2009
Exchange Ratio
Avg. Pre Undisturbed Date (17-Apr) Avg. Before Sep-2008
17-Apr 30-Day 1-Year 3-Year 5-Year 3-Year 5-Year
0.48 x 0.44 x 0.42 x 0.49 x 0.50 x 0.51 x 0.51 x
Source: Bloomberg
Goldman Sachs
DRAFT – HIGHLY CONFIDENTIAL
Update on Financial Projections 9
II. Update on Financial Projections
Goldman Sachs
DRAFT – HIGHLY CONFIDENTIAL
Update on Financial Projections 10
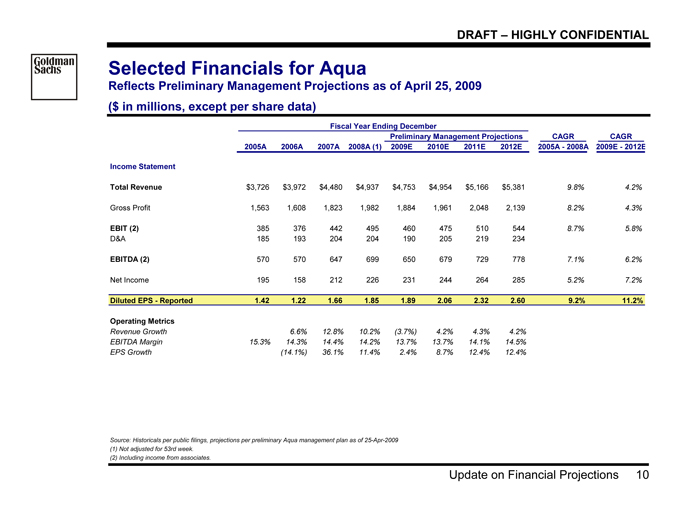
Selected Financials for Aqua
Reflects Preliminary Management Projections as of April 25, 2009
($ in millions, except per share data)
Fiscal Year Ending December
Preliminary Management Projections CAGR CAGR
2005A 2006A 2007A 2008A (1) 2009E 2010E 2011E 2012E 2005A—2008A 2009E—2012E
Income Statement
Total Revenue $3,726 $3,972 $4,480 $4,937 $4,753 $4,954 $5,166 $5,381 9.8% 4.2%
Gross Profit 1,563 1,608 1,823 1,982 1,884 1,961 2,048 2,139 8.2% 4.3%
EBIT (2) 385 376 442 495 460 475 510 544 8.7% 5.8%
D&A 185 193 204 204 190 205 219 234
EBITDA (2) 570 570 647 699 650 679 729 778 7.1% 6.2%
Net Income 195 158 212 226 231 244 264 285 5.2% 7.2%
Diluted EPS—Reported 1.42 1.22 1.66 1.85 1.89 2.06 2.32 2.60 9.2% 11.2%
Operating Metrics
Revenue Growth 6.6% 12.8% 10.2% (3.7%) 4.2% 4.3% 4.2%
EBITDA Margin 15.3% 14.3% 14.4% 14.2% 13.7% 13.7% 14.1% 14.5%
EPS Growth (14.1%) 36.1% 11.4% 2.4% 8.7% 12.4% 12.4%
Source: Historicals per public filings, projections per preliminary Aqua management plan as of 25-Apr-2009
(1) | | Not adjusted for 53rd week. |
(2) | | Including income from associates. |
Goldman Sachs
DRAFT – HIGHLY CONFIDENTIAL
Update on Financial Projections 11
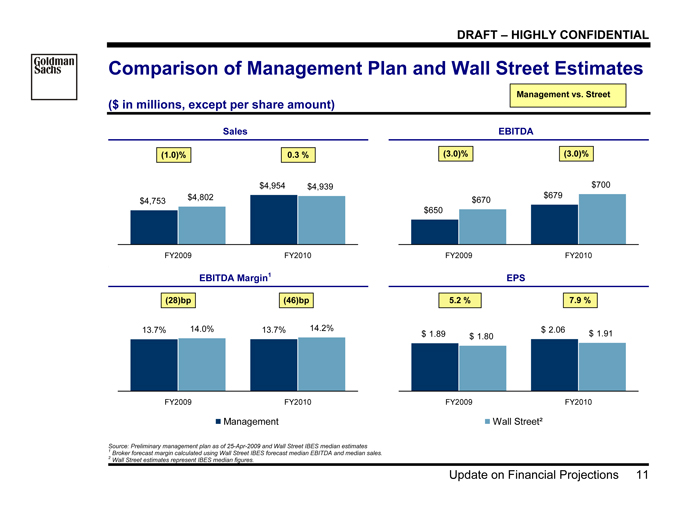
Comparison of Management Plan and Wall Street Estimates
($ in millions, except per share amount)
Sales EBITDA
$4,753
$4,954
$4,802
$4,939
FY2009 FY2010
(1.0)% 0.3 %
$650
$670 $679
$700
FY2009 FY2010
(3.0)% (3.0)%
.
EBITDA Margin1 EPS
13.7% 14.0% 13.7% 14.2%
FY2009 FY2010
(28)bp (46)bp
$ 1.89 $ 2.06
$ 1.80 $ 1.91
FY2009 FY2010
5.2 % 7.9 %
Management Wall Street²
Source: Preliminary management plan as of 25-Apr-2009 and Wall Street IBES median estimates
1 | | Broker forecast margin calculated using Wall Street IBES forecast median EBITDA and median sales. |
2 | | Wall Street estimates represent IBES median figures. |
Management vs. Street
Goldman Sachs
DRAFT – HIGHLY CONFIDENTIAL
Update on Financial Projections 12
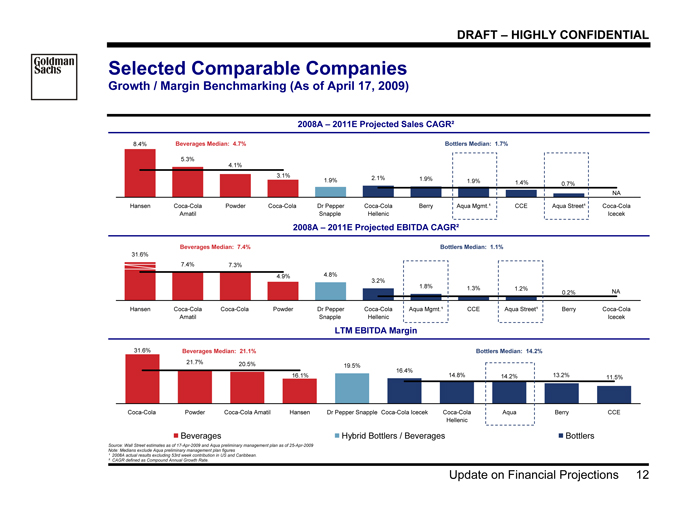
Selected Comparable Companies
Growth / Margin Benchmarking (As of April 17, 2009)
2008A – 2011E Projected Sales CAGR²
8.4%
5.3%
2.1% 1.9%
1.9% 0.7%
NA
1.4%
4.1%
3.1%
1.9%
Hansen Coca-Cola
Amatil
Powder Coca-Cola Dr Pepper
Snapple
Coca-Cola
Hellenic
Berry Aqua Mgmt.¹ CCE Aqua Street¹ Coca-Cola
Icecek
Beverages Median: 4.7% Bottlers Median: 1.7%
2008A – 2011E Projected EBITDA CAGR²
7.4% 7.3%
4.8%
3.2%
1.8% 1.3% 1.2% 0.2% NA
4.9%
31.6%
Hansen Coca-Cola
Amatil
Coca-Cola Powder Dr Pepper
Snapple
Coca-Cola
Hellenic
Aqua Mgmt.¹ CCE Aqua Street¹ Berry Coca-Cola
Icecek
Beverages Median: 7.4% Bottlers Median: 1.1%
LTM EBITDA Margin
31.6%
21.7% 20.5% 19.5%
16.4%
16.1% 14.8% 14.2% 13.2% 11.5%
Coca-Cola Powder Coca-Cola Amatil Hansen Dr Pepper Snapple Coca-Cola Icecek Coca-Cola
Hellenic
Aqua Berry CCE
Beverages Median: 21.1% Bottlers Median: 14.2%
Beverages Hybrid Bottlers / Beverages Bottlers
Source: Wall Street estimates as of 17-Apr-2009 and Aqua preliminary management plan as of 25-Apr-2009
Note: Medians exclude Aqua preliminary management plan figures
¹ 2008A actual results excluding 53rd week contribution in US and Caribbean.
² CAGR defined as Compound Annual Growth Rate.
Goldman Sachs
DRAFT – HIGHLY CONFIDENTIAL
Summary Financial Analysis 13
III. Summary Financial Analysis
Goldman Sachs
DRAFT – HIGHLY CONFIDENTIAL
Summary Financial Analysis 14
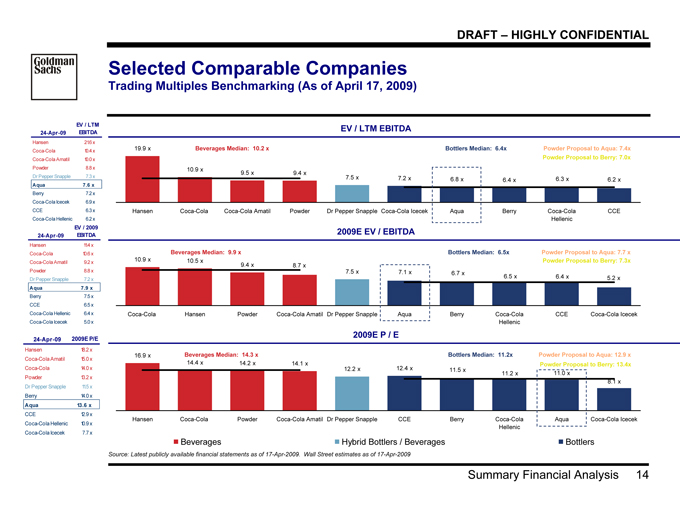
Selected Comparable Companies
Trading Multiples Benchmarking (As of April 17, 2009)
EV / LTM EBITDA
19.9 x
10.9 x 9.5 x 9.4 x
7.5 x 7.2 x 6.8 x 6.4 x 6.3 x 6.2 x
Hansen Coca-Cola Coca-Cola Amatil Powder Dr Pepper Snapple Coca-Cola Icecek Aqua Berry Coca-Cola
Hellenic
CCE
Beverages Median: 10.2 x Bottlers Median: 6.4x Powder Proposal to Aqua: 7.4x
Powder Proposal to Berry: 7.0x
2009E EV / EBITDA
10.9 x 10.5 x
9.4 x
7.5 x
5.2 x
8.7 x
7.1 x 6.7 x 6.5 x 6.4 x
Coca-Cola Hansen Powder Coca-Cola Amatil Dr Pepper Snapple Aqua Berry Coca-Cola
Hellenic
CCE Coca-Cola Icecek
Beverages Median: 9.9 x Bottlers Median: 6.5x Powder Proposal to Aqua: 7.7 x
Powder Proposal to Berry: 7.3x
2009E P / E
16.9 x
14.4 x 14.2 x 14.1 x
12.2 x 12.4 x
8.1 x
11.5 x 11.2 x 11.0 x
Hansen Coca-Cola Powder Coca-Cola Amatil Dr Pepper Snapple CCE Berry Coca-Cola
Hellenic
Aqua Coca-Cola Icecek
Beverages Median: 14.3 x Bottlers Median: 11.2x Powder Proposal to Aqua: 12.9 x
Powder Proposal to Berry: 13.4x
Beverages Hybrid Bottlers / Beverages Bottlers
Source: Latest publicly available financial statements as of 17-Apr-2009. Wall Street estimates as of 17-Apr-2009
24-Apr-09
EV / LTM
EBITDA
Hansen 21.6 x
Coca-Cola 10.4 x
Coca-Cola Amatil 10.0 x
Powder 8.8 x
Dr Pepper Snapple 7.3 x
Aqua 7.6 x
Berry 7.2 x
Coca-Cola Icecek 6.9 x
CCE 6.3 x
Coca-Cola Hellenic 6.2 x
24-Apr-09
EV / 2009
EBITDA
Hansen 11.4 x
Coca-Cola 10.6 x
Coca-Cola Amatil 9.2 x
Powder 8.8 x
Dr Pepper Snapple 7.2 x
Aqua 7.9 x
Berry 7.5 x
CCE 6.5 x
Coca-Cola Hellenic 6.4 x
Coca-Cola Icecek 5.0 x
24-Apr-09 2009E P/E
Hansen 18.2 x
Coca-Cola Amatil 15.0 x
Coca-Cola 14.0 x
Powder 13.2 x
Dr Pepper Snapple 11.5 x
Berry 14.0 x
Aqua 13.6 x
CCE 12.9 x
Coca-Cola Hellenic 10.9 x
Coca-Cola Icecek 7.7 x
Goldman Sachs
DRAFT – HIGHLY CONFIDENTIAL
Summary Financial Analysis 15
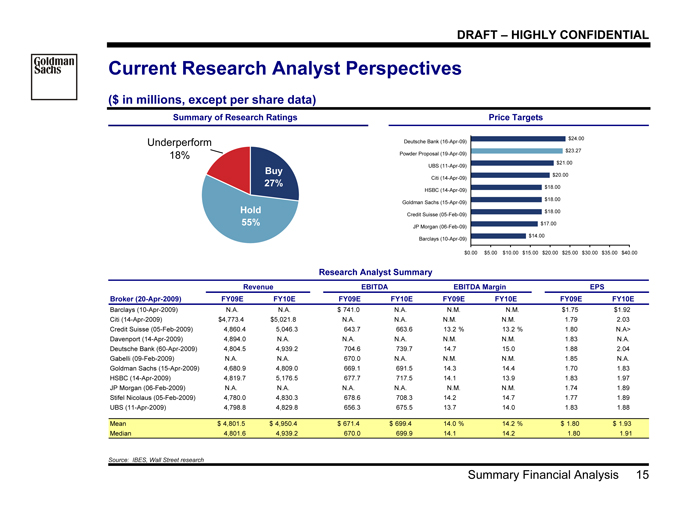
Current Research Analyst Perspectives
($ in millions, except per share data)
Summary of Research Ratings Price Targets
$14.00
$17.00
$18.00
$18.00
$18.00
$20.00
$21.00
$23.27
$24.00
$0.00 $5.00 $10.00 $15.00 $20.00 $25.00 $30.00 $35.00 $40.00
Barclays (10-Apr-09)
JP Morgan (06-Feb-09)
Credit Suisse (05-Feb-09)
Goldman Sachs (15-Apr-09)
HSBC (14-Apr-09)
Citi (14-Apr-09)
UBS (11-Apr-09)
Powder Proposal (19-Apr-09)
Deutsche Bank (16-Apr-09)
Research Analyst Summary
Revenue EBITDA EBITDA Margin EPS
Broker (20-Apr-2009) FY09E FY10E FY09E FY10E FY09E FY10E FY09E FY10E
Barclays (10-Apr-2009) N.A. N.A. $ 741.0 N.A. N.M. N.M. $1.75 $1.92
Citi (14-Apr-2009) $4,773.4 $5,021.8 N.A. N.A. N.M. N.M. 1.79 2.03
Credit Suisse (05-Feb-2009) 4,860.4 5,046.3 643.7 663.6 13.2 % 13.2 % 1.80 N.A>
Davenport (14-Apr-2009) 4,894.0 N.A. N.A. N.A. N.M. N.M. 1.83 N.A.
Deutsche Bank (60-Apr-2009) 4,804.5 4,939.2 704.6 739.7 14.7 15.0 1.88 2.04
Gabelli (09-Feb-2009) N.A. N.A. 670.0 N.A. N.M. N.M. 1.85 N.A.
Goldman Sachs (15-Apr-2009) 4,680.9 4,809.0 669.1 691.5 14.3 14.4 1.70 1.83
HSBC (14-Apr-2009) 4,819.7 5,176.5 677.7 717.5 14.1 13.9 1.83 1.97
JP Morgan (06-Feb-2009) N.A. N.A. N.A. N.A. N.M. N.M. 1.74 1.89
Stifel Nicolaus (05-Feb-2009) 4,780.0 4,830.3 678.6 708.3 14.2 14.7 1.77 1.89
UBS (11-Apr-2009) 4,798.8 4,829.8 656.3 675.5 13.7 14.0 1.83 1.88
Mean $ 4,801.5 $ 4,950.4 $ 671.4 $ 699.4 14.0 % 14.2 % $ 1.80 $ 1.93
Median 4,801.6 4,939.2 670.0 699.9 14.1 14.2 1.80 1.91
Source: IBES, Wall Street research
Buy
27%
Underperform
18%
Hold
55%
Goldman Sachs
DRAFT – HIGHLY CONFIDENTIAL
Summary Financial Analysis 16
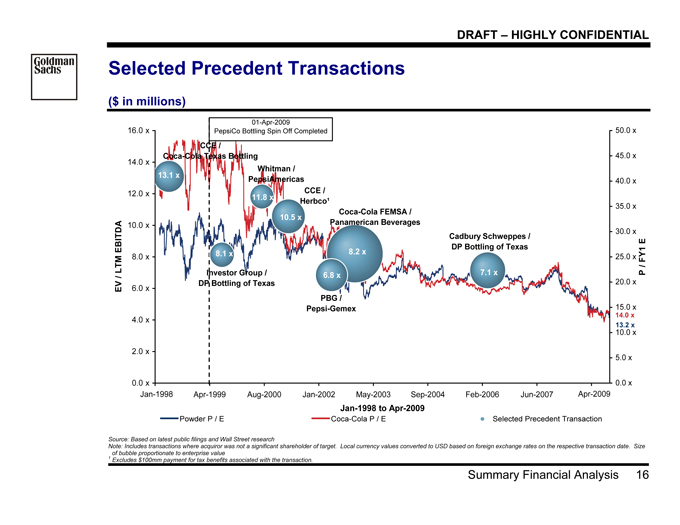
Selected Precedent Transactions
($ in millions)
13.2 x
14.0 x
01-Apr-2009
PepsiCo Bottling Spin Off Completed
Powder P / E Coca-Cola P / E Selected Precedent Transaction
Source: Based on latest public filings and Wall Street research
Note: Includes transactions where acquiror was not a significant shareholder of target. Local currency values converted to USD based on foreign exchange rates on the respective transaction date. Size
of bubble proportionate to enterprise value
1 | | Excludes $100mm payment for tax benefits associated with the transaction. |
0.0 x
2.0 x
4.0 x
6.0 x
8.0 x
10.0 x
12.0 x
14.0 x
16.0 x
Nov-1997 Apr-1999 Aug-2000 Jan-2002 May-2003 Sep-2004 Feb-2006 Jun-2007 Nov-2008
Jan-1998 to Apr-2009
EV / LTM EBITDA
0.0 x
5.0 x
10.0 x
15.0 x
20.0 x
25.0 x
30.0 x
35.0 x
40.0 x
45.0 x
50.0 x
P / FY1 E
Cadbury Schweppes /
DP Bottling of Texas
Coca-Cola FEMSA /
Panamerican Beverages
PBG /
Pepsi-Gemex
CCE /
Herbco¹
Whitman /
PepsiAmericas
Investor Group /
DP Bottling of Texas
CCE /
Coca-Cola Texas Bottling
7.1 x
8.2 x
6.8 x
10.5 x
11.8 x
8.1 x
13.1 x
Jan-1998 Apr-2009
Goldman Sachs
DRAFT – HIGHLY CONFIDENTIAL
Summary Financial Analysis 17
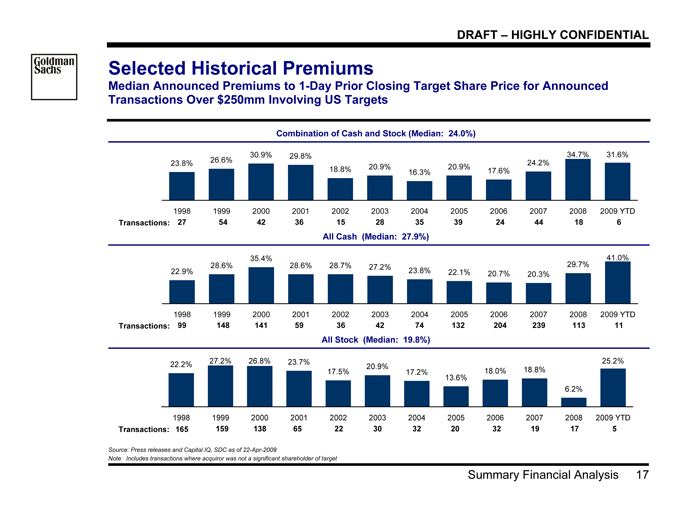
Selected Historical Premiums
Median Announced Premiums to 1-Day Prior Closing Target Share Price for Announced
Transactions Over $250mm Involving US Targets
Combination of Cash and Stock (Median: 24.0%)
23.8% 26.6%
30.9% 29.8%
18.8% 20.9%
16.3%
20.9% 17.6%
24.2%
34.7% 31.6%
1998 1999 2000 2001 2002 2003 2004 2005 2006 2007 2008 2009 YTD
Transactions: 27 54 42 36 15 28 39 24 44 35 18 6
All Cash (Median: 27.9%)
22.9%
28.6%
35.4%
28.6% 28.7% 27.2% 23.8% 22.1% 20.7% 20.3%
29.7%
41.0%
1998 1999 2000 2001 2002 2003 2004 2005 2006 2007 2008 2009 YTD
Transactions: 99 148 141 59 36 42 74 132 204 239 113 11
All Stock (Median: 19.8%)
22.2% 27.2% 26.8% 23.7%
17.5%
20.9%
17.2%
13.6%
18.0% 18.8%
6.2%
25.2%
1998 1999 2000 2001 2002 2003 2004 2005 2006 2007 2008 2009 YTD
Transactions: 165 159 138 65 22 30 32 20 32 19 17 5
Source: Press releases and Capital IQ, SDC as of 22-Apr-2009
Note: Includes transactions where acquiror was not a significant shareholder of target
Goldman Sachs
DRAFT – HIGHLY CONFIDENTIAL
Summary Financial Analysis 18
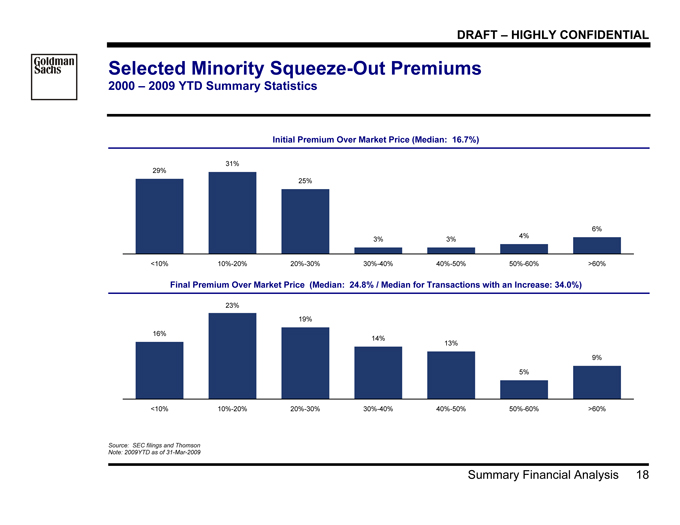
Selected Minority Squeeze-Out Premiums
2000 – 2009 YTD Summary Statistics
Initial Premium Over Market Price (Median: 16.7%)
29%
31%
25%
3% 3% 4%
6%
<10% 10%-20% 20%-30% 30%-40% 40%-50% 50%-60% >60%
Final Premium Over Market Price (Median: 24.8% / Median for Transactions with an Increase: 34.0%)
16%
23%
19%
14%
13%
5%
9%
<10% 10%-20% 20%-30% 30%-40% 40%-50% 50%-60% >60%
Source: SEC filings and Thomson
Note: 2009YTD as of 31-Mar-2009

Goldman Sachs
DRAFT – HIGHLY CONFIDENTIAL
Summary Financial Analysis 19
Illustrative Present Value of Future Share Price
Street Estimates / Preliminary Management Projections (as of April 17, 2009)
Illustrative Future Value Share Price Per Street Estimates¹ Illustrative Future Value Share Price Per Management Plan
$19.88
$17.19 $18.54
$19.37
$21.09 $22.75 $23.78
$24.83 $26.78 $27.99
$30.90 $32.29
$28.65
Current 2009YE 2010YE 2011YE
$23.41
$20.84
$18.54
$19.88
$22.75
$25.57 $28.73
$30.10 $33.82
$26.78
$30.90
$34.73 $39.02
Current 2009YE 2010YE 2011YE
PV of Future Share Price per Street Estimates² (Discounted @10.5%) PV of Future Share Price per Mgmt. Plan² (Discounted @10.5%)
$26.13
$16.23
$16.49 $16.63
$19.88 $19.60
$20.15 $20.19
$23.64
$22.83
$23.60
$27.22 $27.09
Current 2009YE 2010YE 2011YE
$19.88
$17.74 $18.54
$19.30
$21.68 $22.54 $23.37
$26.38 $27.27
$25.45
$29.30 $30.30 $31.26
Current 2009YE 2010YE 2011YE
9.0x 11.0x 13.0x 15.0x
Source: IBES and Aqua preliminary management plan as of 25-Apr-2009
1 Assumes IBES median estimates for 2009E, 2010E and 2011E. 2012E estimate based on 4.5% IBES median long term growth rate.
2 Present values discount future values at 10.5% cost of equity and include dividends. Present values discounted to 1-May-2009.
Goldman Sachs
DRAFT – HIGHLY CONFIDENTIAL
Summary Financial Analysis 20
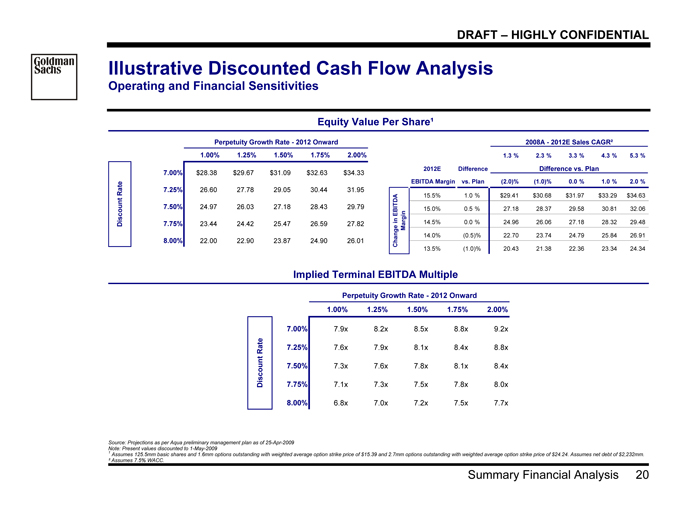
Illustrative Discounted Cash Flow Analysis
Operating and Financial Sensitivities
Equity Value Per Share¹
Perpetuity Growth Rate—2012 Onward
1.00% 1.25% 1.50% 1.75% 2.00%
7.00% $28.38 $29.67 $31.09 $32.63 $34.33
7.25% 26.60 27.78 29.05 30.44 31.95
7.50% 24.97 26.03 27.18 28.43 29.79
7.75% 23.44 24.42 25.47 26.59 27.82
8.00% 22.00 22.90 23.87 24.90 26.01
Discount Rate
2008A—2012E Sales CAGR²
1.3 % 2.3 % 3.3 % 4.3 % 5.3 %
2012E Difference Difference vs. Plan
EBITDA Margin vs. Plan (2.0)% (1.0)% 0.0 % 1.0 % 2.0 %
15.5% 1.0 % $29.41 $30.68 $31.97 $33.29 $34.63
15.0% 0.5 % 27.18 28.37 29.58 30.81 3 2.06
14.5% 0.0 % 24.96 26.06 27.18 28.32 2 9.48
14.0% (0.5)% 22.70 23.74 24.79 25.84 2 6.91
13.5% (1.0)% 20.43 21.38 22.36 23.34 2 4.34
Change in EBITDA
Margin
Implied Terminal EBITDA Multiple
Perpetuity Growth Rate—2012 Onward
1.00% 1.25% 1.50% 1.75% 2.00%
7.00% 7.9x 8.2x 8.5x 8.8x 9.2x
7.25% 7.6x 7.9x 8.1x 8.4x 8.8x
7.50% 7.3x 7.6x 7.8x 8.1x 8.4x
7.75% 7.1x 7.3x 7.5x 7.8x 8.0x
8.00% 6.8x 7.0x 7.2x 7.5x 7.7x
Discount Rate
Source: Projections as per Aqua preliminary management plan as of 25-Apr-2009
Note: Present values discounted to 1-May-2009
1 Assumes 125.5mm basic shares and 1.6mm options outstanding with weighted average option strike price of $15.39 and 2.7mm options outstanding with weighted average option strike price of $24.24. Assumes net debt of $2,232mm.
² Assumes 7.5% WACC.

Goldman Sachs
DRAFT – HIGHLY CONFIDENTIAL
Review of Potential Alternatives 21
IV. Review of Potential Alternatives
Goldman Sachs
DRAFT – HIGHLY CONFIDENTIAL
Review of Potential Alternatives 22
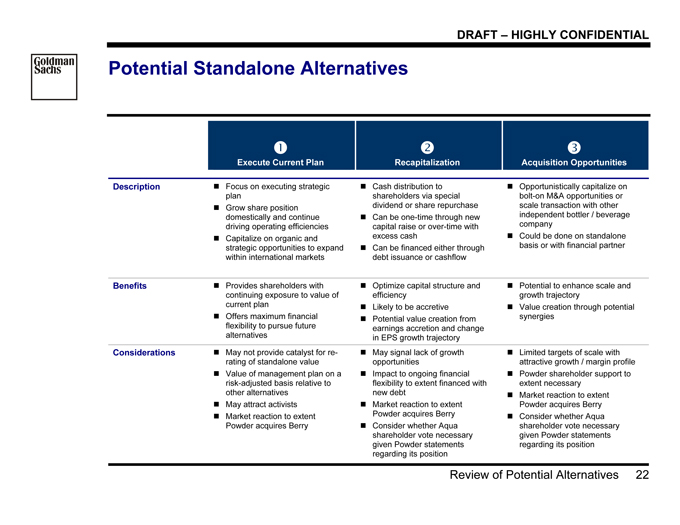
Potential Standalone Alternatives
?
Execute Current Plan
?
Recapitalization
?
Acquisition Opportunities
Description ? Focus on executing strategic
plan
? Grow share position
domestically and continue
driving operating efficiencies
? Capitalize on organic and
strategic opportunities to expand
within international markets
? Cash distribution to
shareholders via special
dividend or share repurchase
? Can be one-time through new
capital raise or over-time with
excess cash
? Can be financed either through
debt issuance or cashflow
? Opportunistically capitalize on
bolt-on M&A opportunities or
scale transaction with other
independent bottler / beverage
company
? Could be done on standalone
basis or with financial partner
Benefits ? Provides shareholders with
continuing exposure to value of
current plan
? Offers maximum financial
flexibility to pursue future
alternatives
? Optimize capital structure and
efficiency
? Likely to be accretive
? Potential value creation from
earnings accretion and change
in EPS growth trajectory
? Potential to enhance scale and
growth trajectory
? Value creation through potential
synergies
Considerations ? May not provide catalyst for rerating
of standalone value
? Value of management plan on a
risk-adjusted basis relative to
other alternatives
? May attract activists
? Market reaction to extent
Powder acquires Berry
? May signal lack of growth
opportunities
? Impact to ongoing financial
flexibility to extent financed with
new debt
? Market reaction to extent
Powder acquires Berry
? Consider whether Aqua
shareholder vote necessary
given Powder statements
regarding its position
? Limited targets of scale with
attractive growth / margin profile
? Powder shareholder support to
extent necessary
? Market reaction to extent
Powder acquires Berry
? Consider whether Aqua
shareholder vote necessary
given Powder statements
regarding its position
Goldman Sachs
DRAFT – HIGHLY CONFIDENTIAL
Review of Potential Alternatives 23
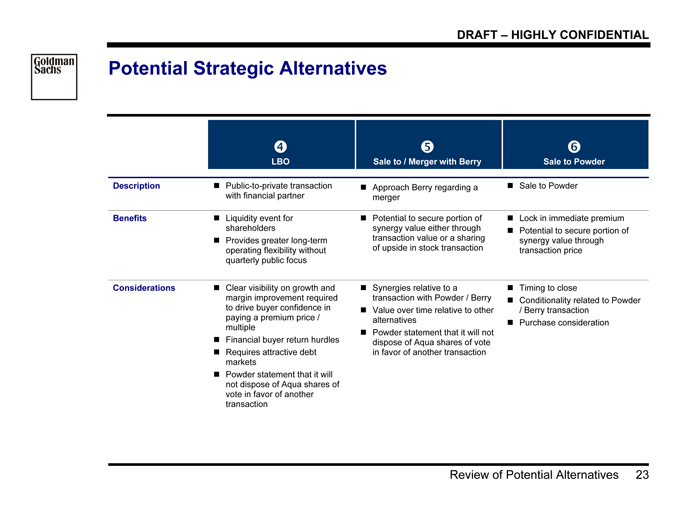
Potential Strategic Alternatives
?
LBO
?
Sale to / Merger with Berry
?
Sale to Powder
Description ? Public-to-private transaction
with financial partner
? Approach Berry regarding a
merger
? Sale to Powder
Benefits ? Liquidity event for
shareholders
? Provides greater long-term
operating flexibility without
quarterly public focus
? Potential to secure portion of
synergy value either through
transaction value or a sharing
of upside in stock transaction
? Lock in immediate premium
? Potential to secure portion of
synergy value through
transaction price
Considerations ? Clear visibility on growth and
margin improvement required
to drive buyer confidence in
paying a premium price /
multiple
? Financial buyer return hurdles
? Requires attractive debt
markets
? Powder statement that it will
not dispose of Aqua shares of
vote in favor of another
transaction
? Synergies relative to a
transaction with Powder / Berry
? Value over time relative to other
alternatives
? Powder statement that it will not
dispose of Aqua shares of vote
in favor of another transaction
? Timing to close
? Conditionality related to Powder
/ Berry transaction
? Purchase consideration
Goldman Sachs
DRAFT – HIGHLY CONFIDENTIAL
Review of Potential Alternatives 24
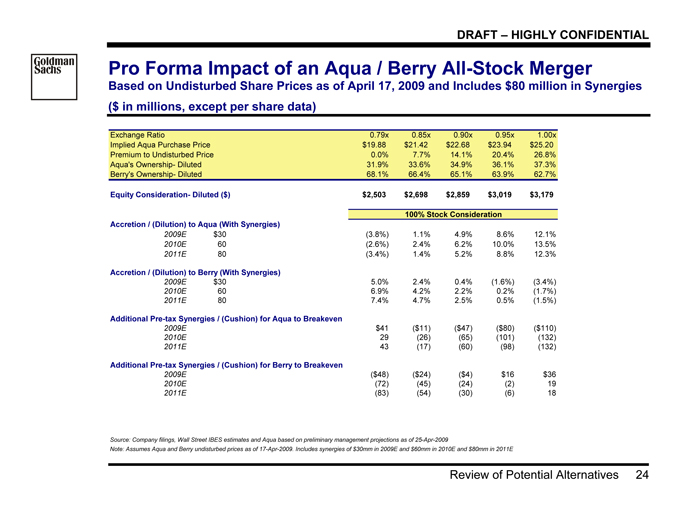
Pro Forma Impact of an Aqua / Berry All-Stock Merger
Based on Undisturbed Share Prices as of April 17, 2009 and Includes $80 million in Synergies
($ in millions, except per share data)
Exchange Ratio 0.79x 0.85x 0.90x 0.95x 1.00x
Implied Aqua Purchase Price $19.88 $21.42 $22.68 $23.94 $25.20
Premium to Undisturbed Price 0.0% 7.7% 14.1% 20.4% 26.8%
Aqua's Ownership- Diluted 31.9% 33.6% 34.9% 36.1% 37.3%
Berry's Ownership- Diluted 68.1% 66.4% 65.1% 63.9% 62.7%
Equity Consideration- Diluted ($) $2,503 $2,698 $2,859 $3,019 $3,179
100% Stock Consideration
Accretion / (Dilution) to Aqua (With Synergies)
2009E $30 (3.8%) 1.1% 4.9% 8.6% 12.1%
2010E 60 (2.6%) 2.4% 6.2% 10.0% 13.5%
2011E 80 (3.4%) 1.4% 5.2% 8.8% 12.3%
Accretion / (Dilution) to Berry (With Synergies)
2009E $30 5.0% 2.4% 0.4% (1.6%) (3.4%)
2010E 60 6.9% 4.2% 2.2% 0.2% (1.7%)
2011E 80 7.4% 4.7% 2.5% 0.5% (1.5%)
Additional Pre-tax Synergies / (Cushion) for Aqua to Breakeven
2009E $41 ($11) ($47) ($80) ($110)
2010E 29 (26) (65) (101) (132)
2011E 43 (17) (60) (98) (132)
Additional Pre-tax Synergies / (Cushion) for Berry to Breakeven
2009E ($48) ($24) ($4) $16 $36
2010E (72) (45) (24) (2) 19
2011E (83) (54) (30) (6) 18
Source: Company filings, Wall Street IBES estimates and Aqua based on preliminary management projections as of 25-Apr-2009
Note: Assumes Aqua and Berry undisturbed prices as of 17-Apr-2009. Includes synergies of $30mm in 2009E and $60mm in 2010E and $80mm in 2011E
Goldman Sachs
DRAFT – HIGHLY CONFIDENTIAL
Review of Potential Alternatives 25
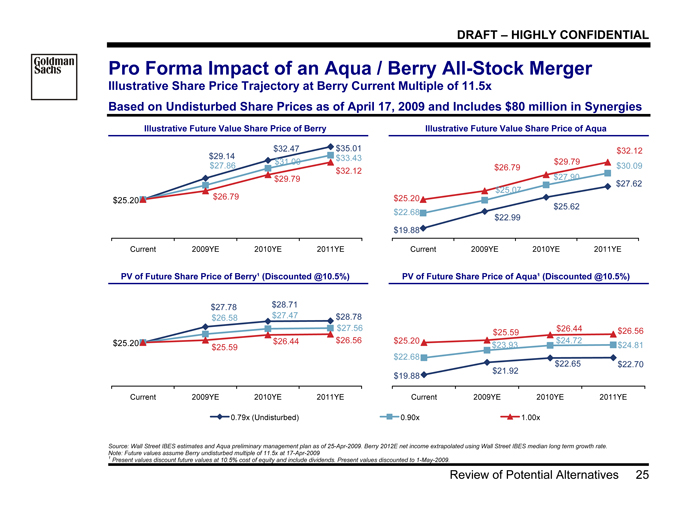
Pro Forma Impact of an Aqua / Berry All-Stock Merger
Illustrative Share Price Trajectory at Berry Current Multiple of 11.5x
Based on Undisturbed Share Prices as of April 17, 2009 and Includes $80 million in Synergies
Illustrative Future Value Share Price of Berry Illustrative Future Value Share Price of Aqua
$25.20
$29.14
$32.47 $35.01
$27.86 $31.00 $33.43
$26.79
$29.79
$32.12
Current 2009YE 2010YE 2011YE
$27.62
$25.62
$22.99
$19.88
$22.68
$25.07
$27.90
$30.09
$25.20
$32.12
$29.79
$26.79
Current 2009YE 2010YE 2011YE
PV of Future Share Price of Berry¹ (Discounted @10.5%) PV of Future Share Price of Aqua¹ (Discounted @10.5%)
$27.56
$28.78
$27.78 $28.71
$25.20
$26.58 $27.47
$25.59
$26.44 $26.56
Current 2009YE 2010YE 2011YE
$22.70
$21.92
$22.65
$19.88
$22.68
$23.93 $24.72 $24.81
$26.44 $26.56
$25.20
$25.59
Current 2009YE 2010YE 2011YE
0.79x (Undisturbed) 0.90x 1.00x
Source: Wall Street IBES estimates and Aqua preliminary management plan as of 25-Apr-2009. Berry 2012E net income extrapolated using Wall Street IBES median long term growth rate.
Note: Future values assume Berry undisturbed multiple of 11.5x at 17-Apr-2009
1 Present values discount future values at 10.5% cost of equity and include dividends. Present values discounted to 1-May-2009.
Goldman Sachs
DRAFT – HIGHLY CONFIDENTIAL
Review of Potential Alternatives 26
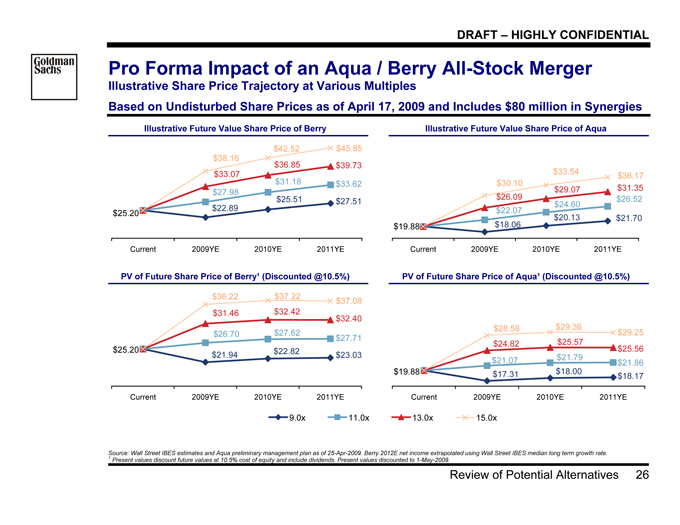
Pro Forma Impact of an Aqua / Berry All-Stock Merger
Illustrative Share Price Trajectory at Various Multiples
Based on Undisturbed Share Prices as of April 17, 2009 and Includes $80 million in Synergies
Illustrative Future Value Share Price of Berry Illustrative Future Value Share Price of Aqua
$45.85
$22.89
$25.51 $27.51
$31.18 $33.62
$27.98
$25.20
$33.07
$36.85 $39.73
$42.52
$38.16
Current 2009YE 2010YE 2011YE
$19.88 $18.06
$20.13 $21.70
$24.60 $26.52
$22.07
$26.09
$29.07 $31.35
$33.54 $36.17
$30.10
Current 2009YE 2010YE 2011YE
PV of Future Share Price of Berry¹ (Discounted @10.5%) PV of Future Share Price of Aqua¹ (Discounted @10.5%)
$37.08
$25.20 $21.94 $22.82 $23.03
$26.70 $27.62 $27.71
$31.46 $32.42
$32.40
$36.22 $37.22
Current 2009YE 2010YE 2011YE
$29.25
$19.88 $17.31 $18.00 $18.17
$21.07 $21.79 $21.86
$24.82 $25.57
$25.56
$28.58 $29.36
Current 2009YE 2010YE 2011YE
9.0x 11.0x 13.0x 15.0x
Source: Wall Street IBES estimates and Aqua preliminary management plan as of 25-Apr-2009. Berry 2012E net income extrapolated using Wall Street IBES median long term growth rate.
1 Present values discount future values at 10.5% cost of equity and include dividends. Present values discounted to 1-May-2009.
Goldman Sachs
DRAFT – HIGHLY CONFIDENTIAL
Pro Forma Impact on Powder 27
V. Pro Forma Impact on Powder
Goldman Sachs
DRAFT – HIGHLY CONFIDENTIAL
Pro Forma Impact on Powder 28
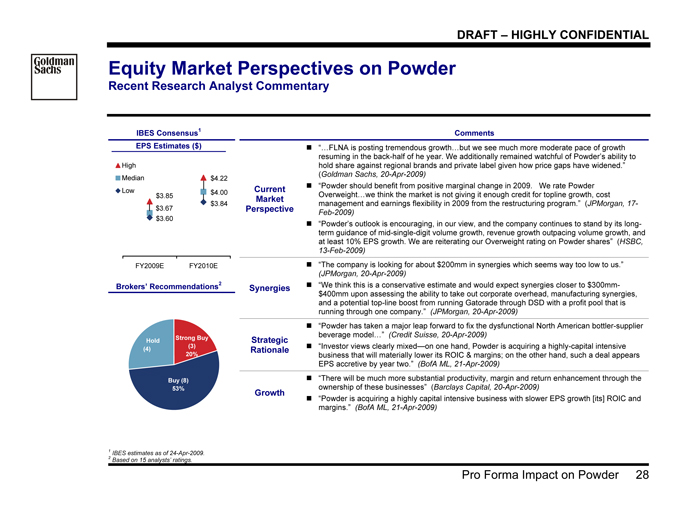
Equity Market Perspectives on Powder
Recent Research Analyst Commentary
IBES Consensus1
EPS Estimates ($)
$3.85
$4.22
$3.67
$4.00
$3.84
$3.60
FY2009E FY2010E
High
Median
Low
Brokers’ Recommendations2
Buy (8)
53%
Hold
Strong Buy
20%
Comments
Current
Market
Perspective
? “…FLNA is posting tremendous growth…but we see much more moderate pace of growth
resuming in the back-half of he year. We additionally remained watchful of Powder’s ability to
hold share against regional brands and private label given how price gaps have widened.”
(Goldman Sachs, 20-Apr-2009)
? “Powder should benefit from positive marginal change in 2009. We rate Powder
Overweight…we think the market is not giving it enough credit for topline growth, cost
management and earnings flexibility in 2009 from the restructuring program.” (JPMorgan, 17-
Feb-2009)
? “Powder’s outlook is encouraging, in our view, and the company continues to stand by its longterm
guidance of mid-single-digit volume growth, revenue growth outpacing volume growth, and
at least 10% EPS growth. We are reiterating our Overweight rating on Powder shares” (HSBC,
13-Feb-2009)
Synergies
? “The company is looking for about $200mm in synergies which seems way too low to us.”
(JPMorgan, 20-Apr-2009)
? “We think this is a conservative estimate and would expect synergies closer to $300mm-
$400mm upon assessing the ability to take out corporate overhead, manufacturing synergies,
and a potential top-line boost from running Gatorade through DSD with a profit pool that is
running through one company.” (JPMorgan, 20-Apr-2009)
Strategic
Rationale
? “Powder has taken a major leap forward to fix the dysfunctional North American bottler-supplier
beverage model…” (Credit Suisse, 20-Apr-2009)
? “Investor views clearly mixed—on one hand, Powder is acquiring a highly-capital intensive
business that will materially lower its ROIC & margins; on the other hand, such a deal appears
EPS accretive by year two.” (BofA ML, 21-Apr-2009)
Growth
? “There will be much more substantial productivity, margin and return enhancement through the
ownership of these businesses” (Barclays Capital, 20-Apr-2009)
? “Powder is acquiring a highly capital intensive business with slower EPS growth [its] ROIC and
margins.” (BofA ML, 21-Apr-2009)
1 | | IBES estimates as of 24-Apr-2009. |
2 | | Based on 15 analysts’ ratings. |
Goldman Sachs
DRAFT – HIGHLY CONFIDENTIAL
Pro Forma Impact on Powder 29
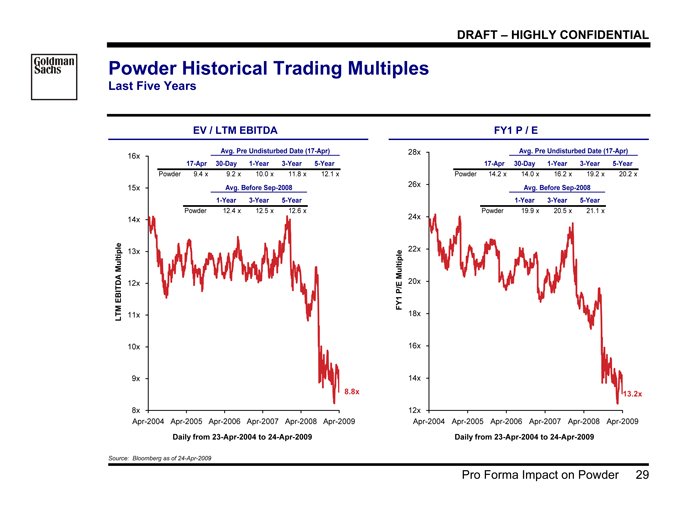
Powder Historical Trading Multiples
Last Five Years
EV / LTM EBITDA FY1 P / E
8.8x
8x
9x
10x
11x
12x
13x
14x
15x
16x
Apr-2004 Apr-2005 Apr-2006 Apr-2007 Apr-2008 Apr-2009
Daily from 23-Apr-2004 to 24-Apr-2009
LTM EBITDA Multiple
Avg. Pre Undisturbed Date (17-Apr)
17-Apr 30-Day 1-Year 3-Year 5-Year
Powder 9.4 x 9.2 x 10.0 x 11.8 x 12.1 x
Avg. Before Sep-2008
1-Year 3-Year 5-Year
Powder 12.4 x 12.5 x 12.6 x
13.2x
12x
14x
16x
18x
20x
22x
24x
26x
28x
Apr-2004 Apr-2005 Apr-2006 Apr-2007 Apr-2008 Apr-2009
Daily from 23-Apr-2004 to 24-Apr-2009
FY1 P/E Multiple
Avg. Pre Undisturbed Date (17-Apr)
17-Apr 30-Day 1-Year 3-Year 5-Year
Powder 14.2 x 14.0 x 16.2 x 19.2 x 20.2 x
Avg. Before Sep-2008
1-Year 3-Year 5-Year
Powder 19.9 x 20.5 x 21.1 x
Source: Bloomberg as of 24-Apr-2009
Goldman Sachs
DRAFT – HIGHLY CONFIDENTIAL
Pro Forma Impact on Powder 30
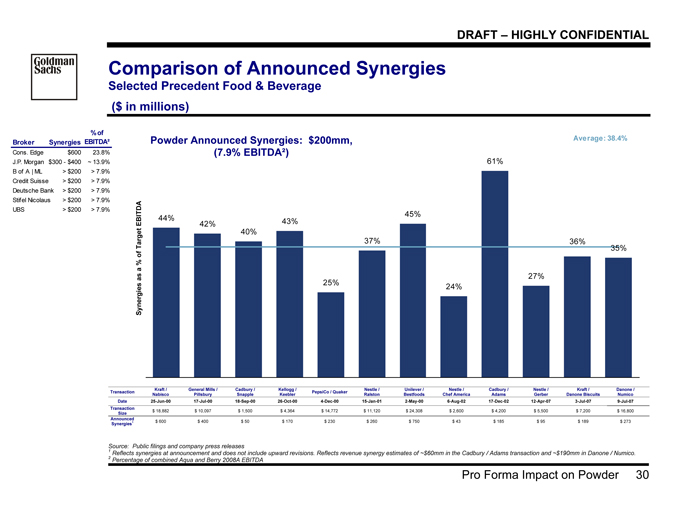
Comparison of Announced Synergies
Selected Precedent Food & Beverage
($ in millions)
Synergies as a % of Target EBITDA
44%
42%
40%
43%
25%
37%
45%
24%
61%
27%
35%
36%
Average: 38.4%
Transaction Kraft /
Nabisco
General Mills /
Pillsbury
Cadbury /
Snapple
Kellogg /
Keebler PepsiCo / Quaker Nestle /
Ralston
Unilever /
Bestfoods
Nestle /
Chef America
Cadbury /
Adams
Nestle /
Gerber
Kraft /
Danone Biscuits
Danone /
Numico
Date 25-Jun-00 17-Jul-00 18-Sep-00 26-Oct-00 4-Dec-00 15-Jan-01 2-May-00 6-Aug-02 17-Dec-02 12-Apr-07 3-Jul-07 9-Jul-07
Transaction
Size $ 18,882 $ 10,097 $ 1,500 $ 4,364 $ 14,772 $ 11,120 $ 24,308 $ 2,600 $ 4,200 $ 5,500 $ 7,200 $ 16,800
Announced
Synergies1 $ 600 $ 400 $ 50 $ 170 $ 230 $ 260 $ 750 $ 43 $ 185 $ 95 $ 189 $ 273
Source: Public filings and company press releases
1 Reflects synergies at announcement and does not include upward revisions. Reflects revenue synergy estimates of ~$60mm in the Cadbury / Adams transaction and ~$190mm in Danone / Numico.
2 | | Percentage of combined Aqua and Berry 2008A EBITDA |
Broker Synergies
% of
EBITDA²
Cons. Edge > $600 23.8%
J.P. Morgan $300—$400 ~ 13.9%
B of A | ML > $200 > 7.9%
Credit Suisse > $200 > 7.9%
Deutsche Bank > $200 > 7.9%
Stifel Nicolaus > $200 > 7.9%
UBS > $200 > 7.9%
Powder Announced Synergies: $200mm,
(7.9% EBITDA²)
Goldman Sachs
DRAFT – HIGHLY CONFIDENTIAL
Pro Forma Impact on Powder 31
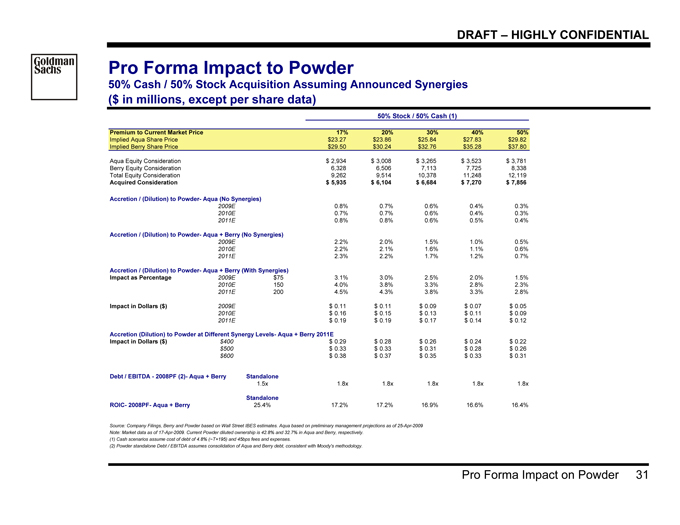
Pro Forma Impact to Powder
50% Cash / 50% Stock Acquisition Assuming Announced Synergies
($ in millions, except per share data)
50% Stock / 50% Cash (1)
Premium to Current Market Price 17% 20% 30% 40% 50%
Implied Aqua Share Price $23.27 $23.86 $25.84 $27.83 $29.82
Implied Berry Share Price $29.50 $30.24 $32.76 $35.28 $37.80
Aqua Equity Consideration $ 2,934 $ 3,008 $ 3,265 $ 3,523 $ 3,781
Berry Equity Consideration 6,328 6,506 7,113 7,725 8,338
Total Equity Consideration 9,262 9,514 10,378 11,248 12,119
Acquired Consideration $ 5,935 $ 6,104 $ 6,684 $ 7,270 $ 7,856
Accretion / (Dilution) to Powder- Aqua (No Synergies)
2009E 0.8% 0.7% 0.6% 0.4% 0.3%
2010E 0.7% 0.7% 0.6% 0.4% 0.3%
2011E 0.8% 0.8% 0.6% 0.5% 0.4%
Accretion / (Dilution) to Powder- Aqua + Berry (No Synergies)
2009E 2.2% 2.0% 1.5% 1.0% 0.5%
2010E 2.2% 2.1% 1.6% 1.1% 0.6%
2011E 2.3% 2.2% 1.7% 1.2% 0.7%
Accretion / (Dilution) to Powder- Aqua + Berry (With Synergies)
Impact as Percentage 2009E $75 3.1% 3.0% 2.5% 2.0% 1.5%
2010E 150 4.0% 3.8% 3.3% 2.8% 2.3%
2011E 200 4.5% 4.3% 3.8% 3.3% 2.8%
Impact in Dollars ($) 2009E $ 0.11 $ 0.11 $ 0.09 $ 0.07 $ 0.05
2010E $ 0.16 $ 0.15 $ 0.13 $ 0.11 $ 0.09
2011E $ 0.19 $ 0.19 $ 0.17 $ 0.14 $ 0.12
Accretion (Dilution) to Powder at Different Synergy Levels- Aqua + Berry 2011E
Impact in Dollars ($) $400 $ 0.29 $ 0.28 $ 0.26 $ 0.24 $ 0.22
$500 $ 0.33 $ 0.33 $ 0.31 $ 0.28 $ 0.26
$600 $ 0.38 $ 0.37 $ 0.35 $ 0.33 $ 0.31
Debt / EBITDA—2008PF (2)- Aqua + Berry Standalone
1.5x 1.8x 1.8x 1.8x 1.8x 1.8x
Standalone
ROIC- 2008PF- Aqua + Berry 25.4% 17.2% 17.2% 16.9% 16.6% 16.4%
Source: Company Filings, Berry and Powder based on Wall Street IBES estimates. Aqua based on preliminary management projections as of 25-Apr-2009
Note: Market data as of 17-Apr-2009. Current Powder diluted ownership is 42.8% and 32.7% in Aqua and Berry, respectively.
(1) | | Cash scenarios assume cost of debt of 4.8% (~T+195) and 45bps fees and expenses. |
(2) | | Powder standalone Debt / EBITDA assumes consolidation of Aqua and Berry debt, consistent with Moody's methodology. |
Goldman Sachs
DRAFT – HIGHLY CONFIDENTIAL
Pro Forma Impact on Powder 32
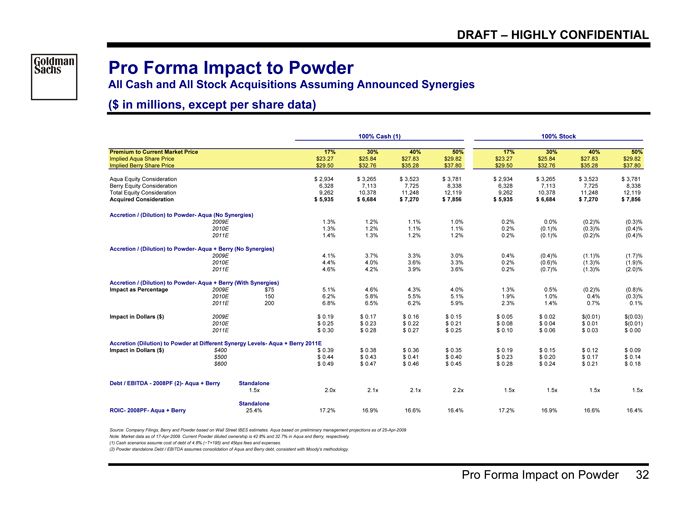
Pro Forma Impact to Powder
All Cash and All Stock Acquisitions Assuming Announced Synergies
($ in millions, except per share data)
100% Cash (1) 100% Stock
Premium to Current Market Price 17% 30% 40% 50% 17% 30% 40% 50%
Implied Aqua Share Price $23.27 $25.84 $27.83 $29.82 $23.27 $25.84 $27.83 $29.82
Implied Berry Share Price $29.50 $32.76 $35.28 $37.80 $29.50 $32.76 $35.28 $37.80
Aqua Equity Consideration $ 2,934 $ 3,265 $ 3,523 $ 3,781 $ 2,934 $ 3,265 $ 3,523 $ 3,781
Berry Equity Consideration 6,328 7,113 7,725 8,338 6,328 7,113 7,725 8,338
Total Equity Consideration 9,262 10,378 11,248 12,119 9,262 10,378 11,248 12,119
Acquired Consideration $ 5,935 $ 6,684 $ 7,270 $ 7,856 $ 5,935 $ 6,684 $ 7,270 $ 7,856
Accretion / (Dilution) to Powder- Aqua (No Synergies)
2009E 1.3% 1.2% 1.1% 1.0% 0.2% 0.0% (0.2)% (0.3)%
2010E 1.3% 1.2% 1.1% 1.1% 0.2% (0.1)% (0.3)% (0.4)%
2011E 1.4% 1.3% 1.2% 1.2% 0.2% (0.1)% (0.2)% (0.4)%
Accretion / (Dilution) to Powder- Aqua + Berry (No Synergies)
2009E 4.1% 3.7% 3.3% 3.0% 0.4% (0.4)% (1.1)% (1.7)%
2010E 4.4% 4.0% 3.6% 3.3% 0.2% (0.6)% (1.3)% (1.9)%
2011E 4.6% 4.2% 3.9% 3.6% 0.2% (0.7)% (1.3)% (2.0)%
Accretion / (Dilution) to Powder- Aqua + Berry (With Synergies)
Impact as Percentage 2009E $75 5.1% 4.6% 4.3% 4.0% 1.3% 0.5% (0.2)% (0.8)%
2010E 150 6.2% 5.8% 5.5% 5.1% 1.9% 1.0% 0.4% (0.3)%
2011E 200 6.8% 6.5% 6.2% 5.9% 2.3% 1.4% 0.7% 0.1%
Impact in Dollars ($) 2009E $ 0.19 $ 0.17 $ 0.16 $ 0.15 $ 0.05 $ 0.02 $(0.01) $(0.03)
2010E $ 0.25 $ 0.23 $ 0.22 $ 0.21 $ 0.08 $ 0.04 $ 0.01 $(0.01)
2011E $ 0.30 $ 0.28 $ 0.27 $ 0.25 $ 0.10 $ 0.06 $ 0.03 $ 0.00
Accretion (Dilution) to Powder at Different Synergy Levels- Aqua + Berry 2011E
Impact in Dollars ($) $400 $ 0.39 $ 0.38 $ 0.36 $ 0.35 $ 0.19 $ 0.15 $ 0.12 $ 0.09
$500 $ 0.44 $ 0.43 $ 0.41 $ 0.40 $ 0.23 $ 0.20 $ 0.17 $ 0.14
$600 $ 0.49 $ 0.47 $ 0.46 $ 0.45 $ 0.28 $ 0.24 $ 0.21 $ 0.18
Debt / EBITDA—2008PF (2)- Aqua + Berry Standalone
1.5x 2.0x 2.1x 2.1x 2.2x 1.5x 1.5x 1.5x 1.5x
Standalone
ROIC- 2008PF- Aqua + Berry 25.4% 17.2% 16.9% 16.6% 16.4% 17.2% 16.9% 16.6% 16.4%
Source: Company Filings, Berry and Powder based on Wall Street IBES estimates. Aqua based on preliminary management projections as of 25-Apr-2009
Note: Market data as of 17-Apr-2009. Current Powder diluted ownership is 42.8% and 32.7% in Aqua and Berry, respectively.
(1) | | Cash scenarios assume cost of debt of 4.8% (~T+195) and 45bps fees and expenses. |
(2) | | Powder standalone Debt / EBITDA assumes consolidation of Aqua and Berry debt, consistent with Moody's methodology. |
Goldman Sachs
DRAFT – HIGHLY CONFIDENTIAL
Pro Forma Impact on Powder 33
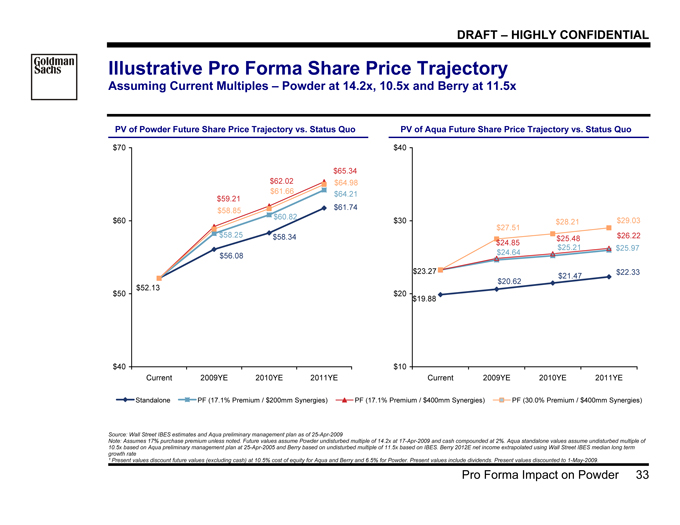
Illustrative Pro Forma Share Price Trajectory
Assuming Current Multiples – Powder at 14.2x, 10.5x and Berry at 11.5x
PV of Powder Future Share Price Trajectory vs. Status Quo PV of Aqua Future Share Price Trajectory vs. Status Quo
$58.34
$61.74
$56.08
$58.25
$60.82
$64.21
$65.34
$62.02
$59.21
$52.13
$58.85
$61.66
$64.98
$40
$50
$60
$70
Current 2009YE 2010YE 2011YE
$19.88
$21.47 $22.33
$20.62
$24.64 $25.21 $25.97
$26.22
$24.85 $25.48
$23.27
$28.21 $29.03
$27.51
$10
$20
$30
$40
Current 2009YE 2010YE 2011YE
Standalone PF (17.1% Premium / $200mm Synergies) PF (17.1% Premium / $400mm Synergies) PF (30.0% Premium / $400mm Synergies)
Source: Wall Street IBES estimates and Aqua preliminary management plan as of 25-Apr-2009
Note: Assumes 17% purchase premium unless noted. Future values assume Powder undisturbed multiple of 14.2x at 17-Apr-2009 and cash compounded at 2%. Aqua standalone values assume undisturbed multiple of
10.5x based on Aqua preliminary management plan at 25-Apr-2005 and Berry based on undisturbed multiple of 11.5x based on IBES. Berry 2012E net income extrapolated using Wall Street IBES median long term
growth rate
¹ Present values discount future values (excluding cash) at 10.5% cost of equity for Aqua and Berry and 6.5% for Powder. Present values include dividends. Present values discounted to 1-May-2009.
Goldman Sachs
DRAFT – HIGHLY CONFIDENTIAL
Pro Forma Impact on Powder 34
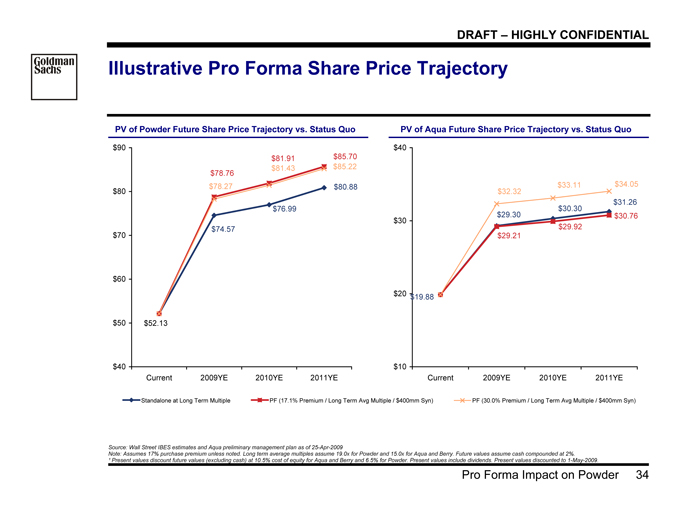
Illustrative Pro Forma Share Price Trajectory
PV of Powder Future Share Price Trajectory vs. Status Quo PV of Aqua Future Share Price Trajectory vs. Status Quo
$74.57
$80.88
$76.99
$52.13
$81.91 $85.70
$78.76
$78.27
$81.43 $85.22
$40
$50
$60
$70
$80
$90
Current 2009YE 2010YE 2011YE
$29.30
$31.26
$30.30
$19.88
$30.76
$29.92
$29.21
$33.11 $34.05
$32.32
$10
$20
$30
$40
Current 2009YE 2010YE 2011YE
Standalone at Long Term Multiple PF (17.1% Premium / Long Term Avg Multiple / $400mm Syn) PF (30.0% Premium / Long Term Avg Multiple / $400mm Syn)
Source: Wall Street IBES estimates and Aqua preliminary management plan as of 25-Apr-2009
Note: Assumes 17% purchase premium unless noted. Long term average multiples assume 19.0x for Powder and 15.0x for Aqua and Berry. Future values assume cash compounded at 2%.
¹ Present values discount future values (excluding cash) at 10.5% cost of equity for Aqua and Berry and 6.5% for Powder. Present values include dividends. Present values discounted to 1-May-2009.
Goldman Sachs
DRAFT – HIGHLY CONFIDENTIAL
Pro Forma Impact on Powder 35
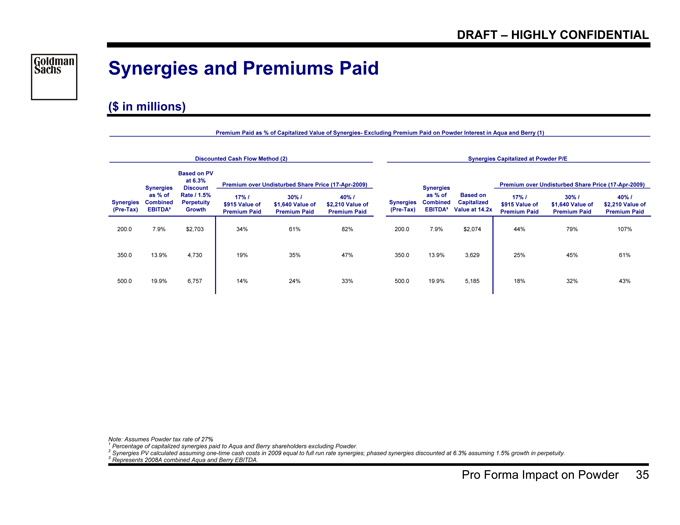
Synergies and Premiums Paid
($ in millions)123
Premium Paid as % of Capitalized Value of Synergies- Excluding Premium Paid on Powder Interest in Aqua and Berry (1)
Discounted Cash Flow Method (2) Synergies Capitalized at Powder P/E
Premium over Undisturbed Share Price (17-Apr-2009) Premium over Undisturbed Share Price (17-Apr-2009)
17% /
$915 Value of
Premium Paid
30% /
$1,640 Value of
Premium Paid
40% /
$2,210 Value of
Premium Paid
17% /
$915 Value of
Premium Paid
30% /
$1,640 Value of
Premium Paid
40% /
$2,210 Value of
Premium Paid
200.0 7.9% $2,703 34% 61% 82% 200.0 7.9% $2,074 44% 79% 107%
350.0 13.9% 4,730 19% 35% 47% 350.0 13.9% 3,629 25% 45% 61%
500.0 19.9% 6,757 14% 24% 33% 500.0 19.9% 5,185 18% 32% 43%
Synergies
(Pre-Tax)
Based on PV
at 6.3%
Discount
Rate / 1.5%
Perpetuity
Growth
Synergies
(Pre-Tax)
Based on
Capitalized
Value at 14.2x
Synergies
as % of
Combined
EBITDA³
Synergies
as % of
Combined
EBITDA³
Note: Assumes Powder tax rate of 27%
1 | | Percentage of capitalized synergies paid to Aqua and Berry shareholders excluding Powder. |
2 Synergies PV calculated assuming one-time cash costs in 2009 equal to full run rate synergies; phased synergies discounted at 6.3% assuming 1.5% growth in perpetuity.
3 | | Represents 2008A combined Aqua and Berry EBITDA. |
Goldman Sachs
DRAFT – HIGHLY CONFIDENTIAL
Pro Forma Impact on Powder 36
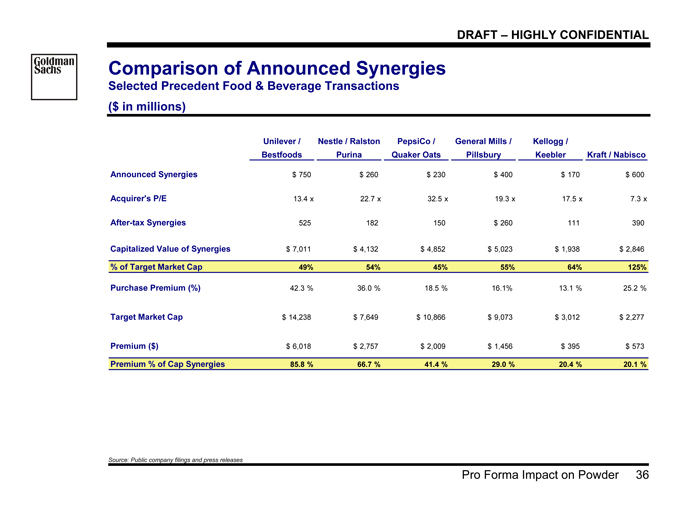
Comparison of Announced Synergies
Selected Precedent Food & Beverage Transactions
($ in millions)
Unilever /
Bestfoods
Nestle / Ralston
Purina
PepsiCo /
Quaker Oats
General Mills /
Pillsbury
Kellogg /
Keebler Kraft / Nabisco
Announced Synergies $ 750 $ 260 $ 230 $ 400 $ 170 $ 600
Acquirer's P/E 13.4 x 22.7 x 32.5 x 19.3 x 17.5 x 7.3 x
After-tax Synergies 525 182 150 $ 260 111 390
Capitalized Value of Synergies $ 7,011 $ 4,132 $ 4,852 $ 5,023 $ 1,938 $ 2,846
% of Target Market Cap 49% 54% 45% 55% 64% 125%
Purchase Premium (%) 42.3 % 36.0 % 18.5 % 16.1% 13.1 % 25.2 %
Target Market Cap $ 14,238 $ 7,649 $ 10,866 $ 9,073 $ 3,012 $ 2,277
Premium ($) $ 6,018 $ 2,757 $ 2,009 $ 1,456 $ 395 $ 573
Premium % of Cap Synergies 85.8 % 66.7 % 41.4 % 29.0 % 20.4 % 20.1 %
Source: Public company filings and press releases
Goldman Sachs
DRAFT – HIGHLY CONFIDENTIAL
Pro Forma Impact on Powder 37
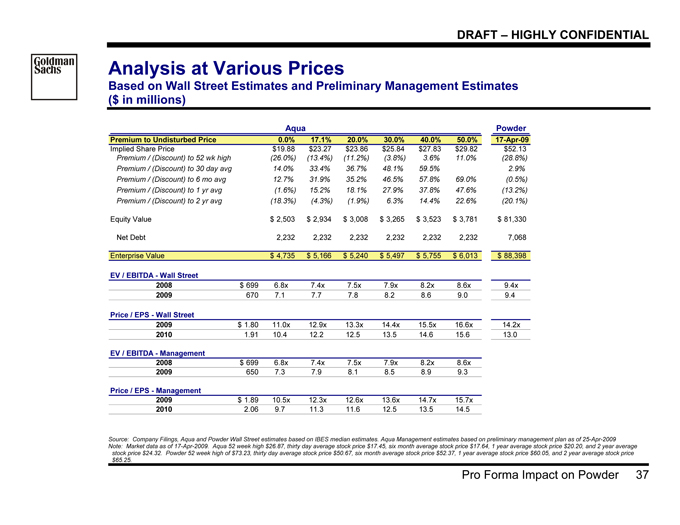
Analysis at Various Prices
Based on Wall Street Estimates and Preliminary Management Estimates
($ in millions)
Aqua Powder
Premium to Undisturbed Price 0.0% 17.1% 20.0% 30.0% 40.0% 50.0% 17-Apr-09
Implied Share Price $19.88 $23.27 $23.86 $25.84 $27.83 $29.82 $52.13
Premium / (Discount) to 52 wk high (26.0%) (13.4%) (11.2%) (3.8%) 3.6% 11.0% (28.8%)
Premium / (Discount) to 30 day avg 14.0% 33.4% 36.7% 48.1% 59.5% 2.9%
Premium / (Discount) to 6 mo avg 12.7% 31.9% 35.2% 46.5% 57.8% 69.0% (0.5%)
Premium / (Discount) to 1 yr avg (1.6%) 15.2% 18.1% 27.9% 37.8% 47.6% (13.2%)
Premium / (Discount) to 2 yr avg (18.3%) (4.3%) (1.9%) 6.3% 14.4% 22.6% (20.1%)
Equity Value $ 2,503 $ 2,934 $ 3,008 $ 3,265 $ 3,523 $ 3,781 $ 81,330
Net Debt 2,232 2,232 2,232 2,232 2,232 2,232 7,068
Enterprise Value $ 4,735 $ 5,166 $ 5,240 $ 5,497 $ 5,755 $ 6,013 $ 88,398
EV / EBITDA—Wall Street
2008 $ 699 6.8x 7.4x 7.5x 7.9x 8.2x 8.6x 9.4x
2009 670 7.1 7.7 7.8 8.2 8.6 9.0 9.4
Price / EPS—Wall Street
2009 $ 1.80 11.0x 12.9x 13.3x 14.4x 15.5x 16.6x 14.2x
2010 1.91 10.4 12.2 12.5 13.5 14.6 15.6 13.0
EV / EBITDA—Management
2008 $ 699 6.8x 7.4x 7.5x 7.9x 8.2x 8.6x
2009 650 7.3 7.9 8.1 8.5 8.9 9.3
Price / EPS—Management
2009 $ 1.89 10.5x 12.3x 12.6x 13.6x 14.7x 15.7x
2010 2.06 9.7 11.3 11.6 12.5 13.5 14.5
Source: Company Filings, Aqua and Powder Wall Street estimates based on IBES median estimates. Aqua Management estimates based on preliminary management plan as of 25-Apr-2009
Note: Market data as of 17-Apr-2009. Aqua 52 week high $26.87, thirty day average stock price $17.45, six month average stock price $17.64, 1 year average stock price $20.20, and 2 year average
stock price $24.32. Powder 52 week high of $73.23, thirty day average stock price $50.67, six month average stock price $52.37, 1 year average stock price $60.05, and 2 year average stock price
$65.25.
Goldman Sachs
DRAFT – HIGHLY CONFIDENTIAL
Supplemental Materials 38
Appendix A: Supplemental Materials
Goldman Sachs
DRAFT – HIGHLY CONFIDENTIAL
Supplemental Materials 39
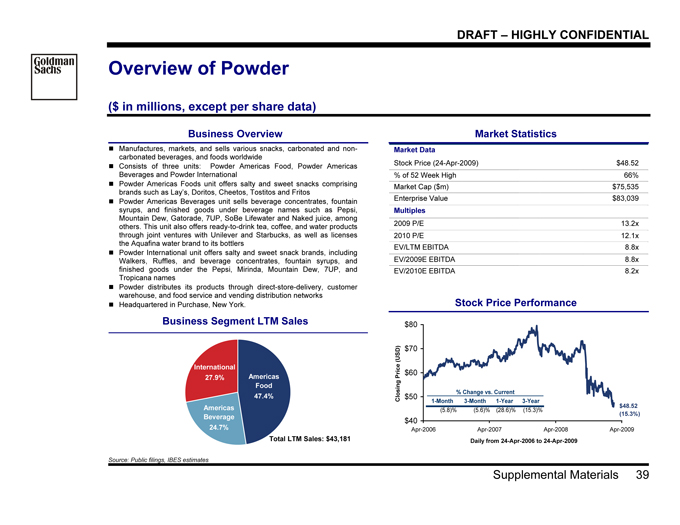
Overview of Powder
($ in millions, except per share data)
Business Overview Market Statistics
Market Data
Stock Price (24-Apr-2009) $48.52
% of 52 Week High 66%
Market Cap ($m) $75,535
Enterprise Value $83,039
Multiples
2009 P/E 13.2x
2010 P/E 12.1x
EV/LTM EBITDA 8.8x
EV/2009E EBITDA 8.8x
EV/2010E EBITDA 8.2x
Stock Price Performance
? Manufactures, markets, and sells various snacks, carbonated and noncarbonated
beverages, and foods worldwide
? Consists of three units: Powder Americas Food, Powder Americas
Beverages and Powder International
? Powder Americas Foods unit offers salty and sweet snacks comprising
brands such as Lay’s, Doritos, Cheetos, Tostitos and Fritos
? Powder Americas Beverages unit sells beverage concentrates, fountain
syrups, and finished goods under beverage names such as Pepsi,
Mountain Dew, Gatorade, 7UP, SoBe Lifewater and Naked juice, among
others. This unit also offers ready-to-drink tea, coffee, and water products
through joint ventures with Unilever and Starbucks, as well as licenses
the Aquafina water brand to its bottlers
? Powder International unit offers salty and sweet snack brands, including
Walkers, Ruffles, and beverage concentrates, fountain syrups, and
finished goods under the Pepsi, Mirinda, Mountain Dew, 7UP, and
Tropicana names
? Powder distributes its products through direct-store-delivery, customer
warehouse, and food service and vending distribution networks
? Headquartered in Purchase, New York.
Business Segment LTM Sales
Americas
Food
47.4%
International
27.9%
Americas
Beverage
24.7%
Total LTM Sales: $43,18 1
$40
$50
$60
$70
$80
Apr-2006 Apr-2007 Apr-2008 Apr-2009
Daily from 24-Apr-2006 to 24-Apr-2009
Closing Price (USD)
$48.52
(15.3%)
% Change vs. Current
1-Month 3-Month 1-Year 3-Year
(5.8)% (5.6)% (28.6)% (15.3)%
Source: Public filings, IBES estimates
Goldman Sachs
DRAFT – HIGHLY CONFIDENTIAL
Supplemental Materials 40
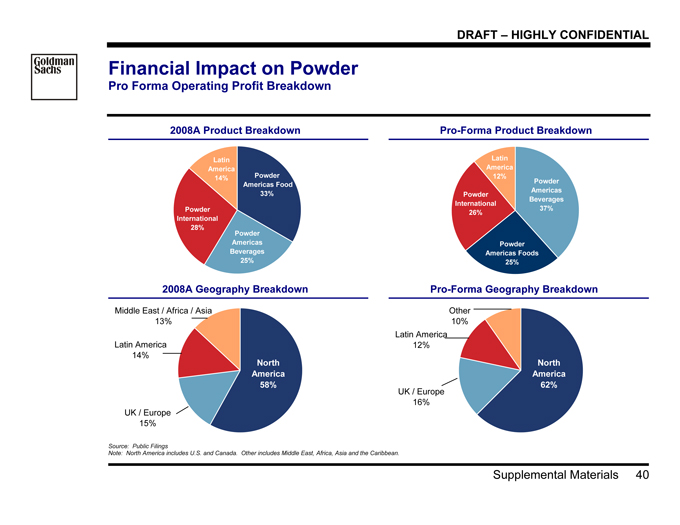
Financial Impact on Powder
Pro Forma Operating Profit Breakdown
2008A Product Breakdown Pro-Forma Product Breakdown
Powder
Americas Food
33%
Powder
Americas
Beverages
25%
Powder
International
28%
Latin
America
14%
Powder
Americas
Beverages
37%
Powder
International
26%
Latin
America
12%
Powder
Americas Foods
25%
2008A Geography Breakdown Pro-Forma Geography Breakdown1
North
America
58%
Latin America
14%
UK / Europe
15%
Middle East / Africa / Asia
13%
North
America
62%
Latin America
12%
UK / Europe
16%
Other
10%
Source: Public Filings
Note: North America includes U.S. and Canada. Other includes Middle East, Africa, Asia and the Caribbean.
Goldman Sachs
DRAFT – HIGHLY CONFIDENTIAL
Supplemental Materials 41
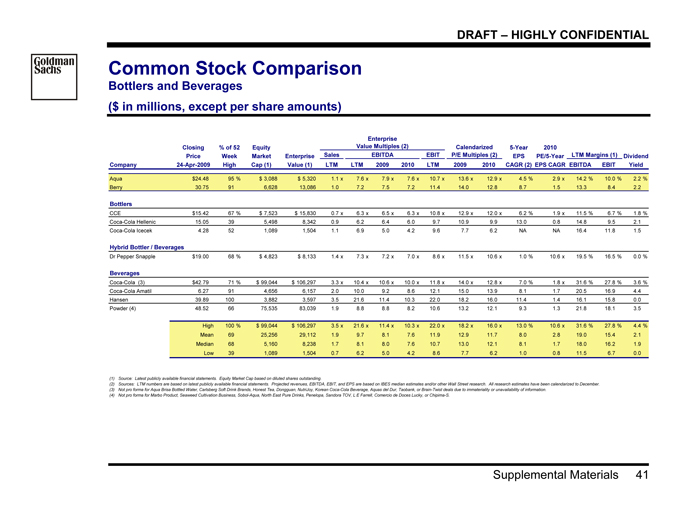
Common Stock Comparison
Bottlers and Beverages
($ in millions, except per share amounts)
Closing % of 52 Equity 5-Year 2010
Price Week Market Enterprise EPS PE/5-Year Dividend
Company 24-Apr-2009 High Cap (1) Value (1) LTM LTM 2009 2010 LTM 2009 2010 CAGR (2) EPS CAGR EBITDA EBIT Yield
Aqua $24.48 95 % $ 3,088 $ 5,320 1.1 x 7.6 x 7.9 x 7.6 x 10.7 x 13.6 x 12.9 x 4.5 % 2.9 x 14.2 % 10.0 % 2.2 %
Berry 30.75 91 6,628 13,086 1.0 7.2 7.5 7.2 11.4 14.0 12.8 8.7 1.5 13.3 8.4 2.2
Bottlers
CCE $15.42 67 % $ 7,523 $ 15,830 0.7 x 6.3 x 6.5 x 6.3 x 10.8 x 12.9 x 12.0 x 6.2 % 1.9 x 11.5 % 6.7 % 1.8 %
Coca-Cola Hellenic 15.05 39 5,498 8,342 0.9 6.2 6.4 6.0 9.7 10.9 9.9 13.0 0.8 14.8 9.5 2.1
Coca-Cola Icecek 4.28 52 1,089 1,504 1.1 6.9 5.0 4.2 9.6 7.7 6.2 NA NA 16.4 11.8 1.5
Hybrid Bottler / Beverages
Dr Pepper Snapple $19.00 68 % $ 4,823 $ 8,133 1.4 x 7.3 x 7.2 x 7.0 x 8.6 x 11.5 x 10.6 x 1.0 % 10.6 x 19.5 % 16.5 % 0.0 %
Beverages
Coca-Cola (3) $42.79 71 % $ 99,044 $ 106,297 3.3 x 10.4 x 10.6 x 10.0 x 11.8 x 14.0 x 12.8 x 7.0 % 1.8 x 31.6 % 27.8 % 3.6 %
Coca-Cola Amatil 6.27 91 4,656 6,157 2.0 10.0 9.2 8.6 12.1 15.0 13.9 8.1 1.7 20.5 16.9 4.4
Hansen 39.89 100 3,882 3,597 3.5 21.6 11.4 10.3 22.0 18.2 16.0 11.4 1.4 16.1 15.8 0.0
Powder (4) 48.52 66 75,535 83,039 1.9 8.8 8.8 8.2 10.6 13.2 12.1 9.3 1.3 21.8 18.1 3.5
High 100 % $ 99,044 $ 106,297 3.5 x 21.6 x 11.4 x 10.3 x 22.0 x 18.2 x 16.0 x 13.0 % 10.6 x 31.6 % 27.8 % 4.4 %
Mean 69 25,256 29,112 1.9 9.7 8.1 7.6 11.9 12.9 11.7 8.0 2.8 19.0 15.4 2.1
Median 68 5,160 8,238 1.7 8.1 8.0 7.6 10.7 13.0 12.1 8.1 1.7 18.0 16.2 1.9
Low 39 1,089 1,504 0.7 6.2 5.0 4.2 8.6 7.7 6.2 1.0 0.8 11.5 6.7 0.0
(1) | | Source: Latest publicly available financial statements. Equity Market Cap based on diluted shares outstanding. |
(2) Sources: LTM numbers are based on latest publicly available financial statements. Projected revenues, EBITDA, EBIT, and EPS are based on IBES median estimates and/or other Wall Street research. All research estimates have been calendarized to December.
(3) Not pro forma for Aqua Brisa Bottled Water, Carlsberg Soft Drink Brands, Honest Tea, Dongguan, NutriJoy, Korean Coca-Cola Beverage, Aquas del Dur, Taobank, or Brain-Twist deals due to immateriality or unavailability of information.
(4) Not pro forma for Marbo Product, Seaweed Cultivation Business, Sobol-Aqua, North East Pure Drinks, Penelopa, Sandora TOV, L E Farrell, Comercio de Doces Lucky, or Chipima-S.
LTM Margins EBITDA (1)
Enterprise
Value Multiples (2)
EBIT P/E Multiples (2)
Calendarized
Sales
Goldman Sachs
DRAFT – HIGHLY CONFIDENTIAL
Supplemental Materials 42
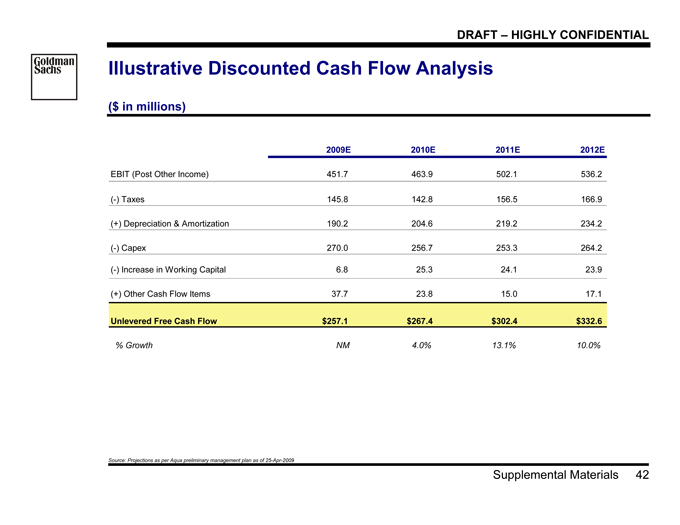
Illustrative Discounted Cash Flow Analysis
($ in millions)1
2009E 2010E 2011E 2012E
EBIT (Post Other Income) 451.7 463.9 502.1 536.2
(-) Taxes 145.8 142.8 156.5 166.9
(+) Depreciation & Amortization 190.2 204.6 219.2 234.2
(-) Capex 270.0 256.7 253.3 264.2
(-) Increase in Working Capital 6.8 25.3 24.1 23.9
(+) Other Cash Flow Items 37.7 23.8 15.0 17.1
Unlevered Free Cash Flow $257.1 $267.4 $302.4 $332.6
% Growth NM 4.0% 13.1% 10.0%
Source: Projections as per Aqua preliminary management plan as of 25-Apr-2009
Goldman Sachs
DRAFT – HIGHLY CONFIDENTIAL
Supplemental Materials 43
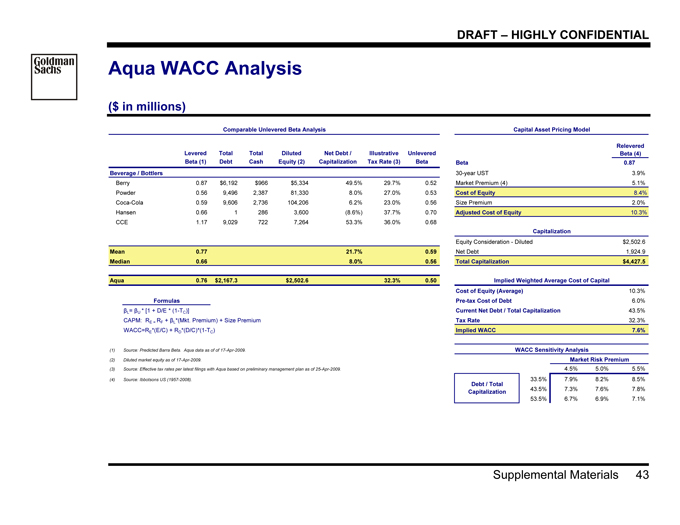
Aqua WACC Analysis
($ in millions)
Comparable Unlevered Beta Analysis Capital Asset Pricing Model
Levered Total Total Diluted Net Debt / Illustrative Unlevered
Beta (1) Debt Cash Equity (2) Capitalization Tax Rate (3) Beta Beta 0.87
Beverage / Bottlers 30-year UST 3.9%
Berry 0 .87 $6,192 $966 $5,334 49.5% 29.7% 0.52 Market Premium (4) 5.1%
Powder 0 .56 9,496 2,387 81,330 8.0% 27.0% 0.53 Cost of Equity 8.4%
Coca-Cola 0 .59 9,606 2,736 104,206 6.2% 23.0% 0.56 Size Premium 2.0%
Hansen 0 .66 1 286 3,600 (8.6%) 37.7% 0.70 Adjusted Cost of Equity 10.3%
CCE 1 .17 9,029 722 7,264 53.3% 36.0% 0.68
Capitalization
Equity Consideration—Diluted $2,502.6
Mean 0 .77 21.7% 0.59 Net Debt 1,924.9
Median 0 .66 8.0% 0.56 Total Capitalization $4,427.5
Aqua 0.76 $2,167.3 $2,502.6 32.3% 0.50 Implied Weighted Average Cost of Capital
Cost of Equity (Average) 10.3%
Formulas Pre-tax Cost of Debt 6.0%
?L= ?U * [1 + D/E * (1-TC)] Current Net Debt / Total Capitalization 43.5%
CAPM: RE = RF + ?L*(Mkt. Premium) + Size Premium Tax Rate 32.3%
WACC=RE*(E/C) + RD*(D/C)*(1-TC) Implied WACC 7.6%
(1) | | Source: Predicted Barra Beta. Aqua data as of of 17-Apr-2009. WACC Sensitivity Analysis |
(2) | | Diluted market equity as of 17-Apr-2009. Market Risk Premium |
(3) Source: Effective tax rates per latest filings with Aqua based on preliminary management plan as of 25-Apr-2009. 7.6% 4.5% 5.0% 5.5%
(4) | | Source: Ibbotsons US (1957-2008). 33.5% 7.9% 8.2% 8.5% |
43.5% 7.3% 7.6% 7.8%
53.5% 6.7% 6.9% 7.1%
Relevered
Beta (4)
Debt / Total
Capitalization