Exhibit (c)(7)
Goldman Sachs
CONFIDENTIAL DRAFT
Project Periwinkle
Confidential Discussion Materials
Goldman, Sachs & Co.
May 18, 2009
Goldman Sachs CONFIDENTIAL DRAFT
Disclaimer
Goldman, Sachs & Co. (“GS”) has prepared and provided these materials and GS’s related presentation (the “Confidential Information”) solely for the
information and assistance of the Board of Directors (the "Board") and senior management of Aqua (the "Company") in connection with its
consideration of the matters referred to herein. Without GS’s prior written consent, the Confidential Information may not be circulated or referred to
publicly, disclosed to or relied upon by any other person, or used or relied upon for any other purpose. Notwithstanding anything hereinto the contrary,
the Company may disclose to any person the US federal income and state income tax treatment and tax structure of any transaction described herein
and all materials of any kind (including tax opinions and other tax analyses) that are provided to the Company relating to such tax treatment and tax
structure, without GS imposing any limitation of any kind. The Confidential Information, including this disclaimer, is subject to, and governed by, any
written agreement between the Company, the Board and/or any committee thereof, on the hand, and GS, on the other hand.
GS and its affiliates are engaged in investment banking, commercial banking and financial advisory services, securities trading, investment
management, principal investment, financial planning, benefits counseling, risk management, hedging, financing, brokerage activities and other
financial and non-financial activities and services for various persons and entities. In the ordinary course of these activities and services, GS and its
affiliates may at any time make or hold long or short positions and investments, as well as actively trade or effect transactions, in the equity, debt and
other securities (or related derivative securities) and financial instruments (including bank loans and other obligations) of third parties, the Company,
any other party to any transaction and any of their respective affiliates or any currency or commodity that may be involved in any transaction for their
own account and for the accounts of their customers.
The Confidential Information has been prepared and based on information obtained by GS from publicly available sources, the Company’s
management and/or other sources. In preparing the Confidential Information, GS has relied upon and assumed, without assuming any responsibility
for independent verification, the accuracy and completeness of all of the financial, legal, regulatory, tax, accounting and other information provided to,
discussed with or reviewed by GS, and GS does not assume any liability for any such information. GS does not provide accounting, tax, legal or
regulatory advice. GS’s role in any due diligence review is limited solely to performing such a review as it shall deem necessary to support its own
advice and analysis and shall not be on behalf of the Company. Analyses based upon forecasts of future results are not necessarily indicative of
actual future results, which may be significantly more or less favorable than suggested by these analyses, and GS does not assume responsibility if
future results are materially different from those forecast.
GS has not made an independent evaluation or appraisal of the assets and liabilities of the Company or any other person and has no obligation to
evaluate the solvency of the Company or any person under any law. The analyses in the Confidential Information are not appraisals nor do they
necessarily reflect the prices at which businesses or securities actually may be sold or purchased. The Confidential Information does not address the
underlying business decision of the Company to engage in any transaction, or the relative merits of any strategic alternative referred to herein as
compared to any other alternative that may be available to the Company. The Confidential Information is necessarily based on economic, monetary,
market and other conditions as in effect on, and the information made available to GS as of, the date of such Confidential Information and GS
assumes no responsibility for updating or revising the Confidential Information.
Goldman Sachs CONFIDENTIAL DRAFT
Table of Contents
I. Public Market Update
II. Summary Analysis
III. Pro Forma Impact on Powder
Appendix A: Supplementary Materials
Goldman Sachs CONFIDENTIAL DRAFT
Public Market Update 4
I. Public Market Update
Goldman Sachs CONFIDENTIAL DRAFT
Public Market Update 5
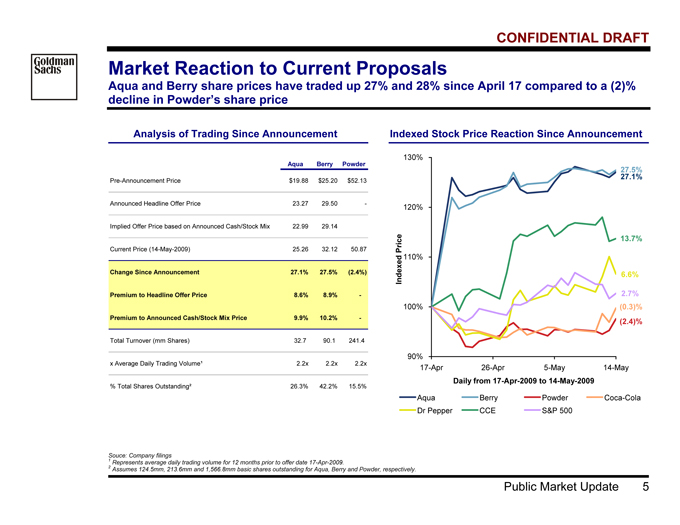
Market Reaction to Current Proposals
Aqua and Berry share prices have traded up 27% and 28% since April 17 compared to a (2)%
decline in Powder’s share price12
Analysis of Trading Since Announcement Indexed Stock Price Reaction Since Announcement
Aqua Berry Powder
Pre-Announcement Price $19.88 $25.20 $52.13
Announced Headline Offer Price 23.27 29.50 -
Implied Offer Price based on Announced Cash/Stock Mix 22.99 29.14
Current Price (14-May-2009) 25.26 32.12 50.87
Change Since Announcement 27.1% 27.5% (2.4%)
Premium to Headline Offer Price 8.6% 8.9% -
Premium to Announced Cash/Stock Mix Price 9.9% 10.2% -
Total Turnover (mm Shares) 32.7 90.1 241.4
x Average Daily Trading Volume¹ 2.2x 2.2x 2.2x
% Total Shares Outstanding² 26.3% 42.2% 15.5%
90%
100%
110%
120%
130%
17-Apr 26-Apr 5-May 14-May
Daily from 17-Apr-2009 to 14-May-2009
Indexed Price Aqua Berry Powder Coca-Cola
Dr Pepper CCE S&P 500
27.1%
27.5%
6.6%
13.7%
2.7%
(2.4)%
(0.3)%
Source: Company filings
1 | | Represents average daily trading volume for 12 months prior to offer date 17-Apr-2009. |
2 | | Assumes 124.5mm, 213.6mm and 1,566.8mm basic shares outstanding for Aqua, Berry and Powder, respectively. |
Goldman Sachs CONFIDENTIAL DRAFT
Public Market Update 6
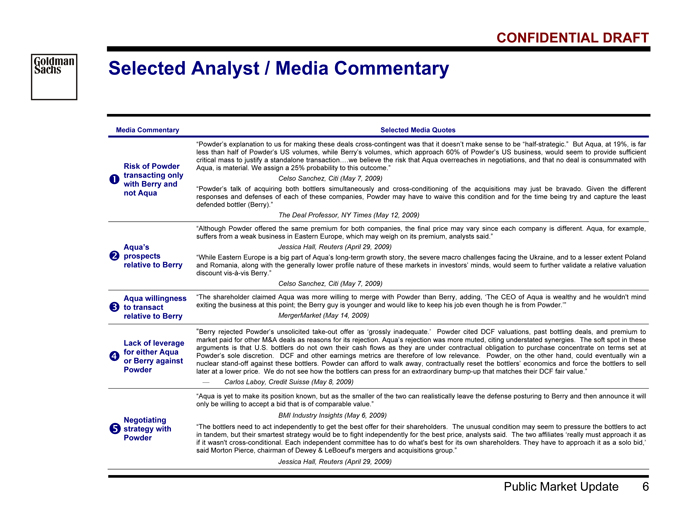
Selected Analyst / Media Commentary
Media Commentary Selected Media Quotes
?
Risk of Powder
transacting only
with Berry and
not Aqua
“Powder’s explanation to us for making these deals cross-contingent was that it doesn’t make sense to be “half-strategic.” But Aqua, at 19%, is far
less than half of Powder’s US volumes, while Berry’s volumes, which approach 60% of Powder’s US business, would seem to provide sufficient
critical mass to justify a standalone transaction….we believe the risk that Aqua overreaches in negotiations, and that no deal is consummated with
Aqua, is material. We assign a 25% probability to this outcome.”
Celso Sanchez, Citi (May 7, 2009)
“Powder’s talk of acquiring both bottlers simultaneously and cross-conditioning of the acquisitions may just be bravado. Given the different
responses and defenses of each of these companies, Powder may have to waive this condition and for the time being try and capture the least
defended bottler (Berry).”
The Deal Professor, NY Times (May 12, 2009)
? Aqua’s
prospects
relative to Berry
“Although Powder offered the same premium for both companies, the final price may vary since each company is different. Aqua, for example,
suffers from a weak business in Eastern Europe, which may weigh on its premium, analysts said.”
Jessica Hall, Reuters (April 29, 2009)
“While Eastern Europe is a big part of Aqua’s long-term growth story, the severe macro challenges facing the Ukraine, and to a lesser extent Poland
and Romania, along with the generally lower profile nature of these markets in investors’ minds, would seem to further validate a relative valuation
discount vis-à-vis Berry.”
Celso Sanchez, Citi (May 7, 2009)
? Aqua willingness
to transact
relative to Berry
“The shareholder claimed Aqua was more willing to merge with Powder than Berry, adding, ‘The CEO of Aqua is wealthy and he wouldn't mind
exiting the business at this point; the Berry guy is younger and would like to keep his job even though he is from Powder.’”
MergerMarket (May 14, 2009)
?
Lack of leverage
for either Aqua
or Berry against
Powder
“Berry rejected Powder’s unsolicited take-out offer as ‘grossly inadequate.’ Powder cited DCF valuations, past bottling deals, and premium to
market paid for other M&A deals as reasons for its rejection. Aqua’s rejection was more muted, citing understated synergies. The soft spot in these
arguments is that U.S. bottlers do not own their cash flows as they are under contractual obligation to purchase concentrate on terms set at
Powder’s sole discretion. DCF and other earnings metrics are therefore of low relevance. Powder, on the other hand, could eventually win a
nuclear stand-off against these bottlers. Powder can afford to walk away, contractually reset the bottlers’ economics and force the bottlers to sell
later at a lower price. We do not see how the bottlers can press for an extraordinary bump-up that matches their DCF fair value.”
— Carlos Laboy, Credit Suisse (May 8, 2009)
?
Negotiating
strategy with
Powder
“Aqua is yet to make its position known, but as the smaller of the two can realistically leave the defense posturing to Berry and then announce it will
only be willing to accept a bid that is of comparable value.”
BMI Industry Insights (May 6, 2009)
“The bottlers need to act independently to get the best offer for their shareholders. The unusual condition may seem to pressure the bottlers to act
in tandem, but their smartest strategy would be to fight independently for the best price, analysts said. The two affiliates ‘really must approach it as
if it wasn't cross-conditional. Each independent committee has to do what's best for its own shareholders. They have to approach it as a solo bid,’
said Morton Pierce, chairman of Dewey & LeBoeuf's mergers and acquisitions group.”
Jessica Hall, Reuters (April 29, 2009)
Goldman Sachs CONFIDENTIAL DRAFT
Public Market Update 7
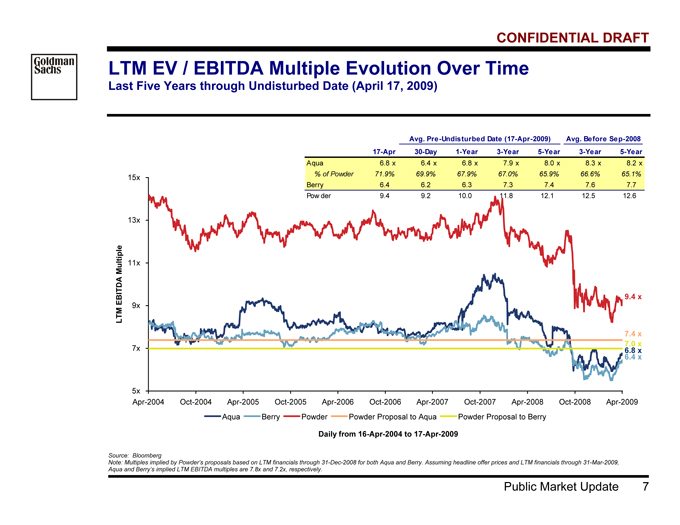
LTM EV / EBITDA Multiple Evolution Over Time
Last Five Years through Undisturbed Date (April 17, 2009)
5x
7x
9x
11x
13x
15x
Apr-2004 Oct-2004 Apr-2005 Oct-2005 Apr-2006 Oct-2006 Apr-2007 Oct-2007 Apr-2008 Oct-2008 Apr-2009
Daily from 16-Apr-2004 to 17-Apr-2009
LTM EBITDA Multiple
Aqua Berry Powder Powder Proposal to Aqua Powder Proposal to Berry
6.8 x
6.4 x
7.4 x
7.0 x
9.4 x
Avg. Pre-Undisturbed Date (17-Apr-2009) Avg. Before Sep-2008
17-Apr 30-Day 1-Year 3-Year 5-Year 3-Year 5-Year
Aqua 6.8 x 6.4 x 6.8 x 7.9 x 8.0 x 8.3 x 8.2 x
% of Powder 71.9% 69.9% 67.9% 67.0% 65.9% 66.6% 65.1%
Berry 6.4 6.2 6.3 7.3 7.4 7.6 7.7
Pow der 9.4 9.2 10.0 11.8 12.1 12.5 12.6
Source: Bloomberg
Note: Multiples implied by Powder’s proposals based on LTM financials through 31-Dec-2008 for both Aqua and Berry. Assuming headline offer prices and LTM financials through 31-Mar-2009,
Aqua and Berry’s implied LTM EBITDA multiples are 7.8x and 7.2x, respectively.
Goldman Sachs CONFIDENTIAL DRAFT
Public Market Update 8
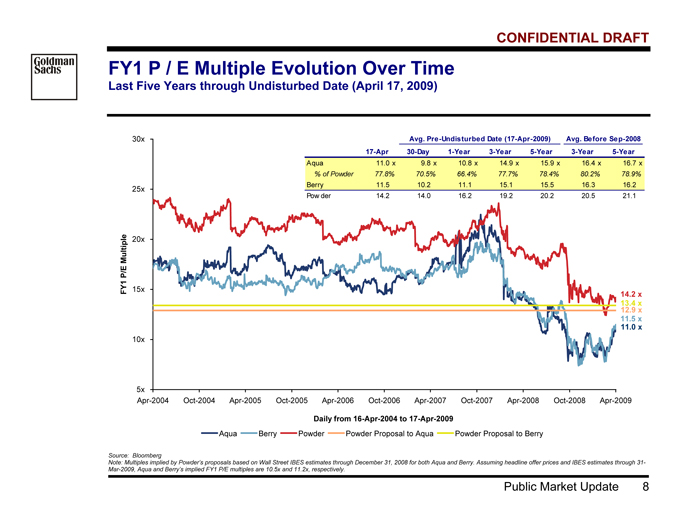
FY1 P / E Multiple Evolution Over Time
Last Five Years through Undisturbed Date (April 17, 2009)
5x
10x
15x
20x
25x
30x
Apr-2004 Oct-2004 Apr-2005 Oct-2005 Apr-2006 Oct-2006 Apr-2007 Oct-2007 Apr-2008 Oct-2008 Apr-2009
Daily from 16-Apr-2004 to 17-Apr-2009
FY1 P/E Multiple
Aqua Berry Powder Powder Proposal to Aqua Powder Proposal to Berry
11.0 x
11.5 x
14.2 x
12.9 x
13.4 x
Avg. Pre-Undisturbed Date (17-Apr-2009) Avg. Before Sep-2008
17-Apr 30-Day 1-Year 3-Year 5-Year 3-Year 5-Year
Aqua 11.0 x 9.8 x 10.8 x 14.9 x 15.9 x 16.4 x 16.7 x
% of Powder 77.8% 70.5% 66.4% 77.7% 78.4% 80.2% 78.9%
Berry 11.5 10.2 11.1 15.1 15.5 16.3 16.2
Powder 14.2 14.0 16.2 19.2 20.2 20.5 21.1
Source: Bloomberg
Note: Multiples implied by Powder’s proposals based on Wall Street IBES estimates through December 31, 2008 for both Aqua and Berry. Assuming headline offer prices and IBES estimates through 31-
Mar-2009, Aqua and Berry’s implied FY1 P/E multiples are 10.5x and 11.2x, respectively.
Goldman Sachs CONFIDENTIAL DRAFT
Public Market Update 9
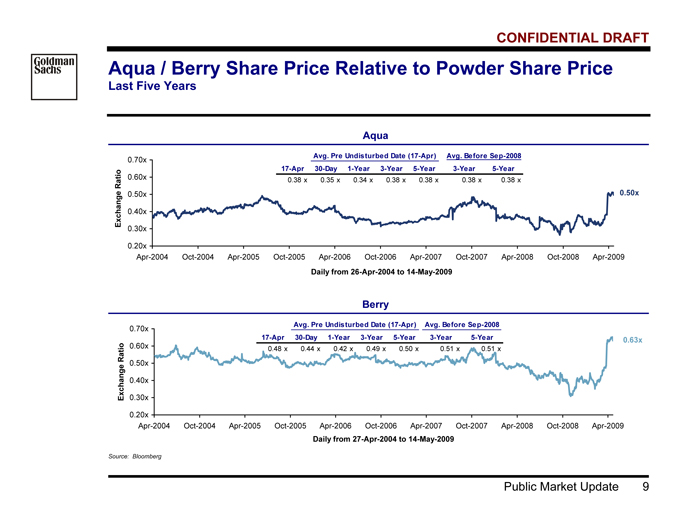
Aqua / Berry Share Price Relative to Powder Share Price
Last Five Years
Aqua
0.50x
0.20x
0.30x
0.40x
0.50x
0.60x
0.70x
Apr-2004 Oct-2004 Apr-2005 Oct-2005 Apr-2006 Oct-2006 Apr-2007 Oct-2007 Apr-2008 Oct-2008 Apr-2009
Daily from 26-Apr-2004 to 14-May-2009
Exchange Ratio
Avg. Pre Undisturbed Date (17-Apr) Avg. Before Sep-2008
17-Apr 30-Day 1-Year 3-Year 5-Year 3-Year 5-Year
0.38 x 0.35 x 0.34 x 0.38 x 0.38 x 0.38 x 0.38 x
Berry
0.63x
0.20x
0.30x
0.40x
0.50x
0.60x
0.70x
Apr-2004 Oct-2004 Apr-2005 Oct-2005 Apr-2006 Oct-2006 Apr-2007 Oct-2007 Apr-2008 Oct-2008 Apr-2009
Daily from 27-Apr-2004 to 14-May-2009
Exchange Ratio
Avg. Pre Undisturbed Date (17-Apr) Avg. Before Sep-2008
17-Apr 30-Day 1-Year 3-Year 5-Year 3-Year 5-Year
0.48 x 0.44 x 0.42 x 0.49 x 0.50 x 0.51 x 0.51 x
Source: Bloomberg
Goldman Sachs CONFIDENTIAL DRAFT
Summary Analysis 10
II. Summary Analysis
Goldman Sachs CONFIDENTIAL DRAFT
Summary Analysis 11
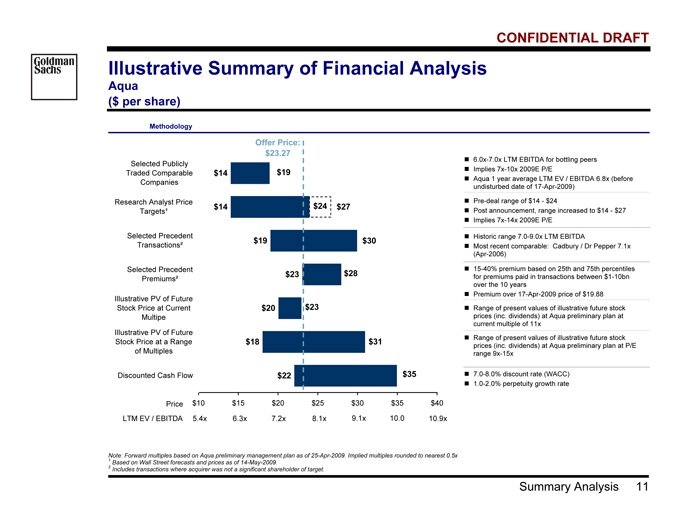
Illustrative Summary of Financial Analysis
Aqua
($ per share)
Note: Forward multiples based on Aqua preliminary management plan as of 25-Apr-2009. Implied multiples rounded to nearest 0.5x
1 | | Based on Wall Street forecasts and prices as of 14-May-2009. |
2 | | Includes transactions where acquirer was not a significant shareholder of target. |
Methodology
? 6.0x-7.0x LTM EBITDA for bottling peers
? Implies 7x-10x 2009E P/E
? Aqua 1 year average LTM EV / EBITDA 6.8x (before
undisturbed date of 17-Apr-2009)
? Pre-deal range of $14—$24
? Post announcement, range increased to $14—$27
? Implies 7x-14x 2009E P/E
? Historic range 7.0-9.0x LTM EBITDA
? Most recent comparable: Cadbury / Dr Pepper 7.1x
(Apr-2006)
? 15-40% premium based on 25th and 75th percentiles
for premiums paid in transactions between $1-10bn
over the 10 years
? Premium over 17-Apr-2009 price of $19.88
? Range of present values of illustrative future stock
prices (inc. dividends) at Aqua preliminary plan at
current multiple of 11x
? Range of present values of illustrative future stock
prices (inc. dividends) at Aqua preliminary plan at P/E
range 9x-15x
$22
$18
$20
$23
$19
$14
$14
$10 $15 $20 $25 $30 $35 $40
Discounted Cash Flow
Illustrative PV of Future
Stock Price at a Range
of Multiples
Illustrative PV of Future
Stock Price at Current
Multipe
Selected Precedent
Premiums²
Selected Precedent
Transactions²
Research Analyst Price
Targets¹
Selected Publicly
Traded Comparable
Companies
$35
$31
$28
$30
$19
Offer Price:
$23.27
$24
$23
5.4x 6.3x 7.2x 8.1x 9.1x 10.0 10.9x
Price
LTM EV / EBITDA
$27
? 7.0-8.0% discount rate (WACC)
? 1.0-2.0% perpetuity growth rate
Goldman Sachs CONFIDENTIAL DRAFT
Summary Analysis 12
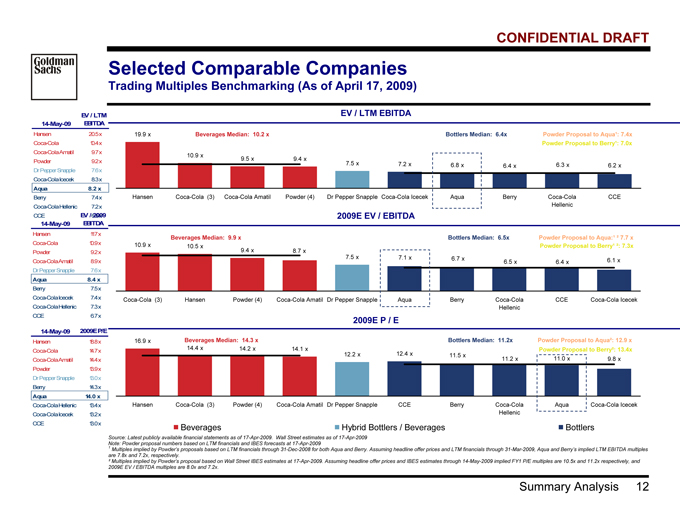
Selected Comparable Companies
Trading Multiples Benchmarking (As of April 17, 2009)
EV / LTM EBITDA
19.9 x
10.9 x 9.5 x 9.4 x
7.5 x 7.2 x 6.8 x 6.4 x 6.3 x 6.2 x
Hansen Coca-Cola (3) Coca-Cola Amatil Powder (4) Dr Pepper Snapple Coca-Cola Icecek Aqua Berry Coca-Cola
Hellenic
CCE
Beverages Median: 10.2 x Bottlers Median: 6.4x Powder Proposal to Aqua¹: 7.4x
Powder Proposal to Berry¹: 7.0x
2009E EV / EBITDA
10.9 x 10.5 x
9.4 x
7.5 x 6.1 x
8.7 x
7.1 x 6.7 x 6.5 x 6.4 x
Coca-Cola (3) Hansen Powder (4) Coca-Cola Amatil Dr Pepper Snapple Aqua Berry Coca-Cola
Hellenic
CCE Coca-Cola Icecek
Beverages Median: 9.9 x Bottlers Median: 6.5x Powder Proposal to Aqua:¹ ² 7.7 x
Powder Proposal to Berry¹ ²: 7.3x
2009E P / E
16.9 x
14.4 x 14.2 x 14.1 x
12.2 x 12.4 x
11.5 x 11.2 x 11.0 x 9.8 x
Hansen Coca-Cola (3) Powder (4) Coca-Cola Amatil Dr Pepper Snapple CCE Berry Coca-Cola
Hellenic
Aqua Coca-Cola Icecek
Beverages Median: 14.3 x Bottlers Median: 11.2x Powder Proposal to Aqua²: 12.9 x
Powder Proposal to Berry²: 13.4x
Beverages Hybrid Bottlers / Beverages Bottlers
Source: Latest publicly available financial statements as of 17-Apr-2009. Wall Street estimates as of 17-Apr-2009
Note: Powder proposal numbers based on LTM financials and IBES forecasts at 17-Apr-2009
1 Multiples implied by Powder’s proposals based on LTM financials through 31-Dec-2008 for both Aqua and Berry. Assuming headline offer prices and LTM financials through 31-Mar-2009, Aqua and Berry’s implied LTM EBITDA multiples
are 7.8x and 7.2x, respectively.
² Multiples implied by Powder’s proposal based on Wall Street IBES estimates at 17-Apr-2009. Assuming headline offer prices and IBES estimates through 14-May-2009 implied FY1 P/E multiples are 10.5x and 11.2x respectively, and
2009E EV / EBITDA multiples are 8.0x and 7.2x.
14-May-09
EV / LTM
EBITDA
Hansen 20.5x
Coca-Cola 10.4x
Coca-ColaAmatil 9.7x
Powder 9.2x
Dr Pepper Snapple 7.6x
Coca-ColaIcecek 8.3x
Aqua 8.2 x
Berry 7.4 x
Coca-ColaHellenic 7.2x
CCE 6.5x
14-May-09
EV / 2009
EBITDA
Hansen 11.7 x
Coca-Cola 10.9x
Powder 9.2x
Coca-ColaAmatil 8.9x
Dr Pepper Snapple 7.6x
Aqua 8.4 x
Berry 7.5 x
Coca-ColaIcecek 7.4x
Coca-ColaHellenic 7.3x
CCE 6.7x
14-May-09 2009E P/E
Hansen 18.8x
Coca-Cola 14.7x
Coca-ColaAmatil 14.4x
Powder 13.9x
Dr Pepper Snapple 13.0x
Berry 14.3x
Aqua 14.0 x
Coca-ColaHellenic 13.4x
Coca-ColaIcecek 13.2x
CCE 13.0x
Goldman Sachs CONFIDENTIAL DRAFT
Summary Analysis 13
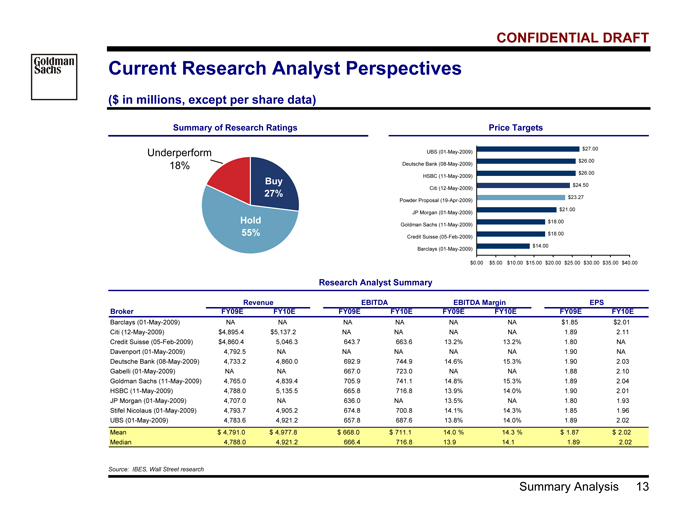
Current Research Analyst Perspectives
($ in millions, except per share data)
Summary of Research Ratings Price Targets
$14.00
$18.00
$18.00
$21.00
$23.27
$24.50
$26.00
$26.00
$27.00
$0.00 $5.00 $10.00 $15.00 $20.00 $25.00 $30.00 $35.00 $40.00
Barclays (01-May-2009)
Credit Suisse (05-Feb-2009)
Goldman Sachs (11-May-2009)
JP Morgan (01-May-2009)
Powder Proposal (19-Apr-2009)
Citi (12-May-2009)
HSBC (11-May-2009)
Deutsche Bank (08-May-2009)
UBS (01-May-2009)
Research Analyst Summary
Revenue EBITDA EBITDA Margin EPS
Broker FY09E FY10E FY09E FY10E FY09E FY10E FY09E FY10E
Barclays (01-May-2009) NA NA NA NA NA NA $1.85 $2.01
Citi (12-May-2009) $4,895.4 $5,137.2 NA NA NA NA 1.89 2.11
Credit Suisse (05-Feb-2009) $4,860.4 5,046.3 643.7 663.6 13.2% 13.2% 1.80 NA
Davenport (01-May-2009) 4,792.5 NA NA NA NA NA 1.90 NA
Deutsche Bank (08-May-2009) 4,733.2 4,860.0 692.9 744.9 14.6% 15.3% 1.90 2.03
Gabelli (01-May-2009) NA NA 667.0 723.0 NA NA 1.88 2.10
Goldman Sachs (11-May-2009) 4,765.0 4,839.4 705.9 741.1 14.8% 15.3% 1.89 2.04
HSBC (11-May-2009) 4,788.0 5,135.5 665.8 716.8 13.9% 14.0% 1.90 2.01
JP Morgan (01-May-2009) 4,707.0 NA 636.0 NA 13.5% NA 1.80 1.93
Stifel Nicolaus (01-May-2009) 4,793.7 4,905.2 674.8 700.8 14.1% 14.3% 1.85 1.96
UBS (01-May-2009) 4,783.6 4,921.2 657.8 687.6 13.8% 14.0% 1.89 2.02
Mean $ 4,791.0 $ 4,977.8 $ 668.0 $ 711.1 14.0 % 14.3 % $ 1.87 $ 2.02
Median 4,788.0 4,921.2 666.4 716.8 13.9 14.1 1.89 2.02
Source: IBES, Wall Street research
Buy
27%
Underperform
18%
Hold
55%
Goldman Sachs CONFIDENTIAL DRAFT
Summary Analysis 14
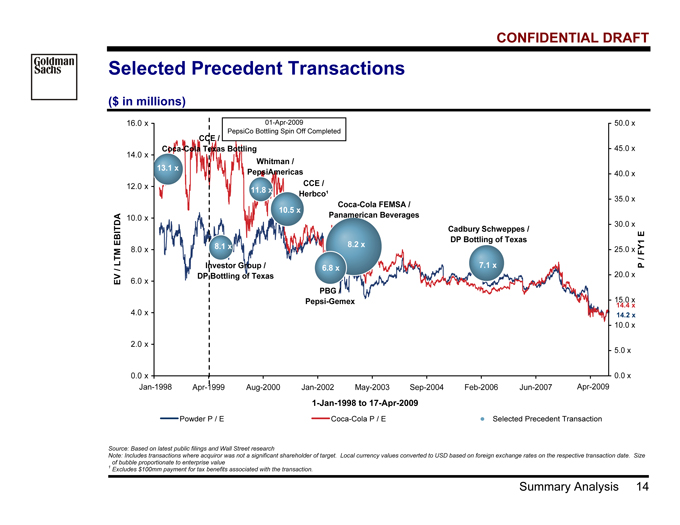
Selected Precedent Transactions
($ in millions)
14.2 x
14.4 x
01-Apr-2009
PepsiCo Bottling Spin Off Completed
Powder P / E Coca-Cola P / E Selected Precedent Transaction
Source: Based on latest public filings and Wall Street research
Note: Includes transactions where acquiror was not a significant shareholder of target. Local currency values converted to USD based on foreign exchange rates on the respective transaction date. Size
of bubble proportionate to enterprise value
1 | | Excludes $100mm payment for tax benefits associated with the transaction. |
0.0 x
2.0 x
4.0 x
6.0 x
8.0 x
10.0 x
12.0 x
14.0 x
16.0 x
Nov-1997 Apr-1999 Aug-2000 Jan-2002 May-2003 Sep-2004 Feb-2006 Jun-2007 Nov-2008
Jan-1998 to Apr-2009
EV / LTM EBITDA
0.0 x
5.0 x
10.0 x
15.0 x
20.0 x
25.0 x
30.0 x
35.0 x
40.0 x
45.0 x
50.0 x
P / FY1 E
Cadbury Schweppes /
DP Bottling of Texas
Coca-Cola FEMSA /
Panamerican Beverages
PBG /
Pepsi-Gemex
CCE /
Herbco¹
Whitman /
PepsiAmericas
Investor Group /
DP Bottling of Texas
CCE /
Coca-Cola Texas Bottling
7.1 x
8.2 x
6.8 x
10.5 x
11.8 x
8.1 x
13.1 x
Jan-1998 Apr-2009
1-Jan-1998 to 17-Apr-2009
Goldman SachsCONFIDENTIAL DRAFT
Summary Analysis 15
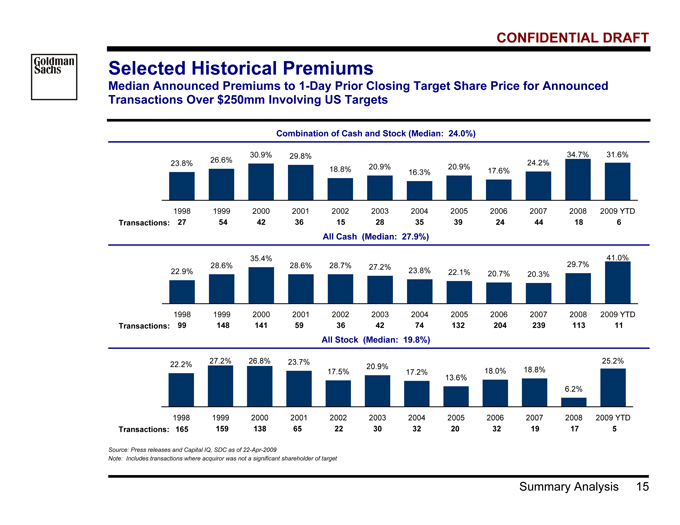
Selected Historical Premiums
Median Announced Premiums to 1-Day Prior Closing Target Share Price for Announced
Transactions Over $250mm Involving US Targets
Combination of Cash and Stock (Median: 24.0%)
23.8% 26.6%
30.9% 29.8%
18.8% 20.9%
16.3%
20.9% 17.6%
24.2%
34.7% 31.6%
1998 1999 2000 2001 2002 2003 2004 2005 2006 2007 2008 2009 YTD
Transactions: 27 54 42 36 15 28 39 24 44 35 18 6
All Cash (Median: 27.9%)
22.9%
28.6%
35.4%
28.6% 28.7% 27.2% 23.8% 22.1% 20.7% 20.3%
29.7%
41.0%
1998 1999 2000 2001 2002 2003 2004 2005 2006 2007 2008 2009 YTD
Transactions: 99 148 141 59 36 42 74 132 204 239 113 11
All Stock (Median: 19.8%)
22.2% 27.2% 26.8% 23.7%
17.5%
20.9%
17.2%
13.6%
18.0% 18.8%
6.2%
25.2%
1998 1999 2000 2001 2002 2003 2004 2005 2006 2007 2008 2009 YTD
Transactions: 165 159 138 65 22 30 32 20 32 19 17 5
Source: Press releases and Capital IQ, SDC as of 22-Apr-2009
Note: Includes transactions where acquiror was not a significant shareholder of target
Goldman Sachs CONFIDENTIAL DRAFT
Summary Analysis 16
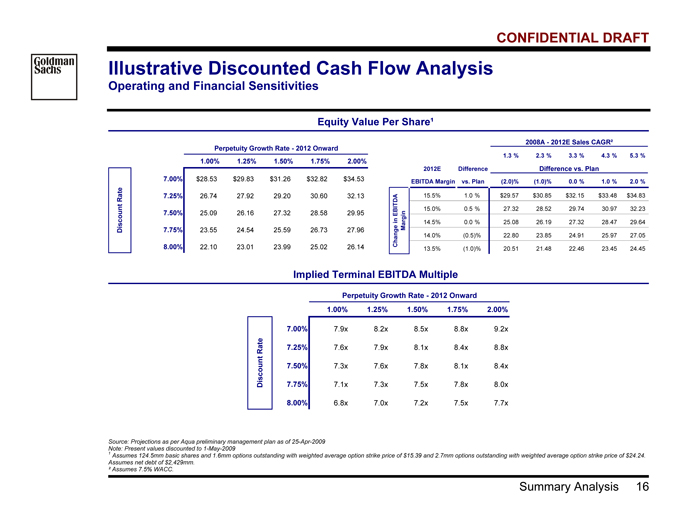
Illustrative Discounted Cash Flow Analysis
Operating and Financial Sensitivities
Equity Value Per Share¹
Perpetuity Growth Rate—2012 Onward
1.00% 1.25% 1.50% 1.75% 2.00%
7.00% $28.53 $29.83 $31.26 $32.82 $34.53
7.25% 26.74 27.92 29.20 30.60 32.13
7.50% 25.09 26.16 27.32 28.58 29.95
7.75% 23.55 24.54 25.59 26.73 27.96
8.00% 22.10 23.01 23.99 25.02 26.14
Discount Rate
2008A—2012E Sales CAGR²
1.3 % 2.3 % 3.3 % 4.3 % 5.3 %
2012E Difference Difference vs. Plan
EBITDA Margin vs. Plan (2.0)% (1.0)% 0.0 % 1.0 % 2.0 %
15.5% 1.0 % $29.57 $30.85 $32.15 $33.48 $34.83
15.0% 0.5 % 27.32 28.52 29.74 30.97 3 2.23
14.5% 0.0 % 25.08 26.19 27.32 28.47 2 9.64
14.0% (0.5)% 22.80 23.85 24.91 25.97 2 7.05
13.5% (1.0)% 20.51 21.48 22.46 23.45 2 4.45
Change in EBITDA
Margin
Implied Terminal EBITDA Multiple
Perpetuity Growth Rate—2012 Onward
1.00% 1.25% 1.50% 1.75% 2.00%
7.00% 7.9x 8.2x 8.5x 8.8x 9.2x
7.25% 7.6x 7.9x 8.1x 8.4x 8.8x
7.50% 7.3x 7.6x 7.8x 8.1x 8.4x
7.75% 7.1x 7.3x 7.5x 7.8x 8.0x
8.00% 6.8x 7.0x 7.2x 7.5x 7.7x
Discount Rate
Source: Projections as per Aqua preliminary management plan as of 25-Apr-2009
Note: Present values discounted to 1-May-2009
1 Assumes 124.5mm basic shares and 1.6mm options outstanding with weighted average option strike price of $15.39 and 2.7mm options outstanding with weighted average option strike price of $24.24.
Assumes net debt of $2,429mm.
² Assumes 7.5% WACC.
Goldman Sachs CONFIDENTIAL DRAFT
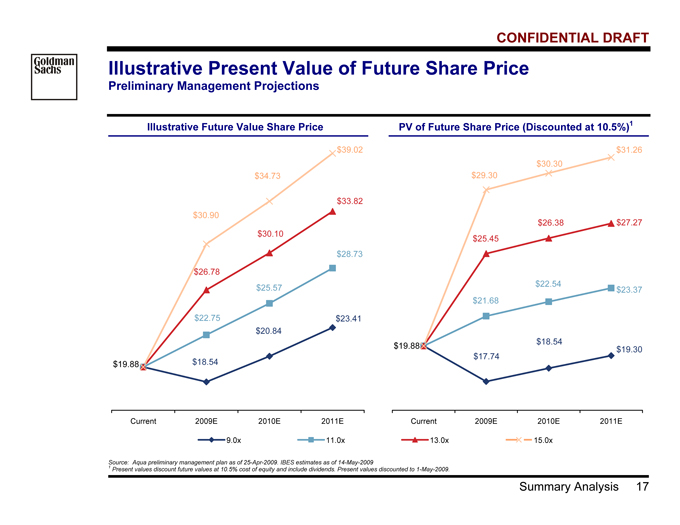
Summary Analysis 17
Illustrative Present Value of Future Share Price
Preliminary Management Projections
Illustrative Future Value Share Price PV of Future Share Price (Discounted at 10.5%)1
$23.41
$18.54
$20.84
$28.73
$25.57
$22.75
$30.10
$26.78
$33.82
$19.88
$30.90
$34.73
$39.02
Current 2009E 2010E 2011E
$19.30
$18.54
$17.74
$23.37
$22.54
$21.68
$26.38 $27.27
$25.45
$29.30
$30.30
$31.26
$19.88
Current 2009E 2010E 2011E
9.0x 11.0x 13.0x 15.0x
Source: Aqua preliminary management plan as of 25-Apr-2009. IBES estimates as of 14-May-2009
1 Present values discount future values at 10.5% cost of equity and include dividends. Present values discounted to 1-May-2009.

Goldman Sachs CONFIDENTIAL DRAFT
Summary Analysis 18
FX Sensitivity Case12
Management FX Sensitivity Case
Preliminary Management Projections (as of 25-Apr-09) vs. FX Sensitivity Case
EBITDA Forecasts EPS Forecasts
$650
$679
$729
$778
$657
$690
$759
$831
FY2009YE FY2010YE FY2011YE FY2012YE
1.1 % 1.6 % 4.0 % 6.7 %
$ 1.89
$ 2.11
$ 2.47
$ 1.89 $ 2.06
$ 2.60
$ 2.32
$ 2.91
FY2009YE FY2010YE FY2011YE FY2012YE
(0.2)% 2.4 % 6.8 % 12.0 %
Management Plan (25-Apr-09) FX Sensitivity
PV of Future Stock Price (Discounted at 10.5%) DCF Sensitivity Case (1) (2)
$19.88 $18.16 $19.74 $21.46
$22.20 $24.03 $26.02
$28.12 $30.39
$26.06
$32.31 $34.86
$30.01
Current 2009YE 2010YE 2011YE
9.0x 11.0x 13.0x 15.0x
Perpetuity Growth Rate—2012 Onward
1.00% 1.25% 1.50% 1.75% 2.00%
7.00% $31.37 $32.80 $34.36 $36.06 $37.93
7.25% 29.46 30.75 32.16 33.68 35.36
7.50% 27.69 28.87 30.14 31.52 33.02
7.75% 26.06 27.13 28.28 29.53 30.88
8.00% 24.54 25.52 26.57 27.70 28.93
Discount Rate
Source: Aqua preliminary management plan including FX sensitivity as at 30-Apr-2009
1 Assumes 124.5mm basic shares and 1.6mm options outstanding with weighted average option strike price of $15.39 and 2.7mm options outstanding with weighted average option strike price of $24.24. Assumes net debt of $2,429mm.
Goldman Sachs CONFIDENTIAL DRAFT
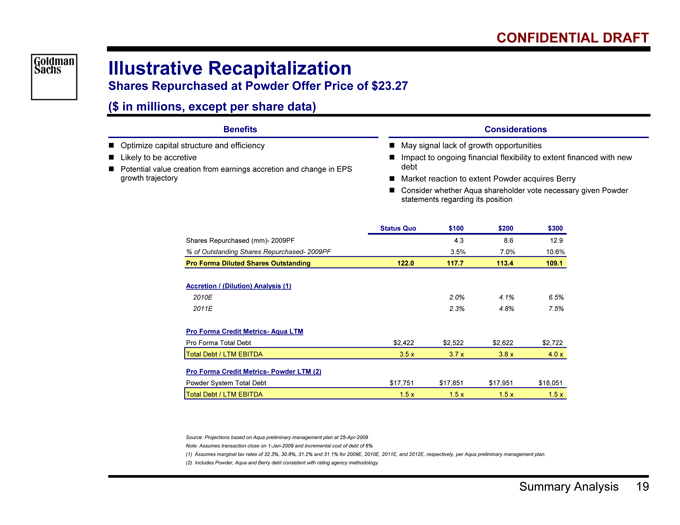
Summary Analysis 19
Illustrative Recapitalization
Shares Repurchased at Powder Offer Price of $23.27
($ in millions, except per share data)
Benefits Considerations
? Optimize capital structure and efficiency
? Likely to be accretive
? Potential value creation from earnings accretion and change in EPS
growth trajectory
? May signal lack of growth opportunities
? Impact to ongoing financial flexibility to extent financed with new
debt
? Market reaction to extent Powder acquires Berry
? Consider whether Aqua shareholder vote necessary given Powder
statements regarding its position
Status Quo $100 $200 $300
Shares Repurchased (mm)- 2009PF 4.3 8.6 12.9
% of Outstanding Shares Repurchased- 2009PF 3.5% 7.0% 10.6%
Pro Forma Diluted Shares Outstanding 122.0 117.7 113.4 109.1
Accretion / (Dilution) Analysis (1)
2010E 2.0% 4.1% 6.5%
2011E 2.3% 4.8% 7.5%
Pro Forma Credit Metrics- Aqua LTM
Pro Forma Total Debt $2,422 $2,522 $2,622 $2,722
Total Debt / LTM EBITDA 3.5 x 3.7 x 3.8 x 4.0 x
Pro Forma Credit Metrics- Powder LTM (2)
Powder System Total Debt $17,751 $17,851 $17,951 $18,051
Total Debt / LTM EBITDA 1.5 x 1.5 x 1.5 x 1.5 x
Source: Projections based on Aqua preliminary management plan at 25-Apr-2009
Note: Assumes transaction close on 1-Jan-2009 and incremental cost of debt of 6%
(1) Assumes marginal tax rates of 32.3%, 30.8%, 31.2% and 31.1% for 2009E, 2010E, 2011E, and 2012E, respectively, per Aqua preliminary management plan.
(2) | | Includes Powder, Aqua and Berry debt consistent with rating agency methodology. |
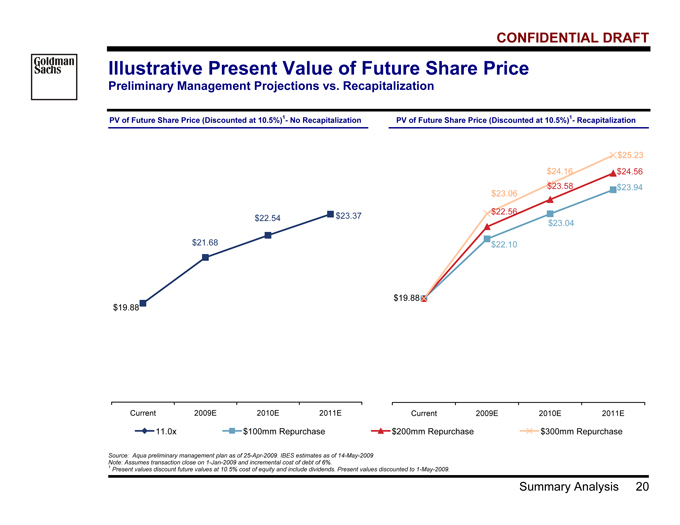
Goldman Sachs CONFIDENTIAL DRAFT
Summary Analysis 20
Illustrative Present Value of Future Share Price
Preliminary Management Projections vs. Recapitalization
PV of Future Share Price (Discounted at 10.5%)1- No Recapitalization PV of Future Share Price (Discounted at 10.5%)1- Recapitalization
$22.54 $23.37
$21.68
$19.88
Current 2009E 2010E 2011E
$25.23
$22.10
$23.04
$23.94
$22.56
$24.56
$23.58
$19.88
$23.06
$24.16
Current 2009E 2010E 2011E
11.0x $100mm Repurchase $200mm Repurchase $300mm Repurchase
Source: Aqua preliminary management plan as of 25-Apr-2009. IBES estimates as of 14-May-2009
Note: Assumes transaction close on 1-Jan-2009 and incremental cost of debt of 6%.
1 Present values discount future values at 10.5% cost of equity and include dividends. Present values discounted to 1-May-2009.
Goldman Sachs CONFIDENTIAL DRAFT
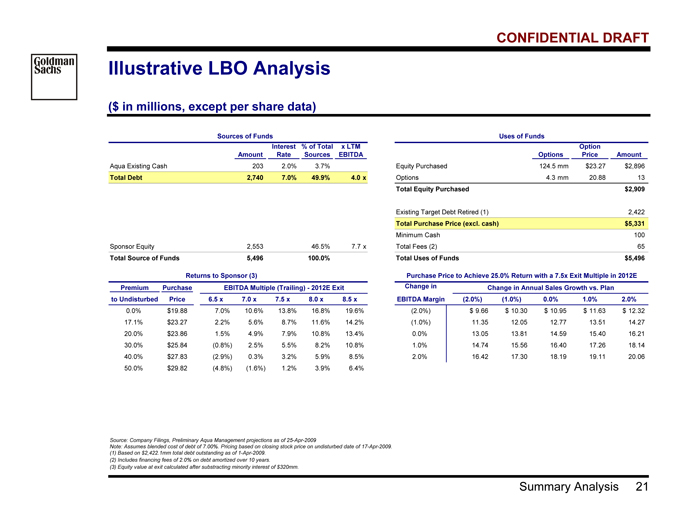
Summary Analysis 21
Illustrative LBO Analysis
($ in millions, except per share data)
Sources of Funds Uses of Funds
Interest % of Total x LTM Option
Amount Rate Sources EBITDA Options Price Amount
Aqua Existing Cash 203 2.0% 3.7% Equity Purchased 124.5 mm $23.27 $2,896
Total Debt 2,740 7.0% 49.9% 4.0 x Options 4.3 mm 20.88 13
Total Equity Purchased $2,909
Existing Target Debt Assumed 0
Existing Target Debt Retired (1) 2,422
Total Purchase Price (excl. cash) $5,331
Minimum Cash 100
Sponsor Equity 2,553 46.5% 7.7 x Total Fees (2) 65
Total Source of Funds 5,496 100.0% Total Uses of Funds $5,496
Returns to Sponsor (3) Purchase Price to Achieve 25.0% Return with a 7.5x Exit Multiple in 2012E
Premium Purchase EBITDA Multiple (Trailing)—2012E Exit Change in Change in Annual Sales Growth vs. Plan
to Undisturbed Price 6.5 x 7.0 x 7.5 x 8.0 x 8.5 x EBITDA Margin (2.0%) (1.0%) 0.0% 1.0% 2.0%
0.0% $19.88 7.0% 10.6% 13.8% 16.8% 19.6% (2.0%) $ 9.66 $ 10.30 $ 10.95 $ 11.63 $ 12.32
17.1% $23.27 2.2% 5.6% 8.7% 11.6% 14.2% (1.0%) 11.35 12.05 12.77 13.51 14.27
20.0% $23.86 1.5% 4.9% 7.9% 10.8% 13.4% 0.0% 13.05 13.81 14.59 15.40 16.21
30.0% $25.84 (0.8%) 2.5% 5.5% 8.2% 10.8% 1.0% 14.74 15.56 16.40 17.26 18.14
40.0% $27.83 (2.9%) 0.3% 3.2% 5.9% 8.5% 2.0% 16.42 17.30 18.19 19.11 20.06
50.0% $29.82 (4.8%) (1.6%) 1.2% 3.9% 6.4%
Source: Company Filings, Preliminary Aqua Management projections as of 25-Apr-2009
Note: Assumes blended cost of debt of 7.00%. Pricing based on closing stock price on undisturbed date of 17-Apr-2009.
(1) | | Based on $2,422.1mm total debt outstanding as of 1-Apr-2009. |
(2) | | Includes financing fees of 2.0% on debt amortized over 10 years. |
(3) | | Equity value at exit calculated after substracting minority interest of $320mm. |
Goldman Sachs CONFIDENTIAL DRAFT
Pro Forma Impact on Powder 22
III. Pro Forma Impact on Powder
Goldman Sachs CONFIDENTIAL DRAFT
Pro Forma Impact on Powder 23
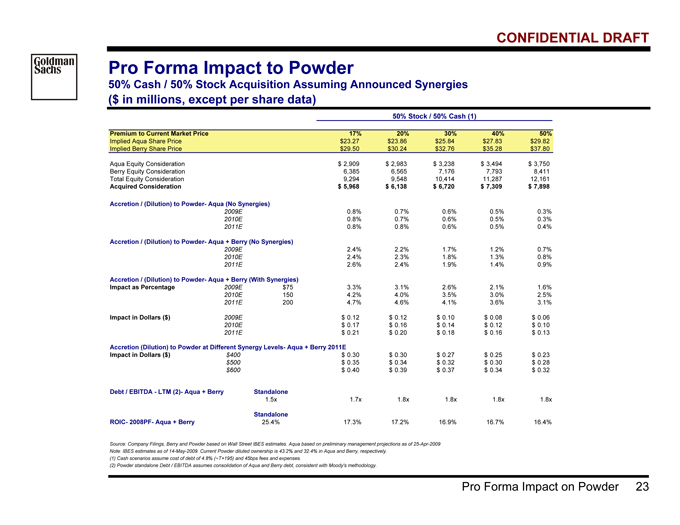
Pro Forma Impact to Powder
50% Cash / 50% Stock Acquisition Assuming Announced Synergies
($ in millions, except per share data)
50% Stock / 50% Cash (1)
Premium to Current Market Price 17% 20% 30% 40% 50%
Implied Aqua Share Price $23.27 $23.86 $25.84 $27.83 $29.82
Implied Berry Share Price $29.50 $30.24 $32.76 $35.28 $37.80
Aqua Equity Consideration $ 2,909 $ 2,983 $ 3,238 $ 3,494 $ 3,750
Berry Equity Consideration 6,385 6,565 7,176 7,793 8,411
Total Equity Consideration 9,294 9,548 10,414 11,287 12,161
Acquired Consideration $ 5,968 $ 6,138 $ 6,720 $ 7,309 $ 7,898
Accretion / (Dilution) to Powder- Aqua (No Synergies)
2009E 0.8% 0.7% 0.6% 0.5% 0.3%
2010E 0.8% 0.7% 0.6% 0.5% 0.3%
2011E 0.8% 0.8% 0.6% 0.5% 0.4%
Accretion / (Dilution) to Powder- Aqua + Berry (No Synergies)
2009E 2.4% 2.2% 1.7% 1.2% 0.7%
2010E 2.4% 2.3% 1.8% 1.3% 0.8%
2011E 2.6% 2.4% 1.9% 1.4% 0.9%
Accretion / (Dilution) to Powder- Aqua + Berry (With Synergies)
Impact as Percentage 2009E $75 3.3% 3.1% 2.6% 2.1% 1.6%
2010E 150 4.2% 4.0% 3.5% 3.0% 2.5%
2011E 200 4.7% 4.6% 4.1% 3.6% 3.1%
Impact in Dollars ($) 2009E $ 0.12 $ 0.12 $ 0.10 $ 0.08 $ 0.06
2010E $ 0.17 $ 0.16 $ 0.14 $ 0.12 $ 0.10
2011E $ 0.21 $ 0.20 $ 0.18 $ 0.16 $ 0.13
Accretion (Dilution) to Powder at Different Synergy Levels- Aqua + Berry 2011E
Impact in Dollars ($) $400 $ 0.30 $ 0.30 $ 0.27 $ 0.25 $ 0.23
$500 $ 0.35 $ 0.34 $ 0.32 $ 0.30 $ 0.28
$600 $ 0.40 $ 0.39 $ 0.37 $ 0.34 $ 0.32
Debt / EBITDA—LTM (2)- Aqua + Berry Standalone
1.5x 1.7x 1.8x 1.8x 1.8x 1.8x
Standalone
ROIC- 2008PF- Aqua + Berry 25.4% 17.3% 17.2% 16.9% 16.7% 16.4%
Source: Company Filings, Berry and Powder based on Wall Street IBES estimates. Aqua based on preliminary management projections as of 25-Apr-2009
Note: IBES estimates as of 14-May-2009. Current Powder diluted ownership is 43.2% and 32.4% in Aqua and Berry, respectively.
(1) | | Cash scenarios assume cost of debt of 4.8% (~T+195) and 45bps fees and expenses. |
(2) | | Powder standalone Debt / EBITDA assumes consolidation of Aqua and Berry debt, consistent with Moody's methodology. |
Goldman Sachs CONFIDENTIAL DRAFT
Pro Forma Impact on Powder 24
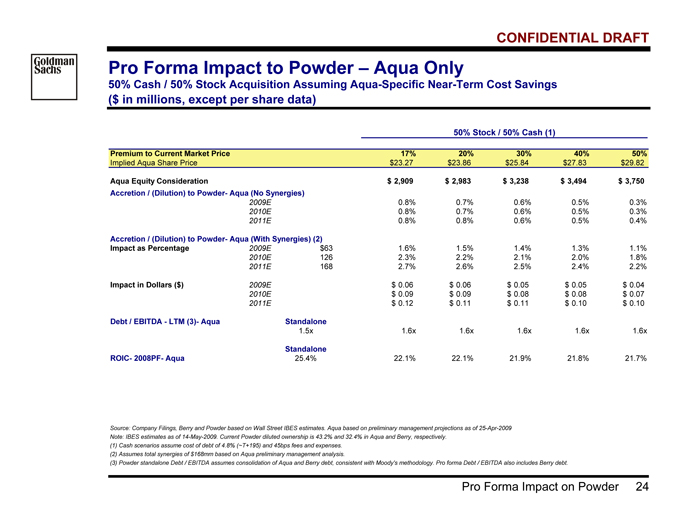
Pro Forma Impact to Powder – Aqua Only
50% Cash / 50% Stock Acquisition Assuming Aqua-Specific Near-Term Cost Savings
($ in millions, except per share data)
50% Stock / 50% Cash (1)
Premium to Current Market Price 17% 20% 30% 40% 50%
Implied Aqua Share Price $23.27 $23.86 $25.84 $27.83 $29.82
Aqua Equity Consideration $ 2,909 $ 2,983 $ 3,238 $ 3,494 $ 3,750
Accretion / (Dilution) to Powder- Aqua (No Synergies)
2009E 0.8% 0.7% 0.6% 0.5% 0.3%
2010E 0.8% 0.7% 0.6% 0.5% 0.3%
2011E 0.8% 0.8% 0.6% 0.5% 0.4%
Accretion / (Dilution) to Powder- Aqua (With Synergies) (2)
Impact as Percentage 2009E $63 1.6% 1.5% 1.4% 1.3% 1.1%
2010E 126 2.3% 2.2% 2.1% 2.0% 1.8%
2011E 168 2.7% 2.6% 2.5% 2.4% 2.2%
Impact in Dollars ($) 2009E $ 0.06 $ 0.06 $ 0.05 $ 0.05 $ 0.04
2010E $ 0.09 $ 0.09 $ 0.08 $ 0.08 $ 0.07
2011E $ 0.12 $ 0.11 $ 0.11 $ 0.10 $ 0.10
Debt / EBITDA—LTM (3)- Aqua Standalone
1.5x 1.6x 1.6x 1.6x 1.6x 1.6x
Standalone
ROIC- 2008PF- Aqua 25.4% 22.1% 22.1% 21.9% 21.8% 21.7%
Source: Company Filings, Berry and Powder based on Wall Street IBES estimates. Aqua based on preliminary management projections as of 25-Apr-2009
Note: IBES estimates as of 14-May-2009. Current Powder diluted ownership is 43.2% and 32.4% in Aqua and Berry, respectively.
(1) | | Cash scenarios assume cost of debt of 4.8% (~T+195) and 45bps fees and expenses. |
(2) | | Assumes total synergies of $168mm based on Aqua preliminary management analysis. |
(3) Powder standalone Debt / EBITDA assumes consolidation of Aqua and Berry debt, consistent with Moody's methodology. Pro forma Debt / EBITDA also includes Berry debt.
Goldman Sachs CONFIDENTIAL DRAFT
Pro Forma Impact on Powder 25
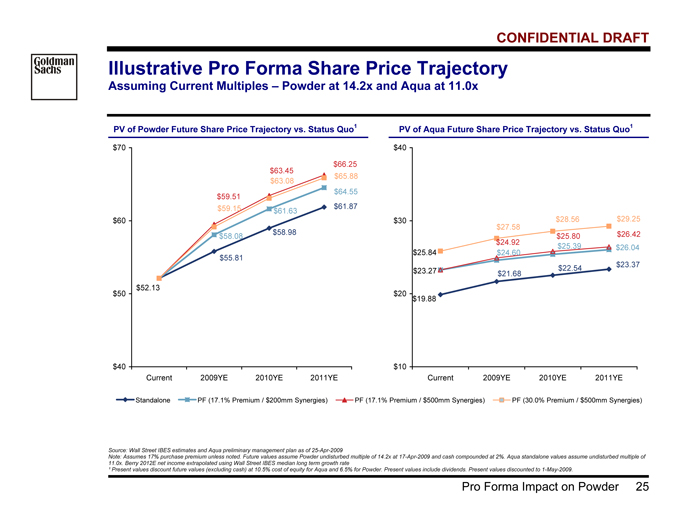
Illustrative Pro Forma Share Price Trajectory
Assuming Current Multiples – Powder at 14.2x and Aqua at 11.0x
PV of Powder Future Share Price Trajectory vs. Status Quo1 PV of Aqua Future Share Price Trajectory vs. Status Quo1
$58.98
$61.87
$55.81
$58.08
$61.63
$64.55
$66.25
$63.45
$59.51
$52.13
$59.15
$63.08 $65.88
$40
$50
$60
$70
Current 2009YE 2010YE 2011YE
$19.88
$22.54 $23.37
$21.68
$24.60
$25.39 $26.04
$26.42
$23.27
$24.92
$25.80
$25.84
$28.56 $29.25
$27.58
$10
$20
$30
$40
Current 2009YE 2010YE 2011YE
Standalone PF (17.1% Premium / $200mm Synergies) PF (17.1% Premium / $500mm Synergies) PF (30.0% Premium / $500mm Synergies)
Source: Wall Street IBES estimates and Aqua preliminary management plan as of 25-Apr-2009
Note: Assumes 17% purchase premium unless noted. Future values assume Powder undisturbed multiple of 14.2x at 17-Apr-2009 and cash compounded at 2%. Aqua standalone values assume undisturbed multiple of
11.0x. Berry 2012E net income extrapolated using Wall Street IBES median long term growth rate
¹ Present values discount future values (excluding cash) at 10.5% cost of equity for Aqua and 6.5% for Powder. Present values include dividends. Present values discounted to 1-May-2009.
Goldman Sachs CONFIDENTIAL DRAFT
Pro Forma Impact on Powder 26
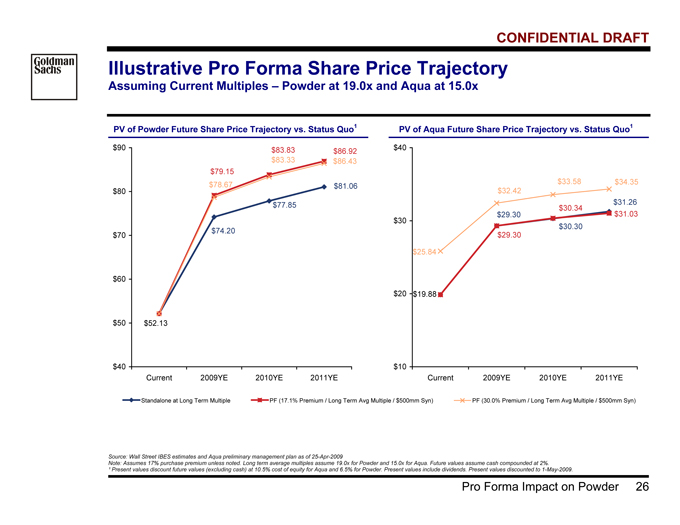
Illustrative Pro Forma Share Price Trajectory
Assuming Current Multiples – Powder at 19.0x and Aqua at 15.0x
PV of Powder Future Share Price Trajectory vs. Status Quo1 PV of Aqua Future Share Price Trajectory vs. Status Quo1
$74.20
$81.06
$77.85
$52.13
$83.83 $86.92
$79.15
$78.67
$83.33 $86.43
$40
$50
$60
$70
$80
$90
Current 2009YE 2010YE 2011YE
$30.30
$31.26
$29.30
$19.88
$29.30
$30.34
$31.03
$25.84
$32.42
$33.58 $34.35
$10
$20
$30
$40
Current 2009YE 2010YE 2011YE
Standalone at Long Term Multiple PF (17.1% Premium / Long Term Avg Multiple / $500mm Syn) PF (30.0% Premium / Long Term Avg Multiple / $500mm Syn)
Source: Wall Street IBES estimates and Aqua preliminary management plan as of 25-Apr-2009
Note: Assumes 17% purchase premium unless noted. Long term average multiples assume 19.0x for Powder and 15.0x for Aqua. Future values assume cash compounded at 2%.
¹ Present values discount future values (excluding cash) at 10.5% cost of equity for Aqua and 6.5% for Powder. Present values include dividends. Present values discounted to 1-May-2009.
Goldman Sachs CONFIDENTIAL DRAFT
Pro Forma Impact on Powder 27
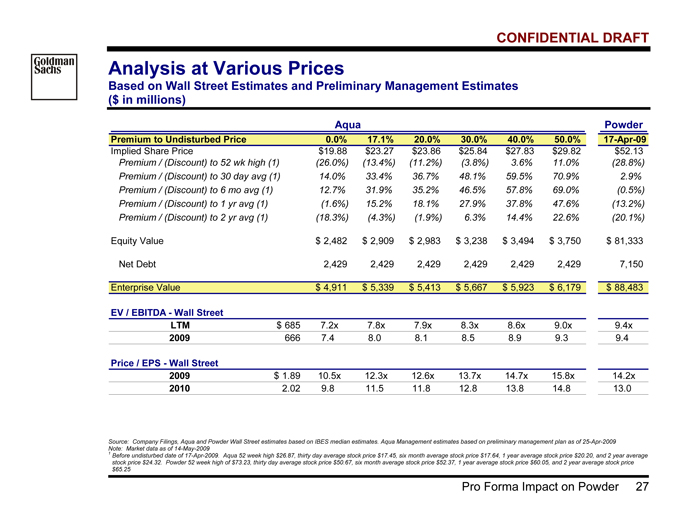
Analysis at Various Prices
Based on Wall Street Estimates and Preliminary Management Estimates
($ in millions)
Aqua Powder
Premium to Undisturbed Price 0.0% 17.1% 20.0% 30.0% 40.0% 50.0% 17-Apr-09
Implied Share Price $19.88 $23.27 $23.86 $25.84 $27.83 $29.82 $52.13
Premium / (Discount) to 52 wk high (1) (26.0%) (13.4%) (11.2%) (3.8%) 3.6% 11.0% (28.8%)
Premium / (Discount) to 30 day avg (1) 14.0% 33.4% 36.7% 48.1% 59.5% 70.9% 2.9%
Premium / (Discount) to 6 mo avg (1) 12.7% 31.9% 35.2% 46.5% 57.8% 69.0% (0.5%)
Premium / (Discount) to 1 yr avg (1) (1.6%) 15.2% 18.1% 27.9% 37.8% 47.6% (13.2%)
Premium / (Discount) to 2 yr avg (1) (18.3%) (4.3%) (1.9%) 6.3% 14.4% 22.6% (20.1%)
Equity Value $ 2,482 $ 2,909 $ 2,983 $ 3,238 $ 3,494 $ 3,750 $ 81,333
Net Debt 2,429 2,429 2,429 2,429 2,429 2,429 7,150
Enterprise Value $ 4,911 $ 5,339 $ 5,413 $ 5,667 $ 5,923 $ 6,179 $ 88,483
EV / EBITDA—Wall Street
LTM $ 685 7.2x 7.8x 7.9x 8.3x 8.6x 9.0x 9.4x
2009 666 7.4 8.0 8.1 8.5 8.9 9.3 9.4
Price / EPS—Wall Street
2009 $ 1.89 10.5x 12.3x 12.6x 13.7x 14.7x 15.8x 14.2x
2010 2.02 9.8 11.5 11.8 12.8 13.8 14.8 13.0
Source: Company Filings, Aqua and Powder Wall Street estimates based on IBES median estimates. Aqua Management estimates based on preliminary management plan as of 25-Apr-2009
Note: Market data as of 14-May-2009
1 Before undisturbed date of 17-Apr-2009. Aqua 52 week high $26.87, thirty day average stock price $17.45, six month average stock price $17.64, 1 year average stock price $20.20, and 2 year average
stock price $24.32. Powder 52 week high of $73.23, thirty day average stock price $50.67, six month average stock price $52.37, 1 year average stock price $60.05, and 2 year average stock price
$65.25
Goldman Sachs CONFIDENTIAL DRAFT
Supplementary Materials 28
Appendix A: Supplementary Materials
Goldman Sachs CONFIDENTIAL DRAFT
Supplementary Materials 29
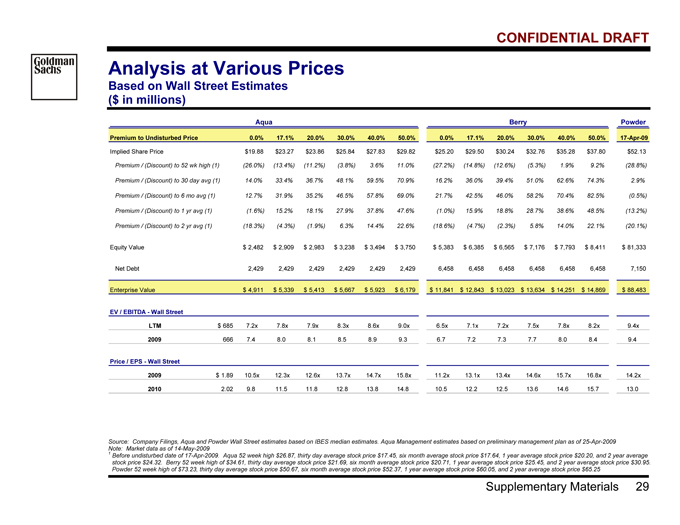
Analysis at Various Prices
Based on Wall Street Estimates
($ in millions)
Aqua Berry Powder
Premium to Undisturbed Price 0.0% 17.1% 20.0% 30.0% 40.0% 50.0% 0.0% 17.1% 20.0% 30.0% 40.0% 50.0% 17-Apr-09
Implied Share Price $19.88 $23.27 $23.86 $25.84 $27.83 $29.82 $25.20 $29.50 $30.24 $32.76 $35.28 $37.80 $52.13
Premium / (Discount) to 52 wk high (1) (26.0%) (13.4%) (11.2%) (3.8%) 3.6% 11.0% (27.2%) (14.8%) (12.6%) (5.3%) 1.9% 9.2% (28.8%)
Premium / (Discount) to 30 day avg (1) 14.0% 33.4% 36.7% 48.1% 59.5% 70.9% 16.2% 36.0% 39.4% 51.0% 62.6% 74.3% 2.9%
Premium / (Discount) to 6 mo avg (1) 12.7% 31.9% 35.2% 46.5% 57.8% 69.0% 21.7% 42.5% 46.0% 58.2% 70.4% 82.5% (0.5%)
Premium / (Discount) to 1 yr avg (1) (1.6%) 15.2% 18.1% 27.9% 37.8% 47.6% (1.0%) 15.9% 18.8% 28.7% 38.6% 48.5% (13.2%)
Premium / (Discount) to 2 yr avg (1) (18.3%) (4.3%) (1.9%) 6.3% 14.4% 22.6% (18.6%) (4.7%) (2.3%) 5.8% 14.0% 22.1% (20.1%)
Equity Value $ 2,482 $ 2,909 $ 2,983 $ 3,238 $ 3,494 $ 3,750 $ 5,383 $ 6,385 $ 6,565 $ 7,176 $ 7,793 $ 8,411 $ 81,333
Net Debt 2,429 2,429 2,429 2,429 2,429 2,429 6,458 6,458 6,458 6,458 6,458 6,458 7,150
Enterprise Value $ 4,911 $ 5,339 $ 5,413 $ 5,667 $ 5,923 $ 6,179 $ 11,841 $ 12,843 $ 13,023 $ 13,634 $ 14,251 $ 14,869 $ 88,483
EV / EBITDA—Wall Street
LTM $ 685 7.2x 7.8x 7.9x 8.3x 8.6x 9.0x 6.5x 7.1x 7.2x 7.5x 7.8x 8.2x 9.4x
2009 666 7.4 8.0 8.1 8.5 8.9 9.3 6.7 7.2 7.3 7.7 8.0 8.4 9.4
Price / EPS—Wall Street
2009 $ 1.89 10.5x 12.3x 12.6x 13.7x 14.7x 15.8x 11.2x 13.1x 13.4x 14.6x 15.7x 16.8x 14.2x
2010 2.02 9.8 11.5 11.8 12.8 13.8 14.8 10.5 12.2 12.5 13.6 14.6 15.7 13.0
Source: Company Filings, Aqua and Powder Wall Street estimates based on IBES median estimates. Aqua Management estimates based on preliminary management plan as of 25-Apr-2009
Note: Market data as of 14-May-2009
1 Before undisturbed date of 17-Apr-2009. Aqua 52 week high $26.87, thirty day average stock price $17.45, six month average stock price $17.64, 1 year average stock price $20.20, and 2 year average
stock price $24.32. Berry 52 week high of $34.61, thirty day average stock price $21.69, six month average stock price $20.71, 1 year average stock price $25.45, and 2 year average stock price $30.95.
Powder 52 week high of $73.23, thirty day average stock price $50.67, six month average stock price $52.37, 1 year average stock price $60.05, and 2 year average stock price $65.25
Goldman Sachs CONFIDENTIAL DRAFT
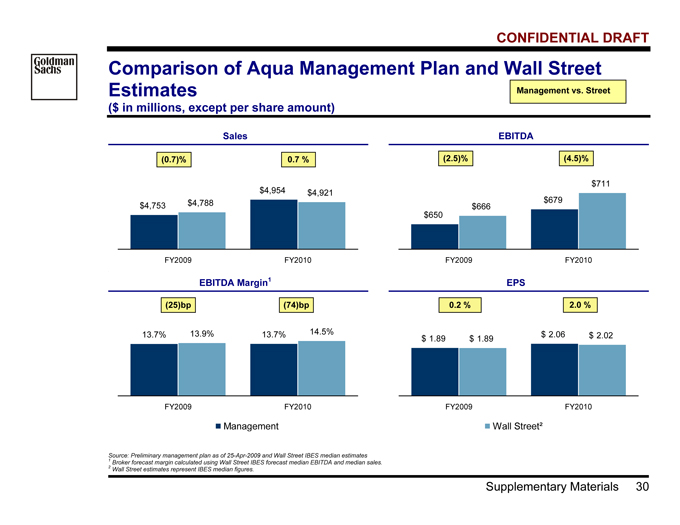
Supplementary Materials 30
Comparison of Aqua Management Plan and Wall Street
Estimates
($ in millions, except per share amount)
Sales EBITDA
$4,753
$4,954
$4,788
$4,921
FY2009 FY2010
(0.7)% 0.7 %
$650
$679
$666
$711
FY2009 FY2010
(2.5)% (4.5)%
.
EBITDA Margin1 EPS
13.7% 13.713.9% % 14.5%
FY2009 FY2010
(25)bp (74)bp
$ 1.89 $ 1.89 $ 2.06 $ 2.02
FY2009 FY2010
0.2 % 2.0 %
Management Wall Street²
Source: Preliminary management plan as of 25-Apr-2009 and Wall Street IBES median estimates
1 | | Broker forecast margin calculated using Wall Street IBES forecast median EBITDA and median sales. |
2 | | Wall Street estimates represent IBES median figures. |
Management vs. Street