Exhibit (c)(8)
HIGHLY CONFIDENTIAL
Project Periwinkle
Discussion Materials
Goldman, Sachs & Co.
August 4, 2009
Goldman Sachs
HIGHLY CONFIDENTIAL
Table of Contents
I. Summary of Transaction
II. Review of Financial Projections
III. Summary Financial Analysis
IV. Pro Forma Impact on Powder
V. Background Information on Powder
Appendix A: Supplemental Materials
Goldman Sachs does not provide accounting, tax, or legal advice. Notwithstanding anything in this document to the contrary, and
except as required to enable compliance with applicable securities law, you (and each of your employees, representatives, and other
agents) may disclose to any and all persons the US federal income and state tax treatment and tax structure of the transaction and all
materials of any kind (including tax opinions and other tax analyses) that are provided to you relating to such tax treatment and tax
structure, without Goldman Sachs imposing any limitation of any kind.
Goldman Sachs
HIGHLY CONFIDENTIAL
Disclaimer
Goldman, Sachs & Co. (“GS”) has prepared and provided these materials and GS’s related presentation (the “Confidential Information”) solely for the
information and assistance of the Board of Directors (the "Board") and senior management of Aqua (the "Company") in connection with its
consideration of the matters referred to herein. Without GS’s prior written consent, the Confidential Information may not be circulated or referred to
publicly, disclosed to or relied upon by any other person, or used or relied upon for any other purpose. Notwithstanding anything hereinto the contrary,
the Company may disclose to any person the US federal income and state income tax treatment and tax structure of any transaction described herein
and all materials of any kind (including tax opinions and other tax analyses) that are provided to the Company relating to such tax treatment and tax
structure, without GS imposing any limitation of any kind. The Confidential Information, including this disclaimer, is subject to, and governed by, any
written agreement between the Company, the Board and/or any committee thereof, on the hand, and GS, on the other hand.
GS and its affiliates are engaged in investment banking, commercial banking and financial advisory services, securities trading, investment
management, principal investment, financial planning, benefits counseling, risk management, hedging, financing, brokerage activities and other
financial and non-financial activities and services for various persons and entities. In the ordinary course of these activities and services, GS and its
affiliates may at any time make or hold long or short positions and investments, as well as actively trade or effect transactions, in the equity, debt and
other securities (or related derivative securities) and financial instruments (including bank loans and other obligations) of third parties, the Company,
any other party to any transaction and any of their respective affiliates or any currency or commodity that may be involved in any transaction for their
own account and for the accounts of their customers.
The Confidential Information has been prepared and based on information obtained by GS from publicly available sources, the Company’s
management and/or other sources. In preparing the Confidential Information, GS has relied upon and assumed, without assuming any responsibility
for independent verification, the accuracy and completeness of all of the financial, legal, regulatory, tax, accounting and other information provided to,
discussed with or reviewed by GS, and GS does not assume any liability for any such information. GS does not provide accounting, tax, legal or
regulatory advice. GS’s role in any due diligence review is limited solely to performing such a review as it shall deem necessary to support its own
advice and analysis and shall not be on behalf of the Company. Analyses based upon forecasts of future results are not necessarily indicative of
actual future results, which may be significantly more or less favorable than suggested by these analyses, and GS does not assume responsibility if
future results are materially different from those forecast.
GS has not made an independent evaluation or appraisal of the assets and liabilities of the Company or any other person and has no obligation to
evaluate the solvency of the Company or any person under any law. The analyses in the Confidential Information are not appraisals nor do they
necessarily reflect the prices at which businesses or securities actually may be sold or purchased. The Confidential Information does not address the
underlying business decision of the Company to engage in any transaction, or the relative merits of any strategic alternative referred to herein as
compared to any other alternative that may be available to the Company. The Confidential Information is necessarily based on economic, monetary,
market and other conditions as in effect on, and the information made available to GS as of, the date of such Confidential Information and GS
assumes no responsibility for updating or revising the Confidential Information.
Goldman Sachs
HIGHLY CONFIDENTIAL
Summary of Transaction 4
I. Summary of Transaction
Goldman Sachs
HIGHLY CONFIDENTIAL
Summary of Transaction 5
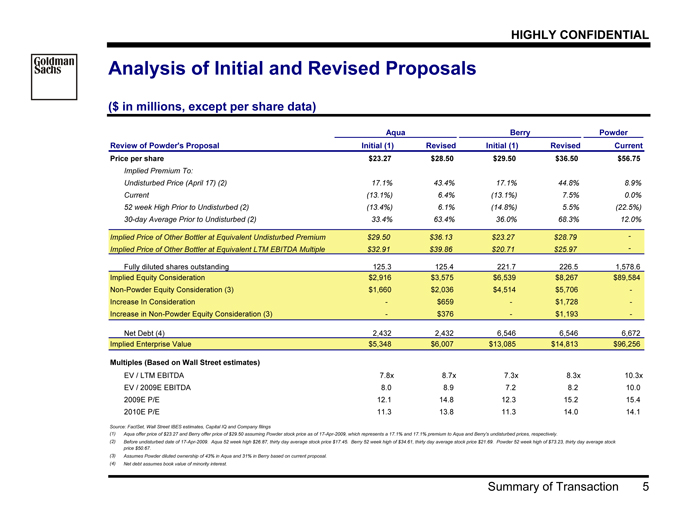
Analysis of Initial and Revised Proposals
($ in millions, except per share data)
Aqua Berry Powder
Review of Powder's Proposal Initial (1) Revised Initial (1) Revised Current
Price per share $23.27 $28.50 $29.50 $36.50 $56.75
Implied Premium To:
Undisturbed Price (April 17) (2) 17.1% 43.4% 17.1% 44.8% 8.9%
Current (13.1%) 6.4% (13.1%) 7.5% 0.0%
52 week High Prior to Undisturbed (2) (13.4%) 6.1% (14.8%) 5.5% (22.5%)
30-day Average Prior to Undisturbed (2) 33.4% 63.4% 36.0% 68.3% 12.0%
Implied Price of Other Bottler at Equivalent Undisturbed Premium $29.50 $36.13 $23.27 $28.79 -
Implied Price of Other Bottler at Equivalent LTM EBITDA Multiple $32.91 $39.86 $20.71 $25.97 -
Fully diluted shares outstanding 125.3 125.4 221.7 226.5 1,578.6
Implied Equity Consideration $2,916 $3,575 $6,539 $8,267 $89,584
Non-Powder Equity Consideration (3) $1,660 $2,036 $4,514 $5,706 -
Increase In Consideration—$659—$1,728 -
Increase in Non-Powder Equity Consideration (3)—$376—$1,193 -
Net Debt (4) 2,432 2,432 6,546 6,546 6,672
Implied Enterprise Value $5,348 $6,007 $13,085 $14,813 $96,256
Multiples (Based on Wall Street estimates)
EV / LTM EBITDA 7.8x 8.7x 7.3x 8.3x 10.3x
EV / 2009E EBITDA 8.0 8.9 7.2 8.2 10.0
2009E P/E 12.1 14.8 12.3 15.2 15.4
2010E P/E 11.3 13.8 11.3 14.0 14.1
Source: FactSet, Wall Street IBES estimates, Capital IQ and Company filings
(4) | | Net debt assumes book value of minority interest. |
Assumes Powder diluted ownership of 43% in Aqua and 31% in Berry based on current proposal.
Aqua offer price of $23.27 and Berry offer price of $29.50 assuming Powder stock price as of 17-Apr-2009, which represents a 17.1% and 17.1% premium to Aqua and Berry's undisturbed prices, respectively.
Before undisturbed date of 17-Apr-2009. Aqua 52 week high $26.87, thirty day average stock price $17.45. Berry 52 week high of $34.61, thirty day average stock price $21.69. Powder 52 week high of $73.23, thirty day average stock
price $50.67.
Goldman Sachs
HIGHLY CONFIDENTIAL
Review of Financial Projections 6
II. Review of Financial Projections
Goldman Sachs
HIGHLY CONFIDENTIAL
Review of Financial Projections 7
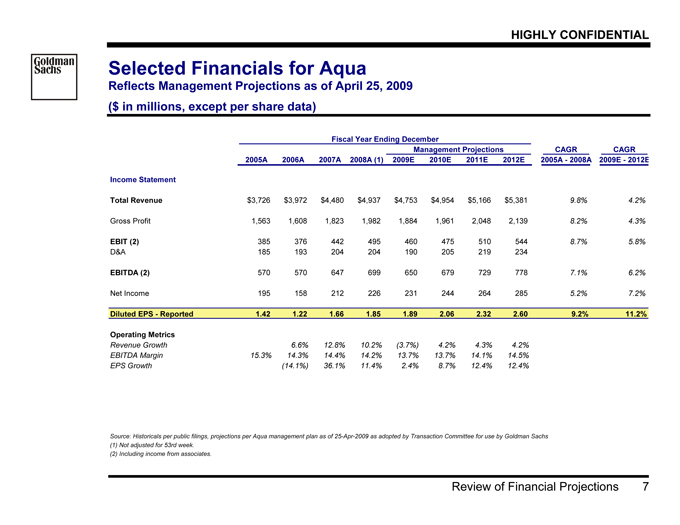
Selected Financials for Aqua
Reflects Management Projections as of April 25, 2009
($ in millions, except per share data)
Fiscal Year Ending December
Management Projections CAGR CAGR
2005A 2006A 2007A 2008A (1) 2009E 2010E 2011E 2012E 2005A—2008A 2009E—2012E
Income Statement
Total Revenue $3,726 $3,972 $4,480 $4,937 $4,753 $4,954 $5,166 $5,381 9.8% 4.2%
Gross Profit 1,563 1,608 1,823 1,982 1,884 1,961 2,048 2,139 8.2% 4.3%
EBIT (2) 385 376 442 495 460 475 510 544 8.7% 5.8%
D&A 185 193 204 204 190 205 219 234
EBITDA (2) 570 570 647 699 650 679 729 778 7.1% 6.2%
Net Income 195 158 212 226 231 244 264 285 5.2% 7.2%
Diluted EPS—Reported 1.42 1.22 1.66 1.85 1.89 2.06 2.32 2.60 9.2% 11.2%
Operating Metrics
Revenue Growth 6.6% 12.8% 10.2% (3.7%) 4.2% 4.3% 4.2%
EBITDA Margin 15.3% 14.3% 14.4% 14.2% 13.7% 13.7% 14.1% 14.5%
EPS Growth (14.1%) 36.1% 11.4% 2.4% 8.7% 12.4% 12.4%
Source: Historicals per public filings, projections per Aqua management plan as of 25-Apr-2009 as adopted by Transaction Committee for use by Goldman Sachs
(1) | | Not adjusted for 53rd week. |
(2) | | Including income from associates. |
Goldman Sachs
HIGHLY CONFIDENTIAL
Review of Financial Projections 8
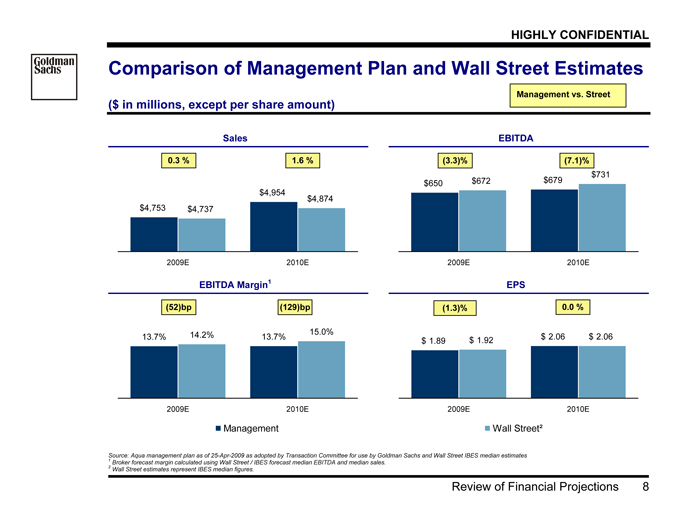
Comparison of Management Plan and Wall Street Estimates
($ in millions, except per share amount)
Sales EBITDA
$4,753
$4,954
$4,737
$4,874
2009E 2010E
0.3 % 1.6 %
$650 $672 $679
$731
2009E 2010E
(3.3)% (7.1)%
.
EBITDA Margin1 EPS
13.7% 14.2% 13.7% 15.0%
2009E 2010E
(52)bp (129)bp
$ 1.89 $ 1.92 $ 2.06 $ 2.06
2009E 2010E
(1.3)% 0.0 %
Management Wall Street²
Source: Aqua management plan as of 25-Apr-2009 as adopted by Transaction Committee for use by Goldman Sachs and Wall Street IBES median estimates
1 | | Broker forecast margin calculated using Wall Street / IBES forecast median EBITDA and median sales. |
2 | | Wall Street estimates represent IBES median figures. |
Management vs. Street
Goldman Sachs
HIGHLY CONFIDENTIAL
Summary Financial Analysis 9
III. Summary Financial Analysis
Goldman Sachs
HIGHLY CONFIDENTIAL
Summary Financial Analysis 10
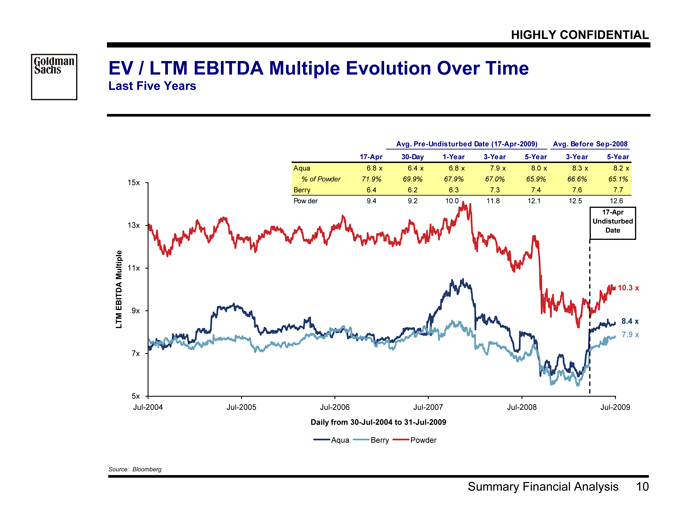
EV / LTM EBITDA Multiple Evolution Over Time
Last Five Years
5x
7x
9x
11x
13x
15x
Jul-2004 Jul-2005 Jul-2006 Jul-2007 Jul-2008 Jul-2009
Daily from 30-Jul-2004 to 31-Jul-2009
LTM EBITDA Multiple
Aqua Berry Powder
8.4 x
7.9 x
10.3 x
Avg. Pre-Undisturbed Date (17-Apr-2009) Avg. Before Sep-2008
17-Apr 30-Day 1-Year 3-Year 5-Year 3-Year 5-Year
Aqua 6.8 x 6.4 x 6.8 x 7.9 x 8.0 x 8.3 x 8.2 x
% of Powder 71.9% 69.9% 67.9% 67.0% 65.9% 66.6% 65.1%
Berry 6.4 6.2 6.3 7.3 7.4 7.6 7.7
Powder 9.4 9.2 10.0 11.8 12.1 12.5 12.6
17-Apr
Undisturbed
Date
Source: Bloomberg
Goldman Sachs
HIGHLY CONFIDENTIAL
Summary Financial Analysis 11
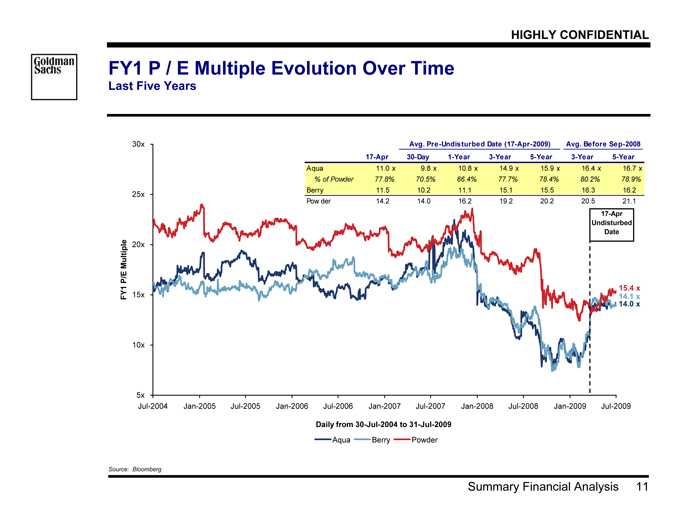
FY1 P / E Multiple Evolution Over Time
Last Five Years
5x
10x
15x
20x
25x
30x
Jul-2004 Jan-2005 Jul-2005 Jan-2006 Jul-2006 Jan-2007 Jul-2007 Jan-2008 Jul-2008 Jan-2009 Jul-2009
Daily from 30-Jul-2004 to 31-Jul-2009
FY1 P/E Multiple
Aqua Berry Powder
14.0 x
14.1 x
15.4 x
Avg. Pre-Undisturbed Date (17-Apr-2009) Avg. Before Sep-2008
17-Apr 30-Day 1-Year 3-Year 5-Year 3-Year 5-Year
Aqua 11.0 x 9.8 x 10.8 x 14.9 x 15.9 x 16.4 x 16.7 x
% of Powder 77.8% 70.5% 66.4% 77.7% 78.4% 80.2% 78.9%
Berry 11.5 10.2 11.1 15.1 15.5 16.3 16.2
Powder 14.2 14.0 16.2 19.2 20.2 20.5 21.1
17-Apr
Undisturbed
Date
Source: Bloomberg
Goldman Sachs
HIGHLY CONFIDENTIAL
Summary Financial Analysis 12
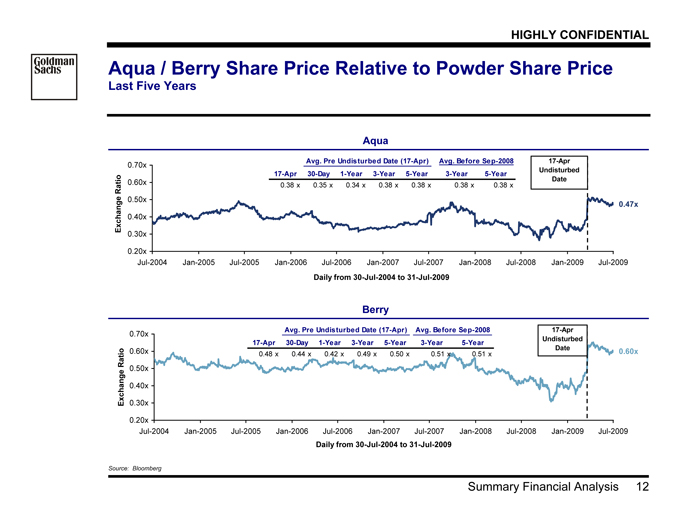
Aqua / Berry Share Price Relative to Powder Share Price
Last Five Years
Aqua
0.47x
0.20x
0.30x
0.40x
0.50x
0.60x
0.70x
Jul-2004 Jan-2005 Jul-2005 Jan-2006 Jul-2006 Jan-2007 Jul-2007 Jan-2008 Jul-2008 Jan-2009 Jul-2009
Daily from 30-Jul-2004 to 31-Jul-2009
Exchange Ratio
Avg. Pre Undisturbed Date (17-Apr) Avg. Before Sep-2008
17-Apr 30-Day 1-Year 3-Year 5-Year 3-Year 5-Year
0.38 x 0.35 x 0.34 x 0.38 x 0.38 x 0.38 x 0.38 x
17-Apr
Undisturbed
Date
Berry
0.60x
0.20x
0.30x
0.40x
0.50x
0.60x
0.70x
Jul-2004 Jan-2005 Jul-2005 Jan-2006 Jul-2006 Jan-2007 Jul-2007 Jan-2008 Jul-2008 Jan-2009 Jul-2009
Daily from 30-Jul-2004 to 31-Jul-2009
Exchange Ratio
Avg. Pre Undisturbed Date (17-Apr) Avg. Before Sep-2008
17-Apr 30-Day 1-Year 3-Year 5-Year 3-Year 5-Year
0.48 x 0.44 x 0.42 x 0.49 x 0.50 x 0.51 x 0.51 x
17-Apr
Undisturbed
Date
Source: Bloomberg
Goldman Sachs
HIGHLY CONFIDENTIAL
Summary Financial Analysis 13
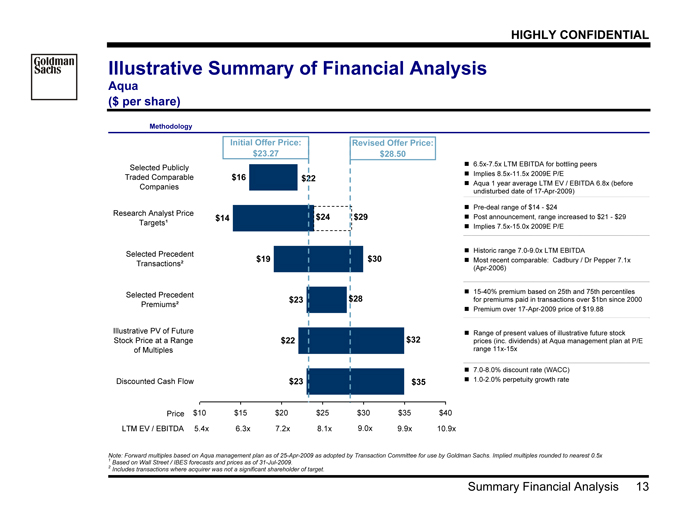
Illustrative Summary of Financial Analysis
Aqua
($ per share)
Note: Forward multiples based on Aqua management plan as of 25-Apr-2009 as adopted by Transaction Committee for use by Goldman Sachs. Implied multiples rounded to nearest 0.5x
1 | | Based on Wall Street / IBES forecasts and prices as of 31-Jul-2009. |
2 | | Includes transactions where acquirer was not a significant shareholder of target. |
Methodology
? 6.5x-7.5x LTM EBITDA for bottling peers
? Implies 8.5x-11.5x 2009E P/E
? Aqua 1 year average LTM EV / EBITDA 6.8x (before
undisturbed date of 17-Apr-2009)
? Pre-deal range of $14—$24
? Post announcement, range increased to $21—$29
? Implies 7.5x-15.0x 2009E P/E
? Historic range 7.0-9.0x LTM EBITDA
? Most recent comparable: Cadbury / Dr Pepper 7.1x
(Apr-2006)
? 15-40% premium based on 25th and 75th percentiles
for premiums paid in transactions over $1bn since 2000
? Premium over 17-Apr-2009 price of $19.88
? Range of present values of illustrative future stock
prices (inc. dividends) at Aqua management plan at P/E
range 11x-15x
$23
$22
$23
$19
$14
$16
$10 $15 $20 $25 $30 $35 $40
Discounted Cash Flow
Illustrative PV of Future
Stock Price at a Range
of Multiples
Selected Precedent
Premiums²
Selected Precedent
Transactions²
Research Analyst Price
Targets¹
Selected Publicly
Traded Comparable
Companies
$35
$32
$28
$30
$22
Revised Offer Price:
$28.50
5.4x 6.3x 7.2x 8.1x 9.0x 9.9x 10.9x
Price
LTM EV / EBITDA
$24 $29
Initial Offer Price:
$23.27
? 7.0-8.0% discount rate (WACC)
? 1.0-2.0% perpetuity growth rate
Goldman Sachs
HIGHLY CONFIDENTIAL
Summary Financial Analysis 14
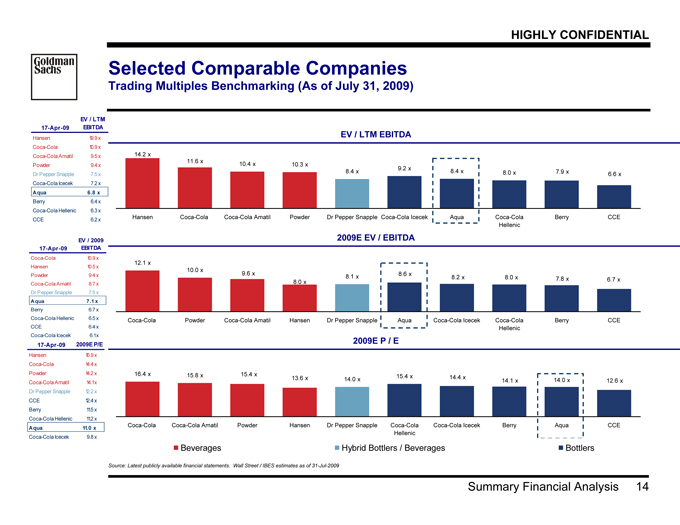
Selected Comparable Companies
Trading Multiples Benchmarking (As of July 31, 2009)
EV / LTM EBITDA
14.2 x
10.4 x 10.3 x
8.4 x 9.2 x 8.4 x 8.0 x
11.6 x
7.9 x 6.6 x
Hansen Coca-Cola Coca-Cola Amatil Powder Dr Pepper Snapple Coca-Cola Icecek Aqua Coca-Cola
Hellenic
Berry CCE
2009E EV / EBITDA
12.1 x
10.0 x
9.6 x 8.1 x
8.0 x 6.7 x
8.6 x 8.2 x 8.0 x 7.8 x
Coca-Cola Powder Coca-Cola Amatil Hansen Dr Pepper Snapple Aqua Coca-Cola Icecek Coca-Cola
Hellenic
Berry CCE
2009E P / E
16.4 x 15.8 x 15.4 x 13.6 x 14.0 x 15.4 x 14.4 x 14.1 x 14.0 x 12.6 x
Coca-Cola Coca-Cola Amatil Powder Hansen Dr Pepper Snapple Coca-Cola
Hellenic
Coca-Cola Icecek Berry Aqua CCE
Beverages Hybrid Bottlers / Beverages Bottlers
Source: Latest publicly available financial statements. Wall Street / IBES estimates as of 31-Jul-2009
17-Apr-09
EV / LTM
EBITDA
Hansen 19.9 x
Coca-Cola 10.9 x
Coca-Cola Amatil 9.5 x
Powder 9.4 x
Dr Pepper Snapple 7.5 x
Coca-Cola Icecek 7.2 x
Aqua 6.8 x
Berry 6.4 x
Coca-Cola Hellenic 6.3 x
CCE 6.2 x
17-Apr-09
EV / 2009
EBITDA
Coca-Cola 10.9 x
Hansen 10.5 x
Powder 9.4 x
Coca-Cola Amatil 8.7 x
Dr Pepper Snapple 7.5 x
Aqua 7.1 x
Berry 6.7 x
Coca-Cola Hellenic 6.5 x
CCE 6.4 x
Coca-Cola Icecek 6.1 x
17-Apr-09 2009E P/E
Hansen 16.9 x
Coca-Cola 14.4 x
Powder 14.2 x
Coca-Cola Amatil 14.1 x
Dr Pepper Snapple 12.2 x
CCE 12.4 x
Berry 11.5 x
Coca-Cola Hellenic 11.2 x
Aqua 11.0 x
Coca-Cola Icecek 9.8 x
Goldman Sachs
HIGHLY CONFIDENTIAL
Summary Financial Analysis 15
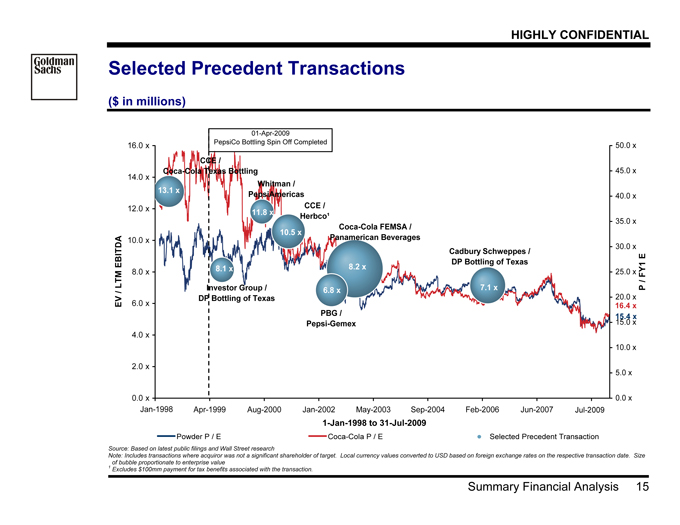
Selected Precedent Transactions
($ in millions)
15.4 x
16.4 x
01-Apr-2009
PepsiCo Bottling Spin Off Completed
Source: Based on latest public filings and Wall Street research
Note: Includes transactions where acquiror was not a significant shareholder of target. Local currency values converted to USD based on foreign exchange rates on the respective transaction date. Size
of bubble proportionate to enterprise value
1 | | Excludes $100mm payment for tax benefits associated with the transaction. |
1-Jan-1998 to 31-Jul-2009
0.0 x
2.0 x
4.0 x
6.0 x
8.0 x
10.0 x
12.0 x
14.0 x
16.0 x
Nov-1997 Apr-1999 Aug-2000 Jan-2002 May-2003 Sep-2004 Feb-2006 Jun-2007 Nov-2008
EV / LTM EBITDA
0.0 x
5.0 x
10.0 x
15.0 x
20.0 x
25.0 x
30.0 x
35.0 x
40.0 x
45.0 x
50.0 x
P / FY1 E
Cadbury Schweppes /
DP Bottling of Texas
Coca-Cola FEMSA /
Panamerican Beverages
PBG /
Pepsi-Gemex
CCE /
Herbco¹
Whitman /
PepsiAmericas
Investor Group /
DP Bottling of Texas
CCE /
Coca-Cola Texas Bottling
7.1 x
8.2 x
6.8 x
10.5 x
11.8 x
8.1 x
13.1 x
Jan-1998 Apr-JJuul-n2-022000900 99
Powder P / E Coca-Cola P / E Selected Precedent Transaction
Goldman Sachs
HIGHLY CONFIDENTIAL
Summary Financial Analysis 16
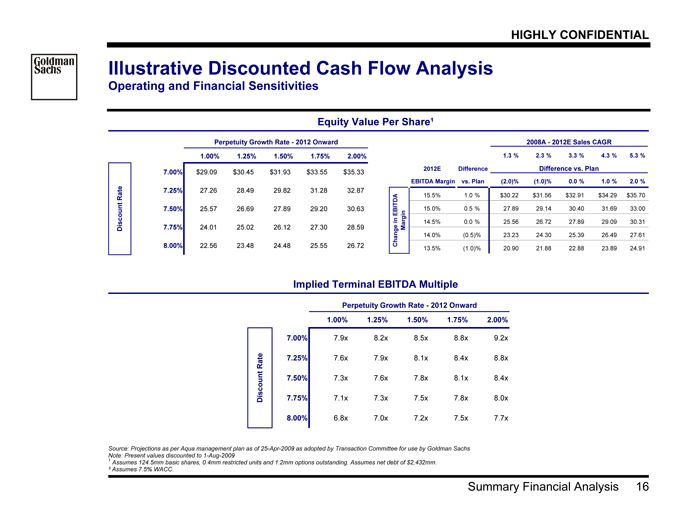
Illustrative Discounted Cash Flow Analysis
Operating and Financial Sensitivities
Equity Value Per Share¹
Perpetuity Growth Rate—2012 Onward
1.00% 1.25% 1.50% 1.75% 2.00%
7.00% $29.09 $30.45 $31.93 $33.55 $35.33
7.25% 27.26 28.49 29.82 31.28 32.87
7.50% 25.57 26.69 27.89 29.20 30.63
7.75% 24.01 25.02 26.12 27.30 28.59
8.00% 22.56 23.48 24.48 25.55 26.72
Discount Rate
2008A—2012E Sales CAGR
1.3 % 2.3 % 3.3 % 4.3 % 5.3 %
2012E Difference Difference vs. Plan
EBITDA Margin vs. Plan (2.0)% (1.0)% 0.0 % 1.0 % 2.0 %
15.5% 1.0 % $30.22 $31.56 $32.91 $34.29 $35.70
15.0% 0.5 % 27.89 29.14 30.40 31.69 3 3.00
14.5% 0.0 % 25.56 26.72 27.89 29.09 3 0.31
14.0% (0.5)% 23.23 24.30 25.39 26.49 2 7.61
13.5% (1.0)% 20.90 21.88 22.88 23.89 2 4.91
Change in EBITDA
Margin
Implied Terminal EBITDA Multiple
Perpetuity Growth Rate—2012 Onward
1.00% 1.25% 1.50% 1.75% 2.00%
7.00% 7.9x 8.2x 8.5x 8.8x 9.2x
7.25% 7.6x 7.9x 8.1x 8.4x 8.8x
7.50% 7.3x 7.6x 7.8x 8.1x 8.4x
7.75% 7.1x 7.3x 7.5x 7.8x 8.0x
8.00% 6.8x 7.0x 7.2x 7.5x 7.7x
Discount Rate
Source: Projections as per Aqua management plan as of 25-Apr-2009 as adopted by Transaction Committee for use by Goldman Sachs
Note: Present values discounted to 1-Aug-2009
1 | | Assumes 124.5mm basic shares, 0.4mm restricted units and 1.2mm options outstanding. Assumes net debt of $2,432mm. |
² Assumes 7.5% WACC.
Goldman Sachs
HIGHLY CONFIDENTIAL
Summary Financial Analysis 17
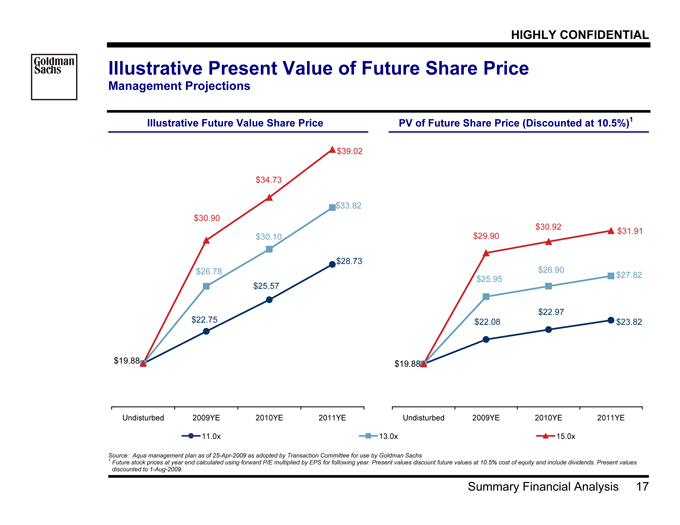
Illustrative Present Value of Future Share Price
Management Projections
Illustrative Future Value Share Price PV of Future Share Price (Discounted at 10.5%)1
$28.73
$25.57
$22.75
$30.10
$26.78
$33.82
$19.88
$30.90
$34.73
$39.02
Undisturbed 2009YE 2010YE 2011YE
$23.82
$22.97
$22.08
$26.90 $27.82
$25.95
$29.90
$30.92 $31.91
$19.88
Undisturbed 2009YE 2010YE 2011YE
11.0x 13.0x 15.0x
Source: Aqua management plan as of 25-Apr-2009 as adopted by Transaction Committee for use by Goldman Sachs
1 Future stock prices at year end calculated using forward P/E multiplied by EPS for following year. Present values discount future values at 10.5% cost of equity and include dividends. Present values
discounted to 1-Aug-2009.
Goldman Sachs
HIGHLY CONFIDENTIAL
Summary Financial Analysis 18
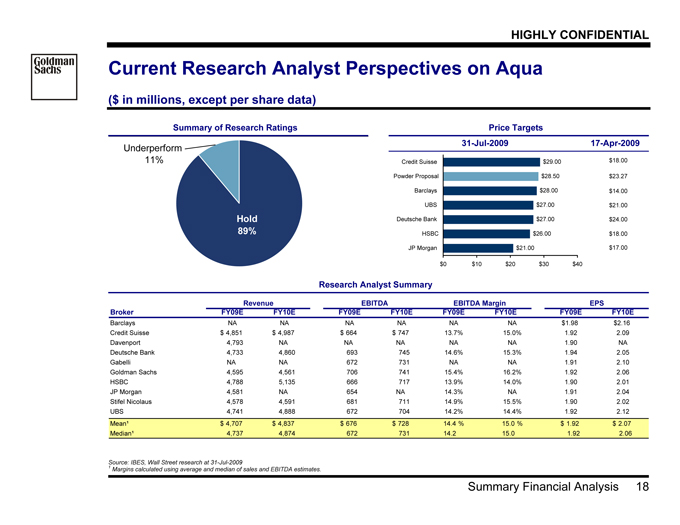
Current Research Analyst Perspectives on Aqua
($ in millions, except per share data)1
Summary of Research Ratings Price Targets
31-Jul-2009 17-Apr-2009
Hold
89%
Underperform
11%
$21.00
$26.00
$27.00
$27.00
$28.00
$28.50
$29.00
$0 $10 $20 $30 $40
JP Morgan
HSBC
Deutsche Bank
UBS
Barclays
Powder Proposal
Credit Suisse $18.00
$23.27
$14.00
$21.00
$24.00
$18.00
$17.00
Research Analyst Summary
Revenue EBITDA EBITDA Margin EPS
Broker FY09E FY10E FY09E FY10E FY09E FY10E FY09E FY10E
Barclays NA NA NA NA NA NA $1.98 $2.16
Credit Suisse $ 4,851 $ 4,987 $ 664 $ 747 13.7% 15.0% 1.92 2.09
Davenport 4,793 NA NA NA NA NA 1.90 NA
Deutsche Bank 4,733 4,860 693 745 14.6% 15.3% 1.94 2.05
Gabelli NA NA 672 731 NA NA 1.91 2.10
Goldman Sachs 4,595 4,561 706 741 15.4% 16.2% 1.92 2.06
HSBC 4,788 5,135 666 717 13.9% 14.0% 1.90 2.01
JP Morgan 4,581 NA 654 NA 14.3% NA 1.91 2.04
Stifel Nicolaus 4,578 4,591 681 711 14.9% 15.5% 1.90 2.02
UBS 4,741 4,888 672 704 14.2% 14.4% 1.92 2.12
Mean¹ $ 4,707 $ 4,837 $ 676 $ 728 14.4 % 15.0 % $ 1.92 $ 2.07
Median¹ 4,737 4,874 672 731 14.2 15.0 1.92 2.06
Source: IBES, Wall Street research at 31-Jul-2009
1 | | Margins calculated using average and median of sales and EBITDA estimates. |
Goldman Sachs
HIGHLY CONFIDENTIAL
Summary Financial Analysis 19
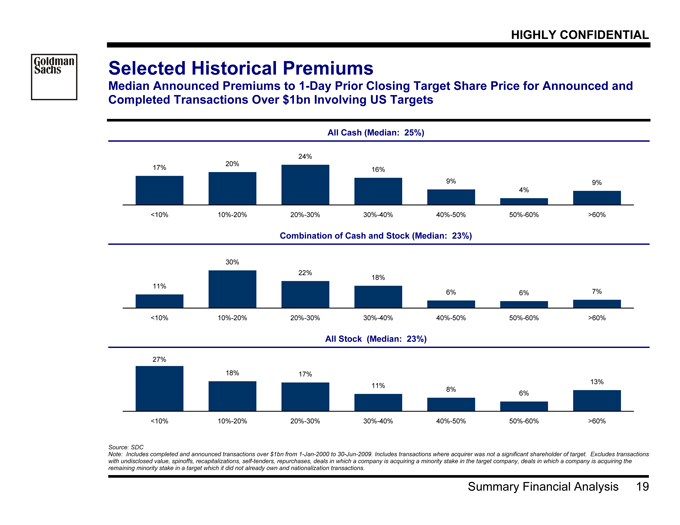
Selected Historical Premiums
Median Announced Premiums to 1-Day Prior Closing Target Share Price for Announced and
Completed Transactions Over $1bn Involving US Targets
All Cash (Median: 25%)
17% 20%
24%
16%
9%
4%
9%
<10% 10%-20% 20%-30% 30%-40% 40%-50% 50%-60% >60%
Combination of Cash and Stock (Median: 23%)
11%
30%
22%
18%
6% 6% 7%
<10% 10%-20% 20%-30% 30%-40% 40%-50% 50%-60% >60%
All Stock (Median: 23%)
27%
18% 17%
11% 8% 6%
13%
<10% 10%-20% 20%-30% 30%-40% 40%-50% 50%-60% >60%
Source: SDC
Note: Includes completed and announced transactions over $1bn from 1-Jan-2000 to 30-Jun-2009. Includes transactions where acquirer was not a significant shareholder of target. Excludes transactions
with undisclosed value, spinoffs, recapitalizations, self-tenders, repurchases, deals in which a company is acquiring a minority stake in the target company, deals in which a company is acquiring the
remaining minority stake in a target which it did not already own and nationalization transactions.
Goldman Sachs
HIGHLY CONFIDENTIAL
Summary Financial Analysis 20
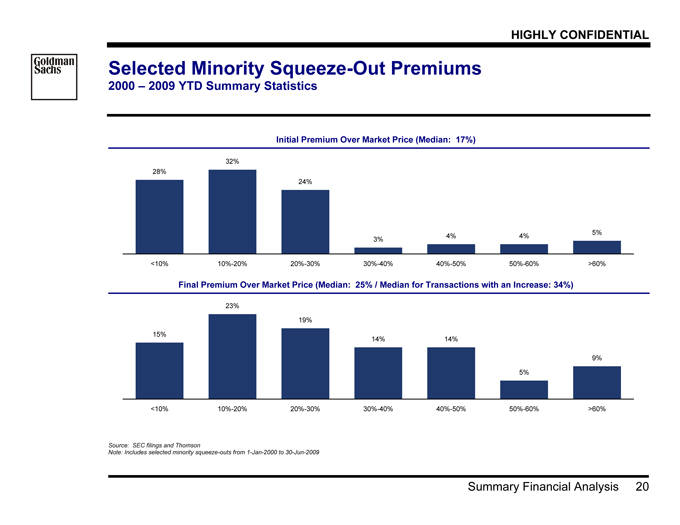
Selected Minority Squeeze-Out Premiums
2000 – 2009 YTD Summary Statistics
Initial Premium Over Market Price (Median: 17%)
28%
32%
24%
3% 4% 4% 5%
<10% 10%-20% 20%-30% 30%-40% 40%-50% 50%-60% >60%
Final Premium Over Market Price (Median: 25% / Median for Transactions with an Increase: 34%)
15%
23%
19%
14% 14%
5%
9%
<10% 10%-20% 20%-30% 30%-40% 40%-50% 50%-60% >60%
Source: SEC filings and Thomson
Note: Includes selected minority squeeze-outs from 1-Jan-2000 to 30-Jun-2009
Goldman Sachs
HIGHLY CONFIDENTIAL
Pro Forma Impact on Powder 21
IV. Pro Forma Impact on Powder
Goldman Sachs
HIGHLY CONFIDENTIAL
Pro Forma Impact on Powder 22
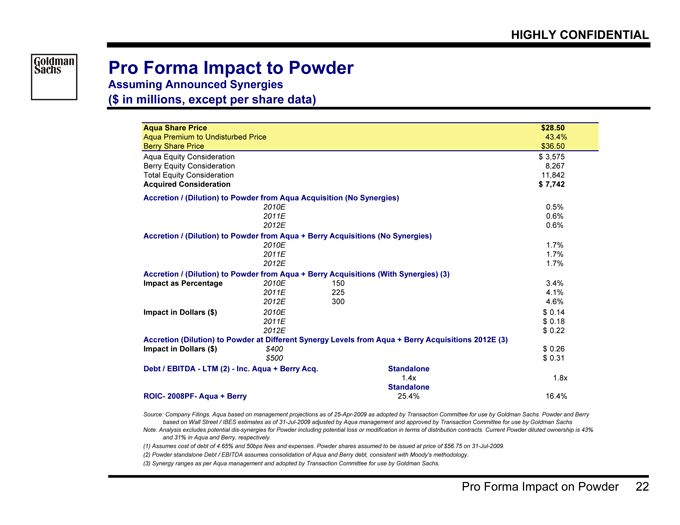
Pro Forma Impact to Powder
Assuming Announced Synergies
($ in millions, except per share data)
Aqua Share Price $28.50
Aqua Premium to Undisturbed Price 43.4%
Berry Share Price $36.50
Aqua Equity Consideration $ 3,575
Berry Equity Consideration 8,267
Total Equity Consideration 11,842
Acquired Consideration $ 7,742
Accretion / (Dilution) to Powder from Aqua Acquisition (No Synergies)
2010E 0.5%
2011E 0.6%
2012E 0.6%
Accretion / (Dilution) to Powder from Aqua + Berry Acquisitions (No Synergies)
2010E 1.7%
2011E 1.7%
2012E 1.7%
Accretion / (Dilution) to Powder from Aqua + Berry Acquisitions (With Synergies) (3)
Impact as Percentage 2010E 150 3.4%
2011E 225 4.1%
2012E 300 4.6%
Impact in Dollars ($) 2010E $ 0.14
2011E $ 0.18
2012E $ 0.22
Accretion (Dilution) to Powder at Different Synergy Levels from Aqua + Berry Acquisitions 2012E (3)
Impact in Dollars ($) $400 $ 0.26
$500 $ 0.31
Debt / EBITDA—LTM (2)—Inc. Aqua + Berry Acq. Standalone
1.4x 1.8x
Standalone
ROIC- 2008PF- Aqua + Berry 25.4% 16.4%
(1) Assumes cost of debt of 4.65% and 50bps fees and expenses. Powder shares assumed to be issued at price of $56.75 on 31-Jul-2009.
(2) | | Powder standalone Debt / EBITDA assumes consolidation of Aqua and Berry debt, consistent with Moody's methodology. |
(3) | | Synergy ranges as per Aqua management and adopted by Transaction Committee for use by Goldman Sachs. |
Source: Company Filings. Aqua based on management projections as of 25-Apr-2009 as adopted by Transaction Committee for use by Goldman Sachs. Powder and Berry
based on Wall Street / IBES estimates as of 31-Jul-2009 adjusted by Aqua management and approved by Transaction Committee for use by Goldman Sachs
Note: Analysis excludes potential dis-synergies for Powder including potential loss or modification in terms of distribution contracts. Current Powder diluted ownership is 43%
and 31% in Aqua and Berry, respectively.
Goldman Sachs
HIGHLY CONFIDENTIAL
Pro Forma Impact on Powder 23
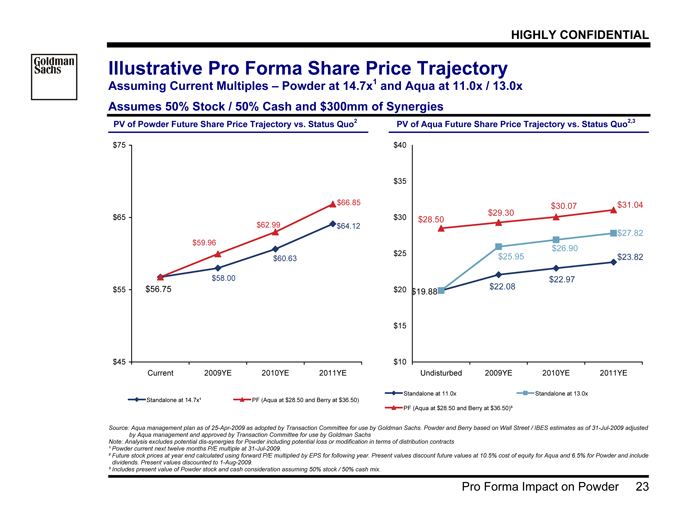
Illustrative Pro Forma Share Price Trajectory
Assuming Current Multiples – Powder at 14.7x1 and Aqua at 11.0x / 13.0x
Assumes 50% Stock / 50% Cash and $300mm of Synergies
PV of Powder Future Share Price Trajectory vs. Status Quo2 PV of Aqua Future Share Price Trajectory vs. Status Quo2,3
$64.12
$60.63
$58.00
$66.85
$62.99
$59.96
$56.75
$45
$55
$65
$75
Current 2009YE 2010YE 2011YE
$23.82
$22.97
$19.88 $22.08
$30.07 $31.04
$29.30
$28.50
$27.82
$26.90
$25.95
$10
$15
$20
$25
$30
$35
$40
Undisturbed 2009YE 2010YE 2011YE
Standalone at 14.7x¹ PF (Aqua at $28.50 and Berry at $36.50)
Standalone at 11.0x Standalone at 13.0x
PF (Aqua at $28.50 and Berry at $36.50)³
Source: Aqua management plan as of 25-Apr-2009 as adopted by Transaction Committee for use by Goldman Sachs. Powder and Berry based on Wall Street / IBES estimates as of 31-Jul-2009 adjusted
by Aqua management and approved by Transaction Committee for use by Goldman Sachs
Note: Analysis excludes potential dis-synergies for Powder including potential loss or modification in terms of distribution contracts
¹ Powder current next twelve months P/E multiple at 31-Jul-2009.
² Future stock prices at year end calculated using forward P/E multiplied by EPS for following year. Present values discount future values at 10.5% cost of equity for Aqua and 6.5% for Powder and include
dividends. Present values discounted to 1-Aug-2009.
³ Includes present value of Powder stock and cash consideration assuming 50% stock / 50% cash mix.
Goldman Sachs
HIGHLY CONFIDENTIAL
Pro Forma Impact on Powder 24
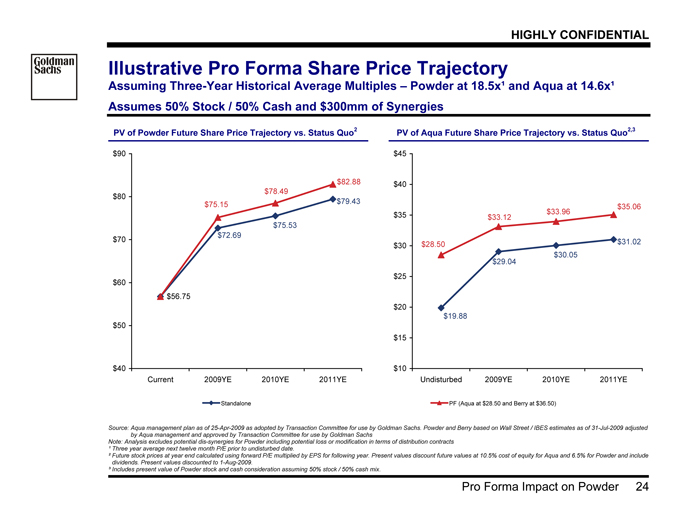
Illustrative Pro Forma Share Price Trajectory
Assuming Three-Year Historical Average Multiples – Powder at 18.5x¹ and Aqua at 14.6x¹
Assumes 50% Stock / 50% Cash and $300mm of Synergies
PV of Powder Future Share Price Trajectory vs. Status Quo2 PV of Aqua Future Share Price Trajectory vs. Status Quo2,3
$79.43
$75.53
$72.69
$82.88
$78.49
$75.15
$56.75
$40
$50
$60
$70
$80
$90
Current 2009YE 2010YE 2011YE
$31.02
$30.05
$29.04
$19.88
$33.96 $35.06
$33.12
$28.50
$10
$15
$20
$25
$30
$35
$40
$45
Undisturbed 2009YE 2010YE 2011YE
Standalone PF (Aqua at $28.50 and Berry at $36.50)
Source: Aqua management plan as of 25-Apr-2009 as adopted by Transaction Committee for use by Goldman Sachs. Powder and Berry based on Wall Street / IBES estimates as of 31-Jul-2009 adjusted
by Aqua management and approved by Transaction Committee for use by Goldman Sachs
Note: Analysis excludes potential dis-synergies for Powder including potential loss or modification in terms of distribution contracts
¹ Three year average next twelve month P/E prior to undisturbed date.
² Future stock prices at year end calculated using forward P/E multiplied by EPS for following year. Present values discount future values at 10.5% cost of equity for Aqua and 6.5% for Powder and include
dividends. Present values discounted to 1-Aug-2009.
³ Includes present value of Powder stock and cash consideration assuming 50% stock / 50% cash mix.
Goldman Sachs
HIGHLY CONFIDENTIAL
Background Information on Powder 25
V. Background Information on Powder
Goldman Sachs
HIGHLY CONFIDENTIAL
Background Information on Powder 26
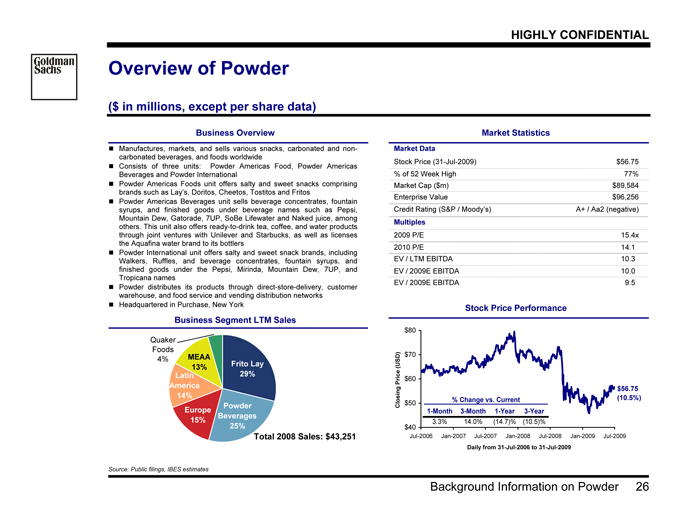
Overview of Powder
($ in millions, except per share data)
Business Overview Market Statistics
Market Data
Stock Price (31-Jul-2009) $56.75
% of 52 Week High 77%
Market Cap ($m) $89,584
Enterprise Value $96,256
Credit Rating (S&P / Moody’s) A+ / Aa2 (negative)
Multiples
2009 P/E 15.4x
2010 P/E 14.1x
EV / LTM EBITDA 10.3x
EV / 2009E EBITDA 10.0x
EV / 2009E EBITDA 9.5x
Stock Price Performance
? Manufactures, markets, and sells various snacks, carbonated and noncarbonated
beverages, and foods worldwide
? Consists of three units: Powder Americas Food, Powder Americas
Beverages and Powder International
? Powder Americas Foods unit offers salty and sweet snacks comprising
brands such as Lay’s, Doritos, Cheetos, Tostitos and Fritos
? Powder Americas Beverages unit sells beverage concentrates, fountain
syrups, and finished goods under beverage names such as Pepsi,
Mountain Dew, Gatorade, 7UP, SoBe Lifewater and Naked juice, among
others. This unit also offers ready-to-drink tea, coffee, and water products
through joint ventures with Unilever and Starbucks, as well as licenses
the Aquafina water brand to its bottlers
? Powder International unit offers salty and sweet snack brands, including
Walkers, Ruffles, and beverage concentrates, fountain syrups, and
finished goods under the Pepsi, Mirinda, Mountain Dew, 7UP, and
Tropicana names
? Powder distributes its products through direct-store-delivery, customer
warehouse, and food service and vending distribution networks
? Headquartered in Purchase, New York
Business Segment LTM Sales
MEAA
13%
Latin
America
14%
Europe
15%
Powder
Beverages
25%
Frito Lay
29%
Quaker
Foods
4%
Total 2008 Sales: $43,251
$40
$50
$60
$70
$80
Jul-2006 Jan-2007 Jul-2007 Jan-2008 Jul-2008 Jan-2009 Jul-2009
Daily from 31-Jul-2006 to 31-Jul-2009
Closing Price (USD)
$56.75
% Change vs. Current (10.5%)
1-Month 3-Month 1-Year 3-Year
3.3% 14.0% (14.7)% (10.5)%
Source: Public filings, IBES estimates
Goldman Sachs
HIGHLY CONFIDENTIAL
Background Information on Powder 27
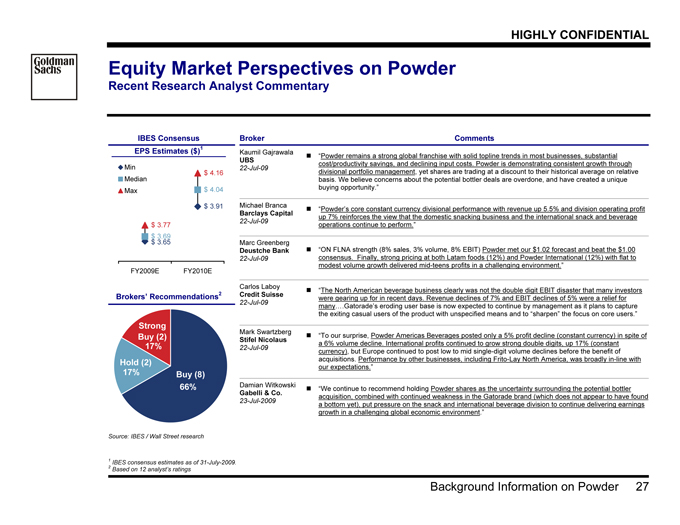
Equity Market Perspectives on Powder
Recent Research Analyst Commentary
IBES Consensus
EPS Estimates ($)1
$ 3.91
$ 3.69
$ 4.04
$ 3.77
$ 4.16
$ 3.65
FY2009E FY2010E
Min
Median
Max
Brokers’ Recommendations2
66%
17%
17% Buy (8)
Hold (2)
Strong
Buy (2)
Broker Comments
Kaumil Gajrawala
UBS
22-Jul-09
? “Powder remains a strong global franchise with solid topline trends in most businesses, substantial
cost/productivity savings, and declining input costs. Powder is demonstrating consistent growth through
divisional portfolio management, yet shares are trading at a discount to their historical average on relative
basis. We believe concerns about the potential bottler deals are overdone, and have created a unique
buying opportunity.”
Michael Branca
Barclays Capital
22-Jul-09
? “Powder’s core constant currency divisional performance with revenue up 5.5% and division operating profit
up 7% reinforces the view that the domestic snacking business and the international snack and beverage
operations continue to perform.”
Marc Greenberg
Deustche Bank
22-Jul-09
? “ON FLNA strength (8% sales, 3% volume, 8% EBIT) Powder met our $1.02 forecast and beat the $1.00
consensus. Finally, strong pricing at both Latam foods (12%) and Powder International (12%) with flat to
modest volume growth delivered mid-teens profits in a challenging environment.”
Carlos Laboy
Credit Suisse
22-Jul-09
? “The North American beverage business clearly was not the double digit EBIT disaster that many investors
were gearing up for in recent days. Revenue declines of 7% and EBIT declines of 5% were a relief for
many….Gatorade’s eroding user base is now expected to continue by management as it plans to capture
the exiting casual users of the product with unspecified means and to “sharpen” the focus on core users.”
Mark Swartzberg
Stifel Nicolaus
22-Jul-09
? “To our surprise, Powder Americas Beverages posted only a 5% profit decline (constant currency) in spite of
a 6% volume decline. International profits continued to grow strong double digits, up 17% (constant
currency), but Europe continued to post low to mid single-digit volume declines before the benefit of
acquisitions. Performance by other businesses, including Frito-Lay North America, was broadly in-line with
our expectations.”
Damian Witkowski
Gabelli & Co.
23-Jul-2009
? “We continue to recommend holding Powder shares as the uncertainty surrounding the potential bottler
acquisition, combined with continued weakness in the Gatorade brand (which does not appear to have found
a bottom yet), put pressure on the snack and international beverage division to continue delivering earnings
growth in a challenging global economic environment.”
Source: IBES / Wall Street research
1 | | IBES consensus estimates as of 31-July-2009. |
2 | | Based on 12 analyst’s ratings |
Goldman Sachs
HIGHLY CONFIDENTIAL
Supplemental Materials 28
Appendix A: Supplemental Materials
Goldman Sachs
HIGHLY CONFIDENTIAL
Supplemental Materials 29
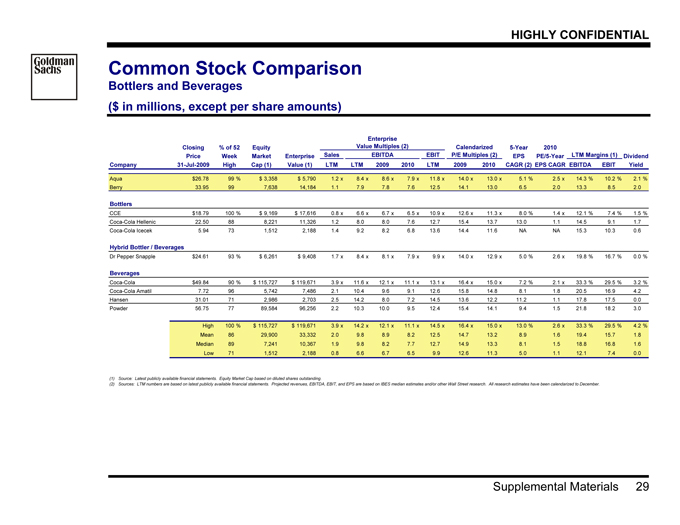
Common Stock Comparison
Bottlers and Beverages
($ in millions, except per share amounts)
Closing % of 52 Equity 5-Year 2010
Price Week Market Enterprise EPS PE/5-Year Dividend
Company 31-Jul-2009 High Cap (1) Value (1) LTM LTM 2009 2010 LTM 2009 2010 CAGR (2) EPS CAGR EBITDA EBIT Yield
Aqua $26.78 99 % $ 3,358 $ 5,790 1.2 x 8.4 x 8.6 x 7.9 x 11.8 x 14.0 x 13.0 x 5.1 % 2.5 x 14.3 % 10.2 % 2.1 %
Berry 33.95 99 7,638 14,184 1.1 7.9 7.8 7.6 12.5 14.1 13.0 6.5 2.0 13.3 8.5 2.0
Bottlers
CCE $18.79 100 % $ 9,169 $ 17,616 0.8 x 6.6 x 6.7 x 6.5 x 10.9 x 12.6 x 11.3 x 8.0 % 1.4 x 12.1 % 7.4 % 1.5 %
Coca-Cola Hellenic 22.50 88 8,221 11,326 1.2 8.0 8.0 7.6 12.7 15.4 13.7 13.0 1.1 14.5 9.1 1.7
Coca-Cola Icecek 5.94 73 1,512 2,188 1.4 9.2 8.2 6.8 13.6 14.4 11.6 NA NA 15.3 10.3 0.6
Hybrid Bottler / Beverages
Dr Pepper Snapple $24.61 93 % $ 6,261 $ 9,408 1.7 x 8.4 x 8.1 x 7.9 x 9.9 x 14.0 x 12.9 x 5.0 % 2.6 x 19.8 % 16.7 % 0.0 %
Beverages
Coca-Cola $49.84 90 % $ 115,727 $ 119,671 3.9 x 11.6 x 12.1 x 11.1 x 13.1 x 16.4 x 15.0 x 7.2 % 2.1 x 33.3 % 29.5 % 3.2 %
Coca-Cola Amatil 7.72 96 5,742 7,486 2.1 10.4 9.6 9.1 12.6 15.8 14.8 8.1 1.8 20.5 16.9 4.2
Hansen 31.01 71 2,986 2,703 2.5 14.2 8.0 7.2 14.5 13.6 12.2 11.2 1.1 17.8 17.5 0.0
Powder 56.75 77 89,584 96,256 2.2 10.3 10.0 9.5 12.4 15.4 14.1 9.4 1.5 21.8 18.2 3.0
High 100 % $ 115,727 $ 119,671 3.9 x 14.2 x 12.1 x 11.1 x 14.5 x 16.4 x 15.0 x 13.0 % 2.6 x 33.3 % 29.5 % 4.2 %
Mean 86 29,900 33,332 2.0 9.8 8.9 8.2 12.5 14.7 13.2 8.9 1.6 19.4 15.7 1.8
Median 89 7,241 10,367 1.9 9.8 8.2 7.7 12.7 14.9 13.3 8.1 1.5 18.8 16.8 1.6
Low 71 1,512 2,188 0.8 6.6 6.7 6.5 9.9 12.6 11.3 5.0 1.1 12.1 7.4 0.0
(1) | | Source: Latest publicly available financial statements. Equity Market Cap based on diluted shares outstanding. |
(2) Sources: LTM numbers are based on latest publicly available financial statements. Projected revenues, EBITDA, EBIT, and EPS are based on IBES median estimates and/or other Wall Street research. All research estimates have been calendarized to December.
LTM Margins EBITDA (1)
Enterprise
Value Multiples (2)
EBIT P/E Multiples (2)
Calendarized
Sales
Goldman Sachs
HIGHLY CONFIDENTIAL
Supplemental Materials 30
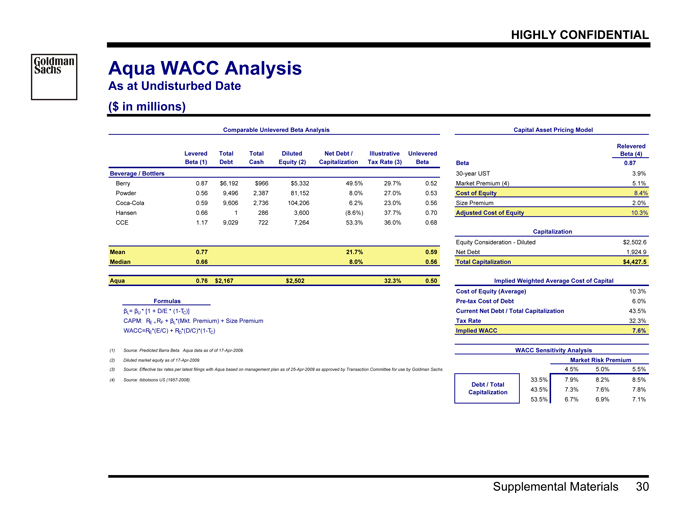
Aqua WACC Analysis
As at Undisturbed Date
($ in millions)
Comparable Unlevered Beta Analysis Capital Asset Pricing Model
Levered Total Total Diluted Net Debt / Illustrative Unlevered
Beta (1) Debt Cash Equity (2) Capitalization Tax Rate (3) Beta Beta 0.87
Beverage / Bottlers 30-year UST 3.9%
Berry 0.87 $6,192 $966 $5,332 49.5% 29.7% 0.52 Market Premium (4) 5.1%
Powder 0.56 9,496 2,387 81,152 8.0% 27.0% 0.53 Cost of Equity 8.4%
Coca-Cola 0.59 9,606 2,736 104,206 6.2% 23.0% 0.56 Size Premium 2.0%
Hansen 0.66 1 286 3,600 (8.6%) 37.7% 0.70 Adjusted Cost of Equity 10.3%
CCE 1.17 9,029 722 7,264 53.3% 36.0% 0.68
Capitalization
Equity Consideration—Diluted $2,502.6
Mean 0.77 21.7% 0.59 Net Debt 1,924.9
Median 0.66 8.0% 0.56 Total Capitalization $4,427.5
Aqua 0.76 $2,167 $2,502 32.3% 0.50 Implied Weighted Average Cost of Capital
Cost of Equity (Average) 10.3%
Formulas Pre-tax Cost of Debt 6.0%
?L = ?U * [1 + D/E * (1-TC )] Current Net Debt / Total Capitalization 43.5%
CAPM: RE = R F + ?L*(Mkt. Premium) + Size Premium Tax Rate 32.3%
WACC=RE *(E/C) + RD *(D/C)*(1-TC) Implied WACC 7.6%
(1) | | Source: Predicted Barra Beta. Aqua data as of of 17-Apr-2009. WACC Sensitivity Analysis |
(2) | | Diluted market equity as of 17-Apr-2009. Market Risk Premium |
(3) Source: Effective tax rates per latest filings with Aqua based on management plan as of 25-Apr-2009 as approved by Transaction Committee for use by Goldman Sachs. 7.6% 4.5% 5.0% 5.5%
(4) | | Source: Ibbotsons US (1957-2008). 33.5% 7.9% 8.2% 8.5% |
43.5% 7.3% 7.6% 7.8%
53.5% 6.7% 6.9% 7.1%
Relevered
Beta (4)
Debt / Total
Capitalization