As filed with the SEC on March 7, 2008.
UNITED STATES
SECURITIES AND EXCHANGE COMMISSION
Washington, D.C. 20549
FORM N-CSR
CERTIFIED SHAREHOLDER REPORT OF REGISTERED
MANAGEMENT INVESTMENT COMPANIES
Investment Company Act file number | 811-04419 |
|
AEGON/TRANSAMERICA SERIES TRUST |
(Exact name of registrant as specified in charter) |
|
570 Carillon Parkway, St. Petersburg, Florida | | 33716 |
(Address of principal executive offices) | | (Zip code) |
|
Dennis P. Gallagher, Esq. P.O. Box 9012, Clearwater, Florida 33758-9771 |
(Name and address of agent for service) |
|
Registrant’s telephone number, including area code: | (727) 299-1800 | |
|
Date of fiscal year end: | December 31 | |
|
Date of reporting period: | January 1, 2007 - December 31, 2007 | |
| | | | | | | | |
Item 1: Report(s) to Shareholders.
2
AEGON/Transamerica Series Trust Annual Report Winter 2007
AEGON/Transamerica Series Trust Annual Report
570 Carillon Parkway
St. Petersburg, FL 33716
Distributor: Transamerica Capital, Inc.
Customer Service: 1-800-851-9777
The following pages contain the most recent annual reports for the investment options in which you are invested. In compliance with Securities and Exchange Commission regulations, we present these reports on a semi-annual basis with the hope that they will foster greater understanding of the investment options’ holdings, performance, financial data, accounting policies and other issues. Unlike our past reports, this streamlined version provides information only on the investment options in which you are invested.
If you have any questions about these reports, please do not hesitate to contact your financial professional. As always, we thank you for your trust and the opportunity to serve you.
Dear Shareholder,
On behalf of AEGON/Transamerica Series Trust, we would like to thank you for your continued support and confidence in our products as we look forward to continuing to serve you and your financial advisor in the future. We value the trust you have placed in us.
This annual report is provided to you with the intent of presenting a comprehensive review of the investments of each of your funds. The Securities and Exchange Commission requires that annual and semi-annual reports be sent to all shareholders, and we believe this report to be an important part of the investment process. In addition to providing a comprehensive review, this report also provides a discussion of accounting policies as well as matters presented to shareholders that may have required their vote.
We believe it is important to recognize and understand current market conditions in order to provide a context for reading the contents of this report. The mildly positive returns experienced in the equity markets for the trailing 12 months ending December 31, 2007, were marked by volatility experienced along the way, with significant pullbacks occurring in February-March, July-August and November. The Federal Reserve was on hold until September when a series of cuts lowered interest rates from 5.25% to 4.25%. The rate reductions by the Federal Reserve signaled an effort to inject liquidity and stability to the markets which have been adversely affected by subprime mortgage debt writedowns and general weakness in the housing market. Concerns over the extent to which subprime debt and housing market weakness may affect consumer spending and persistently high oil prices have weighed on market returns. For the twelve months ending December 31, 2007, the Dow Jones Industrial Average returned 8.88%, the Standard & Poor’s 500 Index returned 5.49%, and the Lehman Aggregate Bond Index returned 6.97%. Please keep in mind it is important to maintain a diversified portfolio as investment returns have historically been difficult to predict.
In addition to your active involvement in the investment process, we firmly believe that a financial advisor is a key resource to help you build a comprehensive picture of your current and future financial needs. In addition, financial advisors are familiar with the market’s history, including long-term returns and volatility of various asset classes. With your financial advisor, you can develop an investment program that incorporates factors such as your goals, your investment timeline, and your risk tolerance. Please contact your financial advisor if you have any questions about the contents of this report, and thanks again for the confidence you have placed in us.
Sincerely,
John K. Carter | | Christopher A. Staples |
President & Chief Executive Officer | | Vice President & Chief Investment Officer |
AEGON/Transamerica Series Trust | | AEGON/Transamerica Series Trust |
The views expressed in this report reflect those of the portfolio managers only and may not necessarily represent the views of AEGON/Transamerica Series Trust. These views are subject to change based upon market conditions. These views should not be relied on as investment advice and are not indicative of a trading intent on behalf of the AEGON/Transamerica Series Trust.
American Century Large Company Value
MARKET ENVIRONMENT
Stocks struggled for most of the one-year reporting period, providing a challenging market environment for the portfolio. The slowing U.S. economy, the sub-prime meltdown, and subsequent credit crisis weighed on investors, who gravitated toward companies that were already strong performers. This momentum bias did not fit well with the portfolio’s investment approach, which seeks stocks that are undervalued by the market. In addition, growth stocks outperformed value across the capitalization spectrum.
PERFORMANCE
For the year ended December 31, 2007, American Century Large Company Value, Initial Class returned (1.12)%. By comparison its primary and secondary benchmarks, the Standard and Poor’s 500 Composite Stock Index and the Russell 1000 Value Index (“Russell 1000 Value”), returned 5.49% and (0.17)%, respectively.
STRATEGY REVIEW
The portfolio benefited from strong security selection in the information technology (“IT”) sector, with most of the gains coming from large leading software and technology companies. A significant holding was software giant Microsoft Corporation, which benefited from strong sales of its new Vista operating system and Office 2007. Hewlett Packard Company continued to gain ground in the personal computer (“PC”) market and moved into high-end enterprise printing equipment.
Our position in consumer staples benefited performance as the U.S. economy slowed and investors sought out companies that provide everyday goods and services. During difficult economic times, consumer staples stocks are regarded as sound, defensive investments. Moreover, our preference for large industry leaders proved advantageous as many of these names outperformed the benchmark. The Pepsi Bottling Group, Inc. (“Pepsi”) and The Coca-Cola Company (“Coca-Cola”), for example, gained about 30% during the period. Despite higher commodity costs, Pepsi announced a healthy increase in profit. Meanwhile, Coca-Cola reported growing revenues and bought back a large number of its shares.
Financial stocks, the portfolio’s largest single position, but a relative underweight nonetheless, represented our largest sources of underperformance versus the benchmark. Many financial firms came under pressure amid the fallout in the sub-prime lending category. Three of our top detractors were the Federal Home Loan Mortgage Corporation (“Freddie Mac”), a stockholder-owned corporation chartered by Congress to keep money flowing to mortgage lenders in support of home ownership; Washington Mutual, Inc., a major thrift involved in mortgage finance; and Citigroup Inc., a diversified global financial services company. All three stocks declined on news of wider-than-expected losses, resulting from housing weakness and the deterioration of mortgage credit.
Although the portfolio’s position in the energy sector contributed on an absolute basis, it underperformed in relative terms. Energy stocks, specifically oil and gas companies, provided the strongest results for the Russell 1000 Value. Because of valuations, we held a smaller-than-the-benchmark allocation, which was a drag on results.
As bottom-up investment managers, we evaluate each company individually and build the portfolio one stock at a time. As of December 31, 2007, the portfolio was broadly diversified, with continued overweight positions in the IT and health care sectors. Our valuation work contributed to our smaller relative weightings in utilities stocks. We have also continued to find greater value opportunities among mega-cap stocks and have maintained our bias toward these firms.
Charles A. Ritter, CFA
Brendan Healy, CFA
Co-Portfolio Managers
American Century Investment Management, Inc.
AEGON/Transamerica Series Trust | Annual Report 2007 |
1
American Century Large Company Value
(unaudited)

Average Annual Total Return for Periods Ended 12/31/2007
| | | | | | From | | Inception | |
| | 1 Year | | 5 Years | | Inception | | Date | |
| | | | | | | | | |
Initial Class | | (1.12 | )% | 12.58 | % | 4.97 | % | 5/1/01 | |
S&P 500(1) | | 5.49 | % | 12.83 | % | 4.27 | % | 5/1/01 | |
Russell 1000 Value(1) | | (0.17 | )% | 14.63 | % | 7.28 | % | 5/1/01 | |
| | | | | | | | | |
Service Class | | (1.33 | )% | — | % | 12.44 | % | 5/1/03 | |
NOTES
(1) The Standard and Poor’s 500 Composite Stock (S&P 500) Index and the Russell 1000 Value (Russell 1000 Value) Index are unmanaged indices used as a general measure of market performance. Calculations assume dividends and capital gains are reinvested and do not include any managerial expenses. From inception, calculation is based on life of Initial Class shares.
The performance data presented represents past performance; future results may vary. The portfolio’s investment return and net asset value will fluctuate. Past performance does not guarantee future results. Investor’s units when redeemed may be worth more or less than their original cost.
Current performance may be lower or higher than performance quoted. Please visit your insurance company’s website for contract or policy level standardized total returns current to the most recent month end. Portfolio performance is net of investment fees and fund expenses, but not product charges, which, if included, would significantly lower the performance quoted.
This material must be preceded or accompanied by a current prospectus, which includes specific contents regarding the investment objectives, explanation of share classes and policies of this portfolio.
2
American Century Large Company Value
UNDERSTANDING YOUR FUND’S EXPENSES
(unaudited)
SHAREHOLDER EXPENSES
Fund shareholders may incur ongoing costs, including management and advisory fees, distribution and service fees, and other fund expenses.
The following Example is intended to help you understand your ongoing costs (in dollars and cents) of investing in the Fund and to compare these costs with the ongoing costs of investing in other funds.
The Example is based on an investment of $1,000 invested at July 1, 2007 and held for the entire period until December 31, 2007.
ACTUAL EXPENSES
The first line in the table below provides information about actual account values and actual expenses. You may use the information in this line, together with the amount you invested, to estimate the expenses that you paid over the period. Simply divide your account value by $1,000 (for example, an $8,600 account value divided by $1,000 = 8.6), then multiply the result by the number in the first line of your Fund under the heading entitled “Expenses Paid During Period” to estimate the expenses you paid on your account during this period.
HYPOTHETICAL EXAMPLE FOR COMPARISON PURPOSES
The second line in the table below provides information about hypothetical account values and hypothetical expenses based on the Fund’s actual expense ratio and an assumed rate of return of 5% per year before expenses, which is not the Fund’s actual return. The hypothetical account values and expenses may not be used to estimate the actual ending account balance or expenses you paid for the period. You may use this information to compare the ongoing costs of investing in your Fund and other funds. To do so, compare this 5% hypothetical example with the 5% hypothetical examples that appear in the shareholder reports of the other funds.
Please note that the expenses shown in the table are meant to highlight your ongoing costs only and do not reflect any transactional costs, such as sales charges, redemption fees, brokerage commissions paid on purchases and sales of fund shares. Therefore, the second line under the Fund in the table is useful in comparing ongoing costs only, and will not help you determine the relative total costs of owning different funds. If any of these transaction costs were included, your costs would be higher. The expenses shown in the table do not reflect any fees that may be charged to you by brokers, financial intermediaries or other financial institutions.
| | Beginning | | Ending | | Annualized | | Expenses | |
| | Account | | Account | | Expense | | Paid During | |
| | Value | | Value | | Ratio | | Period (a) | |
| | | | | | | | | |
Initial Class | | | | | | | | | |
Actual | | $ | 1,000.00 | | $ | 932.91 | | 0.86 | % | $ | 4.19 | |
Hypothetical (b) | | 1,000.00 | | 1,020.87 | | 0.86 | | 4.38 | |
| | | | | | | | | |
Service Class | | | | | | | | | |
Actual | | 1,000.00 | | 932.36 | | 1.11 | | 5.41 | |
Hypothetical (b) | | 1,000.00 | | 1,019.61 | | 1.11 | | 5.65 | |
| | | | | | | | | | | | |
(a) | Expenses are calculated using the Fund’s annualized expense ratio (as disclosed in the table), multiplied by the average account value for the period, multiplied by the number of days in the period (184 days), and divided by the number of days in the year (365 days). |
| |
(b) | 5% return per year before expenses. |
GRAPHICAL PRESENTATION OF SCHEDULE OF INVESTMENTS
By Sector
At December 31, 2007
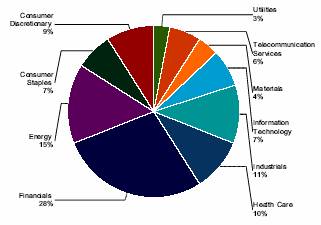
This chart shows the percentage breakdown by sector of the Fund’s total investment securities.
3
American Century Large Company Value
SCHEDULE OF INVESTMENTS
At December 31, 2007
(all amounts except share amounts in thousands)
| | Shares | | Value | |
COMMON STOCKS (95.0%) | | | | | |
Aerospace & Defense (1.0%) | | | | | |
Northrop Grumman Corp. | | 58,800 | | $ | 4,624 | |
Beverages (2.0%) | | | | | |
Coca-Cola Co. (The) | | 90,900 | | 5,579 | |
Pepsi Bottling Group, Inc. | | 83,200 | | 3,283 | |
Biotechnology (0.5%) | | | | | |
Amgen, Inc. ‡ | | 48,800 | | 2,266 | |
Capital Markets (2.6%) | | | | | |
Bear Stearns Cos., Inc. (The) ^ | | 10,600 | | 935 | |
Merrill Lynch & Co., Inc. | | 96,800 | | 5,196 | |
Morgan Stanley ^ | | 100,900 | | 5,359 | |
Chemicals (2.1%) | | | | | |
Ei DU Pont de Nemours & Co. | | 112,300 | | 4,951 | |
PPG Industries, Inc. | | 67,000 | | 4,706 | |
Commercial Banks (6.0%) | | | | | |
Bank of New York Mellon Corp. | | 46,500 | | 2,268 | |
National City Corp. ^ | | 83,400 | | 1,373 | |
PNC Financial Services Group, Inc. | | 43,500 | | 2,856 | |
US Bancorp | | 192,700 | | 6,116 | |
Wachovia Corp. | | 149,600 | | 5,689 | |
Wells Fargo & Co. | | 296,500 | | 8,951 | |
Commercial Services & Supplies (1.5%) | | | | | |
Avery Dennison Corp. | | 22,000 | | 1,169 | |
RR Donnelley & Sons Co. | | 79,300 | | 2,993 | |
Waste Management, Inc. | | 81,500 | | 2,662 | |
Communications Equipment (0.2%) | | | | | |
Motorola, Inc. | | 63,200 | | 1,014 | |
Computers & Peripherals (2.4%) | | | | | |
Hewlett-Packard Co. | | 108,800 | | 5,492 | |
International Business Machines Corp. | | 49,800 | | 5,384 | |
Consumer Finance (0.2%) | | | | | |
Discover Financial Services | | 55,600 | | 838 | |
Diversified Consumer Services (0.5%) | | | | | |
H&R Block, Inc. | | 128,700 | | 2,390 | |
Diversified Financial Services (8.8%) | | | | | |
Bank of America Corp. (1) | | 328,100 | | 13,537 | |
Citigroup, Inc. | | 490,100 | | 14,429 | |
JPMorgan Chase & Co. | | 262,800 | | 11,471 | |
Diversified Telecommunication Services (4.9%) | | | | | |
AT&T, Inc. (1) | | 356,200 | | 14,804 | |
Verizon Communications, Inc. | | 168,400 | | 7,357 | |
Electric Utilities (2.7%) | | | | | |
Exelon Corp. | | 83,700 | | 6,833 | |
PPL Corp. | | 106,000 | | 5,522 | |
Electronic Equipment & Instruments (0.5%) | | | | | |
Tyco International, Ltd. | | 50,900 | | 2,018 | |
Energy Equipment & Services (0.5%) | | | | | |
National Oilwell Varco, Inc. ‡ | | 31,200 | | 2,292 | |
Food & Staples Retailing (2.3%) | | | | | |
Kroger Co. (The) | | 105,500 | | 2,818 | |
Walgreen Co. | | 64,100 | | 2,441 | |
Wal-Mart Stores, Inc. | | 110,900 | | 5,271 | |
Food Products (1.1%) | | | | | |
Unilever NV | | 138,000 | | $ | 5,031 | |
Health Care Equipment & Supplies (0.5%) | | | | | |
Medtronic, Inc. | | 46,800 | | 2,353 | |
Health Care Providers & Services (0.3%) | | | | | |
Quest Diagnostics, Inc. | | 25,600 | | 1,354 | |
Hotels, Restaurants & Leisure (0.4%) | | | | | |
McDonald’s Corp. | | 30,300 | | 1,785 | |
Household Durables (0.7%) | | | | | |
Newell Rubbermaid, Inc. | | 117,100 | | 3,031 | |
Independent Power Producers & Energy Traders (0.5%) | | | | | |
NRG Energy, Inc. ‡ | | 54,500 | | 2,362 | |
Industrial Conglomerates (4.3%) | | | | | |
General Electric Co. | | 522,300 | | 19,362 | |
Insurance (6.3%) | | | | | |
Allstate Corp. (The) | | 97,000 | | 5,066 | |
American International Group, Inc. | | 181,200 | | 10,564 | |
Hartford Financial Services Group, Inc. | | 58,700 | | 5,118 | |
Loews Corp. | | 71,300 | | 3,589 | |
Marsh & McLennan Cos., Inc. | | 43,400 | | 1,149 | |
Torchmark Corp. | | 45,300 | | 2,742 | |
IT Services (0.5%) | | | | | |
Fiserv, Inc. ‡ | | 38,000 | | 2,109 | |
Machinery (3.4%) | | | | | |
Caterpillar, Inc. | | 47,300 | | 3,432 | |
Deere & Co. | | 20,000 | | 1,862 | |
Dover Corp. | | 68,100 | | 3,139 | |
Ingersoll-Rand Co., Ltd. Class A | | 80,800 | | 3,755 | |
Parker Hannifin Corp. | | 42,700 | | 3,216 | |
Media (3.1%) | | | | | |
Gannett Co., Inc. | | 111,300 | | 4,341 | |
Time Warner, Inc. | | 337,400 | | 5,571 | |
Viacom, Inc. Class B ‡ | | 96,800 | | 4,251 | |
Metals & Mining (0.6%) | | | | | |
Nucor Corp. | | 45,500 | | 2,694 | |
Multiline Retail (0.5%) | | | | | |
Kohl’s Corp. ‡ | | 51,900 | | 2,377 | |
Office Electronics (0.6%) | | | | | |
Xerox Corp. ^ | | 164,600 | | 2,665 | |
Oil, Gas & Consumable Fuels (13.9%) | | | | | |
Chevron Corp. | | 168,700 | | 15,745 | |
ConocoPhillips | | 122,900 | | 10,852 | |
Devon Energy Corp. | | 12,300 | | 1,093 | |
Exxon Mobil Corp. | | 242,500 | | 22,720 | |
Royal Dutch Shell PLC Class A | | 147,400 | | 12,411 | |
Paper & Forest Products (1.2%) | | | | | |
Weyerhaeuser Co. | | 70,600 | | 5,206 | |
Pharmaceuticals (8.4%) | | | | | |
Abbott Laboratories (1) | | 97,000 | | 5,447 | |
Eli Lilly & Co. | | 57,800 | | 3,086 | |
Johnson & Johnson | | 160,800 | | 10,725 | |
Merck & Co., Inc. | | 67,700 | | 3,934 | |
Pfizer, Inc. | | 416,600 | | 9,469 | |
The notes to the financial statements are an integral part of this report.
4
| | Shares | | Value | |
Pharmaceuticals (continued) | | | | | |
Wyeth | | 120,000 | | $ | 5,303 | |
Semiconductors & Semiconductor Equipment (0.9%) | | | | | |
Applied Materials, Inc. | | 87,500 | | 1,554 | |
Intel Corp. | | 85,800 | | 2,287 | |
Software (2.3%) | | | | | |
Microsoft Corp. | | 195,000 | | 6,942 | |
Oracle Corp. ‡ | | 144,400 | | 3,261 | |
Specialty Retail (2.3%) | | | | | |
Best Buy Co., Inc. | | 64,100 | | 3,375 | |
Gap, Inc. (The) | | 95,100 | | 2,024 | |
Home Depot, Inc. | | 85,700 | | 2,309 | |
Staples, Inc. | | 122,300 | | 2,821 | |
Textiles, Apparel & Luxury Goods (0.5%) | | | | | |
V.F. Corp. | | 33,300 | | 2,286 | |
Thrifts & Mortgage Finance (2.1%) | | | | | |
Countrywide Financial Corp. ^ | | 42,600 | | 381 | |
Freddie Mac | | 168,900 | | 5,754 | |
MGIC Investment Corp. ^ | | 67,800 | | 1,521 | |
Washington Mutual, Inc. ^ | | 132,800 | | 1,807 | |
Tobacco (1.2%) | | | | | |
Altria Group, Inc. | | 72,700 | | $ | 5,495 | |
Wireless Telecommunication Services (0.7%) | | | | | |
Sprint Nextel Corp. | | 230,900 | | 3,032 | |
Total Common Stocks (cost $434,829) | | | | 428,645 | |
| | | | | |
INVESTMENT COMPANIES (0.9%) | | | | | |
Capital Markets (0.9%) | | | | | |
SPDR Trust Series 1 Series T, Class T ^ | | 26,700 | | 3,905 | |
Total Investment Companies (cost $3,641) | | | | 3,905 | |
| | | | | |
Total Securities Lending Collateral (cost $18,370) (2) | | | | 18,370 | |
| | | | | |
Total Investment Securities (cost $456,840) # | | | | $ | 450,920 | |
FUTURES CONTRACTS:
| | Contracts (·) | | Settlement
Date | | Amount | | Net Unrealized
Appreciation
(Depreciation) | |
| | | | | | | | | |
S&P 500 E-MINI Index | | 189 | | 03/20/2008 | | $ | 13,960 | | $ | (161 | ) |
| | | | | | | | | | | |
NOTES TO SCHEDULE OF INVESTMENTS:
^ | At December 31, 2007, all or a portion of this security is on loan (see Note 1). The value at December 31, 2007, of all securities on loan is $17,712. |
‡ | Non-Income Producing. |
(1) | At December 31, 2007, all or a portion of this security is segregated with the custodian to cover margin requirements for open futures contracts. The value of all securities segregated at December 31, 2007 is $7,342. |
(2) | Cash collateral for the Repurchase Agreements, valued at $6,659, that serves as collateral for securities lending, is invested in corporate bonds with interest rates and maturity dates ranging from 3.00% - 10.18% and 04/28/2008 - 12/01/2096, respectively. |
· | Contract amounts are not in thousands. |
# | Aggregate cost for federal income tax purposes is $457,505. Aggregate gross unrealized appreciation for all securities in which there is an excess of value over tax cost and aggregate gross unrealized depreciation for all securities in which there is an excess of tax cost over value were $41,011 and $47,596, respectively. Net unrealized depreciation for tax purposes is $6,585. |
The notes to the financial statements are an integral part of this report.
5
American Century Large Company Value
STATEMENT OF ASSETS AND LIABILITIES
At December 31, 2007
(all amounts except per share amounts in thousands)
Assets: | | | |
Investment securities, at value (cost: $456,840) (including securities loaned of $17,712) | | $ | 450,920 | |
Cash | | 18,576 | |
Receivables: | | | |
Investment securities sold | | 3,403 | |
Shares sold | | 200 | |
Interest | | 44 | |
Income from loaned securities | | 5 | |
Dividends | | 668 | |
| | 473,816 | |
Liabilities: | | | |
Investment securities purchased | | 3,870 | |
Accounts payable and accrued liabilities: | | | |
Shares redeemed | | 101 | |
Management and advisory fees | | 315 | |
Distribution and service fees | | — | |
Administration fees | | 8 | |
Payable for collateral for securities on loan | | 18,370 | |
Variation margin | | 61 | |
Other | | 38 | |
| | 22,763 | |
Net Assets | | $ | 451,053 | |
| | | |
Net Assets Consist of: | | | |
Capital Stock ($.01 par value) | | $ | 406 | |
Additional paid-in capital | | 434,710 | |
Undistributed (accumulated) net investment income | | 7,707 | |
Undistributed (accumulated) net realized gain from investment securities and futures | | 14,311 | |
Net unrealized (depreciation) on investment securities | | (5,920 | ) |
Futures contracts | | (161 | ) |
Net Assets | | $ | 451,053 | |
Net Assets by Class: | | | |
Initial Class | | $ | 448,651 | |
Service Class | | 2,402 | |
Shares Outstanding: | | | |
Initial Class | | 40,367 | |
Service Class | | 216 | |
Net Asset Value and Offering Price Per Share: | | | |
Initial Class | | $ | 11.11 | |
Service Class | | 11.10 | |
STATEMENT OF OPERATIONS
For the period ended December 31, 2007
(all amounts in thousands)
Investment Income: | | | |
Dividends (net of withholding taxes on foreign dividends of $95) | | $ | 10,637 | |
Interest | | 707 | |
Income from loaned securities-net | | 78 | |
| | 11,422 | |
Expenses: | | | |
Management and advisory fees | | 3,519 | |
Printing and shareholder reports | | 9 | |
Custody fees | | 53 | |
Administration fees | | 86 | |
Legal fees | | 9 | |
Audit fees | | 20 | |
Trustees fees | | 14 | |
Distribution and service fees: | | | |
Service Class | | 7 | |
Other | | 4 | |
Total expenses | | 3,721 | |
| | | |
Net Investment Income | | 7,701 | |
| | | |
Net Realized Gain (Loss) from: | | | |
Investment securities | | 14,622 | |
Futures contracts | | (165 | ) |
| | 14,457 | |
Net Increase (Decrease) in Unrealized Appreciation (Depreciation) on: | | | |
Investment securities | | (28,929 | ) |
Futures contracts | | (161 | ) |
| | (29,090 | ) |
Net Realized and Unrealized (Loss): | | (14,633 | ) |
Net (Decrease) In Net Assets Resulting from Operations | | $ | (6,932 | ) |
The notes to the financial statements are an integral part of this report.
6
American Century Large Company Value
STATEMENT OF CHANGES IN NET ASSETS
For the years ended
(all amounts in thousands)
| | December 31, | | December 31, | |
| | 2007 | | 2006 | |
Increase (Decrease) in Net Assets From: | | | | | |
Operations: | | | | | |
Net investment income | | $ | 7,701 | | $ | 2,166 | |
Net realized gain from investment securities, futures contracts | | 14,457 | | 1,976 | |
Change in unrealized appreciation (depreciation) on investment securities, futures contracts | | (29,090 | ) | 19,119 | |
| | (6,932 | ) | 23,261 | |
Distributions to Shareholders: | | | | | |
From net investment income: | | | | | |
Initial Class | | (2,142 | ) | (2,975 | ) |
Service Class | | (6 | ) | (45 | ) |
| | (2,148 | ) | (3,020 | ) |
From net realized gains: | | | | | |
Initial Class | | (2,009 | ) | (13,551 | ) |
Service Class | | (11 | ) | (225 | ) |
| | (2,020 | ) | (13,776 | ) |
Capital Share Transactions: | | | | | |
Proceeds from shares sold: | | | | | |
Initial Class | | 322,804 | | 55,163 | |
Service Class | | 1,123 | | 1,515 | |
| | 323,927 | | 56,678 | |
Dividends and distributions reinvested: | | | | | |
Initial Class | | 4,151 | | 16,526 | |
Service Class | | 17 | | 270 | |
| | 4,168 | | 16,796 | |
Cost of shares redeemed: | | | | | |
Initial Class | | (40,470 | ) | (25,548 | ) |
Service Class | | (1,751 | ) | (631 | ) |
| | (42,221 | ) | (26,179 | ) |
| | 285,874 | | 47,295 | |
Net increase (decrease) in net assets | | 274,774 | | 53,760 | |
| | | | | |
Net Assets: | | | | | |
Beginning of year | | 176,279 | | 122,519 | |
End of year | | $ | 451,053 | | $ | 176,279 | |
Undistributed (Accumulated) Net Investment Income (Loss) | | $ | 7,707 | | $ | 2,166 | |
Share Activity: | | | | | |
Shares issued: | | | | | |
Initial Class | | 28,236 | | 4,952 | |
Service Class | | 95 | | 139 | |
| | 28,331 | | 5,091 | |
Shares issued-reinvested from distributions: | | | | | |
Initial Class | | 361 | | 1,611 | |
Service Class | | 1 | | 26 | |
| | 362 | | 1,637 | |
Shares redeemed: | | | | | |
Initial Class | | (3,498 | ) | (2,265 | ) |
Service Class | | (151 | ) | (56 | ) |
| | (3,649 | ) | (2,321 | ) |
Net increase (decrease) in shares outstanding: | | | | | |
Initial Class | | 25,099 | | 4,298 | |
Service Class | | (55 | ) | 109 | |
| | 25,044 | | 4,407 | |
The notes to the financial statements are an integral part of this report.
7
American Century Large Company Value
FINANCIAL HIGHLIGHTS
For a share outstanding throughout each period(a)
| | Initial Class | |
| | Year Ended December 31, | |
| | 2007 | | 2006 | | 2005 | | 2004 | | 2003 | |
Net Asset Value | | | | | | | | | | | |
Beginning of period | | $ | 11.34 | | $ | 11.01 | | $ | 11.06 | | $ | 9.81 | | $ | 7.64 | |
Investment Operations | | | | | | | | | | | |
Net investment income (loss) | | 0.21 | | 0.19 | | 0.18 | | 0.17 | | 0.12 | |
Net realized and unrealized gain (loss) | | (0.33 | ) | 1.80 | | 0.26 | | 1.18 | | 2.08 | |
Total operations | | (0.12 | ) | 1.99 | | 0.44 | | 1.35 | | 2.20 | |
Distributions | | | | | | | | | | | |
From net investment income | | (0.06 | ) | (0.30 | ) | (0.07 | ) | (0.10 | ) | (0.03 | ) |
From net realized gains | | (0.05 | ) | (1.36 | ) | (0.42 | ) | — | | — | |
Total distributions | | (0.11 | ) | (1.66 | ) | (0.49 | ) | (0.10 | ) | (0.03 | ) |
Net Asset Value | | | | | | | | | | | |
End of period(b) | | $ | 11.11 | | $ | 11.34 | | $ | 11.01 | | $ | 11.06 | | $ | 9.81 | |
Total Return(c),(d) | | (1.12 | )% | 19.68 | % | 4.15 | % | 13.91 | % | 28.79 | % |
Net Assets End of Period (000’s) | | $ | 448,651 | | $ | 173,206 | | $ | 120,738 | | $ | 185,445 | | $ | 59,978 | |
Ratio and Supplemental Data | | | | | | | | | | | |
Expenses to average net assets(e) | | 0.86 | % | 0.92 | % | 0.91 | % | 0.97 | % | 1.08 | % |
Net investment income (loss), to average net assets(e) | | 1.79 | % | 1.72 | % | 1.62 | % | 1.67 | % | 1.41 | % |
Portfolio turnover rate(d) | | 18 | % | 19 | % | 26 | % | 86 | % | 62 | % |
For a share outstanding throughout each period(a)
| | Service Class | |
| | Year Ended December 31, | | May 1 to Dec | |
| | 2007 | | 2006 | | 2005 | | 2004 | | 31, 2003 | |
Net Asset Value | | | | | | | | | | | |
Beginning of period | | $ | 11.33 | | $ | 11.00 | | $ | 11.07 | | $ | 9.82 | | $ | 7.90 | |
Investment Operations | | | | | | | | | | | |
Net investment income (loss) | | 0.18 | | 0.17 | | 0.15 | | 0.17 | | 0.08 | |
Net realized and unrealized gain (loss) | | (0.33 | ) | 1.80 | | 0.26 | | 1.16 | | 1.85 | |
Total operations | | (0.15 | ) | 1.97 | | 0.41 | | 1.33 | | 1.93 | |
Distributions | | | | | | | | | | | |
From net investment income | | (0.03 | ) | (0.28 | ) | (0.06 | ) | (0.08 | ) | (0.01 | ) |
From net realized gains | | (0.05 | ) | (1.36 | ) | (0.42 | ) | — | | — | |
Total distributions | | (0.08 | ) | (1.64 | ) | (0.48 | ) | (0.08 | ) | (0.01 | ) |
Net Asset Value | | | | | | | | | | | |
End of period(b) | | $ | 11.10 | | $ | 11.33 | | $ | 11.00 | | $ | 11.07 | | $ | 9.82 | |
Total Return(c),(d) | | (1.33 | )% | 19.44 | % | 3.83 | % | 13.61 | % | 24.40 | % |
Net Assets End of Period (000’s) | | $ | 2,402 | | $ | 3,073 | | $ | 1,781 | | $ | 1,947 | | $ | 149 | |
Ratio and Supplemental Data | | | | | | | | | | | |
Expenses to average net assets(e) | | 1.11 | % | 1.17 | % | 1.16 | % | 1.22 | % | 1.31 | % |
Net investment income (loss), to average net assets(e) | | 1.52 | % | 1.49 | % | 1.36 | % | 1.66 | % | 1.39 | % |
Portfolio turnover rate(d) | | 18 | % | 19 | % | 26 | % | 86 | % | 62 | % |
(a) | Per share information is calculated based on average number of shares outstanding. |
(b) | American Century Large Company Value (the “Fund”) share class commenced operations as follows: |
| Initial Class - May 1, 2001 |
| Service Class - May 1, 2003 |
(c) | Total Return reflects all portfolio expenses and includes reinvestment of dividends and capital gains; it does not reflect the charges and deductions under the policies or annuity contracts. |
(d) | Not annualized. |
(e) | Annualized. |
The notes to the financial statements are an integral part of this report.
8
American Century Large Company Value
NOTES TO FINANCIAL STATEMENTS
At December 31, 2007
(all amounts in thousands)
NOTE 1. ORGANIZATION AND SIGNIFICANT ACCOUNTING POLICIES
AEGON/Transamerica Series Trust (“ATST”) is an open-end management investment company registered under the Investment Company Act of 1940, as amended (the “1940 Act”). ATST serves as a funding vehicle for variable life insurance, variable annuity and group annuity products. American Century Large Company Value (the “Fund”) is part of ATST.
In the normal course of business, the Fund enters into contracts that contain a variety of representations that provide general indemnifications. The Fund’s maximum exposure under these arrangements is unknown, as this would involve future claims that may be made against the Fund and/or its affiliates that have not yet occurred. However, based on experience, the Fund expects the risk of loss to be remote.
This report should be read in conjunction with the current Fund prospectus, which contains more complete information about the Fund.
In preparing the Fund’s financial statements in accordance with accounting principles generally accepted in the United States of America (“GAAP”), estimates or assumptions (which could differ from actual results) may be used that affect reported amounts and disclosures. The following is a summary of significant accounting policies followed by the Fund.
Multiple class operations, income and expenses: The Fund currently offers two classes of shares, an Initial Class and a Service Class. Income, non-class specific expenses and realized and unrealized gains and losses, are allocated daily to each class, based upon the value of shares outstanding method as permitted under Rule 18f-3 of the 1940 Act. Each class bears its own specific expenses as well as a portion of general, common expenses.
Security valuations: The Fund values its investments at the close of the New York Stock Exchange (“NYSE”), normally 4 p.m. ET, each day the NYSE is open for business. Fund investments are valued at the last sale price or closing price on the day of valuation taken from the primary exchange where the security is principally traded.
Securities traded in the over-the-counter market and listed securities for which no sale was reported on that date are valued at the last quoted bid price.
Debt securities are valued based on a price quotation or other equivalent indication of value supplied by an exchange, a pricing service or a major market maker; however, those that mature in sixty days or less are valued at amortized cost, which approximates market.
Investment company securities are valued at the net asset value of the underlying portfolio.
Securities for which quotations are not readily available are valued at fair market value as determined in good faith by the Fund’s Administrative Valuation Committee, using guidelines adopted by the Board of Trustees.
Cash: The Fund may leave cash overnight in its cash account with the custodian, State Street Bank & Trust Company (“State Street”). On July 2, 2007, State Street acquired the parent company of Investors Bank & Trust Company. State Street has been contracted on behalf of the Fund to invest the excess cash into a savings account, which at December 31, 2007 was paying an interest rate of 2.60%.
Repurchase agreements: The Fund is authorized to enter into repurchase agreements. The Fund, through its custodian, State Street, receives delivery of the underlying securities, the value of which at the time of purchase is required to be an amount equal to at least 100% of the resale price. The Fund will bear the risk of value fluctuations until the security can be sold and may encounter delays and incur costs in liquidating the security. In the event of bankruptcy or insolvency of the seller, delays and costs may be incurred.
Securities lending: The Fund may lend securities to qualified borrowers, with State Street acting as the Fund’s lending agent. The Fund earns negotiated lenders’ fees. The Fund receives cash and/or securities as collateral against the loaned securities. Cash collateral received is invested in short-term, interest-bearing securities. The Fund monitors the market value of securities loaned on a daily basis and requires collateral in an amount at least equal to the value of the securities loaned. Income from loaned securities earned by State Street for its services, shown in the Statement of Operations is net of fees, in the amount of $34.
The Fund has invested the cash collateral received from securities loaned in the following short-term, interest-bearing securities:
Abbey National PLC, Eurodollar Term, 5.00%, 1/7/2008 | | $ | 793 | |
ABN AMRO Bank NV, Eurodollar Term, 5.18%, 1/4/2008 | | 634 | |
Bank of Nova Scotia, Eurodollar Term, 4.96%, 1/22/2008 | | 555 | |
Barclays, Eurodollar Term, 5.00%, 2/12/2008 | | 1,110 | |
BNP Paribas, Eurodollar Term, 5.01%, 1/11/2008 | | 1,031 | |
Calyon, Eurodollar Term, 5.12%, 3/3/2008 | | 238 | |
Credit Suisse First Boston Corp., Repurchase Agreement, 4.60%, 1/2/2008 | | 2,062 | |
Dexia Group, Eurodollar Term, 4.82%, 1/3/2008 | | 793 | |
HBOS Halifax Bank of Scotland, Eurodollar Term, 5.15%, 1/2/2008 | | 396 | |
JPMorgan Chase & Co., Eurodollar Term, 5.15%, 2/12/2008 | | 396 | |
Lloyds TSB Bank, Eurodollar Term, 5.15%, 1/24/2008 | | 793 | |
Merrill Lynch & Co. (RPG), Repurchase Agreement, 4.60%, 1/2/2008 | | 1,189 | |
Morgan Stanley & Co. (Corp. Repo), Repurchase Agreement, 4.60%, 1/2/2008 | | 3,251 | |
Rabobank Nederland, Eurodollar Term, 5.08%, 1/10/2008 | | 952 | |
Reserve Primary Money Market Fund 4.95% | | 846 | |
Royal Bank of Scotland, Eurodollar Term, 5.00%, 2/25/2008 | | 952 | |
Societe Generale, Eurodollar Term, 5.15%, 3/3/2008 | | 476 | |
Toronto Dominion Bank, Eurodollar Term, 5.05%, 1/10/2008 | | 952 | |
UBS AG, Eurodollar Term, 4.92%, 1/11/2008 | | 555 | |
Wells Fargo, Bank Note, 4.75%, 1/8/2008 | | 396 | |
| | | |
| | $ | 18,370 | |
9
NOTES TO FINANCIAL STATEMENTS (continued)
At December 31, 2007
(all amounts in thousands)
NOTE 1.–(continued)
Futures contracts: The Fund may enter into futures contracts to manage exposure to market, interest rate or currency fluctuations. Futures contracts are valued at the settlement price established each day by the board of trade or exchange on which they are traded. The primary risks associated with futures contracts are: imperfect correlation between the change in market value of the securities held and the prices of futures contracts; the possibility of an illiquid market; and inability of the counterparty to meet the contract terms.
The underlying face amounts of open futures contracts at December 31, 2007 are listed in the Schedule of Investments. The variation margin receivable or payable, as applicable, is included in the Statement of Assets and Liabilities. Variation margin represents the additional payment due or excess deposits made in order to maintain the equity account at the required margin level.
Security transactions and investment income: Security transactions are recorded on the trade date. Security gains and losses are calculated on the first-in, first-out basis. Dividend income, if any, is recorded on the ex-dividend date or, in the case of foreign securities, as soon as the Fund is informed of the ex-dividend date. Interest income, including accretion of discounts and amortization of premiums, is recorded on the accrual basis commencing on the settlement date.
Dividend distributions: Dividends and capital gains distributions are typically declared and reinvested annually and are generally paid and reinvested on the business day following the ex-date.
NOTE 2. RELATED PARTY TRANSACTIONS
ATST serves as a funding vehicle for certain affiliated asset allocation portfolios and certain affiliated separate accounts of Western Reserve Life Assurance Co. of Ohio, Transamerica Life Insurance Company, Transamerica Financial Life Insurance Company, Inc., Monumental Life Insurance Company and Transamerica Occidental Life Insurance Company.
Transamerica Fund Advisors, Inc. (“TFAI”) is the Fund’s investment adviser. Transamerica Fund Services, Inc. (“TFS”) is the Fund’s administrator and transfer agent. Prior to May 1, 2007, AFSG Securities Corp. (“AFSG”), was the Fund’s distributor. Transamerica Capital Inc. (“TCI”) is now the Fund’s distributor. TFAI, TFS, and TCI are affiliates of AEGON NV, a Netherlands corporation.
Certain officers and trustees of the Fund are also officers and/or directors of TFAI, TFS and TCI.
The following schedule reflects the percentage of Fund assets owned by affiliated investment companies at December 31, 2007:
| | Net | | % of Net | |
| | Assets | | Assets | |
| | | | | |
Asset Allocation-Conservative Portfolio | | $ | 17,640 | | 3.91 | % |
Asset Allocation-Growth Portfolio | | 86,386 | | 19.15 | |
Asset Allocation-Moderate Growth Portfolio | | 209,167 | | 46.37 | |
Asset Allocation-Moderate Portfolio | | 84,726 | | 18.79 | |
Total | | $ | 397,919 | | 88.22 | % |
Investment advisory fee: The Fund pays management fees to TFAI based on average daily net assets (“ANA”) at the following breakpoints:
| 0.835% of the first $250 million of ANA |
| 0.80% of the next $150 million of ANA |
| 0.775% of the next $350 million of ANA |
| 0.70% of ANA over $750 million |
TFAI has contractually agreed to waive its advisory fee and will reimburse the Fund to the extent that operating expenses, excluding 12b-1 fees, exceed the following stated annual limit:
If total Fund expenses fall below the annual expense limitation agreement agreed to by the adviser within the succeeding three years, the Fund may be required to pay the adviser a portion or all of the waived advisory fees.
There were no amounts recaptured during the year ended December 31, 2007. There are no amounts available for recapture at December 31, 2007.
Distribution and service fees: ATST entered into a Distribution Agreement with AFSG dated January 1, 1997, as amended. On May 1, 2007, the Distribution Agreement was amended to replace AFSG with TCI as the Fund’s distributor. The Fund has also adopted a distribution plan (“Distribution Plan”) pursuant to Rule 12b-1 under the 1940 Act.
Under the Distribution Plan for the Initial Class shares, TCI, on behalf of the Fund, is authorized to pay various service providers, as direct payment for expenses incurred in connection with distribution of the Fund’s shares, amounts equal to actual expenses associated with distributing the shares.
The Distribution Plan for the Service Class shares requires ATST to pay distribution fees to TCI as compensation for its activities, not as reimbursement for specific expenses. The fee on the Service Class is paid to the insurance companies for providing services and account maintenance for their policyholders who invest in the variable insurance products which invest in the Service Class shares.
The Fund is authorized under the Distribution Plan to pay fees on each class up to the following limits:
Initial Class | | 0.15 | % |
Service Class | | 0.25 | % |
TCI has determined that it will not seek payment by the Fund of the distribution expenses incurred with respect to the Initial
10
NOTES TO FINANCIAL STATEMENTS (continued)
At December 31, 2007
(all amounts in thousands)
NOTE 2.–(continued)
Class shares before April 30, 2009. Prior to TCI seeking reimbursement of future expenses, policy and contract owners will be notified in advance. The Fund will pay fees relating to Service Class shares.
Administrative services: The Fund has entered into an agreement with TFS for financial and legal fund administration services. The Fund pays TFS an annual fee of 0.02% of ANA. The Legal fees on the Statement of Operations are for fees paid to external legal counsel.
Deferred compensation plan: Each eligible independent Fund Trustee may elect participation in a non-qualified deferred compensation plan (“the Plan”). Under the Plan, such Trustees may defer payment of all or a portion of their total fees earned as a Fund Trustee. Each Trustee who is a participant in the Plan may elect that the earnings, losses or gains credited to his or her deferred fee amounts be determined based on a deemed investment in any series of Transamerica IDEX Mutual Funds. The right of a participant to receive a distribution from the Plan of the deferred fees is an unsecured claim against the general assets of all series of Transamerica IDEX Mutual Funds. The pro rata liability to the Fund of all deferred fees in the Plan amounted, as of December 31, 2007, to $22. Amounts deferred under the Plan are unfunded against the general assets of ATST.
Retirement plan: Under a retirement plan (the “Emeritus Plan”) available to the Independent Trustees, each Independent Trustee is deemed to have elected to serve as Trustee Emeritus of ATST upon his or her termination of service, other than removal for cause, and is entitled to 50% of the trustee’s current retainer for a maximum period of five years determined by his or her years of service as a Trustee.
Such amounts shall be accrued by ATST on a pro rata basis allocable to each series of ATST fund based on the relative assets of the series. If retainers increase in the future, past accruals (and credits) will be adjusted upward so that 50% of the Trustee’s current retainer is accrued and credited at all times. Upon death, disability or termination of service, other than removal for cause, amounts deferred become payable to a Trustee Emeritus (or his/her beneficiary). Upon the commencement of service as Trustee Emeritus, compensation will be paid on a quarterly basis during the time period that the Trustee Emeritus is allowed to serve as such.
Amounts accrued under the Emeritus Plan are unsecured claims against the general assets of ATST. For the year ended December 31, 2007, the amount related to the Emeritus Plan was $5. As of December 31, 2007, the Fund has not made any payments related to the Emeritus Plan.
The Emeritus Plan was terminated effective October 30, 2007. Upon the termination, the Fund shall continue to pay any remaining benefits in accordance with the Plan, but no further compensation shall accrue under the Plan.
NOTE 3. INVESTMENT TRANSACTIONS
The cost of securities purchased and proceeds from securities sold (excluding short-term securities) for the year ended December 31, 2007 were as follows:
Purchases of securities: | | | |
Long-term | | $ | 348,588 | |
U.S. Government | | — | |
Proceeds from maturities and sales of securities: | | | |
Long-term | | 70,701 | |
U.S. Government | | — | |
| | | | |
NOTE 4. FEDERAL INCOME TAX MATTERS
The Fund has not made any provision for federal income or excise taxes due to its policy to distribute all of its taxable income and capital gains to its shareholders and otherwise qualify as a regulated investment company under Subchapter M of the Internal Revenue Code. Income and capital gain distributions are determined in accordance with income tax regulations, which may differ from GAAP. These differences are primarily due to differing treatment for items including, but not limited to, wash sales.
Therefore, distributions determined in accordance with tax regulations may differ significantly in amount or character from net investment income and realized gains for financial reporting purposes. Financial reporting records are adjusted for permanent book/tax differences to reflect tax character. Financial records are not adjusted for temporary differences. These reclassifications are as follows:
Additional paid-in capital | | $ | — | |
Undistributed (accumulated) net investment income (loss) | | $ | (12 | ) |
Undistributed (accumulated) net realized gain (loss) from investment securities | | $ | 12 | |
The tax character of distributions paid may differ from the character of distributions shown in the Statements of Changes in Net Assets due to short-term gains being treated as ordinary income for tax purposes. The tax character of distributions paid during 2006 and 2007 was as follows:
2006 Distributions paid from: | | | |
Ordinary Income | | $ | 7,004 | |
Long-term Capital Gain | | 9,792 | |
| | | |
2007 Distributions paid from: | | | |
Ordinary Income | | 2,408 | |
Long-term Capital Gain | | 1,760 | |
| | | |
| | | | |
The tax basis components of distributable earnings as of December 31, 2007 are as follows:
Undistributed Ordinary Income | | $ | 9,600 | |
Undistributed Long-term Capital Gain | | $ | 12,922 | |
Capital Loss Carryforward | | $ | — | |
Net Unrealized Appreciation (Depreciation) | | $ | (6,585 | ) |
11
NOTES TO FINANCIAL STATEMENTS (continued)
At December 31, 2007
(all amounts in thousands)
NOTE 5. REGULATORY PROCEEDINGS
There continues to be significant federal and state regulatory activity relating to financial services companies, particularly mutual fund companies and their investment advisers. As part of an ongoing investigation regarding potential market timing, recordkeeping and trading compliance issues and matters affecting the Fund’s investment adviser, TFAI, and certain affiliates and former employees of TFAI, the SEC staff has indicated that it is likely to take some action against TFAI and certain of its affiliates at the conclusion of the investigation. The potential timing and the scope of any such action is difficult to predict. Although the impact of any action brought against TFAI and/or its affiliates is difficult to assess at the present time, the Fund currently believes that the likelihood that any such action will have a material adverse impact is remote. It is important to note that the Fund is not aware of any allegation of wrongdoing against it and its Board at the time this annual report is printed. Although it is not anticipated that these developments will have an adverse impact on the Fund, there can be no assurance at this time. TFAI and its affiliates are actively working with the SEC in regard to this matter; however, the exact resolution cannot be determined at this time. TFAI will take such actions that it deems necessary or appropriate to continue providing management services to the Fund and to bring all matters to an appropriate conclusion.
TFAI and/or its affiliates, and not the Fund, will bear the costs regarding these regulatory matters.
NOTE 6. RECENTLY ISSUED ACCOUNTING PRONOUNCEMENTS
In July 2006, the Financial Accounting Standards Board (“FASB”) released FASB Interpretation No. 48 “Accounting for Uncertainty in Income Taxes” (“FIN 48”), an interpretation of FASB Statement No. 109. FIN 48 provides guidance for how uncertain tax positions should be recognized, measured, presented and disclosed in the financial statements. FIN 48 requires the accounting and disclosure of tax positions taken or expected to be taken in the course of preparing the Fund’s tax returns to determine whether the tax positions are “more-likely- than-not” of being sustained by the applicable tax authority. Tax positions not deemed to meet the more-likely-than-not threshold would be recorded as a tax benefit or expense in the current year.
Adoption of FIN 48 is effective during the first required financial reporting period for fiscal years beginning after December 15, 2006. Management adopted FIN 48 on June 29, 2007.
Implementation of FIN 48 requires Management of the Fund to analyze all open tax years, as defined by the Statute of Limitations, for all major jurisdictions, which includes federal and certain states. Open tax years are those that are open for exam by taxing authorities (i.e., the last 4 tax year ends and the interim tax period since then). The Fund has no examinations in progress and none are expected at this time.
Management of the Fund has reviewed all open tax years and major jurisdictions and concluded the adoption of FIN 48 resulted in no impact to the Fund’s net assets or results of operations. There is no tax liability resulting from unrecognized tax benefits relating to uncertain income tax positions taken or expected to be taken in future tax returns. The Fund is also not aware of any tax positions for which it is reasonably possible that the total amounts of unrecognized tax benefits will significantly change in the next 12 months.
In September 2006, FASB issued its new Standard No. 157, “Fair Value Measurements” (“FAS 157”). FAS 157 is designed to unify guidance for the measurement of fair value of all types of assets, including financial instruments, and certain liabilities, throughout a number of accounting standards. FAS 157 also establishes a hierarchy for measuring fair value in generally accepted accounting principles and expands financial statement disclosures about fair value measurements that are relevant to mutual funds. FAS 157 is effective for financial statements issued for fiscal years beginning after November 15, 2007, and earlier application is permitted.
As of December 31, 2007, Management does not expect the adoption of FAS 157 to impact the amounts reported in the financial statements, however, additional disclosures will be required about the inputs used to develop the measurements of fair value and the effect of certain of the measurements reported in the statement of operations for a fiscal period.
NOTE 7. SUBSEQUENT EVENT
Effective January 1, 2008, TFAI changed its name to Transamerica Asset Management, Inc.
Effective May 1, 2008, AEGON/Transamerica Series Trust will change its name to Transamerica Series Trust. At that time, the Fund will also change its name to Transamerica American Century Large Company Value VP.
12
Report of Independent Registered Certified Public Accounting Firm
To the Board of Trustees and Shareholders of
American Century Large Company Value:
In our opinion, the accompanying statement of assets and liabilities, including the schedule of investments, and the related statements of operations and of changes in net assets and the financial highlights present fairly, in all material respects, the financial position of American Century Large Company Value (the “Fund”) (one of the portfolios constituting AEGON/Transamerica Series Trust) at December 31, 2007, the results of its operations for the year then ended, the changes in its net assets for each of the two years in the period then ended and the financial highlights for each of the periods presented, in conformity with accounting principles generally accepted in the United States of America. These financial statements and financial highlights (hereafter referred to as “financial statements”) are the responsibility of the Fund’s management; our responsibility is to express an opinion on these financial statements based on our audits. We conducted our audits of these financial statements in accordance with the standards of the Public Company Accounting Oversight Board (United States). Those standards require that we plan and perform the audit to obtain reasonable assurance about whether the financial statements are free of material misstatement. An audit includes examining, on a test basis, evidence supporting the amounts and disclosures in the financial statements, assessing the accounting principles used and significant estimates made by management, and evaluating the overall financial statement presentation. We believe that our audits, which included confirmation of securities at December 31, 2007 by correspondence with the custodian and brokers, provide a reasonable basis for our opinion.

Tampa, Florida
February 29, 2008
13
American Century Large Company Value
SUPPLEMENTAL TAX INFORMATION (unaudited)
(all amounts in thousands)
For tax purposes, the Fund has made a Long-Term Capital Gain Designation of $1,760 for the year ended December 31, 2007.
RESULTS OF SHAREHOLDER PROXY (unaudited)
At a special meeting of shareholders held on October 30, 2007, the results of the Proposals were as follows:
Proposal 1: To elect a new Board:
Proposed | | | | | | Abstentions/Broker Non- | |
Trustee | | For | | Against | | Votes | |
John K. Carter | | 2,274,998,840.817 | | 57,804,698.755 | | 35,433.883 | |
| | | | | | | |
Leo J. Hill | | 2,277,212,702.754 | | 55,590,836.819 | | 35,433.883 | |
| | | | | | | |
Neal M. Jewell | | 2,266,793,295.663 | | 66,010,243.909 | | 35,433.883 | |
| | | | | | | |
Russell A. Kimball, Jr. | | 2,274,825,235.835 | | 57,978,303.737 | | 35,433.883 | |
| | | | | | | |
Eugene M. Mannella | | 2,274,623,165.033 | | 58,180,374.539 | | 35,433.883 | |
| | | | | | | |
Norm R. Nielsen | | 2,275,050,055.885 | | 57,753,483.687 | | 35,433.883 | |
| | | | | | | |
Joyce Galpern Norden | | 2,270,278,122.250 | | 62,525,417.323 | | 35,433.883 | |
| | | | | | | |
Patricia L. Sawyer | | 2,275,737,737.456 | | 57,065,802.116 | | 35,433.883 | |
| | | | | | | |
John W. Waechter | | 2,276,615,120.140 | | 56,188,419.433 | | 35,433.883 | |
Proposal 2: To approve an amendment to the Agreement and Declaration of Trust:
| | | | Abstentions/Broker Non- | |
For | | Against | | Votes | |
2,182,022,669.110 | | 77,590,048.544 | | 73,226,255.801 | |
14
American Century Large Company Value
INVESTMENT ADVISORY AND SUB-ADVISORY AGREEMENTS-REVIEW AND RENEWAL (unaudited)
At a meeting of the Board of Trustees of AEGON/Transamerica Series Trust (“ATST”) held on December 4th, 2007, the Board reviewed and considered the renewal of the investment advisory agreement (the “Investment Advisory Agreement”) between American Century Large Company Value (the “Fund”) and Transamerica Fund Advisors, Inc. (“TFAI”), as well as the renewal of the investment sub-advisory agreement (the “Sub-Advisory Agreement”) of the Fund between TFAI and American Century Investment Management, Inc. (the “Sub-Adviser”), to determine whether the agreements should be renewed for a six-month period. It was noted that this review was interim in nature to align all the Funds on the same calendar, and that the Funds’ advisory arrangements would be reviewed again in the first half of 2008.
Following their review and consideration, the Trustees determined that the renewal of the Investment Advisory Agreement and the Sub-Advisory Agreement would enable shareholders of the Fund to obtain high quality services at a cost that is appropriate, fair, and in the best interests of its shareholders. The Board, including the independent members of the Board, unanimously approved the renewal of the Investment Advisory Agreement and Sub-Advisory Agreement. In reaching their decision, the Trustees requested and obtained from TFAI and the Sub-Adviser such information as they deemed reasonably necessary to evaluate the agreements, including information about fees and performance of comparable funds managed by the Sub-Adviser. The Trustees also carefully considered information they had previously received from TFAI and the Sub-Adviser throughout the year as part of their regular oversight of the Fund, as well as comparative fee, expense, and performance information prepared by Lipper Inc. (“Lipper”), an independent provider of mutual fund performance, fee and expense information and profitability data prepared by management. In considering the proposed continuation of the Investment Advisory and Sub-Advisory Agreements, the Trustees evaluated a number of considerations that they believed, in light of the legal advice furnished to them by independent legal counsel and their own business judgment, to be relevant. They based their decisions on a variety of factors, including the following considerations, among others, although they did not identify any consideration or particular information that was controlling of their decisions:
The nature, extent and quality of the advisory services to be provided. The Board considered the nature and quality of the services provided by TFAI and the Sub-Adviser to the Fund in the past, as well as the services anticipated to be provided in the future. The Board concluded that TFAI and the Sub-Adviser are capable of providing high quality services to the Fund, as indicated by the nature and quality of services provided in the past by TFAI and the Sub-Adviser for this series and the experience, capability and integrity of TFAI’s senior management, the financial resources of TFAI and the Sub-Adviser, TFAI’s management oversight process and the professional qualifications of the portfolio management team of the Sub-Adviser. The Trustees determined that TFAI and the Sub-Adviser can provide investment and related services that are appropriate in scope and extent in light of the Fund’s operations, the competitive landscape of the investment company business and investor needs.
The investment performance of the Fund. The Board examined the short and longer-term performance of the Fund, including relative performance against a peer universe of comparable mutual funds as prepared by Lipper for various trailing periods ended June 30, 2007. The Board noted that performance was around median for comparable funds for 1-, 3- and 5-year periods, but the Board also noted that part of the Fund’s longer-term record was generated under a different investment team. On the basis of the Board’s assessment of the nature, extent and quality of advisory services to be provided or procured by TFAI and the Sub-Adviser, the Board concluded that TFAI and the Sub-Adviser are capable of providing a level of investment performance that is appropriate in light of the Fund’s proposed investment objectives, policies and strategies and competitive with other similarly situated investment companies.
The cost of advisory services provided and the level of profitability. The Board reviewed profitability information of TFAI’s cost of procuring fund management services, as well as the costs of provision of administration, fund accounting and other services, to the Fund and to ATST as a whole by TFAI and its affiliates. The Board reviewed the management and sub-advisory fees for the Fund. Although fees were higher relative to the peer group and universe of comparable mutual funds, the Board noted that fees were renegotiated for 2008. Based on their review, the Trustees determined that the management fees of the Fund generally are appropriate in light of the services expected to be provided or procured, the management fees and the anticipated profitability of the relationship between the Fund, TFAI and its affiliates, and the Sub-Adviser. In making these observations and determinations, the Board reviewed among other things, comparative information provided by Lipper.
Whether fee levels reflect economies of scale and the extent to which economies of scale would be realized as the Fund grows. In evaluating the extent to which the management fees payable under the Investment Advisory and Sub-Advisory Agreements reflect economies of scale or will permit economies of scale to be realized in the future, the Board noted that TFAI and the Sub-Adviser offer breakpoints which appropriately benefit investors by passing on economies of scale in the form of lower management fees as the level of assets grows. The Board also noted that an additional advisory breakpoint occurs above the sub-advisory breakpoints offered. The Trustees also concluded that they will have the opportunity to periodically reexamine whether the Fund has achieved economies of scale, and the appropriateness of management fees payable to TFAI and fees paid to the Sub-Adviser, in the future.
Benefits (such as soft dollars) to TFAI, its affiliates, or the Sub-Adviser from their relationship with the Fund. The Board concluded that other benefits anticipated to be derived by TFAI, its affiliates, and the Sub-Adviser from their relationships with the Fund are expected to be reasonable and fair, and consistent with industry practice and the best interests of the Fund and its shareholders. The Trustees noted that TFAI would not realize soft dollar benefits from its relationship with the Fund, and that the Sub-Adviser’s soft dollar trading is consistent with applicable law, including best execution requirements in particular.
Other considerations. The Board determined that TFAI has made a substantial commitment to the recruitment and retention of high quality personnel, and maintains the financial, compliance and operational resources reasonably necessary to manage the Fund in a professional manner that is consistent with the best interests of the Fund and its shareholders. In this regard, the Trustees favorably considered the procedures and policies in place by TFAI to enforce compliance with applicable laws and regulations and oversee the
15
portfolio management activities of the Sub-Adviser. The Trustees also determined that TFAI has made a significant entrepreneurial commitment to the management and success of the Fund, reflected by TFAI’s expense limitation and fee waiver arrangements with the Fund which may result in TFAI waiving a substantial amount of management fees for the benefit of shareholders.
16
Asset Allocation - Conservative Portfolio
MARKET ENVIRONMENT
The stock and bond markets rose for the twelve-month period through December 31, 2007, but suffered plenty of volatility along the way. The Standard and Poor’s 500 Composite Stock Index returned 5.49%, while the broad Dow Jones Wilshire 5000 Total Market Index (“DJ Wilshire 5000”) gained 5.74%. These modest gains were punctuated by setbacks, however. In the summer, gathering concern about the U.S. mortgage and housing markets reached alarming levels. The mortgage industry’s loose lending standards of recent years came back to haunt lenders, investors, and borrowers alike. Lenders responded by tightening credit standards, many borrowers could no longer qualify for loans, and home sales and refinancings slowed. These problems worsened in the year’s last two months as financial institutions announced write-downs of mortgage-related holdings. After tumbling in the summer, stocks of financial companies again pulled the broad indices down in November and December.
By midyear investors were favoring the relative safety of larger stocks. As they migrated toward large caps while also steering away from financials and other value stocks, they boosted large-cap growth stocks in sectors such as technology. Large growth companies were also rewarded for being big exporters, an advantage with the weak U.S. dollar. For the year, large caps outpaced small caps, and growth stocks significantly outperformed value stocks across all market-cap ranges.
Foreign equity returns surpassed the U.S. indices. The Morgan Stanley Capital International EAFE Index rose 11.63% (gross) for the period, mainly because major foreign currencies strengthened against the dollar (the index gained only 3.54% (net) in local-currency terms). Emerging markets were especially strong as high commodity prices bolstered the developing nations that export them. The Morgan Stanley Capital International Emerging Markets Index soared 39.78% (gross) for the year.
Bond returns improved throughout the year as nervous investors sought safety from the shaky stock market. The Federal Reserve Board’s three rate cuts from September through December also helped bond prices. The Lehman Brothers Aggregate Bond Index (“LBAB”) finished the year with a 6.97% return, with U.S. government bonds leading the gains. High-yield bonds weakened as credit conditions worsened, but posted modestly positive returns thanks to strength earlier in the year.
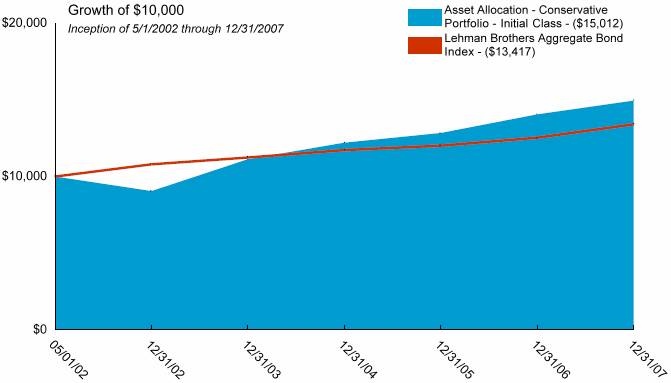
PERFORMANCE
For the year ended December 31, 2007, Asset Allocation - Conservative Portfolio, Initial Class returned 6.38%. By comparison its primary and secondary benchmarks, the LBAB and the DJ Wilshire 5000, returned 6.97% and 5.74%, respectively.
STRATEGY REVIEW
This fund-of-funds portfolio is structured to provide an approximately 35%/55%/10% mix of stocks, bonds, and cash. The fixed-income portion of the portfolio is well diversified, covering investment-grade and credit-sensitive holdings, as well as international bonds. Its equity exposure is intended to provide broad coverage of domestic and international equity markets, across market capitalizations and investment styles. It also includes emerging markets, global real estate, and absolute-return strategies.
The largest position, PIMCO Total Return, finished the year strongly; it beat the LBAB by two percentage points after lagging earlier in the year. Transamerica Convertible Securities was the best performer among the bond funds. MFS High Yield and TA IDEX Transamerica Flexible Income were laggards, but the remaining bond funds performed decently relative to their asset classes. Transamerica Science & Technology was the portfolio’s top gainer thanks to surging tech stocks, and TA IDEX Oppenheimer Developing Markets performed almost as well, as many emerging markets soared. The portfolio’s growth funds within the mid- and large-cap tiers clearly benefited from the strength of growth stocks. A couple of the value funds were weighed down by the financials sector, but in the small-cap area Transamerica Small/Mid Cap Value posted a significant gain and the other small-cap focused value fund, TA IDEX Oppenheimer Small- & Mid-Cap Value, also impressed with a positive return. The international position’s emerging-markets exposure (mostly via the aforementioned Oppenheimer fund) was certainly a boost to returns, but TA IDEX Marsico International Growth also posted strong results, and TA IDEX International Small Cap beat the Morgan Stanley Capital International EAFE Index even though the year favored large caps.
In early 2007 we conducted a broad rebalancing, mainly to further diversify the bond position and better balance the portfolio’s equity exposure. We believe the portfolio’s good 2007 return, demonstrate the effectiveness of maintaining disciplined and balanced market coverage while emphasizing strong managers in each style.
In January 2007, TA IDEX Loomis Sayles Bond was added to the menu of underlying funds available for use in this portfolio, and it was added to the portfolio’s holdings that same month.
Michael Stout, CFA
Jon Hale, Ph.D., CFA
Jeff McConnell, CFA
Maciej Kowara, Ph.D., CFA
Co-Portfolio Managers
Morningstar Associates, LLC
AEGON/Transamerica Series Trust | | | | Annual Report 2007 |
1
Asset Allocation - Conservative Portfolio
(unaudited)
Average Annual Total Return for Periods Ended 12/31/2007
| | | | | | From | | Inception | |
| | 1 Year | | 5 Years | | Inception | | Date | |
| | | | | | | | | |
Initial Class | | 6.38 | % | 10.55 | % | 7.43 | % | 5/1/02 | |
Lehman Brothers Aggregate Bond Index(1) | | 6.97 | % | 4.42 | % | 5.32 | % | 5/1/02 | |
DJ Wilshire 5000(1) | | 5.74 | % | 14.07 | % | 8.54 | % | 5/1/02 | |
| | | | | | | | | |
Service Class | | 6.15 | % | — | % | 9.95 | % | 5/1/03 | |
NOTES
(1) The Lehman Brothers Aggregate Bond (LBAB) Index and the Dow Jones Wilshire 5000 Total Market (DJ Wilshire 5000) Index are unmanaged indices used as a general measure of market performance. Calculations assume dividends and capital gains are reinvested and do not include any managerial expenses. From inception, calculation is based on life of Initial Class shares.
The performance data presented represents past performance; future results may vary. The portfolio’s investment return and net asset value will fluctuate. Past performance does not guarantee future results. Investor’s units when redeemed may be worth more or less than their original cost.
Current performance may be lower or higher than performance quoted. Please visit your insurance company’s website for contract or policy level standardized total returns current to the most recent month end. Portfolio performance is net of investment fees and fund expenses, but not product charges, which, if included, would significantly lower the performance quoted.
This material must be preceded or accompanied by a current prospectus, which includes specific contents regarding the investment objectives, explanation of share classes and policies of this portfolio.
2
Asset Allocation - Conservative Portfolio
UNDERSTANDING YOUR FUND’S EXPENSES
(unaudited)
SHAREHOLDER EXPENSES
Fund shareholders may incur ongoing costs, including management and advisory fees, distribution and service fees, and other fund expenses.
The following Example is intended to help you understand your ongoing costs (in dollars and cents) of investing in the Fund and to compare these costs with the ongoing costs of investing in other funds.
The Example is based on an investment of $1,000 invested at July 1, 2007 and held for the entire period until December 31, 2007.
ACTUAL EXPENSES
The first line in the table below provides information about actual account values and actual expenses. You may use the information in this line, together with the amount you invested, to estimate the expenses that you paid over the period. Simply divide your account value by $1,000 (for example, an $8,600 account value divided by $1,000 = 8.6), then multiply the result by the number in the first line of your Fund under the heading entitled “Expenses Paid During Period” to estimate the expenses you paid on your account during this period.
HYPOTHETICAL EXAMPLE FOR COMPARISON PURPOSES
The second line in the table below provides information about hypothetical account values and hypothetical expenses based on the Fund’s actual expense ratio and an assumed rate of return of 5% per year before expenses, which is not the Fund’s actual return. The hypothetical account values and expenses may not be used to estimate the actual ending account balance or expenses you paid for the period. You may use this information to compare the ongoing costs of investing in your Fund and other funds. To do so, compare this 5% hypothetical example with the 5% hypothetical examples that appear in the shareholder reports of the other funds.
Please note that the expenses shown in the table are meant to highlight your ongoing costs only and do not reflect any transactional costs, such as sales charges, redemption fees, brokerage commissions paid on purchases and sales of fund shares. Therefore, the second line under the Fund in the table is useful in comparing ongoing costs only, and will not help you determine the relative total costs of owning different funds. If any of these transaction costs were included, your costs would be higher. The expenses shown in the table do not reflect any fees that may be charged to you by brokers, financial intermediaries or other financial institutions.
The expenses shown in the table do not reflect any expenses from the Funds investment in other affiliated investment companies. The average weighted annualized expense ratio of the underlying investment companies at December 31, 2007, was 0.77%.
| | Beginning | | Ending | | Annualized | | Expenses | |
| | Account | | Account | | Expense | | Paid During | |
| | Value | | Value | | Ratio | | Period (a) | |
| | | | | | | | | |
Initial Class | | | | | | | | | |
Actual | | $ | 1,000.00 | | $ | 1,030.79 | | 0.13 | % | $ | 0.67 | |
Hypothetical(b) | | 1,000.00 | | 1,024.55 | | 0.13 | | 0.66 | |
| | | | | | | | | |
Service Class | | | | | | | | | |
Actual | | 1,000.00 | | 1,029.25 | | 0.38 | | 1.99 | |
Hypothetical(b) | | 1,000.00 | | 1,023.24 | | 0.38 | | 1.99 | |
| | | | | | | | | | | | |
(a) | | Expenses are calculated using the Fund’s annualized expense ratio (as disclosed in the table), multiplied by the average account value for the period, multiplied by the number of days in the period (184 days), and divided by the number of days in the year (365 days). |
| | |
(b) | | 5% return per year before expenses. |
GRAPHICAL PRESENTATION OF SCHEDULE OF INVESTMENTS
By Asset Type
At December 31, 2007
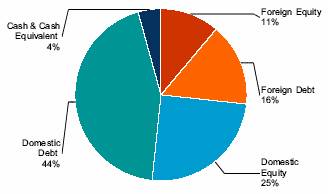
This chart shows the percentage breakdown by asset type of the aggregate portfolio holdings of the underlying affiliated investment companies in which the Fund invests. The security lending collateral in the underlying funds is excluded from this calculation.
3
Asset Allocation - Conservative Portfolio
SCHEDULE OF INVESTMENTS
At December 31, 2007
(all amounts except share amounts in thousands)
| | Shares | | Value | |
INVESTMENT COMPANIES (100.0%) | | | | | |
Bond (44.3%) | | | | | |
MFS High Yield (1) | | 2,369,350 | | $ | 20,708 | |
PIMCO Total Return (1) | | 11,428,285 | | 133,140 | |
TA IDEX JPMorgan International Bond (2) | | 6,167,925 | | 67,662 | |
TA IDEX Transamerica Flexible Income (2) | | 5,855,797 | | 52,878 | |
TA IDEX Transamerica High-Yield Bond (2) | | 2,029,774 | | 18,065 | |
TA IDEX Transamerica Short-Term Bond (2) | | 6,743,847 | | 65,887 | |
TA IDEX Van Kampen Emerging Markets Debt (2) | | 2,787,789 | | 29,300 | |
Transamerica Convertible Securities (1) | | 2,556,188 | | 31,901 | |
Transamerica U.S. Government Securities (1) | | 53,601 | | 643 | |
Capital Preservation (1.9%) | | | | | |
Transamerica Money Market (1) | | 17,949,503 | | 17,950 | |
Global/International Stock (4.6%) | | | | | |
TA IDEX AllianceBernstein International Value (2) | | 674,522 | | 8,553 | |
TA IDEX Evergreen International Small Cap (2) | | 730,268 | | 11,166 | |
TA IDEX Marsico International Growth (2) | | 467,311 | | 6,365 | |
TA IDEX Neuberger Berman International (2) | | 600,003 | | 6,732 | |
TA IDEX Oppenheimer Developing Markets (2) | | 756,349 | | 11,201 | |
Inflation-Protected Securities (7.1%) | | | | | |
TA IDEX PIMCO Real Return TIPS (2) | | 6,463,121 | | 67,087 | |
Tactical and Specialty (12.7%) | | | | | |
Clarion Global Real Estate Securities (1) | | 901,971 | | $ | 17,715 | |
TA IDEX BlackRock Global Allocation (2) | | 259,072 | | 3,155 | |
TA IDEX Evergreen Health Care (2) | | 1,736,291 | | 22,034 | |
TA IDEX Loomis Sayles Bond (2) | | 7,715,482 | | 77,463 | |
U.S. Stock (29.4%) | | | | | |
American Century Large Company Value (1) | | 1,587,086 | | 17,633 | |
BlackRock Large Cap Value (1) | | 693,030 | | 13,279 | |
Capital Guardian Value (1) | | 1,412,875 | | 25,912 | |
Federated Market Opportunity (1) | | 2,386,017 | | 34,979 | |
Jennison Growth (1) | | 1,033,631 | | 8,527 | |
JPMorgan Mid Cap Value (1) | | 1,098,057 | | 17,338 | |
Marsico Growth (1) | | 1,682,268 | | 21,802 | |
T. Rowe Price Equity Income (1) | | 30,653 | | 585 | |
T. Rowe Price Growth Stock (1) | | 433,255 | | 11,109 | |
T. Rowe Price Small Cap (1) | | 558,820 | | 5,739 | |
TA IDEX Oppenheimer Small- & Mid-Cap Value (2) | | 211,363 | | 2,431 | |
TA IDEX Third Avenue Value (2) | | 1,384,737 | | 36,072 | |
TA IDEX UBS Large Cap Value (2) | | 2,723,644 | | 34,073 | |
TA IDEX Van Kampen Small Company Growth (2) | | 120,756 | | 1,402 | |
Transamerica Equity (1) | | 1,133,815 | | 32,767 | |
Transamerica Growth Opportunities (1) | | 732,858 | | 13,323 | |
Transamerica Small/Mid Cap Value (1) | | 72,704 | | 1,607 | |
| | | | | |
Total Investment Companies (cost $924,102) # | | | | $ | 948,183 | |
NOTES TO SCHEDULE OF INVESTMENTS:
(1) | | The Fund invests its assets in the Initial Class shares of the affiliated AEGON/Transamerica Series Trust. |
(2) | | The Fund invests its assets in the Class I shares of the affiliated Transamerica IDEX Mutual Funds. |
# | | Aggregate cost for federal income tax purposes is $926,291. Aggregate gross unrealized appreciation for all securities in which there is an excess of value over tax cost and aggregate gross unrealized depreciation for all securities in which there is an excess of tax cost over value were $40,054 and $18,162, respectively. Net unrealized appreciation for tax purposes is $21,892. |
The notes to the financial statements are an integral part of this report.
4
Asset Allocation - Conservative Portfolio
STATEMENT OF ASSETS AND LIABILITIES
At December 31, 2007
(all amounts except per share amounts in thousands)
Assets: | | | |
Investment in affiliated investment companies at value (cost: $924,102) | | $ | 948,183 | |
Receivables: | | | |
Investment securities sold | | 382 | |
Shares sold | | 411 | |
| | 948,976 | |
Liabilities: | | | |
Accounts payable and accrued liabilities: | | | |
Shares redeemed | | 773 | |
Management and advisory fees | | 80 | |
Distribution and service fees | | 82 | |
Administration fees | | 10 | |
Trustees fees | | 36 | |
Other | | 49 | |
| | 1,030 | |
Net Assets | | $ | 947,946 | |
| | | |
Net Assets Consist of: | | | |
Capital Stock ($.01 par value) | | $ | 826 | |
Additional paid-in capital | | 847,126 | |
Undistributed (accumulated) net investment income in affiliate | | 32,255 | |
Undistributed (accumulated) net realized gain from investment in affiliated investment companies | | 43,658 | |
Net unrealized appreciation on investment in affiliated investment companies | | 24,081 | |
Net Assets | | $ | 947,946 | |
Net Assets by Class: | | | |
Initial Class | | $ | 554,977 | |
Service Class | | 392,969 | |
Shares Outstanding: | | | |
Initial Class | | 48,282 | |
Service Class | | 34,344 | |
Net Asset Value and Offering Price Per Share: | | | |
Initial Class | | $ | 11.49 | |
Service Class | | 11.44 | |
STATEMENT OF OPERATIONS
For the year ended December 31, 2007
(all amounts in thousands)
Investment Income: | | | |
Dividends from affiliated investment companies | | $ | 34,307 | |
| | 34,307 | |
Expenses: | | | |
Management and advisory fees | | 908 | |
Printing and shareholder reports | | 21 | |
Custody fees | | 63 | |
Administration fees | | 114 | |
Legal fees | | 18 | |
Audit fees | | 21 | |
Trustees fees | | 31 | |
Registration fees | | 6 | |
Distribution and service fees: | | | |
Service Class | | 859 | |
Other | | 12 | |
Total expenses | | 2,053 | |
Net Investment Income | | 32,254 | |
| | | |
Net Realized Gain (Loss) from: | | | |
Investment in affiliated investment companies | | 25,698 | |
| | | |
Distributions from investment in affiliated investment companies | | 18,242 | |
| | 43,940 | |
Net Increase (Decrease) in Unrealized Appreciation (Depreciation) on: | | | |
Investment in affiliated investment companies | | (18,517 | ) |
| | | |
Net Realized and Unrealized Gain on Affiliated Investment Companies: | | 25,423 | |
Net Increase In Net Assets Resulting from Operations | | $ | 57,677 | |
The notes to the financial statements are an integral part of this report.
5
Asset Allocation - Conservative Portfolio
STATEMENT OF CHANGES IN NET ASSETS
For the years ended
(all amounts in thousands)
| | December 31, | | December 31, | |
| | 2007 | | 2006 | |
Increase (Decrease) in Net Assets From: | | | | | |
Operations: | | | | | |
Net investment income | | $ | 32,254 | | $ | 26,938 | |
Net realized gain from investment in affiliated investment companies | | 43,940 | | 33,804 | |
Change in unrealized appreciation (depreciation) on investment in affiliated investment companies | | (18,517 | ) | 8,951 | |
| | 57,677 | | 69,693 | |
Distributions to Shareholders: | | | | | |
From net investment income: | | | | | |
Initial Class | | (17,032 | ) | (17,971 | ) |
Service Class | | (9,906 | ) | (7,770 | ) |
| | (26,938 | ) | (25,741 | ) |
From net realized gains: | | | | | |
Initial Class | | (20,994 | ) | (25,335 | ) |
Service Class | | (12,917 | ) | (11,399 | ) |
| | (33,911 | ) | (36,734 | ) |
Capital Share Transactions: | | | | | |
Proceeds from shares sold: | | | | | |
Initial Class | | 234,966 | | 149,884 | |
Service Class | | 151,376 | | 140,651 | |
| | 386,342 | | 290,535 | |
Dividends and distributions reinvested: | | | | | |
Initial Class | | 38,026 | | 43,306 | |
Service Class | | 22,824 | | 19,169 | |
| | 60,850 | | 62,475 | |
Cost of shares redeemed: | | | | | |
Initial Class | | (244,742 | ) | (187,210 | ) |
Service Class | | (69,222 | ) | (44,105 | ) |
| | (313,964 | ) | (231,315 | ) |
| | 133,228 | | 121,695 | |
Net increase in net assets | | 130,056 | | 128,913 | |
| | | | | |
Net Assets: | | | | | |
Beginning of year | | 817,890 | | 688,977 | |
End of year | | $ | 947,946 | | $ | 817,890 | |
Undistributed (Accumulated) net investment income | | $ | 32,255 | | $ | 26,939 | |
Share Activity: | | | | | |
Shares issued: | | | | | |
Initial Class | | 20,148 | | 12,855 | |
Service Class | | 13,024 | | 12,185 | |
| | 33,172 | | 25,040 | |
Shares issued-reinvested from distributions: | | | | | |
Initial Class | | 3,435 | | 3,944 | |
Service Class | | 2,069 | | 1,751 | |
| | 5,504 | | 5,695 | |
Shares redeemed: | | | | | |
Initial Class | | (21,033 | ) | (16,232 | ) |
Service Class | | (5,995 | ) | (3,817 | ) |
| | (27,028 | ) | (20,049 | ) |
Net increase (decrease) in shares outstanding: | | | | | |
Initial Class | | 2,550 | | 567 | |
Service Class | | 9,098 | | 10,119 | |
| | 11,648 | | 10,686 | |
The notes to the financial statements are an integral part of this report.
6
Asset Allocation - Conservative Portfolio
FINANCIAL HIGHLIGHTS
For a share outstanding throughout each period(a)
| | Initial Class | |
| | Year Ended December 31, | |
| | 2007 | | 2006 | | 2005 | | 2004 | | 2003 | |
Net Asset Value | | | | | | | | | | | |
Beginning of period | | $ | 11.54 | | $ | 11.43 | | $ | 12.04 | | $ | 11.16 | | $ | 9.09 | |
Investment Operations | | | | | | | | | | | |
Net investment income (loss) | | 0.42 | | 0.41 | | 0.47 | | 0.24 | | 0.04 | |
Net realized and unrealized gain (loss) | | 0.29 | | 0.62 | | 0.12 | | 0.82 | | 2.04 | |
Total operations | | 0.71 | | 1.03 | | 0.59 | | 1.06 | | 2.08 | |
Distributions | | | | | | | | | | | |
From net investment income | | (0.34 | ) | (0.38 | ) | (0.32 | ) | (0.03 | ) | (0.01 | ) |
From net realized gains | | (0.42 | ) | (0.54 | ) | (0.88 | ) | (0.15 | ) | — | |
Total distributions | | (0.76 | ) | (0.92 | ) | (1.20 | ) | (0.18 | ) | (0.01 | ) |
Net Asset Value | | | | | | | | | | | |
End of period(b) | | $ | 11.49 | | $ | 11.54 | | $ | 11.43 | | $ | 12.04 | | $ | 11.16 | |
Total Return(c),(d) | | 6.38 | % | 9.45 | % | 5.18 | % | 9.71 | % | 22.91 | % |
Ratio and Supplemental Data | | | | | | | | | | | |
Net Assets End of Period (000’s) | | $ | 554,977 | | $ | 527,618 | | $ | 516,376 | | $ | 511,683 | | $ | 453,710 | |
Expenses to average net assets(e),(f) | | 0.13 | % | 0.13 | % | 0.14 | % | 0.14 | % | 0.13 | % |
Net investment income (loss), to average net assets(f),(g) | | 3.60 | % | 3.54 | % | 4.01 | % | 2.10 | % | 0.45 | % |
Portfolio turnover rate(d) | | 43 | % | 18 | % | 40 | % | 53 | % | 24 | % |
For a share outstanding throughout each period(a)
| | Service Class | |
| | Year Ended December 31, | | May 1 to Dec | |
| | 2007 | | 2006 | | 2005 | | 2004 | | 31, 2003 | |
Net Asset Value | | | | | | | | | | | |
Beginning of period | | $ | 11.50 | | $ | 11.41 | | $ | 12.03 | | $ | 11.15 | | $ | 9.53 | |
Investment Operations | | | | | | | | | | | |
Net investment income (loss) | | 0.40 | | 0.40 | | 0.47 | | 0.25 | | — | |
Net realized and unrealized gain (loss) | | 0.28 | | 0.60 | | 0.10 | | 0.79 | | 1.62 | |
Total operations | | 0.68 | | 1.00 | | 0.57 | | 1.04 | | 1.62 | |
Distributions | | | | | | | | | | | |
From net investment income | | (0.32 | ) | (0.37 | ) | (0.31 | ) | (0.01 | ) | — | |
From net realized gains | | (0.42 | ) | (0.54 | ) | (0.88 | ) | (0.15 | ) | — | |
Total distributions | | (0.74 | ) | (0.91 | ) | (1.19 | ) | (0.16 | ) | — | |
Net Asset Value | | | | | | | | | | | |
End of period(b) | | $ | 11.44 | | $ | 11.50 | | $ | 11.41 | | $ | 12.03 | | $ | 11.15 | |
Total Return(c),(d) | | 6.15 | % | 9.14 | % | 5.01 | % | 9.45 | % | 17.00 | % |
Ratio and Supplemental Data | | | | | | | | | | | |
Net Assets End of Period (000’s) | | $ | 392,969 | | $ | 290,272 | | $ | 172,601 | | $ | 84,490 | | $ | 15,030 | |
Expenses to average net assets(e),(f) | | 0.38 | % | 0.38 | % | 0.39 | % | 0.39 | % | 0.38 | % |
Net investment income (loss), to average net assets(f), (g) | | 3.48 | % | 3.44 | % | 4.03 | % | 2.19 | % | 0.03 | % |
Portfolio turnover rate(d) | | 43 | % | 18 | % | 40 | % | 53 | % | 24 | % |
(a) | Per share information is calculated based on average number of shares outstanding. |
(b) | Asset Allocation - Conservative Portfolio (the “Fund”) share classes commenced operations as follows: |
| Initial Class - May 1, 2002 |
| Service Class - May 1, 2003 |
(c) | Total Return reflects all portfolio expenses and includes reinvestment of dividends and capital gains; it does not reflect the charges and deductions under the policies or annuity contracts. |
(d) | Not annualized. |
(e) | Does not include expenses of the investment companies in which the Fund invests. |
(f) | Annualized. |
(g) | Recognition of net investment income by the Fund is affected by the timing of the declaration of dividends by the underlying investment companies in which the Fund invests. |
The notes to the financial statements are an integral part of this report.
7
Asset Allocation - Conservative Portfolio
NOTES TO FINANCIAL STATEMENTS
At December 31, 2007
(all amounts in thousands)
NOTE 1. ORGANIZATION AND SIGNIFICANT ACCOUNTING POLICIES
AEGON/Transamerica Series Trust (“ATST”) is an open-end management investment company registered under the Investment Company Act of 1940, as amended (the “1940 Act”). ATST serves as a funding vehicle for variable life insurance, variable annuity and group annuity products. Asset Allocation-Conservative Portfolio (the “Fund”) is part of ATST.
In the normal course of business, the Fund enters into contracts that contain a variety of representations that provide general indemnifications. The Fund’s maximum exposure under these arrangements is unknown, as this would involve future claims that may be made against the Fund and/or its affiliates that have not yet occurred. However, based on experience, the Fund expects the risk of loss to be remote.
This report should be read in conjunction with the current Fund prospectus, which contains more complete information about the Fund.
In preparing the Fund’s financial statements in accordance with accounting principles generally accepted in the United States of America (“GAAP”), estimates or assumptions (which could differ from actual results) may be used that affect reported amounts and disclosures. The following is a summary of significant accounting policies followed by the Fund.
Multiple class operations, income and expenses: The Fund currently offers two classes of shares, an Initial Class and a Service Class. Income, non-class specific expenses and realized and unrealized gains and losses, are allocated daily to each class, based upon the value of shares outstanding method as permitted under Rule 18f-3 of the 1940 Act. Each class bears its own specific expenses as well as a portion of general, common expenses.
Security valuations: Investment company securities are valued at the net asset value of the underlying portfolio.
Cash: The Fund may leave cash overnight in its cash account with the custodian, State Street Bank & Trust Company (“State Street”). On July 2, 2007, State Street acquired the parent company of Investors Bank & Trust Company. State Street has been contracted on behalf of the Fund to invest the excess cash into a savings account, which at December 31, 2007 was paying an interest rate of 2.60%.
Security transactions and investment income: Security transactions are recorded on the trade date. Security gains and losses are calculated on the first-in, first-out basis. Dividend income, if any, is recorded on the ex-dividend date. Dividends and net realized gain (loss) from investment securities for the Fund are from investments in shares of affiliated investment companies.
Dividend distributions: Dividends and capital gains distributions are typically declared and reinvested annually and are generally paid and reinvested on the business day following the ex-date.
NOTE 2. RELATED PARTY TRANSACTIONS
ATST serves as a funding vehicle for certain affiliated asset allocation portfolios and certain affiliated separate accounts of Western Reserve Life Assurance Co. of Ohio, Transamerica Life Insurance Company, Transamerica Financial Life Insurance Company, Inc., Monumental Life Insurance Company and Transamerica Occidental Life Insurance Company.
Transamerica Fund Advisors, Inc. (“TFAI”) is the Fund’s investment adviser. Transamerica Fund Services, Inc. (“TFS”) is the Fund’s administrator and transfer agent. Prior to May 1, 2007, AFSG Securities Corp. (“AFSG”), was the Fund’s distributor. Transamerica Capital Inc. (“TCI”) is now the Fund’s distributor. TFAI, TFS, AFSG and TCI are affiliates of AEGON NV, a Netherlands corporation.
TFAI has entered into an agreement with Morningstar Associates, LLC (“Morningstar”) to provide investment services to the Fund. TFAI compensates Morningstar as described in the Prospectus.
Transamerica Investment Management, LLC (“TIM”) is an affiliate of the Fund and is a sub-adviser to other funds within ATST.
Certain officers and trustees of the Fund are also officers and/or directors of TFAI, TFS and TCI.
Because the underlying funds have varied expense and fee levels and the Fund may own different proportions of underlying funds at different times, the amount of fees and expenses incurred indirectly by the Fund will vary.
Investment advisory fee: The Fund pays management fees to TFAI based on average daily net assets (“ANA”) at the following rate:
0.10% of ANA
TFAI has contractually agreed to waive its advisory fee and will reimburse the Fund to the extent that operating expenses, excluding 12b-1 fees, exceed the following stated annual limit:
0.25% Expense Limit
If total Fund expenses fall below the annual expense limitation agreement agreed to by the adviser within the succeeding three years, the Fund may be required to pay the adviser a portion or all of the waived advisory fees.
There were no amounts recaptured during the year ended December 31, 2007. There are no amounts available for recapture at December 31, 2007.
Distribution and service fees: ATST entered into a Distribution Agreement with AFSG dated January 1, 1997, as amended. On May 1, 2007, the Distribution Agreement was amended to replace AFSG with TCI as the Fund’s distributor.
8
NOTES TO FINANCIAL STATEMENTS (continued)
At December 31, 2007
(all amounts in thousands)
NOTE 2. – (continued)
The Fund has also adopted a distribution plan (“Distribution Plan”) pursuant to Rule 12b-1 under the 1940 Act.
Under the Distribution Plan for the Initial Class shares, TCI, on behalf of the Fund, is authorized to pay various service providers, as direct payment for expenses incurred in connection with distribution of the Fund’s shares, amounts equal to actual expenses associated with distributing the shares.
The Distribution Plan for the Service Class shares requires ATST to pay distribution fees to TCI as compensation for its activities, not as reimbursement for specific expenses. The fee on the Service Class is paid to the insurance companies for providing services and account maintenance for their policyholders who invest in the variable insurance products which invest in the Service Class shares.
The Fund is authorized under the Distribution Plan to pay fees on each class up to the following limits:
Initial Class | | 0.15 | % |
Service Class | | 0.25 | % |
TCI has determined that it will not seek payment by the Fund of the distribution expenses incurred with respect to the Initial Class shares before April 30, 2009. Prior to TCI seeking reimbursement of future expenses, policy and contract owners will be notified in advance. The Fund will pay fees relating to Service Class shares.
Administrative services: The Fund has entered into an agreement with TFS for financial and legal fund administration services. The Fund pays TFS an annual fee of 0.0125% of ANA. The Legal fees on the Statement of Operations are for fees paid to external legal counsel.
Deferred compensation plan: Each eligible independent Fund Trustee may elect participation in a non-qualified deferred compensation plan (“the Plan”). Under the Plan, such Trustees may defer payment of all or a portion of their total fees earned as a Fund Trustee. Each Trustee who is a participant in the Plan may elect that the earnings, losses or gains credited to his or her deferred fee amounts be determined based on a deemed investment in any series of Transamerica IDEX Mutual Funds. The right of a participant to receive a distribution from the Plan of the deferred fees is an unsecured claim against the general assets of all series of Transamerica IDEX Mutual Funds. The pro rata liability to the Fund of all deferred fees in the Plan amounted, as of December 31, 2007, to $46. Amounts deferred under the Plan are unfunded against the general assets of ATST.
Retirement plan: Under a retirement plan (the “Emeritus Plan”) available to the Independent Trustees, each Independent Trustee is deemed to have elected to serve as Trustee Emeritus of ATST upon his or her termination of service, other than removal for cause, is entitled to 50% of the trustee’s current retainer for a maximum period of five years determined by his or her years of service as a Trustee.
Such amounts shall be accrued by ATST on a pro rata basis allocable to each series of ATST fund based on the relative assets of the series. If retainers increase in the future, past accruals (and credits) will be adjusted upward so that 50% of the Trustee’s current retainer is accrued and credited at all times. Upon death, disability or termination of service, other than removal for cause, amounts deferred become payable to a Trustee Emeritus (or his/her beneficiary). Upon the commencement of service as Trustee Emeritus, compensation will be paid on a quarterly basis during the time period that the Trustee Emeritus is allowed to serve as such.
Amounts accrued under the Emeritus Plan are unsecured claims against the general assets of ATST. For the year ended December 31, 2007, the amount related to the Emeritus Plan was $31. As of year December 31, 2007, the Fund has not made any payments related to the Emeritus Plan.
The Emeritus Plan was terminated effective October 30, 2007. Upon the termination, the Fund shall continue to pay any remaining benefits in accordance with the Plan, but no further compensation shall accrue under the Plan.
NOTE 3. INVESTMENT TRANSACTIONS
The cost of securities purchased and proceeds from securities sold (excluding short-term securities) for the year ended December 31, 2007 were as follows:
Purchases of securities: | | | |
Long-term | | $ | 514,716 | |
U.S. Government | | — | |
Proceeds from maturities and sales of securities: | | | |
Long-term | | 391,796 | |
U.S. Government | | — | |
| | | | |
NOTE 4. FEDERAL INCOME TAX MATTERS
The Fund has not made any provision for federal income or excise taxes due to its policy to distribute all of its taxable income and capital gains to its shareholders and otherwise qualify as a regulated investment company under Subchapter M of the Internal Revenue Code. Income and capital gain distributions are determined in accordance with income tax regulations, which may differ from GAAP. These differences are primarily due to differing treatment for items including, but not limited to, wash sales.
The tax character of distributions paid may differ from the character of distributions shown in the Statements of Changes in Net Assets due to short-term gains being treated as ordinary income for tax purposes. The tax character of distributions paid during 2006 and 2007 was as follows:
9
NOTES TO FINANCIAL STATEMENTS (continued)
At December 31, 2007
(all amounts in thousands)
NOTE 4. – (continued)
2006 Distributions paid from: | | | |
Ordinary Income | | $ | 25,942 | |
Long-term Capital Gain | | 36,533 | |
| | | |
2007 Distributions paid from: | | | |
Ordinary Income | | 28,363 | |
Long-term Capital Gain | | 32,486 | |
| | | | |
The tax basis components of distributable earnings as of December 31, 2007 are as follows:
Undistributed Ordinary Income | | $ | 33,378 | |
Undistributed Long-term Capital Gain | | $ | 44,724 | |
Capital Loss Carryforward | | $ | — | |
Net Unrealized Appreciation (Depreciation) | | $ | 21,892 | |
NOTE 5. REGULATORY PROCEEDINGS
There continues to be significant federal and state regulatory activity relating to financial services companies, particularly mutual fund companies and their investment advisers. As part of an ongoing investigation regarding potential market timing, recordkeeping and trading compliance issues and matters affecting the Funds’ investment adviser, TFAI, and certain affiliates and former employees of TFAI, the SEC staff has indicated that it is likely to take some action against TFAI and certain of its affiliates at the conclusion of the investigation. The potential timing and the scope of any such action is difficult to predict. Although the impact of any action brought against TFAI and/or its affiliates is difficult to assess at the present time, the Funds currently believe that the likelihood that any such action will have a material adverse impact is remote. It is important to note that the Funds are not aware of any allegation of wrong doing against them and their Board at the time this annual report is printed. Although it is not anticipated that these developments will have an adverse impact on the Funds, there can be no assurance at this time. TFAI and its affiliates are actively working with the SEC in regard to this matter; however, the exact resolution cannot be determined at this time. TFAI will take such actions that it deems necessary or appropriate to continue providing management services to the Funds and to bring all matters to an appropriate conclusion.
TFAI and/or its affiliates, and not the Funds, will bear the costs regarding these regulatory matters.
NOTE 6. RECENTLY ISSUED ACCOUNTING PRONOUNCEMENTS
In July 2006, the Financial Accounting Standards Board (“FASB”) released FASB Interpretation No. 48 “Accounting for Uncertainty in Income Taxes” (“FIN 48”), an interpretation of FASB Statement No. 109. FIN 48 provides guidance for how uncertain tax positions should be recognized, measured, presented and disclosed in the financial statements. FIN 48 requires the accounting and disclosure of tax positions taken or expected to be taken in the course of preparing the Fund’s tax returns to determine whether the tax positions are “more-likely- than-not” of being sustained by the applicable tax authority. Tax positions not deemed to meet the more-likely-than-not threshold would be recorded as a tax benefit or expense in the current year.
Adoption of FIN 48 is effective during the first required financial reporting period for fiscal years beginning after December 15, 2006. Management adopted FIN 48 on June 29, 2007.
Implementation of FIN 48 requires Management of the Fund to analyze all open tax years, as defined by the Statute of Limitations, for all major jurisdictions, which includes federal and certain states. Open tax years are those that are open for exam by taxing authorities (i.e., the last 4 tax year ends and the interim tax period since then). The Fund has no examinations in progress and none are expected at this time.
Management of the Fund has reviewed all open tax years and major jurisdictions and concluded the adoption of FIN 48 resulted in no impact to the Fund’s net assets or results of operations. There is no tax liability resulting from unrecognized tax benefits relating to uncertain income tax positions taken or expected to be taken in future tax returns. The Fund is also not aware of any tax positions for which it is reasonably possible that the total amounts of unrecognized tax benefits will significantly change in the next 12 months.
In September 2006, FASB issued its new Standard No. 157, “Fair Value Measurements” (“FAS 157”). FAS 157 is designed to unify guidance for the measurement of fair value of all types of assets, including financial instruments, and certain liabilities, throughout a number of accounting standards. FAS 157 also establishes a hierarchy for measuring fair value in generally accepted accounting principles and expands financial statement disclosures about fair value measurements that are relevant to mutual funds. FAS 157 is effective for financial statements issued for fiscal years beginning after November 15, 2007, and earlier application is permitted.
As of December 31, 2007, Management does not expect the adoption of FAS 157 to impact the amounts reported in the financial statements, however, additional disclosures will be required about the inputs used to develop the measurements of fair value and the effect of certain of the measurements reported in the statement of operations for a fiscal period.
NOTE 7. SUBSEQUENT EVENT
Effective January 1, 2008, TFAI changed its name to Transamerica Asset Management, Inc.
Effective May 1, 2008, AEGON/Transamerica Series Trust will change its name to Transamerica Series Trust. At that time, the Fund will also change its name to Transamerica Asset Allocation - Conservative VP.
10
Report of Independent Registered Certified Public Accounting Firm
To the Board of Trustees and Shareholders of
Asset Allocation - Conservative Portfolio:
In our opinion, the accompanying statement of assets and liabilities, including the schedule of investments, and the related statements of operations and of changes in net assets and the financial highlights present fairly, in all material respects, the financial position of Asset Allocation - Conservative Portfolio (the “Fund”) (one of the portfolios constituting AEGON/Transamerica Series Trust) at December 31, 2007, the results of its operations for the year then ended, the changes in its net assets for each of the two years in the period then ended and the financial highlights for each of the periods presented, in conformity with accounting principles generally accepted in the United States of America. These financial statements and financial highlights (hereafter referred to as “financial statements”) are the responsibility of the Fund’s management; our responsibility is to express an opinion on these financial statements based on our audits. We conducted our audits of these financial statements in accordance with the standards of the Public Company Accounting Oversight Board (United States). Those standards require that we plan and perform the audit to obtain reasonable assurance about whether the financial statements are free of material misstatement. An audit includes examining, on a test basis, evidence supporting the amounts and disclosures in the financial statements, assessing the accounting principles used and significant estimates made by management, and evaluating the overall financial statement presentation. We believe that our audits, which included confirmation of securities at December 31, 2007 by correspondence with the transfer agent, provide a reasonable basis for our opinion.

Tampa, Florida
February 29, 2008
11
Asset Allocation - Conservative Portfolio
SUPPLEMENTAL TAX INFORMATION (unaudited)
(all amounts in thousands)
For tax purposes, the Fund has made a Long-Term Capital Gain Designation of $32,486 for the year ended December 31, 2007.
RESULTS OF SHAREHOLDER PROXY (unaudited)
At a special meeting of shareholders held on October 30, 2007, the results of the Proposals were as follows:
Proposal 1: To elect a new Board:
Proposed | | | | | | Abstentions/Broker Non- | |
Trustee | | For | | Against | | Votes | |
John K. Carter | | 2,274,998,840.817 | | 57,804,698.755 | | 35,433.883 | |
| | | | | | | |
Leo J. Hill | | 2,277,212,702.754 | | 55,590,836.819 | | 35,433.883 | |
| | | | | | | |
Neal M. Jewell | | 2,266,793,295.663 | | 66,010,243.909 | | 35,433.883 | |
| | | | | | | |
Russell A. Kimball, Jr. | | 2,274,825,235.835 | | 57,978,303.737 | | 35,433.883 | |
| | | | | | | |
Eugene M. Mannella | | 2,274,623,165.033 | | 58,180,374.539 | | 35,433.883 | |
| | | | | | | |
Norm R. Nielsen | | 2,275,050,055.885 | | 57,753,483.687 | | 35,433.883 | |
| | | | | | | |
Joyce Galpern Norden | | 2,270,278,122.250 | | 62,525,417.323 | | 35,433.883 | |
| | | | | | | |
Patricia L. Sawyer | | 2,275,737,737.456 | | 57,065,802.116 | | 35,433.883 | |
| | | | | | | |
John W. Waechter | | 2,276,615,120.140 | | 56,188,419.433 | | 35,433.883 | |
Proposal 2: To approve an amendment to the Agreement and Declaration of Trust:
| | | | Abstentions/Broker Non- | |
For | | Against | | Votes | |
2,182,022,669.110 | | 77,590,048.544 | | 73,226,255.801 | |
12
Asset Allocation - Conservative Portfolio
INVESTMENT ADVISORY AND SUB-ADVISORY AGREEMENTS-REVIEW AND RENEWAL (unaudited)
At a meeting of the Board of Trustees of AEGON/Transamerica Series Trust (“ATST”) held on December 4th, 2007, the Board reviewed and considered the renewal of the investment advisory agreement (the “Investment Advisory Agreement”) between Asset Allocation - Conservative Portfolio (the “Fund”) and Transamerica Fund Advisors, Inc. (“TFAI”), as well as the renewal of the investment sub-advisory agreement (the “Sub-Advisory Agreement”) of the Fund between TFAI and Morningstar Associates, LLC (the “Sub-Adviser”), to determine whether the agreements should be renewed for a six-month period. It was noted that this review was interim in nature to align all the Funds on the same calendar, and that the Funds’ advisory arrangements would be reviewed again in the first half of 2008.
Following their review and consideration, the Trustees determined that the renewal of the Investment Advisory Agreement and the Sub-Advisory Agreement would enable shareholders of the Fund to obtain high quality services at a cost that is appropriate, fair, and in the best interests of its shareholders. The Board, including the independent members of the Board, unanimously approved the renewal of the Investment Advisory Agreement and Sub-Advisory Agreement. In reaching their decision, the Trustees requested and obtained from TFAI and the Sub-Adviser such information as they deemed reasonably necessary to evaluate the agreements, including information about fees and performance of comparable funds managed by the Sub-Adviser. The Trustees also carefully considered information they had previously received from TFAI and the Sub-Adviser throughout the year as part of their regular oversight of the Fund, as well as comparative fee, expense, and performance information prepared by Lipper Inc. (“Lipper”), an independent provider of mutual fund performance, fee and expense information and profitability data prepared by management. In considering the proposed continuation of the Investment Advisory and Sub-Advisory Agreements, the Trustees evaluated a number of considerations that they believed, in light of the legal advice furnished to them by independent legal counsel and their own business judgment, to be relevant. They based their decisions on a variety of factors, including the following considerations, among others, although they did not identify any consideration or particular information that was controlling of their decisions:
The nature, extent and quality of the advisory services to be provided. The Board considered the nature and quality of the services provided by TFAI and the Sub-Adviser to the Fund in the past, as well as the services anticipated to be provided in the future. The Board concluded that TFAI and the Sub-Adviser are capable of providing high quality services to the Fund, as indicated by the nature and quality of services provided in the past by TFAI and the Sub-Adviser for this series and the experience, capability and integrity of TFAI’s senior management, the financial resources of TFAI and the Sub-Adviser, TFAI’s management oversight process and the professional qualifications of the portfolio management team of the Sub-Adviser. The Trustees determined that TFAI and the Sub-Adviser can provide investment and related services that are appropriate in scope and extent in light of the Fund’s operations, the competitive landscape of the investment company business and investor needs.
The investment performance of the Fund. The Board examined the short and longer-term performance of the Fund, including relative performance against a peer universe of comparable mutual funds as prepared by Lipper for various trailing periods ended June 30, 2007. The Trustees noted that the Fund’s performance was just below the median for its peer universe for the past 1-year period, strong compared to its peer universe for the past 3-year period, and above the median for the past 5-year period. On the basis of the Board’s assessment of the nature, extent and quality of advisory services to be provided or procured by TFAI and the Sub-Adviser, the Board concluded that TFAI and the Sub-Adviser are capable of providing a level of investment performance that is appropriate in light of the Fund’s proposed investment objectives, policies and strategies and competitive with other similarly situated investment companies.
The cost of advisory services provided and the level of profitability. The Board reviewed profitability information of TFAI’s cost of procuring fund management services, as well as the costs of provision of administration, fund accounting and other services, to the Fund and to ATST as a whole by TFAI and its affiliates. The Board reviewed the management and sub-advisory fees for the Fund. The Trustees noted that the Fund’s contractual management fees were below the medians for its peer group and peer universe and that the total expenses of the Fund were in line with the medians for its peer group and peer universe. Based on their review, the Trustees determined that the management fees of the Fund generally are appropriate in light of the services expected to be provided or procured, the management fees and the anticipated profitability of the relationship between the Fund, TFAI and its affiliates, and the Sub-Adviser. In making these observations and determinations, the Board reviewed, among other things, comparative information provided by Lipper.
Whether fee levels reflect economies of scale and the extent to which economies of scale would be realized as the Fund grows. In evaluating the extent to which the management fees payable under the Investment Advisory and Sub-Advisory Agreements reflect economies of scale or will permit economies of scale to be realized in the future, the Board considered the specific reasons for the absence of breakpoints, and concluded that the absence of breakpoints was acceptable under the circumstances. The Trustees also concluded that they will have the opportunity to periodically reexamine whether the Fund has achieved economies of scale, and the appropriateness of management fees payable to TFAI and fees paid to the Sub-Adviser, in the future.
Benefits (such as soft dollars) to TFAI, its affiliates, or the Sub-Adviser from their relationship with the Fund. The Board concluded that other benefits anticipated to be derived by TFAI, its affiliates, and the Sub-Adviser from their relationships with the Fund are expected to be reasonable and fair, and consistent with industry practice and the best interests of the Fund and its shareholders. The Trustees noted that TFAI would not realize soft dollar benefits from its relationship with the Fund.
Other considerations. The Board determined that TFAI has made a substantial commitment to the recruitment and retention of high quality personnel, and maintains the financial, compliance and operational resources reasonably necessary to manage the Fund in a professional manner that is consistent with the best interests of the Fund and its shareholders. In this regard, the Trustees favorably considered the procedures and policies in place by TFAI to enforce compliance with applicable laws and regulations and oversee the portfolio management activities of the Sub-Adviser. The Trustees also determined that TFAI has made a significant entrepreneurial commitment to the management and success of the Fund, reflected by TFAI’s expense limitation and fee waiver arrangements with the Fund which may result in TFAI waiving a substantial amount of management fees for the benefit of shareholders.
13
Asset Allocation - Growth Portfolio
MARKET ENVIRONMENT
The stock and bond markets rose for the twelve-month period through December 31, 2007, but suffered plenty of volatility along the way. The Standard and Poor’s 500 Composite Stock Index returned 5.49%, while the broad Dow Jones Wilshire 5000 Total Market Index (“DJ Wilshire 5000”) gained 5.74%. These modest gains were punctuated by setbacks, however. In the summer, gathering concern about the U.S. mortgage and housing markets reached alarming levels. The mortgage industry’s loose lending standards of recent years came back to haunt lenders, investors, and borrowers alike. Lenders responded by tightening credit standards, many borrowers could no longer qualify for loans, and home sales and refinancings slowed. These problems worsened in the year’s last two months as financial institutions announced write-downs of mortgage-related holdings. After tumbling in the summer, stocks of financial companies again pulled the broad indices down in November and December.
By midyear investors were favoring the relative safety of larger stocks. As they migrated toward large caps while also steering away from financials and other value stocks, they boosted large-cap growth stocks in sectors such as technology. Large growth companies were also rewarded for being big exporters, an advantage with the weak U.S. dollar. For the year, large caps outpaced small caps, and growth stocks significantly outperformed value stocks across all market-cap ranges.
Foreign equity returns surpassed the U.S. indices. The Morgan Stanley Capital International EAFE Index (“MSCI EAFE”) rose 11.63% (gross) for the period, mainly because major foreign currencies strengthened against the dollar (the index gained only 3.54% (net) in local-currency terms). Emerging markets were especially strong as high commodity prices bolstered the developing nations that export them. The Morgan Stanley Capital International Emerging Markets Index soared 39.78% (gross) for the year.
Bond returns improved throughout the year as nervous investors sought safety from the shaky stock market. The Federal Reserve Board’s three rate cuts from September through December also helped bond prices. The Lehman Brothers Aggregate Bond Index finished the year with a 6.97% return, with U.S. government bonds leading the gains. High-yield bonds weakened as credit conditions worsened, but posted modestly positive returns thanks to strength earlier in the year.
PERFORMANCE
For the year ended December 31, 2007, Asset Allocation – Growth Portfolio, Initial Class returned 7.76%. By comparison its benchmark, the DJ Wilshire 5000, returned 5.74%.
STRATEGY REVIEW
This fund-of-funds portfolio is structured to provide broadly diversified coverage of domestic and international equity markets, across a range of market capitalizations and investment styles. It also includes emerging markets, global real estate, and absolute-return strategies.
The best-performing underlying fund was Transamerica Science & Technology, but it is a small position. The much larger holding TA IDEX Oppenheimer Developing Markets performed almost as well, as many emerging markets soared. The portfolio’s growth funds within the mid- and large-cap tiers (international included) clearly benefited from the strength of growth stocks. Most of those funds notched double-digit gains and also ranked well relative to their categories. Among the value funds, two of the five large-cap funds were weighed down by the financials sector, but in the small-cap area Transamerica Small/Mid Cap Value dodged the Russell 2000 Value Index’s 9.78% loss, posting a significant gain on the back of shipping and energy stocks. The other small-cap focused value fund, TA IDEX Oppenheimer Small- & Mid-Cap Value, also impressed with a positive return. The international position’s emerging-markets exposure (targeted at 20% of the international stake, mostly via the aforementioned Oppenheimer fund) was certainly a boost to returns. But TA IDEX Marsico International Growth also posted strong results, and TA IDEX Evergreen International Small Cap beat the MSCI EAFE even though the year favored large caps. The portfolio’s worst performer was Clarion Global Real Estate Securities; as real-estate stocks gave back some of their gains of recent years.
In early 2007 we conducted a broad rebalancing, mainly to correct a small-cap overweight and better balance the portfolio’s value and growth exposure. We believe the portfolio’s good 2007 return, demonstrate the effectiveness of maintaining disciplined and balanced market coverage while emphasizing strong managers in each style.
During the year three new funds were added to the menu available for use in this portfolio: TA IDEX BlackRock Natural Resources, and the two absolute-return strategies TA IDEX Mellon Market Neutral Strategy and TA IDEX UBS Dynamic Alpha. The portfolio currently owns all three of these funds.
Michael Stout, CFA
Jon Hale, Ph.D., CFA
Jeff McConnell, CFA
Maciej Kowara, Ph.D., CFA
Co-Portfolio Managers
Morningstar Associates, LLC
AEGON/Transamerica Series Trust | | Annual Report 2007 |
1
Asset Allocation - Growth Portfolio
(unaudited)
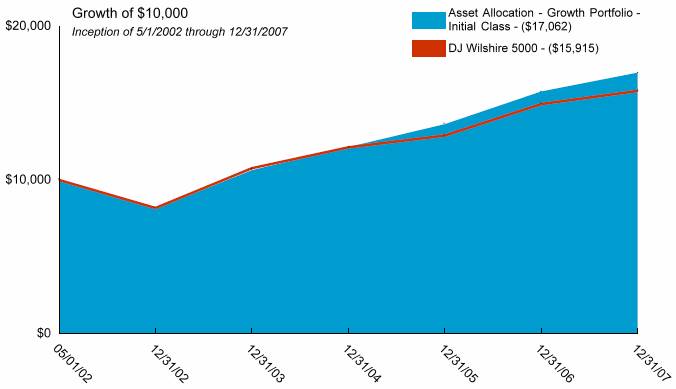
Average Annual Total Return for Periods Ended 12/31/2007
| | | | | | From | | Inception | |
| | 1 Year | | 5 Years | | Inception | | Date | |
| | | | | | | | | |
Initial Class | | 7.76 | % | 15.87 | % | 9.88 | % | 5/1/02 | |
DJ Wilshire 5000(1) | | 5.74 | % | 14.07 | % | 8.54 | % | 5/1/02 | |
| | | | | | | | | |
Service Class | | 7.54 | % | — | % | 15.91 | % | 5/1/03 | |
NOTES
(1) The Dow Jones Wilshire 5000 Total Market (DJ Wilshire 5000) Index is an unmanaged index used as a general measure of market performance. Calculations assume dividends and capital gains are reinvested and do not include any managerial expenses. From inception, calculation is based on life of Initial Class shares.
The performance data presented represents past performance; future results may vary. The portfolio’s investment return and net asset value will fluctuate. Past performance does not guarantee future results. Investor’s units when redeemed may be worth more or less than their original cost.
Current performance may be lower or higher than performance quoted. Please visit your insurance company’s website for contract or policy level standardized total returns current to the most recent month end. Portfolio performance is net of investment fees and fund expenses, but not product charges, which, if included, would significantly lower the performance quoted.
This material must be preceded or accompanied by a current prospectus, which includes specific contents regarding the investment objectives, explanation of share classes and policies of this portfolio.
2
Asset Allocation - Growth Portfolio
UNDERSTANDING YOUR FUND’S EXPENSES
(unaudited)
SHAREHOLDER EXPENSES
Fund shareholders may incur ongoing costs, including management and advisory fees, distribution and service fees, and other fund expenses.
The following Example is intended to help you understand your ongoing costs (in dollars and cents) of investing in the Fund and to compare these costs with the ongoing costs of investing in other funds.
The Example is based on an investment of $1,000 invested at July 1, 2007 and held for the entire period until December 31, 2007.
ACTUAL EXPENSES
The first line in the table below provides information about actual account values and actual expenses. You may use the information in this line, together with the amount you invested, to estimate the expenses that you paid over the period. Simply divide your account value by $1,000 (for example, an $8,600 account value divided by $1,000 = 8.6), then multiply the result by the number in the first line of your Fund under the heading entitled “Expenses Paid During Period” to estimate the expenses you paid on your account during this period.
HYPOTHETICAL EXAMPLE FOR COMPARISON PURPOSES
The second line in the table below provides information about hypothetical account values and hypothetical expenses based on the Fund’s actual expense ratio and an assumed rate of return of 5% per year before expenses, which is not the Fund’s actual return. The hypothetical account values and expenses may not be used to estimate the actual ending account balance or expenses you paid for the period. You may use this information to compare the ongoing costs of investing in your Fund and other funds. To do so, compare this 5% hypothetical example with the 5% hypothetical examples that appear in the shareholder reports of the other funds.
Please note that the expenses shown in the table are meant to highlight your ongoing costs only and do not reflect any transactional costs, such as sales charges, redemption fees, brokerage commissions paid on purchases and sales of fund shares. Therefore, the second line under the Fund in the table is useful in comparing ongoing costs only, and will not help you determine the relative total costs of owning different funds. If any of these transaction costs were included, your costs would be higher. The expenses shown in the table do not reflect any fees that may be charged to you by brokers, financial intermediaries or other financial institutions.
The expenses shown in the table do not reflect any expenses from the Funds investment in other affiliated investment companies. The average weighted annualized expense ratio of the underlying investment companies at December 31, 2007, was 0.91%.
| | Beginning | | Ending | | Annualized | | Expenses | |
| | Account | | Account | | Expense | | Paid During | |
| | Value | | Value | | Ratio | | Period (a) | |
| | | | | | | | | |
Initial Class | | | | | | | | | |
Actual | | $ | 1,000.00 | | $ | 998.44 | | 0.13 | % | $ | 0.65 | |
Hypothetical (b) | | 1,000.00 | | 1,024.55 | | 0.13 | | 0.66 | |
| | | | | | | | | |
Service Class | | | | | | | | | |
Actual | | 1,000.00 | | 997.27 | | 0.38 | | 1.91 | |
Hypothetical (b) | | 1,000.00 | | 1,023.29 | | 0.38 | | 1.94 | |
| | | | | | | | | | | | |
(a) | | Expenses are calculated using the Fund’s annualized expense ratio (as disclosed in the table), multiplied by the average account value for the period, multiplied by the number of days in the period (184 days), and divided by the number of days in the year (365 days). |
| | |
(b) | | 5% return per year before expenses. |
GRAPHICAL PRESENTATION OF SCHEDULE OF INVESTMENTS
By Asset Type
At December 31, 2007
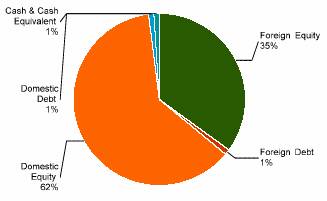
This chart shows the percentage breakdown by asset type of the aggregate portfolio holdings of the underlying affiliated investment companies in which the Fund invests. The security lending collateral in the underlying funds is excluded from this calculation.
3
Asset Allocation - Growth Portfolio
SCHEDULE OF INVESTMENTS
At December 31, 2007
(all amounts except share amounts in thousands)
| | Shares | | Value | |
INVESTMENT COMPANIES (100.0%) | | | | | |
Capital Preservation (0.2%) | | | | | |
Transamerica Money Market (1) | | 4,291,825 | | $ | 4,292 | |
Global/International Stock (17.1%) | | | | | |
TA IDEX AllianceBernstein International Value (2) | | 2,109,086 | | 26,743 | |
TA IDEX Evergreen International Small Cap (2) | | 4,602,138 | | 70,367 | |
TA IDEX Marsico International Growth (2) | | 4,439,784 | | 60,470 | |
TA IDEX Neuberger Berman International (2) | | 5,592,943 | | 62,753 | |
TA IDEX Oppenheimer Developing Markets (2) | | 4,445,993 | | 65,845 | |
Tactical and Specialty (15.2%) | | | | | |
Clarion Global Real Estate Securities (1) | | 3,584,520 | | 70,400 | |
TA IDEX BlackRock Global Allocation (2) | | 5,262,620 | | 64,099 | |
TA IDEX BlackRock Natural Resources (2) | | 2,181,656 | | 30,238 | |
TA IDEX Evergreen Health Care (2) | | 2,667,550 | | 33,851 | |
TA IDEX Mellon Market Neutral Strategy (2) | | 1,999,990 | | 18,380 | |
TA IDEX UBS Dynamic Alpha (2) | | 3,787,126 | | 36,583 | |
U.S. Stock (67.5%) | | | | | |
American Century Large Company Value (1) | | 7,772,459 | | $ | 86,352 | |
BlackRock Large Cap Value (1) | | 8,168,948 | | 156,517 | |
Capital Guardian Value (1) | | 6,825,585 | | 125,181 | |
Jennison Growth (1) | | 5,349,171 | | 44,131 | |
JPMorgan Mid Cap Value (1) | | 2,824,414 | | 44,598 | |
Marsico Growth (1) | | 8,330,026 | | 107,957 | |
Munder Net50 (1) | | 3,434,441 | | 40,458 | |
T. Rowe Price Equity Income (1) | | 5,205 | | 99 | |
T. Rowe Price Growth Stock (1) | | 1,655,679 | | 42,452 | |
TA IDEX Bjurman, Barry Micro Emerging Growth (2) | | 798,917 | | 9,044 | |
TA IDEX Oppenheimer Small- & Mid-Cap Value (2) | | 1,101,159 | | 12,663 | |
TA IDEX Third Avenue Value (2) | | 5,928,509 | | 154,438 | |
TA IDEX UBS Large Cap Value (2) | | 5,445,984 | | 68,129 | |
TA IDEX Van Kampen Mid-Cap Growth (2) | | 64,155 | | 794 | |
TA IDEX Van Kampen Small Company Growth (2) | | 3,083,368 | | 35,798 | |
Transamerica Equity (1) | | 3,998,481 | | 115,556 | |
Transamerica Growth Opportunities (1) | | 1,998,910 | | 36,340 | |
Transamerica Science & Technology (1) ~ | | 523,630 | | 2,801 | |
Transamerica Small/Mid Cap Value (1) | | 2,031,901 | | 44,905 | |
| | | | | |
Total Investment Companies (cost $1,526,012) # | | | | $ | 1,672,234 | |
NOTES TO SCHEDULE OF INVESTMENTS:
(1) The Fund invests its assets in the Initial Class shares of the affiliated AEGON/Transamerica Series Trust.
(2) The Fund invests its assets in the Class I shares of the affiliated Transamerica IDEX Mutual Funds.
# Aggregate cost for federal income tax purposes is $1,526,184. Aggregate gross unrealized appreciation for all securities in which there is an excess of value over tax cost and aggregate gross unrealized depreciation for all securities in which there is an excess of tax cost over value were $165,481 and $19,431, respectively. Net unrealized appreciation for tax purposes is $146,050.
~ Non-income producing.
The notes to the financial statements are an integral part of this report.
4
Asset Allocation - Growth Portfolio
STATEMENT OF ASSETS AND LIABILITIES
At December 31, 2007
(all amounts except per share amounts in thousands)
Assets: | | | |
Investment in affiliated investment companies at value (cost: $ 1,526,012) | | $ | 1,672,234 | |
Receivables: | | | |
Investment securities sold | | 806 | |
Shares sold | | 162 | |
| | 1,673,202 | |
Liabilities: | | | |
Accounts payable and accrued liabilities: | | | |
Shares redeemed | | 933 | |
Management and advisory fees | | 143 | |
Distribution and service fees | | 87 | |
Administration fees | | 18 | |
Trustees fees | | 64 | |
Other | | 99 | |
| | 1,344 | |
Net Assets | | $ | 1,671,858 | |
Net Assets Consist of: | | | |
Capital Stock ($.01 par value) | | $ | 1,216 | |
Additional paid-in capital | | 1,308,386 | |
Undistributed (accumulated) net investment income | | 32,693 | |
Undistributed (accumulated) net realized gain from investment in affiliated investment companies | | 183,341 | |
Net unrealized appreciation on investment in affiliated investment companies | | 146,222 | |
Net Assets | | $ | 1,671,858 | |
Net Assets by Class: | | | |
Initial Class | | $ | 1,260,779 | |
Service Class | | 411,079 | |
Shares Outstanding: | | | |
Initial Class | | 91,573 | |
Service Class | | 30,076 | |
Net Asset Value and Offering Price Per Share: | | | |
Initial Class | | $ | 13.77 | |
Service Class | | 13.67 | |
STATEMENT OF OPERATIONS
For the year ended December 31, 2007
(all amounts in thousands)
Investment Income: | | | |
Dividends from affiliated investment companies | | $ | 35,819 | |
| | 35,819 | |
Expenses: | | | |
Management and advisory fees | | 1,658 | |
Printing and shareholder reports | | 81 | |
Custody fees | | 75 | |
Administration fees | | 207 | |
Legal fees | | 34 | |
Audit fees | | 21 | |
Trustees fees | | 56 | |
Registration fees | | 10 | |
Distribution and service fees: | | | |
Service Class | | 962 | |
Other | | 23 | |
Total expenses | | 3,127 | |
| | | |
Net Investment Income | | 32,692 | |
| | | |
Net Realized Gain (Loss) from: | | | |
Investment in affiliated investment companies | | 107,732 | |
Distributions from investment in affiliated investment companies | | 75,656 | |
| | 183,388 | |
| | | |
Net Increase (Decrease) in Unrealized Appreciation (Depreciation) on: | | | |
Investment in affiliated investment companies | | (98,013 | ) |
Net Realized and Unrealized Gain on Affiliated Investment Companies: | | 85,375 | |
Net Increase In Net Assets Resulting from Operations | | $ | 118,067 | |
The notes to the financial statements are an integral part of this report.
5
Asset Allocation - Growth Portfolio
STATEMENT OF CHANGES IN NET ASSETS
For the years ended
(all amounts in thousands)
| | December 31, | | December 31, | |
| | 2007 | | 2006 | |
Increase (Decrease) in Net Assets From: | | | | | |
Operations: | | | | | |
Net investment income | | $ | 32,692 | | $ | 36,536 | |
Net realized gain from investment in affiliated investment companies | | 183,388 | | 63,660 | |
Change in unrealized appreciation (depreciation) on investment in affiliated investment companies | | (98,013 | ) | 94,379 | |
| | 118,067 | | 194,575 | |
Distributions to Shareholders: | | | | | |
From net investment income: | | | | | |
Initial Class | | (28,439 | ) | (9,963 | ) |
Service Class | | (8,096 | ) | (2,233 | ) |
| | (36,535 | ) | (12,196 | ) |
From net realized gains: | | | | | |
Initial Class | | (48,639 | ) | (75,856 | ) |
Service Class | | (15,016 | ) | (20,093 | ) |
| | (63,655 | ) | (95,949 | ) |
Capital Share Transactions: | | | | | |
Proceeds from shares sold: | | | | | |
Initial Class | | 181,969 | | 222,293 | |
Service Class | | 98,688 | | 113,595 | |
| | 280,657 | | 335,888 | |
Dividends and distributions reinvested: | | | | | |
Initial Class | | 77,079 | | 85,819 | |
Service Class | | 23,112 | | 22,326 | |
| | 100,191 | | 108,145 | |
Cost of shares redeemed: | | | | | |
Initial Class | | (212,569 | ) | (146,188 | ) |
Service Class | | (51,663 | ) | (26,802 | ) |
| | (264,232 | ) | (172,990 | ) |
| | 116,616 | | 271,043 | |
Net increase in net assets | | 134,493 | | 357,473 | |
| | | | | |
Net Assets: | | | | | |
Beginning of year | | 1,537,365 | | 1,179,892 | |
End of year | | $ | 1,671,858 | | $ | 1,537,365 | |
Undistributed (Accumulated) net investment income | | $ | 32,693 | | $ | 36,536 | |
Share Activity: | | | | | |
Shares issued: | | | | | |
Initial Class | | 12,885 | | 16,726 | |
Service Class | | 7,029 | | 8,562 | |
| | 19,914 | | 25,288 | |
Shares issued-reinvested from distributions: | | | | | |
Initial Class | | 5,782 | | 6,989 | |
Service Class | | 1,745 | | 1,829 | |
| | 7,527 | | 8,818 | |
Shares redeemed: | | | | | |
Initial Class | | (15,044 | ) | (11,037 | ) |
Service Class | | (3,711 | ) | (2,058 | ) |
| | (18,755 | ) | (13,095 | ) |
Net increase (decrease) in shares outstanding: | | | | | |
Initial Class | | 3,623 | | 12,678 | |
Service Class | | 5,063 | | 8,333 | |
| | 8,686 | | 21,011 | |
The notes to the financial statements are an integral part of this report.
6
Asset Allocation - Growth Portfolio
FINANCIAL HIGHLIGHTS
For a share outstanding throughout each period(a)
| | Initial Class | |
| | Year Ended December 31, | |
| | 2007 | | 2006 | | 2005 | | 2004 | | 2003 | |
Net Asset Value | | | | | | | | | | | |
Beginning of period | | $ | 13.63 | | $ | 12.84 | | $ | 12.06 | | $ | 10.67 | | $ | 8.17 | |
Investment Operations | | | | | | | | | | | |
Net investment income (loss) | | 0.28 | | 0.37 | | 0.16 | | 0.05 | | 0.02 | |
Net realized and unrealized gain (loss) | | 0.75 | | 1.52 | | 1.27 | | 1.45 | | 2.49 | |
Total operations | | 1.03 | | 1.89 | | 1.43 | | 1.50 | | 2.51 | |
Distributions | | | | | | | | | | | |
From net investment income | | (0.33 | ) | (0.13 | ) | (0.06 | ) | (0.01 | ) | (0.01 | ) |
From net realized gains | | (0.56 | ) | (0.97 | ) | (0.59 | ) | (0.10 | ) | — | |
Total distributions | | (0.89 | ) | (1.10 | ) | (0.65 | ) | (0.11 | ) | (0.01 | ) |
Net Asset Value | | | | | | | | | | | |
End of period(b) | | $ | 13.77 | | $ | 13.63 | | $ | 12.84 | | $ | 12.06 | | $ | 10.67 | |
| | | | | | | | | | | |
Total Return(c),(d) | | 7.76 | % | 15.62 | % | 12.24 | % | 14.19 | % | 30.80 | % |
Ratio and Supplemental Data | | | | | | | | | | | |
| | | | | | | | | | | |
Net Assets End of Period (000’s) | | $ | 1,260,779 | | $ | 1,198,596 | | $ | 966,677 | | $ | 759,168 | | $ | 501,532 | |
Expenses to average net assets(e),(f) | | 0.13 | % | 0.14 | % | 0.14 | % | 0.14 | % | 0.14 | % |
Net investment income (loss), to average net assets(f),(g) | | 2.00 | % | 2.75 | % | 1.28 | % | 0.46 | % | 0.18 | % |
Portfolio turnover rate(d) | | 26 | % | 4 | % | 41 | % | 38 | % | 18 | % |
For a share outstanding throughout each period(a)
| | Service Class | |
| | Year Ended December 31 | | May 1 to Dec | |
| | 2007 | | 2006 | | 2005 | | 2004 | | 31, 2003 | |
Net Asset Value | | | | | | | | | | | |
Beginning of period | | $ | 13.54 | | $ | 12.78 | | $ | 12.03 | | $ | 10.67 | | $ | 8.46 | |
Investment Operations | | | | | | | | | | | |
Net investment income (loss) | | 0.26 | | 0.34 | | 0.13 | | 0.03 | | — | (h) |
Net realized and unrealized gain (loss) | | 0.73 | | 1.50 | | 1.26 | | 1.44 | | 2.21 | |
Total operations | | 0.99 | | 1.84 | | 1.39 | | 1.47 | | 2.21 | |
Distributions | | | | | | | | | | | |
From net investment income | | (0.30 | ) | (0.11 | ) | (0.05 | ) | (0.01 | ) | — | |
From net realized gains | | (0.56 | ) | (0.97 | ) | (0.59 | ) | (0.10 | ) | — | |
Total distributions | | (0.86 | ) | (1.08 | ) | (0.64 | ) | (0.11 | ) | — | |
Net Asset Value | | | | | | | | | | | |
End of period(b) | | $ | 13.67 | | $ | 13.54 | | $ | 12.78 | | $ | 12.03 | | $ | 10.67 | |
| | | | | | | | | | | |
Total Return(c), (d) | | 7.54 | % | 15.28 | % | 11.92 | % | 13.90 | % | 26.12 | % |
Ratio and Supplemental Data | | | | | | | | | | | |
| | | | | | | | | | | |
Net Assets End of Period (000’s) | | $ | 411,079 | | $ | 338,769 | | $ | 213,215 | | $ | 118,490 | | $ | 14,893 | |
Expenses to average net assets(e),(f) | | 0.38 | % | 0.39 | % | 0.39 | % | 0.39 | % | 0.38 | % |
Net investment income (loss), to average net assets(f),(g) | | 1.86 | % | 2.54 | % | 1.06 | % | 0.29 | % | 0.03 | % |
Portfolio turnover rate(d) | | 26 | % | 4 | % | 41 | % | 38 | % | 18 | % |
(a) Per share information is calculated based on average number of shares outstanding.
(b) Asset Allocation - Growth Portfolio (the “Fund”) share classes commenced operations as follows:
Initial Class - May 1, 2002
Service Class - May 1, 2003
(c) Total Return reflects all portfolio expenses and includes reinvestment of dividends and capital gains; it does not reflect the charges and deductions under the policies or annuity contracts.
(d) Not annualized.
(e) Does not include expenses of the investment companies in which the Fund invests.
(f) Annualized.
(g) Recognition of net investment income by the Fund is affected by the timing of the declaration of dividends by the underlying investment companies in which the Fund invests.
(h) Rounds to less than $0.01 per share.
The notes to the financial statements are an integral part of this report.
7
Asset Allocation - Growth Portfolio
NOTES TO FINANCIAL STATEMENTS
At December 31, 2007
(all amounts in thousands)
NOTE 1. ORGANIZATION AND SIGNIFICANT ACCOUNTING POLICIES
AEGON/Transamerica Series Trust (“ATST”) is an open-end management investment company registered under the Investment Company Act of 1940, as amended (the “1940 Act”). ATST serves as a funding vehicle for variable life insurance, variable annuity and group annuity products. Asset Allocation - Growth Portfolio (the “Fund”) is part of ATST.
In the normal course of business, the Fund enters into contracts that contain a variety of representations that provide general indemnifications. The Fund’s maximum exposure under these arrangements is unknown, as this would involve future claims that may be made against the Fund and/or its affiliates that have not yet occurred. However, based on experience, the Fund expects the risk of loss to be remote.
This report should be read in conjunction with the current Fund prospectus, which contains more complete information about the Fund.
In preparing the Fund’s financial statements in accordance with accounting principles generally accepted in the United States of America (“GAAP”), estimates or assumptions (which could differ from actual results) may be used that affect reported amounts and disclosures. The following is a summary of significant accounting policies followed by the Fund.
Multiple class operations, income and expenses: The Fund currently offers two classes of shares, an Initial Class and a Service Class. Income, non-class specific expenses and realized and unrealized gains and losses, are allocated daily to each class, based upon the value of shares outstanding method as permitted under Rule 18f-3 of the 1940 Act. Each class bears its own specific expenses as well as a portion of general, common expenses.
Security valuations: Investment company securities are valued at the net asset value of the underlying portfolio.
Cash: The Fund may leave cash overnight in its cash account with the custodian, State Street Bank & Trust Company (“State Street”). On July 2, 2007, State Street acquired the parent company of Investors Bank & Trust Company. State Street has been contracted on behalf of the Fund to invest the excess cash into a savings account, which at December 31, 2007 was paying an interest rate of 2.60%.
Security transactions and investment income: Security transactions are recorded on the trade date. Security gains and losses are calculated on the first-in, first-out basis. Dividend income, if any, is recorded on the ex-dividend date. Dividends and net realized gain (loss) from investment securities for the Fund are from investments in shares of affiliated investment companies.
Dividend distributions: Dividends and capital gains distributions are typically declared and reinvested annually and are generally paid and reinvested on the business day following the ex-date.
NOTE 2. RELATED PARTY TRANSACTIONS
ATST serves as a funding vehicle for certain affiliated asset allocation portfolios and certain affiliated separate accounts of Western Reserve Life Assurance Co. of Ohio, Transamerica Life Insurance Company, Transamerica Financial Life Insurance Company, Inc., Monumental Life Insurance Company and Transamerica Occidental Life Insurance Company.
Transamerica Fund Advisors, Inc. (“TFAI”) is the Fund’s investment adviser. Transamerica Fund Services, Inc. (“TFS”) is the Fund’s administrator and transfer agent. Prior to May 1, 2007, AFSG Securities Corp. (“AFSG”), was the Fund’s distributor. Transamerica Capital, Inc. (“TCI”) is now the Fund’s distributor. TFAI, TFS, AFSG and TCI are affiliates of AEGON NV, a Netherlands corporation.
TFAI has entered into an agreement with Morningstar Associates, LLC (“Morningstar”) to provide investment services to the Fund. TFAI compensates Morningstar as described in the Prospectus.
Transamerica Investment Management, LLC (“TIM”) is an affiliate of the Fund and is a sub-adviser to other funds within ATST.
Certain officers and trustees of the Fund are also officers and/or directors of TFAI, TFS and TCI.
Because the underlying funds have varied expense and fee levels and the Fund may own different proportions of underlying funds at different times, the amount of fees and expenses incurred indirectly by the Fund will vary.
Investment advisory fee: The Fund pays management fees to TFAI based on average daily net assets (“ANA”) at the following rate:
0.10% of ANA
TFAI has contractually agreed to waive its advisory fee and will reimburse the Fund to the extent that operating expenses, excluding 12b-1 fees, exceed the following stated annual limit:
0.25% Expense Limit
If total Fund expenses fall below the annual expense limitation agreement agreed to by the adviser within the succeeding three years, the Fund may be required to pay the adviser a portion or all of the waived advisory fees.
There were no amounts recaptured during the year ended December 31, 2007. There are no amounts available for recapture at December 31, 2007.
8
NOTES TO FINANCIAL STATEMENTS (continued)
At December 31, 2007
(all amounts in thousands)
NOTE 2. – (continued)
Distribution and service fees: ATST entered into a Distribution Agreement with AFSG dated January 1, 1997, as amended. On May 1, 2007, the Distribution Agreement was amended to replace AFSG with TCI as the Fund’s distributor. The Fund has also adopted a distribution plan (“Distribution Plan”) pursuant to Rule 12b-1 under the 1940 Act.
Under the Distribution Plan for the Initial Class shares, TCI, on behalf of the Fund, is authorized to pay various service providers, as direct payment for expenses incurred in connection with distribution of the Fund’s shares, amounts equal to actual expenses associated with distributing the shares.
The Distribution Plan for the Service Class shares requires ATST to pay distribution fees to TCI as compensation for its activities, not as reimbursement for specific expenses. The fee on the Service Class is paid to the insurance companies for providing services and account maintenance for their policyholders who invest in the variable insurance products which invest in the Service Class shares.
The Fund is authorized under the Distribution Plan to pay fees on each class up to the following limits:
Initial Class | | 0.15 | % |
Service Class | | 0.25 | % |
TCI has determined that it will not seek payment by the Fund of the distribution expenses incurred with respect to the Initial Class shares before April 30, 2009. Prior to TCI seeking reimbursement of future expenses, policy and contract owners will be notified in advance. The Fund will pay fees relating to Service Class shares.
Administrative services: The Fund has entered into an agreement with TFS for financial and legal fund administration services. The Fund pays TFS an annual fee of 0.0125% of ANA. The Legal fees on the Statement of Operations are for fees paid to external legal counsel.
Deferred compensation plan: Each eligible independent Fund Trustee may elect participation in a non-qualified deferred compensation plan (“the Plan”). Under the Plan, such Trustees may defer payment of all or a portion of their total fees earned as a Fund Trustee. Each Trustee who is a participant in the Plan may elect that the earnings, losses or gains credited to his or her deferred fee amounts be determined based on a deemed investment in any series of Transamerica IDEX Mutual Funds. The right of a participant to receive a distribution from the Plan of the deferred fees is an unsecured claim against the general assets of all series of Transamerica IDEX Mutual Funds. The pro rata liability to the Fund of all deferred fees in the Plan amounted, as of December 31, 2007, to $80. Amounts deferred under the Deferred Compensation Plan are unfunded against the general assets of ATST.
Retirement plan: Under a retirement plan (the “Emeritus Plan”) available to the Independent Trustees, each Independent Trustee is deemed to have elected to serve as Trustee Emeritus of ATST upon his or her termination of service, other than removal for cause, is entitled to 50% of the trustee’s current retainer for a maximum period of five years determined by his or her years of service as a Trustee.
Such amounts shall be accrued by ATST on a pro rata basis allocable to each series of ATST fund based on the relative assets of the series. If retainers increase in the future, past accruals (and credits) will be adjusted upward so that 50% of the Trustee’s current retainer is accrued and credited at all times. Upon death, disability or termination of service, other than removal for cause, amounts deferred become payable to a Trustee Emeritus (or his/her beneficiary). Upon the commencement of service as Trustee Emeritus, compensation will be paid on a quarterly basis during the time period that the Trustee Emeritus is allowed to serve as such.
Amounts accrued under the Emeritus Plan are unsecured claims against the general assets of ATST. For the year ended December 31, 2007, the amount related to the Emeritus Plan was $54. As of December 31, 2007, the Fund has not made any payments related to the Emeritus Plan.
The Emeritus Plan was terminated effective October 30, 2007. Upon the termination, the Fund shall continue to pay any remaining benefits in accordance with the Plan, but no further compensation shall accrue under the Plan.
NOTE 3. INVESTMENT TRANSACTIONS
The cost of securities purchased and proceeds from securities sold (excluding short-term securities) for the year ended December 31, 2007 were as follows:
Purchases of securities: | | | |
Long-term | | $ | 558,186 | |
U.S. Government | | — | |
Proceeds from maturities and sales of securities: | | | |
Long-term | | 433,363 | |
U.S. Government | | — | |
| | | | |
NOTE 4. FEDERAL INCOME TAX MATTERS
The Fund has not made any provision for federal income or excise taxes due to its policy to distribute all of its taxable income and capital gains to its shareholders and otherwise qualify as a regulated investment company under Subchapter M of the Internal Revenue Code. Income and capital gain distributions are determined in accordance with income tax regulations, which may differ from GAAP. These differences are primarily due to differing treatment for items including, but not limited to, wash sales.
The tax character of distributions paid may differ from the character of distributions shown in the Statements of Changes in Net Assets due to short-term gains being treated as ordinary income for tax purposes. The tax character of distributions paid during 2006 and 2007 was as follows:
9
NOTES TO FINANCIAL STATEMENTS (continued)
At December 31, 2007
(all amounts in thousands)
NOTE 4. – (continued)
2006 Distributions paid from: | | | |
Ordinary Income | | $ | 12,302 | |
Long-term Capital Gain | | 95,843 | |
| | | |
2007 Distributions paid from: | | | |
Ordinary Income | | 36,774 | |
Long-term Capital Gain | | 63,416 | |
| | | | |
The tax basis components of distributable earnings as of December 31, 2007 are as follows:
Undistributed Ordinary Income | | $ | 34,215 | |
Undistributed Long-term Capital Gain | | $ | 181,991 | |
Capital Loss Carryforward | | $ | — | |
Net Unrealized Appreciation (Depreciation) | | $ | 146,050 | |
NOTE 5. REGULATORY PROCEEDINGS
There continues to be significant federal and state regulatory activity relating to financial services companies, particularly mutual fund companies and their investment advisers. As part of an ongoing investigation regarding potential market timing, recordkeeping and trading compliance issues and matters affecting the Fund’s investment adviser, TFAI, and certain affiliates and former employees of TFAI, the SEC staff has indicated that it is likely to take some action against TFAI and certain of its affiliates at the conclusion of the investigation. The potential timing and the scope of any such action is difficult to predict. Although the impact of any action brought against TFAI and/or its affiliates is difficult to assess at the present time, the Fund currently believes that the likelihood that any such action will have a material adverse impact is remote. It is important to note that the Fund is not aware of any allegation of wrongdoing against it and its Board at the time this annual report is printed. Although it is not anticipated that these developments will have an adverse impact on the Fund, there can be no assurance at this time. TFAI and its affiliates are actively working with the SEC in regard to this matter; however, the exact resolution cannot be determined at this time. TFAI will take such actions that it deems necessary or appropriate to continue providing management services to the Fund and to bring all matters to an appropriate conclusion.
TFAI and/or its affiliates, and not the Fund, will bear the costs regarding these regulatory matters.
NOTE 6. RECENTLY ISSUED ACCOUNTING PRONOUNCEMENTS
In July 2006, the Financial Accounting Standards Board (“FASB”) released FASB Interpretation No. 48 “Accounting for Uncertainty in Income Taxes” (“FIN 48”), an interpretation of FASB Statement No. 109. FIN 48 provides guidance for how uncertain tax positions should be recognized, measured, presented and disclosed in the financial statements. FIN 48 requires the accounting and disclosure of tax positions taken or expected to be taken in the course of preparing the Fund’s tax returns to determine whether the tax positions are “more-likely- than-not” of being sustained by the applicable tax authority. Tax positions not deemed to meet the more-likely-than-not threshold would be recorded as a tax benefit or expense in the current year.
Adoption of FIN 48 is effective during the first required financial reporting period for fiscal years beginning after December 15, 2006. Management adopted FIN 48 on June 29, 2007.
Implementation of FIN 48 requires Management of the Fund to analyze all open tax years, as defined by the Statute of Limitations, for all major jurisdictions, which includes federal and certain states. Open tax years are those that are open for exam by taxing authorities (i.e., the last 4 tax year ends and the interim tax period since then). The Fund has no examinations in progress and none are expected at this time.
Management of the Fund has reviewed all open tax years and major jurisdictions and concluded the adoption of FIN 48 resulted in no impact to the Fund’s net assets or results of operations. There is no tax liability resulting from unrecognized tax benefits relating to uncertain income tax positions taken or expected to be taken in future tax returns. The Fund is also not aware of any tax positions for which it is reasonably possible that the total amounts of unrecognized tax benefits will significantly change in the next 12 months.
In September 2006, FASB issued its new Standard No. 157, “Fair Value Measurements” (“FAS 157”). FAS 157 is designed to unify guidance for the measurement of fair value of all types of assets, including financial instruments, and certain liabilities, throughout a number of accounting standards. FAS 157 also establishes a hierarchy for measuring fair value in generally accepted accounting principles and expands financial statement disclosures about fair value measurements that are relevant to mutual funds. FAS 157 is effective for financial statements issued for fiscal years beginning after November 15, 2007, and earlier application is permitted.
As of December 31, 2007, Management does not expect the adoption of FAS 157 to impact the amounts reported in the financial statements, however, additional disclosures will be required about the inputs used to develop the measurements of fair value and the effect of certain of the measurements reported in the statement of operations for a fiscal period.
NOTE 7. SUBSEQUENT EVENT
Effective January 1, 2008, TFAI changed its name to Transamerica Asset Management, Inc.
Effective May 1, 2008, AEGON/Transamerica Series Trust will change its name to Transamerica Series Trust. At that time, the Fund will also change its name to Transamerica Asset Allocation - Growth VP.
10
Report of Independent Registered Certified Public Accounting Firm
To the Board of Trustees and Shareholders of
Asset Allocation Growth Portfolio:
In our opinion, the accompanying statement of assets and liabilities, including the schedule of investments, and the related statements of operations and of changes in net assets and the financial highlights present fairly, in all material respects, the financial position of Asset Allocation Growth Portfolio (the “Fund”) (one of the portfolios constituting AEGON/Transamerica Series Trust) at December 31, 2007, the results of its operations for the year then ended, the changes in its net assets for each of the two years in the period then ended and the financial highlights for each of the periods presented, in conformity with accounting principles generally accepted in the United States of America. These financial statements and financial highlights (hereafter referred to as “financial statements”) are the responsibility of the Fund’s management; our responsibility is to express an opinion on these financial statements based on our audits. We conducted our audits of these financial statements in accordance with the standards of the Public Company Accounting Oversight Board (United States). Those standards require that we plan and perform the audit to obtain reasonable assurance about whether the financial statements are free of material misstatement. An audit includes examining, on a test basis, evidence supporting the amounts and disclosures in the financial statements, assessing the accounting principles used and significant estimates made by management, and evaluating the overall financial statement presentation. We believe that our audits, which included confirmation of securities at December 31, 2007 by correspondence with the transfer agent, provide a reasonable basis for our opinion.

Tampa, Florida
February 29, 2008
11
Asset Allocation - Growth Portfolio
SUPPLEMENTAL TAX INFORMATION (unaudited)
(all amounts in thousands)
For tax purposes, the Fund has made a Long-Term Capital Gain Designation of $63,416 for the year ended December 31, 2007.
RESULTS OF SHAREHOLDER PROXY (unaudited)
At a special meeting of shareholders held on October 30, 2007, the results of the Proposals were as follows:
Proposal 1: To elect a new Board:
Proposed
Trustee | | For | | Against | | Abstentions/Broker Non-
Votes | |
John K. Carter | | 2,274,998,840.817 | | 57,804,698.755 | | 35,433.883 | |
| | | | | | | |
Leo J. Hill | | 2,277,212,702.754 | | 55,590,836.819 | | 35,433.883 | |
| | | | | | | |
Neal M. Jewell | | 2,266,793,295.663 | | 66,010,243.909 | | 35,433.883 | |
| | | | | | | |
Russell A. Kimball, Jr. | | 2,274,825,235.835 | | 57,978,303.737 | | 35,433.883 | |
| | | | | | | |
Eugene M. Mannella | | 2,274,623,165.033 | | 58,180,374.539 | | 35,433.883 | |
| | | | | | | |
Norm R. Nielsen | | 2,275,050,055.885 | | 57,753,483.687 | | 35,433.883 | |
| | | | | | | |
Joyce Galpern Norden | | 2,270,278,122.250 | | 62,525,417.323 | | 35,433.883 | |
| | | | | | | |
Patricia L. Sawyer | | 2,275,737,737.456 | | 57,065,802.116 | | 35,433.883 | |
| | | | | | | |
John W. Waechter | | 2,276,615,120.140 | | 56,188,419.433 | | 35,433.883 | |
Proposal 2: To approve an amendment to the Agreement and Declaration of Trust:
For | | Against | | Abstentions/Broker Non-
Votes | |
2,182,022,669.110 | | 77,590,048.544 | | 73,226,255.801 | |
12
Asset Allocation - Growth Portfolio
INVESTMENT ADVISORY AND SUB-ADVISORY AGREEMENTS-REVIEW AND RENEWAL (unaudited)
At a meeting of the Board of Trustees of AEGON/Transamerica Series Trust (“ATST”) held on December 4th, 2007, the Board reviewed and considered the renewal of the investment advisory agreement (the “Investment Advisory Agreement”) between Asset Allocation - Growth Portfolio (the “Fund”) and Transamerica Fund Advisors, Inc. (“TFAI”), as well as the renewal of the investment sub-advisory agreement (the “Sub-Advisory Agreement”) of the Fund between TFAI and Morningstar Associates, LLC (the “Sub-Adviser”), to determine whether the agreements should be renewed for a six-month period. It was noted that this review was interim in nature to align all the Funds on the same calendar, and that the Funds’ advisory arrangements would be reviewed again in the first half of 2008.
Following their review and consideration, the Trustees determined that the renewal of the Investment Advisory Agreement and the Sub-Advisory Agreement would enable shareholders of the Fund to obtain high quality services at a cost that is appropriate, fair, and in the best interests of its shareholders. The Board, including the independent members of the Board, unanimously approved the renewal of the Investment Advisory Agreement and Sub-Advisory Agreement. In reaching their decision, the Trustees requested and obtained from TFAI and the Sub-Adviser such information as they deemed reasonably necessary to evaluate the agreements, including information about fees and performance of comparable funds managed by the Sub-Adviser. The Trustees also carefully considered information they had previously received from TFAI and the Sub-Adviser throughout the year as part of their regular oversight of the Fund, as well as comparative fee, expense, and performance information prepared by Lipper Inc. (“Lipper”), an independent provider of mutual fund performance, fee and expense information and profitability data prepared by management. In considering the proposed continuation of the Investment Advisory and Sub-Advisory Agreements, the Trustees evaluated a number of considerations that they believed, in light of the legal advice furnished to them by independent legal counsel and their own business judgment, to be relevant. They based their decisions on a variety of factors, including the following considerations, among others, although they did not identify any consideration or particular information that was controlling of their decisions:
The nature, extent and quality of the advisory services to be provided. The Board considered the nature and quality of the services provided by TFAI and the Sub-Adviser to the Fund in the past, as well as the services anticipated to be provided in the future. The Board concluded that TFAI and the Sub-Adviser are capable of providing high quality services to the Fund, as indicated by the nature and quality of services provided in the past by TFAI and the Sub-Adviser for this series and the experience, capability and integrity of TFAI’s senior management, the financial resources of TFAI and the Sub-Adviser, TFAI’s management oversight process and the professional qualifications of the portfolio management team of the Sub-Adviser. The Trustees determined that TFAI and the Sub-Adviser can provide investment and related services that are appropriate in scope and extent in light of the Fund’s operations, the competitive landscape of the investment company business and investor needs.
The investment performance of the Fund. The Board examined the short and longer-term performance of the Fund, including relative performance against a peer universe of comparable mutual funds as prepared by Lipper for various trailing periods ended June 30, 2007. The Trustees noted that the performance of the Fund was strong compared to its peer universe for the past 3-year period, and above the median for the past 1- and 5-year periods. The Trustees further noted that the Fund has generated an attractive level of return given the risk incurred. On the basis of the Board’s assessment of the nature, extent and quality of advisory services to be provided or procured by TFAI and the Sub-Adviser, the Board concluded that TFAI and the Sub-Adviser are capable of providing a level of investment performance that is appropriate in light of the Fund’s proposed investment objectives, policies and strategies and competitive with other similarly situated investment companies.
The cost of advisory services provided and the level of profitability. The Board reviewed profitability information of TFAI’s cost of procuring fund management services, as well as the costs of provision of administration, fund accounting and other services, to the Fund and to ATST as a whole by TFAI and its affiliates. The Board reviewed the management and sub-advisory fees for the Fund. The Trustees noted that the Fund’s contractual management fees were below the median for its peer group and that the total expenses of the Fund were in line with the medians for its peer group and peer universe. Based on their review, the Trustees determined that the management fees of the Fund generally are appropriate in light of the services expected to be provided or procured, the management fees and the anticipated profitability of the relationship between the Fund, TFAI and its affiliates, and the Sub-Adviser. In making these observations and determinations, the Board reviewed, among other things, comparative information provided by Lipper.
Whether fee levels reflect economies of scale and the extent to which economies of scale would be realized as the Fund grows. In evaluating the extent to which the management fees payable under the Investment Advisory and Sub-Advisory Agreements reflect economies of scale or will permit economies of scale to be realized in the future, the Board considered the specific reasons for the absence of breakpoints, and concluded that the absence of breakpoints was acceptable under the circumstances. The Trustees also concluded that they will have the opportunity to periodically reexamine whether the Fund has achieved economies of scale, and the appropriateness of management fees payable to TFAI and fees paid to the Sub-Adviser, in the future.
Benefits (such as soft dollars) to TFAI, its affiliates, or the Sub-Adviser from their relationship with the Fund. The Board concluded that other benefits anticipated to be derived by TFAI, its affiliates, and the Sub-Adviser from their relationships with the Fund are expected to be reasonable and fair, and consistent with industry practice and the best interests of the Fund and its shareholders. The Trustees noted that TFAI would not realize soft dollar benefits from its relationship with the Fund.
Other considerations. The Board determined that TFAI has made a substantial commitment to the recruitment and retention of high quality personnel, and maintains the financial, compliance and operational resources reasonably necessary to manage the Fund in a professional manner that is consistent with the best interests of the Fund and its shareholders. In this regard, the Trustees favorably considered the procedures and policies in place by TFAI to enforce compliance with applicable laws and regulations and oversee the portfolio management activities of the Sub-Adviser. The Trustees also determined that TFAI has made a significant entrepreneurial commitment to the management and success of the Fund, reflected by TFAI’s expense limitation and fee waiver arrangements with the Fund which may result in TFAI waiving a substantial amount of management fees for the benefit of shareholders.
13
Asset Allocation – Moderate Portfolio
MARKET ENVIRONMENT
The stock and bond markets rose for the twelve-month period through December 31, 2007, but suffered plenty of volatility along the way. The Standard and Poor’s 500 Composite Stock Index returned 5.49%, while the broad Dow Jones Wilshire 5000 Total Market Index (“DJ Wilshire 5000”) gained 5.74%. These modest gains were punctuated by setbacks, however. In the summer, gathering concern about the U.S. mortgage and housing markets reached alarm levels. The mortgage industry’s loose lending standards of recent years came back to haunt lenders, investors, and borrowers alike. Lenders responded by tightening credit standards, many borrowers could no longer qualify for loans, and home sales and re-financings slowed. These problems worsened in the year’s last two months as financial institutions announced write-downs of mortgage-related holdings. After tumbling in the summer, stocks of financial companies again pulled the broad indices down in November and December.
By midyear investors were favoring the relative safety of larger stocks. As they migrated toward large caps while also steering away from financials and other value stocks, they boosted large-cap growth stocks in sectors such as technology. Large growth companies were also rewarded for being big exporters, an advantage with the weak U.S. dollar. For the year, large caps outpaced small caps, and growth stocks significantly outperformed value stocks across all market-cap ranges.
Foreign equity returns surpassed the U.S. indices. The Morgan Stanley Capital International EAFE Index (“MSCI EAFE”) rose 11.63% (gross) for the period, mainly because major foreign currencies strengthened against the dollar (the index gained only 3.54% (net) in local-currency terms). Emerging markets were especially strong as high commodity prices bolstered the developing nations that export them. The Morgan Stanley Capital International Emerging Markets Index soared 39.78% (gross) for the year.
Bond returns improved throughout the year as nervous investors sought safety from the shaky stock market. The Federal Reserve Board’s three rate cuts from September through December also helped bond prices. The Lehman Brothers Aggregate Bond Index (“LBAB”) finished the year with a 6.97% return, with U.S. government bonds leading the gains. High-yield bonds weakened as credit conditions worsened, but posted modestly positive returns thanks to strength earlier in the year.
PERFORMANCE
For the year ended December 31, 2007, Asset Allocation – Moderate Portfolio, Initial Class returned 7.95%. By comparison its primary and secondary benchmarks, the DJ Wilshire 5000 and the LBAB, returned 5.74% and 6.97%, respectively.
STRATEGY REVIEW
This fund-of-funds portfolio is structured to provide an approximately 50%/45%/5% mix of stocks, bonds, and cash. Its equity exposure provides broad coverage of domestic and international equity markets, across market capitalizations and investment styles. It also includes emerging markets, global real estate, and absolute-return strategies. The fixed-income portion is similarly well diversified, covering investment-grade and credit-sensitive holdings as well as international bonds.
The best-performing underlying fund was Transamerica Science & Technology, thanks to surging technology stocks. TA IDEX Oppenheimer Developing Markets performed almost as well, gaining significantly for the year as many emerging markets soared. The portfolio’s growth funds within the mid- and large-cap tiers (international included) clearly benefited from the strength of growth stocks. Among the value funds, two of the large-cap funds were weighed down by the financials sector, but in the small-cap area Transamerica Small/Mid Cap Value posted a significant gain and the other small-cap focused value fund, TA IDEX Oppenheimer Small- & Mid-Cap Value, also impressed with a positive return. The international position’s emerging-markets exposure (targeted at 20% of the international stake, mostly via the aforementioned Oppenheimer fund) was certainly a boost to returns. But TA IDEX Marsico International Growth also posted strong results, and TA IDEX Evergreen International Small Cap beat the MSCI EAFE even though the year favored large caps. Meanwhile, the portfolio’s three largest bond funds all surpassed the LBAB and ranked well within their categories, and Transamerica Convertible Securities beat all of the other bond funds. MFS High Yield and TA IDEX Transamerica Flexible Income were laggards, but the remaining bond funds held their own.
In early 2007 we conducted a broad rebalancing, mainly to better balance the portfolio’s equity exposure and diversify its bond position. We believe the portfolio’s good 2007 return, demonstrate the effectiveness of maintaining disciplined and balanced market coverage while emphasizing strong managers in each style.
In January 2007, TA IDEX Loomis Sayles Bond was added to the menu of underlying funds available for use in this portfolio, and it was added to the portfolio’s holdings that same month.
Michael Stout, CFA
Jon Hale, Ph.D., CFA
Jeff McConnell, CFA
Macicj Kowara, Ph.D., CFA
Co-Portfolio Managers
Morningstar Associates, LLC
AEGON/Transamerica Series Trust | | Annual Report 2007 |
1
Asset Allocation – Moderate Portfolio
(unaudited)

Average Annual Total Return for Periods Ended 12/31/2007
| | | | | | From | | Inception | |
| | 1 Year | | 5 Years | | Inception | | Date | |
Initial Class | | 7.95 | % | 12.46 | % | 8.45 | % | 5/1/02 | |
DJ Wilshire 5000(1) | | 5.74 | % | 14.07 | % | 8.54 | % | 5/1/02 | |
Lehman Brothers Aggregate Bond Index(1) | | 6.97 | % | 4.42 | % | 5.32 | % | 5/1/02 | |
| | | | | | | | | |
Service Class | | 7.73 | % | — | % | 12.04 | % | 5/1/03 | |
NOTES
(1) The Dow Jones Wilshire 5000 Total Market (DJ Wilshire 5000) Index and the Lehman Brothers Aggregate Bond (LBAB) Index are unmanaged indices used as a general measure of market performance. Calculations assume dividends and capital gains are reinvested and do not include any managerial expenses. From inception, calculation is based on life of Initial Class shares.
The performance data presented represents past performance; future results may vary. The portfolio’s investment return and net asset value will fluctuate. Past performance does not guarantee future results. Investor’s units when redeemed may be worth more or less than their original cost.
Current performance may be lower or higher than performance quoted. Please visit your insurance company’s website for contract or policy level standardized total returns current to the most recent month end. Portfolio performance is net of investment fees and fund expenses, but not product charges, which, if included, would significantly lower the performance quoted.
This material must be preceded or accompanied by a current prospectus, which includes specific contents regarding the investment objectives, explanation of share classes and policies of this portfolio.
2
Asset Allocation – Moderate Portfolio
UNDERSTANDING YOUR FUND’S EXPENSES
(unaudited)
SHAREHOLDER EXPENSES
Fund shareholders may incur ongoing costs, including management and advisory fees, distribution and service fees, and other fund expenses.
The following Example is intended to help you understand your ongoing costs (in dollars and cents) of investing in the Fund and to compare these costs with the ongoing costs of investing in other funds.
The Example is based on an investment of $1,000 invested at July 1, 2007 and held for the entire period until December 31, 2007.
ACTUAL EXPENSES
The first line in the table below provides information about actual account values and actual expenses. You may use the information in this line, together with the amount you invested, to estimate the expenses that you paid over the period. Simply divide your account value by $1,000 (for example, an $8,600 account value divided by $1,000 = 8.6), then multiply the result by the number in the first line of your Fund under the heading entitled “Expenses Paid During Period” to estimate the expenses you paid on your account during this period.
HYPOTHETICAL EXAMPLE FOR COMPARISON PURPOSES
The second line in the table below provides information about hypothetical account values and hypothetical expenses based on the Fund’s actual expense ratio and an assumed rate of return of 5% per year before expenses, which is not the Fund’s actual return. The hypothetical account values and expenses may not be used to estimate the actual ending account balance or expenses you paid for the period. You may use this information to compare the ongoing costs of investing in your Fund and other funds. To do so, compare this 5% hypothetical example with the 5% hypothetical examples that appear in the shareholder reports of the other funds.
Please note that the expenses shown in the table are meant to highlight your ongoing costs only and do not reflect any transactional costs, such as sales charges, redemption fees, brokerage commissions paid on purchases and sales of fund shares. Therefore, the second line under the Fund in the table is useful in comparing ongoing costs only, and will not help you determine the relative total costs of owning different funds. If any of these transaction costs were included, your costs would be higher. The expenses shown in the table do not reflect any fees that may be charged to you by brokers, financial intermediaries or other financial institutions.
The expenses shown in the table do not reflect any expenses from the Funds investment in other affiliated investment companies. The average weighted annualized expense ratio of the underlying investment companies at December 31, 2007, was 0.80%.
| | Beginning | | Ending | | Annualized | | Expenses | |
| | Account | | Account | | Expense | | Paid During | |
| | Value | | Value | | Ratio | | Period (a) | |
| | | | | | | | | |
Initial Class | | | | | | | | | |
Actual | | $ | 1,000.00 | | $ | 1,030.71 | | 0.13 | % | $ | 0.67 | |
Hypothetical (b) | | 1,000.00 | | 1,024.55 | | 0.13 | | 0.66 | |
| | | | | | | | | |
Service Class | | | | | | | | | |
Actual | | 1,000.00 | | 1,029.16 | | 0.38 | | 1.94 | |
Hypothetical (b) | | 1,000.00 | | 1,023.29 | | 0.38 | | 1.94 | |
| | | | | | | | | | | | |
(a) Expenses are calculated using the Fund’s annualized expense ratio (as disclosed in the table), multiplied by the average account value for the period, multiplied by the number of days in the period (184 days), and divided by the number of days in the year (365 days).
(b) 5% return per year before expenses.
GRAPHICAL PRESENTATION OF SCHEDULE OF INVESTMENTS
By Asset Type
At December 31, 2007
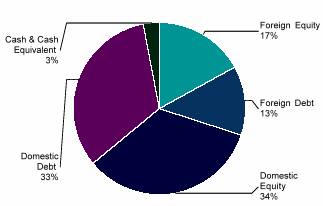
This chart shows the percentage breakdown by asset type of the aggregate portfolio holdings of the underlying affiliated investment companies in which the Fund invests. The security lending collateral in the underlying funds is excluded from this calculation.
3
Asset Allocation – Moderate Portfolio
SCHEDULE OF INVESTMENTS
At December 31, 2007
(all amounts except share amounts in thousands)
| | Shares | | Value | |
INVESTMENT COMPANIES (100.0%) | | | | | |
Bond (35.3%) | | | | | |
MFS High Yield (1) | | 11,142,968 | | $ | 97,390 | |
PIMCO Total Return (1) | | 32,933,505 | | 383,675 | |
TA IDEX JPMorgan International Bond (2) | | 17,638,748 | | 193,497 | |
TA IDEX Transamerica Flexible Income (2) | | 7,540,210 | | 68,088 | |
TA IDEX Transamerica High-Yield Bond (2) | | 2,722,667 | | 24,232 | |
TA IDEX Transamerica Short-Term Bond (2) | | 13,592,438 | | 132,798 | |
TA IDEX Van Kampen Emerging Markets Debt (2) | | 7,910,008 | | 83,134 | |
Transamerica Convertible Securities (1) | | 6,283,870 | | 78,423 | |
Capital Preservation (0.8%) | | | | | |
Transamerica Money Market (1) | | 23,567,369 | | 23,567 | |
Global/International Stock (7.7%) | | | | | |
TA IDEX AllianceBernstein International Value (2) | | 3,464,951 | | 43,936 | |
TA IDEX Evergreen International Small Cap (2) | | 3,115,854 | | 47,641 | |
TA IDEX Marsico International Growth (2) | | 2,639,003 | | 35,943 | |
TA IDEX Neuberger Berman International (2) | | 3,447,785 | | 38,684 | |
TA IDEX Oppenheimer Developing Markets (2) | | 4,452,722 | | 65,945 | |
Inflation-Protected Securities (6.4%) | | | | | |
TA IDEX PIMCO Real Return TIPS (2) | | 18,530,789 | | 192,350 | |
Tactical and Specialty (9.1%) | | | | | |
Clarion Global Real Estate Securities | | 4,209,620 | | 82,677 | |
TA IDEX BlackRock Global Allocation (2) | | 1,681,367 | | 20,479 | |
TA IDEX Evergreen Health Care | | 4,069,133 | | 51,637 | |
TA IDEX Loomis Sayles Bond (2) | | 11,766,241 | | 118,133 | |
U.S. Stock (40.7%) | | | | | |
American Century Large Company Value (1) | | 7,623,016 | | $ | 84,692 | |
BlackRock Large Cap Value (1) | | 4,947,295 | | 94,790 | |
Capital Guardian Value (1) | | 6,030,715 | | 110,603 | |
Federated Market Opportunity (1) | | 5,155,926 | | 75,586 | |
Jennison Growth (1) | | 906,572 | | 7,479 | |
JPMorgan Mid Cap Value (1) | | 2,231,588 | | 35,237 | |
Marsico Growth (1) | | 10,139,313 | | 131,406 | |
Munder Net50 (1) | | 838,643 | | 9,879 | |
T. Rowe Price Equity Income | | 54,147 | | 1,033 | |
T. Rowe Price Growth Stock | | 1,971,682 | | 50,554 | |
T. Rowe Price Small Cap (1) | | 2,635,768 | | 27,069 | |
TA IDEX Bjurman, Barry Micro | | 1,187,875 | | 13,447 | |
Emerging Growth (2) | | | | | |
TA IDEX Oppenheimer Small- & Mid- | | 1,041,949 | | 11,982 | |
Cap Value (2) | | | | | |
TA IDEX Third Avenue Value (2) | | 6,549,242 | | 170,608 | |
TA IDEX UBS Large Cap Value (2) | | 7,663,431 | | 95,870 | |
TA IDEX Van Kampen Small Company Growth (2) | | 57,727 | | 670 | |
| | | | | |
Transamerica Equity (1) | | 4,889,428 | | 141,304 | |
Transamerica Growth Opportunities (1) | | 4,268,738 | | 77,606 | |
Transamerica Science & Technology (1) ~ | | 8,714,192 | | 46,621 | |
Transamerica Small/Mid Cap Value | | 1,617,992 | | 35,758 | |
| | | | | |
Total Investment Companies (cost $2,772,916) # | | | | $ | 3,004,423 | |
NOTES TO SCHEDULE OF INVESTMENTS:
(1) The Fund invests its assets in the Initial Class shares of the affiliated AEGON/Transamerica Series Trust.
(2) The Fund invests its assets in the Class I shares of the affiliated Transamerica IDEX Mutual Funds.
# Aggregate cost for federal income tax purposes is $2,773,783. Aggregate gross unrealized appreciation for all securities in which there is an excess of value over tax cost and aggregate gross unrealized depreciation for all securities in which there is an excess of tax cost over value were $277,273 and $46,633, respectively. Net unrealized appreciation for tax purposes is $230,640.
~ Non-income producing.
The notes to the financial statements are an integral part of this report.
4
Asset Allocation – Moderate Portfolio
STATEMENT OF ASSETS AND LIABILITIES
At December 31, 2007
(all amounts except per share amounts in thousands)
Assets: | | | |
Investment in affiliated investment companies at value (cost: $2,772,916) | | $ | 3,004,423 | |
Receivables: | | | |
Investment securities sold | | 1,198 | |
Shares sold | | 614 | |
| | 3,006,235 | |
Liabilities: | | | |
Accounts payable and accrued liabilities: | | | |
Shares redeemed | | 1,752 | |
Management and advisory fees | | 255 | |
Distribution and service fees | | 306 | |
Administration fees | | 32 | |
Trustees fees | | 111 | |
Other | | 102 | |
| | 2,558 | |
Net Assets | | $ | 3,003,677 | |
| | | |
Net Assets Consist of: | | | |
Capital Stock ($.01 par value) | | $ | 2,335 | |
Additional paid-in capital | | 2,480,486 | |
Undistributed (accumulated) net investment income in affiliated investment companies | | 86,809 | |
Undistributed (accumulated) net realized gain from investment in affiliated investment companies | | 202,540 | |
Net unrealized appreciation on investment in affiliated investment companies | | 231,507 | |
Net Assets | | $ | 3,003,677 | |
Net Assets by Class: | | | |
Initial Class | | $ | 1,550,984 | |
Service Class | | 1,452,693 | |
Shares Outstanding: | | | |
Initial Class | | 120,242 | |
Service Class | | 113,248 | |
Net Asset Value and Offering Price Per Share: | | | |
Initial Class | | $ | 12.90 | |
Service Class | | 12.83 | |
STATEMENT OF OPERATIONS
For the year ended December 31, 2007
(all amounts in thousands)
Investment Income: | | | |
Dividends from affiliated investment companies | | $ | 93,516 | |
| | | | |
Expenses: | | | |
Management and advisory fees | | 2,829 | |
Printing and shareholder reports | | 60 | |
Custody fees | | 98 | |
Administration fees | | 354 | |
Legal fees | | 57 | |
Audit fees | | 21 | |
Trustees fees | | 95 | |
Registration fees | | 20 | |
Distribution and service fees: | | | |
Service Class | | 3,133 | |
Other | | 39 | |
Total expenses | | 6,706 | |
| | | |
Net Investment Income | | 86,810 | |
| | | |
Net Realized Gain (Loss) from: | | | |
Investment in affiliated investment companies | | 130,787 | |
Distributions from investment in affiliated investment companies | | 71,965 | |
| | 202,752 | |
Net Increase (Decrease) in Unrealized Appreciation (Depreciation) on: | | | |
Investment in affiliated investment companies | | (79,857 | ) |
Net Realized and Unrealized Gain on Affiliated Investment Companies: | | 122,895 | |
Net Increase In Net Assets Resulting from Operations | | $ | 209,705 | |
The notes to the financial statements are an integral part of this report.
5
Asset Allocation – Moderate Portfolio
STATEMENT OF CHANGES IN NET ASSETS
For the years ended
(all amounts in thousands)
| | December 31, | | December 31, | |
| | 2007 | | 2006 | |
Increase (Decrease) in Net Assets From: | | | | | |
Operations: | | | | | |
Net investment income | | $ | 86,810 | | $ | 82,631 | |
Net realized gain from investment in affiliated investment companies | | 202,752 | | 74,044 | |
Change in unrealized appreciation (depreciation) on investment in affiliated investment companies | | (79,857 | ) | 101,415 | |
| | 209,705 | | 258,090 | |
Distributions to Shareholders: | | | | | |
From net investment income: | | | | | |
Initial Class | | (46,088 | ) | (39,931 | ) |
Service Class | | (36,543 | ) | (21,762 | ) |
| | (82,631 | ) | (61,693 | ) |
From net realized gains: | | | | | |
Initial Class | | (40,327 | ) | (69,586 | ) |
Service Class | | (33,758 | ) | (39,653 | ) |
| | (74,085 | ) | (109,239 | ) |
Capital Share Transactions: | | | | | |
Proceeds from shares sold: | | | | | |
Initial Class | | 146,040 | | 154,399 | |
Service Class | | 412,278 | | 393,038 | |
| | 558,318 | | 547,437 | |
Dividends and distributions reinvested: | | | | | |
Initial Class | | 86,414 | | 109,517 | |
Service Class | | 70,301 | | 61,415 | |
| | 156,715 | | 170,932 | |
Cost of shares redeemed: | | | | | |
Initial Class | | (306,998 | ) | (240,954 | ) |
Service Class | | (91,790 | ) | (45,171 | ) |
| | (398,788 | ) | (286,125 | ) |
| | 316,245 | | 432,244 | |
Net increase in net assets | | 369,234 | | 519,402 | |
| | | | | |
Net Assets: | | | | | |
Beginning of year | | 2,634,443 | | 2,115,041 | |
End of year | | $ | 3,003,677 | | $ | 2,634,443 | |
Undistributed (Accumulated) net investment income | | $ | 86,809 | | $ | 82,630 | |
Share Activity: | | | | | |
Shares issued: | | | | | |
Initial Class | | 11,211 | | 12,360 | |
Service Class | | 31,880 | | 31,575 | |
| | 43,091 | | 43,935 | |
Shares issued-reinvested from distributions: | | | | | |
Initial Class | | 6,986 | | 9,281 | |
Service Class | | 5,706 | | 5,222 | |
| | 12,692 | | 14,503 | |
Shares redeemed: | | | | | |
Initial Class | | (23,671 | ) | (19,265 | ) |
Service Class | | (7,111 | ) | (3,634 | ) |
| | (30,782 | ) | (22,899 | ) |
Net increase (decrease) in shares outstanding: | | | | | |
Initial Class | | (5,474 | ) | 2,376 | |
Service Class | | 30,475 | | 33,163 | |
| | 25,001 | | 35,539 | |
The notes to the financial statements are an integral part of this report.
6
Asset Allocation – Moderate Portfolio
FINANCIAL HIGHLIGHTS
For a share outstanding throughout each period(a)
| | Initial Class | |
| | Year Ended December 31, | |
| | 2007 | | 2006 | | 2005 | | 2004 | | 2003 | |
Net Asset Value | | | | | | | | | | | |
Beginning of period | | $ | 12.66 | | $ | 12.24 | | $ | 12.10 | | $ | 10.99 | | $ | 8.81 | |
Investment Operations | | | | | | | | | | | |
Net investment income (loss) | | 0.40 | | 0.44 | | 0.40 | | 0.18 | | 0.04 | |
Net realized and unrealized gain (loss) | | 0.57 | | 0.89 | | 0.46 | | 1.06 | | 2.15 | |
Total operations | | 0.97 | | 1.33 | | 0.86 | | 1.24 | | 2.19 | |
Distributions | | | | | | | | | | | |
From net investment income | | (0.39 | ) | (0.33 | ) | (0.22 | ) | (0.03 | ) | (0.01 | ) |
From net realized gains | | (0.34 | ) | (0.58 | ) | (0.50 | ) | (0.10 | ) | — | |
Total distributions | | (0.73 | ) | (0.91 | ) | (0.72 | ) | (0.13 | ) | (0.01 | ) |
Net Asset Value | | | | | | | | | | | |
End of period(b) | | $ | 12.90 | | $ | 12.66 | | $ | 12.24 | | $ | 12.10 | | $ | 10.99 | |
| | | | | | | | | | | |
Total Return(c),(d) | | 7.95 | % | 11.48 | % | 7.44 | % | 11.39 | % | 24.87 | % |
Ratio and Supplemental Data | | | | | | | | | | | |
| | | | | | | | | | | |
Net Assets End of Period (000’s) | | $ | 1,550,984 | | $ | 1,591,304 | | $ | 1,509,579 | | $ | 1,405,218 | | $ | 1,169,496 | |
Expenses to average net assets(e),(f) | | 0.13 | % | 0.13 | % | 0.14 | % | 0.13 | % | 0.12 | % |
Net investment income (loss), to average net assets(f),(g) | | 3.10 | % | 3.53 | % | 3.36 | % | 1.61 | % | 0.39 | % |
Portfolio turnover rate(d) | | 20 | % | 3 | % | 24 | % | 30 | % | 16 | % |
For a share outstanding throughout each period(a)
| | Service Class | |
| | Year Ended December 31, | | May 1 to Dec | |
| | 2007 | | 2006 | | 2005 | | 2004 | | 31, 2003 | |
Net Asset Value | | | | | | | | | | | |
Beginning of period | | $ | 12.60 | | $ | 12.20 | | $ | 12.09 | | $ | 10.98 | | $ | 9.21 | |
Investment Operations | | | | | | | | | | | |
Net investment income (loss) | | 0.39 | | 0.43 | | 0.41 | | 0.18 | | 0.01 | |
Net realized and unrealized gain (loss) | | 0.55 | | 0.87 | | 0.42 | | 1.03 | | 1.76 | |
Total operations | | 0.94 | | 1.30 | | 0.83 | | 1.21 | | 1.77 | |
Distributions | | | | | | | | | | | |
From net investment income | | (0.37 | ) | (0.32 | ) | (0.22 | ) | — | (h) | — | |
From net realized gains | | (0.34 | ) | (0.58 | ) | (0.50 | ) | (0.10 | ) | — | |
Total distributions | | (0.71 | ) | (0.90 | ) | (0.72 | ) | (0.10 | ) | — | |
Net Asset Value | | | | | | | | | | | |
End of period(b) | | $ | 12.83 | | $ | 12.60 | | $ | 12.20 | | $ | 12.09 | | $ | 10.98 | |
| | | | | | | | | | | |
Total Return(c),(d) | | 7.73 | % | 11.21 | % | 7.13 | % | 11.13 | % | 19.22 | % |
Ratio and Supplemental Data | | | | | | | | | | | |
| | | | | | | | | | | |
Net Assets End of Period (000’s) | | $ | 1,452,693 | | $ | 1,043,139 | | $ | 605,462 | | $ | 227,221 | | $ | 28,018 | |
Expenses to average net assets(e),(f) | | 0.38 | % | 0.38 | % | 0.39 | % | 0.39 | % | 0.37 | % |
Net investment income (loss), to average net assets(f),(g) | | 3.03 | % | 3.44 | % | 3.40 | % | 1.63 | % | 0.13 | % |
Portfolio turnover rate(d) | | 20 | % | 3 | % | 24 | % | 30 | % | 16 | % |
(a) Per share information is calculated based on average number of shares outstanding.
(b) Asset Allocation - Moderate Portfolio (the “Fund”) share classes commenced operations as follows:
Initial Class - May 1, 2002
Service Class - May 1, 2003
(c) Total Return reflects all portfolio expenses and includes reinvestment of dividends and capital gains; it does not reflect the charges and deductions under the policies or annuity contracts.
(d) Not annualized.
(e) Does not include expenses of the investment companies in which the Fund invests.
(f) Annualized.
(g) Recognition of net investment income by the Fund is affected by the timing of the declaration of dividends by the underlying investment companies in which the Fund invests.
(h) Rounds to less than $0.01 per share.
The notes to the financial statements are an integral part of this report.
7
Asset Allocation – Moderate Portfolio
NOTES TO FINANCIAL STATEMENTS
At December 31, 2007
(all amounts in thousands)
NOTE 1. ORGANIZATION AND SIGNIFICANT ACCOUNTING POLICIES
AEGON/Transamerica Series Trust (“ATST”) is an open-end management investment company registered under the Investment Company Act of 1940, as amended (the “1940 Act”). ATST serves as a funding vehicle for variable life insurance, variable annuity and group annuity products. Asset Allocation - -Moderate Portfolio (the “Fund”) is part of ATST.
In the normal course of business, the Fund enters into contracts that contain a variety of representations that provide general indemnifications. The Fund’s maximum exposure under these arrangements is unknown, as this would involve future claims that may be made against the Fund and/or its affiliates that have not yet occurred. However, based on experience, the Fund expects the risk of loss to be remote.
This report should be read in conjunction with the current Fund prospectus, which contains more complete information about the Fund.
In preparing the Fund’s financial statements in accordance with accounting principles generally accepted in the United States of America (“GAAP”), estimates or assumptions (which could differ from actual results) may be used that affect reported amounts and disclosures. The following is a summary of significant accounting policies followed by the Fund.
Multiple class operations, income and expenses: The Fund currently offers two classes of shares, an Initial Class and a Service Class. Income, non-class specific expenses and realized and unrealized gains and losses, are allocated daily to each class, based upon the value of shares outstanding method as permitted under Rule 18f-3 of the 1940 Act. Each class bears its own specific expenses as well as a portion of general, common expenses.
Security valuations: Investment company securities are valued at the net asset value of the underlying portfolio.
Cash: The Fund may leave cash overnight in its cash account with the custodian, State Street Bank & Trust Company (“State Street”). On July 2, 2007, State Street acquired the parent company of Investors Bank & Trust Company. State Street has been contracted on behalf of the Fund to invest the excess cash into a savings account, which at December 31, 2007 was paying an interest rate of 2.60%.
Security transactions and investment income: Security transactions are recorded on the trade date. Security gains and losses are calculated on the first-in, first-out basis. Dividend income, if any, is recorded on the ex-dividend date. Dividends and net realized gain (loss) from investment securities for the Fund are from investments in shares of affiliated investment companies.
Dividend distributions: Dividends and capital gains distributions are typically declared and reinvested annually and are generally paid and reinvested on the business day following the ex-date.
NOTE 2. RELATED PARTY TRANSACTIONS
ATST serves as a funding vehicle for certain affiliated asset allocation portfolios and certain affiliated separate accounts of Western Reserve Life Assurance Co. of Ohio, Transamerica Life Insurance Company, Transamerica Financial Life Insurance Company, Inc., Monumental Life Insurance Company and Transamerica Occidental Life Insurance Company.
Transamerica Fund Advisors, Inc. (“TFAI”) is the Fund’s investment adviser. Transamerica Fund Services, Inc. (“TFS”) is the Fund’s administrator and transfer agent. Prior to May 1, 2007, AFSG Securities Corp. (“AFSG”), was the Fund’s distributor. Transamerica Capital Inc. (“TCI”) is now the Fund’s distributor. TFAI, TFS, AFSG and TCI are affiliates of AEGON NV, a Netherlands corporation.
TFAI has entered into an agreement with Morningstar Associates, LLC (“Morningstar”) to provide investment services to the Fund. TFAI compensates Morningstar as described in the Prospectus.
Transamerica Investment Management, LLC (“TIM”) is an affiliate of the Fund and is a sub-adviser to other funds within ATST.
Certain officers and trustees of the Fund are also officers and/or directors of TFAI, TFS and TCI.
Because the underlying funds have varied expense and fee levels and the Fund may own different proportions of underlying funds at different times, the amount of fees and expenses incurred indirectly by the Fund will vary.
Investment advisory fee: The Fund pays management fees to TFAI based on average daily net assets (“ANA”) at the following rate:
0.10% of ANA
TFAI has contractually agreed to waive its advisory fee and will reimburse the Fund to the extent that operating expenses, excluding 12b-1 fees, exceed the following stated annual limit:
0.25% Expense Limit
If total Fund expenses fall below the annual expense limitation agreement agreed to by the adviser within the succeeding three years, the Fund may be required to pay the adviser a portion or all of the waived advisory fees.
There were no amounts recaptured during the year ended December 31, 2007. There are no amounts available for recapture at December 31, 2007.
8
NOTES TO FINANCIAL STATEMENTS (Continued)
At December 31,2007
(all amounts in thousands)
NOTE 2.– (continued)
Distribution and service fees: ATST entered into a Distribution Agreement with AFSG dated January 1, 1997, as amended. On May 1, 2007, the Distribution Agreement was amended to replace AFSG with TCI as the Fund’s distributor. The Fund has also adopted a distribution plan (“Distribution Plan”) pursuant to Rule 12b-1 under the 1940 Act.
Under the Distribution Plan for the Initial Class shares, TCI, on behalf of the Fund, is authorized to pay various service providers, as direct payment for expenses incurred in connection with distribution of the Fund’s shares, amounts equal to actual expenses associated with distributing the shares.
The Distribution Plan for the Service Class shares requires ATST to pay distribution fees to TCI as compensation for its activities, not as reimbursement for specific expenses. The fee on the Service Class is paid to the insurance companies for providing services and account maintenance for their policyholders who invest in the variable insurance products which invest in the Service Class shares.
The Fund is authorized under the Distribution Plan to pay fees on each class up to the following limits:
Initial Class | | 0.15 | % |
Service Class | | 0.25 | % |
TCI has determined that it will not seek payment by the Fund of the distribution expenses incurred with respect to the Initial Class shares before April 30, 2009. Prior to TCI seeking reimbursement of future expenses, policy and contract owners will be notified in advance. The Fund will pay fees relating to Service Class shares.
Administrative services: The Fund has entered into an agreement with TFS for financial and legal fund administration services. The Fund pays TFS an annual fee of 0.0125% of ANA. The Legal fees on the Statement of Operations are for fees paid to external legal counsel.
Deferred compensation plan: Each eligible independent Fund Trustee may elect participation in a non-qualified deferred compensation plan (“the Plan”). Under the Plan, such Trustees may defer payment of all or a portion of their total fees earned as a Fund Trustee. Each Trustee who is a participant in the Plan may elect that the earnings, losses or gains credited to his or her deferred fee amounts be determined based on a deemed investment in any series of Transamerica IDEX Mutual Funds. The right of a participant to receive a distribution from the Plan of the deferred fees is an unsecured claim against the general assets of all series of Transamerica IDEX Mutual Funds. The pro rata liability to the Fund of all deferred fees in the Plan amounted, as of December 31, 2007, to $144. Amounts deferred under the Plan are unfunded against the general assets of ATST.
Retirement plan: Under a retirement plan (the “Emeritus Plan”) available to the Independent Trustees, each Independent Trustee is deemed to have elected to serve as Trustee Emeritus of ATST upon his or her termination of service, other than removal for cause, is entitled to 50% of the trustee’s current retainer for a maximum period of five years determined by his or her years of service as a Trustee.
Such amounts shall be accrued by ATST on a pro rata basis allocable to each series of ATST fund based on the relative assets of the series. If retainers increase in the future, past accruals (and credits) will be adjusted upward so that 50% of the Trustee’s current retainer is accrued and credited at all times. Upon death, disability or termination of service, other than removal for cause, amounts deferred become payable to a Trustee Emeritus (or his/her beneficiary). Upon the commencement of service as Trustee Emeritus, compensation will be paid on a quarterly basis during the time period that the Trustee Emeritus is allowed to serve as such.
Amounts accrued under the Emeritus Plan are unsecured claims against the general assets of ATST. For the year ended December 31, 2007, the amount related to the Emeritus Plan was $95. As of December 31, 2007, the Fund has not made any payments related to the Emeritus Plan.
The Emeritus Plan was terminated effective October 30, 2007. Upon the termination, the Fund shall continue to pay any remaining benefits in accordance with the Plan, but no further compensation shall accrue under the Plan.
NOTE 3. INVESTMENT TRANSACTIONS
The cost of securities purchased and proceeds from securities sold (excluding short-term securities) for the year ended December 31, 2007 were as follows:
Purchases of securities: | | | |
Long-term | | $ | 890,286 | |
U.S. Government | | — | |
Proceeds from maturities and sales of securities: | | | |
Long-term | | 571,877 | |
U.S. Government | | — | |
| | | | |
NOTE 4. FEDERAL INCOME TAX MATTERS
The Fund has not made any provision for federal income or excise taxes due to its policy to distribute all of its taxable income and capital gains to its shareholders and otherwise qualify as a regulated investment company under Subchapter M of the Internal Revenue Code. Income and capital gain distributions are determined in accordance with income tax regulations, which may differ from GAAP. These differences are primarily due to differing treatment for items including, but not limited to, wash sales.
The tax character of distributions paid may differ from the character of distributions shown in the Statements of Changes in Net Assets due to short-term gains being treated as ordinary income for tax purposes. The tax character of distributions paid during 2006 and 2007 was as follows:
9
NOTES TO FINANCIAL STATEMENTS (Continued)
At December 31,2007
(all amounts in thousands)
2006 Distributions paid from: | | | |
Ordinary Income | | $ | 62,077 | |
Long-term Capital Gain | | 108,855 | |
| | | |
2007 Distributions paid from: | | | |
Ordinary Income | | 82,662 | |
Long-term Capital Gain | | 74,054 | |
| | | | |
The tax basis components of distributable earnings as of December 31, 2007 are as follows:
Undistributed Ordinary Income | | $ | 88,935 | |
Undistributed Long-term Capital Gain | | $ | 201,281 | |
Capital Loss Carryforward | | $ | — | |
Net Unrealized Appreciation (Depreciation) | | $ | 230,640 | |
NOTE 5. REGULATORY PROCEEDINGS
There continues to be significant federal and state regulatory activity relating to financial services companies, particularly mutual fund companies and their investment advisers. As part of an ongoing investigation regarding potential market timing, recordkeeping and trading compliance issues and matters affecting the Fund’s investment adviser, TFAI, and certain affiliates and former employees of TFAI, the SEC staff has indicated that it is likely to take some action against TFAI and certain of its affiliates at the conclusion of the investigation. The potential timing and the scope of any such action is difficult to predict. Although the impact of any action brought against TFAI and/or its affiliates is difficult to assess at the present time, the Fund currently believes that the likelihood that any such action will have a material adverse impact is remote. It is important to note that the Fund is not aware of any allegation of wrong doing against it and its Board at the time this annual report is printed. Although it is not anticipated that these developments will have an adverse impact on the Fund, there can be no assurance at this time. TFAI and its affiliates are actively working with the SEC in regard to this matter; however, the exact resolution cannot be determined at this time. TFAI will take such actions that it deems necessary or appropriate to continue providing management services to the Fund and to bring all matters to an appropriate conclusion.
TFAI and/or its affiliates, and not the Fund, will bear the costs regarding these regulatory matters.
NOTE 6. RECENTLY ISSUED ACCOUNTING PRONOUNCEMENTS
In July 2006, the Financial Accounting Standards Board (“FASB”) released FASB Interpretation No. 48 “Accounting for Uncertainty in Income Taxes” (“FIN 48”), an interpretation of FASB Statement No. 109. FIN 48 provides guidance for how uncertain tax positions should be recognized, measured, presented and disclosed in the financial statements. FIN 48 requires the accounting and disclosure of tax positions taken or expected to be taken in the course of preparing the Fund’s tax returns to determine whether the tax positions are “more-likely-than-not” of being sustained by the applicable tax authority. Tax positions not deemed to meet the more-likely-than-not threshold would be recorded as a tax benefit or expense in the current year.
Adoption of FIN 48 is effective during the first required financial reporting period for fiscal years beginning after December 15, 2006. Management adopted FIN 48 on June 29, 2007.
Implementation of FIN 48 requires Management of the Fund to analyze all open tax years, as defined by the Statute of Limitations, for all major jurisdictions, which includes federal and certain states. Open tax years are those that are open for exam by taxing authorities (i.e., the last 4 tax year ends and the interim tax period since then). The Fund has no examinations in progress and none are expected at this time.
Management of the Fund has reviewed all open tax years and major jurisdictions and concluded the adoption of FIN 48 resulted in no impact to the Fund’s net assets or results of operations. There is no tax liability resulting from unrecognized tax benefits relating to uncertain income tax positions taken or expected to be taken in future tax returns. The Fund is also not aware of any tax positions for which it is reasonably possible that the total amounts of unrecognized tax benefits will significantly change in the next 12 months.
In September 2006, FASB issued its new Standard No. 157, “Fair Value Measurements” (“FAS 157”). FAS 157 is designed to unify guidance for the measurement of fair value of all types of assets, including financial instruments, and certain liabilities, throughout a number of accounting standards. FAS 157 also establishes a hierarchy for measuring fair value in generally accepted accounting principles and expands financial statement disclosures about fair value measurements that are relevant to mutual funds. FAS 157 is effective for financial statements issued for fiscal years beginning after November 15, 2007, and earlier application is permitted.
As of December 31, 2007, Management does not expect the adoption of FAS 157 to impact the amounts reported in the financial statements, however, additional disclosures will be required about the inputs used to develop the measurements of fair value and the effect of certain of the measurements reported in the statement of operations for a fiscal period.
NOTE 7. SUBSEQUENT EVENT
Effective January 1, 2008, TFAI changed its name to Transamerica Asset Management, Inc.
Effective May 1, 2008, AEGON/Transamerica Series Trust will change its name to Transamerica Series Trust. At that time, the Fund will also change its name to Transamerica Asset Allocation - Moderate VP.
10
Report of Independent Registered Certified Public Accounting Firm
To the Board of Trustees and Shareholders of
Asset Allocation - Moderate Portfolio:
In our opinion, the accompanying statement of assets and liabilities, including the schedule of investments, and the related statements of operations and of changes in net assets and the financial highlights present fairly, in all material respects, the financial position of Asset Allocation - Moderate Portfolio (the “Fund”) (one of the portfolios constituting AEGON/Transamerica Series Trust) at December 31, 2007, the results of its operations for the year then ended, the changes in its net assets for each of the two years in the period then ended and the financial highlights for each of the periods presented, in conformity with accounting principles generally accepted in the United States of America. These financial statements and financial highlights (hereafter referred to as “financial statements”) are the responsibility of the Fund’s management; our responsibility is to express an opinion on these financial statements based on our audits. We conducted our audits of these financial statements in accordance with the standards of the Public Company Accounting Oversight Board (United States). Those standards require that we plan and perform the audit to obtain reasonable assurance about whether the financial statements are free of material misstatement. An audit includes examining, on a test basis, evidence supporting the amounts and disclosures in the financial statements, assessing the accounting principles used and significant estimates made by management, and evaluating the overall financial statement presentation. We believe that our audits, which included confirmation of securities at December 31, 2007 by correspondence with the transfer agent, provide a reasonable basis for our opinion.

Tampa, Florida
February 29, 2008
11
Asset Allocation - Moderate Portfolio
SUPPLEMENTAL TAX INFORMATION (unaudited)
(all amounts in thousands)
For tax purposes, the Fund has made a Long-Term Capital Gain Designation of $74,054 for the year ended December 31, 2007.
RESULTS OF SHAREHOLDER PROXY (unaudited)
At a special meeting of shareholders held on October 30, 2007, the results of the Proposals were as follows:
Proposal 1: To elect a new Board:
Proposed | | | | | | Abstentions/Broker Non- | |
Trustee | | For | | Against | | Votes | |
John K. Carter | | 2,274,998,840.817 | | 57,804,698.755 | | 35,433.883 | |
| | | | | | | |
Leo J. Hill | | 2,277,212,702.754 | | 55,590,836.819 | | 35,433.883 | |
| | | | | | | |
Neal M. Jewell | | 2,266,793,295.663 | | 66,010,243.909 | | 35,433.883 | |
| | | | | | | |
Russell A. Kimball, Jr. | | 2,274,825,235.835 | | 57,978,303.737 | | 35,433.883 | |
| | | | | | | |
Eugene M. Mannella | | 2,274,623,165.033 | | 58,180,374.539 | | 35,433.883 | |
| | | | | | | |
Norm R. Nielsen | | 2,275,050,055.885 | | 57,753,483.687 | | 35,433.883 | |
| | | | | | | |
Joyce Galpern Norden | | 2,270,278,122.250 | | 62,525,417.323 | | 35,433.883 | |
| | | | | | | |
Patricia L. Sawyer | | 2,275,737,737.456 | | 57,065,802.116 | | 35,433.883 | |
| | | | | | | |
John W. Waechter | | 2,276,615,120.140 | | 56,188,419.433 | | 35,433.883 | |
Proposal 2: To approve an amendment to the Agreement and Declaration of Trust:
| | | | Abstentions/Broker Non- | |
For | | Against | | Votes | |
2,182,022,669.110 | | 77,590,048.544 | | 73,226,255.801 | |
12
Asset Allocation - Moderate Portfolio
INVESTMENT ADVISORY AND SUB-ADVISORY AGREEMENTS-REVIEW AND RENEWAL (unaudited)
At a meeting of the Board of Trustees of AEGON/Transamerica Series Trust (“ATST”) held on December 4th, 2007, the Board reviewed and considered the renewal of the investment advisory agreement (the “Investment Advisory Agreement”) between Asset Allocation - Moderate Portfolio (the “Fund”) and Transamerica Fund Advisors, Inc. (“TFAI”), as well as the renewal of the investment sub-advisory agreement (the “Sub-Advisory Agreement”) of the Fund between TFAI and Morningstar Associates, LLC (the “Sub-Adviser”), to determine whether the agreements should be renewed for a six-month period. It was noted that this review was interim in nature to align all the Funds on the same calendar, and that the Funds’ advisory arrangements would be reviewed again in the first half of 2008.
Following their review and consideration, the Trustees determined that the renewal of the Investment Advisory Agreement and the Sub-Advisory Agreement would enable shareholders of the Fund to obtain high quality services at a cost that is appropriate, fair, and in the best interests of its shareholders. The Board, including the independent members of the Board, unanimously approved the renewal of the Investment Advisory Agreement and Sub-Advisory Agreement. In reaching their decision, the Trustees requested and obtained from TFAI and the Sub-Adviser such information as they deemed reasonably necessary to evaluate the agreements, including information about fees and performance of comparable funds managed by the Sub-Adviser. The Trustees also carefully considered information they had previously received from TFAI and the Sub-Adviser throughout the year as part of their regular oversight of the Fund, as well as comparative fee, expense, and performance information prepared by Lipper Inc. (“Lipper”), an independent provider of mutual fund performance, fee and expense information and profitability data prepared by management. In considering the proposed continuation of the Investment Advisory and Sub-Advisory Agreements, the Trustees evaluated a number of considerations that they believed, in light of the legal advice furnished to them by independent legal counsel and their own business judgment, to be relevant. They based their decisions on a variety of factors, including the following considerations, among others, although they did not identify any consideration or particular information that was controlling of their decisions:
The nature, extent and quality of the advisory services to be provided. The Board considered the nature and quality of the services provided by TFAI and the Sub-Adviser to the Fund in the past, as well as the services anticipated to be provided in the future. The Board concluded that TFAI and the Sub-Adviser are capable of providing high quality services to the Fund, as indicated by the nature and quality of services provided in the past by TFAI and the Sub-Adviser for this series and the experience, capability and integrity of TFAI’s senior management, the financial resources of TFAI and the Sub-Adviser, TFAI’s management oversight process and the professional qualifications of the portfolio management team of the Sub-Adviser. The Trustees determined that TFAI and the Sub-Adviser can provide investment and related services that are appropriate in scope and extent in light of the Fund’s operations, the competitive landscape of the investment company business and investor needs.
The investment performance of the Fund. The Board examined the short and longer-term performance of the Fund, including relative performance against a peer universe of comparable mutual funds as prepared by Lipper for various trailing periods ended June 30, 2007. The Trustees observed that the Fund’s performance for the past 1-year period has been below the median for its peer universe, but noted that the performance of the Fund has been strong compared to its peer universe for the past 3- and 5-year periods. The Board considered that the recent underperformance generally can be attributed to the Fund’s higher bond exposure which can cause performance to lag in strong equity markets. On the basis of the Board’s assessment of the nature, extent and quality of advisory services to be provided or procured by TFAI and the Sub-Adviser, the Board concluded that TFAI and the Sub-Adviser are capable of providing a level of investment performance that is appropriate in light of the Fund’s proposed investment objectives, policies and strategies and competitive with other similarly situated investment companies, but that the Board would be monitoring performance closely.
The cost of advisory services provided and the level of profitability. The Board reviewed profitability information of TFAI’s cost of procuring fund management services, as well as the costs of provision of administration, fund accounting and other services, to the Fund and to ATST as a whole by TFAI and its affiliates. The Board reviewed the management and sub-advisory fees for the Fund. The Trustees noted that the Fund’s contractual management fees were below the medians for its peer group and peer universe and that the total expenses of the Fund were in line with the medians for its peer group and peer universe. Based on their review, the Trustees determined that the management fees of the Fund generally are appropriate in light of the services expected to be provided or procured, the management fees and the anticipated profitability of the relationship between the Fund, TFAI and its affiliates, and the Sub-Adviser. In making these observations and determinations, the Board reviewed, among other things, comparative information provided by Lipper.
Whether fee levels reflect economies of scale and the extent to which economies of scale would be realized as the Fund grows.
In evaluating the extent to which the management fees payable under the Investment Advisory and Sub-Advisory Agreements reflect economies of scale or will permit economies of scale to be realized in the future, the Board considered the specific reasons for the absence of breakpoints, and concluded that the absence of breakpoints was acceptable under the circumstances. The Trustees also concluded that they will have the opportunity to periodically reexamine whether the Fund has achieved economies of scale, and the appropriateness of management fees payable to TFAI and fees paid to the Sub-Adviser, in the future.
Benefits (such as soft dollars) to TFAI, its affiliates, or the Sub-Adviser from their relationship with the Fund. The Board concluded that other benefits anticipated to be derived by TFAI, its affiliates, and the Sub-Adviser from their relationships with the Fund are expected to be reasonable and fair, and consistent with industry practice and the best interests of the Fund and its shareholders. The Trustees noted that TFAI would not realize soft dollar benefits from its relationship with the Fund.
13
Other considerations. The Board determined that TFAI has made a substantial commitment to the recruitment and retention of high quality personnel, and maintains the financial, compliance and operational resources reasonably necessary to manage the Fund in a professional manner that is consistent with the best interests of the Fund and its shareholders. In this regard, the Trustees favorably considered the procedures and policies in place by TFAI to enforce compliance with applicable laws and regulations and oversee the portfolio management activities of the Sub-Adviser. The Trustees also determined that TFAI has made a significant entrepreneurial commitment to the management and success of the Fund, reflected by TFAI’s expense limitation and fee waiver arrangements with the Fund which may result in TFAI waiving a substantial amount of management fees for the benefit of shareholders.
14
Asset Allocation - Moderate Growth Portfolio
MARKET ENVIRONMENT
The stock and bond markets rose for the twelve-month period through December 31, 2007, but suffered plenty of volatility along the way. The Standard and Poor’s 500 Composite Stock Index returned 5.49%, while the broad Dow Jones Wilshire 5000 Total Market Index (“DJ Wilshire 5000”) gained 5.74%. These modest gains were punctuated by setbacks, however. In the summer, gathering concern about the U.S. mortgage and housing markets reached alarm levels. The mortgage industry’s loose lending standards of recent years came back to haunt lenders, investors, and borrowers alike. Lenders responded by tightening credit standards, many borrowers could no longer qualify for loans, and home sales and refinancings slowed. These problems worsened in the year’s last two months as financial institutions announced write-downs of mortgage-related holdings. After tumbling in the summer, stocks of financial companies again pulled the broad indices down in November and December.
By midyear investors were favoring the relative safety of larger stocks. As they migrated toward large caps while also steering away from financials and other value stocks, they boosted large-cap growth stocks in sectors such as technology. Large growth companies were also rewarded for being big exporters, an advantage with the weak U.S. dollar. For the year, large caps outpaced small caps, and growth stocks significantly outperformed value stocks across all market-cap ranges.
Foreign equity returns surpassed the U.S. indices. The Morgan Stanley Capital International EAFE Index (“MSCI EAFE”) rose 11.63% (gross) for the period, mainly because major foreign currencies strengthened against the dollar (the index gained only 3.54% (net) in local-currency terms). Emerging markets were especially strong as high commodity prices bolstered the developing nations that export them. The Morgan Stanley Capital International Emerging Markets Index soared 39.78% (gross) for the year.
Bond returns improved throughout the year as nervous investors sought safety from the shaky stock market. The Federal Reserve Board’s three rate cuts from September through December also helped bond prices. The Lehman Brothers Aggregate Bond Index (“LBAB”) finished the year with a 6.97% return, with U.S. government bonds leading the gains. High-yield bonds weakened as credit conditions worsened, but posted modestly positive returns thanks to strength earlier in the year.
PERFORMANCE
For the year ended December 31, 2007, Asset Allocation – Moderate Growth Portfolio, Initial Class returned 7.81%. By comparison its primary and secondary benchmarks, the DJ Wilshire 5000 and the LBAB, returned 5.74% and 6.97%, respectively.
STRATEGY REVIEW
This fund-of-funds portfolio is structured to provide an approximately 70%/25%/5% mix of stocks, bonds, and cash. Its equity exposure provides broad coverage of domestic and international equity markets, across market capitalizations and investment styles. It also includes emerging markets, global real estate, and absolute-return strategies. The fixed-income portion is similarly well diversified, covering investment-grade and credit-sensitive holdings as well as international bonds.
The best-performing underlying fund was Transamerica Science & Technology, thanks to surging tech stocks. TA IDEX Oppenheimer Developing Markets performed almost as well, as many emerging markets soared. The portfolio’s growth funds within the mid- and large-cap tiers (international included) clearly benefited from the strength of growth stocks. Most of those funds notched double-digit gains and also ranked well relative to their categories. Among the value funds, two of the five large-cap funds were weighed down by the financials sector, but in the small-cap area Transamerica Small/Mid Cap Value dodged the Russell 2000 Value Index’s 9.78% loss by posting a significant gain on the back of shipping and energy stocks. The other small-cap focused value fund, TA IDEX Oppenheimer Small- & Mid-Cap Value, also impressed with a positive return. The international position’s emerging-markets exposure (targeted at 20% of the international stake, mostly via the aforementioned Oppenheimer fund) was certainly a boost to returns. But TA IDEX Marsico International Growth also posted strong results, and TA IDEX Evergreen International Small Cap beat the MSCI EAFE even though the year favored large caps. The portfolio’s three largest bond funds all surpassed the LBAB and ranked well within their categories.
In early 2007 we conducted a broad rebalancing, mainly to better balance the portfolio’s equity exposure and diversify its bond position. We believe the portfolio’s good 2007 return, demonstrate the effectiveness of maintaining disciplined and balanced market coverage while emphasizing strong managers in each style.
In January 2007, TA IDEX Loomis Sayles Bond was added to the menu of underlying funds available for use in this portfolio, and it was added to the portfolio’s holdings that same month.
Michael Stout, CFA
Jon Hale, Ph.D., CFA
Jeff McConnell, CFA
Maciej Kowara, Ph.D., CFA
Co-Portfolio Managers
Morningstar Associates, LLC
AEGON/Transamerica Series Trust | Annual Report 2007 |
1
Asset Allocation - Moderate Growth Portfolio
(unaudited)
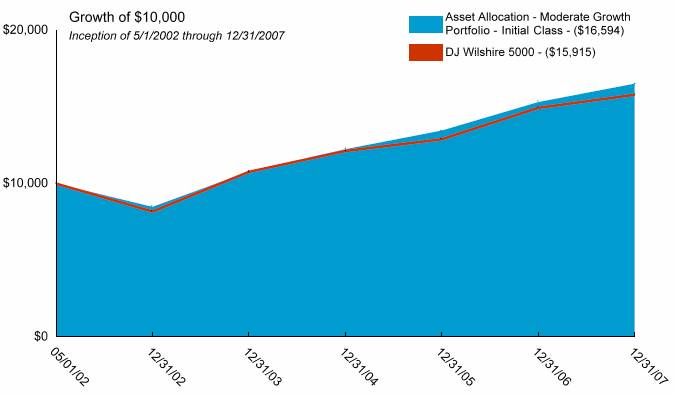
Average Annual Total Return for Periods Ended 12/31/2007
| | | | | | From | | Inception | |
| | 1 Year | | 5 Years | | Inception | | Date | |
| | | | | | | | | |
Initial Class | | 7.81 | % | 14.26 | % | 9.34 | % | 5/1/02 | |
DJ Wilshire 5000(1) | | 5.74 | % | 14.07 | % | 8.54 | % | 5/1/02 | |
Lehman Brothers Aggregate Bond Index(1) | | 6.97 | % | 4.42 | % | 5.32 | % | 5/1/02 | |
| | | | | | | | | |
Service Class | | 7.56 | % | — | % | 14.09 | % | 5/1/03 | |
NOTES
(1) The Dow Jones Wilshire 5000 Total Market (DJ Wilshire 5000) Index and the Lehman Brothers Aggregate Bond (LBAB) Index are unmanaged indices used as a general measure of market performance. Calculations assume dividends and capital gains are reinvested and do not include any managerial expenses. From inception, calculation is based on life of Initial Class shares.
The performance data presented represents past performance; future results may vary. The portfolio’s investment return and net asset value will fluctuate. Past performance does not guarantee future results. Investor’s units when redeemed may be worth more or less than their original cost.
Current performance may be lower or higher than performance quoted. Please visit your insurance company’s website for contract or policy level standardized total returns current to the most recent month end. Portfolio performance is net of investment fees and fund expenses, but not product charges, which, if included, would significantly lower the performance quoted.
This material must be preceded or accompanied by a current prospectus, which includes specific contents regarding the investment objectives, explanation of share classes and policies of this portfolio.
2
Asset Allocation - Moderate Growth Portfolio
UNDERSTANDING YOUR FUND’S EXPENSES
(unaudited)
SHAREHOLDER EXPENSES
Fund shareholders may incur ongoing costs, including management and advisory fees, distribution and service fees, and other fund expenses.
The following Example is intended to help you understand your ongoing costs (in dollars and cents) of investing in the Fund and to compare these costs with the ongoing costs of investing in other funds.
The Example is based on an investment of $1,000 invested at July 1, 2007 and held for the entire period until December 31, 2007.
ACTUAL EXPENSES
The first line in the table below provides information about actual account values and actual expenses. You may use the information in this line, together with the amount you invested, to estimate the expenses that you paid over the period. Simply divide your account value by $1,000 (for example, an $8,600 account value divided by $1,000 = 8.6), then multiply the result by the number in the first line of your Fund under the heading entitled “Expenses Paid During Period” to estimate the expenses you paid on your account during this period.
HYPOTHETICAL EXAMPLE FOR COMPARISON PURPOSES
The second line in the table below provides information about hypothetical account values and hypothetical expenses based on the Fund’s actual expense ratio and an assumed rate of return of 5% per year before expenses, which is not the Fund’s actual return. The hypothetical account values and expenses may not be used to estimate the actual ending account balance or expenses you paid for the period. You may use this information to compare the ongoing costs of investing in your Fund and other funds. To do so, compare this 5% hypothetical example with the 5% hypothetical examples that appear in the shareholder reports of the other funds.
Please note that the expenses shown in the table are meant to highlight your ongoing costs only and do not reflect any transactional costs, such as sales charges, redemption fees, brokerage commissions paid on purchases and sales of fund shares. Therefore, the second line under the Fund in the table is useful in comparing ongoing costs only, and will not help you determine the relative total costs of owning different funds. If any of these transaction costs were included, your costs would be higher. The expenses shown in the table do not reflect any fees that may be charged to you by brokers, financial intermediaries or other financial institutions.
The expenses shown in the table do not reflect any expenses from the Funds investment in other affiliated investment companies. The average weighted annualized expense ratio of the underlying investment companies at December 31, 2007, was 0.84%.
| | Beginning | | Ending | | Annualized | | Expenses | |
| | Account | | Account | | Expense | | Paid During | |
| | Value | | Value | | Ratio | | Period (a) | |
| | | | | | | | | |
Initial Class | | | | | | | | | |
Actual | | $ | 1,000.00 | | $ | 1,015.91 | | 0.13 | % | $ | 0.66 | |
Hypothetical (b) | | 1,000.00 | | 1,024.55 | | 0.13 | | 0.66 | |
| | | | | | | | | |
Service Class | | | | | | | | | |
Actual | | | | | | | | | |
Hypothetical (b) | | 1,000.00 | | 1,014.59 | | 0.38 | | 1.93 | |
| | 1,000.00 | | 1,023.29 | | 0.38 | | 1.94 | |
| | | | | | | | | | | | |
(a) | Expenses are calculated using the Fund’s annualized expense ratio (as disclosed in the table), multiplied by the average account value for the period, multiplied by the number of days in the period (184 days), and divided by the number of days in the year (365 days). |
| |
(b) | 5% return per year before expenses. |
GRAPHICAL PRESENTATION OF SCHEDULE OF INVESTMENTS
By Asset Type
At December 31, 2007
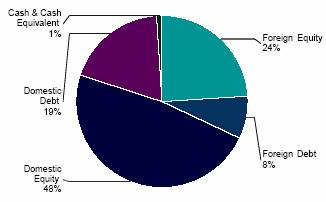
This chart shows the percentage breakdown by asset type of the aggregate portfolio holdings of the underlying affiliated investment companies in which the Fund invests. The security lending collateral in the underlying funds is excluded from this calculation.
3
Asset Allocation - Moderate Growth Portfolio
SCHEDULE OF INVESTMENTS
At December 31, 2007
(all amounts except share amounts in thousands)
| | Shares | | Value | |
INVESTMENT COMPANIES (100.0%) | | | | | |
Bond (19.7%) | | | | | |
MFS High Yield (1) | | 7,907,649 | | $ | 69,113 | |
PIMCO Total Return (1) | | 28,627,556 | | 333,511 | |
TA IDEX JPMorgan International Bond (2) | | 15,903,917 | | 174,466 | |
TA IDEX Transamerica Flexible Income (2) | | 10,086,664 | | 91,083 | |
TA IDEX Transamerica High-Yield Bond (2) | | 4,048,118 | | 36,028 | |
TA IDEX Transamerica Short-Term Bond (2) | | 13,464,693 | | 131,550 | |
TA IDEX Van Kampen Emerging Markets Debt (2) | | 7,860,539 | | 82,614 | |
Transamerica Convertible Securities (1) | | 5,942,720 | | 74,165 | |
Capital Preservation (0.6%) | | | | | |
Transamerica Money Market (1) | | 29,549,961 | | 29,550 | |
Global/International Stock (11.8%) | | | | | |
TA IDEX AllianceBernstein International Value (2) | | 8,011,910 | | 101,591 | |
TA IDEX Evergreen International Small Cap (2) | | 8,998,900 | | 137,593 | |
TA IDEX Marsico International Growth (2) | | 9,387,892 | | 127,863 | |
TA IDEX Neuberger Berman International (2) | | 7,629,230 | | 85,600 | |
TA IDEX Oppenheimer Developing Markets (2) | | 9,421,970 | | 139,540 | |
Inflation-Protected Securities (3.3%) | | | | | |
TA IDEX PIMCO Real Return TIPS (2) | | 15,963,239 | | 165,698 | |
Tactical and Specialty (12.1%) | | | | | |
Clarion Global Real Estate Securities (1) | | 8,984,277 | | 176,451 | |
TA IDEX BlackRock Global Allocation (2) | | 14,631,810 | | 178,216 | |
TA IDEX Evergreen Health Care (2) | | 8,916,367 | | 113,149 | |
TA IDEX Loomis Sayles Bond (2) | | 14,219,833 | | 142,767 | |
U.S. Stock (52.5%) | | | | | |
American Century Large Company Value (1) | | 18,819,404 | | 209,084 | |
BlackRock Large Cap Value (1) | | 15,308,741 | | 293,315 | |
Capital Guardian Value (1) | | 15,940,518 | | 292,349 | |
Federated Market Opportunity (1) | | 860,239 | | 12,611 | |
Jennison Growth (1) | | 8,222,143 | | 67,833 | |
JPMorgan Mid Cap Value (1) | | 11,575,730 | | 182,781 | |
Marsico Growth (1) | | 25,195,831 | | 326,538 | |
Munder Net50 (1) | | 2,738,188 | | 32,256 | |
T. Rowe Price Equity Income (1) | | 48,081 | | 917 | |
T. Rowe Price Growth Stock (1) | | 4,703,725 | | 120,603 | |
TA IDEX Bjurman, Barry Micro Emerging Growth (2) | | 1,836,343 | | 20,787 | |
TA IDEX Oppenheimer Small- & Mid- Cap Value (2) | | 5,539,075 | | 63,699 | |
TA IDEX Third Avenue Value (2) | | 9,326,049 | | 242,944 | |
TA IDEX UBS Large Cap Value (2) | | 17,195,592 | | 215,117 | |
TA IDEX Van Kampen Mid-Cap Growth (2) | | 270,991 | | 3,355 | |
TA IDEX Van Kampen Small Company Growth (2) | | 4,594,227 | | 53,339 | |
Transamerica Equity (1) | | 10,356,600 | | 299,306 | |
Transamerica Growth Opportunities( 1) | | 6,319,876 | | 114,895 | |
Transamerica Science & Technology (1) ~ | | 11,344,478 | | 60,693 | |
Transamerica Small/Mid Cap Value (1) | | 1,148,544 | | 25,383 | |
| | | | | |
Total Investment Companies (cost $4,708,537) # | | | | $ | 5,028,353 | |
NOTES TO SCHEDULE OF INVESTMENTS:
(1) The Fund invests its assets in the Initial Class shares of the affiliated AEGON/Transamerica Series Trust.
(2) The Fund invests its assets in the Class I shares of the affiliated Transamerica IDEX Mutual Funds.
# Aggregate cost for federal income tax purposes is $4,708,861. Aggregate gross unrealized appreciation for all securities in which there is an excess of value over tax cost and aggregate gross unrealized depreciation for all securities in which there is an excess of tax cost over value were $385,240 and $65,748, respectively. Net unrealized appreciation for tax purposes is $319,492.
~ Non-income producing.
The notes to the financial statements are an integral part of this report.
4
Asset Allocation - Moderate Growth Portfolio
STATEMENT OF ASSETS AND LIABILITIES
At December 31, 2007
(all amounts except per share amounts in thousands)
Assets: | | | |
Investment in affiliated investment companies at value (cost: $4,708,537) | | $ | 5,028,353 | |
Receivables: | | | |
Shares sold | | 3,595 | |
| | 5,031,948 | |
Liabilities: | | | |
Investment securities purchased | | 2,109 | |
Accounts payable and accrued liabilities: | | | |
Shares redeemed | | 1,401 | |
Management and advisory fees | | 427 | |
Distribution and service fees | | 589 | |
Administration fees | | 53 | |
Trustees fees | | 158 | |
Other | | 177 | |
| | 4,914 | |
Net Assets | | $ | 5,027,034 | |
| | | |
Net Assets Consist of: | | | |
Capital Stock ($.01 par value) | | $ | 3,587 | |
Additional paid-in capital | | 4,143,813 | |
Undistributed (accumulated) net investment income | | 121,839 | |
Undistributed (accumulated) net realized gain from investment in affiliated investment companies | | 437,979 | |
Net unrealized appreciation on investment in affiliated investment companies | | 319,816 | |
Net Assets | | $ | 5,027,034 | |
Net Assets by Class: | | | |
Initial Class | | $ | 2,229,744 | |
Service Class | | 2,797,290 | |
Shares Outstanding: | | | |
Initial Class | | 158,462 | |
Service Class | | 200,227 | |
Net Asset Value and Offering Price Per Share: | | | |
Initial Class | | $ | 14.07 | |
Service Class | | 13.97 | |
STATEMENT OF OPERATIONS
For the year ended December 31, 2007
(all amounts in thousands)
Investment Income: | | | |
Dividends from affiliated investment companies | | $ | 133,512 | |
| | 133,512 | |
| | | |
Expenses: | | | |
Management and advisory fees | | 4,624 | |
Printing and shareholder reports | | 118 | |
Custody fees | | 131 | |
Administration fees | | 578 | |
Legal fees | | 93 | |
Audit fees | | 21 | |
Trustees fees | | 155 | |
Registration fees | | 56 | |
Distribution and service fees: | | | |
Service Class | | 5,836 | |
Other | | 61 | |
Total expenses | | 11,673 | |
| | | |
Net Investment Income | | 121,839 | |
| | | |
Net Realized Gain (Loss) from: | | | |
Investment in affiliated investment companies | | 270,819 | |
Distributions from investment in affiliated investment companies | | 167,710 | |
| | 438,529 | |
| | | |
Net Increase (Decrease) in Unrealized Appreciation (Depreciation) on: | | | |
Investment in affiliated investment companies | | (235,990 | ) |
Net Realized and Unrealized Gain on Affiliated Investment Companies: | | 202,539 | |
Net Increase In Net Assets Resulting from Operations | | $ | 324,378 | |
The notes to the financial statements are an integral part of this report.
5
Asset Allocation - Moderate Growth Portfolio
STATEMENT OF CHANGES IN NET ASSETS
For the years ended
(all amounts in thousands)
| | December 31, | | December 31, | |
| | 2007 | | 2006 | |
Increase (Decrease) in Net Assets From: | | | | | |
Operations: | | | | | |
Net investment income | | $ | 121,839 | | $ | 107,618 | |
Net realized gain from investment in affiliated investment companies | | 438,529 | | 114,484 | |
Change in unrealized appreciation (depreciation) on investment in affiliated investment companies | | (235,990 | ) | 220,122 | |
| | 324,378 | | 442,224 | |
Distributions to Shareholders: | | | | | |
From net investment income: | | | | | |
Initial Class | | (52,701 | ) | (32,729 | ) |
Service Class | | (54,917 | ) | (21,416 | ) |
| | (107,618 | ) | (54,145 | ) |
From net realized gains: | | | | | |
Initial Class | | (54,425 | ) | (84,525 | ) |
Service Class | | (60,076 | ) | (58,701 | ) |
| | (114,501 | ) | (143,226 | ) |
Capital Share Transactions: | | | | | |
Proceeds from shares sold: | | | | | |
Initial Class | | 207,340 | | 328,290 | |
Service Class | | 919,712 | | 831,486 | |
| | 1,127,052 | | 1,159,776 | |
Dividends and distributions reinvested: | | | | | |
Initial Class | | 107,126 | | 117,254 | |
Service Class | | 114,993 | | 80,117 | |
| | 222,119 | | 197,371 | |
Cost of shares redeemed: | | | | | |
Initial Class | | (425,729 | ) | (211,964 | ) |
Service Class | | (99,525 | ) | (40,042 | ) |
| | (525,254 | ) | (252,006 | ) |
| | 823,917 | | 1,105,141 | |
Net increase in net assets | | 926,176 | | 1,349,994 | |
| | | | | |
Net Assets: | | | | | |
Beginning of year | | 4,100,858 | | 2,750,864 | |
End of year | | $ | 5,027,034 | | $ | 4,100,858 | |
Undistributed (Accumulated) net investment income | | $ | 121,839 | | $ | 107,618 | |
Share Activity: | | | | | |
Shares issued: | | | | | |
Initial Class | | 14,651 | | 24,761 | |
Service Class | | 65,119 | | 62,937 | |
| | 79,770 | | 87,698 | |
Shares issued-reinvested from distributions: | | | | | |
Initial Class | | 7,906 | | 9,321 | |
Service Class | | 8,537 | | 6,398 | |
| | 16,443 | | 15,719 | |
Shares redeemed: | | | | | |
Initial Class | | (30,060 | ) | (15,970 | ) |
Service Class | | (7,096 | ) | (3,047 | ) |
| | (37,156 | ) | (19,017 | ) |
Net increase (decrease) in shares outstanding: | | | | | |
Initial Class | | (7,503 | ) | 18,112 | |
Service Class | | 66,560 | | 66,288 | |
| | 59,057 | | 84,400 | |
The notes to the financial statements are an integral part of this report.
6
Asset Allocation - Moderate Growth Portfolio
FINANCIAL HIGHLIGHTS
For a share outstanding throughout each period(a)
| | Initial Class | |
| | Year Ended December 31, | |
| | 2007 | | 2006 | | 2005 | | 2004 | | 2003 | |
Net Asset Value | | | | | | | | | | | |
Beginning of period | | $ | 13.72 | | $ | 12.80 | | $ | 12.18 | | $ | 10.82 | | $ | 8.52 | |
Investment Operations | | | | | | | | | | | |
Net investment income (loss) | | 0.37 | | 0.43 | | 0.30 | | 0.13 | | 0.03 | |
Net realized and unrealized gain (loss) | | 0.67 | | 1.27 | | 0.88 | | 1.32 | | 2.28 | |
Total operations | | 1.04 | | 1.70 | | 1.18 | | 1.45 | | 2.31 | |
Distributions | | | | | | | | | | | |
From net investment income | | (0.34 | ) | (0.22 | ) | (0.14 | ) | (0.02 | ) | (0.01 | ) |
From net realized gains | | (0.35 | ) | (0.56 | ) | (0.42 | ) | (0.07 | ) | — | |
Total distributions | | (0.69 | ) | (0.78 | ) | (0.56 | ) | (0.09 | ) | (0.01 | ) |
Net Asset Value | | | | | | | | | | | |
End of period(b) | | $ | 14.07 | | $ | 13.72 | | $ | 12.80 | | $ | 12.18 | | $ | 10.82 | |
| | | | | | | | | | | |
Total Return(c),(d) | | 7.81 | % | 13.83 | % | 9.91 | % | 13.54 | % | 27.17 | % |
Ratio and Supplemental Data | | | | | | | | | | | |
| | | | | | | | | | | |
Net Assets End of Period (000’s) | | $ | 2,229,744 | | $ | 2,277,269 | | $ | 1,892,007 | | $ | 1,560,998 | | $ | 1,166,851 | |
Expenses to average net assets(e),(f) | | 0.13 | % | 0.13 | % | 0.14 | % | 0.14 | % | 0.12 | % |
Net investment income (loss), to average net assets(f),(g) | | 2.63 | % | 3.25 | % | 2.47 | % | 1.15 | % | 0.34 | % |
Portfolio turnover rate(d) | | 24 | % | 2 | % | 23 | % | 30 | % | 13 | % |
For a share outstanding throughout each period(a)
| | Service Class | |
| | Year Ended December 31, | | May 1 to Dec | |
| | 2007 | | 2006 | | 2005 | | 2004 | | 31, 2003 | |
Net Asset Value | | | | | | | | | | | |
Beginning of period | | $ | 13.64 | | $ | 12.75 | | $ | 12.15 | | $ | 10.83 | | $ | 8.87 | |
Investment Operations | | | | | | | | | | | |
Net investment income (loss) | | 0.37 | | 0.42 | | 0.29 | | 0.12 | | 0.01 | |
Net realized and unrealized gain (loss) | | 0.63 | | 1.24 | | 0.86 | | 1.29 | | 1.95 | |
Total operations | | 1.00 | | 1.66 | | 1.15 | | 1.41 | | 1.96 | |
Distributions | | | | | | | | | | | |
From net investment income | | (0.32 | ) | (0.21 | ) | (0.13 | ) | (0.02 | ) | — | |
From net realized gains | | (0.35 | ) | (0.56 | ) | (0.42 | ) | (0.07 | ) | — | |
Total distributions | | (0.67 | ) | (0.77 | ) | (0.55 | ) | (0.09 | ) | — | |
Net Asset Value | | | | | | | | | | | |
End of period(b) | | $ | 13.97 | | $ | 13.64 | | $ | 12.75 | | $ | 12.15 | | $ | 10.83 | |
| | | | | | | | | | | |
Total Return(c),(d) | | 7.56 | % | 13.54 | % | 9.71 | % | 13.16 | % | 22.10 | % |
Ratio and Supplemental Data | | | | | | | | | | | |
| | | | | | | | | | | |
Net Assets End of Period (000’s) | | $ | 2,797,290 | | $ | 1,823,589 | | $ | 858,857 | | $ | 272,625 | | $ | 40,083 | |
Expenses to average net assets(e),(f) | | 0.38 | % | 0.38 | % | 0.39 | % | 0.39 | % | 0.37 | % |
Net investment income (loss), to average net assets(f),(g) | | 2.64 | % | 3.15 | % | 2.40 | % | 1.08 | % | 0.17 | % |
Portfolio turnover rate(d) | | 24 | % | 2 | % | 23 | % | 30 | % | 13 | % |
(a) | Per share information is calculated based on average number of shares outstanding. |
(b) | Asset Allocation - Moderate Growth Portfolio (the “Fund”) share classes commenced operations as follows: |
| Initial Class - May 1, 2002 |
| Service Class - May 1, 2003 |
(c) | Total Return reflects all portfolio expenses and includes reinvestment of dividends and capital gains; it does not reflect the charges and deductions under the policies or annuity contracts. |
(d) | Not annualized. |
(e) | Does not include expenses of the investment companies in which the Fund invests. |
(f) | Annualized. |
(g) | Recognition of net investment income by the Fund is affected by the timing of the declaration of dividends by the underlying investment companies in which the Fund invests. |
The notes to the financial statements are an integral part of this report.
7
Asset Allocation - Moderate Growth Portfolio
NOTES TO FINANCIAL STATEMENTS
At December 31, 2007
(all amounts in thousands)
NOTE 1. ORGANIZATION AND SIGNIFICANT ACCOUNTING POLICIES
AEGON/Transamerica Series Trust (“ATST”) is an open-end management investment company registered under the Investment Company Act of 1940, as amended (the “1940 Act”). ATST serves as a funding vehicle for variable life insurance, variable annuity and group annuity products. Asset Allocation–Moderate Growth Portfolio (the “Fund”) is part of ATST.
In the normal course of business, the Fund enters into contracts that contain a variety of representations that provide general indemnifications. The Fund’s maximum exposure under these arrangements is unknown, as this would involve future claims that may be made against the Fund and/or its affiliates that have not yet occurred. However, based on experience, the Fund expects the risk of loss to be remote.
This report should be read in conjunction with the current Fund prospectus, which contains more complete information about the Fund.
In preparing the Fund’s financial statements in accordance with accounting principles generally accepted in the United States of America (“GAAP”), estimates or assumptions (which could differ from actual results) may be used that affect reported amounts and disclosures. The following is a summary of significant accounting policies followed by the Fund.
Multiple class operations, income and expenses: The Fund currently offers two classes of shares, an Initial Class and a Service Class. Income, non-class specific expenses and realized and unrealized gains and losses, are allocated daily to each class, based upon the value of shares outstanding method as permitted under Rule 18f-3 of the 1940 Act. Each class bears its own specific expenses as well as a portion of general, common expenses.
Security valuations: Investment company securities are valued at the net asset value of the underlying portfolio.
Cash: The Fund may leave cash overnight in its cash account with the custodian, State Street Bank & Trust Company (“State Street”). On July 2, 2007, State Street acquired the parent company of Investors Bank & Trust Company. State Street has been contracted on behalf of the Fund to invest the excess cash into a savings account, which at December 31, 2007 was paying an interest rate of 2.60%.
Security transactions and investment income: Security transactions are recorded on the trade date. Security gains and losses are calculated on the first-in, first-out basis. Dividend income is recorded on the ex-dividend date. Dividends and net realized gain (loss) from investment securities for the Fund are from investments in shares of affiliated investment companies.
Dividend distributions: Dividends and capital gains distributions are typically declared and reinvested annually and are generally paid and reinvested on the business day following the ex-date.
NOTE 2. RELATED PARTY TRANSACTIONS
ATST serves as a funding vehicle for certain affiliated asset allocation portfolios and certain affiliated separate accounts of Western Reserve Life Assurance Co. of Ohio, Transamerica Life Insurance Company, Transamerica Financial Life Insurance Company, Inc., Monumental Life Insurance Company and Transamerica Occidental Life Insurance Company.
Transamerica Fund Advisors, Inc. (“TFAI”) is the Fund’s investment adviser. Transamerica Fund Services, Inc. (“TFS”) is the Fund’s administrator and transfer agent. Prior to May 1, 2007, AFSG Securities Corp. (“AFSG”), was the Fund’s distributor. Transamerica Capital Inc. (“TCI”) is now the Fund’s distributor. TFAI, TFS, AFSG and TCI are affiliates of AEGON NV, a Netherlands corporation.
TFAI has entered into an agreement with Morningstar Associates, LLC (“Morningstar”) to provide investment services to the Fund. TFAI compensates Morningstar as described in the Prospectus.
Transamerica Investment Management, LLC (“TIM”) is an affiliate of the Fund and is a sub-adviser to other funds within ATST.
Certain officers and trustees of the Fund are also officers and/or directors of TFAI, TFS and TCI.
Because the underlying funds have varied expense and fee levels and the Fund may own different proportions of underlying funds at different times, the amount of fees and expenses incurred indirectly by the Fund will vary.
Investment advisory fee: The Fund pays management fees to TFAI based on average daily net assets (“ANA”) at the following rate:
0.10% of ANA
TFAI has contractually agreed to waive its advisory fee and will reimburse the Fund to the extent that operating expenses, excluding 12b-1 fees, exceed the following stated annual limit:
0.25% Expense Limit
If total Fund expenses fall below the annual expense limitation agreement agreed to by the adviser within the succeeding three years, the Fund may be required to pay the adviser a portion or all of the waived advisory fees.
There were no amounts recaptured during the year ended December 31, 2007. There are no amounts available for recapture at December 31, 2007.
8
NOTES TO FINANCIAL STATEMENTS (continued)
At December 31, 2007
(all amounts in thousands)
NOTE 2. – (continued)
Distribution and service fees: ATST entered into a Distribution Agreement with AFSG dated January 1, 1997, as amended. On May 1, 2007, the Distribution Agreement was amended to replace AFSG with TCI as the Fund’s distributor. The Fund has also adopted a distribution plan (“Distribution Plan”) pursuant to Rule 12b-1 under the 1940 Act.
Under the Distribution Plan for the Initial Class shares, TCI, on behalf of the Fund, is authorized to pay various service providers, as direct payment for expenses incurred in connection with distribution of the Fund’s shares, amounts equal to actual expenses associated with distributing the shares.
The Distribution Plan for the Service Class shares requires ATST to pay distribution fees to TCI as compensation for its activities, not as reimbursement for specific expenses. The fee on the Service Class is paid to the insurance companies for providing services and account maintenance for their policyholders who invest in the variable insurance products which invest in the Service Class shares.
The Fund is authorized under the Distribution Plan to pay fees on each class up to the following limits:
Initial Class | | 0.15 | % |
Service Class | | 0.25 | % |
TCI has determined that it will not seek payment by the Fund of the distribution expenses incurred with respect to the Initial Class shares before April 30, 2009. Prior to TCI seeking reimbursement of future expenses, policy and contract owners will be notified in advance. The Fund will pay fees relating to Service Class shares.
Administrative services: The Fund has entered into an agreement with TFS for financial and legal fund administration services. The Fund pays TFS an annual fee of 0.0125% of ANA. The Legal fees on the Statement of Operations are for fees paid to external legal counsel.
Deferred compensation plan: Each eligible independent Fund Trustee may elect participation in a non-qualified deferred compensation plan (“the Plan”). Under the Plan, such Trustees may defer payment of all or a portion of their total fees earned as a Fund Trustee. Each Trustee who is a participant in the Plan may elect that the earnings, losses or gains credited to his or her deferred fee amounts be determined based on a deemed investment in any series of Transamerica IDEX Mutual Funds. The right of a participant to receive a distribution from the Plan of the deferred fees is an unsecured claim against the general assets of all series of Transamerica IDEX Mutual Funds. The pro rata liability to the Fund of all deferred fees in the Plan amounted, as of December 31, 2007, to $241. Amounts deferred under the Deferred Compensation Plan are unfunded against the general assets of ATST.
Retirement plan: Under a retirement plan (the “Emeritus Plan”) available to the Independent Trustees, each Independent Trustee is deemed to have elected to serve as Trustee Emeritus of ATST upon his or her termination of service, other than removal for cause, is entitled to 50% of the trustee’s current retainer for a maximum period of five years determined by his or her years of service as a Trustee.
Such amounts shall be accrued by ATST on a pro rata basis allocable to each series of ATST fund based on the relative assets of the series. If retainers increase in the future, past accruals (and credits) will be adjusted upward so that 50% of the Trustee’s current retainer is accrued and credited at all times. Upon death, disability or termination of service, other than removal for cause, amounts deferred become payable to a Trustee Emeritus (or his/her beneficiary). Upon the commencement of service as Trustee Emeritus, compensation will be paid on a quarterly basis during the time period that the Trustee Emeritus is allowed to serve as such.
Amounts accrued under the Emeritus Plan are unsecured claims against the general assets of ATST. For the year ended December 31, 2007, the amount related to the Emeritus Plan was $132. As of December 31, 2007, the Fund has not made any payments related to the Emeritus Plan.
The Emeritus Plan was terminated effective October 30, 2007. Upon the termination, the Fund shall continue to pay any remaining benefits in accordance with the Plan, but no further compensation shall accrue under the Plan.
NOTE 3. INVESTMENT TRANSACTIONS
The cost of securities purchased and proceeds from securities sold (excluding short-term securities) for the year ended December 31, 2007 were as follows:
Purchases of securities: | | | |
Long-term | | $ | 1,987,809 | |
U.S. Government | | — | |
Proceeds from maturities and sales of securities: | | | |
Long-term | | 1,096,097 | |
U.S. Government | | — | |
| | | | |
NOTE 4. FEDERAL INCOME TAX MATTERS
The Fund has not made any provision for federal income or excise taxes due to its policy to distribute all of its taxable income and capital gains to its shareholders and otherwise qualify as a regulated investment company under Subchapter M of the Internal Revenue Code. Income and capital gain distributions are determined in accordance with income tax regulations, which may differ from GAAP. These differences are primarily due to differing treatment for items including, but not limited to, wash sales.
The tax character of distributions paid may differ from the character of distributions shown in the Statements of Changes in Net Assets due to short-term gains being treated as ordinary income for tax purposes. The tax character of distributions paid during 2006 and 2007 was as follows:
9
NOTES TO FINANCIAL STATEMENTS (continued)
At December 31, 2007
(all amounts in thousands)
NOTE 4. – (continued)
2006 Distributions paid from: | | | |
Ordinary Income | | $ | 54,145 | |
Long-term Capital Gain | | 143,226 | |
| | | |
2007 Distributions paid from: | | | |
Ordinary Income | | 107,668 | |
Long-term Capital Gain | | 114,451 | |
| | | | |
The tax basis components of distributable earnings as of December 31, 2007 are as follows:
Undistributed Ordinary Income | | $ | 124,137 | |
Undistributed Long-term Capital Gain | | $ | 436,005 | |
Capital Loss Carryforward | | $ | — | |
Net Unrealized Appreciation (Depreciation) | | $ | 319,492 | |
NOTE 5. REGULATORY PROCEEDINGS
There continues to be significant federal and state regulatory activity relating to financial services companies, particularly mutual fund companies and their investment advisers. As part of an ongoing investigation regarding potential market timing, recordkeeping and trading compliance issues and matters affecting the Fund’s investment adviser, TFAI, and certain affiliates and former employees of TFAI, the SEC staff has indicated that it is likely to take some action against TFAI and certain of its affiliates at the conclusion of the investigation. The potential timing and the scope of any such action is difficult to predict. Although the impact of any action brought against TFAI and/or its affiliates is difficult to assess at the present time, the Fund currently believes that the likelihood that any such action will have a material adverse impact is remote. It is important to note that the Fund is not aware of any allegation of wrongdoing against it and its Board at the time this annual report is printed. Although it is not anticipated that these developments will have an adverse impact on the Fund, there can be no assurance at this time. TFAI and its affiliates are actively working with the SEC in regard to this matter; however, the exact resolution cannot be determined at this time. TFAI will take such actions that it deems necessary or appropriate to continue providing management services to the Fund and to bring all matters to an appropriate conclusion.
TFAI and/or its affiliates, and not the Fund, will bear the costs regarding these regulatory matters.
NOTE 6. RECENTLY ISSUED ACCOUNTING PRONOUNCEMENTS
In July 2006, the Financial Accounting Standards Board (“FASB”) released FASB Interpretation No. 48 “Accounting for Uncertainty in Income Taxes” (“FIN 48”), an interpretation of FASB Statement No. 109. FIN 48 provides guidance for how uncertain tax positions should be recognized, measured, presented and disclosed in the financial statements. FIN 48 requires the accounting and disclosure of tax positions taken or expected to be taken in the course of preparing the Fund’s tax returns to determine whether the tax positions are “more-likely- than-not” of being sustained by the applicable tax authority. Tax positions not deemed to meet the more-likely-than-not threshold would be recorded as a tax benefit or expense in the current year.
Adoption of FIN 48 is effective during the first required financial reporting period for fiscal years beginning after December 15, 2006. Management adopted FIN 48 on June 29, 2007.
Implementation of FIN 48 requires Management of the Fund to analyze all open tax years, as defined by the Statute of Limitations, for all major jurisdictions, which includes federal and certain states. Open tax years are those that are open for exam by taxing authorities (i.e., the last 4 tax year ends and the interim tax period since then). The Fund has no examinations in progress and none are expected at this time.
Management of the Fund has reviewed all open tax years and major jurisdictions and concluded the adoption of FIN 48 resulted in no impact to the Fund’s net assets or results of operations. There is no tax liability resulting from unrecognized tax benefits relating to uncertain income tax positions taken or expected to be taken in future tax returns. The Fund is also not aware of any tax positions for which it is reasonably possible that the total amounts of unrecognized tax benefits will significantly change in the next 12 months.
In September 2006, FASB issued its new Standard No. 157, “Fair Value Measurements” (“FAS 157”). FAS 157 is designed to unify guidance for the measurement of fair value of all types of assets, including financial instruments, and certain liabilities, throughout a number of accounting standards. FAS 157 also establishes a hierarchy for measuring fair value in generally accepted accounting principles and expands financial statement disclosures about fair value measurements that are relevant to mutual funds. FAS 157 is effective for financial statements issued for fiscal years beginning after November 15, 2007, and earlier application is permitted.
As of December 31, 2007, Management does not expect the adoption of FAS 157 to impact the amounts reported in the financial statements, however, additional disclosures will be required about the inputs used to develop the measurements of fair value and the effect of certain of the measurements reported in the statement of operations for a fiscal period.
NOTE 7. SUBSEQUENT EVENT
Effective January 1, 2008, TFAI changed its name to Transamerica Asset Management, Inc.
Effective May 1, 2008, AEGON/Transamerica Series Trust will change its name to Transamerica Series Trust. At that time, the Fund will also change its name to Transamerica Asset Allocation - Moderate Growth VP.
10
Report of Independent Registered Certified Public Accounting Firm
To the Board of Trustees and Shareholders of
Asset Allocation Moderate Growth Portfolio:
In our opinion, the accompanying statement of assets and liabilities, including the schedule of investments, and the related statements of operations and of changes in net assets and the financial highlights present fairly, in all material respects, the financial position of Asset Allocation Moderate Growth Portfolio (the “Fund”) (one of the portfolios constituting AEGON/Transamerica Series Trust) at December 31, 2007, the results of its operations for the year then ended, the changes in its net assets for each of the two years in the period then ended and the financial highlights for each of the periods presented, in conformity with accounting principles generally accepted in the United States of America. These financial statements and financial highlights (hereafter referred to as “financial statements”) are the responsibility of the Fund’s management; our responsibility is to express an opinion on these financial statements based on our audits. We conducted our audits of these financial statements in accordance with the standards of the Public Company Accounting Oversight Board (United States). Those standards require that we plan and perform the audit to obtain reasonable assurance about whether the financial statements are free of material misstatement. An audit includes examining, on a test basis, evidence supporting the amounts and disclosures in the financial statements, assessing the accounting principles used and significant estimates made by management, and evaluating the overall financial statement presentation. We believe that our audits, which included confirmation of securities at December 31, 2007 by correspondence with the transfer agent, provide a reasonable basis for our opinion.

Tampa, Florida
February 29, 2008
11
Asset Allocation - Moderate Growth Portfolio
SUPPLEMENTAL TAX INFORMATION (unaudited)
(all amounts in thousands)
For tax purposes, the Fund has made a Long-Term Capital Gain Designation of $114,451 for the year ended December 31, 2007.
RESULTS OF SHAREHOLDER PROXY (unaudited)
At a special meeting of shareholders held on October 30, 2007, the results of the Proposals were as follows:
Proposal 1: To elect a new Board:
Proposed | | | | | | Abstentions/Broker Non- |
Trustee | | For | | Against | | Votes |
John K. Carter | | 2,274,998,840.817 | | 57,804,698.755 | | 35,433.883 |
| | | | | | |
Leo J. Hill | | 2,277,212,702.754 | | 55,590,836.819 | | 35,433.883 |
| | | | | | |
Neal M. Jewell | | 2,266,793,295.663 | | 66,010,243.909 | | 35,433.883 |
| | | | | | |
Russell A. Kimball, Jr. | | 2,274,825,235.835 | | 57,978,303.737 | | 35,433.883 |
| | | | | | |
Eugene M. Mannella | | 2,274,623,165.033 | | 58,180,374.539 | | 35,433.883 |
| | | | | | |
Norm R. Nielsen | | 2,275,050,055.885 | | 57,753,483.687 | | 35,433.883 |
| | | | | | |
Joyce Galpern Norden | | 2,270,278,122.250 | | 62,525,417.323 | | 35,433.883 |
| | | | | | |
Patricia L. Sawyer | | 2,275,737,737.456 | | 57,065,802.116 | | 35,433.883 |
| | | | | | |
John W. Waechter | | 2,276,615,120.140 | | 56,188,419.433 | | 35,433.883 |
Proposal 2: To approve an amendment to the Agreement and Declaration of Trust:
| | | | Abstentions/Broker Non- | |
For | | Against | | Votes | |
2,182,022,669.110 | | 77,590,048.544 | | 73,226,255.801 | |
12
Asset Allocation - Moderate Growth Portfolio
INVESTMENT ADVISORY AND SUB-ADVISORY AGREEMENTS-REVIEW AND RENEWAL (unaudited)
At a meeting of the Board of Trustees of AEGON/Transamerica Series Trust (“ATST”) held on December 4th, 2007, the Board reviewed and considered the renewal of the investment advisory agreement (the “Investment Advisory Agreement”) between Asset Allocation - Moderate Growth Portfolio (the “Fund”) and Transamerica Fund Advisors, Inc. (“TFAI”), as well as the renewal of the investment sub-advisory agreement (the “Sub-Advisory Agreement”) of the Fund between TFAI and Morningstar Associates, LLC (the “Sub-Adviser”), to determine whether the agreements should be renewed for a six-month period. It was noted that this review was interim in nature to align all the Funds on the same calendar, and that the Funds’ advisory arrangements would be reviewed again in the first half of 2008.
Following their review and consideration, the Trustees determined that the renewal of the Investment Advisory Agreement and the Sub-Advisory Agreement would enable shareholders of the Fund to obtain high quality services at a cost that is appropriate, fair, and in the best interests of its shareholders. The Board, including the independent members of the Board, unanimously approved the renewal of the Investment Advisory Agreement and Sub-Advisory Agreement. In reaching their decision, the Trustees requested and obtained from TFAI and the Sub-Adviser such information as they deemed reasonably necessary to evaluate the agreements, including information about fees and performance of comparable funds managed by the Sub-Adviser. The Trustees also carefully considered information they had previously received from TFAI and the Sub-Adviser throughout the year as part of their regular oversight of the Fund, as well as comparative fee, expense, and performance information prepared by Lipper Inc. (“Lipper”), an independent provider of mutual fund performance, fee and expense information and profitability data prepared by management. In considering the proposed continuation of the Investment Advisory and Sub-Advisory Agreements, the Trustees evaluated a number of considerations that they believed, in light of the legal advice furnished to them by independent legal counsel and their own business judgment, to be relevant. They based their decisions on a variety of factors, including the following considerations, among others, although they did not identify any consideration or particular information that was controlling of their decisions:
The nature, extent and quality of the advisory services to be provided. The Board considered the nature and quality of the services provided by TFAI and the Sub-Adviser to the Fund in the past, as well as the services anticipated to be provided in the future. The Board concluded that TFAI and the Sub-Adviser are capable of providing high quality services to the Fund, as indicated by the nature and quality of services provided in the past by TFAI and the Sub-Adviser for this series and the experience, capability and integrity of TFAI’s senior management, the financial resources of TFAI and the Sub-Adviser, TFAI’s management oversight process and the professional qualifications of the portfolio management team of the Sub-Adviser. The Trustees determined that TFAI and the Sub-Adviser can provide investment and related services that are appropriate in scope and extent in light of the Fund’s operations, the competitive landscape of the investment company business and investor needs.
The investment performance of the Fund. The Board examined the short and longer-term performance of the Fund, including relative performance against a peer universe of comparable mutual funds as prepared by Lipper for various trailing periods ended June 30, 2007. The Trustees noted that the performance of the Fund was strong compared to its peer universe for the past 3- and 5-year periods, and just below the median for the past 1-year period. The Trustees further noted that the Fund has generated strong returns for the level of risk incurred. On the basis of the Board’s assessment of the nature, extent and quality of advisory services to be provided or procured by TFAI and the Sub-Adviser, the Board concluded that TFAI and the Sub-Adviser are capable of providing a level of investment performance that is appropriate in light of the Fund’s proposed investment objectives, policies and strategies and competitive with other similarly situated investment companies.
The cost of advisory services provided and the level of profitability. The Board reviewed profitability information of TFAI’s cost of procuring fund management services, as well as the costs of provision of administration, fund accounting and other services, to the Fund and to ATST as a whole by TFAI and its affiliates. The Board reviewed the management and sub-advisory fees for the Fund. The Trustees noted that the Fund’s contractual management fees were below the medians for its peer group and peer universe and that the total expenses of the Fund were in line with the medians for its peer group and peer universe. Based on their review, the Trustees determined that the management fees of the Fund generally are appropriate in light of the services expected to be provided or procured, the management fees and the anticipated profitability of the relationship between the Fund, TFAI and its affiliates, and the Sub-Adviser. In making these observations and determinations, the Board reviewed, among other things, comparative information provided by Lipper.
Whether fee levels reflect economies of scale and the extent to which economies of scale would be realized as the Fund grows. In evaluating the extent to which the management fees payable under the Investment Advisory and Sub-Advisory Agreements reflect economies of scale or will permit economies of scale to be realized in the future, the Board considered the specific reasons for the absence of breakpoints, and concluded that the absence of breakpoints was acceptable under the circumstances. The Trustees also concluded that they will have the opportunity to periodically reexamine whether the Fund has achieved economies of scale, and the appropriateness of management fees payable to TFAI and fees paid to the Sub-Adviser, in the future.
Benefits (such as soft dollars) to TFAI, its affiliates, or the Sub-Adviser from their relationship with the Fund. The Board concluded that other benefits anticipated to be derived by TFAI, its affiliates, and the Sub-Adviser from their relationships with the Fund are expected to be reasonable and fair, and consistent with industry practice and the best interests of the Fund and its shareholders. The Trustees noted that TFAI would not realize soft dollar benefits from its relationship with the Fund.
Other considerations. The Board determined that TFAI has made a substantial commitment to the recruitment and retention of high quality personnel, and maintains the financial, compliance and operational resources reasonably necessary to manage the Fund in a professional manner that is consistent with the best interests of the Fund and its shareholders. In this regard, the Trustees favorably considered the procedures and policies in place by TFAI to enforce compliance with applicable laws and regulations and oversee the portfolio management activities of the Sub-Adviser. The Trustees also determined that TFAI has made a significant entrepreneurial commitment to the management and success of the Fund, reflected by TFAI’s expense limitation and fee waiver arrangements with the Fund which may result in TFAI waiving a substantial amount of management fees for the benefit of shareholders.
13
BlackRock Large Cap Value
MARKET ENVIRONMENT
2007 began largely where 2006 left off. A slowdown in U.S. growth occurred following the Federal Reserve Board (“Fed”) tightening, rising oil prices, and the beginning of concerns around credit and a slowing U.S. consumer. Earnings growth remained strong on the back of strong export growth, a declining dollar and share buybacks. A transition in leadership from small, value and domestic to large, growth and multinational became evident as the year began.
But what a difference six months makes! During 2007’s second half, the benign fundamentals of 2003-2006, namely strong global growth, rising profitability levels and falling risk premiums, were replaced by credit stress, pressures on the capital position of the financial system, questions about the sustainability of the business cycle, and rising energy and food prices. Reflecting these woes, market prices moved considerably. Government bond yields plummeted; the dollar fell faster than in earlier years; credit spreads widened; and equities turned trend less and volatile. The financial and consumer discretionary sectors experienced drops of one-quarter to one-third. Commodity and industrial related multinational companies performed best. Emerging market economies and equity markets performed well yet again. The Fed moved from an attitude of vigilance about inflation to one of providing liquidity and lowering rates to shore up the functioning of credit markets and fight economic weakness. With this noticeable shift in the environment from the first to the second half of the year, the burning question is whether or not the fundamental and financial challenges are under-appreciated by investors or do market prices imply an opportunity to look over the valley.
PERFORMANCE
For the year ended December 31, 2007, BlackRock Large Cap Value, Initial Class returned 4.64% By comparison its benchmark, the Russell 1000 Value Index, returned (0.17)%.
STRATEGY REVIEW
For the year ending December 31st the portfolio outperformed its benchmark. Financials, health care, industrials and energy drove the out-performance. Within financials, under-weights in thrifts and mortgage companies and the big diversified financial services companies were the most significant contributors. Stock selection was particularly important, as we were able to avoid many of the firms that ended up suffering significant setbacks related to the mortgage debacle. In health care, our long-standing preference for service providers (such as Well Point, Inc., McKesson Corporation and Medco Health Solutions, Inc.) over product companies has continued to be additive for the portfolio.
Selected US and multi-national companies, especially those with exposure to agriculture and developing economies, have been strong contributors to our performance. Within industrials, Deere & Company and AGCO Corporation have benefited from the agriculture boom brought on by increased demand for corn-based ethanol and from emerging markets that need to feed growing and increasingly prosperous populations.
On the negative side, at a high level our attention to valuation was a negative, especially within utilities and consumer staples. In addition, we were underweight in both of these sectors, which also detracted from performance. While overall, our deep underweight to financials was additive, exposure to Citigroup Inc. (which we trimmed to an underweight by December) was one of the largest detractors. Our valuation discipline hurt us in the period following the August market melt-down, when “growth at any price” proved to be a more successful strategy. That said, however, we stuck to our disciplined approach, believing that buying better-than-market growth opportunities for better-than-market valuations is—in the long term—a recipe for success.
At the end of the period, relative to the benchmark, the portfolio’s largest over-weights are health care, energy and industrials and the portfolio’s largest under-weights are financials, utilities and consumer staples.
Robert C. Doll, Jr., CFA, CPA
Portfolio Manager
BlackRock Investment Management, LLC
AEGON/Transamerica Series Trust | Annual Report 2007 |
1
BlackRock Large Cap Value
(unaudited)
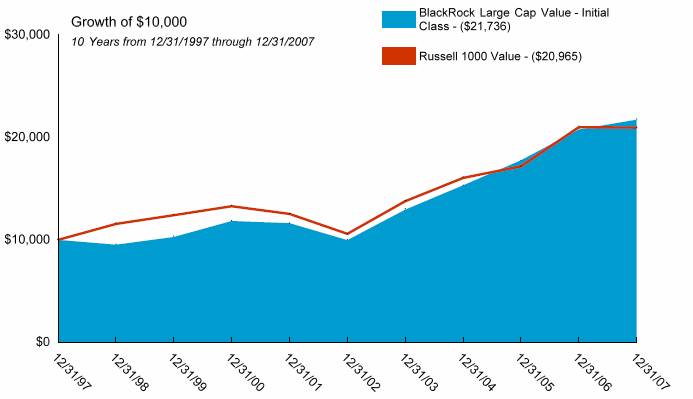
Average Annual Total Return for Periods Ended 12/31/2007
| | | | | | | | From | | Inception | |
| | 1 Year | | 5 Years | | 10 Years | | Inception | | Date | |
| | | | | | | | | | | |
Initial Class | | 4.64 | % | 16.85 | % | 8.07 | % | 10.10 | % | 5/1/96 | |
Russell 1000 Value(1) | | (0.17 | )% | 14.63 | % | 7.68 | % | 10.63 | % | 5/1/96 | |
| | | | | | | | | | | |
Service Class | | 4.35 | % | — | % | — | % | 17.54 | % | 5/1/03 | |
NOTES
(1) The Russell 1000 Value (Russell 1000 Value) Index is an unmanaged index used as a general measure of market performance. Calculations assume dividends and capital gains are reinvested and do not include any managerial expenses. From inception, calculation is based on life of Initial Class shares
The performance data presented represents past performance; future results may vary. The portfolio’s investment return and net asset value will fluctuate. Past performance does not guarantee future results. Investor’s units when redeemed may be worth more or less than their original cost.
Current performance may be lower or higher than performance quoted. Please visit your insurance company’s website for contract or policy level standardized total returns current to the most recent month end. Portfolio performance is net of investment fees and fund expenses, but not product charges, which, if included, would significantly lower the performance quoted.
This material must be preceded or accompanied by a current prospectus, which includes specific contents regarding the investment objectives, explanation of share classes and policies of this portfolio.
2
BlackRock Large Cap Value
UNDERSTANDING YOUR FUND’S EXPENSES
(unaudited)
SHAREHOLDER EXPENSES
Fund shareholders may incur ongoing costs, including management and advisory fees, distribution and service fees, and other fund expenses.
The following Example is intended to help you understand your ongoing costs (in dollars and cents) of investing in the Fund and to compare these costs with the ongoing costs of investing in other funds.
The Example is based on an investment of $1,000 invested at July 1, 2007 and held for the entire period until December 31, 2007.
ACTUAL EXPENSES
The first line in the table below provides information about actual account values and actual expenses. You may use the information in this line, together with the amount you invested, to estimate the expenses that you paid over the period. Simply divide your account value by $1,000 (for example, an $8,600 account value divided by $1,000 = 8.6), then multiply the result by the number in the first line of your Fund under the heading entitled “Expenses Paid During Period” to estimate the expenses you paid on your account during this period.
HYPOTHETICAL EXAMPLE FOR COMPARISON PURPOSES
The second line in the table below provides information about hypothetical account values and hypothetical expenses based on the Fund’s actual expense ratio and an assumed rate of return of 5% per year before expenses, which is not the Fund’s actual return. The hypothetical account values and expenses may not be used to estimate the actual ending account balance or expenses you paid for the period. You may use this information to compare the ongoing costs of investing in your Fund and other funds. To do so, compare this 5% hypothetical example with the 5% hypothetical examples that appear in the shareholder reports of the other funds.
Please note that the expenses shown in the table are meant to highlight your ongoing costs only and do not reflect any transactional costs, such as sales charges, redemption fees, brokerage commissions paid on purchases and sales of fund shares. Therefore, the second line under the Fund in the table is useful in comparing ongoing costs only, and will not help you determine the relative total costs of owning different funds. If any of these transaction costs were included, your costs would be higher. The expenses shown in the table do not reflect any fees that may be charged to you by brokers, financial intermediaries or other financial institutions.
| | Beginning | | Ending | | Annualized | | Expenses | |
| | Account | | Account | | Expense | | Paid During | |
| | Value | | Value | | Ratio | | Period (a) | |
| | | | | | | | | |
Initial Class | | | | | | | | | |
Actual | | $ | 1,000.00 | | $ | 969.46 | | 0.84 | % | $ | 4.17 | |
Hypothetical (b) | | 1,000.00 | | 1,020.97 | | 0.84 | | 4.28 | |
| | | | | | | | | |
Service Class | | | | | | | | | |
Actual | | 1,000.00 | | 968.32 | | 1.09 | | 5.41 | |
Hypothetical (b) | | 1,000.00 | | 1,019.71 | | 1.09 | | 5.55 | |
| | | | | | | | | | | | |
(a) Expenses are calculated using the Fund’s annualized expense ratio (as disclosed in the table), multiplied by the average account value for the period, multiplied by the number of days in the period (184 days), and divided by the number of days in the year (365 days).
(b) 5% return per year before expenses.
GRAPHICAL PRESENTATION OF SCHEDULE OF INVESTMENTS
By Sector
At December 31, 2007
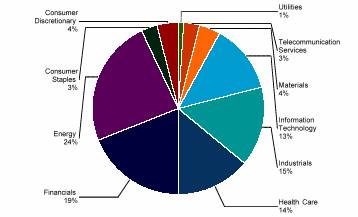
This chart shows the percentage breakdown by sector of the Fund’s total investment securities.
3
BlackRock Large Cap Value
SCHEDULE OF INVESTMENTS
At December 31, 2007
(all amounts except share amounts in thousands)
| | Shares | | Value | |
COMMON STOCKS (99.9%) | | | | | |
Aerospace & Defense (6.0%) | | | | | |
Honeywell International, Inc. | | 162,000 | | $ | 9,975 | |
Lockheed Martin Corp. | | 78,000 | | 8,210 | |
Northrop Grumman Corp. | | 155,000 | | 12,189 | |
Raytheon Co. | | 176,000 | | 10,683 | |
United Technologies Corp. | | 167,000 | | 12,782 | |
Biotechnology (0.9%) | | | | | |
Biogen IDEC, Inc. ‡ | | 144,000 | | 8,197 | |
Capital Markets (1.4%) | | | | | |
Goldman Sachs Group, Inc. (The) | | 58,000 | | 12,473 | |
Chemicals (3.1%) | | | | | |
Dow Chemical Co. (The) | | 220,000 | | 8,673 | |
Eastman Chemical Co. | | 2,000 | | 122 | |
Ei DU Pont de Nemours & Co. | | 198,000 | | 8,730 | |
Mosaic Co. (The) ‡ | | 104,000 | | 9,811 | |
Commercial Services & Supplies (0.4%) | | | | | |
Allied Waste Industries, Inc. ‡ | | 299,000 | | 3,295 | |
Communications Equipment (1.5%) | | | | | |
ADC Telecommunications, Inc. ‡ | | 255,000 | | 3,965 | |
Juniper Networks, Inc. ‡ | | 278,000 | | 9,230 | |
Computers & Peripherals (4.2%) | | | | | |
EMC Corp. ‡ | | 374,000 | | 6,930 | |
Hewlett-Packard Co. | | 186,000 | | 9,389 | |
International Business Machines Corp. | | 123,000 | | 13,296 | |
QLogic Corp. ‡ | | 68,000 | | 966 | |
Sun Microsystems, Inc. ‡ | | 374,000 | | 6,781 | |
Diversified Financial Services (3.9%) | | | | | |
Bank of America Corp. (1) | | 140,000 | | 5,777 | |
Citigroup, Inc. | | 47,000 | | 1,384 | |
JPMorgan Chase & Co. | | 619,000 | | 27,019 | |
Nasdaq Stock Market Inc/The ‡ | | 21,000 | | 1,039 | |
Diversified Telecommunication Services (2.6%) | | | | | |
AT&T, Inc. | | 363,000 | | 15,086 | |
Qwest Communications International, Inc. ‡^ | | 1,202,000 | | 8,426 | |
Electric Utilities (0.1%) | | | | | |
CMS Energy Corp. ^ | | 73,000 | | 1,269 | |
Electrical Equipment (0.2%) | | | | | |
Hubbell, Inc. Class B | | 29,000 | | 1,496 | |
Electronic Equipment & Instruments (1.0%) | | | | | |
Agilent Technologies, Inc. ‡ | | 232,000 | | 8,524 | |
Energy Equipment & Services (1.8%) | | | | | |
Ensco International, Inc. ^ | | 152,000 | | 9,062 | |
Tidewater, Inc. | | 127,000 | | 6,967 | |
Food & Staples Retailing (1.1%) | | | | | |
Kroger Co. (The) | | 364,000 | | 9,722 | |
Food Products (0.8%) | | | | | |
HJ Heinz Co. | | 157,000 | | 7,329 | |
Health Care Providers & Services (6.5%) | | | | | |
Aetna, Inc. | | 165,000 | | 9,526 | |
AmerisourceBergen Corp. Class A | | 190,000 | | 8,525 | |
Humana, Inc. ‡ | | 122,000 | | 9,188 | |
McKesson Corp. | | 145,000 | | $ | 9,499 | |
Medco Health Solutions, Inc. ‡ | | 93,000 | | 9,430 | |
WellPoint, Inc. ‡ | | 140,000 | | 12,282 | |
Hotels, Restaurants & Leisure (1.8%) | | | | | |
McDonald’s Corp. | | 272,000 | | 16,024 | |
Household Products (1.0%) | | | | | |
Colgate-Palmolive Co. | | 119,000 | | 9,277 | |
Independent Power Producers & Energy Traders (1.0%) | | | | | |
NRG Energy, Inc. ‡ | | 214,000 | | 9,275 | |
Industrial Conglomerates (2.8%) | | | | | |
General Electric Co. | | 685,000 | | 25,393 | |
Insurance (13.6%) | | | | | |
ACE, Ltd. | | 194,000 | | 11,985 | |
Aflac, Inc. | | 149,000 | | 9,332 | |
Allstate Corp. (The) | | 124,000 | | 6,477 | |
American International Group, Inc. | | 407,000 | | 23,728 | |
Chubb Corp. | | 219,000 | | 11,953 | |
Hanover Insurance Group, Inc. (The) ‡ | | 10,000 | | 458 | |
Loews Corp. | | 237,000 | | 11,931 | |
MetLife, Inc. ‡ | | 202,000 | | 12,447 | |
Nationwide Financial Services Class A | | 36,000 | | 1,620 | |
Prudential Financial, Inc. | | 11,000 | | 1,023 | |
SAFECO Corp. | | 151,000 | | 8,408 | |
Travelers Cos., Inc. (The) ‡ | | 261,000 | | 14,042 | |
W.R. Berkley Corp. | | 40,000 | | 1,192 | |
XL Capital, Ltd. Class A | | 145,000 | | 7,295 | |
IT Services (0.1%) | | | | | |
Computer Sciences Corp. ‡ | | 2,000 | | 99 | |
Electronic Data Systems Corp. | | 50,000 | | 1,036 | |
Leisure Equipment & Products (0.4%) | | | | | |
Hasbro, Inc. | | 140,000 | | 3,581 | |
Machinery (3.8%) | | | | | |
AGCO Corp. ‡^ | | 80,000 | | 5,438 | |
Deere & Co. | | 156,000 | | 14,527 | |
Ingersoll-Rand Co., Ltd. Class A | | 70,000 | | 3,253 | |
ITT Corp. | | 138,000 | | 9,114 | |
Kennametal, Inc. | | 32,000 | | 1,211 | |
Media (1.5%) | | | | | |
Walt Disney Co. (The) ‡ | | 411,000 | | 13,267 | |
Multiline Retail (0.3%) | | | | | |
Dollar Tree Stores, Inc. ‡ | | 85,000 | | 2,203 | |
Office Electronics (0.3%) | | | | | |
Xerox Corp. | | 158,000 | | 2,558 | |
Oil, Gas & Consumable Fuels (22.6%) | | | | | |
Chevron Corp. | | 375,000 | | 34,999 | |
ConocoPhillips | | 317,000 | | 27,991 | |
Exxon Mobil Corp. | | 667,000 | | 62,491 | |
Frontier Oil Corp. | | 216,000 | | 8,765 | |
Marathon Oil Corp. | | 245,000 | | 14,911 | |
Noble Energy, Inc. | | 129,000 | | 10,258 | |
Occidental Petroleum Corp. | | 224,000 | | 17,246 | |
Sunoco, Inc. | | 114,000 | | 8,258 | |
4
| | Shares | | Value | |
Oil, Gas & Consumable Fuels (continued) | | | | | |
Tesoro Corp. | | 155,000 | | $ | 7,394 | |
Valero Energy Corp. | | 142,000 | | 9,944 | |
Paper & Forest Products (1.1%) | | | | | |
International Paper Co. ^ | | 309,000 | | 10,005 | |
Pharmaceuticals (6.0%) | | | | | |
Eli Lilly & Co. | | 230,000 | | 12,280 | |
Merck & Co., Inc. | | 201,000 | | 11,680 | |
Pfizer, Inc. | | 1,289,000 | | 29,299 | |
Road & Rail (1.2%) | | | | | |
CSX Corp. | | 249,000 | | 10,951 | |
Semiconductors & Semiconductor Equipment (2.6%) | | | | | |
Intersil Corp. Class A ^ | | 283,000 | | 6,928 | |
KLA-Tencor Corp. | | 156,000 | | 7,513 | |
Novellus Systems, Inc. ‡ | | 330,000 | | 9,098 | |
Software (3.2%) | | | | | |
BMC Software, Inc. ‡ | | 247,000 | | 8,803 | |
CA, Inc. | | 132,000 | | 3,293 | |
Compuware Corp. ‡ | | 863,000 | | 7,664 | |
McAfee, Inc. ‡ | | 242,000 | | 9,075 | |
Specialty Retail (0.1%) | | | | | |
Gap, Inc. (The) | | 20,000 | | 426 | |
Trading Companies & Distributors (0.6%) | | | | | |
WW Grainger, Inc. | | 62,000 | | 5,426 | |
Wireless Telecommunication Services (0.4%) | | | | | |
Telephone & Data Systems, Inc. | | 49,000 | | 3,067 | |
Total Common Stocks (cost $776,269) | | | | 893,159 | |
| | | | | |
INVESTMENT COMPANIES (0.3%) | | | | | |
Capital Markets (0.3%) | | | | | |
Merrill Lynch Money Market Mutual Fund 5.33% | | 2,788 | | 2,788 | |
Total Investment Companies (cost $2,788) | | | | 2,788 | |
| | | | | |
Total Securities Lending Collateral (cost $29,650) (1) | | | | 29,650 | |
| | | | | |
Total Investment Securities (cost $808,707) # | | | | $ | 925,597 | |
NOTES TO SCHEDULE OF INVESTMENTS:
^ At December 31, 2007, all or a portion of this security is on loan (see Note 1). The value at December 31, 2007, of all securities on loan is $27,885.
‡ Non-Income Producing.
(1) Cash collateral for the Repurchase Agreements, valued at $10,748, that serves as collateral for securities lending, is invested in corporate bonds with interest rates and maturity dates ranging from 3.00% - 10.18% and 04/28/2008 - 12/01/2096, respectively.
# Aggregate cost for federal income tax purposes is $809,431. Aggregate gross unrealized appreciation for all securities in which there is an excess of value over tax cost and aggregate gross unrealized depreciation for all securities in which there is an excess of tax cost over value were $140,256 and $24,090, respectively. Net unrealized appreciation for tax purposes is $116,166.
The notes to the financial statements are an integral part of this report.
5
BlackRock Large Cap Value
STATEMENT OF ASSETS AND LIABILITIES
At December 31, 2007
(all amounts except per share amounts in thousands)
Assets: | | | |
Investment securities, at value (cost: $808,707)
(including securities loaned of $27,885) | | $ | 925,597 | |
Cash | | 4 | |
Receivables: | | | |
Investment securities sold | | 4,234 | |
Shares sold | | 177 | |
Interest | | 7 | |
Income from loaned securities | | 4 | |
Dividends | | 1,057 | |
| | 931,080 | |
Liabilities: | | | |
Investment securities purchased | | 5,827 | |
Accounts payable and accrued liabilities: | | | |
Shares redeemed | | 344 | |
Management and advisory fees | | 591 | |
Distribution and service fees | | 7 | |
Administration fees | | 15 | |
Payable for collateral for securities on loan | | 29,650 | |
Other | | 141 | |
| | 36,575 | |
Net Assets | | $ | 894,505 | |
| | | |
Net Assets Consist of: | | | |
Capital Stock ($.01 par value) | | $ | 467 | |
Additional paid-in capital | | 657,616 | |
Undistributed (accumulated) net investment income | | 8,792 | |
Undistributed (accumulated) net realized gain from investment securities | | 110,740 | |
Net unrealized appreciation on investment securities | | 116,890 | |
Net Assets | | $ | 894,505 | |
Net Assets by Class: | | | |
Initial Class | | $ | 860,991 | |
Service Class | | 33,514 | |
Shares Outstanding: | | | |
Initial Class | | 44,938 | |
Service Class | | 1,745 | |
Net Asset Value and Offering Price Per Share: | | | |
Initial Class | | $ | 19.16 | |
Service Class | | 19.21 | |
STATEMENT OF OPERATIONS
For the year ended December 31, 2007
(all amounts in thousands)
Investment Income: | | | |
Dividends | | $ | 16,730 | |
Interest | | 53 | |
Income from loaned securities-net | | 69 | |
| | 16,852 | |
| | | |
Expenses: | | | |
Management and advisory fees | | 7,293 | |
Printing and shareholder reports | | 81 | |
Custody fees | | 317 | |
Administration fees | | 188 | |
Legal fees | | 34 | |
Audit fees | | 20 | |
Trustees fees | | 33 | |
Distribution and service fees: | | | |
Service Class | | 78 | |
Other | | 15 | |
Total expenses | | 8,059 | |
| | | |
Net Investment Income | | 8,793 | |
| | | |
Net Realized Gain (Loss) from: | | | |
Investment securities | | 110,970 | |
| | | |
Net Increase (Decrease) in Unrealized Appreciation (Depreciation) on: | | | |
Investment securities | | (75,199 | ) |
| | | |
Net Realized and Unrealized Gain: | | 35,771 | |
Net Increase In Net Assets Resulting from Operations | | $ | 44,564 | |
The notes to the financial statements are an integral part of this report.
6
BlackRock Large Cap Value
STATEMENTS OF CHANGES IN NET ASSETS
For the December 31, 2007
(all amounts in thousands)
| | December 31,
2007 | | December 31,
2006 | |
Increase (Decrease) in Net Assets From: | | | | | |
Operations: | | | | | |
Net investment income | | $ | 8,793 | | $ | 8,492 | |
Net realized gain from investment securities | | 110,970 | | 98,978 | |
Change in unrealized appreciation (depreciation) on investment securities | | (75,199 | ) | 46,201 | |
| | 44,564 | | 153,671 | |
Distributions to Shareholders: | | | | | |
From net investment income: | | | | | |
Initial Class | | (8,239 | ) | (4,917 | ) |
Service Class | | (253 | ) | (87 | ) |
| | (8,492 | ) | (5,004 | ) |
From net realized gains: | | | | | |
Initial Class | | (95,448 | ) | (43,607 | ) |
Service Class | | (3,522 | ) | (953 | ) |
| | (98,970 | ) | (44,560 | ) |
Capital Share Transactions: | | | | | |
Proceeds from shares sold: | | | | | |
Initial Class | | 98,197 | | 118,323 | |
Service Class | | 17,129 | | 14,942 | |
| | 115,326 | | 133,265 | |
Dividends and distributions reinvested: | | | | | |
Initial Class | | 103,687 | | 48,524 | |
Service Class | | 3,775 | | 1,040 | |
| | 107,462 | | 49,564 | |
Cost of shares redeemed: | | | | | |
Initial Class | | (335,255 | ) | (75,276 | ) |
Service Class | | (12,598 | ) | (4,926 | ) |
| | (347,853 | ) | (80,202 | ) |
| | (125,065 | ) | 102,627 | |
Net increase (decrease) in net assets | | (187,963 | ) | 206,734 | |
| | | | | |
Net Assets: | | | | | |
Beginning of year | | 1,082,468 | | 875,734 | |
End of year | | $ | 894,505 | | $ | 1,082,468 | |
Undistributed (Accumulated) Net Investment Income (Loss) | | $ | 8,792 | | $ | 8,491 | |
Share Activity: | | | | | |
Shares issued: | | | | | |
Initial Class | | 4,698 | | 5,991 | |
Service Class | | 815 | | 746 | |
| | 5,513 | | 6,737 | |
Shares issued-reinvested from distributions: | | | | | |
Initial Class | | 5,498 | | 2,532 | |
Service Class | | 199 | | 54 | |
| | 5,697 | | 2,586 | |
Shares redeemed: | | | | | |
Initial Class | | (15,943 | ) | (3,816 | ) |
Service Class | | (615 | ) | (247 | ) |
| | (16,558 | ) | (4,063 | ) |
Net increase (decrease) in shares outstanding: | | | | | |
Initial Class | | (5,747 | ) | 4,707 | |
Service Class | | 399 | | 553 | |
| | (5,348 | ) | 5,260 | |
The notes to the financial statements are an integral part of this report.
7
BlackRock Large Cap Value
FINANCIAL HIGHLIGHTS
For a share outstanding throughout each period(a)
| | Initial Class | |
| | Year Ended December 31, | |
| | 2007 | | 2006 | | 2005 | | 2004 | | 2003 | |
Net Asset Value | | | | | | | | | | | |
Beginning of period | | $ | 20.80 | | $ | 18.72 | | $ | 17.17 | | $ | 14.97 | | $ | 11.63 | |
Investment Operations | | | | | | | | | | | |
Net investment income (loss) | | 0.20 | | 0.17 | | 0.13 | | 0.18 | | 0.17 | |
Net realized and unrealized gain (loss) | | 0.72 | | 2.91 | | 2.54 | | 2.47 | | 3.28 | |
Total operations | | 0.92 | | 3.08 | | 2.67 | | 2.65 | | 3.45 | |
Distributions | | | | | | | | | | | |
From net investment income | | (0.20 | ) | (0.10 | ) | (0.12 | ) | (0.16 | ) | (0.11 | ) |
From net realized gains | | (2.36 | ) | (0.90 | ) | (1.00 | ) | (0.29 | ) | — | |
Total distributions | | (2.56 | ) | (1.00 | ) | (1.12 | ) | (0.45 | ) | (0.11 | ) |
Net Asset Value | | | | | | | | | | | |
End of period(b) | | $ | 19.16 | | $ | 20.80 | | $ | 18.72 | | $ | 17.17 | | $ | 14.97 | |
Total Return(c),(d) | | 4.64 | % | 16.92 | % | 15.94 | % | 18.34 | % | 29.78 | % |
Net Assets End of Period (000’s) | | $ | 860,991 | | $ | 1,054,389 | | $ | 860,826 | | $ | 584,426 | | $ | 383,372 | |
Ratio and Supplemental Data | | | | | | | | | | | |
Expenses to average net assets(e) | | 0.85 | % | 0.83 | % | 0.84 | % | 0.85 | % | 0.84 | % |
Net investment income (loss), to average net assets(e) | | 0.94 | % | 0.86 | % | 0.70 | % | 1.19 | % | 1.33 | % |
Portfolio turnover rate(d) | | 67 | % | 60 | % | 69 | % | 132 | % | 145 | % |
For a share outstanding throughout each period(a)
| | Service Class | |
| | Year Ended December 31, | | May 1 to Dec | |
| | 2007 | | 2006 | | 2005 | | 2004 | | 31, 2003 | |
Net Asset Value | | | | | | | | | | | |
Beginning of period | | $ | 20.87 | | $ | 18.81 | | $ | 17.27 | | $ | 15.06 | | $ | 11.77 | |
Investment Operations | | | | | | | | | | | |
Net investment income (loss) | | 0.14 | | 0.13 | | 0.09 | | 0.15 | | 0.11 | |
Net realized and unrealized gain (loss) | | 0.73 | | 2.91 | | 2.57 | | 2.48 | | 3.19 | |
Total operations | | 0.87 | | 3.04 | | 2.66 | | 2.63 | | 3.30 | |
Distributions | | | | | | | | | | | |
From net investment income | | (0.17 | ) | (0.08 | ) | (0.12 | ) | (0.13 | ) | (0.01 | ) |
From net realized gains | | (2.36 | ) | (0.90 | ) | (1.00 | ) | (0.29 | ) | — | |
Total distributions | | (2.53 | ) | (0.98 | ) | (1.12 | ) | (0.42 | ) | (0.01 | ) |
Net Asset Value | | | | | | | | | | | |
End of period(b) | | $ | 19.21 | | $ | 20.87 | | $ | 18.81 | | $ | 17.27 | | $ | 15.06 | |
Total Return(c),(d) | | 4.35 | % | 16.62 | % | 15.73 | % | 18.00 | % | 28.03 | % |
Net Assets End of Period (000’s) | | $ | 33,514 | | $ | 28,079 | | $ | 14,908 | | $ | 3,189 | | $ | 918 | |
Ratio and Supplemental Data | | | | | | | | | | | |
Expenses to average net assets(e) | | 1.10 | % | 1.08 | % | 1.09 | % | 1.10 | % | 1.10 | % |
Net investment income (loss), to average net assets(e) | | 0.70 | % | 0.64 | % | 0.49 | % | 0.97 | % | 1.19 | % |
Portfolio turnover rate(d) | | 67 | % | 60 | % | 69 | % | 132 | % | 145 | % |
(a) Per share information is calculated based on average number of shares outstanding.
(b) BlackRock Large Cap Value (the “Fund”) share class commenced operations as follows:
Initial Class - May 1, 1996
Service Class - May 1, 2003
(c) Total Return reflects all portfolio expenses and includes reinvestment of dividends and capital gains; it does not reflect the charges and deductions under the policies or annuity contracts.
(d) Not annualized.
(e) Annualized.
The notes to the financial statements are an integral part of this report.
8
BlackRock Large Cap Value
NOTES TO FINANCIAL STATEMENTS
At December 31, 2007
(all amounts in thousands)
NOTE 1. ORGANIZATION AND SIGNIFICANT ACCOUNTING POLICIES
AEGON/Transamerica Series Trust (“ATST”) is an open-end management investment company registered under the Investment Company Act of 1940, as amended (the “1940 Act”). ATST serves as a funding vehicle for variable life insurance, variable annuity and group annuity products. BlackRock Large Cap Value (the “Fund”) is part of ATST.
In the normal course of business, the Fund enters into contracts that contain a variety of representations that provide general indemnifications. The Fund’s maximum exposure under these arrangements is unknown, as this would involve future claims that may be made against the Fund and/or its affiliates that have not yet occurred. However, based on experience, the Fund expects the risk of loss to be remote.
This report should be read in conjunction with the current Fund prospectus, which contains more complete information about the Fund.
In preparing the Fund’s financial statements in accordance with accounting principles generally accepted in the United States of America (“GAAP”), estimates or assumptions (which could differ from actual results) may be used that affect reported amounts and disclosures. The following is a summary of significant accounting policies followed by the Fund.
Multiple class operations, income and expenses: The Fund currently offers two classes of shares, an Initial Class and a Service Class. Income, non-class specific expenses and realized and unrealized gains and losses, are allocated daily to each class, based upon the value of shares outstanding method as permitted under Rule 18f-3 of the 1940 Act. Each class bears its own specific expenses as well as a portion of general, common expenses.
Security valuations: The Fund values its investments at the close of the New York Stock Exchange (“NYSE”), normally 4 p.m. ET, each day the NYSE is open for business. Fund investments are valued at the last sale price or closing price on the day of valuation taken from the primary exchange where the security is principally traded.
Securities traded in the over-the-counter market and listed securities for which no sale was reported on that date are valued at the last quoted bid price.
Debt securities are valued based on a price quotation or other equivalent indication of value supplied by an exchange, a pricing service or a major market maker; however, those that mature in sixty days or less are valued at amortized cost, which approximates market.
Investment company securities are valued at the net asset value of the underlying portfolio.
Securities for which quotations are not readily available are valued at fair market value as determined in good faith by the Fund’s Administrative Valuation Committee, using guidelines adopted by the Board of Trustees.
Cash: The Fund may leave cash overnight in its cash account with the custodian, State Street Bank & Trust Company (“State Street”). On July 2, 2007, State Street acquired the parent company of Investors Bank & Trust Company. State Street has been contracted on behalf of the Fund to invest the excess cash into a savings account, which at December 31, 2007 was paying an interest rate of 2.60%.
Repurchase agreements: The Fund is authorized to enter into repurchase agreements. The Fund, through its custodian, State Street, receives delivery of the underlying securities, the value of which at the time of purchase is required to be an amount equal to at least 100% of the resale price. The Fund will bear the risk of value fluctuations until the security can be sold and may encounter delays and incur costs in liquidating the security. In the event of bankruptcy or insolvency of the seller, delays and costs may be incurred.
Securities lending: The Fund may lend securities to qualified borrowers, with State Street acting as the Fund’s lending agent. The Fund earns negotiated lenders’ fees. The Fund receives cash and/or securities as collateral against the loaned securities. Cash collateral received is invested in short-term, interest-bearing securities. The Fund monitors the market value of securities loaned on a daily basis and requires collateral in an amount at least equal to the value of the securities loaned. Income from loaned securities earned by State Street for its services, shown in the Statement of Operations is net of fees, in the amount of $30.
The Fund has invested the cash collateral received from securities loaned in the following short-term, interest-bearing securities:
Abbey National PLC, Eurodollar Term, 5.00%, 1/7/2008 | | $ | 1,280 | |
ABN AMRO Bank NV, Eurodollar Term, 5.18%, 1/4/2008 | | 1,024 | |
Bank of Nova Scotia, Eurodollar Term, 4.96%, 1/22/2008 | | 896 | |
Barclays, Eurodollar Term, 5.00%, 2/12/2008 | | 1,792 | |
BNP Paribas, Eurodollar Term, 5.01%, 1/11/2008 | | 1,664 | |
Calyon, Eurodollar Term, 5.12%, 3/3/2008 | | 384 | |
Credit Suisse First Boston Corp., Repurchase Agreement, 4.60%, 1/2/2008 | | 3,327 | |
Dexia Group, Eurodollar Term, 4.82%, 1/3/2008 | | 1,280 | |
HBOS Halifax Bank of Scotland, Eurodollar Term, 5.15%, 1/2/2008 | | 640 | |
JPMorgan Chase & Co., Eurodollar Term, 5.15%, 2/12/2008 | | 640 | |
Lloyds TSB Bank, Eurodollar Term, 5.15%, 1/24/2008 | | 1,280 | |
Merrill Lynch & Co. (RPG), Repurchase Agreement, 4.60%, 1/2/2008 | | 1,920 | |
Morgan Stanley & Co. (Corp. Repo), Repurchase Agreement, 4.60%, 1/2/2008 | | 5,247 | |
Rabobank Nederland, Eurodollar Term, 5.08%, 1/10/2008 | | 1,536 | |
Reserve Primary Money Market Fund, 4.95% | | 1,365 | |
Royal Bank of Scotland, Eurodollar Term, 5.00%, 2/25/2008 | | 1,536 | |
Societe Generale, Eurodollar Term, 5.15%, 3/3/2008 | | 768 | |
Toronto Dominion Bank, Eurodollar Term, 5.05%, 1/10/2008 | | 1,536 | |
UBS AG, Eurodollar Term, 4.92%, 1/11/2008 | | 896 | |
Wells Fargo, Bank Note, 4.75%, 1/8/2008 | | 639 | |
| | | |
| | $ | 29,650 | |
9
NOTES TO FINANCIAL STATEMENTS (continued)
At December 31, 2007
(all amounts in thousands)
NOTE 1. – (continued)
Security transactions and investment income: Security transactions are recorded on the trade date. Security gains and losses are calculated on the first-in, first-out basis. Dividend income, if any, is recorded on the ex-dividend date or, in the case of foreign securities, as soon as the Fund is informed of the ex-dividend date. Interest income, including accretion of discounts and amortization of premiums, is recorded on the accrual basis commencing on the settlement date.
Dividend distributions: Dividends and capital gains distributions are typically declared and reinvested annually and are generally paid and reinvested on the business day following the ex-date.
NOTE 2. RELATED PARTY TRANSACTIONS
ATST serves as a funding vehicle for certain affiliated asset allocation portfolios and certain affiliated separate accounts of Western Reserve Life Assurance Co. of Ohio, Transamerica Life Insurance Company, Transamerica Financial Life Insurance Company, Inc., Monumental Life Insurance Company and Transamerica Occidental Life Insurance Company.
Transamerica Fund Advisors, Inc. (“TFAI”) is the Fund’s investment adviser. Transamerica Fund Services, Inc. (“TFS”) is the Fund’s administrator and transfer agent. Prior to May 1, 2007, AFSG Securities Corp. (“AFSG”), was the Fund’s distributor. Transamerica Capital Inc. (“TCI”) is now the Fund’s distributor. TFAI, TFS, AFSG, and TCI are affiliates of AEGON NV, a Netherlands corporation.
Certain officers and trustees of the Fund are also officers and/or directors of TFAI, TFS and TCI.
The following schedule reflects the percentage of Fund assets owned by affiliated investment companies at December 31, 2007:
| | Net | | % of Net | |
| | Assets | | Assets | |
Asset Allocation-Conservative Portfolio | | $ | 13,279 | | 1.48 | % |
Asset Allocation-Growth Portfolio | | 156,520 | | 17.50 | |
Asset Allocation-Moderate Growth Portfolio | | 293,322 | | 32.79 | |
Asset Allocation-Moderate Portfolio | | 94,792 | | 10.60 | |
Total | | $ | 557,913 | | 62.37 | % |
Investment advisory fee: The Fund pays management fees to TFAI based on average daily net assets (“ANA”) at the following breakpoints:
0.80% of first $250 million of ANA
0.775% of the next $500 million of ANA
0.75% of ANA over $750 million
TFAI has contractually agreed to waive its advisory fee and will reimburse the Fund to the extent that operating expenses, excluding 12b-1 fees, exceed the following stated annual limit:
1.00% Expense Limit
If total Fund expenses fall below the annual expense limitation agreement agreed to by the adviser within the succeeding three years, the Fund may be required to pay the adviser a portion or all of the waived advisory fees.
There were no amounts recaptured during the year ended December 31, 2007. There are no amounts available for recapture at December 31, 2007.
Distribution and service fees: ATST entered into Distribution Agreement with AFSG dated January 1, 1997, as amended. On May 1, 2007, the Distribution Agreement was amended to replace AFSG with TCI as the Fund’s distributor. The Fund has also adopted a distribution plan (“Distribution Plan”) pursuant to Rule 12b-1 under the 1940 Act.
Under the Distribution Plan for the Initial Class shares, TCI, on behalf of the Fund, is authorized to pay various service providers, as direct payment for expenses incurred in connection with distribution of the Fund’s shares, amounts equal to actual expenses associated with distributing the shares.
The Distribution Plan for the Service Class shares requires ATST to pay distribution fees to TCI as compensation for its activities, not as reimbursement for specific expenses. The fee on the Service Class is paid to the insurance companies for providing services and account maintenance for their policyholders who invest in the variable insurance products which invest in the Service Class shares.
The Fund is authorized under the Distribution Plan to pay fees on each class up to the following limits:
Initial Class | | 0.15% |
Service Class | | 0.25% |
TCI has determined that it will not seek payment by the Fund of the distribution expenses incurred with respect to the Initial Class shares before April 30, 2009. Prior to TCI seeking reimbursement of future expenses, policy and contract owners will be notified in advance. The Fund will pay fees relating to Service Class shares.
Administrative services: The Fund has entered into an agreement with TFS for financial and legal fund administration services. The Fund pays TFS an annual fee of 0.02% of ANA. The Legal fees on the Statement of Operations are for fees paid to external legal counsel.
10
NOTES TO FINANCIAL STATEMENTS (continued)
At December 31, 2007
(all amounts in thousands)
NOTE 2. - (continued)
Deferred compensation plan: Each eligible independent Fund Trustee may elect participation in a non-qualified deferred compensation plan (“the Plan”). Under the Plan, such Trustees may defer payment of all or a portion of their total fees earned as a Fund Trustee. Each Trustee who is a participant in the Plan may elect that the earnings, losses or gains credited to his or her deferred fee amounts be determined based on a deemed investment in any series of Transamerica IDEX Mutual Funds. The right of a participant to receive a distribution from the Plan of the deferred fees is an unsecured claim against the general assets of all series of Transamerica IDEX Mutual Funds. The pro rata liability to the Fund of all deferred fees in the Plan amounted, as of December 31, 2007, to $43. Amounts deferred under the Deferred Compensation Plan are unfunded against the general assets of ATST.
Retirement plan: Under a retirement plan (the “Emeritus Plan”) available to the Independent Trustees, each Independent Trustee is deemed to have elected to serve as Trustee Emeritus of ATST upon his or her termination of service, other than removal for cause, and is entitled to 50% of the trustee’s current retainer for a maximum period of five years determined by his or her years of service as a Trustee.
Such amounts shall be accrued by ATST on a pro rata basis allocable to each series of ATST fund based on the relative assets of the series. If retainers increase in the future, past accruals (and credits) will be adjusted upward so that 50% of the Trustee’s current retainer is accrued and credited at all times. Upon death, disability or termination of service, other than removal for cause, amounts deferred become payable to a Trustee Emeritus (or his/her beneficiary). Upon the commencement of service as Trustee Emeritus, compensation will be paid on a quarterly basis during the time period that the Trustee Emeritus is allowed to serve as such.
Amounts accrued under the Emeritus Plans are unsecured claims against the general assets of ATST. For the year ended December 31, 2007, the amount related to the Emeritus Plan was $40. As of December 31, 2007, the Fund has not made any payments related to the Emeritus Plan.
The Emeritus Plan was terminated effective October 30, 2007. Upon the termination, the Fund shall continue to pay any remaining benefits in accordance with the Plan, but no further compensation shall accrue under the Plan.
NOTE 3. INVESTMENT TRANSACTIONS
The cost of securities purchased and proceeds from securities sold (excluding short-term securities) for the year ended December 31, 2007 were as follows:
Purchases of securities: | | | |
Long-term | | $ | 635,507 | |
U.S. Government | | — | |
Proceeds from maturities and sales of securities: | | | |
Long-term | | 857,051 | |
U.S. Government | | — | |
| | | | |
NOTE 4. FEDERAL INCOME TAX MATTERS
The Fund has not made any provision for federal income or excise taxes due to its policy to distribute all of its taxable income and capital gains to its shareholders and otherwise qualify as a regulated investment company under Subchapter M of the Internal Revenue Code. Income and capital gain distributions are determined in accordance with income tax regulations, which may differ from GAAP. These differences are primarily due to differing treatment for items including, but not limited to, wash sales, capital loss carryforwards, and post October loss deferral.
The capital loss carryforwards are available to offset future realized capital gains through the periods listed:
Capital Loss | | | |
Carryforwards | | Available Through | |
$ | 76 | | December 31, 2010 | |
| | | | |
The capital loss carryforward utilized during the year ended December 31, 2007 was $43.
The capital loss carryforwards are available to offset future realized gains, subject to certain limitations under the Internal Revenue Code, through the periods listed.
The tax character of distributions paid may differ from the character of distributions shown in the Statements of Changes in Net Assets due to short-term gains being treated as ordinary income for tax purposes.
The tax character of distributions paid during 2006 and 2007 was as follows:
2006 Distributions paid from: | | | |
Ordinary Income | | $ | 26,263 | |
Long-term Capital Gain | | 23,301 | |
2007 Distributions paid from: | | | |
Ordinary Income | | 8,492 | |
Long-term Capital Gain | | 98,970 | |
| | | | |
The tax basis components of distributable earnings as of December 31, 2007 are as follows:
Undistributed Ordinary Income | | $ | 8,793 | |
Undistributed Long-term Capital Gain | | $ | 111,721 | |
Capital Loss Carryforward | | $ | (76 | ) |
Post October Capital Loss Deferral | | $ | (182 | ) |
Post October Currency Loss Deferral | | $ | — | |
Net Unrealized Appreciation (Depreciation) | | $ | 116,166 | |
11
NOTES TO FINANCIAL STATEMENTS (continued)
(all amounts in thousands)
At December 31, 2007
NOTE 5. REGULATORY PROCEEDINGS
There continues to be significant federal and state regulatory activity relating to financial services companies, particularly mutual fund companies and their investment advisers. As part of an ongoing investigation regarding potential market timing, recordkeeping and trading compliance issues and matters affecting the Fund’s investment adviser, TFAI, and certain affiliates and former employees of TFAI, the SEC staff has indicated that it is likely to take some action against TFAI and certain of its affiliates at the conclusion of the investigation. The potential timing and the scope of any such action is difficult to predict. Although the impact of any action brought against TFAI and/or its affiliates is difficult to assess at the present time, the Fund currently believes that the likelihood that any such action will have a material adverse impact is remote. It is important to note that the Fund is not aware of any allegation of wrong doing against it and its Board at the time this annual report is printed. Although it is not anticipated that these developments will have an adverse impact on the Fund, there can be no assurance at this time. TFAI and its affiliates are actively working with the SEC in regard to this matter; however, the exact resolution cannot be determined at this time. TFAI will take such actions that it deems necessary or appropriate to continue providing management services to the Fund and to bring all matters to an appropriate conclusion.
TFAI and/or its affiliates, and not the Fund, will bear the costs regarding these regulatory matters.
NOTE 6. RECENTLY ISSUED ACCOUNTING PRONOUNCEMENTS
In July 2006, the Financial Accounting Standards Board (“FASB”) released FASB Interpretation No. 48 “Accounting for Uncertainty in Income Taxes” (“FIN 48”), an interpretation of FASB Statement No. 109. FIN 48 provides guidance for how uncertain tax positions should be recognized, measured, presented and disclosed in the financial statements. FIN 48 requires the accounting and disclosure of tax positions taken or expected to be taken in the course of preparing the Fund’s tax returns to determine whether the tax positions are “more-likely-than-not” of being sustained by the applicable tax authority. Tax positions not deemed to meet the more-likely-than-not threshold would be recorded as a tax benefit or expense in the current year.
Adoption of FIN 48 is effective during the first required financial reporting period for fiscal years beginning after December 15, 2006. Management adopted FIN 48 on June 29, 2007.
Implementation of FIN 48 requires Management of the Fund to analyze all open tax years, as defined by the Statute of Limitations, for all major jurisdictions, which includes federal and certain states. Open tax years are those that are open for exam by taxing authorities (i.e., the last 4 tax year ends and the interim tax period since then). The Fund has no examinations in progress and none are expected at this time.
Management of the Fund has reviewed all open tax years and major jurisdictions and concluded the adoption of FIN 48 resulted in no impact to the Fund’s net assets or results of operations. There is no tax liability resulting from unrecognized tax benefits relating to uncertain income tax positions taken or expected to be taken in future tax returns. The Fund is also not aware of any tax positions for which it is reasonably possible that the total amounts of unrecognized tax benefits will significantly change in the next 12 months.
In September 2006, FASB issued its new Standard No. 157, “Fair Value Measurements” (“FAS 157”). FAS 157 is designed to unify guidance for the measurement of fair value of all types of assets, including financial instruments, and certain liabilities, throughout a number of accounting standards. FAS 157 also establishes a hierarchy for measuring fair value in generally accepted accounting principles and expands financial statement disclosures about fair value measurements that are relevant to mutual funds. FAS 157 is effective for financial statements issued for fiscal years beginning after November 15, 2007, and earlier application is permitted.
As of December 31, 2007, Management does not expect the adoption of FAS 157 to impact the amounts reported in the financial statements, however, additional disclosures will be required about the inputs used to develop the measurements of fair value and the effect of certain of the measurements reported in the statement of operations for a fiscal period.
NOTE 7. SUBSEQUENT EVENT
Effective January 1, 2008, TFAI changed its name to Transamerica Asset Management, Inc.
Effective May 1, 2008, AEGON/Transamerica Series Trust will change its nam to Transamerica Series Trust. At that time, the Fund will also change its name to Transamerica BlackRock Large Cap Value VP.
12
Report of Independent Registered Certified Public Accounting Firm
To the Board of Trustees and Shareholders of
BlackRock Large Cap Value:
In our opinion, the accompanying statement of assets and liabilities, including the schedule of investments, and the related statements of operations and of changes in net assets and the financial highlights present fairly, in all material respects, the financial position of BlackRock Large Cap Value (the “Fund”) (one of the portfolios constituting AEGON/Transamerica Series Trust) at December 31, 2007, the results of its operations for the year then ended, the changes in its net assets for each of the two years in the period then ended and the financial highlights for each of the periods presented, in conformity with accounting principles generally accepted in the United States of America. These financial statements and financial highlights (hereafter referred to as “financial statements”) are the responsibility of the Fund’s management; our responsibility is to express an opinion on these financial statements based on our audits. We conducted our audits of these financial statements in accordance with the standards of the Public Company Accounting Oversight Board (United States). Those standards require that we plan and perform the audit to obtain reasonable assurance about whether the financial statements are free of material misstatement. An audit includes examining, on a test basis, evidence supporting the amounts and disclosures in the financial statements, assessing the accounting principles used and significant estimates made by management, and evaluating the overall financial statement presentation. We believe that our audits, which included confirmation of securities at December 31, 2007 by correspondence with the custodian and brokers, provide a reasonable basis for our opinion.

Tampa, Florida
February 29, 2008
13
BlackRock Large Cap Value
SUPPLEMENTAL TAX INFORMATION (unaudited)
(all amounts in thousands)
For tax purposes, the Fund has made a Long-Term Capital Gain Designation of $98,970 for the year ended December 31, 2007.
RESULTS OF SHAREHOLDER PROXY (unaudited)
At a special meeting of shareholders held on October 30, 2007, the results of the Proposals were as follows:
Proposal 1: To elect a new Board:
Proposed | | | | | | Abstentions/Broker Non- |
Trustee | | For | | Against | | Votes |
John K. Carter | | 2,274,998,840.817 | | 57,804,698.755 | | 35,433.883 |
| | | | | | |
Leo J. Hill | | 2,277,212,702.754 | | 55,590,836.819 | | 35,433.883 |
| | | | | | |
Neal M. Jewell | | 2,266,793,295.663 | | 66,010,243.909 | | 35,433.883 |
| | | | | | |
Russell A. Kimball, Jr. | | 2,274,825,235.835 | | 57,978,303.737 | | 35,433.883 |
| | | | | | |
Eugene M. Mannella | | 2,274,623,165.033 | | 58,180,374.539 | | 35,433.883 |
| | | | | | |
Norm R. Nielsen | | 2,275,050,055.885 | | 57,753,483.687 | | 35,433.883 |
| | | | | | |
Joyce Galpern Norden | | 2,270,278,122.250 | | 62,525,417.323 | | 35,433.883 |
| | | | | | |
Patricia L. Sawyer | | 2,275,737,737.456 | | 57,065,802.116 | | 35,433.883 |
| | | | | | |
John W. Waechter | | 2,276,615,120.140 | | 56,188,419.433 | | 35,433.883 |
Proposal 2: To approve an amendment to the Agreement and Declaration of Trust:
| | | | Abstentions/Broker Non- | |
For | | Against | | Votes | |
2,182,022,669.110 | | 77,590,048.544 | | 73,226,255.801 | |
14
BlackRock Large Cap Value
INVESTMENT ADVISORY AND SUB-ADVISORY AGREEMENTS-REVIEW AND RENEWAL (unaudited)
At a meeting of the Board of Trustees of AEGON/Transamerica Series Trust (“ATST”) held on December 4th, 2007, the Board reviewed and considered the renewal of the investment advisory agreement (the “Investment Advisory Agreement”) between BlackRock Large Cap Value (the “Fund”) and Transamerica Fund Advisors, Inc. (“TFAI”), as well as the renewal of the investment sub-advisory agreement (the “Sub-Advisory Agreement”) of the Fund between TFAI and BlackRock Investment Management, LLC (the “Sub-Adviser”), to determine whether the agreements should be renewed for a six-month period. It was noted that this review was interim in nature to align all the Funds on the same calendar, and that the Funds’ advisory arrangements would be reviewed again in the first half of 2008.
Following their review and consideration, the Trustees determined that the renewal of the Investment Advisory Agreement and the Sub-Advisory Agreement would enable shareholders of the Fund to obtain high quality services at a cost that is appropriate, fair, and in the best interests of its shareholders. The Board, including the independent members of the Board, unanimously approved the renewal of the Investment Advisory Agreement and Sub-Advisory Agreement. In reaching their decision, the Trustees requested and obtained from TFAI and the Sub-Adviser such information as they deemed reasonably necessary to evaluate the agreements, including information about fees and performance of comparable funds managed by the Sub-Adviser. The Trustees also carefully considered information they had previously received from TFAI and the Sub-Adviser throughout the year as part of their regular oversight of the Fund, as well as comparative fee, expense, and performance information prepared by Lipper Inc. (“Lipper”), an independent provider of mutual fund performance, fee and expense information and profitability data prepared by management. In considering the proposed continuation of the Investment Advisory and Sub-Advisory Agreements, the Trustees evaluated a number of considerations that they believed, in light of the legal advice furnished to them by independent legal counsel and their own business judgment, to be relevant. They based their decisions on a variety of factors, including the following considerations, among others, although they did not identify any consideration or particular information that was controlling of their decisions:
The nature, extent and quality of the advisory services to be provided. The Board considered the nature and quality of the services provided by TFAI and the Sub-Adviser to the Fund in the past, as well as the services anticipated to be provided in the future. The Board concluded that TFAI and the Sub-Adviser are capable of providing high quality services to the Fund, as indicated by the nature and quality of services provided in the past by TFAI and the Sub-Adviser for this series and the experience, capability and integrity of TFAI’s senior management, the financial resources of TFAI and the Sub-Adviser, TFAI’s management oversight process and the professional qualifications of the portfolio management team of the Sub-Adviser. The Trustees determined that TFAI and the Sub-Adviser can provide investment and related services that are appropriate in scope and extent in light of the Fund’s operations, the competitive landscape of the investment company business and investor needs.
The investment performance of the Fund. The Board examined the short and longer-term performance of the Fund, including relative performance against a peer universe of comparable mutual funds as prepared by Lipper for various trailing periods ended June 30, 2007. The Trustees noted that the 3- and 5-year performance of the Fund indicated strong longer-term investment results, but that shorter-term performance had lagged. On the basis of the Board’s assessment of the nature, extent and quality of advisory services to be provided or procured by TFAI and the Sub-Adviser, the Board concluded that TFAI and the Sub-Adviser are capable of providing a level of investment performance that is appropriate in light of the Fund’s proposed investment objectives, policies and strategies and competitive with other similarly situated investment companies, but the Board noted that they would be monitoring performance closely.
The cost of advisory services provided and the level of profitability. The Board reviewed profitability information of TFAI’s cost of procuring fund management services, as well as the costs of provision of administration, fund accounting and other services, to the Fund and to ATST as a whole by TFAI and its affiliates. The Board reviewed the management and sub-advisory fees for the Fund. Based on their review, the Trustees determined that the management fees of the Fund generally are appropriate in light of the services expected to be provided or procured, the management fees and the anticipated profitability of the relationship between the Fund, TFAI and its affiliates, and the Sub-Adviser. In making these observations and determinations, the Board reviewed, among other things, comparative information provided by Lipper.
Whether fee levels reflect economies of scale and the extent to which economies of scale would be realized as the Fund grows. In evaluating the extent to which the management fees payable under the Investment Advisory and Sub-Advisory Agreements reflect economies of scale or will permit economies of scale to be realized in the future, the Board noted that TFAI and the Sub-Adviser offer breakpoints which appropriately benefit investors by passing on economies of scale in the form of lower management fees as the level of assets grows. The Trustees also concluded that they will have the opportunity to periodically reexamine whether the Fund has achieved economies of scale, and the appropriateness of management fees payable to TFAI and fees paid to the Sub-Adviser, in the future.
Benefits (such as soft dollars) to TFAI, its affiliates, or the Sub-Adviser from their relationship with the Fund. The Board concluded that other benefits anticipated to be derived by TFAI, its affiliates, and the Sub-Adviser from their relationships with the Fund are expected to be reasonable and fair, and consistent with industry practice and the best interests of the Fund and its shareholders. The Trustees noted that TFAI would not realize soft dollar benefits from its relationship with the Fund, and that the Sub-Adviser’s soft dollar trading is consistent with applicable law, including best execution requirements in particular.
Other considerations. The Board determined that TFAI has made a substantial commitment to the recruitment and retention of high quality personnel, and maintains the financial, compliance and operational resources reasonably necessary to manage the Fund in a professional manner that is consistent with the best interests of the Fund and its shareholders. In this regard, the Trustees favorably considered the procedures and policies in place by TFAI to enforce compliance with applicable laws and regulations and oversee the portfolio management activities of the Sub-Adviser. The Trustees also determined that TFAI has made a significant entrepreneurial commitment to the management and success of the Fund, reflected by TFAI’s expense limitation and fee waiver arrangements with the Fund which may result in TFAI waiving a substantial amount of management fees for the benefit of shareholders.
15
Capital Guardian Global
MARKET ENVIRONMENT
Global stocks made modest gains in a year that saw several major stock markets breach record highs then stumble as problems in the U.S. sub-prime mortgage market spread to other areas of the market. The Morgan Stanley Capital International World Index (“MSCIW”) rose 9.57%. Stock returns for U.S. investors were enhanced by a weaker dollar, which depreciated 10% against the euro.
Stocks soared for much of the year as low borrowing rates and the easy availability of credit supported a record $4.7 trillion in worldwide merger-and-acquisitions activity. Companies reported strong corporate earnings, and the global economy grew at a fast clip. But troubles in the U.S. sub-prime mortgage market appeared in February and June and then became a severe crisis in bank loan and bond markets in the third quarter. The fallout incorporated two main elements: the lower value of sub-prime mortgages and related investments; and the effect of the credit crisis on financial institutions that wrote down the value of their mortgage assets and subsequently faced severe financing constraints. Though the U.S. Federal Reserve Board cut interest rates three times and worked with other central banks to inject liquidity into the system, earnings began to decline and the outlook for global economic growth looked bleak by December as stocks gave up some of the year’s gains.
The stock market in Germany, Europe’s largest economy, made sharp gains, and several markets in Asia, including Hong Kong, also advanced. However, Japanese shares fell against the backdrop of a weak economy and the unexpected transition of power to a new prime minister.
Global energy and materials stocks rose, supported by robust demand for commodities from developing economies such as China and India. Information technology (“IT”) and consumer staples stocks were also higher. However, shares of financial companies fell in the aggregate.
PERFORMANCE
For the year ended December 31, 2007, Capital Guardian Global, Initial Class returned 6.31%. By comparison its benchmark, the MSCIW, returned 9.57%.
STRATEGY REVIEW
Stock selection in the U.S. was the top overall detractor from results for the year, especially in the IT and financials sectors. In the financials sector, we added to our investments in U.S. thrifts, mortgage lenders and insurers in the second half of the year as valuations declined, but we did so too early as the credit crunch further intensified in the fourth quarter. Washington Mutual, Inc. (“Washington Mutual”) was the largest detractor to results and Wachovia Corporation (“Wachovia”) was the fourth-largest detractor. Shares of Washington Mutual and Wachovia fell amid investor concerns about their exposure to the sub-prime mortgage business. Japanese banks, including Sumitomo Mitsui Financial Group Inc. and ORIX Corporation, were the other major detractors among financial stocks. Their shares fell due to lackluster earnings, a tepid Japanese economy and, toward the end of the year, concerns over any potential exposure to the U.S. sub-prime mortgage market.
Within the technology sector, the investment in SanDisk Corporation hurt results. The company is a leading manufacturer of flash memory for computers and handheld devices, and the stock pulled back over worries that there may be an oversupply in the market in the near term.
Areas that added value during the year include stock selection in Canada and in materials. Potash Corporation of Saskatchewan Inc., the Canadian company that controls around 75% of the world’s spare potash capacity, was the top contributor to results. Canadian Natural Resources Limited, one of the world’s largest oil and natural gas producers, and Barrick Gold Corporation, the Canadian gold mining company, were the other large contributors to portfolio results.
Michael R. Ericksen |
David I. Fisher |
Richard N. Havas |
Nancy J. Kyle |
Lionel M. Sauvage |
Nilly Sikorsky |
Rudolf M. Staehelin |
Eugene P. Stein |
Co-Portfolio Managers
Capital Guardian Trust Company
AEGON/Transamerica Series Trust | Annual Report 2007 |
1
Capital Guardian Global
(unaudited)

Average Annual Total Return for Periods Ended 12/31/2007
| | | | | | From | | Inception | |
| | 1 Year | | 5 Years | | Inception | | Date | |
| | | | | | | | | |
Initial Class | | 6.31 | % | 15.36 | % | 7.05 | % | 2/3/98 | |
MSCI WORLD (USD)(1) | | 9.57 | % | 17.53 | % | 7.22 | % | 2/3/98 | |
| | | | | | | | | |
Service Class | | 6.10 | % | — | % | 15.46 | % | 5/1/03 | |
NOTES
(1) The Morgan Stanley Capital International World ex USA (MSCI World) Index is an unmanaged index used as a general measure of market performance. Calculations assume dividends and capital gains are reinvested and do not include any managerial expenses. From inception calculation is based on life of Initial Class shares.
The performance data presented represents past performance; future results may vary. The portfolio’s investment return and net asset value will fluctuate. Past performance does not guarantee future results. Investor’s units when redeemed may be worth more or less than their original cost.
Current performance may be lower or higher than performance quoted. Please visit your insurance company’s website for contract or policy level standardized total returns current to the most recent month end. Portfolio performance is net of investment fees and fund expenses, but not product charges, which, if included, would significantly lower the performance quoted.
Investments in global securities involve risks relating to political, social, and economic developments abroad, foreign currency contracts for hedging, as well as risks resulting from the differences between the regulations to which U.S. and foreign issuer markets are subject.
This material must be preceded or accompanied by a current prospectus, which includes specific contents regarding the investment objectives, explanation of share classes and policies of this portfolio.
The historical financial information for periods prior to May 1, 2002 has been derived from the financial history of the predecessor portfolio, Capital Guardian Global Portfolio, of the Endeavor Series Trust. Capital Guardian Trust Company has been the portfolio’s subadviser since October 9, 2000. Prior to that a different firm managed the portfolio and the performance set forth above prior to October 9, 2000 is attributable to that firm.
2
Capital Guardian Global
UNDERSTANDING YOUR FUND’S EXPENSES
(unaudited)
SHAREHOLDER EXPENSES
Fund shareholders may incur ongoing costs, including management and advisory fees, distribution and service fees, and other fund expenses.
The following Example is intended to help you understand your ongoing costs (in dollars and cents) of investing in the Fund and to compare these costs with the ongoing costs of investing in other funds.
The Example is based on an investment of $1,000 invested at July 1, 2007 and held for the entire period until December 31, 2007.
ACTUAL EXPENSES
The first line in the table below provides information about actual account values and actual expenses. You may use the information in this line, together with the amount you invested, to estimate the expenses that you paid over the period. Simply divide your account value by $1,000 (for example, an $8,600 account value divided by $1,000 = 8.6), then multiply the result by the number in the first line of your Fund under the heading entitled “Expenses Paid During Period” to estimate the expenses you paid on your account during this period.
HYPOTHETICAL EXAMPLE FOR COMPARISON PURPOSES
The second line in the table below provides information about hypothetical account values and hypothetical expenses based on the Fund’s actual expense ratio and an assumed rate of return of 5% per year before expenses, which is not the Fund’s actual return. The hypothetical account values and expenses may not be used to estimate the actual ending account balance or expenses you paid for the period. You may use this information to compare the ongoing costs of investing in your Fund and other funds. To do so, compare this 5% hypothetical example with the 5% hypothetical examples that appear in the shareholder reports of the other funds.
Please note that the expenses shown in the table are meant to highlight your ongoing costs only and do not reflect any transactional costs, such as sales charges, redemption fees, brokerage commissions paid on purchases and sales of fund shares. Therefore, the second line under the Fund in the table is useful in comparing ongoing costs only, and will not help you determine the relative total costs of owning different funds. If any of these transaction costs were included, your costs would be higher. The expenses shown in the table do not reflect any fees that may be charged to you by brokers, financial intermediaries or other financial institutions.
| | Beginning | | Ending | | Annualized | | Expenses | |
| | Account | | Account | | Expense | | Paid During | |
| | Value | | Value | | Ratio | | Period (a) | |
| | | | | | | | | |
Initial Class | | | | | | | | | |
Actual | | $ | 1,000.00 | | $ | 980.62 | | 1.15 | % | $ | 5.74 | |
Hypothetical (b) | | 1,000.00 | | 1,019.41 | | 1.15 | | 5.85 | |
| | | | | | | | | |
Service Class | | | | | | | | | |
Actual | | 1,000.00 | | 980.30 | | 1.40 | | 6.99 | |
Hypothetical (b) | | 1,000.00 | | 1,018.15 | | 1.40 | | 7.12 | |
| | | | | | | | | | | | |
(a) | | Expenses are calculated using the Fund’s annualized expense ratio (as disclosed in the table), multiplied by the average account value for the period, multiplied by the number of days in the period (184 days), and divided by the number of days in the year (365 days). |
| | |
(b) | | 5% return per year before expenses. |
GRAPHICAL PRESENTATION OF SCHEDULE OF INVESTMENTS
By Sector
At December 31, 2007

This chart shows the percentage breakdown by sector of the Fund’s total investment securities.
3
Capital Guardian Global
SCHEDULE OF INVESTMENTS
At December 31, 2007
(all amounts except share amounts in thousands)
| | Shares | | Value | |
CONVERTIBLE PREFERRED STOCKS (0.2%) | | | | | |
United States (0.2%) | | | | | |
Washington Mutual, Inc., due 12/18/2012 ^ Ž | | 420 | | $ | 372 | |
Total Convertible Preferred Stocks (cost $409) | | | | 372 | |
| | | | | |
COMMON STOCKS (97.5%) | | | | | |
Australia (2.6%) | | | | | |
Amcor, Ltd. | | 68,300 | | 414 | |
Asciano Group ‡ | | 42,033 | | 258 | |
Billabong International, Ltd. | | 37,200 | | 484 | |
Coca-Cola Amatil, Ltd. | | 121,500 | | 1,011 | |
Macquarie Group, Ltd. ‡^ | | 9,843 | | 659 | |
Newcrest Mining, Ltd. | | 15,795 | | 459 | |
QBE Insurance Group, Ltd. | | 16,204 | | 474 | |
Telstra Corp., Ltd. | | 109,000 | | 449 | |
Toll Holdings, Ltd. | | 48,301 | | 486 | |
Woolworths, Ltd. | | 23,538 | | 703 | |
Austria (0.4%) | | | | | |
Raiffeisen International Bank Holding AG (1) | | 3,200 | | 481 | |
Wienerberger AG (1) | | 7,000 | | 386 | |
Belgium (0.2%) | | | | | |
Fortis ‡ | | 7,400 | | m | |
Fortis | | 18,500 | | 489 | |
Bermuda (1.0%) | | | | | |
PartnerRe, Ltd. | | 5,300 | | 437 | |
SeaDrill, Ltd. ‡ | | 30,400 | | 734 | |
Tyco International, Ltd. | | 9,300 | | 369 | |
Weatherford International, Ltd. ‡ | | 7,100 | | 487 | |
Brazil (0.1%) | | | | | |
Bovespa Holding SA ‡ | | 6,000 | | 116 | |
Canada (9.7%) | | | | | |
Barrick Gold Corp. | | 137,900 | | 5,799 | |
Cameco Corp. | | 54,200 | | 2,173 | |
Canadian Imperial Bank of Commerce | | 6,300 | | 450 | |
Canadian Natural Resources, Ltd. | | 34,200 | | 2,515 | |
EnCana Corp. ‡ | | 13,400 | | 916 | |
EnCana Corp. ^ | | 9,000 | | 612 | |
Methanex Corp. ^ | | 9,973 | | 279 | |
Potash Corp. of Saskatchewan | | 42,900 | | 6,237 | |
Power Corp. of Canada ^ | | 8,200 | | 333 | |
Suncor Energy, Inc. ‡ | | 9,800 | | 1,072 | |
Cayman Islands (0.8%) | | | | | |
Alibaba.Com, Ltd. ‡ | | 2,000 | | 7 | |
Seagate Technology | | 31,300 | | 798 | |
Transocean, Inc. ‡ | | 2,658 | | 380 | |
XL Capital, Ltd. Class A | | 8,400 | | 423 | |
Denmark (0.2%) | | | | | |
Genmab A/S ‡ | | 5,600 | | 336 | |
Finland (0.3%) | | | | | |
UPM-Kymmene OYJ | | 32,300 | | 654 | |
France (6.2%) | | | | | |
Air Liquide | | 7,660 | | 1,140 | |
AXA SA | | 11,900 | | 477 | |
BNP Paribas | | 9,630 | | 1,045 | |
Bouygues | | 17,048 | | 1,421 | |
Dassault Systemes SA | | 8,300 | | 491 | |
Groupe Danone | | 7,400 | | 664 | |
L’Oreal SA | | 8,800 | | 1,261 | |
Pernod-Ricard SA | | 1,700 | | 393 | |
Peugeot SA | | 6,200 | | 470 | |
Sanofi-Aventis SA | | 21,800 | | 2,007 | |
Schneider Electric SA | | 5,600 | | 759 | |
Societe Generale | | 2,200 | | 318 | |
Total SA | | 8,100 | | 673 | |
Veolia Environnement | | 19,538 | | 1,784 | |
Germany (3.5%) | | | | | |
Allianz SE | | 4,900 | | 1,056 | |
Bayer AG | | 5,800 | | 530 | |
Continental AG | | 2,900 | | 379 | |
Daimler AG | | 19,900 | | 1,929 | |
Deutsche Bank AG | | 4,900 | | 640 | |
HYPO Real Estate Holding AG (1) | | 12,196 | | 644 | |
Infineon Technologies AG ‡ | | 19,800 | | 233 | |
SAP AG ^ | | 3,500 | | 179 | |
SAP AG | | 3,300 | | 170 | |
Siemens AG | | 10,100 | | 1,606 | |
Hong Kong (1.3%) | | | | | |
China Mobile, Ltd. | | 20,000 | | 354 | |
Hang Lung Properties, Ltd. | | 34,000 | | 154 | |
Melco International Development | | 206,000 | | 310 | |
Sino Land Co. | | 120,000 | | 426 | |
Sun Hung KAI Properties, Ltd. | | 34,000 | | 722 | |
Swire Pacific, Ltd. ‡ | | 58,000 | | 799 | |
Ireland (0.7%) | | | | | |
CRH PLC | | 30,100 | | 1,046 | |
Ryanair Holdings PLC ‡ | | 10,400 | | 410 | |
Israel (0.3%) | | | | | |
Teva Pharmaceutical Industries, Ltd. | | 12,314 | | 572 | |
Japan (13.8%) | | | | | |
Advantest Corp. ^ | | 12,200 | | 345 | |
AEON Co., Ltd. | | 74,500 | | 1,087 | |
Bank of Yokohama, Ltd. (The) | | 42,000 | | 293 | |
Canon, Inc. | | 14,700 | | 673 | |
Citizen Holdings Co., Ltd. ^ | | 39,000 | | 379 | |
Daiwa House Industry Co., Ltd. | | 20,000 | | 255 | |
Elpida Memory, Inc. ‡ | | 9,800 | | 335 | |
Fanuc, Ltd. | | 10,000 | | 969 | |
Hankyu Hanshin Holdings, Inc. | | 44,000 | | 190 | |
Hoya Corp. | | 23,500 | | 743 | |
Idemitsu Kosan Co., Ltd. | | 5,000 | | 527 | |
Keyence Corp. | | 1,500 | | 368 | |
Millea Holdings, Inc. | | 9,000 | | 302 | |
Mitsubishi Corp. | | 11,400 | | 308 | |
Mitsubishi UFJ Financial Group, Inc. | | 42,000 | | 396 | |
Mitsui & Co., Ltd. | | 24,000 | | 501 | |
| | | | | | |
The notes to the financial statements are an integral part of this report.
4
| | Shares | | Value | |
Japan (continued) | | | | | |
Mizuho Financial Group, Inc. | | 80 | | 381 | |
Nintendo Co., Ltd. | | 2,100 | | 1,233 | |
Nippon Electric Glass Co., Ltd. | | 25,500 | | 415 | |
Nippon Telegraph & Telephone Corp. | | 81 | | 403 | |
Nissan Motor Co., Ltd. | | 44,900 | | 490 | |
Nomura Holdings, Inc. | | 36,000 | | 603 | |
NTT DoCoMo, Inc. | | 239 | | 393 | |
Okinawa Electric Power Co., Inc. (The) | | 4,950 | | 230 | |
Oracle Corp. ^ | | 3,400 | | 149 | |
ORIX Corp. | | 6,240 | | 1,049 | |
Shimamura Co., Ltd. ^ | | 7,600 | | 643 | |
Shin-Etsu Chemical Co., Ltd. | | 6,700 | | 417 | |
SMC Corp./Japan | | 4,400 | | 523 | |
Softbank Corp. | | 120,900 | | 2,480 | |
Sony Corp. | | 10,100 | | 550 | |
Sony Financial Holdings, Inc. ‡ | | 61 | | 233 | |
Sumitomo Chemical Co., Ltd. | | 58,000 | | 514 | |
Sumitomo Corp. | | 24,000 | | 336 | |
Sumitomo Mitsui Financial Group, Inc. ^ | | 297 | | 2,198 | |
Suzuki Motor Corp. | | 68,000 | | 2,039 | |
Takeda Pharmaceutical Co., Ltd. | | 17,700 | | 1,034 | |
TDK Corp. | | 4,100 | | 302 | |
Tokyu Corp. | | 66,000 | | 431 | |
Toshiba Corp. | | 73,000 | | 539 | |
Toto, Ltd. ^ | | 16,000 | | 127 | |
Trend Micro, Inc. | | 17,500 | | 622 | |
Ushio, Inc. | | 21,500 | | 469 | |
Yahoo! Japan Corp. | | 2,356 | | 1,051 | |
Yamada Denki Co., Ltd. | | 7,190 | | 811 | |
Yamato Holdings Co., Ltd. | | 32,000 | | 460 | |
Korea, Republic of (0.3%) | | | | | |
Samsung Electronics Co., Ltd. | | 1,036 | | 610 | |
Luxembourg (0.2%) | | | | | |
Arcelormittal ‡ | | 5,800 | | 450 | |
Mexico (0.5%) | | | | | |
America Movil SAB de CV Series R, Class R | | 14,115 | | 866 | |
Cemex SAB de CV ‡^ | | 9,700 | | 251 | |
Netherlands (1.3%) | | | | | |
ASML Holding NV ‡ | | 10,577 | | 335 | |
ING Groep NV | | 26,510 | | 1,037 | |
Koninklijke Ahold NV ‡ | | 52,000 | | 725 | |
Unilever NV | | 15,400 | | 566 | |
Netherlands Antilles (1.1%) | | | | | |
Schlumberger, Ltd. | | 23,500 | | 2,312 | |
Norway (0.3%) | | | | | |
Telenor ASA ‡ | | 27,100 | | 643 | |
Panama (0.2%) | | | | | |
Carnival Corp. | | 7,600 | | 338 | |
Poland (0.1%) | | | | | |
Polski Koncern Naftowy Orlen ‡ | | 7,300 | | 305 | |
Russian Federation (0.6%) | | | | | |
Gazprom OAO | | 23,400 | | 1,310 | |
Singapore (0.1%) | | | | | |
Capitaland, Ltd. | | 38,000 | | 165 | |
South Africa (0.4%) | | | | | |
Harmony Gold Mining Co., Ltd. ‡ | | 17,400 | | 179 | |
Harmony Gold Mining Co., Ltd. ‡ | | 12,100 | | 125 | |
Sasol, Ltd. | | 9,000 | | 447 | |
Spain (0.8%) | | | | | |
Banco Bilbao Vizcaya Argentaria SA | | 40,400 | | 983 | |
Banco Santander Central Hispano SA | | 20,400 | | 441 | |
Repsol YPF SA | | 8,300 | | 296 | |
Sweden (0.4%) | | | | | |
Eniro AB | | 40,300 | | 358 | |
TeliaSonera AB | | 60,500 | | 565 | |
Switzerland (4.4%) | | | | | |
Compagnie Financiere Richemont SA Class A | | 19,838 | | 1,355 | |
Holcim, Ltd. | | 16,302 | | 1,738 | |
Nestle SA | | 2,611 | | 1,199 | |
Nobel Biocare Holding AG | | 1,400 | | 373 | |
Novartis AG | | 32,869 | | 1,798 | |
Roche Holding AG | | 7,928 | | 1,370 | |
Swiss Reinsurance | | 11,901 | | 842 | |
Swisscom AG | | 1,504 | | 587 | |
Taiwan (0.5%) | | | | | |
High Tech Computer Corp. | | 7,410 | | 541 | |
Taiwan Semiconductor Manufacturing Co., Ltd. | | 51,225 | | 510 | |
Turkey (0.2%) | | | | | |
Turkcell Iletisim Hizmet As | | 19,000 | | 524 | |
United Kingdom (10.4%) | | | | | |
AstraZeneca PLC | | 25,500 | | 1,092 | |
AstraZeneca PLC | | 18,600 | | 801 | |
BAE Systems PLC | | 156,600 | | 1,552 | |
Barclays PLC | | 30,500 | | 306 | |
BHP Billiton PLC | | 22,947 | | 706 | |
HBOS PLC | | 55,500 | | 812 | |
HSBC Holdings PLC ‡ | | 25,800 | | 432 | |
Lloyds TSB Group PLC | | 40,200 | | 378 | |
Marks & Spencer Group PLC | | 25,300 | | 282 | |
Reuters Group PLC | | 71,700 | | 909 | |
Rio Tinto PLC | | 25,400 | | 2,688 | |
Royal Bank of Scotland Group PLC | | 104,300 | | 922 | |
Royal Dutch Shell PLC Class A | | 3,200 | | 270 | |
Royal Dutch Shell PLC Class A | | 84,968 | | 3,572 | |
Sabmiller PLC | | 95,300 | | 2,686 | |
Scottish & Southern Energy PLC | | 20,500 | | 668 | |
Standard Chartered PLC | | 14,800 | | 543 | |
Tesco PLC | | 101,900 | | 968 | |
Vodafone Group PLC | | 431,882 | | 1,615 | |
Yell Group PLC | | 63,400 | | 506 | |
The notes to the financial statements are an integral part of this report.
5
| | Shares | | Value | |
United States (34.6%) | | | | | |
Advanced Micro Devices, Inc. ‡^ | | 28,900 | | $ | 217 | |
Aflac, Inc. | | 14,000 | | 877 | |
Agilent Technologies, Inc. ‡ | | 11,000 | | 404 | |
Allergan, Inc. | | 7,800 | | 501 | |
Altera Corp. | | 50,600 | | 978 | |
American Capital Strategies, Ltd. ^ | | 7,900 | | 260 | |
American International Group, Inc. | | 15,750 | | 918 | |
American Tower Corp. Class A ‡ | | 8,800 | | 375 | |
Anheuser-Busch Cos., Inc. | | 6,700 | | 351 | |
Applied Materials, Inc. ^ | | 119,359 | | 2,120 | |
Arch Coal, Inc. | | 7,600 | | 342 | |
AT&T, Inc. | | 20,600 | | 856 | |
Baker Hughes, Inc. | | 10,600 | | 860 | |
Bank of America Corp. | | 14,000 | | 578 | |
Baxter International, Inc. | | 23,500 | | 1,364 | |
Beazer Homes USA, Inc. ^ | | 8,500 | | 63 | |
Berkshire Hathaway, Inc. Class A ‡ | | 11 | | 1,558 | |
Best Buy Co., Inc. | | 22,400 | | 1,179 | |
BJ Services Co. | | 28,200 | | 684 | |
Boeing Co. | | 10,600 | | 927 | |
Brocade Communications Systems, Inc. ‡ | | 64,200 | | 471 | |
Campbell Soup Co. | | 9,500 | | 339 | |
Capital One Financial Corp. | | 11,600 | | 548 | |
Chevron Corp. | | 5,438 | | 508 | |
Cisco Systems, Inc. ‡ | | 78,000 | | 2,112 | |
Citigroup, Inc. | | 8,200 | | 241 | |
Cleveland-Cliffs, Inc. | | 3,400 | | 343 | |
Comcast Corp. Class A ‡ | | 28,950 | | 529 | |
ConocoPhillips | | 5,700 | | 503 | |
Corning, Inc. | | 36,900 | | 885 | |
Danaher Corp. | | 12,200 | | 1,070 | |
Davita, Inc. ‡ | | 6,200 | | 349 | |
Dell, Inc. ‡ | | 11,600 | | 284 | |
Delta Petroleum Corp. ‡^ | | 12,900 | | 243 | |
eBay, Inc. ‡ | | 37,000 | | 1,228 | |
Energizer Holdings, Inc. ‡ | | 4,300 | | 482 | |
Exxon Mobil Corp. | | 5,500 | | 515 | |
Fannie Mae | | 30,600 | | 1,223 | |
FedEx Corp. | | 7,000 | | 624 | |
Fifth Third Bancorp | | 11,400 | | 287 | |
Fluor Corp. | | 7,900 | | 1,151 | |
Forest Laboratories, Inc. ‡ | | 23,600 | | 860 | |
Freddie Mac | | 50,700 | | 1,727 | |
Genentech, Inc. ‡ | | 26,200 | | 1,757 | |
General Electric Co. | | 37,300 | | 1,383 | |
General Mills, Inc. | | 5,400 | | 308 | |
Goldman Sachs Group, Inc. (The) | | 3,100 | | 667 | |
Google, Inc. Class A ‡ | | 2,900 | | 2,005 | |
Hanesbrands, Inc. ‡ | | 22,625 | | 615 | |
Hewlett-Packard Co. | | 17,200 | | 868 | |
Home Depot, Inc. | | 8,100 | | 218 | |
Hudson City Bancorp, Inc. | | 31,700 | | 476 | |
Illinois Tool Works, Inc. | | 24,100 | | 1,290 | |
Jabil Circuit, Inc. | | 14,900 | | 228 | |
JPMorgan Chase & Co. | | 29,888 | | 1,305 | |
KLA-Tencor Corp. ^ | | 31,500 | | 1,517 | |
Kraft Foods, Inc. Class A | | 20,600 | | 672 | |
LAM Research Corp. ‡ | | 9,600 | | 415 | |
Las Vegas Sands Corp. ‡ | | 2,900 | | 299 | |
Lehman Brothers Holdings, Inc. | | 12,000 | | 785 | |
Lennar Corp. Class A ^ | | 16,900 | | 302 | |
Lowe’s Cos., Inc. | | 39,700 | | 898 | |
Medtronic, Inc. | | 23,400 | | 1,176 | |
Microsoft Corp. | | 42,900 | | 1,527 | |
Monsanto Co. | | 7,900 | | 882 | |
Moody’s Corp. ^ | | 10,100 | | 361 | |
News Corp. Class A | | 51,513 | | 1,056 | |
Oracle Corp. ‡ | | 14,800 | | 334 | |
Paychex, Inc. | | 11,300 | | 409 | |
Peabody Energy Corp. | | 8,200 | | 505 | |
PepsiCo, Inc. | | 13,300 | | 1,010 | |
Polycom, Inc. ‡ | | 17,400 | | 483 | |
Progressive Corp. (The) ^ | | 2,400 | | 46 | |
Qualcomm, Inc. | | 28,100 | | 1,106 | |
SanDisk Corp. ‡ | | 48,800 | | 1,619 | |
Sara Lee Corp. | | 24,200 | | 389 | |
Sepracor, Inc. ‡ | | 12,400 | | 326 | |
SLM Corp. | | 29,600 | | 596 | |
Starwood Hotels & Resorts Worldwide, Inc. ‡ | | 13,700 | | 603 | |
SunTrust Banks, Inc. | | 5,400 | | 337 | |
Synthes, Inc. | | 3,328 | | 414 | |
Target Corp. | | 31,100 | | 1,555 | |
Time Warner Telecom, Inc. Class A ‡ | | 24,300 | | 493 | |
Time Warner, Inc. | | 55,550 | | 917 | |
United Parcel Service, Inc. Class B | | 15,300 | | 1,082 | |
United Technologies Corp. | | 13,100 | | 1,003 | |
UnitedHealth Group, Inc. | | 22,700 | | 1,321 | |
Wachovia Corp. | | 43,500 | | 1,654 | |
Walt Disney Co. (The) ‡ | | 41,900 | | 1,353 | |
Washington Mutual, Inc. ^ | | 16,500 | | 225 | |
Wells Fargo & Co. | | 14,600 | | 441 | |
Wyeth | | 6,900 | | 305 | |
Xilinx, Inc. | | 13,100 | | 287 | |
Yahoo!, Inc. ‡ | | 24,300 | | 565 | |
Total Common Stocks (cost $172,728) | | | | 203,912 | |
| | | | | |
Total Securities Lending Collateral (cost $9,868) (2) | | | | 9,868 | |
| | | | | |
Total Investment Securities (cost $183,005) # | | | | $ | 214,152 | |
The notes to the financial statements are an integral part of this report.
6
FORWARD FOREIGN CURRENCY CONTRACTS:
| | | | | | Amount in | | Net Unrealized | |
| | Bought | | Settlement | | U.S. Dollars | | Appreciation | |
Currency | | (Sold) | | Date | | Bought (Sold) | | (Depreciation) | |
Japanese Yen | | 2,784 | | 01/07/2008 | | $ | 25 | | $ | m | |
Japanese Yen | | 2,756 | | 01/08/2008 | | 24 | | m | |
Japanese Yen | | (91,145 | ) | 03/05/2008 | | (834 | ) | 13 | |
Japanese Yen | | (75,854 | ) | 03/18/2008 | | (676 | ) | (8 | ) |
Swiss Franc | | (2,018 | ) | 01/28/2008 | | (1,837 | ) | 52 | |
| | | | | | $ | (3,298 | ) | $ | 57 | |
| | Percentage of | | | |
(unaudited) | | Total Investments | | Value | |
INVESTMENTS BY INDUSTRY: | | | | | |
Oil, Gas & Consumable Fuels | | 8.1 | % | $ | 17,302 | |
Commercial Banks | | 6.4 | % | 13,743 | |
Metals & Mining | | 5.0 | % | 10,749 | |
Pharmaceuticals | | 5.0 | % | 10,666 | |
Chemicals | | 4.7 | % | 9,999 | |
Wireless Telecommunication Services | | 3.8 | % | 8,027 | |
Insurance | | 3.7 | % | 7,976 | |
Semiconductors & Semiconductor Equipment | | 3.7 | % | 7,901 | |
Media | | 2.6 | % | 5,627 | |
Energy Equipment & Services | | 2.6 | % | 5,457 | |
Beverages | | 2.5 | % | 5,451 | |
Computers & Peripherals | | 2.4 | % | 5,120 | |
Automobiles | | 2.3 | % | 4,927 | |
Internet Software & Services | | 2.3 | % | 4,856 | |
Software | | 2.2 | % | 4,706 | |
Communications Equipment | | 2.1 | % | 4,586 | |
Food Products | | 1.9 | % | 4,138 | |
Diversified Financial Services | | 1.9 | % | 4,126 | |
Thrifts & Mortgage Finance | | 1.9 | % | 4,023 | |
Diversified Telecommunication Services | | 1.9 | % | 3,996 | |
Machinery | | 1.8 | % | 3,854 | |
Specialty Retail | | 1.8 | % | 3,749 | |
Capital Markets | | 1.7 | % | 3,614 | |
Industrial Conglomerates | | 1.6 | % | 3,488 | |
Aerospace & Defense | | 1.6 | % | 3,482 | |
Food & Staples Retailing | | 1.6 | % | 3,482 | |
Health Care Equipment & Supplies | | 1.6 | % | 3,327 | |
Electronic Equipment & Instruments | | 1.5 | % | 3,208 | |
Construction Materials | | 1.4 | % | 3,034 | |
Air Freight & Logistics | | 1.2 | % | 2,652 | |
Textiles, Apparel & Luxury Goods | | 1.1 | % | 2,454 | |
Real Estate Management & Development | | 1.1 | % | 2,267 | |
Consumer Finance | | 1.0 | % | 2,194 | |
Biotechnology | | 1.0 | % | 2,093 | |
Multiline Retail | | 0.9 | % | 1,837 | |
Multi-Utilities | | 0.8 | % | 1,784 | |
Health Care Providers & Services | | 0.8 | % | 1,671 | |
Personal Products | | 0.6 | % | 1,261 | |
Hotels, Restaurants & Leisure | | 0.6 | % | 1,240 | |
Electrical Equipment | | 0.6 | % | 1,228 | |
| | | | | | |
The notes to the financial statements are an integral part of this report.
7
| | Percentage of | | | |
(unaudited) | | Total Investments | | Value | |
INVESTMENTS BY INDUSTRY (continued): | | | | | |
Household Durables | | 0.6 | % | $ | 1,171 | |
Construction & Engineering | | 0.5 | % | 1,151 | |
Trading Companies & Distributors | | 0.5 | % | 1,146 | |
Electric Utilities | | 0.4 | % | 898 | |
Road & Rail | | 0.3 | % | 689 | |
Office Electronics | | 0.3 | % | 673 | |
Paper & Forest Products | | 0.3 | % | 654 | |
Building Products | | 0.2 | % | 512 | |
Household Products | | 0.2 | % | 482 | |
Containers & Packaging | | 0.2 | % | 414 | |
Airlines | | 0.2 | % | 410 | |
IT Services | | 0.2 | % | 409 | |
Auto Components | | 0.2 | % | 380 | |
Investment Securities, at value | | 95.4 | % | 204,284 | |
Short-Term Investments | | 4.6 | % | 9,868 | |
Total Investments | | 100.0 | % | $ | 214,152 | |
| | | | | | | |
NOTES TO SCHEDULE OF INVESTMENTS:
m | | Value is less than $1. |
‡ | | Non-Income Producing. |
^ | | At December 31, 2007, all or a portion of this security is on loan (see Note 1). The value at December 31, 2007, of all securities on loan is $9,398. |
(1) | | Security valued as determined in good faith in accordance with procedures established by the Fund’s Board of Trustees. |
(2) | | Cash collateral for the Repurchase Agreements, valued at $3,577, that serves as collateral for securities lending, is invested in corporate bonds with interest rates and maturity dates ranging from 3.00% - 10.18% and 04/28/2008 - 12/01/2096, respectively. |
Ž | | The security has a perpetual maturity. The date shown is the next call date. |
# | | Aggregate cost for federal income tax purposes is $184,155. Aggregate gross unrealized appreciation for all securities in which there is an excess of value over tax cost and aggregate gross unrealized depreciation for all securities in which there is an excess of tax cost over value were $41,296, and $11,299, respectively. Net unrealized appreciation for tax purposes is $29,997. |
The notes to the financial statements are an integral part of this report.
8
Capital Guardian Global
STATEMENT OF ASSETS AND LIABILITIES
At December 31, 2007
(all amounts except per share amounts in thousands)
Assets: | | | |
Investment securities, at value (cost: $183,005)
(including securities loaned of $9,398) | | $ | 214,152 | |
Cash | | 4,833 | |
Foreign currency (cost:$4) | | 4 | |
Receivables: | | | |
Investment securities sold | | 88 | |
Shares sold | | 21 | |
Interest | | 14 | |
Income from loaned securities | | 5 | |
Dividends | | 212 | |
Dividend reclaims | | 47 | |
Unrealized appreciation on forward foreign currency contracts | | 65 | |
| | 219,441 | |
Liabilities: | | | |
Investment securities purchased | | 50 | |
Accounts payable and accrued liabilities: | | | |
Shares redeemed | | 158 | |
Management and advisory fees | | 184 | |
Distribution and service fees | | 3 | |
Administration fees | | 4 | |
Payable for collateral for securities on loan | | 9,868 | |
Unrealized depreciation on forward foreign currency contracts | | 8 | |
Other | | 67 | |
| | 10,342 | |
Net Assets | | $ | 209,099 | |
| | | |
Net Assets Consist of: | | | |
Capital Stock ($.01 par value) | | $ | 213 | |
Additional paid-in capital | | 151,712 | |
Undistributed (accumulated) net investment income | | 436 | |
Undistributed (accumulated) net realized gain from investment securities and foreign currency transactions | | 25,531 | |
Net unrealized appreciation on investment securities | | 31,147 | |
Net unrealized appreciation on translation of assets and liabilities denominated in foreign currencies | | 60 | |
Net Assets | | $ | 209,099 | |
Net Assets by Class: | | | |
Initial Class | | $ | 193,197 | |
Service Class | | 15,902 | |
Shares Outstanding: | | | |
Initial Class | | 19,716 | |
Service Class | | 1,628 | |
Net Asset Value and Offering Price Per Share: | | | |
Initial Class | | $ | 9.80 | |
Service Class | | 9.77 | |
STATEMENT OF OPERATIONS
For the year ended December 31, 2007
(all amounts in thousands)
Investment Income: | | | |
Dividends (net of withholding taxes on foreign dividends of $254) | | $ | 4,054 | |
Interest | | 113 | |
Income from loaned securities-net | | 94 | |
| | 4,261 | |
Expenses: | | | |
Management and advisory fees | | 2,278 | |
Printing and shareholder reports | | 28 | |
Custody fees | | 137 | |
Administration fees | | 44 | |
Legal fees | | 5 | |
Audit fees | | 24 | |
Trustees fees | | 8 | |
Distribution and service fees: | | | |
Service Class | | 35 | |
Other | | 3 | |
Total expenses | | 2,562 | |
| | | |
Net Investment Income | | 1,699 | |
| | | |
Net Realized Gain (Loss) from: | | | |
Investment securities | | 26,571 | |
Foreign currency transactions | | (283 | ) |
| | 26,288 | |
Net Increase (Decrease) in Unrealized Appreciation (Depreciation) on: | | | |
Investment securities | | (14,186 | ) |
Translation of assets and liabilities denominated in foreign currencies | | 95 | |
| | (14,091 | ) |
| | | |
Net Realized and Unrealized Gain: | | 12,197 | |
Net Increase In Net Assets Resulting from Operations | | $ | 13,896 | |
The notes to the financial statements are an integral part of this report.
9
Capital Guardian Global
STATEMENTS OF CHANGES IN NET ASSETS
For the years ended
(all amounts in thousands)
| | December 31, | | December 31, | |
| | 2007 | | 2006 | |
Increase (Decrease) in Net Assets From: | | | | | |
Operations: | | | | | |
Net investment income | | $ | 1,699 | | $ | 2,007 | |
Net realized gain from investment securities and foreign currency transactions | | 26,288 | | 18,669 | |
Change in unrealized appreciation (depreciation) on investment securities and foreign currency translation | | (14,091 | ) | 9,283 | |
| | 13,896 | | 29,959 | |
Distributions to Shareholders: | | | | | |
From net investment income: | | | | | |
Initial Class | | (1,764 | ) | (5,158 | ) |
Service Class | | (94 | ) | (247 | ) |
| | (1,858 | ) | (5,405 | ) |
From net realized gains: | | | | | |
Initial Class | | (17,744 | ) | (66,437 | ) |
Service Class | | (1,217 | ) | (3,411 | ) |
| | (18,961 | ) | (69,848 | ) |
Capital Share Transactions: | | | | | |
Proceeds from shares sold: | | | | | |
Initial Class | | 12,644 | | 21,065 | |
Service Class | | 5,481 | | 3,302 | |
| | 18,125 | | 24,367 | |
Dividends and distributions reinvested: | | | | | |
Initial Class | | 19,508 | | 71,595 | |
Service Class | | 1,311 | | 3,658 | |
| | 20,819 | | 75,253 | |
Cost of shares redeemed: | | | | | |
Initial Class | | (49,396 | ) | (43,255 | ) |
Service Class | | (2,739 | ) | (2,082 | ) |
| | (52,135 | ) | (45,337 | ) |
| | (13,191 | ) | 54,283 | |
Net increase (decrease) in net assets | | (20,114 | ) | 8,989 | |
| | | | | |
Net Assets: | | | | | |
Beginning of year | | 229,213 | | 220,224 | |
End of year | | $ | 209,099 | | $ | 229,213 | |
Undistributed (Accumulated) Net Investment Income (Loss) | | $ | 436 | | $ | 753 | |
Share Activity: | | | | | |
Shares issued: | | | | | |
Initial Class | | 1,213 | | 1,693 | |
Service Class | | 535 | | 283 | |
| | 1,748 | | 1,976 | |
Shares issued-reinvested from Distributions: | | | | | |
Initial Class | | 2,043 | | 7,584 | |
Service Class | | 137 | | 388 | |
| | 2,180 | | 7,972 | |
Shares redeemed: | | | | | |
Initial Class | | (4,731 | ) | (3,456 | ) |
Service Class | | (264 | ) | (166 | ) |
| | (4,995 | ) | (3,622 | ) |
Net increase (decrease) in shares outstanding: | | | | | |
Initial Class | | (1,475 | ) | 5,821 | |
Service Class | | 408 | | 505 | |
| | (1,067 | ) | 6,326 | |
The notes to the financial statements are an integral part of this report.
10
Capital Guardian Global
FINANCIAL HIGHLIGHTS
For a share outstanding throughout each period (a)
| | Initial Class | |
| | Year Ended December 31, | |
| | 2007 | | 2006 | | 2005 | | 2004 | | 2003 | |
| | | | | | | | | | | |
Net Asset Value | | | | | | | | | | | |
Beginning of period | | $ | 10.23 | | $ | 13.69 | | $ | 12.88 | | $ | 11.66 | | $ | 8.49 | |
Investment Operations | | | | | | | | | | | |
Net investment income (loss) | | 0.08 | | 0.11 | | 0.11 | | 0.08 | | 0.05 | |
Net realized and unrealized gain (loss) | | 0.53 | | 1.43 | | 1.17 | | 1.18 | | 3.14 | |
Total operations | | 0.61 | | 1.54 | | 1.28 | | 1.26 | | 3.19 | |
Distributions | | | | | | | | | | | |
From net investment income | | (0.09 | ) | (0.36 | ) | (0.06 | ) | (0.04 | ) | (0.02 | ) |
From net realized gains | | (0.95 | ) | (4.64 | ) | (0.41 | ) | — | | — | |
Total distributions | | (1.04 | ) | (5.00 | ) | (0.47 | ) | (0.04 | ) | (0.02 | ) |
Net Asset Value | | | | | | | | | | | |
End of period (b) | | $ | 9.80 | | $ | 10.23 | | $ | 13.69 | | $ | 12.88 | | $ | 11.66 | |
Total Return (c), (d) | | 6.31 | % | 14.32 | % | 10.18 | % | 10.88 | % | 37.60 | % |
Net Assets End of Period (000’s) | | $ | 193,197 | | $ | 216,762 | | $ | 210,441 | | $ | 409,831 | | $ | 271,610 | |
Ratio and Supplemental Data | | | | | | | | | | | |
Expenses to average net assets (e) | | 1.14 | % | 1.14 | % | 1.10 | % | 1.10 | % | 1.14 | % |
Net investment income (loss), to average net assets (e) | | 0.78 | % | 0.91 | % | 0.86 | % | 0.65 | % | 0.48 | % |
Portfolio turnover rate (d) | | 38 | % | 36 | % | 32 | % | 23 | % | 20 | % |
| | | | | | | | | | | |
For a share outstanding throughout each period (a) | | | | | | | |
| | | | | | | | | | | |
| | Service Class | |
| | Year Ended December 31, | | May 1 to Dec | |
| | 2007 | | 2006 | | 2005 | | 2004 | | 31, 2003 | |
| | | | | | | | | | | |
Net Asset Value | | | | | | | | | | | |
Beginning of period | | $ | 10.20 | | $ | 13.67 | | $ | 12.88 | | $ | 11.66 | | $ | 8.76 | |
Investment Operations | | | | | | | | | | | |
Net investment income (loss) | | 0.05 | | 0.08 | | 0.07 | | 0.05 | | (0.01 | ) |
Net realized and unrealized gain (loss) | | 0.54 | | 1.43 | | 1.17 | | 1.18 | | 2.91 | |
Total operations | | 0.59 | | 1.51 | | 1.24 | | 1.23 | | 2.90 | |
Distributions | | | | | | | | | | | |
From net investment income | | (0.07 | ) | (0.34 | ) | (0.04 | ) | (0.01 | ) | — | |
From net realized gains | | (0.95 | ) | (4.64 | ) | (0.41 | ) | — | | — | |
Total distributions | | (1.02 | ) | (4.98 | ) | (0.45 | ) | (0.01 | ) | — | |
Net Asset Value | | | | | | | | | | | |
End of period (b) | | $ | 9.77 | | $ | 10.20 | | $ | 13.67 | | $ | 12.88 | | $ | 11.66 | |
Total Return (c), (d) | | 6.10 | % | 14.00 | % | 9.90 | % | 10.60 | % | 33.11 | % |
Net Assets End of Period (000’s) | | $ | 15,902 | | $ | 12,451 | | $ | 9,783 | | $ | 5,832 | | $ | 1,212 | |
Ratio and Supplemental Data | | | | | | | | | | | |
Expenses to average net assets (e) | | 1.39 | % | 1.39 | % | 1.35 | % | 1.35 | % | 1.39 | % |
Net investment income (loss), to average net assets (e) | | 0.50 | % | 0.65 | % | 0.55 | % | 0.38 | % | (0.14 | )% |
Portfolio turnover rate (d) | | 38 | % | 36 | % | 32 | % | 23 | % | 20 | % |
(a) | | Per share information is calculated based on average number of shares outstanding. |
(b) | | Capital Guardian Global (the “Fund”) share class commenced operations as follows: |
| | Initial Class - February 3, 1998 |
| | Service Class - May 1, 2003 |
(c) | | Total Return reflects all portfolio expenses and includes reinvestment of dividends and capital gains; it does not reflect the charges and deductions under the policies or annuity contracts. |
(d) | | Not annualized. |
(e) | | Annualized. |
The notes to the financial statements are an integral part of this report.
11
Capital Guardian Global
NOTES TO FINANCIAL STATEMENTS
At December 31, 2007
(all amounts in thousands)
NOTE 1. ORGANIZATION AND SIGNIFICANT ACCOUNTING POLICIES
AEGON/Transamerica Series Trust (“ATST”) is an open-end management investment company registered under the Investment Company Act of 1940, as amended (the “1940 Act”). ATST serves as a funding vehicle for variable life insurance, variable annuity and group annuity products. Capital Guardian Global (the “Fund”) is part of ATST.
In the normal course of business, the Fund enters into contracts that contain a variety of representations that provide general indemnifications. The Fund’s maximum exposure under these arrangements is unknown, as this would involve future claims that may be made against the Fund and/or its affiliates that have not yet occurred. However, based on experience, the Fund expects the risk of loss to be remote.
This report should be read in conjunction with the current Fund prospectus, which contains more complete information about the Fund.
In preparing the Fund’s financial statements in accordance with accounting principles generally accepted in the United States of America (“GAAP”), estimates or assumptions (which could differ from actual results) may be used that affect reported amounts and disclosures. The following is a summary of significant accounting policies followed by the Fund.
Multiple class operations, income and expenses: The Fund currently offers two classes of shares, an Initial Class and a Service Class. Income, non-class specific expenses and realized and unrealized gains and losses, are allocated daily to each class, based upon the value of shares outstanding method as permitted under Rule 18f-3 of the 1940 Act. Each class bears its own specific expenses as well as a portion of general, common expenses.
Security valuations: The Fund values its investments at the close of the New York Stock Exchange (“NYSE”), normally 4 p.m. ET, each day the NYSE is open for business. Fund investments are valued at the last sale price or closing price on the day of valuation taken from the primary exchange where the security is principally traded.
Securities traded in the over-the-counter market and listed securities for which no sale was reported on that date are valued at the last quoted bid price.
Debt securities are valued based on a price quotation or other equivalent indication of value supplied by an exchange, a pricing service or a major market maker; however, those that mature in sixty days or less are valued at amortized cost, which approximates market.
Investment company securities are valued at the net asset value of the underlying portfolio.
Foreign securities generally are valued based on quotations from the primary market in which they are traded. Because many foreign securities markets and exchanges close prior to the close of the NYSE, closing prices for foreign securities in those markets or on those exchanges do not reflect the events that occur after that close. If a significant market event impacting the value of a portfolio security (e.g., natural disaster, company announcement, market volatility) occurs subsequent to the close of trading in the security, but prior to the calculation of the Fund’s net asset value per share, market quotations for that security may be determined to be unreliable and, accordingly, not “readily available.” As a result, foreign equity securities held by the Fund may be valued at fair market value as determined in good faith by the Fund’s Administrative Valuation Committee, using guidelines adopted by the Board of Trustees.
Other securities for which quotations are not readily available are valued at fair market value as determined in good faith by the Fund’s Administrative Valuation Committee, using guidelines adopted by the Board of Trustees.
Cash: The Fund may leave cash overnight in its cash account with the custodian, State Street Bank & Trust Company (“State Street”). On July 2, 2007, State Street acquired the parent company of Investors Bank & Trust Company. State Street has been contracted on behalf of the Fund to invest the excess cash into a savings account, which at December 31, 2007 was paying an interest rate of 2.60%.
Repurchase agreements: The Fund is authorized to enter into repurchase agreements. The Fund, through its custodian, State Street, receives delivery of the underlying securities, the value of which at the time of purchase is required to be an amount equal to at least 100% of the resale price. The Fund will bear the risk of value fluctuations until the security can be sold and may encounter delays and incur costs in liquidating the security. In the event of bankruptcy or insolvency of the seller, delays and costs may be incurred.
Commission recapture: The sub-adviser, to the extent consistent with the best execution and usual commission rate policies and practices, may place security transactions of the Fund with broker/dealers with which ATST has established a Commission Recapture Program. A Commission Recapture Program is any arrangement under which a broker/dealer applies a portion of the commissions received by such broker/dealer on the security transactions to the Fund. In no event will commissions paid by the Fund be used to pay expenses that would otherwise be borne by any other funds within ATST, or by any other party.
Recaptured commissions during the year ended December 31, 2007 of $7 are included in net realized gains in the Statement of Operations.
Securities lending: The Fund may lend securities to qualified borrowers, with State Street acting as the Fund’s lending agent. The Fund earns negotiated lenders’ fees. The Fund receives cash and/or securities as collateral against the loaned securities. Cash collateral received is invested in short-term, interest-bearing securities. The Fund monitors the market value
12
NOTES TO FINANCIAL STATEMENTS (continued)
At December 31, 2007
(all amounts in thousands)
NOTE 1. – (continued)
of securities loaned on a daily basis and requires collateral in an amount at least equal to the value of the securities loaned. Income from loaned securities earned by State Street for its services, shown in the Statement of Operations is net of fees, in the amount of $40.
The Fund has invested the cash collateral received from securities loaned in the following short-term, interest-bearing securities:
Abbey National PLC, Eurodollar Term, 5.00%, 1/7/2008 | | $ | 426 | |
ABN AMRO Bank NV, Eurodollar Term, 5.18%, 1/4/2008 | | 341 | |
Bank of Nova Scotia, Eurodollar Term, 4.96%, 1/22/2008 | | 298 | |
Barclays, Eurodollar Term, 5.00%, 2/12/2008 | | 596 | |
BNP Paribas, Eurodollar Term, 5.01%, 1/11/2008 | | 554 | |
Calydon, Eurodollar Term, 5.12%, 3/3/2008 | | 128 | |
Credit Suisse First Boston Corp., Repurchase Agreement, 4.60%, 1/2/2008 | | 1,108 | |
Dexia Group, Eurodollar Term, 4.82%, 1/3/2008 | | 426 | |
HBOS Halifax Bank of Scotland, Eurodollar Term, 5.15%, 1/2/2008 | | 213 | |
JPMorgan Chase & Co., Eurodollar Term, 5.15%, 2/12/2008 | | 213 | |
Lloyds TSB Bank, Eurodollar Term, 5.15%, 1/24/2008 | | 426 | |
Merrill Lynch & Co. (RPG), Repurchase Agreement, 4.60%, 1/2/2008 | | 639 | |
Morgan Stanley & Co. (Corp. Repo), Repurchase Agreement, 4.60%, 1/2/2008 | | 1,746 | |
Rabobank Nederland, Eurodollar Term, 5.08%, 1/10/2008 | | 511 | |
Reserve Primary Money Market Fund, 4.95% | | 454 | |
Royal Bank of Scotland, Eurodollar Term, 5.00%, 2/25/2008 | | 511 | |
Societe Generale, Eurodollar Term, 5.15%, 3/3/2008 | | 256 | |
Toronto Dominion Bank, Eurodollar Term, 5.05%, 1/10/2008 | | 511 | |
UBS AG, Eurodollar Term, 4.92%, 1/11/2008 | | 298 | |
Wells Fargo, Bank Note, 4.75%, 1/8/2008 | | 213 | |
| | | |
| | $ | 9,868 | |
Security transactions and investment income: Security transactions are recorded on the trade date. Security gains and losses are calculated on the first-in, first-out basis. Dividend income, if any, is recorded on the ex-dividend date or, in the case of foreign securities, as soon as the Fund is informed of the ex-dividend date. Interest income, including accretion of discounts and amortization of premiums, is recorded on the accrual basis commencing on the settlement date.
Foreign currency denominated investments: The accounting records of the Fund are maintained in U.S. dollars. Securities and other assets and liabilities denominated in foreign currencies are translated into U.S. dollars at the closing exchange rate each day. The cost of foreign securities is translated at the exchange rate in effect when the investment was acquired. The Fund combines fluctuations from currency exchange rates and fluctuations in value when computing net realized and unrealized gains or losses from investments.
Net foreign currency gains and losses resulting from changes in exchange rates include: 1) foreign currency fluctuations between trade date and settlement date of investment security transactions; 2) gains and losses on forward foreign currency contracts; and 3) the difference between the receivable amounts of interest and dividends recorded in the accounting records in U.S. dollars and the amounts actually received. Foreign currency denominated assets may involve risks not typically associated with domestic transactions. These risks include revaluation of currencies, adverse fluctuations in foreign currency values and possible adverse political, social and economic developments, including those particular to a specific industry, country or region.
Forward foreign currency contracts: The Fund may enter into forward foreign currency contracts to hedge against exchange rate risk arising from investments in securities denominated in foreign currencies. Contracts are valued at the contractual forward rate and are marked to market daily, with the change in value recorded as an unrealized gain or loss. When the contracts are settled a realized gain or loss is incurred. Risks may arise from changes in market value of the underlying currencies and from the possible inability of counterparties to meet the terms of their contracts.
Open forward foreign currency contracts at December 31, 2007, are listed in the Schedule of Investments.
Dividend distributions: Dividends and capital gains distributions are typically declared and reinvested annually and are generally paid and reinvested on the business day following the ex-date.
NOTE 2. RELATED PARTY TRANSACTIONS
ATST serves as a funding vehicle for certain affiliated asset allocation portfolios and certain affiliated separate accounts of Western Reserve Life Assurance Co. of Ohio, Transamerica Life Insurance Company, Transamerica Financial Life Insurance Company, Inc., Monumental Life Insurance Company and Transamerica Occidental Life Insurance Company.
Transamerica Fund Advisors, Inc. (“TFAI”) is the Fund’s investment adviser. Transamerica Fund Services, Inc. (“TFS”) is the Fund’s administrator and transfer agent. Prior to May 1, 2007, AFSG Securities Corp. (“AFSG”), was the Fund’s distributor. Transamerica Capital Inc. (“TCI”) is now the Fund’s distributor. TFAI, TFS, AFSG, and TCI are affiliates of AEGON NV, a Netherlands corporation.
Certain officers and trustees of the Fund are also officers and/or directors of TFAI, TFS and TCI.
Investment advisory fee: The Fund pays management fees to TFAI based on average daily net assets (“ANA”) at the following breakpoints:
1.05% of the first $125 million of ANA
1.00% of the next $125 million of ANA
0.90% of the next $150 million of ANA
0.825% of the next $350 million of ANA
0.80% of the next $250 million of ANA
0.75% of the next $1 billion of ANA
0.70% of ANA over $2 billion
13
NOTES TO FINANCIAL STATEMENTS (continued)
At December 31, 2007
(all amounts in thousands)
NOTE 2. – (continued)
TFAI has contractually agreed to waive its advisory fee and will reimburse the Fund to the extent that operating expenses, excluding 12b-1 fees, exceed the following stated annual limit:
1.32% Expense Limit
If total Fund expenses fall below the annual expense limitation agreement agreed to by the adviser within the succeeding three years, the Fund may be required to pay the adviser a portion or all of the waived advisory fees.
There were no amounts recaptured during the year ended December 31, 2007. There are no amounts available for recapture at December 31, 2007.
Distribution and service fees: ATST entered into a Distribution Agreement with AFSG dated January 1, 1997, as amended. On May 1, 2007, the Distribution Agreement was amended to replace AFSG with TCI as the Fund’s distributor. The Fund has also adopted a distribution plan (“Distribution Plan”) pursuant to Rule 12b-1 under the 1940 Act.
Under the Distribution Plan for the Initial Class shares, TCI, on behalf of the Fund, is authorized to pay various service providers, as direct payment for expenses incurred in connection with distribution of the Fund’s shares, amounts equal to actual expenses associated with distributing the shares.
The Distribution Plan for the Service Class shares requires ATST to pay distribution fees to TCI as compensation for its activities, not as reimbursement for specific expenses. The fee on the Service Class is paid to the insurance companies for providing services and account maintenance for their policyholders who invest in the variable insurance products which invest in the Service Class shares.
The Fund is authorized under the Distribution Plan to pay fees on each class up to the following limits:
Initial Class | | 0.15 | % |
Service Class | | 0.25 | % |
TCI has determined that it will not seek payment by the Fund of the distribution expenses incurred with respect to the Initial Class shares before April 30, 2009. Prior to TCI seeking reimbursement of future expenses, policy and contract owners will be notified in advance. The Fund will pay fees relating to Service Class shares.
Administrative services: The Fund has entered into an agreement with TFS for financial and legal fund administration services. The Fund pays TFS an annual fee of 0.02% of ANA. The Legal fees on the Statement of Operations are for fees paid to external legal counsel.
Deferred compensation plan: Each eligible independent Fund Trustee may elect participation in a non-qualified deferred compensation plan (“the Plan”). Under the Plan, such Trustees may defer payment of all or a portion of their total fees earned as a Fund Trustee. Each Trustee who is a participant in the Plan may elect that the earnings, losses or gains credited to his or her deferred fee amounts be determined based on a deemed investment in any series of Transamerica IDEX Mutual Funds. The right of a participant to receive a distribution from the Plan of the deferred fees is an unsecured claim against the general assets of all series of Transamerica IDEX Mutual Funds. The pro rata liability to the Fund of all deferred fees in the Plan amounted, as of December 31, 2007, to $10. Amounts deferred under the Deferred Compensation Plan are unfunded against the general assets of ATST.
Retirement plan: Under a retirement plan (the “Emeritus Plan”) available to the Independent Trustees, each Independent Trustee is deemed to have elected to serve as Trustee Emeritus of ATST upon his or her termination of service, other than removal for cause, and is entitled to 50% of the trustee’s current retainer for a maximum period of five years determined by his or her years of service as a Trustee.
Such amounts shall be accrued by ATST on a pro rata basis allocable to each series of ATST fund based on the relative assets of the series. If retainers increase in the future, past accruals (and credits) will be adjusted upward so that 50% of the Trustee’s current retainer is accrued and credited at all times. Upon death, disability or termination of service, other than removal for cause, amounts deferred become payable to a Trustee Emeritus (or his/her beneficiary). Upon the commencement of service as Trustee Emeritus, compensation will be paid on a quarterly basis during the time period that the Trustee Emeritus is allowed to serve as such.
Amounts accrued under the Emeritus Plan are unsecured claims against the general assets of ATST. For the year ended December 31, 2007, the amount related to the Emeritus Plan was $9. As of December 31, 2007, the Fund has not made any payments related to the Emeritus Plan.
The Emeritus Plan was terminated effective October 30, 2007. Upon the termination, the Fund shall continue to pay any remaining benefits in accordance with the Plan, but no further compensation shall accrue under the Plan.
NOTE 3. INVESTMENT TRANSACTIONS
The cost of securities purchased and proceeds from securities sold (excluding short-term securities) for the year ended December 31, 2007 were as follows:
Purchases of securities: | | | |
Long-term | | $ | 82,916 | |
U.S. Government | | — | |
Proceeds from maturities and sales of securities: | | | |
Long-term | | 117,097 | |
U.S. Government | | — | |
| | | | |
14
NOTES TO FINANCIAL STATEMENTS (continued)
At December 31, 2007
(all amounts in thousands)
NOTE 4. FEDERAL INCOME TAX MATTERS
The Fund has not made any provision for federal income or excise taxes due to its policy to distribute all of its taxable income and capital gains to its shareholders and otherwise qualify as a regulated investment company under Subchapter M of the Internal Revenue Code. Income and capital gain distributions are determined in accordance with income tax regulations, which may differ from GAAP. These differences are primarily due to differing treatment for items including, but not limited to, wash sales, foreign currency transactions, passive foreign investment companies and post October loss deferrals.
Therefore, distributions determined in accordance with tax regulations may differ significantly in amount or character from net investment income and realized gains for financial reporting purposes. Financial reporting records are adjusted for permanent book/tax differences to reflect tax character. Financial records are not adjusted for temporary differences. These reclassifications are as follows:
Additional paid-in capital | | $ | — | |
Undistributed (accumulated) net investment income (loss) | | $ | (158 | ) |
Undistributed (accumulated) net realized gain (loss) from investment securities | | $ | 158 | |
The tax character of distributions paid may differ from the character of distributions shown in the Statements of Changes in Net Assets due to short-term gains being treated as ordinary income for tax purposes. The tax character of distributions paid during 2006 and 2007 was as follows:
2006 Distributions paid from: | | | |
Ordinary Income | | $ | 10,367 | |
Long-term Capital Gain | | 64,886 | |
2007 Distributions paid from: | | | |
Ordinary Income | | 4,083 | |
Long-term Capital Gain | | 16,736 | |
| | | | |
The tax basis components of distributable earnings as of December 31, 2007 are as follows:
Undistributed Ordinary Income | | $ | 2,783 | |
Undistributed Long-term Capital Gain | | $ | 24,531 | |
Capital Loss Carryforward | | $ | — | |
Post October Capital Loss Deferral | | $ | — | |
Post October Currency Loss Deferral | | $ | (140 | ) |
Net Unrealized Appreciation (Depreciation) | | $ | 30,000 | * |
* Amount includes unrealized appreciation (depreciation) from foreign currency.
NOTE 5. REGULATORY PROCEEDINGS
There continues to be significant federal and state regulatory activity relating to financial services companies, particularly mutual fund companies and their investment advisers. As part of an ongoing investigation regarding potential market timing, recordkeeping and trading compliance issues and matters affecting the Fund’s investment adviser, TFAI, and certain affiliates and former employees of TFAI, the SEC staff has indicated that it is likely to take some action against TFAI and certain of its affiliates at the conclusion of the investigation. The potential timing and the scope of any such action is difficult to predict. Although the impact of any action brought against TFAI and/or its affiliates is difficult to assess at the present time, the Fund currently believes that the likelihood that any such action will have a material adverse impact is remote. It is important to note that the Fund is not aware of any allegation of wrong doing against it and its Board at the time this annual report is printed. Although it is not anticipated that these developments will have an adverse impact on the Fund, there can be no assurance at this time. TFAI and its affiliates are actively working with the SEC in regard to this matter; however, the exact resolution cannot be determined at this time. TFAI will take such actions that it deems necessary or appropriate to continue providing management services to the Fund and to bring all matters to an appropriate conclusion.
TFAI and/or its affiliates, and not the Fund, will bear the costs regarding these regulatory matters.
NOTE 6. RECENTLY ISSUED ACCOUNTING PRONOUNCEMENTS
In July 2006, the Financial Accounting Standards Board (“FASB”) released FASB Interpretation No. 48 “Accounting for Uncertainty in Income Taxes” (“FIN 48”), an interpretation of FASB Statement No. 109. FIN 48 provides guidance for how uncertain tax positions should be recognized, measured, presented and disclosed in the financial statements. FIN 48 requires the accounting and disclosure of tax positions taken or expected to be taken in the course of preparing the Fund’s tax returns to determine whether the tax positions are “more-likely- than-not” of being sustained by the applicable tax authority. Tax positions not deemed to meet the more-likely-than-not threshold would be recorded as a tax benefit or expense in the current year.
Adoption of FIN 48 is effective during the first required financial reporting period for fiscal years beginning after December 15, 2006. Management adopted FIN 48 on June 29, 2007.
Implementation of FIN 48 requires Management of the Fund to analyze all open tax years, as defined by the Statute of Limitations, for all major jurisdictions, which includes federal and certain states. Open tax years are those that are open for exam by taxing authorities (i.e., the last 4 tax year ends and the interim tax period since then). The Fund has no examinations in progress and none are expected at this time.
Management of the Fund has reviewed all open tax years and major jurisdictions and concluded the adoption of FIN 48 resulted in no impact to the Fund’s net assets or results of operations. There is no tax liability resulting from unrecognized tax benefits relating to uncertain income tax positions taken or expected to be taken in future tax returns. The Fund is also not aware of any tax positions for which it is reasonably possible
15
NOTES TO FINANCIAL STATEMENTS (continued)
At December 31, 2007
(all amounts in thousands)
NOTE 6. – (continued)
that the total amounts of unrecognized tax benefits will significantly change in the next 12 months.
In September 2006, FASB issued its new Standard No. 157, “Fair Value Measurements” (“FAS 157”). FAS 157 is designed to unify guidance for the measurement of fair value of all types of assets, including financial instruments, and certain liabilities, throughout a number of accounting standards. FAS 157 also establishes a hierarchy for measuring fair value in generally accepted accounting principles and expands financial statement disclosures about fair value measurements that are relevant to mutual funds. FAS 157 is effective for financial statements issued for fiscal years beginning after November 15, 2007, and earlier application is permitted.
As of December 31, 2007, Management does not expect the adoption of FAS 157 to impact the amounts reported in the financial statements, however, additional disclosures will be required about the inputs used to develop the measurements of fair value and the effect of certain of the measurements reported in the statement of operations for a fiscal period.
NOTE 7. SUBSEQUENT EVENT
Effective January 1, 2008, TFAI changed its name to Transamerica Asset Management, Inc.
Effective May 1, 2008, AEGON/Transamerica Series Trust will change its name to Transamerica Series Trust. At that time, the Fund will also change its name to Transamerica Capital Guardian Global VP.
16
Report of Independent Registered Certified Public Accounting Firm
To the Board of Trustees and Shareholders of
Capital Guardian Global:
In our opinion, the accompanying statement of assets and liabilities, including the schedule of investments, and the related statements of operations and of changes in net assets and the financial highlights present fairly, in all material respects, the financial position of Capital Guardian Global (the “Fund”) (one of the portfolios constituting AEGON/Transamerica Series Trust) at December 31, 2007, the results of its operations for the year then ended, the changes in its net assets for each of the two years in the period then ended and the financial highlights for each of the periods presented, in conformity with accounting principles generally accepted in the United States of America. These financial statements and financial highlights (hereafter referred to as “financial statements”) are the responsibility of the Fund’s management; our responsibility is to express an opinion on these financial statements based on our audits. We conducted our audits of these financial statements in accordance with the standards of the Public Company Accounting Oversight Board (United States). Those standards require that we plan and perform the audit to obtain reasonable assurance about whether the financial statements are free of material misstatement. An audit includes examining, on a test basis, evidence supporting the amounts and disclosures in the financial statements, assessing the accounting principles used and significant estimates made by management, and evaluating the overall financial statement presentation. We believe that our audits, which included confirmation of securities at December 31, 2007 by correspondence with the custodian and brokers, provide a reasonable basis for our opinion.

Tampa, Florida
February 29, 2008
17
Capital Guardian Global
SUPPLEMENTAL TAX INFORMATION (unaudited)
(all amounts in thousands)
For tax purposes, the Fund has made a Long-Term Capital Gain Designation of $16,736 for the year ended December 31, 2007.
RESULTS OF SHAREHOLDER PROXY (unaudited)
At a special meeting of shareholders held on October 30, 2007, the results of the Proposals were as follows:
Proposal 1: To elect a new Board:
Proposed
Trustee | | For | | Against | | Abstentions/Broker Non-
Votes | |
John K. Carter | | 2,274,998,840.817 | | 57,804,698.755 | | 35,433.883 | |
| | | | | | | |
Leo J. Hill | | 2,277,212,702.754 | | 55,590,836.819 | | 35,433.883 | |
| | | | | | | |
Neal M. Jewell | | 2,266,793,295.663 | | 66,010,243.909 | | 35,433.883 | |
| | | | | | | |
Russell A. Kimball, Jr. | | 2,274,825,235.835 | | 57,978,303.737 | | 35,433.883 | |
| | | | | | | |
Eugene M. Mannella | | 2,274,623,165.033 | | 58,180,374.539 | | 35,433.883 | |
| | | | | | | |
Norm R. Nielsen | | 2,275,050,055.885 | | 57,753,483.687 | | 35,433.883 | |
| | | | | | | |
Joyce Galpern Norden | | 2,270,278,122.250 | | 62,525,417.323 | | 35,433.883 | |
| | | | | | | |
Patricia L. Sawyer | | 2,275,737,737.456 | | 57,065,802.116 | | 35,433.883 | |
| | | | | | | |
John W. Waechter | | 2,276,615,120.140 | | 56,188,419.433 | | 35,433.883 | |
Proposal 2: To approve an amendment to the Agreement and Declaration of Trust:
For | | Against | | Abstentions/Broker Non-
Votes | |
2,182,022,669.110 | | 77,590,048.544 | | 73,226,255.801 | |
18
Capital Guardian Global
INVESTMENT ADVISORY AND SUB-ADVISORY AGREEMENTS-REVIEW AND RENEWAL (unaudited)
At a meeting of the Board of Trustees of AEGON/Transamerica Series Trust (“ATST”) held on December 4th, 2007, the Board reviewed and considered the renewal of the investment advisory agreement (the “Investment Advisory Agreement”) between Capital Guardian Global (the “Fund”) and Transamerica Fund Advisors, Inc. (“TFAI”), as well as the renewal of the investment sub-advisory agreement (the “Sub-Advisory Agreement”) of the Fund between TFAI and Capital Guardian Trust Company (the “Sub-Adviser”), to determine whether the agreements should be renewed for a six-month period. It was noted that this review was interim in nature to align all the Funds on the same calendar, and that the Funds’ advisory arrangements would be reviewed again in the first half of 2008.
Following their review and consideration, the Trustees determined that the renewal of the Investment Advisory Agreement and the Sub-Advisory Agreement would enable shareholders of the Fund to obtain high quality services at a cost that is appropriate, fair, and in the best interests of its shareholders. The Board, including the independent members of the Board, unanimously approved the renewal of the Investment Advisory Agreement and Sub-Advisory Agreement. In reaching their decision, the Trustees requested and obtained from TFAI and the Sub-Adviser such information as they deemed reasonably necessary to evaluate the agreements, including information about fees and performance of comparable funds managed by the Sub-Adviser. The Trustees also carefully considered information they had previously received from TFAI and the Sub-Adviser throughout the year as part of their regular oversight of the Fund, as well as comparative fee, expense, and performance information prepared by Lipper Inc. (“Lipper”), an independent provider of mutual fund performance, fee and expense information and profitability data prepared by management. In considering the proposed continuation of the Investment Advisory and Sub-Advisory Agreements, the Trustees evaluated a number of considerations that they believed, in light of the legal advice furnished to them by independent legal counsel and their own business judgment, to be relevant. They based their decisions on a variety of factors, including the following considerations, among others, although they did not identify any consideration or particular information that was controlling of their decisions:
The nature, extent and quality of the advisory services to be provided. The Board considered the nature and quality of the services provided by TFAI and the Sub-Adviser to the Fund in the past, as well as the services anticipated to be provided in the future. The Board concluded that TFAI and the Sub-Adviser are capable of providing high quality services to the Fund, as indicated by the nature and quality of services provided in the past by TFAI and the Sub-Adviser for this series and the experience, capability and integrity of TFAI’s senior management, the financial resources of TFAI and the Sub-Adviser, TFAI’s management oversight process and the professional qualifications of the portfolio management team of the Sub-Adviser. The Trustees determined that TFAI and the Sub-Adviser can provide investment and related services that are appropriate in scope and extent in light of the Fund’s operations, the competitive landscape of the investment company business and investor needs.
The investment performance of the Fund. The Board examined the short and longer-term performance of the Fund, including relative performance against a peer group of comparable mutual funds as prepared by Lipper for various trailing periods ended June 30, 2007. The Board noted that the performance of the Fund over both a short and long-term period has lagged relative to its peer universe, but the Fund has turned in consistent positive returns. On the basis of the Board’s assessment of the nature, extent and quality of advisory services to be provided or procured by TFAI and the Sub-Adviser, the Board concluded that TFAI and the Sub-Adviser are capable of providing a level of investment performance that is appropriate in light of the Fund’s proposed investment objectives, policies and strategies and competitive with other similarly situated investment companies, but the Board noted that they would be monitoring performance closely.
The cost of advisory services provided and the level of profitability. The Board reviewed profitability information of TFAI’s cost of procuring fund management services, as well as the costs of provision of administration, fund accounting and other services, to the Fund and to ATST as a whole by TFAI and its affiliates. The Board reviewed the management and sub-advisory fees for the Fund. The Board noted that fees and expenses are higher than the peer group and universe of funds, but that the Sub-Adviser was not willing to reduce fees further. Based on their review, the Trustees determined that the management fees of the Fund were acceptable under the circumstances in light of the services expected to be provided or procured, the management fees and the anticipated profitability of the relationship between the Fund, TFAI and its affiliates, and the Sub-Adviser. In making these observations and determinations, the Board reviewed, among other things, comparative information provided by Lipper.
Whether fee levels reflect economies of scale and the extent to which economies of scale would be realized as the Fund grows. In evaluating the extent to which the management fees payable under the Investment Advisory and Sub-Advisory Agreements reflect economies of scale or will permit economies of scale to be realized in the future, the Board noted that TFAI and the Sub-Adviser offer breakpoints which appropriately benefit investors by passing on economies of scale in the form of lower management fees as the level of assets grows. The Board further noted that the Advisor offers additional breakpoints above those offered by the Sub-Adviser. The Trustees also concluded that they will have the opportunity to periodically reexamine whether the Fund has achieved economies of scale, and the appropriateness of management fees payable to TFAI and fees paid to the Sub-Adviser, in the future.
Benefits (such as soft dollars) to TFAI, its affiliates, or the Sub-Adviser from their relationship with the Fund. The Board concluded that other benefits anticipated to be derived by TFAI, its affiliates, and the Sub-Adviser from their relationships with the Fund are expected to be reasonable and fair, and consistent with industry practice and the best interests of the Fund and its shareholders. The Trustees noted that TFAI would not realize soft dollar benefits from its relationship with the Fund. The Board also noted that the Sub-Adviser is participating in a brokerage program pursuant to which a portion of brokerage commissions paid by the Fund is recaptured for the benefit of the Fund and its shareholders, thus limiting the amount of soft dollar arrangements the Sub-Adviser may engage in with respect to the Fund’s brokerage transactions.
19
Other considerations. The Board determined that TFAI has made a substantial commitment to the recruitment and retention of high quality personnel, and maintains the financial, compliance and operational resources reasonably necessary to manage the Fund in a professional manner that is consistent with the best interests of the Fund and its shareholders. In this regard, the Trustees favorably considered the procedures and policies in place by TFAI to enforce compliance with applicable laws and regulations and oversee the portfolio management activities of the Sub-Adviser. The Trustees also determined that TFAI has made a significant entrepreneurial commitment to the management and success of the Fund, reflected by TFAI’s expense limitation and fee waiver arrangements with the Fund which may result in TFAI waiving a substantial amount of management fees for the benefit of shareholders.
20
Capital Guardian U.S. Equity
MARKET ENVIRONMENT
U.S. equities made small gains in a year dominated by fluctuating liquidity levels and corporate profits. Stocks soared to new highs on record merger and acquisition (“M&A”) activity and earnings, and then dropped dramatically as the tap of cheap money dried up in the wake of the sub-prime mortgage crisis. By year’s end earnings had begun to slide and investors grew concerned about the possibility of an economic recession.
Stocks soared for much of the year as easy money supported a record $4.7 trillion in worldwide deals. Companies reported strong corporate earnings and the economy accelerated. But ripples of sub-prime mortgage trouble appeared in February and June before bursting open in the third quarter. The fallout incorporated two main elements: the lower value of sub-prime mortgages and related investments; and the effect of the crisis on financial institutions that wrote down the value of their mortgage assets and subsequently faced severe financing constraints. Though the Federal Reserve Board cut interest rates three times and worked with other central banks to inject liquidity into the system, earnings began to decline and the outlook for economic growth looked bleak by December, while 2007’s stock market gains were nearly erased. The Standard and Poor’s 500 Composite Stock Index (“S&P 500”) ended the year up 5.49%.
The sell-off was most acutely felt by financial companies, which had their worst year since 1990. Citigroup Inc. was the biggest drag on the S&P 500 after it announced staggering losses. Consumer discretionary stocks slid as concerns about the economy grew. Other sectors posted double-digit gains, however. Energy stocks climbed as oil futures rose by nearly 60%; materials advanced on demand from the emerging markets; and utilities benefited both from the M&A boom and the flight to safety amid the turmoil. Information technology (“IT”) stocks also jumped, led by Apple Inc. after the unveiling of its iPhone.
Economic data showed that while the housing market was at its weakest level in decades, other critical measures of the economy, including employment, held up well throughout most of the year. Real gross domestic product (“GDP”) growth accelerated to 4.9% in the third quarter, though by the end of 2007 durable goods data and other economic indicators showed signs of strain.
PERFORMANCE
For the year ended December 31, 2007, Capital Guardian U.S. Equity, Initial Class returned (0.15)%. By comparison its benchmark, the S&P 500, returned 5.49%.
STRATEGY REVIEW
The portfolio’s underperformance was due primarily to stock selection in the IT and financials sectors during the fourth quarter.
Rising investor concern about the U.S. economy and capital spending negatively impacted some technology holdings, including contract manufacturers and semiconductor memory companies SanDisk Corporation, Micron Technology, Inc. and Jabil Circuit, Inc.
The credit crunch further intensified concerns about the housing market, sub-prime mortgages, and collateralized debt obligations, hurting several of our holdings among thrifts and bond insurers, including Washington Mutual, Inc., which was the biggest detractor to portfolio returns. The largest U.S. savings and loan saw its shares tumble as the housing and credit markets deteriorated and after regulators began investigating how the company set values for mortgages sold to investors. Other decliners in the financials area included Wachovia Corporation, Ambac Financial Group, Inc., MBIA Inc. and SLM Corporation (“Sallie Mae”), which sank after a $25 billion proposed takeover collapsed. Selection in health care and the underweight position in energy also weighed on returns.
The choice of materials stocks, especially Potash Corporation of Saskatchewan Inc., was positive for the portfolio. The stock gained as demand for fertilizers increased throughout the year. Google Inc. was the top contributor to returns as the company posted consistently solid results.
Michael R. Ericksen David I. Fisher Eugene P. Stein Terry Berkemeier | | Karen A. Miller Theodore R. Samuels Alan J. Wilson |
| | |
Co-Portfolio Managers Capital Guardian Trust Company | | |
AEGON/Transamerica Series Trust | | Annual Report 2007 |
1
Capital Guardian U.S. Equity
(unaudited)
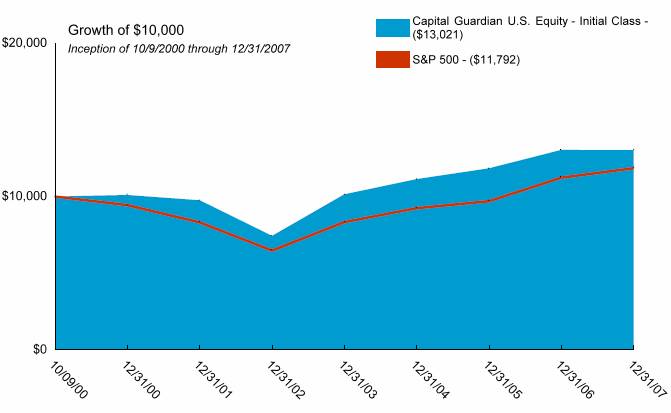
Average Annual Total Return for Periods Ended 12/31/2007
| | | | | | From | | Inception | |
| | 1 Year | | 5 Years | | Inception | | Date | |
| | | | | | | | | |
Initial Class | | (0.15 | )% | 11.86 | % | 3.72 | % | 10/9/00 | |
S&P 500(1) | | 5.49 | % | 12.83 | % | 2.31 | % | 10/9/00 | |
| | | | | | | | | |
Service Class | | (0.39 | )% | — | % | 10.70 | % | 5/1/03 | |
NOTES
(1) The Standard and Poor’s 500 Composite Stock (S&P 500) Index is an unmanaged index used as a general measure of market performance.
Calculations assume dividends and capital gains are reinvested and do not include any managerial expenses. From inception calculation is based on life of Initial Class shares.
The performance data presented represents past performance; future results may vary. The portfolio’s investment return and net asset value will fluctuate. Past performance does not guarantee future results. Investor’s units when redeemed may be worth more or less than their original cost.
Current performance may be lower or higher than performance quoted. Please visit your insurance company’s website for contract or policy level standardized total returns current to the most recent month end. Portfolio performance is net of investment fees and fund expenses, but not product charges, which, if included, would significantly lower the performance quoted.
This material must be preceded or accompanied by a current prospectus, which includes specific contents regarding the investment objectives, explanation of share classes and policies of this portfolio.
2
Capital Guardian U.S. Equity
UNDERSTANDING YOUR FUND’S EXPENSES
(unaudited)
SHAREHOLDER EXPENSES
Fund shareholders may incur ongoing costs, including management and advisory fees, distribution and service fees, and other fund expenses.
The following Example is intended to help you understand your ongoing costs (in dollars and cents) of investing in the Fund and to compare these costs with the ongoing costs of investing in other funds.
The Example is based on an investment of $1,000 invested at July 1, 2007 and held for the entire period until December 31, 2007.
ACTUAL EXPENSES
The first line in the table below provides information about actual account values and actual expenses. You may use the information in this line, together with the amount you invested, to estimate the expenses that you paid over the period. Simply divide your account value by $1,000 (for example, an $8,600 account value divided by $1,000 = 8.6), then multiply the result by the number in the first line of your Fund under the heading entitled “Expenses Paid During Period” to estimate the expenses you paid on your account during this period.
HYPOTHETICAL EXAMPLE FOR COMPARISON PURPOSES
The second line in the table below provides information about hypothetical account values and hypothetical expenses based on the Fund’s actual expense ratio and an assumed rate of return of 5% per year before expenses, which is not the Fund’s actual return. The hypothetical account values and expenses may not be used to estimate the actual ending account balance or expenses you paid for the period. You may use this information to compare the ongoing costs of investing in your Fund and other funds. To do so, compare this 5% hypothetical example with the 5% hypothetical examples that appear in the shareholder reports of the other funds.
Please note that the expenses shown in the table are meant to highlight your ongoing costs only and do not reflect any transactional costs, such as sales charges, redemption fees, brokerage commissions paid on purchases and sales of fund shares. Therefore, the second line under the Fund in the table is useful in comparing ongoing costs only, and will not help you determine the relative total costs of owning different funds. If any of these transaction costs were included, your costs would be higher. The expenses shown in the table do not reflect any fees that may be charged to you by brokers, financial intermediaries or other financial institutions.
| | Beginning | | Ending | | Annualized | | Expenses | |
| | Account | | Account | | Expense | | Paid During | |
| | Value | | Value | | Ratio | | Period (a) | |
| | | | | | | | | |
Initial Class | | | | | | | | | |
Actual | | $ | 1,000.00 | | $ | 934.46 | | 0.87 | % | $ | 4.24 | |
Hypothetical (b) | | 1,000.00 | | 1,020.82 | | 0.87 | | 4.43 | |
| | | | | | | | | |
Service Class | | | | | | | | | |
Actual | | 1,000.00 | | 933.74 | | 1.12 | | 5.46 | |
Hypothetical (b) | | 1,000.00 | | 1,019.56 | | 1.12 | | 5.70 | |
| | | | | | | | | | | | |
(a) | Expenses are calculated using the Fund’s annualized expense ratio (as disclosed in the table), multiplied by the average account value for the period, multiplied by the number of days in the period (184 days), and divided by the number of days in the year (365 days). |
| |
(b) | 5% return per year before expenses. |
GRAPHICAL PRESENTATION OF SCHEDULE OF INVESTMENTS
By Sector
At December 31, 2007
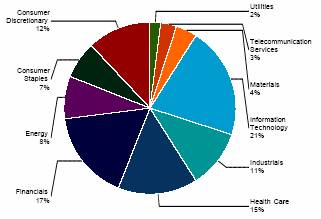
This chart shows the percentage breakdown by sector of the Fund’s total investment securities.
3
Capital Guardian U.S. Equity
SCHEDULE OF INVESTMENTS
At December 31, 2007
(all amounts except share amounts in thousands)
| | Shares | | Value | |
CONVERTIBLE PREFERRED STOCKS (0.7%) | | | | | |
Consumer Finance (0.1%) | | | | | |
SLM Corp., ‡ | | 180 | | $ | 186 | |
Pharmaceuticals (0.2%) | | | | | |
Schering-Plough, | | 1,800 | | 437 | |
Thrifts & Mortgage Finance (0.4%) | | | | | |
Washington Mutual, Inc., ‡ ^ | | 1,030 | | 912 | |
Total Convertible Preferred Stocks (cost $1,646) | | | | $ | 1,535 | |
| | Principal | | Value | |
CONVERTIBLE BONDS (0.3%) | | | | | |
Automobiles (0.3%) | | | | | |
Ford Motor Co. | | | | | |
4.25%, due 12/15/2036 | | $ | 629 | | $ | 625 | |
Total Convertible Bonds (cost $633) | | | | 625 | |
| | | | | | | |
| | Shares | | Value | |
COMMON STOCKS (97.9%) | | | | | |
Aerospace & Defense (1.8%) | | | | | |
Boeing Co. | | 21,300 | | $ | 1,863 | |
United Technologies Corp. | | 25,200 | | 1,929 | |
Air Freight & Logistics (2.2%) | | | | | |
FedEx Corp. | | 9,300 | | 829 | |
United Parcel Service, Inc. Class B | | 53,600 | | 3,791 | |
Airlines (0.2%) | | | | | |
Southwest Airlines Co. | | 35,400 | | 432 | |
Auto Components (0.3%) | | | | | |
Johnson Controls, Inc. | | 17,900 | | 645 | |
Automobiles (0.8%) | | | | | |
Ford Motor Co. ‡^ | | 176,300 | | 1,186 | |
General Motors Corp. | | 19,000 | | 473 | |
Beverages (2.1%) | | | | | |
Anheuser-Busch Cos., Inc. | | 9,500 | | 497 | |
Coca-Cola Co. (The) | | 25,100 | | 1,540 | |
PepsiCo, Inc. | | 33,000 | | 2,505 | |
Biotechnology (3.1%) | | | | | |
Genentech, Inc. ‡ | | 61,700 | | 4,139 | |
ImClone Systems, Inc. ‡ | | 36,700 | | 1,578 | |
Millennium Pharmaceuticals, Inc. ‡ | | 67,900 | | 1,017 | |
Building Products (0.1%) | | | | | |
Owens Corning, Inc. ‡^ | | 10,900 | | 220 | |
Capital Markets (2.6%) | | | | | |
American Capital Strategies, Ltd. ^ | | 19,300 | | 636 | |
Goldman Sachs Group, Inc. (The) | | 15,200 | | 3,269 | |
Lehman Brothers Holdings, Inc. | | 24,500 | | 1,603 | |
Chemicals (1.7%) | | | | | |
Monsanto Co. | | 7,700 | | 860 | |
Potash Corp. of Saskatchewan | | 18,800 | | 2,707 | |
Commercial Banks (3.1%) | | | | | |
Fifth Third Bancorp | | 23,600 | | $ | 593 | |
SunTrust Banks, Inc. | | 12,600 | | 788 | |
Wachovia Corp. | | 93,714 | | 3,564 | |
Wells Fargo & Co. | | 54,400 | | 1,642 | |
Commercial Services & Supplies (0.1%) | | | | | |
Monster Worldwide, Inc. ‡ | | 9,300 | | 301 | |
Communications Equipment (3.1%) | | | | | |
Ciena Corp. ‡^ | | 8,300 | | 283 | |
Cisco Systems, Inc. ‡ | | 110,500 | | 2,991 | |
Corning, Inc. | | 22,700 | | 545 | |
Polycom, Inc. ‡ | | 17,600 | | 489 | |
Qualcomm, Inc. | | 59,600 | | 2,345 | |
Computers & Peripherals (3.1%) | | | | | |
Brocade Communications Systems, Inc. ‡ | | 88,600 | | 650 | |
Dell, Inc. ‡ | | 34,400 | | 843 | |
Hewlett-Packard Co. | | 22,057 | | 1,114 | |
Network Appliance, Inc. ‡ | | 9,700 | | 242 | |
SanDisk Corp. ‡ | | 70,600 | | 2,342 | |
Seagate Technology | | 41,900 | | 1,069 | |
Sun Microsystems, Inc. ‡ | | 25,000 | | 453 | |
Construction & Engineering (1.3%) | | | | | |
Fluor Corp. | | 18,900 | | 2,754 | |
Consumer Finance (1.3%) | | | | | |
AmeriCredit Corp. ‡^ | | 23,900 | | 306 | |
Capital One Financial Corp. | | 15,200 | | 718 | |
SLM Corp. ^ | | 88,200 | | 1,776 | |
Diversified Financial Services (2.3%) | | | | | |
JPMorgan Chase & Co. | | 101,704 | | 4,439 | |
Moody’s Corp. | | 12,200 | | 436 | |
Diversified Telecommunication Services (2.2%) | | | | | |
AT&T, Inc. | | 52,400 | | 2,178 | |
Level 3 Communications, Inc. ‡^ | | 149,900 | | 455 | |
Time Warner Telecom, Inc. Class A ‡ | | 68,500 | | 1,390 | |
Verizon Communications, Inc. | | 14,400 | | 629 | |
Electric Utilities (1.5%) | | | | | |
Allegheny Energy, Inc. | | 8,400 | | 534 | |
CMS Energy Corp. ^ | | 43,000 | | 748 | |
Edison International | | 25,900 | | 1,382 | |
Pinnacle West Capital Corp. | | 15,200 | | 645 | |
Electrical Equipment (0.6%) | | | | | |
Cooper Industries, Ltd. Class A | | 13,800 | | 730 | |
Emerson Electric Co. | | 11,300 | | 640 | |
Electronic Equipment & Instruments (1.3%) | | | | | |
Agilent Technologies, Inc. ‡ | | 17,200 | | 632 | |
Flextronics International, Ltd. ‡ | | 52,400 | | 632 | |
Jabil Circuit, Inc. | | 79,200 | | 1,209 | |
Tyco International, Ltd. | | 8,700 | | 345 | |
Energy Equipment & Services (3.4%) | | | | | |
Baker Hughes, Inc. | | 15,000 | | 1,216 | |
BJ Services Co. | | 53,200 | | 1,291 | |
Schlumberger, Ltd. | | 32,700 | | 3,217 | |
The notes to the financial statements are an integral part of this report.
4
Energy Equipment & Services (continued) | | | | | |
Weatherford International, Ltd. ‡ | | 23,200 | | $ | 1,591 | |
Food & Staples Retailing (0.5%) | | | | | |
Costco Wholesale Corp. | | 9,600 | | 670 | |
Walgreen Co. | | 11,300 | | 430 | |
Food Products (2.6%) | | | | | |
Campbell Soup Co. | | 16,800 | | 600 | |
General Mills, Inc. | | 6,700 | | 382 | |
Kraft Foods, Inc. Class A | | 65,450 | | 2,136 | |
Sara Lee Corp. | | 89,300 | | 1,434 | |
Unilever NV | | 24,800 | | 904 | |
Health Care Equipment & Supplies (2.2%) | | | | | |
Baxter International, Inc. | | 52,500 | | 3,048 | |
Medtronic, Inc. | | 34,500 | | 1,734 | |
Health Care Providers & Services (2.9%) | | | | | |
Davita, Inc. ‡ | | 26,300 | | 1,482 | |
UnitedHealth Group, Inc. | | 82,500 | | 4,802 | |
Health Care Technology (0.3%) | | | | | |
Cerner Corp. ‡^ | | 10,900 | | 615 | |
Hotels, Restaurants & Leisure (1.4%) | | | | | |
Las Vegas Sands Corp. ‡^ | | 12,500 | | 1,288 | |
McDonald’s Corp. | | 15,700 | | 925 | |
Starbucks Corp. ‡ | | 19,100 | | 391 | |
Starwood Hotels & Resorts Worldwide, Inc. ‡ | | 10,500 | | 462 | |
Household Durables (0.5%) | | | | | |
Jarden Corp. ‡^ | | 11,200 | | 264 | |
Leggett & Platt, Inc. | | 32,500 | | 567 | |
Lennar Corp. Class A ^ | | 12,400 | | 222 | |
Household Products (0.3%) | | | | | |
Energizer Holdings, Inc. ‡ | | 5,400 | | 606 | |
Independent Power Producers & Energy Traders (0.2%) | | | | | |
AES Corp. (The) ‡ | | 20,400 | | 436 | |
Industrial Conglomerates (2.6%) | | | | | |
General Electric Co. | | 133,700 | | 4,956 | |
Siemens AG | | 3,800 | | 598 | |
Insurance (4.4%) | | | | | |
Aflac, Inc. | | 13,900 | | 871 | |
AMBAC Financial Group, Inc. ^ | | 33,200 | | 856 | |
American International Group, Inc. | | 49,100 | | 2,863 | |
Berkshire Hathaway, Inc. Class A ‡ | | 12 | | 1,699 | |
Marsh & McLennan Cos., Inc. | | 46,900 | | 1,241 | |
MBIA, Inc. ^ | | 41,400 | | 771 | |
Progressive Corp. (The) | | 29,400 | | 563 | |
XL Capital, Ltd. Class A | | 13,100 | | 659 | |
Internet Software & Services (4.9%) | | | | | |
eBay, Inc. ‡ | | 88,300 | | 2,931 | |
Google, Inc. Class A ‡ | | 8,400 | | 5,808 | |
Yahoo!, Inc. ‡ | | 72,900 | | 1,696 | |
IT Services (1.0%) | | | | | |
Affiliated Computer Services, Inc. Class A ‡ | | 11,200 | | 505 | |
Cognizant Technology Solutions Corp. Class A ‡^ | | 10,400 | | 353 | |
Paychex, Inc. | | 17,000 | | $ | 616 | |
Verifone Holdings, Inc. ‡^ | | 24,700 | | 574 | |
Machinery (1.7%) | | | | | |
Caterpillar, Inc. | | 6,400 | | 464 | |
Danaher Corp. | | 15,400 | | 1,351 | |
Illinois Tool Works, Inc. | | 30,700 | | 1,644 | |
Parker Hannifin Corp. | | 3,000 | | 226 | |
Media (3.2%) | | | | | |
CBS Corp. Class B | | 36,100 | | 984 | |
Comcast Corp. Class A ‡ | | 29,550 | | 540 | |
Gannett Co., Inc. | | 14,500 | | 566 | |
Omnicom Group, Inc. | | 13,600 | | 646 | |
Time Warner Cable, Inc. Class A ‡ | | 18,800 | | 519 | |
Time Warner, Inc. | | 32,250 | | 532 | |
Viacom, Inc. Class B ‡ | | 14,050 | | 617 | |
Walt Disney Co. (The) ‡ | | 74,500 | | 2,405 | |
Metals & Mining (2.4%) | | | | | |
Allegheny Technologies, Inc. | | 3,000 | | 259 | |
Barrick Gold Corp. | | 59,300 | | 2,494 | |
Cleveland-Cliffs, Inc. | | 4,000 | | 403 | |
Freeport-McMoRan Copper & Gold, Inc. | | 6,000 | | 615 | |
Newmont Mining Corp. | | 18,200 | | 889 | |
Nucor Corp. | | 7,400 | | 438 | |
Multiline Retail (1.9%) | | | | | |
Nordstrom, Inc. | | 14,100 | | 518 | |
Target Corp. | | 70,300 | | 3,515 | |
Oil, Gas & Consumable Fuels (4.5%) | | | | | |
Anadarko Petroleum Corp. | | 5,500 | | 361 | |
Arch Coal, Inc. | | 11,400 | | 512 | |
Chevron Corp. | | 10,219 | | 954 | |
ConocoPhillips | | 11,900 | | 1,051 | |
EOG Resources, Inc. | | 5,400 | | 482 | |
Exxon Mobil Corp. | | 20,200 | | 1,893 | |
Peabody Energy Corp. | | 9,500 | | 586 | |
Royal Dutch Shell PLC Class B | | 16,580 | | 1,376 | |
Royal Dutch Shell PLC Class A | | 28,900 | | 2,433 | |
Personal Products (0.3%) | | | | | |
Avon Products, Inc. | | 8,100 | | 320 | |
Bare Essentials, Inc. ‡^ | | 14,800 | | 359 | |
Pharmaceuticals (6.4%) | | | | | |
Abbott Laboratories | | 16,800 | | 943 | |
Allergan, Inc. | | 28,100 | | 1,805 | |
AstraZeneca PLC | | 53,300 | | 2,282 | |
Bristol-Myers Squibb Co. | | 42,800 | | 1,135 | |
Forest Laboratories, Inc. ‡ | | 59,700 | | 2,176 | |
Pfizer, Inc. | | 52,200 | | 1,187 | |
Sanofi-Aventis SA | | 43,300 | | 1,972 | |
Sepracor, Inc. ‡ | | 31,400 | | 824 | |
Teva Pharmaceutical Industries, Ltd. | | 19,900 | | 925 | |
Wyeth | | 12,700 | | 561 | |
Real Estate Investment Trusts (0.2%) | | | | | |
Douglas Emmett, Inc. REIT | | 13,800 | | 312 | |
Host Hotels & Resorts, Inc. REIT ^ | | 8,754 | | 149 | |
The notes to the financial statements are an integral part of this report.
5
| | Shares | | Value | |
Semiconductors & Semiconductor Equipment (5.0%) | | | | | |
Altera Corp. | | 70,300 | | $ | 1,358 | |
Applied Materials, Inc. | | 153,200 | | 2,721 | |
Intel Corp. | | 42,200 | | 1,125 | |
KLA-Tencor Corp. | | 50,400 | | 2,427 | |
LAM Research Corp. ‡ | | 11,200 | | 484 | |
Linear Technology Corp. ^ | | 13,500 | | 430 | |
Micron Technology, Inc. ‡^ | | 186,800 | | 1,354 | |
Qimonda AG ‡ | | 42,500 | | 304 | |
Silicon Laboratories, Inc. ‡ | | 4,000 | | 150 | |
Xilinx, Inc. | | 14,000 | | 306 | |
Software (2.1%) | | | | | |
Microsoft Corp. | | 93,500 | | 3,329 | |
Oracle Corp. ‡ | | 34,400 | | 777 | |
SAP AG ^ | | 8,800 | | 449 | |
Specialty Retail (3.1%) | | | | | |
Best Buy Co., Inc. | | 47,400 | | 2,495 | |
Home Depot, Inc. | | 31,000 | | 835 | |
Lowe’s Cos., Inc. | | 116,300 | | 2,631 | |
Urban Outfitters, Inc. ‡^ | | 27,800 | | 758 | |
Textiles, Apparel & Luxury Goods (0.7%) | | | | | |
Coach, Inc. ‡ | | 8,100 | | 248 | |
Hanesbrands, Inc. ‡ | | 43,037 | | 1,169 | |
Thrifts & Mortgage Finance (2.9%) | | | | | |
Fannie Mae | | 36,500 | | $ | 1,459 | |
Freddie Mac | | 36,300 | | 1,237 | |
Hudson City Bancorp, Inc. | | 117,300 | | 1,762 | |
IndyMac Bancorp, Inc. ^ | | 43,000 | | 256 | |
Washington Mutual, Inc. ^ | | 107,600 | | 1,464 | |
Tobacco (1.1%) | | | | | |
Altria Group, Inc. | | 30,300 | | 2,290 | |
Wireless Telecommunication Services (0.4%) | | | | | |
American Tower Corp. Class A ‡ | | 20,000 | | 852 | |
Total Common Stocks (cost $196,002) | | | | 209,717 | |
| | | | | |
Total Securities Lending Collateral (cost $13,859) (1) | | | | 13,859 | |
| | | | | |
Total Investment Securities (cost $212,140) # | | | | $ | 225,736 | |
| | | | | | | | |
NOTES TO SCHEDULE OF INVESTMENTS:
^ At December 31, 2007, all or a portion of this security is on loan (see Note 1). The value at December 31, 2007 of all securities on loan is $13,133.
‡ Non-Income Producing.
(1) Cash collateral for the Repurchase Agreements, valued at $5,024, that serves as collateral for securities lending, is invested in corporate bonds with interest rates and maturity dates ranging from 3.00% - 10.18% and 04/28/2008 - 12/01/2096, respectively.
Ž The security has a perpetual maturity. The date shown is the next call date.
# Aggregate cost for federal income tax purposes is $212,676. Aggregate gross unrealized appreciation for all securities in which there is an excess of value over tax cost and aggregate gross unrealized depreciation for all securities in which there is an excess of tax cost over value were $35,306 and $22,246, respectively. Net unrealized appreciation for tax purposes is $13,060.
DEFINITIONS:
REIT Real Estate Investment Trust
The notes to the financial statements are an integral part of this report.
6
Capital Guardian U.S. Equity
STATEMENT OF ASSETS AND LIABILITIES
At December 31, 2007
(all amounts except per share amounts in thousands)
Assets: | | | |
Investment securities, at value (cost: $212,140)
(including securities loaned of $13,133) | | $ | 225,736 | |
Cash | | 2,783 | |
Receivables: | | | |
Investment securities sold | | 720 | |
Shares sold | | 19 | |
Interest | | 11 | |
Income from loaned securities | | 7 | |
Dividends | | 324 | |
| | 229,600 | |
Liabilities: | | | |
Investment securities purchased | | 1,178 | |
Accounts payable and accrued liabilities: | | | |
Shares redeemed | | 145 | |
Management and advisory fees | | 149 | |
Distribution and service fees | | 2 | |
Administration fees | | 4 | |
Payable for collateral for securities on loan | | 13,859 | |
Other | | 52 | |
| | 15,389 | |
Net Assets | | $ | 214,211 | |
| | | |
Net Assets Consist of: | | | |
Capital Stock ($.01 par value) | | $ | 211 | |
Additional paid-in capital | | 166,409 | |
Undistributed (accumulated) net investment income | | 1,873 | |
Undistributed (accumulated) net realized gain from investment securities | | 32,122 | |
Net unrealized appreciation on investment securities | | 13,596 | |
Net Assets | | $ | 214,211 | |
Net Assets by Class: | | | |
Initial Class | | $ | 202,356 | |
Service Class | | 11,855 | |
Shares Outstanding: | | | |
Initial Class | | 19,937 | |
Service Class | | 1,170 | |
Net Asset Value and Offering Price Per Share: | | | |
Initial Class | | $ | 10.15 | |
Service Class | | 10.14 | |
STATEMENT OF OPERATIONS
For the year ended December 31, 2007
(all amounts in thousands)
Investment Income: | | | |
Dividends (net of withholding taxes on foreign dividends of $44) | | $ | 3,800 | |
Interest | | 131 | |
Income from loaned securities-net | | 87 | |
| | 4,018 | |
| | | |
Expenses: | | | |
Management and advisory fees | | 1,961 | |
Printing and shareholder reports | | 26 | |
Custody fees | | 42 | |
Administration fees | | 49 | |
Legal fees | | 5 | |
Audit fees | | 20 | |
Trustees fees | | 9 | |
Distribution and service fees: | | | |
Service Class | | 29 | |
Other | | 4 | |
Total expenses | | 2,145 | |
| | | |
Net Investment Income | | 1,873 | |
| | | |
Net Realized Gain (Loss) from: | | | |
Investment securities | | 32,672 | |
| | | |
Net Increase (Decrease) in Unrealized Appreciation (Depreciation) on: | | | |
Investment securities | | (33,078 | ) |
| | | |
Net Realized and Unrealized (Loss): | | (406 | ) |
Net Increase In Net Assets Resulting from Operations | | $ | 1,467 | |
The notes to the financial statements are an integral part of this report.
7
Capital Guardian U.S. Equity
STATEMENTS OF CHANGES IN NET ASSETS
For the years ended
(all amounts in thousands)
| | December 31, | | December 31, | |
| | 2007 | | 2006 | |
Increase (Decrease) in Net Assets From: | | | | | |
Operations: | | | | | |
Net investment income | | $ | 1,873 | | $ | 1,688 | |
Net realized gain from investment securities | | 32,672 | | 21,138 | |
Change in unrealized appreciation (depreciation) on investment securities | | (33,078 | ) | 2,298 | |
| | 1,467 | | 25,124 | |
Distributions to Shareholders: | | | | | |
From net investment income: | | | | | |
Initial Class | | (1,622 | ) | (1,360 | ) |
Service Class | | (56 | ) | (36 | ) |
| | (1,678 | ) | (1,396 | ) |
From net realized gains: | | | | | |
Initial Class | | (19,884 | ) | (22,250 | ) |
Service Class | | (1,011 | ) | (951 | ) |
| | (20,895 | ) | (23,201 | ) |
Capital Share Transactions: | | | | | |
Proceeds from shares sold: | | | | | |
Initial Class | | 6,813 | | 23,316 | |
Service Class | | 3,484 | | 2,246 | |
| | 10,297 | | 25,562 | |
Dividends and distributions reinvested: | | | | | |
Initial Class | | 21,505 | | 23,610 | |
Service Class | | 1,068 | | 987 | |
| | 22,573 | | 24,597 | |
Cost of shares redeemed: | | | | | |
Initial Class | | (55,170 | ) | (53,167 | ) |
Service Class | | (2,946 | ) | (1,569 | ) |
| | (58,116 | ) | (54,736 | ) |
| | (25,246 | ) | (4,577 | ) |
Net increase (decrease) in net assets | | (46,352 | ) | (4,050 | ) |
| | | | | |
Net Assets: | | | | | |
Beginning of year | | 260,563 | | 264,613 | |
End of year | | $ | 214,211 | | $ | 260,563 | |
Undistributed (Accumulated) Net Investment Income (Loss) | | $ | 1,873 | | $ | 1,678 | |
Share Activity: | | | | | |
Shares issued: | | | | | |
Initial Class | | 603 | | 2,024 | |
Service Class | | 314 | | 197 | |
| | 917 | | 2,221 | |
Shares issued-reinvested from distributions: | | | | | |
Initial Class | | 2,029 | | 2,253 | |
Service Class | | 101 | | 94 | |
| | 2,130 | | 2,347 | |
Shares redeemed: | | | | | |
Initial Class | | (4,853 | ) | (4,633 | ) |
Service Class | | (261 | ) | (138 | ) |
| | (5,114 | ) | (4,771 | ) |
Net increase (decrease) in shares outstanding: | | | | | |
Initial Class | | (2,221 | ) | (356 | ) |
Service Class | | 154 | | 153 | |
| | (2,067 | ) | (203 | ) |
The notes to the financial statements are an integral part of this report.
8
Capital Guardian U.S. Equity
FINANCIAL HIGHLIGHTS
For a share outstanding throughout each period(a)
| | Initial Class | |
| | Year Ended December 31, | |
| | 2007 | | 2006 | | 2005 | | 2004 | | 2003 | |
Net Asset Value | | | | | | | | | | | |
Beginning of period | | $ | 11.24 | | $ | 11.32 | | $ | 11.02 | | $ | 10.07 | | $ | 7.39 | |
Investment Operations | | | | | | | | | | | |
Net investment income (loss) | | 0.09 | | 0.07 | | 0.06 | | 0.06 | | 0.04 | |
Net realized and unrealized gain (loss) | | (0.06 | ) | 1.00 | | 0.62 | | 0.92 | | 2.65 | |
Total operations | | 0.03 | | 1.07 | | 0.68 | | 0.98 | | 2.69 | |
Distributions | | | | | | | | | | | |
From net investment income | | (0.08 | ) | (0.07 | ) | (0.06 | ) | (0.03 | ) | (0.01 | ) |
From net realized gains | | (1.04 | ) | (1.08 | ) | (0.32 | ) | — | | — | |
Total distributions | | (1.12 | ) | (1.15 | ) | (0.38 | ) | (0.03 | ) | (0.01 | ) |
Net Asset Value | | | | | | | | | | | |
End of period(b) | | $ | 10.15 | | $ | 11.24 | | $ | 11.32 | | $ | 11.02 | | $ | 10.07 | |
Total Return(c),(d) | | (0.15 | )% | 10.11 | % | 6.31 | % | 9.77 | % | 36.50 | % |
Net Assets End of Period (000’s) | | $ | 202,356 | | $ | 249,151 | | $ | 254,860 | | $ | 266,915 | | $ | 238,949 | |
Ratio and Supplemental Data | | | | | | | | | | | |
Expenses to average net assets(e) | | 0.86 | % | 0.86 | % | 0.89 | % | 0.90 | % | 0.91 | % |
Net investment income (loss), to average net assets(e) | | 0.78 | % | 0.66 | % | 0.55 | % | 0.57 | % | 0.41 | % |
Portfolio turnover rate(d) | | 37 | % | 27 | % | 35 | % | 23 | % | 20 | % |
For a share outstanding throughout each period(a)
| | Service Class | |
| | Year Ended December 31, | | May 1 to Dec | |
| | 2007 | | 2006 | | 2005 | | 2004 | | 31, 2003 | |
Net Asset Value | | | | | | | | | | | |
Beginning of period | | $ | 11.23 | | $ | 11.31 | | $ | 11.02 | | $ | 10.07 | | $ | 7.96 | |
Investment Operations | | | | | | | | | | | |
Net investment income (loss) | | 0.06 | | 0.05 | | 0.03 | | 0.04 | | 0.01 | |
Net realized and unrealized gain (loss) | | (0.05 | ) | 0.99 | | 0.63 | | 0.92 | | 2.10 | |
Total operations | | 0.01 | | 1.04 | | 0.66 | | 0.96 | | 2.11 | |
Distributions | | | | | | | | | | | |
From net investment income | | (0.06 | ) | (0.04 | ) | (0.05 | ) | (0.01 | ) | — | |
From net realized gains | | (1.04 | ) | (1.08 | ) | (0.32 | ) | — | | — | |
Total distributions | | (1.10 | ) | (1.12 | ) | (0.37 | ) | (0.01 | ) | — | |
Net Asset Value | | | | | | | | | | | |
End of period(b) | | $ | 10.14 | | $ | 11.23 | | $ | 11.31 | | $ | 11.02 | | $ | 10.07 | |
Total Return(c),(d) | | (0.39 | )% | 9.87 | % | 6.06 | % | 9.49 | % | 26.50 | % |
Net Assets End of Period (000’s) | | $ | 11,855 | | $ | 11,412 | | $ | 9,753 | | $ | 8,120 | | $ | 2,331 | |
Ratio and Supplemental Data | | | | | | | | | | | |
Expenses to average net assets(e) | | 1.11 | % | 1.11 | % | 1.14 | % | 1.15 | % | 1.16 | % |
Net investment income (loss), to average net assets(e) | | 0.53 | % | 0.40 | % | 0.29 | % | 0.38 | % | 0.17 | % |
Portfolio turnover rate(d) | | 37 | % | 27 | % | 35 | % | 23 | % | 20 | % |
(a) | Per share information is calculated based on average number of shares outstanding. |
(b) | Capital Guardian U.S. Equity (the “Fund”) share class commenced operations as follows: Initial Class - October 9, 2000 Service Class - May 1, 2003 |
(c) | Total Return reflects all portfolio expenses and includes reinvestment of dividends and capital gains; it does not reflect the charges and deductions under the policies or annuity contracts. |
(d) | Not annualized. |
(e) | Annualized. |
The notes to the financial statements are an integral part of this report.
9
Capital Guardian U.S. Equity
NOTES TO FINANCIAL STATEMENTS
At December 31, 2007
(all amounts in thousands)
NOTE 1. ORGANIZATION AND SIGNIFICANT ACCOUNTING POLICIES
AEGON/Transamerica Series Trust (“ATST”) is an open-end management investment company registered under the Investment Company Act of 1940, as amended (the “1940 Act”). ATST serves as a funding vehicle for variable life insurance, variable annuity and group annuity products. Capital Guardian U.S. Equity (the “Fund”) is part of ATST.
In the normal course of business, the Fund enters into contracts that contain a variety of representations that provide general indemnifications. The Fund’s maximum exposure under these arrangements is unknown, as this would involve future claims that may be made against the Fund and/or its affiliates that have not yet occurred. However, based on experience, the Fund expects the risk of loss to be remote.
This report should be read in conjunction with the current Fund prospectus, which contains more complete information about the Fund.
In preparing the Fund’s financial statements in accordance with accounting principles generally accepted in the United States of America (“GAAP”), estimates or assumptions (which could differ from actual results) may be used that affect reported amounts and disclosures. The following is a summary of significant accounting policies followed by the Fund.
Multiple class operations, income and expenses: The Fund currently offers two classes of shares, an Initial Class and a Service Class. Income, non-class specific expenses and realized and unrealized gains and losses, are allocated daily to each class, based upon the value of shares outstanding method as permitted under Rule 18f-3 of the 1940 Act. Each class bears its own specific expenses as well as a portion of general, common expenses.
Security valuations: The Fund values its investments at the close of the New York Stock Exchange (“NYSE”), normally 4 p.m. ET, each day the NYSE is open for business. Fund investments are valued at the last sale price or closing price on the day of valuation taken from the primary exchange where the security is principally traded.
Securities traded in the over-the-counter market and listed securities for which no sale was reported on that date are valued at the last quoted bid price.
Debt securities are valued based on a price quotation or other equivalent indication of value supplied by an exchange, a pricing service or a major market maker; however, those that mature in sixty days or less are valued at amortized cost, which approximates market.
Investment company securities are valued at the net asset value of the underlying portfolio.
Securities for which quotations are not readily available are valued at fair market value as determined in good faith by the Fund’s Administrative Valuation Committee, using guidelines adopted by the Board of Trustees.
Cash: The Fund may leave cash overnight in its cash account with the custodian, State Street Bank & Trust Company (“State Street”). On July 2, 2007, State Street acquired the parent company of Investors Bank & Trust Company. State Street has been contracted on behalf of the Fund to invest the excess cash into a savings account, which at December 31, 2007 was paying an interest rate of 2.60%.
Repurchase agreements: The Fund is authorized to enter into repurchase agreements. The Fund, through its custodian, State Street, receives delivery of the underlying securities, the value of which at the time of purchase is required to be an amount equal to at least 100% of the resale price. The Fund will bear the risk of value fluctuations until the security can be sold and may encounter delays and incur costs in liquidating the security. In the event of bankruptcy or insolvency of the seller, delays and costs may be incurred.
Commission recapture: The sub-adviser, to the extent consistent with the best execution and usual commission rate policies and practices, may place security transactions of the Fund with broker/dealers with which ATST has established a Commission Recapture Program. A Commission Recapture Program is any arrangement under which a broker/dealer applies a portion of the commissions received by such broker/dealer on the security transactions to the Fund. In no event will commissions paid by the Fund be used to pay expenses that would otherwise be borne by any other funds within ATST, or by any other party.
Recaptured commissions during the year ended December 31, 2007 of $11 are included in net realized gains in the Statement of Operations.
Securities lending: The Fund may lend securities to qualified borrowers, with State Street acting as the Fund’s lending agent. The Fund earns negotiated lenders’ fees. The Fund receives cash and/or securities as collateral against the loaned securities. Cash collateral received is invested in short term, interest bearing securities. The Fund monitors the market value of securities loaned on a daily basis and requires collateral in an amount at least equal to the value of the securities loaned. Income from loaned securities earned by State Street for its services, shown in the Statement of Operations is net of fees, in the amount of $37.
The Funds have invested the cash collateral received from securities loaned in the following short-term, interest-bearing securities:
10
NOTES TO FINANCIAL STATEMENTS (continued)
At December 31, 2007
(all amounts in thousands)
NOTE 1.-(continued)
Abbey National PLC, Eurodollar Term, 5.00%, 1/7/2008 | | $ | 598 | |
ABN AMRO Bank NV, Eurodollar Term, 5.18%, 1/4/2008 | | 479 | |
Bank of Nova Scotia, Eurodollar Term, 4.96%, 1/22/2008 | | 419 | |
Barclays, Eurodollar Term, 5.00%, 2/12/2008 | | 838 | |
BNP Paribas, Eurodollar Term, 5.01%, 1/11/2008 | | 778 | |
Calyon, Eurodollar Term, 5.12%, 3/3/2008 | | 179 | |
Credit Suisse First Boston Corp., Repurchase Agreement, 4.60%, 1/2/2008 | | 1,555 | |
Dexia Group, Eurodollar Term, 4.82%, 1/3/2008 | | 598 | |
HBOS Halifax Bank of Scotland, Eurodollar Term, 5.15%, 1/2/2008 | | 299 | |
JPMorgan Chase & Co., Eurodollar Term, 5.15%, 2/12/2008 | | 299 | |
Lloyds TSB Bank, Eurodollar Term, 5.15%, 1/24/2008 | | 598 | |
Merrill Lynch & Co. (RPG), Repurchase Agreement, 4.60%, 1/2/2008 | | 897 | |
Morgan Stanley & Co. (Corp. Repo), Repurchase Agreement, 4.60%, 1/2/2008 | | 2,453 | |
Rabobank Nederland, Eurodollar Term, 5.08%, 1/10/2008 | | 718 | |
Reserve Primary Money Market Fund 4.95% | | 638 | |
Royal Bank of Scotland, Eurodollar Term, 5.00%, 2/25/2008 | | 718 | |
Societe Generale, Eurodollar Term, 5.15%, 3/3/2008 | | 359 | |
Toronto Dominion Bank, Eurodollar Term, 5.05%, 1/10/2008 | | 718 | |
UBS AG, Eurodollar Term, 4.92%, 1/11/2008 | | 419 | |
Wells Fargo, Bank Note, 4.75%, 1/8/2008 | | 299 | |
| | | |
| | $ | 13,859 | |
Real Estate Investment Trusts (“REITs”): There are certain additional risks involved in investing in REITs. These include, but are not limited to, economic conditions, changes in zoning laws, real estate values, property taxes and interest rates.
Dividend income is recorded at management’s estimate of the income included in distributions from the REIT investments. Distributions received in excess of the estimated amount are recorded as a reduction of the cost of investments. The actual amounts of income, return of capital and capital gains are only determined by each REIT after the fiscal year end and may differ from the estimated amounts.
Security transactions and investment income: Security transactions are recorded on the trade date. Security gains and losses are calculated on the first-in, first-out basis. Dividend income, if any, is recorded on the ex-dividend date or, in the case of foreign securities, as soon as the Fund is informed of the ex-dividend date. Interest income, including accretion of discounts and amortization of premiums, is recorded on the accrual basis commencing on the settlement date.
Dividend distributions: Dividends and capital gains distributions are typically declared and reinvested annually and are generally paid and reinvested on the business day following the ex-date.
NOTE 2. RELATED PARTY TRANSACTIONS
ATST serves as a funding vehicle for certain affiliated asset allocation portfolios and certain affiliated separate accounts of Western Reserve Life Assurance Co. of Ohio, Transamerica Life Insurance Company, Transamerica Financial Life Insurance Company, Inc., Monumental Life Insurance Company and Transamerica Occidental Life Insurance Company.
Transamerica Fund Advisors, Inc. (“TFAI”) is the Fund’s investment adviser. Transamerica Fund Services, Inc. (“TFS”) the Fund’s administrator and transfer agent. Prior to May 1, 2007, AFSG Securities Corp. (“AFSG”), was the Fund’s distributor. Transamerica Capital Inc. (“TCI”) is now the Fund’s distributor. TFAI, TFS, AFSG, and TCI are affiliates of AEGON NV, a Netherlands corporation.
Certain officers and trustees of the Fund are also officers and/or directors of TFAI, TFS and TCI.
Investment advisory fee: The Fund pays management fees to TFAI based on average daily net assets (“ANA”) at the following breakpoints:
| 0.80% of the first $500 million of ANA |
| 0.775% of the next $500 million of ANA |
| 0.70% of the next $1 billion of ANA |
| 0.65% of ANA over $2 billion |
TFAI has contractually agreed to waive its advisory fee and will reimburse the Fund to the extent that operating expenses, excluding 12b-1 fees, exceed the following stated annual limit:
If total Fund expenses fall below the annual expense limitation agreement agreed to by the adviser within the succeeding three years, the Fund may be required to pay the adviser a portion or all of the waived advisory fees.
There were no amounts recaptured during the year ended December 31, 2007. There are no amounts available for recapture at December 31, 2007.
Distribution and service fees: ATST entered into a Distribution Agreement with AFSG dated January 1, 1997, as amended. On May 1, 2007, the Distribution Agreement was amended to replace AFSG with TCI as the Fund’s distributor. The Fund has also adopted a distribution plan (“Distribution Plan”) pursuant to Rule 12b-1 under the 1940 Act.
Under the Distribution Plan for the Initial Class shares, TCI, on behalf of the Fund, is authorized to pay various service providers, as direct payment for expenses incurred in connection with distribution of the Fund’s shares, amounts equal to actual expenses associated with distributing the shares.
The Distribution Plan for the Service Class shares requires ATST to pay distribution fees to TCI as compensation for its activities, not as reimbursement for specific expenses. The fee on the Service Class is paid to the insurance companies for providing services and account maintenance for their policyholders who invest in the variable insurance products which invest in the Service Class shares.
The Fund is authorized under the Distribution Plan to pay fees on each class up to the following limits:
Initial Class | | 0.15 | % |
Service Class | | 0.25 | % |
11
NOTES TO FINANCIAL STATEMENTS (continued)
At December 31, 2007
(all amounts in thousands)
NOTE 2.-(continued)
TCI has determined that it will not seek payment by the Fund of the distribution expenses incurred with respect to the Initial Class shares before April 30, 2009. Prior to TCI seeking reimbursement of future expenses, policy and contract owners will be notified in advance. The Fund will pay fees relating to Service Class shares.
Administrative services: The Fund has entered into an agreement with TFS for financial and legal fund administration services. The Fund pays TFS an annual fee of 0.02% of ANA. The Legal fees on the Statement of Operations are for fees paid to external legal counsel.
Deferred compensation plan: Each eligible independent Fund Trustee may elect participation in a non-qualified deferred compensation plan (“the Plan”). Under the Plan, such Trustees may defer payment of all or a portion of their total fees earned as a Fund Trustee. Each Trustee who is a participant in the Plan may elect that the earnings, losses or gains credited to his or her deferred fee amounts be determined based on a deemed investment in any series of Transamerica IDEX Mutual Funds. The right of a participant to receive a distribution from the Plan of the deferred fees is an unsecured claim against the general assets of all series of Transamerica IDEX Mutual Funds. The pro rata liability to the Fund of all deferred fees in the Plan amounted, as of December 31, 2007, to $10. Amounts deferred under the Plan are unfunded against the general assets of ATST.
Retirement plan: Under a retirement plan (the “Emeritus Plan”) available to the Independent Trustees, each Independent Trustee is deemed to have elected to serve as Trustee Emeritus of ATST upon his or her termination of service, other than removal for cause, and is entitled to 50% of the trustee’s current retainer for a maximum period of five years determined by his or her years of service as a Trustee.
Such amounts shall be accrued by ATST on a pro rata basis allocable to each series of ATST fund based on the relative assets of the series. If retainers increase in the future, past accruals (and credits) will be adjusted upward so that 50% of the Trustee’s current retainer is accrued and credited at all times. Upon death, disability or termination of service, other than removal for cause, amounts deferred become payable to a Trustee Emeritus (or his/her beneficiary). Upon the commencement of service as Trustee Emeritus, compensation will be paid on a quarterly basis during the time period that the Trustee Emeritus is allowed to serve as such.
Amounts accrued under the Emeritus Plan are unsecured claims against the general assets of ATST. For the year ended December 31, 2007, the amount related to the Emeritus Plan was $11. As of December 31, 2007, the Fund has not made any payments related to the Emeritus Plan.
The Emeritus Plan was terminated effective October 30, 2007. Upon the termination, the Fund shall continue to pay any remaining benefits in accordance with the Plan, but no further compensation shall accrue under the Plan.
NOTE 3. INVESTMENT TRANSACTIONS
The cost of securities purchased and proceeds from securities sold (excluding short-term securities) for year ended December 31, 2007 were as follows:
Purchases of securities: | | | |
Long-term | | $ | 89,371 | |
U.S. Government | | — | |
Proceeds from maturities and sales of securities: | | | |
Long-term | | 131,637 | |
U.S. Government | | — | |
| | | | |
NOTE 4. FEDERAL INCOME TAX MATTERS
The Fund has not made any provision for federal income or excise taxes due to its policy to distribute all of its taxable income and capital gains to its shareholders and otherwise qualify as a regulated investment company under Subchapter M of the Internal Revenue Code. Income and capital gain distributions are determined in accordance with income tax regulations, which may differ from GAAP. These differences are primarily due to differing treatment for items including, but not limited to, wash sales and REIT reclassifications.
The tax character of distributions paid may differ from the character of distributions shown in the Statements of Changes in Net Assets due to short-term gains being treated as ordinary income for tax purposes. The tax character of distributions paid during 2006 and 2007 was as follows:
2006 Distributions paid from: | | | |
Ordinary Income | | $ | 1,618 | |
Long-term Capital Gain | | 22,979 | |
| | | |
2007 Distributions paid from: | | | |
Ordinary Income | | 3,416 | |
Long-term Capital Gain | | 19,157 | |
| | | | |
The tax basis components of distributable earnings as of December 31, 2007 are as follows:
Undistributed Ordinary Income | | $ | 3,784 | |
Undistributed Long-term Capital Gain | | $ | 30,747 | |
Capital Loss Carryforward | | $ | — | |
Net Unrealized Appreciation (Depreciation) | | $ | 13,060 | |
12
NOTES TO FINANCIAL STATEMENTS (continued)
At December 31, 2007
(all amounts in thousands)
NOTE 5. REGULATORY PROCEEDINGS
There continues to be significant federal and state regulatory activity relating to financial services companies, particularly mutual fund companies and their investment advisers. As part of an ongoing investigation regarding potential market timing, recordkeeping and trading compliance issues and matters affecting the Fund’s investment adviser, TFAI, and certain affiliates and former employees of TFAI, the SEC staff has indicated that it is likely to take some action against TFAI and certain of its affiliates at the conclusion of the investigation. The potential timing and the scope of any such action is difficult to predict. Although the impact of any action brought against TFAI and/or its affiliates is difficult to assess at the present time, the Fund currently believes that the likelihood that any such action will have a material adverse impact is remote. It is important to note that the Fund is not aware of any allegation of wrong doing against it and its Board at the time this annual report is printed. Although it is not anticipated that these developments will have an adverse impact on the Fund, there can be no assurance at this time. TFAI and its affiliates are actively working with the SEC in regard to this matter; however, the exact resolution cannot be determined at this time. TFAI will take such actions that it deems necessary or appropriate to continue providing management services to the Fund and to bring all matters to an appropriate conclusion.
TFAI and/or its affiliates, and not the Fund, will bear the costs regarding these regulatory matters.
NOTE 6. RECENTLY ISSUED ACCOUNTING PRONOUNCEMENTS
In July 2006, the Financial Accounting Standards Board (“FASB”) released FASB Interpretation No. 48 “Accounting for Uncertainty in Income Taxes” (“FIN 48”), an interpretation of FASB Statement No. 109. FIN 48 provides guidance for how uncertain tax positions should be recognized, measured, presented and disclosed in the financial statements. FIN 48 requires the accounting and disclosure of tax positions taken or expected to be taken in the course of preparing the Fund’s tax returns to determine whether the tax positions are “more-likely- than-not” of being sustained by the applicable tax authority. Tax positions not deemed to meet the more-likely-than-not threshold would be recorded as a tax benefit or expense in the current year.
Adoption of FIN 48 is effective during the first required financial reporting period for fiscal years beginning after December 15, 2006. Management adopted FIN 48 on June 29, 2007.
Implementation of FIN 48 requires Management of the Fund to analyze all open tax years, as defined by the Statute of Limitations, for all major jurisdictions, which includes federal and certain states. Open tax years are those that are open for exam by taxing authorities (i.e., the last 4 tax year ends and the interim tax period since then). The Fund has no examinations in progress and none are expected at this time.
Management of the Fund has reviewed all open tax years and major jurisdictions and concluded the adoption of FIN 48 resulted in no impact to the Fund’s net assets or results of operations. There is no tax liability resulting from unrecognized tax benefits relating to uncertain income tax positions taken or expected to be taken in future tax returns. The Fund is also not aware of any tax positions for which it is reasonably possible that the total amounts of unrecognized tax benefits will significantly change in the next 12 months.
In September 2006, FASB issued its new Standard No. 157, “Fair Value Measurements” (“FAS 157”). FAS 157 is designed to unify guidance for the measurement of fair value of all types of assets, including financial instruments, and certain liabilities, throughout a number of accounting standards. FAS 157 also establishes a hierarchy for measuring fair value in generally accepted accounting principles and expands financial statement disclosures about fair value measurements that are relevant to mutual funds. FAS 157 is effective for financial statements issued for fiscal years beginning after November 15, 2007, and earlier application is permitted.
As of December 31, 2007, Management does not expect the adoption of FAS 157 to impact the amounts reported in the financial statements, however, additional disclosures will be required about the inputs used to develop the measurements of fair value and the effect of certain of the measurements reported in the statement of operations for a fiscal period.
NOTE 7. SUBSEQUENT EVENT
Effective January 1, 2008, TFAI changed its name to Transamerica Asset Management, Inc.
Effective May 1, 2008, AEGON/Transamerica Series Trust will change its name to Transamerica Series Trust. At that time, the Fund will also change its name to Transamerica Capital Guardian U.S. Equity VP.
13
Report of Independent Registered Certified Public Accounting Firm
To the Board of Trustees and Shareholders of
Capital Guardian U.S. Equity:
In our opinion, the accompanying statement of assets and liabilities, including the schedule of investments, and the related statements of operations and of changes in net assets and the financial highlights present fairly, in all material respects, the financial position of Capital Guardian U.S. Equity (the “Fund”) (one of the portfolios constituting AEGON/Transamerica Series Trust) at December 31, 2007, the results of its operations for the year then ended, the changes in its net assets for each of the two years in the period then ended and the financial highlights for each of the periods presented, in conformity with accounting principles generally accepted in the United States of America. These financial statements and financial highlights (hereafter referred to as “financial statements”) are the responsibility of the Fund’s management; our responsibility is to express an opinion on these financial statements based on our audits. We conducted our audits of these financial statements in accordance with the standards of the Public Company Accounting Oversight Board (United States). Those standards require that we plan and perform the audit to obtain reasonable assurance about whether the financial statements are free of material misstatement. An audit includes examining, on a test basis, evidence supporting the amounts and disclosures in the financial statements, assessing the accounting principles used and significant estimates made by management, and evaluating the overall financial statement presentation. We believe that our audits, which included confirmation of securities at December 31, 2007 by correspondence with the custodian and brokers, provide a reasonable basis for our opinion.

Tampa, Florida
February 29, 2008
14
Capital Guardian U.S. Equity
SUPPLEMENTAL TAX INFORMATION (unaudited)
(all amounts in thousands)
For tax purposes, the Fund has made a Long-Term Capital Gain Designation of $19,157 for the year ended December 31, 2007.
RESULTS OF SHAREHOLDER PROXY (unaudited)
At a special meeting of shareholders held on October 30, 2007, the results of the Proposals were as follows:
Proposal 1: To elect a new Board:
Proposed
Trustee | | For | | Against | | Abstentions/Broker Non-
Votes | |
| | | | | | | |
John K. Carter | | 2,274,998,840.817 | | 57,804,698.755 | | 35,433.883 | |
| | | | | | | |
Leo J. Hill | | 2,277,212,702.754 | | 55,590,836.819 | | 35,433.883 | |
| | | | | | | |
Neal M. Jewell | | 2,266,793,295.663 | | 66,010,243.909 | | 35,433.883 | |
| | | | | | | |
Russell A. Kimball, Jr. | | 2,274,825,235.835 | | 57,978,303.737 | | 35,433.883 | |
| | | | | | | |
Eugene M. Mannella | | 2,274,623,165.033 | | 58,180,374.539 | | 35,433.883 | |
| | | | | | | |
Norm R. Nielsen | | 2,275,050,055.885 | | 57,753,483.687 | | 35,433.883 | |
| | | | | | | |
Joyce Galpern Norden | | 2,270,278,122.250 | | 62,525,417.323 | | 35,433.883 | |
| | | | | | | |
Patricia L. Sawyer | | 2,275,737,737.456 | | 57,065,802.116 | | 35,433.883 | |
| | | | | | | |
John W. Waechter | | 2,276,615,120.140 | | 56,188,419.433 | | 35,433.883 | |
Proposal 2: To approve an amendment to the Agreement and Declaration of Trust:
For | | Against | | Abstentions/Broker Non-
Votes | |
2,182,022,669.110 | | 77,590,048.544 | | 73,226,255.801 | |
15
Capital Guardian U.S. Equity
INVESTMENT ADVISORY AND SUB-ADVISORY AGREEMENTS-REVIEW AND RENEWAL (unaudited)
At a meeting of the Board of Trustees of AEGON/Transamerica Series Trust (“ATST”) held on December 4th, 2007, the Board reviewed and considered the renewal of the investment advisory agreement (the “Investment Advisory Agreement”) between Capital Guardian U.S. Equity (the “Fund”) and Transamerica Fund Advisors, Inc. (“TFAI”), as well as the renewal of the investment sub-advisory agreement (the “Sub-Advisory Agreement”) of the Fund between TFAI and Capital Guardian Trust Company (the “Sub-Adviser”), to determine whether the agreements should be renewed for a six-month period. It was noted that this review was interim in nature to align all the Funds on the same calendar, and that the Funds’ advisory arrangements would be reviewed again in the first half of 2008.
Following their review and consideration, the Trustees determined that the renewal of the Investment Advisory Agreement and the Sub-Advisory Agreement would enable shareholders of the Fund to obtain high quality services at a cost that is appropriate, fair, and in the best interests of its shareholders. The Board, including the independent members of the Board, unanimously approved the renewal of the Investment Advisory Agreement and Sub-Advisory Agreement. In reaching their decision, the Trustees requested and obtained from TFAI and the Sub-Adviser such information as they deemed reasonably necessary to evaluate the agreements, including information about fees and performance of comparable funds managed by the Sub-Adviser. The Trustees also carefully considered information they had previously received from TFAI and the Sub-Adviser throughout the year as part of their regular oversight of the Fund, as well as comparative fee, expense, and performance information prepared by Lipper Inc. (“Lipper”), an independent provider of mutual fund performance, fee and expense information and profitability data prepared by management. In considering the proposed continuation of the Investment Advisory and Sub-Advisory Agreements, the Trustees evaluated a number of considerations that they believed, in light of the legal advice furnished to them by independent legal counsel and their own business judgment, to be relevant. They based their decisions on a variety of factors, including the following considerations, among others, although they did not identify any consideration or particular information that was controlling of their decisions:
The nature, extent and quality of the advisory services to be provided. The Board considered the nature and quality of the services provided by TFAI and the Sub-Adviser to the Fund in the past, as well as the services anticipated to be provided in the future. The Board concluded that TFAI and the Sub-Adviser are capable of providing high quality services to the Fund, as indicated by the nature and quality of services provided in the past by TFAI and the Sub-Adviser for this series and the experience, capability and integrity of TFAI’s senior management, the financial resources of TFAI and the Sub-Adviser, TFAI’s management oversight process and the professional qualifications of the portfolio management team of the Sub-Adviser. The Trustees determined that TFAI and the Sub-Adviser can provide investment and related services that are appropriate in scope and extent in light of the Fund’s operations, the competitive landscape of the investment company business and investor needs.
The investment performance of the Fund. The Board examined the short and longer-term performance of the Fund, including relative performance against a peer universe of comparable mutual funds as prepared by Lipper for various trailing periods ended June 30, 2007. The Board noted the performance of the Fund over the 1-, 3- and 5-year periods indicated more attractive longer-term results, but more challenging shorter-term performance. On the basis of the Board’s assessment of the nature, extent and quality of advisory services to be provided or procured by TFAI and the Sub-Adviser, the Board concluded that TFAI and the Sub-Adviser are capable of providing a level of investment performance that is appropriate in light of the Fund’s proposed investment objectives, policies and strategies and competitive with other similarly situated investment companies, but the Board noted that it would be monitoring performance closely.
The cost of advisory services provided and the level of profitability. The Board reviewed profitability information of TFAI’s cost of procuring fund management services, as well as the costs of provision of administration, fund accounting and other services, to the Fund and to ATST as a whole by TFAI and its affiliates. The Board reviewed the management and sub-advisory fees for the Fund. The Board noted that the fees were generally in-line with peer funds. The Board noted that fees were renegotiated for 2008. Based on their review, the Trustees determined that the management fees of the Fund generally are appropriate in light of the services expected to be provided or procured, the management fees and the anticipated profitability of the relationship between the Fund, TFAI and its affiliates, and the Sub-Adviser. In making these observations and determinations, the Board reviewed, among other things, comparative information provided by Lipper.
Whether fee levels reflect economies of scale and the extent to which economies of scale would be realized as the Fund grows. In evaluating the extent to which the management fees payable under the Investment Advisory and Sub-Advisory Agreements reflect economies of scale or will permit economies of scale to be realized in the future, the Board noted that TFAI and the Sub-Adviser offer breakpoints which appropriately benefit investors by passing on economies of scale in the form of lower management fees as the level of assets grows. The Board further noted additional breakpoints are proposed for 2008 further reducing the sub-advisory fee. The Trustees also concluded that they will have the opportunity to periodically reexamine whether the Fund has achieved economies of scale, and the appropriateness of management fees payable to TFAI and fees paid to the Sub-Adviser, in the future.
Benefits (such as soft dollars) to TFAI, its affiliates, or the Sub-Adviser from their relationship with the Fund. The Board concluded that other benefits anticipated to be derived by TFAI, its affiliates, and the Sub-Adviser from their relationships with the Fund are expected to be reasonable and fair, and consistent with industry practice and the best interests of the Fund and its shareholders. The Trustees noted that TFAI would not realize soft dollar benefits from its relationship with the Fund. The Board also noted that the Sub-Adviser is participating in a brokerage program pursuant to which a portion of brokerage commissions paid by the Fund is recaptured for the benefit of the Fund and its shareholders, thus limiting the amount of soft dollar arrangements the Sub-Adviser may engage in with respect to the Fund’s brokerage transactions.
16
Other considerations. The Board determined that TFAI has made a substantial commitment to the recruitment and retention of high quality personnel, and maintains the financial, compliance and operational resources reasonably necessary to manage the Fund in a professional manner that is consistent with the best interests of the Fund and its shareholders. In this regard, the Trustees favorably considered the procedures and policies in place by TFAI to enforce compliance with applicable laws and regulations and oversee the portfolio management activities of the Sub-Adviser. The Trustees also determined that TFAI has made a significant entrepreneurial commitment to the management and success of the Fund, reflected by TFAI’s expense limitation and fee waiver arrangements with the Fund which may result in TFAI waiving a substantial amount of management fees for the benefit of shareholders.
17
Capital Guardian Value
MARKET ENVIRONMENT
U.S. value stocks recorded their worst year since 2002 as fluctuating liquidity levels and concerns about the impact of the credit crunch worried investors. Financial lenders reported large losses and recession fears weighed on economically sensitive stocks, helping send the Russell 1000 Value Index (“Russell 1000 Value”) down 0.17% for 2007. The Russell 1000 Value lagged both the Standard and Poor’s 500 Composite Stock Index and the Russell 1000 Growth Index for the quarter and the full year.
Stocks soared for much of the year as easy money supported a record $4.7 trillion in worldwide merger deals. Companies reported strong corporate earnings and the economy accelerated. But ripples of sub-prime mortgage trouble appeared in February and June before bursting open in the third and fourth quarters. The fallout incorporated two main elements: the lower value of sub-prime mortgages and related investments; and the effect of the crisis on financial institutions that wrote down the value of their mortgage assets and subsequently faced severe financing constraints. Though the Federal Reserve Board cut interest rates three times and worked with other central banks to inject liquidity into the system, earnings began to decline and the outlook for economic growth looked bleak by December.
Financials, which make up roughly a third of the benchmark, sank. Citigroup Inc. (“Citigroup”) was the biggest drag on the Russell 1000 Value after it announced staggering losses and brought nearly $50 billion in structured investment vehicles (“SIV”) onto its balance sheet. A government-supported plan to bail out SIV funds was abandoned by Citigroup, Bank of America Corporation and JPMorgan Chase & Co. after banks launched independent rescues. Information technology (“IT”) and consumer discretionary stocks also declined.
Energy stocks rose as oil futures rose by nearly 60%, materials advanced on demand from the emerging markets and utilities benefited both from the merger and acquisition (“M&A”) boom and the flight to safety amid the turmoil.
Economic data showed that while the housing market was at its weakest level in decades, other critical measures of the economy held up well throughout most of the year. Real gross domestic product (“GDP”) growth accelerated to 4.9% in the third quarter, though by the end of 2007 durable goods data and other economic indicators showed signs of strain.
PERFORMANCE
For the year ended December 31, 2007, Capital Guardian Value, Initial Class returned (6.28)%. By comparison its benchmark, the Russell 1000 Value, returned (0.17)%.
STRATEGY REVIEW
The portfolio’s underperformance was driven primarily by stock selection in the financials sector. We added to our holdings among thrifts, mortgage lenders and insurers in the third quarter as valuations declined, but we did so too early as the credit crunch further intensified in the fourth quarter.
Throughout November and December concerns about the housing market, sub-prime mortgages, and collateralized debt obligations negatively affected several of our financial holdings. Washington Mutual, Inc. was the biggest detractor to the portfolio. The largest U.S. savings and loan saw its shares tumble as the housing and credit markets deteriorated and after regulators began investigating how the company set values for mortgages sold to investors. Mortgage writers IndyMac Bancorp, Inc. and Wachovia Corporation sank; and bond insurers Ambac Financial Group, Inc. and MBIA Inc. also sold off amid the deteriorating credit conditions. The underweight position in energy also dragged on results as oil futures rose to almost $100 per barrel.
The selection of materials stocks was positive. Lyondell Chemical Company was the top contributor to returns as the company posted consistently solid results. The portfolio’s underweighting and selection of stocks in the consumer discretionary sector benefited relative returns.
Eugene P. Stein
Karen A. Miller
Theodore R. Samuels
Co-Portfolio Managers
Capital Guardian Trust Company
AEGON/Transamerica Series Trust | Annual Report 2007 |
1
Capital Guardian Value
(unaudited)
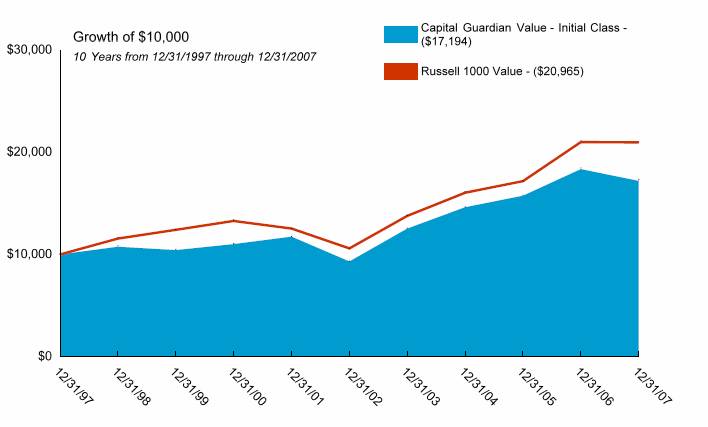
Average Annual Total Return for Periods Ended 12/31/2007
| | | | | | | | From | | Inception | |
| | 1 Year | | 5 Years | | 10 Years | | Inception | | Date | |
Initial Class | | (6.28 | )% | 13.05 | % | 5.57 | % | 9.63 | % | 5/27/93 | |
Russell 1000 Value(1) | | (0.17 | )% | 14.63 | % | 7.68 | % | 11.63 | % | 5/27/93 | |
Service Class | | (6.54 | )% | — | % | — | % | 12.82 | % | 5/1/03 | |
NOTES
(1) The Russell 1000 Value (Russell 1000 Value) Index is an unmanaged index used as a general measure of market performance. Calculations assume dividends and capital gains are reinvested and do not include any managerial expenses. From inception, calculation is based on life of Initial Class shares.
The performance data presented represents past performance; future results may vary. The portfolio’s investment return and net asset value will fluctuate. Past performance does not guarantee future results. Investor’s units when redeemed, may be worth more or less than their original cost.
Current performance may be lower or higher than performance quoted. Please visit your insurance company’s website for contract or policy level standardized total returns current to the most recent month end. Portfolio performance is net of investment fees and fund expenses, but not product charges, which, if included, would significantly lower the performance quoted.
This material must be preceded or accompanied by a current prospectus, which includes specific contents regarding the investment objectives, explanation of share classes and policies of this portfolio.
The historical financial information for periods prior to May 1, 2002 has been derived from the financial history and performance of the predecessor portfolio, Capital Guardian Value Portfolio of Endeavor Series Trust. Capital Guardian has been the portfolio’s subadviser since October 9, 2000. Prior to that date, a different sub-adviser firm managed the portfolio and the performance set forth above prior to October 9, 2000 is attributable to that sub-adviser.
2
Capital Guardian Value
UNDERSTANDING YOUR FUND’S EXPENSES
(unaudited)
SHAREHOLDER EXPENSES
Fund shareholders may incur ongoing costs, including management and advisory fees, distribution and service fees, and other fund expenses.
The following Example is intended to help you understand your ongoing costs (in dollars and cents) of investing in the Fund and to compare these costs with the ongoing costs of investing in other funds.
The Example is based on an investment of $1,000 invested at July 1, 2007 and held for the entire period until December 31, 2007.
ACTUAL EXPENSES
The first line in the table below provides information about actual account values and actual expenses. You may use the information in this line, together with the amount you invested, to estimate the expenses that you paid over the period. Simply divide your account value by $1,000 (for example, an $8,600 account value divided by $1,000 = 8.6), then multiply the result by the number in the first line of your Fund under the heading entitled “Expenses Paid During Period” to estimate the expenses you paid on your account during this period.
HYPOTHETICAL EXAMPLE FOR COMPARISON PURPOSES
The second line in the table below provides information about hypothetical account values and hypothetical expenses based on the Fund’s actual expense ratio and an assumed rate of return of 5% per year before expenses, which is not the Fund’s actual return. The hypothetical account values and expenses may not be used to estimate the actual ending account balance or expenses you paid for the period. You may use this information to compare the ongoing costs of investing in your Fund and other funds. To do so, compare this 5% hypothetical example with the 5% hypothetical examples that appear in the shareholder reports of the other funds.
Please note that the expenses shown in the table are meant to highlight your ongoing costs only and do not reflect any transactional costs, such as sales charges, redemption fees, brokerage commissions paid on purchases and sales of fund shares. Therefore, the second line under the Fund in the table is useful in comparing ongoing costs only, and will not help you determine the relative total costs of owning different funds. If any of these transaction costs were included, your costs would be higher. The expenses shown in the table do not reflect any fees that may be charged to you by brokers, financial intermediaries or other financial institutions.
| | Beginning | | Ending | | Annualized | | Expenses | |
| | Account | | Account | | Expense | | Paid During | |
| | Value | | Value | | Ratio | | Period (a) | |
Initial Class | | | | | | | | | |
Actual | | $ | 1,000.00 | | $ | 875.75 | | 083 | % | $ | 3.92 | |
Hypothetical (b) | | 1,000.00 | | 1,021.02 | | 0.83 | | 4.23 | |
| | | | | | | | | |
Service Class | | | | | | | | | |
Actual | | 1,000.00 | | 874.36 | | 1.08 | | 5.10 | |
Hypothetical (b) | | 1,000.00 | | 1,019.76 | | 1.08 | | 5.50 | |
| | | | | | | | | | | | |
(a) Expenses are calculated using the Fund’s annualized expense ratio (as disclosed in the table), multiplied by the average account value for the period, multiplied by the number of days in the period (184 days), and divided by the number of days in the year (365 days).
(b) 5% return per year before expenses.
GRAPHICAL PRESENTATION OF SCHEDULE OF INVESTMENTS
By Sector
At December 31, 2007
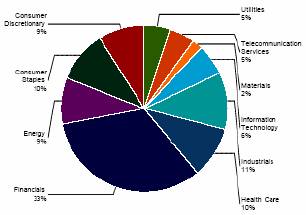
This chart shows the percentage breakdown by sector of the Fund’s total investment securities.
3
Capital Guardian Value
SCHEDULE OF INVESTMENTS
At December 31, 2007
(all amounts except share amounts in thousands)
| | Shares | | Value | |
PREFERRED STOCKS (0.7%) | | | | | |
Thrifts & Mortgage Finance (0.7%) | | | | | |
Washington Mutual, Inc.,
Convertible ‡^ Ž, due 12/31/2049 | | 7,700 | | $ | 6,814 | |
Total Preferred Stocks (cost $7,548) | | | | 6,814 | |
COMMON STOCKS (96.9%) | | | | | |
Air Freight & Logistics (0.4%) | | | | | |
FedEx Corp. | | 45,300 | | 4,040 | |
Airlines (0.2%) | | | | | |
Southwest Airlines Co. | | 154,100 | | 1,880 | |
Automobiles (0.4%) | | | | | |
General Motors Corp. ^ | | 168,700 | | 4,199 | |
Beverages (0.9%) | | | | | |
Coca-Cola Co. (The) | | 136,000 | | 8,346 | |
Biotechnology (0.6%) | | | | | |
Millennium Pharmaceuticals, Inc. ‡ | | 405,300 | | 6,071 | |
Capital Markets (3.6%) | | | | | |
American Capital Strategies, Ltd. ^ | | 466,500 | | 15,376 | |
Goldman Sachs Group, Inc. (The) | | 44,100 | | 9,484 | |
Lehman Brothers Holdings, Inc. | | 77,100 | | 5,045 | |
Merrill Lynch & Co., Inc. | | 94,200 | | 5,057 | |
Chemicals (0.4%) | | | | | |
Dow Chemical Co. (The) | | 101,900 | | 4,017 | |
Commercial Banks (7.6%) | | | | | |
East-West Bancorp, Inc. | | 89,600 | | 2,171 | |
Fifth Third Bancorp | | 254,000 | | 6,383 | |
SunTrust Banks, Inc. ^ | | 318,000 | | 19,872 | |
Wachovia Corp. | | 668,495 | | 25,423 | |
Wells Fargo & Co. | | 680,900 | | 20,556 | |
Computers & Peripherals (1.9%) | | | | | |
Hewlett-Packard Co. | | 163,200 | | 8,238 | |
Seagate Technology ^ | | 396,000 | | 10,098 | |
Consumer Finance (2.0%) | | | | | |
AmeriCredit Corp. ‡^ | | 330,000 | | 4,221 | |
Capital One Financial Corp. | | 215,300 | | 10,175 | |
SLM Corp. | | 243,440 | | 4,903 | |
Diversified Financial Services (3.3%) | | | | | |
JPMorgan Chase & Co. | | 744,040 | | 32,477 | |
Diversified Telecommunication Services (4.9%) | | | | | |
AT&T, Inc. | | 942,200 | | 39,158 | |
Verizon Communications, Inc. | | 206,300 | | 9,013 | |
Electric Utilities (5.3%) | | | | | |
CMS Energy Corp. ^ | | 595,700 | | 10,353 | |
Edison International | | 324,700 | | 17,329 | |
NiSource, Inc. | | 223,100 | | 4,215 | |
Pinnacle West Capital Corp. | | 460,200 | | 19,517 | |
Electrical Equipment (0.9%) | | | | | |
Emerson Electric Co. | | 146,600 | | 8,306 | |
Electronic Equipment & Instruments (2.1%) | | | | | |
Jabil Circuit, Inc. | | 1,144,100 | | 17,470 | |
Tyco International, Ltd. | | 86,175 | | 3,417 | |
Energy Equipment & Services (2.9%) | | | | | |
Transocean, Inc. ‡ | | 86,190 | | 12,338 | |
Weatherford International, Ltd. ‡ | | 228,300 | | $ | 15,662 | |
Food Products (7.2%) | | | | | |
General Mills, Inc. | | 144,800 | | 8,254 | |
Kraft Foods, Inc. Class A | | 1,035,716 | | 33,795 | |
Sara Lee Corp. | | 1,013,410 | | 16,275 | |
Unilever NV | | 335,600 | | 12,236 | |
Health Care Providers & Services (0.9%) | | | | | |
WellPoint, Inc. ‡ | | 97,000 | | 8,510 | |
Hotels, Restaurants & Leisure (1.2%) | | | | | |
Carnival Corp. | | 144,600 | | 6,433 | |
McDonald’s Corp. | | 92,000 | | 5,420 | |
Household Durables (1.7%) | | | | | |
Fortune Brands, Inc. | | 45,300 | | 3,278 | |
Jarden Corp. ‡ | | 574,100 | | 13,555 | |
Industrial Conglomerates (5.1%) | | | | | |
3M Co. | | 56,600 | | 4,772 | |
General Electric Co. | | 1,042,800 | | 38,657 | |
Siemens AG | | 39,300 | | 6,184 | |
Insurance (10.8%) | | | | | |
AMBAC Financial Group, Inc. ^ | | 257,300 | | 6,631 | |
American International Group, Inc. | | 429,100 | | 25,016 | |
Berkshire Hathaway, Inc. Class A ‡ | | 90 | | 12,744 | |
Hartford Financial Services Group, Inc. | | 40,700 | | 3,549 | |
Marsh & McLennan Cos., Inc. | | 593,200 | | 15,702 | |
MBIA, Inc. ^ | | 388,300 | | 7,234 | |
Progressive Corp. (The) | | 1,065,800 | | 20,421 | |
XL Capital, Ltd. Class A | | 288,700 | | 14,524 | |
IT Services (0.6%) | | | | | |
Affiliated Computer Services, Inc. Class A ‡ | | 139,200 | | 6,278 | |
Machinery (3.2%) | | | | | |
Caterpillar, Inc. | | 157,500 | | 11,428 | |
Illinois Tool Works, Inc. | | 293,600 | | 15,719 | |
Parker Hannifin Corp. | | 57,600 | | 4,338 | |
Media (2.5%) | | | | | |
CBS Corp. Class B | | 162,200 | | 4,420 | |
Gannett Co., Inc. | | 313,000 | | 12,207 | |
Time Warner Cable, Inc. Class A ‡ | | 142,700 | | 3,939 | |
Time Warner, Inc. | | 227,800 | | 3,761 | |
Metals & Mining (2.0%) | | | | | |
Nucor Corp. | | 327,000 | | 19,365 | |
Oil, Gas & Consumable Fuels (5.8%) | | | | | |
ConocoPhillips | | 189,400 | | 16,724 | |
Exxon Mobil Corp. | | 103,266 | | 9,675 | |
Royal Dutch Shell PLC Class B | | 202,565 | | 16,813 | |
Royal Dutch Shell PLC Class A | | 67,000 | | 5,641 | |
Spectra Energy Corp. | | 289,300 | | 7,470 | |
Pharmaceuticals (7.8%) | | | | | |
AstraZeneca PLC | | 260,600 | | 11,159 | |
Merck & Co., Inc. | | 149,800 | | 8,705 | |
Pfizer, Inc. | | 1,169,000 | | 26,571 | |
The notes to the financial statements are an integral part of this report.
4
| | Shares | | Value | |
Pharmaceuticals (continued) | | | | | |
Sanofi-Aventis SA ^ | | 666,800 | | $ | 30,360 | |
Real Estate Investment Trusts (1.5%) | | | | | |
Douglas Emmett, Inc. REIT | | 249,600 | | 5,644 | |
General Growth Properties, Inc. REIT | | 154,790 | | 6,374 | |
Host Hotels & Resorts, Inc. REIT ^ | | 150,000 | | 2,556 | |
Road & Rail (0.7%) | | | | | |
Union Pacific Corp. | | 57,700 | | 7,248 | |
Semiconductors & Semiconductor Equipment (1.8%) | | | | | |
Advanced Micro Devices, Inc. ‡^ | | 524,100 | | 3,931 | |
Fairchild Semiconductor International, Inc. Class A ‡ | | 343,600 | | 4,958 | |
Micron Technology, Inc. ‡^ | | 1,211,200 | | 8,781 | |
Specialty Retail (1.4%) | | | | | |
Lowe’s Cos., Inc. | | 618,200 | | 13,984 | |
Thrifts & Mortgage Finance (3.5%) | | | | | |
Hudson City Bancorp, Inc. | | 1,169,500 | | $ | 17,566 | |
IndyMac Bancorp, Inc. ^ | | 763,970 | | 4,545 | |
Washington Mutual, Inc. | | 906,300 | | 12,335 | |
Tobacco (1.8%) | | | | | |
Altria Group, Inc. | | 210,600 | | 15,917 | |
Loews Corp. - Carolina Group | | 20,600 | | 1,758 | |
Total Common Stocks (cost $982,800) | | | | 948,170 | |
| | Shares | | Value | |
CONVERTIBLE BONDS (1.2%) | | | | | |
Automobiles (1.2%) | | | | | |
Ford Motor Co., Convertible | | | | | |
4.25%, due 12/15/2036 | | $ | 11,955 | | $ | 11,880 | |
Total Convertible Bonds (cost $12,457) | | | | 11,880 | |
| | | | | |
Total Securities Lending Collateral (cost $97,188) (1) | | | | 97,188 | |
Total Investment Securities (cost $1,099,993) # | | | | $ | 1,064,052 | |
| | | | | | | |
NOTES TO SCHEDULE OF INVESTMENTS:
^ At December 31, 2007, all or a portion of this security is on loan (see Note 1). The value at December 31, 2007, of all securities on loan is $92,434.
‡ Non-Income Producing.
(1) Cash collateral for the Repurchase Agreements, valued at $35,230, that serves as collateral for securities lending, is invested in corporate bonds with interest rates and maturity dates ranging from 3.00% - 10.18% and 04/28/2008 - 12/01/2096, respectively.
Ž The security has a perpetual maturity. The date shown is the next call date.
# Aggregate cost for federal income tax purposes is $1,101,689. Aggregate gross unrealized appreciation for all securities in which there is an excess of value over tax cost and aggregate gross unrealized depreciation for all securities in which there is an excess of tax cost over value were $114,727 and $152,364, respectively. Net unrealized depreciation for tax purposes is $37,637.
DEFINITIONS:
REIT Real Estate Investment Trust
The notes to the financial statements are an integral part of this report.
5
Capital Guardian Value
STATEMENT OF ASSETS AND LIABILITIES
At December 31, 2007
(all amounts except per share amounts in thousands)
Assets: | | | |
Investment securities, at value (cost: $1,099,993)
(including securities loaned of $92,434) | | $ | 1,064,052 | |
Cash | | 10,658 | |
Receivables: | | | |
Shares sold | | 200 | |
Interest | | 73 | |
Income from loaned securities | | 62 | |
Dividends | | 2,465 | |
| | 1,077,510 | |
Liabilities: | | | |
Investment securities purchased | | 64 | |
Accounts payable and accrued liabilities: | | | |
Shares redeemed | | 432 | |
Management and advisory fees | | 672 | |
Distribution and service fees | | 7 | |
Administration fees | | 17 | |
Payable for collateral for securities on loan | | 97,188 | |
Other | | 113 | |
| | 98,493 | |
Net Assets | | $ | 979,017 | |
| | | |
Net Assets Consist of: | | | |
Capital Stock ($.01 par value) | | $ | 534 | |
Additional paid-in capital | | 913,641 | |
Undistributed (accumulated) net investment income | | 22,648 | |
Undistributed (accumulated) net realized gain from investment securities | | 78,135 | |
Net unrealized (depreciation) on investment securities | | (35,941 | ) |
Net Assets | | $ | 979,017 | |
Net Assets by Class: | | | |
Initial Class | | $ | 947,185 | |
Service Class | | 31,832 | |
Shares Outstanding: | | | |
Initial Class | | 51,649 | |
Service Class | | 1,729 | |
Net Asset Value and Offering Price Per Share: | | | |
Initial Class | | $ | 18.34 | |
Service Class | | 18.41 | |
STATEMENT OF OPERATIONS
For the year ended December 31, 2007
(all amounts in thousands)
Investment Income: | | | |
Dividends (net of withholding taxes on foreign dividends of $294) | | $ | 29,308 | |
Interest | | 1,498 | |
Income from loaned securities-net | | 882 | |
| | 31,688 | |
Expenses: | | | |
Management and advisory fees | | 8,440 | |
Printing and shareholder reports | | 52 | |
Custody fees | | 108 | |
Administration fees | | 216 | |
Legal fees | | 22 | |
Audit fees | | 21 | |
Trustees fees | | 37 | |
Distribution and service fees: Service Class | | 89 | |
Other | | 14 | |
Total expenses | | 8,999 | |
| | | |
Net Investment Income | | 22,689 | |
| | | |
Net Realized Gain (Loss) from: | | | |
Investment securities | | 78,095 | |
| | | |
| | | |
Net Increase (Decrease) in Unrealized Appreciation (Depreciation) on: | | | |
Investment securities | | (166,400 | ) |
| | | |
Net Realized and Unrealized (Loss): | | (88,305 | ) |
Net (Decrease) In Net Assets Resulting from Operations | | $ | (65,616 | ) |
The notes to the financial statements are an integral part of this report.
6
Capital Guardian Value
STATEMENTS OF CHANGES IN NET ASSETS
For the years ended
(all amounts in thousands)
| | December 31, | | December 31, | |
| | 2007 | | 2006 | |
Increase (Decrease) in Net Assets From: | | | | | |
Operations: | | | | | |
Net investment income | | $ | 22,689 | | $ | 11,993 | |
Net realized gain from investment securities | | 78,095 | | 74,617 | |
Change in unrealized appreciation (depreciation) on investment securities | | (166,400 | ) | 29,731 | |
| | (65,616 | ) | 116,341 | |
Distributions to Shareholders: | | | | | |
From net investment income: | | | | | |
Initial Class | | (11,667 | ) | (10,896 | ) |
Service Class | | (318 | ) | (376 | ) |
| | (11,985 | ) | (11,272 | ) |
From net realized gains: | | | | | |
Initial Class | | (72,187 | ) | (68,412 | ) |
Service Class | | (2,397 | ) | (2,679 | ) |
| | (74,584 | ) | (71,091 | ) |
Capital Share Transactions: | | | | | |
Proceeds from shares sold: | | | | | |
Initial Class | | 366,816 | | 72,333 | |
Service Class | | 9,749 | | 11,577 | |
| | 376,565 | | 83,910 | |
Dividends and distributions reinvested: | | | | | |
Initial Class | | 83,854 | | 79,308 | |
Service Class | | 2,715 | | 3,055 | |
| | 86,569 | | 82,363 | |
Cost of shares redeemed: | | | | | |
Initial Class | | (150,771 | ) | (111,221 | ) |
Service Class | | (10,844 | ) | (4,145 | ) |
| | (161,615 | ) | (115,366 | ) |
| | 301,519 | | 50,907 | |
Net increase (decrease) in net assets | | 149,334 | | 84,885 | |
| | | | | |
Net Assets: | | | | | |
Beginning of year | | 829,683 | | 744,798 | |
End of year | | $ | 979,017 | | $ | 829,683 | |
Undistributed (Accumulated) Net Investment Income (Loss) | | $ | 22,648 | | $ | 11,985 | |
Share Activity: | | | | | |
Shares issued: | | | | | |
Initial Class | | 17,236 | | 3,506 | |
Service Class | | 460 | | 551 | |
| | 17,696 | | 4,057 | |
Shares issued-reinvested from distributions: | | | | | |
Initial Class | | 4,176 | | 4,080 | |
Service Class | | 134 | | 156 | |
| | 4,310 | | 4,236 | |
Shares redeemed: | | | | | |
Initial Class | | (7,143 | ) | (5,268 | ) |
Service Class | | (521 | ) | (195 | ) |
| | (7,664 | ) | (5,463 | ) |
Net increase (decrease) in shares outstanding: | | | | | |
Initial Class | | 14,269 | | 2,318 | |
Service Class | | 73 | | 512 | |
| | 14,342 | | 2,830 | |
The notes to the financial statements are an integral part of this report.
7
Capital Guardian Value
FINANCIAL HIGHLIGHTS
For a share outstanding throughout each period(a)
| | Initial Class | |
| | Year Ended December 31, | |
| | 2007 | | 2006 | | 2005 | | 2004 | | 2003 | |
Net Asset Value | | | | | | | | | | | |
Beginning of period | | $ | 21.25 | | $ | 20.57 | | $ | 20.27 | | $ | 17.56 | | $ | 13.15 | |
Investment Operations | | | | | | | | | | | |
Net investment income (loss) | | 0.44 | | 0.34 | | 0.29 | | 0.25 | | 0.24 | |
Net realized and unrealized gain (loss) | | (1.63 | ) | 2.82 | | 1.22 | | 2.65 | | 4.29 | |
Total operations | | (1.19 | ) | 3.16 | | 1.51 | | 2.90 | | 4.53 | |
Distributions | | | | | | | | | | | |
From net investment income | | (0.24 | ) | (0.34 | ) | (0.20 | ) | (0.19 | ) | (0.12 | ) |
From net realized gains | | (1.48 | ) | (2.14 | ) | (1.01 | ) | — | | — | |
Total distributions | | (1.72 | ) | (2.48 | ) | (1.21 | ) | (0.19 | ) | (0.12 | ) |
Net Asset Value | | | | | | | | | | | |
End of period(b) | | $ | 18.34 | | $ | 21.25 | | $ | 20.57 | | $ | 20.27 | | $ | 17.56 | |
Total Return(c),(d) | | (6.28 | )% | 16.50 | % | 7.71 | % | 16.70 | % | 34.58 | % |
Net Assets End of Period (000’s) | | $ | 947,185 | | $ | 794,352 | | $ | 721,176 | | $ | 774,182 | | $ | 459,102 | |
Ratio and Supplemental Data | | | | | | | | | | | |
Expenses to average net assets(e) | | 0.82 | % | 0.84 | % | 0.85 | % | 0.86 | % | 0.88 | % |
Net investment income (loss), to average net assets(e) | | 2.11 | % | 1.59 | % | 1.43 | % | 1.35 | % | 1.63 | % |
Portfolio turnover rate(d) | | 43 | % | 40 | % | 35 | % | 32 | % | 30 | % |
For a share outstanding throughout each period(a)
| | Service Class | |
| | Year Ended December 31, | | May 1 to Dec | |
| | 2007 | | 2006 | | 2005 | | 2004 | | 31, 2003 | |
Net Asset Value | | | | | | | | | | | |
Beginning of period | | $ | 21.34 | | $ | 20.66 | | $ | 20.37 | | $ | 17.65 | | $ | 13.66 | |
Investment Operations | | | | | | | | | | | |
Net investment income (loss) | | 0.39 | | 0.30 | | 0.24 | | 0.21 | | 0.15 | |
Net realized and unrealized gain (loss) | | (1.64 | ) | 2.82 | | 1.23 | | 2.66 | | 3.85 | |
Total operations | | (1.25 | ) | 3.12 | | 1.47 | | 2.87 | | 4.00 | |
Distributions | | | | | | | | | | | |
From net investment income | | (0.20 | ) | (0.30 | ) | (0.17 | ) | (0.15 | ) | (0.01 | ) |
From net realized gains | | (1.48 | ) | (2.14 | ) | (1.01 | ) | — | | — | |
Total distributions | | (1.68 | ) | (2.44 | ) | (1.18 | ) | (0.15 | ) | (0.01 | ) |
Net Asset Value | | | | | | | | | | | |
End of period(b) | | $ | 18.41 | | $ | 21.34 | | $ | 20.66 | | $ | 20.37 | | $ | 17.65 | |
Total Return(c),(d) | | (6.54 | )% | 16.20 | % | 7.50 | % | 16.39 | % | 29.30 | % |
Net Assets End of Period (000’s) | | $ | 31,832 | | $ | 35,331 | | $ | 23,622 | | $ | 16,961 | | $ | 2,271 | |
Ratio and Supplemental Data | | | | | | | | | | | |
Expenses to average net assets(e) | | 1.07 | % | 1.09 | % | 1.10 | % | 1.11 | % | 1.13 | % |
Net investment income (loss), to average net assets(e) | | 1.85 | % | 1.38 | % | 1.18 | % | 1.11 | % | 1.34 | % |
Portfolio turnover rate(d) | | 43 | % | 40 | % | 35 | % | 32 | % | 30 | % |
(a) Per share information is calculated based on average number of shares outstanding.
(b) Capital Guardian Value (the “Fund”) share class commenced operations as follows:
Initial Class - May 27, 1993
Service Class - May 1, 2003
(c) Total Return reflects all portfolio expenses and includes reinvestment of dividends and capital gains; it does not reflect the charges and deductions under the policies or annuity contracts.
(d) Not annualized.
(e) Annualized.
The notes to the financial statements are an integral part of this report.
8
Capital Guardian Value
NOTES TO FINANCIAL STATEMENTS
At December 31, 2007
(all amounts in thousands)
NOTE 1. ORGANIZATION AND SIGNIFICANT ACCOUNTING POLICIES
AEGON/Transamerica Series Trust (“ATST”) is an open-end management investment company registered under the Investment Company Act of 1940, as amended (the “1940 Act”). ATST serves as a funding vehicle for variable life insurance, variable annuity and group annuity products. Capital Guardian Value (the “Fund”) is part of ATST.
In the normal course of business, the Fund enters into contracts that contain a variety of representations that provide general indemnifications. The Fund’s maximum exposure under these arrangements is unknown, as this would involve future claims that may be made against the Fund and/or its affiliates that have not yet occurred. However, based on experience, the Fund expects the risk of loss to be remote.
This report should be read in conjunction with the current Fund prospectus, which contains more complete information about the Fund.
In preparing the Fund’s financial statements in accordance with accounting principles generally accepted in the United States of America (“GAAP”), estimates or assumptions (which could differ from actual results) may be used that affect reported amounts and disclosures. The following is a summary of significant accounting policies followed by the Fund.
Multiple class operations, income and expenses: The Fund currently offers two classes of shares, an Initial Class and a Service Class. Income, non-class specific expenses and realized and unrealized gains and losses, are allocated daily to each class, based upon the value of shares outstanding method as permitted under Rule 18f-3 of the 1940 Act. Each class bears its own specific expenses as well as a portion of general, common expenses.
Security valuations: The Fund values its investments at the close of the New York Stock Exchange (“NYSE”), normally 4 p.m. ET, each day the NYSE is open for business. Fund investments are valued at the last sale price or closing price on the day of valuation taken from the primary exchange where the security is principally traded.
Securities traded in the over-the-counter market and listed securities for which no sale was reported on that date are valued at the last quoted bid price.
Debt securities are valued based on a price quotation or other equivalent indication of value supplied by an exchange, a pricing service or a major market maker; however, those that mature in sixty days or less are valued at amortized cost, which approximates market.
Investment company securities are valued at the net asset value of the underlying portfolio.
Securities for which quotations are not readily available are valued at fair market value as determined in good faith by the Fund’s Administrative Valuation Committee, using guidelines adopted by the Board of Trustees.
Cash: The Fund may leave cash overnight in its cash account with the custodian, State Street Bank & Trust Company (“State Street”). On July 2, 2007, State Street acquired the parent company of Investors Bank & Trust Company. State Street has been contracted on behalf of the Fund to invest the excess cash into a savings account, which at December 31, 2007 was paying an interest rate of 2.60%.
Repurchase agreements: The Fund is authorized to enter into repurchase agreements. The Fund, through its custodian, State Street, receives delivery of the underlying securities, the value of which at the time of purchase is required to be an amount equal to at least 100% of the resale price. The Fund will bear the risk of value fluctuations until the security can be sold and may encounter delays and incur costs in liquidating the security. In the event of bankruptcy or insolvency of the seller, delays and costs may be incurred.
Commission recapture: The sub-adviser, to the extent consistent with the best execution and usual commission rate policies and practices, may place security transactions of the Fund with broker/dealers with which ATST has established a Commission Recapture Program. A Commission Recapture Program is any arrangement under which a broker/dealer applies a portion of the commissions received by such broker/dealer on the security transactions to the Fund. In no event will commissions paid by the Fund be used to pay expenses that would otherwise be borne by any other funds within ATST, or by any other party.
Recaptured commissions during the year ended December 31, 2007 of $68 are included in net realized gain (loss) in the Statement of Operations.
Securities lending: The Fund may lend securities to qualified borrowers, with State Street acting as the Fund’s lending agent. The Fund earns negotiated lenders’ fees. The Fund receives cash and/or securities as collateral against the loaned securities. Cash collateral received is invested in short term, interest bearing securities. The Fund monitors the market value of securities loaned on a daily basis and requires collateral in an amount at least equal to the value of the securities loaned. Income from loaned securities earned by State Street for its services, shown in the Statement of Operations is net of fees, in the amount of $378.
The Fund has invested the cash collateral received from securities loaned in the following short-term, interest-bearing securities:
9
NOTES TO FINANCIAL STATEMENTS (continued)
At December 31, 2007
(all amounts in thousands)
NOTE 1.–(continued)
Abbey National PLC, Eurodollar Term, 5.00%, 1/7/2008 | | $ | 4,195 | |
ABN AMRO Bank NV, Eurodollar Term, 5.18%, 1/4/2008 | | 3,356 | |
Bank of Nova Scotia, Eurodollar Term, 4.96%, 1/22/2008 | | 2,937 | |
Barclays, Eurodollar Term, 5.00%, 2/12/2008 | | 5,873 | |
BNP Paribas, Eurodollar Term, 5.01%, 1/11/2008 | | 5,454 | |
Calyon, Eurodollar Term, 5.12%, 3/3/2008 | | 1,259 | |
Credit Suisse First Boston Corp., Repurchase Agreement, 4.60%, 1/2/2008 | | 10,907 | |
Dexia Group, Eurodollar Term, 4.82%, 1/3/2008 | | 4,195 | |
HBOS Halifax Bank of Scotland, Eurodollar Term, 5.15%, 1/2/2008 | | 2,098 | |
JPMorgan Chase & Co., Eurodollar Term, 5.15%, 2/12/2008 | | 2,098 | |
Lloyds TSB Bank, Eurodollar Term, 5.15%, 1/24/2008 | | 4,195 | |
Merrill Lynch & Co. (RPG), Repurchase Agreement, 4.60%,1/2/2008 | | 6,293 | |
Morgan Stanley & Co. (Corp. Repo), Repurchase Agreement, 4.60%, 1/2/2008 | | 17,200 | |
Rabobank Nederland, Eurodollar Term, 5.08%, 1/10/2008 | | 5,034 | |
Reserve Primary Money Market Fund, 4.95% | | 4,475 | |
Royal Bank of Scotland, Eurodollar Term, 5.00%, 2/25/2008 | | 5,034 | |
Societe Generale, Eurodollar Term, 5.15%, 3/3/2008 | | 2,517 | |
Toronto Dominion Bank, Eurodollar Term, 5.05%, 1/10/2008 | | 5,034 | |
UBS AG, Eurodollar Term, 4.92%, 1/11/2008 | | 2,937 | |
Wells Fargo, Bank Note, 4.75%, 1/8/2008 | | 2,097 | |
| | | |
| | $ | 97,188 | |
Real Estate Investment Trusts (“REITs”): There are certain additional risks involved in investing in REITs. These include, but are not limited to, economic conditions, changes in zoning laws, real estate values, property taxes and interest rates.
Dividend income is recorded at management’s estimate of the income included in distributions from the REIT investments. Distributions received in excess of the estimated amount are recorded as a reduction of the cost of investments. The actual amounts of income, return of capital and capital gains are only determined by each REIT after the fiscal year end and may differ from the estimated amounts.
Security transactions and investment income: Security transactions are recorded on the trade date. Security gains and losses are calculated on the first-in, first-out basis. Dividend income, if any, is recorded on the ex-dividend date or, in the case of foreign securities, as soon as the Fund is informed of the ex-dividend date. Interest income, including accretion of discounts and amortization of premiums, is recorded on the accrual basis commencing on the settlement date.
Dividend distributions: Dividends and capital gains distributions are typically declared and reinvested annually and are generally paid and reinvested on the business day following the ex-date.
NOTE 2. RELATED PARTY TRANSACTIONS
ATST serves as a funding vehicle for certain affiliated asset allocation portfolios and certain affiliated separate accounts of Western Reserve Life Assurance Co. of Ohio, Transamerica Life Insurance Company, Transamerica Financial Life Insurance Company, Inc., Monumental Life Insurance Company and Transamerica Occidental Life Insurance Company.
Transamerica Fund Advisors, Inc. (“TFAI”) is the Fund’s investment adviser. Transamerica Fund Services, Inc. (“TFS”) is the Fund’s administrator and transfer agent. Prior to May 1, 2007, AFSG Securities Corp. (“AFSG”), was the Fund’s distributor. Transamerica Capital Inc. (“TCI”) is now the Fund’s distributor. TFAI, TFS, AFSG, and TCI are affiliates of AEGON NV, a Netherlands corporation.
Certain officers and trustees of the Fund are also officers and/or directors of TFAI, TFS and TCI.
The following schedule reflects the percentage of Fund assets owned by affiliated investment companies at December 31, 2007:
| | Net | | % of Net | |
| | Assets | | Assets | |
| | | | | | |
Asset Allocation-Conservative Portfolio | | $ | 25,912 | | 2.65 | % |
Asset Allocation-Growth Portfolio | | 125,180 | | 12.78 | |
Asset Allocation-Moderate Growth Portfolio | | 292,347 | | 29.86 | |
Asset Allocation-Moderate Portfolio | | 110,602 | | 11.30 | |
Total | | $ | 554,041 | | 56.59 | % |
Investment advisory fee: The Fund pays management fees to TFAI based on average daily net assets (“ANA”) at the following breakpoints:
0.80% of the first $500 million of ANA
0.775% of the next $500 million of ANA
0.70% of the next $1 billion of ANA
0.65% of ANA over $2 billion
TFAI has contractually agreed to waive its advisory fee and will reimburse the Fund to the extent that operating expenses, excluding 12b-1 fees, exceed the following stated annual limit:
0.87% Expense Limit
If total Fund expenses fall below the annual expense limitation agreement agreed to by the adviser within the succeeding three years, the Fund may be required to pay the adviser a portion or all of the waived advisory fees.
There were no amounts recaptured during the year ended December 31, 2007. There are no amounts available for recapture at December 31, 2007.
Distribution and service fees: ATST entered into a Distribution Agreement with AFSG dated January 1, 1997, as amended. On May 1, 2007, the Distribution Agreement was amended to replace AFSG with TCI as the Fund’s distributor. The Fund has also adopted a distribution plan (“Distribution Plan”) pursuant to Rule 12b-1 under the 1940 Act.
10
NOTES TO FINANCIAL STATEMENTS (continued)
At December 31, 2007
(all amounts in thousands)
NOTE 2.–(continued)
Under the Distribution Plan for the Initial Class shares, TCI, on behalf of the Fund, is authorized to pay various service providers, as direct payment for expenses incurred in connection with distribution of the Fund’s shares, amounts equal to actual expenses associated with distributing the shares.
The Distribution Plan for the Service Class shares requires ATST to pay distribution fees to TCI as compensation for its activities, not as reimbursement for specific expenses. The fee on the Service Class is paid to the insurance companies for providing services and account maintenance for their policyholders who invest in the variable insurance products which invest in the Service Class shares.
The Fund is authorized under the Distribution Plan to pay fees on each class up to the following limits:
Initial Class | | 0.15 | % |
Service Class | | 0.25 | % |
TCI has determined that it will not seek payment by the Fund of the distribution expenses incurred with respect to the Initial Class shares before April 30, 2009. Prior to TCI seeking reimbursement of future expenses, policy and contract owners will be notified in advance. The Fund will pay fees relating to Service Class shares.
Administrative services: The Fund has entered into an agreement with TFS for financial and legal fund administration services. The Fund pays TFS an annual fee of 0.02% of ANA. The Legal fees on the Statement of Operations are for fees paid to external legal counsel.
Deferred compensation plan: Each eligible independent Fund Trustee may elect participation in a non-qualified deferred compensation plan (“the Plan”). Such Trustees may defer payment of all or a portion of their total fees earned as a Fund Trustee. Each Trustee who is a participant in the Plan may elect that the earnings, losses or gains credited to his or her deferred fee amounts be determined based on a deemed investment in any series of Transamerica IDEX Mutual Funds. The right of a participant to receive a distribution from the Plan of the deferred fees is an unsecured claim against the general assets of all series of Transamerica IDEX Mutual Funds. The pro rata liability to the Fund of all deferred fees in the Plan amounted, as of December 31, 2007, to $47. Amounts deferred under the Plan are unfunded against the general assets of ATST.
Retirement plan: Under a retirement plan (the “Emeritus Plan”) available to the Independent Trustees, each Independent Trustee is deemed to have elected to serve as Trustee Emeritus of ATST upon his or her termination of service, other than removal for cause, and is entitled to 50% of the trustee’s current retainer for a maximum period of five years determined by his or her years of service as a Trustee.
Such amounts shall be accrued by ATST on a pro rata basis allocable to each ATST fund based on the relative assets of the fund. If retainers increase in the future, past accruals (and credits) will be adjusted upward so that 50% of the Trustee’s current retainer is accrued and credited at all times. Upon death, disability or termination of service, other than removal for cause, amounts deferred become payable to an Emeritus Trustee (or his/her beneficiary). Upon the commencement of service as Trustee Emeritus, compensation will be paid on a quarterly basis during the time period that the Trustee Emeritus is allowed to serve as such.
Amounts accrued under the Emeritus Plan are unsecured claims against the general assets of ATST. For the year ended December 31, 2007, the amount related to the Emeritus Plan was $31. As of December 31, 2007, the Fund has not made any payments related to the Emeritus Plan.
The Emeritus Plan was terminated effective October 30, 2007. Upon the termination, the Fund shall continue to pay any remaining benefits in accordance with the Plan, but no further compensation shall accrue under the Plan.
NOTE 3. INVESTMENT TRANSACTIONS
The cost of securities purchased and proceeds from securities sold (excluding short-term securities) for the year ended December 31, 2007 were as follows:
Purchases of securities: | | | |
Long-term | | $ | 695,747 | |
U.S. Government | | — | |
Proceeds from maturities and sales of securities: | | | |
Long-term | | 448,364 | |
U.S. Government | | — | |
| | | | |
NOTE 4. FEDERAL INCOME TAX MATTERS
The Fund has not made any provision for federal income or excise taxes due to its policy to distribute all of its taxable income and capital gains to its shareholders and otherwise qualify as a regulated investment company under Subchapter M of the Internal Revenue Code. Income and capital gain distributions are determined in accordance with income tax regulations, which may differ from GAAP. These differences are primarily due to differing treatment for items including, but not limited to, basis adjustment on disposition.
Therefore, distributions determined in accordance with tax regulations may differ significantly in amount or character from net investment income and realized gains for financial reporting purposes. Financial reporting records are adjusted for permanent book/tax differences to reflect tax character. Financial records are not adjusted for temporary differences. These reclassifications are as follows:
Additional paid-in capital | | $ | — | |
Undistributed (accumulated) net investment income (loss) | | $ | (41 | ) |
Undistributed (accumulated) net realized gain (loss) from investment securities | | $ | 41 | |
11
NOTES TO FINANCIAL STATEMENTS (continued)
At December 31, 2007
(all amounts in thousands)
NOTE 4.–(continued)
The tax character of distributions paid may differ from the character of distributions shown in the Statements of Changes in Net Assets due to short-term gains being treated as ordinary income for tax purposes. The tax character of distributions paid during 2006 and 2007 was as follows:
2006 Distributions paid from: | | | |
Ordinary Income | | $ | 22,374 | |
Long-term Capital Gain | | 59,989 | |
| | | |
2007 Distributions paid from: | | | |
Ordinary Income | | 21,805 | |
Long-term Capital Gain | | 64,764 | |
| | | | |
The tax basis components of distributable earnings as of December 31, 2007 are as follows:
Undistributed Ordinary Income | | $ | 49,507 | |
Undistributed Long-term Capital Gain | | $ | 52,972 | |
Capital Loss Carryforward | | $ | — | |
Net Unrealized Appreciation (Depreciation) | | $ | (37,637 | ) |
NOTE 5. REGULATORY PROCEEDINGS
There continues to be significant federal and state regulatory activity relating to financial services companies, particularly mutual fund companies and their investment advisers. As part of an ongoing investigation regarding potential market timing, recordkeeping and trading compliance issues and matters affecting the Fund’s investment adviser, TFAI, and certain affiliates and former employees of TFAI, the SEC staff has indicated that it is likely to take some action against TFAI and certain of its affiliates at the conclusion of the investigation. The potential timing and the scope of any such action is difficult to predict. Although the impact of any action brought against TFAI and/or its affiliates is difficult to assess at the present time, the Fund currently believes that the likelihood that any such action will have a material adverse impact is remote. It is important to note that the Fund is not aware of any allegation of wrong doing against it and its Board at the time this annual report is printed. Although it is not anticipated that these developments will have an adverse impact on the Fund, there can be no assurance at this time. TFAI and its affiliates are actively working with the SEC in regard to this matter; however, the exact resolution cannot be determined at this time. TFAI will take such actions that it deems necessary or appropriate to continue providing management services to the Fund and to bring all matters to an appropriate conclusion.
TFAI and/or its affiliates, and not the Fund, will bear the costs regarding these regulatory matters.
NOTE 6. RECENTLY ISSUED ACCOUNTING PRONOUNCEMENTS
In July 2006, the Financial Accounting Standards Board (“FASB”) released FASB Interpretation No. 48 “Accounting for Uncertainty in Income Taxes” (“FIN 48”), an interpretation of FASB Statement No. 109. FIN 48 provides guidance for how uncertain tax positions should be recognized, measured, presented and disclosed in the financial statements. FIN 48 requires the accounting and disclosure of tax positions taken or expected to be taken in the course of preparing the Fund’s tax returns to determine whether the tax positions are “more-likely- than-not” of being sustained by the applicable tax authority. Tax positions not deemed to meet the more-likely-than-not threshold would be recorded as a tax benefit or expense in the current year.
Adoption of FIN 48 is effective during the first required financial reporting period for fiscal years beginning after December 15, 2006. Management adopted FIN 48 on June 29, 2007.
Implementation of FIN 48 requires Management of the Fund to analyze all open tax years, as defined by the Statute of Limitations, for all major jurisdictions, which includes federal and certain states. Open tax years are those that are open for exam by taxing authorities (i.e., the last 4 tax year ends and the interim tax period since then). The Fund has no examinations in progress and none are expected at this time.
Management of the Fund has reviewed all open tax years and major jurisdictions and concluded the adoption of FIN 48 resulted in no impact to the Fund’s net assets or results of operations. There is no tax liability resulting from unrecognized tax benefits relating to uncertain income tax positions taken or expected to be taken in future tax returns. The Fund is also not aware of any tax positions for which it is reasonably possible that the total amounts of unrecognized tax benefits will significantly change in the next 12 months.
In September 2006, FASB issued its new Standard No. 157, “Fair Value Measurements” (“FAS 157”). FAS 157 is designed to unify guidance for the measurement of fair value of all types of assets, including financial instruments, and certain liabilities, throughout a number of accounting standards. FAS 157 also establishes a hierarchy for measuring fair value in generally accepted accounting principles and expands financial statement disclosures about fair value measurements that are relevant to mutual funds. FAS 157 is effective for financial statements issued for fiscal years beginning after November 15, 2007, and earlier application is permitted.
As of December 31, 2007, Management does not expect the adoption of FAS 157 to impact the amounts reported in the financial statements, however, additional disclosures will be required about the inputs used to develop the measurements of fair value and the effect of certain of the measurements reported in the statement of operations for a fiscal period.
NOTE 7. SUBSEQUENT EVENT
Effective January 1, 2008, TFAI changed its name to Transamerica Asset Management, Inc.
Effective May 1, 2008, AEGON/Transamerica Series Trust will change its name to Transamerica Series Trust. At that time, the Fund will also change its name to Transamerica Capital Guardian Value VP.
12
Report of Independent Registered Certified Public Accounting Firm
To the Board of Trustees and Shareholders of
Capital Guardian Value:
In our opinion, the accompanying statement of assets and liabilities, including the schedule of investments, and the related statements of operations and of changes in net assets and the financial highlights present fairly, in all material respects, the financial position of Capital Guardian Value (the “Fund”) (one of the portfolios constituting AEGON/Transamerica Series Trust) at December 31, 2007, the results of its operations for the year then ended, the changes in its net assets for each of the two years in the period then ended and the financial highlights for each of the periods presented, in conformity with accounting principles generally accepted in the United States of America. These financial statements and financial highlights (hereafter referred to as “financial statements”) are the responsibility of the Fund’s management; our responsibility is to express an opinion on these financial statements based on our audits. We conducted our audits of these financial statements in accordance with the standards of the Public Company Accounting Oversight Board (United States). Those standards require that we plan and perform the audit to obtain reasonable assurance about whether the financial statements are free of material misstatement. An audit includes examining, on a test basis, evidence supporting the amounts and disclosures in the financial statements, assessing the accounting principles used and significant estimates made by management, and evaluating the overall financial statement presentation. We believe that our audits, which included confirmation of securities at December 31, 2007 by correspondence with the custodian and brokers, provide a reasonable basis for our opinion.

Tampa, Florida
February 29, 2008
13
Capital Guardian Value
SUPPLEMENTAL TAX INFORMATION (unaudited)
(all amounts in thousands)
For tax purposes, the Fund has made a Long-Term Capital Gain Designation of $64,764 for the year ended December 31, 2007.
RESULTS OF SHAREHOLDER PROXY (unaudited)
At a special meeting of shareholders held on October 30, 2007, the results of the Proposals were as follows:
Proposal 1: To elect a new Board:
Proposed | | | | | | Abstentions/Broker Non- | |
Trustee | | For | | Against | | Votes | |
John K. Carter | | 2,274,998,840.817 | | 57,804,698.755 | | 35,433.883 | |
| | | | | | | |
Leo J. Hill | | 2,277,212,702.754 | | 55,590,836.819 | | 35,433.883 | |
| | | | | | | |
Neal M. Jewell | | 2,266,793,295.663 | | 66,010,243.909 | | 35,433.883 | |
| | | | | | | |
Russell A. Kimball, Jr. | | 2,274,825,235.835 | | 57,978,303.737 | | 35,433.883 | |
| | | | | | | |
Eugene M. Mannella | | 2,274,623,165.033 | | 58,180,374.539 | | 35,433.883 | |
| | | | | | | |
Norm R. Nielsen | | 2,275,050,055.885 | | 57,753,483.687 | | 35,433.883 | |
| | | | | | | |
Joyce Galpern Norden | | 2,270,278,122.250 | | 62,525,417.323 | | 35,433.883 | |
| | | | | | | |
Patricia L. Sawyer | | 2,275,737,737.456 | | 57,065,802.116 | | 35,433.883 | |
| | | | | | | |
John W. Waechter | | 2,276,615,120.140 | | 56,188,419.433 | | 35,433.883 | |
Proposal 2: To approve an amendment to the Agreement and Declaration of Trust:
| | | | Abstentions/Broker Non- | |
For | | Against | | Votes | |
2,182,022,669.110 | | 77,590,048.544 | | 73,226,255.801 | |
14
Capital Guardian Value
INVESTMENT ADVISORY AND SUB-ADVISORY AGREEMENTS-REVIEW AND RENEWAL (unaudited)
At a meeting of the Board of Trustees of AEGON/Transamerica Series Trust (“ATST”) held on December 4th, 2007, the Board reviewed and considered the renewal of the investment advisory agreement (the “Investment Advisory Agreement”) between Capital Guardian Value (the “Fund”) and Transamerica Fund Advisors, Inc. (“TFAI”), as well as the renewal of the investment sub-advisory agreement (the “Sub-Advisory Agreement”) of the Fund between TFAI and Capital Guardian Trust Company (the “Sub-Adviser”), to determine whether the agreements should be renewed for a six-month period. It was noted that this review was interim in nature to align all the Funds on the same calendar, and that the Funds’ advisory arrangements would be reviewed again in the first half of 2008.
Following their review and consideration, the Trustees determined that the renewal of the Investment Advisory Agreement and the Sub-Advisory Agreement would enable shareholders of the Fund to obtain high quality services at a cost that is appropriate, fair, and in the best interests of its shareholders. The Board, including the independent members of the Board, unanimously approved the renewal of the Investment Advisory Agreement and Sub-Advisory Agreement. In reaching their decision, the Trustees requested and obtained from TFAI and the Sub-Adviser such information as they deemed reasonably necessary to evaluate the agreements, including information about fees and performance of comparable funds managed by the Sub-Adviser. The Trustees also carefully considered information they had previously received from TFAI and the Sub-Adviser throughout the year as part of their regular oversight of the Fund, as well as comparative fee, expense, and performance information prepared by Lipper Inc. (“Lipper”), an independent provider of mutual fund performance, fee and expense information and profitability data prepared by management. In considering the proposed continuation of the Investment Advisory and Sub-Advisory Agreements, the Trustees evaluated a number of considerations that they believed, in light of the legal advice furnished to them by independent legal counsel and their own business judgment, to be relevant. They based their decisions on a variety of factors, including the following considerations, among others, although they did not identify any consideration or particular information that was controlling of their decisions:
The nature, extent and quality of the advisory services to be provided. The Board considered the nature and quality of the services provided by TFAI and the Sub-Adviser to the Fund in the past, as well as the services anticipated to be provided in the future. The Board concluded that TFAI and the Sub-Adviser are capable of providing high quality services to the Fund, as indicated by the nature and quality of services provided in the past by TFAI and the Sub-Adviser for this series and the experience, capability and integrity of TFAI’s senior management, the financial resources of TFAI and the Sub-Adviser, TFAI’s management oversight process and the professional qualifications of the portfolio management team of the Sub-Adviser. The Trustees determined that TFAI and the Sub-Adviser can provide investment and related services that are appropriate in scope and extent in light of the Fund’s operations, the competitive landscape of the investment company business and investor needs.
The investment performance of the Fund. The Board examined the short and longer-term performance of the Fund, including relative performance against a peer universe of comparable mutual funds as prepared by Lipper for various trailing periods ended June 30, 2007. The Board noted the performance of the Fund over the 1-, 3- and 5-year periods indicated attractive longer-term results, but that shorter-term performance has lagged. On the basis of the Board’s assessment of the nature, extent and quality of advisory services to be provided or procured by TFAI and the Sub-Adviser, the Board concluded that TFAI and the Sub-Adviser are capable of providing a level of investment performance that is appropriate in light of the Fund’s proposed investment objectives, policies and strategies and competitive with other similarly situated investment companies, but the Board noted that they would be monitoring performance closely.
The cost of advisory services provided and the level of profitability. The Board reviewed profitability information of TFAI’s cost of procuring fund management services, as well as the costs of provision of administration, fund accounting and other services, to the Fund and to ATST as a whole by TFAI and its affiliates. The Board reviewed the management and sub-advisory fees for the Fund. The Board noted that contractual advisory fees were close to the median for the expense group and universe. The Board noted further that total expenses were slightly above median relative to the peer group and slightly below median relative to the peer universe. The Board noted that fees were renegotiated for 2008. Based on their review, the Trustees determined that the management fees of the Fund generally are appropriate in light of the services expected to be provided or procured, the management fees and the anticipated profitability of the relationship between the Fund, TFAI and its affiliates, and the Sub-Adviser. In making these observations and determinations, the Board reviewed, among other things, comparative information provided by Lipper.
Whether fee levels reflect economies of scale and the extent to which economies of scale would be realized as the Fund grows. In evaluating the extent to which the management fees payable under the Investment Advisory and Sub-Advisory Agreements reflect economies of scale or will permit economies of scale to be realized in the future. The Board noted that TFAI and the Sub-Adviser offer breakpoints which appropriately benefit investors by passing on economies of scale in the form of lower management fees as the level of assets grows. The Board further noted additional breakpoints are proposed for 2008 further reducing the sub-advisory fee. The Trustees also concluded that they will have the opportunity to periodically reexamine whether the Fund has achieved economies of scale, and the appropriateness of management fees payable to TFAI and fees paid to the Sub-Adviser, in the future.
Benefits (such as soft dollars) to TFAI, its affiliates, or the Sub-Adviser from their relationship with the Fund. The Board concluded that other benefits anticipated to be derived by TFAI, its affiliates, and the Sub-Adviser from their relationships with the Fund are expected to be reasonable and fair, and consistent with industry practice and the best interests of the Fund and its shareholders. The Trustees noted that TFAI would not realize soft dollar benefits from its relationship with the Fund. The Board also noted that the Sub-Adviser is participating in a brokerage program pursuant to which a portion of brokerage commissions paid by the Fund is recaptured for the benefit of the Fund and its shareholders, thus limiting the amount of soft dollar arrangements the Sub-Adviser may engage in with respect to the Fund’s brokerage transactions.
15
Other considerations. The Board determined that TFAI has made a substantial commitment to the recruitment and retention of high quality personnel, and maintains the financial, compliance and operational resources reasonably necessary to manage the Fund in a professional manner that is consistent with the best interests of the Fund and its shareholders. In this regard, the Trustees favorably considered the procedures and policies in place by TFAI to enforce compliance with applicable laws and regulations and oversee the portfolio management activities of the Sub-Adviser. The Trustees also determined that TFAI has made a significant entrepreneurial commitment to the management and success of the Fund, reflected by TFAI’s expense limitation and fee waiver arrangements with the Fund which may result in TFAI waiving a substantial amount of management fees for the benefit of shareholders.
16
Clarion Global Real Estate Securities
MARKET ENVIRONMENT
It was a tough year for real estate stocks. After a promising start to the year, real estate stocks came under selling pressure later in the year, particularly in the fourth quarter when global listed real estate stocks fell 10%. For the first time since 1998, global real estate stocks fell for the year as the index was down -7.3% in 2007. European real estate stocks were by far the worst performers, off over 25% as United Kingdom (“UK”) real estate stocks went from being one of the best performers in 2006 to one of the worst in 2007, declining 36%. North American real estate stocks were down over 16%. Real Estate Investment Trusts (“REITs”) suffered one of the worst years ever in the U.S., falling almost 17% (much of it during the fourth quarter) despite the receipt of a healthy 4%+ dividend. Asia-Pacific was the only region to deliver positive returns for the year (+12.9%), but only because of Hong Kong (+57%) and Singapore (+16%). Hong Kong listed property companies were the only major geographic area to record positive total returns during the fourth quarter. Japan real estate stocks were off 7% for the year; Australian real estate stocks were up slightly (+3%), despite a terrible fourth quarter.
We managed to mitigate the downside. Through a combination of stock selection and asset allocation decisions we were able to outperform the benchmark for the year. Nearly two-thirds of our relative outperformance during the year came from good stock selection, particularly in Europe and Asia. Our favorable security selections in the UK and Austria were offset slightly by our picks in France and Germany. In Asia, Hong Kong stock picks added value despite some drag from mainland China developers during the fourth quarter. In terms of asset allocation, our underweight of Continental Europe and our overweight of Hong Kong were major contributors to outperformance but were partially offset by our overweight of the UK early in the year, our overweight of Japan and our underweight of Australia.
PERFORMANCE
For the year ended December 31, 2007, Clarion Global Real Estate Securities, Initial Class returned (6.70)%. By comparison its benchmark, the S&P/Citigroup World Property Index (“Citigroup World Property”), returned (7.25)%.
STRATEGY REVIEW
The portfolio offers a global strategy for real estate securities investors in the U.S. The portfolio generally owns between 80-110 real estate stocks with the goal of outperforming the Citigroup World Property. The portfolio seeks to own attractively priced stocks that own property in markets with favorable underlying real estate fundamentals. The global universe of public real estate companies is approximately three times the size of the U.S. public company universe, which offers additional choices and diversification opportunities to the manager.
Real estate demand is a function of economic growth. There is reason for concern. More headlines about declining home prices, sub-prime mortgage write-offs and higher residential mortgage delinquencies, we believe, will affect the general mood about real estate of all types: residential and commercial. More directly relevant to the commercial real estate companies we invest in will be the flow of data suggesting that private market real estate values are coming down. Unwinding overleveraged real estate deals done before the current credit market turmoil and redemptions in open-end real estate funds that cause forced sales may create some pressure on cap rates and produce some sensational headlines about real estate value declines.
T. Ritson Ferguson, CFA
Joseph P. Smith, CFA
Steven D. Burton, CFA
Co-Portfolio Managers
ING Clarion Real Estate Securities, L.P.
AEGON/Transamerica Series Trust | Annual Report 2007 |
1
Clarion Global Real Estate Securities
(unaudited)

Average Annual Total Return for Periods Ended 12/31/2007
| | | | | | From | | Inception | |
| | 1 Year | | 5 Years | | Inception | | Date | |
Initial Class | | (6.70 | )% | 22.12 | % | 13.19 | % | 5/1/98 | |
S&P/Citigroup World Property (1) | | (7.25 | )% | 23.55 | % | 12.51 | % | 5/1/98 | |
| | | | | | | | | |
Service Class | | (6.91 | )% | — | % | 22.23 | % | 5/1/03 | |
NOTES
(1) The S&P/Citigroup World Property (S&P Citigroup World Property) Index is an unmanaged index used as a general measure of market performance. Calculations assume dividends and capital gains are reinvested and do not include any managerial expenses. From inception, calculation is based on life of Initial Class shares.
The performance data presented represents past performance; future results may vary. The portfolio’s investment return and net asset value will fluctuate. Past performance does not guarantee future results. Investor’s units when redeemed may be worth more or less than their original cost.
Current performance may be lower or higher than performance quoted. Please visit your insurance company’s website for contract or policy level standardized total returns current to the most recent month end. Portfolio performance is net of investment fees and fund expenses, but not product charges, which, if included, would significantly lower the performance quoted.
Risks associated with real estate securities include fluctuations in the value of real estate, extended vacancies and uninsured damage losses from natural disasters. Global investing involves special risks including fluctuations, political instability and different financial accounting standards.
This material must be preceded or accompanied by a current prospectus, which includes specific contents regarding the investment objectives, explanation of share classes and policies of this portfolio.
2
Clarion Global Real Estate Securities
UNDERSTANDING YOUR FUND’S EXPENSES
(unaudited)
SHAREHOLDER EXPENSES
Fund shareholders may incur ongoing costs, including management and advisory fees, distribution and service fees, and other fund expenses.
The following Example is intended to help you understand your ongoing costs (in dollars and cents) of investing in the Fund and to compare these costs with the ongoing costs of investing in other funds.
The Example is based on an investment of $1,000 invested at July 1, 2007 and held for the entire period until December 31, 2007.
ACTUAL EXPENSES
The first line in the table below provides information about actual account values and actual expenses. You may use the information in this line, together with the amount you invested, to estimate the expenses that you paid over the period. Simply divide your account value by $1,000 (for example, an $8,600 account value divided by $1,000 = 8.6), then multiply the result by the number in the first line of your Fund under the heading entitled “Expenses Paid during Period” to estimate the expenses you paid on your account during this period.
HYPOTHETICAL EXAMPLE FOR COMPARISON PURPOSES
The second line in the table below provides information about hypothetical account values and hypothetical expenses based on the Fund’s actual expense ratio and an assumed rate of return of 5% per year before expenses, which is not the Fund’s actual return. The hypothetical account values and expenses may not be used to estimate the actual ending account balance or expenses you paid for the period. You may use this information to compare the ongoing costs of investing in your Fund and other funds. To do so, compare this 5% hypothetical example with the 5% hypothetical examples that appear in the shareholder reports of the other funds.
Please note that the expenses shown in the table are meant to highlight your ongoing costs only and do not reflect any transactional costs, such as sales charges, redemption fees, brokerage commissions paid on purchases and sales of fund shares. Therefore, the second line under the Fund in the table is useful in comparing ongoing costs only, and will not help you determine the relative total costs of owning different funds. If any of these transaction costs were included, your costs would be higher. The expenses shown in the table do not reflect any fees that may be charged to you by brokers, financial intermediaries or other financial institutions.
| | Beginning
Account
Value | | Ending
Account
Value | | Annualized
Expense
Ratio | | Expenses
Paid During
Period (a) | |
Initial Class | | | | | | | | | |
Actual | | $ | 1,000.00 | | $ | 948.02 | | 0.85 | % | $ | 4.17 | |
Hypothetical (b) | | 1,000.00 | | 1,020.92 | | 0.85 | | 4.33 | |
| | | | | | | | | |
Service Class | | | | | | | | | |
Actual | | 1,000.00 | | 947.17 | | 1.10 | | 5.40 | |
Hypothetical (b) | | 1,000.00 | | 1,019.66 | | 1.10 | | 5.60 | |
| | | | | | | | | | | | |
(a) Expenses are calculated using the Fund’s annualized expense ratio (as disclosed in the table), multiplied by the average account value for the period, multiplied by the number of days in the period (184 days), and divided by the number of days in the year (365 days).
(b) 5% return per year before expenses.
GRAPHICAL PRESENTATION OF SCHEDULE OF INVESTMENTS
By Region
At December 31, 2007
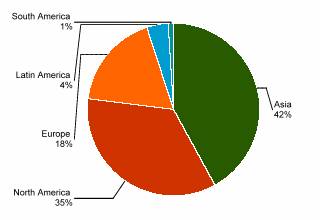
This chart shows the percentage breakdown by region of the Fund’s total investment securities.
3
Clarion Global Real Estate Securities
SCHEDULE OF INVESTMENTS
At December 31, 2007
(all amounts except share amounts in thousands)
| | Shares | | Value | |
COMMON STOCKS (97.1%) | | | | | |
Australia (13.9%) | | | | | |
CFS Retail Property Trust REIT | | 2,086,400 | | $ | 4,287 | |
DB Rreef Trust REIT | | 2,894,687 | | 5,083 | |
Goodman Group | | 2,523,076 | | 10,833 | |
GPT Group REIT | | 1,678,997 | | 5,956 | |
ING Industrial Fund REIT | | 1,280,100 | | 2,855 | |
Macquarie Countrywide Trust REIT | | 2,023,153 | | 2,931 | |
Macquarie Ddr Trust REIT | | 1,787,600 | | 1,209 | |
Mirvac Group REIT | | 1,726,917 | | 9,098 | |
Stockland REIT | | 1,615,900 | | 11,947 | |
Valad Property Group REIT | | 2,457,075 | | 2,783 | |
Westfield Group REIT | | 2,269,318 | | 41,844 | |
Austria (0.8%) | | | | | |
Conwert Immobilien Invest Se ‡^ | | 322,110 | | 5,620 | |
Bermuda (2.1%) | | | | | |
Hongkong Land Holdings, Ltd. | | 783,900 | | 3,873 | |
Kerry Properties, Ltd. | | 943,085 | | 7,577 | |
Mandarin Oriental International, Ltd. | | 583,500 | | 1,377 | |
Shangri-La Asia, Ltd. | | 574,000 | | 1,804 | |
Brazil (0.5%) | | | | | |
Br Malls Participacoes SA ‡ | | 292,100 | | 3,939 | |
Canada (2.1%) | | | | | |
Brookfield Properties Corp. ^ | | 257,350 | | 4,954 | |
Calloway Real Estate Investment Trust | | 113,200 | | 2,809 | |
REIT-144A ‡ | | | | | |
RioCan Real Estate Investment Trust REIT | | 311,300 | | 6,882 | |
Cayman Islands (0.9%) | | | | | |
Shiamo Property Holdings, Ltd. | | 1,138,600 | | 2,906 | |
Shui On Land, Ltd. | | 3,091,800 | | 3,608 | |
Finland (1.5%) | | | | | |
Citycon OYJ (2) | | 1,200,053 | | 6,402 | |
Sponda OYJ | | 339,196 | | 4,033 | |
France (5.2%) | | | | | |
Klepierre REIT | | 31,535 | | 1,612 | |
Mercialys SA REIT | | 110,102 | | 4,213 | |
SILIC REIT | | 20,900 | | 3,065 | |
Societe de La Tour Eiffel REIT | | 18,570 | | 2,548 | |
Unibail-Rodamco | | 117,438 | | 25,741 | |
Germany (0.2%) | | | | | |
DIC Asset AG (2) | | 47,005 | | 1,500 | |
Hong Kong (11.4%) | | | | | |
Agile Property Holdings, Ltd. | | 2,101,100 | | 3,826 | |
Cheung Kong Holdings, Ltd. ‡ | | 1,032,100 | | 19,087 | |
Hang Lung Group, Ltd. | | 1,468,452 | | 8,023 | |
Hang Lung Properties, Ltd. | | 1,669,400 | | 7,558 | |
Link REIT (The) | | 1,954,100 | | 4,230 | |
Sino Land Co. | | 1,389,200 | | 4,935 | |
Sun Hung KAI Properties, Ltd. | | 1,362,655 | | 28,940 | |
Wharf Holdings, Ltd. ‡ | | 821,800 | | 4,305 | |
Japan (12.7%) | | | | | |
Japan Logistics Fund, Inc. Class A REIT | | 463 | | $ | 3,336 | |
Japan Real Estate Investment Corp. Class A REIT | | 507 | | 6,292 | |
Japan Retail Fund Investment Corp. Class A REIT | | 431 | | 3,056 | |
Kenedix Realty Investment Corp. Class A REIT | | 274 | | 1,810 | |
Mitsubishi Estate Co., Ltd. | | 1,150,800 | | 27,418 | |
Mitsui Fudosan Co., Ltd. | | 1,081,100 | | 23,316 | |
New City Residence Investment Corp. Class A REIT | | 571 | | 2,329 | |
Nippon Accommodations Fund, Inc. Class A REIT | | 307 | | 1,591 | |
Nippon Building Fund, Inc. Class A REIT | | 569 | | 7,946 | |
Nomura Real Estate Residential Fund, Inc. Class A REIT | | 269 | | 1,532 | |
NTT Urban Development Corp. | | 1,245 | | 1,993 | |
Sumitomo Realty & Development Co., Ltd. | | 381,900 | | 9,340 | |
Netherlands (1.8%) | | | | | |
Corio NV REIT | | 123,270 | | 9,985 | |
Eurocommercial Properties NV REIT (2) | | 57,570 | | 2,971 | |
Norway (0.2%) | | | | | |
Norwegian Property ASA | | 126,600 | | 1,538 | |
Singapore (3.4%) | | | | | |
Allgreen Properties, Ltd. | | 421,200 | | 436 | |
Ascendas Real Estate Investment Trust REIT ‡ | | 977,000 | | 1,669 | |
Ascott Group, Ltd. (The) | | 1,546,800 | | 1,311 | |
Capitaland, Ltd. | | 2,374,000 | | 10,341 | |
CapitaMall Trust REIT ‡ | | 2,593,200 | | 6,233 | |
Keppel Land, Ltd. | | 282,700 | | 1,430 | |
Wing Tai Holdings, Ltd. (2) | | 1,281,610 | | 2,404 | |
Sweden (0.4%) | | | | | |
Hufvudstaden AB Class A ^ | | 264,340 | | 2,545 | |
United Kingdom (8.0%) | | | | | |
British Land Co. PLC REIT | | 442,000 | | 8,315 | |
Brixton PLC REIT | | 428,700 | | 2,515 | |
Derwent London PLC REIT | | 310,893 | | 8,751 | |
Great Portland Estates PLC REIT | | 266,900 | | 2,497 | |
Hammerson PLC REIT | | 426,957 | | 8,712 | |
Land Securities Group PLC REIT | | 486,031 | | 14,570 | |
Safestore Holdings, Ltd. | | 1,835,105 | | 6,356 | |
Segro PLC REIT | | 513,600 | | 4,805 | |
United States (32.0%) | | | | | |
AMB Property Corp. REIT | | 101,000 | | 5,814 | |
AvalonBay Communities, Inc. REIT ^ | | 73,760 | | 6,944 | |
BioMed Realty Trust, Inc. REIT ^ | | 106,600 | | 2,470 | |
Boston Properties, Inc. REIT | | 165,600 | | 15,204 | |
BRE Properties, Inc. Class A REIT | | 92,300 | | 3,741 | |
Corporate Office Properties Trust SBI REIT ^ | | 82,650 | | 2,603 | |
Douglas Emmett, Inc. REIT | | 147,800 | | 3,342 | |
Equity One, Inc. REIT ^ | | 90,400 | | 2,082 | |
Equity Residential REIT ^ | | 41,200 | | 1,503 | |
Essex Property Trust, Inc. REIT | | 27,300 | | 2,661 | |
Extra Space Storage, Inc. REIT ^ | | 128,200 | | 1,832 | |
Federal Realty Investment Trust REIT ^ | | 133,200 | | 10,942 | |
Felcor Lodging Trust, Inc. REIT ^ | | 119,600 | | 1,865 | |
General Growth Properties, Inc. REIT ^ | | 199,170 | | 8,202 | |
Health Care Property Investors, Inc. REIT | | 223,612 | | 7,777 | |
The notes to the financial statements are an integral part of this report.
4
| | Shares | | Value | |
United States (continued) | | | | | | |
Health Care REIT, Inc. REIT ^ | | 48,200 | | $ | 2,154 | |
Highwoods Properties, Inc. REIT ^ | | 114,700 | | 3,370 | |
Home Properties, Inc. REIT ^ | | 84,600 | | 3,794 | |
Host Hotels & Resorts, Inc. REIT ^ | | 377,423 | | 6,431 | |
Kilroy Realty Corp. REIT | | 58,200 | | 3,199 | |
Kimco Realty Corp. REIT ^ | | 207,800 | | 7,564 | |
LaSalle Hotel Properties REIT ^ | | 58,800 | | 1,876 | |
Macerich Co. (The) REIT ^ | | 122,600 | | 8,712 | |
Nationwide Health Properties, Inc. REIT ^ | | 221,600 | | 6,958 | |
Omega Healthcare Investors, Inc. REIT ^ | | 266,700 | | 4,280 | |
Post Properties, Inc. REIT ^ | | 76,300 | | 2,680 | |
ProLogis REIT | | 252,200 | | 15,984 | |
Public Storage, Inc. REIT ^ | | 39,180 | | 2,876 | |
Regency Centers Corp. REIT | | 157,300 | | 10,144 | |
Simon Property Group, Inc. REIT | | 285,000 | | 24,755 | |
SL Green Realty Corp. REIT ^ | | 105,800 | | 9,888 | |
Starwood Hotels & Resorts Worldwide, Inc. ‡ | | 45,300 | | 1,995 | |
Strategic Hotels & Resorts, Inc. REIT | | 112,200 | | 1,877 | |
Tanger Factory Outlet Centers REIT ^ | | 68,400 | | 2,579 | |
Taubman Centers, Inc. REIT ^ | | 107,900 | | 5,308 | |
Ventas, Inc. REIT ^ | | 325,800 | | 14,742 | |
Vornado Realty Trust REIT | | 95,800 | | 8,425 | |
Total Common Stocks (cost $679,141) | | | | 688,109 | |
| | Contracts (·) | | Value | |
PURCHASED OPTIONS (0.6%) | | | | | |
Covered Call Options (0.6%) | | | | | |
Brascan Residential Properties | | 715,200 | | $ | 4,420 | |
Call Strike $0.00 | | | | | |
Expires 10/22/2008 | | | | | |
Total Purchased Options (cost $5,035) | | | | 4,420 | |
| | | | | | |
| | Shares | | Value | |
RIGHTS (0.0%) | | | | | |
Hong Kong (0.0%) | | | | | |
Wharf Holdings, Ltd. | | 102,725 | | 141 | |
Total Rights (cost $0) | | | | 141 | |
| | | | | |
WARRANTS (1.3%) | | | | | |
Australia (1.3%) | | | | | |
Unitech Limited | | | | | |
Expiration: 06/19/2008, Exercise | | 705,200 | | 8,752 | |
Price: $0.00 | | | | | |
Hong Kong (0.0%) | | | | | |
China Overseas Land & Investment, Ltd. | | | | | |
Expiration: 08/27/2008, Exercise | | 101,583 | | 55 | |
Price: $12.50 | | | | | |
Total Warrants (cost $4,343) | | | | 8,807 | |
| | | | | |
Total Securities Lending Collateral (cost $100,785) (1) | | | | $ | 100,785 | |
| | | | | |
Total Investment Securities (cost $789,304) # | | | | $ | 802,262 | |
NOTES TO SCHEDULE OF INVESTMENTS:
^ At December 31, 2007, all or a portion of this security is on loan (see Note 1). The value at December 31, 2007 of all securities on loan is $97,362.
‡ Non-Income Producing.
· Contract Amounts are not in thousands.
(1) Cash collateral for the Repurchase Agreements, valued at $36,533, that serves as collateral for securities lending, is invested in corporate bonds with interest rates and maturity dates ranging from 3.00% - 10.18% and 04/28/2008 - 12/01/2096, respectively.
(2) Fair Value
# Aggregate cost for federal income tax purposes is $815,873. Aggregate gross unrealized appreciation for all securities in which there is an excess of value over tax cost and aggregate gross unrealized depreciation for all securities in which there is an excess of tax cost over value were $49,151 and $62,762, respectively. Net unrealized depreciation for tax purposes is $13,611.
DEFINITIONS:
144A | | 144A Securities are registered pursuant to Rule 144A of the Securities Act of 1933. These securities are deemed to be liquid for purposes of compliance limitations on holdings of illiquid securities and may be resold as transactions exempt from registration, normally to qualified institutional buyers. At December 31, 2007, these securities aggregated $2,809, or 0.40%, of net assets of the Fund. |
REIT | | Real Estate Investment Trust |
SBI | | Shares Beneficial Interest |
The notes to the financial statements are an integral part of this report.
5
Clarion Global Real Estate Securities
STATEMENT OF ASSETS AND LIABILITIES
At December 31, 2007
(all amounts except per share amounts in thousands)
Assets: | | | |
Investment securities, at value (cost: $789,304) (including securities loaned of $97,362) | | $ | 802,262 | |
Cash | | 4,636 | |
Receivables: | | | |
Investment securities sold | | 4,410 | |
Shares sold | | 150 | |
Interest | | 28 | |
Income from loaned securities | | 16 | |
Dividends | | 3,796 | |
Dividend reclaims | | 70 | |
| | 815,368 | |
Liabilities: | | | |
Investment securities purchased | | 4,470 | |
Accounts payable and accrued liabilities: | | | |
Shares redeemed | | 858 | |
Management and advisory fees | | 469 | |
Distribution and service fees | | 9 | |
Administration fees | | 12 | |
Payable for collateral for securities on loan | | 100,785 | |
Other | | 193 | |
| | 106,796 | |
Net Assets | | $ | 708,572 | |
| | | |
Net Assets Consist of: | | | |
Capital Stock ($.01 par value) | | $ | 360 | |
Additional paid-in capital | | 552,935 | |
Undistributed (accumulated) net investment loss | | (10,440 | ) |
Undistributed (accumulated) net realized gain from investment securities and foreign currency transactions | | 152,745 | |
Net unrealized appreciation on investment securities | | 12,958 | |
Net unrealized appreciation on translation of assets and liabilities denominated in foreign currencies | | 14 | |
Net Assets | | $ | 708,572 | |
Net Assets by Class: | | | |
Initial Class | | $ | 667,356 | |
Service Class | | 41,216 | |
Shares Outstanding: | | | |
Initial Class | | 33,978 | |
Service Class | | 2,049 | |
Net Asset Value and Offering Price Per Share: | | | |
Initial Class | | $ | 19.64 | |
Service Class | | 20.12 | |
STATEMENT OF OPERATIONS
For the year ended December 31, 2007
(all amounts in thousands)
Investment Income: | | | |
Dividends (net of withholding taxes on foreign dividends of $2,067) | | $ | 19,739 | |
Interest | | 291 | |
Income from loaned securities-net | | 258 | |
| | 20,288 | |
| | | |
Expenses: | | | |
Management and advisory fees | | 6,486 | |
Printing and shareholder reports | | 99 | |
Custody fees | | 420 | |
Administration fees | | 173 | |
Legal fees | | 18 | |
Audit fees | | 21 | |
Trustees fees | | 31 | |
Distribution and service fees: | | | |
Service Class | | 135 | |
Other | | 13 | |
Total expenses | | 7,396 | |
| | | |
Net Investment Income | | 12,892 | |
| | | |
Net Realized Gain (Loss) from: | | | |
Investment securities | | 176,585 | |
Foreign currency transactions | | (1,779 | ) |
| | 174,806 | |
| | | |
Net Increase (Decrease) in Unrealized Appreciation (Depreciation) on: | | | |
Investment securities | | (239,584 | ) |
Translation of assets and liabilities denominated in foreign currencies | | (1 | ) |
| | (239,585 | ) |
| | | |
Net Realized and Unrealized (Loss): | | (64,779 | ) |
Net (Decrease) In Net Assets Resulting from Operations | | $ | (51,887 | ) |
The notes to the financial statements are an integral part of this report.
6
Clarion Global Real Estate Securities
STATEMENT OF CHANGES IN NET ASSETS
December 31, 2007
(all amounts in thousands)
| | December 31, | | December 31, | |
| | 2007 | | 2006 | |
Increase (Decrease) in Net Assets From: | | | | | |
Operations: | | | | | |
Net investment income | | $ | 12,892 | | $ | 11,924 | |
Net realized gain from investment securities and foreign currency transactions | | 174,806 | | 62,057 | |
Change in unrealized appreciation (depreciation) on investment securities and foreign currency translation | | (239,585 | ) | 199,151 | |
| | (51,887 | ) | 273,132 | |
Distributions to Shareholders: | | | | | |
From net investment income: | | | | | |
Initial Class | | (53,142 | ) | (10,275 | ) |
Service Class | | (3,186 | ) | (450 | ) |
| | (56,328 | ) | (10,725 | ) |
From net realized gains: | | | | | |
Initial Class | | (53,946 | ) | (83,635 | ) |
Service Class | | (3,323 | ) | (4,008 | ) |
| | (57,269 | ) | (87,643 | ) |
Capital Share Transactions: | | | | | |
Proceeds from shares sold: | | | | | |
Initial Class | | 110,779 | | 122,465 | |
Service Class | | 21,510 | | 22,899 | |
| | 132,289 | | 145,364 | |
Dividends and distributions reinvested: | | | | | |
Initial Class | | 107,088 | | 93,910 | |
Service Class | | 6,509 | | 4,458 | |
| | 113,597 | | 98,368 | |
Cost of shares redeemed: | | | | | |
Initial Class | | (317,863 | ) | (59,753 | ) |
Service Class | | (29,377 | ) | (7,085 | ) |
| | (347,240 | ) | (66,838 | ) |
| | (101,354 | ) | 176,894 | |
Net increase (decrease) in net assets | | (266,838 | ) | 351,658 | |
| | | | | |
Net Assets: | | | | | |
Beginning of year | | 975,410 | | 623,752 | |
End of year | | $ | 708,572 | | $ | 975,410 | |
Undistributed (Accumulated) Net Investment Income (Loss) | | $ | (10,440 | ) | $ | 11,517 | |
Share Activity: | | | | | |
Shares issued: | | | | | |
Initial Class | | 4,499 | | 5,472 | |
Service Class | | 840 | | 1,011 | |
| | 5,339 | | 6,483 | |
Shares issued-reinvested from distributions: | | | | | |
Initial Class | | 5,077 | | 4,526 | |
Service Class | | 301 | | 210 | |
| | 5,378 | | 4,736 | |
Shares redeemed: | | | | | |
Initial Class | | (13,181 | ) | (2,718 | ) |
Service Class | | (1,218 | ) | (316 | ) |
| | (14,399 | ) | (3,034 | ) |
Net increase (decrease) in shares outstanding: | | | | | |
Initial Class | | (3,605 | ) | 7,280 | |
Service Class | | (77 | ) | 905 | |
| | (3,682 | ) | 8,185 | |
The notes to the financial statements are an integral part of this report.
7
Clarion Global Real Estate Securities
FINANCIAL HIGHLIGHTS
For a share outstanding throughout each period(a)
| | Initial Class | |
| | Year Ended December 31, | |
| | 2007 | | 2006 | | 2005 | | 2004 | | 2003 | |
Net Asset Value | | | | | | | | | | | |
Beginning of period | | $ | 24.54 | | $ | 19.77 | | $ | 19.15 | | $ | 15.08 | | $ | 11.41 | |
Investment Operations | | | | | | | | | | | |
Net investment income (loss) | | 0.36 | | 0.35 | | 0.27 | | 0.43 | | 0.51 | |
Net realized and unrealized gain (loss) | | (1.77 | ) | 7.45 | | 2.20 | | 4.35 | | 3.51 | |
Total operations | | (1.41 | ) | 7.80 | | 2.47 | | 4.78 | | 4.02 | |
Distributions | | | | | | | | | | | |
From net investment income | | (1.73 | ) | (0.33 | ) | (0.32 | ) | (0.36 | ) | (0.29 | ) |
From net realized gains | | (1.76 | ) | (2.70 | ) | (1.53 | ) | (0.35 | ) | (0.06 | ) |
Total distributions | | (3.49 | ) | (3.03 | ) | (1.85 | ) | (0.71 | ) | (0.35 | ) |
Net Asset Value | | | | | | | | | | | |
End of period(b) | | $ | 19.64 | | $ | 24.54 | | $ | 19.77 | | $ | 19.15 | | $ | 15.08 | |
Total Return(c),(d) | | (6.70 | )% | 42.27 | % | 13.47 | % | 32.86 | % | 35.74 | % |
Net Assets End of Period (000’s) | | $ | 667,356 | | $ | 922,134 | | $ | 599,134 | | $ | 396,224 | | $ | 213,159 | |
Ratio and Supplemental Data | | | | | | | | | | | |
Expenses to average net assets(e) | | 0.84 | % | 0.84 | % | 0.86 | % | 0.86 | % | 0.87 | % |
Net investment income (loss), to average net assets(e) | | 1.51 | % | 1.59 | % | 1.41 | % | 2.62 | % | 3.96 | % |
Portfolio turnover rate(d) | | 60 | % | 44 | % | 103 | % | 69 | % | 78 | % |
For a share outstanding throughout each period(a)
| | Service Class | |
| | Year Ended December 31, | | May 1 to Dec | |
| | 2007 | | 2006 | | 2005 | | 2004 | | 31, 2003 | |
Net Asset Value | | | | | | | | | | | |
Beginning of period | | $ | 25.06 | | $ | 20.16 | | $ | 19.53 | | $ | 15.37 | | $ | 12.00 | |
Investment Operations | | | | | | | | | | | |
Net investment income (loss) | | 0.31 | | 0.32 | | 0.23 | | 0.47 | | 0.33 | |
Net realized and unrealized gain (loss) | | (1.80 | ) | 7.58 | | 2.23 | | 4.36 | | 3.13 | |
Total operations | | (1.49 | ) | 7.90 | | 2.46 | | 4.83 | | 3.46 | |
Distributions | | | | | | | | | | | |
From net investment income | | (1.69 | ) | (0.30 | ) | (0.30 | ) | (0.32 | ) | (0.03 | ) |
From net realized gains | | (1.76 | ) | (2.70 | ) | (1.53 | ) | (0.35 | ) | (0.06 | ) |
Total distributions | | (3.45 | ) | (3.00 | ) | (1.83 | ) | (0.67 | ) | (0.09 | ) |
Net Asset Value | | | | | | | | | | | |
End of period(b) | | $ | 20.12 | | $ | 25.06 | | $ | 20.16 | | $ | 19.53 | | $ | 15.37 | |
Total Return(c),(d) | | (6.91 | )% | 41.91 | % | 13.18 | % | 32.50 | % | 28.90 | % |
Net Assets End of Period (000’s) | | $ | 41,216 | | $ | 53,276 | | $ | 24,618 | | $ | 11,771 | | $ | 1,072 | |
Ratio and Supplemental Data | | | | | | | | | | | |
Expenses to average net assets(e) | | 1.09 | % | 1.09 | % | 1.11 | % | 1.11 | % | 1.13 | % |
Net investment income (loss), to average net assets(e) | | 1.26 | % | 1.39 | % | 1.21 | % | 2.77 | % | 3.52 | % |
Portfolio turnover rate(d) | | 60 | % | 44 | % | 103 | % | 69 | % | 78 | % |
(a) | | Per share information is calculated based on average number of shares outstanding. |
(b) | | Clarion Global Real Estate Securities (the “Fund”) share class commenced operations as follows: |
| | Initial Class - May 1, 1998 |
| | Service Class - May 1, 2003 |
(c) | | Total Return reflects all portfolio expenses and includes reinvestment of dividends and capital gains; it does not reflect the charges and deductions under the policies or annuity contracts. |
(d) | | Not annualized. |
(e) | | Annualized. |
The notes to the financial statements are an integral part of this report.
8
Clarion Global Real Estate Securities
NOTES TO FINANCIAL STATEMENTS
At December 31, 2007
(all amounts in thousands)
NOTE 1. ORGANIZATION AND SIGNIFICANT ACCOUNTING POLICIES
AEGON/Transamerica Series Trust (“ATST”) is an open-end management investment company registered under the Investment Company Act of 1940, as amended (the “1940 Act”). ATST serves as a funding vehicle for variable life insurance, variable annuity and group annuity products.
Clarion Global Real Estate Securities (the “Fund”) is part of ATST. The Fund is “non-diversified” under the 1940 Act.
In the normal course of business, the Fund enters into contracts that contain a variety of representations that provide general indemnifications. The Fund’s maximum exposure under these arrangements is unknown, as this would involve future claims that may be made against the Fund and/or its affiliates that have not yet occurred. However, based on experience, the Fund expects the risk of loss to be remote.
This report should be read in conjunction with the current Fund prospectus, which contains more complete information about the Fund.
In preparing the Fund’s financial statements in accordance with accounting principles generally accepted in the United States of America (“GAAP”), estimates or assumptions (which could differ from actual results) may be used that affect reported amounts and disclosures. The following is a summary of significant accounting policies followed by the Fund.
Multiple class operations, income and expenses: The Fund currently offers two classes of shares, an Initial Class and a Service Class. Income, non-class specific expenses and realized and unrealized gains and losses, are allocated daily to each class, based upon the value of shares outstanding method as permitted under Rule 18f-3 of the 1940 Act. Each class bears its own specific expenses as well as a portion of general, common expenses.
Security valuations: The Fund values its investments at the close of the New York Stock Exchange (“NYSE”), normally 4 p.m. ET, each day the NYSE is open for business. Fund investments are valued at the last sale price or closing price on the day of valuation taken from the primary exchange where the security is principally traded.
Securities traded in the over-the-counter market and listed securities for which no sale was reported on that date are valued at the last quoted bid price.
Debt securities are valued based on a price quotation or other equivalent indication of value supplied by an exchange, a pricing service or a major market maker; however, those that mature in sixty days or less are valued at amortized cost, which approximates market.
Investment company securities are valued at the net asset value of the underlying portfolio.
Foreign securities generally are valued based on quotations from the primary market in which they are traded. Because many foreign securities markets and exchanges close prior to the close of the NYSE, closing prices for foreign securities in those markets or on those exchanges do not reflect the events that occur after that close. If a significant market event impacting the value of a portfolio security (e.g., natural disaster, company announcement, market volatility) occurs subsequent to the close of trading in the security, but prior to the calculation of the Fund’s net asset value per share, market quotations for that security may be determined to be unreliable and, accordingly, not “readily available.” As a result, foreign equity securities held by the Fund may be valued at fair market value as determined in good faith by the Fund’s Administrative Valuation Committee, using guidelines adopted by the Board of Trustees.
Other securities for which quotations are not readily available are valued at fair market value as determined in good faith by the Fund’s Administrative Valuation Committee, using guidelines adopted by the Board of Trustees.
Cash: The Fund may leave cash overnight in its cash account with the custodian, State Street Bank & Trust Company (“State Street”). On July 2, 2007, State Street acquired the parent company of Investors Bank & Trust Company. State Street has been contracted on behalf of the Fund to invest the excess cash into a savings account, which at December 31, 2007 was paying an interest rate of 2.60%.
Repurchase agreements: The Fund is authorized to enter into repurchase agreements. The Fund, through its custodian, State Street, receives delivery of the underlying securities, the value of which at the time of purchase is required to be an amount equal to at least 100% of the resale price. The Fund will bear the risk of value fluctuations until the security can be sold and may encounter delays and incur costs in liquidating the security. In the event of bankruptcy or insolvency of the seller, delays and costs may be incurred.
Commission recapture: The sub-adviser, to the extent consistent with the best execution and usual commission rate policies and practices, may place security transactions of the Fund with broker/dealers with which ATST has established a Commission Recapture Program. A Commission Recapture Program is any arrangement under which a broker/dealer applies a portion of the commissions received by such broker/dealer on the security transactions to the Fund. In no event will commissions paid by the Fund be used to pay expenses that would otherwise be borne by any other funds within ATST, or by any other party.
Recaptured commissions during the year ended December 31, 2007 of $110 are included in net realized gain (loss) in the Statement of Operations.
9
NOTES TO FINANCIAL STATEMENTS (continued)
At December 31, 2007
(all amounts in thousands)
NOTE 1.– (continued)
Securities lending: The Fund may lend securities to qualified borrowers, with State Street acting as the Fund’s lending agent. The Fund earns negotiated lenders’ fees. The Fund receives cash and/or securities as collateral against the loaned securities. Cash collateral received is invested in short-term, interest-bearing securities. The Fund monitors the market value of securities loaned on a daily basis and requires collateral in an amount at least equal to the value of the securities loaned. Income from loaned securities earned by State Street for its services, shown in the Statement of Operations is net of fees, in the amount of $111.
The Fund has invested the cash collateral received from securities loaned in the following short-term, interest-bearing securities:
Abbey National PLC, Eurodollar Term, 5.00%, 1/7/2008 | | $ | 4,350 | |
ABN AMRO Bank NV, Eurodollar Term, 5.18%, 1/4/2008 | | 3,480 | |
Bank of Nova Scotia, Eurodollar Term, 4.96%, 1/22/2008 | | 3,045 | |
Barclays, Eurodollar Term, 5.00%, 2/12/2008 | | 6,091 | |
BNP Paribas, Eurodollar Term, 5.01%, 1/11/2008 | | 5,656 | |
Calyon, Eurodollar Term, 5.12%, 3/3/2008 | | 1,305 | |
Credit Suisse First Boston Corp., Repurchase Agreement, 4.60%, 1/2/2008 | | 11,311 | |
Dexia Group, Eurodollar Term, 4.82%, 1/3/2008 | | 4,350 | |
HBOS Halifax Bank of Scotland, Eurodollar Term, 5.15%, 1/2/2008 | | 2,175 | |
JPMorgan Chase & Co., Eurodollar Term, 5.15%, 2/12/2008 | | 2,175 | |
Lloyds TSB Bank, Eurodollar Term, 5.15%, 1/24/2008 | | 4,351 | |
Merrill Lynch & Co. (RPG), Repurchase Agreement, 4.60%, 1/2/2008 | | 6,526 | |
Morgan Stanley & Co. (Corp. Repo), Repurchase Agreement, 4.60%, 1/2/2008 | | 17,837 | |
Rabobank Nederland, Eurodollar Term, 5.08%, 1/10/2008 | | 5,221 | |
Reserve Primary Money Market Fund, 4.95% | | 4,640 | |
Royal Bank of Scotland, Eurodollar Term, 5.00%, 2/25/2008 | | 5,221 | |
Societe Generale, Eurodollar Term, 5.15%, 3/3/2008 | | 2,610 | |
Toronto Dominion Bank, Eurodollar Term, 5.05%, 1/10/2008 | | 5,221 | |
UBS AG, Eurodollar Term, 4.92%, 1/11/2008 | | 3,045 | |
Wells Fargo, Bank Note, 4.75%, 1/8/2008 | | 2,175 | |
| | $ | 100,785 | |
Real Estate Investment Trusts (“REITs”): There are certain additional risks involved in investing in REITs. These include, but are not limited to, economic conditions, changes in zoning laws, real estate values, property taxes and interest rates. Since the Fund invests primarily in real estate securities, the net asset value per share may fluctuate more widely than the value of shares of a fund that invests in a broad range of industries.
Dividend income is recorded at management’s estimate of the income included in distributions from the REIT investments. Distributions received in excess of the estimated amount are recorded as a reduction of the cost of investments. The actual amounts of income, return of capital and capital gains are only determined by each REIT after the fiscal year end and may differ from the estimated amounts.
Security transactions and investment income: Security transactions are recorded on the trade date. Security gains and losses are calculated on the first-in, first-out basis. Dividend income, if any, is recorded on the ex-dividend date or, in the case of foreign securities, as soon as the Fund is informed of the ex-dividend date. Interest income, including accretion of discounts and amortization of premiums, is recorded on the accrual basis commencing on the settlement date.
Foreign currency denominated investments: The accounting records of the Fund are maintained in U.S. dollars. Securities and other assets and liabilities denominated in foreign currencies are translated into U.S. dollars at the closing exchange rate each day. The cost of foreign securities is translated at the exchange rate in effect when the investment was acquired. The Fund combines fluctuations from currency exchange rates and fluctuations in value when computing net realized and unrealized gains or losses from investments.
Net foreign currency gains and losses resulting from changes in exchange rates include: 1) foreign currency fluctuations between trade date and settlement date of investment security transactions; 2) gains and losses on forward foreign currency contracts; and 3) the difference between the receivable amounts of interest and dividends recorded in the accounting records in U.S. dollars and the amounts actually received.
Foreign currency denominated assets may involve risks not typically associated with domestic transactions. These risks include revaluation of currencies, adverse fluctuations in foreign currency values and possible adverse political, social and economic developments, including those particular to a specific industry, country or region.
Dividend distributions: Distributions to shareholders are recorded on the ex-dividend date and are determined in accordance with federal income tax regulations which may differ from GAAP.
NOTE 2. RELATED PARTY TRANSACTIONS
ATST serves as a funding vehicle for certain affiliated asset allocation portfolios and certain affiliated separate accounts of Western Reserve Life Assurance Co. of Ohio, Transamerica Life Insurance Company, Transamerica Financial Life Insurance Company, Inc., Monumental Life Insurance Company and Transamerica Occidental Life Insurance Company.
Transamerica Fund Advisors, Inc. (“TFAI”) is the Fund’s investment adviser. Transamerica Fund Services, Inc. (“TFS”) is the Fund’s administrator and transfer agent. Prior to May 1, 2007, AFSG Securities Corp. (“AFSG”), was the Fund’s distributor. Transamerica Capital Inc. (“TCI”) is now the Fund’s distributor. TFAI, TFS, AFSG, and TCI are affiliates of AEGON NV, a Netherlands corporation.
Certain officers and trustees of the Fund are also officers and/or directors of TFAI, TFS and TCI.
10
NOTES TO FINANCIAL STATEMENTS (continued)
At December 31, 2007
(all amounts in thousands)
NOTE 2.– (continued)
The following schedule reflects the percentage of Fund assets owned by affiliated investment companies at December 31, 2007:
| | Net | | % of Net | |
| | Assets | | Assets | |
| | | | | | |
Asset Allocation-Conservative Portfolio | | $ | 17,717 | | 2.50 | % |
| | | | | |
Asset Allocation-Growth Portfolio | | 70,408 | | 9.94 | |
| | | | | |
Asset Allocation-Moderate Growth Portfolio | | 176,472 | | 24.90 | |
| | | | | |
Asset Allocation-Moderate Portfolio | | 82,687 | | 11.67 | |
| | | | | |
Int’l Moderate Growth Fund | | 12,490 | | 1.76 | |
| | | | | | |
Total | | $ | 359,774 | | 50.77 | % |
Investment advisory fee: The Fund pays management fees to TFAI based on average daily net assets (“ANA”) at the following breakpoints:
0.80% of the first $250 million of ANA
0.775% of the next $250 million of ANA
0.70% of the next $500 million of ANA
0.65% of ANA over $1 billion
TFAI has contractually agreed to waive its advisory fee and will reimburse the Fund to the extent that operating expenses, excluding 12b-1 fees, exceed the following stated annual limit:
1.00% Expense Limit
If total Fund expenses fall below the annual expense limitation agreement agreed to by the adviser within the succeeding three years, the Fund may be required to pay the adviser a portion or all of the waived advisory fees.
There were no amounts recaptured during the year ended December 31, 2007. There re no amounts available for recapture at December 31, 2007.
Distribution and service fees: ATST entered into a Distribution Agreement with AFSG dated January 1, 1997, as amended. On May 1, 2007, the Distribution Agreement was amended to replace AFSG with TCI as the Fund’s distributor. The Fund has also adopted a distribution plan (“Distribution Plan”) pursuant to Rule 12b-1 under the 1940 Act.
Under the Distribution Plan for the Initial Class shares, TCI, on behalf of the Fund, is authorized to pay various service providers, as direct payment for expenses incurred in connection with distribution of the Fund’s shares, amounts equal to actual expenses associated with distributing the shares.
The Distribution Plan for the Service Class shares requires ATST to pay distribution fees to TCI as compensation for its activities, not as reimbursement for specific expenses. The fee on the Service Class is paid to the insurance companies for providing services and account maintenance for their policyholders who invest in the variable insurance products which invest in the Service Class shares.
The Fund is authorized under the Distribution Plan to pay fees on each class up to the following limits:
Initial Class | | 0.15 | % |
Service Class | | 0.25 | % |
TCI has determined that it will not seek payment by the Fund of the distribution expenses incurred with respect to the Initial Class shares before April 30, 2009. Prior to TCI seeking reimbursement of future expenses, policy and contract owners will be notified in advance. The Fund will pay fees relating to Service Class shares.
Administrative services: The Fund has entered into an agreement with TFS for financial and legal fund administration services. The Fund pays TFS an annual fee of 0.02% of ANA. The Legal fees on the Statement of Operations are for fees paid to external legal counsel.
Deferred compensation plan: Each eligible independent Fund Trustee may elect participation in a non-qualified deferred compensation plan (“the Plan”). Under the Plan, such Trustees may defer payment of all or a portion of their total fees earned as a Fund Trustee. Each Trustee who is a participant in the Plan may elect that the earnings, losses or gains credited to his or her deferred fee amounts be determined based on a deemed investment in any series of Transamerica IDEX Mutual Funds. The right of a participant to receive a distribution from the Plan of the deferred fees is an unsecured claim against the general assets of all series of Transamerica IDEX Mutual Funds. The pro rata liability to the Fund of all deferred fees in the Plan amounted, as of December 31, 2007, to $34. Amounts deferred under the Plan are unfunded against the general assets of ATST.
Retirement plan: Under a retirement plan (the “Emeritus Plan”) available to the Independent Trustees, each Independent Trustee is deemed to have elected to serve as Trustee Emeritus of ATST upon his or her termination of service, other than removal for cause, and is entitled to 50% of the trustee’s current retainer for a maximum period of five years determined by his or her years of service as a Trustee.
Such amounts shall be accrued by ATST on a pro rata basis allocable to each series of ATST fund based on the relative assets of the series. If retainers increase in the future, past accruals (and credits) will be adjusted upward so that 50% of the Trustee’s current retainer is accrued and credited at all times. Upon death, disability or termination of service, other than removal for cause, amounts deferred become payable to a Trustee Emeritus (or his/her beneficiary). Upon the commencement of service as Trustee Emeritus, compensation will be paid on a quarterly basis during the time period that the Trustee Emeritus is allowed to serve as such.
Amounts accrued under the Emeritus Plan are unsecured claims against the general assets of ATST. For the year ended December 31, 2007, the amount related to the Emeritus Plan was $29. As of December 31, 2007, the Fund has not made any payments related to the Emeritus Plan.
11
NOTES TO FINANCIAL STATEMENTS (continued)
At December 31, 2007
(all amounts in thousands)
NOTE 2.– (continued)
The Emeritus Plan was terminated effective October 30, 2007. Upon the termination, the Fund shall continue to pay any remaining benefits in accordance with the Plan, but no further compensation shall accrue under the Plan.
NOTE 3. INVESTMENT TRANSACTIONS
The cost of securities purchased and proceeds from securities sold (excluding short-term securities) for the year ended December 31, 2007 were as follows:
Purchases of securities: | | | |
Long-term | | $ | 516,768 | |
U.S. Government | | — | |
Proceeds from maturities and sales of securities: | | | |
Long-term | | $ | 712,803 | |
U.S. Government | | — | |
NOTE 4. FEDERAL INCOME TAX MATTERS
The Fund has not made any provision for federal income or excise taxes due to its policy to distribute all of its taxable income and capital gains to its shareholders and otherwise qualify as a regulated investment company under Subchapter M of the Internal Revenue Code. Income and capital gain distributions are determined in accordance with income tax regulations, which may differ from GAAP. These differences are primarily due to differing treatment for items including, but not limited to, wash sales, post October currency loss deferrals, passive foreign investment companies, and foreign currency transactions.
Therefore, distributions determined in accordance with tax regulations may differ significantly in amount or character from net investment income and realized gains for financial reporting purposes. Financial reporting records are adjusted for permanent book/tax differences to reflect tax character. Financial records are not adjusted for temporary differences. These reclassifications are as follows:
Additional paid-in capital | | $ | (8 | ) |
Undistributed (accumulated) net investment income (loss) | | $ | 21,480 | |
Undistributed (accumulated) net realized gain (loss) from investment securities | | $ | (21,472 | ) |
The tax character of distributions paid may differ from the character of distributions shown in the Statements of Changes in Net Assets due to short-term gains being treated as ordinary income for tax purposes.
The tax character of distributions paid during 2006 and 2007 was as follows:
2006 | Distributions paid from: | | | |
| Ordinary Income | | $ | 23,273 | |
| Long-term Capital Gain | | 75,095 | |
| | | | |
2007 | Distributions paid from: | | | |
| Ordinary Income | | 85,783 | |
| Long-term Capital Gain | | 27,814 | |
| | | | | |
The tax basis components of distributable earnings as of December 31, 2007 are as follows:
Undistributed Ordinary Income | | $ | 36,921 | |
Undistributed Long-term Capital Gain | | $ | 132,080 | |
Capital Loss Carryforward | | $ | — | |
Post October Capital Loss Deferral | | $ | — | |
Post October Currency Loss Deferral | | $ | (132 | ) |
Net Unrealized Appreciation (Depreciation)* | | $ | (13,592 | ) |
*The amount includes unrealized appreciation (depreciation) from foreign currency.
NOTE 5. REGULATORY PROCEEDINGS
There continues to be significant federal and state regulatory activity relating to financial services companies, particularly mutual fund companies and their investment advisers. As part of an ongoing investigation regarding potential market timing, recordkeeping and trading compliance issues and matters affecting the Fund’s investment adviser, TFAI, and certain affiliates and former employees of TFAI, the SEC staff has indicated that it is likely to take some action against TFAI and certain of its affiliates at the conclusion of the investigation. The potential timing and the scope of any such action is difficult to predict. Although the impact of any action brought against TFAI and/or its affiliates is difficult to assess at the present time, the Fund currently believes that the likelihood that any such action will have a material adverse impact is remote. It is important to note that the Fund is not aware of any allegation of wrongdoing against it and its Board at the time this annual report is printed. Although it is not anticipated that these developments will have an adverse impact on the Fund, there can be no assurance at this time. TFAI and its affiliates are actively working with the SEC in regard to this matter; however, the exact resolution cannot be determined at this time. TFAI will take such actions that it deems necessary or appropriate to continue providing management services to the Fund and to bring all matters to an appropriate conclusion.
TFAI and/or its affiliates, and not the Fund, will bear the costs regarding these regulatory matters.
12
NOTES TO FINANCIAL STATEMENTS (continued)
At December 31, 2007
(all amounts in thousands)
NOTE 6. RECENTLY ISSUED ACCOUNTING PRONOUNCEMENTS
In July 2006, the Financial Accounting Standards Board (“FASB”) released FASB Interpretation No. 48 “Accounting for Uncertainty in Income Taxes” (“FIN 48”), an interpretation of FASB Statement No. 109. FIN 48 provides guidance for how uncertain tax positions should be recognized, measured, presented and disclosed in the financial statements. FIN 48 requires the accounting and disclosure of tax positions taken or expected to be taken in the course of preparing the Fund’s tax returns to determine whether the tax positions are “more-likely-than-not” of being sustained by the applicable tax authority. Tax positions not deemed to meet the more-likely-than-not threshold would be recorded as a tax benefit or expense in the current year.
Adoption of FIN 48 is effective during the first required financial reporting period for fiscal years beginning after December 15, 2006. Management adopted FIN 48 on June 29, 2007.
Implementation of FIN 48 requires Management of the Fund to analyze all open tax years, as defined by the Statute of Limitations, for all major jurisdictions, which includes federal and certain states. Open tax years are those that are open for exam by taxing authorities (i.e., the last 4 tax year ends and the interim tax period since then). The Fund has no examinations in progress and none are expected at this time.
Management of the Fund has reviewed all open tax years and major jurisdictions and concluded the adoption of FIN 48 resulted in no impact to the Fund’s net assets or results of operations. There is no tax liability resulting from unrecognized tax benefits relating to uncertain income tax positions taken or expected to be taken in future tax returns. The Fund is also not aware of any tax positions for which it is reasonably possible that the total amounts of unrecognized tax benefits will significantly change in the next 12 months.
In September 2006, FASB issued its new Standard No. 157, “Fair Value Measurements” (“FAS 157”). FAS 157 is designed to unify guidance for the measurement of fair value of all types of assets, including financial instruments, and certain liabilities, throughout a number of accounting standards. FAS 157 also establishes a hierarchy for measuring fair value in generally accepted accounting principles and expands financial statement disclosures about fair value measurements that are relevant to mutual funds. FAS 157 is effective for financial statements issued for fiscal years beginning after November 15, 2007, and earlier application is permitted.
As of December 31, 2007, Management does not expect the adoption of FAS 157 to impact the amounts reported in the financial statements, however, additional disclosures will be required about the inputs used to develop the measurements of fair value and the effect of certain of the measurements reported in the statement of operations for a fiscal period.
NOTE 7. SUBSEQUENT EVENT
Effective January 1, 2008, TFAI changed its name to Transamerica Asset Management, Inc.
Effective May 1, 2008, AEGON/Transamerica Series Trust will change its name to Transamerica Series Trust. At that time, the Fund will also change its name to Transamerica Clarion Global Real Estate Securities VP.
13
Report of Independent Registered Certified Public Accounting Firm
To the Board of Trustees and Shareholders of
Clarion Global Real Estate Securities:
In our opinion, the accompanying statement of assets and liabilities, including the schedule of investments, and the related statements of operations and of changes in net assets and the financial highlights present fairly, in all material respects, the financial position of Clarion Global Real Estate Securities (the “Fund”) (one of the portfolios constituting AEGON/Transamerica Series Trust) at December 31, 2007, the results of its operations for the year then ended, the changes in its net assets for each of the two years in the period then ended and the financial highlights for each of the periods presented, in conformity with accounting principles generally accepted in the United States of America. These financial statements and financial highlights (hereafter referred to as “financial statements”) are the responsibility of the Fund’s management; our responsibility is to express an opinion on these financial statements based on our audits. We conducted our audits of these financial statements in accordance with the standards of the Public Company Accounting Oversight Board (United States). Those standards require that we plan and perform the audit to obtain reasonable assurance about whether the financial statements are free of material misstatement. An audit includes examining, on a test basis, evidence supporting the amounts and disclosures in the financial statements, assessing the accounting principles used and significant estimates made by management, and evaluating the overall financial statement presentation. We believe that our audits, which included confirmation of securities at December 31, 2007 by correspondence with the custodian and brokers, provide a reasonable basis for our opinion.

Tampa, Florida
February 29, 2008
14
Clarion Global Real Estate Securities
SUPPLEMENT TAX INFORMATION (unaudited)
(all amounts in thousands)
For tax purposes, the Fund has made a Long-Term Capital Gain Designation of $27,813 for the year ended December 31, 2007.
RESULTS OF SHAREHOLDER PROXY (unaudited)
At a special meeting of shareholders held on October 30, 2007, the results of the Proposals were as follows:
Proposal 1: To elect a new Board:
Proposed | | | | | | Abstentions/Broker Non- | |
Trustee | | For | | Against | | Votes | |
John K. Carter | | 2,274,998,840.817 | | 57,804,698.755 | | 35,433.883 | |
| | | | | | | |
Leo J. Hill | | 2,277,212,702.754 | | 55,590,836.819 | | 35,433.883 | |
| | | | | | | |
Neal M. Jewell | | 2,266,793,295.663 | | 66,010,243.909 | | 35,433.883 | |
| | | | | | | |
Russell A. Kimball, Jr. | | 2,274,825,235.835 | | 57,978,303.737 | | 35,433.883 | |
| | | | | | | |
Eugene M. Mannella | | 2,274,623,165.033 | | 58,180,374.539 | | 35,433.883 | |
| | | | | | | |
Norm R. Nielsen | | 2,275,050,055.885 | | 57,753,483.687 | | 35,433.883 | |
| | | | | | | |
Joyce Galpern Norden | | 2,270,278,122.250 | | 62,525,417.323 | | 35,433.883 | |
| | | | | | | |
Patricia L. Sawyer | | 2,275,737,737.456 | | 57,065,802.116 | | 35,433.883 | |
| | | | | | | |
John W. Waechter | | 2,276,615,120.140 | | 56,188,419.433 | | 35,433.883 | |
Proposal 2: To approve an amendment to the Agreement and Declaration of Trust:
| | | | Abstentions/Broker Non- | |
For | | Against | | Votes | |
2,182,022,669.110 | | 77,590,048.544 | | 73,226,255.801 | |
15
Clarion Global Real Estate Securities
INVESTMENT ADVISORY AND SUB-ADVISORY AGREEMENTS-REVIEW AND RENEWAL (unaudited)
At a meeting of the Board of Trustees of AEGON/Transamerica Series Trust (“ATST”) held on December 4th, 2007, the Board reviewed and considered the renewal of the investment advisory agreement (the “Investment Advisory Agreement”) between Clarion Global Real Estate Securities (the “Fund”) and Transamerica Fund Advisors, Inc. (“TFAI”), as well as the renewal of the investment sub-advisory agreement (the “Sub-Advisory Agreement”) of the Fund between TFAI and ING Clarion Real Estate Securities, LP (the “Sub-Adviser”), to determine whether the agreements should be renewed for a six-month period. It was noted that this review was interim in nature to align all the Funds on the same calendar, and that the Funds’ advisory arrangements would be reviewed again in the first half of 2008.
Following their review and consideration, the Trustees determined that the renewal of the Investment Advisory Agreement and the Sub-Advisory Agreement would enable shareholders of the Fund to obtain high quality services at a cost that is appropriate, fair, and in the best interests of its shareholders. The Board, including the independent members of the Board, unanimously approved the renewal of the Investment Advisory Agreement and Sub-Advisory Agreement. In reaching their decision, the Trustees requested and obtained from TFAI and the Sub-Adviser such information as they deemed reasonably necessary to evaluate the agreements, including information about fees and performance of comparable funds managed by the Sub-Adviser. The Trustees also carefully considered information they had previously received from TFAI and the Sub-Adviser throughout the year as part of their regular oversight of the Fund, as well as comparative fee, expense, and performance information prepared by Lipper Inc. (“Lipper”), an independent provider of mutual fund performance, fee and expense information and profitability data prepared by management. In considering the proposed continuation of the Investment Advisory and Sub-Advisory Agreements, the Trustees evaluated a number of considerations that they believed, in light of the legal advice furnished to them by independent legal counsel and their own business judgment, to be relevant. They based their decisions on a variety of factors, including the following considerations, among others, although they did not identify any consideration or particular information that was controlling of their decisions:
The nature, extent and quality of the advisory services to be provided. The Board considered the nature and quality of the services provided by TFAI and the Sub-Adviser to the Fund in the past, as well as the services anticipated to be provided in the future. The Board concluded that TFAI and the Sub-Adviser are capable of providing high quality services to the Fund, as indicated by the nature and quality of services provided in the past by TFAI and the Sub-Adviser for this series and the experience, capability and integrity of TFAI’s senior management, the financial resources of TFAI and the Sub-Adviser, TFAI’s management oversight process and the professional qualifications of the portfolio management team of the Sub-Adviser. The Trustees determined that TFAI and the Sub-Adviser can provide investment and related services that are appropriate in scope and extent in light of the Fund’s operations, the competitive landscape of the investment company business and investor needs.
The investment performance of the Fund. The Board examined the short and longer-term performance of the Fund, including relative performance against a peer universe of comparable mutual funds as prepared by Lipper for various trailing periods ended June 30, 2007. The Board favorably noted the strong short and longer-term performance of the Fund, however the Board did observe that the longer-term performance reflected a more narrow strategy of investing primarily in domestic real estate. On the basis of the Board’s assessment of the nature, extent and quality of advisory services to be provided or procured by TFAI and the Sub-Adviser, the Board concluded that TFAI and the Sub-Adviser are capable of providing a level of investment performance that is appropriate in light of the Fund’s proposed investment objectives, policies and strategies and competitive with other similarly situated investment companies.
The cost of advisory services provided and the level of profitability. The Board reviewed profitability information of TFAI’s cost of procuring fund management services, as well as the costs of provision of administration, fund accounting and other services, to the Fund and to ATST as a whole by TFAI and its affiliates. The Board reviewed the management and sub-advisory fees for the Fund. The Board noted the Fund’s advisory fees are in line with the Lipper expense group and universe. Based on their review, the Trustees determined that the management fees of the Fund generally are appropriate in light of the services expected to be provided or procured, the management fees and the anticipated profitability of the relationship between the Fund, TFAI and its affiliates, and the Sub-Adviser. In making these observations and determinations, the Board reviewed, among other things, comparative information provided by Lipper.
Whether fee levels reflect economies of scale and the extent to which economies of scale would be realized as the Fund grows. In evaluating the extent to which the management fees payable under the Investment Advisory and Sub-Advisory Agreements reflect economies of scale or will permit economies of scale to be realized in the future, the Board noted that TFAI and the Sub-Adviser offer breakpoints which appropriately benefit investors by passing on economies of scale in the form of lower management fees as the level of assets grows. The Trustees also concluded that they will have the opportunity to periodically reexamine whether the Fund has achieved economies of scale, and the appropriateness of management fees payable to TFAI and fees paid to the Sub-Adviser, in the future.
Benefits (such as soft dollars) to TFAI, its affiliates, or the Sub-Adviser from their relationship with the Fund. The Board concluded that other benefits anticipated to be derived by TFAI, its affiliates, and the Sub-Adviser from their relationships with the Fund are expected to be reasonable and fair, and consistent with industry practice and the best interests of the Fund and its shareholders. The Trustees noted that TFAI would not realize soft dollar benefits from its relationship with the Fund, and that the Sub-Adviser’s soft dollar trading is consistent with applicable law, including best execution requirements in particular. The Board also noted that the Sub-Adviser is participating in a brokerage program pursuant to which a portion of brokerage commissions paid by the Fund is recaptured for the benefit of the Fund and its shareholders, thus limiting the amount of soft dollar arrangements the Sub-Adviser may engage in with respect to the Fund’s brokerage transactions.
16
Other considerations. The Board determined that TFAI has made a substantial commitment to the recruitment and retention of high quality personnel, and maintains the financial, compliance and operational resources reasonably necessary to manage the Fund in a professional manner that is consistent with the best interests of the Fund and its shareholders. In this regard, the Trustees favorably considered the procedures and policies in place by TFAI to enforce compliance with applicable laws and regulations and oversee the portfolio management activities of the Sub-Adviser. The Trustees also determined that TFAI has made a significant entrepreneurial commitment to the management and success of the Fund, reflected by TFAI’s expense limitation and fee waiver arrangements with the Fund which may result in TFAI waiving a substantial amount of management fees for the benefit of shareholders.
17
Federated Market Opportunity
MARKET ENVIRONMENT
The fiscal year was mixed for major equity markets. In the U.S., the Standard and Poor’s 500 Composite Stock Index (“S&P 500”), for example, returned 5.49%. Despite rapidly spreading cracks in the credit markets, equity markets rebounded late in the fiscal year. In terms of currencies and their impact on investment results for international holdings, the U.S. dollar declined against most currencies, including approximately an 8.6% decline against the U.S. dollar index (“DXY”). This increases the value in U.S. dollar terms of returns on international holdings.
The long, unprecedented credit boom evidently has peaked and is on its way to a credit bust, with consequences that reach far beyond the sub-prime segment of the residential mortgage market. This credit boom was accompanied by massive risk-taking and trend following by market participants, who shunned the notion of capital preservation. This has been based on the widespread belief that “they” (the authorities and heads of the major financial firms) are all-powerful and will not let anything bad happen to markets. We believe that unprecedented financial leverage, high degrees of speculation and asset prices, and deteriorating economic conditions make sharp market declines probable. This is based on market history, regardless of what “they” may want.
PERFORMANCE
For the year ended December 31, 2007, Federated Market Opportunity, Initial Class returned (0.48)%. By comparison its primary and secondary benchmarks, the Russell 3000 Value Index and the Merrill Lynch 3-Month Treasury Bill Index, returned (1.01)% and 8.20%, respectively. Effective May 1, 2007, Federated Growth & Income was renamed Federated Market Opportunity.
STRATEGY REVIEW
The portfolio is managed with an emphasis on moderate capital appreciation with low volatility, and an emphasis on capital preservation when valuations and risks are high. It is not managed to an equity benchmark or with regard to the individual components of an equity benchmark. The portfolio’s strategy is an unconventional one that includes holding substantial cash reserves and using put options to emphasize capital preservation when market risks seem high. This will cause the portfolio’s returns to lag those of market benchmarks and peers during periods of sharply rising stock prices. In addition, the portfolio tends to have substantial non-U.S. investments that are generally not hedged against changes in currency values. Periods of rising values of the U.S. dollar in foreign exchange markets will tend to cause currency losses on the portfolio’s non-U.S. investments as international market prices become worth less when converted into (more expensive) U.S. dollars. (The reverse would cause currency gains for the portfolio’s foreign holdings.)
The portfolio has been positioned to benefit from a significant decline in U.S. equity prices. The portfolio had substantial cash reserves in addition to put options as a hedge against an anticipated decline in stock prices. The put options on U.S. equity indexes would increase in value if stock prices fell. Since the market rose over the course of the year, the portfolio had significant net losses on the put options that aggravated the missed profit opportunity from holding cash reserves and short-term government notes instead of holding more in equities. The rationale for the portfolio’s strategy was that market bubble history and market valuation history in general, and rapidly deteriorating economic and financial conditions, supported a highly risk-averse strategy during the period.
In terms of currency impact on the portfolio, the general decline in the foreign-exchange value of the U.S. dollar had a positive impact on the portfolio. It enhanced the U.S. dollar based returns of the portfolio’s international holdings relative to their local market returns, as international returns were converted into more (cheaper) U.S. dollars. In particular, the Canadian dollar and Swiss Franc had positive returns for the portfolio.
Among the several positive contributors to the portfolio’s performance, the best was EnCana Corporation, a Canadian energy company. The worst contributor was from the put options on the S & P 500. From a country perspective, Canadian stocks were the top contributors to the portfolio.
Steven J. Lehman, CFA
Portfolio Manager
Federated Equity Management Company of Pennsylvania
AEGON/Transamerica Series Trust | Annual Report 2007 |
1
Federated Market Opportunity
(unaudited)
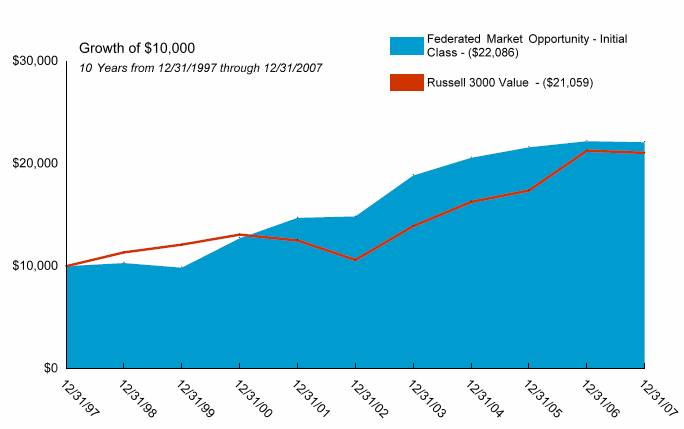
Average Annual Total Return for Periods Ended 12/31/2007
| | | | | | | | From | | Inception | |
| | 1 Year | | 5 Years | | 10 Years | | Inception | | Date | |
| | | | | | | | | | | |
Initial Class | | (0.48 | )% | 8.26 | % | 8.25 | % | 9.86 | % | 3/1/94 | |
Russell 3000 Value (1) | | (1.01 | )% | 14.69 | % | 7.73 | % | 11.68 | % | 3/1/94 | |
Merrill Lynch 3 Month Treasury Bill (1) | | 8.20 | % | 6.20 | % | 6.93 | % | 4.20 | % | 3/1/94 | |
| | | | | | | | | | | |
Service Class | | (0.70 | )% | — | % | — | % | 7.51 | % | 5/1/03 | |
NOTES
(1) The Russell 3000 Value (Russell 3000 Value) Index and Merrill Lynch 3-Month Treasury Bill (3-Month T-Bill) Index are unmanaged indices used as a general measure of market performance. Calculations assume dividends and capital gains are reinvested and do not include any managerial expenses. From inception, calculation is based on life of Initial Class shares.
The performance data presented represents past performance; future results may vary. The portfolio’s investment return and net asset value will fluctuate. Past performance does not guarantee future results. Investor’s units when redeemed may be worth more or less than their original cost.
Current performance may be lower or higher than performance quoted. Please visit your insurance company’s website for contract or policy level standardized total returns current to the most recent month end. Portfolio performance is net of investment fees and fund expenses, but not product charges, which, if included, would significantly lower the performance quoted.
This material must be preceded or accompanied by a current prospectus, which includes specific contents regarding the investment objectives, explanation of share classes and policies of this portfolio.
2
Federated Market Opportunity
UNDERSTANDING YOUR FUND’S EXPENSES
(unaudited)
SHAREHOLDER EXPENSES
Fund shareholders may incur ongoing costs, including management fees, and advisory fees, and other fund expenses.
The following Example is intended to help you understand your ongoing costs (in dollars and cents) of investing in the Fund and to compare these costs with the ongoing costs of investing in other funds.
The Example is based on an investment of $1,000 invested at July 1, 2007 and held for the entire period until December 31, 2007.
ACTUAL EXPENSES
The first line in the table below provides information about actual account values and actual expenses. You may use the information in this line, together with the amount you invested, to estimate the expenses that you paid over the period. Simply divide your account value by $1,000 (for example, an $8,600 account value divided by $1,000 = 8.6), then multiply the result by the number in the first line of your Fund under the heading entitled “Expenses Paid During Period” to estimate the expenses you paid on your account during this period. If your account is an IRA, your expenses could have included a $15 annual fee. The amount of any fee paid through your account would increase the estimate of expenses you paid during the period and decrease your ending account value.
HYPOTHETICAL EXAMPLE FOR COMPARISON PURPOSES
The second line in the table below provides information about hypothetical account values and hypothetical expenses based on the Fund’s actual expense ratio and an assumed rate of return of 5% per year before expenses, which is not the Fund’s actual return. The hypothetical account values and expenses may not be used to estimate the actual ending account balance or expenses you paid for the period. You may use this information to compare the ongoing costs of investing in your Fund and other funds. To do so, compare this 5% hypothetical example with the 5% hypothetical examples that appear in the shareholder reports of the other funds.
Please note that the expenses shown in the table are meant to highlight your ongoing costs only and do not reflect any transactional costs, such as sales charges, redemption fees, brokerage commissions paid on purchases and sales of fund shares. Therefore, the second line under the Fund in the table is useful in comparing ongoing costs only, and will not help you determine the relative total costs of owning different funds. If any of these transaction costs were included, your costs would be higher. The expenses shown in the table do not reflect any fees that may be charged to you by brokers, financial intermediaries or other financial institutions.
| | Beginning
Account
Value | | Ending
Account
Value | | Annualized
Expense
Ratio | | Expenses
Paid During
Period (a) | |
| | | | | | | | | |
Initial Class | | | | | | | | | |
Actual | | $ | 1,000.00 | | $ | 1,024.51 | | 0.81 | % | $ | 4.13 | |
Hypothetical (b) | | 1,000.00 | | 1,021.12 | | 0.81 | | 4.13 | |
| | | | | | | | | |
Service Class | | | | | | | | | |
Actual | | 1,000.00 | | 1,023.23 | | 1.06 | | 5.41 | |
Hypothetical (b) | | 1,000.00 | | 1,019.86 | | 1.06 | | 5.40 | |
| | | | | | | | | | | | |
(a) Expenses are calculated using the Fund’s annualized expense ratio (as disclosed in the table), multiplied by the average account value for the period, multiplied by the number of days in the period (184 days), and divided by the number of days in the year (365 days).
(b) 5% return per year before expenses.
GRAPHICAL PRESENTATION OF SCHEDULE OF INVESTMENTS
By Asset Type
At December 31, 2007

This chart shows the percentage breakdown by asset type of the Fund’s total investment securities.
3
Federated Market Opportunity
SCHEDULE OF INVESTMENTS
At December 31, 2007
(all amounts except share amounts in thousands)
| | | | Principal | | Value | |
U.S. GOVERNMENT OBLIGATIONS (24.2%) | | | | | | | |
United States (24.2%) | | | | | | | |
U.S. Treasury Inflation Indexed Note, | | | | | | | |
2.38%, due 04/15/2011 ^ | | | | $ | 18,946 | | $ | 19,749 | |
U.S. Treasury Note | | | | | | | |
4.00%, due 03/15/2010 ^ | | | | 15,000 | | 15,308 | |
4.88%, due 05/15/2009 | | | | 32,000 | | 32,755 | |
5.13%, due 06/30/2008 | | | | 35,000 | | 35,290 | |
Total U.S. Government Obligations (cost $101,471) | | | | | | 103,102 | |
| | | | | | | |
SOVEREIGN GOVERNMENT OBLIGATIONS (3.6%) | | | | | | | |
Japan (3.6%) | | | | | | | |
Japan Government Two Year Bond | | | | | | | |
0.60%, due 04/15/2008 | | JPY | | 850,000 | | 7,606 | |
0.90%, due 06/15/2008 | | JPY | | 850,000 | | 7,616 | |
Total Sovereign Government Obligations (cost $15,109) | | | | | | 15,222 | |
| | | | | | | | | |
| | Shares | | Value | |
CONVERTIBLE PREFERRED STOCKS (0.7%) | | | | | |
United States (0.7%) | | | | | |
Goldman Sachs Group, Inc. | | | | | |
(The) -144A, Convertible | | 83,000 | | 3,022 | |
Total Convertible Preferred Stocks (cost $3,456) | | | | 3,022 | |
| | | | | |
COMMON STOCKS (19.3%) | | | | | |
Canada (5.3%) | | | | | |
Canetic Resources Trust ^ | | 415,000 | | 5,574 | |
Enerplus Resources Fund ^ | | 105,000 | | 4,205 | |
Goldcorp, Inc. | | 91,000 | | 3,088 | |
Pengrowth Energy Trust | | 285,900 | | 5,104 | |
Penn West Energy Trust ^ | | 175,000 | | 4,550 | |
Japan (3.8%) | | | | | |
NTT DoCoMo, Inc. | | 4,800 | | 7,902 | |
Sankyo Co., Ltd. | | 120,000 | | 5,544 | |
Sega Sammy Holdings, Inc. ^ | | 225,000 | | 2,787 | |
South Africa (2.2%) | | | | | |
Gold Fields, Ltd. | | 560,000 | | 7,952 | |
Harmony Gold Mining Co., Ltd. ‡^ | | 150,000 | | 1,547 | |
United Kingdom (0.7%) | | | | | |
Tate & Lyle PLC | | 350,000 | | 3,100 | |
United States (7.3%) | | | | | |
Coeur D’alene Mines Corp. ‡^ | | 1,025,000 | | 5,063 | |
Electronic Data Systems Corp. | | 260,000 | | 5,390 | |
Forest Laboratories, Inc. ‡ | | 115,000 | | 4,192 | |
Johnson & Johnson | | 48,400 | | 3,228 | |
Lexmark International, Inc. Class A ‡ | | 20,200 | | 704 | |
Office Depot, Inc. ‡ | | 215,000 | | 2,991 | |
Patterson-UTI Energy, Inc. | | 271,000 | | 5,290 | |
Symantec Corp. ‡ | | 250,000 | | 4,035 | |
Total Common Stocks (cost $87,089) | | | | 82,246 | |
| | Principal | | Value | |
REPURCHASE AGREEMENTS (49.2%) | | | | | |
United States (49.2%) | | | | | |
State Street Repurchase Agreement £ 2.55%, dated 12/31/2007 to be repurchased at $209,893 on 01/02/2008 ± | | $ | 209,863 | | $ | 209,863 | |
Total Repurchase Agreements (cost $209,863) | | | | 209,863 | |
| | | | | | | |
| | Contracts· | | Value | |
PURCHASED OPTIONS (1.6%) | | | | | |
Put Options (1.1%) | | | | | |
Mdy Jan08 Put Option | | | | | |
Put Strike $170.00 | | | | | |
Expires 01/19/2008 | | 900 | | 1,332 | |
NASDAQ 100 Jan08 Put-Option | | | | | |
Put Strike $55.00 | | | | | |
Expires 01/19/2008 | | 2,250 | | 840 | |
NASDAQ 100 Put Option | | | | | |
Put Strike $55.00 | | | | | |
Expires 03/31/2008 | | 6,000 | | 2,670 | |
United States (0.5%) | | | | | |
Materials Select Sector SPDR | | | | | |
Put Strike $43.00 | | | | | |
Expires 03/22/2008 | | 5,200 | | 1,508 | |
Midcap SPDR Trust | | | | | |
Put Strike $164.00 | | | | | |
Expires 03/22/2008 | | 600 | | 672 | |
Total Purchased Options (cost $8,652) | | | | 7,022 | |
| | | | | |
Total Securities Lending Collateral (cost $18,565) (1) | | | | 18,565 | |
| | | | | |
Total Investment Securities (cost $444,205) # | | | | $ | 439,042 | |
| | | | | | |
4
FORWARD FOREIGN CURRENCY CONTRACTS:
| | | | | | Amount in | | Net Unrealized | |
| | Bought | | Settlement | | U.S. Dollars | | Appreciation | |
Currency | | (Sold) | | Date | | Bought(Sold) | | (Depreciation) | |
| | | | | | | | | |
Canadian Dollar | | (34,345 | ) | 02/21/2008 | | $ | (34,942 | ) | $ | 125 | |
Euro Dollar | | (16,241 | ) | 06/04/2008 | | (23,890 | ) | 135 | |
Swiss Franc | | 30,133 | | 01/31/2008 | | 26,000 | | 662 | |
Swiss Franc | | (30,133 | ) | 01/31/2008 | | (27,063 | ) | 401 | |
United Kingdom Pound | | (8,574 | ) | 06/04/2008 | | (17,540 | ) | 550 | |
| | | | | | $ | (77,435 | ) | $ | 1,873 | |
FORWARD FOREIGN CROSS CURRENCY CONTRACTS
| | | | | | | | | | Net Unrealized | |
| | | | | | | | Settlement | | Appreciation | |
Currency Bought | | Currency Sold | | Date | | (Depreciation) | |
| | | | | | | | | | | | |
Canadian Dollar | | 31,143 | | Japanese Yen | | 3,420,638 | | 05/13/2008 | | $ | 552 | |
Japanese Yen | | 3,420,638 | | Canadian Dollar | | 30,244 | | 05/13/2008 | | 360 | |
Japanese Yen | | 951,802 | | Euro Dollar | | 5,923 | | 06/04/2008 | | (14 | ) |
| | | | | | | | | | $ | 898 | |
| | | | | | | | | | | | | | |
NOTES TO SCHEDULE OF INVESTMENTS:
^ | | At December 31, 2007, all or a portion of this security is on loan (see Note 1). The value at December 31, 2007, of all securities on loan is $17,796. |
‡ | | Non-Income Producing. |
£ | | State Street serves as the accounting, custody and lending agent for the Fund and provides various administrative functions for the Funds. |
± | | At December 31, 2007, repurchase agreements excluding collateral for securities on loan are collateralized by U.S. Government Agency Obligations with interest rates and maturity dates ranging from 3.83% - 6.21% and 12/01/2020 - 05/15/2036, respectively, and with a market value plus accrued interest of $214,496. |
1 | | Cash collateral for the Repurchase Agreements, valued at $6,730, that serves as collateral for securities lending, is invested in corporate bonds with interest rates and maturity dates ranging from 3.00% - 10.18% and 04/28/2008 - 12/01/2096, respectively. |
# | | Aggregate cost for federal income tax purposes is $444,210. Aggregate gross unrealized appreciation for all securities in which there is an excess of value over tax cost and aggregate gross unrealized depreciation for all securities in which there is an excess of tax cost over value were $6,014 and $11,182, respectively. Net unrealized depreciation for tax purposes is $5,168. |
· | | Contract amounts are not in thousands. |
DEFINITIONS:
144A | | 144A Securities are registered pursuant to Rule 144A of the Securities Act of 1933. These securities are deemed to be liquid for purposes of compliance limitations on holdings of illiquid securities and may be resold as transactions exempt from registration, normally to qualified institutional buyers. At December 31, 2007, these securities aggregated $3,022, or 0.71%, of net assets of the Fund. |
SPDR | | Standard & Poor’s Depository Receipts |
JPY | | Japanese Yen |
The notes to the financial statements are an integral part of this report.
5
Federated Market Opportunity
STATEMENT OF ASSETS AND LIABILITIES
At December 31, 2007
(all amounts except per share amounts in thousands)
Assets: | | | |
Investment securities, at value (cost: $444,205)
(including securities loaned of $17,796) | | $ | 439,042 | |
Cash | | 70 | |
Receivables: | | | |
Investment securities sold | | 3,772 | |
Shares sold | | 77 | |
Interest | | 511 | |
Income from loaned securities | | 54 | |
Dividends | | 290 | |
Dividend reclaims | | 66 | |
Unrealized appreciation on forward foreign currency contracts | | 2,785 | |
| | 446,667 | |
Liabilities: | | | |
Investment securities purchased | | 459 | |
Accounts payable and accrued liabilities: | | | |
Shares redeemed | | 427 | |
Management and advisory fees | | 274 | |
Distribution and service fees | | 5 | |
Administration fees | | 7 | |
Foreign currency due to custodian | | 1 | |
Payable for collateral for securities on loan | | 18,565 | |
Unrealized depreciation on forward foreign currency contracts | | 14 | |
Other | | 120 | |
| | 19,872 | |
Net Assets | | $ | 426,795 | |
| | | |
Net Assets Consist of: | | | |
Capital Stock ($.01 par value) | | $ | 290 | |
Additional paid-in capital | | 419,755 | |
Undistributed (accumulated) net investment income | | 15,429 | |
Undistributed (accumulated) net realized loss from investment securities and foreign currrency transactions | | (6,290 | ) |
Net unrealized (depreciation) on investment securities | | (5,163 | ) |
Net unrealized appreciation on translation of assets and liabilities denominated in foreign currencies | | 2,774 | |
Net Assets | | $ | 426,795 | |
Net Assets by Class: | | | |
Initial Class | | $ | 401,656 | |
Service Class | | 25,139 | |
Shares Outstanding: | | | |
Initial Class | | 27,391 | |
Service Class | | 1,654 | |
Net Asset Value and Offering Price Per Share: | | | |
Initial Class | | $ | 14.66 | |
Service Class | | 15.20 | |
STATEMENT OF OPERATIONS
For the year ended December 31, 2007
(all amounts in thousands)
Investment Income: | | | |
Dividends (net of withholding taxes on foreign dividends of $424) | | $ | 4,045 | |
Interest | | 12,208 | |
Income from loaned securities-net | | 237 | |
| | 16,490 | |
| | | |
Expenses: | | | |
Management and advisory fees | | 3,492 | |
Printing and shareholder reports | | 89 | |
Custody fees | | 71 | |
Administration fees | | 93 | |
Legal fees | | 10 | |
Audit fees | | 21 | |
Trustees fees | | 16 | |
Distribution and service fees: | | | |
Service Class | | 72 | |
Other | | 7 | |
Total expenses | | 3,871 | |
| | | |
Net Investment Income | | 12,619 | |
| | | |
Net Realized Gain (Loss) from: | | | |
Investment securities | | (9,617 | ) |
Foreign currency transactions | | 1,765 | |
| | (7,852 | ) |
Net Increase (Decrease) in Unrealized Appreciation (Depreciation) on: | | | |
Investment securities | | (11,796 | ) |
Translation of assets and liabilities denominated in foreign currencies | | 2,767 | |
| | (9,029 | ) |
| | | |
Net Realized and Unrealized (Loss): | | (16,881 | ) |
Net (Decrease) In Net Assets Resulting from Operations | | $ | (4,262 | ) |
The notes to the financial statements are an integral part of this report.
6
Federated Market Opportunity
STATEMENT OF CHANGES IN NET ASSETS
For the years ended
(all amounts in thousands)
| | December 31, | | December 31, | |
| | 2007 | | 2006 | |
Increase (Decrease) in Net Assets From: | | | | | |
Operations: | | | | | |
Net investment income | | $ | 12,619 | | $ | 16,840 | |
Net realized gain (loss) from investment securities | | (7,852 | ) | 7,644 | |
Change in unrealized (depreciation) on investment securities | | (9,029 | ) | (9,850 | ) |
Net increase (decrease) in net assets resulting from operations | | (4,262 | ) | 14,634 | |
Distributions to Shareholders: | | | | | |
From net investment income: | | | | | |
Initial Class | | (16,177 | ) | (9,100 | ) |
Service Class | | (960 | ) | (489 | ) |
| | (17,137 | ) | (9,589 | ) |
From net realized gains: | | | | | |
Initial Class | | (2,079 | ) | (42,475 | ) |
Service Class | | (134 | ) | (2,581 | ) |
| | (2,213 | ) | (45,056 | ) |
Capital Share Transactions: | | | | | |
Proceeds from shares sold: | | | | | |
Initial Class | | 42,022 | | 61,323 | |
Service Class | | 6,709 | | 8,192 | |
| | 48,731 | | 69,515 | |
Dividends and distributions reinvested: | | | | | |
Initial Class | | 18,254 | | 51,575 | |
Service Class | | 1,094 | | 3,070 | |
| | 19,348 | | 54,645 | |
Cost of shares redeemed: | | | | | |
Initial Class | | (155,260 | ) | (134,117 | ) |
Service Class | | (13,684 | ) | (9,396 | ) |
| | (168,944 | ) | (143,513 | ) |
| | (100,865 | ) | (19,353 | ) |
Net increase (decrease) in net assets | | (124,477 | ) | (59,364 | ) |
| | | | | |
Net Assets: | | | | | |
Beginning of year | | 551,272 | | 610,636 | |
End of year | | $ | 426,795 | | $ | 551,272 | |
Undistributed (Accumulated) Net Investment Income (Loss) | | $ | 15,429 | | $ | 17,077 | |
Share Activity: | | | | | |
Shares issued: | | | | | |
Initial Class | | 2,804 | | 3,664 | |
Service Class | | 434 | | 479 | |
| | 3,238 | | 4,143 | |
Shares issued-reinvested from distributions: | | | | | |
Initial Class | | 1,274 | | 3,281 | |
Service Class | | 74 | | 189 | |
| | 1,348 | | 3,470 | |
Shares redeemed: | | | | | |
Initial Class | | (10,372 | ) | (8,227 | ) |
Service Class | | (887 | ) | (561 | ) |
| | (11,259 | ) | (8,788 | ) |
Net increase (decrease) in shares outstanding: | | | | | |
Initial Class | | (6,294 | ) | (1,282 | ) |
Service Class | | (379 | ) | 107 | |
| | (6,673 | ) | (1,175 | ) |
The notes to the financial statements are an integral part of this report.
7
Federated Market Opportunity
FINANCIAL HIGHLIGHTS
For a share outstanding throughout each period (a)
| | Initial Class | |
| | Year Ended December 31 | |
| | 2007 | | 2006 | | 2005 | | 2004 | | 2003 | |
| | | | | | | | | | | |
Net Asset Value | | | | | | | | | | | |
Beginning of period | | $ | 15.40 | | $ | 16.52 | | $ | 17.59 | | $ | 17.09 | | $ | 14.35 | |
Investment Operations | | | | | | | | | | | |
Net investment income (loss) | | 0.41 | | 0.48 | | 0.30 | | 0.30 | | 0.48 | |
Net realized and unrealized gain (loss) | | (0.50 | ) | — | (f) | 0.52 | | 1.20 | | 3.24 | |
Total operations | | (0.09 | ) | 0.48 | | 0.82 | | 1.50 | | 3.72 | |
Distributions | | | | | | | | | | | |
From net investment income | | (0.58 | ) | (0.28 | ) | (0.40 | ) | (0.48 | ) | (0.49 | ) |
From net realized gains | | (0.07 | ) | (1.32 | ) | (1.49 | ) | (0.52 | ) | (0.49 | ) |
Total distributions | | (0.65 | ) | (1.60 | ) | (1.89 | ) | (1.00 | ) | (0.98 | ) |
Net Asset Value | | | | | | | | | | | |
End of period(b) | | $ | 14.66 | | $ | 15.40 | | $ | 16.52 | | $ | 17.59 | | $ | 17.09 | |
Total Return(c),(d) | | (0.48 | )% | 2.76 | % | 4.96 | % | 9.21 | % | 26.84 | % |
Net Assets End of Period (000’s) | | $ | 401,656 | | $ | 518,866 | | $ | 577,785 | | $ | 482,823 | | $ | 453,361 | |
Ratio and Supplemental Data | | | | | | | | | | | |
Expenses to average net assets(e) | | 0.82 | % | 0.81 | % | 0.83 | % | 0.82 | % | 0.81 | % |
Net investment income (loss), to average net assets(e) | | 2.72 | % | 2.94 | % | 1.76 | % | 1.74 | % | 3.14 | % |
Portfolio turnover rate(d) | | 56 | % | 91 | % | 55 | % | 93 | % | 128 | % |
For a share outstanding throughout each period (a)
| | Service Class | |
| | Year Ended December 31 | | May 1 to Dec | |
| | 2007 | | 2006 | | 2005 | | 2004 | | 31, 2003 | |
| | | | | | | | | | | |
Net Asset Value | | | | | | | | | | | �� |
Beginning of period | | $ | 15.94 | | $ | 17.05 | | $ | 18.12 | | $ | 17.57 | | $ | 15.04 | |
Investment Operations | | | | | | | | | | | |
Net investment income (loss) | | 0.38 | | 0.45 | | 0.27 | | 0.24 | | 0.17 | |
Net realized and unrealized gain (loss) | | (0.52 | ) | 0.01 | | 0.54 | | 1.27 | | 2.88 | |
Total operations | | (0.14 | ) | 0.46 | | 0.81 | | 1.51 | | 3.05 | |
Distributions | | | | | | | | | | | |
From net investment income | | (0.53 | ) | (0.25 | ) | (0.39 | ) | (0.44 | ) | (0.03 | ) |
From net realized gains | | (0.07 | ) | (1.32 | ) | (1.49 | ) | (0.52 | ) | (0.49 | ) |
Total distributions | | (0.60 | ) | (1.57 | ) | (1.88 | ) | (0.96 | ) | (0.52 | ) |
Net Asset Value | | | | | | | | | | | |
End of period(b) | | $ | 15.20 | | $ | 15.94 | | $ | 17.05 | | $ | 18.12 | | $ | 17.57 | |
Total Return(c),(d) | | (0.70 | )% | 2.47 | % | 4.72 | % | 8.97 | % | 20.79 | % |
Net Assets End of Period(000’s) | | $ | 25,139 | | $ | 32,406 | | $ | 32,851 | | $ | 16,709 | | $ | 2,807 | |
Ratio and Supplemental Data | | | | | | | | | | | |
Expenses to average net assets(e) | | 1.07 | % | 1.06 | % | 1.08 | % | 1.07 | % | 1.08 | % |
Net investment income(loss), to average net assets(e) | | 2.48 | % | 2.67 | % | 1.54 | % | 1.37 | % | 1.55 | % |
Portfolio turnover rate(d) | | 56 | % | 91 | % | 55 | % | 93 | % | 128 | % |
(a) | Per share information is calculated based on average number of shares outstanding. |
(b) | Federated Market Opportunity (the “Fund”) share class commenced operations as follows: |
| Initial Class - March 1, 1994 |
| Service Class - May 1, 2003 |
(c) | Total Return reflects all portfolio expenses and includes reinvestment of dividends and capital gains; it does not reflect the charges and deductions under the policies or annuity contracts. |
(d) | Not annualized. |
(e) | Annualized. |
(f) | Rounds to less than $0.01. |
The notes to the financial statements are an integral part of this report.
8
Federated Market Opportunity
NOTES TO FINANCIAL STATEMENTS
At December 31, 2007
(all amounts in thousands)
NOTE 1. ORGANIZATION AND SIGNIFICANT ACCOUNTING POLICIES
AEGON/Transamerica Series Trust (“ATST”) is an open-end management investment company registered under the Investment Company Act of 1940, as amended (the “1940 Act”). ATST serves as a funding vehicle for variable life insurance, variable annuity and group annuity products. Effective May 1, 2007, Federated Growth & Income was renamed Federated Market Opportunity (“the Fund”). The Fund is part of ATST.
In the normal course of business, the Fund enters into contracts that contain a variety of representations that provide general indemnifications. The Fund’s maximum exposure under these arrangements is unknown, as this would involve future claims that may be made against the Fund and/or its affiliates that have not yet occurred. However, based on experience, the Fund expects the risk of loss to be remote.
This report should be read in conjunction with the current Fund prospectus, which contains more complete information about the Fund.
In preparing the Fund’s financial statements in accordance with accounting principles generally accepted in the United States of America (“GAAP”), estimates or assumptions (which could differ from actual results) may be used that affect reported amounts and disclosures. The following is a summary of significant accounting policies followed by the Fund.
Multiple class operations, income and expenses: The Fund currently offers two classes of shares, an Initial Class and a Service Class. Income, non-class specific expenses and realized and unrealized gains and losses, are allocated daily to each class, based upon the value of shares outstanding method as permitted under Rule 18f-3 of the 1940 Act. Each class bears its own specific expenses as well as a portion of general, common expenses.
Security valuations: The Fund values its investments at the close of the New York Stock Exchange (“NYSE”), normally 4 p.m. ET, each day the NYSE is open for business. Fund investments are valued at the last sale price or closing price on the day of valuation taken from the primary exchange where the security is principally traded.
Securities traded in the over-the-counter market and listed securities for which no sale was reported on that date are valued at the last quoted bid price.
Debt securities are valued based on a price quotation or other equivalent indication of value supplied by an exchange, a pricing service or a major market maker; however, those that mature in sixty days or less are valued at amortized cost, which approximates market.
Investment company securities are valued at the net asset value of the underlying portfolio.
Foreign securities generally are valued based on quotations from the primary market in which they are traded. Because many foreign securities markets and exchanges close prior to the close of the NYSE, closing prices for foreign securities in those markets or on those exchanges do not reflect the events that occur after that close. If a significant market event impacting the value of a portfolio security (e.g., natural disaster, company announcement, market volatility) occurs subsequent to the close of trading in the security, but prior to the calculation of the Fund’s net asset value per share, market quotations for that security may be determined to be unreliable and, accordingly, not “readily available.” As a result, foreign equity securities held by the Fund may be valued at fair market value as determined in good faith by the Fund’s Administrative Valuation Committee, using guidelines adopted by the Board of Trustees.
Other securities for which quotations are not readily available are valued at fair market value as determined in good faith by the Fund’s Administrative Valuation Committee, using guidelines adopted by the Board of Trustees.
Cash: The Fund may leave cash overnight in its cash account with the custodian, State Street Bank & Trust Company (“State Street”). On July 2, 2007, State Street acquired the parent company of Investors Bank & Trust Company. State Street has been contracted on behalf of the Fund to invest the excess cash into a savings account, which at December 31, 2007 was paying an interest rate of 2.60%.
Repurchase agreements: The Fund is authorized to enter into repurchase agreements. The Fund, through its custodian, State Street, receives delivery of the underlying securities, the value of which at the time of purchase is required to be an amount equal to at least 100% of the resale price. The Fund will bear the risk of value fluctuations until the security can be sold and may encounter delays and incur costs in liquidating the security. In the event of bankruptcy or insolvency of the seller, delays and costs may be incurred.
Commission recapture: The sub-adviser, to the extent consistent with the best execution and usual commission rate policies and practices, may place security transactions of the Fund with broker/dealers with which ATST has established a Commission Recapture Program. A Commission Recapture Program is any arrangement under which a broker/dealer applies a portion of the commissions received by such broker/dealer on the security transactions to the Fund. In no event will commissions paid by the Fund be used to pay expenses that would otherwise be borne by any other funds within ATST, or by any other party.
Recaptured commissions during the year ended December 31, 2007 of $53 are included in net realized gains in the Statement of Operations.
9
NOTES TO FINANCIAL STATEMENTS (continued)
At December 31, 2007
(all amounts in thousands)
NOTE 1. – (continued)
Securities lending: The Fund may lend securities to qualified borrowers, with State Street acting as the Fund’s lending agent. The Fund earns negotiated lenders’ fees. The Fund receives cash and/or securities as collateral against the loaned securities. Cash collateral received is invested in short term, interest bearing securities. The Fund monitors the market value of securities loaned on a daily basis and requires collateral in an amount at least equal to the value of the securities loaned. Income from loaned securities earned by State Street for its services, shown in the Statement of Operations is net of fees, in the amount of $101.
The Fund has invested the cash collateral received from securities loaned in the following short-term, interest-bearing securities:
Abbey National PLC, Eurodollar Term, 5.00%, 1/7/2008 | | $ | 801 | |
ABN AMRO Bank NV, Eurodollar Term, 5.18%, 1/4/2008 | | 641 | |
Bank of Nova Scotia, Eurodollar Term, 4.96%, 1/22/2008 | | 561 | |
Barclays, Eurodollar Term, 5.00%, 2/12/2008 | | 1,122 | |
BNP Paribas, Eurodollar Term, 5.01%, 1/11/2008 | | 1,042 | |
Calyon, Eurodollar Term, 5.12%, 3/3/2008 | | 240 | |
Credit Suisse First Boston Corp., Repurchase Agreement, 4.60%, 1/2/2008 | | 2,083 | |
Dexia Group, Eurodollar Term, 4.82%, 1/3/2008 | | 801 | |
HBOS Halifax Bank of Scotland, Eurodollar Term, 5.15%, 1/2/2008 | | 401 | |
JPMorgan Chase & Co., Eurodollar Term, 5.15%, 2/12/2008 | | 401 | |
Lloyds TSB Bank, Eurodollar Term, 5.15%, 1/24/2008 | | 801 | |
Merrill Lynch & Co. (RPG), Repurchase Agreement, 4.60%, 1/2/2008 | | 1,202 | |
Morgan Stanley & Co. (Corp. Repo), Repurchase Agreement, 4.60%, 1/2/2008 | | 3,285 | |
Rabobank Nederland, Eurodollar Term, 5.08%, 1/10/2008 | | 962 | |
Reserve Primary Money Market Fund, 4.95% | | 855 | |
Royal Bank of Scotland, Eurodollar Term, 5.00%, 2/25/2008 | | 962 | |
Societe Generale, Eurodollar Term, 5.15%, 3/3/2008 | | 481 | |
Toronto Dominion Bank, Eurodollar Term, 5.05%, 1/10/2008 | | 962 | |
UBS AG, Eurodollar Term, 4.92%, 1/11/2008 | | 561 | |
Wells Fargo, Bank Note, 4.75%, 1/8/2008 | | 401 | |
| | | |
| | $ | 18,565 | |
Security transactions and investment income: Security transactions are recorded on the trade date. Security gains and losses are calculated on the first-in, first-out basis. Dividend income, if any, is recorded on the ex-dividend date or, in the case of foreign securities, as soon as the Fund is informed of the ex-dividend date. Interest income, including accretion of discounts and amortization of premiums, is recorded on the accrual basis commencing on the settlement date.
Foreign currency denominated investments: The accounting records of the Fund are maintained in U.S. dollars. Securities and other assets and liabilities denominated in foreign currencies are translated into U.S. dollars at the closing exchange rate each day. The cost of foreign securities is translated at the exchange rate in effect when the investment was acquired. The Fund combines fluctuations from currency exchange rates and fluctuations in value when computing net realized and unrealized gains or losses from investments.
Net foreign currency gains and losses resulting from changes in exchange rates include: 1) foreign currency fluctuations between trade date and settlement date of investment security transactions; 2) gains and losses on forward foreign currency contracts; and 3) the difference between the receivable amounts of interest and dividends recorded in the accounting records in U.S. dollars and the amounts actually received.
Foreign currency denominated assets may involve risks not typically associated with domestic transactions. These risks include revaluation of currencies, adverse fluctuations in foreign currency values and possible adverse political, social and economic developments, including those particular to a specific industry, country or region.
Option contracts: The Fund may enter into options contracts to manage exposure to market fluctuations. Options are valued at the average of the bid and ask (“Mean Quote”) established each day at the close of the board of trade or exchange on which they are traded. The primary risks associated with options are imperfect correlation between the change in value of the securities held and the prices of the options contracts; the possibility of an illiquid market; and inability of the counterparty to meet the contracts terms. When the Fund writes a covered call or put option, an amount equal to the premium received by the Fund is included in the Fund’s Statement of Assets and Liabilities as an asset and as an equivalent liability. Options are marked-to-market daily to reflect the current value of the option written.
The underlying face amounts of open contracts at December 31, 2007 are listed in the Schedule of Investments.
Dividend distributions: Dividends and capital gains distributions are typically declared and reinvested annually and are generally paid and reinvested on the business day following the ex-date.
NOTE 2. RELATED PARTY TRANSACTIONS
ATST serves as a funding vehicle for certain affiliated asset allocation portfolios and certain affiliated separate accounts of Western Reserve Life Assurance Co. of Ohio, Transamerica Life Insurance Company, Transamerica Financial Life Insurance Company, Inc., Monumental Life Insurance Company and Transamerica Occidental Life Insurance Company.
Transamerica Fund Advisors, Inc. (“TFAI”) is the Fund’s investment adviser. Transamerica Fund Services, Inc. (“TFS”) is the Fund’s administrator and transfer agent. Prior to May 1, 2007, AFSG Securities Corp. (“AFSG”), was the Fund’s distributor. Transamerica Capital Inc. (“TCI”) is now the Fund’s distributor. TFAI, TFS, AFSG, and TCI are affiliates of AEGON NV, a Netherlands corporation.
Certain officers and trustees of the Fund are also officers and/or directors of TFAI, TFS and TCI.
10
NOTES TO FINANCIAL STATEMENTS (continued)
At December 31, 2007
(all amounts in thousands)
NOTE 2. – (continued)
The following schedule reflects the percentage of Fund assets owned by affiliated investment companies at December 31, 2007:
| | Net | | % of Net | |
| | Assets | | Assets | |
| | | | | | |
Asset Allocation-Conservative Portfolio | | $ | 34,988 | | 8.20 | % |
Asset Allocation-Moderate Growth Portfolio | | 12,615 | | 2.96 | |
Asset Allocation-Moderate Portfolio | | 75,606 | | 17.71 | |
Int’l Moderate Growth Fund | | 13,093 | | 3.07 | |
| | | | | | |
Total | | $ | 136,302 | | 31.94 | % |
Investment advisory fee: The Fund pays management fees to TFAI based on average daily net assets (“ANA”) at the following breakpoints:
0.75% of the first $500 million of ANA
0.70% of ANA over $500 million
TFAI has contractually agreed to waive its advisory fee and will reimburse the Fund to the extent that operating expenses, excluding 12b-1 fees, exceed the following stated annual limit:
1.00% Expense Limit
If total Fund expenses fall below the annual expense limitation agreement agreed to by the adviser within the succeeding three years, the Fund may be required to pay the adviser a portion or all of the waived advisory fees.
There were no amounts recaptured during the year ended December 31, 2007. There are no amounts available for recapture at December 31, 2007.
Distribution and service fees: ATST entered into a Distribution Agreement with AFSG dated January 1, 1997, as amended. On May 1, 2007, the Distribution Agreement was amended to replace AFSG with TCI as the Fund’s distributor. The Fund has also adopted a distribution plan (“Distribution Plan”) pursuant to Rule 12b-1 under the 1940 Act.
Under the Distribution Plan for the Initial Class shares, TCI, on behalf of the Fund, is authorized to pay various service providers, as direct payment for expenses incurred in connection with distribution of the Fund’s shares, amounts equal to actual expenses associated with distributing the shares.
The Distribution Plan for the Service Class shares requires ATST to pay distribution fees to TCI as compensation for its activities, not as reimbursement for specific expenses. The fee on the Service Class is paid to the insurance companies for providing services and account maintenance for their policyholders who invest in the variable insurance products which invest in the Service Class shares.
The Fund is authorized under the Distribution Plan to pay fees on each class up to the following limits:
Initial Class | | 0.15 | % |
Service Class | | 0.25 | % |
TCI has determined that it will not seek payment by the Fund of the distribution expenses incurred with respect to the Initial Class shares before April 30, 2009. Prior to TCI seeking reimbursement of future expenses, policy and contract owners will be notified in advance. The Fund will pay fees relating to Service Class shares.
Administrative services: The Fund has entered into an agreement with TFS for financial and legal fund administration services. The Fund pays TFS an annual fee of 0.02% of ANA. The Legal fees on the Statement of Operations are for fees paid to external legal counsel.
Deferred compensation plan: Each eligible independent Fund Trustee may elect participation in a non-qualified deferred compensation plan (“the Plan”). Under the Plan, such Trustees may defer payment of all or a portion of their total fees earned as a Fund Trustee. Each Trustee who is a participant in the Plan may elect that the earnings, losses or gains credited to his or her deferred fee amounts be determined based on a deemed investment in any series of Transamerica DEX Mutual Funds. The right of a participant to receive a distribution from the Plan of the deferred fees is an unsecured claim against the general assets of all series of Transamerica IDEX Mutual Funds. The pro rata liability to the Fund of all deferred fees in the Plan amounted, as of December 31, 2007, to $20. Amounts deferred under the Deferred Compensation Plan are unfunded against the general assets of ATST.
Retirement plan: Under a retirement plan (the “Emeritus Plan”) available to the Independent Trustees, each Independent Trustee is deemed to have elected to serve as Trustee Emeritus of ATST upon his or her termination of service, other than removal for cause, is entitled to 50% of the trustee’s current retainer for a maximum period of five years determined by his or her years of service as a Trustee.
Such amounts shall be accrued by ATST on a pro rata basis allocable to each series of ATST fund based on the relative assets of the series. If retainers increase in the future, past accruals (and credits) will be adjusted upward so that 50% of the Trustee’s current retainer is accrued and credited at all times. Upon death, disability or termination of service, other than removal for cause, amounts deferred become payable to a Trustee Emeritus (or his/her beneficiary). Upon the commencement of service as Trustee Emeritus, compensation will be paid on a quarterly basis during the time period that the Trustee Emeritus is allowed to serve as such.
11
NOTES TO FINANCIAL STATEMENTS (continued)
At December 31, 2007
(all amounts in thousands)
NOTE 2. – (continued)
Amounts accrued under the Emeritus Plan are unsecured claims against the general assets of ATST. For the year ended December 31, 2007, the amount related to the Emeritus Plan was $24. As of December 31, 2007, the Fund has not made any payments related to the Emeritus Plan.
The Emeritus Plan was terminated effective October 30, 2007. Upon the termination, the Fund shall continue to pay any remaining benefits in accordance with the Plan, but no further compensation shall accrue under the Plan.
NOTE 3. INVESTMENT TRANSACTIONS
The cost of securities purchased and proceeds from securities sold (excluding short-term securities) for the year ended December 31, 2007 were as follows:
Purchases of securities: | | | |
Long-term | | $ | 155,698 | |
U.S. Government | | — | |
Proceeds from maturities and sales of securities: | | | |
Long-term | | 328,066 | |
U.S. Government | | 99,052 | |
| | | | |
NOTE 4. FEDERAL INCOME TAX MATTERS
The Fund has not made any provision for federal income or excise taxes due to its policy to distribute all of its taxable income and capital gains to its shareholders and otherwise qualify as a regulated investment company under Subchapter M of the Internal Revenue Code. Income and capital gain distributions are determined in accordance with income tax regulations, which may differ from GAAP. These differences are primarily due to differing treatment for items including, but not limited to, foreign currency transactions, post October loss deferrals, options, REIT’s and wash sales.
Therefore, distributions determined in accordance with tax regulations may differ significantly in amount or character from net investment income and realized gains for financial reporting purposes. Financial reporting records are adjusted for permanent book/tax differences to reflect tax character. Financial records are not adjusted for temporary differences. These reclassifications are as follows:
Additional paid-in capital | | $ | — | |
Undistributed (accumulated) net investment income (loss) | | $ | 2,870 | |
Undistributed (accumulated) net realized gain (loss) from investment securities | | $ | (2,870 | ) |
The capital loss carryforwards are available to offset future realized capital gains through the periods listed:
Capital Loss | | | |
Carryforwards | | Available Through | |
| | | |
$ | 7,220 | | December 31, 2015 | |
| | | | |
The tax character of distributions paid may differ from the character of distributions shown in the Statements of Changes in Net Assets due to short-term gains being treated as ordinary income for tax purposes. The tax character of distributions paid during 2006 and 2007 was as follows:
2006 Distributions paid from: | | | |
Ordinary Income | | $ | 15,697 | |
Long-term Capital Gain | | 38,948 | |
| | | |
2007 Distributions paid from: | | | |
Ordinary Income | | 17,137 | |
Long-term Capital Gain | | 2,212 | |
| | | | |
The tax basis components of distributable earnings as of December 31, 2007 are as follows:
Undistributed Ordinary Income | | $ | 18,213 | |
Undistributed Long-term Capital Gain | | $ | — | |
Capital Loss Carryforward | | $ | (7,220 | ) |
Net Unrealized Appreciation (Depreciation) | | $ | (4,243 | )* |
* The amount includes unrealized appreciation (depreciation) from foreign currency
NOTE 5. REGULATORY PROCEEDINGS
There continues to be significant federal and state regulatory activity relating to financial services companies, particularly mutual fund companies and their investment advisers. As part of an ongoing investigation regarding potential market timing, recordkeeping and trading compliance issues and matters affecting the Fund’s investment adviser, TFAI, and certain affiliates and former employees of TFAI, the SEC staff has indicated that it is likely to take some action against TFAI and certain of its affiliates at the conclusion of the investigation. The potential timing and the scope of any such action is difficult to predict. Although the impact of any action brought against TFAI and/or its affiliates is difficult to assess at the present time, the Fund currently believes that the likelihood that any such action will have a material adverse impact is remote. It is important to note that the Fund is not aware of any allegation of wrongdoing against it and its Board at the time this annual report is printed. Although it is not anticipated that these developments will have an adverse impact on the Fund, there can be no assurance at this time. TFAI and its affiliates are actively working with the SEC in regard to this matter; however, the exact resolution cannot be determined at this time. TFAI will take such actions that it deems necessary or appropriate to continue providing management services to the Fund and to bring all matters to an appropriate conclusion.
TFAI and/or its affiliates, and not the Fund, will bear the costs regarding these regulatory matters.
12
NOTES TO FINANCIAL STATEMENTS (continued)
At December 31, 2007
(all amounts in thousands)
NOTE 6. RECENTLY ISSUED ACCOUNTING PRONOUNCEMENTS
In July 2006, the Financial Accounting Standards Board (“FASB”) released FASB Interpretation No. 48 “Accounting for Uncertainty in Income Taxes” (“FIN 48”), an interpretation of FASB Statement No. 109. FIN 48 provides guidance for how uncertain tax positions should be recognized, measured, presented and disclosed in the financial statements. FIN 48 requires the accounting and disclosure of tax positions taken or expected to be taken in the course of preparing the Fund’s tax returns to determine whether the tax positions are “more-likely- than-not” of being sustained by the applicable tax authority. Tax positions not deemed to meet the more-likely-than-not threshold would be recorded as a tax benefit or expense in the current year.
Adoption of FIN 48 is effective during the first required financial reporting period for fiscal years beginning after December 15, 2006. Management adopted FIN 48 on June 29, 2007.
Implementation of FIN 48 requires Management of the Fund to analyze all open tax years, as defined by the Statute of Limitations, for all major jurisdictions, which includes federal and certain states. Open tax years are those that are open for exam by taxing authorities (i.e., the last 4 tax year ends and the interim tax period since then). The Fund has no examinations in progress and none are expected at this time.
Management of the Fund has reviewed all open tax years and major jurisdictions and concluded the adoption of FIN 48 resulted in no impact to the Fund’s net assets or results of operations. There is no tax liability resulting from unrecognized tax benefits relating to uncertain income tax positions taken or expected to be taken in future tax returns. The Fund is also not aware of any tax positions for which it is reasonably possible that the total amounts of unrecognized tax benefits will significantly change in the next 12 months.
In September 2006, FASB issued its new Standard No. 157, “Fair Value Measurements” (“FAS 157”). FAS 157 is designed to unify guidance for the measurement of fair value of all types of assets, including financial instruments, and certain liabilities, throughout a number of accounting standards. FAS 157 also establishes a hierarchy for measuring fair value in generally accepted accounting principles and expands financial statement disclosures about fair value measurements that are relevant to mutual funds. FAS 157 is effective for financial statements issued for fiscal years beginning after November 15, 2007, and earlier application is permitted.
As of December 31, 2007, Management does not expect the adoption of FAS 157 to impact the amounts reported in the financial statements, however, additional disclosures will be required about the inputs used to develop the measurements of fair value and the effect of certain of the measurements reported in the statement of operations for a fiscal period.
NOTE 7. SUBSEQUENT EVENT
Effective January 1, 2008, TFAI changed its name to Transamerica Asset Management, Inc.
Effective May 1, 2008, AEGON/Transamerica Series Trust will change its name to Transamerica Series Trust. At that time, the Fund will also change its name to Transamerica Federated Market Opportunity VP.
13
Report of Independent Registered Certified Public Accounting Firm
To the Board of Trustees and Shareholders of
Federated Market Opportunity:
In our opinion, the accompanying statement of assets and liabilities, including the schedule of investments, and the related statements of operations and of changes in net assets and the financial highlights present fairly, in all material respects, the financial position of Federated Market Opportunity (the “Fund”) (one of the portfolios constituting AEGON/Transamerica Series Trust) at December 31, 2007, the results of its operations for the year then ended, the changes in its net assets for each of the two years in the period then ended and the financial highlights for each of the periods presented, in conformity with accounting principles generally accepted in the United States of America. These financial statements and financial highlights (hereafter referred to as “financial statements”) are the responsibility of the Fund’s management; our responsibility is to express an opinion on these financial statements based on our audits. We conducted our audits of these financial statements in accordance with the standards of the Public Company Accounting Oversight Board (United States). Those standards require that we plan and perform the audit to obtain reasonable assurance about whether the financial statements are free of material misstatement. An audit includes examining, on a test basis, evidence supporting the amounts and disclosures in the financial statements, assessing the accounting principles used and significant estimates made by management, and evaluating the overall financial statement presentation. We believe that our audits, which included confirmation of securities at December 31, 2007 by correspondence with the custodian and brokers, provide a reasonable basis for our opinion.

Tampa, Florida
February 29, 2008
14
Federated Market Opportunity
SUPPLEMENTAL TAX INFORMATION (unaudited)
(all amounts in thousands)
For tax purposes, the Fund has made a Long-Term Capital Gain Designation of $2,212 for the year ended December 31, 2007.
RESULTS OF SHAREHOLDER PROXY (unaudited)
At a special meeting of shareholders held on October 30, 2007, the results of the Proposals were as follows:
Proposal 1: To elect a new Board:
Proposed | | | | | | Abstentions/Broker Non- | |
Trustee | | For | | Against | | Votes | |
John K. Carter | | 2,274,998,840.817 | | 57,804,698.755 | | 35,433.883 | |
| | | | | | | |
Leo J. Hill | | 2,277,212,702.754 | | 55,590,836.819 | | 35,433.883 | |
| | | | | | | |
Neal M. Jewell | | 2,266,793,295.663 | | 66,010,243.909 | | 35,433.883 | |
| | | | | | | |
Russell A. Kimball, Jr. | | 2,274,825,235.835 | | 57,978,303.737 | | 35,433.883 | |
| | | | | | | |
Eugene M. Mannella | | 2,274,623,165.033 | | 58,180,374.539 | | 35,433.883 | |
| | | | | | | |
Norm R. Nielsen | | 2,275,050,055.885 | | 57,753,483.687 | | 35,433.883 | |
| | | | | | | |
Joyce Galpern Norden | | 2,270,278,122.250 | | 62,525,417.323 | | 35,433.883 | |
| | | | | | | |
Patricia L. Sawyer | | 2,275,737,737.456 | | 57,065,802.116 | | 35,433.883 | |
| | | | | | | |
John W. Waechter | | 2,276,615,120.140 | | 56,188,419.433 | | 35,433.883 | |
Proposal 2: To approve an amendment to the Agreement and Declaration of Trust:
| | | | Abstentions/Broker Non- | |
For | | Against | | Votes | |
2,182,022,669.110 | | 77,590,048.544 | | 73,226,255.801 | |
15
Federated Market Opportunity
INVESTMENT ADVISORY AND SUB-ADVISORY AGREEMENTS – REVIEW AND RENEWAL (unaudited)
At a meeting of the Board of Trustees of AEGON/Transamerica Series Trust (“ATST”) held on December 4th, 2007, the Board reviewed and considered the renewal of the investment advisory agreement (the “Investment Advisory Agreement”) between Federated Market Opportunity (the “Fund”) and Transamerica Fund Advisors, Inc. (“TFAI”), as well as the renewal of the investment sub-advisory agreement (the “Sub-Advisory Agreement”) of the Fund between TFAI and Federated Equity Management Company of Pennsylvania (the “Sub-Adviser”), to determine whether the agreements should be renewed for a six-month period. It was noted that this review was interim in nature to align all the Funds on the same calendar, and that the Funds’ advisory arrangements would be reviewed again in the first half of 2008.
Following their review and consideration, the Trustees determined that the renewal of the Investment Advisory Agreement and the Sub-Advisory Agreement would enable shareholders of the Fund to obtain high quality services at a cost that is appropriate, fair, and in the best interests of its shareholders. The Board, including the independent members of the Board, unanimously approved the renewal of the Investment Advisory Agreement and Sub-Advisory Agreement. In reaching their decision, the Trustees requested and obtained from TFAI and the Sub-Adviser such information as they deemed reasonably necessary to evaluate the agreements, including information about fees and performance of comparable funds managed by the Sub-Adviser. The Trustees also carefully considered information they had previously received from TFAI and the Sub-Adviser throughout the year as part of their regular oversight of the Fund, as well as comparative fee, expense, and performance information prepared by Lipper Inc. (“Lipper”), an independent provider of mutual fund performance, fee and expense information and profitability data prepared by management. In considering the proposed continuation of the Investment Advisory and Sub-Advisory Agreements, the Trustees evaluated a number of considerations that they believed, in light of the legal advice furnished to them by independent legal counsel and their own business judgment, to be relevant. They based their decisions on a variety of factors, including the following considerations, among others, although they did not identify any consideration or particular information that was controlling of their decisions:
The nature, extent and quality of the advisory services to be provided. The Board considered the nature and quality of the services provided by TFAI and the Sub-Adviser to the Fund in the past, as well as the services anticipated to be provided in the future. The Board concluded that TFAI and the Sub-Adviser are capable of providing high quality services to the Fund, as indicated by the nature and quality of services provided in the past by TFAI and the Sub-Adviser for this series and the experience, capability and integrity of TFAI’s senior management, the financial resources of TFAI and the Sub-Adviser, TFAI’s management oversight process and the professional qualifications of the portfolio management team of the Sub-Adviser. The Trustees determined that TFAI and the Sub-Adviser can provide investment and related services that are appropriate in scope and extent in light of the Fund’s operations, the competitive landscape of the investment company business and investor needs.
The investment performance of the Fund. The Board examined the short and longer-term performance of the Fund, including relative performance against a peer universe of comparable mutual funds as prepared by Lipper for various trailing periods ended June 30, 2007. The Board did note the below median performance of the Fund over the short and longer-term periods, but that 10-year performance was strong. On the basis of the Board’s assessment of the nature, extent and quality of advisory services to be provided or procured by TFAI and the Sub-Adviser, the Board concluded that TFAI and the Sub-Adviser are capable of providing a level of investment performance that is appropriate in light of the Fund’s proposed investment objectives, policies and strategies and competitive with other similarly situated investment companies, but the Board noted that they would be monitoring performance closely.
The cost of advisory services provided and the level of profitability. The Board reviewed profitability information of TFAI’s cost of procuring fund management services, as well as the costs of provision of administration, fund accounting and other services, to the Fund and to ATST as a whole by TFAI and its affiliates. The Board reviewed the management and sub-advisory fees for the Fund. The Board did note the lower expenses for the Fund relative to one of two peer groups. The Board also noted that fees were renegotiated for 2008. Based on their review, the Trustees determined that the management fees of the Fund generally are appropriate in light of the services expected to be provided or procured, the management fees and the anticipated profitability of the relationship between the Fund, TFAI and its affiliates, and the Sub-Adviser. In making these observations and determinations, the Board reviewed, among other things, comparative information provided by Lipper.
Whether fee levels reflect economies of scale and the extent to which economies of scale would be realized as the Fund grows. In evaluating the extent to which the management fees payable under the Investment Advisory and Sub-Advisory Agreements reflect economies of scale or will permit economies of scale to be realized in the future, the Board noted that TFAI and the Sub-Adviser offer breakpoints which appropriately benefit investors by passing on economies of scale in the form of lower management fees as the level of assets grows. The Board also noted additional breakpoints are proposed for 2008. The Trustees also concluded that they will have the opportunity to periodically reexamine whether the Fund has achieved economies of scale, and the appropriateness of management fees payable to TFAI and fees paid to the Sub-Adviser, in the future.
Benefits (such as soft dollars) to TFAI, its affiliates, or the Sub-Adviser from their relationship with the Fund. The Board concluded that other benefits anticipated to be derived by TFAI, its affiliates, and the Sub-Adviser from their relationships with the Fund are expected to be reasonable and fair, and consistent with industry practice and the best interests of the Fund and its shareholders. The Trustees noted that TFAI would not realize soft dollar benefits from its relationship with the Fund, and that the Sub-Adviser’s soft dollar trading is consistent with applicable law, including best execution requirements in particular. The Board also noted that the Sub-Adviser is participating in a brokerage program pursuant to which a portion of brokerage commissions paid by the Fund is recaptured for the benefit of the Fund and its shareholders, thus limiting the amount of soft dollar arrangements the Sub-Adviser may engage in with respect to the Fund’s brokerage transactions.
16
Other considerations. The Board determined that TFAI has made a substantial commitment to the recruitment and retention of high quality personnel, and maintains the financial, compliance and operational resources reasonably necessary to manage the Fund in a professional manner that is consistent with the best interests of the Fund and its shareholders. In this regard, the Trustees favorably considered the procedures and policies in place by TFAI to enforce compliance with applicable laws and regulations and oversee the portfolio management activities of the Sub-Adviser. The Trustees also determined that TFAI has made a significant entrepreneurial commitment to the management and success of the Fund, reflected by TFAI’s expense limitation and fee waiver arrangements with the Fund which may result in TFAI waiving a substantial amount of management fees for the benefit of shareholders.
17
International Moderate Growth Fund
MARKET ENVIRONMENT
The stock and bond markets rose for the twelve-month period through December 31, 2007, but suffered plenty of volatility along the way. The Standard and Poor’s 500 Composite Stock Index returned 5.49%, while the broad Dow Jones Wilshire 5000 Total Market Index gained 5.74%. These modest gains were punctuated by setbacks, however. In the summer, gathering concern about the U.S. mortgage and housing markets reached alarming levels. The mortgage industry’s loose lending standards of recent years came back to haunt lenders, investors, and borrowers alike. Lenders responded by tightening credit standards; many borrowers could no longer qualify for loans; and home sales and refinancings slowed. These problems worsened in the year’s last two months as financial institutions announced write-downs of mortgage-related holdings. After tumbling in the summer, stocks of financial companies again pulled the broad indices down in November and December.
By midyear investors were favoring the relative safety of larger stocks. As they migrated toward large caps while also steering away from financials and other value stocks, they boosted large-cap growth stocks in sectors such as technology. For the year, large caps outpaced small caps, and growth stocks significantly outperformed value stocks across all market-cap ranges.
Foreign equity returns surpassed the U.S. indices. The Morgan Stanley Capital International EAFE Index rose 11.63% (gross) for the period, mainly because major foreign currencies strengthened against the dollar (the index gained only 3.54% (net) in local-currency terms). Emerging markets were especially strong as high commodity prices bolstered the developing nations that export them. The Morgan Stanley Capital International Emerging Markets Index soared 39.78% (gross) for the year.
Bond returns improved throughout the year as nervous investors sought safety from the shaky stock market. The Federal Reserve Board’s three rate cuts from September through December also helped bond prices. The Lehman Brothers Aggregate Bond Index (“LBAB”) finished the year with a 6.97% return, with U.S. government bonds leading the gains. High-yield bonds weakened as credit conditions worsened, but posted modestly positive returns thanks to strength earlier in the year.
PERFORMANCE
For the year ended December 31, 2007, International Moderate Growth Fund, Initial Class returned 8.69%. By comparison, its primary and secondary benchmarks, the Morgan Stanley Capital International World ex US Index (“MSCI World ex US”) and LBAB, returned 12.92% (gross) and 6.97%, respectively.
STRATEGY REVIEW
This fund-of-funds portfolio is structured to provide broad coverage of international equity markets moderated by exposure to fixed-income securities. Its underlying equity portfolio holdings cover a range of international equity investing styles, including large value, large growth, all cap, small cap, emerging markets, and global real estate. The portfolio typically devotes between 60% and 70% of assets to international developed markets equity, and another 5% combined to emerging markets equity and debt. The remaining 25% to 35% of assets is devoted to U.S. bonds. These underlying U.S. fixed-income holdings are mostly in intermediate investment-grade bonds, with smaller amounts in Treasury Inflation Protected Securities (“TIPS”) and short-term investment-grade bonds.
The portfolio’s performance was hindered primarily by two underlying funds with large allocations. TA IDEX AllianceBernstein International Value, which took up 21% of assets at the end of 2007, was weighed down by struggling financials stocks and posted a return that was well behind the MSCI World ex-US. TA IDEX Neuberger Berman International, which accounted for another 15% of assets at the end of the year, was hurt also by financials and several significant holdings in the consumer discretionary sector. TA IDEX Clarion Global Real Estate underperformed as real-estate markets tumbled after four straight years of strong performance.
TA IDEX Oppenheimer Developing Markets was the portfolio’s best performer, but it was a small position overall. The portfolio’s primary large-cap growth holding, TA IDEX Marsico International Growth, gained significantly on the strength of good stock picks in consumer sectors and a slug of high-flying emerging-markets stocks. Both TA IDEX PIMCO Total Return and TA IDEX PIMCO Real Return TIPS outperformed the LBAB.
Michael Stout, CFA
Jon Hale, Ph.D., CFA
Jeff McConnell, CFA
Maciej Kowara, Ph.D., CFA
Co-Portfolio Managers
Morningstar Associates, LLC
AEGON/Transamerica Series Trust | Annual Report 2007 |
1
International Moderate Growth Fund
(unaudited)
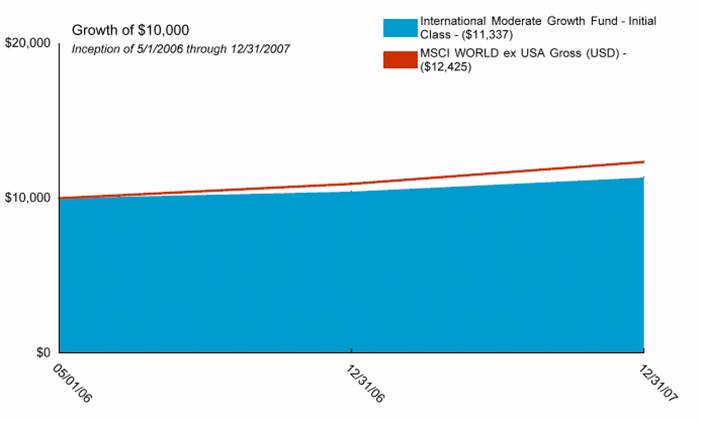
Average Annual Total Return for Periods Ended 12/31/2007
| | 1 Year | | From
Inception | | Inception
Date | |
| | | | | | | |
Initial Class | | 8.69 | % | 7.80 | % | 5/1/06 | |
MSCI WORLD ex USA Gross (USD)(1) | | 12.92 | % | 13.87 | % | 5/1/06 | |
Lehman Brothers Aggregate Bond Index (1) | | 6.97 | % | 7.32 | % | 5/1/06 | |
| | | | | | | |
Service Class | | 8.49 | % | 7.55 | % | 5/1/06 | |
NOTES
(1) The Morgan Stanley Capital International – World ex USA (MSCI – WORLD ex USA Gross) Index and the Lehman Brothers Aggregate Bond (LBAB) Index are unmanaged indices used as a general measure of market performance. Calculations assume dividends and capital gains are reinvested and do not include any managerial expenses. From inception calculation is based on life of Initial Class shares.
The performance data presented represents past performance, future results may vary. The portfolio’s investment return and net asset value will fluctuate. Past performance does not guarantee future results. Investor’s units when redeemed, may be worth more or less than their original cost.
Current performance may be lower or higher than performance quoted. Please visit your insurance company’s website for contract or policy level standardized total returns current to the most recent month end. Portfolio performance is net of investment fees and fund expenses, but not product charges, which, if included, would significantly lower the performance quoted.
This material must be preceded or accompanied by a current prospectus, which includes specific contents regarding the investment objectives, explanation of share classes and policies of this portfolio.
International investing involves special risks including fluctuations, political instability and different financial accounting standards.
2
International Moderate Growth Fund
UNDERSTANDING YOUR FUND’S EXPENSES
(unaudited)
SHAREHOLDER EXPENSES
Fund shareholders may incur ongoing costs, including management and advisory fees, distribution and service fees, and other fund expenses.
The following Example is intended to help you understand your ongoing costs (in dollars and cents) of investing in the Fund and to compare these costs with the ongoing costs of investing in other funds.
The Example is based on an investment of $1,000 invested at July 1, 2007 and held for the entire period until December 31, 2007.
ACTUAL EXPENSES
The first line in the table below provides information about actual account values and actual expenses. You may use the information in this line, together with the amount you invested, to estimate the expenses that you paid over the period. Simply divide your account value by $1,000 (for example, an $8,600 account value divided by $1,000 = 8.6), then multiply the result by the number in the first line of your Fund under the heading entitled “Expenses Paid During Period” to estimate the expenses you paid on your account during this period.
HYPOTHETICAL EXAMPLE FOR COMPARISON PURPOSES
The second line in the table below provides information about hypothetical account values and hypothetical expenses based on the Fund’s actual expense ratio and an assumed rate of return of 5% per year before expenses, which is not the Fund’s actual return. The hypothetical account values and expenses may not be used to estimate the actual ending account balance or expenses you paid for the period. You may use this information to compare the ongoing costs of investing in your Fund and other funds. To do so, compare this 5% hypothetical example with the 5% hypothetical examples that appear in the shareholder reports of the other funds.
Please note that the expenses shown in the table are meant to highlight your ongoing costs only and do not reflect any transactional costs, such as sales charges, redemption fees, brokerage commissions paid on purchases and sales of fund shares. Therefore, the second line under the Fund in the table is useful in comparing ongoing costs only, and will not help you determine the relative total costs of owning different funds. If any of these transaction costs were included, your costs would be higher. The expenses shown in the table do not reflect any fees that may be charged to you by brokers, financial intermediaries or other financial institutions.
The expenses shown in the table do not reflect any expenses from the Funds investment in other affiliated investment companies. The average weighted annualized expense ratio of the underlying investment companies at December 31, 2007, was 0.94%.
| | Beginning
Account
Value | | Ending
Account
Value | | Annualized
Expense
Ratio | | Expenses
Paid During
Period (a) | |
| | | | | | | | | |
Initial Class | | | | | | | | | |
Actual | | $ | 1,000.00 | | $ | 1,020.40 | | 0.17 | % | $ | 0.87 | |
Hypothetical (b) | | 1,000.00 | | 1,024.35 | | 0.17 | | 0.87 | |
| | | | | | | | | |
Service Class | | | | | | | | | |
Actual | | 1,000.00 | | 1,019.33 | | 0.42 | | 2.14 | |
Hypothetical (b) | | 1,000.00 | | 1,023.09 | | 0.42 | | 2.14 | |
| | | | | | | | | | | | |
(a) Expenses are calculated using the Fund’s annualized expense ratio (as disclosed in the table), multiplied by the average account value for the period, multiplied by the number of days in the period (184 days), and divided by the number of days in the year (365 days).
(b) 5% return per year before expenses.
GRAPHICAL PRESENTATION OF SCHEDULE OF INVESTMENTS
By Asset Type
At December 31, 2007
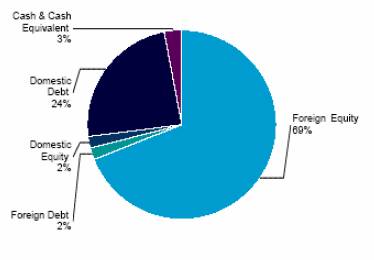
This chart shows the percentage breakdown by asset type of the aggregate portfolio holdings of the underlying affiliated investment companies in which the Fund invests. The security lending collateral in the underlying funds is excluded from this calculation.
3
International Moderate Growth Fund
SCHEDULE OF INVESTMENTS
At December 31, 2007
(all amounts except share amounts in thousands)
| | Shares | | Value | |
INVESTMENT COMPANIES (100.0%) | | | | | |
Bond (21.1%) | | | | | |
PIMCO Total Return (1) | | 3,951,065 | | $ | 46,030 | |
TA IDEX Transamerica Short-Term Bond (2) | | 704,749 | | 6,885 | |
Global/International Stock (64.9%) | | | | | |
TA IDEX AllianceBernstein International Value (2) | | 4,079,143 | | 51,724 | |
TA IDEX Evergreen International Small Cap (2) | | 1,648,827 | | 25,211 | |
TA IDEX Marsico International Growth (2) | | 3,187,107 | | 43,408 | |
TA IDEX Neuberger Berman International (2) | | 3,241,643 | | 36,371 | |
TA IDEX Oppenheimer Developing Markets (2) | | 376,175 | | 5,571 | |
Inflation-Protected Securities (3.8%) | | | | | |
TA IDEX PIMCO Real Return TIPS (2) | | 911,167 | | 9,458 | |
Tactical and Specialty (5.0%) | | | | | |
Clarion Global Real Estate Securities (1) | | 635,892 | | 12,489 | |
U.S. Stock (5.2%) | | | | | |
Federated Market Opportunity (1) | | 892,877 | | 13,090 | |
| | | | | |
Total Investment Companies (cost $259,792) # | | | | $ | 250,237 | |
NOTES TO SCHEDULE OF INVESTMENTS:
(1) The Fund invests its assets in the Initial Class shares of the affiliated AEGON/Transamerica Series Trust.
(2) The Fund invests its assets in the Class I shares of the affiliated Transamerica IDEX Mutual Funds.
# Aggregate cost for federal income tax purposes is $259,875. Aggregate gross unrealized appreciation for all securities in which there is an excess of value over tax cost and aggregate gross unrealized depreciation for all securities in which there is an excess of tax cost over value were $2,448 and $12,086, respectively. Net unrealized depreciation for tax purposes is $9,638.
The notes to the financial statements are an integral part of this report.
4
International Moderate Growth Fund
STATEMENT OF ASSETS AND LIABILITIES
At December 31, 2007
(all amounts except per share amounts in thousands)
Assets: | | | |
Investment in affiliated investment companies at value (cost: $259,792) | | $ | 250,237 | |
Receivables: | | | |
Shares sold | | 1,007 | |
| | 251,244 | |
Liabilities: | | | |
Investment securities purchased | | 706 | |
Accounts payable and accrued liabilities: | | | |
Shares redeemed | | 301 | |
Management and advisory fees | | 41 | |
Distribution and service fees | | 45 | |
Administration fees | | 3 | |
Trustees fees | | 1 | |
Other | | 32 | |
| | 1,129 | |
Net Assets | | $ | 250,115 | |
| | | |
Net Assets Consist of: | | | |
Capital Stock ($.01 par value) | | $ | 226 | |
Additional paid-in capital | | 241,305 | |
Undistributed (accumulated) net investment income in affiliated investment companies | | 7,144 | |
Undistributed (accumulated) net realized gain from investment in affiliated investment companies | | 10,995 | |
Net unrealized (depreciation) on investment in affiliated investment companies | | (9,555 | ) |
Net Assets | | $ | 250,115 | |
Net Assets by Class: | | | |
Initial Class | | $ | 24,495 | |
Service Class | | 225,620 | |
Shares Outstanding: | | | |
Initial Class | | 2,203 | |
Service Class | | 20,370 | |
Net Asset Value and Offering Price Per Share: | | | |
Initial Class | | $ | 11.12 | |
Service Class | | 11.08 | |
STATEMENT OF OPERATIONS
For the year ended December 31, 2007
(all amounts in thousands)
Investment Income: | | | |
Dividends from affiliated investment companies | | $ | 7,707 | |
| | 7,707 | |
| | | |
Expenses: | | | |
Management and advisory fees | | 139 | |
Printing and shareholder reports | | 10 | |
Custody fees | | 34 | |
Administration fees | | 17 | |
Legal fees | | 2 | |
Audit fees | | 20 | |
Trustees fees | | 4 | |
Registration fees | | 7 | |
Distribution and service fees: | | | |
Service Class | | 309 | |
Other | | 1 | |
Total expenses before recapture of waived expenses | | 543 | |
Recaptured expenses | | 21 | |
Net expenses | | 564 | |
| | | |
Net Investment Income | | 7,143 | |
| | | |
Net Realized Gain (Loss) from: | | | |
Investment in affiliated investment companies | | (29 | ) |
Distributions from investment in affiliated investment companies | | 11,033 | |
| | 11,004 | |
| | | |
Net Increase (Decrease) in Unrealized Appreciation (Depreciation) on: | | | |
Investment in affiliated investment companies | | (9,818 | ) |
| | | |
Net Realized and Unrealized Gain on Investment Affiliated Investment Companies: | | 1,186 | |
Net Increase In Net Assets Resulting from Operations | | $ | 8,329 | |
The notes to the financial statements are an integral part of this report.
5
International Moderate Growth Fund
STATEMENT OF CHANGES IN NET ASSETS
For the years ended
(all amounts in thousands)
| | December 31, | | December 31, | |
| | 2007 | | 2006 (a) | |
Increase (Decrease) in Net Assets From: | | | | | |
Operations: | | | | | |
Net investment income | | $ | 7,143 | | $ | 1,845 | |
Net realized gain from investment in affiliated investment companies | | 11,004 | | 1,108 | |
Change in unrealized appreciation (depreciation) on investment in affiliated investment companies | | (9,818 | ) | 263 | |
| | 8,329 | | 3,216 | |
Distributions to Shareholders: | | | | | |
From net investment income: | | | | | |
Initial Class | | (193 | ) | — | |
Service Class | | (1,654 | ) | — | |
| | (1,847 | ) | — | |
From net realized gains: | | | | | |
Initial Class | | (115 | ) | — | |
Service Class | | (1,002 | ) | — | |
| | (1,117 | ) | — | |
Capital Share Transactions: | | | | | |
Proceeds from shares sold: | | | | | |
Initial Class | | 20,171 | | 8,782 | |
Service Class | | 184,239 | | 42,323 | |
| | 204,410 | | 51,105 | |
Dividends and distributions reinvested: | | | | | |
Initial Class | | 308 | | — | |
Service Class | | 2,656 | | — | |
| | 2,964 | | — | |
Cost of shares redeemed: | | | | | |
Initial Class | | (4,269 | ) | (1,734 | ) |
Service Class | | (9,924 | ) | (1,018 | ) |
| | (14,193 | ) | (2,752 | ) |
| | 193,181 | | 48,353 | |
Net increase in net assets | | 198,546 | | 51,569 | |
| | | | | |
Net Assets: | | | | | |
Beginning of year | | 51,569 | | — | |
End of year | | $ | 250,115 | | $ | 51,569 | |
Undistributed (Accumulated) net investment income | | $ | 7,144 | | $ | 1,848 | |
Share Activity: | | | | | |
Shares issued: | | | | | |
Initial Class | | 1,840 | | 901 | |
Service Class | | 16,788 | | 4,338 | |
| | 18,628 | | 5,239 | |
Shares issued-reinvested from distributions: | | | | | |
Initial Class | | 29 | | — | |
Service Class | | 254 | | — | |
| | 283 | | — | |
Shares redeemed: | | | | | |
Initial Class | | (387 | ) | (180 | ) |
Service Class | | (904 | ) | (106 | ) |
| | (1,291 | ) | (286 | ) |
Net increase (decrease) in shares outstanding: | | | | | |
Initial Class | | 1,482 | | 721 | |
Service Class | | 16,138 | | 4,232 | |
| | 17,620 | | 4,953 | |
(a) Commenced operations on May 1, 2006.
The notes to the financial statements are an integral part of this report.
6
International Moderate Growth Fund
FINANCIAL HIGHLIGHTS
For a share outstanding throughout each period(a)
| | Initial Class | | Service Class | |
| | December 31,
2007 | | May 1 to Dec
31, 2006 | | December 31,
2007 | | May 1 to Dec
31, 2006 | |
Net Asset Value | | | | | | | | | |
Beginning of period | | $ | 10.43 | | $ | 10.00 | | $ | 10.41 | | $ | 10.00 | |
Investment Operations | | | | | | | | | |
Net investment income (loss) | | 0.56 | | 0.85 | | 0.57 | | 0.84 | |
Net realized and unrealized gain (loss) | | 0.34 | | (0.42 | ) | 0.31 | | (0.43 | ) |
Total operations | | 0.90 | | 0.43 | | 0.88 | | 0.41 | |
Distributions | | | | | | | | | |
From net investment income | | (0.13 | ) | — | | (0.13 | ) | — | |
From net realized gains | | (0.08 | ) | — | | (0.08 | ) | — | |
Total distributions | | (0.21 | ) | — | | (0.21 | ) | — | |
Net Asset Value | | | | | | | | | |
End of period(b) | | $ | 11.12 | | $ | 10.43 | | $ | 11.08 | | $ | 10.41 | |
| | | | | | | | | |
Total Return(c),(d) | | 8.69 | % | 4.30 | % | 8.49 | % | 4.10 | % |
Ratio and Supplemental Data | | | | | | | | | |
| | | | | | | | | |
Net Assets End of Period (000’s) | | $ | 24,495 | | $ | 7,516 | | $ | 225,620 | | $ | 44,053 | |
| | | | | | | | | |
Expenses to average net assets(e),(f) | | | | | | | | | |
After reimbursement/fee waiver(g) | | 0.19 | %(J) | 0.25 | % | 0.44 | %(J) | 0.50 | % |
Before reimbursement/fee waiver(h) | | 0.19 | %(J) | 0.39 | % | 0.44 | %(J) | 0.64 | % |
Net investment income (loss), to average net assets(f),(i) | | 5.05 | % | 12.92 | % | 5.18 | % | 12.63 | % |
Portfolio turnover rate(d) | | 1 | % | 1 | % | 1 | % | 1 | % |
| | | | | | | | | | | | | | | |
(a) | | Per share information is calculated based on average number of shares outstanding. |
(b) | | International Moderate Growth Fund (the “Fund”) share classes commenced operations as follows: |
| | Initial Class - May 1, 2006 |
| | Service Class - May 1, 2006 |
(c) | | Total Return reflects all portfolio expenses and includes reinvestment of dividends and capital gains; it does not reflect the charges and deductions under the policies or annuity contracts. |
(d) | | Not annualized. |
(e) | | Does not include expenses of the investment companies in which the Fund invests. |
(f) | | Annualized. |
(g) | | Ratio of Net Expenses to Average Net Assets is net of fee waivers and reimbursements by the investment adviser, if any (see Note 2). |
(h) | | Ratio of Total Expenses to Average Net Assets includes all expenses before fee waivers and reimbursements by the investment advisor. |
(i) | | Recognition of net investment income by the Fund is affected by the timing of the declaration of dividends by the underlying investment companies in which the Fund invests. |
(j) | | Ratio is inclusive of recaptured expenses by the investment adviser. The impact of recaptured expenses was 0.02% and 0.02% for Initial Class and Service Class, respectively (see Note 2). |
The notes to the financial statements are an integral part of this report.
7
International Moderate Growth Fund
NOTES TO FINANCIAL STATEMENTS
At December 31, 2007
(all amounts in thousands)
NOTE 1. ORGANIZATION AND SIGNIFICANT ACCOUNTING POLICIES
AEGON/Transamerica Series Trust (“ATST”) is an open-end management investment company registered under the Investment Company Act of 1940, as amended (the “1940 Act”). ATST serves as a funding vehicle for variable life insurance, variable annuity and group annuity products. International Moderate Growth Fund (the “Fund”) is part of ATST.
In the normal course of business, the Fund enters into contracts that contain a variety of representations that provide general indemnifications. The Fund’s maximum exposure under these arrangements is unknown, as this would involve future claims that may be made against the Fund and/or its affiliates that have not yet occurred. However, based on experience, the Fund expects the risk of loss to be remote.
This report should be read in conjunction with the current Fund prospectus, which contains more complete information about the Fund.
In preparing the Fund’s financial statements in accordance with accounting principles generally accepted in the United States of America (“GAAP”), estimates or assumptions (which could differ from actual results) may be used that affect reported amounts and disclosures. The following is a summary of significant accounting policies followed by the Fund.
Multiple class operations, income and expenses: The Fund currently offers two classes of shares, an Initial Class and a Service Class. Income, non-class specific expenses and realized and unrealized gains and losses, are allocated daily to each class, based upon the value of shares outstanding method as permitted under Rule 18f-3 of the 1940 Act. Each class bears its own specific expenses as well as a portion of general, common expenses.
Security valuations: Investment company securities are valued at the net asset value of the underlying portfolio.
Cash: The Fund may leave cash overnight in its cash account with the custodian, State Street Bank & Trust Company (“State Street”). On July 2, 2007, State Street acquired the parent company of Investors Bank & Trust Company. State Street has been contracted on behalf of the Fund to invest the excess cash into a savings account, which at December 31, 2007 was paying an interest rate of 2.60%.
Security transactions and investment income: Security transactions are recorded on the trade date. Security gains and losses are calculated on the first-in, first-out basis. Dividend income, if any, is recorded on the ex-dividend date. Dividends and net realized gain (loss) from investment securities for the Fund are from investments in shares of affiliated investment companies.
Dividend distributions: Dividends and capital gains distributions are typically declared and reinvested annually and are generally paid and reinvested on the business day following the ex-date. Dividends and net realized gain (loss) from investment securities for the Fund are from investments in shares of affiliated investment companies
NOTE 2. RELATED PARTY TRANSACTIONS
ATST serves as a funding vehicle for certain affiliated asset allocation portfolios and certain affiliated separate accounts of Western Reserve Life Assurance Co. of Ohio, Transamerica Life Insurance Company, Transamerica Financial Life Insurance Company, Inc., Monumental Life Insurance Company and Transamerica Occidental Life Insurance Company.
Transamerica Fund Advisors, Inc. (“TFAI”) is the Fund’s investment adviser. Transamerica Fund Services, Inc. (“TFS”) is the Fund’s administrator and transfer agent. Prior to May 1, 2007, AFSG Securities Corp. (“AFSG”), was the Fund’s distributor. Transamerica Capital Inc. (“TCI”) is now the fund’s distributor. TFAI, TFS, AFSG and TCI are affiliates of AEGON NV, a Netherlands corporation.
TFAI has entered into an agreement with Morningstar Associates, LLC (“Morningstar”) to provide investment services to the Fund. TFAI compensates Morningstar as described in the prospectus.
Transamerica Investment Management, LLC (“TIM”) is an affiliate of the Fund and is a sub-adviser to other funds within ATST.
Certain officers and trustees of the Fund are also officers and/or directors of TFAI, TFS and TCI.
Because the underlying funds have varied expense and fee levels and the Fund may own different proportions of underlying funds at different times, the amount of fees and expenses incurred indirectly by the Fund will vary.
Investment advisory fee: The Fund pays management fees to TFAI based on average daily net assets (“ANA”) at the following rate:
0.10% of ANA
TFAI has contractually agreed to waive its advisory fee and will reimburse the Fund to the extent that operating expenses, excluding 12b-1 fees, exceed the following stated annual limit:
0.25% Expense Limit
If total Fund expenses fall below the annual expense limitation agreement agreed to by the adviser within the succeeding three years, the Fund may be required to pay the adviser a portion or all of the waived advisory fees.
For the year ended December 31, 2007, the Fund recaptured $21 of previously reimbursed expenses. There were no amounts available for recapture at December 31, 2007.
Distribution and service fees: ATST entered into a Distribution Agreement with AFSG dated January 1, 1997, as amended. On May 1, 2007, the Distribution Agreement was amended to replace AFSG with TCI as the Fund’s distributor. The Fund has also adopted a distribution plan (“Distribution Plan”) pursuant to Rule 12b-1 under the 1940 Act.
8
NOTES TO FINANCIAL STATEMENTS (continued)
At December 31, 2007
(all amounts in thousands)
NOTE 2.– (continued)
Under the Distribution Plan for the Initial Class shares, TCI, on behalf of the Fund, is authorized to pay various service providers, as direct payment for expenses incurred in connection with distribution of the Fund’s shares, amounts equal to actual expenses associated with distributing the shares.
The Distribution Plan for the Service Class shares requires ATST to pay distribution fees to TCI as compensation for its activities, not as reimbursement for specific expenses. The fee on the Service Class is paid to the insurance companies for providing services and account maintenance for their policyholders who invest in the variable insurance products which invest in the Service Class shares.
The Fund is authorized under the Distribution Plan to pay fees on each class up to the following limits:
Initial Class | | 0.15 | % |
Service Class | | 0.25 | % |
TCI has determined that it will not seek payment by the Fund of the distribution expenses incurred with respect to the Initial Class shares before April 30, 2009. Prior to TCI seeking reimbursement of future expenses, policy and contract owners will be notified in advance. The Fund will pay fees relating to Service Class shares.
Administrative services: The Fund has entered into an agreement with TFS for financial and legal fund administration services. The Fund pays TFS an annual fee of 0.0125% of ANA. The Legal fees on the Statement of Operations are for fees paid to external legal counsel.
Deferred compensation plan: Each eligible independent Fund Trustee may elect participation in a non-qualified deferred compensation plan (“the Plan”). Under the Plan, such Trustees may defer payment of all or a portion of their total fees earned as a Fund Trustee. Each Trustee who is a participant in the Plan may elect that the earnings, losses or gains credited to his or her deferred fee amounts be determined based on a deemed investment in any series of Transamerica IDEX Mutual Funds. The right of a participant to receive a distribution from the Plan of the deferred fees is an unsecured claim against the general assets of all series of Transamerica IDEX Mutual Funds. The pro rata liability to the Fund of all deferred fees in the Plan amounted, as of December 31, 2007, to $12. Amounts deferred under the Plan are unfunded against the general assets of ATST.
Retirement plan: Under a retirement plan (the “Emeritus Plan”) available to the Independent Trustees, each Independent Trustee is deemed to have elected to serve as Trustee Emeritus of ATST upon his or her termination of service, other than removal for cause, and is entitled to 50% of the trustee’s current retainer for a maximum period of five years determined by his or her years of service as a Trustee.
Such amounts shall be accrued by ATST on a pro rata basis allocable to each series of ATST fund based on the relative assets of the series. If retainers increase in the future, past accruals (and credits) will be adjusted upward so that 50% of the Trustee’s current retainer is accrued and credited at all times. Upon death, disability or termination of service, other than removal for cause, amounts deferred become payable to a Trustee Emeritus (or his/her beneficiary). Upon the commencement of service as Trustee Emeritus,compensation will be paid on a quarterly basis during the time period that the Trustee Emeritus is allowed to serve as such.
Amounts accrued under the Emeritus Plan are unsecured claims against the general assets of ATST. For the year ended December 31, 2007, the amount related to the Emeritus Plan was less than $1. As of December 31, 2007, the Fund has not made any payments related to the Emeritus Plan.
The Emeritus Plan was terminated effective October 30, 2007. Upon the termination, the Fund shall continue to pay any remaining benefits in accordance with the Plan, but no further compensation shall accrue under the Plan.
NOTE 3. INVESTMENT TRANSACTIONS
The cost of securities purchased and proceeds from securities sold (excluding short-term securities) for the year ended December 31, 2007 were as follows:
Purchases of securities: | | | |
Long-term | | $ | 210,190 | |
U.S. Government | | — | |
Proceeds from maturities and sales of securities: | | | |
Long-term | | 1,711 | |
U.S. Government | | — | |
| | | | |
NOTE 4. FEDERAL INCOME TAX MATTERS
The Fund has not made any provision for federal income or excise taxes due to its policy to distribute all of its taxable income and capital gains to its shareholders and otherwise qualify as a regulated investment company under Subchapter M of the Internal Revenue Code. Income and capital gain distributions are determined in accordance with income tax regulations, which may differ from GAAP. These differences are primarily due to differing treatment for items including, but not limited to, wash sales.
9
NOTES TO FINANCIAL STATEMENTS (continued)
At December 31, 2007
(all amounts in thousands)
NOTE 2.– (continued)
The tax character of distributions paid may differ from the character of distributions shown in the Statements of Changes in Net Assets due to short-term gains being treated as ordinary income for tax purposes. The tax character of distributions paid during 2006 and 2007 was as follows:
2006 Distributions paid from: | | | |
Ordinary Income | | $ | — | |
Long-term Capital Gain | | — | |
2007 Distributions paid from: | | | |
Ordinary Income | | 1,848 | |
Long-term Capital Gain | | 1,116 | |
| | | | |
The tax basis components of distributable earnings as of December 31, 2007 are as follows:
Undistributed Ordinary Income | | $ | 7,172 | |
Undistributed Long-term Capital Gain | | $ | 11,050 | |
Capital Loss Carryforward | | $ | — | |
Net Unrealized Appreciation (Depreciation) | | $ | (9,638 | ) |
NOTE 5. REGULATORY PROCEEDINGS
There continues to be significant federal and state regulatory activity relating to financial services companies, particularly mutual fund companies and their investment advisers. As part of an ongoing investigation regarding potential market timing, recordkeeping and trading compliance issues and matters affecting the Funds’ investment adviser, TFAI, and certain affiliates and former employees of TFAI, the SEC staff has indicated that it is likely to take some action against TFAI and certain of its affiliates at the conclusion of the investigation. The potential timing and the scope of any such action is difficult to predict. Although the impact of any action brought against TFAI and/or its affiliates is difficult to assess at the present time, the Funds currently believe that the likelihood that any such action will have a material adverse impact is remote. It is important to note that the Funds are not aware of any allegation of wrong doing against them and their Board at the time this annual report is printed. Although it is not anticipated that these developments will have an adverse impact on the Funds, there can be no assurance at this time. TFAI and its affiliates are actively working with the SEC in regard to this matter; however, the exact resolution cannot be determined at this time. TFAI will take such actions that it deems necessary or appropriate to continue providing management services to the Funds and to bring all matters to an appropriate conclusion.
TFAI and/or its affiliates, and not the Funds, will bear the costs regarding these regulatory matters.
NOTE 6. RECENTLY ISSUED ACCOUNTING PRONOUNCEMENTS
In July 2006, the Financial Accounting Standards Board (“FASB”) released FASB Interpretation No. 48 “Accounting for Uncertainty in Income Taxes” (“FIN 48”), an interpretation of FASB Statement No. 109. FIN 48 provides guidance for how uncertain tax positions should be recognized, measured, presented and disclosed in the financial statements. FIN 48 requires the accounting and disclosure of tax positions taken or expected to be taken in the course of preparing the Fund’s tax returns to determine whether the tax positions are “more-likely-than-not” of being sustained by the applicable tax authority. Tax positions not deemed to meet the more-likely-than-not threshold would be recorded as a tax benefit or expense in the current year.
Adoption of FIN 48 is effective during the first required financial reporting period for fiscal years beginning after December 15, 2006. Management adopted FIN 48 on June 29, 2007.
Implementation of FIN 48 requires Management of the Fund to analyze all open tax years, as defined by the Statute of Limitations, for all major jurisdictions, which includes federal and certain states. Open tax years are those that are open for exam by taxing authorities (i.e., the last 4 tax year ends and the interim tax period since then). The Fund has no examinations in progress and none are expected at this time.
Management of the Fund has reviewed all open tax years and major jurisdictions and concluded the adoption of FIN 48 resulted in no impact to the Fund’s net assets or results of operations. There is no tax liability resulting from unrecognized tax benefits relating to uncertain income tax positions taken or expected to be taken in future tax returns. The Fund is also not aware of any tax positions for which it is reasonably possible that the total amounts of unrecognized tax benefits will significantly change in the next 12 months.
In September 2006, FASB issued its new Standard No. 157, “Fair Value Measurements” (“FAS 157”). FAS 157 is designed to unify guidance for the measurement of fair value of all types of assets, including financial instruments, and certain liabilities, throughout a number of accounting standards. FAS 157 also establishes a hierarchy for measuring fair value in generally accepted accounting principles and expands financial statement disclosures about fair value measurements that are relevant to mutual funds. FAS 157 is effective for financial statements issued for fiscal years beginning after November 15, 2007, and earlier application is permitted.
As of December 31, 2007, Management does not expect the adoption of FAS 157 to impact the amounts reported in the financial statements, however, additional disclosures will be required about the inputs used to develop the measurements of fair value and the effect of certain of the measurements reported in the statement of operations for a fiscal period.
NOTE 7. SUBSEQUENT EVENT
Effective January 1, 2008, TFAI changed its name to Transamerica Asset Management, Inc.
Effective May 1, 2008, AEGON/Transamerica Series Trust will change its name to Transamerica Series Trust. At that time, the Fund will also change its name to Transamerica International Moderate Growth VP.
10
Report of Independent Registered Certified Public Accounting Firm
To the Board of Trustees and Shareholders of
International Moderate Growth Fund:
In our opinion, the accompanying statement of assets and liabilities, including the schedule of investments, and the related statements of operations and of changes in net assets and the financial highlights present fairly, in all material respects, the financial position of International Moderate Growth Fund (the “Fund”) (one of the portfolios constituting AEGON/Transamerica Series Trust) at December 31, 2007, the results of its operations for the year then ended, and the changes in its net assets and the financial highlights for the year then ended and for the period May 1, 2006 (commencement of operations) through December 31, 2007, in conformity with accounting principles generally accepted in the United States of America. These financial statements and financial highlights (hereafter referred to as “financial statements”) are the responsibility of the Fund’s management; our responsibility is to express an opinion on these financial statements based on our audits. We conducted our audits of these financial statements in accordance with the standards of the Public Company Accounting Oversight Board (United States). Those standards require that we plan and perform the audit to obtain reasonable assurance about whether the financial statements are free of material misstatement. An audit includes examining, on a test basis, evidence supporting the amounts and disclosures in the financial statements, assessing the accounting principles used and significant estimates made by management, and evaluating the overall financial statement presentation. We believe that our audits, which included confirmation of securities at December 31, 2007 by correspondence with the transfer agent, provide a reasonable basis for our opinion.

Tampa, Florida
February 29, 2008
11
International Moderate Growth Fund
SUPPLEMENTAL TAX INFORMATION (unaudited)
(all amounts in thousands)
For tax purposes, the Fund has made a Long-Term Capital Gain Designation of $1,116 for the year ended December 31, 2007.
RESULTS OF SHAREHOLDER PROXY (unaudited)
At a special meeting of shareholders held on October 30, 2007, the results of the Proposals were as follows:
Proposal 1: To elect a new Board:
Proposed | | | | | | Abstentions/Broker Non- | |
Trustee | | For | | Against | | Votes | |
John K. Carter | | 2,274,998,840.817 | | 57,804,698.755 | | 35,433.883 | |
| | | | | | | |
Leo J. Hill | | 2,277,212,702.754 | | 55,590,836.819 | | 35,433.883 | |
| | | | | | | |
Neal M. Jewell | | 2,266,793,295.663 | | 66,010,243.909 | | 35,433.883 | |
| | | | | | | |
Russell A. Kimball, Jr. | | 2,274,825,235.835 | | 57,978,303.737 | | 35,433.883 | |
| | | | | | | |
Eugene M. Mannella | | 2,274,623,165.033 | | 58,180,374.539 | | 35,433.883 | |
| | | | | | | |
Norm R. Nielsen | | 2,275,050,055.885 | | 57,753,483.687 | | 35,433.883 | |
| | | | | | | |
Joyce Galpern Norden | | 2,270,278,122.250 | | 62,525,417.323 | | 35,433.883 | |
| | | | | | | |
Patricia L. Sawyer | | 2,275,737,737.456 | | 57,065,802.116 | | 35,433.883 | |
| | | | | | | |
John W. Waechter | | 2,276,615,120.140 | | 56,188,419.433 | | 35,433.883 | |
Proposal 2: To approve an amendment to the Agreement and Declaration of Trust:
| | | | Abstentions/Broker Non- | |
For | | Against | | Votes | |
2,182,022,669.110 | | 77,590,048.544 | | 73,226,255.801 | |
12
International Moderate Growth Fund
INVESTMENT ADVISORY AND SUB-ADVISORY AGREEMENTS-REVIEW AND RENEWAL (unaudited)
At a meeting of the Board of Trustees of AEGON/Transamerica Series Trust (“ATST”) held on December 4th, 2007, the Board reviewed and considered the renewal of the investment advisory agreement (the “Investment Advisory Agreement”) between International Moderate Growth Fund (the “Fund”) and Transamerica Fund Advisors, Inc. (“TFAI”), as well as the renewal of the investment sub-advisory agreement (the “Sub-Advisory Agreement”) of the Fund between TFAI and Morningstar Associates, LLC (the “Sub-Adviser”), to determine whether the agreements should be renewed for a six-month period. It was noted that this review was interim in nature to align all the Funds on the same calendar, and that the Funds’ advisory arrangements would be reviewed again in the first half of 2008.
Following their review and consideration, the Trustees determined that the renewal of the Investment Advisory Agreement and the Sub-Advisory Agreement would enable shareholders of the Fund to obtain high quality services at a cost that is appropriate, fair, and in the best interests of its shareholders. The Board, including the independent members of the Board, unanimously approved the renewal of the Investment Advisory Agreement and Sub-Advisory Agreement. In reaching their decision, the Trustees requested and obtained from TFAI and the Sub-Adviser such information as they deemed reasonably necessary to evaluate the agreements, including information about fees and performance of comparable funds managed by the Sub-Adviser. The Trustees also carefully considered information they had previously received from TFAI and the Sub-Adviser throughout the year as part of their regular oversight of the Fund, as well as comparative fee, expense, and performance information prepared by Lipper Inc. (“Lipper”), an independent provider of mutual fund performance, fee and expense information and profitability data prepared by management. In considering the proposed continuation of the Investment Advisory and Sub-Advisory Agreements, the Trustees evaluated a number of considerations that they believed, in light of the legal advice furnished to them by independent legal counsel and their own business judgment, to be relevant. They based their decisions on a variety of factors, including the following considerations, among others, although they did not identify any consideration or particular information that was controlling of their decisions:
The nature, extent and quality of the advisory services to be provided. The Board considered the nature and quality of the services provided by TFAI and the Sub-Adviser to the Fund in the past, as well as the services anticipated to be provided in the future. The Board concluded that TFAI and the Sub-Adviser are capable of providing high quality services to the Fund, as indicated by the nature and quality of services provided in the past by TFAI and the Sub-Adviser for this series and the experience, capability and integrity of TFAI’s senior management, the financial resources of TFAI and the Sub-Adviser, TFAI’s management oversight process and the professional qualifications of the portfolio management team of the Sub-Adviser. The Trustees determined that TFAI and the Sub-Adviser can provide investment and related services that are appropriate in scope and extent in light of the Fund’s operations, the competitive landscape of the investment company business and investor needs.
The investment performance of the Fund. The Board examined the short and longer-term performance of the Fund, including relative performance against a peer universe of comparable mutual funds as prepared by Lipper for various trailing periods ended June 30, 2007. The Trustees observed that the Fund’s performance for the past 1-year period has been below the median for its peer universe, and noted that that no long-term performance information was available because the Fund had launched operations on May 1, 2006. The Trustees further noted that the recent underperformance generally can be attributed to the Fund’s higher bond exposure which can cause performance to lag in strong equity markets. On the basis of the Board’s assessment of the nature, extent and quality of advisory services to be provided or procured by TFAI and the Sub-Adviser, the Board concluded that TFAI and the Sub-Adviser are capable of providing a level of investment performance that is appropriate in light of the Fund’s proposed investment objectives, policies and strategies and competitive with other similarly situated investment companies, but that the Board would be monitoring performance closely.
The cost of advisory services provided and the level of profitability. The Board reviewed profitability information of TFAI’s cost of procuring fund management services, as well as the costs of provision of administration, fund accounting and other services, to the Fund and to ATST as a whole by TFAI and its affiliates. The Board reviewed the management and sub-advisory fees for the Fund. The Trustees noted that the Fund’s contractual management fees and the total expenses of the Fund were below the medians for its peer group and peer universe. Based on their review, the Trustees determined that the management fees of the Fund generally are appropriate in light of the services expected to be provided or procured, the management fees and the anticipated profitability of the relationship between the Fund, TFAI and its affiliates, and the Sub-Adviser. In making these observations and determinations, the Board reviewed, among other things, comparative information provided by Lipper.
Whether fee levels reflect economies of scale and the extent to which economies of scale would be realized as the Fund grows. In evaluating the extent to which the management fees payable under the Investment Advisory and Sub-Advisory Agreements reflect economies of scale or will permit economies of scale to be realized in the future, the Board considered the specific reasons for the absence of breakpoints, and concluded that the absence of breakpoints was acceptable under the circumstances. The Trustees also concluded that they will have the opportunity to periodically reexamine whether the Fund has achieved economies of scale, and the appropriateness of management fees payable to TFAI and fees paid to the Sub-Adviser, in the future.
Benefits (such as soft dollars) to TFAI, its affiliates, or the Sub-Adviser from their relationship with the Fund. The Board concluded that other benefits anticipated to be derived by TFAI, its affiliates, and the Sub-Adviser from their relationships with the Fund are expected to be reasonable and fair, and consistent with industry practice and the best interests of the Fund and its shareholders. The Trustees noted that TFAI would not realize soft dollar benefits from its relationship with the Fund.
13
Other considerations. The Board determined that TFAI has made a substantial commitment to the recruitment and retention of high quality personnel, and maintains the financial, compliance and operational resources reasonably necessary to manage the Fund in a professional manner that is consistent with the best interests of the Fund and its shareholders. In this regard, the Trustees favorably considered the procedures and policies in place by TFAI to enforce compliance with applicable laws and regulations and oversee the portfolio management activities of the Sub-Adviser. The Trustees also determined that TFAI has made a significant entrepreneurial commitment to the management and success of the Fund, reflected by TFAI’s expense limitation and fee waiver arrangements with the Fund which may result in TFAI waiving a substantial amount of management fees for the benefit of shareholders.
14
Jennison Growth
MARKET ENVIRONMENT
The portfolio’s fiscal year was volatile, with two distinctly different environments for equity markets. During the first half of the year, most markets advanced, led by emerging economies and those US sectors most directly exposed to global economic expansion, especially energy stocks, which rose on soaring oil prices. Interest rates moved up as the Federal Reserve Board sought to contain the incipient inflation reflected in personal consumption expenditures. Companies in the Standard and Poor’s 500 Composite Stock Index (“S&P 500”) extended their run of double-digit profit gains to a record-setting 17 quarters by June, while capital markets activity, fortified by the coffers of private equity firms and hedge funds, reached peak levels with a boom in mergers and acquisitions. The consumer sector was less sanguine, as the effects of high energy prices and rising interest rates slowed growth in consumption. The labor market remained strong, however, with the unemployment rate hovering at 4.5%, relatively low by historical standards.
By late July, the market environment changed dramatically. The souring residential real estate market rekindled market volatility and triggered a liquidity squeeze that by year-end had caused mortgage investors to incur losses of tens of billions of dollars. The credit market turmoil sparked a swift reappraisal of risk in the US equity markets. In less than a month, from July 19th to August 15th, the S&P 500 fell 9%. Equities rebounded quickly, however, with the S&P 500 up nearly 10% from its August lows by early October, before reversing course once again and falling over 9% by late November. The S&P 500 ended 2007 with a positive return of 5.49%, while large capitalization growth stocks, and the portfolio, produced double-digit returns.
The epicenter of the credit crunch was the trillion dollar market for US residential mortgages and the securities derived from underlying interest and principal components – most notably collateralized debt obligations. The problem was exacerbated by the inability of financial institutions to accurately identify and price their exposures. This uncertainty led to extreme dislocation in the normally deep and liquid market for overnight money. Central banks responded with interest rate cuts and extraordinary open market operations that permitted financial institutions to secure necessary funds. Despite the efforts, at year-end, short-term funds were still priced at an unusual premium.
The financial market stress forced many financial institutions to take fourth-quarter write-offs, resulting in substantial losses, management changes, and moves to raise capital. Employment remained essentially healthy through year-end, but slowing economic growth, the prospect of recession in 2008, and the weak housing market caused retail sales to tail off further into the important year-end holiday season. Oil closed 2007 just shy of $100 per barrel; many agricultural commodities hit new cycle highs; and the value of the US dollar fell, fueling inflation concerns.
PERFORMANCE
For the year ended December 31, 2007, Jennison Growth, Initial Class returned 11.51%. By comparison its benchmark, the Russell 1000 Growth Index (“Russell 1000 Growth”), returned 11.81%.
STRATEGY REVIEW
Growth stocks, as reflected by the Russell 1000 Growth benchmark, substantially outperformed the S&P 500 with a return of 11.81% versus 5.49%. Benchmark returns were greatest in materials, energy, utilities, and information technology. The consumer discretionary, telecommunication services and financials sectors declined.
The portfolio is built from the bottom up, with stocks selected one at a time, based on the fundamentals of individual companies rather than on overarching themes. The portfolio’s security selection was strong in information technology, led by triple-digit gains in Research in Motion Limited (“RIMM”) and Apple Inc.; Google Inc. (“Google”), NVIDIA Corporation, and Juniper Networks, Inc. posted 50%-plus advances, as well. In the materials sector, Monsanto Company (“Monsanto”) advanced more than 100%. Top performers in energy included Occidental Petroleum Corporation and Schlumberger Limited. Consumer discretionary and financials holdings detracted from the portfolio’s return, as Coach, Inc. (“Coach”), Marriott International, Inc. (“Marriott”), Starbucks Corporation, UBS AG, and Merrill Lynch & Co., Inc. declined.
The five greatest contributors to the portfolio’s return were Apple Inc., RIMM, Google, Monsanto, and Gilead Sciences, Inc. The five greatest detractors were Coach, Marriott, Genentech, Inc., Marvell Technology Group Ltd., and International Game Technology.
Michael A. Del Balso
Spiros Segalas
Kathleen A. McCarragher
Co-Portfolio Managers
Jennison Associates LLC
AEGON/Transamerica Series Trust | | Annual Report 2007 |
1
Jennison Growth
(unaudited)
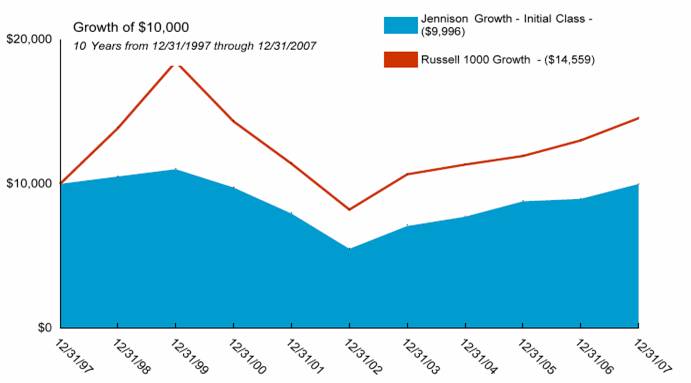
Average Annual Total Return for Periods Ended 12/31/2007
| | | | | | | | From | | Inception | |
| | 1 Year | | 5 Years | | 10 Years | | Inception | | Date | |
| | | | | | | | | | | |
Initial Class | | 11.51 | % | 12.70 | % | 0.00 | % | 1.46 | % | 11/18/96 | |
Russell 1000 Growth (1) | | 11.81 | % | 12.10 | % | 3.83 | % | 5.93 | % | 11/18/96 | |
| | | | | | | | | | | |
Service Class | | 11.28 | % | — | % | — | % | 11.97 | % | 5/1/03 | |
NOTES
(1) The Russell 1000 Growth (Russell 1000 Growth) index is an unmanaged index used as a general measure of market performance. Calculations assume dividends and capital gains are reinvested and do not include any managerial expenses. From inception, calculation is based on life of Initial Class shares.
The performance data presented represents past performance; future results may vary. The portfolio’s investment return and net asset value will fluctuate. Past performance does not guarantee future results. Investor’s units when redeemed, may be worth more or less than their original cost.
Current performance may be lower or higher than performance quoted. Please visit your insurance company’s website for contract or policy level standardized total returns current to the most recent month end. Portfolio performance is net of investment fees and fund expenses, but not product charges, which, if included, would significantly lower the performance quoted.
This material must be preceded or accompanied by a current prospectus, which includes specific contents regarding the investment objectives, explanation of share classes and policies of this portfolio.
2
Jennison Growth
UNDERSTANDING YOUR FUND’S EXPENSES
(unaudited)
SHAREHOLDER EXPENSES
Fund shareholders may incur ongoing costs, including management and advisory fees, distribution and service fees, and other fund expenses.
The following Example is intended to help you understand your ongoing costs (in dollars and cents) of investing in the Fund and to compare these costs with the ongoing costs of investing in other funds.
The Example is based on an investment of $1,000 invested at July 1, 2007 and held for the entire period until December 31, 2007.
ACTUAL EXPENSES
The first line in the table below provides information about actual account values and actual expenses. You may use the information in this line, together with the amount you invested, to estimate the expenses that you paid over the period. Simply divide your account value by $1,000 (for example, an $8,600 account value divided by $1,000 = 8.6), then multiply the result by the number in the first line of your Fund under the heading entitled “Expenses Paid During Period” to estimate the expenses you paid on your account during this period. If your account is an IRA, your expenses could have included a $15 annual fee. The amount of any fee paid through your account would increase the estimate of expenses you paid during the period and decrease your ending account value.
HYPOTHETICAL EXAMPLE FOR COMPARISON PURPOSES
The second line in the table below provides information about hypothetical account values and hypothetical expenses based on the Fund’s actual expense ratio and an assumed rate of return of 5% per year before expenses, which is not the Fund’s actual return. The hypothetical account values and expenses may not be used to estimate the actual ending account balance or expenses you paid for the period. You may use this information to compare the ongoing costs of investing in your Fund and other funds. To do so, compare this 5% hypothetical example with the 5% hypothetical examples that appear in the shareholder reports of the other funds.
Please note that the expenses shown in the table are meant to highlight your ongoing costs only and do not reflect any transactional costs, such as sales charges, redemption fees, brokerage commissions paid on purchases and sales of fund shares. Therefore, the second line under the Fund in the table is useful in comparing ongoing costs only, and will not help you determine the relative total costs of owning different funds. If any of these transaction costs were included, your costs would be higher. The expenses shown in the table do not reflect any fees that may be charged to you by brokers, financial intermediaries or other financial institutions.
| | Beginning | | Ending | | Annualized | | Expenses | |
| | Account | | Account | | Expense | | Paid During | |
| | Value | | Value | | Ratio | | Period (a) | |
| | | | | | | | | |
Initial Class | | | | | | | | | |
Actual | | $ | 1,000.00 | | $ | 1,063.71 | | 0.86 | % | $ | 4.47 | |
Hypothetical (b) | | 1,000.00 | | 1,020.87 | | 0.86 | | 4.38 | |
| | | | | | | | | |
Service Class | | | | | | | | | |
Actual | | 1,000.00 | | 1,062.33 | | 1.11 | | 5.77 | |
Hypothetical (b) | | 1,000.00 | | 1,019.61 | | 1.11 | | 5.65 | |
| | | | | | | | | | | | |
(a) | | Expenses are calculated using the Fund’s annualized expense ratio (as disclosed in the table), multiplied by the average account value for the period, multiplied by the number of days in the period (184 days), and divided by the number of days in the year (365 days). |
| | |
(b) | | 5% return per year before expenses. |
GRAPHICAL PRESENTATION OF SCHEDULE OF INVESTMENTS
By Sector
At December 31, 2007
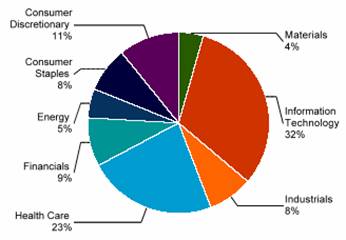
This chart shows the percentage breakdown by sector of the Fund’s total investment securities.
3
Jennison Growth
SCHEDULE OF INVESTMENTS
At December 31, 2007
(all amounts except share amounts in thousands)
| | Shares | | Value | |
COMMON STOCKS (98.8%) | | | | | |
Aerospace & Defense (3.0%) | | | | | |
Boeing Co. | | 19,000 | | $ | 1,662 | |
United Technologies Corp. | | 42,400 | | 3,245 | |
Beverages (2.2%) | | | | | |
PepsiCo, Inc. | | 47,300 | | 3,590 | |
Biotechnology (5.5%) | | | | | |
Genentech, Inc. ‡ | | 35,700 | | 2,394 | |
Gilead Sciences, Inc. ‡ | | 142,000 | | 6,534 | |
Capital Markets (5.5%) | | | | | |
Charles Schwab Corp. (The) | | 138,300 | | 3,534 | |
Goldman Sachs Group, Inc. (The) | | 11,500 | | 2,473 | |
Lazard, Ltd. Class A ^ | | 42,800 | | 1,741 | |
Merrill Lynch & Co., Inc. | | 22,100 | | 1,186 | |
Chemicals (4.4%) | | | | | |
Monsanto Co. | | 39,000 | | 4,356 | |
Mosaic Co. (The) ‡ | | 7,700 | | 726 | |
Potash Corp. of Saskatchewan | | 14,100 | | 2,030 | |
Communications Equipment (10.1%) | | | | | |
Ciena Corp. ‡^ | | 35,200 | | 1,201 | |
Cisco Systems, Inc. ‡ | | 164,900 | | 4,464 | |
Juniper Networks, Inc. ‡ | | 52,500 | | 1,743 | |
Nokia OYJ | | 42,900 | | 1,647 | |
Qualcomm, Inc. | | 61,100 | | 2,404 | |
Research In Motion, Ltd. ‡ | | 44,500 | | 5,046 | |
Computers & Peripherals (6.0%) | | | | | |
Apple, Inc. ‡ | | 28,900 | | 5,725 | |
Hewlett-Packard Co. | | 80,100 | | 4,043 | |
Consumer Finance (0.9%) | | | | | |
American Express Co. | | 29,100 | | 1,514 | |
Diversified Financial Services (2.2%) | | | | | |
CME Group, Inc. Class A | | 2,500 | | 1,715 | |
NYSE Euronext | | 21,200 | | 1,861 | |
Electrical Equipment (2.9%) | | | | | |
ABB, Ltd. | | 63,700 | | 1,834 | |
First Solar, Inc. ‡ | | 7,400 | | 1,977 | |
Sunpower Corp. Class A ‡^ | | 6,800 | | 887 | |
Energy Equipment & Services (1.5%) | | | | | |
Schlumberger, Ltd. | | 25,400 | | 2,499 | |
Food & Staples Retailing (2.8%) | | | | | |
Costco Wholesale Corp. | | 25,600 | | 1,786 | |
CVS Caremark Corp. | | 41,100 | | 1,634 | |
Whole Foods Market, Inc. ^ | | 26,900 | | 1,097 | |
Health Care Equipment & Supplies (5.4%) | | | | | |
Alcon, Inc. | | 20,900 | | 2,989 | |
Baxter International, Inc. | | 42,200 | | 2,450 | |
Hologic, Inc. ‡^ | | 19,900 | | 1,366 | |
St Jude Medical, Inc. ‡ | | 49,900 | | 2,028 | |
Hotels, Restaurants & Leisure (1.3%) | | | | | |
Marriott International, Inc. Class A | | 64,800 | | 2,215 | |
Household Products (3.1%) | | | | | |
Colgate-Palmolive Co. | | 41,500 | | 3,235 | |
Procter & Gamble Co. | | 23,900 | | 1,755 | |
Industrial Conglomerates (2.0%) | | | | | |
General Electric Co. | | 88,100 | | $ | 3,266 | |
Internet & Catalog Retail (1.7%) | | | | | |
Amazon.Com, Inc. ‡ | | 30,000 | | 2,779 | |
Internet Software & Services (8.0%) | | | | | |
Akamai Technologies, Inc. ‡^ | | 46,700 | | 1,616 | |
Alibaba.Com, Ltd. ‡ | | 32,900 | | 117 | |
eBay, Inc. ‡ | | 65,400 | | 2,171 | |
Google, Inc. Class A ‡ | | 11,100 | | 7,675 | |
Yahoo!, Inc. ‡ | | 60,900 | | 1,416 | |
IT Services (0.6%) | | | | | |
Infosys Technologies, Ltd. | | 20,700 | | 939 | |
Life Sciences Tools & Services (1.8%) | | | | | |
Thermo Fisher Scientific, Inc. ‡ | | 51,900 | | 2,994 | |
Media (3.7%) | | | | | |
News Corp. Class A | | 105,100 | | 2,153 | |
Walt Disney Co. (The) ‡ | | 121,500 | | 3,922 | |
Multiline Retail (0.8%) | | | | | |
Saks, Inc. ‡^ | | 63,600 | | 1,320 | |
Oil, Gas & Consumable Fuels (3.6%) | | | | | |
Marathon Oil Corp. | | 40,600 | | 2,471 | |
Occidental Petroleum Corp. | | 26,200 | | 2,017 | |
Southwestern Energy Co. ‡ | | 9,600 | | 535 | |
Suncor Energy, Inc. | | 7,400 | | 804 | |
Pharmaceuticals (10.0%) | | | | | |
Abbott Laboratories | | 68,600 | | 3,852 | |
Elan Corp. PLC ‡ | | 43,000 | | 945 | |
Merck & Co., Inc. | | 42,000 | | 2,440 | |
Mylan Inc. ^ | | 56,000 | | 787 | |
Roche Holding AG | | 28,900 | | 2,493 | |
Schering-Plough Corp. | | 45,000 | | 1,199 | |
Teva Pharmaceutical Industries, Ltd. | | 64,000 | | 2,975 | |
Wyeth | | 36,700 | | 1,622 | |
Semiconductors & Semiconductor Equipment (0.5%) | | | | | |
NVIDIA Corp. ‡ | | 25,300 | | 861 | |
Software (6.2%) | | | | | |
Adobe Systems, Inc. ‡ | | 90,700 | | 3,876 | |
Microsoft Corp. | | 170,000 | | 6,052 | |
Vmware, Inc. Class A ‡^ | | 2,600 | | 221 | |
Specialty Retail (0.3%) | | | | | |
Urban Outfitters, Inc. ‡^ | | 17,600 | | 480 | |
Textiles, Apparel & Luxury Goods (2.8%) | | | | | |
Coach, Inc. ‡ | | 67,100 | | 2,052 | |
Nike, Inc. Class B | | 40,200 | | 2,582 | |
Total Common Stocks (cost $135,511) | | | | 161,218 | |
| | | | | |
Total Securities Lending Collateral (cost $8,761) (1) | | | | 8,761 | |
| | | | | |
Total Investment Securities (cost $144,272) # | | | | $ | 169,979 | |
| | | | | | | |
The notes to the financial statements are an integral part of this report.
4
NOTES TO SCHEDULE OF INVESTMENTS:
^ At December 31, 2007, all or a portion of this security is on loan (see Note 1). The value at December 31, 2007, of all securities on loan is $8,484.
‡ Non-Income Producing.
(1) Cash collateral for the Repurchase Agreements, valued at $3,176, that serves as collateral for securities lending, is invested in corporate bonds with interest rates and maturity dates ranging from 3.00% - 10.18% and 04/28/2008 - 12/01/2096, respectively.
# Aggregate cost for federal income tax purposes is $144,316. Aggregate gross unrealized appreciation for all securities in which there is an excess of value over tax cost and aggregate gross unrealized depreciation for all securities in which there is an excess of tax cost over value were $28,481 and $2,818, respectively. Net unrealized appreciation for tax purposes is $25,663.
The notes to the financial statements are an integral part of this report.
5
Jennison Growth
STATEMENT OF ASSETS AND LIABILITIES
At December 31, 2007
(all amounts except per share amounts in thousands)
Assets: | | | |
Investment securities, at value (cost: $144,272) (including securities loaned of $8,484) | | $ | 169,979 | |
Cash | | 976 | |
Receivables: | | | |
Investment securities sold | | 1,053 | |
Shares sold | | 22 | |
Interest | | 7 | |
Income from loaned securities | | 5 | |
Dividends | | 152 | |
| | 172,194 | |
Liabilities: | | | |
Investment securities purchased | | 179 | |
Accounts payable and accrued liabilities: | | | |
Shares redeemed | | 40 | |
Management and advisory fees | | 111 | |
Distribution and service fees | | — | (a) |
Administration fees | | 3 | |
Payable for collateral for securities on loan | | 8,761 | |
Other | | 30 | |
| | 9,124 | |
Net Assets | | $ | 163,070 | |
| | | |
Net Assets Consist of: | | | |
Capital Stock ($.01 par value) | | $ | 198 | |
Additional paid-in capital | | 128,078 | |
Undistributed (accumulated) net investment income | | 240 | |
Undistributed (accumulated) net realized gain from investment securities | | 8,847 | |
Net unrealized appreciation on investment securities | | 25,707 | |
Net Assets | | $ | 163,070 | |
Net Assets by Class: | | | |
Initial Class | | $ | 161,847 | |
Service Class | | 1,223 | |
Shares Outstanding: | | | |
Initial Class | | 19,616 | |
Service Class | | 150 | |
Net Asset Value and Offering Price Per Share: | | | |
Initial Class | | $ | 8.25 | |
Service Class | | 8.16 | |
| | | | | |
(a) Rounds to less than $1.
STATEMENT OF OPERATIONS
For the year ended December 31, 2007
(all amounts in thousands)
Investment Income: | | | |
Dividends (net of withholding taxes on foreign dividends of $54) | | $ | 1,384 | |
Interest | | 66 | |
Income from loaned securities-net | | 100 | |
| | 1,550 | |
Expenses: | | | |
Management and advisory fees | | 1,212 | |
Printing and shareholder reports | | 7 | |
Custody fees | | 27 | |
Administration fees | | 30 | |
Legal fees | | 3 | |
Audit fees | | 21 | |
Trustees fees | | 5 | |
Distribution and service fees: | | | |
Service Class | | 3 | |
Other | | 2 | |
Total expenses | | 1,310 | |
| | | |
Net Investment Income | | 240 | |
| | | |
Net Realized Gain (Loss) from: | | | |
Investment securities | | 9,065 | |
| | | |
Net Increase (Decrease) in Unrealized Appreciation (Depreciation) on: | | | |
Investment securities | | 7,170 | |
| | | |
Net Realized and Unrealized Gain: | | 16,235 | |
| | | |
Net Increase In Net Assets Resulting from Operations | | $ | 16,475 | |
The notes to the financial statements are an integral part of this report.
6
Jennison Growth
STATEMENTS OF CHANGES IN NET ASSETS
For the years ended
(all amounts in thousands)
| | December 31, | | December 31, | |
| | 2007 | | 2006 | |
Increase (Decrease) in Net Assets From: | | | | | |
Operations: | | | | | |
Net investment income | | $ | 240 | | $ | 92 | |
Net realized gain from investment securities | | 9,065 | | 8,453 | |
Change in unrealized appreciation (depreciation) on investment securities | | 7,170 | | (7,694 | ) |
| | 16,475 | | 851 | |
Distributions to Shareholders: | | | | | |
From net investment income: | | | | | |
Initial Class | | (92 | ) | — | |
Service Class | | — | | — | |
| | (92 | ) | — | |
From net realized gains: | | | | | |
Initial Class | | (8,484 | ) | (12,294 | ) |
Service Class | | (59 | ) | (64 | ) |
| | (8,543 | ) | (12,358 | ) |
Capital Share Transactions: | | | | | |
Proceeds from shares sold: | | | | | |
Initial Class | | 59,204 | | 24,310 | |
Service Class | | 656 | | 551 | |
| | 59,860 | | 24,861 | |
Dividends and distributions reinvested: | | | | | |
Initial Class | | 8,576 | | 12,294 | |
Service Class | | 59 | | 64 | |
| | 8,635 | | 12,358 | |
Cost of shares redeemed: | | | | | |
Initial Class | | (58,907 | ) | (32,598 | ) |
Service Class | | (370 | ) | (201 | ) |
| | (59,277 | ) | (32,799 | ) |
| | 9,218 | | 4,420 | |
Net increase (decrease) in net assets | | 17,058 | | (7,087 | ) |
| | | | | |
Net Assets: | | | | | |
Beginning of year | | 146,012 | | 153,099 | |
End of year | | $ | 163,070 | | $ | 146,012 | |
Undistributed (Accumulated) Net Investment Income (Loss) | | $ | 240 | | $ | 92 | |
Share Activity: | | | | | |
Shares issued: | | | | | |
Initial Class | | 7,290 | | 3,052 | |
Service Class | | 80 | | 69 | |
| | 7,370 | | 3,121 | |
Shares issued-reinvested from distributions: | | | | | |
Initial Class | | 1,119 | | 1,722 | |
Service Class | | 8 | | 9 | |
| | 1,127 | | 1,731 | |
Shares redeemed: | | | | | |
Initial Class | | (7,274 | ) | (4,144 | ) |
Service Class | | (46 | ) | (25 | ) |
| | (7,320 | ) | (4,169 | ) |
Net increase (decrease) in shares outstanding: | | | | | |
Initial Class | | 1,135 | | 630 | |
Service Class | | 42 | | 53 | |
| | 1,177 | | 683 | |
The notes to the financial statements are an integral part of this report.
7
Jennison Growth
FINANCIAL HIGHLIGHTS
For a share outstanding throughout each period(a)
| | Initial Class | |
| | Year Ended December 31, | |
| | 2007 | | 2006 | | 2005 | | 2004 | | 2003 | |
Net Asset Value | | | | | | | | | | | |
Beginning of period | | $ | 7.86 | | $ | 8.55 | | $ | 8.01 | | $ | 7.34 | | $ | 5.70 | |
Investment Operations | | | | | | | | | | | |
Net investment income (loss) | | 0.01 | | 0.01 | | (0.01 | ) | 0.01 | | — | |
Net realized and unrealized gain (loss) | | 0.86 | | 0.08 | | 1.07 | | 0.66 | | 1.64 | |
Total operations | | 0.87 | | 0.09 | | 1.06 | | 0.67 | | 1.64 | |
Distributions | | | | | | | | | | | |
From net investment income | | (0.01 | ) | — | | (0.02 | ) | — | | — | |
From net realized gains | | (0.47 | ) | (0.78 | ) | (0.50 | ) | — | | — | |
Total distributions | | (0.48 | ) | (0.78 | ) | (0.52 | ) | — | | — | |
Net Asset Value | | | | | | | | | | | |
End of period(b) | | $ | 8.25 | | $ | 7.86 | | $ | 8.55 | | $ | 8.01 | | $ | 7.34 | |
Total Return(c),(d) | | 11.51 | % | 1.96 | % | 13.79 | % | 9.13 | % | 28.77 | % |
Net Assets End of Period (000’s) | | $ | 161,847 | | $ | 145,174 | | $ | 152,630 | | $ | 128,235 | | $ | 160,265 | |
Ratio and Supplemental Data | | | | | | | | | | | |
Expenses to average net assets(e) | | 0.86 | % | 0.87 | % | 0.87 | % | 0.90 | % | 0.90 | % |
Net investment income (loss), to average net
assets(e) | | 0.16 | % | 0.07 | % | (0.14 | )% | 0.19 | % | (0.04 | )% |
Portfolio turnover rate(d) | | 72 | % | 78 | % | 67 | % | 68 | % | 132 | % |
For a share outstanding throughout each period(a)
| | Service Class | |
| | Year Ended December 31, | | May 1 to Dec | |
| | 2007 | | 2006 | | 2005 | | 2004 | | 31, 2003 | |
Net Asset Value | | | | | | | | | | | |
Beginning of period | | $ | 7.79 | | $ | 8.51 | | $ | 7.98 | | $ | 7.33 | | $ | 6.04 | |
Investment Operations | | | | | | | | | | | |
Net investment income (loss) | | (0.01 | ) | (0.02 | ) | (0.03 | ) | 0.09 | | (0.02 | ) |
Net realized and unrealized gain (loss) | | 0.85 | | 0.08 | | 1.06 | | 0.56 | | 1.31 | |
Total operations | | 0.84 | | 0.06 | | 1.03 | | 0.65 | | 1.29 | |
Distributions | | | | | | | | | | | |
From net investment income | | — | | — | | — | (f) | — | | — | |
From net realized gains | | (0.47 | ) | (0.78 | ) | (0.50 | ) | — | | — | |
Total distributions | | (0.47 | ) | (0.78 | ) | (0.50 | ) | — | | — | |
Net Asset Value | | | | | | | | | | | |
End of period(b) | | $ | 8.16 | | $ | 7.79 | | $ | 8.51 | | $ | 7.98 | | $ | 7.33 | |
Total Return(c),(d) | | 11.28 | % | 1.60 | % | 13.52 | % | 8.87 | % | 21.36 | % |
Net Assets End of Period (000’s) | | $ | 1,223 | | $ | 838 | | $ | 469 | | $ | 876 | | $ | 121 | |
Ratio and Supplemental Data | | | | | | | | | | | |
Expenses to average net assets(e) | | 1.11 | % | 1.12 | % | 1.12 | % | 1.17 | % | 1.17 | % |
Net investment income (loss), to average net
assets(e) | | (0.13 | )% | (0.21 | )% | (0.41 | )% | 1.23 | % | (0.36 | )% |
Portfolio turnover rate(d) | | 72 | % | 78 | % | 67 | % | 68 | % | 132 | % |
(a) | Per share information is calculated based on average number of shares outstanding. |
(b) | Jennison Growth (the “Fund”) share class commenced operations as follows: |
| Initial Class - November 18, 1996 |
| Service Class - May 1, 2003 |
(c) | Total Return reflects all portfolio expenses and includes reinvestment of dividends and capital gains; it does not reflect the charges and deductions under the policies or annuity contracts. |
(d) | Not annualized. |
(e) | Annualized. |
(f) | Rounds to less than $(0.01) per share. |
8
Jennison Growth
NOTES TO FINANCIAL STATEMENTS
At December 31, 2007
(all amounts in thousands)
NOTE 1. ORGANIZATION AND SIGNIFICANT ACCOUNTING POLICIES
AEGON/Transamerica Series Trust, Inc. (“ATST”) is an open-end management investment company registered under the Investment Company Act of 1940, as amended (the “1940 Act”). ATST serves as a funding vehicle for variable life insurance, variable annuity and group annuity products. Jennison Growth (the “Fund”) is part of ATST.
In the normal course of business, the Fund enters into contracts that contain a variety of representations that provide general indemnifications. The Fund’s maximum exposure under these arrangements is unknown, as this would involve future claims that may be made against the Fund and/or its affiliates that have not yet occurred. However, based on experience, the Fund expects the risk of loss to be remote.
This report should be read in conjunction with the current Fund prospectus, which contains more complete information about the Fund.
In preparing the Fund’s financial statements in accordance with accounting principles generally accepted in the United States of America (“GAAP”), estimates or assumptions (which could differ from actual results) may be used that affect reported amounts and disclosures. The following is a summary of significant accounting policies followed by the Fund.
Multiple class operations, income and expenses: The Fund currently offers two classes of shares, an Initial Class and a Service Class. Income, non-class specific expenses and realized and unrealized gains and losses, are allocated daily to each class, based upon the value of shares outstanding method as permitted under Rule 18f-3 of the 1940 Act. Each class bears its own specific expenses as well as a portion of general, common expenses.
Security valuations: The Fund values its investments at the close of the New York Stock Exchange (“NYSE”), normally 4 p.m. ET, each day the NYSE is open for business. Fund investments are valued at the last sale price or closing price on the day of valuation taken from the primary exchange where the security is principally traded.
Securities traded in the over-the-counter market and listed securities for which no sale was reported on that date are valued at the last quoted bid price.
Debt securities are valued based on a price quotation or other equivalent indication of value supplied by an exchange, a pricing service or a major market maker; however, those that mature in sixty days or less are valued at amortized cost, which approximates market.
Investment company securities are valued at the net asset value of the underlying portfolio.
Securities for which quotations are not readily available are valued at fair market value as determined in good faith by the Fund’s Administrative Valuation Committee, using guidelines adopted by the Board of Trustees.
Cash: The Fund may leave cash overnight in its cash account with the custodian, State Street Bank & Trust Company (“State Street”). On July 2, 2007, State Street acquired the parent company of Investors Bank & Trust Company. State Street has been contracted on behalf of the Fund to invest the excess cash into a savings account, which at December 31, 2007 was paying an interest rate of 2.60%.
Repurchase agreements: The Fund is authorized to enter into repurchase agreements. The Fund, through its custodian, State Street, receives delivery of the underlying securities, the value of which at the time of purchase is required to be an amount equal to at least 100% of the resale price. The Fund will bear the risk of value fluctuations until the security can be sold and may encounter delays and incur costs in liquidating the security. In the event of bankruptcy or insolvency of the seller, delays and costs may be incurred.
Commission recapture: The sub-adviser, to the extent consistent with the best execution and usual commission rate policies and practices, may place security transactions of the Fund with broker/dealers with which ATST has established a Commission Recapture Program. A Commission Recapture Program is any arrangement under which a broker/dealer applies a portion of the commissions received by such broker/dealer on the security transactions to the Fund. In no event will commissions paid by the Fund be used to pay expenses that would otherwise be borne by any other funds within ATST, or by any other party.
Recaptured commissions during the year ended December 31, 2007 of $24 are included in net realized gains in the Statement of Operations.
Securities lending: The Fund may lend securities to qualified borrowers, with State Street acting as the Fund’s lending agent. The Fund earns negotiated lenders’ fees. The Fund receives cash and/or securities as collateral against the loaned securities. Cash collateral received is invested in short term, interest bearing securities. The Fund monitors the market value of securities loaned on a daily basis and requires collateral in an amount at least equal to the value of the securities loaned. Income from loaned securities earned by State Street for its services, shown in the Statement of Operations is net of fees, in the amount of $43.
The Fund has invested the cash collateral received from securities loaned in the following short-term, interest-bearing securities:
Abbey National PLC, Eurodollar Term, 5.00%, 1/7/2008 | | $ | 378 | |
ABN AMRO Bank NV, Eurodollar Term, 5.18%, 1/4/2008 | | 303 | |
Bank of Nova Scotia, Eurodollar Term, 4.96%, 1/22/2008 | | 265 | |
Barclays, Eurodollar Term, 5.00%, 2/12/2008 | | 529 | |
BNP Paribas, Eurodollar Term, 5.01%, 1/11/2008 | | 492 | |
Calyon, Eurodollar Term, 5.12%, 3/3/2008 | | 113 | |
Credit Suisse First Boston Corp., Repurchase Agreement, 4.60%, 1/2/2008 | | 983 | |
Dexia Group, Eurodollar Term, 4.82%, 1/3/2008 | | 378 | |
HBOS Halifax Bank of Scotland, Eurodollar Term, 5.15%,1/2/2008 | | 189 | |
JPMorgan Chase & Co., Eurodollar Term, 5.15%, 2/12/2008 | | 189 | |
Lloyds TSB Bank, Eurodollar Term, 5.15%, 1/24/2008 | | 378 | |
Merrill Lynch & Co. (RPG), Repurchase Agreement, 4.60%,1/2/2008 | | 567 | |
Morgan Stanley & Co. (Corp. Repo), Repurchase Agreement, 4.60%, 1/2/2008 | | 1,551 | |
Rabobank Nederland, Eurodollar Term, 5.08%, 1/10/2008 | | 454 | |
Reserve Primary Money Market Fund, 4.95%, | | 403 | |
Royal Bank of Scotland, Eurodollar Term, 5.00%, 2/25/2008 | | 454 | |
Societe Generale, Eurodollar Term, 5.15%, 3/3/2008 | | 227 | |
Toronto Dominion Bank, Eurodollar Term, 5.05%, 1/10/2008 | | 454 | |
UBS AG, Eurodollar Term, 4.92%, 1/11/2008 | | 265 | |
Wells Fargo, Bank Note, 4.75%, 1/8/2008 | | 189 | |
| | | |
| | $ | 8,761 | |
9
NOTES TO FINANCIAL STATEMENTS (continued)
At December 31, 2007
(all amounts in thousands)
NOTE 1. – (continued)
Security transactions and investment income: Security transactions are recorded on the trade date. Security gains and losses are calculated on the first-in, first-out basis. Dividend income, if any, is recorded on the ex-dividend date or, in the case of foreign securities, as soon as the Fund is informed of the ex-dividend date. Interest income, including accretion of discounts and amortization of premiums, is recorded on the accrual basis commencing on the settlement date.
Dividend distributions: Dividends and capital gains distributions are typically declared and reinvested annually and are generally paid and reinvested on the business day following the ex-date.
NOTE 2. RELATED PARTY TRANSACTIONS
ATST serves as a funding vehicle for certain affiliated asset allocation portfolios and certain affiliated separate accounts of Western Reserve Life Assurance Co. of Ohio, Transamerica Life Insurance Company, Transamerica Financial Life Insurance Company, Inc., Monumental Life Insurance Company and Transamerica Occidental Life Insurance Company.
Transamerica Fund Advisors, Inc. (“TFAI”) is the Fund’s investment adviser. Transamerica Fund Services, Inc. (“TFS”) is the Fund’s administrator and transfer agent. Prior to May 1, 2007, AFSG Securities Corp. (“AFSG”), was the Fund’s distributor. Transamerica Capital Inc. (“TCI”) is now the Fund’s distributor. TFAI, TFS, AFSG, and TCI are affiliates of AEGON NV, a Netherlands corporation.
TFAI has entered into an agreement with Jennison Associates LLC (“Jennison”) to provide investment services to the Fund.
The following schedule reflects the percentage of Fund assets owned by affiliated investment companies at December 31, 2007:
| | Net | | % of Net | |
| | Assets | | Assets | |
Asset Allocation-Conservative Portfolio | | $ | 8,528 | | 5.23 | % |
Asset Allocation-Growth Portfolio | | 44,148 | | 27.07 | |
Asset Allocation-Moderate Growth Portfolio | | 67,813 | | 41.58 | |
Asset Allocation-Moderate Portfolio | | 7,479 | | 4.59 | |
Total | | $ | 127,968 | | 78.47 | % |
Investment advisory fee: The Fund pays management fees to TFAI based on average daily net assets (“ANA”) at the following breakpoints:
0.80% of the first $250 million of ANA
0.775% of the next $250 million of ANA
0.70% of the next $500 million of ANA
0.675% of the next $500 million of ANA
0.65% of ANA over $1.5 billion
TFAI has contractually agreed to waive its advisory fee and will reimburse the Fund to the extent that operating expenses, excluding 12b-1 fees, exceed the following stated annual limit:
0.94% Expense Limit
If total Fund expenses fall below the annual expense limitation agreement agreed to by the adviser within the succeeding three years, the Fund may be required to pay the adviser a portion or all of the waived advisory fees.
There were no amounts recaptured during the year ended December 31, 2007. There are no amounts available for recapture at December 31, 2007.
Distribution and service fees: ATST entered into a Distribution Agreement with AFSG dated January 1, 1997, as amended. On May 1, 2007, the Distribution Agreement was amended to replace AFSG with TCI as the Fund’s distributor. The Fund has also adopted a distribution plan (“Distribution Plan”) pursuant to Rule 12b-1 under the 1940 Act.
Under the Distribution Plan for the Initial Class shares, TCI, on behalf of the Fund, is authorized to pay various service providers, as direct payment for expenses incurred in connection with distribution of the Fund’s shares, amounts equal to actual expenses associated with distributing the shares.
The Distribution Plan for the Service Class shares requires ATST to pay distribution fees to TCI as compensation for its activities, not as reimbursement for specific expenses. The fee on the Service Class is paid to the insurance companies for providing services and account maintenance for their policyholders who invest in the variable insurance products which invest in the Service Class shares.
The Fund is authorized under the Distribution Plan to pay fees on each class up to the following limits:
Initial Class | | 0.15 | % |
Service Class | | 0.25 | % |
TCI has determined that it will not seek payment by the Fund of the distribution expenses incurred with respect to the Initial Class shares before April 30, 2009. Prior to TCI seeking reimbursement of future expenses, policy and contract owners will be notified in advance. The Fund will pay fees relating to Service Class shares.
Administrative services: The Fund has entered into an agreement with TFS for financial and legal fund administration services. The Fund pays TFS an annual fee of 0.02% of ANA. The Legal fees on the Statement of Operations are for fees paid to external legal counsel.
10
NOTES TO FINANCIAL STATEMENTS (continued)
At December 31, 2007
(all amounts in thousands)
NOTE 2. – (continued)
Deferred compensation plan: Each eligible independent Fund Trustee may elect participation in a non-qualified deferred compensation plan (“the Plan”). Under the Plan, such Trustees may defer payment of all or a portion of their total fees earned as a Fund Trustee. Each Trustee who is a participant in the Plan may elect that the earnings, losses or gains credited to his or her deferred fee amounts be determined based on a deemed investment in any series of Transamerica IDEX Mutual Funds. The right of a participant to receive a distribution from the Plan of the deferred fees is an unsecured claim against the general assets of all series of Transamerica IDEX Mutual Funds. The pro rata liability to the Fund of all deferred fees in the Plan amounted, as of December 31, 2007, to $8. Amounts deferred under the Plan are unfunded against the general assets of ATST.
Retirement plan: Under a retirement plan (the “Emeritus Plan”) available to the Independent Trustees, each Independent Trustee is deemed to have elected to serve as Trustee Emeritus of ATST upon his or her termination of service, other than removal for cause, is entitled to 50% of the trustee’s current retainer for a maximum period of five years determined by his or her years of service as a Trustee.
Such amounts shall be accrued by ATST on a pro rata basis allocable to each series of ATST fund based on the relative assets of the series. If retainers increase in the future, past accruals (and credits) will be adjusted upward so that 50% of the Trustee’s current retainer is accrued and credited at all times. Upon death, disability or termination of service, other than removal for cause, amounts deferred become payable to a Trustee Emeritus (or his/her beneficiary). Upon the commencement of service as Trustee Emeritus, compensation will be paid on a quarterly basis during the time period that the Trustee Emeritus is allowed to serve as such.
Amounts accrued under the Emeritus Plans are unsecured claims against the general assets of ATST. For the year ended December 31, 2007, the amount related to the Emeritus Plan was $6. As of December 31, 2007, the Fund has not made any payments related to the Emeritus Plan.
The Emeritus Plan was terminated effective October 30, 2007. Upon the termination, the Fund shall continue to pay any remaining benefits in accordance with the Plan, but no further compensation shall accrue under the Plan.
NOTE 3. INVESTMENT TRANSACTIONS
The cost of securities purchased and proceeds from securities sold (excluding short-term securities) for the year ended December 31, 2007 were as follows:
Purchases of securities: | | | |
Long-term | | $ | 110,216 | |
U.S. Government | | — | |
Proceeds from maturities and sales of securities: | | | |
Long-term | | 108,752 | |
U.S. Government | | — | |
| | | | |
NOTE 4. FEDERAL INCOME TAX MATTERS
The Fund has not made any provision for federal income or excise taxes due to its policy to distribute all of its taxable income and capital gains to its shareholders and otherwise qualify as a regulated investment company under Subchapter M of the Internal Revenue Code. Income and capital gain distributions are determined in accordance with income tax regulations, which may differ from GAAP. These differences are primarily due to differing treatment for items including, but not limited to, wash sales.
The tax character of distributions paid may differ from the character of distributions shown in the Statements of Changes in Net Assets due to short-term gains being treated as ordinary income for tax purposes. The tax character of distributions paid during 2006 and 2007 was as follows:
2006 Distributions paid from: | | | |
Ordinary Income | | $ | 789 | |
Long-term Capital Gain | | 11,569 | |
| | | |
2007 Distributions paid from: | | | |
Ordinary Income | | 93 | |
Long-term Capital Gain | | 8,542 | |
| | | | |
The tax basis components of distributable earnings as of year ended December 31, 2007 are as follows:
Undistributed Ordinary Income | | $ | 233 | |
Undistributed Long-term Capital Gain | | $ | 8,898 | |
Capital Loss Carryforward | | $ | — | |
Post October Capital Loss Deferral | | $ | — | |
Post October Currency Loss Deferral | | $ | — | |
Net Unrealized Appreciation (Depreciation) | | $ | 25,663 | |
11
NOTES TO FINANCIAL STATEMENTS (continued)
At December 31, 2007
(all amounts in thousands)
NOTE 5. REGULATORY PROCEEDINGS
There continues to be significant federal and state regulatory activity relating to financial services companies, particularly mutual fund companies and their investment advisers. As part of an ongoing investigation regarding potential market timing, recordkeeping and trading compliance issues and matters affecting the Fund’s investment adviser, TFAI, and certain affiliates and former employees of TFAI, the SEC staff has indicated that it is likely to take some action against TFAI and certain of its affiliates at the conclusion of the investigation. The potential timing and the scope of any such action is difficult to predict. Although the impact of any action brought against TFAI and/or its affiliates is difficult to assess at the present time, the Fund currently believes that the likelihood that any such action will have a material adverse impact is remote. It is important to note that the Fund is not aware of any allegation of wrongdoing against it and its Board at the time this annual report is printed. Although it is not anticipated that these developments will have an adverse impact on the Fund, there can be no assurance at this time. TFAI and its affiliates are actively working with the SEC in regard to this matter; however, the exact resolution cannot be determined at this time. TFAI will take such actions that it deems necessary or appropriate to continue providing management services to the Fund and to bring all matters to an appropriate conclusion.
TFAI and/or its affiliates, and not the Fund, will bear the costs regarding these regulatory matters.
NOTE 6. RECENTLY ISSUED ACCOUNTING PRONOUNCEMENTS
In July 2006, the Financial Accounting Standards Board (“FASB”) released FASB Interpretation No. 48 “Accounting for Uncertainty in Income Taxes” (“FIN 48”), an interpretation of FASB Statement No. 109. FIN 48 provides guidance for how uncertain tax positions should be recognized, measured, presented and disclosed in the financial statements. FIN 48 requires the accounting and disclosure of tax positions taken or expected to be taken in the course of preparing the Fund’s tax returns to determine whether the tax positions are “more-likely-than-not” of being sustained by the applicable tax authority. Tax positions not deemed to meet the more-likely-than-not threshold would be recorded as a tax benefit or expense in the current year.
Adoption of FIN 48 is effective during the first required financial reporting period for fiscal years beginning after December 15, 2006. Management adopted FIN 48 on June 29, 2007.
Implementation of FIN 48 requires Management of the Fund to analyze all open tax years, as defined by the Statute of Limitations, for all major jurisdictions, which includes federal and certain states. Open tax years are those that are open for exam by taxing authorities (i.e., the last 4 tax year ends and the interim tax period since then). The Fund has no examinations in progress and none are expected at this time.
Management of the Fund has reviewed all open tax years and major jurisdictions and concluded the adoption of FIN 48 resulted in no impact to the Fund’s net assets or results of operations. There is no tax liability resulting from unrecognized tax benefits relating to uncertain income tax positions taken or expected to be taken in future tax returns. The Fund is also not aware of any tax positions for which it is reasonably possible that the total amounts of unrecognized tax benefits will significantly change in the next 12 months.
In September 2006, FASB issued its new Standard No. 157, “Fair Value Measurements” (“FAS 157”). FAS 157 is designed to unify guidance for the measurement of fair value of all types of assets, including financial instruments, and certain liabilities, throughout a number of accounting standards. FAS 157 also establishes a hierarchy for measuring fair value in generally accepted accounting principles and expands financial statement disclosures about fair value measurements that are relevant to mutual funds. FAS 157 is effective for financial statements issued for fiscal years beginning after November 15, 2007, and earlier application is permitted.
As of December 31, 2007, Management does not expect the adoption of FAS 157 to impact the amounts reported in the financial statements, however, additional disclosures will be required about the inputs used to develop the measurements of fair value and the effect of certain of the measurements reported in the statement of operations for a fiscal period.
NOTE 7. SUBSEQUENT EVENT
Effective January 1, 2008, TFAI changed its name to Transamerica Asset Management, Inc.
Effective May 1, 2008, AEGON/Transamerica Series Trust will change its name to Transamerica Series Trust. At that time, the Fund will also change its name to Transamerica Jennison Growth VP.
12
Report of Independent Registered Certified Public Accounting Firm
To the Board of Trustees and Shareholders of
Jennison Growth:
In our opinion, the accompanying statement of assets and liabilities, including the schedule of investments, and the related statements of operations and of changes in net assets and the financial highlights present fairly, in all material respects, the financial position of Jennison Growth (the “Fund”) (one of the portfolios constituting AEGON/Transamerica Series Trust) at December 31, 2007, the results of its operations for the year then ended, the changes in its net assets for each of the two years in the period then ended and the financial highlights for each of the periods presented, in conformity with accounting principles generally accepted in the United States of America. These financial statements and financial highlights (hereafter referred to as “financial statements”) are the responsibility of the Fund’s management; our responsibility is to express an opinion on these financial statements based on our audits. We conducted our audits of these financial statements in accordance with the standards of the Public Company Accounting Oversight Board (United States). Those standards require that we plan and perform the audit to obtain reasonable assurance about whether the financial statements are free of material misstatement. An audit includes examining, on a test basis, evidence supporting the amounts and disclosures in the financial statements, assessing the accounting principles used and significant estimates made by management, and evaluating the overall financial statement presentation. We believe that our audits, which included confirmation of securities at December 31, 2007 by correspondence with the custodian and brokers, provide a reasonable basis for our opinion.

Tampa, Florida
February 29, 2008
13
Jennison Growth
SUPPLEMENTAL TAX INFORMATION (unaudited)
(all amounts in thousands)
For tax purposes, the Fund has made a Long-Term Capital Gain Designation of $8,542 for the year ended December 31, 2007.
RESULTS OF SHAREHOLDER PROXY (unaudited)
At a special meeting of shareholders held on October 30, 2007, the results of the Proposals were as follows:
Proposal 1: To elect a new Board:
Proposed | | | | | | Abstentions/Broker Non- | |
Trustee | | For | | Against | | Votes | |
John K. Carter | | 2,274,998,840.817 | | 57,804,698.755 | | 35,433.883 | |
| | | | | | | |
Leo J. Hill | | 2,277,212,702.754 | | 55,590,836.819 | | 35,433.883 | |
| | | | | | | |
Neal M. Jewell | | 2,266,793,295.663 | | 66,010,243.909 | | 35,433.883 | |
| | | | | | | |
Russell A. Kimball, Jr. | | 2,274,825,235.835 | | 57,978,303.737 | | 35,433.883 | |
| | | | | | | |
Eugene M. Mannella | | 2,274,623,165.033 | | 58,180,374.539 | | 35,433.883 | |
| | | | | | | |
Norm R. Nielsen | | 2,275,050,055.885 | | 57,753,483.687 | | 35,433.883 | |
| | | | | | | |
Joyce Galpern Norden | | 2,270,278,122.250 | | 62,525,417.323 | | 35,433.883 | |
| | | | | | | |
Patricia L. Sawyer | | 2,275,737,737.456 | | 57,065,802.116 | | 35,433.883 | |
| | | | | | | |
John W. Waechter | | 2,276,615,120.140 | | 56,188,419.433 | | 35,433.883 | |
Proposal 2: To approve an amendment to the Agreement and Declaration of Trust:
| | | | Abstentions/Broker Non- | |
For | | Against | | Votes | |
2,182,022,669.110 | | 77,590,048.544 | | 73,226,255.801 | |
14
Jennison Growth
INVESTMENT ADVISORY AND SUB-ADVISORY AGREEMENTS-REVIEW AND RENEWAL (unaudited)
At a meeting of the Board of Trustees of AEGON/Transamerica Series Trust (“ATST”) held on December 4th, 2007, the Board reviewed and considered the renewal of the investment advisory agreement (the “Investment Advisory Agreement”) between Jennison Growth (the “Fund”) and Transamerica Fund Advisors, Inc. (“TFAI”), as well as the renewal of the investment sub-advisory agreement (the “Sub-Advisory Agreement”) of the Fund between TFAI and Jennison Associates LLC (the “Sub-Adviser”), to determine whether the agreements should be renewed for a six-month period. It was noted that this review was interim in nature to align all the Funds on the same calendar, and that the Funds’ advisory arrangements would be reviewed again in the first half of 2008.
Following their review and consideration, the Trustees determined that the renewal of the Investment Advisory Agreement and the Sub-Advisory Agreement would enable shareholders of the Fund to obtain high quality services at a cost that is appropriate, fair, and in the best interests of its shareholders. The Board, including the independent members of the Board, unanimously approved the renewal of the Investment Advisory Agreement and Sub-Advisory Agreement. In reaching their decision, the Trustees requested and obtained from TFAI and the Sub-Adviser such information as they deemed reasonably necessary to evaluate the agreements, including information about fees and performance of comparable funds managed by the Sub-Adviser. The Trustees also carefully considered information they had previously received from TFAI and the Sub-Adviser throughout the year as part of their regular oversight of the Fund, as well as comparative fee, expense, and performance information prepared by Lipper Inc. (“Lipper”), an independent provider of mutual fund performance, fee and expense information and profitability data prepared by management. In considering the proposed continuation of the Investment Advisory and Sub-Advisory Agreements, the Trustees evaluated a number of considerations that they believed, in light of the legal advice furnished to them by independent legal counsel and their own business judgment, to be relevant. They based their decisions on a variety of factors, including the following considerations, among others, although they did not identify any consideration or particular information that was controlling of their decisions:
The nature, extent and quality of the advisory services to be provided. The Board considered the nature and quality of the services provided by TFAI and the Sub-Adviser to the Fund in the past, as well as the services anticipated to be provided in the future. The Board concluded that TFAI and the Sub-Adviser are capable of providing high quality services to the Fund, as indicated by the nature and quality of services provided in the past by TFAI and the Sub-Adviser for this series and the experience, capability and integrity of TFAI’s senior management, the financial resources of TFAI and the Sub-Adviser, TFAI’s management oversight process and the professional qualifications of the portfolio management team of the Sub-Adviser. The Trustees determined that TFAI and the Sub-Adviser can provide investment and related services that are appropriate in scope and extent in light of the Fund’s operations, the competitive landscape of the investment company business and investor needs.
The investment performance of the Fund. The Board examined the short and longer-term performance of the Fund, including relative performance against a peer universe of comparable mutual funds as prepared by Lipper for various trailing periods ended June 30, 2007. The Board noted that performance has been near or below median for 1-, 3- and 5-year periods, but that the near-term performance has been below median due in part to the aggressive strategy employed by the Fund. On the basis of the Board’s assessment of the nature, extent and quality of advisory services to be provided or procured by TFAI and the Sub-Adviser, the Board concluded that TFAI and the Sub-Adviser are capable of providing a level of investment performance that is appropriate in light of the Fund’s proposed investment objectives, policies and strategies and competitive with other similarly situated investment companies, but the Board noted that they would be monitoring performance closely.
The cost of advisory services provided and the level of profitability. The Board reviewed profitability information of TFAI’s cost of procuring fund management services, as well as the costs of provision of administration, fund accounting and other services, to the Fund and to ATST as a whole by TFAI and its affiliates. The Board reviewed the management and sub-advisory fees for the Fund noting that they were above median relative to the Fund’s peer group and universe. However based on their review, the Trustees determined that the management fees of the Fund generally are appropriate in light of the services expected to be provided or procured, the management fees and the anticipated profitability of the relationship between the Fund, TFAI and its affiliates, and the Sub-Adviser. In making these observations and determinations, the Board reviewed, among other things, comparative information provided by Lipper.
Whether fee levels reflect economies of scale and the extent to which economies of scale would be realized as the Fund grows. In evaluating the extent to which the management fees payable under the Investment Advisory and Sub-Advisory Agreements reflect economies of scale or will permit economies of scale to be realized in the future, the Board noted that TFAI and the Sub-Adviser offer breakpoints which appropriately benefit investors by passing on economies of scale in the form of lower management fees as the level of assets grows. The Trustees also concluded that they will have the opportunity to periodically reexamine whether the Fund has achieved economies of scale, and the appropriateness of management fees payable to TFAI and fees paid to the Sub-Adviser, in the future.
Benefits (such as soft dollars) to TFAI, its affiliates, or the Sub-Adviser from their relationship with the Fund. The Board concluded that other benefits anticipated to be derived by TFAI, its affiliates, and the Sub-Adviser from their relationships with the Fund are expected to be reasonable and fair, and consistent with industry practice and the best interests of the Fund and its shareholders. The Trustees noted that TFAI would not realize soft dollar benefits from its relationship with the Fund, and that the Sub-Adviser’s soft dollar trading is consistent with applicable law, including best execution requirements in particular. The Board also noted that the Sub-Adviser is participating in a brokerage program pursuant to which a portion of brokerage commissions paid by the Fund is recaptured for the benefit of the Fund and its shareholders, thus limiting the amount of soft dollar arrangements the Sub-Adviser may engage in with respect to the Fund’s brokerage transactions.
15
Other considerations. The Board determined that TFAI has made a substantial commitment to the recruitment and retention of high quality personnel, and maintains the financial, compliance and operational resources reasonably necessary to manage the Fund in a professional manner that is consistent with the best interests of the Fund and its shareholders. In this regard, the Trustees favorably considered the procedures and policies in place by TFAI to enforce compliance with applicable laws and regulations and oversee the portfolio management activities of the Sub-Adviser. The Trustees also determined that TFAI has made a significant entrepreneurial commitment to the management and success of the Fund, reflected by TFAI’s expense limitation and fee waiver arrangements with the Fund which may result in TFAI waiving a substantial amount of management fees for the benefit of shareholders.
16
JPMorgan Core Bond
MARKET ENVIRONMENT
The fiscal year began with the federal funds rate at 5.25%, which the Federal Reserve Board (“Fed”) left unchanged at its March 21st meeting. However, the Fed neutralized its inflation bias, noting the more serious threat may be to future economic growth stemming from weaknesses in the sub-prime mortgage market and sluggish capital spending. By the end of the second quarter, market volatility picked up, as the re-rating of U.S. growth prospects pushed Treasury yields sharply higher. Additionally, significant losses for two Bear Stearns structured credit hedge funds led to jitters regarding credit quality in the leveraged and sub-investment-grade loan markets.
By the third quarter, fears that originated in the sub-prime mortgage market expanded rapidly across all markets, causing spreads to widen precipitously and liquidity to shrink rapidly, regardless of underlying fundamentals. The Fed reacted, implementing a larger-than-expected 50-basis-point (“bp”) rate cut in September. The fourth quarter was the weakest of a volatile 2007, as candid loss disclosures by major financial institutions led to renewed risk aversion through year-end. The Fed eventually reverted to 25-bp moves (one each in October and December) in both the fed funds and discount rates. Nevertheless, the Fed revealed in the post-meeting press conference that a rate hike had been discussed, given a stronger-than-expected inflation outlook. December’s announcement of a U.S. government plan to slow the pace of rising foreclosures by freezing resets on adjustable-rate sub- prime mortgages had a limited impact on investor sentiment.
The U.S. Treasury curve steepened throughout the year, as the two- to ten-year spread ended the year 109 bps higher than it was at the beginning of 2007. The two-year Treasury yield fell 176 bps to 3.05% during the year, while the 10-year yield fell 68 bps to 4.03%.
PERFORMANCE
For the year ended December 31, 2007, JPMorgan Core Bond, Initial Class returned 6.94%. By comparison its primary and secondary benchmarks, the Lehman Brothers Aggregate Bond Index and the Lehman Brothers U.S. Government/Credit Index, returned 6.97% and 7.23%, respectively. Effective May 1, 2007, AEGON Bond was renamed JPMorgan Core Bond.
STRATEGY REVIEW
The portfolio remained overweight in seasoned AAA-rated mortgage-backed securities (“MBS”) and showed better convexity than the benchmark, with most of the portfolio’s exposure in seasoned collateralized mortgage obligations. Sub-prime exposure in the portfolio was minimal, at less than 0.05% as of year-end. We have avoided the sub-prime sector since 2005, when we became concerned about increased layers of risk on collateral and observed deteriorating underwriting standards.
In a reversal from 2006, all major bond market sectors posted negative excess returns relative to comparable-duration Treasuries during 2007. In the investment-grade arena, corporate issues and asset-backed securities were the worst performers.
Our sector allocations changed minimally throughout the year. We remained overweight in mortgage securities, including commercial mortgage-backed securities, and underweight in agency debentures and corporate bonds. Our sector allocation positively affected performance.
In an environment marked by a flight to quality and significant spread widening, we maintained a defensive credit posture, continuing to overweight the “Aaa” segment and underweight the “Baa” area. This contributed positively to performance. We continued to overweight securities with maturities of one year and less and underweight securities with maturities of 20 years and longer. Additionally, we maintained our overweight in the three- to seven-year range. Throughout the year, our duration remained neutral to slightly long relative to the benchmark.
Douglas S. Swanson
Portfolio Manager
JPMorgan Investment Advisors Inc.
1
JPMorgan Core Bond
(unaudited)
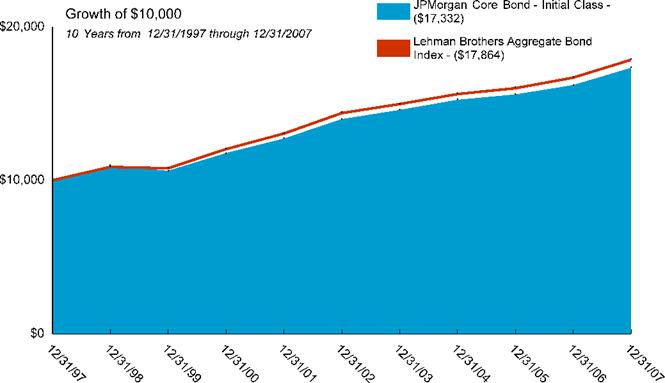
Average Annual Total Return for Periods Ended 12/31/2007
| | 1 Year | | 5 Years | | 10 Years | | From
Inception | | Inception
Date | |
| | | | | | | | | | | |
Initial Class | | 6.94 | % | 4.38 | % | 5.65 | % | 6.77 | % | 10/2/86 | |
Lehman Brothers Aggregate Bond Index(1) | | 6.97 | % | 4.42 | % | 5.97 | % | 7.40 | % | 10/2/86 | |
Lehman Government/Credit Bond Index(1) | | 7.23 | % | 4.44 | % | 6.01 | % | 7.37 | % | 10/2/86 | |
| | | | | | | | | | | |
Service Class | | 6.61 | % | – | % | – | % | 3.93 | % | 5/1/03 | |
NOTES
(1) The Lehman Brothers Aggregate Bond (LBAB) Index and Lehman Brothers U.S. Government/Credit (LBGC) Index are unmanaged indices used as a general measure of market performance. Calculations assume dividends and capital gains are reinvested and do not include any managerial expenses. From inception, calculation is based on life of Initial Class shares.
The performance data presented represents past performance; future results may vary. The portfolio’s investment return and net asset value will fluctuate. Past performance does not guarantee future results. Investor’s units when redeemed may be worth more or less than their original cost.
Current performance may be lower or higher than performance quoted. Please visit your insurance company’s website for contract or policy level standardized total returns current to the most recent month end. Portfolio performance is net of investment fees and fund expenses, but not product charges, which, if included, would significantly lower the performance quoted.
This material must be preceded or accompanied by a current prospectus, which includes specific contents regarding the investment objectives, explanation of share classes and policies of this portfolio.
2
JPMorgan Core Bond
UNDERSTANDING YOUR FUND’S EXPENSES
(unaudited)
SHAREHOLDER EXPENSES
Fund shareholders may incur ongoing costs, including management and advisory fees, distribution and service fees, and other fund expenses.
The following Example is intended to help you understand your ongoing costs (in dollars and cents) of investing in the Fund and to compare these costs with the ongoing costs of investing in other funds.
The Example is based on an investment of $1,000 invested at July 1, 2007 and held for the entire period until December 31, 2007.
ACTUAL EXPENSES
The first line in the table below provides information about actual account values and actual expenses. You may use the information in this line, together with the amount you invested, to estimate the expenses that you paid over the period. Simply divide your account value by $1,000 (for example, an $8,600 account value divided by $1,000 = 8.6), then multiply the result by the number in the first line of your Fund under the heading entitled “Expenses Paid During Period” to estimate the expenses you paid on your account during this period. If your account is an IRA, your expenses could have included a $15 annual fee. The amount of any fee paid through your account would increase the estimate of expenses you paid during the period and decrease your ending account value.
HYPOTHETICAL EXAMPLE FOR COMPARISON PURPOSES
The second line in the table below provides information about hypothetical account values and hypothetical expenses based on the Fund’s actual expense ratio and an assumed rate of return of 5% per year before expenses, which is not the Fund’s actual return. The hypothetical account values and expenses may not be used to estimate the actual ending account balance or expenses you paid for the period. You may use this information to compare the ongoing costs of investing in your Fund and other funds. To do so, compare this 5% hypothetical example with the 5% hypothetical examples that appear in the shareholder reports of the other funds.
Please note that the expenses shown in the table are meant to highlight your ongoing costs only and do not reflect any transactional costs, such as sales charges, redemption fees, brokerage commissions paid on purchases and sales of fund shares. Therefore, the second line under the Fund in the table is useful in comparing ongoing costs only, and will not help you determine the relative total costs of owning different funds. If any of these transaction costs were included, your costs would be higher. The expenses shown in the table do not reflect any fees that may be charged to you by brokers, financial intermediaries or other financial institutions.
| | Beginning
Account
Value | | Ending
Account
Value | | Annualized
Expense
Ratio | | Expenses
Paid During
Period (a) | |
| | | | | | | | | |
Initial Class | | | | | | | | | |
Actual | | $ | 1,000.00 | | $ | 1,058.53 | | 0.57 | % | $ | 2.96 | |
Hypothetical (b) | | 1,000.00 | | 1,022.33 | | 0.57 | | 2.91 | |
| | | | | | | | | |
Service Class | | | | | | | | | |
Actual | | 1,000.00 | | 1,057.49 | | 0.82 | | 4.25 | |
Hypothetical (b) | | 1,000.00 | | 1,021.07 | | 0.82 | | 4.18 | |
| | | | | | | | | | | | |
(a) Expenses are calculated using the Fund’s annualized expense ratio (as disclosed in the table), multiplied by the average account value for the period, multiplied by the number of days in the period (184 days), and divided by the number of days in the year (365 days).
(b) 5% return per year before expenses.
GRAPHICAL PRESENTATION OF SCHEDULE OF INVESTMENTS
By Bond Type
At December 31, 2007
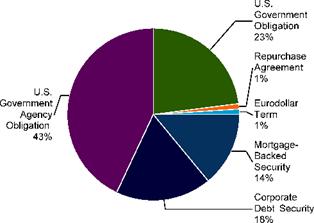
This chart shows the percentage breakdown by bond type of the Fund’s total investment securities.
3
JPMorgan Core Bond
SCHEDULE OF INVESTMENTS
At December 31, 2007
(all amounts except share amounts in thousands)
| | Principal | | Value | |
U.S. GOVERNMENT OBLIGATIONS (23.3%) | | | | | |
U.S. Government Obiligation (23.3%) | | | | | |
U.S. Treasury Bond | | | | | |
6.25%, due 08/15/2023 | | $ | 5,000 | | $ | 5,986 | |
6.50%, due 11/15/2026 | | 1,500 | | 1,877 | |
7.25%, due 05/15/2016 – 08/15/2022 | | 2,300 | | 2,849 | |
7.50%, due 11/15/2016 | | 2,750 | | 3,452 | |
7.63%, due 02/15/2025 | | 1,125 | | 1,542 | |
11.75%, due 11/15/2014 ^ | | 2,500 | | 2,886 | |
U.S. Treasury Note | | | | | |
6.50%, due 02/15/2010 | | 585 | | 626 | |
U.S. Treasury STRIPS U.S. Treasury , | | | | | |
Zero Coupon, | | 22,425 | | 16,678 | |
due 02/15/2010 – 02/15/2023 | | | | | |
Total U.S. Government Obligations (cost $32,568) | | | | 35,896 | |
| | | | | |
U.S. GOVERNMENT AGENCY OBLIGATIONS (42.6%) | | | | | |
U.S. Government Agency Obligation | | | | | |
Banc of America Funding Corp. | | | | | |
0.00%, due 03/25/2034 – 11/25/2035 1 | | 408 | | 274 | |
Countrywide Alternative Loan Trust | | | | | |
0.00%, due 10/25/2033 1 | | 181 | | 141 | |
Fannie Mae | | | | | |
0.00%, due 12/25/2033 – 11/25/2036 1 | | 1,944 | | 1,403 | |
0.93%, due 07/25/2036 | | 167 | | 127 | |
1.29%, due 08/25/2033 * | | 221 | | 155 | |
1.90%, due 03/25/2034 * | | 165 | | 125 | |
2.17%, due 07/25/2033 * | | 291 | | 234 | |
4.00%, due 07/01/2018 – 04/25/2033 | | 1,334 | | 1,211 | |
4.50%, due 03/01/2019 – 04/01/2019 | | 2,239 | | 2,202 | |
4.53%, due 09/25/2033 * | | 127 | | 120 | |
4.83%, due 01/01/2035 * | | 252 | | 254 | |
4.87%, due 05/25/2034 * | | 90 | | 91 | |
5.00%, due 11/25/2015 – 12/01/2016 | | 1,668 | | 1,672 | |
5.50%, due 06/01/2012 – 12/25/2035 | | 3,736 | | 3,765 | |
5.71%, due 12/25/2032 * | | 148 | | 151 | |
5.75%, due 06/25/2033 | | 750 | | 746 | |
6.00%, due 03/25/2016 – 03/01/2033 | | 1,161 | | 1,186 | |
6.37%, due 04/25/2034 – 05/25/2034 * | | 836 | | 878 | |
6.50%, due 04/01/2008 – 12/25/2042 | | 2,922 | | 3,017 | |
7.00%, due 01/25/2008 – 11/25/2031 | | 2,498 | | 2,598 | |
7.17%, due 10/25/2008 * | | 23 | | 24 | |
7.50%, due 01/01/2008 – 12/25/2042 | | 187 | | 197 | |
8.00%, due 07/01/2009 | | 82 | | 84 | |
9.00%, due 10/01/2019 – 06/01/2025 | | 167 | | 181 | |
9.50%, due 06/25/2018 | | 200 | | 221 | |
9.64%, due 02/25/2032 * | | 71 | | 81 | |
10.00%, due 03/25/2032 * | | 51 | | 57 | |
Fannie Mae , STRIPS | | | | | |
0.00%, due 01/01/2033 – 09/01/2033 1 | | 282 | | 210 | |
Freddie Mac | | | | | |
0.00%, due 02/15/2029 – 07/15/2036 1 | | 2,298 | | 1,675 | |
2.02%, due 10/15/2033 – 11/15/2033 * | | 292 | | 216 | |
2.10%, due 01/15/2034 – 04/15/2034 * | | $ | 890 | | $ | 595 | |
2.35%, due 02/15/2033 * 2 | | 1,292 | | 72 | |
2.45%, due 03/15/2033 * 2 | | 1,498 | | 106 | |
2.70%, due 02/15/2034 * | | 75 | | 57 | |
2.90%, due 02/15/2033 * 2 | | 909 | | 60 | |
3.05%, due 07/15/2017 * 2 | | 957 | | 69 | |
3.07%, due 10/15/2015 * | | 698 | | 661 | |
3.08%, due 11/15/2035 * | | 60 | | 63 | |
3.35%, due 03/15/2032 * 2 | | 264 | | 26 | |
4.00%, due 05/01/2019 – 03/15/2032 | | 1,806 | | 1,726 | |
4.13%, due 07/12/2010 | | 573 | | 580 | |
4.90%, due 05/15/2030 * | | 261 | | 252 | |
5.00%, due 07/15/2014 – 05/15/2023 | | 782 | | 778 | |
5.50%, due 02/15/2009 – 12/15/2022 | | 3,444 | | 3,489 | |
5.68%, due 11/01/2036 * | | 440 | | 444 | |
5.75%, due 01/15/2012 | | 200 | | 214 | |
6.00%, due 02/15/2013 – 02/15/2033 | | 5,653 | | 5,758 | |
6.38%, due 03/15/2032 | | 769 | | 799 | |
6.50%, due 10/15/2013 – 02/25/2043 | | 4,047 | | 4,213 | |
7.00%, due 03/15/2024 – 02/25/2043 | | 5,950 | | 6,254 | |
7.25%, due 09/15/2030 – 12/15/2030 | | 1,141 | | 1,154 | |
7.50%, due 02/15/2023 – 08/25/2042 | | 1,399 | | 1,449 | |
8.00%, due 01/15/2030 | | 763 | | 801 | |
8.50%, due 09/15/2020 | | 210 | | 228 | |
Ginnie Mae | | | | | |
0.00%, due 03/16/2033 – 06/16/2033 1 | | 237 | | 184 | |
3.29%, due 04/16/2032 * 2 | | 425 | | 42 | |
5.50%, due 12/20/2013 – 01/20/2032 2 | | 978 | | 679 | |
6.50%, due 03/15/2023 – 06/20/2033 | | 8,110 | | 8,465 | |
6.85%, due 04/16/2034 * | | 88 | | 93 | |
7.00%, due 07/15/2017 – 10/20/2031 | | 609 | | 636 | |
7.33%, due 11/20/2030 | | 72 | | 76 | |
7.50%, due 09/15/2009 – 09/20/2030 | | 552 | | 574 | |
8.00%, due 01/15/2016 – 06/20/2030 | | 370 | | 394 | |
8.50%, due 02/16/2030 | | 804 | | 884 | |
9.00%, due 05/16/2027 | | 54 | | 58 | |
11.96%, due 04/20/2031 * | | 58 | | 65 | |
WAMU Mortgage Pass-Through | | | | | |
0.00%, due 11/25/2017 1 | | 271 | | 243 | |
Washington Mutual MSC Mortgage | | | | | |
0.00%, due 03/25/2033 1 | | 195 | | 151 | |
| | | | | |
Total U.S. Government Agency
Obligations (cost $66,980) | | | | 65,688 | |
| | | | | |
SOVEREIGN GOVERNMENT OBLIGATIONS (0.4%) | | | | | |
Sovereign Government Obligation (0.4%) | | | | | |
United Mexican States | | | | | |
6.38%, due 01/16/2013 | | 75 | | 80 | |
The notes to the financial statements are an integral part of this report.
4
| | Principal | | Value | |
Sovereign Government Obligation (continued) | | | | | |
United Mexican States (continued) | | | | | |
7.50%, due 04/08/2033 | | $ | 400 | | $ | 477 | |
| | | | | |
Total Sovereign Government Obligations (cost $469) | | | | 557 | |
| | | | | |
MORTGAGE-BACKED SECURITIES (13.5%) | | | | | |
Banc of America Commercial Mortgage, Inc. | | | | | |
Series 2005-6, Class ASB | | | | | |
5.35%, due 09/10/2047 | | 150 | | 150 | |
Banc of America Funding Corp. | | | | | |
Series 2005-8, Class 30PO | | | | | |
0.00%, due 01/25/2036 1 | | 91 | | 59 | |
Banc of America Mortgage Securities, Inc. | | | | | |
Series 2004-E, Class 2A5 | | | | | |
4.11%, due 06/25/2034 * | | 400 | | 393 | |
Bear Stearns Adjustable Rate Mortgage Trust | | | | | |
Series 2006-1, Class A1 | | | | | |
4.63%, due 02/25/2036 * | | 499 | | 491 | |
Bear Stearns Commercial Mortgage Securities | | | | | |
Series 2000-WF1, Class A1 | | | | | |
7.64%, due 02/15/2032 | | 33 | | 33 | |
Citibank Credit Card Issuance Trust | | | | | |
Series 2005-B1, Class B1 | | | | | |
4.40%, due 09/15/2010 | | 150 | | 150 | |
Commercial Mortgage Pass Through Certificates | | | | | |
Series 2001-J2A, Class B-144A | | | | | |
6.30%, due 07/16/2034 | | 4,000 | | 4,197 | |
Countrywide Alternative Loan Trust | | | | | |
Series 2004-2CB, Class 1A9 | | | | | |
5.75%, due 03/25/2034 | | 313 | | 285 | |
Countrywide Alternative Loan Trust | | | | | |
Series 2005-22T1, Class A2 | | | | | |
0.28%, due 06/25/2035 * 2 | | 3,126 | | 43 | |
Countrywide Alternative Loan Trust | | | | | |
Series 2005-26CB, Class A10 | | | | | |
4.37%, due 07/25/2035 * | | 108 | | 107 | |
Countrywide Alternative Loan Trust | | | | | |
Series 2005-28CB, Class 1A4 | | | | | |
5.50%, due 08/25/2035 | | 500 | | 472 | |
Countrywide Alternative Loan Trust | | | | | |
Series 2005-54CB, Class 1A11 | | | | | |
5.50%, due 11/25/2035 | | 200 | | 186 | |
Countrywide Alternative Loan Trust | | | | | |
Series 2005-J1, Class 1A4 | | | | | |
0.31%, due 02/25/2035 * 2 | | 1,671 | | 25 | |
Countrywide Home Loan Mortgage Pass-Through Trust | | | | | |
Series 2004-7, Class 2A1 | | | | | |
4.04%, due 06/25/2034 * | | $ | 146 | | $ | 146 | |
Countrywide Home Loan Mortgage Pass-Through Trust | | | | | |
Series 2004-HYB1, Class 2A | | | | | |
4.22%, due 05/20/2034 | | 152 | | 150 | |
Countrywide Home Loan Mortgage Pass-Through Trust | | | | | |
Series 2005-22, Class 2A1 | | | | | |
5.26%, due 11/25/2035 * | | 685 | | 685 | |
Federal Home Loan Bank | | | | | |
4.72%, due 09/20/2012 | | 390 | | 393 | |
First Horizon Asset Securities, Inc. | | | | | |
Series 2004-AR7, Class 2A1 | | | | | |
4.91%, due 02/25/2035 * | | 300 | | 302 | |
GE Capital Commercial Mortgage Corp. | | | | | |
Series 2001-2, Class B | | | | | |
6.44%, due 08/11/2033 | | 3,000 | | 3,163 | |
GSR Mortgage Loan Trust | | | | | |
Series 2005-7F, Class 3A9 | | | | | |
6.00%, due 09/25/2035 | | 304 | | 306 | |
GSR Mortgage Loan Trust | | | | | |
Series 2006-1F, Class 2A4 | | | | | |
6.00%, due 02/25/2036 | | 188 | | 185 | |
GSR Mortgage Loan Trust | | | | | |
Series 2007-1F, Class 2A4 | | | | | |
5.50%, due 01/25/2037 | | 500 | | 473 | |
Household Automotive Trust | | | | | |
Series 2005-1, Class A4 | | | | | |
4.35%, due 06/18/2012 | | 110 | | 110 | |
Household Credit Card Master Note Trust I | | | | | |
Series 2006-1, Class A | | | | | |
5.10%, due 06/15/2012 | | 150 | | 151 | |
IndyMac Index Mortgage Loan Trust | | | | | |
Series 2005-AR11, Class A7 | | | | | |
0.72%, due 08/25/2035 * 2 | | 2,460 | | 33 | |
Master Adjustable Rate Mortgages Trust | | | | | |
Series 2004-13, Class 2A1 | | | | | |
3.82%, due 04/21/2034 * | | 322 | | 319 | |
Master Alternative Loans Trust | | | | | |
Series 2004-10, Class 1A1 | | | | | |
4.50%, due 09/25/2019 | | 372 | | 364 | |
Master Asset Securitization Trust | | | | | |
Series 2003-4, Class 2A2 | | | | | |
5.00%, due 05/25/2018 | | 123 | | 123 | |
Master Resecuritization Trust | | | | | |
Series 2005-PO, Class 3PO-144A | | | | | |
0.00%, due 05/28/2035 1 | | 781 | | 500 | |
The notes to the financial statements are an integral part of this report.
5
| | Principal | | Value | |
MBNA Master Credit Card Trust USA | | | | | |
Series 1999-J, Class C-144A | | | | | |
7.85%, due 02/15/2012 | | $ | 300 | | $ | 312 | |
Merrill Lynch Mortgage Trust | | | | | |
Series 2005-MCP1, Class ASB | | | | | |
4.67%, due 06/12/2043 | | 300 | | 294 | |
Morgan Stanley Capital I | | | | | |
Series 1998-HF2, Class B | | | | | |
6.80%, due 11/15/2030 | | 2,000 | | 2,010 | |
MortgageIT Trust | | | | | |
Series 2005-1, Class 1A1 | | | | | |
5.11%, due 02/25/2035 * | | 164 | | 160 | |
Nomura Asset Acceptance Corp. | | | | | |
Series 2003-A1, Class A2 | | | | | |
6.00%, due 05/25/2033 | | 94 | | 94 | |
Nomura Asset Acceptance Corp. | | | | | |
Series 2003-A1, Class A5 | | | | | |
7.00%, due 04/25/2033 | | 12 | | 11 | |
Prudential Securities Secured Financing Corp. | | | | | |
Series 1998-C1, Class A1B | | | | | |
6.51%, due 07/15/2008 | | 27 | | 27 | |
Residential Accredit Loans, Inc. | | | | | |
Series 2002-QS16, Class A3 | | | | | |
6.61%, due 10/25/2017 * | | 93 | | 98 | |
Residential Accredit Loans, Inc. | | | | | |
Series 2003-QS3, Class A2 | | | | | |
5.96%, due 02/25/2018 * | | 77 | | 81 | |
Residential Funding Mortgage Securities I | | | | | |
Series 2004-S6, Class 2A6 | | | | | |
0.00%, due 06/25/2034 | | 141 | | 101 | |
Vendee Mortgage Trust | | | | | |
Series 1997-1, Class 2Z | | | | | |
7.50%, due 02/15/2027 | | 1,290 | | 1,399 | |
WAMU Mortgage Pass-Through Certificates | | | | | |
Series 2004-AR3, Class A2 | | | | | |
4.24%, due 06/25/2034 | | 141 | | 140 | |
Washington Mutual Alternative Mortgage Pass-Through Certificates | | | | | |
Series 2005-2, Class 1A4 | | | | | |
0.26%, due 04/25/2035 * 2 | | 2,166 | | 41 | |
Washington Mutual Alternative Mortgage Pass-Through Certificates | | | | | |
Series 2005-4, Class CB7 | | | | | |
5.50%, due 06/25/2035 | | 500 | | 475 | |
Wells Fargo Mortgage Backed Securities Trust | | | | | |
Series 2004-7, Class 2A2 | | | | | |
5.00%, due 07/25/2019 | | 331 | | 330 | |
Wells Fargo Mortgage Backed Securities Trust | | | | | |
Series 2004-BB, Class A4 | | | | | |
4.56%, due 01/25/2035 * | | $ | 533 | | $ | 530 | |
Wells Fargo Mortgage Backed Securities Trust | | | | | |
Series 2004-EE, Class 3A1 | | | | | |
3.99%, due 12/25/2034 * | | 310 | | 307 | |
Wells Fargo Mortgage Backed Securities Trust | | | | | |
Series 2004-S, Class A5 | | | | | |
3.54%, due 09/25/2034 * | | 500 | | 495 | |
| | | | | |
Total Mortgage-Backed Securities (cost $20,681) | | | | 20,899 | |
| | | | | |
ASSET-BACKED SECURITIES (0.1%) | | | | | |
Countrywide Asset-Backed Certificates | | | | | |
Series 2004-AB2, Class A2 | | | | | |
5.06%, due 05/25/2036 * | | 51 | | 51 | |
MBNA Credit Card Master Note Trust | | | | | |
Series 2003-C1, Class C1 | | | | | |
6.35%, due 06/15/2012 * | | 150 | | 149 | |
| | | | | |
Total Asset-Backed Securities (cost $201) | | | | 200 | |
| | | | | |
MUNICIPAL GOVERNMENT OBLIGATIONS (0.3%) | | | | | |
Municipal Government Obligation (0.3%) | | | | | |
State of Illinois | | | | | |
5.10%, due 06/01/2033 | | 450 | | 437 | |
| | | | | |
Total Municipal Government Obligations (cost $450) | | | | 437 | |
| | | | | |
CORPORATE DEBT SECURITIES (18.0%) | | | | | |
Aerospace & Defense (0.7%) | | | | | |
Systems 2001 AT LLC -144A | | | | | |
6.66%, due 09/15/2013 | | 1,099 | | 1,132 | |
Capital Markets (3.3%) | | | | | |
Bear Stearns Cos., Inc. (The) | | | | | |
3.25%, due 03/25/2009 | | 500 | | 484 | |
Credit Suisse USA, Inc. | | | | | |
4.70%, due 06/01/2009 | | 125 | | 125 | |
4.88%, due 01/15/2015 | | 300 | | 293 | |
Goldman Sachs Group, Inc. (The) | | | | | |
6.25%, due 09/01/2017 | | 70 | | 73 | |
6.88%, due 01/15/2011 | | 850 | | 902 | |
Lehman Brothers Holdings, Inc. | | | | | |
7.88%, due 08/15/2010 | | 1,000 | | 1,060 | |
Merrill Lynch & Co., Inc. | | | | | |
4.79%, due 08/04/2010 | | 100 | | 99 | |
5.45%, due 07/15/2014 | | 300 | | 295 | |
6.40%, due 08/28/2017 | | 180 | | 183 | |
The notes to the financial statements are an integral part of this report.
6
| | Principal | | Value | |
Capital Markets (continued) | | | | | |
Morgan Stanley | | | | | |
4.25%, due 05/15/2010 | | $ | 500 | | $ | 492 | |
4.75%, due 04/01/2014 | | 145 | | 136 | |
6.60%, due 04/01/2012 | | 250 | | 263 | |
6.75%, due 04/15/2011 | | 400 | | 419 | |
State Street Corp. | | | | | |
7.65%, due 06/15/2010 | | 300 | | 320 | |
Chemicals (1.6%) | | | | | |
Dow Chemical Co. (The) | | | | | |
6.13%, due 02/01/2011 | | 260 | | 270 | |
Koninklijke DSM NV -144A | | | | | |
6.75%, due 05/15/2009 | | 2,000 | | 2,068 | |
Monsanto Co. | | | | | |
7.38%, due 08/15/2012 | | 100 | | 109 | |
Potash Corp. of Saskatchewan | | | | | |
4.88%, due 03/01/2013 | | 40 | | 39 | |
Commercial Banks (2.4%) | | | | | |
Corp. Andina de Fomento | | | | | |
5.20%, due 05/21/2013 | | 100 | | 100 | |
General Electric Capital Corp. | | | | | |
4.63%, due 09/15/2009 | | 500 | | 502 | |
5.88%, due 02/15/2012 | | 520 | | 542 | |
6.00%, due 06/15/2012 | | 430 | | 451 | |
6.13%, due 02/22/2011 | | 500 | | 523 | |
KeyCorp | | | | | |
4.70%, due 05/21/2009 | | 100 | | 100 | |
PNC Funding Corp. | | | | | |
5.25%, due 11/15/2015 | | 50 | | 48 | |
Popular North America, Inc. | | | | | |
4.25%, due 04/01/2008 | | 150 | | 150 | |
Suntrust Banks, Inc. | | | | | |
6.38%, due 04/01/2011 | | 250 | | 261 | |
Wachovia Bank NA | | | | | |
7.80%, due 08/18/2010 | | 250 | | 269 | |
Wachovia Corp. | | | | | |
3.50%, due 08/15/2008 | | 150 | | 148 | |
5.75%, due 06/15/2017 | | 100 | | 99 | |
Wells Fargo & Co. | | | | | |
3.13%, due 04/01/2009 | | 260 | | 255 | |
4.20%, due 01/15/2010 | | 300 | | 298 | |
Communications Equipment (0.0%) | | | | | |
Cisco Systems, Inc. | | | | | |
5.50%, due 02/22/2016 | | 50 | | 51 | |
Computers & Peripherals (0.2%) | | | | | |
Hewlett-Packard Co. | | | | | |
5.40%, due 03/01/2017 | | 50 | | 50 | |
International Business Machines Corp. | | | | | |
6.22%, due 08/01/2027 | | 250 | | 260 | |
Consumer Finance (0.9%) | | | | | |
American General Finance Corp. | | | | | |
5.38%, due 10/01/2012 | | 100 | | 99 | |
Capital One Financial Corp. | | | | | |
5.70%, due 09/15/2011 | | $ | 20 | | $ | 19 | |
6.25%, due 11/15/2013 | | 75 | | 72 | |
HSBC Finance Corp. | | | | | |
5.25%, due 01/15/2014 | | 100 | | 99 | |
6.40%, due 06/17/2008 | | 100 | | 101 | |
6.75%, due 05/15/2011 | | 760 | | 788 | |
SLM Corp. | | | | | |
4.00%, due 01/15/2010 | | 175 | | 161 | |
Toyota Motor Credit Corp. | | | | | |
2.88%, due 08/01/2008 | | 100 | | 99 | |
Diversified Financial Services (3.0%) | | | | | |
ASIF Global Financing XIX -144A | | | | | |
4.90%, due 01/17/2013 | | 500 | | 489 | |
Bank of America Corp. | | | | | |
7.40%, due 01/15/2011 | | 1,600 | | 1,720 | |
Captiva CBO Series 1997-1 | | | | | |
Class 1997-1-144A | | | | | |
6.86%, due 11/30/2009 § | | 424 | | 424 | |
CIT Group, Inc. | | | | | |
5.00%, due 02/13/2014 | | 30 | | 26 | |
Citigroup, Inc. | | | | | |
4.25%, due 07/29/2009 | | 200 | | 199 | |
5.63%, due 08/27/2012 | | 400 | | 405 | |
ConocoPhillips Canada Funding Co. | | | | | |
5.63%, due 10/15/2016 | | 100 | | 103 | |
International Lease Finance Corp. | | | | | |
4.50%, due 05/01/2008 | | 75 | | 75 | |
5.88%, due 05/01/2013 | | 75 | | 76 | |
John Hancock Global Funding II -144A | | | | | |
7.90%, due 07/02/2010 | | 300 | | 327 | |
MassMutual Global Funding II -144A | | | | | |
3.50%, due 03/15/2010 | | 150 | | 149 | |
New York Life Global Funding -144A | | | | | |
3.88%, due 01/15/2009 | | 200 | | 199 | |
Principal Life Global Funding I -144A | | | | | |
2.80%, due 06/26/2008 | | 140 | | 138 | |
6.25%, due 02/15/2012 | | 250 | | 266 | |
Textron Financial Corp. | | | | | |
5.13%, due 02/03/2011 | | 80 | | 82 | |
Diversified Telecommunication Services (2.0%) | | | | | |
BellSouth Corp. | | | | | |
6.00%, due 10/15/2011 | | 250 | | 259 | |
British Telecommunications PLC | | | | | |
9.125 due 12/15/2030, 3 | | 150 | | 198 | |
France Telecom SA | | | | | |
7.75%, due 03/01/2011, 3 | | 200 | | 215 | |
GTE Corp. | | | | | |
7.51%, due 04/01/2009 | | 475 | | 489 | |
Nynex Capital Funding Co. | | | | | |
8.23%, due 10/15/2009 | | 400 | | 426 | |
The notes to the financial statements are an integral part of this report.
7
| | Principal | | Value | |
Diversified Telecommunication Services (continued) | | | | | |
NYNEX Corp. | | | | | |
9.55%, due 05/01/2010 | | $ | 105 | | $ | 111 | |
Sprint Capital Corp. | | | | | |
6.88%, due 11/15/2028 | | 800 | | 759 | |
Telecom Italia Capital SA | | | | | |
5.25%, due 11/15/2013 | | 60 | | 59 | |
Verizon Pennsylvania, Inc. | | | | | |
8.35%, due 12/15/2030 | | 400 | | 479 | |
Electric Utilities (0.7%) | | | | | |
CenterPoint Energy Houston Electric | | | | | |
5.75%, due 01/15/2014 | | 60 | | 60 | |
Dominion Resources, Inc. | | | | | |
6.25%, due 06/30/2012 | | 144 | | 151 | |
DTE Energy Co. | | | | | |
6.65%, due 04/15/2009 | | 200 | | 205 | |
Duke Energy Corp. | | | | | |
4.20%, due 10/01/2008 | | 50 | | 50 | |
5.63%, due 11/30/2012 | | 200 | | 207 | |
Exelon Generation Co. LLC | | | | | |
6.95%, due 06/15/2011 | | 250 | | 261 | |
PSEG Power LLC | | | | | |
7.75%, due 04/15/2011 | | 115 | | 124 | |
Food & Staples Retailing (0.2%) | | | | | |
Kroger Co. (The) | | | | | |
8.05%, due 02/01/2010 | | 200 | | 213 | |
Food Products (0.1%) | | | | | |
Kraft Foods, Inc. | | | | | |
6.13%, due 02/01/2018 | | 100 | | 101 | |
6.88%, due 02/01/2038 | | 50 | | 52 | |
Gas Utilities (0.1%) | | | | | |
KeySpan Gas East Corp. | | | | | |
7.88%, due 02/01/2010 | | 100 | | 106 | |
Southern California Gas Co. | | | | | |
4.80%, due 10/01/2012 | | 100 | | 101 | |
Insurance (0.2%) | | | | | |
Protective Life Secured Trusts | | | | | |
4.00%, due 04/01/2011 | | 250 | | 250 | |
XL Capital, Ltd. | | | | | |
5.25%, due 09/15/2014 | | 50 | | 49 | |
Media (1.6%) | | | | | |
Comcast Cable Holdings LLC | | | | | |
9.80%, due 02/01/2012 | | 500 | | 578 | |
Comcast Corp. | | | | | |
5.50%, due 03/15/2011 | | 250 | | 252 | |
COX Communications, Inc. | | | | | |
6.75%, due 03/15/2011 | | 1,000 | | 1,049 | |
Historic TW, Inc. | | | | | |
9.15%, due 02/01/2023 | | 500 | | 612 | |
Metals & Mining (0.1%) | | | | | |
Alcoa, Inc. | | | | | |
5.55%, due 02/01/2017 | | 60 | | 58 | |
Oil, Gas & Consumable Fuels (0.0%) | | | | | |
Transcanada Pipelines, Ltd. | | | | | |
4.00%, due 06/15/2013 | | $ | 50 | | $ | 48 | |
Paper & Forest Products (0.2%) | | | | | |
International Paper Co. | | | | | |
4.00%, due 04/01/2010 | | 165 | | 164 | |
4.25%, due 01/15/2009 | | 65 | | 64 | |
Road & Rail (0.2%) | | | | | |
Burlington Northern Santa Fe Corp. | | | | | |
7.13%, due 12/15/2010 | | 200 | | 212 | |
Union Pacific Corp. | | | | | |
5.65%, due 05/01/2017 | | 50 | | 49 | |
Software (0.0%) | | | | | |
Oracle Corp. | | | | | |
5.25%, due 01/15/2016 | | 30 | | 30 | |
Thrifts & Mortgage Finance (0.4%) | | | | | |
Countrywide Home Loans, Inc. | | | | | |
3.25%, due 05/21/2008 ^ | | 250 | | 226 | |
4.00%, due 03/22/2011 | | 225 | | 162 | |
Washington Mutual Bank FA | | | | | |
6.88%, due 06/15/2011 | | 250 | | 236 | |
Water Utilities (0.0%) | | | | | |
American Water Capital Corp. -144A | | | | | |
6.09%, due 10/15/2017 | | 50 | | 50 | |
Wireless Telecommunication Services (0.1%) | | | | | |
AT&T Wireless Services, Inc. | | | | | |
7.88%, due 03/01/2011 | | 100 | | 108 | |
| | | | | |
Total Corporate Debt Securities (cost $27,326) | | | | 27,808 | |
| | | | | |
Total Securities Lending Collateral (cost $2,753) 4 | | | | 2,753 | |
| | | | | |
Total Investment Securities (cost $151,428) # | | | | $ | 154,238 | |
The notes to the financial statements are an integral part of this report.
8
NOTES TO SCHEDULE OF INVESTMENTS:
^ At December 31, 2007, all or a portion of this security is on loan (see Note 1). The value at December 31, 2007, of all securities on loan is $2,682.
* Floating or variable rate note. Rate is listed as of December 31, 2007.
§ Illiquid. At December 31, 2007, this security had a value of $424 or 0.27% of total investments securities of the Fund.
1 PO - Principal Only
2 IO - Interest Only
3 Step Bond. Interest rate may increase or decrease as the credit rating changes.
4 Cash collateral for the Repurchase Agreements, valued at $998, that serve as collateral for securities lending, are invested in corporate bonds with interest rates and maturity dates ranging from 3.00% - 10.18% and 04/28/2008 - 12/01/2096, respectively.
# Aggregate cost for federal income tax purposes is $151,428. Aggregate gross unrealized appreciation for all securities in which there is an excess of value over tax cost and aggregate gross unrealized depreciation for all securities in which there is an excess of tax cost over value were $5,526 and $2,716, respectively. Net unrealized appreciation for tax purposes is $2,810.
DEFINITIONS:
144A 144A Securities are registered pursuant to Rule 144A of the Securities Act of 1933. These securities are deemed to be liquid for purposes of compliance limitations on holdings of illiquid securities and may be resold as transactions exempt from registration, normally to qualified institutional buyers. At December 31, 2007, these securities aggregated $10,251 or 6.65% of net assets of the fund.
The notes to the financial statements are an integral part of this report.
9
JPMorgan Core Bond
STATEMENT OF ASSETS AND LIABILITIES
At December 31, 2007
(all amounts except per share amounts in thousands)
Assets: | | | |
Investment securities, at value (cost: $151,428) | | $ | 154,238 | |
(including securities loaned of $2,682) | | | |
Cash | | 1,710 | |
Receivables: | | | |
Investment securities sold | | 18 | |
Shares sold | | 49 | |
Interest | | 1,151 | |
Income from loaned securities | | 3 | |
| | 157,169 | |
Liabilities: | | | |
Accounts payable and accrued liabilities: | | | |
Shares redeemed | | 18 | |
Management and advisory fees | | 59 | |
Distribution and service fees | | 2 | |
Administration fees | | 3 | |
Payable for collateral for securities on loan | | 2,753 | |
Other | | 86 | |
| | 2,921 | |
Net Assets | | $ | 154,248 | |
| | | |
Net Assets Consist of: | | | |
Capital Stock ($.01 par value) | | $ | 130 | |
Additional paid-in capital | | 144,405 | |
Undistributed (accumulated) net investment income | | 7,072 | |
Undistributed (accumulated) net realized loss from investment securities | | (169 | ) |
Net unrealized appreciation on investment securities | | 2,810 | |
Net Assets | | $ | 154,248 | |
Net Assets by Class: | | | |
Initial Class | | $ | 142,788 | |
Service Class | | 11,460 | |
Shares Outstanding: | | | |
Initial Class | | 12,090 | |
Service Class | | 922 | |
Net Asset Value and Offering Price Per Share: | | | |
Initial Class | | $ | 11.81 | |
Service Class | | 12.43 | |
STATEMENT OF OPERATIONS
For the year ended December 31, 2007
(all amounts in thousands)
Investment Income: | | | |
Interest | | $ | 8,006 | |
Income from loaned securities-net | | 18 | |
| | 8,024 | |
| | | |
Expenses: | | | |
Management and advisory fees | | 717 | |
Printing and shareholder reports | | 71 | |
Custody fees | | 74 | |
Administration fees | | 32 | |
Legal fees | | 3 | |
Audit fees | | 20 | |
Trustees fees | | 6 | |
Distribution and service fees: | | | |
Service Class | | 27 | |
Other | | 2 | |
Total expenses | | 952 | |
| | | |
Net Investment Income | | 7,072 | |
| | | |
Net Realized Gain (Loss) from: | | | |
Investment securities | | 8 | |
Net Increase (Decrease) in Unrealized Appreciation (Depreciation) on: | | | |
Investment securities | | 3,370 | |
| | | |
Net Realized and Unrealized Gain: | | 3,378 | |
| | | |
Net Increase In Net Assets Resulting from Operations | | $ | 10,450 | |
The notes to the financial statements are an integral part of this report.
10
JPMorgan Core Bond
STATEMENT OF CHANGES IN NET ASSETS
For the years ended
(all amounts in thousands)
| | December 31,
2007 | | December 31,
2006 | |
Increase (Decrease) in Net Assets From: | | | | | |
Operations: | | | | | |
Net investment income | | $ | 7,072 | | $ | 8,098 | |
Net realized gain (loss) from investment securities | | 8 | | (81 | ) |
Change in unrealized appreciation (depreciation) on investment securities | | 3,370 | | (1,348 | ) |
Net increase (decrease) in net assets resulting from operations | | 10,450 | | 6,669 | |
Distributions to Shareholders: | | | | | |
From net investment income: | | | | | |
Initial Class | | (7,585 | ) | (8,764 | ) |
Service Class | | (513 | ) | (493 | ) |
| | (8,098 | ) | (9,257 | ) |
Capital Share Transactions: | | | | | |
Proceeds from shares sold: | | | | | |
Initial Class | | 13,534 | | 18,113 | |
Service Class | | 2,296 | | 3,798 | |
| | 15,830 | | 21,911 | |
Dividends and distributions reinvested: | | | | | |
Initial Class | | 7,585 | | 8,764 | |
Service Class | | 513 | | 493 | |
| | 8,098 | | 9,257 | |
Cost of shares redeemed: | | | | | |
Initial Class | | (37,665 | ) | (53,060 | ) |
Service Class | | (2,125 | ) | (1,875 | ) |
| | (39,790 | ) | (54,935 | ) |
| | (15,862 | ) | (23,767 | ) |
Net increase (decrease) in net assets | | (13,510 | ) | (26,355 | ) |
| | | | | |
Net Assets: | | | | | |
Beginning of year | | 167,758 | | 194,113 | |
End of year | | $ | 154,248 | | $ | 167,758 | |
Undistributed (Accumulated) Net | | | | | |
Investment Income (Loss) | | $ | 7,072 | | $ | 8,098 | |
Share Activity: | | | | | |
Shares issued: | | | | | |
Initial Class | | 1,153 | | 1,546 | |
Service Class | | 186 | | 308 | |
| | 1,339 | | 1,854 | |
Shares issued-reinvested from | | | | | |
distributions: | | | | | |
Initial Class | | 666 | | 769 | |
Service Class | | 42 | | 42 | |
| | 708 | | 811 | |
Shares redeemed: | | | | | |
Initial Class | | (3,214 | ) | (4,534 | ) |
Service Class | | (172 | ) | (153 | ) |
| | (3,386 | ) | (4,687 | ) |
Net increase (decrease) in shares outstanding: | | | | | |
Initial Class | | (1,395 | ) | (2,219 | ) |
Service Class | | 56 | | 197 | |
| | (1,339 | ) | (2,022 | ) |
The notes to the financial statements are an integral part of this report.
11
JPMorgan Core Bond
FINANCIAL HIGHLIGHTS
For a share outstanding throughout each period(a)
| | Initial Class | |
| | Year Ended December 31, | |
| | 2007 | | 2006 | | 2005 | | 2004 | | 2003 | |
Net Asset Value | | | | | | | | | | | |
Beginning of period | | $11.66 | | $11.83 | | $12.23 | | $12.61 | | $12.68 | |
Investment Operations | | | | | | | | | | | |
Net investment income (loss) | | 0.52 | | 0.53 | | 0.54 | | 0.56 | | 0.62 | |
Net realized and unrealized gain (loss) | | 0.26 | | (0.07 | ) | (0.26 | ) | (0.01 | ) | (0.10 | ) |
Total operations | | 0.78 | | 0.46 | | 0.28 | | 0.55 | | 0.52 | |
Distributions | | | | | | | | | | | |
From net investment income | | (0.63 | ) | (0.63 | ) | (0.66 | ) | (0.88 | ) | (0.59 | ) |
From net realized gains | | — | | — | | (0.02 | ) | (0.05 | ) | — | |
Total distributions | | (0.63 | ) | (0.63 | ) | (0.68 | ) | (0.93 | ) | (0.59 | ) |
Net Asset Value | | | | | | | | | | | |
End of period(b) | | $11.81 | | $11.66 | | $11.83 | | $12.23 | | $12.61 | |
Total Return(c),(d) | | 6.85 | % | 3.92 | % | 2.30 | % | 4.53 | % | 4.28 | % |
Net Assets End of Period (000’s) | | $142,788 | | $157,167 | | $185,820 | | $218,258 | | $264,668 | |
Ratio and Supplemental Data | | | | | | | | | | | |
Expenses to average net assets(e) | | 0.58 | % | 0.57 | % | 0.59 | % | 0.56 | % | 0.52 | % |
Net investment income (loss), to average net assets(e) | | 4.46 | % | 4.54 | % | 4.42 | % | 4.52 | % | 4.88 | % |
Portfolio turnover rate(d) | | 4 | % | 5 | % | 6 | % | 12 | % | 27 | % |
For a share outstanding throughout each period(a)
| | Service Class | |
| | Year Ended December 31, | | May 1 to Dec | |
| | 2007 | | 2006 | | 2005 | | 2004 | | 31, 2003 | |
Net Asset Value | | | | | | | | | | | |
Beginning of period | | $12.24 | | $12.41 | | $12.81 | | $13.16 | | $12.97 | |
Investment Operations | | | | | | | | | | | |
Net investment income (loss) | | 0.52 | | 0.53 | | 0.53 | | 0.55 | | 0.40 | |
Net realized and unrealized gain (loss) | | 0.27 | | (0.09 | ) | (0.27 | ) | — | | (0.17 | ) |
Total operations | | 0.79 | | 0.44 | | 0.26 | | 0.55 | | 0.23 | |
Distributions | | | | | | | | | | | |
From net investment income | | (0.60 | ) | (0.61 | ) | (0.64 | ) | (0.85 | ) | (0.04 | ) |
From net realized gains | | — | | — | | (0.02 | ) | (0.05 | ) | — | |
Total distributions | | (0.60 | ) | (0.61 | ) | (0.66 | ) | (0.90 | ) | (0.04 | ) |
Net Asset Value | | | | | | | | | | | |
End of period(b) | | $12.43 | | $12.24 | | $12.41 | | $12.81 | | $13.16 | |
Total Return(c),(d) | | 6.61 | % | 3.63 | % | 2.07 | % | 4.31 | % | 1.78 | % |
Net Assets End of Period (000’s) | | $11,460 | | $10,591 | | $8,293 | | $5,471 | | $1,315 | |
Ratio and Supplemental Data | | | | | | | | | | | |
Expenses to average net assets(e) | | 0.83 | % | 0.82 | % | 0.84 | % | 0.81 | % | 0.80 | % |
Net investment income (loss), to average net assets(e) | | 4.21 | % | 4.29 | % | 4.16 | % | 4.21 | % | 4.57 | % |
Portfolio turnover rate(d) | | 4 | % | 5 | % | 6 | % | 12 | % | 27 | % |
(a) | | Per share information is calculated based on average number of shares outstanding. |
(b) | | JPMorgan Core Bond (the “Fund”) share class commenced operations as follows: |
| | Initial Class - October 2, 1986 |
| | Service Class - May 1, 2003 |
(c) | | Total Return reflects all portfolio expenses and includes reinvestment of dividends and capital gains; it does not reflect the charges and deductions under the policies orannuity contracts. |
(d) | | Not annualized. |
(e) | | Annualized. |
The notes to the financial statements are an integral part of this report.
12
JPMorgan Core Bond
NOTES TO FINANCIAL STATEMENTS
At December 31, 2007
(all amounts in thousands)
NOTE 1. ORGANIZATION AND SIGNIFICANT ACCOUNTING POLICIES
AEGON/Transamerica Series Trust (“ATST”) is an open-end management investment company registered under the Investment Company Act of 1940, as amended (the “1940 Act”). ATST serves as a funding vehicle for variable life insurance, variable annuity and group annuity products. Effective May 1, 2007, AEGON Bond was renamed JPMorgan Core Bond (“the Fund”). The Fund is part of ATST.
In the normal course of business, the Fund enters into contracts that contain a variety of representations that provide general indemnifications. The Fund’s maximum exposure under these arrangements is unknown, as this would involve future claims that may be made against the Fund and/or its affiliates that have not yet occurred. However, based on experience, the Fund expects the risk of loss to be remote.
This report should be read in conjunction with the current Fund prospectus, which contains more complete information about the Fund.
In preparing the Fund’s financial statements in accordance with accounting principles generally accepted in the United States of America (“GAAP”), estimates or assumptions (which could differ from actual results) may be used that affect reported amounts and disclosures. The following is a summary of significant accounting policies followed by the Fund.
Multiple class operations, income and expenses: The Fund currently offers two classes of shares, an Initial Class and a Service Class. Income, non-class specific expenses and realized and unrealized gains and losses, are allocated daily to each class, based upon the value of shares outstanding method as permitted under Rule 1 8f-3 of the 1940 Act. Each class bears its own specific expenses as well as a portion of general, common expenses.
Security valuations: The Fund values its investments at the close of the New York Stock Exchange (“NYSE”), normally 4 p.m. ET, each day the NYSE is open for business. Fund investments are valued at the last sale price or closing price on the day of valuation taken from the primary exchange where the security is principally traded.
Securities traded in the over-the-counter market and listed securities for which no sale was reported on that date are valued at the last quoted bid price.
Debt securities are valued based on a price quotation or other equivalent indication of value supplied by an exchange, a pricing service or a major market maker; however, those that mature in sixty days or less are valued at amortized cost, which approximates market.
Investment company securities are valued at the net asset value of the underlying portfolio.
Securities for which quotations are not readily available are valued at fair market value as determined in good faith by the Fund’s Administrative Valuation Committee, using guidelines adopted by the Board of Trustees.
Cash: The Fund may leave cash overnight in its cash account with the custodian, State Street Bank & Trust Company (“State Street”). On July 2, 2007, State Street acquired the parent company of Investors Bank & Trust Company. State Street has been contracted on behalf of the Fund to invest the excess cash into a savings account, which at December 31, 2007 was paying an interest rate of 2.60%.
Repurchase agreements: The Fund is authorized to enter into repurchase agreements. The Fund, through its custodian, State Street, receives delivery of the underlying securities, the value of which at the time of purchase is required to be an amount equal to at least 100% of the resale price. The Fund will bear the risk of value fluctuations until the security can be sold and may encounter delays and incur costs in liquidating the security. In the event of bankruptcy or insolvency of the seller, delays and costs may be incurred.
Securities lending: The Fund may lend securities to qualified borrowers, with State Street acting as the Fund’s lending agent. The Fund earns negotiated lenders’ fees. The Fund receives cash and/or securities as collateral against the loaned securities. Cash collateral received is invested in short-term, interest-bearing securities. The Fund monitors the market value of securities loaned on a daily basis and requires collateral in an amount at least equal to the value of the securities loaned. Income from loaned securities earned by State Street for its services, shown in the Statement of Operations is net of fees, in the amount of $8.
The Fund has invested the cash collateral received from securities loaned in the following short-term, interest-bearing securities:
Abbey National PLC, Eurodollar Term, 5.00%, 1/7/2008 | | $ | 119 | |
ABN AMRO Bank NV, Eurodollar Term, 5.18%, 1/4/2008 | | 95 | |
Bank of Nova Scotia, Eurodollar Term, 4.96%, 1/22/2008 | | 83 | |
Barclays, Eurodollar Term, 5.00%, 2/12/2008 | | 166 | |
BNP Paribas, Eurodollar Term, 5.01%, 1/11/2008 | | 155 | |
Calyon, Eurodollar Term, 5.12%, 3/3/2008 | | 36 | |
Credit Suisse First Boston Corp., Repurchase Agreement, 4.60%, 1/2/2008 | | 309 | |
Dexia Group, Eurodollar Term, 4.82%, 1/3/2008 | | 119 | |
HBOS Halifax Bank of Scotland, Eurodollar Term, 5.15%, 1/2/2008 | | 59 | |
JPMorgan Chase & Co., Eurodollar Term, 5.15%, 2/12/2008 | | 59 | |
Lloyds TSB Bank, Eurodollar Term, 5.15%, 1/24/2008 | | 119 | |
Merrill Lynch & Co. (RPG), Repurchase Agreement, 4.60%, 1/2/2008 | | 178 | |
Morgan Stanley & Co. (Corp. Repo), Repurchase Agreement, 4.60%, 1/2/2008 | | 487 | |
Rabobank Nederland, Eurodollar Term, 5.08%, 1/10/2008 | | 143 | |
Reserve Primary Money Market Fund, 4.95% | | 127 | |
Royal Bank of Scotland, Eurodollar Term, 5.00%, 2/25/2008 | | 143 | |
Societe Generale, Eurodollar Term, 5.15%, 3/3/2008 | | 71 | |
Toronto Dominion Bank, Eurodollar Term, 5.05%, 1/10/2008 | | 143 | |
UBS AG, Eurodollar Term, 4.92%, 1/11/2008 | | 83 | |
Wells Fargo, Bank Note, 4.75%, 1/8/2008 | | 59 | |
| | $ | 2,753 | |
13
NOTES TO FINANCIAL STATEMENTS (continued)
At December 31, 2007
(all amounts in thousands)
NOTE 1.– (continued)
Security transactions and investment income: Security transactions are recorded on the trade date. Security gains and losses are calculated on the first-in, first-out basis. Dividend income, if any, is recorded on the ex-dividend date or, in the case of foreign securities, as soon as the Fund is informed of the ex-dividend date. Interest income, including accretion of discounts and amortization of premiums, is recorded on the accrual basis commencing on the settlement date.
Dividend distributions: Dividends and capital gains distributions are typically declared and reinvested annually and are generally paid and reinvested on the business day following the ex-date.
NOTE 2. RELATED PARTY TRANSACTIONS
ATST serves as a funding vehicle for certain affiliated asset allocation portfolios and certain affiliated separate accounts of Western Reserve Life Assurance Co. of Ohio, Transamerica Life Insurance Company, Transamerica Financial Life Insurance Company, Inc., Monumental Life Insurance Company and Transamerica Occidental Life Insurance Company.
Transamerica Fund Advisors, Inc. (“TFAI”) is the Fund’s investment adviser. Transamerica Fund Services, Inc. (“TFS”) is the Fund’s administrator and transfer agent. Prior to May 1, 2007, AFSG Securities Corp. (“AFSG”), was the Fund’s distributor. Transamerica Capital Inc. (“TCI”) is now the Fund’s distributor. TFAI, TFS, AFSG and TCI are affiliates of AEGON NV, a Netherlands corporation.
Certain officers and trustees of the Fund are also officers and/or directors of TFAI, TFS and TCI.
Investment advisory fee: The Fund pays management fees to TFAI based on average daily net assets (“ANA”) at the following breakpoints:
0.45% of the first $750 million of ANA
0.40% of the next $250 million of ANA
0.375% of ANA over $1 billion
TFAI has contractually agreed to waive its advisory fee and will reimburse the Fund to the extent that operating expenses, excluding 12b-1 fees, exceed the following stated annual limit:
0.70% Expense Limit
If total Fund expenses fall below the annual expense limitation agreement agreed to by the adviser within the succeeding three years, the Fund may be required to pay the adviser a portion or all of the waived advisory fees.
There were no amounts recaptured during the year ended December 31, 2007. There are no amounts available for recapture at December 31, 2007.
Distribution and service fees: ATST entered into a Distribution Agreement with AFSG dated January 1, 1997, as amended. On May 1, 2007, the Distribution Agreement was amended to replace AFSG with TCI as the Fund’s distributor. The Fund has also adopted a distribution plan (“Distribution Plan”) pursuant to Rule 12b-1 under the 1940 Act.
Under the Distribution Plan for the Initial Class shares, TCI, on behalf of the Fund, is authorized to pay various service providers, as direct payment for expenses incurred in connection with distribution of the Fund’s shares, amounts equal to actual expenses associated with distributing the shares.
The Distribution Plan for the Service Class shares requires ATST to pay distribution fees to TCI as compensation for its activities, not as reimbursement for specific expenses. The fee on the Service Class is paid to the insurance companies for providing services and account maintenance for their policyholders who invest in the variable insurance products which invest in the Service Class shares.
The Fund is authorized under the Distribution Plan to pay fees on each class up to the following limits:
Initial Class | | 0.15 | % |
Service Class | | 0.25 | % |
TCI has determined that it will not seek payment by the Fund of the distribution expenses incurred with respect to the Initial Class shares before April 30, 2009. Prior to TCI seeking reimbursement of future expenses, policy and contract owners will be notified in advance. The Fund will pay fees relating to Service Class shares.
Administrative services: The Fund has entered into an agreement with TFS for financial and legal fund administration services. The Fund pays TFS an annual fee of 0.02% of ANA. The Legal fees on the Statement of Operations are for fees paid to external legal counsel.
Deferred compensation plan: Each eligible independent Fund Trustee may elect participation in a non-qualified deferred compensation plan (“the Plan”). Such Trustees may defer payment of all or a portion of their total fees earned as a Fund Trustee. Each Trustee who is a participant in the Plan may elect that the earnings, losses or gains credited to his or her deferred fee amounts be determined based on a deemed investment in any series of Transamerica IDEX Mutual Funds. The right of a participant to receive a distribution from the Plan of the deferred fees is an unsecured claim against the general assets of all series of Transamerica IDEX Mutual Funds. The pro rata liability to the Fund of all deferred fees in the Plan amounted, as of December 31, 2007, to $7. Amounts deferred under the Plan are unfunded against the general assets of ATST.
Retirement plan: Under a retirement plan (the “Emeritus Plan”) available to the Independent Trustees, each Independent Trustee is deemed to have elected to serve as Trustee Emeritus of ATST upon his or her termination of service, other than removal for cause, and is entitled to 50% of the trustee’s current retainer for a maximum period of five years determined by his or her years of service as a Trustee.
14
NOTES TO FINANCIAL STATEMENTS (continued)
At December 31, 2007
(all amounts in thousands)
NOTE 2.– (continued)
Such amounts shall be accrued by ATST on a pro rata basis allocable to each series of ATST fund based on the relative assets of the series. If retainers increase in the future, past accruals (and credits) will be adjusted upward so that 50% of the Trustee’s current retainer is accrued and credited at all times. Upon death, disability or termination of service, other than removal for cause, amounts deferred become payable to a Trustee Emeritus (or his/her beneficiary). Upon the commencement of service as Trustee Emeritus, compensation will be paid on a quarterly basis during the time period that the Trustee Emeritus is allowed to serve as such.
Amounts accrued under the Emeritus Plan are unsecured claims against the general assets of ATST. For the year ended December 31, 2007, the liability related to the Emeritus Plan was $8. As of December 31, 2007, the Fund has not made any payments related to the Emeritus Plan.
The Emeritus Plan was terminated effective October 30, 2007. Upon the termination, the Fund shall continue to pay any remaining benefits in accordance with the Plan, but no further compensation shall accrue under the Plan.
NOTE 3. INVESTMENT TRANSACTIONS
The cost of securities purchased and proceeds from securities sold (excluding short-term securities) for the year ended December 31, 2007 were as follows:
Purchases of securities: | | | |
Long-term | | $ | 4,919 | |
U.S. Government | | 641 | |
Proceeds from maturities and sales of securities: | | | |
Long-term | | 20,828 | |
U.S. Government | | 1,972 | |
| | | | |
NOTE 4. FEDERAL INCOME TAX MATTERS
The Fund has not made any provision for federal income or excise taxes due to its policy to distribute all of its taxable income and capital gains to its shareholders and otherwise qualify as a regulated investment company under Subchapter M of the Internal Revenue Code. Income and capital gain distributions are determined in accordance with income tax regulations, which may differ from GAAP. These differences are primarily due to differing treatment for items including, but not limited to, capital loss carryforwards and post October loss deferrals.
The capital loss carryforwards are available to offset future realized capital gains through the periods listed:
Capital Loss | | | |
Carryforwards | | Available Through | |
$ | 95 | | December 31, 2013 | |
$ | 73 | | December 31, 2014 | |
The capital loss carryforward utilized during the year ended December 31, 2007 was $1.
The tax character of distributions paid may differ from the character of distributions shown in the Statements of Changes in Net Assets due to short-term gains being treated as ordinary income for tax purposes. The tax character of distributions paid during 2006 and 2007 was as follows:
2006 Distributions paid from: | | | |
Ordinary Income | | $ | 9,257 | |
Long-term Capital Gain | | — | |
2007 Distributions paid from: | | | |
Ordinary Income | | 8,098 | |
Long-term Capital Gain | | — | |
| | | | |
The tax basis components of distributable earnings as of December 31, 2007 are as follows:
Undistributed Ordinary Income | | $ | 7,072 | |
Undistributed Long-term Capital Gain | | $ | — | |
Capital Loss Carryforward | | $ | (169 | ) |
Net Unrealized Appreciation (Depreciation) | | $ | 2,810 | |
NOTE 5. REGULATORY PROCEEDINGS
There continues to be significant federal and state regulatory activity relating to financial services companies, particularly mutual fund companies and their investment advisers. As part of an ongoing investigation regarding potential market timing, recordkeeping and trading compliance issues and matters affecting the Fund’s investment adviser, TFAI, and certain affiliates and former employees of TFAI, the SEC staff has indicated that it is likely to take some action against TFAI and certain of its affiliates at the conclusion of the investigation. The potential timing and the scope of any such action is difficult to predict. Although the impact of any action brought against TFAI and/or its affiliates is difficult to assess at the present time, the Fund currently believes that the likelihood that any such action will have a material adverse impact is remote. It is important to note that the Fund is not aware of any allegation of wrongdoing against it and its Board at the time this annual report is printed. Although it is not anticipated that these developments will have an adverse impact on the Fund, there can be no assurance at this time. TFAI and its affiliates are actively working with the SEC in regard to this matter; however, the exact resolution cannot be determined at this time. TFAI will take such actions that it deems necessary or appropriate to continue providing management services to the Fund and to bring all matters to an appropriate conclusion.
TFAI and/or its affiliates, and not the Fund, will bear the costs regarding these regulatory matters.
15
NOTES TO FINANCIAL STATEMENTS (continued)
At December 31, 2007
(all amounts in thousands)
NOTE 6. RECENTLY ISSUED ACCOUNTING PRONOUNCEMENTS
In July 2006, the Financial Accounting Standards Board (“FASB”) released FASB Interpretation No. 48 “Accounting for Uncertainty in Income Taxes” (“FIN 48”), an interpretation of FASB Statement No. 109. FIN 48 provides guidance for how uncertain tax positions should be recognized, measured, presented and disclosed in the financial statements. FIN 48 requires the accounting and disclosure of tax positions taken or expected to be taken in the course of preparing the Fund’s tax returns to determine whether the tax positions are “more-likely- than-not” of being sustained by the applicable tax authority. Tax positions not deemed to meet the more-likely-than-not threshold would be recorded as a tax benefit or expense in the current year.
Adoption of FIN 48 is effective during the first required financial reporting period for fiscal years beginning after December 15, 2006. Management adopted FIN 48 on June 29, 2007.
Implementation of FIN 48 requires Management of the Fund to analyze all open tax years, as defined by the Statute of Limitations, for all major jurisdictions, which includes federal and certain states. Open tax years are those that are open for exam by taxing authorities (i.e., the last 4 tax year ends and the interim tax period since then). The Fund has no examinations in progress and none are expected at this time.
Management of the Fund has reviewed all open tax years and major jurisdictions and concluded the adoption of FIN 48 resulted in no impact to the Fund’s net assets or results of operations. There is no tax liability resulting from unrecognized tax benefits relating to uncertain income tax positions taken or expected to be taken in future tax returns. The Fund is also not aware of any tax positions for which it is reasonably possible that the total amounts of unrecognized tax benefits will significantly change in the next 12 months.
In September 2006, FASB issued its new Standard No. 157, “Fair Value Measurements” (“FAS 157”). FAS 157 is designed to unify guidance for the measurement of fair value of all types of assets, including financial instruments, and certain liabilities, throughout a number of accounting standards. FAS 157 also establishes a hierarchy for measuring fair value in generally accepted accounting principles and expands financial statement disclosures about fair value measurements that are relevant to mutual funds. FAS 157 is effective for financial statements issued for fiscal years beginning after November 15, 2007, and earlier application is permitted.
As of December 31, 2007, Management does not expect the adoption of FAS 157 to impact the amounts reported in the financial statements, however, additional disclosures will be required about the inputs used to develop the measurements of fair value and the effect of certain of the measurements reported in the statement of operations for a fiscal period.
NOTE 7. SUBSEQUENT EVENT
Effective January 1, 2008, TFAI changed its name to Transamerica Asset Management, Inc.
Effective May 1, 2008, AEGON/Transamerica Series Trust will change its name to Transamerica Series Trust. At that time, the Fund will also change its name to Transamerica JPMorgan Core Bond VP.
16
Report of Independent Registered Certified Public Accounting Firm
To the Board of Trustees and Shareholders of
JPMorgan Core Bond:
In our opinion, the accompanying statement of assets and liabilities, including the schedule of investments, and the related statements of operations and of changes in net assets and the financial highlights present fairly, in all material respects, the financial position of JPMorgan Core Bond (the “Fund”) (one of the portfolios constituting AEGON/Transamerica Series Trust) at December 31, 2007, the results of its operations for the year then ended, the changes in its net assets for each of the two years in the period then ended and the financial highlights for each of the periods presented, in conformity with accounting principles generally accepted in the United States of America. These financial statements and financial highlights (hereafter referred to as “financial statements”) are the responsibility of the Fund’s management; our responsibility is to express an opinion on these financial statements based on our audits. We conducted our audits of these financial statements in accordance with the standards of the Public Company Accounting Oversight Board (United States). Those standards require that we plan and perform the audit to obtain reasonable assurance about whether the financial statements are free of material misstatement. An audit includes examining, on a test basis, evidence supporting the amounts and disclosures in the financial statements, assessing the accounting principles used and significant estimates made by management, and evaluating the overall financial statement presentation. We believe that our audits, which included confirmation of securities at December 31, 2007 by correspondence with the custodian and brokers, provide a reasonable basis for our opinion.

Tampa, Florida
February 29, 2008
17
JPMorgan Core Bond
RESULTS OF SHAREHOLDER PROXY (unaudited)
At a special meeting of shareholders held on October 30, 2007, the results of the Proposals were as follows:
Proposal 1: To elect a new Board:
Proposed
Trustee | | For | | Against | | Abstentions/Broker Non-
Votes | |
John K. Carter | | 2,274,998,840.817 | | 57,804,698.755 | | 35,433.883 | |
| | | | | | | |
Leo J. Hill | | 2,277,212,702.754 | | 55,590,836.819 | | 35,433.883 | |
| | | | | | | |
Neal M. Jewell | | 2,266,793,295.663 | | 66,010,243.909 | | 35,433.883 | |
| | | | | | | |
Russell A. Kimball, Jr. | | 2,274,825,235.835 | | 57,978,303.737 | | 35,433.883 | |
| | | | | | | |
Eugene M. Mannella | | 2,274,623,165.033 | | 58,180,374.539 | | 35,433.883 | |
| | | | | | | |
Norm R. Nielsen | | 2,275,050,055.885 | | 57,753,483.687 | | 35,433.883 | |
| | | | | | | |
Joyce Galpern Norden | | 2,270,278,122.250 | | 62,525,417.323 | | 35,433.883 | |
| | | | | | | |
Patricia L. Sawyer | | 2,275,737,737.456 | | 57,065,802.116 | | 35,433.883 | |
| | | | | | | |
John W. Waechter | | 2,276,615,120.140 | | 56,188,419.433 | | 35,433.883 | |
Proposal 2: To approve an amendment to the Agreement and Declaration of Trust:
| | | | Abstentions/Broker Non- | |
For | | Against | | Votes | |
2,182,022,669.110 | | 77,590,048.544 | | 73,226,255.801 | |
18
JPMorgan Core Bond
INVESTMENT ADVISORY AND SUB-ADVISORY AGREEMENTS-REVIEW AND RENEWAL (unaudited)
At a meeting of the Board of Trustees of AEGON/Transamerica Series Trust (“ATST”) held on December 4th, 2007, the Board reviewed and considered the renewal of the investment advisory agreement (the “Investment Advisory Agreement”) between JP Morgan Core Bond (the “Fund”) and Transamerica Fund Advisors, Inc. (“TFAI”), as well as the renewal of the investment sub-advisory agreement (the “Sub-Advisory Agreement”) of the Fund between TFAI and JP Morgan Investment Management Inc. (the “Sub-Adviser”), to determine whether the agreements should be renewed for a six-month period. It was noted that this review was interim in nature to align all the Funds on the same calendar, and that the Funds’ advisory arrangements would be reviewed again in the first half of 2008.
Following their review and consideration, the Trustees determined that the renewal of the Investment Advisory Agreement and the Sub- Advisory Agreement would enable shareholders of the Fund to obtain high quality services at a cost that is appropriate, fair, and in the best interests of its shareholders. The Board, including the independent members of the Board, unanimously approved the renewal of the Investment Advisory Agreement and Sub-Advisory Agreement. In reaching their decision, the Trustees requested and obtained from TFAI and the Sub-Adviser such information as they deemed reasonably necessary to evaluate the agreements, including information about fees and performance of comparable funds managed by the Sub-Adviser. The Trustees also carefully considered information they had previously received from TFAI and the Sub-Adviser throughout the year as part of their regular oversight of the Fund, as well as comparative fee, expense, and performance information prepared by Lipper Inc. (“Lipper”), an independent provider of mutual fund performance, fee and expense information and profitability data prepared by management. In considering the proposed continuation of the Investment Advisory and Sub-Advisory Agreements, the Trustees evaluated a number of considerations that they believed, in light of the legal advice furnished to them by independent legal counsel and their own business judgment, to be relevant. They based their decisions on a variety of factors, including the following considerations, among others, although they did not identify any consideration or particular information that was controlling of their decisions:
The nature, extent and quality of the advisory services to be provided. The Board considered the nature and quality of the services provided by TFAI and the Sub-Adviser to the Fund in the past, as well as the services anticipated to be provided in the future. The Board concluded that TFAI and the Sub-Adviser are capable of providing high quality services to the Fund, as indicated by the nature and quality of services provided in the past by TFAI and the Sub-Adviser for this series and the experience, capability and integrity of TFAI’s senior management, the financial resources of TFAI and the Sub-Adviser, TFAI’s management oversight process and the professional qualifications of the portfolio management team of the Sub-Adviser. The Trustees determined that TFAI and the Sub-Adviser can provide investment and related services that are appropriate in scope and extent in light of the Fund’s operations, the competitive landscape of the investment company business and investor needs.
The investment performance of the Fund. The Board examined the short and longer-term performance of the Fund, including relative performance against a peer universe of comparable mutual funds as prepared by Lipper for various trailing periods ended June 30, 2007. The Board noted the Fund has shown approximately average performance relative to its peers for all relevant periods. On the basis of the Board’s assessment of the nature, extent and quality of advisory services to be provided or procured by TFAI and the Sub-Adviser, the Board concluded that TFAI and the Sub-Adviser are capable of providing a level of investment performance that is appropriate in light of the Fund’s proposed investment objectives, policies and strategies and competitive with other similarly situated investment companies.
The cost of advisory services provided and the level of profitability. The Board reviewed profitability information of TFAI’s cost of procuring fund management services, as well as the costs of provision of administration, fund accounting and other services, to the Fund and to ATST as a whole by TFAI and its affiliates. The Board reviewed the management and sub-advisory fees for the Fund. The Board did note that the contractual management fees were lower relative to a peer group and universe of funds. Based on their review, the Trustees determined that the management fees of the Fund generally are appropriate in light of the services expected to be provided or procured, the management fees and the anticipated profitability of the relationship between the Fund, TFAI and its affiliates, and the Sub- Adviser. In making these observations and determinations, the Board reviewed, among other things, comparative information provided by Lipper.
Whether fee levels reflect economies of scale and the extent to which economies of scale would be realized as the Fund grows. In evaluating the extent to which the management fees payable under the Investment Advisory and Sub-Advisory Agreements reflect economies of scale or will permit economies of scale to be realized in the future, the Board noted that TFAI and the Sub-Adviser offer breakpoints which appropriately benefit investors by passing on economies of scale in the form of lower management fees as the level of assets grows. The Trustees also concluded that they will have the opportunity to periodically reexamine whether the Fund has achieved economies of scale, and the appropriateness of management fees payable to TFAI and fees paid to the Sub-Adviser, in the future.
Benefits (such as soft dollars) to TFAI, its affiliates, or the Sub-Adviser from their relationship with the Fund. The Board concluded that other benefits anticipated to be derived by TFAI, its affiliates, and the Sub-Adviser from their relationships with the Fund are expected to be reasonable and fair, and consistent with industry practice and the best interests of the Fund and its shareholders. The Trustees noted that TFAI would not realize soft dollar benefits from its relationship with the Fund.
Other considerations. The Board determined that TFAI has made a substantial commitment to the recruitment and retention of high quality personnel, and maintains the financial, compliance and operational resources reasonably necessary to manage the Fund in a professional manner that is consistent with the best interests of the Fund and its shareholders. In this regard, the Trustees favorably considered the procedures and policies in place by TFAI to enforce compliance with applicable laws and regulations and oversee the portfolio management activities of the Sub-Adviser. The Trustees also determined that TFAI has made a significant entrepreneurial commitment to the management and success of the Fund, reflected by TFAI’s expense limitation and fee waiver arrangements with the Fund which may result in TFAI waiving a substantial amount of management fees for the benefit of shareholders.
19
JPMorgan Enhanced Index
MARKET ENVIRONMENT
U.S. equity markets began the first half of 2007 on solid footing as investors were fairly optimistic that the broad economy could experience a soft landing and maintain sustainable levels of growth. However, heavier-than-expected reported losses due to sub-prime mortgage exposure at major financial institutions, the collapse of the U.S. housing market and higher energy and commodity prices contributed to fears of an eventual U.S. recession and levels of market volatility not seen since the early 2000s.
Large-cap stocks outperformed small caps in 2007 as the Standard and Poor’s 500 Composite Stock Index (“S&P 500”) posted a return of 5.49% while the Russell 2000 Index lost ground, returning (1.57)%. Growth indexes across all capitalizations handily outperformed value indexes, which were more heavily weighted to financials, as value stocks posted declines for the year.
PERFORMANCE
For the year ended December 31, 2007, JPMorgan Enhanced Index, Initial Class returned 4.54%. By comparison its benchmark, the S&P 500, returned 5.49%.
STRATEGY REVIEW
Stock selection in the telecommunications, media and consumer cyclical sectors contributed to returns, while insurance, capital markets and utilities detracted.
At the security level, an overweight position in Merck & Co., Inc. (“Merck”) and an underweight in Comcast Corporation (“Comcast”) benefited performance. Shares of pharmaceutical company Merck climbed as the company posted strong 2007 earnings, beating analysts’ expectations. Our underweight in cable operator Comcast contributed to returns as shares were down sharply for the year due in part to a slowdown in subscriber growth and stiffer competition.
Alternatively, overweight positions in financial guarantors Ambac Financial Group, Inc. (“Ambac”) and MBIA Inc. (“MBIA”) were the top detractors in the portfolio. Both stocks were plagued during the second half of the year by concerns over the credit markets and their exposure to sub-prime mortgages. Ambac and MBIA first dipped in July when both firms revealed the impact of losses tied to sub-prime transactions and declined further when the companies announced losses from marking to market their credit derivative portfolios.
Terance Chen, CFA
Raffaele Zingone, CFA
Co-Portfolio Managers
J.P. Morgan Investment Management Inc.
AEGON/Transamerica Series Trust | | Annual Report 2007 |
1
JPMorgan Enhanced Index
(unaudited)
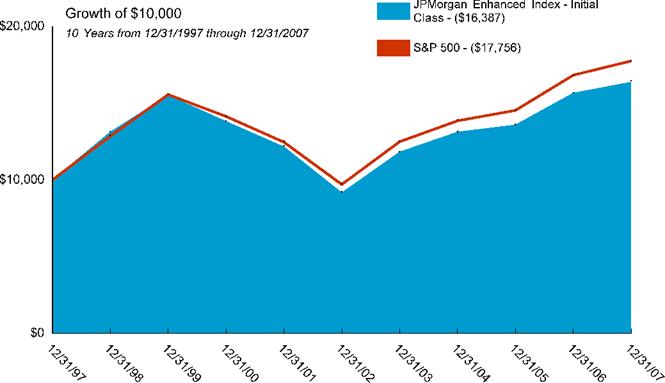
Average Annual Total Return for Periods Ended 12/31/2007
| | | | | | | | From | | Inception | |
| | 1 Year | | 5 Years | | 10 Years | | Inception | | Date | |
| | | | | | | | | | | |
Initial Class | | 4.54 | % | 12.29 | % | 5.06 | % | 6.78 | % | 5/2/97 | |
S&P 500(1) | | 5.49 | % | 12.83 | % | 5.91 | % | 7.60 | % | 5/2/97 | |
| | | | | | | | | | | |
Service Class | | 4.30 | % | — | % | — | % | 11.76 | % | 5/1/03 | |
NOTES
(1) The Standard and Poor’s 500 Composite Stock (S&P 500) Index is an unmanaged index used as a general measure of market performance. Calculations assume dividends and capital gains are reinvested and do not include any managerial expenses. From inception, calculation is based on life of Initial Class shares.
The performance data presented represents past performance; future results may vary. The portfolio’s investment return and net asset value will fluctuate. Past performance does not guarantee future results. Investor’s units when redeemed, may be worth more or less than their original cost.
Current performance may be lower or higher than performance quoted. Please visit your insurance company’s website for contract or policy level standardized total returns current to the most recent month end. Portfolio performance is net of investment fees and fund expenses, but not product charges, which, if included, would significantly lower the performance quoted.
This material must be preceded or accompanied by a current prospectus, which includes specific contents regarding the investment objectives, explanation of share classes and policies of this portfolio.
2
JPMorgan Enhanced Index
UNDERSTANDING YOUR FUNDS EXPENSES
(unaudited)
SHAREHOLDER EXPENSES
Fund shareholders may incur ongoing costs, including management and advisory fees, distribution and service fees, and other fund expenses.
The following Example is intended to help you understand your ongoing costs (in dollars and cents) of investing in the Fund and to compare these costs with the ongoing costs of investing in other funds.
The Example is based on an investment of $1,000 invested at July 1, 2007 and held for the entire period until December 31, 2007.
ACTUAL EXPENSES
The first line in the table below provides information about actual account values and actual expenses. You may use the information in this line, together with the amount you invested, to estimate the expenses that you paid over the period. Simply divide your account value by $1,000 (for example, an $8,600 account value divided by $1,000 = 8.6), then multiply the result by the number in the first line of your Fund under the heading entitled “Expenses Paid During Period” to estimate the expenses you paid on your account during this period. If your account is an IRA, your expenses could have included a $15 annual fee. The amount of any fee paid through your account would increase the estimate of expenses you paid during the period and decrease your ending account value.
HYPOTHETICAL EXAMPLE FOR COMPARISON PURPOSES
The second line in the table below provides information about hypothetical account values and hypothetical expenses based on the Fund’s actual expense ratio and an assumed rate of return of 5% per year before expenses, which is not the Fund’s actual return. The hypothetical account values and expenses may not be used to estimate the actual ending account balance or expenses you paid for the period. You may use this information to compare the ongoing costs of investing in your Fund and other funds. To do so, compare this 5% hypothetical example with the 5% hypothetical examples that appear in the shareholder reports of the other funds.
Please note that the expenses shown in the table are meant to highlight your ongoing costs only and do not reflect any transactional costs, such as sales charges, redemption fees, brokerage commissions paid on purchases and sales of fund shares. Therefore, the second line under the Fund in the table is useful in comparing ongoing costs only, and will not help you determine the relative total costs of owning different funds. If any of these transaction costs were included, your costs would be higher. The expenses shown in the table do not reflect any fees that may be charged to you by brokers, financial intermediaries or other financial institutions.
| | Beginning
Account
Value | | Ending
Account
Value | | Annualized
Expense
Ratio | | Expenses
Paid During
Period (a) | |
| | | | | | | | | |
Initial Class | | | | | | | | | |
Actual | | $ | 1,000.00 | | $ | 971.69 | | 0.82 | % | $ | 4.08 | |
Hypothetical (b) | | 1,000.00 | | 1,021.07 | | 0.82 | | 4.18 | |
| | | | | | | | | |
Service Class | | | | | | | | | |
Actual | | 1,000.00 | | 970.68 | | 1.07 | | 5.31 | |
Hypothetical (b) | | 1,000.00 | | 1,019.81 | | 1.07 | | 5.45 | |
| | | | | | | | | | | | |
(a) Expenses are calculated using the Fund’s annualized expense ratio (as disclosed in the table), multiplied by the average account value for the period, multiplied by the number of days in the period (184 days), and divided by the number of days in the year (365 days).
(b) 5% return per year before expenses.
GRAPHICAL PRESENTATION OF SCHEDULE OF INVESTMENTS
By Sector
At December 31, 2007
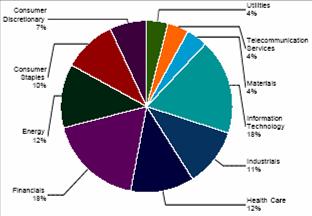
This chart shows the percentage breakdown by sector of the Fund’s total investment securities.
3
JPMorgan Enhanced Index
SCHEDULE OF INVESTMENTS
At December 31, 2007
(all amounts except share amounts in thousands)
| | Principal | | Value | |
U.S. GOVERNMENT OBLIGATIONS (0.1%) | | | | | |
U.S. Government Obligation (0.1%) | | | | | |
U.S. Treasury Note | | | | | |
5.13%, due 06/30/2008 (1) | | $ | 130 | | $ | 131 | |
Total Common Stocks (cost $130) | | | | 131 | |
| | | | | | | |
| | Shares | | Value | |
COMMON STOCKS (99.3%) | | | | | |
Aerospace & Defense (3.7%) | | | | | |
Boeing Co. | | 11,700 | | 1,023 | |
General Dynamics Corp. | | 2,100 | | 187 | |
Goodrich Corp. ^ | | 10,700 | | 756 | |
Northrop Grumman Corp. | | 25,100 | | 1,974 | |
United Technologies Corp. | | 31,500 | | 2,411 | |
Air Freight & Logistics (0.1%) | | | | | |
United Parcel Service, Inc. Class B | | 2,400 | | 170 | |
Auto Components (0.8%) | | | | | |
Johnson Controls, Inc. | | 39,600 | | 1,427 | |
Automobiles (0.1%) | | | | | |
Harley-Davidson, Inc. | | 3,400 | | 159 | |
Beverages (0.3%) | | | | | |
Coca-Cola Co. (The) | | 9,000 | | 552 | |
Biotechnology (1.7%) | | | | | |
Amgen, Inc. ‡ | | 27,800 | | 1,291 | |
Celgene Corp. ‡^ | | 19,200 | | 887 | |
Gilead Sciences, Inc. ‡ | | 16,500 | | 759 | |
Capital Markets (3.5%) | | | | | |
Goldman Sachs Group, Inc. (The) | | 5,000 | | 1,075 | |
Lehman Brothers Holdings, Inc. | | 15,400 | | 1,008 | |
Merrill Lynch & Co., Inc. | | 4,300 | | 231 | |
Morgan Stanley | | 32,400 | | 1,721 | |
State Street Corp. ^ | | 15,900 | | 1,291 | |
TD Ameritrade Holding Corp. ‡ | | 37,100 | | 744 | |
Chemicals (2.5%) | | | | | |
Air Products & Chemicals, Inc. | | 5,000 | | 493 | |
Dow Chemical Co. (The) | | 35,900 | | 1,415 | |
Ei DU Pont de Nemours & Co. | | 1,300 | | 58 | |
PPG Industries, Inc. | | 7,500 | | 527 | |
Praxair, Inc. | | 5,500 | | 488 | |
ROHM & Haas Co. | | 24,200 | | 1,284 | |
Commercial Banks (3.4%) | | | | | |
Bank of New York Mellon Corp. | | 7,000 | | 341 | |
Colonial Bancgroup, Inc. (The) | | 3,400 | | 46 | |
Comerica, Inc. | | 5,700 | | 248 | |
Huntington Bancshares, Inc. | | 22,600 | | 334 | |
Regions Financial Corp. | | 32,900 | | 778 | |
SunTrust Banks, Inc. | | 4,600 | | 288 | |
TCF Financial Corp. | | 26,800 | | 481 | |
US Bancorp | | 45,400 | | 1,441 | |
Wachovia Corp. | | 13,100 | | 498 | |
Wells Fargo & Co. | | 41,500 | | 1,253 | |
Zions Bancorporation | | 4,400 | | 205 | |
Communications Equipment (3.8%) | | | | | |
Cisco Systems, Inc. ‡ | | 111,200 | | 3,010 | |
Corning, Inc. | | 60,700 | | 1,456 | |
Juniper Networks, Inc. ‡ | | 7,800 | | 259 | |
Qualcomm, Inc. | | 42,900 | | 1,688 | |
Tellabs, Inc. ‡ | | 20,000 | | 131 | |
Computers & Peripherals (4.6%) | | | | | |
Apple, Inc.‡ | | 11,600 | | $ | 2,298 | |
Dell, Inc.‡ | | 200 | | 5 | |
EMC Corp. ‡ | | 16,500 | | 306 | |
Hewlett-Packard Co. | | 44,100 | | 2,226 | |
International Business Machines Corp. | | 25,000 | | 2,702 | |
SanDisk Corp. ‡ | | 9,500 | | 315 | |
Consumer Finance (0.5%) | | | | | |
American Express Co. | | 9,200 | | 478 | |
Capital One Financial Corp. | | 9,900 | | 468 | |
Diversified Financial Services (4.4%) | | | | | |
Bank of America Corp. | | 85,600 | | 3,532 | |
CIT Group, Inc. | | 26,500 | | 637 | |
Citigroup, Inc. | | 85,300 | | 2,511 | |
CME Group, Inc. Class A | | 1,200 | | 823 | |
Diversified Telecommunication Services (3.9%) | | | | | |
AT&T, Inc. | | 90,900 | | 3,778 | |
Verizon Communications, Inc. | | 65,300 | | 2,853 | |
Electric Utilities (3.9%) | | | | | |
American Electric Power Co., Inc. | | 26,500 | | 1,234 | |
CMS Energy Corp. | | 44,000 | | 765 | |
Edison International | | 34,200 | | 1,825 | |
FirstEnergy Corp. | | 10,500 | | 760 | |
FPL Group, Inc. | | 2,000 | | 135 | |
Northeast Utilities | | 11,500 | | 360 | |
Scana Corp. | | 5,000 | | 211 | |
Sierra Pacific Resources | | 40,900 | | 694 | |
Xcel Energy, Inc. | | 34,200 | | 772 | |
Electronic Equipment & Instruments (0.6%) | | 27,700 | | 1,028 | |
Tyco Electronics, Ltd. | | | | | |
Energy Equipment & Services (1.9%) | | | | | |
Baker Hughes, Inc. | | 2,300 | | 186 | |
BJ Services Co. | | 11,200 | | 272 | |
Nabors Industries, Ltd. ‡ | | 3,900 | | 107 | |
Patterson-UTI Energy, Inc. | | 8,200 | | 160 | |
Schlumberger, Ltd. | | 25,700 | | 2,528 | |
Weatherford International, Ltd. ‡ | | 1,400 | | 96 | |
Food & Staples Retailing (2.4%) | | | | | |
CVS Caremark Corp. | | 29,900 | | 1,189 | |
Safeway, Inc. | | 39,100 | | 1,338 | |
Supervalu, Inc. | | 7,100 | | 266 | |
SYSCO Corp. | | 19,500 | | 609 | |
Wal-Mart Stores, Inc. | | 14,400 | | 684 | |
Food Products (2.8%) | | | | | |
Campbell Soup Co. | | 16,600 | | 593 | |
General Mills, Inc. | | 25,700 | | 1,465 | |
Kellogg Co. | | 27,300 | | 1,431 | |
Kraft Foods, Inc. Class A | | 43,200 | | 1,410 | |
Health Care Equipment & Supplies (1.0%) | | | | | |
Baxter International, Inc. | | 10,800 | | 627 | |
Covidien, Ltd. | | 10,300 | | 456 | |
CR Bard, Inc. ^ | | 5,200 | | 493 | |
Zimmer Holdings, Inc. ‡ | | 1,000 | | 66 | |
| | | | | | |
The notes to the financial statements are an integral part of this report.
4
| | Shares | | Value | |
Health Care Providers & Services (2.5%) | | | | | |
Aetna, Inc. | | 27,600 | | $ | 1,593 | |
Cigna Corp. | | 11,300 | | 607 | |
McKesson Corp. | | 11,200 | | 734 | |
UnitedHealth Group, Inc. | | 3,800 | | 221 | |
WellPoint, Inc.‡ | | 12,600 | | 1,106 | |
Hotels, Restaurants & Leisure (1.6%) | | | | | |
Carnival Corp. | | 8,700 | | 387 | |
International Game Technology | | 8,000 | | 351 | |
McDonald’s Corp. | | 6,000 | | 354 | |
Royal Caribbean Cruises, Ltd. ^ | | 10,700 | | 454 | |
Starwood Hotels & Resorts Worldwide, Inc. | | 20,100 | | 885 | |
Wyndham Worldwide Corp. | | 12,400 | | 292 | |
Household Durables (0.2%) | | | | | |
Toll Brothers, Inc.‡^ | | 16,200 | | 325 | |
Household Products (2.1%) | | | | | |
Procter & Gamble Co. | | 48,500 | | 3,561 | |
Industrial Conglomerates (2.6%) | | | | | |
3M Co. | | 7,400 | | 624 | |
General Electric Co. | | 99,300 | | 3,681 | |
Textron, Inc. | | 1,700 | | 121 | |
Insurance (4.2%) | | | | | |
Aflac, Inc. | | 11,900 | | 745 | |
AMBAC Financial Group, Inc. ^ | | 18,800 | | 485 | |
American International Group, Inc. | | 15,000 | | 875 | |
Assurant, Inc. | | 1,200 | | 80 | |
Axis Capital Holdings, Ltd. | | 21,000 | | 819 | |
Chubb Corp. | | 2,400 | | 131 | |
Genworth Financial, Inc. Class A | | 14,000 | | 356 | |
Hartford Financial Services Group, Inc. | | 8,900 | | 776 | |
Lincoln National Corp. | | 3,400 | | 198 | |
MBIA, Inc. ^ | | 16,600 | | 309 | |
MetLife, Inc. | | 15,300 | | 943 | |
Protective Life Corp. | | 11,000 | | 451 | |
RenaissanceRe Holdings, Ltd. | | 4,700 | | 283 | |
Travelers Cos., Inc. (The) ‡ | | 7,500 | | 404 | |
Unum Group | | 12,200 | | 290 | |
XL Capital, Ltd. Class A | | 800 | | 40 | |
Internet Software & Services (3.1%) | | | | | |
eBay, Inc.‡ | | 37,600 | | 1,248 | |
Google, Inc. Class A ‡ | | 4,300 | | 2,973 | |
Yahoo!, Inc.‡ | | 51,100 | | 1,189 | |
IT Services (0.6%) | | | | | |
Affiliated Computer Services, Inc. Class A ‡ | | 6,500 | | 293 | |
Cognizant Technology Solutions | | 10,700 | | 363 | |
Corp. Class A ‡^ | | | | | |
Genpact, Ltd. ‡^ | | 24,300 | | 370 | |
Paychex, Inc. | | 300 | | 11 | |
Machinery (2.6%) | | | | | |
Caterpillar, Inc. | | 16,500 | | $ | 1,197 | |
Danaher Corp. | | 8,500 | | 746 | |
Dover Corp. | | 23,100 | | 1,065 | |
Eaton Corp. | | 5,200 | | 504 | |
Illinois Tool Works, Inc. | | 6,900 | | 369 | |
Ingersoll-Rand Co., Ltd. Class A | | 6,800 | | 316 | |
PACCAR, Inc. | | 4,200 | | 229 | |
Media (1.6%) | | | | | |
CBS Corp. Class B | | 300 | | 8 | |
New York Times Co. (The) Class A ^ | | 900 | | 16 | |
News Corp. Class A | | 70,400 | | 1,442 | |
Walt Disney Co. (The) ^ | | 41,900 | | 1,353 | |
Metals & Mining (0.7%) | | | | | |
Freeport-McMoRan Copper & Gold, Inc. | | 1,500 | | 154 | |
U.S. Steel Corp. | | 8,200 | | 991 | |
Multiline Retail (0.6%) | | | | | |
Family Dollar Stores, Inc. | | 11,500 | | 221 | |
Kohl’s Corp. ‡ | | 12,800 | | 586 | |
Target Corp. | | 4,900 | | 245 | |
Office Electronics (0.0%) | | | | | |
Seagate Technology, Inc. - Escrow | | 8,700 | | q | |
Shares ‡, (2) | | | | | |
Oil, Gas & Consumable Fuels (10.5%) | | | | | |
Apache Corp. | | 5,700 | | 613 | |
Chevron Corp. | | 22,300 | | 2,081 | |
ConocoPhillips | | 31,300 | | 2,764 | |
Devon Energy Corp. | | 11,700 | | 1,040 | |
Exxon Mobil Corp. | | 63,100 | | 5,912 | |
Marathon Oil Corp. | | 26,000 | | 1,582 | |
Occidental Petroleum Corp. | | 25,100 | | 1,932 | |
Sunoco, Inc. | | 11,700 | | 848 | |
Valero Energy Corp. | | 2,500 | | 175 | |
XTO Energy, Inc. | | 22,400 | | 1,151 | |
Paper & Forest Products (0.5%) | | | | | |
Domtar Corp. ‡ | | 96,300 | | 741 | |
International Paper Co. | | 1,300 | | 42 | |
Personal Products (0.2%) | | | | | |
Estee Lauder Cos., Inc. (The) Class A | | 6,400 | | 279 | |
Pharmaceuticals (6.9%) | | | | | |
Abbott Laboratories | | 41,200 | | 2,313 | |
Eli Lilly & Co. | | 400 | | 21 | |
Johnson & Johnson | | 12,400 | | 827 | |
Merck & Co., Inc. | | 55,900 | | 3,248 | |
Pfizer, Inc. | | 70,000 | | 1,591 | |
Schering-Plough Corp. | | 80,500 | | 2,145 | |
Sepracor, Inc. ‡ | | 11,600 | | 305 | |
Wyeth | | 30,300 | | 1,339 | |
Real Estate Investment Trusts (1.2%) | | | | | |
Apartment Investment & Management | | 6,700 | | 233 | |
Co. Class A REIT ^ | | | | | |
Duke Realty Corp. REIT | | 4,900 | | 128 | |
Hospitality Properties Trust REIT | | 21,900 | | 706 | |
Host Hotels & Resorts, Inc. REIT | | 6,300 | | 107 | |
The notes to the financial statements are an integral part of this report.
5
| | Shares | | Value | |
Real Estate Investment Trusts (continued) | | | | | |
ProLogis REIT ^ | | 6,400 | | $ | 406 | |
Public Storage, Inc. REIT | | 2,500 | | 183 | |
UDR, Inc. REIT ‡^ | | 13,000 | | 258 | |
Road & Rail (1.5%) | | | | | |
Burlington Northern Santa Fe Corp. | | 6,000 | | 499 | |
Norfolk Southern Corp. | | 39,900 | | 2,013 | |
Union Pacific Corp. | | 1,200 | | 151 | |
Semiconductors & Semiconductor Equipment (2.0%) | | | | | |
Altera Corp. | | 17,500 | | 338 | |
Broadcom Corp. Class A ‡ | | 20,000 | | 523 | |
Intel Corp. | | 10,700 | | 285 | |
Linear Technology Corp. ^ | | 4,300 | | 137 | |
LSI Corp.‡ | | 14,700 | | 78 | |
National Semiconductor Corp. | | 5,100 | | 116 | |
Texas Instruments, Inc. | | 23,200 | | 775 | |
Xilinx, Inc. | | 57,400 | | 1,255 | |
Software (3.4%) | | | | | |
Microsoft Corp. | | 150,800 | | 5,368 | |
Oracle Corp. ‡ | | 20,400 | | 461 | |
Specialty Retail (1 .2%) | | | | | |
Abercrombie & Fitch Co. Class A | | 4,500 | | 360 | |
Advance Auto Parts, Inc. | | 10,100 | | 384 | |
Carmax, Inc. ‡^ | | 10,100 | | 199 | |
Dick’s Sporting Goods, Inc. ‡ | | 4,600 | | 128 | |
Home Depot, Inc. | | 5,200 | | 140 | |
Staples, Inc. | | 41,000 | | 946 | |
Textiles, Apparel & Luxury Goods (1.0%) | | | | | |
Coach, Inc. ‡ | | 12,700 | | 388 | |
Nike, Inc. Class B | | 20,000 | | 1,285 | |
Polo Ralph Lauren Corp. Class A | | 700 | | 43 | |
Thrifts & Mortgage Finance (0.3%) | | | | | |
Countrywide Financial Corp. ^ | | 15,600 | | 139 | |
Fannie Mae | | 500 | | 20 | |
Freddie Mac | | 1,100 | | 37 | |
MGIC Investment Corp. ^ | | 3,100 | | 70 | |
Sovereign Bancorp, Inc. ^ | | 7,300 | | 83 | |
Washington Mutual, Inc. ^ | | 6,800 | | 93 | |
Tobacco (2.2%) | | | | | |
Altria Group, Inc. | | 49,400 | | 3,734 | |
Wireless Telecommunication Services (0.1%) | | | | | |
Sprint Nextel Corp. | | 17,100 | | 225 | |
Total Common Stocks (cost $155,596) | | | | 170,693 | |
| | | | | |
Total Securities Lending Collateral (cost $6,321) (3) | | | | 6,321 | |
Total Investment Securities (cost $162,047) # | | | | $ | 177,145 | |
FUTURES CONTRACTS:
| | | | | | | | Net Unrealized | |
| | | | Settlement | | | | Appreciation | |
| | Contracts (*) | | Date | | Amount | | (Depreciation) | |
| | | | | | | | | |
S&P 500 FUTURE INDEX | | 3 | | 03/17/2008 | | $ | 1,108 | | $ | 12 | |
| | | | | | $ | 1,108 | | $ | 12 | |
The notes to the financial statements are an integral part of this report.
6
NOTES TO SCHEDULE OF INVESTMENTS:
q | | Value is less than $1 |
^ | | At December 31, 2007, all or a portion of this security is on loan (see Note 1). The value at December 31, 2007 of all securities on loan is $6,076. |
‡ | | Non-Income Producing. |
· | | Contract Amounts are not in thousands. |
(1) | | At December 31, 2007, all or a portion of this security is segregated with the custodian to cover margin requirements for open futures contracts. The value of all securities segregated at December 31, 2007 is $131. |
(2) | | Fair Valued. |
(3) | | Cash collateral for the Repurchase Agreements, valued at $2,291, that serves as collateral for securities lending, is invested in corporate bonds with interest rates and maturity dates ranging from 3.00% - 10.18% and 04/28/2008 - 12/01/2096, respectively. |
# | | Aggregate cost for federal income tax purposes is $163,204. Aggregate gross unrealized appreciation for all securities in which there is an excess of value over tax cost and aggregate gross unrealized depreciation for all securities in which there is an excess of tax cost over value were $24,201 and $10,260 respectively. Net unrealized appreciation for tax purposes is $13,941. |
DEFINITIONS:
REIT Real Estate Investment Trust
The notes to the financial statements are an integral part of this report.
7
JPMorgan Enhanced Index
STATEMENT OF ASSETS AND LIABILITIES
At December 31, 2007
(all amounts except per share amounts in thousands)
Assets: | | | |
Investment securities, at value (cost: $6,076)
(including securities loaned of $162,047) | | $ | 177,145 | |
Cash | | 894 | |
Receivables: | | | |
Investment securities sold | | 3,270 | |
Shares sold | | 21 | |
Interest | | 6 | |
Income from loaned securities | | 3 | |
Dividends | | 331 | |
| | 181,670 | |
Liabilities: | | | |
Investment securities purchased | | 3,298 | |
Accounts payable and accrued liabilities: | | | |
Shares redeemed | | 72 | |
Management and advisory fees | | 110 | |
Distribution and service fees | | 2 | |
Administration fees | | 3 | |
Payable for collateral for securities on loan | | 6,321 | |
Variation margin | | 6 | |
Other | | 46 | |
| | 9,858 | |
Net Assets | | $ | 171,812 | |
| | | |
Net Assets Consist of: | | | |
Capital Stock ($.01 par value) | | $ | 105 | |
Additional paid-in capital | | 131,144 | |
Undistributed (accumulated) net investment income | | 2,084 | |
Undistributed (accumulated) net realized gain from investment securities and futures | | 23,369 | |
Net unrealized appreciation on investment securities | | 15,098 | |
Futures contracts | | 12 | |
Net Assets | | $ | 171,812 | |
Net Assets by Class: | | | |
Initial Class | | $ | 164,761 | |
Service Class | | 7,051 | |
Shares Outstanding: | | | |
Initial Class | | 10,025 | |
Service Class | | 429 | |
Net Asset Value and Offering Price Per Share: | | | |
Initial Class | | $ | 16.43 | |
Service Class | | 16.45 | |
STATEMENT OF OPERATIONS
For the year ended December 31, 2007
(all amounts in thousands)
Investment Income: | | | |
Dividends | | $ | 3,682 | |
Interest | | 39 | |
Income from loaned securities-net | | 21 | |
| | 3,742 | |
Expenses: | | | |
Management and advisory fees | | 1,425 | |
Printing and shareholder reports | | 19 | |
Custody fees | | 46 | |
Administration fees | | 38 | |
Legal fees | | 4 | |
Audit fees | | 21 | |
Trustees fees | | 7 | |
Distribution and service fees: | | | |
Service Class | | 18 | |
Other | | 3 | |
Total expenses | | 1,581 | |
Net Investment Income | | 2,161 | |
Net Realized Gain (Loss) from: | | | |
| | | |
Investment securities | | 24,473 | |
| | | |
Futures contracts | | (75 | ) |
| | 24,398 | |
Net Increase (Decrease) in Unrealized Appreciation (Depreciation) on: | | | |
Investment securities | | (17,234 | ) |
| | | |
Futures contracts | | 15 | |
| | (17,219 | ) |
| | | |
Net Realized and Unrealized Gain: | | 7,179 | |
| | | |
Net Increase In Net Assets Resulting from Operations | | $ | 9,340 | |
The notes to the financial statements are an integral part of this report.
8
JPMorgan Enhanced Index
STATEMENTS OF CHANGES IN NET ASSETS
For the years ended
(all amounts except share amounts in thousands)
| | December 31,
2007 | | December 31,
2006 | |
Increase (Decrease) in Net Assets From: Operations: | | | | | |
Net investment income | | $ | 2,161 | | $ | 2,232 | |
Net realized gain from investment securities and futures contracts | | 24,398 | | 18,392 | |
Change in unrealized appreciation (depreciation) on investment securities and futures contracts | | (17,219 | ) | 6,946 | |
| | 9,340 | | 27,570 | |
Distributions to Shareholders: | | | | | |
From net investment income: | | | | | |
Initial Class | | (2,118 | ) | (1,972 | ) |
Service Class | | (72 | ) | (50 | ) |
| | (2,190 | ) | (2,022 | ) |
From net realized gains: | | | | | |
Initial Class | | (4,690 | ) | — | |
Service Class | | (194 | ) | — | |
| | (4,884 | ) | — | |
Capital Share Transactions: | | | | | |
Proceeds from shares sold: | | | | | |
Initial Class | | 10,556 | | 15,440 | |
Service Class | | 5,048 | | 1,180 | |
| | 15,604 | | 16,620 | |
Dividends and distributions reinvested: | | | | | |
Initial Class | | 6,809 | | 1,972 | |
Service Class | | 265 | | 50 | |
| | 7,074 | | 2,022 | |
Cost of shares redeemed: | | | | | |
Initial Class | | (48,210 | ) | (49,627 | ) |
Service Class | | (5,095 | ) | (2,709 | ) |
| | (53,305 | ) | (52,336 | ) |
| | (30,627 | ) | (33,694 | ) |
Net increase (decrease) in net assets | | (28,361 | ) | (8,146 | ) |
| | | | | |
Net Assets: | | | | | |
Beginning of year | | 200,173 | | 208,319 | |
End of year | | $ | 171,812 | | $ | 200,173 | |
Undistributed (Accumulated) Net Investment Income (Loss) | | $ | 2,084 | | $ | 2,207 | |
Share Activity: | | | | | |
Shares issued: | | | | | |
Initial Class | | 617 | | 1,005 | |
Service Class | | 292 | | 77 | |
| | 909 | | 1,082 | |
Shares issued-reinvested from distributions: | | | | | |
Initial Class | | 414 | | 134 | |
Service Class | | 16 | | 3 | |
| | 430 | | 137 | |
Shares redeemed: | | | | | |
Initial Class | | (2,832 | ) | (3,321 | ) |
Service Class | | (297 | ) | (182 | ) |
| | (3,129 | ) | (3,503 | ) |
Net increase (decrease) in shares outstanding: | | | | | |
Initial Class | | (1,801 | ) | (2,182 | ) |
Service Class | | 11 | | (102 | ) |
| | (1,790 | ) | (2,284 | ) |
The notes to the financial statements are an integral part of this report.
9
For a share outstanding throughout each period(a)
| | Initial Class | |
| | Year Ended December 31, | |
| | 2007 | | 2006 | | 2005 | | 2004 | | 2003 | |
Net Asset Value | | | | | | | | | | | |
Beginning of period | | $ | 16.35 | | $ | 14.34 | | $ | 14.04 | | $ | 12.75 | | $ | 9.94 | |
Investment Operations | | | | | | | | | | | |
Net investment income (loss) | | 0.19 | | 0.17 | | 0.13 | | 0.15 | | 0.10 | |
Net realized and unrealized gain (loss) | | 0.56 | | 2.01 | | 0.35 | | 1.24 | | 2.77 | |
Total operations | | 0.75 | | 2.18 | | 0.48 | | 1.39 | | 2.87 | |
Distributions | | | | | | | | | | | |
From net investment income | | (0.21 | ) | (0.17 | ) | (0.18 | ) | (0.10 | ) | (0.06 | ) |
From net realized gains | | (0.46 | ) | — | | — | | — | | — | |
Total distributions | | (0.67 | ) | (0.17 | ) | (0.18 | ) | (0.10 | ) | (0.06 | ) |
Net Asset Value | | | | | | | | | | | |
End of period(b) | | $ | 16.43 | | $ | 16.35 | | $ | 14.34 | | $ | 14.04 | | $ | 12.75 | |
Total Return(c),(d) | | 4.54 | % | 15.31 | % | 3.46 | % | 11.02 | % | 28.94 | % |
Net Assets End of Period (000’s) | | $ | 164,761 | | $ | 193,322 | | $ | 200,857 | | $ | 231,055 | | $ | 233,744 | |
Ratio and Supplemental Data | | | | | | | | | | | |
Expenses to average net assets(e) | | 0.81 | % | 0.81 | % | 0.83 | % | 0.80 | % | 0.82 | % |
Net investment income (loss), to average net assets(e) | | 1.13 | % | 1.16 | % | 0.95 | % | 1.18 | % | 0.91 | % |
Portfolio turnover rate(d) | | 55 | % | 55 | % | 42 | % | 48 | % | 52 | % |
For a share outstanding throughout each period(a)
| | Service Class | |
| | Year Ended December 31, | | May 1 to Dec | |
| | 2007 | | 2006 | | 2005 | | 2004 | | 31, 2003 | |
Net Asset Value | | | | | | | | | | | |
Beginning of period | | $ | 16.37 | | $ | 14.36 | | $ | 14.08 | | $ | 12.79 | | $ | 10.43 | |
Investment Operations | | | | | | | | | | | |
Net investment income (loss) | | 0.15 | | 0.14 | | 0.10 | | 0.17 | | 0.06 | |
Net realized and unrealized gain (loss) | | 0.56 | | 2.00 | | 0.35 | | 1.19 | | 2.31 | |
Total operations | | 0.71 | | 2.14 | | 0.45 | | 1.36 | | 2.37 | |
Distributions | | | | | | | | | | | |
From net investment income | | (0.17 | ) | (0.13 | ) | (0.17 | ) | (0.07 | ) | (0.01 | ) |
From net realized gains | | (0.46 | ) | — | | — | | — | | — | |
Total distributions | | (0.63 | ) | (0.13 | ) | (0.17 | ) | (0.07 | ) | (0.01 | ) |
Net Asset Value | | | | | | | | | | | |
End of period(b) | | $ | 16.45 | | $ | 16.37 | | $ | 14.36 | | $ | 14.08 | | $ | 12.79 | |
Total Return(c),(d) | | 4.30 | % | 14.96 | % | 3.20 | % | 10.71 | % | 22.71 | % |
Net Assets End of Period (000’s) | | $ | 7,051 | | $ | 6,851 | | $ | 7,462 | | $ | 6,339 | | $ | 922 | |
Ratio and Supplemental Data | | | | | | | | | | | |
Expenses to average net assets(e) | | 1.06 | % | 1.06 | % | 1.08 | % | 1.06 | % | 1.06 | % |
Net investment income (loss), to average net assets(e) | | 0.88 | % | 0.91 | % | 0.71 | % | 1.33 | % | 0.74 | % |
Portfolio turnover rate(d) | | 55 | % | 55 | % | 42 | % | 48 | % | 52 | % |
(a) Per share information is calculated based on average number of shares outstanding.
(b) JPMorgan Enhanced Index (the “Fund”) share class commenced operations as follows
Initial Class - May 2, 1997
Service Class - May 1, 2003
(c) Total Return reflects all portfolio expenses and includes reinvestment of dividends and capital gains; it does not reflect the charges and deductions under the policies or annuity contracts.
(d) Not annualized.
(e) Annualized.
The notes to the financial statements are an integral part of this report.
10
JPMorgan Enhanced Index
NOTES TO FINANCIAL STATEMENTS
At December 31, 2007
(all amounts in thousands)
NOTE 1. ORGANIZATION AND SIGNIFICANT ACCOUNTING POLICIES
AEGON/Transamerica Series Trust (“ATST”) is an open-end management investment company registered under the Investment Company Act of 1940, as amended (the “1940 Act”). ATST serves as a funding vehicle for variable life insurance, variable annuity and group annuity products. Effective May 1, 2007, J.P. Morgan Enhanced Index was renamed JPMorgan Enhanced Index (“the Fund’). The Fund is part of ATST.
In the normal course of business, the Fund enters into contracts that contain a variety of representations that provide general indemnifications. The Fund’s maximum exposure under these arrangements is unknown, as this would involve future claims that may be made against the Fund and/or its affiliates that have not yet occurred. However, based on experience, the Fund expects the risk of loss to be remote.
This report should be read in conjunction with the current Fund prospectus, which contains more complete information about the Fund.
In preparing the Fund’s financial statements in accordance with accounting principles generally accepted in the United States of America (“GAAP”), estimates or assumptions (which could differ from actual results) may be used that affect reported amounts and disclosures. The following is a summary of significant accounting policies followed by the Fund.
Multiple class operations, income and expenses: The Fund currently offers two classes of shares, an Initial Class and a Service Class. Income, non-class specific expenses and realized and unrealized gains and losses, are allocated daily to each class, based upon the value of shares outstanding method as permitted under Rule 1 8f-3 of the 1940 Act. Each class bears its own specific expenses as well as a portion of general, common expenses.
Security valuations: The Fund values its investments at the close of the New York Stock Exchange (“NYSE”), normally 4 p.m. ET, each day the NYSE is open for business. Fund investments are valued at the last sale price or closing price on the day of valuation taken from the primary exchange where the security is principally traded.
Securities traded in the over-the-counter market and listed securities for which no sale was reported on that date are valued at the last quoted bid price.
Debt securities are valued based on a price quotation or other equivalent indication of value supplied by an exchange, a pricing service or a major market maker; however, those that mature in sixty days or less are valued at amortized cost, which approximates market.
Investment company securities are valued at the net asset value of the underlying portfolio. Securities for which quotations are not readily available are valued at fair market value as determined in good faith by the Fund’s Administrative Valuation Committee, using guidelines adopted by the Board of Trustees.
Cash: The Fund may leave cash overnight in its cash account with the custodian, State Street Bank & Trust Company (“State Street”). On July 2, 2007, State Street acquired the parent company of Investors Bank & Trust Company. State Street has been contracted on behalf of the Fund to invest the excess cash into a savings account, which at December 31, 2007 was paying an interest rate of 2.60%.
Repurchase agreements: The Fund is authorized to enter into repurchase agreements. The Fund, through its custodian, State Street, receives delivery of the underlying securities, the value of which at the time of purchase is required to be an amount equal to at least 100% of the resale price. The Fund will bear the risk of value fluctuations until the security can be sold and may encounter delays and incur costs in liquidating the security. In the event of bankruptcy or insolvency of the seller, delays and costs may be incurred.
Commission recapture: The sub-adviser, to the extent consistent with the best execution and usual commission rate policies and practices, may place security transactions of the Fund with broker/dealers with which ATST has established a Commission Recapture Program. A Commission Recapture Program is any arrangement under which a broker/dealer applies a portion of the commissions received by such broker/dealer on the security transactions to the Fund. In no event will commissions paid by the Fund be used to pay expenses that would otherwise be borne by any other funds within ATST, or by any other party.
Recaptured commissions during the year ended December 31, 2007 of $9 are included in net realized gain in the Statement of Operations.
Securities lending: The Fund may lend securities to qualified borrowers, with State Street acting as the Fund’s lending agent. The Fund earns negotiated lenders’ fees. The Fund receives cash and/or securities as collateral against the loaned securities. Cash collateral received is invested in short term, interest bearing securities. The Fund monitors the market value of securities loaned on a daily basis and requires collateral in an amount at least equal to the value of the securities loaned. Income from loaned securities earned by State Street for its services, shown in the Statement of Operations is net of fees, in the amount of $9.
The Fund has invested the cash collateral received from securities loaned in the following short-term, interest-bearing securities:
11
NOTES TO FINANCIAL STATEMENTS (continued)
At December 31, 2007
(all amounts in thousands)
NOTE 1.-(continued)
Abbey National PLC, Eurodollar Term, 5.00%, 1/7/2008 | | $ | 273 | |
ABN AMRO Bank NV, Eurodollar Term, 5.18%, 1/4/2008 | | 218 | |
Bank of Nova Scotia, Eurodollar Term, 4.96%, 1/22/2008 | | 191 | |
Barclays, Eurodollar Term, 5.00%, 2/12/2008 | | 382 | |
BNP Paribas, Eurodollar Term, 5.01%, 1/11/2008 | | 355 | |
Calyon, Eurodollar Term, 5.12%, 3/3/2008 | | 82 | |
Credit Suisse First Boston Corp., Repurchase Agreement, 4.60%, 1/2/2008 | | 710 | |
Dexia Group, Eurodollar Term, 4.82%, 1/3/2008 | | 273 | |
HBOS Halifax Bank of Scotland, Eurodollar Term, 5.15%, 1/2/2008 | | 136 | |
JPMorgan Chase & Co., Eurodollar Term, 5.15%, 2/12/2008 | | 136 | |
Lloyds TSB Bank, Eurodollar Term, 5.15%, 1/24/2008 | | 273 | |
Merrill Lynch & Co. (RPG), Repurchase Agreement, 4.60%, 1/2/2008 | | 409 | |
Morgan Stanley & Co. (Corp. Repo), Repurchase Agreement, 4.60%, 1/2/2008 | | 1,119 | |
Rabobank Nederland, Eurodollar Term, 5.08%, 1/10/2008 | | 327 | |
Reserve Primary Money Market Fund, 4.95% | | 291 | |
Royal Bank of Scotland, Eurodollar Term, 5.00%, 2/25/2008 | | 328 | |
Societe Generale, Eurodollar Term, 5.15%, 3/3/2008 | | 164 | |
Toronto Dominion Bank, Eurodollar Term, 5.05%, 1/10/2008 | | 327 | |
UBS AG, Eurodollar Term, 4.92%, 1/11/2008 | | 191 | |
Wells Fargo, Bank Note, 4.75%, 1/8/2008 | | 136 | |
| | | |
| | $ | 6,321 | |
Real Estate Investment Trusts (“REITs”): There are certain additional risks involved in investing in REITs. These include, but are not limited to, economic conditions, changes in zoning laws, real estate values, property taxes and interest rates.
Security transactions and investment income: Security transactions are recorded on the trade date. Security gains and losses are calculated on the first-in, first-out basis. Dividend income, if any, is recorded on the ex-dividend date or, in the case of foreign securities, as soon as the Fund is informed of the ex-dividend date. Interest income, including accretion of discounts and amortization of premiums, is recorded on the accrual basis commencing on the settlement date.
Futures contracts: The Fund may enter into futures contracts to manage exposure to market, interest rate or currency fluctuations. Futures contracts are valued at the settlement price established each day by the board of trade or exchange on which they are traded. The primary risks associated with futures contracts are imperfect correlation between the change in market value of the securities held and the prices of futures contracts; the possibility of an illiquid market and inability of the counterparty to meet the contract terms.
The underlying face amount of open futures contracts at December 31, 2007, are listed in the Schedule of Investments. The variation margin receivable or payable, as applicable, is included in the Statement of Assets and Liabilities. Variation margin represents the additional payments due or excess deposits made in order to maintain the equity account at the required margin level.
Dividend distributions: Dividends and capital gains distributions are typically declared and reinvested annually and are generally paid and reinvested on the business day following the ex-date.
NOTE 2. RELATED PARTY TRANSACTIONS
ATST serves as a funding vehicle for certain affiliated asset allocation portfolios and certain affiliated separate accounts of Western Reserve Life Assurance Co. of Ohio, Transamerica Life Insurance Company, Transamerica Financial Life Insurance Company, Inc.,Monumental Life Insurance Company and Transamerica Occidental Life Insurance Company.
Transamerica Fund Advisors, Inc. (“TFAI”) is the Fund’s investment adviser. Transamerica Fund Services, Inc. (“TFS”) is the Fund’s administrator and transfer agent. Prior to May 1, 2007, AFSG Securities Corp. (“AFSG”), was the Fund’s distributor. Transamerica Capital Inc. (“TCI”) is now the Fund’s distributor. TFAI, TFS, AFSG, and TCI are affiliates of AEGON NV, a Netherlands corporation.
Certain officers and trustees of the Fund are also officers and/or directors of TFAI, TFS and TCI.
Investment advisory fees: The Funds pay management fees to TFAI based on average daily net assets (“ANA”) at the following breakpoints:
0.74% of the first $750 million of ANA
0.69% of the next $250 million of ANA
0.65% of ANA over $1 billion
TFAI has contractually agreed to waive its advisory fee and will reimburse the Fund to the extent that operating expenses, excluding 12b-1 fees, exceed the following stated annual limit:
0.84% Expense Limit
If total Fund expenses fall below the annual expense limitation agreement agreed to by the adviser within the succeeding three years, the Fund may be required to pay the adviser a portion or all of the waived advisory fees.
There were no amounts recaptured during the year ended December 31, 2007. There are no amounts available for recapture at December 31, 2007.
Distribution and service fees: ATST entered into a Distribution Agreement with AFSG dated January 1, 1997, as amended. On May 1, 2007, the Distribution Agreement was amended to replace AFSG with TCI as the Fund’s distributor. The Fund has also adopted a distribution plan (“Distribution Plan”) pursuant to Rule 12b-1 under the 1940 Act.
Under the Distribution Plan for the Initial Class shares, TCI, on behalf of the Fund, is authorized to pay various service providers, as direct payment for expenses incurred in connection with distribution of the Fund’s shares, amounts equal to actual expenses associated with distributing the shares.
The Distribution Plan for the Service Class shares requires ATST to pay distribution fees to TCI as compensation for its activities, not as reimbursement for specific expenses. The fee on the Service Class is paid to the insurance companies for providing services and account maintenance for their policyholders who invest in the variable insurance products which invest in the Service Class shares.
12
NOTES TO FINANCIAL STATEMENTS (continued)
At December 31, 2007
(all amounts in thousands)
NOTE 2.-(continued)
The Fund is authorized under the Distribution Plan to pay fees on each class up to the following limits:
Initial Class | | 0.15 | % |
Service Class | | 0.25 | % |
TCI has determined that it will not seek payment by the Fund of the distribution expenses incurred with respect to the Initial Class shares before April 30, 2009. Prior to TCI seeking reimbursement of future expenses, policy and contract owners will be notified in advance. The Fund will pay fees relating to Service Class shares.
Administrative services: The Fund has entered into an agreement with TFS for financial and legal fund administration services. The Fund pays TFS an annual fee of 0.02% of ANA. The Legal fees on the Statement of Operations are for fees paid to external legal counsel.
Deferred compensation plan: Each eligible independent Fund Trustee may elect participation in a non-qualified deferred compensation plan (“the Plan”). Under the plan, such Trustees may defer payment of all or a portion of their total fees earned as a Fund Trustee. Each Trustee who is a participant in the Plan may elect that the earnings, losses or gains credited to his or her deferred fee amounts be determined based on a deemed investment in any series of Transamerica IDEX Mutual Funds. The right of a participant to receive a distribution from the Plan of the deferred fees is an unsecured claim against the general assets of all series of Transamerica IDEX Mutual Funds. The pro rata liability to the Fund of all deferred fees in the Plan amounted, as of December 31, 2007, to $8. Amounts deferred under the Deferred Compensation Plan are unfunded against the general assets of ATST.
Retirement plan: Under a retirement plan (the “Emeritus Plan”) available to the Independent Trustees, each Independent Trustee is deemed to have elected to serve as Trustee Emeritus of ATST upon his or her termination of service, other than removal for cause, is entitled to 50% of the trustee’s current retainer for a maximum period of five years determined by his or her years of service as a Trustee.
Such amounts shall be accrued by ATST on a pro rata basis allocable to each series of ATST fund based on the relative assets of the series. If retainers increase in the future, past accruals (and credits) will be adjusted upward so that 50% of the Trustee’s current retainer is accrued and credited at all times. Upon death, disability or termination of service, other than removal for cause, amounts deferred become payable to a Trustee Emeritus (or his/her beneficiary). Upon the commencement of service as Trustee Emeritus, compensation will be paid on a quarterly basis during the time period that the Trustee Emeritus is allowed to serve as such.
Amounts accrued under the Emeritus Plan are unsecured claims against the general assets of ATST. For the year ended December 31, 2007, the amount related to the Emeritus Plan was $8. As of December 31, 2007, the Fund has not made any payments related to the Emeritus Plan.
The Emeritus Plan was terminated effective October 30, 2007. Upon the termination, the Fund shall continue to pay any remaining benefits in accordance with the Plan, but no further compensation shall accrue under the Plan.
NOTE 3. INVESTMENT TRANSACTIONS
The cost of securities purchased and proceeds from securities sold (excluding short-term securities) for the year ended December 31, 2007 were as follows:
Purchases of securities: | | | |
Long-term | | $ | 105,043 | |
U.S. Government | | — | |
Proceeds from maturities and sales of securities: | | | |
Long-term | | 139,002 | |
U.S. Government | | 310 | |
| | | | |
NOTE 4. FEDERAL INCOME TAX MATTERS
The Fund has not made any provision for federal income or excise taxes due to its policy to distribute all of its taxable income and capital gains to its shareholders and otherwise qualify as a regulated investment company under Subchapter M of the Internal Revenue Code. Income and capital gain distributions are determined in accordance with income tax regulations, which may differ from GAAP. These differences are primarily due to differing treatment for items including, but not limited to, wash sales, and REITs.
Therefore, distributions determined in accordance with tax regulations may differ significantly in amount or character from net investment income and realized gains for financial reporting purposes. Financial reporting records are adjusted for permanent book/tax differences to reflect tax character. Financial records are not adjusted for temporary differences. These reclassifications are as follows:
Additional paid-in capital | | $ | — | |
Undistributed (accumulated) net investment income (loss) | | $ | (94 | ) |
Undistributed (accumulated) net realized gain (loss) from investment securities | | $ | 94 | |
The tax character of distributions paid may differ from the character of distributions shown in the Statements of Changes in Net Assets due to short-term gains being treated as ordinary income for tax purposes. The tax character of distributions paid during 2006 and 2007 was as follows:
2006 Distributions paid from: | | | |
Ordinary Income | | $ | 2,022 | |
Long-term Capital Gain | | — | |
2007 Distributions paid from: | | | |
Ordinary Income | | 3,067 | |
Long-term Capital Gain | | 4,007 | |
| | | | |
13
NOTES TO FINANCIAL STATEMENTS (continued)
At December 31, 2007
(all amounts in thousands)
NOTE 4.-(continued)
The tax basis components of distributable earnings as of December 31, 2007 are as follows:
Undistributed Ordinary Income | | $ | 7,203 | |
Undistributed Long-term Capital Gain | | $ | 19,419 | |
Capital Loss Carryforward | | $ | — | |
Net Unrealized Appreciation (Depreciation) | | $ | 13,941 | |
NOTE 5. REGULATORY PROCEEDINGS
There continues to be significant federal and state regulatory activity relating to financial services companies, particularly mutual fund companies and their investment advisers. As part of an ongoing investigation regarding potential market timing, recordkeeping and trading compliance issues and matters affecting the Fund’s investment adviser, TFAI, and certain affiliates and former employees of TFAI, the SEC staff has indicated that it is likely to take some action against TFAI and certain of its affiliates at the conclusion of the investigation. The potential timing and the scope of any such action is difficult to predict. Although the impact of any action brought against TFAI and/or its affiliates is difficult to assess at the present time, the Fund currently believes that the likelihood that any such action will have a material adverse impact is remote. It is important to note that the Fund is not aware of any allegation of wrongdoing against it and its Board at the time this annual report is printed. Although it is not anticipated that these developments will have an adverse impact on the Fund, there can be no assurance at this time. TFAI and its affiliates are actively working with the SEC in regard to this matter; however, the exact resolution cannot be determined at this time. TFAI will take such actions that it deems necessary or appropriate to continue providing management services to the Fund and to bring all matters to an appropriate conclusion.
TFAI and/or its affiliates, and not the Fund, will bear the costs regarding these regulatory matters.
NOTE 6. RECENTLY ISSUED ACCOUNTING PRONOUNCEMENTS
In July 2006, the Financial Accounting Standards Board (“FASB”) released FASB Interpretation No. 48 “Accounting for Uncertainty in Income Taxes” (“FIN 48”), an interpretation of FASB Statement No. 109. FIN 48 provides guidance for how uncertain tax positions should be recognized, measured, presented and disclosed in the financial statements. FIN 48 requires the accounting and disclosure of tax positions taken or expected to be taken in the course of preparing the Fund’s tax returns to determine whether the tax positions are “more-likely- than-not” of being sustained by the applicable tax authority. Tax positions not deemed to meet the more-likely-than-not threshold would be recorded as a tax benefit or expense in the current year.
Adoption of FIN 48 is effective during the first required financial reporting period for fiscal years beginning after December 15, 2006. Management adopted FIN 48 on June 29, 2007.
Implementation of FIN 48 requires Management of the Fund to analyze all open tax years, as defined by the Statute of Limitations, for all major jurisdictions, which includes federal and certain states. Open tax years are those that are open for exam by taxing authorities (i.e., the last 4 tax year ends and the interim tax period since then). The Fund has no examinations in progress and none are expected at this time.
Management of the Fund has reviewed all open tax years and major jurisdictions and concluded the adoption of FIN 48 resulted in no impact to the Fund’s net assets or results of operations. There is no tax liability resulting from unrecognized tax benefits relating to uncertain income tax positions taken or expected to be taken in future tax returns. The Fund is also not aware of any tax positions for which it is reasonably possible that the total amounts of unrecognized tax benefits will significantly change in the next 12 months.
In September 2006, FASB issued its new Standard No. 157, “Fair Value Measurements” (“FAS 157”). FAS 157 is designed to unify guidance for the measurement of fair value of all types of assets, including financial instruments, and certain liabilities, throughout a number of accounting standards. FAS 157 also establishes a hierarchy for measuring fair value in generally accepted accounting principles and expands financial statement disclosures about fair value measurements that are relevant to mutual funds. FAS 157 is effective for financial statements issued for fiscal years beginning after November 15, 2007, and earlier application is permitted.
As of December 31, 2007, Management does not expect the adoption of FAS 157 to impact the amounts reported in the financial statements, however, additional disclosures will be required about the inputs used to develop the measurements of fair value and the effect of certain of the measurements reported in the statement of operations for a fiscal period.
NOTE 7. SUBSEQUENT EVENT
Effective January 1, 2008, TFAI changed its name to Transamerica Asset Management, Inc.
Effective May 1, 2008, AEGON/Transamerica Series Trust will change its name to Transamerica Series Trust. At that time, the Fund will also change its name to Transamerica JPMorgan Enhanced Index VP.
14
Report of Independent Registered Certified Public Accounting Firm
To the Board of Trustees and Shareholders of
JPMorgan Enhanced Index:
In our opinion, the accompanying statement of assets and liabilities, including the schedule of investments, and the related statements of operations and of changes in net assets and the financial highlights present fairly, in all material respects, the financial position of JPMorgan Enhanced Index (the “Fund”) (one of the portfolios constituting AEGON/Transamerica Series Trust) at December 31, 2007, the results of its operations for the year then ended, the changes in its net assets for each of the two years in the period then ended and the financial highlights for each of the periods presented, in conformity with accounting principles generally accepted in the United States of America. These financial statements and financial highlights (hereafter referred to as “financial statements”) are the responsibility of the Fund’s management; our responsibility is to express an opinion on these financial statements based on our audits. We conducted our audits of these financial statements in accordance with the standards of the Public Company Accounting Oversight Board (United States). Those standards require that we plan and perform the audit to obtain reasonable assurance about whether the financial statements are free of material misstatement. An audit includes examining, on a test basis, evidence supporting the amounts and disclosures in the financial statements, assessing the accounting principles used and significant estimates made by management, and evaluating the overall financial statement presentation. We believe that our audits, which included confirmation of securities at December 31, 2007 by correspondence with the custodian and brokers, provide a reasonable basis for our opinion.

Tampa, Florida
February 29, 2008
15
JPMorgan Enhanced Index
SUPPLEMENTAL TAX INFORMATION (unaudited)
(all amounts in thousands)
For tax purposes, the Fund has made a Long-Term Capital Gain Designation of $4,007 for the year ended December 31, 2007.
RESULTS OF SHAREHOLDER PROXY (unaudited)
At a special meeting of shareholders held on October 30, 2007, the results of the Proposals were as follows:
Proposal 1: To elect a new Board:
Proposed
Trustee | | For | | Against | | Abstentions/Broker Non-
Votes | |
John K. Carter | | 2,274,998,840.817 | | 57,804,698.755 | | 35,433.883 | |
| | | | | | | |
Leo J. Hill | | 2,277,212,702.754 | | 55,590,836.819 | | 35,433.883 | |
| | | | | | | |
Neal M. Jewell | | 2,266,793,295.663 | | 66,010,243.909 | | 35,433.883 | |
| | | | | | | |
Russell A. Kimball, Jr. | | 2,274,825,235.835 | | 57,978,303.737 | | 35,433.883 | |
| | | | | | | |
Eugene M. Mannella | | 2,274,623,165.033 | | 58,180,374.539 | | 35,433.883 | |
| | | | | | | |
Norm R. Nielsen | | 2,275,050,055.885 | | 57,753,483.687 | | 35,433.883 | |
| | | | | | | |
Joyce Galpern Norden | | 2,270,278,122.250 | | 62,525,417.323 | | 35,433.883 | |
| | | | | | | |
Patricia L. Sawyer | | 2,275,737,737.456 | | 57,065,802.116 | | 35,433.883 | |
| | | | | | | |
John W. Waechter | | 2,276,615,120.140 | | 56,188,419.433 | | 35,433.883 | |
Proposal 2: To approve an amendment to the Agreement and Declaration of Trust:
| | | | Abstentions/Broker Non- | |
For | | Against | | Votes | |
2,182,022,669.110 | | 77,590,048.544 | | 73,226,255.801 | |
16
JPMorgan Enhanced Index
INVESTMENT ADVISORY AND SUB-ADVISORY AGREEMENTS-REVIEW AND RENEWAL (unaudited)
At a meeting of the Board of Trustees of AEGON/Transamerica Series Trust (“ATST”) held on December 4th, 2007, the Board reviewed and considered the renewal of the investment advisory agreement (the “Investment Advisory Agreement”) between JP Morgan Enhanced Index (the “Fund”) and Transamerica Fund Advisors, Inc. (“TFAI”), as well as the renewal of the investment sub-advisory agreement (the “Sub-Advisory Agreement”) of the Fund between TFAI and JP Morgan Investment Management Inc. (the “Sub-Adviser”), to determine whether the agreements should be renewed for a six-month period. It was noted that this review was interim in nature to align all the Funds on the same calendar, and that the Funds’ advisory arrangements would be reviewed again in the first half of 2008.
Following their review and consideration, the Trustees determined that the renewal of the Investment Advisory Agreement and the Sub- Advisory Agreement would enable shareholders of the Fund to obtain high quality services at a cost that is appropriate, fair, and in the best interests of its shareholders. The Board, including the independent members of the Board, unanimously approved the renewal of the Investment Advisory Agreement and Sub-Advisory Agreement. In reaching their decision, the Trustees requested and obtained from TFAI and the Sub-Adviser such information as they deemed reasonably necessary to evaluate the agreements, including information about fees and performance of comparable funds managed by the Sub-Adviser. The Trustees also carefully considered information they had previously received from TFAI and the Sub-Adviser throughout the year as part of their regular oversight of the Fund, as well as comparative fee, expense, and performance information prepared by Lipper Inc. (“Lipper”), an independent provider of mutual fund performance, fee and expense information and profitability data prepared by management. In considering the proposed continuation of the Investment Advisory and Sub-Advisory Agreements, the Trustees evaluated a number of considerations that they believed, in light of the legal advice furnished to them by independent legal counsel and their own business judgment, to be relevant. They based their decisions on a variety of factors, including the following considerations, among others, although they did not identify any consideration or particular information that was controlling of their decisions:
The nature, extent and quality of the advisory services to be provided. The Board considered the nature and quality of the services provided by TFAI and the Sub-Adviser to the Fund in the past, as well as the services anticipated to be provided in the future. The Board concluded that TFAI and the Sub-Adviser are capable of providing high quality services to the Fund, as indicated by the nature and quality of services provided in the past by TFAI and the Sub-Adviser for this series and the experience, capability and integrity of TFAI’s senior management, the financial resources of TFAI and the Sub-Adviser, TFAI’s management oversight process and the professional qualifications of the portfolio management team of the Sub-Adviser. The Trustees determined that TFAI and the Sub-Adviser can provide investment and related services that are appropriate in scope and extent in light of the Fund’s operations, the competitive landscape of the investment company business and investor needs.
The investment performance of the Fund. The Board examined the short and longer-term performance of the Fund, including relative performance against a peer universe of comparable mutual funds as prepared by Lipper for various trailing periods ended June 30, 2007. The Board noted the Fund performed in-line with its peer universe of funds for all relevant periods. On the basis of the Board’s assessment of the nature, extent and quality of advisory services to be provided or procured by TFAI and the Sub-Adviser, the Board concluded that TFAI and the Sub-Adviser are capable of providing a level of investment performance that is appropriate in light of the Fund’s proposed investment objectives, policies and strategies and competitive with other similarly situated investment companies.
The cost of advisory services provided and the level of profitability. The Board reviewed profitability information of TFAI’s cost of procuring fund management services, as well as the costs of provision of administration, fund accounting and other services, to the Fund and to ATST as a whole by TFAI and its affiliates. The Board reviewed the management and sub-advisory fees for the Fund. The Board noted that advisory fees are generally in line with the peer universe of funds and total expenses are close to the median of the expense universe. Based on their review, the Trustees determined that the management fees of the Fund generally are appropriate in light of the services expected to be provided or procured, the management fees and the anticipated profitability of the relationship between the Fund, TFAI and its affiliates, and the Sub-Adviser. In making these observations and determinations, the Board reviewed, among other things, comparative information provided by Lipper.
Whether fee levels reflect economies of scale and the extent to which economies of scale would be realized as the Fund grows. In evaluating the extent to which the management fees payable under the Investment Advisory and Sub-Advisory Agreements reflect economies of scale or will permit economies of scale to be realized in the future, the Board noted that TFAI and the Sub-Adviser offer a breakpoint which appropriately benefit investors by passing on economies of scale in the form of lower management fees as the level of assets grows. The Board further noted the Advisor offers an additional breakpoint above the level offered by the Sub-Advisor. The Trustees also concluded that they will have the opportunity to periodically reexamine whether the Fund has achieved economies of scale, and the appropriateness of management fees payable to TFAI and fees paid to the Sub-Adviser, in the future.
Benefits (such as soft dollars) to TFAI, its affiliates, or the Sub-Adviser from their relationship with the Fund. The Board concluded that other benefits anticipated to be derived by TFAI, its affiliates, and the Sub-Adviser from their relationships with the Fund are expected to be reasonable and fair, and consistent with industry practice and the best interests of the Fund and its shareholders. The Trustees noted that TFAI would not realize soft dollar benefits from its relationship with the Fund. The Board also noted that the Sub- Adviser is participating in a brokerage program pursuant to which a portion of brokerage commissions paid by the Fund is recaptured for the benefit of the Fund and its shareholders, thus limiting the amount of soft dollar arrangements the Sub-Adviser may engage in with respect to the Fund’s brokerage transactions.
17
Other considerations. The Board determined that TFAI has made a substantial commitment to the recruitment and retention of high quality personnel, and maintains the financial, compliance and operational resources reasonably necessary to manage the Fund in a professional manner that is consistent with the best interests of the Fund and its shareholders. In this regard, the Trustees favorably considered the procedures and policies in place by TFAI to enforce compliance with applicable laws and regulations and oversee the portfolio management activities of the Sub-Adviser. The Trustees also determined that TFAI has made a significant entrepreneurial commitment to the management and success of the Fund, reflected by TFAI’s expense limitation and fee waiver arrangements with the Fund which may result in TFAI waiving a substantial amount of management fees for the benefit of shareholders.
18
JPMorgan Mid Cap Value
MARKET ENVIRONMENT
U.S. equity markets began the first half of 2007 on solid footing as investors were fairly optimistic that the broad economy could experience a soft landing and maintain sustainable levels of growth. However, heavier-than-expected reported losses due to sub-prime mortgage exposure at major financial institutions, the collapse of the U.S. housing market and higher energy and commodity prices contributed to fears of an eventual U.S. recession and levels of market volatility not seen since the early 2000s.
Large-cap stocks outperformed small caps in 2007 as the Standard and Poor’s 500 Index posted a return of 5.49% while the Russell 2000 Index lost ground, returning (1.57)%. Growth indexes across all capitalizations handily outperformed value indexes, which were more heavily weighted to financials, as value stocks posted declines for the year.
PERFORMANCE
For the year ended December 31, 2007, JPMorgan Mid Cap Value, Initial Class returned 2.83%. By comparison its benchmark, the Russell Midcap Value Index (Russell Midcap Value”), returned (1.42)%.
STRATEGY REVIEW
The portfolio outperformed the Russell Midcap Value mostly due to stock selection in the financial and consumer discretionary sectors, while energy and materials detracted from performance.
At the individual stock level, shares of The Williams Companies, Inc. soared, prompted by the sale of the majority of its power- trading business to The Bear Stearns Companies Inc. and consecutive quarters of impressive earnings. The sale of its power business was expected to reduce both earnings volatility and borrowing costs while allowing the company to focus its efforts on its core natural gas business.
Another top contributor was Assurant, Inc., which reported solid earnings results throughout the year, was driven by increased premium growth in its specialty property unit and higher-thanexpected investment income. Analysts revised earnings estimates upward, based on lower-than-expected year-to-date catastrophic losses and increased volumes in its creditor-placed homeowner’s business as homeowners’ insurance policies were allowed to lapse and mortgage foreclosures continued to mount.
Detracting from performance was M&T Bank Corporation (“M&T”), a Mid-Atlantic regional bank, as concerns over sub- prime mortgages significantly devalued its portfolio of Alt-A mortgage loans, causing an earnings shortfall for M&T early in the year. M&T also posted disappointing third-quarter results due to losses from loans caused by rising delinquencies and depreciation of its investment in a Florida commercial mortgage lender.
Old Republic International Corporation, an insurer, also detracted from performance. While the company posted solid results in its property casualty segment, declining revenues in its mortgage guaranty and title insurance segments pressured results.
Jonathan K.L. Simon
Lawrence Playford, CFA, CPA
Gloria Fu, CFA
Co-Portfolio Managers
J.P. Morgan Investment Management Inc.
AEGON/Transamerica Series Trust | | Annual Report 2007 |
JPMorgan Mid Cap Value |
1
JPMorgan Mid Cap Value
(unaudited)

Average Annual Total Return for Periods Ended 12/31/2007
| | | | | | From | | Inception | |
| | 1 Year | | 5 Years | | Inception | | Date | |
| | | | | | | | | |
Initial Class | | 2.83 | % | 14.66 | % | 8.40 | % | 5/3/99 | |
Russell Midcap Value (1) | | (1.42 | )% | 17.92 | % | 10.45 | % | 5/3/99 | |
| | | | | | | | | |
Service Class | | 2.53 | % | — | % | 14.59 | % | 5/1/03 | |
NOTES
(1) The Russell Midcap Value (Russell Midcap Value) Index is an unmanaged index used as a general measure of market performance. Calculations assume dividends and capital gains are reinvested and do not include any managerial expenses. From inception calculation is based on life of Initial Class shares.
The performance data presented represents past performance, future results may vary. The portfolio’s investment return and net asset value will fluctuate. Past performance does not guarantee future results. Investor’s units when redeemed, may be worth more or less than their original cost.
Current performance may be lower or higher than performance quoted. Please visit your insurance company’s website for contract or policy level standardized total returns current to the most recent month end. Portfolio performance is net of investment fees and fund expenses, but not product charges, which, if included, would significantly lower the performance quoted.
This material must be preceded or accompanied by a current prospectus, which includes specific contents regarding the investment objectives, explanation of share classes and policies of this portfolio.
This Fund was closed to new investors and new share purchases effective close of business December 9, 2005..
2
JPMorgan Mid Cap Value
UNDERSTANDING YOUR FUNDS EXPENSES
(unaudited)
SHAREHOLDER EXPENSES
Fund shareholders may incur ongoing costs, including management and advisory fees, distribution and service fees, and other fund expenses.
The following Example is intended to help you understand your ongoing costs (in dollars and cents) of investing in the Fund and to compare these costs with the ongoing costs of investing in other funds.
The Example is based on an investment of $1,000 invested at July 1, 2007 and held for the entire period until December 31, 2007.
ACTUAL EXPENSES
The first line in the table below provides information about actual account values and actual expenses. You may use the information in this line, together with the amount you invested, to estimate the expenses that you paid over the period. Simply divide your account value by $1,000 (for example, an $8,600 account value divided by $1,000 = 8.6), then multiply the result by the number in the first line of your Fund under the heading entitled “Expenses Paid During Period” to estimate the expenses you paid on your account during this period.
HYPOTHETICAL EXAMPLE FOR COMPARISON PURPOSES
The second line in the table below provides information about hypothetical account values and hypothetical expenses based on the Fund’s actual expense ratio and an assumed rate of return of 5% per year before expenses, which is not the Fund’s actual return. The hypothetical account values and expenses may not be used to estimate the actual ending account balance or expenses you paid for the period. You may use this information to compare the ongoing costs of investing in your Fund and other funds.
Please note that the expenses shown in the table are meant to highlight your ongoing costs only and do not reflect any transactional costs, such as sales charges, redemption fees, brokerage commissions paid on purchases and sales of fund shares. Therefore, the second line under the Fund in the table is useful in comparing ongoing costs only, and will not help you determine the relative total costs of owning different funds. If any of these transaction costs were included, your costs would be higher. The expenses shown in the table do not reflect any fees that may be charged to you by brokers, financial intermediaries or other financial institutions.
| | Beginning
Account
Value | | Ending
Account
Value | | Annualized
Expense
Ratio | | Expenses
Paid During
Period (a) | |
| | | | | | | | | |
Initial Class | | | | | | | | | |
Actual | | $ | 1,000.00 | | $ | 953.10 | | 0.87 | % | $ | 4.28 | |
Hypothetical (b) | | 1,000.00 | | 1,020.82 | | 0.87 | | 4.43 | |
| | | | | | | | | |
Service | | | | | | | | | |
Class Actual | | 1,000.00 | | 951.66 | | 1.12 | | 5.51 | |
Hypothetical (b) | | 1,000.00 | | 1,019.56 | | 1.12 | | 5.70 | |
| | | | | | | | | | | | |
(a) Expenses are calculated using the Fund’s annualized expense ratio (as disclosed in the table), multiplied by the average account value for the period, multiplied by the number of days in the period (184 days), and divided by the number of days in the year (365 days).
(b) 5% return per year before expenses.
GRAPHICAL PRESENTATION OF SCHEDULE OF INVESTMENTS
By Sector
At December 31, 2007
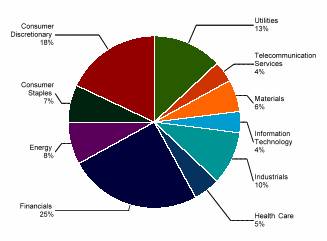
This chart shows the percentage breakdown by sector of the Fund’s total investment securities.
3
JPMorgan Mid Cap Value
SCHEDULE OF INVESTMENTS
At December 31, 2007
(all amounts except share amounts in thousands)
| | Shares | | Value | |
COMMON STOCKS (97.4%) | | | | | |
Aerospace & Defense (1.2%) | | | | | |
Alliant Techsystems, Inc. ‡ | | 34,400 | | $ | 3,913 | |
Auto Components (0.8%) | | | | | |
Wabco Holdings, Inc. | | 53,500 | | 2,680 | |
Beverages (2.4%) | | | | | |
Brown-Forman Corp. Class B ^ | | 80,100 | | 5,936 | |
Constellation Brands, Inc. Class A ‡ | | 93,880 | | 2,220 | |
Building Products (0.4%) | | | | | |
Owens Corning, Inc. ‡^ | | 73,600 | | 1,488 | |
Capital Markets (2.2%) | | | | | |
Affiliated Managers Group, Inc. ‡^ | | 17,750 | | 2,085 | |
Legg Mason, Inc. | | 6,600 | | 483 | |
Northern Trust Corp. | | 29,900 | | 2,289 | |
T. Rowe Price Group, Inc. | | 43,000 | | 2,618 | |
Chemicals (3.6%) | | | | | |
Albemarle Corp. | | 103,300 | | 4,261 | |
PPG Industries, Inc. | | 62,900 | | 4,418 | |
Sigma-Aldrich Corp. | | 60,500 | | 3,303 | |
Commercial Banks (6.3%) | | | | | |
Cullen/Frost Bankers, Inc. | | 62,900 | | 3,186 | |
M&T Bank Corp. | | 72,400 | | 5,906 | |
Synovus Financial Corp. | | 352,500 | | 8,488 | |
Wilmington Trust Corp. | | 78,900 | | 2,777 | |
Zions Bancorporation | | 19,760 | | 923 | |
Commercial Services & Supplies (1.1%) | | | | | |
Republic Services, Inc. Class A | | 121,750 | | 3,817 | |
Computers & Peripherals (0.8%) | | | | | |
NCR Corp. ‡ | | 104,400 | | 2,620 | |
Construction Materials (0.5%) | | | | | |
Vulcan Materials Co. ^ | | 23,200 | | 1,835 | |
Containers & Packaging (1.2%) | | 90,300 | | 4,064 | |
Ball Corp. | | | | | |
Diversified Telecommunication Services (2.0%) | | | | | |
CenturyTel, Inc. | | 64,100 | | 2,657 | |
Windstream Corp. | | 316,960 | | 4,127 | |
Electric Utilities (8.9%) | | | | | |
American Electric Power Co., Inc. | | 129,900 | | 6,048 | |
CMS Energy Corp. ^ | | 252,100 | | 4,381 | |
FirstEnergy Corp. | | 73,900 | | 5,346 | |
PG&E Corp. | | 137,400 | | 5,921 | |
Westar Energy, Inc. | | 172,400 | | 4,472 | |
Xcel Energy, Inc. | | 164,500 | | 3,713 | |
Electrical Equipment (1.0%) | | 75,600 | | 3,541 | |
Ametek, Inc. ^ | | | | | |
Electronic Equipment & Instruments (2.3%) | | | | | |
Amphenol Corp. Class A | | 56,800 | | 2,634 | |
Arrow Electronics, Inc. ‡ | | 128,300 | | 5,039 | |
Energy Equipment & Services (1.1%) | | | | | |
Helix Energy Solutions Group, Inc. ‡ | | 92,500 | | 3,839 | |
Food & Staples Retailing (2.3%) | | | | | |
Safeway, Inc. | | 80,100 | | 2,740 | |
Supervalu, Inc. | | 135,400 | | $ | 5,080 | |
Food Products (0.6%) | | | | | |
Dean Foods Co. | | 45,700 | | 1,182 | |
WM Wrigley Jr. Co. | | 15,800 | | 925 | |
Gas Utilities (4.1%) | | | | | |
Energen Corp. | | 76,800 | | 4,933 | |
Oneok, Inc. | | 59,400 | | 2,659 | |
Questar Corp. | | 64,100 | | 3,468 | |
UGI Corp. | | 102,200 | | 2,785 | |
Health Care Providers & Services (4.2%) | | | | | |
Community Health Systems, Inc. ‡ | | 88,800 | | 3,273 | |
Coventry Health Care, Inc. ‡ | | 127,350 | | 7,545 | |
Henry Schein, Inc. ‡^ | | 6,059 | | 372 | |
Lincare Holdings, Inc.‡ | | 82,700 | | 2,908 | |
Hotels, Restaurants & Leisure (1.5%) | | | | | |
Burger King Holdings, Inc. | | 92,100 | | 2,626 | |
Marriott International, Inc. Class A | | 69,200 | | 2,365 | |
Household Durables (2.1%) | | | | | |
Fortune Brands, Inc. | | 72,700 | | 5,261 | |
Jarden Corp. ‡ | | 71,300 | | 1,683 | |
Household Products (1.1%) | | | | | |
Clorox Co. | | 59,500 | | 3,878 | |
Industrial Conglomerates (1.0%) | | | | | |
Carlisle Cos., Inc. | | 92,900 | | 3,440 | |
Insurance (10.4%) | | | | | |
AMBAC Financial Group, Inc. ^ | | 13,800 | | 356 | |
Assurant, Inc. | | 103,850 | | 6,948 | |
Cincinnati Financial Corp. | | 167,025 | | 6,604 | |
Everest RE Group, Ltd. | | 38,800 | | 3,895 | |
Old Republic International Corp. | | 367,825 | | 5,668 | |
OneBeacon Insurance Group, Ltd. Class A | | 152,147 | | 3,271 | |
Principal Financial Group, Inc. ^ | | 66,700 | | 4,592 | |
W.R. Berkley Corp. | | 121,900 | | 3,634 | |
IT Services (0.7%) | | | | | |
Western Union Co. (The) | | 94,400 | | 2,292 | |
Machinery (2.8%) | | | | | |
Dover Corp. | | 126,200 | | 5,817 | |
Oshkosh Truck Corp. | | 74,800 | | 3,535 | |
Media (4.6%) | | | | | |
Cablevision Systems Corp. Class A ‡ | | 144,100 | | 3,530 | |
Clear Channel Communications, Inc. | | 75,800 | | 2,617 | |
Clear Channel Outdoor Holdings, Inc. Class A ‡^ | | 77,284 | | 2,138 | |
Lamar Advertising Co. Class A ^ | | 34,200 | | 1,644 | |
Omnicom Group, Inc. | | 43,100 | | 2,048 | |
Washington Post Co. (The) Class B | | 4,450 | | 3,522 | |
Metals & Mining (0.3%) | | | | | |
Carpenter Technology Corp. | | 15,000 | | 1,128 | |
Oil, Gas & Consumable Fuels (6.3%) | | | | | |
CVR Energy, Inc. ‡ | | 38,300 | | 955 | |
The notes to the financial statements are an integral part of this report.
4
| | Shares | | Value | |
Oil, Gas & Consumable Fuels (continued) | | | | | |
Devon Energy Corp. | | 77,400 | | $ | 6,882 | |
Kinder Morgan Management LLC ‡ | | 40,016 | | 2,118 | |
Teekay Corp. ^ | | 67,900 | | 3,613 | |
Williams Cos., Inc. | | 214,900 | | 7,689 | |
Pharmaceuticals (1.1%) | | | | | |
Warner Chilcott, Ltd. Class A ‡^ | | 203,800 | | 3,613 | |
Real Estate Investment Trusts (3.6%) | | | | | |
Plum Creek Timber Co., Inc. REIT ^ | | 36,700 | | 1,690 | |
Public Storage, Inc. REIT | | 44,700 | | 3,281 | |
Rayonier, Inc. REIT | | 99,003 | | 4,677 | |
Vornado Realty Trust REIT | | 29,100 | | 2,559 | |
Real Estate Management & Development (1.2%) | | | | | |
Brookfield Properties Corp. ^ | | 179,975 | | 3,465 | |
Forest City Enterprises, Inc. Class A | | 13,300 | | 591 | |
Road & Rail (0.8%) | | | | | |
Norfolk Southern Corp. | | 51,200 | | 2,583 | |
Software (0.5%) | | 71,000 | | 1,728 | |
Jack Henry & Associates, Inc. | | | | | |
Specialty Retail (5.8%) | | | | | |
AutoNation, Inc. ‡ | | 91,619 | | $ | 1,435 | |
AutoZone, Inc. ‡ | | 37,850 | | 4,539 | |
Limited Brands, Inc. ^ | | 128,700 | | 2,436 | |
Staples, Inc. | | 164,600 | | 3,797 | |
Tiffany & Co. | | 58,300 | | 2,683 | |
TJX Cos., Inc. | | 164,100 | | 4,715 | |
Textiles, Apparel & Luxury Goods (2.4%) | | | | | |
Columbia Sportswear Co. ^ | | 60,400 | | 2,663 | |
V.F. Corp. ^ | | 76,800 | | 5,273 | |
Thrifts & Mortgage Finance (1.1%) | | | | | |
People’s United Financial, Inc. ^ | | 209,300 | | 3,726 | |
Trading Companies & Distributors (1.7%) | | | | | |
Genuine Parts Co. | | 124,300 | | 5,755 | |
Wireless Telecommunication Services (1.4%) | | | | | |
Telephone & Data Systems, Inc. Class L | | 81,900 | | 4,717 | |
Total Common Stocks (cost $301,750) | | | | 328,573 | |
| | | | | |
Total Securities Lending Collateral (cost $37,523) (1) | | | | 37,523 | |
| | | | | |
Total Investment Securities (cost $339,273) # | | | | $ | 366,096 | |
NOTES TO SCHEDULE OF INVESTMENTS:
^ | | At December 31, 2007, all or a portion of this security is on loan (see Note 1). The value at December 31, 2007, of all securities on loan is $36,229. |
| | |
‡ | | Non Income Producing. |
| | |
(1) | | Cash collateral for the Repurchase Agreements, valued at $13,601, that serve as collateral for securities lending, are invested in corporate bonds with interest rates and maturity dates ranging from 3.00% - 10.18% and 04/28/2008 - 12/01/2096, respectively. |
| | |
# | | Aggregate cost for federal income tax purposes is $339,683. Aggregate gross unrealized appreciation for all securities in which there is an excess of value over tax cost and aggregate gross unrealized depreciation for all securities in which there is an excess of tax cost over value were $40,880, and $14,467, respectively. Net unrealized appreciation for tax purposes is $26,413. |
DEFINITIONS:
REIT Real Estate Investment Trust
The notes to the financial statements are an integral part of this report.
5
JPMorgan Mid Cap Value
SCHEDULE OF asset and liabilities
At December 31, 2007
(all amounts except share amounts in thousands)
Assets: | | | |
Investment securities, at value (cost: $339,273) | | $ | 366,096 | |
(including securities loaned of $36,229) | | | |
Cash | | 8 | |
Receivables: | | ,121 | |
Investment securities sold | | 349 | |
Interest | | 31 | |
Income from loaned securities | | 6 | |
Dividends | | 678 | |
| | 375,281 | |
Liabilities: | | | |
Investment securities purchased | | 37 | |
Accounts payable and accrued liabilities: | | | |
Shares redeemed | | 62 | |
Management and advisory fees | | 237 | |
Administration fees | | 6 | |
Due to custodian | | 64 | |
Payable for collateral for securities on loan | | 37,523 | |
Other | | 56 | |
| | 37,985 | |
Net Assets | | $ | 337,296 | |
| | | |
Net Assets Consist of: | | | |
Capital Stock ($.01 par value) | | $ | 214 | |
Additional paid-in capital | | 278,921 | |
Undistributed (accumulated) net investment income | | 3,530 | |
Undistributed (accumulated) net realized gain from investment securities | | 27,808 | |
Net unrealized appreciation on investment securities | | 26,823 | |
Net Assets | | $ | 337,296 | |
| | | |
Net Assets by Class: | | | |
Initial Class | | $ | 336,861 | |
Service Class | | 435 | |
Shares Outstanding: | | | |
Initial Class | | 21,335 | |
Service Class | | 28 | |
Net Asset Value and Offering Price Per Share: | | | |
Initial Class | | $ | 15.79 | |
Service Class | | 1 | |
| | 5.73 | |
SCHEDULE OF operations
For the year ended December 31, 2007
(all amounts in thousands)
Investment Income: | | | |
Dividends (net of withholding taxes on foreign dividends of $13) | | $ | 6,702 | |
Interest | | 306 | |
Income from loaned securities-net | | 77 | |
| | 7,085 | |
| | | |
Expenses: | | | |
Management and advisory fees | | 2,928 | |
Printing and shareholder reports | | 23 | |
Custody fees | | 51 | |
Administration fees | | 72 | |
Legal fees | | 7 | |
Audit fees | | 21 | |
Trustees fees | | 12 | |
Distribution and service fees: | | | |
Service Class | | 1 | |
Other | | 5 | |
Total expenses | | 3,120 | |
| | | |
Net Investment Income | | 3,965 | |
| | | |
Net Realized Gain (Loss) from: | | | |
Investment securities | | 28,059 | |
| | | |
Net Increase (Decrease) in Unrealized Appreciation(Depreciation) on: | | | |
| | | |
Investment securities | | (21,533 | ) |
| | | |
Net Realized and Unrealized Gain: | | 6,526 | |
Net Increase In Net Assets Resulting from Operations | | $ | 10,491 | |
The notes to the financial statements are an integral part of this report.
6
JPMorgan Mid Cap Value
STATEMENTS OF CHANGES IN NET ASSETS
For the years ended
(all amounts in thousands)
| | December 31,
2007 | | December 31,
2006 | |
Increase (Decrease) in Net Assets From: Operations: | | | | | |
Net investment income | | $ | 3,965 | | $ | 3,476 | |
Net realized gain from investment securities | | 28,059 | | 23,244 | |
Change in unrealized appreciation (depreciation) on investment securities | | (21,533 | ) | 27,408 | |
| | 10,491 | | 54,128 | |
Distributions to Shareholders: | | | | | |
From net investment income: | | | | | |
Initial Class | | (3,541 | ) | (2,803 | ) |
Service Class | | (3 | ) | (3 | ) |
| | (3,544 | ) | (2,806 | ) |
From net realized gains: | | | | | |
Initial Class | | (22,858 | ) | (32,907 | ) |
Service Class | | (29 | ) | (49 | ) |
| | (22,887 | ) | (32,956 | ) |
Capital Share Transactions: | | | | | |
Proceeds from shares sold: | | | | | |
Initial Class | | 2,391 | | 3,146 | |
Service Class | | 1 | | 17 | |
| | 2,392 | | 3,163 | |
Dividends and distributions reinvested: | | | | | |
Initial Class | | 26,399 | | 35,710 | |
Service Class | | 32 | | 52 | |
| | 26,431 | | 35,762 | |
Cost of shares redeemed: | | | | | |
Initial Class | | (29,503 | ) | (42,069 | ) |
Service Class | | (98 | ) | (199 | ) |
| | (29,601 | ) | (42,268 | ) |
| | (778 | ) | (3,343 | ) |
Net increase (decrease) in net assets | | (16,718 | ) | 15,023 | |
| | | | | |
Net Assets: | | | | | |
Beginning of year | | 354,014 | | 338,991 | |
End of year | | $ | 337,296 | | $ | 354,014 | |
Undistributed (Accumulated) Net Investment Income (Loss) | | $ | 3,530 | | $ | 3,545 | |
Share Activity: | | | | | |
Shares issued: | | | | | |
Initial Class | | 140 | | 192 | |
Service Class | | — | | 1 | |
| | 140 | | 193 | |
Shares issued-reinvested from distributions: | | | | | |
Initial Class | | 1,653 | | 2,363 | |
Service Class | | 2 | | 3 | |
| | 1,655 | | 2,366 | |
Shares redeemed: | | | | | |
Initial Class | | (1,751 | ) | (2,554 | ) |
Service Class | | (5 | ) | (12 | ) |
| | (1,756 | ) | (2,566 | ) |
Net increase (decrease) in shares outstanding: | | | | | |
Initial Class | | 42 | | 1 | |
Service Class | | (3 | ) | (8 | ) |
| | 39 | | (7 | ) |
The notes to the financial statements are an integral part of this report.
7
JPMorgan Mid Cap Value
FINANCIAL HIGHLIGHTS
For a share outstanding throughout each period(a)
| | Initial Class | |
| | Year Ended December 31, | |
| | 2007 | | 2006 | | 2005 | | 2004 | | 2003 | |
Net Asset Value | | | | | | | | | | | |
Beginning of period | | $ | 16.60 | | 15.89 | | 14.81 | | 12.93 | | 9.85 | |
Investment Operations | | $ | | $ | $ | | $ | | | | | |
Net investment income (loss) | | 0.19 | | 0.17 | | 0.13 | | 0.08 | | 0.01 | |
Net realized and unrealized gain (loss) | | 0.29 | | 2.39 | | 1.22 | | 1.81 | | 3.08 | |
Total operations | | 0.48 | | 2.56 | | 1.35 | | 1.89 | | 3.09 | |
Distributions | | | | | | | | | | | |
From net investment income | | (0.17 | ) | (0.15 | ) | (0.03 | ) | (0.01 | ) | (0.01 | ) |
From net realized gains | | (1.12 | ) | (1.70 | ) | (0.24 | ) | — | | — | |
Total distributions | | (1.29 | ) | (1.85 | ) | (0.27 | ) | (0.01 | ) | (0.01 | ) |
Net Asset Value | | | | | | | | | | | |
End of period(b) | | $ | 15.79 | | $ | 16.60 | | $ | 15.89 | | $ | 14.81 | | $ | 12.93 | |
Total Return(c),(d) | | 2.83 | % | 17.25 | % | 9.15 | % | 14.58 | % | 31.42 | % |
Net Assets End of Period (000’s) | | $ | 336,861 | | $ | 353,498 | | $ | 338,377 | | $ | 295,909 | | $ | 74,375 | |
Ratio and Supplemental Data Expenses to average net assets | | | | | | | | | | | |
After reimbursement/fee waiver | | 0.87 | % | 0.88 | % | 0.89 | %(g) | 1.00 | %(h) | 1.00 | % |
Before reimbursement/fee waiver(f) | | 0.87 | % | 0.88 | % | 0.89 | %(g) | 1.00 | %(h) | 1.02 | % |
Net investment income (loss), to average net assets(e) | | 1.10 | % | 1.02 | % | 0.82 | % | 0.58 | % | 0.10 | % |
Portfolio turnover rate(d) | | 45 | % | 40 | % | 68 | % | 109 | % | 73 | % |
For a share outstanding throughout each period(a)
| | Service Class | |
| | Year Ended December 31, | | May 1 to Dec | |
| | 2007 | | 2006 | | 2005 | | 2004 | | 31, 2003 | |
Net Asset Value | | | | | | | | | | | |
Beginning of period | | $ | 16.54 | | $ | 15.83 | | $ | 14.77 | | $ | 12.92 | | $ | 10.21 | |
Investment Operations | | | | | | | | | | | |
Net investment income (loss) | | 0.15 | | 0.13 | | 0.09 | | 0.04 | | (0.01 | ) |
Net realized and unrealized gain (loss) | | 0.28 | | 2.37 | | 1.22 | | 1.82 | | 2.72 | |
Total operations | | 0.43 | | 2.50 | | 1.31 | | 1.86 | | 2.71 | |
Distributions | | | | | | | | | | | |
From net investment income | | (0.12 | ) | (0.09 | ) | (0.01 | ) | (0.01 | ) | — | |
From net realized gains | | (1.12 | ) | (1.70 | ) | (0.24 | ) | — | | — | |
Total distributions | | (1.24 | ) | (1.79 | ) | (0.25 | ) | (0.01 | ) | — | |
Net Asset Value | | | | | | | | | | | |
End of period(b) | | $ | 15.73 | | $ | 16.54 | | $ | 15.83 | | $ | 14.77 | | $ | 12.92 | |
Total Return(c),(d) | | 2.53 | % | 16.96 | % | 8.86 | % | 14.36 | % | 26.54 | % |
Net Assets End of Period (000’s) | | $ | 435 | | $ | 516 | | $ | 614 | | $ | 470 | | $ | 310 | |
Ratio and Supplemental Data Expenses to average net assets | | | | | | | | | | | |
After reimbursement/fee waiver | | 1.12 | % | 1.13 | % | 1.14 | %(g) | 1.25 | %(h) | 1.25 | % |
Before reimbursement/fee waiver(f) | | 1.12 | % | 1.13 | % | 1.14 | %(g) | 1.25 | %(h) | 1.28 | % |
Net investment income (loss), to average net assets(e) | | 0.89 | % | 0.77 | % | 0.59 | % | 0.27 | % | (0.14 | )% |
Portfolio turnover rate(d) | | 45 | % | 40 | % | 68 | % | 109 | % | 73 | % |
(a) | | Per share information is calculated based on average number of shares outstanding. |
| | |
(b) | | JPMorgan Mid Cap Value (the “Fund”) share class commenced operations as follows: Initial Class - May 3, 1999 |
| | |
(c) | | Total Return reflects all portfolio expenses and includes reinvestment of dividends and capital gains; it does not reflect the charges and deductions under the policies or annuity contracts. |
| | Initial Class - May 3, 1999 |
| | Service Class - May 1, 2003 |
| | |
(d) | | Not annualized. |
| | |
(e) | | Annualized. |
| | |
(f) | | Ratio of Total Expenses to Average Net Assets includes all expenses before fee waivers and reimbursements by the investment advisor. |
| | |
(g) | | Ratio of Total Expenses to Average Net Assets and net Expenses to Average Net Assets are inclusive of recaptured expenses by the investment advisor, if any. The impact of recaptured expenses was 0.02% and 0.02% for Initial Class and Service Class, respectively (see Note 2). |
| | |
(h) | | Ratio of Total Expenses to Average Net Assets and net Expenses to Average Net Assets are inclusive of recaptured expenses by the investment advisor, if any. The impact of recaptured expenses was 0.07% and 0.07% for Initial Class and Service Class, respectively (see Note 2). |
The notes to the financial statements are an integral part of this report.
8
JPMorgan Mid Cap Value
NOTES TO FINANCIAL STATEMENTS
At December 31, 2007
(all amounts in thousands)
NOTE 1. ORGANIZATION AND SIGNIFICANT ACCOUNTING POLICIES
AEGON/Transamerica Series Trust (“ATST”) is an open-end management investment company, registered under the Investment Company Act of 1940, as amended (the “1940 Act”). ATST serves as a funding vehicle for variable life insurance, variable annuity and group annuity products. Effective May 1, 2007, J.P. Morgan Mid Cap Value was renamed JPMorgan Mid Cap Value (“the Fund”). The Fund is a part of ATST.
In the normal course of business, the Fund enters into contracts that contain a variety of representations that provide general indemnifications. The Fund’s maximum exposure under these arrangements is unknown, as this would involve future claims that may be made against the Fund and/or its affiliates that have not yet occurred. However, based on experience, the Fund expects the risk of loss to be remote.
This report should be read in conjunction with the current Fund prospectus, which contains more complete information about the Fund.
In preparing the Fund’s financial statements in accordance with accounting principles generally accepted in the United States of America (“GAAP”), estimates or assumptions (which could differ from actual results) may be used that affect reported amounts and disclosures. The following is a summary of significant accounting policies followed by the Fund.
Multiple class operations, income and expenses: The Fund currently offers two classes of shares, an Initial Class and a Service Class. Income, non-class specific expenses and realized and unrealized gains and losses, are allocated daily to each class, based upon the value of shares outstanding method as permitted under Rule 18f-3 of the 1940 Act. Each class bears its own specific expenses as well as a portion of general, common expenses.
Security valuations: The Fund values its investments at the close of the New York Stock Exchange (“NYSE”), normally 4 p.m. ET, each day the NYSE is open for business. Fund investments are valued at the last sale price or closing price on the day of valuation taken from the primary exchange where the security is principally traded.
Securities traded in the over-the-counter market and listed securities for which no sale was reported on that date are valued at the last quoted bid price.
Debt securities are valued based on a price quotation or other equivalent indication of value supplied by an exchange, a pricing service or a major market maker; however, those that mature in sixty days or less are valued at amortized cost, which approximates market. Investment company securities are valued at the net asset value of the underlying portfolio.
Securities for which quotations are not readily available are valued at fair market value as determined in good faith by the Fund’s Administrative Valuation Committee, under the supervision of the Board’s Valuation Committee, using guidelines adopted by the Board of Trustees.
Cash: The Fund may leave cash overnight in its cash account with the custodian, State Street Bank & Trust Company (“State Street”). On July 2, 2007, State Street acquired the parent company of Investors Bank & Trust Company. State Street has been contracted on behalf of the Fund to invest the excess cash into a savings account, which at December 31, 2007 was paying an interest rate of 2.60%.
Repurchase agreements: The Fund is authorized to enter into repurchase agreements. The Fund, through its custodian, State Street, receives delivery of the underlying securities, the value of which at the time of purchase is required to be an amount equal to at least 100% of the resale price. The Fund will bear the risk of value fluctuations until the security can be sold and may encounter delays and incur costs in liquidating the security. In the event of bankruptcy or insolvency of the seller, delays and costs may be incurred.
Commission recapture: The sub-adviser, to the extent consistent with the best execution and usual commission rate policies and practices, may place security transactions of the Fund with broker/dealers with which ATST has established a Commission Recapture Program. A Commission Recapture Program is any arrangement under which a broker/dealer applies a portion of the commissions received by such broker/dealer on the security transactions to the Fund. In no event will commissions paid by the Fund be used to pay expenses that would otherwise be borne by any other funds within ATST, or by any other party.
Recaptured commissions during the year ended December 31, 2007 of $9 are included in net realized gain (loss) in the Statement of Operations.
Securities lending: The Fund may lend securities to qualified borrowers, with State Street acting as the Fund’s lending agent. The Fund earns negotiated lenders’ fees. The Fund receives cash and/or securities as collateral against the loaned securities. Cash collateral received is invested in short term, interest bearing securities. The Fund monitors the market value of securities loaned on a daily basis and requires collateral in an amount at least equal to the value of the securities loaned. Income from loaned securities earned by State Street for its services, shown on the Statement of Operations is net of fees, in the amount of $33.
The Fund has invested the cash collateral received from securities loaned in the following short-term, interest-bearing securities:
9
NOTES TO FINANCIAL STATEMENTS (continued)
At December 31, 2007
(all amounts in thousands)
NOTE 1.– (continued)
Abbey National PLC, Eurodollar Term, 5.00%, 1/7/2008 | | $ | 1,620 | |
ABN AMRO Bank NV, Eurodollar Term, 5.18%, 1/4/2008 | | 1,296 | |
Bank of Nova Scotia, Eurodollar Term, 4.96%, 1/22/2008 | | 1,134 | |
Barclays, Eurodollar Term, 5.00%, 2/12/2008 | | 2,267 | |
BNP Paribas, Eurodollar Term, 5.01%, 1/11/2008 | | 2,105 | |
Calyon, Eurodollar Term, 5.12%, 3/3/2008 | | 486 | |
Credit Suisse First Boston Corp., Repurchase Agreement, 4.60%, 1/2/2008 | | 4,211 | |
Dexia Group, Eurodollar Term, 4.82%, 1/3/2008 | | 1,620 | |
HBOS Halifax Bank of Scotland, Eurodollar Term, 5.15%, 1/2/2008 | | 810 | |
JPMorgan Chase & Co., Eurodollar Term, 5.15%, 2/12/2008 | | 810 | |
Lloyds TSB Bank, Eurodollar Term, 5.15%, 1/24/2008 | | 1,620 | |
Merrill Lynch & Co. (RPG), Repurchase Agreement, 4.60%, 1/2/2008 | | 2,429 | |
Morgan Stanley & Co. (Corp. Repo), Repurchase Agreement, 4.60%, 1/2/2008 | | 6,641 | |
Rabobank Nederland, Eurodollar Term, 5.08%, 1/10/2008 | | 1,943 | |
Reserve Primary Money Market Fund 4.95% | | 1,728 | |
Royal Bank of Scotland, Eurodollar Term, 5.00%, 2/25/2008 | | 1,943 | |
Societe Generale, Eurodollar Term, 5.15%, 3/3/2008 | | 972 | |
Toronto Dominion Bank, Eurodollar Term, 5.05 %, 1/10/2008 | | 1,944 | |
UBS AG, Eurodollar Term, 4.92%, 1/11/2008 | | 1,134 | |
Wells Fargo, Bank Note, 4.75%, 1/8/2008 | | 810 | |
| | | |
| | $ | 37,523 | |
Real Estate Investment Trusts (“REITs”): There are certain additional risks involved in investing in REITs. These include, but are not limited to, economic conditions, changes in zoning laws, real estate values, property taxes and interest rates.
Dividend income is recorded at management’s estimate of the income included in distributions from the REIT investments. Distributions received in excess of the estimated amount are recorded as a reduction of the cost of investments. The actual amounts of income, return of capital and capital gains are only determined by each REIT after the fiscal year end and may differ from the estimated amounts.
Security transactions and investment income: Security transactions are recorded on the trade date. Security gains and losses are calculated on the first-in, first-out basis. Dividend income, if any, is recorded on the ex-dividend date or, in the case of foreign securities, as soon as the Fund is informed of the ex-dividend date. Interest income, including accretion of discounts and amortization of premiums, is recorded on the accrual basis commencing on the settlement date.
Dividend distributions: Dividends and capital gains distributions are typically declared and reinvested annually and are generally paid and reinvested on the business day following the ex-date.
NOTE 2. RELATED PARTY TRANSACTIONS
ATST serves as a funding vehicle for certain affiliated asset allocation portfolios and certain affiliated separate accounts of Western Reserve Life Assurance Co. of Ohio, Transamerica Life Insurance Company, Transamerica Financial Life Insurance Company, Inc., Monumental Life Insurance Company and Transamerica Occidental Life Insurance Company.
Transamerica Fund Advisors, Inc. (“TFAI”) is the Fund’s investment adviser. Transamerica Fund Services, Inc. (“TFS”) is the Fund’s administrator and transfer agent. Prior to May 1, 2007, AFSG Securities Corp. (“AFSG”), was the Fund’s distributor. Transamerica Capital Inc. (“TCI”) is now the Fund’s distributor. TFAI, TFS and TCI are affiliates of AEGON NV, a Netherlands corporation.
Certain officers and trustees of the Fund are also officers and/or directors of TFAI, TFS, AFSG, and TCI.
The following schedule reflects the percentage of Fund assets owned by affiliated investment companies at December 31, 2007:
| | | | % of Net | |
| | Net Assets | | Assets | |
Asset Allocation-Conservative Portfolio | | $ | 17,344 | | 5.14 | % |
Asset Allocation-Growth Portfolio | | 44,617 | | 13.22 | |
Asset Allocation-Moderate Growth Portfolio | | 182,761 | | 54.18 | |
Asset Allocation-Moderate Portfolio | | 35,245 | | 10.45 | |
Total | | $ | 279,967 | | 82.99 | % |
Investment advisory fee: The Fund pays management fees to TFAI based on average daily net assets (“ANA”) at the following breakpoints:
0.85% of the first $100 million of ANA
0.80% of ANA over $100 million
TFAI has contractually agreed to waive its advisory fee and will reimburse the Fund to the extent that operating expenses, excluding 12b-1 fees, exceed the following stated annual limit:
1.00% Expense Limit
If total Fund expenses fall below the annual expense limitation agreement agreed to by the adviser within the succeeding three years, the Fund may be required to pay the adviser a portion or all of the waived advisory fees.
There were no amounts recaptured during year ended December 31, 2007. There are no amounts available for recapture at December 31, 2007.
Distribution and service fees: ATST entered into a Distribution Agreement with AFSG dated January 1, 1997, as amended. On May 1, 2007, the Distribution Agreement was amended to replace AFSG with TCI as the Fund’s distributor. The Fund has also adopted a distribution plan (“Distribution Plan”) pursuant to Rule 12b-1 under the 1940 Act.
Under the Distribution Plan for the Initial Class shares, TCI, on behalf of the Fund, is authorized to pay various service providers, as direct payment for expenses incurred in connection with distribution of the Fund’s shares, amounts equal to actual expenses associated with distributing the shares.
10
NOTES TO FINANCIAL STATEMENTS (continued)
At December 31, 2007
(all amounts in thousands)
NOTE 2.– (continued)
The Distribution Plan for the Service Class shares requires ATST to pay distribution fees to TCI as compensation for its activities, not as reimbursement for specific expenses. The fee on the Service Class is paid to the insurance companies for providing services and account maintenance for their policyholders who invest in the variable insurance products which invest in the Service Class shares.
The Fund is authorized under the Distribution Plan to pay fees on each class up to the following limits:
Initial Class | | 0.15 | % |
Service Class | | 0.25 | % |
TCI has determined that it will not seek payment by the Fund of the distribution expenses incurred with respect to the Initial Class shares before April 30, 2009. Prior to TCI seeking reimbursement of future expenses, policy and contract owners will be notified in advance. The Fund will pay fees relating to Service Class shares.
Administrative services: The Fund has entered into an agreement with TFS for financial and legal fund administration services. The Fund pays TFS an annual fee of 0.02% of ANA. The Legal fees on the Statement of Operations are for fees paid to external legal counsel.
Deferred compensation plan: Each eligible independent Fund Trustee may elect participation in a non-qualified deferred compensation plan (“the Plan”) maintained by Transamerica IDEX Mutual Funds, an affiliate of the Fund. Under the Plan, such Trustees may defer payment of all or a portion of their total fees earned as a Fund Trustee. Each Trustee who is a participant in the Plan may elect that the earnings, losses or gains credited to his or her deferred fee amounts be determined based on a deemed investment in any series of Transamerica IDEX Mutual Funds. The right of a participant to receive a distribution from the Plan of the deferred fees is an unsecured claim against the general assets of all series of Transamerica IDEX Mutual Funds. The pro rata liability to the Fund of all deferred fees in the Plan amounted, as of December 31, 2007, to $16. Amounts deferred under the Deferred Compensation Plan are unfunded against the general assets of ATST.
Retirement plan: Under a retirement plan (the “Emeritus Plan”) available to the Independent Trustees, each Independent Trustee is deemed to have elected to serve as Trustee Emeritus of ATST upon his or her termination of service, other than removal for cause and is entitled to 50% of the trustee’s current retainer for a maximum period of five years determined by his or her years of service as a Trustee.
Such amounts shall be accrued by ATST on a pro rata basis allocable to each ATST fund based on the relative assets of the fund. If retainers increase in the future, past accruals (and credits) will be adjusted upward so that 50% of the Trustee’s current retainer is accrued and credited at all times. Upon death, disability or termination of service, other than removal for cause, amounts deferred become payable to an Emeritus Trustee (or his/her beneficiary). Upon the commencement of service as Trustee Emeritus, compensation will be paid on a quarterly basis during the time period that the Trustee Emeritus is allowed to serve as such.
Amounts accrued under the Emeritus Plans are unsecured claims against the general assets of ATST. For the year ended December 31, 2007, the amount related to the Emeritus Plan was $14. As of December 31, 2007, the Fund has not made any payments related to the Emeritus Plan.
The Emeritus Plan was terminated effective October 30, 2007. Upon the termination, the Fund shall continue to pay any remaining benefits in accordance with the Plan, but no further compensation shall accrue under the Plan.
NOTE 3. INVESTMENT TRANSACTIONS
The cost of securities purchased and proceeds from securities sold (excluding short-term securities) for the year ended December 31, 2007 were as follows:
Purchases of securities: | | | |
Long-term | | $ | 155,836 | |
U.S. Government | | — | |
Proceeds from maturities and sales of securities: | | | |
Long-term | | 177,043 | |
U.S. Government | | — | |
| | | | |
NOTE 4. FEDERAL INCOME TAX MATTERS
The Fund has not made any provision for federal income or excise taxes due to its policy to distribute all of its taxable income and capital gains to its shareholders and otherwise qualify as a regulated investment company under Subchapter M of the Internal Revenue Code. Income and capital gain distributions are determined in accordance with income tax regulations, which may differ from GAAP. These differences are primarily due to differing treatment for items including, but not limited to, wash sales and REITs.
Therefore, distributions determined in accordance with tax regulations may differ significantly in amount or character from net investment income and realized gains for financial reporting purposes. Financial reporting records are adjusted for permanent book/tax differences to reflect tax character. Financial records are not adjusted for temporary differences. These reclassifications are as follows:
Additional paid-in capital | | $ | — | |
Undistributed (accumulated) net investment income (loss) | | $ | (436 | ) |
Undistributed (accumulated) net realized gain (loss) from investment securities | | $ | 436 | |
The tax character of distributions paid may differ from the character of distributions shown in the Statements of Changes in Net Assets due to short-term gains being treated as ordinary income for tax purposes. The tax character of distributions paid during 2006 and 2007 was as follows:
11
NOTES TO FINANCIAL STATEMENTS (continued)
At December 31, 2007
(all amounts in thousands)
NOTE 4.– (continued)
2006 Distributions paid from: | | | |
Ordinary Income | | $ | 16,477 | |
Long-term Capital Gain | | 19,285 | |
| | | |
2007 Distributions paid from: | | | |
Ordinary Income | | 8,048 | |
Long-term Capital Gain | | 18,383 | |
| | | | |
The tax basis components of distributable earnings as of December 31, 2007 are as follows:
Undistributed Ordinary Income | | $ | 3,530 | |
Undistributed Long-term Capital Gain | | $ | 28,218 | |
Capital Loss Carryforward | | $ | — | |
Net Unrealized Appreciation (Depreciation) | | $ | 26,413 | |
NOTE 5. REGULATORY PROCEEDINGS
There continues to be significant federal and state regulatory activity relating to financial services companies, particularly mutual fund companies and their investment advisers. As part of an ongoing investigation regarding potential market timing, recordkeeping and trading compliance issues and matters affecting the Fund’s investment adviser, TFAI, and certain affiliates and former employees of TFAI, the SEC staff has indicated that it is likely to take some action against TFAI and certain of its affiliates at the conclusion of the investigation. The potential timing and the scope of any such action is difficult to predict. Although the impact of any action brought against TFAI and/or its affiliates is difficult to assess at the present time, the Fund currently believes that the likelihood that any such action will have a material adverse impact is remote. It is important to note that the Fund is not aware of any allegation of wrong doing against it and its Board at the time this annual report is printed. Although it is not anticipated that these developments will have an adverse impact on the Fund, there can be no assurance at this time. TFAI and its affiliates are actively working with the SEC in regard to this matter; however, the exact resolution cannot be determined at this time. TFAI will take such actions that it deems necessary or appropriate to continue providing management services to the Fund and to bring all matters to an appropriate conclusion.
TFAI and/or its affiliates, and not the Fund, will bear the costs regarding these regulatory matters.
NOTE 6. RECENTLY ISSUED ACCOUNTING PRONOUNCEMENTS
In July 2006, the Financial Accounting Standards Board (“FASB”) released FASB Interpretation No. 48 “Accounting for Uncertainty in Income Taxes” (“FIN 48”), an interpretation of FASB Statement No. 109. FIN 48 provides guidance for how uncertain tax positions should be recognized, measured, presented and disclosed in the financial statements. FIN 48 requires the accounting and disclosure of tax positions taken or expected to be taken in the course of preparing the Fund’s tax returns to determine whether the tax positions are “more-likely- than-not” of being sustained by the applicable tax authority. Tax positions not deemed to meet the more-likely-than-not threshold would be recorded as a tax benefit or expense in the current year.
Adoption of FIN 48 is effective during the first required financial reporting period for fiscal years beginning after December 15, 2006. Management adopted FIN 48 on June 29, 2007.
Implementation of FIN 48 requires Management of the Fund to analyze all open tax years, as defined by the Statute of Limitations, for all major jurisdictions, which includes federal and certain states. Open tax years are those that are open for exam by taxing authorities (i.e., the last 4 tax year ends and the interim tax period since then). The Fund has no examinations in progress and none are expected at this time.
Management of the Fund has reviewed all open tax years and major jurisdictions and concluded the adoption of FIN 48 resulted in no impact to the Fund’s net assets or results of operations. There is no tax liability resulting from unrecognized tax benefits relating to uncertain income tax positions taken or expected to be taken in future tax returns. The Fund is also not aware of any tax positions for which it is reasonably possible that the total amounts of unrecognized tax benefits will significantly change in the next 12 months.
In September 2006, FASB issued its new Standard No. 157, “Fair Value Measurements” (“FAS 157”). FAS 157 is designed to unify guidance for the measurement of fair value of all types of assets, including financial instruments, and certain liabilities, throughout a number of accounting standards. FAS 157 also establishes a hierarchy for measuring fair value in generally accepted accounting principles and expands financial statement disclosures about fair value measurements that are relevant to mutual funds. FAS 157 is effective for financial statements issued for fiscal years beginning after November 15, 2007, and earlier application is permitted.
As of December 31, 2007, Management does not expect the adoption of FAS 157 to impact the amounts reported in the financial statements, however, additional disclosures will be required about the inputs used to develop the measurements of fair value and the effect of certain of the measurements reported in the statement of operations for a fiscal period.
NOTE 7. SUBSEQUENT EVENT
Effective January 1, 2008, TFAI changed its name to Transamerica Asset Management, Inc.
Effective May 1, 2008, AEGON/Transamerica Series Trust will change its name to Transamerica Series Trust. At that time, the Fund will also change its name to Transamerica JPMorgan Mid Cap Value VP.
12
Report of Independent Registered Certified Public Accounting Firm
To the Board of Trustees and Shareholders of
JPMorgan Mid Cap Value:
In our opinion, the accompanying statement of assets and liabilities, including the schedule of investments, and the related statements of operations and of changes in net assets and the financial highlights present fairly, in all material respects, the financial position of JPMorgan Mid Cap Value (the “Fund”) (one of the portfolios constituting AEGON/Transamerica Series Trust) at December 31, 2007, the results of its operations for the year then ended, the changes in its net assets for each of the two years in the period then ended and the financial highlights for each of the periods presented, in conformity with accounting principles generally accepted in the United States of America. These financial statements and financial highlights (hereafter referred to as “financial statements”) are the responsibility of the Fund’s management; our responsibility is to express an opinion on these financial statements based on our audits. We conducted our audits of these financial statements in accordance with the standards of the Public Company Accounting Oversight Board (United States). Those standards require that we plan and perform the audit to obtain reasonable assurance about whether the financial statements are free of material misstatement. An audit includes examining, on a test basis, evidence supporting the amounts and disclosures in the financial statements, assessing the accounting principles used and significant estimates made by management, and evaluating the overall financial statement presentation. We believe that our audits, which included confirmation of securities at December 31, 2007 by correspondence with the custodian and brokers, provide a reasonable basis for our opinion.

Tampa, Florida
February 29, 2008
13
JPMorgan Mid Cap Value
SUPPLEMENTAL TAX INFORMATION (unaudited)
(all amounts in thousands)
For tax purposes, the Fund has made a Long-Term Capital Gain Designation of $18,383 for the year ended December 31, 2007.
RESULTS OF SHAREHOLDER PROXY (unaudited)
At a special meeting of shareholders held on October 30, 2007, the results of the Proposals were as follows:
Proposal 1: To elect a new Board:
Proposed
Trustee | | For | | Against | | Abstentions/Broker Non-
Votes | |
John K. Carter | | 2,274,998,840.817 | | 57,804,698.755 | | 35,433.883 | |
| | | | | | | |
Leo J. Hill | | 2,277,212,702.754 | | 55,590,836.819 | | 35,433.883 | |
| | | | | | | |
Neal M. Jewell | | 2,266,793,295.663 | | 66,010,243.909 | | 35,433.883 | |
| | | | | | | |
Russell A. Kimball, Jr. | | 2,274,825,235.835 | | 57,978,303.737 | | 35,433.883 | |
| | | | | | | |
Eugene M. Mannella | | 2,274,623,165.033 | | 58,180,374.539 | | 35,433.883 | |
| | | | | | | |
Norm R. Nielsen | | 2,275,050,055.885 | | 57,753,483.687 | | 35,433.883 | |
| | | | | | | |
Joyce Galpern Norden | | 2,270,278,122.250 | | 62,525,417.323 | | 35,433.883 | |
| | | | | | | |
Patricia L. Sawyer | | 2,275,737,737.456 | | 57,065,802.116 | | 35,433.883 | |
| | | | | | | |
John W. Waechter | | 2,276,615,120.140 | | 56,188,419.433 | | 35,433.883 | |
Proposal 2: To approve an amendment to the Agreement and Declaration of Trust:
| | | | Abstentions/Broker Non- | |
For | | Against | | Votes | |
2,182,022,669.110 | | 77,590,048.544 | | 73,226,255.801 | |
14
JPMorgan Mid Cap Value
INVESTMENT ADVISORY AND SUB-ADVISORY AGREEMENTS-REVIEW AND RENEWAL (unaudited)
At a meeting of the Board of Trustees of AEGON/Transamerica Series Trust (“ATST”) held on December 4th, 2007, the Board reviewed and considered the renewal of the investment advisory agreement (the “Investment Advisory Agreement”) between JP Morgan Mid Cap Value (the “Fund”) and Transamerica Fund Advisors, Inc. (“TFAI”), as well as the renewal of the investment sub-advisory agreement (the “Sub-Advisory Agreement”) of the Fund between TFAI and JP Morgan Investment Management Inc. (the “Sub-Adviser”), to determine whether the agreements should be renewed for a six-month period. It was noted that this review was interim in nature to align all the Funds on the same calendar, and that the Funds’ advisory arrangements would be reviewed again in the first half of 2008.
Following their review and consideration, the Trustees determined that the renewal of the Investment Advisory Agreement and the Sub- Advisory Agreement would enable shareholders of the Fund to obtain high quality services at a cost that is appropriate, fair, and in the best interests of its shareholders. The Board, including the independent members of the Board, unanimously approved the renewal of the Investment Advisory Agreement and Sub-Advisory Agreement. In reaching their decision, the Trustees requested and obtained from TFAI and the Sub-Adviser such information as they deemed reasonably necessary to evaluate the agreements, including information about fees and performance of comparable funds managed by the Sub-Adviser. The Trustees also carefully considered information they had previously received from TFAI and the Sub-Adviser throughout the year as part of their regular oversight of the Fund, as well as comparative fee, expense, and performance information prepared by Lipper Inc. (“Lipper”), an independent provider of mutual fund performance, fee and expense information and profitability data prepared by management. In considering the proposed continuation of the Investment Advisory and Sub-Advisory Agreements, the Trustees evaluated a number of considerations that they believed, in light of the legal advice furnished to them by independent legal counsel and their own business judgment, to be relevant. They based their decisions on a variety of factors, including the following considerations, among others, although they did not identify any consideration or particular information that was controlling of their decisions:
The nature, extent and quality of the advisory services to be provided. The Board considered the nature and quality of the services provided by TFAI and the Sub-Adviser to the Fund in the past, as well as the services anticipated to be provided in the future. The Board concluded that TFAI and the Sub-Adviser are capable of providing high quality services to the Fund, as indicated by the nature and quality of services provided in the past by TFAI and the Sub-Adviser for this series and the experience, capability and integrity of TFAI’s senior management, the financial resources of TFAI and the Sub-Adviser, TFAI’s management oversight process and the professional qualifications of the portfolio management team of the Sub-Adviser. The Trustees determined that TFAI and the Sub-Adviser can provide investment and related services that are appropriate in scope and extent in light of the Fund’s operations, the competitive landscape of the investment company business and investor needs.
The investment performance of the Fund. The Board examined the short and longer-term performance of the Fund, including relative performance against a peer universe of comparable mutual funds as prepared by Lipper for various trailing periods ended June 30, 2007. The Board did note that the Sub-Adviser has only managed the Fund since May 2004, but that since the Sub-Adviser has managed the Fund performance has been near to or above median. On the basis of the Board’s assessment of the nature, extent and quality of advisory services to be provided or procured by TFAI and the Sub-Adviser, the Board concluded that TFAI and the Sub-Adviser are capable of providing a level of investment performance that is appropriate in light of the Fund’s proposed investment objectives, policies and strategies and competitive with other similarly situated investment companies.
The cost of advisory services provided and the level of profitability. The Board reviewed profitability information of TFAI’s cost of procuring fund management services, as well as the costs of provision of administration, fund accounting and other services, to the Fund and to ATST as a whole by TFAI and its affiliates. The Board reviewed the management and sub-advisory fees for the Fund. The Board noted the contractual advisory fees are generally in line with a peer group and slightly above the peer universe. Based on their review, the Trustees determined that the management fees of the Fund generally are appropriate in light of the services expected to be provided or procured, the management fees and the anticipated profitability of the relationship between the Fund, TFAI and its affiliates, and the Sub-Adviser. In making these observations and determinations, the Board reviewed, among other things, comparative information provided by Lipper.
Whether fee levels reflect economies of scale and the extent to which economies of scale would be realized as the Fund grows. In evaluating the extent to which the management fees payable under the Investment Advisory and Sub-Advisory Agreements reflect economies of scale or will permit economies of scale to be realized in the future, the Board noted that TFAI offers a breakpoint, despite not receiving a matching discount from the Sub-Adviser, which appropriately benefit investors by passing on economies of scale in the form of lower management fees as the level of assets grows. The Trustees also concluded that they will have the opportunity to periodically reexamine whether the Fund has achieved economies of scale, and the appropriateness of management fees payable to TFAI and fees paid to the Sub-Adviser, in the future.
Benefits (such as soft dollars) to TFAI, its affiliates, or the Sub-Adviser from their relationship with the Fund. The Board concluded that other benefits anticipated to be derived by TFAI, its affiliates, and the Sub-Adviser from their relationships with the Fund are expected to be reasonable and fair, and consistent with industry practice and the best interests of the Fund and its shareholders. The Trustees noted that TFAI would not realize soft dollar benefits from its relationship with the Fund. The Board also noted that the Sub- Adviser is participating in a brokerage program pursuant to which a portion of brokerage commissions paid by the Fund is recaptured for the benefit of the Fund and its shareholders, thus limiting the amount of soft dollar arrangements the Sub-Adviser may engage in with respect to the Fund’s brokerage transactions.
15
Other considerations. The Board determined that TFAI has made a substantial commitment to the recruitment and retention of high quality personnel, and maintains the financial, compliance and operational resources reasonably necessary to manage the Fund in a professional manner that is consistent with the best interests of the Fund and its shareholders. In this regard, the Trustees favorably considered the procedures and policies in place by TFAI to enforce compliance with applicable laws and regulations and oversee the portfolio management activities of the Sub-Adviser. The Trustees also determined that TFAI has made a significant entrepreneurial commitment to the management and success of the Fund, reflected by TFAI’s expense limitation and fee waiver arrangements with the Fund which may result in TFAI waiving a substantial amount of management fees for the benefit of shareholders.
16
Legg Mason Partners All Cap
MARKET ENVIRONMENT
Currently the ratio of the two-year Treasury to the federal funds rate is the lowest in 30 years, indicating the Federal Reserve Board actions (4.25% federal funds rate) are far behind the market’s verdict of what is happening (two-year Treasury yield of 2.62%). We believe that at least a 0.50% cut in the federal funds interest rate will occur in early 2008.
PERFORMANCE
For the year ended December 31, 2007, Legg Mason Partners All Cap, Initial Class returned 1.04%. By comparison its benchmark, the Russell 3000 Index, returned 5.14%.
STRATEGY REVIEW
The portfolio’s holdings in the energy, industrials, and consumer staples sectors were the largest contributors to absolute performance during the reporting period. In contrast, stocks in the financial and consumer discretionary sectors detracted from results. In terms of individual stocks, the largest contributors to performance were Honeywell International Inc., Vodafone Group Plc, Unilever plc, Schlumberger Limited, and Anadarko Petroleum Corporation. The largest detractors to performance were PMI Group, Inc., Merrill Lynch & Co., Inc., MGIC Investment Corporation, Interpublic Group of Companies, Inc., and Home Depot, Inc.
John J. Goode
Peter J. Hable
Co-Portfolio Managers
ClearBridge Advisors, LLC
AEGON/Transamerica Series Trust | Annual Report 2007 |
1
Legg Mason Partners All Cap
(unaudited)

Average Annual Total Return for Periods Ended 12/31/2007
| | | | | | From | | Inception | |
| | 1 Year | | 5 Years | | Inception | | Date | |
| | | | | | | | | |
Initial Class | | 1.04 | % | 12.96 | % | 7.90 | % | 5/3/99 | |
Russell 3000 (1) | | 5.14 | % | 13.63 | % | 3.63 | % | 5/3/99 | |
| | | | | | | | | |
Service Class | | 0.77 | % | — | % | 12.59 | % | 5/1/03 | |
NOTES
(1) The Russell 3000 (Russell 3000) Index is an unmanaged index used as a general measure of market performance. Calculations assume dividends and capital gains are reinvested and do not include any managerial expenses. From inception, calculation is based on life of Initial Class shares.
The performance data presented represents past performance; future results may vary. The portfolio’s investment return and net asset value will fluctuate. Past performance does not guarantee future results. Investor’s units when redeemed, may be worth more or less than their original cost.
Current performance may be lower or higher than performance quoted. Please visit your insurance company’s website for contract or policy level standardized total returns current to the most recent month end. Portfolio performance is net of investment fees and fund expenses, but not product charges, which, if included, would significantly lower the performance quoted.
Investments in a “non-diversified” portfolio may be subject to specific risks such as susceptibility to single economic, political, or regulatory events, and may be subject to greater loss than investments in a diversified portfolio.
This material must be preceded or accompanied by a current prospectus, which includes specific contents regarding the investment objectives, explanation of share classes and policies of this portfolio.
2
Legg Mason Partners All Cap
UNDERSTANDING YOUR FUND’S EXPENSES
(unaudited)
SHAREHOLDER EXPENSES
Fund shareholders may incur ongoing costs, including management and advisory fees, distribution and service fees, and other fund expenses.
The following Example is intended to help you understand your ongoing costs (in dollars and cents) of investing in the Fund and to compare these costs with the ongoing costs of investing in other funds.
The Example is based on an investment of $1,000 invested at July 1, 2007 and held for the entire period until December 31, 2007.
ACTUAL EXPENSES
The first line in the table below provides information about actual account values and actual expenses. You may use the information in this line, together with the amount you invested, to estimate the expenses that you paid over the period. Simply divide your account value by $1,000 (for example, an $8,600 account value divided by $1,000 = 8.6), then multiply the result by the number in the first line of your Fund under the heading entitled “Expenses Paid During Period” to estimate the expenses you paid on your account during this period.
HYPOTHETICAL EXAMPLE FOR COMPARISON PURPOSES
The second line in the table below provides information about hypothetical account values and hypothetical expenses based on the Fund’s actual expense ratio and an assumed rate of return of 5% per year before expenses, which is not the Fund’s actual return. The hypothetical account values and expenses may not be used to estimate the actual ending account balance or expenses you paid for the period. You may use this information to compare the ongoing costs of investing in your Fund and other funds. To do so, compare this 5% hypothetical example with the 5% hypothetical examples that appear in the shareholder reports of the other funds.
Please note that the expenses shown in the table are meant to highlight your ongoing costs only and do not reflect any transactional costs, such as sales charges, redemption fees, brokerage commissions paid on purchases and sales of fund shares. Therefore, the second line under the Fund in the table is useful in comparing ongoing costs only, and will not help you determine the relative total costs of owning different funds. If any of these transaction costs were included, your costs would be higher. The expenses shown in the table do not reflect any fees that may be charged to you by brokers, financial intermediaries or other financial institutions.
| | Beginning
Account
Value | | Ending
Account
Value | | Annualized
Expense
Ratio | | Expenses
Paid During
Period (a) | |
| | | | | | | | | |
Initial Class | | | | | | | | | |
Actual | | $ | 1,000.00 | | $ | 954.01 | | 0.87 | % | $ | 4.28 | |
Hypothetical (b) | | 1,000.00 | | 1,020.82 | | 0.87 | | 4.43 | |
| | | | | | | | | |
Service Class | | | | | | | | | |
Actual | | 1,000.00 | | 952.53 | | 1.12 | | 5.51 | |
Hypothetical (b) | | 1,000.00 | | 1,019.56 | | 1.12 | | 5.70 | |
| | | | | | | | | | | | |
(a) Expenses are calculated using the Fund’s annualized expense ratio (as disclosed in the table), multiplied by the average account value for the period, multiplied by the number of days in the period (184 days), and divided by the number of days in the year (365 days).
(b) 5% return per year before expenses.
GRAPHICAL PRESENTATION OF SCHEDULE OF INVESTMENTS
By Sector
At December 31, 2007
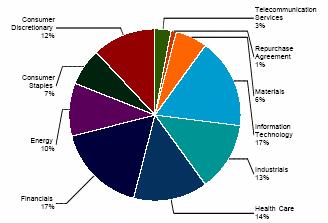
This chart shows the percentage breakdown by sector of the Fund’s total investment securities.
3
Legg Mason Partners All Cap
SCHEDULE OF INVESTMENTS
At December 31, 2007
(all amounts except share amounts in thousands)
| | Shares | | Value | |
COMMON STOCKS (99.3%) | | | | | |
Aerospace & Defense (7.4%) | | | | | |
Boeing Co. | | 57,400 | | $ | 5,020 | |
Honeywell International, Inc. | | 137,306 | | 8,454 | |
Raytheon Co. | | 157,100 | | 9,536 | |
Building Products (0.3%) | | | | | |
Simpson Manufacturing Co., Inc. ^ | | 31,600 | | 840 | |
Capital Markets (4.6%) | | | | | |
Franklin Resources, Inc. | | 11,100 | | 1,270 | |
Merrill Lynch & Co., Inc. | | 80,600 | | 4,327 | |
State Street Corp. | | 107,320 | | 8,714 | |
Chemicals (2.7%) | | | | | |
Dow Chemical Co. (The) | | 89,619 | | 3,533 | |
Ei DU Pont de Nemours & Co. | | 109,100 | | 4,810 | |
Communications Equipment (3.5%) | | | | | |
Cisco Systems, Inc. ‡ | | 188,412 | | 5,100 | |
Motorola, Inc. | | 365,200 | | 5,858 | |
Socket Communications, Inc. ‡ | | 11,500 | | 10 | |
Computers & Peripherals (1.7%) | | | | | |
International Business Machines Corp. | | 49,700 | | 5,373 | |
Consumer Finance (1.5%) | | | | | |
American Express Co. | | 88,900 | | 4,625 | |
Diversified Financial Services (5.0%) | | | | | |
Bank of America Corp. | | 174,652 | | 7,206 | |
JPMorgan Chase & Co. | | 191,700 | | 8,368 | |
Electronic Equipment & Instruments (0.9%) | | | | | |
Agilent Technologies, Inc. ‡ | | 76,600 | | 2,814 | |
Energy Equipment & Services (4.8%) | | | | | |
Baker Hughes, Inc. | | 28,100 | | 2,279 | |
BJ Services Co. | | 75,300 | | 1,827 | |
Halliburton Co. | | 85,800 | | 3,253 | |
Nabors Industries, Ltd. ‡ | | 28,900 | | 792 | |
Schlumberger, Ltd. | | 32,800 | | 3,226 | |
Transocean, Inc. | | 23,356 | | 3,343 | |
Food & Staples Retailing (2.2%) | | | | | |
Wal-Mart Stores, Inc. | | 140,800 | | 6,692 | |
Food Products (3.6%) | | | | | |
Kraft Foods, Inc. Class A | | 120,761 | | 3,940 | |
Unilever PLC | | 69,930 | | 2,631 | |
Unilever PLC | | 119,574 | | 4,475 | |
Household Products (1.5%) | | | | | |
Kimberly-Clark Corp. | | 68,400 | | 4,743 | |
Industrial Conglomerates (2.3%) | | | | | |
General Electric Co. | | 190,700 | | 7,069 | |
Insurance (4.7%) | | | | | |
Allied World Assurance Co. Holdings, Ltd. | | 41,380 | | 2,076 | |
Chubb Corp. | | 117,100 | | 6,391 | |
CNA Surety Corp. ‡^ | | 186,500 | | 3,691 | |
Hartford Financial Services Group, Inc. | | 26,200 | | 2,285 | |
Internet Software & Services (1.4%) | | | | | |
Bridgeline Software, Inc. ‡ | | 19,100 | | 70 | |
Internet Software & Services (continued) | | | | | |
eBay, Inc. ‡ | | 69,400 | | $ | 2,303 | |
VeriSign, Inc. ‡^ | | 49,340 | | 1,856 | |
Life Sciences Tools & Services (0.9%) | | | | | |
ENZO Biochem, Inc. ‡^ | | 207,036 | | 2,638 | |
Machinery (2.6%) | | | | | |
Caterpillar, Inc. | | 65,024 | | 4,718 | |
Dover Corp. | | 68,900 | | 3,176 | |
Media (8.5%) | | | | | |
Interpublic Group of Cos., Inc. ‡ | | 445,370 | | 3,612 | |
News Corp. Class A | | 209,800 | | 4,299 | |
News Corp. Class B | | 270,400 | | 5,746 | |
Time Warner, Inc. | | 319,700 | | 5,278 | |
Walt Disney Co. (The) ‡ | | 229,934 | | 7,422 | |
Metals & Mining (1.6%) | | | | | |
Alcoa, Inc. | | 134,449 | | 4,914 | |
Oil, Gas & Consumable Fuels (5.6%) | | | | | |
Anadarko Petroleum Corp. | | 77,200 | | 5,071 | |
Chevron Corp. | | 37,200 | | 3,472 | |
ConocoPhillips | | 21,200 | | 1,872 | |
Exxon Mobil Corp. | | 34,400 | | 3,223 | |
Williams Cos., Inc. | | 104,900 | | 3,753 | |
Paper & Forest Products (1.5%) | | | | | |
Weyerhaeuser Co. | | 61,500 | | 4,535 | |
Pharmaceuticals (13.1%) | | | | | |
Abbott Laboratories | | 151,538 | | 8,509 | |
Bentley Pharmaceuticals, Inc. ‡^ | | 2,813 | | 42 | |
Eli Lilly & Co. | | 57,800 | | 3,086 | |
Forest Laboratories, Inc. ‡ | | 42,400 | | 1,546 | |
GlaxoSmithKline PLC ^ | | 99,500 | | 5,014 | |
Johnson & Johnson | | 101,500 | | 6,770 | |
Novartis AG | | 65,300 | | 3,546 | |
Pfizer, Inc. | | 256,400 | | 5,828 | |
Wyeth | | 142,007 | | 6,275 | |
Real Estate Investment Trusts (1.1%) | | | | | |
Annaly Capital Management, Inc. REIT | | 186,000 | | 3,381 | |
Semiconductors & Semiconductor Equipment (6.9%) | | | | | |
Applied Materials, Inc. | | 362,400 | | 6,436 | |
Novellus Systems, Inc. ‡ | | 122,300 | | 3,372 | |
Taiwan Semiconductor Manufacturing | | 440,128 | | 4,383 | |
Co., Ltd. | | | | | |
Texas Instruments, Inc. | | 195,900 | | 6,543 | |
Verigy, Ltd. ‡ | | 26,342 | | 716 | |
Software (2.9%) | | | | | |
Microsoft Corp. | | 242,230 | | 8,623 | |
Sybase, Inc. ‡ | | 2,200 | | 58 | |
Wave Systems Corp. Class A ‡^ | | 203,427 | | 295 | |
Specialty Retail (3.0%) | | | | | |
Gap, Inc. (The) | | 260,900 | | 5,552 | |
Home Depot, Inc. | | 143,300 | | 3,860 | |
Thrifts & Mortgage Finance (0.6%) | | | | | |
PMI Group, Inc. (The) ^ | | 143,580 | | 1,907 | |
The notes to the financial statements are an integral part of this report.
4
| | Shares | | Value | |
Wireless Telecommunication Services (2.9%) | | | | | |
Vodafone Group PLC | | 237,594 | | $ | 8,868 | |
Total Common Stocks (cost $245,470) | | | | 307,139 | |
| | | | | |
| | Principal | | Value | |
REPURCHASE AGREEMENTS (0.6%) | | | | | |
Repurchase Agreement (0.6%) | | | | | |
State Street Repurchase Agreement £ 2.55%, dated 12/31/2007 to be repurchased at $1,808 on 01/02/2008 ± | | $ | 1,807 | | $ | 1,807 | |
Total Repurchase Agreements (cost $1,807) | | | | 1,807 | |
| | | | | |
Total Securities Lending Collateral (cost $11,790) (1) | | | | 11,790 | |
| | | | | |
Total Investment Securities (cost $259,067) # | | | | $ | 320,736 | |
| | | | | | | |
NOTES TO SCHEDULE OF INVESTMENTS:
^ | | At December 31, 2007, all or a portion of this security is on loan (see Note 1). The value at December 31, 2007, of all securities on loan is $11,160. |
‡ | | Non-Income Producing. |
(1) | | Cash collateral for the Repurchase Agreements, valued at $4,274, that serves as collateral for securities lending, is invested in corporate bonds with interest rates and maturity dates ranging from 3.00% - 10.18% and 04/28/2008 - 12/01/2096, respectively. |
£ | | State Street serves as the accounting, custody and lending agent for the Fund and provides various administrative services on behalf of the Funds. |
± | | At December 31, 2007, repurchase agreements excluding collateral for securities on loan are collateralized by U.S. Government Agency Obligations with interest rates and maturity dates ranging from 4.03% - 4.47% and 03/01/2033 – 04/01/2033 respectively, and with a market value plus accrued interest of $1,845. |
# | | Aggregate cost for federal income tax purposes is $259,654. Aggregate gross unrealized appreciation for all securities in which there is an excess of value over tax cost and aggregate gross unrealized depreciation for all securities in which there is an excess of tax cost over value were $71,638 and $10,556, respectively. Net unrealized appreciation for tax purposes is $61,082. |
DEFINITIONS:
REIT Real Estate Investment Trust
The notes to the financial statements are an integral part of this report.
5
Legg Mason Partners All Cap
STATEMENT OF ASSETS AND LIABILITIES
At December 31, 2007
(all amounts except per share amounts in thousands)
Assets: | | | |
Investment securities, at value (cost: $259,067)
(including securities loaned of $11,160) | | $ | 320,736 | |
Cash | | 56 | |
Receivables: | | | |
Investment securities sold | | 804 | |
Shares sold | | 7 | |
Interest | | 2 | |
Income from loaned securities | | 6 | |
Dividends | | 686 | |
| | 322,297 | |
Liabilities: | | | |
Investment securities purchased | | 500 | |
Accounts payable and accrued liabilities: | | | |
Shares redeemed | | 351 | |
Management and advisory fees | | 215 | |
Distribution and service fees | | 3 | |
Administration fees | | 5 | |
Payable for collateral for securities on loan | | 11,790 | |
Other | | 98 | |
| | 12,962 | |
Net Assets | | $ | 309,335 | |
| | | |
Net Assets Consist of: | | | |
Capital Stock ($.01 par value) | | $ | 223 | |
Additional paid-in capital | | 211,239 | |
Undistributed (accumulated) net investment income | | 3 ,930 | |
Undistributed (accumulated) net realized gain from investment securities and foreign currency transactions | | 32,274 | |
Net unrealized appreciation on investment securities | | 61,669 | |
Net Assets | | $ | 309,335 | |
Net Assets by Class: | | | |
Initial Class | | $ | 297,425 | |
Service Class | | 11,910 | |
Shares Outstanding: | | | |
Initial Class | | 21,425 | |
Service Class | | 861 | |
Net Asset Value and Offering Price Per Share: | | | |
Initial Class | | $ | 13.88 | |
Service Class | | 13.83 | |
STATEMENT OF OPERATIONS
For the year ended December 31, 2007
(all amounts in thousands)
Investment Income: | | | |
Dividends (net of withholding taxes on foreign dividends of $62) | | $ | 6,841 | |
Interest | | 124 | |
Income from loaned securities-net | | 105 | |
| | 7,070 | |
| | | |
Expenses: | | | |
Management and advisory fees | | 2,859 | |
Printing and shareholder reports | | 79 | |
Custody fees | | 49 | |
Administration fees | | 71 | |
Legal fees | | 7 | |
Audit fees | | 20 | |
Trustees fees | | 13 | |
Distribution and service fees: | | | |
Service Class | | 33 | |
Other | | 5 | |
Total expenses | | 3,136 | |
| | | |
Net Investment Income | | 3,934 | |
| | | |
Net Realized Gain (Loss) from: | | | |
Investment securities | | 32,909 | |
Foreign currency transactions | | (6 | ) |
| | 32,903 | |
| | | |
Net Increase (Decrease) in Unrealized Appreciation (Depreciation) on: | | | |
Investment securities | | (31,499 | ) |
| | | |
Net Realized and Unrealized Gain: | | 1,404 | |
Net Increase In Net Assets Resulting from Operations | | $ | 5,338 | |
The notes to the financial statements are an integral part of this report.
6
Legg Mason Partners All Cap
STATEMENTS OF CHANGES IN NET ASSETS
For the years ended
(all amounts in thousands)
| | December 31,
2007 | | December 31,
2006 | |
Increase (Decrease) in Net Assets From: Operations: | | | | | |
Net investment income | | $ | 3,934 | | $ | 4,561 | |
Net realized gain from investment securities and foreign currency transactions | | 32,903 | | 18,610 | |
Change in unrealized appreciation (depreciation) on investment securities and foreign currency translation | | (31,499 | ) | 40,612 | |
| | 5,338 | | 63,783 | |
Distributions to Shareholders: | | | | | |
From net investment income: | | | | | |
Initial Class | | (4,415 | ) | (3,581 | ) |
Service Class | | (149 | ) | (89 | ) |
| | (4,564 | ) | (3,670 | ) |
From net realized gains: | | | | | |
Initial Class | | (17,584 | ) | (49,991 | ) |
Service Class | | (694 | ) | (1,528 | ) |
| | (18,278 | ) | (51,519 | ) |
Capital Share Transactions: | | | | | |
Proceeds from shares sold: | | | | | |
Initial Class | | 11,134 | | 24,165 | |
Service Class | | 3,259 | | 4,192 | |
| | 14,393 | | 28,357 | |
Dividends and distributions reinvested: | | | | | |
Initial Class | | 21,999 | | 53,572 | |
Service Class | | 843 | | 1,617 | |
| | 22,842 | | 55,189 | |
Cost of shares redeemed: | | | | | |
Initial Class | | (89,664 | ) | (94,817 | ) |
Service Class | | (4,234 | ) | (1,874 | ) |
| | (93,898 | ) | (96,691 | ) |
| | (56,663 | ) | (13,145 | ) |
Net increase (decrease) in net assets | | (74,167 | ) | (4,551 | ) |
| | | | | |
Net Assets: | | | | | |
Beginning of year | | 383,502 | | 388,053 | |
End of year | | $ | 309,335 | | $ | 383,502 | |
Undistributed (Accumulated) Net Investment Income (Loss) | | $ | 3,930 | | $ | 4,566 | |
Share Activity: | | | | | |
Shares issued: | | | | | |
Initial Class | | 749 | | 1,625 | |
Service Class | | 220 | | 284 | |
| | 969 | | 1,909 | |
Shares issued-reinvested from distributions: | | | | | |
Initial Class | | 1,581 | | 4,068 | |
Service Class | | 61 | | 123 | |
| | 1,642 | | 4,191 | |
Shares redeemed: | | | | | |
Initial Class | | (6,072 | ) | (6,322 | ) |
Service Class | | (292 | ) | (126 | ) |
| | (6,364 | ) | (6,448 | ) |
Net increase (decrease) in shares outstanding: | | | | | |
Initial Class | | (3,742 | ) | (629 | ) |
Service Class | | (11 | ) | 281 | |
| | (3,753 | ) | (348 | ) |
The notes to the financial statements are an integral part of this report.
7
Legg Mason Partners All Cap
FINANCIAL HIGHLIGHTS
For a share outstanding throughout each period(a)
| | Initial Class | |
| | Year Ended December 31, | |
| | 2007 | | 2006 | | 2005 | | 2004 | | 2003 | |
Net Asset Value | | | | | | | | | | | |
Beginning of period | | $ | 14.73 | | $ | 14.71 | | $ | 14.22 | | $ | 13.06 | | $ | 9.70 | |
Investment Operations | | | | | | | | | | | |
Net investment income (loss) | | 0.16 | | 0.18 | | 0.10 | | 0.07 | | 0.04 | |
Net realized and unrealized gain (loss) | | (0.01 | ) | 2.26 | | 0.48 | | 1.12 | | 3.36 | |
Total operations | | 0.15 | | 2.44 | | 0.58 | | 1.19 | | 3.40 | |
Distributions | | | | | | | | | | | |
From net investment income | | (0.20 | ) | (0.16 | ) | (0.09 | ) | (0.03 | ) | (0.04 | ) |
From net realized gains | | (0.80 | ) | (2.26 | ) | — | | — | | — | |
Total distributions | | (1.00 | ) | (2.42 | ) | (0.09 | ) | (0.03 | ) | (0.04 | ) |
Net Asset Value | | | | | | | | | | | |
End of period(b) | | $ | 13.88 | | $ | 14.73 | | $ | 14.71 | | $ | 14.22 | | $ | 13.06 | |
Total Return(c),(d) | | 1.04 | % | 18.56 | % | 4.08 | % | 9.14 | % | 35.15 | % |
Net Assets End of Period (000’s) | | $ | 297,425 | | $ | 370,692 | | $ | 379,373 | | $ | 611,410 | | $ | 599,732 | |
Ratio and Supplemental Data | | | | | | | | | | | |
Expenses to average net assets(e) | | 0.87 | % | 0.88 | % | 0.86 | % | 0.87 | % | 0.86 | % |
Net investment income (loss), to average net assets(e) | | 1.11 | % | 1.22 | % | 0.68 | % | 0.53 | % | 0.32 | % |
Portfolio turnover rate(d) | | 15 | % | 15 | % | 33 | % | 36 | % | 17 | % |
| | | | | | | | | | | |
For a share outstanding throughout each period(a) | | | |
| | | | | |
| | Service Class | |
| | Year Ended December 31, | | May 1 to Dec | |
| | 2007 | | 2006 | | 2005 | | 2004 | | 31, 2003 | |
Net Asset Value | | | | | | | | | | | |
Beginning of period | | $ | 14.69 | | $ | 14.68 | | $ | 14.21 | | $ | 13.08 | | $ | 10.13 | |
Investment Operations | | | | | | | | | | | |
Net investment income (loss) | | 0.13 | | 0.15 | | 0.06 | | 0.06 | | 0.01 | |
Net realized and unrealized gain (loss) | | (0.02 | ) | 2.25 | | 0.48 | | 1.10 | | 2.94 | |
Total operations | | 0.11 | | 2.40 | | 0.54 | | 1.16 | | 2.95 | |
Distributions | | | | | | | | | | | |
From net investment income | | (0.17 | ) | (0.13 | ) | (0.07 | ) | (0.03 | ) | — | |
From net realized gains | | (0.80 | ) | (2.26 | ) | — | | — | | — | |
Total distributions | | (0.97 | ) | (2.39 | ) | (0.07 | ) | (0.03 | ) | — | |
Net Asset Value | | | | | | | | | | | |
End of period(b) | | $ | 13.83 | | $ | 14.69 | | $ | 14.68 | | $ | 14.21 | | $ | 13.08 | |
Total Return(c),(d) | | 0.77 | % | 18.29 | % | 3.81 | % | 8.90 | % | 29.12 | % |
Net Assets End of Period (000’s) | | $ | 11,910 | | $ | 12,810 | | $ | 8,680 | | $ | 7,496 | | $ | 1,239 | |
Ratio and Supplemental Data | | | | | | | | | | | |
Expenses to average net assets(e) | | 1.12 | % | 1.13 | % | 1.11 | % | 1.13 | % | 1.12 | % |
Net investment income (loss), to average net assets(e) | | 0.86 | % | 0.99 | % | 0.44 | % | 0.42 | % | 0.14 | % |
Portfolio turnover rate(d) | | 15 | % | 15 | % | 33 | % | 36 | % | 17 | % |
(a) Per share information is calculated based on average number of shares outstanding.
(b) Legg Mason Partners All Cap (the Fund”) share class commenced operations as follows:
Initial Class - May 3, 1999
Service Class - May 1, 2003
(c) Total Return reflects all portfolio expenses and includes reinvestment of dividends and capital gains; it does not reflect the charges and deductions under the policies or annuity contracts.
(d) Not annualized.
(e) Annualized.
The notes to the financial statements are an integral part of this report.
8
Legg Mason Partners All Cap
NOTES TO FINANCIAL STATEMENTS
At December 31, 2007
(all amounts in thousands)
NOTE 1. ORGANIZATION AND SIGNIFICANT ACCOUNTING POLICIES
AEGON/Transamerica Series Trust (“ATST”) is an open-end management investment company registered under the Investment Company Act of 1940, as amended (the “1940 Act”). ATST serves as a funding vehicle for variable life insurance, variable annuity and group annuity products. Legg Mason Partners All Cap (the “Fund”) is part of ATST. The Fund is “non- diversified” under the 1940 Act.
In the normal course of business, the Fund enters into contracts that contain a variety of representations that provide general indemnifications. The Fund’s maximum exposure under these arrangements is unknown, as this would involve future claims that may be made against the Fund and/or its affiliates that have not yet occurred. However, based on experience, the Fund expects the risk of loss to be remote.
This report should be read in conjunction with the current Fund prospectus, which contains more complete information about the Fund.
In preparing the Fund’s financial statements in accordance with accounting principles generally accepted in the United States of America (“GAAP”), estimates or assumptions (which could differ from actual results) may be used that affect reported amounts and disclosures. The following is a summary of significant accounting policies followed by the Fund.
Multiple class operations, income and expenses: The Fund currently offers two classes of shares, an Initial Class and a Service Class. Income, non-class specific expenses and realized and unrealized gains and losses, are allocated daily to each class, based upon the value of shares outstanding method as permitted under Rule 1 8f-3 of the 1940 Act. Each class bears its own specific expenses as well as a portion of general, common expenses.
Security valuations: The Fund values its investments at the close of the New York Stock Exchange (“NYSE”), normally 4 p.m. ET, each day the NYSE is open for business. Fund investments are valued at the last sale price or closing price on the day of valuation taken from the primary exchange where the security is principally traded.
Securities traded in the over-the-counter market and listed securities for which no sale was reported on that date are valued at the last quoted bid price.
Debt securities are valued based on a price quotation or other equivalent indication of value supplied by an exchange, a pricing service or a major market maker; however, those that mature in sixty days or less are valued at amortized cost, which approximates market.
Investment company securities are valued at the net asset value of the underlying portfolio.
Securities for which quotations are not readily available are valued at fair market value as determined in good faith by the Fund’s Administrative Valuation Committee, under the supervision of the Board’s Valuation Committee, using guidelines adopted by the Board of Trustees.
Cash: The Fund may leave cash overnight in its cash account with the custodian, State Street Bank & Trust Company (“State Street”). On July 2, 2007, State Street acquired the parent company of Investors Bank & Trust Company. State Street has been contracted on behalf of the Fund to invest the excess cash into a savings account, which at December 31, 2007 was paying an interest rate of 2.60%.
Repurchase agreements: The Fund is authorized to enter into repurchase agreements. The Fund, through its custodian, State Street, receives delivery of the underlying securities, the value of which at the time of purchase is required to be an amount equal to at least 100% of the resale price. The Fund will bear the risk of value fluctuations until the security can be sold and may encounter delays and incur costs in liquidating the security. In the event of bankruptcy or insolvency of the seller, delays and costs may be incurred.
Commission recapture: The sub-adviser, to the extent consistent with the best execution and usual commission rate policies and practices, may place security transactions of the Fund with broker/dealers with which ATST has established a Commission Recapture Program. A Commission Recapture Program is any arrangement under which a broker/dealer applies a portion of the commissions received by such broker/dealer on the security transactions to the Fund. In no event will commissions paid by the Fund be used to pay expenses that would otherwise be borne by any other funds within ATST, or by any other party.
Recaptured commissions during the year ended December 31, 2007 of $10 are included in net realized gain (loss) in the Statement of Operations.
Securities lending: The Fund may lend securities to qualified borrowers, with State Street acting as the Fund’s lending agent. The Fund earns negotiated lenders’ fees. The Fund receives cash and/or securities as collateral against the loaned securities. Cash collateral received is invested in short term, interest bearing securities. The Fund monitors the market value of securities loaned on a daily basis and requires collateral in an amount at least equal to the value of the securities loaned. Income from loaned securities earned by State Street for its services, shown in the Statement of Operations is net of fees, in the amount of $45.
The Fund has invested the cash collateral received from securities loaned in the following short-term, interest-bearing securities:
9
NOTES TO FINANCIAL STATEMENTS (continued)
At December 31, 2007
(all amounts in thousands)
NOTE 1.– (continued)
Abbey National PLC, Eurodollar Term, 5.00%, 1/7/2008 | | $ | 509 | |
ABN AMRO Bank NV, Eurodollar Term, 5.18%, 1/4/2008 | | 407 | |
Bank of Nova Scotia, Eurodollar Term, 4.96%, 1/22/2008 | | 356 | |
Barclays, Eurodollar Term, 5.00%, 2/12/2008 | | 713 | |
BNP Paribas, Eurodollar Term, 5.01%, 1/11/2008 | | 662 | |
Calyon, Eurodollar Term, 5.12%, 3/3/2008 | | 153 | |
Credit Suisse First Boston Corp., Repurchase Agreement, 4.60%, 1/2/2008 | | 1,323 | |
Dexia Group, Eurodollar Term, 4.82%, 1/3/2008 | | 509 | |
HBOS Halifax Bank of Scotland, Eurodollar Term, 5.15%, 1/2/2008 | | 254 | |
JPMorgan Chase & Co., Eurodollar Term, 5.15%, 2/12/2008 | | 254 | |
Lloyds TSB Bank, Eurodollar Term, 5.15%, 1/24/2008 | | 509 | |
Merrill Lynch & Co. (RPG), Repurchase Agreement, 4.60%, 1/2/2008 | | 763 | |
Morgan Stanley & Co. (Corp. Repo), Repurchase Agreement, 4.60%, 1/2/2008 | | 2,087 | |
Rabobank Nederland, Eurodollar Term, 5.08%, 1/10/2008 | | 611 | |
Reserve Primary Money Market Fund, 4.95% | | 543 | |
Royal Bank of Scotland, Eurodollar Term, 5.00%, 2/25/2008 | | 611 | |
Societe Generale, Eurodollar Term, 5.15%, 3/3/2008 | | 305 | |
Toronto Dominion Bank, Eurodollar Term, 5. 05 %, 1/10/2008 | | 611 | |
UBS AG, Eurodollar Term, 4.92%, 1/11/2008 | | 356 | |
Wells Fargo, Bank Note, 4.75%, 1/8/2008 | | 254 | |
| | | |
| | $ | 11,790 | |
Real Estate Investment Trusts (“REITs”): There are certain additional risks involved in investing in REITs. These include, but are not limited to, economic conditions, changes in zoning laws, real estate values, property taxes and interest rates. Since the Fund invests in real estate securities, the net asset value per share may fluctuate more widely than the value of shares of a fund that invests in a broad range of industries.
Dividend income is recorded at management’s estimate of the income included in distributions from the REIT investments. Distributions received in excess of the estimated amount are recorded as a reduction of the cost of investments. The actual amounts of income, return of capital and capital gains are only determined by each REIT after the fiscal year end and may differ from the estimated amounts.
Security transactions and investment income: Security transactions are recorded on the trade date. Security gains and losses are calculated on the first-in, first-out basis. Dividend income, if any, is recorded on the ex-dividend date or, in the case of foreign securities, as soon as the Fund is informed of the ex-dividend date. Interest income, including accretion of discounts and amortization of premiums, is recorded on the accrual basis commencing on the settlement date.
Dividend distributions: Dividends and capital gains distributions are typically declared and reinvested annually and are generally paid and reinvested on the business day following the ex-date.
NOTE 2. RELATED PARTY TRANSACTIONS
ATST serves as a funding vehicle for certain affiliated asset allocation portfolios and certain affiliated separate accounts of Western Reserve Life Assurance Co. of Ohio, Transamerica Life Insurance Company, Transamerica Financial Life Insurance Company, Inc., Monumental Life Insurance Company and Transamerica Occidental Life Insurance Company.
Transamerica Fund Advisors, Inc. (“TFAI”) is the Fund’s investment adviser. Transamerica Fund Services, Inc. (“TFS”) is the Fund’s administrator and transfer agent. Prior to May 1, 2007, AFSG Securities Corp. (“AFSG”), was the Fund’s distributor. Transamerica Capital Inc. (“TCI”) is now the Fund’s distributor. TFAI, TFS, AFSG, and TCI are affiliates of AEGON NV, a Netherlands corporation.
Certain officers and trustees of the Fund are also officers and/or directors of TFAI, TFS and TCI.
Investment advisory fee: The Fund pays management fees to TFAI based on average daily net assets (“ANA”) at the following breakpoints:
0.80% of the first $500 million of ANA
0.675% of ANA over $500 million
TFAI has contractually agreed to waive its advisory fee and will reimburse the Fund to the extent that operating expenses, excluding 12b-1 fees, exceed the following stated annual limit:
0.90% Expense Limit
If total Fund expenses fall below the annual expense limitation agreement agreed to by the adviser within the succeeding three years, the Fund may be required to pay the adviser a portion or all of the waived advisory fees.
There were no amounts recaptured during the year ended December 31, 2007. There are no amounts available for recapture at December 31, 2007.
Distribution and service fees: ATST entered into a Distribution Agreement with AFSG dated January 1, 1997, as amended. On May 1, 2007, the Distribution Agreement was amended to replace AFSG with TCI as the Fund’s distributor. The Fund has also adopted a distribution plan (“Distribution Plan”) pursuant to Rule 12b-1 under the 1940 Act.
Under the Distribution Plan for the Initial Class shares, TCI, on behalf of the Fund, is authorized to pay various service providers, as direct payment for expenses incurred in connection with distribution of the Fund’s shares, amounts equal to actual expenses associated with distributing the shares.
The Distribution Plan for the Service Class shares requires ATST to pay distribution fees to TCI as compensation for its activities, not as reimbursement for specific expenses. The fee on the Service Class is paid to the insurance companies for providing services and account maintenance for their policyholders who invest in the variable insurance products which invest in the Service Class shares.
The Fund is authorized under the Distribution Plan to pay fees on each class up to the following limits:
Initial Class | | 0.15% |
Service Class | | 0.25% |
10
NOTES TO FINANCIAL STATEMENTS (continued)
At December 31, 2007
(all amounts in thousands)
NOTE 2.– (continued)
TCI has determined that it will not seek payment by the Fund of the distribution expenses incurred with respect to the Initial Class shares before April 30, 2009. Prior to TCI seeking reimbursement of future expenses, policy and contract owners will be notified in advance. The Fund will pay fees relating to Service Class shares.
Administrative services: The Fund has entered into an agreement with TFS for financial and legal fund administration services. The Fund pays TFS an annual fee of 0.02% of ANA. The Legal fees on the Statement of Operations are for fees paid to external legal counsel.
Deferred compensation plan: Each eligible independent Fund Trustee may elect participation in a non-qualified deferred compensation plan (“the Plan”). Under the Plan, such Trustees may defer payment of all or a portion of their total fees earned as a Fund Trustee. Each Trustee who is a participant in the Plan may elect that the earnings, losses or gains credited to his or her deferred fee amounts be determined based on a deemed investment in any series of Transamerica IDEX Mutual Funds. The right of a participant to receive a distribution from the Plan of the deferred fees is an unsecured claim against the general assets of all series of Transamerica IDEX Mutual Funds. The pro rata liability to the Fund of all deferred fees in the Plan amounted, as of December 31, 2007, to $15. Amounts deferred under the Plan are unfunded against the general assets of ATST.
Retirement plan: Under a retirement plan (the “Emeritus Plan”) available to the Independent Trustees, each Independent Trustee is deemed to have elected to serve as Trustee Emeritus of ATST upon his or her termination of service, other than removal for cause, and is entitled to 50% of the trustee’s current retainer for a maximum period of five years determined by his or her years of service as a Trustee.
Such amounts shall be accrued by ATST on a pro rata basis allocable to each series of ATST fund based on the relative assets of the series. If retainers increase in the future, past accruals (and credits) will be adjusted upward so that 50% of the Trustee’s current retainer is accrued and credited at all times. Upon death, disability or termination of service, other than removal for cause, amounts deferred become payable to an Emeritus Trustee (or his/her beneficiary). Upon the commencement of service as Trustee Emeritus, compensation will be paid on a quarterly basis during the time period that the Trustee Emeritus is allowed to serve as such.
Amounts accrued under the Emeritus Plan are unsecured claims against the general assets of ATST. For the year ended December 31, 2007, the amount related to the Emeritus Plan was $16. As of December 31, 2007, the Fund has not made any payments related to the Emeritus Plan.
The Emeritus Plan was terminated effective October 30, 2007. Upon the termination, the Fund shall continue to pay any remaining benefits in accordance with the Plan, but no further compensation shall accrue under the Plan.
NOTE 3. INVESTMENT TRANSACTIONS
The cost of securities purchased and proceeds from securities sold (excluding short-term securities) for the year ended December 31, 2007 were as follows:
Purchases of securities: | | | |
Long-term | | $ | 54,532 | |
U.S. Government | | — | |
Proceeds from maturities and sales of securities: | | | |
Long-term | | 126,187 | |
U.S. Government | | — | |
| | | | |
NOTE 4. FEDERAL INCOME TAX MATTERS
The Fund has not made any provision for federal income or excise taxes due to its policy to distribute all of its taxable income and capital gains to its shareholders and otherwise qualify as a regulated investment company under Subchapter M of the Internal Revenue Code. Income and capital gain distributions are determined in accordance with income tax regulations, which may differ from GAAP.
These differences are primarily due to differing treatment for items including, but not limited to, wash sales and foreign currency transactions.
Therefore, distributions determined in accordance with tax regulations may differ significantly in amount or character from net investment income and realized gains for financial reporting purposes. Financial reporting records are adjusted for permanent book/tax differences to reflect tax character. Financial records are not adjusted for temporary differences. These reclassifications are as follows:
Additional paid-in capital | | $ | — | |
Undistributed (accumulated) net investment income (loss) | | $ | (6 | ) |
Undistributed (accumulated) net realized gain (loss) from investment securities | | $ | 6 | |
The tax character of distributions paid may differ from the character of distributions shown in the Statements of Changes in Net Assets due to short-term gains being treated as ordinary income for tax purposes. The tax character of distributions paid during 2006 and 2007 was as follows:
2006 Distributions paid from: | | | |
Ordinary Income | | $ | 3,670 | |
Long-term Capital Gain | | 51,519 | |
2007 Distributions paid from: | | | |
Ordinary Income | | 5,500 | |
Long-term Capital Gain | | 17,342 | |
| | | | |
11
NOTES TO FINANCIAL STATEMENTS (continued)
At December 31, 2007
(all amounts in thousands)
NOTE 4.– (continued)
The tax basis components of distributable earnings as of December 31, 2007 are as follows:
Undistributed Ordinary Income | | $ | 4,736 | |
Undistributed Long-term Capital Gain | | $ | 32,056 | |
Capital Loss Carryforward | | $ | — | |
Post October Capital Loss Deferral | | $ | — | |
Post October Currency Loss Deferral | | $ | (1 | ) |
Net Unrealized Appreciation (Depreciation) | | $ | 61,082 | |
NOTE 5. REGULATORY PROCEEDINGS
There continues to be significant federal and state regulatory activity relating to financial services companies, particularly mutual fund companies and their investment advisers. As part of an ongoing investigation regarding potential market timing, recordkeeping and trading compliance issues and matters affecting the Fund’s investment adviser, TFAI, and certain affiliates and former employees of TFAI, the SEC staff has indicated that it is likely to take some action against TFAI and certain of its affiliates at the conclusion of the investigation. The potential timing and the scope of any such action is difficult to predict. Although the impact of any action brought against TFAI and/or its affiliates is difficult to assess at the present time, the Fund currently believes that the likelihood that any such action will have a material adverse impact is remote. It is important to note that the Fund is not aware of any allegation of wrong doing against it and its Board at the time this annual report is printed. Although it is not anticipated that these developments will have an adverse impact on the Fund, there can be no assurance at this time. TFAI and its affiliates are actively working with the SEC in regard to this matter; however, the exact resolution cannot be determined at this time. TFAI will take such actions that it deems necessary or appropriate to continue providing management services to the Fund and to bring all matters to an appropriate conclusion.
TFAI and/or its affiliates, and not the Fund, will bear the costs regarding these regulatory matters.
NOTE 6. RECENTLY ISSUED ACCOUNTING PRONOUNCEMENTS
In July 2006, the Financial Accounting Standards Board (“FASB”) released FASB Interpretation No. 48 “Accounting for Uncertainty in Income Taxes” (“FIN 48”), an interpretation of FASB Statement No. 109. FIN 48 provides guidance for how uncertain tax positions should be recognized, measured, presented and disclosed in the financial statements. FIN 48 requires the accounting and disclosure of tax positions taken or expected to be taken in the course of preparing the Fund’s tax returns to determine whether the tax positions are “more-likely- than-not” of being sustained by the applicable tax authority. Tax positions not deemed to meet the more-likely-than-not threshold would be recorded as a tax benefit or expense in the current year.
Adoption of FIN 48 is effective during the first required financial reporting period for fiscal years beginning after December 15, 2006. Management adopted FIN 48 on June 29, 2007.
Implementation of FIN 48 requires Management of the Fund to analyze all open tax years, as defined by the Statute of Limitations, for all major jurisdictions, which includes federal and certain states. Open tax years are those that are open for exam by taxing authorities (i.e., the last 4 tax year ends and the interim tax period since then). The Fund has no examinations in progress and none are expected at this time.
Management of the Fund has reviewed all open tax years and major jurisdictions and concluded the adoption of FIN 48 resulted in no impact to the Fund’s net assets or results of operations. There is no tax liability resulting from unrecognized tax benefits relating to uncertain income tax positions taken or expected to be taken in future tax returns. The Fund is also not aware of any tax positions for which it is reasonably possible that the total amounts of unrecognized tax benefits will significantly change in the next 12 months.
In September 2006, FASB issued its new Standard No. 157, “Fair Value Measurements” (“FAS 157”). FAS 157 is designed to unify guidance for the measurement of fair value of all types of assets, including financial instruments, and certain liabilities, throughout a number of accounting standards. FAS 157 also establishes a hierarchy for measuring fair value in generally accepted accounting principles and expands financial statement disclosures about fair value measurements that are relevant to mutual funds. FAS 157 is effective for financial statements issued for fiscal years beginning after November 15, 2007, and earlier application is permitted.
As of December 31, 2007, Management does not expect the adoption of FAS 157 to impact the amounts reported in the financial statements, however, additional disclosures will be required about the inputs used to develop the measurements of fair value and the effect of certain of the measurements reported in the statement of operations for a fiscal period.
NOTE 7. SUBSEQUENT EVENT
Effective January 1, 2008, TFAI changed its name to Transamerica Asset Management, Inc.
Effective May 1, 2008, AEGON/Transamerica Series Trust will change its name to Transamerica Series Trust. At that time, the Fund will also change its name to Transamerica Legg Mason Partners All Cap VP.
12
Report of Independent Registered Certified Public Accounting Firm
To the Board of Trustees and Shareholders of
Legg Mason Partners All Cap:
In our opinion, the accompanying statement of assets and liabilities, including the schedule of investments, and the related statements of operations and of changes in net assets and the financial highlights present fairly, in all material respects, the financial position of Legg Mason Partners All Cap (the “Fund”) (one of the portfolios constituting AEGON/Transamerica Series Trust) at December 31, 2007, the results of its operations for the year then ended, the changes in its net assets for each of the two years in the period then ended and the financial highlights for each of the periods presented, in conformity with accounting principles generally accepted in the United States of America. These financial statements and financial highlights (hereafter referred to as “financial statements”) are the responsibility of the Fund’s management; our responsibility is to express an opinion on these financial statements based on our audits. We conducted our audits of these financial statements in accordance with the standards of the Public Company Accounting Oversight Board (United States). Those standards require that we plan and perform the audit to obtain reasonable assurance about whether the financial statements are free of material misstatement. An audit includes examining, on a test basis, evidence supporting the amounts and disclosures in the financial statements, assessing the accounting principles used and significant estimates made by management, and evaluating the overall financial statement presentation. We believe that our audits, which included confirmation of securities at December 31, 2007 by correspondence with the custodian and brokers, provide a reasonable basis for our opinion.

Tampa, Florida
February 29, 2008
13
Legg Mason Partners All Cap
SUPPLEMENTAL TAX INFORMATION (unaudited)
(all amounts in thousands)
For tax purposes, the Fund has made a Long-Term Capital Gain Designation of $17,343 for the year ended December 31, 2007.
RESULTS OF SHAREHOLDER PROXY (unaudited)
At a special meeting of shareholders held on October 30, 2007, the results of the Proposals were as follows:
Proposal 1: To elect a new Board:
Proposed
Trustee | | For | | Against | | Abstentions/Broker Non-
Votes |
John K. Carter | | 2,274,998,840.817 | | 57,804,698.755 | | 35,433.883 |
| | | | | | |
Leo J. Hill | | 2,277,212,702.754 | | 55,590,836.819 | | 35,433.883 |
| | | | | | |
Neal M. Jewell | | 2,266,793,295.663 | | 66,010,243.909 | | 35,433.883 |
| | | | | | |
Russell A. Kimball, Jr. | | 2,274,825,235.835 | | 57,978,303.737 | | 35,433.883 |
| | | | | | |
Eugene M. Mannella | | 2,274,623,165.033 | | 58,180,374.539 | | 35,433.883 |
| | | | | | |
Norm R. Nielsen | | 2,275,050,055.885 | | 57,753,483.687 | | 35,433.883 |
| | | | | | |
Joyce Galpern Norden | | 2,270,278,122.250 | | 62,525,417.323 | | 35,433.883 |
| | | | | | |
Patricia L. Sawyer | | 2,275,737,737.456 | | 57,065,802.116 | | 35,433.883 |
| | | | | | |
John W. Waechter | | 2,276,615,120.140 | | 56,188,419.433 | | 35,433.883 |
Proposal 2: To approve an amendment to the Agreement and Declaration of Trust:
| | | | Abstentions/Broker Non- |
For | | Against | | Votes |
2,182,022,669.110 | | 77,590,048.544 | | 73,226,255.801 |
14
Legg Mason Partners All Cap
INVESTMENT ADVISORY AND SUB-ADVISORY AGREEMENTS-REVIEW AND RENEWAL (unaudited)
At a meeting of the Board of Trustees of AEGON/Transamerica Series Trust (“ATST”) held on December 4th, 2007, the Board reviewed and considered the renewal of the investment advisory agreement (the “Investment Advisory Agreement”) between Legg Mason Partners All Cap (the “Fund”) and Transamerica Fund Advisors, Inc. (“TFAI”), as well as the renewal of the investment sub-advisory agreement (the “Sub-Advisory Agreement”) of the Fund between TFAI and ClearBridge Advisors, LLC (the “Sub-Adviser”), to determine whether the agreements should be renewed for a six-month period. It was noted that this review was interim in nature to align all the Funds on the same calendar, and that the Funds’ advisory arrangements would be reviewed again in the first half of 2008.
Following their review and consideration, the Trustees determined that the renewal of the Investment Advisory Agreement and the Sub- Advisory Agreement would enable shareholders of the Fund to obtain high quality services at a cost that is appropriate, fair, and in the best interests of its shareholders. The Board, including the independent members of the Board, unanimously approved the renewal of the Investment Advisory Agreement and Sub-Advisory Agreement. In reaching their decision, the Trustees requested and obtained from TFAI and the Sub-Adviser such information as they deemed reasonably necessary to evaluate the agreements, including information about fees and performance of comparable funds managed by the Sub-Adviser. The Trustees also carefully considered information they had previously received from TFAI and the Sub-Adviser throughout the year as part of their regular oversight of the Fund, as well as comparative fee, expense, and performance information prepared by Lipper Inc. (“Lipper”), an independent provider of mutual fund performance, fee and expense information and profitability data prepared by management. In considering the proposed continuation of the Investment Advisory and Sub-Advisory Agreements, the Trustees evaluated a number of considerations that they believed, in light of the legal advice furnished to them by independent legal counsel and their own business judgment, to be relevant. They based their decisions on a variety of factors, including the following considerations, among others, although they did not identify any consideration or particular information that was controlling of their decisions:
The nature, extent and quality of the advisory services to be provided. The Board considered the nature and quality of the services provided by TFAI and the Sub-Adviser to the Fund in the past, as well as the services anticipated to be provided in the future. The Board concluded that TFAI and the Sub-Adviser are capable of providing high quality services to the Fund, as indicated by the nature and quality of services provided in the past by TFAI and the Sub-Adviser for this series and the experience, capability and integrity of TFAI’s senior management, the financial resources of TFAI and the Sub-Adviser, TFAI’s management oversight process and the professional qualifications of the portfolio management team of the Sub-Adviser. The Trustees determined that TFAI and the Sub-Adviser can provide investment and related services that are appropriate in scope and extent in light of the Fund’s operations, the competitive landscape of the investment company business and investor needs.
The investment performance of the Fund. The Board examined the short and longer-term performance of the Fund, including relative performance against a peer universe of comparable mutual funds as prepared by Lipper for various trailing periods ended June 30, 2007. The Board noted both short and longer-term performance was below median. On the basis of the Board’s assessment of the nature, extent and quality of advisory services to be provided or procured by TFAI and the Sub-Adviser, the Board concluded that TFAI and the Sub-Adviser are capable of providing a level of investment performance that is appropriate in light of the Fund’s proposed investment objectives, policies and strategies and competitive with other similarly situated investment companies, but the Board noted that they would be monitoring performance closely.
The cost of advisory services provided and the level of profitability. The Board reviewed profitability information of TFAI’s cost of procuring fund management services, as well as the costs of provision of administration, fund accounting and other services, to the Fund and to ATST as a whole by TFAI and its affiliates. The Board reviewed the management and sub-advisory fees for the Fund, noting that the contractual advisory are higher than the median for comparable funds but by a relatively small margin. The Board noted that fees for the Fund were renegotiated for 2008. Based on their review, the Trustees determined that the management fees of the Fund generally are appropriate in light of the services expected to be provided or procured, the management fees and the anticipated profitability of the relationship between the Fund, TFAI and its affiliates, and the Sub-Adviser. In making these observations and determinations, the Board reviewed, among other things, comparative information provided by Lipper.
Whether fee levels reflect economies of scale and the extent to which economies of scale would be realized as the Fund grows. In evaluating the extent to which the management fees payable under the Investment Advisory and Sub-Advisory Agreements reflect economies of scale or will permit economies of scale to be realized in the future, the Board noted that TFAI and the Sub-Adviser offer breakpoints which appropriately benefit investors by passing on economies of scale in the form of lower management fees as the level of assets grows. The Trustees also concluded that they will have the opportunity to periodically reexamine whether the Fund has achieved economies of scale, and the appropriateness of management fees payable to TFAI and fees paid to the Sub-Adviser, in the future.
Benefits (such as soft dollars) to TFAI, its affiliates, or the Sub-Adviser from their relationship with the Fund. The Board concluded that other benefits anticipated to be derived by TFAI, its affiliates, and the Sub-Adviser from their relationships with the Fund are expected to be reasonable and fair, and consistent with industry practice and the best interests of the Fund and its shareholders. The Trustees noted that TFAI would not realize soft dollar benefits from its relationship with the Fund, and that the Sub-Adviser’s soft dollar trading is consistent with applicable law, including best execution requirements in particular. The Board also noted that the Sub-Adviser is participating in a brokerage program pursuant to which a portion of brokerage commissions paid by the Fund is recaptured for the benefit of the Fund and its shareholders, thus limiting the amount of soft dollar arrangements the Sub-Adviser may engage in with respect to the Fund’s brokerage transactions.
15
Other considerations. The Board determined that TFAI has made a substantial commitment to the recruitment and retention of high quality personnel, and maintains the financial, compliance and operational resources reasonably necessary to manage the Fund in a professional manner that is consistent with the best interests of the Fund and its shareholders. In this regard, the Trustees favorably considered the procedures and policies in place by TFAI to enforce compliance with applicable laws and regulations and oversee the portfolio management activities of the Sub-Adviser. The Trustees also determined that TFAI has made a significant entrepreneurial commitment to the management and success of the Fund, reflected by TFAI’s expense limitation and fee waiver arrangements with the Fund which may result in TFAI waiving a substantial amount of management fees for the benefit of shareholders.
16
Marsico Growth
MARKET ENVIRONMENT
U.S. large capitalization equities, as measured by the Standard and Poor’s 500 Composite Stock Index (“S&P 500”), posted a return of 5.49% for the year-ended December 31, 2007. From the perspective of the Global Industry Classification Standards (“GICS”) sector performance (in the S&P 500), eight of ten sectors had positive gains for the year. Energy (+35%), materials (+23%), utilities (+19%), and information technology (“IT”) (+16%) posted the highest returns, while financials (-19%) and consumer discretionary (-13%) were in negative territory for the year.
At an industry level, the top-performing groups included: software and services (+18%); food beverage and tobacco (+18%); technology hardware and equipment (+17%); and capital goods (+16%). Several industry groups had negative returns for the year, including: banks (-30%); consumer durables and apparel (-21%); diversified financials (-19%); and real estate (-18%).
PERFORMANCE
For the year ended December 31, 2007, Marsico Growth, Initial Class returned 20.40%. By comparison its primary and secondary benchmarks, the S&P 500 and the Russell 1000 Growth Index, returned 5.49% and 11.81%, respectively.
STRATEGY REVIEW
In reviewing the portfolio’s annual investment results, several factors emerged as primary contributors to the portfolio’s performance results in the period. The portfolio’s holdings in the IT sector, including: MasterCard Incorporated (112%); Apple Inc. (+82%); and Google Inc. (+48%), were among the top contributors to performance for the period. Telecommunication services companies China Mobile Limited (+114%) and America Movil S.A. de C.V. (+41%) also materially contributed.
Financials was an area of weakness for the benchmark index with an absolute return of - -19%. The portfolio’s underweighted posture in the sector, therefore, helped performance. In addition, price increases in China Merchants Bank Co., Ltd. (+94% prior to being sold) and Goldman Sachs Group, Inc. (+9%) further aided results.
Several individual holdings also contributed to performance. Monsanto Company (+115%), Jacobs Engineering Group Inc. (+121%), Schlumberger Limited (+58%), MGM MIRAGE (+46%) and Union Pacific Corporation (+39%) emerged as top contributors to performance for the period.
A few factors had a negative impact on performance results. The most significant factor was an overweighted posture in the weak-performing consumer discretionary sector. In addition, price declines in several of the consumer discretionary holdings detracted from results. Media company Comcast Corporation (-37% prior to being sold), Lowe’s Companies, Inc. (-27%), Toyota Motor Corporation (-19%), and Starbucks Corporation (-26% prior to being sold) were among the portfolio’s weakest individual positions.
Financials companies Federal National Mortgage Association (“Fannie Mae”), Moody’s Corporation, and Morgan Stanley, each declined sharply prior to being sold from the portfolio.
Energy was an area of strength for the benchmark index with an absolute return of +35%. The portfolio’s underweighted posture in the sector, therefore, proved to be an opportunity cost.
Thomas F. Marsico
Portfolio Manager
Marsico Capital Management, LLC*
* Columbia Management Advisors, LLC entered into an agreement with Marsico under which Marsico provides portfolio management to the portfolio.
AEGON/Transamerica Series Trust | Annual Report 2007 |
1
Marsico Growth
(unaudited)
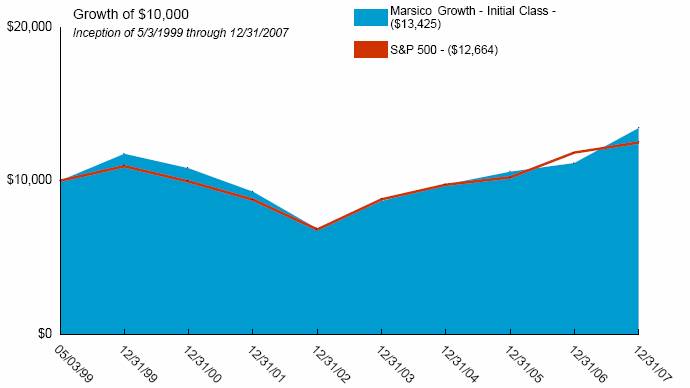
Average Annual Total Return for Periods Ended 12/31/2007
| | 1 Year | | 5 Years | | From
Inception | | Inception
Date | |
| | | | | | | | | |
Initial Class | | 20.40 | % | 14.33 | % | 3.46 | % | 5/3/99 | |
S&P 500(1) | | 5.49 | % | 12.83 | % | 2.76 | % | 5/3/99 | |
Russell 1000 Growth (1) | | 11.81 | % | 12.10 | % | (0.17 | )% | 5/3/99 | |
| | | | | | | | | |
Service Class | | 20.13 | % | — | % | 13.94 | % | 5/1/03 | |
NOTES
(1) The Standard and Poor’s 500 Composite Stock (S&P 500) Index and the Russell 1000 Growth (Russell 1000 Growth) Index are unmanaged indices used as a general measure of market performance. Calculations assume dividends and capital gains are reinvested and do not include any managerial expenses. From inception calculation is based on life of Initial Class shares.
The performance data presented represents past performance, future results may vary. The portfolio’s investment return and net asset value will fluctuate. Past performance does not guarantee future results. Investor’s units when redeemed, may be worth more or less than their original cost.
Current performance may be lower or higher than performance quoted. Please visit your insurance company’s website for contract or policy level standardized total returns current to the most recent month end. Portfolio performance is net of investment fees and fund expenses, but not product charges, which, if included, would significantly lower the performance quoted.
This material must be preceded or accompanied by a current prospectus, which includes specific contents regarding the investment objectives, explanation of share classes and policies of this portfolio.
2
Marsico Growth
UNDERSTANDING YOUR FUND’S EXPENSES
(unaudited)
SHAREHOLDER EXPENSES
Fund shareholders may incur ongoing costs, including management and advisory fees, distribution and service fees, and other fund expenses.
The following Example is intended to help you understand your ongoing costs (in dollars and cents) of investing in the Fund and to compare these costs with the ongoing costs of investing in other funds.
The Example is based on an investment of $1,000 invested at July 1, 2007 and held for the entire period until December 31, 2007.
ACTUAL EXPENSES
The first line in the table below provides information about actual account values and actual expenses. You may use the information in this line, together with the amount you invested, to estimate the expenses that you paid over the period. Simply divide your account value by $1,000 (for example, an $8,600 account value divided by $1,000 = 8.6), then multiply the result by the number in the first line of your Fund under the heading entitled “Expenses Paid During Period” to estimate the expenses you paid on your account during this period. If your account is an IRA, your expenses could have included a $15 annual fee. The amount of any fee paid through your account would increase the estimate of expenses you paid during the period and decrease your ending account value.
HYPOTHETICAL EXAMPLE FOR COMPARISON PURPOSES
The second line in the table below provides information about hypothetical account values and hypothetical expenses based on the Fund’s actual expense ratio and an assumed rate of return of 5% per year before expenses, which is not the Fund’s actual return. The hypothetical account values and expenses may not be used to estimate the actual ending account balance or expenses you paid for the period. You may use this information to compare the ongoing costs of investing in your Fund and other funds. To do so, compare this 5% hypothetical example with the 5% hypothetical examples that appear in the shareholder reports of the other funds.
Please note that the expenses shown in the table are meant to highlight your ongoing costs only and do not reflect any transactional costs, such as sales charges, redemption fees, brokerage commissions paid on purchases and sales of fund shares. Therefore, the second line under the Fund in the table is useful in comparing ongoing costs only, and will not help you determine the relative total costs of owning different funds. If any of these transaction costs were included, your costs would be higher. The expenses shown in the table do not reflect any fees that may be charged to you by brokers, financial intermediaries or other financial institutions.
| | Beginning
Account
Value | | Ending
Account
Value | | Annualized
Expense
Ratio | | Expenses
Paid During
Period (a) | |
Initial Class | | | | | | | | | |
Actual | | $ | 1,000.00 | | $ | 1,108.27 | | 0.81 | % | $ | 4.30 | |
Hypothetical (b) | | 1,000.00 | | 1,021.12 | | 0.81 | | 4.13 | |
| | | | | | | | | |
Service Class | | | | | | | | | |
Actual | | 1,000.00 | | 1,108.04 | | 1.06 | | 5.63 | |
Hypothetical (b) | | 1,000.00 | | 1,019.86 | | 1.06 | | 5.40 | |
| | | | | | | | | | | | |
(a) | | Expenses are calculated using the Fund’s annualized expense ratio (as disclosed in the table), multiplied by the average account value for the period, multiplied by the number of days in the period (184 days), and divided by the number of days in the year (365 days). |
| | |
(b) | | 5% return per year before expenses. |
GRAPHICAL PRESENTATION OF SCHEDULE OF INVESTMENTS
By Sector
At December 31, 2007

This chart shows the percentage breakdown by sector of the Fund’s total investment securities.
3
Marsico Growth
SCHEDULE OF INVESTMENTS
At December 31, 2007
(all amounts except share amounts in thousands)
| | Shares | | Value | |
COMMON STOCKS (94.0%) | | | | | |
Aerospace & Defense (6.7%) | | | | | |
Boeing Co. | | 60,778 | | $ | 5,316 | |
General Dynamics Corp. | | 214,353 | | 19,075 | |
Lockheed Martin Corp. | | 226,054 | | 23,794 | |
Air Freight & Logistics (0.2%) | | | | | |
FedEx Corp. | | 17,801 | | 1,587 | |
Automobiles (1.9%) | | | | | |
Toyota Motor Corp. | | 129,254 | | 13,723 | |
Beverages (2.5%) | | | | | |
Coca-Cola Co. (The) | | 120,794 | | 7,413 | |
Heineken NV | | 330,765 | | 10,717 | |
Biotechnology (2.4%) | | | | | |
Amylin Pharmaceuticals, Inc. ‡^ | | 68,955 | | 2,551 | |
Genentech, Inc. ‡ | | 221,569 | | 14,861 | |
Capital Markets (6.9%) | | | | | |
Goldman Sachs Group, Inc. (The) | | 139,091 | | 29,912 | |
Lehman Brothers Holdings, Inc. | | 252,911 | | 16,550 | |
Merrill Lynch & Co., Inc. | | 58,667 | | 3,149 | |
Chemicals (6.4%) | | | | | |
Air Products & Chemicals, Inc. | | 70,968 | | 7,000 | |
Monsanto Co. | | 238,964 | | 26,690 | |
Praxair, Inc. | | 145,084 | | 12,870 | |
Commercial Banks (3.3%) | | | | | |
Industrial & Commercial Bank of China Class H | | 27,960,000 | | 20,080 | |
Wells Fargo & Co. | | 136,127 | | 4,110 | |
Communications Equipment (0.7%) | | | | | |
Qualcomm, Inc. | | 129,779 | | 5,107 | |
Computers & Peripherals (5.1%) | | | | | |
Apple, Inc. ‡ | | 139,392 | | 27,611 | |
Hewlett-Packard Co. | | 182,276 | | 9,201 | |
Construction & Engineering (3.2%) | | | | | |
Jacobs Engineering Group, Inc. ‡ | | 238,874 | | 22,839 | |
Diversified Telecommunication Services (2.6%) | | | | | |
AT&T, Inc. | | 461,033 | | 19,161 | |
Energy Equipment & Services (6.4%) | | | | | |
Cameron International Corp. ‡ | | 89,206 | | 4,294 | |
Schlumberger, Ltd. | | 247,648 | | 24,361 | |
Transocean, Inc. | | 121,868 | | 17,445 | |
Food & Staples Retailing (2.2%) | | | | | |
CVS Caremark Corp. | | 234,613 | | 9,326 | |
Tesco PLC | | 720,745 | | 6,847 | |
Health Care Providers & Services (4.8%) | | | | | |
UnitedHealth Group, Inc. | | 594,809 | | $ | 34,618 | |
Hotels, Restaurants & Leisure (11.1%) | | | | | |
Las Vegas Sands Corp. ‡ | | 147,516 | | 15,202 | |
McDonald's Corp. | | 541,306 | | 31,888 | |
MGM Mirage, Inc. ‡ | | 180,434 | | 15,160 | |
Wynn Resorts, Ltd. ^ | | 69,534 | | 7,797 | |
Yum! Brands, Inc. | | 279,732 | | 10,705 | |
Internet Software & Services (3.2%) | | | | | |
Google, Inc. Class A ‡ | | 33,424 | | 23,112 | |
IT Services (4.0%) | | | | | |
Mastercard, Inc. Class A ^ | | 133,095 | | 28,642 | |
Oil, Gas & Consumable Fuels (3.0%) | | | | | |
Petroleo Brasileiro SA | | 187,133 | | 21,565 | |
Pharmaceuticals (3.1%) | | | | | |
Merck & Co., Inc. | | 290,006 | | 16,852 | |
Schering-Plough Corp. | | 198,570 | | 5,290 | |
Road & Rail (2.3%) | | | | | |
Union Pacific Corp. | | 130,103 | | 16,344 | |
Semiconductors & Semiconductor Equipment (2.0%) | | | | | |
Intel Corp. | | 555,891 | | 14,820 | |
Software (2.9%) | | | | | |
Microsoft Corp. | | 595,121 | | 21,186 | |
Specialty Retail (1.2%) | | | | | |
Lowe's Cos., Inc. | | 393,583 | | 8,903 | |
Wireless Telecommunication Services (5.9%) | | | | | |
America Movil SAB de CV Series R, Class R | | 324,266 | | 19,907 | |
China Mobile, Ltd. | | 1,304,000 | | 23,062 | |
Total Common Stocks (cost $554,778) | | | | 680,643 | |
| | Principal | | Value | |
REPURCHASE AGREEMENTS (5.5%) | | | | | |
Repurchase Agreement (5.5%) | | | | | |
State Street Repurchase Agreement £ | | $ | 40,060 | | $ | 40,060 | |
2.55%, dated 12/31/2007 to be repurchased at $40,066 on 01/02/2008 ± | | | | | |
Total Repurchase Agreements (cost $40,060) | | | | 40,060 | |
| | | | | |
Total Securities Lending Collateral (cost $34,000) (1) | | | | 34,000 | |
| | | | | |
Total Investment Securities (cost $628,838) # | | | | $ | 754,703 | |
| | | | | | | |
NOTES TO SCHEDULE OF INVESTMENTS:
^ | | At December 31, 2007, all or a portion of this security is on loan (see Note 1). The value at December 31, 2007, of all securities on loan is $33,180. |
‡ | | Non-Income Producing. |
£ | | State Street serves as the accounting, custody and lending agent for the Fund and provides various administrative services on behalf of the Funds. |
± | | At December 31, 2007, repurchase agreements excluding collateral for securities on loan are collateralized by U.S. Government Agency Obligations with interest rates and maturity dates ranging from 4.23% - 6.25% and 03/01/2035 — 04/01/2035, respectively, and with a market value plus accrued interest of $40,867. |
1 | | Cash collateral for the Repurchase Agreements, valued at $12,325, that serves as collateral for securities lending, is invested in corporate bonds with interest rates and maturity dates ranging from 3.00% - 10.18% and 04/28/2008 - 12/01/2096, respectively. |
# | | Aggregate cost for federal income tax purposes is $628,992. Aggregate gross unrealized appreciation for all securities in which there is an excess of value over tax cost and aggregate gross unrealized depreciation for all securities in which there is an excess of tax cost over value were $134,933 and $9,222, respectively. Net unrealized appreciation for tax purposes is $125,711. |
The notes to the financial statements are an integral part of this report.
4
Marsico Growth
STATEMENT OF ASSETS AND LIABILITIES
At December 31, 2007
(all amounts except per share amounts in thousands)
Assets: | | | |
Investment securities, at value (cost: $628,838) | | $ | 754,703 | |
(including securities loaned of $33,180) | | | |
Cash | | 58 | |
Receivables: | | | |
Investment securities sold | | 7,279 | |
Shares sold | | 191 | |
Interest | | 8 | |
Income from loaned securities | | 9 | |
Dividends | | 328 | |
Dividend reclaims | | 50 | |
| | 762,626 | |
Liabilities: | | | |
Investment securities purchased | | 3,438 | |
Accounts payable and accrued liabilities: | | | |
Shares redeemed | | 228 | |
Management and advisory fees | | 463 | |
Distribution and service fees | | 4 | |
Administration fees | | 12 | |
Payable for collateral for securities on loan | | 34,000 | |
Other | | 64 | |
| | 38,209 | |
Net Assets | | $ | 724,417 | |
| | | |
Net Assets Consist of: | | | |
Capital Stock ($.01 par value) | | $ | 559 | |
Additional paid-in capital | | 576,447 | |
Undistributed (accumulated) net investment income | | 3,367 | |
Undistributed (accumulated) net realized gain from investment securities and foreign currency transactions | | 18,179 | |
Net unrealized appreciation on investment securities | | 125,865 | |
Net Assets | | $ | 724,417 | |
Net Assets by Class: | | | |
Initial Class | | $ | 707,025 | |
Service Class | | 17,392 | |
Shares Outstanding: | | | |
Initial Class | | 54,534 | |
Service Class | | 1,354 | |
Net Asset Value and Offering Price Per Share: | | | |
Initial Class | | $ | 12.96 | |
Service Class | | 12.85 | |
STATEMENT OF OPERATIONS
For the year ended December 31, 2007
(all amounts in thousands)
Investment Income: | | | |
Dividends (net of withholding taxes on foreign dividends of $150) | | $ | 6,953 | |
Interest | | 1,024 | |
Income from loaned securities-net | | 97 | |
| | 8,074 | |
Expenses: | | | |
Management and advisory fees | | 4,515 | |
Printing and shareholder reports | | 22 | |
Custody fees | | 99 | |
Administration fees | | 119 | |
Legal fees | | 12 | |
Audit fees | | 20 | |
Trustees fees | | 18 | |
Distribution and service fees: | | | |
Service Class | | 36 | |
Other | | 5 | |
Total expenses | | 4,846 | |
| | | |
Net Investment Income | | 3,228 | |
| | | |
Net Realized Gain (Loss) from: | | | |
Investment securities | | 18,924 | |
Foreign currency transactions | | (5 | ) |
| | 18,919 | |
| | | |
Net Increase (Decrease) in Unrealized Appreciation (Depreciation) on: | | | |
Investment securities | | 80,184 | |
| | | |
Net Realized and Unrealized Gain on Investment Securities: | | 99,103 | |
Net Increase In Net Assets Resulting from Operations | | $ | 102,331 | |
The notes to the financial statements are an integral part of this report.
5
Marsico Growth
STATEMENT OF CHANGES IN NET ASSETS
For the years ended
(all amounts in thousands)
| | December 31,
2007 | | December 31,
2006 | |
Increase (Decrease) in Net Assets From: | | | | | |
Operations: | | | | | |
Net investment income | | $ | 3,228 | | $ | 307 | |
Net realized gain from investment securities and foreign currency transactions | | 18,919 | | 12,314 | |
Change in unrealized appreciation (depreciation) on investment securities and foreign currency translation | | 80,184 | | (2,042 | ) |
Net increase (decrease) in net assets resulting from operations | | 102,331 | | 10,579 | |
Distributions to Shareholders: | | | | | |
From net investment income: | | | | | |
Initial Class | | (162 | ) | (235 | ) |
| | (162 | ) | (235 | ) |
From net realized gains: | | | | | |
Initial Class | | (6,211 | ) | — | |
Service Class | | (143 | ) | — | |
| | (6,354 | ) | — | |
Capital Share Transactions: | | | | | |
Proceeds from shares sold: | | | | | |
Initial Class | | 446,126 | | 43,655 | |
Service Class | | 5,826 | | 3,333 | |
| | 451,952 | | 46,988 | |
Dividends and distributions reinvested: | | | | | |
Initial Class | | 6,373 | | 235 | |
Service Class | | 143 | | — | |
| | 6,516 | | 235 | |
Cost of shares redeemed: | | | | | |
Initial Class | | (50,232 | ) | (37,006 | ) |
Service Class | | (3,840 | ) | (3,347 | ) |
| | (54,072 | ) | (40,353 | ) |
| | 404,396 | | 6,870 | |
Net increase (decrease) in net assets | | 500,211 | | 17,214 | |
| | | | | |
Net Assets: | | | | | |
Beginning of year | | 224,206 | | 206,992 | |
End of year | | $ | 724,417 | | $ | 224,206 | |
Undistributed (Accumulated) Net Investment Income (Loss) | | $ | 3,367 | | $ | 306 | |
Share Activity: | | | | | |
Shares issued: | | | | | |
Initial Class | | 38,823 | | 4,134 | |
Service Class | | 485 | | 325 | |
| | 39,308 | | 4,459 | |
Shares issued-reinvested from distributions: | | | | | |
Initial Class | | 552 | | 24 | |
Service Class | | 12 | | — | |
| | 564 | | 24 | |
Shares redeemed: | | | | | |
Initial Class | | (4,269 | ) | (3,565 | ) |
Service Class | | (330 | ) | (327 | ) |
| | (4,599 | ) | (3,892 | ) |
Net increase (decrease) in shares outstanding: | | | | | |
Initial Class | | 35,106 | | 593 | |
Service Class | | 167 | | (2 | ) |
| | 35,273 | | 591 | |
The notes to the financial statements are an integral part of this report.
6
For a share outstanding throughout each period(a)
| | Initial Class | |
| | Year Ended December 31, | |
| | 2007 | | 2006 | | 2005 | | 2004 | | 2003 | |
Net Asset Value | | | | | | | | | | | |
Beginning of period | | $ | 10.88 | | $ | 10.34 | | $ | 9.53 | | $ | 8.49 | | $ | 6.72 | |
Investment Operations | | | | | | | | | | | |
Net investment income (loss) | | 0.07 | | 0.02 | | 0.01 | | 0.01 | | (0.01 | ) |
Net realized and unrealized gain (loss) | | 2.13 | | 0.53 | | 0.81 | | 1.03 | | 1.78 | |
Total operations | | 2.20 | | 0.55 | | 0.82 | | 1.04 | | 1.77 | |
Distributions | | | | | | | | | | | |
From net investment income | | — | (b) | (0.01 | ) | (0.01 | ) | — | | — | |
From net realized gains | | (0.12 | ) | — | | — | | — | | — | |
Total distributions | | (0.12 | ) | (0.01 | ) | (0.01 | ) | — | | — | |
Net Asset Value | | | | | | | | | | | |
End of period(c) | | $ | 12.96 | | $ | 10.88 | | $ | 10.34 | | $ | 9.53 | | $ | 8.49 | |
Total Return(d),(e) | | 20 .40 | % | 5.36 | % | 8.58 | % | 12.25 | % | 26 .34 | % |
Net Assets End of Period (000’s) | | $ | 707,025 | | $ | 211,386 | | $ | 194,775 | | $ | 143,150 | | $ | 135,376 | |
Ratio and Supplemental Data | | | | | | | | | | | |
Expenses to average net assets(f) | | 0.81 | % | 0.87 | % | 0.88 | % | 0.87 | % | 0 .98 | % |
Net investment income (loss), to average net
assets(f) | | 0.55 | % | 0.17 | % | 0.15 | % | 0.15 | % | (0 .19 | )% |
Portfolio turnover rate(e) | | 56 | % | 67 | % | 66 | % | 80 | % | 111 | % |
For a share outstanding throughout each period(a)
| | Service Class | |
| | Year Ended December 31, | | May 1 to Dec | |
| | 2007 | | 2006 | | 2005 | | 2004 | | 31, 2003 | |
Net Asset Value | | | | | | | | | | | |
Beginning of period | | $ | 10.81 | | $ | 10.28 | | $ | 9.50 | | $ | 8.48 | | $ | 7.06 | |
Investment Operations | | | | | | | | | | | |
Net investment income (loss) | | 0.04 | | (0.01 | ) | (0.01 | ) | (0.01 | ) | (0.03 | ) |
Net realized and unrealized gain (loss) | | 2.12 | | 0.54 | | 0.79 | | 1.03 | | 1.45 | |
Total operations | | 2.16 | | 0.53 | | 0.78 | | 1.02 | | 1.42 | |
Distributions | | | | | | | | | | | |
From net investment income | | — | | — | | — | | — | | — | |
From net realized gains | | (0.12 | ) | — | | — | | — | | — | |
Total distributions | | (0.12 | ) | — | | — | | — | | — | |
Net Asset Value | | | | | | | | | | | |
End of period(c) | | $ | 12.85 | | $ | 10.81 | | $ | 10.28 | | $ | 9.50 | | $ | 8.48 | |
Total Return(d),(e) | | 20.13 | % | 5.16 | % | 8.21 | % | 12.03 | % | 20 .11 | % |
Net Assets End of Period (000’s) | | $ | 17,392 | | $ | 12,820 | | $ | 12,217 | | $ | 5,818 | | $ | 759 | |
Ratio and Supplemental Data | | | | | | | | | | | |
Expenses to average net assets(f) | | 1 .06 | % | 1 .12 | % | 1 .13 | % | 1 .10 | % | 1 .25 | % |
Net investment income (loss), to average net
assets(f) | | 0.30 | % | (0 .08 | )% | (0 .12 | )% | (0 .07 | )% | (0 .47 | )% |
Portfolio turnover rate(e) | | 56 | % | 67 | % | 66 | % | 80 | % | 111 | % |
(a) | | Per share information is calculated based on average number of shares outstanding. |
(b) | | Rounds to less than $(.01) per share. |
(c) | | Marsico Growth (the “Fund”) share class commenced operations as follows: |
| | Initial Class - May 3, 1999 |
| | Service Class - May 1, 2003 |
(d) | | Total Return reflects all portfolio expenses and includes reinvestment of dividends and capital gains; it does not reflect the charges and deductions under the policies or annuity contracts. |
(e) | | Not annualized. |
(f) | | Annualized. |
The notes to the financial statements are an integral part of this report.
7
Marsico Growth
NOTES TO FINANCIAL STATEMENTS
At December 31, 2007
(all amounts in thousands)
NOTE 1. ORGANIZATION AND SIGNIFICANT ACCOUNTING POLICIES
AEGON/Transamerica Series Trust (“ATST”) is an open-end management investment company registered under the Investment Company Act of 1940, as amended (the “1940 Act”). ATST serves as a funding vehicle for variable life insurance, variable annuity and group annuity products. Marsico Growth (the “Fund”) is part of ATST.
In the normal course of business, the Fund enters into contracts that contain a variety of representations that provide general indemnifications. The Fund’s maximum exposure under these arrangements is unknown, as this would involve future claims that may be made against the Fund and/or its affiliates that have not yet occurred. However, based on experience, the Fund expects the risk of loss to be remote.
This report should be read in conjunction with the current Fund prospectus, which contains more complete information about the Fund.
In preparing the Fund’s financial statements in accordance with accounting principles generally accepted in the United States of America (“GAAP”), estimates or assumptions (which could differ from actual results) may be used that affect reported amounts and disclosures. The following is a summary of significant accounting policies followed by the Fund.
Multiple class operations, income and expenses: The Fund currently offers two classes of shares, an Initial Class and a Service Class. Income, non-class specific expenses and realized and unrealized gains and losses, are allocated daily to each class, based upon the value of shares outstanding method as permitted under Rule 18f-3 of the 1940 Act. Each class bears its own specific expenses as well as a portion of general, common expenses.
Security valuations: The Fund values its investments at the close of the New York Stock Exchange (“NYSE”), normally 4 p.m. ET, each day the NYSE is open for business. Fund investments are valued at the last sale price or closing price on the day of valuation taken from the primary exchange where the security is principally traded.
Securities traded in the over-the-counter market and listed securities for which no sale was reported on that date are valued at the last quoted bid price.
Debt securities are valued based on a price quotation or other equivalent indication of value supplied by an exchange, a pricing service or a major market maker; however, those that mature in sixty days or less are valued at amortized cost, which approximates market.
Investment company securities are valued at the net asset value of the underlying portfolio.
Foreign securities generally are valued based on quotations from the primary market in which they are traded. Because many foreign securities markets and exchanges close prior to the close of the NYSE, closing prices for foreign securities in those markets or on those exchanges do not reflect the events that occur after that close. If a significant market event impacting the value of a portfolio security (e.g., natural disaster, company announcement, market volatility) occurs subsequent to the close of trading in the security, but prior to the calculation of the Fund’s net asset value per share, market quotations for that security may be determined to be unreliable and, accordingly, not “readily available.” As a result, foreign equity securities held by the Fund may be valued at fair market value as determined in good faith by the Fund’s Administrative Valuation Committee, using guidelines adopted by the Board of Trustees.
Other securities for which quotations are not readily available are valued at fair market value as determined in good faith by the Fund’s Administrative Valuation Committee, using guidelines adopted by the Board of Trustees.
Cash: The Fund may leave cash overnight in its cash account with the custodian, State Street Bank & Trust Company (“State Street”). On July 2, 2007, State Street acquired the parent company of Investors Bank & Trust Company. State Street has been contracted on behalf of the Fund to invest the excess cash into a savings account, which at December 31, 2007 was paying an interest rate of 2.60%.
Repurchase agreements: The Fund is authorized to enter into repurchase agreements. The Fund, through its custodian, State Street, receives delivery of the underlying securities, the value of which at the time of purchase is required to be an amount equal to at least 100% of the resale price. The Fund will bear the risk of value fluctuations until the security can be sold and may encounter delays and incur costs in liquidating the security. In the event of bankruptcy or insolvency of the seller, delays and costs may be incurred.
Commission recapture: The sub-adviser, to the extent consistent with the best execution and usual commission rate policies and practices, may place security transactions of the Fund with broker/dealers with which ATST has established a Commission Recapture Program. A Commission Recapture Program is any arrangement under which a broker/dealer applies a portion of the commissions received by such broker/dealer on the security transactions to the Fund. In no event will commissions paid by the Fund be used to pay expenses that would otherwise be borne by any other funds within ATST, or by any other party.
Recaptured commissions during the year ended December 31, 2007 of $52 are included in net realized gains in the Statement of Operations.
8
NOTES TO FINANCIAL STATEMENTS (continued)
At December 31, 2007
(all amounts in thousands)
NOTE 1.– (continued)
Securities lending: The Fund may lend securities to qualified borrowers, with State Street acting as the Fund’s lending agent. The Fund earns negotiated lenders’ fees. The Fund receives cash and/or securities as collateral against the loaned securities. Cash collateral received is invested in short-term, interest-bearing securities. The Fund monitors the market value of securities loaned on a daily basis and requires collateral in an amount at least equal to the value of the securities loaned. Income from loaned securities earned by State Street for its services, shown in the Statement of Operations is net of fees, in the amount of $41.
The Fund has invested the cash collateral received from securities loaned in the following short-term, interest-bearing securities:
Abbey National PLC, Eurodollar Term, 5.00%, 1/7/2008 | | $ | 1,468 | |
ABN AMRO Bank NV, Eurodollar Term, 5.18%, 1/4/2008 | | 1,174 | |
Bank of Nova Scotia, Eurodollar Term, 4.96%, 1/22/2008 | | 1,027 | |
Barclays, Eurodollar Term, 5.00%, 2/12/2008 | | 2,055 | |
BNP Paribas, Eurodollar Term, 5.01%, 1/11/2008 | | 1,908 | |
Calyon, Eurodollar Term, 5.12%, 3/3/2008 | | 440 | |
Credit Suisse First Boston Corp., Repurchase Agreement, 4.60%, 1/2/2008 | | 3,816 | |
Dexia Group, Eurodollar Term, 4.82%, 1/3/2008 | | 1,468 | |
HBOS Halifax Bank of Scotland, Eurodollar Term, 5.15%, 1/2/2008 | | 734 | |
JPMorgan Chase & Co., Eurodollar Term, 5.15%, 2/12/2008 | | 734 | |
Lloyds TSB Bank, Eurodollar Term, 5.15%, 1/24/2008 | | 1,468 | |
Merrill Lynch & Co. (RPG), Repurchase Agreement, 4.60%, 1/2/2008 | | 2,201 | |
Morgan Stanley & Co. (Corp. Repo), Repurchase Agreement, 4.60%, 1/2/2008 | | 6,017 | |
Rabobank Nederland, Eurodollar Term, 5.08%, 1/10/2008 | | 1,761 | |
Reserve Primary Money Market Fund 4.95% | | 1,565 | |
Royal Bank of Scotland, Eurodollar Term, 5.00%, 2/25/2008 | | 1,761 | |
Societe Generale, Eurodollar Term, 5.15%, 3/3/2008 | | 881 | |
Toronto Dominion Bank, Eurodollar Term, 5.05%, 1/10/2008 | | 1,761 | |
UBS AG, Eurodollar Term, 4.92%, 1/11/2008 | | 1,027 | |
Wells Fargo, Bank Note, 4.75%, 1/8/2008 | | 734 | |
| | $ | 34,000 | |
Security transactions and investment income: Security transactions are recorded on the trade date. Security gains and losses are calculated on the first-in, first-out basis. Dividend income, if any, is recorded on the ex-dividend date or, in the case of foreign securities, as soon as the Fund is informed of the ex-dividend date. Interest income, including accretion of discounts and amortization of premiums, is recorded on the accrual basis commencing on the settlement date.
Foreign currency denominated investments: The accounting records of the Fund are maintained in U.S. dollars. Securities and other assets and liabilities denominated in foreign currencies are translated into U.S. dollars at the closing exchange rate each day. The cost of foreign securities is translated at the exchange rate in effect when the investment was acquired. The Fund combines fluctuations from currency exchange rates and fluctuations in value when computing net realized and unrealized gains or losses from investments.
Net foreign currency gains and losses resulting from changes in exchange rates include: 1) foreign currency fluctuations between trade date and settlement date of investment security transactions; 2) gains and losses on forward foreign currency contracts; and 3) the difference between the receivable amounts of interest and dividends recorded in the accounting records in U.S. dollars and the amounts actually received.
Foreign currency denominated assets may involve risks not typically associated with domestic transactions. These risks include revaluation of currencies, adverse fluctuations in foreign currency values and possible adverse political, social and economic developments, including those particular to a specific industry, country or region.
Dividend distributions: Dividends and capital gains distributions are typically declared and reinvested annually and are generally paid and reinvested on the business day following the ex-date.
NOTE 2. RELATED PARTY TRANSACTIONS
ATST serves as a funding vehicle for certain affiliated asset allocation portfolios and certain affiliated separate accounts of Western Reserve Life Assurance Co. of Ohio, Transamerica Life Insurance Company, Transamerica Financial Life Insurance Company, Inc., Monumental Life Insurance Company and Transamerica Occidental Life Insurance Company.
Transamerica Fund Advisors, Inc. (“TFAI”) is the Fund’s investment adviser. Transamerica Fund Services, Inc. (“TFS”) is the Fund’s administrator and transfer agent. Prior to May 1, 2007, AFSG Securities Corp. (“AFSG”), was the Fund’s distributor. Transamerica Capital Inc. (“TCI”) is now the Fund’s distributor. TFAI, TFS, AFSG, and TCI are affiliates of AEGON NV, a Netherlands corporation.
Certain officers and trustees of the Fund are also officers and/or directors of TFAI, TFS and TCI.
Because the underlying funds have varied expense and fee levels and the Fund may own different proportions of underlying funds at different times, the amount of fees and expenses incurred indirectly by the Fund will vary.
The following schedule reflects the percentage of Fund assets owned by affiliated investment companies at December 31, 2007.
Investment advisory fee: The Fund pays management fees to TFAI based on average daily net assets (“ANA”) at the following breakpoints:
0.80% of the first $250 million of ANA
0.75% of the next $250 million of ANA
0.70% of the next $500 million of ANA
0.60% of ANA over $1 billion
TFAI has contractually agreed to waive its advisory fee and will reimburse the Fund to the extent that operating expenses, excluding 12b-1 fees, exceed the following stated annual limit:
1.00% Expense Limit
9
NOTES TO FINANCIAL STATEMENTS (continued)
At December 31, 2007
(all amounts in thousands)
If total Fund expenses fall below the annual expense limitation agreement agreed to by the adviser within the succeeding three years, the Fund may be required to pay the adviser a portion or all of the waived advisory fees.
There were no amounts recaptured during the year ended December 31, 2007 There are no amounts available for recapture at December 31, 2007.
The following schedule reflects the percentage of Fund assets owned by affiliated investment companies at December 31, 2007:
| | Net
Assets | | % of Net
Assets | |
Asset Allocation-Conservative Portfolio | | $ | 21,810 | | 3.01 | % |
Asset Allocation-Growth Portfolio | | 107,996 | | 14.91 | |
Asset Allocation-Moderate Growth Portfolio | | 326,656 | | 45.09 | |
Asset Allocation-Moderate Portfolio | | 131,453 | | 18.15 | |
Total | | $ | 587,915 | | 81.16 | % |
Distribution and service fees: ATST entered into a Distribution Agreement with ASFG dated January 1, 1997, as amended. On May 1, 2007, the Distribution Agreement was amended to replace AFSG with TCI as the Fund’s distributor. The Fund has also adopted a distribution plan (“Distribution Plan”) pursuant to Rule 12b-1 under the 1940 Act.
Under the Distribution Plan for the Initial Class shares, TCI, on behalf of the Fund, is authorized to pay various service providers, as direct payment for expenses incurred in connection with distribution of the Fund’s shares, amounts equal to actual expenses associated with distributing the shares.
The Distribution Plan for the Service Class shares requires ATST to pay distribution fees to TCI as compensation for its activities, not as reimbursement for specific expenses. The fee on the Service Class is paid to the insurance companies for providing services and account maintenance for their policyholders who invest in the variable insurance products which invest in the Service Class shares.
The Fund is authorized under the Distribution Plan to pay fees on each class up to the following limits:
Initial Class | | 0.15 | % |
Service Class | | 0.25 | % |
TCI has determined that it will not seek payment by the Fund of the distribution expenses incurred with respect to the Initial Class shares before April 30, 2009. Prior to TCI seeking reimbursement of future expenses, policy and contract owners will be notified in advance. The Fund will pay fees relating to Service Class shares.
Administrative services: The Fund has entered into an agreement with TFS for financial and legal fund administration services. The Fund pays TFS an annual fee of 0.02% of ANA. The Legal fees on the Statement of Operations are for fees paid to external legal counsel.
Deferred compensation plan: Each eligible independent Fund Trustee may elect participation in a non-qualified deferred compensation plan (“the Plan”). Under the Plan, such Trustees may defer payment of all or a portion of their total fees earned as a Fund Trustee. Each Trustee who is a participant in the Plan may elect that the earnings, losses or gains credited to his or her deferred fee amounts be determined based on a deemed investment in any series of Transamerica IDEX Mutual Funds. The right of a participant to receive a distribution from the Plan of the deferred fees is an unsecured claim against the general assets of all series of Transamerica IDEX Mutual Funds. The pro rata liability to the Fund of all deferred fees in the Plan amounted, as of December 31, 2007, to $35. Amounts deferred under the Plan are unfunded against the general assets of ATST.
Retirement plan: Under a retirement plan (the “Emeritus Plan”) available to the Independent Trustees, each Independent Trustee is deemed to have elected to serve as Trustee Emeritus of ATST upon his or her termination of service, other than removal for cause, is entitled to 50% of the trustee’s current retainer for a maximum period of five years determined by his or her years of service as a Trustee.
Such amounts shall be accrued by ATST on a pro rata basis allocable to each series of ATST fund based on the relative assets of the series. If retainers increase in the future, past accruals (and credits) will be adjusted upward so that 50% of the Trustee’s current retainer is accrued and credited at all times. Upon death, disability or termination of service, other than removal for cause, amounts deferred become payable to a Trustee Emeritus (or his/her beneficiary). Upon the commencement of service as Trustee Emeritus, compensation will be paid on a quarterly basis during the time period that the Trustee Emeritus is allowed to serve as such.
Amounts accrued under the Emeritus Plan are unsecured claims against the general assets of ATST. For the year ended December 31, 2007 the amount related to the Emeritus Plan was $8. As of December 31, 2007, the Fund has not made any payments related to the Emeritus Plan.
The Emeritus Plan was terminated effective October 30, 2007. Upon the termination, the Fund shall continue to pay any remaining benefits in accordance with the Plan, but no further compensation shall accrue under the Plan.
10
NOTES TO FINANCIAL STATEMENTS (continued)
At December 31, 2007
(all amounts in thousands)
NOTE 3. INVESTMENT TRANSACTIONS
The cost of securities purchased and proceeds from securities sold (excluding short-term securities) for the year ended December 31, 2007 were as follows:
Purchases of securities: | | | |
Long-term | | $ | 674,126 | |
U.S. Government | | — | |
Proceeds from maturities and sales of securities: | | | |
Long-term | | 315,939 | |
U.S. Government | | — | |
| | | | |
NOTE 4. FEDERAL INCOME TAX MATTERS
The Fund has not made any provision for federal income or excise taxes due to its policy to distribute all of its taxable income and capital gains to its shareholders and otherwise qualify as a regulated investment company under Subchapter M of the Internal Revenue Code. Income and capital gain distributions are determined in accordance with income tax regulations, which may differ from GAAP. These differences are primarily due to differing treatment for items including, but not limited to, wash sales, foreign currency transactions, and post- October loss deferrals.
Therefore, distributions determined in accordance with tax regulations may differ significantly in amount or character from net investment income and realized gains for financial reporting purposes. Financial reporting records are adjusted for permanent book/tax differences to reflect tax character. Financial records are not adjusted for temporary differences. These reclassifications are as follows:
Additional paid-in capital | | $ | — | |
Undistributed (accumulated) net investment income (loss) | | $ | (5 | ) |
Undistributed (accumulated) net realized gain (loss) from investment securities | | $ | 5 | |
The tax character of distributions paid may differ from the character of distributions shown in the Statements of Changes in Net Assets due to short-term gains being treated as ordinary income for tax purposes. The tax character of distributions paid during 2006 and 2007 was as follows:
2006 Distributions paid from: | | | |
Ordinary Income | | $ | 235 | |
Long-term Capital Gain | | — | |
2007 Distributions paid from: | | | |
Ordinary Income | | 162 | |
Long-term Capital Gain | | 6,353 | |
| | | | |
Tax basis components of distributable earnings as of December 31, 2007 are as follows:
Undistributed Ordinary Income | | $ | 5,351 | |
Undistributed Long-term Capital Gain | | $ | 17,682 | |
Capital Loss Carryforward | | $ | — | |
Post October Capital Loss Deferral | | $ | (1,330 | ) |
Post October Currency Loss Deferral | | $ | (3 | ) |
Net Unrealized Appreciation (Depreciation) | | $ | 125,711 | |
NOTE 5. REGULATORY PROCEEDINGS
There continues to be significant federal and state regulatory activity relating to financial services companies, particularly mutual fund companies and their investment advisers. As part of an ongoing investigation regarding potential market timing, recordkeeping and trading compliance issues and matters affecting the Fund’s investment adviser, TFAI, and certain affiliates and former employees of TFAI, the SEC staff has indicated that it is likely to take some action against TFAI and certain of its affiliates at the conclusion of the investigation. The potential timing and the scope of any such action is difficult to predict. Although the impact of any action brought against TFAI and/or its affiliates is difficult to assess at the present time, the Fund currently believes that the likelihood that any such action will have a material adverse impact is remote. It is important to note that the Fund is not aware of any allegation of wrongdoing against it and its Board at the time this annual report is printed. Although it is not anticipated that these developments will have an adverse impact on the Fund, there can be no assurance at this time. TFAI and its affiliates are actively working with the SEC in regard to this matter; however, the exact resolution cannot be determined at this time. TFAI will take such actions that it deems necessary or appropriate to continue providing management services to the Fund and to bring all matters to an appropriate conclusion. TFAI and/or its affiliates, and not the Fund, will bear the costs regarding these regulatory matters.
NOTE 6. RECENTLY ISSUED ACCOUNTING PRONOUNCEMENTS
In July 2006, the Financial Accounting Standards Board (“FASB”) released FASB Interpretation No. 48 “Accounting for Uncertainty in Income Taxes” (“FIN 48”), an interpretation of FASB Statement No. 109. FIN 48 provides guidance for how uncertain tax positions should be recognized, measured, presented and disclosed in the financial statements. FIN 48 requires the accounting and disclosure of tax positions taken or expected to be taken in the course of preparing the Fund’s tax returns to determine whether the tax positions are “more-likely- than-not” of being sustained by the applicable tax authority. Tax positions not deemed to meet the more-likely-than-not threshold would be recorded as a tax benefit or expense in the current year.
Adoption of FIN 48 is effective during the first required financial reporting period for fiscal years beginning after December 15, 2006. Management adopted FIN 48 on June 29, 2007.
Implementation of FIN 48 requires Management of the Fund to analyze all open tax years, as defined by the Statute of
11
NOTES TO FINANCIAL STATEMENTS (continued)
At December 31, 2007
(all amounts in thousands)
NOTE 6.– (continued)
Limitations, for all major jurisdictions, which includes federal and certain states. Open tax years are those that are open for exam by taxing authorities (i.e., the last 4 tax year ends and the interim tax period since then). The Fund has no examinations in progress and none are expected at this time.
Management of the Fund has reviewed all open tax years and major jurisdictions and concluded the adoption of FIN 48 resulted in no impact to the Fund’s net assets or results of operations. There is no tax liability resulting from unrecognized tax benefits relating to uncertain income tax positions taken or expected to be taken in future tax returns. The Fund is also not aware of any tax positions for which it is reasonably possible that the total amounts of unrecognized tax benefits will significantly change in the next 12 months.
In September 2006, FASB issued its new Standard No. 157, “Fair Value Measurements” (“FAS 157”). FAS 157 is designed to unify guidance for the measurement of fair value of all types of assets, including financial instruments, and certain liabilities, throughout a number of accounting standards. FAS 157 also establishes a hierarchy for measuring fair value in generally accepted accounting principles and expands financial statement disclosures about fair value measurements that are relevant to mutual funds. FAS 157 is effective for financial statements issued for fiscal years beginning after November 15, 2007, and earlier application is permitted.
As of December 31, 2007, Management does not expect the adoption of FAS 157 to impact the amounts reported in the financial statements, however, additional disclosures will be required about the inputs used to develop the measurements of fair value and the effect of certain of the measurements reported in the statement of operations for a fiscal period.
NOTE 7. SUBSEQUENT EVENT
Effective January 1, 2008, TFAI changed its name to Transamerica Asset Management, Inc.
Effective May 1, 2008, AEGON/Transamerica Series Trust will change its name to Transamerica Series Trust. At that time, the Fund will also change its name to Transamerica Marsico Growth VP.
12
Report of Independent Registered Certified Public Accounting Firm
To the Board of Trustees and Shareholders of
Marsico Growth:
In our opinion, the accompanying statement of assets and liabilities, including the schedule of investments, and the related statements of operations and of changes in net assets and the financial highlights present fairly, in all material respects, the financial position of Marsico Growth (the “Fund”) (one of the portfolios constituting AEGON/Transamerica Series Trust) at December 31, 2007, the results of its operations for the year then ended, the changes in its net assets for each of the two years in the period then ended and the financial highlights for each of the periods presented, in conformity with accounting principles generally accepted in the United States of America. These financial statements and financial highlights (hereafter referred to as “financial statements”) are the responsibility of the Fund’s management; our responsibility is to express an opinion on these financial statements based on our audits. We conducted our audits of these financial statements in accordance with the standards of the Public Company Accounting Oversight Board (United States). Those standards require that we plan and perform the audit to obtain reasonable assurance about whether the financial statements are free of material misstatement. An audit includes examining, on a test basis, evidence supporting the amounts and disclosures in the financial statements, assessing the accounting principles used and significant estimates made by management, and evaluating the overall financial statement presentation. We believe that our audits, which included confirmation of securities at December 31, 2007 by correspondence with the custodian and brokers, provide a reasonable basis for our opinion.

Tampa, Florida
February 29, 2008
13
Marsico Growth
SUPPLEMENTAL TAX INFORMATION (unaudited)
(all amounts in thousands)
For tax purposes, the Fund has made a Long-Term Capital Gain Designation of $6,353 for the year ended December 31, 2007.
RESULTS OF SHAREHOLDER PROXY (unaudited)
At a special meeting of shareholders held on October 30, 2007, the results of the Proposals were as follows:
Proposal 1: To elect a new Board:
Proposed
Trustee | | For | | Against | | Abstentions/Broker Non-
Votes | |
John K. Carter | | 2,274,998,840.817 | | 57,804,698.755 | | 35,433.883 | |
| | | | | | | |
Leo J. Hill | | 2,277,212,702.754 | | 55,590,836.819 | | 35,433.883 | |
| | | | | | | |
Neal M. Jewell | | 2,266,793,295.663 | | 66,010,243.909 | | 35,433.883 | |
| | | | | | | |
Russell A. Kimball, Jr. | | 2,274,825,235.835 | | 57,978,303.737 | | 35,433.883 | |
| | | | | | | |
Eugene M. Mannella | | 2,274,623,165.033 | | 58,180,374.539 | | 35,433.883 | |
| | | | | | | |
Norm R. Nielsen | | 2,275,050,055.885 | | 57,753,483.687 | | 35,433.883 | |
| | | | | | | |
Joyce Galpern Norden | | 2,270,278,122.250 | | 62,525,417.323 | | 35,433.883 | |
| | | | | | | |
Patricia L. Sawyer | | 2,275,737,737.456 | | 57,065,802.116 | | 35,433.883 | |
| | | | | | | |
John W. Waechter | | 2,276,615,120.140 | | 56,188,419.433 | | 35,433.883 | |
Proposal 2: To approve an amendment to the Agreement and Declaration of Trust:
| | | | Abstentions/Broker Non- | |
For | | Against | | Votes | |
2,182,022,669.110 | | 77,590,048.544 | | 73,226,255.801 | |
14
Marsico Growth
INVESTMENT ADVISORY, SUB-ADVISORY AND PORTFOLIO MANAGEMENT AGREEMENTS - CONTRACT RENEWAL
At a meeting of the Board of Trustees of AEGON/Transamerica Series Trust (“ATST”) held on December 4th, 2007, the Board reviewed and considered the renewal of the investment advisory agreement (the “Investment Advisory Agreement”) between Marsico Growth (the “Fund”) and Transamerica Fund Advisors, Inc. (“TFAI”), as well as the renewal of the investment sub-advisory agreement (the “Sub-Advisory Agreement”) of the Fund between TFAI and Columbia Management Advisors, LLC (the “Sub-Adviser”) and the portfolio management agreement (the “Portfolio Management Agreement”) between the Sub-Adviser and Marsico Capital Management (“MCM”), to determine whether the agreements should be renewed for a six-month period. The Board noted that the Sub-Adviser has entered into an agreement with MCM to provide portfolio management services for the Fund, and that the Board had considered that agreement at a Board meeting held in October, 2007. It also was noted that this review was interim in nature in order to get all the Funds on the same review calendar, and that the Funds’ advisory arrangements would be reviewed again in the first half of 2008.
Following their review and consideration, the Trustees determined that the renewal of the Investment Advisory Agreement, the Sub- Advisory Agreement and the Portfolio Management Agreement would enable shareholders of the Fund to obtain high quality services at a cost that is appropriate, fair, and in the best interests of its shareholders. The Board, including the independent members of the Board, unanimously approved the renewal of the Investment Advisory Agreement, Sub-Advisory Agreement and Portfolio Management Agreement. In reaching their decision, the Trustees requested and obtained from TFAI, the Sub-Adviser and MCM such information as they deemed reasonably necessary to evaluate the agreements, including information about fees and performance of comparable funds managed by the Sub-Adviser. The Trustees also carefully considered information they had previously received from TFAI, the Sub-Adviser and MCM as part of their regular oversight of the Fund, as well as comparative fee, expense, and performance information prepared by Lipper Inc. (“Lipper”), an independent provider of mutual fund performance, fee and expense information and profitability data prepared by management. In considering the proposed continuation of the Investment Advisory, Sub-Advisory and Portfolio Management Agreements, the Trustees evaluated a number of considerations that they believed, in light of the legal advice furnished to them by independent legal counsel and their own business judgment, to be relevant. They based their decisions on the following considerations, among others, although they did not identify any consideration or particular information that was controlling of their decisions:
The nature, extent and quality of the advisory services to be provided. The Board considered the nature and quality of the services provided by TFAI and MCM to the Fund in the past, as well as the services anticipated to be provided in the future. The Board concluded that TFAI and MCM are capable of providing high quality services to the Fund, as indicated by the nature and quality of services provided in the past by TFAI and MCM for this series and the experience, capability and integrity of TFAI’s senior management, the financial resources of TFAI and MCM, TFAI’s management oversight process and the professional qualifications of the portfolio management team of MCM. The Trustees determined that TFAI and MCM can provide investment and related services that are appropriate in scope and extent in light of the Fund’s operations, the competitive landscape of the investment company business and investor needs.
The investment performance of the Fund. The Board examined the short and longer-term performance of the Fund, including relative performance against a peer universe of comparable mutual funds as prepared by Lipper for various trailing periods ended June 30, 2007. The Board favorably noted the longer-term performance of the Fund. On the basis of the Board’s assessment of the nature, extent and quality of advisory services to be provided or procured by TFAI and MCM, the Board concluded that TFAI and MCM are capable of generating a level of investment performance that is appropriate in light of the Fund’s proposed investment objectives, policies and strategies and competitive with other investment companies.
The cost of advisory services provided and the level of profitability. The Board reviewed profitability information of TFAI’s cost of procuring fund management services, as well as the costs of provision of administration, fund accounting and other services, to the Fund and to ATST as a whole by TFAI and its affiliates. The Board reviewed the management and sub-advisory fees for the Fund. The Board noted that contractual fees were close to the median of the Lipper universe. Based on their review, the Trustees determined that the management fees of the Fund generally are appropriate in light of the services expected to be provided or procured, the management fees and the anticipated profitability of the relationship between the Fund, TFAI and its affiliates, and MCM. In making these observations and determinations, the Board reviewed comparative information provided by Lipper.
Whether fee levels reflect economies of scale and the extent to which economies of scale would be realized as the Fund grows. In evaluating the extent to which the management fees payable under the Investment Advisory and Sub-Advisory Agreements reflect economies of scale or will permit economies of scale to be realized in the future, the Board noted that TFAI and MCM offer breakpoints which appropriately benefit investors by passing on economies of scale in the form of lower management fees as the level of assets grows. The Trustees also concluded that they will have the opportunity to periodically reexamine whether the Fund has achieved economies of scale, and the appropriateness of management fees payable to TFAI and fees paid to MCM, in the future.
Benefits (such as soft dollars) to TFAI and others from their relationship with the Fund. The Board concluded that other benefits anticipated to be derived by TFAI, its affiliates, and MCM from their relationships with the Fund are expected to be reasonable and fair, and consistent with industry practice and the best interests of the Fund and its shareholders. The Trustees noted that TFAI would not realize soft dollar benefits from its relationship with the Fund, and that MCM’s soft dollar trading is consistent with applicable law, including best execution requirements in particular. The Board also noted that MCM is participating in a brokerage program pursuant to which a portion of brokerage commissions paid by the Fund is recaptured for the benefit of the Fund and its shareholders, thus limiting the amount of soft dollar arrangements MCM may engage in with respect to the Fund’s brokerage transactions.
15
Other considerations. The Board determined that TFAI has made a substantial commitment to the recruitment and retention of high quality personnel, and maintains the financial, compliance and operational resources reasonably necessary to manage the Fund in a professional manner that is consistent with the best interests of the Fund and its shareholders. In this regard, the Trustees favorably considered the procedures and policies in place by TFAI to enforce compliance with applicable laws and regulations and oversee the portfolio management activities of MCM. The Trustees also determined that TFAI has made a significant entrepreneurial commitment to the management and success of the Fund, reflected by TFAI’s expense limitation and fee waiver arrangements with the Fund which may result in TFAI waiving a substantial amount of management fees for the benefit of shareholders.
The Board also noted that in October, the Board had considered a new portfolio management agreement with MCM because of a corporate transaction that would transition the ownership of MCM back to the founding partners of MCM; that the transaction was expected to close in December; and that in approving that agreement, the Board had relied on assurances from MCM that the transaction would not affect the management or strategies of the Fund, and that the portfolio management team was not expected to change after giving effect to the transaction, that the same quality and quantity of services would be provided to the Fund after giving effect to the transaction, and that the fees to be charged would remain unchanged (those fees being paid by the Sub-Adviser).
16
MFS HIGH YIELD
MARKET ENVIRONMENT
As 2007 drew to a close, global financial markets were enmeshed in another period of volatility driven by the ongoing credit crisis and the uncertainty about the effect that the slowing of the U.S. economy could have on the global economies.
The crisis in the U.S. sub-prime market was in full force by year-end. The crisis erupted in the third quarter as rising interest rates spurred defaults on U.S. sub-prime loans. Fears of more bad loans, combined with the slowing in the U.S. housing market, sparked a global liquidity crunch. In response, central banks around the world injected billions of dollars to keep financial systems liquid and help ease investor worries.
Investor fears were heightened in November as the severity of the credit crisis became more apparent as did the toll it had wrought on banks’ balance sheets. Globally, banks were hit by losses from mortgage bets gone bad, and some of the world’s largest banks, such as Citigroup Inc. and UBS AG, agreed to capital infusions from sovereign wealth funds in the Middle East.
In mid-December several of the world’s central banks announced a joint plan to ease the liquidity squeeze in global markets by broadening the range of collateral against which banks can borrow. As part of the plan, the U.S. Federal Reserve Board introduced a monetary tool, the “term-auction facility,” and temporary swap lines with the European Central Bank and the Swiss National Bank.
Investor fears and the ensuing volatility have also been driven by the possibility of an impending recession in the United States and the effect such a drastic slowdown could have on the rest of the world. Exporting countries became especially concerned that a decline in U.S. consumer demand will cut into their own growth. Recession concerns have been exacerbated by the high cost of oil, bad mortgage bets, and a glut of empty homes. Retail sales have stalled, corporate earnings likely have peaked, and consumer confidence is falling.
In line with slowing in the United States, we have begun to see signs that other developed markets have entered a slowing phase as the financial crisis spread to real economies. Housing demand is falling in the United Kingdom (“UK”), retail sales have slowed in the eurozone, and, globally, industrial production has retreated.
At the same time some measures of consumer inflation are being nudged upward in line with higher oil and food prices. These higher prices have created a conflict for central bankers, who also are confronting the pressures of slowing growth and financial market turmoil. Overall, expectations have risen that global monetary policies will remain on hold or loosen until the credit crunch passes. Meanwhile, central banks have assured markets that they are ready to inject liquidity should the banking system need it.
Global stock markets still closed the year higher. At this time, we do not believe that the conditions are in place yet for a worldwide recession. In fact, the global economies continue to expand.
PERFORMANCE
For the year ended December 31, 2007, MFS High Yield, Initial Class returned 1.85%. By comparison its benchmark, the Lehman Brothers High Yield Bond Index (“LBHYB”), returned 1.87%.
STRATEGY REVIEW
For the reporting period, the debt of Finance Marketing Group (“FMG”), Freeport-McMoRan Copper & Gold Inc., The Williams Companies, Inc., Crystal U.S. Holdings Corp., Paxson Communications, The Mosaic Company, and MGM MIRAGE were among the portfolio’s top contributors. Additionally, our lesser exposure to corporate and industrial issues and positioning in “BB” rated securities helped relative performance.
Over the reporting period, yield was a negative factor in performance relative to the benchmark. Our relative exposure to “B” rated bonds also hurt.
Debt holdings that detracted from results included the bonds of Arcap REIT, Inc., Harrah’s Entertainment, Inc., Tropicana Entertainment LLC, General Motors Acceptance Corporation (“GMAC”), Realogy Corporation, and Ford Motor Credit Company.
John F. Addeo |
|
David P. Cole, CFA |
|
Co-Portfolio Managers |
MFS Investment Management |
AEGON//Transamerica Series Trust | | | | Annual Report 2007 |
1
MFS High Yield
(unaudited)
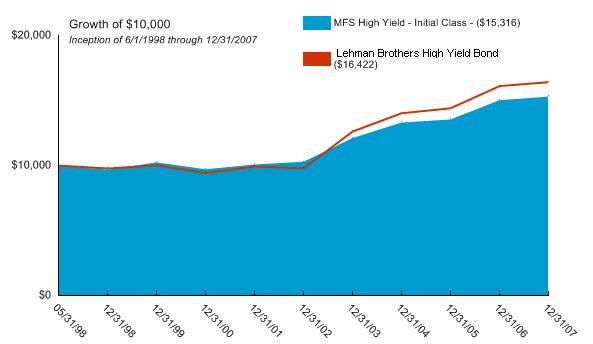
Average Annual Total Return for Periods Ended 12/31/2007
| | | | | | From | | Inception | |
| | 1 Year | | 5 Years | | Inception | | Date | |
| | | | | | | | | |
Initial Class | | 1.85 | % | 8.26 | % | 4.55 | % | 6/1/98 | |
Lehman Brothers High Yield(1) | | 1.87 | % | 10.90 | % | 5.31 | % | 6/1/98 | |
| | | | | | | | | |
Service Class | | 1.73 | % | — | % | 7.01 | % | 5/1/03 | |
NOTES
(1) The Lehman Brothers High Yield Bond (LBHYB) Index is an unmanaged index used as a general measure of market performance. Calculations assume dividends and capital gains are reinvested and do not include any managerial expenses. From inception, calculation is based on life of Initial Class shares.
The performance data presented represents past performance; future results may vary. The portfolio’s investment return and net asset value will fluctuate. Past performance does not guarantee future results. Investor’s units when redeemed may be worth more or less than their original cost.
Current performance may be lower or higher than performance quoted. Please visit your insurance company’s website for contract or policy level standardized total returns current to the most recent month end. Portfolio performance is net of investment fees and fund expenses, but not product charges, which, if included, would significantly lower the performance quoted.
This material must be preceded or accompanied by a current prospectus, which includes specific contents regarding the investment objectives, explanation of share classes and policies of this portfolio.
2
MFS High Yield
UNDERSTANDING YOUR FUND’S EXPENSES
(unaudited)
SHAREHOLDER EXPENSES
Fund shareholders may incur ongoing costs, including management and advisory fees, distribution and service fees, and other fund expenses.
The following Example is intended to help you understand your ongoing costs (in dollars and cents) of investing in the Fund and to compare these costs with the ongoing costs of investing in other funds.
The Example is based on an investment of $1,000 invested at July 1, 2007 and held for the entire period until December 31, 2007.
ACTUAL EXPENSES
The first line in the table below provides information about actual account values and actual expenses. You may use the information in this line, together with the amount you invested, to estimate the expenses that you paid over the period. Simply divide your account value by $1,000 (for example, an $8,600 account value divided by $1,000 = 8.6), then multiply the result by the number in the first line of your Fund under the heading entitled “Expenses Paid During Period” to estimate the expenses you paid on your account during this period. If your account is an IRA, your expenses could have included a $15 annual fee. The amount of any fee paid through your account would increase the estimate of expenses you paid during the period and decrease your ending account value.
HYPOTHETICAL EXAMPLE FOR COMPARISON PURPOSES
The second line in the table below provides information about hypothetical account values and hypothetical expenses based on the Fund’s actual expense ratio and an assumed rate of return of 5% per year before expenses, which is not the Fund’s actual return. The hypothetical account values and expenses may not be used to estimate the actual ending account balance or expenses you paid for the period. You may use this information to compare the ongoing costs of investing in your Fund and other funds. To do so, compare this 5% hypothetical example with the 5% hypothetical examples that appear in the shareholder reports of the other funds.
Please note that the expenses shown in the table are meant to highlight your ongoing costs only and do not reflect any transactional costs, such as sales charges, redemption fees, brokerage commissions paid on purchases and sales of fund shares. Therefore, the second line under the Fund in the table is useful in comparing ongoing costs only, and will not help you determine the relative total costs of owning different funds. If any of these transaction costs were included, your costs would be higher. The expenses shown in the table do not reflect any fees that may be charged to you by brokers, financial intermediaries or other financial institutions.
| | Beginning | | Ending | | Annualized | | Expenses | |
| | Account | | Account | | Expense | | Paid During | |
| | Value | | Value | | Ratio | | Period (a) | |
Initial Class | | | | | | | | | |
Actual | | $ | 1,000.00 | | $ | 988.30 | | 0.82 | % | $ | 4.11 | |
Hypothetical (b) | | 1,000.00 | | 1,021.07 | | 0.82 | | 4.18 | |
| | | | | | | | | |
Service Class | | | | | | | | | |
Actual | | 1,000.00 | | 988.33 | | 1.07 | | 5.36 | |
Hypothetical (b) | | 1,000.00 | | 1,019.81 | | 1.07 | | 5.45 | |
| | | | | | | | | | | | |
(a) | Expenses are calculated using the Fund’s annualized expense ratio (as disclosed in the table), multiplied by the average account value for the period, multiplied by the number of days in the period (184 days), and divided by the number of days in the year (365 days). | |
| | |
(b) | 5% return per year before expenses. | |
GRAPHICAL PRESENTATION OF SCHEDULE OF INVESTMENTS
By Bond Credit Quality (Moody Ratings)
At December 31, 2007
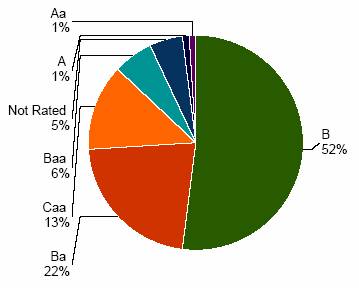
This chart shows the percentage breakdown by bond credit quality (Moody ratings) of the Fund’s total investment securities.
3
MFS High Yield
SCHEDULE OF INVESTMENTS
At December 31, 2007
(all amounts except share amounts in thousands)
| | Principal | | Value | |
SOVEREIGN GOVERNMENT OBLIGATIONS (4.5%) | | | | | |
Sovereign Government Obligations (4.5%) | | | | | |
Argentina Bonos | | | | | |
5.39%, due 08/03/2012 * | | $ | 876 | | $ | 792 | |
7.00%, due 09/12/2013 | | 900 | | 792 | |
Argentina Government International | | | | | |
8.28%, due 12/31/2033 | | 423 | | 406 | |
Argentine Republic | | | | | |
0.62%, due 12/15/2035 * | | 1,924 | | 221 | |
Gabonese Republic -144A | | | | | |
8.20%, due 12/12/2017 § | | 609 | | 630 | |
Mexico Government International Bond | | | | | |
6.75%, due 09/27/2034 | | 398 | | 440 | |
Republic of Brazil | | | | | |
6.00%, due 01/17/2017 | | 125 | | 127 | |
8.00%, due 01/15/2018 | | 451 | | 505 | |
8.88%, due 10/14/2019 | | 187 | | 231 | |
Republic of Colombia | | | | | |
6.68%, due 11/16/2015 * | | 410 | | 425 | |
Republic of Ecuador , Reg S | | | | | |
10 due 08/15/2030 1 | | 197 | | 191 | |
Republic of El Salvador , Reg S | | | | | |
8.25%, due 04/10/2032 | | 950 | | 1,159 | |
Republic of Ghana -144A | | | | | |
8.50%, due 10/04/2017 | | 100 | | 105 | |
Republic of Indonesia , Reg S | | | | | |
8.50%, due 10/12/2035 | | 826 | | 965 | |
Republic of Panama | | | | | |
6.70%, due 01/26/2036 | | 652 | | 688 | |
Republic of the Philippines | | | | | |
9.38%, due 01/18/2017 | | 810 | | 1,002 | |
9.50%, due 02/02/2030 | | 211 | | 284 | |
Republic of Turkey | | | | | |
6.88%, due 03/17/2036 | | 1,200 | | 1,179 | |
11.50%, due 01/23/2012 | | 571 | | 691 | |
Republic of Uruguay | | | | | |
9.25%, due 05/17/2017 | | 1,168 | | 1,408 | |
Republic of Uruguay | | | | | |
8.00%, due 11/18/2022 | | 500 | | 560 | |
Republic of Venezuela , Reg S | | | | | |
7.00%, due 12/01/2018 | | 392 | | 335 | |
Russian Federation , Reg S | | | | | |
12.75%, due 06/24/2028 | | 190 | | 345 | |
Turkey Government International Bond | | | | | |
6.75%, due 04/03/2018 | | 509 | | 522 | |
Ukraine Government International Bond-1 44A | | 110 | | 108 | |
6.75%, due 11/14/2017 § | | | | | |
Total Sovereign Government Obligations (cost $13,620) | | | | 14,111 | |
| | | | | |
MORTGAGE-BACKED SECURITIES (1.2%) | | | | | |
Arcap REIT, Inc. | | | | | |
Series 2004-RR3, Class H-144A | | | | | | | |
6.10%, due 09/21/2045 | | $ | 1,515 | | $ | 606 | |
First Union National Bank Commercial Mortgage | | | | | |
Series 2000-C2, Class H | | | | | |
6.75%, due 10/15/2032 | | 1,305 | | 1,309 | |
JPMorgan Chase Commercial Mortgage Securities Corp. | | | | | |
Series 2007-LD12, Class C | | | | | |
6.26%, due 02/15/2051 | | 720 | | 668 | |
Merrill Lynch Mortgage Trust | | | | | |
Series 2007-C1, Class B | | | | | |
6.02%, due 06/12/2050 | | 720 | | 659 | |
Morgan Stanley Capital I | | | | | |
Series 2004-RR, Class FX-1 44A | | | | | |
1.42%, due 04/28/2039 | | 10,481 | | 391 | |
| | | | | |
Total Mortgage-Backed Securities (cost $4,643) | | | | 3,633 | |
| | | | | |
ASSET-BACKED SECURITIES (1.5%) | | | | | |
Airlie LCDO AVIV LCDO 2006-3, Ltd. | | | | | |
Series 2006-AV3A, Class D-144A | | | | | |
7.11%, due 12/22/2011 * § | | 832 | | 734 | |
Babson CLO, Ltd. 2003-I | | | | | |
Series 2006-1A, Class D-144A | | | | | |
6.74%, due 07/15/2018 * | | 785 | | 636 | |
Crest, Ltd. | | | | | |
Series 2004-1A, Class G2 | | | | | |
7.00%, due 01/28/2040 | | 1,422 | | 1,135 | |
CW Capital Cobalt, Ltd. | | | | | |
Series 2005-1A, Class F2-144A | | | | | |
6.23%, due 05/25/2045 | | 1,112 | | 785 | |
CW Capital Cobalt, Ltd. | | | | | |
Series 2006-2A, Class F-1 44A | | | | | |
6.37%, due 01/25/2036 * § | | 500 | | 348 | |
CW Capital Cobalt, Ltd. | | | | | |
Series 2006-2A, Class G-1 44A | | | | | |
6.57%, due 04/26/2050 * § | | 500 | | 333 | |
Falcon Franchise Loan LLC | | | | | |
Series 2003-1, Class IO-144A | | | | | |
3.93%, due 01/05/2025 (a) | | 3,265 | | 469 | |
Wachovia CRE CDO | | | | | |
Series 2006-1A, Class G-144A | | | | | |
6.55%, due 09/25/2026 * § | | 432 | | 349 | |
| | | | | |
Total Asset-Backed Securities (cost $5,982) | | | | 4,789 | |
| | | | | |
CORPORATE DEBT SECURITIES (77.9%) | | | | | |
Aerospace & Defense (1.8%) | | | | | |
Bombardier, Inc. -144A | | | | | |
8.00%, due 11/15/2014 | | 1,761 | | 1,840 | |
The notes to the financial statements are an integral part of this report.
4
| | Principal | | Value | |
Aerospace & Defense (continued) | | | | | |
L-3 Communications Corp. | | | | | |
5.88%, due 01/15/2015 | | $ | 1,650 | | $ | 1,592 | |
6.13%, due 01/15/2014 | | 95 | | 93 | |
Transdigm, Inc. | | | | | |
7.75%, due 07/15/2014 | | 655 | | 665 | |
Vought Aircraft Industries, Inc. | | | | | |
8.00%, due 07/15/2011 | | 1,620 | | 1,535 | |
Air Freight & Logistics (0.2%) | | | | | |
Tgi International, Ltd. -144A | | | | | |
9.50%, due 10/03/2017 § | | 481 | | 503 | |
Airlines (0.9%) | | | | | |
Continental Airlines, Inc. | | | | | |
6.75%, due 03/15/2017 | | 376 | | 359 | |
6.80%, due 08/02/2018 | | 803 | | 763 | |
6.90%, due 01/02/2017 | | 501 | | 481 | |
7.57%, due 03/15/2020 | | 1,186 | | 1,150 | |
Auto Components (0.2%) | | | | | |
TRW Automotive, Inc. -144A | | | | | |
7.00%, due 03/15/2014 | | 685 | | 630 | |
Automobiles (0.7%) | | | | | |
General Motors Corp. | | | | | |
8.38%, due 07/15/2033 ^ | | 2,612 | | 2,103 | |
Beverages (0.1%) | | | | | |
Cerveceria National Domi- Regs , Reg S | | | | | |
8.00%, due 03/27/2014 | | 324 | | 329 | |
Building Products (0.7%) | | | | | |
Nortek, Inc. | | | | | |
8.50%, due 09/01/2014 | | 1,260 | | 1,008 | |
Ply Gem Industries, Inc. | | | | | |
9.00%, due 02/15/2012 ^ | | 1,490 | | 1,155 | |
Capital Markets (0.9%) | | | | | |
Lvb Acquisition Merger Sub, Inc. -144A | | | | | |
10.00%, due 10/15/2017 | | 1,285 | | 1,311 | |
11.63%, due 10/15/2017 | | 690 | | 680 | |
Nuveen Investments, Inc. -144A | | | | | |
10.50%, due 11/15/2015 § | | 865 | | 862 | |
Chemicals (3.2%) | | | | | |
JohnsonDiversey, Inc. | | | | | |
9.63%, due 05/15/2012 | | 3,670 | | 3,753 | |
Koppers Holdings, Inc. | | | | | |
due 11/15/2014 1 | | 2,279 | | 1,914 | |
Momentive Performance Materials, Inc. -144A | | | | | |
9.75%, due 12/01/2014 § | | 1,650 | | 1,518 | |
Mosaic Co. (The) -144A | | | | | |
7.88%, due 12/01/2016 ^ | | 1,955 | | 2,111 | |
Nalco Co. | | | | | |
7.75%, due 11/15/2011 | | 480 | | 486 | |
8.88%, due 11/15/2013 | | 1,940 | | 2,022 | |
Commercial Banks (0.6%) | | | | | |
Russian Standard Finance SA for Russian Standard Bank , Reg S | | | | | | | |
7.50%, due 10/07/2010 | | $ | 759 | | $ | 672 | |
Tnk-BP Finance SA -144A | | | | | |
7.50%, due 07/18/2016 | | 472 | | 457 | |
Vtb Capital SA -144A | | | | | |
6.61%, due 10/31/2012 § | | 828 | | 813 | |
Commercial Services & Supplies (1.1%) | | | | | |
Corrections Corp. of America | | 620 | | 611 | |
6.25%, due 03/15/2013 | | | | | |
Geo Group, Inc. (The) | | | | | |
8.25%, due 07/15/2013 | | 870 | | 879 | |
Interface, Inc. | | | | | |
9.50%, due 02/01/2014 | | 200 | | 209 | |
10.38%, due 02/01/2010 | | 1,550 | | 1,624 | |
Construction & Engineering (0.1%) | | | | | |
Autopistas del Sol SA -144A | | | | | |
11.50%, due 05/23/2017 | | 570 | | 484 | |
Consumer Finance (2.9%) | | | | | |
Ford Motor Credit Co. LLC | | | | | |
8.63%, due 11/01/2010 | | 1,275 | | 1,183 | |
9.75%, due 09/15/2010 | | 5,410 | | 5,162 | |
GMAC LLC 6.88%, due 09/15/2011 | | 3,374 | | 2,887 | |
Containers & Packaging (2.1%) | | | | | |
Crown Americas | | | | | |
7.63%, due 11/15/2013 | | 990 | | 1,012 | |
Graham Packaging Co., Inc. | | 1,005 | | 925 | |
9.88%, due 10/15/2014 ^ | | | | | |
Greif, Inc. | | | | | |
6.75%, due 02/01/2017 | | 1,025 | | 1,002 | |
Jefferson Smurfit Corp. US | | | | | |
8.25%, due 10/01/2012 | | 1,297 | | 1,277 | |
Owens Brockway Glass Container, Inc. | | | | | |
8.25%, due 05/15/2013 | | 1,830 | | 1,899 | |
Vitro SAB de CV | | | | | |
8.63%, due 02/01/2012 | | 57 | | 54 | |
9.13%, due 02/01/2017 | | 375 | | 345 | |
Diversified Consumer Services (0.9%) | | | | | |
Service Corp. International | | | | | |
7.00%, due 06/15/2017 | | 1,800 | | 1,724 | |
Service Corp. International/US | | | | | |
6.75%, due 04/01/2015 | | 154 | | 152 | |
7.38%, due 10/01/2014 | | 895 | | 905 | |
Diversified Financial Services (2.4%) | | | | | |
C10 Capital SPV, Ltd. -144A | | | | | |
6.72%, due 12/31/2016 Ž | | 161 | | 148 | |
Centercredit International BV -144A | | | | | |
8.63%, due 01/30/2014 | | 650 | | 520 | |
El Paso Performance-Linked Trust -144A | | | | | |
7.75%, due 07/15/2011 | | 1,765 | | 1,811 | |
The notes to the financial statements are an integral part of this report.
5
| | Principal | | Value | |
Diversified Financial Services (continued) | | | | | |
Hawker Beechcraft Acquisition Co. LLC / Hawker Beechcraft Notes Co. -144A | | | | | |
9.75%, due 04/01/2017 ^ | | $ | 1,565 | | $ | 1,557 | |
Isa Capital Do Brasil SA -144A | | | | | |
7.88%, due 01/30/2012 | | 353 | | 360 | |
8.80%, due 01/30/2017 | | 646 | | 666 | |
Kar Holdings, Inc. -144A | | | | | |
10.00%, due 05/01/2015 | | 750 | | 669 | |
Local Tv Finance LLC -144A | | | | | |
9.25%, due 06/15/2015 | | 1,010 | | 965 | |
Smurfit Kappa Funding PLC | | | | | |
7.75%, due 04/01/2015 | | 170 | | 162 | |
Tropicana Entertainment LLC | | | | | |
9.63%, due 12/15/2014 ^ | | 980 | | 622 | |
Diversified Telecommunication Services (4.1%) | | | | | |
ALLTEL Corp. | | | | | |
7.00%, due 07/01/2012 | | 1,380 | | 1,190 | |
Cincinnati Bell, Inc. | | | | | |
8.38%, due 01/15/2014 | | 1,715 | | 1,672 | |
Citizens Communications Co. | | | | | |
9.25%, due 05/15/2011 | | 1,089 | | 1,179 | |
Globo Comunicacoes E Participacoes SA -144A | | | | | |
7.25%, due 04/26/2022 | | 242 | | 234 | |
Nordic Telephone Co. Holdings Aps -144A | | | | | |
8.88%, due 05/01/2016 | | 785 | | 805 | |
Qwest Capital Funding, Inc. | | | | | |
7.25%, due 02/15/2011 ^ | | 1,295 | | 1,276 | |
Qwest Corp. | | | | | |
7.88%, due 09/01/2011 | | 650 | | 676 | |
8.88%, due 03/15/2012 | | 1,240 | | 1,327 | |
Time Warner Telecom Holdings, Inc. | | | | | |
9.25%, due 02/15/2014 | | 660 | | 675 | |
Virgin Media Finance PLC | | | | | |
9.13%, due 08/15/2016 | | 875 | | 866 | |
Wind Acquisition Finance SA -144A | | | | | |
10.75%, due 12/01/2015 | | 1,540 | | 1,679 | |
Windstream Corp. | | | | | |
8.63%, due 08/01/2016 | | 1,230 | | 1,291 | |
Electric Utilities (2.2%) | | | | | |
Eeb International, Ltd. -144A | | | | | |
8.75%, due 10/31/2014 § | | 438 | | 447 | |
Enersis SA | | | | | |
7.38%, due 01/15/2014 | | 511 | | 547 | |
Intergen NV -144A | | | | | |
9.00%, due 06/30/2017 | | 810 | | 852 | |
Majapahit Holding BV -144A | | | | | |
7.25%, due 06/28/2017 | | 262 | | 251 | |
7.88%, due 06/29/2037 ^ | | 748 | | 716 | |
Mirant Americas Generation LLC | | | | | |
8.30%, due 05/01/2011 | | 800 | | 802 | |
Reliant Energy, Inc. | | | | | |
6.75%, due 12/15/2014 | | $ | 500 | | $ | 501 | |
7.88%, due 06/15/2017 ^ | | 2,240 | | 2,218 | |
Sierra Pacific Resources | | | | | |
8.63%, due 03/15/2014 | | 580 | | 620 | |
Electronic Equipment & Instruments (0.9%) | | | | | |
Flextronics International, Ltd. | | | | | |
6.25%, due 11/15/2014 | | 1,140 | | 1,086 | |
Innophos, Inc. | | | | | |
8.875 due 08/15/2014 1 | | 1,895 | | 1,885 | |
Energy Equipment & Services (0.7%) | | | | | |
Basic Energy Services, Inc. | | | | | |
7.13%, due 04/15/2016 | | 1,600 | | 1,504 | |
Gulfmark Offshore, Inc. | | | | | |
7.75%, due 07/15/2014 | | 605 | | 611 | |
Food & Staples Retailing (1.2%) | | | | | |
Couche-Tard US, LP/Couche-Tard | | | | | |
7.50%, due 12/15/2013 | | 665 | | 663 | |
Rite AID Corp. | | | | | |
7.50%, due 03/01/2017 | | 780 | | 688 | |
9.50%, due 06/15/2017 | | 190 | | 157 | |
Stater Brothers Holdings | | | | | |
7.75%, due 04/15/2015 | | 1,065 | | 1,028 | |
Supervalu, Inc. | | | | | |
7.50%, due 11/15/2014 | | 1,155 | | 1,184 | |
Food Products (1.1%) | | | | | |
B&G Foods, Inc. | | | | | |
8.00%, due 10/01/2011 | | 1,105 | | 1,083 | |
Del Monte Corp. | | | | | |
6.75%, due 02/15/2015 | | 1,205 | | 1,139 | |
Michael Foods, Inc. | | | | | |
8.00%, due 11/15/2013 | | 1,165 | | 1,153 | |
Gas Utilities (0.0%) | | | | | |
Intergas Finance BV -144A | | | | | |
6.38%, due 05/14/2017 | | 164 | | 147 | |
Health Care Equipment & Supplies (0.9%) | | | | | |
Cooper Cos., Inc. | | | | | |
7.13%, due 02/15/2015 | | 1,625 | | 1,580 | |
Universal Hospital Services, Inc. | | | | | |
8.29%, due 06/01/2015 * | | 290 | | 290 | |
8.50%, due 06/01/2015 | | 1,020 | | 1,030 | |
Health Care Providers & Services (5.1%) | | | | | |
Centene Corp. | | | | | |
7.25%, due 04/01/2014 | | 1,100 | | 1,072 | |
Community Health Systems, Inc. | | | | | |
8.88%, due 07/15/2015 | | 2,435 | | 2,481 | |
Davita, Inc. | | | | | |
6.63%, due 03/15/2013 | | 1,140 | | 1,134 | |
7.25%, due 03/15/2015 | | 2,285 | | 2,291 | |
HCA, Inc. | | | | | |
6.38%, due 01/15/2015 | | 2,325 | | 1,965 | |
9.25%, due 11/15/2016 | | 3,610 | | 3,791 | |
The notes to the financial statements are an integral part of this report.
6
| | Principal | | Value | |
Health Care Providers & Services (continued) | | | | | |
Psychiatric Solutions, Inc. | | | | | |
7.75%, due 07/15/2015 | | $ | 1,875 | | $ | 1,870 | |
US Oncology, Inc. | | | | | |
10.75%, due 08/15/2014 | | 1,495 | | 1,476 | |
Hotels, Restaurants & Leisure (5.3%) | | | | | |
Capital Cana SA , Reg S | | | | | |
9.63%, due 11/03/2013 | | 341 | | 329 | |
Fontainebleau Las Vegas Holdings | | | | | |
LLC/Fontainebleau Las Vegas Capital Corp. -144A | | | | | |
10.25%, due 06/15/2015 | | 1,280 | | 1,110 | |
Harrahs Operating Co., Inc. | | | | | |
5.38%, due 12/15/2013 | | 750 | | 570 | |
Harrah’s Operating Co., Inc. | | | | | |
5.75%, due 10/01/2017 | | 3,635 | | 2,463 | |
Isle of Capri Casinos, Inc. | | | | | |
7.00%, due 03/01/2014 | | 1,080 | | 886 | |
Mandalay Resort Group | | | | | |
9.38%, due 02/15/2010 | | 1,050 | | 1,087 | |
MGM Mirage | | | | | |
5.88%, due 02/27/2014 | | 1,520 | | 1,391 | |
8.38%, due 02/01/2011 | | 775 | | 792 | |
8.50%, due 09/15/2010 | | 765 | | 794 | |
MGM Mirage, Inc. | | | | | |
7.50%, due 06/01/2016 | | 2,500 | | 2,475 | |
Pinnacle Entertainment, Inc. | | | | | |
8.25%, due 03/15/2012 | | 250 | | 252 | |
Station Casinos, Inc. | | | | | |
6.50%, due 02/01/2014 | | 2,675 | | 2,006 | |
6.88%, due 03/01/2016 | | 350 | | 255 | |
Wynn Las Vegas Capital Corp. | | | | | |
6.63%, due 12/01/2014 | | 2,085 | | 2,049 | |
Household Durables (0.5%) | | | | | |
Jarden Corp. | | | | | |
7.50%, due 05/01/2017 | | 965 | | 830 | |
Visant Holding Corp. | | | | | |
8.75%, due 12/01/2013 | | 718 | | 721 | |
Independent Power Producers & Energy Traders (4.0%) | | | | | |
AES Corp. (The) | | | | | |
9.38%, due 09/15/2010 | | 2,055 | | 2,158 | |
Edison Mission Energy | | | | | |
7.00%, due 05/15/2017 | | 3,465 | | 3,404 | |
Empresa Nacional de Electricidad SA | | | | | |
8.35%, due 08/01/2013 | | 760 | | 861 | |
Mirant North America LLC | | | | | |
7.38%, due 12/31/2013 | | 1,640 | | 1,644 | |
NRG Energy, Inc. | | | | | |
7.38%, due 02/01/2016 | | 4,515 | | 4,402 | |
Insurance (0.4%) | | | | | |
Usi Holdings Corp. -144A | | | | | |
9.75%, due 05/15/2015 | | 1,410 | | 1,135 | |
IT Services (1.6%) | | | | | |
Aramark Corp. | | | | | |
8.50%, due 02/01/2015 | | $ | 1,610 | | $ | 1,630 | |
First Data Corp. -144A | | | | | |
9.88%, due 09/24/2015 | | 1,455 | | 1,353 | |
SunGard Data Systems, Inc. | | | | | |
10.25%, due 08/15/2015 | | 2,078 | | 2,125 | |
Machinery (1.5%) | | | | | |
Allison Transmission -144A | | | | | |
11.00%, due 11/01/2015 ^ | | 1,720 | | 1,565 | |
Blount, Inc. | | | | | |
8.88%, due 08/01/2012 | | 1,035 | | 1,038 | |
Case New Holland, Inc. | | | | | |
7.13%, due 03/01/2014 | | 1,500 | | 1,496 | |
Koppers, Inc. | | | | | |
9.88%, due 10/15/2013 | | 590 | | 621 | |
Media (10.1%) | | | | | |
Allbritton Communications Co. | | | | | |
7.75%, due 12/15/2012 | | 2,323 | | 2,300 | |
AMC Entertainment, Inc. | | | | | |
11.00%, due 02/01/2016 ^ | | 500 | | 526 | |
American Media Operations, Inc. | | | | | |
10.25%, due 05/01/2009 ^ | | 1,375 | | 1,174 | |
Bonten Media Acquisition Co. -144A | | | | | |
9.00%, due 06/01/2015 | | 1,345 | | 1,173 | |
Canwest Mediaworks, LP -144A | | | | | |
9.25%, due 08/01/2015 | | 920 | | 900 | |
CCH I Holdings LLC/CCH I Holdings | | | | | |
11.00%, due 10/01/2015 | | 715 | | 583 | |
CCO Holdings LLC/CCO Holdings | | | | | |
8.75%, due 11/15/2013 | | 2,210 | | 2,111 | |
Clear Channel Communications, Inc. | | | | | |
5.50%, due 09/15/2014 ^ | | 1,810 | | 1,380 | |
CSC Holdings, Inc. | | | | | |
6.75%, due 04/15/2012 | | 2,175 | | 2,080 | |
Dex Media, Inc. | | | | | |
due 11/15/2013 (1) | | 4,095 | | 3,726 | |
Grupo Televisa SA | | | | | |
8.50%, due 03/11/2032 | | 890 | | 1,089 | |
Idearc, Inc. | | | | | |
8.00%, due 11/15/2016 | | 4,265 | | 3,913 | |
Intelsat Bermuda, Ltd. | | | | | |
11.25%, due 06/15/2016 | | 2,345 | | 2,421 | |
11.41%, due 06/15/2013 * | | 605 | | 620 | |
Intelsat Intermediate Holding Co., Ltd. | | | | | |
due 02/01/2015 11 | | 485 | | 396 | |
Ion Media Networks, Inc. -144A | | | | | |
11.49%, due 01/15/2013 * | | 1,485 | | 1,461 | |
Lamar Media Corp. | | | | | |
6.63%, due 08/15/2015 | | 710 | | 690 | |
Lbi Media, Inc. -144A | | | | | |
8.50%, due 08/01/2017 | | 955 | | 920 | |
The notes to the financial statements are an integral part of this report.
7
| | Principal | | Value | |
Media (continued) | | | | | |
Lin Television Corp. | | | | | |
6.50%, due 05/15/2013 | | $ | 1,320 | | $ | 1,242 | |
MediaCom LLC / Capital Corp. | | | | | |
9.50%, due 01/15/2013 | | 960 | | 892 | |
Nexstar Broadcasting, Inc. | | | | | |
7.00%, due 01/15/2014 | | 1,045 | | 973 | |
Nielsen Finance LLC / Nielsen Finance | | | | | |
10.00%, due 08/01/2014 | | 910 | | 930 | |
RH Donnelley Corp. | | | | | |
8.88%, due 01/15/2016 | | 1,730 | | 1,618 | |
Univision Communications, Inc. -144A | | | | | |
9.75%, due 03/15/2015 ^ | | 2,065 | | 1,882 | |
Videotron LTEE | | | | | |
6.88%, due 01/15/2014 | | 915 | | 896 | |
Metals & Mining (3.4%) | | | | | |
Cii Carbon LLC -144A | | | | | |
11.13%, due 11/15/2015 § | | 580 | | 571 | |
Corp. Nacional del Cobre de Chile - Codelco , Reg S | | | | | |
5.63%, due 09/21/2035 | | 1,563 | | 1,436 | |
FMG Finance Property, Ltd. -144A | | | | | |
10.63%, due 09/01/2016 | | 1,715 | | 1,964 | |
Freeport-McMoRan Copper & Gold, Inc. | | | | | |
8.25%, due 04/01/2015 | | 660 | | 700 | |
8.38%, due 04/01/2017 | | 3,100 | | 3,325 | |
8.39%, due 04/01/2015 * | | 675 | | 685 | |
Pna Group, Inc. | | | | | |
10.75%, due 09/01/2016 | | 1,320 | | 1,241 | |
Ryerson, Inc. -144A | | | | | |
12.00%, due 11/01/2015 | | 630 | | 622 | |
Oil, Gas & Consumable Fuels (9.7%) | | | | | |
Arch Western Finance LLC | | | | | |
6.75%, due 07/01/2013 | | 1,120 | | 1,086 | |
Atlas Pipeline Partners, LP | | | | | |
8.13%, due 12/15/2015 | | 1,660 | | 1,643 | |
Chaparral Energy, Inc. -144A | | | | | |
8.88%, due 02/01/2017 | | 1,560 | | 1,408 | |
Chesapeake Energy Corp. | | | | | |
6.38%, due 06/15/2015 | | 575 | | 556 | |
6.88%, due 01/15/2016 | | 880 | | 871 | |
7.00%, due 08/15/2014 | | 1,302 | | 1,309 | |
Dynegy Holdings, Inc. | | | | | |
7.50%, due 06/01/2015 | | 750 | | 701 | |
El Paso Corp. | | | | | |
7.75%, due 01/15/2032 | | 915 | | 929 | |
Forest Oil Corp. -144A | | | | | |
7.25%, due 06/15/2019 | | 900 | | 905 | |
Foundation PA Coal Co. | | | | | |
7.25%, due 08/01/2014 | | 500 | | 494 | |
GAZ Capital for Gazprom , Reg S | | | | | |
6.21%, due 11/22/2016 | | 439 | | 426 | |
6.51%, due 03/07/2022 -144A | | 830 | | 789 | |
Hilcorp Energy I, LP/Hilcorp Finance Co. -144A | | | | | |
7.75%, due 11/01/2015 | | $ | 645 | | $ | 634 | |
9.00%, due 06/01/2016 | | 1,670 | | 1,728 | |
Knight, Inc. | | | | | |
7.25%, due 03/01/2028 | | 860 | | 807 | |
Mariner Energy, Inc. | | | | | |
8.00%, due 05/15/2017 | | 1,545 | | 1,470 | |
Morgan Stanley Bank AG for OAO Gazprom, Reg S | | | | | |
9.63%, due 03/01/2013 | | 1,550 | | 1,756 | |
Newfield Exploration Co. | | | | | |
6.63%, due 09/01/2014 | | 1,590 | | 1,574 | |
Opti Canada, Inc. -144A | | | | | |
8.25%, due 12/15/2014 | | 890 | | 881 | |
Peabody Energy Corp. | | | | | |
5.88%, due 04/15/2016 | | 1,200 | | 1,128 | |
7.38%, due 11/01/2016 | | 960 | | 984 | |
Pemex Project Funding Master Trust -144A | | | | | |
6.63%, due 06/15/2035 § | | 28 | | 30 | |
Petroleos de Venezuela SA , Reg S | | | | | |
5.25%, due 04/12/2017 | | 568 | | 403 | |
Petroleum Co. of Trinidad & Tobago, Ltd. -144A | | | | | |
6.00%, due 05/08/2022 | | 382 | | 380 | |
Plains Exploration & Production Co. | | | | | |
7.00%, due 03/15/2017 | | 2,000 | | 1,913 | |
Quicksilver Resources, Inc. | | | | | |
7.13%, due 04/01/2016 | | 1,655 | | 1,626 | |
Transcontinental Gas Pipe Line Corp. | | | | | |
7.00%, due 08/15/2011 | | 289 | | 303 | |
Williams Cos., Inc. | | | | | |
7.13%, due 09/01/2011 | | 858 | | 906 | |
8.75%, due 03/15/2032 | | 991 | | 1,212 | |
Williams Partners, LP/Williams Partners | | | | | |
7.25%, due 02/01/2017 | | 1,405 | | 1,447 | |
Paper & Forest Products (1.6%) | | | | | |
Buckeye Technologies, Inc. | | | | | |
8.50%, due 10/01/2013 | | 2,525 | | 2,569 | |
Catalyst Paper Corp. | | | | | |
8.63%, due 06/15/2011 | | 495 | | 411 | |
Millar Western Forest Products, Ltd. | | | | | |
7.75%, due 11/15/2013 | | 1,475 | | 1,099 | |
Newpage Corp. -144A | | | | | |
10.00%, due 05/01/2012 § | | 925 | | 930 | |
Real Estate Management & Development (0.3%) | | | | | |
Newland International Properties Corp. -144A | | | | | |
9.50%, due 11/15/2014 § | | 869 | | 837 | |
Road & Rail (0.7%) | | | | | |
Hertz Corp. (The) | | | | | |
8.88%, due 01/01/2014 | | 2,075 | | 2,104 | |
Semiconductors & Semiconductor Equipment (0.6%) | | | | | |
Avago Technologies Finance Pte | | | | | |
11.88%, due 12/01/2015 | | 770 | | 823 | |
Spansion, Inc. -144A | | | | | |
11.25%, due 01/15/2016 ^ | | 1,205 | | 1,024 | |
The notes to the financial statements are an integral part of this report.
8
| | Principal | | Value | |
Specialty Retail (1.3%) | | | | | |
AmeriGas Partners, LP/AmeriGas Eagle | | | | | |
7.13%, due 05/20/2016 | | $ | 1,085 | | $ | 1,052 | |
Collective Brands, Inc. | | | | | |
8.25%, due 08/01/2013 | | 540 | | 508 | |
Inergy, LP/Inergy Finance Corp. | | | | | |
6.88%, due 12/15/2014 | | 1,515 | | 1,473 | |
Michaels Stores, Inc. | | | | | |
10.00%, due 11/01/2014 ^ | | 990 | | 941 | |
Textiles, Apparel & Luxury Goods (0.1%) | | | | | |
Levi Strauss & Co. | | | | | |
9.75%, due 01/15/2015 | | 365 | | 364 | |
Thrifts & Mortgage Finance (0.3%) | | | | | |
Residential Capital Corp. | | | | | |
7.63%, due 11/21/2008 | | 1,240 | | 986 | |
Residential Capital LLC | | | | | |
8.00%, due 06/01/2012 | | 179 | | 110 | |
Trading Companies & Distributors (0.6%) | | | | | |
Buhrmann US, Inc. | | | | | |
7.88%, due 03/01/2015 | | 795 | | 749 | |
Varietal Distribution Merger Sub, Inc. -1 44A | | | | | |
10.25%, due 07/15/2015 | | 845 | | 805 | |
WESCO Distribution, Inc. | | | | | |
7.50%, due 10/15/2017 | | 350 | | 326 | |
Wireless Telecommunication Services (0.5%) | | | | | |
American Tower Corp. -144A | | | | | |
7.00%, due 10/15/2017 § | | 585 | | 588 | |
Metropcs Wireless, Inc. | | | | | |
9.25%, due 11/01/2014 | | 1,010 | | 949 | |
| | | | | |
Total Corporate Debt Securities (cost $256,051) | | | | 248,580 | |
| | | | | |
LOAN ASSIGNMENTS (9.8%) | | | | | |
Airlines (0.3%) | | | | | |
Hawker Beechcraft Acquisition | | | | | |
5.20%, due 03/28/2014 | | 41 | | 39 | |
6.83%, due 03/28/2014 | | 993 | | 947 | |
Auto Components (0.2%) | | | | | |
Allison Transmission, Inc. | | | | | |
7.96%, due 08/07/2014 | | 556 | | 520 | |
Automobiles (1.7%) | | | | | |
Dayco Products, LLC | | | | | |
10.77%, due 12/31/2011 | | 1,224 | | 1,149 | |
Ford Motor Company | | | | | |
8.00%, due 12/16/2013 | | 2,488 | | 2,308 | |
Goodyear Tire & Rubber Company (The) | | | | | |
6.43%, due 04/30/2014 | | 2,046 | | 1,925 | |
Commercial Services & Supplies (1.5%) | | | | | |
Allied Waste Industries Inc. | | | | | |
5.50%, due 03/28/2014 | | $ | 491 | | $ | 471 | |
6.59%, due 03/28/2014 | | 776 | | 745 | |
Idearc, Inc. | | | | | |
6.83%, due 11/17/2014 | | 1,859 | | 1,773 | |
Nielsen Finance LLC | | | | | |
7.28%, due 08/09/2013 | | 1,758 | | 1,671 | |
Diversified Financial Services (0.6%) | | | | | |
Celanese U.S. Holdings LLC | | | | | |
6.98%, due 04/02/2014 | | 1,860 | | 1,798 | |
Diversified Telecommunication Services (0.7%) | | | | | |
CSC Holdings, Inc. | | | | | |
6.90%, due 03/29/2013 | | 1,222 | | 1,157 | |
Mediacom LLC Group | | | | | |
6.53%, due 09/30/2012 | | 1,101 | | 1,030 | |
Food Products (0.8%) | | | | | |
Dean Foods Company | | | | | |
6.58%, due 04/02/2014 | | 1,415 | | 1,338 | |
Dole Food Company, Inc. | | | | | |
5.16%, due 04/12/2013 | | 130 | | 121 | |
7.16%, due 04/12/2013 | | 287 | | 267 | |
7.22%, due 04/12/2013 | | 957 | | 890 | |
Health Care Equipment & Supplies (0.2%) | | | | | |
Advanced Medical Optics, Inc | | | | | |
6.95%, due 04/02/2014 | | 644 | | 604 | |
Health Care Providers & Services (0.9%) | | | | | |
Community Health Systems, Inc. | | | | | |
7.33%, due 07/25/2014 | | 1,048 | | 960 | |
HCA, Inc. | | | | | |
7.08%, due 11/18/2013 | | 2,069 | | 1,996 | |
IT Services (0.3%) | | | | | |
First Data Corporation | | | | | |
7.63%, due 09/24/2014 | | 864 | | 821 | |
Media (1.4%) | | | | | |
Charter Communications Operating, LLC | | | | | |
6.99%, due 03/06/2014 | | 1,787 | | 1,674 | |
Gray Television, Inc. | | | | | |
6.73%, due 12/31/2014 | | 838 | | 782 | |
Univision Communications, Inc. | | | | | |
7.21%, due 09/29/2014 | | 1,975 | | 1,759 | |
Paper & Forest Products (1.0%) | | | | | |
Altivity Packaging LLC | | | | | |
9.98%, due 12/30/2013 | | 412 | | 414 | |
Building Materials Corporation of | | | | | |
10.69%, due 09/15/2014 | | 853 | | 632 | |
The notes to the financial statements are an integral part of this report.
9
| | Principal | | Value | |
Paper & Forest Products (continued) | | | | | |
Georgia-Pacific Corporation | | | | | |
6.84%, due 12/20/2012 | | $ | 137 | | $ | 131 | |
6.87%, due 12/20/2012 | | 2,096 | | 2,000 | |
Specialty Retail (0.4%) | | | | | |
Michaels Stores, Inc. | | | | | |
7.61%, due 10/31/2013 | | 1,487 | | 1,372 | |
Total Loan Assignments (cost $32,903) | | | | 31 ,294 | |
| | | | | |
STRUCTURED NOTES (0.2%) | | | | | |
Media (0.2%) | | | | | |
Nielsen Finance LLC | | | | | |
12.5 due 08/01/2016 (1) | | 1,065 | | 748 | |
| | | | | |
Total Structured Notes (cost $797) | | | | 748 | |
| | | | | | | |
| | Shares | | Value | |
CONVERTIBLE PREFERRED STOCKS (0.0%) | | | | | |
Real Estate Investment Trusts (0.0%) | | | | | |
HRPT Properties Trust Ž | | 1,181 | | $ | 30 | |
| | | | | |
Total Convertible Preferred Stocks (cost $32) | | | | 30 | |
| | | | | |
COMMON STOCKS (1.7%) | | | | | |
Building Products (0.3%) | | | | | |
Goodman Global, Inc. ‡ | | 33,900 | | $ | 832 | |
Diversified Financial Services (0.1%) | | | | | |
Bank of America Corp. | | 3,300 | | 136 | |
JPMorgan Chase & Co. | | 3,300 | | 144 | |
Diversified Telecommunication Services (0.3%) | | | | | |
Windstream Corp. | | 68,700 | | 895 | |
Household Products (0.0%) | | | | | |
Central Garden And Pet Co. ‡^ | | 13,400 | | 77 | |
Media (0.6%) | | | | | |
Comcast Corp. Class A ‡ | | 68,000 | | 1,242 | |
Time Warner Cable, Inc. Class A ‡ | | 16,700 | | 461 | |
Oil, Gas & Consumable Fuels (0.1%) | | | | | |
Chevron Corp. ^ | | 4,300 | | 401 | |
Paper & Forest Products (0.1%) | | | | | |
Louisiana-Pacific Corp. ^ | | 14,800 | | 202 | |
Pharmaceuticals (0.1%) | | | | | |
Johnson & Johnson | | 5,300 | | 354 | |
Semiconductors & Semiconductor Equipment (0.1%) | | | | | |
Intel Corp. | | 14,600 | | 389 | |
Total Common Stocks (cost $5,977) | | | | 5,133 | |
| | | | | |
Total Securities Lending Collateral (cost $20,317) (2) | | | | 20,317 | |
| | | | | |
Total Investment Securities (cost $340,322) # | | | | $ | 328,635 | |
NOTES TO SCHEDULE OF INVESTMENTS:
^ | | At December 31, 2007, all or a portion of this security is on loan (see Note 1). The value at December 31, 2007, of all securities on loan is $19,782. |
* | | Floating or variable rate note. Rate is listed as of December 31, 2007. |
§ | | Illiquid. At December 31, 2007, these securities aggregated $10,069 or 3.06% of total investment securities of the Fund. |
‡ | | Non-Income Producing. |
(1) | | Step Bond. Interest rate may increase or decrease as the credit rating changes. |
(2) | | Cash collateral for the Repurchase Agreements, valued at $7,365, that serves as collateral for securities lending, is invested in corporate bonds with interest rates and maturity dates ranging from 3.00% - 10.18% and 04/28/2008 - 12/01/2096, respectively. |
Ž | | The security has a perpetual maturity. The date shown is the next call date. |
# | | Aggregate cost for federal income tax purposes is $340,633. Aggregate gross unrealized appreciation for all securities in which there is an excess of value over tax cost and aggregate gross unrealized depreciation for all securities in which there is an excess of tax cost over value were $2,869 and $14,867, respectively. Net unrealized depreciation for tax purposes is $11,998 |
(a) | | Interest only security. Holder is entitled to interest payments on the underlying pool. |
DEFINITIONS:
144A | | 144A Securities are registered pursuant to Rule 144A of the Securities Act of 1933. These securities are deemed to be liquid for purposes of compliance limitations on holdings of illiquid securities and may be resold as transactions exempt from registration, normally to qualified institutional buyers. At December 31, 2007, these securities aggregated $55,166 or 17.30% of net assets of the Fund. |
CDO | | Collateralized Debt Obligation. |
The notes to the financial statements are an integral part of this report.
10
MFS High Yield
STATEMENT OF ASSETS AND LIABILITIES
At December 31, 2007
(all amounts except per share amounts in thousands)
Assets: | | $ | 328,635 | |
Investment securities, at value (cost: $340,322)
(including securities loaned of $19,782) | | | |
Cash | | 4,878 | |
Receivables: | | | |
Investment securities sold | | 836 | |
Shares sold | | 34 | |
Interest | | 6,185 | |
Income from loaned securities | | 10 | |
Dividends | | 17 | |
| | 340,595 | |
Liabilities: | | | |
Investment securities purchased | | 894 | |
Accounts payable and accrued liabilities: | | | |
Shares redeemed | | 180 | |
Management and advisory fees | | 202 | |
Distribution and service fees | | 2 | |
Administration fees | | 6 | |
Payable for collateral for securities on loan | | 20,317 | |
Other | | 73 | |
| | 21,674 | |
Net Assets | | $ | 318 921 | |
| | | |
Net Assets Consist of: | | | |
Capital Stock ($.01 par value) | | $ | 365 | |
Additional paid-in capital | | 301,106 | |
Undistributed (accumulated) net investment income | | 26,099 | |
Undistributed (accumulated) net realized gain from investment securities | | 3,038 | |
Net unrealized (depreciation) on investment securities | | (11,687 | ) |
Net Assets | | $ | 318,921 | |
Net Assets by Class: | | | |
Initial Class | | $ | 308,893 | |
Service Class | | 10,028 | |
Shares Outstanding: | | | |
Initial Class | | 35,328 | |
Service Class | | 1,136 | |
Net Asset Value and Offering Price Per Share: | | | |
Initial Class | | $ | 8.74 | |
Service Class | | 8.83 | |
STATEMENT OF OPERATIONS
For the year ended December 31, 2007
(all amounts in thousands)
Investment Income: | | | |
Dividends | | $ | 127 | |
Interest | | 28,190 | |
Income from loaned securities-net | | 182 | |
| | 28,499 | |
| | | |
Expenses: | | | |
Management and advisory fees | | 2,621 | |
Printing and shareholder reports | | 41 | |
Custody fees | | 94 | |
Administration fees | | 71 | |
Legal fees | | 7 | |
Audit fees | | 21 | |
Trustees fees | | 12 | |
Distribution and service fees: | | | |
Service Class | | 30 | |
Other | | 7 | |
Total expenses | | 2,904 | |
Net Investment Income | | 25,595 | |
Net Realized Gain (Loss) from: | | | |
| | | |
Investment securities | | 3,987 | |
| | | |
Net Increase (Decrease) in Unrealized Appreciation (Depreciation) on: | | | |
Investment securities | | (21,878 | ) |
| | | |
Net Realized and Unrealized (Loss): | | (17,891 | ) |
| | | |
Net Increase In Net Assets Resulting from Operations | | $ | 7,704 | |
11
MFS High Yield
STATEMENT OF CHANGES IN NET ASSETS
For the years ended
(all amounts in thousands)
| | December 31, | | December 31, | |
| | 2007 | | 2006 | |
Increase (Decrease) in Net Assets From: | | | | | |
Operations: | | | | | |
Net investment income | | $ | 25,595 | | $ | 30,439 | |
Net realized gain from investment securities | | 3,987 | | 1,182 | |
Change in unrealized appreciation (depreciation) on investment securities | | (21,878 | ) | 12,865 | |
| | 7,704 | | 44,486 | |
Distributions to Shareholders: | | | | | |
From net investment income: | | | | | |
Initial Class | | (29,868 | ) | (41,778 | ) |
Service Class | | (908 | ) | (802 | ) |
| | (30,776 | ) | (42,580 | ) |
From net realized gains: | | | | | |
Initial Class | | (17 | ) | (4,890 | ) |
Service Class | | (1 | ) | (96 | ) |
| | (18 | ) | (4,986 | ) |
Capital Share Transactions: | | | | | |
Proceeds from shares sold: | | | | | |
Initial Class | | 51,999 | | 41,274 | |
Service Class | | 14,511 | | 9,122 | |
| | 66,510 | | 50,396 | |
Dividends and distributions reinvested: | | | | | |
Initial Class | | 29,885 | | 46,668 | |
Service Class | | 909 | | 898 | |
| | 30,794 | | 47,566 | |
Cost of shares redeemed: | | | | | |
Initial Class | | (129,018 | ) | (127,398 | ) |
Service Class | | (14,829 | ) | (7,765 | ) |
| | (143,847 | ) | (135,163 | ) |
| | (46,543 | ) | (37,201 | ) |
Net increase (decrease) in net assets | | (69,633 | ) | (40,281 | ) |
| | | | | |
Net Assets: | | | | | |
Beginning of year | | 388,554 | | 428,835 | |
End of year | | $ | 318,921 | | $ | 388,554 | |
Undistributed (Accumulated) Net Investment Income (Loss) | | $ | 26,099 | | $ | 30,547 | |
Share Activity: | | | | | |
Shares issued: | | | | | |
Initial Class | | 5,602 | | 4,277 | |
Service Class | | 1,555 | | 939 | |
| | 7,157 | | 5,216 | |
Shares issued-reinvested from distributions: | | | | | |
Initial Class | | 3,492 | | 5,232 | |
Service Class | | 105 | | 100 | |
| | 3,597 | | 5,332 | |
Shares redeemed: | | | | | |
Initial Class | | (13,702 | ) | (13,337 | ) |
Service Class | | (1,578 | ) | (792 | ) |
| | (15,280 | ) | (14,129 | ) |
Net increase (decrease) in shares outstanding: | | | | | |
Initial Class | | (4,608 | ) | (3,828 | ) |
Service Class | | 82 | | 247 | |
| | (4,526 | ) | (3,581 | ) |
12
MFS High Yield
FINANCIAL HIGHLIGHTS
For a share outstanding throughout each period(a)
| | Initial Class | |
| | Year Ended December 31, | |
| | 2007 | | 2006 | | 2005 | | 2004 | | 2003 | |
Net Asset Value | | | | | | | | | | | |
Beginning of period | | $ | 9.48 | | $ | 9.62 | | $ | 10.54 | | $ | 10.28 | | $ | 8.83 | |
Investment Operations | | | | | | | | | | | |
Net investment income (loss) | | 0.68 | | 0.69 | | 0.70 | | 0.77 | | 0.72 | |
Net realized and unrealized gain (loss) | | (0.52 | ) | 0.29 | | (0.51 | ) | 0.18 | | 0.83 | |
Total operations | | 0.16 | | 0.98 | | 0.19 | | 0.95 | | 1.55 | |
Distributions | | | | | | | | | | | |
From net investment income | | (0.90 | ) | (1.00 | ) | (0.85 | ) | (0.65 | ) | (0.10 | ) |
From net realized gains | | — | (b) | (0.12 | ) | (0.26 | ) | (0.04 | ) | — | |
Total distributions | | (0.90 | ) | (1.12 | ) | (1.11 | ) | (0.69 | ) | (0.10 | ) |
Net Asset Value | | | | | | | | | | | |
End of period(c) | | $ | 8.74 | | $ | 9.48 | | $ | 9.62 | | $ | 10.54 | | $ | 10.28 | |
Total Return(d),(e) | | 1.85 | % | 10.95 | % | 1.81 | % | 9.77 | % | 17.74 | % |
Net Assets End of Period (000’s) | | $ | 308,893 | | $ | 378,471 | | $ | 421,010 | | $ | 647,277 | | $ | 661,026 | |
Ratio and Supplemental Data | | | | | | | | | | | |
Expenses to average net assets(f) | | 0.81 | % | 0.82 | % | 0.83 | % | 0.82 | % | 0.81 | % |
Net investment income (loss), to average net
assets(f) | | 7.25 | % | 7.16 | % | 6.92 | % | 7.51 | % | 7.58 | % |
Portfolio turnover rate(e) | | 70 | % | 96 | % | 51 | % | 71 | % | 64 | % |
For a share outstanding throughout each period(a)
| | Service Class | |
| | Year Ended December 31, | | May 1 to Dec | |
| | 2007 | | 2006 | | 2005 | | 2004 | | 31, 2003 | |
Net Asset Value | | | | | | | | | | | |
Beginning of period | | $ | 9.56 | | $ | 9.70 | | $ | 10.64 | | $ | 10.37 | | $ | 9.48 | |
Investment Operations | | | | | | | | | | | |
Net investment income (loss) | | 0.66 | | 0.67 | | 0.68 | | 0.75 | | 0.50 | |
Net realized and unrealized gain (loss) | | (0.51 | ) | 0.29 | | (0.52 | ) | 0.18 | | 0.42 | |
Total operations | | 0.15 | | 0.96 | | 0.16 | | 0.93 | | 0.92 | |
Distributions | | | | | | | | | | | |
From net investment income | | (0.88 | ) | (0.98 | ) | (0.84 | ) | (0.62 | ) | (0.03 | ) |
From net realized gains | | — | (b) | (0.12 | ) | (0.26 | ) | (0.04 | ) | — | |
Total distributions | | (0.88 | ) | (1.10 | ) | (1.10 | ) | (0.66 | ) | (0.03 | ) |
Net Asset Value | | | | | | | | | | | |
End of period(c) | | $ | 8.83 | | $ | 9.56 | | $ | 9.70 | | $ | 10.64 | | $ | 10.37 | |
Total Return(d),(e) | | 1.73 | % | 10.62 | % | 1.50 | % | 9.50 | % | 9.74 | % |
Net Assets End of Period (000’s) | | $ | 10,028 | | $ | 10,083 | | $ | 7,825 | | $ | 5,009 | | $ | 1,270 | |
Ratio and Supplemental Data | | | | | | | | | | | |
Expenses to average net assets(f) | | 1.06 | % | 1.07 | % | 1.08 | % | 1.07 | % | 1.03 | % |
Net investment income (loss), to average net
assets(f) | | 7.01 | % | 6.91 | % | 6.66 | % | 7.25 | % | 7.45 | % |
Portfolio turnover rate(e) | | 70 | % | 96 | % | 51 | % | 71 | % | 64 | % |
(a) | Per share information is calculated based on average number of shares outstanding. |
(b) | Rounds to less than $0.01. |
(c) | MFS High Yield (the "Fund") share class commenced operations as follows: |
| Initial Class - June 1, 1998 |
| Service Class - May 1, 2003 |
(d) | Total Return reflects all portfolio expenses and includes reinvestment of dividends and capital gains; it does not reflect the charges and deductions under the policies or annuity contracts. |
(e) | Not annualized. |
(f) | Annualized. |
13
MFS High Yield
NOTES TO FINANCIAL STATEMENTS
At December 31, 2007
(all amounts in thousands)
NOTE 1. ORGANIZATION AND SIGNIFICANT ACCOUNTING POLICIES
AEGON/Transamerica Series Trust (“ATST”) is an open-end management investment company registered under the Investment Company Act of 1940, as amended (the “1940 Act”). ATST serves as a funding vehicle for variable life insurance, variable annuity and group annuity products. MFS High Yield (the “Fund”) is part of ATST.
In the normal course of business, the Fund enters into contracts that contain a variety of representations that provide general indemnifications. The Fund’s maximum exposure under these arrangements is unknown, as this would involve future claims that may be made against the Fund and/or its affiliates that have not yet occurred. However, based on experience, the Fund expects the risk of loss to be remote.
This report should be read in conjunction with the current Fund prospectus, which contains more complete information about the Fund.
In preparing the Fund’s financial statements in accordance with accounting principles generally accepted in the United States of America (“GAAP”), estimates or assumptions (which could differ from actual results) may be used that affect reported amounts and disclosures. The following is a summary of significant accounting policies followed by the Fund.
Multiple class operations, income and expenses: The Fund currently offers two classes of shares, an Initial Class and a Service Class. Income, non-class specific expenses and realized and unrealized gains and losses, are allocated daily to each class, based upon the value of shares outstanding method as permitted under Rule 18f-3 of the 1940 Act. Each class bears its own specific expenses as well as a portion of general, common expenses.
Security valuations: The Fund values its investments at the close of the New York Stock Exchange (“NYSE”), normally 4 p.m. ET, each day the NYSE is open for business. Fund investments are valued at the last sale price or closing price on the day of valuation taken from the primary exchange where the security is principally traded.
Securities traded in the over-the-counter market and listed securities for which no sale was reported on that date are valued at the last quoted bid price.
Debt securities are valued based on a price quotation or other equivalent indication of value supplied by an exchange, a pricing service or a major market maker; however, those that mature in sixty days or less are valued at amortized cost, which approximates market.
Investment company securities are valued at the net asset value of the underlying portfolio.
Foreign securities generally are valued based on quotations from the primary market in which they are traded. Because many foreign securities markets and exchanges close prior to the close of the NYSE, closing prices for foreign securities in those markets or on those exchanges do not reflect the events that occur after that close. If a significant market event impacting the value of a portfolio security (e.g., natural disaster, company announcement, market volatility) occurs subsequent to the close of trading in the security, but prior to the calculation of the Fund’s net asset value per share, market quotations for that security may be determined to be unreliable and, accordingly, not “readily available.” As a result, foreign equity securities held by the Fund may be valued at fair market value as determined in good faith by the Fund’s Administrative Valuation Committee, using guidelines adopted by the Board of Trustees.
Other securities for which quotations are not readily available are valued at fair market value as determined in good faith by the Fund’s Administrative Valuation Committee, using guidelines adopted by the Board of Trustees.
Cash: The Fund may leave cash overnight in its cash account with the custodian, State Street Bank & Trust Company (“State Street”). On July 2, 2007, State Street acquired the parent company of Investors Bank & Trust Company. State Street has been contracted on behalf of the Fund to invest the excess cash into a savings account, which at December 31, 2007 was paying an interest rate of 2.60%.
Repurchase agreements: The Fund is authorized to enter into repurchase agreements. The Fund, through its custodian, State Street, receives delivery of the underlying securities, the value of which at the time of purchase is required to be an amount equal to at least 100% of the resale price. The Fund will bear the risk of value fluctuations until the security can be sold and may encounter delays and incur costs in liquidating the security. In the event of bankruptcy or insolvency of the seller, delays and costs may be incurred.
Securities lending: The Fund may lend securities to qualified borrowers, with State Street acting as the Fund’s lending agent. The Fund earns negotiated lenders’ fees. The Fund receives cash and/or securities as collateral against the loaned securities. Cash collateral received is invested in short-term, interest-bearing securities. The Fund monitors the market value of securities loaned on a daily basis and requires collateral in an amount at least equal to the value of the securities loaned. Income from loaned securities earned by State Street for its services, shown in the Statement of Operations is net of fees, in the amount of $78.
14
NOTES TO FINANCIAL STATEMENTS (continued)
At December 31, 2007
(all amounts in thousands)
NOTE 1.— (continued)
The Fund has invested the cash collateral received from securities loaned in the following short-term, interest-bearing securities:
Abbey National PLC, Eurodollar Term, 5.00%, 1/7/2008 | | $ | 877 | |
ABN AMRO Bank NV, Eurodollar Term, 5.18%, 1/4/2008 | | 702 | |
Bank of Nova Scotia, Eurodollar Term, 4.96%, 1/22/2008 | | 614 | |
Barclays, Eurodollar Term, 5.00%, 2/12/2008 | | 1 ,228 | |
BNP Paribas, Eurodollar Term, 5.01%, 1/11/2008 | | 1,140 | |
Calyon, Eurodollar Term, 5.12%, 3/3/2008 | | 263 | |
Credit Suisse First Boston Corp., Repurchase Agreement, 4.60%, 1/2/2008 | | 2,280 | |
Dexia Group, Eurodollar Term, 4.82%, 1/3/2008 | | 877 | |
HBOS Halifax Bank of Scotland, Eurodollar Term, 5.15%, 1/2/2008 | | 439 | |
JPMorgan Chase & Co., Eurodollar Term, 5.15%, 2/12/2008 | | 439 | |
Lloyds TSB Bank, Eurodollar Term, 5.15%, 1/24/2008 | | 877 | |
Merrill Lynch & Co. (RPG), Repurchase Agreement, 4.60%, 1/2/2008 | | 1 ,315 | |
Morgan Stanley & Co. (Corp. Repo), Repurchase Agreement, 4.60%, 1/2/2008 | | 3 ,596 | |
Rabobank Nederland, Eurodollar Term, 5.08%, 1/10/2008 | | 1,052 | |
Reserve Primary Money Market Fund, 4.95% | | 935 | |
Royal Bank of Scotland, Eurodollar Term, 5.00%, 2/25/2008 | | 1 ,052 | |
Societe Generale, Eurodollar Term, 5.15%, 3/3/2008 | | 526 | |
Toronto Dominion Bank, Eurodollar Term, 5.05%, 1/10/2008 | | 1 ,052 | |
UBS AG, Eurodollar Term, 4.92%, 1/11/2008 | | 614 | |
Wells Fargo, Bank Note, 4.75%, 1/8/2008 | | 439 | |
| | | |
| | $ | 20,317 | |
Real Estate Investment Trusts (“REITs”): There are certain additional risks involved in investing in REITs. These include, but are not limited to, economic conditions, changes in zoning laws, real estate values, property taxes and interest rates.
Dividend income is recorded at management’s estimate of the income included in distributions from the REIT investments. Distributions received in excess of the estimated amount are recorded as a reduction of the cost of investments. The actual amounts of income, return of capital and capital gains are only determined by each REIT after the fiscal year end and may differ from the estimated amounts.
Loan participations/ assignments: The Fund may purchase participations/ assignments in commercial loans. Such indebtedness may be secured or unsecured. These investments may include standby financing commitments, including revolving credit facilities that obligate the Fund to supply additional cash to the borrower on demand. Loan participations/ assignments involve risks of insolvency of the lending bank or other financial intermediaries. As such, the Fund assumes the credit risk associated with the corporate borrower and may assume the credit risk associated with the interposed bank or other financial intermediary. The Fund may be contractually obligated to receive approval from the agent bank and/or borrower prior to the sale of these investments. Loan participations typically represent direct participation in a loan to a corporate borrower, and generally are offered by banks or other financial institutions or lending syndicates. The Fund may participate in such syndications, or can buy part of a loan, becoming a part lender. A loan is often administered by an agent bank acting as agent for all holders. The agent bank administers the terms of the loan, as specified in the loan agreement. In addition, the agent bank is normally responsible for the collection of principal and interest payments from the corporate borrower and the apportionment of these payments to the credit of all institutions that are parties to the loan agreement. Unless, under the terms of the loan or other indebtedness, the fund has direct recourse against the corporate borrower, the Fund may have to rely on the agent bank or other financial intermediary to apply appropriate credit remedies against a corporate borrower.
Unfunded Commitments: At December 31, 2007, the Fund had the following unfunded loan commitments:
| | Unfunded | | Unrealized | |
Borrower | | Commitment | | Depreciation | |
Community Health Systems, Inc. | | 50 | | (2 | ) |
0.50%, due 07/25/2014 | | | | | |
Univision Communications, Inc. | | | | | |
1.00%, due 09/29/2014 | | 46 | | (4 | ) |
| | | | (6 | ) |
The commitments are available until the maturity date of the respective security.
Security transactions and investment income: Security transactions are recorded on the trade date. Security gains and losses are calculated on the first-in, first-out basis. Dividend income, if any, is recorded on the ex-dividend date or, in the case of foreign securities, as soon as the Fund is informed of the ex-dividend date. Interest income, including accretion of discounts and amortization of premiums, is recorded on the accrual basis commencing on the settlement date.
Foreign currency denominated investments: The accounting records of the Fund are maintained in U.S. dollars. Securities and other assets and liabilities denominated in foreign currencies are translated into U.S. dollars at the closing exchange rate each day. The cost of foreign securities is translated at the exchange rate in effect when the investment was acquired. The Fund combines fluctuations from currency exchange rates and fluctuations in value when computing net realized and unrealized gains or losses from investments.
Net foreign currency gains and losses resulting from changes in exchange rates include: 1) foreign currency fluctuations between trade date and settlement date of investment security transactions; 2) gains and losses on forward foreign currency contracts; and 3) the difference between the receivable amounts of interest and dividends recorded in the accounting records in U.S. dollars and the amounts actually received.
Foreign currency denominated assets may involve risks not typically associated with domestic transactions. These risks include revaluation of currencies, adverse fluctuations in foreign currency values and possible adverse political, social and economic developments, including those particular to a specific industry, country or region.
15
NOTES TO FINANCIAL STATEMENTS (continued)
At December 31, 2007
(all amounts in thousands)
NOTE 1.— (continued)
Dividend distributions: Dividends and capital gains distributions are typically declared and reinvested annually and are generally paid and reinvested on the business day following the ex-date.
NOTE 2. RELATED PARTY TRANSACTIONS
ATST serves as a funding vehicle for certain affiliated asset allocation portfolios and certain affiliated separate accounts of Western Reserve Life Assurance Co. of Ohio, Transamerica Life Insurance Company, Transamerica Financial Life Insurance Company, Inc., Monumental Life Insurance Company and Transamerica Occidental Life Insurance Company.
Transamerica Fund Advisors, Inc. (“TFAI”) is the Fund’s investment adviser. Transamerica Fund Services, Inc. (“TFS”) is the Fund’s administrator and transfer agent. Prior to May 1, 2007, AFSG Securities Corp. (“AFSG”), was the Fund’s distributor. Transamerica Capital Inc. (“TCI”) is now the Fund’s distributor. TFAI, TFS, AFSG, and TCI are affiliates of AEGON NV, a Netherlands corporation.
Certain officers and trustees of the Fund are also officers and/or directors of TFAI, TFS and TCI.
The following schedule reflects the percentage of Fund assets owned by affiliated investment companies at December 31, 2007:
| | Net
Assets | | % of Net
Assets | |
Asset Allocation-Conservative Portfolio | | $ | 20,717 | | 6.50 | % |
Asset Allocation-Moderate Growth Portfolio | | 69,143 | | 21.68 | |
Asset Allocation-Moderate Portfolio | | 97,433 | | 30.55 | |
Total | | $ | 187,293 | | 58.73 | % |
Investment advisory fee: The Fund pays management fees to TFAI based on average daily net assets (“ANA”) at the following breakpoints:
0.75% of the first $250 million of ANA
0.72% of the next $250 million of ANA
0.71% of the next $250 million of ANA
0.68% of the next $250 million of ANA
0.67% of ANA over $1 billion
TFAI has contractually agreed to waive its advisory fee and will reimburse the Fund to the extent that operating expenses, excluding 12b-1 fees, exceed the following stated annual limit:
1.05% Expense Limit
If total Fund expenses fall below the annual expense limitation agreement agreed to by the adviser within the succeeding three years, the Fund may be required to pay the adviser a portion or all of the waived advisory fees.
There were no amounts recaptured during the year ended December 31, 2007. There are no amounts available for recapture at December 31, 2007.
Distribution and service fees: ATST entered into a Distribution Agreement with AFSG dated January 1, 1997, as amended. On May 1, 2007, the Distribution Agreement was amended to replace AFSG with TCI as the Fund’s distributor. The Fund has also adopted a distribution plan (“Distribution Plan”) pursuant to Rule 12b-1 under the 1940 Act.
Under the Distribution Plan for the Initial Class shares, TCI, on behalf of the Fund, is authorized to pay various service providers, as direct payment for expenses incurred in connection with distribution of the Fund’s shares, amounts equal to actual expenses associated with distributing the shares.
The Distribution Plan for the Service Class shares requires ATST to pay distribution fees to TCI as compensation for its activities, not as reimbursement for specific expenses. The fee on the Service Class is paid to the insurance companies for providing services and account maintenance for their policyholders who invest in the variable insurance products which invest in the Service Class shares.
The Fund is authorized under the Distribution Plan to pay fees on each class up to the following limits:
Initial Class | | 0.15 | % |
Service Class | | 0.25 | % |
TCI has determined that it will not seek payment by the Fund of the distribution expenses incurred with respect to the Initial Class shares before April 30, 2009. Prior to TCI seeking reimbursement of future expenses, policy and contract owners will be notified in advance. The Fund will pay fees relating to Service Class shares.
Administrative services: The Fund has entered into an agreement with TFS for financial and legal fund administration services. The Fund pays TFS an annual fee of 0.02% of ANA. The Legal fees on the Statement of Operations are for fees paid to external legal counsel.
Deferred compensation plan: Each eligible independent Fund Trustee may elect participation in a non-qualified deferred compensation plan (“the Plan”). Under the Plan, such Trustees may defer payment of all or a portion of their total fees earned as a Fund Trustee. Each Trustee who is a participant in the Plan may elect that the earnings, losses or gains credited to his or her deferred fee amounts be determined based on a deemed investment in any series of Transamerica IDEX Mutual Funds. The right of a participant to receive a distribution from the Plan of the deferred fees is an unsecured claim against the general assets of all series of Transamerica IDEX Mutual Funds. The pro rata liability to the Fund of all deferred fees in the Plan amounted, as of December 31, 2007, to $15. Amounts deferred under the Plan are unfunded against the general assets of ATST.
16
NOTES TO FINANCIAL STATEMENTS (continued)
At December 31, 2007
(all amounts in thousands)
NOTE 2.— (continued)
Retirement plan: Under a retirement plan (the “Emeritus Plan”) available to the Independent Trustees, each Independent Trustee is deemed to have elected to serve as Trustee Emeritus of ATST upon his or her termination of service, other than removal for cause, and is entitled to 50% of the trustee’s current retainer for a maximum period of five years determined by his or her years of service as a Trustee.
Such amounts shall be accrued by ATST on a pro rata basis allocable t each series of ATST fund based on the relative assets of the series. If retainers increase in the future, past accruals (and credits) will be adjusted upward so that 50% of the Trustee’s current retainer is accrued and credited at all times. Upon death, disability or termination of service, other than removal for cause, amounts deferred become payable to a Trustee Emeritus (or his/her beneficiary). Upon the commencement of service as Trustee Emeritus, compensation will be paid on a quarterly basis during the time period that the Trustee Emeritus is allowed to serve as such.
Amounts accrued under the Emeritus Plan are unsecured claims against the general assets of ATST. As of December 31, 2007, the amount related to the Emeritus Plan was $18. As of December 31, 2007, the Fund has not made any payments related to the Emeritus Plan.
The Emeritus Plan was terminated effective October 30, 2007. Upon the termination, the Fund shall continue to pay any remaining benefits in accordance with the Plan, but no further compensation shall accrue under the Plan.
NOTE 3. INVESTMENT TRANSACTIONS
The cost of securities purchased and proceeds from securities sold (excluding short-term securities) for the year ended December 31, 2007 were as follows:
Purchases of securities: | | | |
Long-term | | $ | 230,902 | |
U.S. Government | | — | |
Proceeds from maturities and sales of securities: | | | |
Long-term | | 316,327 | |
U.S. Government | | — | |
| | | | |
NOTE 4. FEDERAL INCOME TAX MATTERS
The Fund has not made any provision for federal income or excise taxes due to its policy to distribute all of its taxable income and capital gains to its shareholders and otherwise qualify as a regulated investment company under Subchapter M of the Internal Revenue Code. Income and capital gain distributions are determined in accordance with income tax regulations, which may differ from GAAP. These differences are primarily due to differing treatment for items including, but not limited to, wash sales, foreign currency transactions, defaulted bonds and post October loss deferrals and structured notes. Therefore, distributions determined in accordance with tax regulations may differ significantly in amount or character from net investment income and realized gains for financial reporting purposes. Financial reporting records are adjusted for permanent book/tax differences to reflect tax character. Financial records are not adjusted for temporary differences. These reclassifications are as follows:
Additional paid-in capital | | $ | — | |
Undistributed (accumulated) net investment income (loss) | | $ | 733 | |
Undistributed (accumulated) net realized gain (loss) from investment securities | | $ | (733 | ) |
The tax character of distributions paid may differ from the character of distributions shown in the Statements of Changes in Net Assets due to short-term gains being treated as ordinary income for tax purposes. The tax character of distributions paid during 2006 and 2007 was as follows:
2006 Distributions paid from: | | | |
Ordinary Income | | $ | 42,580 | |
Long-term Capital Gain | | 4,986 | |
2007 Distributions paid from: | | | |
Ordinary Income | | 30,776 | |
Long-term Capital Gain | | 18 | |
| | | | |
17
NOTES TO FINANCIAL STATEMENTS (continued)
At December 31, 2007
(all amounts in thousands)
NOTE 4.— (continued)
The tax basis components of distributable earnings as of December 31, 2007 are as follows:
Undistributed Ordinary Income | | $ | 28,724 | |
Undistributed Long-term Capital Gain | | $ | 2,518 | |
Capital Loss Carryforward | | $ | — | |
Post October Capital Loss Deferral | | $ | (1,794 | ) |
Post October Currency Loss Deferral | | $ | — | |
Net Unrealized Appreciation (Depreciation) | | $ | (11,998 | ) |
NOTE 5. REGULATORY PROCEEDINGS
There continues to be significant federal and state regulatory activity relating to financial services companies, particularly mutual fund companies and their investment advisers. As part of an ongoing investigation regarding potential market timing, recordkeeping and trading compliance issues and matters affecting the Fund’s investment adviser, TFAI, and certain affiliates and former employees of TFAI, the SEC staff has indicated that it is likely to take some action against TFAI and certain of its affiliates at the conclusion of the investigation. The potential timing and the scope of any such action is difficult to predict. Although the impact of any action brought against TFAI and/or its affiliates is difficult to assess at the present time, the Fund currently believes that the likelihood that any such action will have a material adverse impact is remote. It is important to note that the Fund is not aware of any allegation of wrongdoing against it and its Board at the time this annual report is printed. Although it is not anticipated that these developments will have an adverse impact on the Fund, there can be no assurance at this time. TFAI and its affiliates are actively working with the SEC in regard to this matter; however, the exact resolution cannot be determined at this time. TFAI will take such actions that it deems necessary or appropriate to continue providing management services to the Fund and to bring all matters to an appropriate conclusion.
TFAI and/or its affiliates, and not the Fund, will bear the costs regarding these regulatory matters.
NOTE 6. RECENTLY ISSUED ACCOUNTING PRONOUNCEMENTS
In July 2006, the Financial Accounting Standards Board (“FASB”) released FASB Interpretation No. 48 “Accounting for Uncertainty in Income Taxes” (“FIN 48”), an interpretation of FASB Statement No. 109. FIN 48 provides guidance for how uncertain tax positions should be recognized, measured, presented and disclosed in the financial statements. FIN 48 requires the accounting and disclosure of tax positions taken or expected to be taken in the course of preparing the Fund’s tax returns to determine whether the tax positions are “more-likely- than-not” of being sustained by the applicable tax authority. Tax positions not deemed to meet the more-likely-than-not threshold would be recorded as a tax benefit or expense in the current year.
Adoption of FIN 48 is effective during the first required financial reporting period for fiscal years beginning after December 15, 2006. Management adopted FIN 48 on June 29, 2007. Implementation of FIN 48 requires Management of the Fund to analyze all open tax years, as defined by the Statute of Limitations, for all major jurisdictions, which includes federal and certain states. Open tax years are those that are open for exam by taxing authorities (i.e., the last 4 tax year ends and the interim tax period since then). The Fund has no examinations in progress and none are expected at this time.Management of the Fund has reviewed all open tax years and major jurisdictions and concluded the adoption of FIN 48 resulted in no impact to the Fund’s net assets or results of operations. There is no tax liability resulting from unrecognized tax benefits relating to uncertain income tax positions taken or expected to be taken in future tax returns. The Fund is also not aware of any tax positions for which it is reasonably possible that the total amounts of unrecognized tax benefits will significantly change in the next 12 months.
In September 2006, FASB issued its new Standard No. 157, “Fair Value Measurements” (“FAS 157”). FAS 157 is designed to unify guidance for the measurement of fair value of all types of assets, including financial instruments, and certain liabilities, throughout a number of accounting standards. FAS 157 also establishes a hierarchy for measuring fair value in generally accepted accounting principles and expands financial statement disclosures about fair value measurements that are relevant to mutual funds. FAS 157 is effective for financial statements issued for fiscal years beginning after November 15, 2007, and earlier application is permitted.
As of December 31, 2007, Management does not expect the adoption of FAS 157 to impact the amounts reported in the financial statements, however, additional disclosures will be required about the inputs used to develop the measurements of fair value and the effect of certain of the measurements reported in the statement of operations for a fiscal period.
NOTE 7. SUBSEQUENT EVENT
Effective January 1, 2008, TFAI changed its name to Transamerica Asset Management, Inc.
Effective May 1, 2008, AEGON/Transamerica Series Trust will change its name to Transamerica Series Trust. At that time, the Fund will also change its name to Transamerica MFS High Yield VP.
18
Report of Independent Registered Certified Public Accounting Firm
To the Board of Trustees and Shareholders of
MFS High Yield:
In our opinion, the accompanying statement of assets and liabilities, including the schedule of investments, and the related statements of operations and of changes in net assets and the financial highlights present fairly, in all material respects, the financial position of MFS High Yield (the “Fund”) (one of the portfolios constituting AEGON/Transamerica Series Trust) at December 31, 2007, the results of its operations for the year then ended, the changes in its net assets for each of the two years in the period then ended and the financial highlights for each of the periods presented, in conformity with accounting principles generally accepted in the United States of America. These financial statements and financial highlights (hereafter referred to as “financial statements”) are the responsibility of the Fund’s management; our responsibility is to express an opinion on these financial statements based on our audits. We conducted our audits of these financial statements in accordance with the standards of the Public Company Accounting Oversight Board (United States). Those standards require that we plan and perform the audit to obtain reasonable assurance about whether the financial statements are free of material misstatement. An audit includes examining, on a test basis, evidence supporting the amounts and disclosures in the financial statements, assessing the accounting principles used and significant estimates made by management, and evaluating the overall financial statement presentation. We believe that our audits, which included confirmation of securities at December 31, 2007 by correspondence with the custodian and brokers, provide a reasonable basis for our opinion.

Tampa, Florida
February 29, 2008
19
MFS High Yield
SUPPLEMENTAL TAX INFORMATION (unaudited)
(all amounts in thousands)
For tax purposes, the Fund has made a Long-Term Capital Gain Designation of $18 for the year ended December 31, 2007.
RESULTS OF SHAREHOLDER PROXY (unaudited)
At a special meeting of shareholders held on October 30, 2007, the results of the Proposals were as follows:
Proposal 1: To elect a new Board:
Proposed
Trustee | | For | | Against | | Abstentions/Broker Non-
Votes | |
John K. Carter | | 2,274,998,840.817 | | 57,804,698.755 | | 35,433.883 | |
| | | | | | | |
Leo J. Hill | | 2,277,212,702.754 | | 55,590,836.819 | | 35,433.883 | |
| | | | | | | |
Neal M. Jewell | | 2,266,793,295.663 | | 66,010,243.909 | | 35,433.883 | |
| | | | | | | |
Russell A. Kimball, Jr. | | 2,274,825,235.835 | | 57,978,303.737 | | 35,433.883 | |
| | | | | | | |
Eugene M. Mannella | | 2,274,623,165.033 | | 58,180,374.539 | | 35,433.883 | |
| | | | | | | |
Norm R. Nielsen | | 2,275,050,055.885 | | 57,753,483.687 | | 35,433.883 | |
| | | | | | | |
Joyce Galpern Norden | | 2,270,278,122.250 | | 62,525,417.323 | | 35,433.883 | |
| | | | | | | |
Patricia L. Sawyer | | 2,275,737,737.456 | | 57,065,802.116 | | 35,433.883 | |
| | | | | | | |
John W. Waechter | | 2,276,615,120.140 | | 56,188,419.433 | | 35,433.883 | |
Proposal 2: To approve an amendment to the Agreement and Declaration of Trust:
| | | | Abstentions/Broker Non- | |
For | | Against | | Votes | |
2,182,022,669.110 | | 77,590,048.544 | | 73,226,255.801 | |
20
MFS High Yield
INVESTMENT ADVISORY AND SUB-ADVISORY AGREEMENTS-REVIEW AND RENEWAL (unaudited)
At a meeting of the Board of Trustees of AEGON/Transamerica Series Trust (“ATST”) held on December 4th, 2007, the Board reviewed and considered the renewal of the investment advisory agreement (the “Investment Advisory Agreement”) between MFS High Yield (the “Fund”) and Transamerica Fund Advisors, Inc. (“TFAI”), as well as the renewal of the investment sub-advisory agreement (the “Sub-Advisory Agreement”) of the Fund between TFAI and MFS Investment Management (the “Sub-Adviser”), to determine whether the agreements should be renewed for a six-month period. It was noted that this review was interim in nature to align all the Funds on the same calendar, and that the Funds’ advisory arrangements would be reviewed again in the first half of 2008.
Following their review and consideration, the Trustees determined that the renewal of the Investment Advisory Agreement and the Sub-Advisory Agreement would enable shareholders of the Fund to obtain high quality services at a cost that is appropriate, fair, and in the best interests of its shareholders. The Board, including the independent members of the Board, unanimously approved the renewal of the Investment Advisory Agreement and Sub-Advisory Agreement. In reaching their decision, the Trustees requested and obtained from TFAI and the Sub-Adviser such information as they deemed reasonably necessary to evaluate the agreements, including information about fees and performance of comparable funds managed by the Sub-Adviser. The Trustees also carefully considered information they had previously received from TFAI and the Sub-Adviser throughout the year as part of their regular oversight of the Fund, as well as comparative fee, expense, and performance information prepared by Lipper Inc. (“Lipper”), an independent provider of mutual fund performance, fee and expense information and profitability data prepared by management. In considering the proposed continuation of the Investment Advisory and Sub-Advisory Agreements, the Trustees evaluated a number of considerations that they believed, in light of the legal advice furnished to them by independent legal counsel and their own business judgment, to be relevant. They based their decisions on a variety of factors, including the following considerations, among others, although they did not identify any consideration or particular information that was controlling of their decisions:
The nature, extent and quality of the advisory services to be provided. The Board considered the nature and quality of the services provided by TFAI and the Sub-Adviser to the Fund in the past, as well as the services anticipated to be provided in the future. The Board concluded that TFAI and the Sub-Adviser are capable of providing high quality services to the Fund, as indicated by the nature and quality of services provided in the past by TFAI and the Sub-Adviser for this series and the experience, capability and integrity of TFAI’s senior management, the financial resources of TFAI and the Sub-Adviser, TFAI’s management oversight process and the professional qualifications of the portfolio management team of the Sub-Adviser. The Trustees determined that TFAI and the Sub-Adviser can provide investment and related services that are appropriate in scope and extent in light of the Fund’s operations, the competitive landscape of the investment company business and investor needs.
The investment performance of the Fund. The Board examined the short and longer-term performance of the Fund, including relative performance against a peer universe of comparable mutual funds as prepared by Lipper for various trailing periods ended June 30, 2007. The Board noted the strong near-term performance of the Fund, which was an improvement from the 5-year period. On the basis of the Board’s assessment of the nature, extent and quality of advisory services to be provided or procured by TFAI and the Sub-Adviser, the Board concluded that TFAI and the Sub-Adviser are capable of providing a level of investment performance that is appropriate in light of the Fund’s proposed investment objectives, policies and strategies and competitive with other similarly situated investment companies.
The cost of advisory services provided and the level of profitability. The Board reviewed profitability information of TFAI’s cost of procuring fund management services, as well as the costs of provision of administration, fund accounting and other services, to the Fund and to ATST as a whole by TFAI and its affiliates. The Board reviewed the management and sub-advisory fees for the Fund, which they noted were higher than the median for the comparable peer group and universe of funds. The Board noted that the fees were renegotiated in 2007 and were renegotiated again for 2008. Based on their review, the Trustees determined that the management fees of the Fund generally are appropriate in light of the services expected to be provided or procured, the management fees and the anticipated profitability of the relationship between the Fund, TFAI and its affiliates, and the Sub-Adviser. In making these observations and determinations, the Board reviewed, among other things, comparative information provided by Lipper.
Whether fee levels reflect economies of scale and the extent to which economies of scale would be realized as the Fund grows. In evaluating the extent to which the management fees payable under the Investment Advisory and Sub-Advisory Agreements reflect economies of scale or will permit economies of scale to be realized in the future, the Board noted that TFAI and the Sub-Adviser offer breakpoints which appropriately benefit investors by passing on economies of scale in the form of lower management fees as the level of assets grows. The Trustees also concluded that they will have the opportunity to periodically reexamine whether the Fund has achieved economies of scale, and the appropriateness of management fees payable to TFAI and fees paid to the Sub-Adviser, in the future.
Benefits (such as soft dollars) to TFAI, its affiliates, or the Sub-Adviser from their relationship with the Fund. The Board concluded that other benefits anticipated to be derived by TFAI, its affiliates, and the Sub-Adviser from their relationships with the Fund are expected to be reasonable and fair, and consistent with industry practice and the best interests of the Fund and its shareholders. The Trustees noted that TFAI would not realize soft dollar benefits from its relationship with the Fund, and that the Sub-Adviser’s soft dollar trading is consistent with applicable law, including best execution requirements in particular.
Other considerations. The Board determined that TFAI has made a substantial commitment to the recruitment and retention of high quality personnel, and maintains the financial, compliance and operational resources reasonably necessary to manage the Fund in a professional manner that is consistent with the best interests of the Fund and its shareholders. In this regard, the Trustees favorably considered the procedures and policies in place by TFAI to enforce compliance with applicable laws and regulations and oversee the portfolio management activities of the Sub-Adviser. The Trustees also determined that TFAI has made a significant entrepreneurial commitment to the management and success of the Fund, reflected by TFAI’s expense limitation and fee waiver arrangements with the Fund which may result in TFAI waiving a substantial amount of management fees for the benefit of shareholders.
21
MFS International Equity
MARKET ENVIRONMENT
As 2007 drew to a close, global financial markets were enmeshed in another period of volatility driven by the ongoing credit crisis and the uncertainty about the effect that the slowing of the U.S. economy could have on the global economies.
The crisis in the U.S. sub-prime market was in full force by year-end. The crisis erupted in the third quarter as rising interest rates spurred defaults on U.S. sub-prime loans. Fears of more bad loans, combined with the slowing in the U.S. housing market, sparked a global liquidity crunch. In response, central banks around the world injected billions of dollars to keep financial systems liquid and help ease investor worries.
Investor fears were heightened in November as the severity of the credit crisis became more apparent as did the toll it had wrought on banks’ balance sheets. Globally, banks were hit by losses from mortgage bets gone bad, and some of the world’s largest banks, such as Citigroup Inc. and UBS AG (“UBS”), agreed to capital infusions from sovereign wealth funds in the Middle East.
In mid-December several of the world’s central banks announced a joint plan to ease the liquidity squeeze in global markets by broadening the range of collateral against which banks can borrow. As part of the plan, the U.S. Federal Reserve Board introduced a monetary tool, the “term-auction facility,” and temporary swap lines with the European Central Bank and the Swiss National Bank.
Investor fears and the ensuing volatility have also been driven by the possibility of an impending recession in the United States and the effect such a drastic slowdown could have on the rest of the world. Exporting countries become especially concerned that a decline in U.S. consumer demand will cut into their own growth. In its annual report, the International Monetary Fund said that the risk of a severe global slowdown is stronger than at any time since the 2001 terror attacks in the United States. Recession concerns have been exacerbated by the high cost of oil, bad mortgage bets, and a glut of empty homes. Retail sales have stalled, corporate earnings likely have peaked, and consumer confidence is falling.
In line with slowing in the United States, we have begun to see signs that other developed markets have entered a slowing phase as the financial crisis spread to real economies. Housing demand is falling in the United Kingdom (“UK”), retail sales have slowed in the eurozone, and, globally, industrial production has retreated.
At the same time some measures of consumer inflation are being nudged upward in line with higher oil and food prices. These higher prices have created a conflict for central bankers, who also are confronting the pressures of slowing growth and financial market turmoil. Overall, expectations have risen that global monetary policies will remain on hold or loosen until the credit crunch passes. Meanwhile, central banks have assured markets that they are ready to inject liquidity should the banking system need it.
PERFORMANCE
For the year ended December 31, 2007, MFS International Equity, Initial Class returned 9.15%. By comparison its benchmark, the Morgan Stanley Capital International EAFE Index, returned 11.63%.
STRATEGY REVIEW
Security selection in the technology sector dampened performance relative to the benchmark over the reporting period. Several individual holdings within this sector were among the portfolio’s top detractors, including printers and computer peripherals maker Canon Inc. (Japan) and microchip and electronics manufacturer Samsung Electronics Co., Inc. (Korea). Not owning mobile phone maker Nokia Corporation (Finland), a strong-performing benchmark constituent also held back relative returns.
A combination of stock selection and our overweighting of the leisure sector also hurt results. Our overweighted position in gaming operator William Hill PLC (UK) was a drag on performance as the stock underperformed the benchmark.
A combination of an underweighted position and weak stock selection in the special products and services sector held back results within the portfolio. Not holding electronics and electrical engineering company Siemens AG detracted from relative performance.
A combination of an underweighted position and stock selection in the basic materials sector also hurt performance relative to the benchmark. Our decision not to own strong-performing mining operator Rio Tinto Group (Australia) hurt results.
Elsewhere, investment management and banking firm UBS (Switzerland) and banking firm Credit Agricole S.A. (France) were detractors from the portfolio’s relative results. The holdings of pharmaceutical and diagnostic company Roche Holding Ltd. (Switzerland) and re-insurer Swiss Reinsurance Company (Switzerland) were top detractors.
During the reporting period, currency exposure was a detractor from the portfolio’s relative performance. All of MFS’ investment decisions are driven by the fundamentals of each individual opportunity and, as such, it is common for our funds to have different currency exposure than the benchmark.
Underweighting the financial services sector was the primary contributor to performance relative to the portfolio’s benchmark. Key factors in positive relative performance within this sector were our holdings of wealth management firm Julius Baer Holding Ltd. (Switzerland) and our decision not to hold poor-performing financial services firms The Royal Bank of Scotland Group plc (UK) and Mitsubishi UFJ Financial Group, Inc. (Japan).
Overweighting the consumer staples sector was another bright spot during the period. Within this sector, global food company Nestle S.A. (Switzerland) and household products manufacturer Reckitt Benckiser plc (U.K.) were among the portfolio’s top contributors.
Stock selection in the retailing sector also helped, although no individual stocks in this sector were top contributors to relative results over the period.
Security selection in the health care sector benefited relative performance, where shares of health care products maker Bayer AG (Germany) greatly outpaced the return of the portfolio’s benchmark.
In other sectors, power and gas company E.ON AG (Germany), electrical distribution equipment manufacturer Schneider
AEGON/Transamerica Series Trust | | Annual Report 2007 |
1
Electric SA (France), video game console maker Nintendo Co., Ltd. (Japan), and industrial and medical gases producer The Linde Group (Germany) all helped performance over the period.
David R. Mannheim
Marcus L. Smith
Co-Portfolio Managers
MFS Investment Management
2
MFS International Equity
(unaudited)

Average Annual Total Return for Periods Ended 12/31/2007
| | | | | | | | From | | Inception | |
| | 1 Year | | 5 Years | | 10 Years | | Inception | | Date | |
| | | | | | | | | | | |
Initial Class | | 9.15 | % | 16.78 | % | 4.62 | % | 4.88 | % | 1/2/97 | |
MSCI EAFE (USD)(1) | | 11.63 | % | 22.08 | % | 9.04 | % | 8.39 | % | 1/2/97 | |
| | | | | | | | | | | |
Service Class | | 8.87 | % | — | % | — | % | 18.23 | % | 5/1/03 | |
NOTES
(1) The Morgan Stanley Capital International-Europe, Asia, and Far East (MSCI-EAFE) Index is a widely recognized unmanaged index used as a general measure of market performance. Calculations assume dividends and capital gains are reinvested and do not include any managerial expenses. From inception calculation is based on life of Initial Class shares.
The performance data presented represents past performance, future results may vary. The portfolio’s investment return and net asset value will fluctuate. Past performance does not guarantee future results. Investor’s units when redeemed, may be worth more or less than their original cost.
Current performance may be lower or higher than performance quoted. Please visit your insurance company’s website for contract or policy level standardized total returns current to the most recent month end. Portfolio performance is net of investment fees and fund expenses, but not product charges, which, if included, would significantly lower the performance quoted.
This material must be preceded or accompanied by a current prospectus, which includes specific contents regarding the investment objectives, explanation of share classes and policies of this portfolio.
International investing involves special risks including fluctuations, political instability and different financial accounting standards.
3
MFS International Equity
UNDERSTANDING YOUR FUNDS EXPENSES
(unaudited)
SHAREHOLDER EXPENSES
Fund shareholders may incur ongoing costs, including management and advisory fees, distribution and service fees, and other fund expenses.
The following Example is intended to help you understand your ongoing costs (in dollars and cents) of investing in the Fund and to compare these costs with the ongoing costs of investing in other funds.
The Example is based on an investment of $1,000 invested at July 1, 2007 and held for the entire period until December 31, 2007.
ACTUAL EXPENSES
The first line in the table below provides information about actual account values and actual expenses. You may use the information in this line, together with the amount you invested, to estimate the expenses that you paid over the period. Simply divide your account value by $1,000 (for example, an $8,600 account value divided by $1,000 = 8.6), then multiply the result by the number in the first line of your Fund under the heading entitled “Expenses Paid During Period” to estimate the expenses you paid on your account during this period.
HYPOTHETICAL EXAMPLE FOR COMPARISON PURPOSES
The second line in the table below provides information about hypothetical account values and hypothetical expenses based on the Fund’s actual expense ratio and an assumed rate of return of 5% per year before expenses, which is not the Fund’s actual return. The hypothetical account values and expenses may not be used to estimate the actual ending account balance or expenses you paid for the period. You may use this information to compare the ongoing costs of investing in your Fund and other funds. To do so, compare this 5% hypothetical example with the 5% hypothetical examples that appear in the shareholder reports of the other funds.
Please note that the expenses shown in the table are meant to highlight your ongoing costs only and do not reflect any transactional costs, such as sales charges, redemption fees, brokerage commissions paid on purchases and sales of fund shares. Therefore, the second line under the Fund in the table is useful in comparing ongoing costs only, and will not help you determine the relative total costs of owning different funds. If any of these transaction costs were included, your costs would be higher. The expenses shown in the table do not reflect any fees that may be charged to you by brokers, financial intermediaries or other financial institutions.
| | Beginning
Account
Value | | Ending
Account
Value | | Annualized
Expense
Ratio | | Expenses
Paid During
Period (a) | |
| | | | | | | | | |
Initial Class | | | | | | | | | |
Actual | | $ | 1,000.00 | | $ | 999.81 | | 1.05 | % | $ | 5.29 | |
Hypothetical (b) | | 1,000.00 | | 1,019.91 | | 1.05 | | 5.35 | |
| | | | | | | | | |
Service Class | | | | | | | | | |
Actual | | 1,000.00 | | 998.54 | | 1.30 | | 6.55 | |
Hypothetical (b) | | 1,000.00 | | 1,018.65 | | 1.30 | | 6.61 | |
| | | | | | | | | | | | |
(a) | | Expenses are calculated using the Fund’s annualized expense ratio (as disclosed in the table), multiplied by the average account value for the period, multiplied by the number of days in the period (184 days), and divided by the number of days in the year (365 days). |
| | |
(b) | | 5% return per year before expenses. |
GRAPHICAL PRESENTATION OF SCHEDULE OF INVESTMENTS
By Region
At December 31, 2007
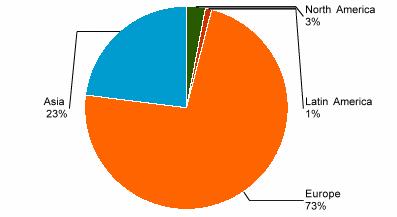
This chart shows the percentage breakdown by region of the Fund’s total investment securities.
4
MFS International Equity
SCHEDULE OF INVESTMENTS
At December 31, 2007
(all amounts except share amounts in thousands)
| | Shares | | Value | |
COMMON STOCKS (99.8%) | | | | | |
Australia (0.4%) | | | | | |
QBE Insurance Group, Ltd. | | 49,310 | | $ | 1,444 | |
Austria (1.7%) | | | | | |
Erste Bank DER Oesterreichischen Sparkassen AG | | 82,920 | | 5,855 | |
Bermuda (0.7%) | | | | | |
LI & Fung, Ltd. | | 560,000 | | 2,262 | |
Canada (0.9%) | | | | | |
Canadian National Railway Co. ^ | | 65,070 | | 3,054 | |
Czech Republic (0.8%) | | | | | |
Komercni Banka As | | 11,035 | | 2,624 | |
France (20.2%) | | | | | |
Air Liquide | | 43,340 | | 6,450 | |
AXA SA | | 173,780 | | 6,959 | |
Credit Agricole SA | | 98,440 | | 3,320 | |
Gaz De France | | 66,370 | | 3,882 | |
Legrand SA ^ | | 130,170 | | 4,444 | |
LVMH Moet Hennessy Louis Vuitton SA | | 92,670 | | 11,202 | |
Pernod-Ricard SA | | 26,646 | | 6,159 | |
Schneider Electric SA | | 71,160 | | 9,642 | |
Societe Television Francaise (1) | | 61,943 | | 1,657 | |
Suez SA | | 59,760 | | 4,069 | |
Total SA | | 102,660 | | 8,530 | |
Vivendi | | 58,950 | | 2,705 | |
Germany (10.4%) | | | | | |
Bayer AG | | 113,500 | | 10,380 | |
Bayerische Motoren Werke AG | | 63,700 | | 3,952 | |
E.ON AG | | 37,580 | | 7,989 | |
Linde AG | | 60,210 | | 7,978 | |
Merck KGAA | | 40,210 | | 5,200 | |
India (0.7%) | | | | | |
Satyam Computer Services, Ltd. ^ | | 89,030 | | 2,379 | |
Indonesia (0.1%) | | | | | |
Bank Central Asia TBK PT | | 698,500 | | 535 | |
Italy (1.5%) | | | | | |
Assicurazioni Generali SpA | | 41,491 | | 1,878 | |
Intesa Sanpaolo SpA | | 411,062 | | 3,235 | |
Japan (18.7%) | | | | | |
AEON Credit Service Co., Ltd. | | 124,500 | | 1,834 | |
Asahi Glass Co., Ltd. ^ | | 269,000 | | 3,558 | |
Bridgestone Corp. | | 135,900 | | 2,399 | |
Canon, Inc. | | 193,600 | | 8,860 | |
Fanuc, Ltd. | | 31,000 | | 3,005 | |
Hirose Electric Co., Ltd. | | 19,900 | | 2,284 | |
INPEX Holdings, Inc. | | 500 | | 5,426 | |
KAO Corp. | | 385,000 | | 11,574 | |
Nintendo Co., Ltd. | | 3,800 | | 2,231 | |
Nomura Holdings, Inc. | | 279,500 | | 4,683 | |
Omron Corp. | | 103,800 | | 2,444 | |
Ricoh Co., Ltd. | | 210,000 | | $ | 3,834 | |
Shin-Etsu Chemical Co., Ltd. | | 31,000 | | 1,928 | |
Shizuoka Bank, Ltd. (The) | | 156,000 | | 1,711 | |
Tokyo Gas Co., Ltd. | | 452,000 | | 2,112 | |
Toyota Motor Corp. | | 102,800 | | 5,475 | |
Yamato Holdings Co., Ltd. | | 37,000 | | 532 | |
Korea, Republic of (1.4%) | | | | | |
Samsung Electronics Co., Ltd. | | 8,032 | | 4,727 | |
Mexico (0.2%) | | | | | |
Grupo Modelo SAB de CV Series C, Class C | | 159,200 | | 751 | |
Netherlands (5.8%) | | | | | |
Heineken NV | | 101,290 | | 6,549 | |
Royal Dutch Shell PLC Class A | | 159,560 | | 6,705 | |
TNT NV | | 156,340 | | 6,457 | |
Singapore (1.5%) | | | | | |
Singapore Telecommunications, Ltd. | | 1,845,700 | | 5,129 | |
South Africa (0.3%) | | | | | |
MTN Group, Ltd. | | 63,300 | | 1,186 | |
Spain (0.5%) | | | | | |
Banco Bilbao Vizcaya Argentaria SA | | 69,710 | | 1,697 | |
Switzerland (15.7%) | | | | | |
Actelion, Ltd. ‡ | | 37,963 | | 1,734 | |
Givaudan SA | | 6,060 | | 5,849 | |
Julius Baer Holding AG | | 56,838 | | 4,664 | |
Nestle SA | | 34,794 | | 15,977 | |
Roche Holding AG | | 69,160 | | 11,955 | |
Swiss Reinsurance | | 78,290 | | 5,539 | |
UBS AG | | 172,711 | | 7,963 | |
Taiwan (0.7%) | | | | | |
Taiwan Semiconductor Manufacturing Co., Ltd. | | 249,280 | | 2,483 | |
United Kingdom (16.1%) | | | | | |
BG Group PLC | | 57,130 | | 1,308 | |
BHP Billiton PLC | | 80,120 | | 2,465 | |
Diageo PLC | | 349,220 | | 7,508 | |
GlaxoSmithKline PLC | | 344,820 | | 8,779 | |
HSBC Holdings PLC ‡ | | 141,060 | | 2,364 | |
Ladbrokes PLC | | 419,940 | | 2,702 | |
Reckitt Benckiser Group PLC ‡ | | 175,270 | | 10,167 | |
Smiths Group PLC | | 245,374 | | 4,948 | |
Tesco PLC | | 290,860 | | 2,763 | |
William Hill PLC | | 534,430 | | 5,580 | |
WPP Group PLC | | 510,180 | | 6,571 | |
United States (1.5%) | | | | | |
Synthes, Inc. | | 42,530 | | 5,287 | |
Total Common Stocks (cost $301,387) | | | | 341,481 | |
| | | | | |
Total Securities Lending Collateral (cost $8,161) (1) | | | | 8,161 | |
| | | | | |
Total Investment Securities (cost $309,548) # | | | | $ | 349,642 | |
The notes to the financial statements are an integral part of this report.
5
FORWARD FOREIGN CURRENCY CONTRACTS:
| | | | | | Amount in | | Net Unrealized | |
| | Bought | | Settlement | | U.S. Dollars | | Appreciation | |
Currency | | (Sold) | | Date | | Bought (Sold) | | (Depreciation) | |
Euro Dollar | | 192 | | 01/02/2008 | | $ | 279 | | $ | 2 | |
Japanese Yen | | 18,898 | | 01/07/2008 | | 173 | | (4 | ) |
Japanese Yen | | 23,555 | | 01/08/2008 | | 215 | | (3 | ) |
| | | | | | $ | 667 | | | $ | (5 | ) |
| | | | | | | | | | | | | |
(unaudited) | | Percentage of
Total Investments | | Value | |
INVESTMENTS BY INDUSTRY: | | | | | |
Chemicals | | 9.3 | % | $ | 32,584 | |
Pharmaceuticals | | 7.4 | % | 25,935 | |
Oil, Gas & Consumable Fuels | | 6.3 | % | 21,969 | |
Household Products | | 6.2 | % | 21,741 | |
Commercial Banks | | 6.1 | % | 21,342 | |
Beverages | | 6.0 | % | 20,967 | |
Capital Markets | | 5.0 | % | 17,310 | |
Food Products | | 4.6 | % | 15,977 | |
Insurance | | 4.5 | % | 15,819 | |
Electrical Equipment | | 4.0 | % | 14,086 | |
Office Electronics | | 3.6 | % | 12,694 | |
Textiles, Apparel & Luxury Goods | | 3.2 | % | 11,202 | |
Media | | 3.1 | % | 10,933 | |
Automobiles | | 2.7 | % | 9,427 | |
Hotels, Restaurants & Leisure | | 2.4 | % | 8,282 | |
Electric Utilities | | 2.3 | % | 7,989 | |
Semiconductors & Semiconductor Equipment | | 2.1 | % | 7,210 | |
Air Freight & Logistics | | 2.0 | % | 6,989 | |
Gas Utilities | | 1.7 | % | 5,993 | |
Health Care Equipment & Supplies | | 1.5 | % | 5,288 | |
Diversified Telecommunication Services | | 1.5 | % | 5,129 | |
Industrial Conglomerates | | 1.4 | % | 4,948 | |
Electronic Equipment & Instruments | | 1.4 | % | 4,727 | |
Energy Equipment & Services | | 1.2 | % | 4,069 | |
Building Products | | 1.0 | % | 3,558 | |
Road & Rail | | 0.9 | % | 3,054 | |
Machinery | | 0.9 | % | 3,005 | |
Food & Staples Retailing | | 0.8 | % | 2,763 | |
Metals & Mining | | 0.7 | % | 2,466 | |
Auto Components | | 0.7 | % | 2,399 | |
IT Services | | 0.7 | % | 2,379 | |
Trading Companies & Distributors | | 0.6 | % | 2,262 | |
| | | | | | |
The notes to the financial statements are an integral part of this report.
6
(unaudited) | | Percentage of
Total Investments | | Value | |
INVESTMENTS BY INDUSTRY (continued): | | | | | |
Software | | 0.6 | % | $ | 2,231 | |
Consumer Finance | | 0.5 | % | 1,834 | |
Biotechnology | | 0.5 | % | 1,734 | |
Wireless Telecommunication Services | | 0.3 | % | 1,186 | |
Investment Securities, at value | | 97.7 | % | 341,481 | |
Short-Term Investments | | 2.3 | % | 8,161 | |
Total Investments | | 100.0 | % | $ | 349,642 | |
NOTES TO SCHEDULE OF INVESTMENTS:
^ | | At December 31, 2007, all or a portion of this security is on loan (see Note 1). The value at December 31, 2007, of all securities on loan is $7,844. |
‡ | | Non-Income Producing. |
(1) | | Cash collateral for the Repurchase Agreements, valued at $2,958, that serves as collateral for securities lending, is invested in corporate bonds with interest rates and maturity dates ranging from 3.00% - 10.18% and 04/28/2008 - 12/01/2096, respectively. |
# | | Aggregate cost for federal income tax purposes is $310,763. Aggregate gross unrealized appreciation for all securities in which there is an excess of value over tax cost and aggregate gross unrealized depreciation for all securities in which there is an excess of tax cost over value were $48,739 and $9,860, respectively. Net unrealized appreciation for tax purposes is $38,879. |
The notes to the financial statements are an integral part of this report.
7
MFS International Equity
STATEMENT OF ASSETS AND LIABILITIES
At December 31, 2007
(all amounts except per share amounts in thousands)
Assets: | | | |
Investment securities, at value (cost: $ 309,548)
(including securities loaned of $ 7,844) | | $ | 349,642 | |
Cash | | 1 ,581 | |
Receivables: | | | |
Shares sold | | 74 | |
Interest | | 7 | |
Income from loaned securities | | 6 | |
Dividends | | 415 | |
Dividend reclaims | | 204 | |
Unrealized appreciation on forward foreign currency contracts | | 2 | |
| | 351,931 | |
Liabilities: | | | |
Investment securities purchased | | 786 | |
Accounts payable and accrued liabilities: | | | |
Shares redeemed | | 601 | |
Management and advisory fees | | 269 | |
Distribution and service fees | | 3 | |
Administration fees | | 6 | |
Payable for collateral for securities on loan | | 8,161 | |
Unrealized depreciation on forward foreign currency contracts | | 7 | |
Other | | 134 | |
| | 9 ,967 | |
Net Assets | | $ | 341,964 | |
| | | |
Net Assets Consist of: | | | |
Capital Stock ($.01 par value) | | $ | 385 | |
Additional paid-in capital | | 268,649 | |
Undistributed (accumulated) net investment income | | 3 ,528 | |
Undistributed (accumulated) net realized gain from investment securities and foreign currency transactions | | 29,307 | |
Net unrealized appreciation on investment securities | | 40,094 | |
Net unrealized appreciation on: | | | |
Translation of assets and liabilities denominated in foreign currencies | | 1 | |
Net Assets | | $ | 341,964 | |
Net Assets by Class: | | | |
Initial Class | | $ | 327,306 | |
Service Class | | 14,658 | |
Shares Outstanding: | | | |
Initial Class | | 36,847 | |
Service Class | | 1 ,666 | |
Net Asset Value and Offering Price Per Share: | | | |
Initial Class | | $ | 8.88 | |
Service Class | | 8.80 | |
STATEMENT OF OPERATIONS
For the year ended December 31, 2007
(all amounts in thousands)
Investment Income: | | | |
Dividends (net of withholding taxes on foreign dividends of $915) | | $ | 10,083 | |
Interest | | 106 | |
Income from loaned securities-net | | 280 | |
| | 10,469 | |
| | | |
Expenses: | | | |
Management and advisory fees | | 3,425 | |
Printing and shareholder reports | | 81 | |
Custody fees | | 275 | |
Administration fees | | 75 | |
Legal fees | | 8 | |
Audit fees | | 20 | |
Trustees fees | | 13 | |
Distribution and service fees: | | | |
Service Class | | 29 | |
Other | | 5 | |
Total expenses | | 3,931 | |
Net Investment Income | |
6,538
| |
| | | |
Net Realized Gain (Loss) from: | | | |
Investment securities (net of foreign capital gains tax of $38) | | 30,439 | |
Foreign currency transactions | | (2,090 | ) |
| | 28,349 | |
| | | |
Net Increase (Decrease) in Unrealized Appreciation (Depreciation) on: | | | |
Investment securities | | (2,545 | ) |
Translation of assets and liabilities denominated in foreign currencies | | (6 | ) |
| | (2,551 | ) |
| | | |
Net Realized and Unrealized Gain: | | 25,798 | |
Net Increase In Net Assets Resulting from Operations | | $ | 32,336 | |
The notes to the financial statements are an integral part of this report.
8
MFS International Equity
STATEMENT OF CHANGES IN NET ASSETS
For the years ended
(all amounts in thousands)
| | December 31,
2007 | | December 31,
2006 | |
Increase (Decrease) in Net Assets From: | | | | | |
Operations: | | | | | |
Net investment income | | $ | 6,538 | | $ | 2,529 | |
Net realized gain from investment securities and foreign currency transactions | | 28,349 | | 66,023 | |
Change in unrealized (depreciation) on investment securities and foreign currency translation | | (2,551 | ) | (4,311 | ) |
| | 32,336 | | 64,241 | |
Distributions to Shareholders: | | | | | |
From net investment income: | | | | | |
Initial Class | | (3,326 | ) | (4,405 | ) |
Service Class | | (106 | ) | (72 | ) |
| | (3,432 | ) | (4,477 | ) |
From net realized gains: | | | | | |
Initial Class | | (61,381 | ) | (16,939 | ) |
Service Class | | (2,229 | ) | (307 | ) |
| | (63,610 | ) | (17,246 | ) |
Capital Share Transactions: | | | | | |
Proceeds from shares sold: | | | | | |
Initial Class | | 56,188 | | 92,338 | |
Service Class | | 9,548 | | 5,876 | |
| | 65,736 | | 98,214 | |
Dividends and distributions reinvested: | | | | | |
Initial Class | | 64,706 | | 21,344 | |
Service Class | | 2,336 | | 379 | |
| | 67,042 | | 21,723 | |
Cost of shares redeemed: | | | | | |
Initial Class | | (114,698 | ) | (66,509 | ) |
Service Class | | (3,808 | ) | (2,658 | ) |
| | (118,506 | ) | (69,167 | ) |
| | 14,272 | | 50,770 | |
Net increase (decrease) in net assets | | (20,434 | ) | 93,288 | |
| | | | | |
Net Assets: | | | | | |
Beginning of year | | 362,398 | | 269,110 | |
End of year | | $ | 341,964 | | $ | 362,398 | |
Undistributed (Accumulated) Net Investment Income (Loss) | | $ | 3,528 | | $ | 1,572 | |
Share Activity: | | | | | |
Shares issued: | | | | | |
Initial Class | | 5,548 | | 9,726 | |
Service Class | | 971 | | 617 | |
| | 6,519 | | 10,343 | |
Shares issued-reinvested from distributions: | | | | | |
Initial Class | | 7,676 | | 2,328 | |
Service Class | | 279 | | 42 | |
| | 7,955 | | 2,370 | |
Shares redeemed: | | | | | |
Initial Class | | (11,690 | ) | (7,064 | ) |
Service Class | | (399 | ) | (286 | ) |
| | (12,089 | ) | (7,350 | ) |
Net increase (decrease) in shares outstanding: | | | | | |
Initial Class | | 1,534 | | 4,990 | |
Service Class | | 851 | | 373 | |
| | 2,385 | | 5,363 | |
The notes to the financial statements are an integral part of this report.
9
MFS International Equity
FINANCIAL HIGHLIGHTS
For a share outstanding throughout each period(a)
| | Initial Class | |
| | Year Ended December 31, | |
| | 2007 | | 2006 | | 2005 | | 2004 | | 2003 | |
Net Asset Value | | | | | | | | | | | |
Beginning of period | | $ | 10.03 | | $ | 8.75 | | $ | 8.61 | | $ | 7.53 | | $ | 6.01 | |
Investment Operations | | | | | | | | | | | |
Net investment income (loss) | | 0.18 | | 0.08 | | 0.11 | | 0.05 | | 0.04 | |
Net realized and unrealized gain (loss) | | 0.63 | | 1.88 | | 0.92 | | 1.03 | | 1.48 | |
Total operations | | 0.81 | | 1.96 | | 1.03 | | 1.08 | | 1.52 | |
Distributions | | | | | | | | | | | |
From net investment income | | (0.10 | ) | (0.14 | ) | (0.07 | ) | — | | — | |
From net realized gains | | (1.86 | ) | (0.54 | ) | (0.82 | ) | — | | — | |
Total distributions | | (1.96 | ) | (0.68 | ) | (0.89 | ) | — | | — | |
Net Asset Value | | | | | | | | | | | |
End of period(b) | | $ | 8.88 | | $ | 10.03 | | $ | 8.75 | | $ | 8.61 | | $ | 7.53 | |
Total Return(c),(d) | | 9.15 | % | 23.07 | % | 12.86 | % | 14.34 | % | 25.29 | % |
Net Assets End of Period (000’s) | | $ | 327,306 | | $ | 354,278 | | $ | 265,260 | | $ | 235,949 | | $ | 303,527 | |
Ratio and Supplemental Data | | | | | | | | | | | |
Expenses to average net assets(e) | | 1.05 | % | 1.07 | % | 1.10 | % | 1.09 | % | 1.14 | %(f) |
Net investment income (loss), to average
net assets(e) | | 1.77 | % | 0.79 | % | 1.30 | % | 0.70 | % | 0.58 | % |
Portfolio turnover rate(d) | | 35 | % | 138 | % | 103 | % | 125 | % | 219 | % |
For a share outstanding throughout each period(a)
| | Service Class | |
| | Year Ended December 31, | | May 1 to Dec | |
| | 2007 | | 2006 | | 2005 | | 2004 | | 31, 2003 | |
Net Asset Value | | | | | | | | | | | |
Beginning of period | | $ | 9.97 | | $ | 8.70 | | $ | 8.59 | | $ | 7.52 | | $ | 5.91 | |
Investment Operations | | | | | | | | | | | |
Net investment income (loss) | | 0.12 | | 0.05 | | 0.08 | | 0.03 | | (0.02 | ) |
Net realized and unrealized gain (loss) | | 0.66 | | 1.89 | | 0.91 | | 1.04 | | 1.63 | |
Total operations | | 0.78 | | 1.94 | | 0.99 | | 1.07 | | 1.61 | |
Distributions | | | | | | | | | | | |
From net investment income | | (0.09 | ) | (0.13 | ) | (0.06 | ) | — | | — | |
From net realized gains | | (1.86 | ) | (0.54 | ) | (0.82 | ) | — | | — | |
Total distributions | | (1.95 | ) | (0.67 | ) | (0.88 | ) | — | | — | |
Net Asset Value | | | | | | | | | | | |
End of period(b) | | $ | 8.80 | | $ | 9.97 | | $ | 8.70 | | $ | 8.59 | | $ | 7.52 | |
Total Return(c),(d) | | 8.87 | % | 22.92 | % | 12.42 | % | 14.23 | % | 27.24 | % |
Net Assets End of Period (000’s) | | $ | 14,658 | | $ | 8,120 | | $ | 3,850 | | $ | 2,215 | | $ | 650 | |
Ratio and Supplemental Data | | | | | | | | | | | |
Expenses to average net assets(e) | | 1.30 | % | 1.32 | % | 1.35 | % | 1.35 | % | 1.39 | % |
Net investment income (loss), to average
net assets(e) | | 1.27 | % | 0.55 | % | 0.97 | % | 0.40 | % | (0.51 | )% |
Portfolio turnover rate(d) | | 35 | % | 138 | % | 103 | % | 125 | % | 219 | % |
(a) | | Per share information is calculated based on average number of shares outstanding. |
(b) | | MFS International Equity (the “Fund”) share class commenced operations as follows: |
| | Initial Class - January 2, 1997 |
| | Service Class - May 1, 2003 |
(c) | | Total Return reflects all portfolio expenses and includes reinvestment of dividends and capital gains; it does not reflect the charges and deductions under the policies or annuity contracts. |
(d) | | Not annualized. |
(e) | | Annualized. |
(f) | | The impact of recaptured expenses on the Ratio of Expenses to Average Net Assets was 0.14% for the period ended December 31, 2003. |
The notes to the financial statements are an integral part of this report.
10
MFS International Equity
NOTES TO FINANCIAL STATEMENTS
At December 31, 2007
(all amounts in thousands)
NOTE 1. ORGANIZATION AND SIGNIFICANT ACCOUNTING POLICIES
AEGON/Transamerica Series Trust (“ATST”) is an open-end management investment company registered under the Investment Company Act of 1940, as amended (the “1940 Act”). ATST serves as a funding vehicle for variable life insurance, variable annuity and group annuity products. MFS International Equity (the “Fund”) is part of ATST.
In the normal course of business, the Fund enters into contracts that contain a variety of representations that provide general indemnifications. The Fund’s maximum exposure under these arrangements is unknown, as this would involve future claims that may be made against the Fund and/or its affiliates that have not yet occurred. However, based on experience, the Fund expects the risk of loss to be remote.
This report should be read in conjunction with the current Fund prospectus, which contains more complete information about the Fund.
In preparing the Fund’s financial statements in accordance with accounting principles generally accepted in the United States of America (“GAAP”), estimates or assumptions (which could differ from actual results) may be used that affect reported amounts and disclosures. The following is a summary of significant accounting policies followed by the Fund.
Multiple class operations, income and expenses: The Fund currently offers two classes of shares, an Initial Class and a Service Class. Income, non-class specific expenses and realized and unrealized gains and losses, are allocated daily to each class, based upon the value of shares outstanding method as permitted under Rule 1 8f-3 of the 1940 Act. Each class bears its own specific expenses as well as a portion of general, common expenses.
Security valuations: The Fund values its investments at the close of the New York Stock Exchange (“NYSE”), normally 4 p.m. ET, each day the NYSE is open for business. Fund investments are valued at the last sale price or closing price on the day of valuation taken from the primary exchange where the security is principally traded.
Securities traded in the over-the-counter market and listed securities for which no sale was reported on that date are valued at the last quoted bid price.
Debt securities are valued based on a price quotation or other equivalent indication of value supplied by an exchange, a pricing service or a major market maker; however, those that mature in sixty days or less are valued at amortized cost, which approximates market.
Investment company securities are valued at the net asset value of the underlying portfolio.
Foreign securities generally are valued based on quotations from the primary market in which they are traded. Because many foreign securities markets and exchanges close prior to the close of the NYSE, closing prices for foreign securities in those markets or on those exchanges do not reflect the events that occur after that close. If a significant market event impacting the value of a portfolio security (e.g., natural disaster, company announcement, market volatility) occurs subsequent to the close of trading in the security, but prior to the calculation of the Fund’s net asset value per share, market quotations for that security may be determined to be unreliable and, accordingly, not “readily available.” As a result, foreign equity securities held by the Fund may be valued at fair market value as determined in good faith by the Fund’s Administrative Valuation Committee, using guidelines adopted by the Board of Trustees.
Other securities for which quotations are not readily available are valued at fair market value as determined in good faith by the Fund’s Administrative Valuation Committee, using guidelines adopted by the Board of Trustees.
Cash: The Fund may leave cash overnight in its cash account with the custodian, State Street Bank & Trust Company (“State Street”). On July 2, 2007, State Street acquired the parent company of Investors Bank & Trust Company. State Street has been contracted on behalf of the Fund to invest the excess cash into a savings account, which at December 31, 2007 was paying an interest rate of 2.60%.
Repurchase agreements: The Fund is authorized to enter into repurchase agreements. The Fund, through its custodian, State Street, receives delivery of the underlying securities, the value of which at the time of purchase is required to be an amount equal to at least 100% of the resale price. The Fund will bear the risk of value fluctuations until the security can be sold and may encounter delays and incur costs in liquidating the security. In the event of bankruptcy or insolvency of the seller, delays and costs may be incurred.
Securities lending: The Fund may lend securities to qualified borrowers, with State Street acting as the Fund’s lending agent. The Fund earns negotiated lenders’ fees. The Fund receives cash and/or securities as collateral against the loaned securities. Cash collateral received is invested in short term, interest bearing securities. The Fund monitors the market value of securities loaned on a daily basis and requires collateral in an amount at least equal to the value of the securities loaned. Income from loaned securities earned by State Street for its services, shown in the Statement of Operations is net of fees, in the amount of $120.
The Fund has invested the cash collateral received from securities loaned in the following short-term, interest-bearing securities:
11
NOTES TO FINANCIAL STATEMENTS (continued)
At December 31, 2007
(all amounts in thousands)
NOTE 1. – (continued)
Abbey National PLC, Eurodollar Term, 5.00%, 1/7/2008 | | $ | 352 | |
ABN AMRO Bank NV, Eurodollar Term, 5.18%, 1/4/2008 | | 282 | |
Bank of Nova Scotia, Eurodollar Term, 4.96%, 1/22/2008 | | 247 | |
Barclays, Eurodollar Term, 5.00%, 2/12/2008 | | 493 | |
BNP Paribas, Eurodollar Term, 5.01%, 1/11/2008 | | 458 | |
Calyon, Eurodollar Term, 5.12%, 3/3/2008 | | 106 | |
Credit Suisse First Boston Corp., Repurchase Agreement, 4.60%, 1/2/2008 | | 916 | |
Dexia Group, Eurodollar Term, 4.82%, 1/3/2008 | | 352 | |
HBOS Halifax Bank of Scotland, Eurodollar Term, 5.15%, 1/2/2008 | | 176 | |
JPMorgan Chase & Co., Eurodollar Term, 5.15%, 2/12/2008 | | 176 | |
Lloyds TSB Bank, Eurodollar Term, 5.15%, 1/24/2008 | | 352 | |
Merrill Lynch & Co. (RPG), Repurchase Agreement, 4.60%, 1/2/2008 | | 528 | |
Morgan Stanley & Co. (Corp. Repo), Repurchase Agreement, 4.60%, 1/2/2008 | | 1,444 | |
Rabobank Nederland, Eurodollar Term, 5.08%, 1/10/2008 | | 423 | |
Reserve Primary Money Market Fund, 4.95% | | 376 | |
Royal Bank of Scotland, Eurodollar Term, 5.00%, 2/25/2008 | | 423 | |
Societe Generale, Eurodollar Term, 5.15%, 3/3/2008 | | 211 | |
Toronto Dominion Bank, Eurodollar Term, 5.05%, 1/10/2008 | | 423 | |
UBS AG, Eurodollar Term, 4.92%, 1/11/2008 | | 247 | |
Wells Fargo, Bank Note, 4.75%, 1/8/2008 | | 176 | |
| | | |
| | $ | 8,161 | |
Security transactions and investment income: Security transactions are recorded on the trade date. Security gains and losses are calculated on the first-in, first-out basis. Dividend income, if any, is recorded on the ex-dividend date or, in the case of foreign securities, as soon as the Fund is informed of the ex-dividend date. Interest income, including accretion of discounts and amortization of premiums, is recorded on the accrual basis commencing on the settlement date.
Foreign currency denominated investments: The accounting records of the Fund are maintained in U.S. dollars. Securities and other assets and liabilities denominated in foreign currencies are translated into U.S. dollars at the closing exchange rate each day. The cost of foreign securities is translated at the exchange rate in effect when the investment was acquired. The Fund combines fluctuations from currency exchange rates and fluctuations in value when computing net realized and unrealized gains or losses from investments.
Net foreign currency gains and losses resulting from changes in exchange rates include: 1) foreign currency fluctuations between trade date and settlement date of investment security transactions; 2) gains and losses on forward foreign currency contracts; and 3) the difference between the receivable amounts of interest and dividends recorded in the accounting records in U.S. dollars and the amounts actually received.
Foreign currency denominated assets may involve risks not typically associated with domestic transactions. These risks include revaluation of currencies, adverse fluctuations in foreign currency values and possible adverse political, social and economic developments, including those particular to a specific industry, country or region.
Foreign capital gains taxes: The Fund may be subject to taxes imposed by countries in which it invests, with respect to its investment in issuers existing or operating in such countries. Such taxes are generally based on income earned or repatriated and capital gains realized on the sale of such investments. The Fund accrues such taxes when the related income or capital gains are earned. Some countries require governmental approval for the repatriation of investment income, capital or the proceeds of sales earned by foreign investors. In addition, if there is deterioration in a country’s balance of payments or for other reasons, a country may impose temporary restrictions on foreign capital remittances abroad.
The Fund’s investments in Thailand are subject to a 15% governmental capital gains tax. Such taxes are due upon sale of individual securities. The Fund accrues for taxes on the capital gains throughout the holding period of the underlying securities.
Forward foreign currency contracts: The Fund may enter into forward foreign currency contracts to hedge against exchange rate risk arising from investments in securities denominated in foreign currencies. Contracts are valued at the contractual forward rate and are marked to market daily, with the change in value recorded as an unrealized gain or loss. When the contracts are settled a realized gain or loss is incurred. Risks may arise from changes in market value of the underlying currencies and from the possible inability of counterparties to meet the terms of their contracts.
Open forward foreign currency contracts at December 31, 2007 are listed in the Schedule of Investments.
Dividend distributions: Dividends and capital gains distributions are typically declared and reinvested annually and are generally paid and reinvested on the business day following the ex-date.
NOTE 2. RELATED PARTY TRANSACTIONS
ATST serves as a funding vehicle for certain affiliated asset allocation portfolios and certain affiliated separate accounts of Western Reserve Life Assurance Co. of Ohio, Transamerica Life Insurance Company, Transamerica Financial Life Insurance Company, Inc., Monumental Life Insurance Company and Transamerica Occidental Life Insurance Company.
Transamerica Fund Advisors, Inc. (“TFAI”) is the Fund’s investment adviser. Transamerica Fund Services, Inc. (“TFS”) is the Fund’s administrator and transfer agent. Prior to May 1, 2007, AFSG Securities Corp. (“AFSG”), was the Fund’s distributor. Transamerica Capital Inc. (“TCI”) is now the Fund’s distributor. TFAI, TFS, AFSG, and TCI are affiliates of AEGON NV, a Netherlands corporation.
Certain officer and trustees of the Fund are also officers and/or directors of TFAI, TFS, and TCI.
12
NOTES TO FINANCIAL STATEMENTS (continued)
At December 31, 2007
(all amounts in thousands)
NOTE 2. – (continued)
Investment advisory fee: The Fund pays management fees to TFAI based on average daily net assets (“ANA”) at the following breakpoints:
0.925% of the first $250 million of ANA
0.90% of the next $250 million of ANA
0.85% of the next $500 million of ANA
0.80% of ANA over $1 billion
TFAI has contractually agreed to waive its advisory fee and will reimburse the Fund to the extent that operating expenses, excluding 12b-1 fees, exceed the following stated annual limit:
1.125% Expense Limit
If total Fund expenses fall below the annual expense limitation agreement agreed to by the adviser within the succeeding three years, the Fund may be required to pay the adviser a portion or all of the waived advisory fees.
There were no amounts recaptured during the year ended December 31, 2007. There are no amounts available for recapture at December 31, 2007.
Distribution and service fees: ATST entered into a Distribution Agreement with AFSG dated January 1, 1997, as amended. On May 1, 2007, the Distribution Agreement was amended to replace AFSG with TCI as the Fund’s distributor. The Fund has also adopted a distribution plan (“Distribution Plan”) pursuant to Rule 12b-1 under the 1940 Act.
Under the Distribution Plan for the Initial Class shares, TCI, on behalf of the Fund, is authorized to pay various service providers, as direct payment for expenses incurred in connection with distribution of the Fund’s shares, amounts equal to actual expenses associated with distributing the shares.
The Distribution Plan for the Service Class shares requires ATST to pay distribution fees to TCI as compensation for its activities, not as reimbursement for specific expenses. The fee on the Service Class is paid to the insurance companies for providing services and account maintenance for their policyholders who invest in the variable insurance products which invest in the Service Class shares.
The Fund is authorized under the Distribution Plan to pay fees on each class up to the following limits:
Initial Class | | 0.15% |
Service Class | | 0.25% |
TCI has determined that it will not seek payment by the Fund of the distribution expenses incurred with respect to the Initial Class shares before April 30, 2009. Prior to TCI seeking reimbursement of future expenses, policy and contract owners will be notified in advance. The Fund will pay fees relating to Service Class shares.
Administrative services: The Fund has entered into an agreement with TFS for financial and legal fund administration services. The Fund pays TFS an annual fee of 0.02% of ANA. The Legal fees on the Statement of Operations are for fees paid to external legal counsel.
Deferred compensation plan: Each eligible independent Fund Trustee may elect participation in a non-qualified deferred compensation plan (“the Plan”). Under the Plan, such Trustees may defer payment of all or a portion of their total fees earned as a Fund Trustee. Each Trustee who is a participant in the Plan may elect that the earnings, losses or gains credited to his or her deferred fee amounts be determined based on a deemed investment in any series of Transamerica IDEX Mutual Funds. The right of a participant to receive a distribution from the Plan of the deferred fees is an unsecured claim against the general assets of all series of Transamerica IDEX Mutual Funds. The pro rata liability to the Fund of all deferred fees in the Plan amounted, as of December 31, 2007, to $15. Amounts deferred under the Plan are unfunded against the general assets of ATST.
Retirement plan: Under a retirement plan (the “Emeritus Plan”) available to the Independent Trustees, each Independent Trustee is deemed to have elected to serve as Trustee Emeritus of ATST upon his or her termination of service, other than removal for cause, and is entitled to 50% of the trustee’s current retainer for a maximum period of five years determined by his or her years of service as a Trustee.
Such amounts shall be accrued by ATST on a pro rata basis allocable to each series of ATST fund based on the relative assets of the series. If retainers increase in the future, past accruals (and credits) will be adjusted upward so that 50% of the Trustee’s current retainer is accrued and credited at all times. Upon death, disability or termination of service, other than removal for cause, amounts deferred become payable to a Trustee Emeritus (or his/her beneficiary). Upon the commencement of service as Trustee Emeritus, compensation will be paid on a quarterly basis during the time period that the Trustee Emeritus is allowed to serve as such.
Amounts accrued under the Emeritus Plan are unsecured claims against the general assets of ATST. For the year ended December 31, 2007, the amount related to the Emeritus Plan was $13. As of December 31, 2007, the Fund has not made any payments related to the Emeritus Plan.
The Emeritus Plan was terminated effective October 30, 2007. Upon the termination, the Fund shall continue to pay any remaining benefits in accordance with the Plan, but no further compensation shall accrue under the Plan.
13
NOTES TO FINANCIAL STATEMENTS (continued)
At December 31, 2007
(all amounts in thousands)
NOTE 3. INVESTMENT TRANSACTIONS
The cost of securities purchased and proceeds from securities sold (excluding short-term securities) for the year ended December 31, 2007 were as follows:
Purchases of securities: | | | |
Long-term | | $ | 129,701 | |
U.S. Government | | — | |
| | | |
Proceeds from maturities and sales of securities: | | | |
Long-term | | 169,049 | |
U.S. Government | | — | |
| | | | |
NOTE 4. FEDERAL INCOME TAX MATTERS
The Fund has not made any provision for federal income or excise taxes due to its policy to distribute all of its taxable income and capital gains to its shareholders and otherwise qualify as a regulated investment company under Subchapter M of the Internal Revenue Code. Income and capital gain distributions are determined in accordance with income tax regulations, which may differ from GAAP. These differences are primarily due to differing treatment for items including, but not limited to, wash sales, foreign currency transactions, passive foreign investment companies and post-October loss deferrals.
Therefore, distributions determined in accordance with tax regulations may differ significantly in amount or character from net investment income and realized gains for financial reporting purposes. Financial reporting records are adjusted for permanent book/tax differences to reflect tax character. Financial records are not adjusted for temporary differences. These reclassifications are as follows:
Additional paid-in capital | | $ | — | |
Undistributed (accumulated) net investment income (loss) | | $ | (1,150 | ) |
Undistributed (accumulated) net realized gain (loss) from investment securities | | $ | 1,150 | |
The tax character of distributions paid may differ from the character of distributions shown in the Statements of Changes in Net Assets due to short-term gains being treated as ordinary income for tax purposes. The tax character of distributions paid during 2006 and 2007 was as follows:
2006 Distributions paid from: | | | |
Ordinary Income | | $ | 4,839 | |
Long-term Capital Gain | | 16,884 | |
| | | |
2007 Distributions paid from: | | | |
Ordinary Income | | 23,742 | |
Long-term Capital Gain | | 43,300 | |
| | | | |
The tax basis components of distributable earnings as of December 31, 2007 are as follows:
Undistributed Ordinary Income | | $ | 13,469 | |
Undistributed Long-term Capital Gain | | $ | 20,605 | |
Capital Loss Carryforward | | $ | — | |
Post October Capital Loss Deferral | | $ | — | |
Post October Currency Loss Deferral | | $ | (22 | ) |
Net Unrealized Appreciation (Depreciation)* | | $ | 38,878 | |
*The amount includes unrealized appreciation (depreciation) from foreign currency.
NOTE 5. REGULATORY PROCEEDINGS
There continues to be significant federal and state regulatory activity relating to financial services companies, particularly mutual fund companies and their investment advisers. As part of an ongoing investigation regarding potential market timing, recordkeeping and trading compliance issues and matters affecting the Fund’s investment adviser, TFAI, and certain affiliates and former employees of TFAI, the SEC staff has indicated that it is likely to take some action against TFAI and certain of its affiliates at the conclusion of the investigation. The potential timing and the scope of any such action is difficult to predict. Although the impact of any action brought against TFAI and/or its affiliates is difficult to assess at the present time, the Fund currently believes that the likelihood that any such action will have a material adverse impact is remote. It is important to note that the Fund is not aware of any allegation of wrongdoing against it and its Board at the time this annual report is printed. Although it is not anticipated that these developments will have an adverse impact on the Fund, there can be no assurance at this time. TFAI and its affiliates are actively working with the SEC in regard to this matter; however, the exact resolution cannot be determined at this time. TFAI will take such actions that it deems necessary or appropriate to continue providing management services to the Fund and to bring all matters to an appropriate conclusion.
TFAI and/or its affiliates, and not the Fund, will bear the costs regarding these regulatory matters.
NOTE 6. RECENTLY ISSUED ACCOUNTING PRONOUNCEMENTS
In July 2006, the Financial Accounting Standards Board (“FASB”) released FASB Interpretation No. 48 “Accounting for Uncertainty in Income Taxes” (“FIN 48”), an interpretation of FASB Statement No. 109. FIN 48 provides guidance for how uncertain tax positions should be recognized, measured, presented and disclosed in the financial statements. FIN 48 requires the accounting and disclosure of tax positions taken or expected to be taken in the course of preparing the Fund’s tax returns to determine whether the tax positions are “more-likely-than-not” of being sustained by the applicable tax authority. Tax positions not deemed to meet the more-likely-than-not threshold would be recorded as a tax benefit or expense in the current year.
14
NOTES TO FINANCIAL STATEMENTS (continued)
At December 31, 2007
(all amounts in thousands)
NOTE 6. – (continued)
Adoption of FIN 48 is effective during the first required financial reporting period for fiscal years beginning after December 15, 2006. Management adopted FIN 48 on June 29, 2007.
Implementation of FIN 48 requires Management of the Fund to analyze all open tax years, as defined by the Statute of Limitations, for all major jurisdictions, which includes federal and certain states. Open tax years are those that are open for exam by taxing authorities (i.e., the last 4 tax year ends and the interim tax period since then). The Fund has no examinations in progress and none are expected at this time.
Management of the Fund has reviewed all open tax years and major jurisdictions and concluded the adoption of FIN 48 resulted in no impact to the Fund’s net assets or results of operations. There is no tax liability resulting from unrecognized tax benefits relating to uncertain income tax positions taken or expected to be taken in future tax returns. The Fund is also not aware of any tax positions for which it is reasonably possible that the total amounts of unrecognized tax benefits will significantly change in the next 12 months.
In September 2006, FASB issued its new Standard No. 157, “Fair Value Measurements” (“FAS 157”). FAS 157 is designed to unify guidance for the measurement of fair value of all types of assets, including financial instruments, and certain liabilities, throughout a number of accounting standards. FAS 157 also establishes a hierarchy for measuring fair value in generally accepted accounting principles and expands financial statement disclosures about fair value measurements that are relevant to mutual funds. FAS 157 is effective for financial statements issued for fiscal years beginning after November 15, 2007, and earlier application is permitted.
As of December 31, 2007, Management does not expect the adoption of FAS 157 to impact the amounts reported in the financial statements, however, additional disclosures will be required about the inputs used to develop the measurements of fair value and the effect of certain of the measurements reported in the statement of operations for a fiscal period.
NOTE 7. SUBSEQUENT EVENT
Effective January 1, 2008, TFAI changed its name to Transamerica Asset Management, Inc.
Effective May 1, 2008, AEGON/Transamerica Series Trust will change its name to Transamerica Series Trust. At that time, the Fund will also change its name to Transamerica MFS International Equity VP.
15
Report of Independent Registered Certified Public Accounting Firm
To the Board of Trustees and Shareholders of
MFS International Equity:
In our opinion, the accompanying statement of assets and liabilities, including the schedule of investments, and the related statements of operations and of changes in net assets and the financial highlights present fairly, in all material respects, the financial position of MFS International Equity (the “Fund”) (one of the portfolios constituting AEGON/Transamerica Series Trust) at December 31, 2007, the results of its operations for the year then ended, the changes in its net assets for each of the two years in the period then ended and the financial highlights for each of the periods presented, in conformity with accounting principles generally accepted in the United States of America. These financial statements and financial highlights (hereafter referred to as “financial statements”) are the responsibility of the Fund’s management; our responsibility is to express an opinion on these financial statements based on our audits. We conducted our audits of these financial statements in accordance with the standards of the Public Company Accounting Oversight Board (United States). Those standards require that we plan and perform the audit to obtain reasonable assurance about whether the financial statements are free of material misstatement. An audit includes examining, on a test basis, evidence supporting the amounts and disclosures in the financial statements, assessing the accounting principles used and significant estimates made by management, and evaluating the overall financial statement presentation. We believe that our audits, which included confirmation of securities at December 31, 2007 by correspondence with the custodian and brokers, provide a reasonable basis for our opinion.

Tampa, Florida
February 29, 2008
16
MFS International Equity
SUPPLEMENTAL TAX INFORMATION (unaudited)
(all amounts in thousands)
For tax purposes, the Fund has made a Long-Term Capital Gain Designation of $43,300 for the year ended December 31, 2007.
RESULTS OF SHAREHOLDER PROXY (unaudited)
At a special meeting of shareholders held on October 30, 2007, the results of the Proposals were as follows:
Proposal 1: To elect a new Board:
Proposed
Trustee | | For | | Against | | Abstentions/Broker Non-
Votes | |
John K. Carter | | 2,274,998,840.817 | | 57,804,698.755 | | 35,433.883 | |
| | | | | | | |
Leo J. Hill | | 2,277,212,702.754 | | 55,590,836.819 | | 35,433.883 | |
| | | | | | | |
Neal M. Jewell | | 2,266,793,295.663 | | 66,010,243.909 | | 35,433.883 | |
| | | | | | | |
Russell A. Kimball, Jr. | | 2,274,825,235.835 | | 57,978,303.737 | | 35,433.883 | |
| | | | | | | |
Eugene M. Mannella | | 2,274,623,165.033 | | 58,180,374.539 | | 35,433.883 | |
| | | | | | | |
Norm R. Nielsen | | 2,275,050,055.885 | | 57,753,483.687 | | 35,433.883 | |
| | | | | | | |
Joyce Galpern Norden | | 2,270,278,122.250 | | 62,525,417.323 | | 35,433.883 | |
| | | | | | | |
Patricia L. Sawyer | | 2,275,737,737.456 | | 57,065,802.116 | | 35,433.883 | |
| | | | | | | |
John W. Waechter | | 2,276,615,120.140 | | 56,188,419.433 | | 35,433.883 | |
Proposal 2: To approve an amendment to the Agreement and Declaration of Trust:
| | | | Abstentions/Broker Non- | |
For | | Against | | Votes | |
2,182,022,669.110 | | 77,590,048.544 | | 73,226,255.801 | |
17
MFS International Equity
INVESTMENT ADVISORY AND SUB-ADVISORY AGREEMENTS-REVIEW AND RENEWAL (unaudited)
At a meeting of the Board of Trustees of AEGON/Transamerica Series Trust (“ATST”) held on December 4th, 2007, the Board reviewed and considered the renewal of the investment advisory agreement (the “Investment Advisory Agreement”) between MFS International Equity (the “Fund”) and Transamerica Fund Advisors, Inc. (“TFAI”), as well as the renewal of the investment sub-advisory agreement (the “Sub-Advisory Agreement”) of the Fund between TFAI and MFS Investment Management (the “Sub-Adviser”), to determine whether the agreements should be renewed for a six-month period. It was noted that this review was interim in nature to align all the Funds on the same calendar, and that the Funds’ advisory arrangements would be reviewed again in the first half of 2008.
Following their review and consideration, the Trustees determined that the renewal of the Investment Advisory Agreement and the Sub- Advisory Agreement would enable shareholders of the Fund to obtain high quality services at a cost that is appropriate, fair, and in the best interests of its shareholders. The Board, including the independent members of the Board, unanimously approved the renewal of the Investment Advisory Agreement and Sub-Advisory Agreement. In reaching their decision, the Trustees requested and obtained from TFAI and the Sub-Adviser such information as they deemed reasonably necessary to evaluate the agreements, including information about fees and performance of comparable funds managed by the Sub-Adviser. The Trustees also carefully considered information they had previously received from TFAI and the Sub-Adviser throughout the year as part of their regular oversight of the Fund, as well as comparative fee, expense, and performance information prepared by Lipper Inc. (“Lipper”), an independent provider of mutual fund performance, fee and expense information and profitability data prepared by management. In considering the proposed continuation of the Investment Advisory and Sub-Advisory Agreements, the Trustees evaluated a number of considerations that they believed, in light of the legal advice furnished to them by independent legal counsel and their own business judgment, to be relevant. They based their decisions on a variety of factors, including the following considerations, among others, although they did not identify any consideration or particular information that was controlling of their decisions:
The nature, extent and quality of the advisory services to be provided. The Board considered the nature and quality of the services provided by TFAI and the Sub-Adviser to the Fund in the past, as well as the services anticipated to be provided in the future. The Board concluded that TFAI and the Sub-Adviser are capable of providing high quality services to the Fund, as indicated by the nature and quality of services provided in the past by TFAI and the Sub-Adviser for this series and the experience, capability and integrity of TFAI’s senior management, the financial resources of TFAI and the Sub-Adviser, TFAI’s management oversight process and the professional qualifications of the portfolio management team of the Sub-Adviser. The Trustees determined that TFAI and the Sub-Adviser can provide investment and related services that are appropriate in scope and extent in light of the Fund’s operations, the competitive landscape of the investment company business and investor needs.
The investment performance of the Fund. The Board examined the short and longer-term performance of the Fund, including relative performance against a peer universe of comparable mutual funds as prepared by Lipper for various trailing periods ended June 30, 2007. The Board observed that both short and longer-term performance was below median, however the Board noted longer-term performance was attributable to a former manager and the MFS retail mutual fund managed in this style has a strong long-term track record and was a top performer in 2006. On the basis of the Board’s assessment of the nature, extent and quality of advisory services to be provided or procured by TFAI and the Sub-Adviser, the Board concluded that TFAI and the Sub-Adviser are capable of providing a level of investment performance that is appropriate in light of the Fund’s proposed investment objectives, policies and strategies and competitive with other similarly situated investment companies, but the Board noted that they would be monitoring performance closely.
The cost of advisory services provided and the level of profitability. The Board reviewed profitability information of TFAI’s cost of procuring fund management services, as well as the costs of provision of administration, fund accounting and other services, to the Fund and to ATST as a whole by TFAI and its affiliates. The Board reviewed the management and sub-advisory fees for the Fund. The Board noted that the fees were generally competitive with its peer group and universe of funds. Based on their review, the Trustees determined that the management fees of the Fund generally are appropriate in light of the services expected to be provided or procured, the management fees and the anticipated profitability of the relationship between the Fund, TFAI and its affiliates, and the Sub-Adviser. In making these observations and determinations, the Board reviewed, among other things, comparative information provided by Lipper.
Whether fee levels reflect economies of scale and the extent to which economies of scale would be realized as the Fund grows. In evaluating the extent to which the management fees payable under the Investment Advisory and Sub-Advisory Agreements reflect economies of scale or will permit economies of scale to be realized in the future, the Board noted that TFAI and the Sub-Adviser offer breakpoints which appropriately benefit investors by passing on economies of scale in the form of lower management fees as the level of assets grows. The Trustees also concluded that they will have the opportunity to periodically reexamine whether the Fund has achieved economies of scale, and the appropriateness of management fees payable to TFAI and fees paid to the Sub-Adviser, in the future.
Benefits (such as soft dollars) to TFAI, its affiliates, or the Sub-Adviser from their relationship with the Fund. The Board concluded that other benefits anticipated to be derived by TFAI, its affiliates, and the Sub-Adviser from their relationships with the Fund are expected to be reasonable and fair, and consistent with industry practice and the best interests of the Fund and its shareholders. The Trustees noted that TFAI would not realize soft dollar benefits from its relationship with the Fund and that the Sub-Adviser’s soft dollar trading is consistent with applicable law, including best execution requirements in particular.
Other considerations. The Board determined that TFAI has made a substantial commitment to the recruitment and retention of high quality personnel, and maintains the financial, compliance and operational resources reasonably necessary to manage the Fund in a professional manner that is consistent with the best interests of the Fund and its shareholders. In this regard, the Trustees favorably considered the procedures and policies in place by TFAI to enforce compliance with applicable laws and regulations and oversee the portfolio management activities of the Sub-Adviser. The Trustees also determined that TFAI has made a significant entrepreneurial commitment to the management and success of the Fund, reflected by TFAI’s expense limitation and fee waiver arrangements with the Fund which may result in TFAI waiving a substantial amount of management fees for the benefit of shareholders.
18
Munder Net50
MARKET ENVIRONMENT
The Standard and Poor’s 500 Composite Stock Index (“S&P 500”) posted a 5.49% total return for the year ended December 31, 2007. Technology stocks were strong performers during the period, as demonstrated by the Standard and Poor’s Goldman Sachs Technology Index (“S&P GSTI”), which was up 16.9% for the year. The Internet segment of the market also had a strong year with the Inter@ctive Week Internet Index (“IIX”) up 14.72% and the Morgan Stanley Internet Index up 33.7% for the year.
As the economy slowed, the best performers in the information technology sector were large-cap stocks, which outperformed smaller-cap technology stocks for the year.
PERFORMANCE
For the year ended December 31, 2007, Munder Net50, Initial Class, returned 17.04%. By comparison, its primary and secondary benchmarks, the S&P 500 and the IIX, returned 5.49% and 14.72%, respectively.
STRATEGY REVIEW
We invest in companies that we believe are positioned to benefit from the growth of the Internet. This encompasses pure play Internet companies, technology companies, and offline companies transitioning a key aspect of their business online.
The portfolio’s 17.04% return for the year ended December 31, 2007 exceeded the 14.9% median return for the Lipper universe of science and technology funds. The portfolio’s performance relative to this peer group was due in part to the strong performance of Internet stocks in general and stock selection in the portfolio.
Significant positive contributors to absolute performance during the year included: aQuantive, Inc., which was acquired by Microsoft Corporation; Apple Inc., which saw strong growth in its computer, media player and online music businesses; and priceline.com, Incorporated, which experienced significant growth in its European online travel business. The largest detractor from performance was Move, Inc., which experienced slower growth due to the difficult real estate environment in the U.S. We continue to hold the stock in the portfolio as we see significant value in the company’s assets, particularly its realtor.com web site.
The most significant foreign holdings in the portfolio during 2007 were Chinese Internet companies. We believe that the Chinese Internet sector may see strong growth in the coming years driven by user growth and broadband adoption. After the U.S., China has the second largest number of Internet users in the world. We believe that companies such as SINA Corporation and Sohu.com Inc. are well-positioned to benefit from China’s Internet growth.
Kenneth A. Smith, CFA
Jonathan R. Woodley
Mark A. Lebovitz, CFA
Co-Portfolio Managers
Munder Capital Management
AEGON/Transamerica Series Trust | | Annual Report 2007 |
1
Munder Net50
(unaudited)

Average Annual Total Return for Periods Ended 12/31/2007
| | 1 Year | | 5 Years | | From
Inception | | Inception
Date | |
| | | | | | | | | |
Initial Class (NAV) | | 17.04 | % | 19.44 | % | 3.14 | % | 5/3/99 | |
S&P 500(1) | | 5.49 | % | 12.83 | % | 2.76 | % | 5/3/99 | |
IIX(1) | | 14.72 | % | 22.60 | % | (4.16 | )% | 5/3/99 | |
| | | | | | | | | |
Service Class (NAV) | | 16.80 | % | — | % | 16.14 | % | 5/1/03 | |
NOTES
(1) The Standard and Poor’s 500 Composite Stock (S&P 500) Index and Inter@ctive Week Internet (IIX) Index are unmanaged indices used as a general measure of market performance. Calculations assume dividends and capital gains are reinvested and do not include any managerial expenses. From inception calculation is based on life of Initial Class shares.
The performance data presented represents past performance, future results may vary. The portfolio’s investment return and net asset value will fluctuate. Past performance does not guarantee future results. Investor’s units when redeemed, may be worth more or less than their original cost.
Current performance may be lower or higher than performance quoted. Please visit your insurance company’s website for contract or policy level standardized total returns current to the most recent month end. Portfolio performance is net of investment fees and fund expenses, but not product charges, which, if included, would significantly lower the performance quoted.
This material must be preceded or accompanied by a current prospectus, which includes specific contents regarding the investment objectives, explanation of share classes and policies of this portfolio.
Investing is technology stocks generally involves greater volatility and risks so an investment in the portfolio may not be appropriate for everyone.
2
Munder Net50
UNDERSTANDING YOUR FUND’S EXPENSES
(unaudited)
SHAREHOLDER EXPENSES
Fund shareholders may incur ongoing costs, including management and advisory fees, distribution and service fees, and other fund expenses.
The following Example is intended to help you understand your ongoing costs (in dollars and cents) of investing in the Fund and to compare these costs with the ongoing costs of investing in other funds.
The Example is based on an investment of $1,000 invested at July 1, 2007 and held for the entire period until December 31, 2007.
ACTUAL EXPENSES
The first line in the table below provides information about actual account values and actual expenses. You may use the information in this line, together with the amount you invested, to estimate the expenses that you paid over the period. Simply divide your account value by $1,000 (for example, an $8,600 account value divided by $1,000 = 8.6), then multiply the result by the number in the first line of your Fund under the heading entitled “Expenses Paid During Period” to estimate the expenses you paid on your account during this period. If your account is an IRA, your expenses could have included a $15 annual fee. The amount of any fee paid through your account would increase the estimate of expenses you paid during the period and decrease your ending account value.
HYPOTHETICAL EXAMPLE FOR COMPARISON PURPOSES
The second line in the table below provides information about hypothetical account values and hypothetical expenses based on the Fund’s actual expense ratio and an assumed rate of return of 5% per year before expenses, which is not the Fund’s actual return. The hypothetical account values and expenses may not be used to estimate the actual ending account balance or expenses you paid for the period. You may use this information to compare the ongoing costs of investing in your Fund and other funds. To do so, compare this 5% hypothetical example with the 5% hypothetical examples that appear in the shareholder reports of the other funds.
Please note that the expenses shown in the table are meant to highlight your ongoing costs only and do not reflect any transactional costs, such as sales charges, redemption fees, brokerage commissions paid on purchases and sales of fund shares. Therefore, the second line under the Fund in the table is useful in comparing ongoing costs only, and will not help you determine the relative total costs of owning different funds. If any of these transaction costs were included, your costs would be higher. The expenses shown in the table do not reflect any fees that may be charged to you by brokers, financial intermediaries or other financial institutions.
| | Beginning
Account
Value | | Ending
Account
Value | | Annualized
Expense
Ratio | | Expenses
Paid During
Period (a) | |
| | | | | | | | | |
Initial Class | | | | | | | | | |
Actual | | $ | 1,000.00 | | $ | 1,027.96 | | 0.99 | % | $ | 5.06 | |
Hypothetical (b) | | 1,000.00 | | 1,020.21 | | 0.99 | | 5.04 | |
| | | | | | | | | |
Service Class | | | | | | | | | |
Actual | | 1,000.00 | | 1,026.49 | | 1.24 | | 6.33 | |
Hypothetical (b) | | 1,000.00 | | 1,018.95 | | 1.24 | | 6.31 | |
| | | | | | | | | | | | |
(a) | | Expenses are calculated using the Fund’s annualized expense ratio (as disclosed in the table), multiplied by the average account value for the period, multiplied by the number of days in the period (184 days), and divided by the number of days in the year (365 days). |
| | |
(b) | | 5% return per year before expenses. |
GRAPHICAL PRESENTATION OF SCHEDULE OF INVESTMENTS
By Sector
At December 31, 2007
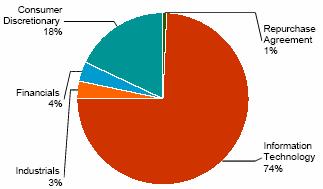
This chart shows the percentage breakdown by sector of the Fund’s total investment securities.
3
Munder Net50
SCHEDULE OF INVESTMENTS
At December 31, 2007
(all amount except share amounts in thousands)
| | Shares | | Value | |
COMMON STOCKS (99.5%) | | | | | |
Capital Markets (3.7%) | | | | | |
Optionsxpress Holdings, Inc. ^ | | 68,500 | | $ | 2,317 | |
TD Ameritrade Holding Corp. ‡ | | 109,600 | | 2,198 | |
Commercial Services & Supplies (3.4%) | | | | | |
51job, Inc. ‡^ | | 42,500 | | 766 | |
Monster Worldwide, Inc. ‡ | | 102,900 | | 3,334 | |
Communications Equipment (6.3%) | | | | | |
Cisco Systems, Inc. ‡ | | 92,100 | | 2,493 | |
Juniper Networks, Inc. ‡ | | 60,000 | | 1,992 | |
Qualcomm, Inc. | | 35,000 | | 1,377 | |
Research In Motion, Ltd. ‡ | | 16,000 | | 1,815 | |
Computers & Peripherals (6.1%) | | | | | |
Apple, Inc. ‡ | | 26,000 | | 5,150 | |
EMC Corp. ‡ | | 125,500 | | 2,326 | |
Internet & Catalog Retail (17.2%) | | | | | |
Amazon.Com, Inc. ‡ | | 52,500 | | 4,864 | |
Drugstore.Com, Inc. ‡ | | 540,000 | | 1,782 | |
Expedia, Inc. ‡ | | 94,669 | | 2,993 | |
FTD Group, Inc. | | 57,500 | | 741 | |
GSI Commerce, Inc. ‡^ | | 58,900 | | 1,148 | |
IAC/InterActiveCorp ‡ | | 139,000 | | 3,742 | |
NetFlix, Inc. ‡^ | | 59,500 | | 1,584 | |
PetMed Express, Inc. ‡^ | | 175,500 | | 2,123 | |
priceline.com, Inc. ‡^ | | 17,750 | | 2,039 | |
Internet Software & Services (43.1%) | | | | | |
Akamai Technologies, Inc. ‡ | | 99,800 | | 3,453 | |
Baidu.Com ‡^ | | 10,000 | | 3,904 | |
Bankrate, Inc. ‡^ | | 34,600 | | 1,664 | |
CMGI, Inc. ‡ | | 81,000 | | 1,060 | |
CNET Networks, Inc. ‡^ | | 436,200 | | 3,987 | |
Digital River, Inc. ‡ | | 113,500 | | 3,753 | |
eBay, Inc. ‡ | | 152,300 | | 5,055 | |
Gmarket, Inc. ‡^ | | 39,500 | | 984 | |
Google, Inc. Class A ‡ | | 8,850 | | 6,120 | |
LoopNet, Inc. ‡^ | | 55,500 | | 780 | |
Move, Inc. ‡ | | 1,249,330 | | 3,061 | |
NetEase.Com ‡^ | | 75,200 | | 1,426 | |
Rediff.Com India, Ltd. ‡^ | | 61,000 | | $ | 665 | |
SINA Corp. ‡ | | 57,200 | | 2,534 | |
Sohu.Com, Inc. ‡^ | | 45,200 | | 2,464 | |
Tencent Holdings, Ltd. | | 220,000 | | 1,666 | |
TheStreet.com, Inc. | | 125,800 | | 2,003 | |
Valueclick, Inc. ‡^ | | 37,900 | | 830 | |
VeriSign, Inc. ‡^ | | 62,500 | | 2,351 | |
WebMD Health Corp. Class A ‡^ | | 19,500 | | 801 | |
Yahoo!, Inc. ‡^ | | 177,100 | | 4,119 | |
Media (0.8%) | | | | | |
Time Warner, Inc. | | 58,000 | | 958 | |
Semiconductors & Semiconductor Equipment (3.4%) | | | | | |
Intel Corp. | | 76,500 | | 2,039 | |
Micron Technology, Inc. ‡ | | 108,000 | | 783 | |
Silicon Motion Technology Corp. ‡ | | 73,000 | | 1,298 | |
Software (15.5%) | | | | | |
Adobe Systems, Inc. ‡ | | 28,186 | | 1,204 | |
Check Point Software Technologies ‡ | | 109,000 | | 2,394 | |
McAfee, Inc. ‡ | | 25,500 | | 956 | |
Microsoft Corp. | | 148,600 | | 5,290 | |
Napster, Inc. ‡ | | 441,600 | | 870 | |
Nintendo Co., Ltd. | | 2,100 | | 1,233 | |
Oracle Corp. ‡ | | 40,000 | | 903 | |
Red Hat, Inc. ‡ | | 48,200 | | 1,004 | |
Shanda Interactive Entertainment, Ltd. ‡ | | 43,300 | | 1,444 | |
Sourceforge, Inc. ‡ | | 712,000 | | 1,744 | |
The9, Ltd. ‡^ | | 43,000 | | 917 | |
THQ, Inc. ‡ | | 35,000 | | 987 | |
Total Common Stocks (cost $110,729) | | | | 121,488 | |
| | Principal | | Value | |
REPURCHASE AGREEMENTS (0.7%) | | | | | |
Repurchase Agreement (0.7%) | | | | | |
State Street Repurchase Agreement (1) | | $ | 883 | | $ | 883 | |
2.55%, dated 12/31/2007 to be repurchased at $883 on 01/02/2008 £ | | | | | |
Total Repurchase Agreements (cost $883) | | | | 883 | |
| | | | | |
Total Securities Lending Collateral (cost $24,293) (2) | | | | 24,293 | |
| | | | | |
Total Investment Securities (cost $135,905) # | | | | $ | 146,664 | |
| | | | | | | |
The notes to the financial statements are an integral part of this report.
4
NOTES TO SCHEDULE OF INVESTMENTS:
^ | | At December 31, 2007, all or a portion of this security is on loan (see Note 1). The value at December 31, 2007, of all securities on loan is $23,345. |
‡ | | Non-Income Producing. |
(1) | | State Street Bank, serves as the accounting, custody and lending agent for the Fund and provides various administrative services on behalf of the Funds. |
(2) | | Cash collateral for the Repurchase Agreements, valued at $8,806, that serves as collateral for securities lending, is invested in corporate bonds with interest rates and maturity dates ranging from 3.00% - 10.18% and 04/28/2008 - 12/01/2096, respectively. |
£ | | At December 31, 2007, repurchase agreements excluding collateral for securities on loan are collateralized by U. S. Government Agency Obligations with an interest rate of 4.03% and a maturity date of 03/01/2033, and with a market value plus accrued interest of $902. |
# | | Aggregate cost for federal income tax purposes is $136,595. Aggregate gross unrealized appreciation for all securities in which there is an excess of value over tax cost and aggregate gross unrealized depreciation for all securities in which there is an excess of tax cost over value were $20,827 and $10,758, respectively. Net unrealized appreciation for tax purposes is $10,069. |
The notes to the financial statements are an integral part of this report.
5
Munder Net50
STATEMENT OF ASSETS AND LIABILITIES
At December 31, 2007
(all amounts except per share amounts in thousands)
Assets: | | | |
Investment securities, at value (cost: $135,905)
(including securities loaned of $23,345) | | $ | 146,664 | |
Cash | | 46 | |
Receivables: | | | |
Investment securities sold | | 174 | |
Shares sold | | 9 | |
Interest | | 4 | |
Income from loaned securities | | 17 | |
Dividends | | 14 | |
| | 146,928 | |
Liabilities: | | | |
Investment securities purchased | | 280 | |
Accounts payable and accrued liabilities: | | | |
Shares redeemed | | 77 | |
Management and advisory fees | | 131 | |
Distribution and service fees | | 1 | |
Administration fees | | 2 | |
Payable for collateral for securities on loan | | 24,293 | |
Other | | 35 | |
| | 24,819 | |
Net Assets | | $ | 122,109 | |
Net Assets Consist of: | | | |
Capital Stock ($.01 par value) | | $ | 104 | |
Additional paid-in capital | | 86,971 | |
Undistributed (accumulated) net investment loss | | (2 | ) |
Undistributed (accumulated) net realized gain from investment securities and foreign currency transactions | | 24,277 | |
Net unrealized appreciation on investment securities | | 10,759 | |
Net Assets | | $ | 122,109 | |
Net Assets by Class: | | | |
Initial Class | | $ | 116,929 | |
Service Class | | 5,180 | |
Shares Outstanding: | | | |
Initial Class | | 9,927 | |
Service Class | | 444 | |
Net Asset Value and Offering Price Per Share: | | | |
Initial Class | | $ | 11.78 | |
Service Class | | 11.67 | |
STATEMENT OF OPERATIONS
For the year ended December 31, 2007
(all amounts in thousands)
Investment Income: | | | |
Dividends | | $ | 163 | |
Interest | | 66 | |
Income from loaned securities-net | | 246 | |
| | 475 | |
Expenses: | | | |
Management and advisory fees | | 1,065 | |
Printing and shareholder reports | | 16 | |
Custody fees | | 26 | |
Administration fees | | 24 | |
Legal fees | | 2 | |
Audit fees | | 20 | |
Trustees fees | | 4 | |
Distribution and service fees: | | | |
Service Class | | 11 | |
Other | | 2 | |
Total expenses before recapture of waived expenses | | 1,170 | |
Recaptured expense | | 16 | |
Net expenses | | 1,186 | |
| | | |
Net Investment Loss | | (711 | ) |
| | | |
Net Realized Gain (Loss) from: | | | |
Investment securities | | 25,172 | |
Foreign currency transactions | | 1 | |
| | 25,173 | |
Net Increase (Decrease) in Unrealized Appreciation (Depreciation) on: | | | |
Investment securities | | (6,486 | ) |
| | | |
Net Realized and Unrealized Gain: | | 18,687 | |
Net Increase In Net Assets Resulting from Operations | | $ | 17,976 | |
The notes to the financial statements are an integral part of this report.
6
Munder Net50
STATEMENT OF CHANGES IN NET ASSETS
For the years ended
(all amounts in thousands)
| | December 31,
2007 | | December 31,
2006 | |
Increase (Decrease) in Net Assets From: | | | | | |
Operations: | | | | | |
Net investment income (loss) | | $ | (711 | ) | $ | 68 | |
Net realized gain from investment securities and foreign currency transactions | | 25,173 | | 5,191 | |
Change in unrealized (depreciation) on investment securities and foreign currency translation | | (6,486 | ) | (5,864 | ) |
| | 17,976 | | (605 | ) |
Distributions to Shareholders: | | | | | |
From net realized gains: | | | | | |
Initial Class | | (2,767 | ) | — | |
Service Class | | (111 | ) | — | |
| | (2,878 | ) | — | |
Capital Share Transactions: | | | | | |
Proceeds from shares sold: | | | | | |
Initial Class | | 13,775 | | 8,482 | |
Service Class | | 2,655 | | 1,918 | |
| | 16,430 | | 10,400 | |
Dividends and distributions reinvested: | | | | | |
Initial Class | | 2,767 | | — | |
Service Class | | 111 | | — | |
| | 2,878 | | — | |
Cost of shares redeemed: | | | | | |
Initial Class | | (19,215 | ) | (16,309 | ) |
Service Class | | (1,460 | ) | (1,739 | ) |
| | (20,675 | ) | (18,048 | ) |
| | (1,367 | ) | (7,648 | ) |
Net increase (decrease) in net assets | | 13,731 | | (8,253 | ) |
| | | | | |
Net Assets: | | | | | |
Beginning of year | | 108,378 | | 116,631 | |
End of year | | $ | 122,109 | | $ | 108,378 | |
Undistributed (Accumulated) Net Investment Income (Loss) | | $ | (2 | ) | $ | 68 | |
Share Activity: | | | | | |
Shares issued: | | | | | |
Initial Class | | 1,205 | | 840 | |
Service Class | | 232 | | 198 | |
| | 1,437 | | 1,038 | |
Shares issued-reinvested from distributions: | | | | | |
Initial Class | | 252 | | — | |
Service Class | | 10 | | — | |
| | 262 | | — | |
Shares redeemed: | | | | | |
Initial Class | | (1,706 | ) | (1,655 | ) |
Service Class | | (128 | ) | (178 | ) |
| | (1,834 | ) | (1,833 | ) |
Net increase (decrease) in shares outstanding: | | | | | |
Initial Class | | (249 | ) | (815 | ) |
Service Class | | 114 | | 20 | |
| | (135 | ) | (795 | ) |
The notes to the financial statements are an integral part of this report.
7
Munder Net50
FINANCIAL HIGHLIGHTS
For a share outstanding throughout each period(a)
| | Initial Class | |
| | Year Ended December 31, | |
| | 2007 | | 2006 | | 2005 | | 2004 | | 2003 | |
Net Asset Value | | | | | | | | | | | |
Beginning of period | | $ | 10.32 | | $ | 10.32 | | $ | 9.55 | | $ | 8.28 | | $ | 4.97 | |
Investment Operations | | | | | | | | | | | |
Net investment income (loss) | | (0.07 | ) | 0.01 | | (0.06 | ) | (0.05 | ) | (0.06 | ) |
Net realized and unrealized gain (loss) | | 1.81 | | (0.01 | ) | 0.83 | | 1.32 | | 3.37 | |
Total operations | | 1.74 | | — | | 0.77 | | 1.27 | | 3.31 | |
Distributions | | | | | | | | | | | |
From net investment income | | — | | — | | — | | — | | — | |
From net realized gains | | (0.28 | ) | — | | — | | — | | — | |
Total distributions | | (0.28 | ) | — | | — | | — | | — | |
Net Asset Value | | | | | | | | | | | |
End of period(b) | | $ | 11.78 | | $ | 10.32 | | $ | 10.32 | | $ | 9.55 | | $ | 8.28 | |
Total Return(c),(d) | | 17.04 | % | — | %(e) | 8.06 | % | 15.34 | % | 66.60 | % |
Net Assets End of Period (000’s) | | $ | 116,929 | | $ | 105,005 | | $ | 113,452 | | $ | 100,139 | | $ | 74,941 | |
Ratio and Supplemental Data | | | | | | | | | | | |
Expenses to average net assets(f) | | | | | | | | | | | |
After reimbursement/fee waiver | | 0.99 | %(j) | 1.00 | %(i) | 1.00 | % | 1.00 | %(h) | 1.00 | % |
Before reimbursement/fee waiver(g) | | 0.99 | %(j) | 1.00 | %(i) | 1.02 | % | 1.00 | %(h) | 1.08 | % |
Net investment income (loss), to average net assets(f) | | (0.60 | )% | 0.07 | % | (0.62 | )% | (0.55 | )% | (0.88 | )% |
Portfolio turnover rate(d) | | 94 | % | 72 | % | 96 | % | 34 | % | 29 | % |
For a share outstanding throughout each period(a)
| | Service Class | |
| | Year Ended December 31, | | May 1 to Dec | |
| | 2007 | | 2006 | | 2005 | | 2004 | | 31, 2003 | |
Net Asset Value | | | | | | | | | | | |
Beginning of period | | $ | 10.23 | | $ | 10.26 | | $ | 9.52 | | $ | 8.28 | | $ | 5.94 | |
Investment Operations | | | | | | | | | | | |
Net investment income (loss) | | (0.08 | ) | (0.02 | ) | (0.08 | ) | (0.06 | ) | (0.06 | ) |
Net realized and unrealized gain (loss) | | 1.78 | | (0.01 | ) | 0.82 | | 1.30 | | 2.40 | |
Total operations | | 1.70 | | (0.03 | ) | 0.74 | | 1.24 | | 2.34 | |
Distributions | | | | | | | | | | | |
From net investment income | | — | | — | | — | | — | | — | |
From net realized gains | | (0.26 | ) | — | | — | | — | | — | |
Total distributions | | (0.26 | ) | — | | — | | — | | — | |
Net Asset Value | | | | | | | | | | | |
End of period(b) | | $ | 11.67 | | $ | 10.23 | | $ | 10.26 | | $ | 9.52 | | $ | 8.28 | |
Total Return(c),(d) | | 16.80 | % | (0.29 | )% | 7.77 | % | 14.98 | % | 39.39 | % |
Net Assets End of Period (000’s) | | $ | 5,180 | | $ | 3,373 | | $ | 3,179 | | $ | 2,771 | | $ | 750 | |
Ratio and Supplemental Data | | | | | | | | | | | |
Expenses to average net assets(f) | | | | | | | | | | | |
After reimbursement/fee waiver | | 1.24 | %(j) | 1.25 | %(i) | 1.25 | % | 1.25 | %(h) | 1.25 | % |
Before reimbursement/fee waiver(g) | | 1.24 | %(j) | 1.25 | %(i) | 1.27 | % | 1.25 | %(h) | 1.38 | % |
Net investment income (loss), to average net assets(f) | | (0.70 | )% | (0.23 | )% | (0.87 | )% | (0.68 | )% | (1.14 | )% |
Portfolio turnover rate(d) | | 94 | % | 72 | % | 96 | % | 34 | % | 29 | % |
(a) | | Per share information is calculated based on average number of shares outstanding. |
(b) | | Munder Net50 (the “Fund”) share classes commenced operations as follows: |
| | Initial Class - May 3, 19993 |
| | Service Class - May 1, 200 |
(c) | | Total Return reflects all portfolio expenses and includes reinvestment of dividends and capital gains; it does not reflect the charges and deductions under the policies or annuity contracts. |
(d) | | Not annualized |
(e) | | Rounds to less than 0.01%. |
(f) | | Annualized. |
(g) | | Ratio of Total Expenses to Average Net Assets includes all expenses before fee waivers and reimbursements by the investment advisor. |
(h) | | Ratio is inclusive of recaptured expenses by the investment adviser, if any. The impact of recaptured expenses was 0.0 1% and 0.01% for Initial Class and Service Class, respectively (See Note 2). |
(i) | | Ratio is inclusive of recaptured expenses by the investment adviser, if any. The impact of recaptured expenses was 0.02% and 0.02% for Initial Class and Service Class, respectively (See Note 2). |
(j) | | Ratio is inclusive of recaptured expenses by the investment adviser, if any. The impact of recaptured expenses was 0.01% and 0.01% for Initial Class and Service Class, respectively (See Note 2). |
The notes to the financial statements are an integral part of this report.
8
Munder Net50
NOTES TO FINANCIAL STATEMENTS
At December 31, 2007
(all amounts in thousands)
NOTE 1. ORGANIZATION AND SIGNIFICANT ACCOUNTING POLICIES
AEGON/Transamerica Series Trust (“ATST”) is an open-end management investment company registered under the Investment Company Act of 1940, as amended (the “1940 Act”). ATST serves as a funding vehicle for variable life insurance, variable annuity and group annuity products. Munder Net50 (the “Fund”) is part of ATST.
In the normal course of business, the Fund enters into contracts that contain a variety of representations that provide general indemnifications. The Fund’s maximum exposure under these arrangements is unknown, as this would involve future claims that may be made against the Fund and/or its affiliates that have not yet occurred. However, based on experience, the Fund expects the risk of loss to be remote.
This report should be read in conjunction with the current Fund prospectus, which contains more complete information about the Fund.
In preparing the Fund’s financial statements in accordance with accounting principles generally accepted in the United States of America (“GAAP”), estimates or assumptions (which could differ from actual results) may be used that affect reported amounts and disclosures. The following is a summary of significant accounting policies followed by the Fund.
Multiple class operations, income and expenses: The Fund currently offers two classes of shares, an Initial Class and a Service Class. Income, non-class specific expenses and realized and unrealized gains and losses, are allocated daily to each class, based upon the value of shares outstanding method as permitted under Rule 1 8f-3 of the 1940 Act. Each class bears its own specific expenses as well as a portion of general, common expenses.
Security valuations: The Fund values its investments at the close of the New York Stock Exchange (“NYSE”), normally 4 p.m. ET, each day the NYSE is open for business. Fund investments are valued at the last sale price or closing price on the day of valuation taken from the primary exchange where the security is principally traded.
Securities traded in the over-the-counter market and listed securities for which no sale was reported on that date are valued at the last quoted bid price.
Debt securities are valued based on a price quotation or other equivalent indication of value supplied by an exchange, a pricing service or a major market maker; however, those that mature in sixty days or less are valued at amortized cost, which approximates market.
Investment company securities are valued at the net asset value of the underlying portfolio.
Foreign securities generally are valued based on quotations from the primary market in which they are traded. Because many foreign securities markets and exchanges close prior to the close of the NYSE, closing prices for foreign securities in those markets or on those exchanges do not reflect the events that occur after that close. If a significant market event impacting the value of a portfolio security (e.g., natural disaster, company announcement, market volatility) occurs subsequent to the close of trading in the security, but prior to the calculation of the Fund’s net asset value per share, market quotations for that security may be determined to be unreliable and, accordingly, not “readily available.” As a result, foreign equity securities held by the Fund may be valued at fair market value as determined in good faith by the Fund’s Administrative Valuation Committee, using guidelines adopted by the Board of Trustees.
Other securities for which quotations are not readily available are valued at fair market value as determined in good faith by the Fund’s Administrative Valuation Committee, using guidelines adopted by the Board of Trustees.
Cash: The Fund may leave cash overnight in its cash account with the custodian, State Street Bank & Trust Company (“State Street”). On July 2, 2007, State Street acquired the parent company of Investors Bank & Trust Company. State Street has been contracted on behalf of the Fund to invest the excess cash into a savings account, which at December 31, 2007 was paying an interest rate of 2.60%.
Repurchase agreements: The Fund is authorized to enter into repurchase agreements. The Fund, through its custodian, State Street, receives delivery of the underlying securities, the value of which at the time of purchase is required to be an amount equal to at least 100% of the resale price. The Fund will bear the risk of value fluctuations until the security can be sold and may encounter delays and incur costs in liquidating the security. In the event of bankruptcy or insolvency of the seller, delays and costs may be incurred.
Commission recapture: The sub-adviser, to the extent consistent with the best execution and usual commission rate policies and practices, may place security transactions of the Fund with broker/dealers with which ATST has established a Commission Recapture Program. A Commission Recapture Program is any arrangement under which a broker/dealer applies a portion of the commissions received by such broker/dealer on the security transactions to the Fund. In no event will commissions paid by the Fund be used to pay expenses that would otherwise be borne by any other funds within ATST, or by any other party.
Recaptured commissions during the year ended December 31, 2007 of $99 are included in net realized gains in the Statement of Operations.
Securities lending: The Fund may lend securities to qualified borrowers, with State Street acting as the Fund’s lending agent. The Fund earns negotiated lenders’ fees. The Fund receives cash and/or securities as collateral against the loaned securities. Cash collateral received is invested in short-term, interest-bearing securities. The Fund monitors the market value of securities loaned on a daily basis and requires collateral in an amount at least equal to the value of the securities loaned. Income from loaned securities earned by State Street for its services, shown in the Statement of Operations is net of fees, in the amount of $105.
9
NOTES TO FINANCIAL STATEMENTS (continued)
At December 31, 2007
(all amounts in thousands)
NOTE 1.-(continued)
The Fund has invested the cash collateral received from securities loaned in the following short-term, interest bearing securities:
Abbey National PLC, Eurodollar Term, 5.00%, 1/7/2008 | | $ | 1,049 | |
ABN AMRO Bank NV, Eurodollar Term, 5.18%, 1/4/2008 | | 839 | |
Bank of Nova Scotia, Eurodollar Term, 4.96%, 1/22/2008 | | 734 | |
Barclays, Eurodollar Term, 5.00%, 2/12/2008 | | 1,468 | |
BNP Paribas, Eurodollar Term, 5.01%, 1/11/2008 | | 1,363 | |
Calyon, Eurodollar Term, 5.12%, 3/3/2008 | | 315 | |
Credit Suisse First Boston Corp., Repurchase Agreement, 4.60%, 1/2/2008 | | 2,727 | |
Dexia Group, Eurodollar Term, 4.82%, 1/3/2008 | | 1,049 | |
HBOS Halifax Bank of Scotland, Eurodollar Term, 5.15%, 1/2/2008 | | 524 | |
JPMorgan Chase & Co., Eurodollar Term, 5.15%, 2/12/2008 | | 524 | |
Lloyds TSB Bank, Eurodollar Term, 5.15%, 1/24/2008 | | 1,049 | |
Merrill Lynch & Co. (RPG), Repurchase Agreement, 4.60%, 1/2/2008 | | 1,573 | |
Morgan Stanley & Co. (Corp. Repo), Repurchase Agreement, 4.60%, 1/2/2008 | | 4,299 | |
Rabobank Nederland, Eurodollar Term, 5.08%, 1/10/2008 | | 1,258 | |
Reserve Primary Money Market Fund, 4.95% | | 1,119 | |
Royal Bank of Scotland, Eurodollar Term, 5.00%, 2/25/2008 | | 1,258 | |
Societe Generale, Eurodollar Term, 5.15%, 3/3/2008 | | 629 | |
Toronto Dominion Bank, Eurodollar Term, 5.05%, 1/10/2008 | | 1,258 | |
UBS AG, Eurodollar Term, 4.92%, 1/11/2008 | | 734 | |
Wells Fargo, Bank Note, 4.75%, 1/8/2008 | | 524 | |
| | | |
| | $ | 24,293 | |
Security transactions and investment income: Security transactions are recorded on the trade date. Security gains and losses are calculated on the first-in, first-out basis. Dividend income, if any, is recorded on the ex-dividend date or, in the case of foreign securities, as soon as the Fund is informed of the ex-dividend date. Interest income, including accretion of discounts and amortization of premiums, is recorded on the accrual basis commencing on the settlement date.
Dividend distributions: Dividends and capital gains distributions are typically declared and reinvested annually and are generally paid and reinvested on the business day following the ex-date.
NOTE 2. RELATED PARTY TRANSACTIONS
ATST serves as a funding vehicle for certain affiliated asset allocation portfolios and certain affiliated separate accounts of Western Reserve Life Assurance Co. of Ohio, Transamerica Life Insurance Company, Transamerica Financial Life Insurance Company, Inc., Monumental Life Insurance Company and Transamerica Occidental Life Insurance Company. Transamerica Fund Advisors, Inc. (“TFAI”) is the Fund’s investment adviser. Transamerica Fund Services, Inc. (“TFS”) is the Fund’s administrator and transfer agent. Prior to May 1, 2007, AFSG Securities Corp. (“AFSG”), was the Fund’s distributor. Transamerica Capital, Inc. (“TCI”) is now the Fund’s distributor. TFAI, TFS and TCI are affiliates of AEGON NV, a Netherlands corporation.
Certain officers and trustees of the Fund are also officers and/or directors of TFAI, TFS, AFSG, and TCI.
The following schedule reflects the percentage of Fund assets owned by affiliated investment companies at December 31, 2007:
| | Net
Assets | | % of Net
Assets | |
| | | | | |
Asset Allocation-Growth Portfolio | | 40,455 | | 33.13 | |
Asset Allocation-Moderate Growth Portfolio | | 32,254 | | 26.41 | |
Asset Allocation-Moderate Portfolio | | 9,879 | | 8.09 | |
Total | | $ | 82,588 | | 67.63 | % |
| | | | | | |
Investment advisory fee: The Fund pays management fees to TFAI based on average daily net assets (“ANA”) at the following rate:
0.90% of ANA
TFAI has contractually agreed to waive its advisory fee and will reimburse the Fund to the extent that operating expenses, excluding 12b-1 fees, exceed the following stated annual limit:
1.00% Expense Limit
If total Fund expenses fall below the annual expense limitation agreement agreed to by the adviser within the succeeding three years, the Fund may be required to pay the adviser a portion or all of the waived advisory fees.
For the year ended December 31, 2007, the Fund recaptured $16 of previously reimbursed expenses. There are no amounts available for recapture at December 31, 2007.
Distribution and service fees: ATST entered into a Distribution Agreement with AFSG dated January 1, 1997, as amended. On May 1, 2007, the Distribution Agreement was amended to replace AFSG with TCI as the Fund’s distributor. The Fund has also adopted a distribution plan (“Distribution Plan”) pursuant to Rule 12b-1 under the 1940 Act.
Under the Distribution Plan for the Initial Class shares, TCI, on behalf of the Fund, is authorized to pay various service providers, as direct payment for expenses incurred in connection with distribution of the Fund’s shares, amounts equal to actual expenses associated with distributing the shares.
The Distribution Plan for the Service Class shares requires ATST to pay distribution fees to TCI as compensation for its activities, not as reimbursement for specific expenses. The fee on the Service Class is paid to the insurance companies for providing services and account maintenance for their policyholders who invest in the variable insurance products which invest in the Service Class shares.
The Fund is authorized under the Distribution Plan to pay fees on each class up to the following limits:
Initial Class | | 0.15 | % |
Service Class | | 0.25 | % |
10
NOTES TO FINANCIAL STATEMENTS (continued)
At December 31, 2007
(all amounts in thousands)
NOTE 2.-(continued)
TCI has determined that it will not seek payment by the Fund of the distribution expenses incurred with respect to the Initial Class shares before April 30, 2009. Prior to TCI seeking reimbursement of future expenses, policy and contract owners will be notified in advance. The Fund will pay fees relating to Service Class shares.
Administrative services: The Fund has entered into an agreement with TFS for financial and legal fund administration services. The Fund pays TFS an annual fee of 0.02% of ANA. The Legal fees on the Statement of Operations are for fees paid to external legal counsel.
Deferred compensation plan: Each eligible independent Fund Trustee may elect participation in a non-qualified deferred compensation plan (“the Plan”). Under the Plan, such Trustees may defer payment of all or a portion of their total fees earned as a Fund Trustee. Each Trustee who is a participant in the Plan may elect that the earnings, losses or gains credited to his or her deferred fee amounts be determined based on a deemed investment in any series of Transamerica IDEX Mutual Funds. The right of a participant to receive a distribution from the Plan of the deferred fees is an unsecured claim against the general assets of all series of Transamerica IDEX Mutual Funds. The pro rata liability to the Fund of all deferred fees in the Plan amounted, as of year ended December 31, 2007, to $6. Amounts deferred under the Deferred Compensation Plan are unfunded against the general assets of ATST.
Retirement plan: Under a retirement plan (the “Emeritus Plan”) available to the Independent Trustees, each Independent Trustee is deemed to have elected to serve as Trustee Emeritus of ATST upon his or her termination of service, other than removal for cause, is entitled to 50% of the trustee’s current retainer for a maximum period of five years determined by his or her years of service as a Trustee.
Such amounts shall be accrued by ATST on a pro rata basis allocable to each series of ATST fund based on the relative assets of the series. If retainers increase in the future, past accruals (and credits) will be adjusted upward so that 50% of the Trustee’s current retainer is accrued and credited at all times. Upon death, disability or termination of service, other than removal for cause, amounts deferred become payable to an Emeritus Trustee (or his/her beneficiary). Upon the commencement of service as Trustee Emeritus, compensation will be paid on a quarterly basis during the time period that the Trustee Emeritus is allowed to serve as such.
Amounts accrued under the Emeritus Plan are unsecured claims against the general assets of ATST. For the year ended December 31, 2007, the amount related to the Emeritus Plan was $5. As of December 31, 2007, the Fund has not made any payments related to the Emeritus Plan.
The Emeritus Plan was terminated effective October 30, 2007. Upon the termination, the Fund shall continue to pay any remaining benefits in accordance with the Plan, but no further compensation shall accrue under the Plan.
NOTE 3. INVESTMENT TRANSACTIONS
The cost of securities purchased and proceeds from securities sold (excluding short-term securities) for the year ended December 31, 2007 were as follows:
Purchases of securities: | | | |
Long-term | | $ | 109,366 | |
U.S. Government | | — | |
Proceeds from maturities and sales of securities: | | | |
Long-term | | 114,214 | |
U.S. Government | | — | |
| | | | |
NOTE 4. FEDERAL INCOME TAX MATTERS
The Fund has not made any provision for federal income or excise taxes due to its policy to distribute all of its taxable income and capital gains to its shareholders and otherwise qualify as a regulated investment company under Subchapter M of the Internal Revenue Code. Income and capital gain distributions are determined in accordance with income tax regulations, which may differ from GAAP. These differences are primarily due to differing treatment for items including, but not limited to, net operating losses, and wash sales.
Therefore, distributions determined in accordance with tax regulations may differ significantly in amount or character from net investment income and realized gains for financial reporting purposes. Financial reporting records are adjusted for permanent book/tax differences to reflect tax character. Financial records are not adjusted for temporary differences. These reclassifications are as follows:
Additional paid-in capital | | $ | — | |
Undistributed (accumulated) net investment income (loss) | | $ | 641 | |
Undistributed (accumulated) net realized gain (loss) from investment securities | | $ | (641 | ) |
The tax character of distributions paid may differ from the character of distributions shown in the Statements of Changes in Net Assets due to short-term gains being treated as ordinary income for tax purposes. The tax character of distributions paid during 2006 and 2007 was as follows:
2006 Distributions paid from: | | | |
Ordinary Income | | $ | — | |
Long-term Capital Gain | | — | |
2007 Distributions paid from: | | | |
Ordinary Income | | 983 | |
Long-term Capital Gain | | 1,895 | |
| | | | |
11
NOTES TO FINANCIAL STATEMENTS (continued)
At December 31, 2007
(all amounts in thousands)
NOTE 4.-(continued)
The tax basis components of distributable earnings as of December 31, 2007 are as follows:
Undistributed Ordinary Income | | $ | 4,333 | |
Undistributed Long-term Capital Gain | | $ | 20,633 | |
Capital Loss Carryforward | | $ | — | |
Post October Capital Loss Deferral | | $ | — | |
Post October Currency Loss Deferral | | $ | (1 | ) |
Net Unrealized Appreciation (Depreciation)* | | $ | 10,069 | |
NOTE 5. REGULATORY PROCEEDINGS
There continues to be significant federal and state regulatory activity relating to financial services companies, particularly mutual fund companies and their investment advisers. As part of an ongoing investigation regarding potential market timing, recordkeeping and trading compliance issues and matters affecting the Fund’s investment adviser, TFAI, and certain affiliates and former employees of TFAI, the SEC staff has indicated that it is likely to take some action against TFAI and certain of its affiliates at the conclusion of the investigation. The potential timing and the scope of any such action is difficult to predict. Although the impact of any action brought against TFAI and/or its affiliates is difficult to assess at the present time, the Fund currently believes that the likelihood that any such action will have a material adverse impact is remote. It is important to note that the Fund is not aware of any allegation of wrongdoing against it and its Board at the time this annual report is printed. Although it is not anticipated that these developments will have an adverse impact on the Fund, there can be no assurance at this time. TFAI and its affiliates are actively working with the SEC in regard to this matter; however, the exact resolution cannot be determined at this time. TFAI will take such actions that it deems necessary or appropriate to continue providing management services to the Fund and to bring all matters to an appropriate conclusion.
TFAI and/or its affiliates, and not the Fund, will bear the costs regarding these regulatory matters.
NOTE 6. RECENTLY ISSUED ACCOUNTING PRONOUNCEMENTS
In July 2006, the Financial Accounting Standards Board (“FASB”) released FASB Interpretation No. 48 “Accounting for Uncertainty in Income Taxes” (“FIN 48”), an interpretation of FASB Statement No. 109. FIN 48 provides guidance for how uncertain tax positions should be recognized, measured, presented and disclosed in the financial statements. FIN 48 requires the accounting and disclosure of tax positions taken or expected to be taken in the course of preparing the Fund’s tax returns to determine whether the tax positions are “more-likely- than-not” of being sustained by the applicable tax authority. Tax positions not deemed to meet the more-likely-than-not threshold would be recorded as a tax benefit or expense in the current year.
Adoption of FIN 48 is effective during the first required financial reporting period for fiscal years beginning after December 15, 2006. Management adopted FIN 48 on June 29, 2007.
Implementation of FIN 48 requires Management of the Fund to analyze all open tax years, as defined by the Statute of Limitations, for all major jurisdictions, which includes federal and certain states. Open tax years are those that are open for exam by taxing authorities (i.e., the last 4 tax year ends and the interim tax period since then). The Fund has no examinations in progress and none are expected at this time.
Management of the Fund has reviewed all open tax years and major jurisdictions and concluded the adoption of FIN 48 resulted in no impact to the Fund’s net assets or results of operations. There is no tax liability resulting from unrecognized tax benefits relating to uncertain income tax positions taken or expected to be taken in future tax returns. The Fund is also not aware of any tax positions for which it is reasonably possible that the total amounts of unrecognized tax benefits will significantly change in the next 12 months.
In September 2006, FASB issued its new Standard No. 157, “Fair Value Measurements” (“FAS 157”). FAS 157 is designed to unify guidance for the measurement of fair value of all types of assets, including financial instruments, and certain liabilities, throughout a number of accounting standards. FAS 157 also establishes a hierarchy for measuring fair value in generally accepted accounting principles and expands financial statement disclosures about fair value measurements that are relevant to mutual funds. FAS 157 is effective for financial statements issued for fiscal years beginning after November 15, 2007, and earlier application is permitted.
As of December 31, 2007, Management does not expect the adoption of FAS 157 to impact the amounts reported in the financial statements, however, additional disclosures will be required about the inputs used to develop the measurements of fair value and the effect of certain of the measurements reported in the statement of operations for a fiscal period.
NOTE 7. SUBSEQUENT EVENT
Effective January 1, 2008, TFAI changed its name to Transamerica Asset Management, Inc.
Effective May 1, 2008, AEGON/Transamerica Series Trust will change its name to Transamerica Series Trust. At that time, the Fund will also change its name to Transamerica Munder Net50 VP.
12
Report of Independent Registered Certified Public Accounting Firm
To the Board of Trustees and Shareholders of
Munder Net50:
In our opinion, the accompanying statement of assets and liabilities, including the schedule of investments, and the related statements of operations and of changes in net assets and the financial highlights present fairly, in all material respects, the financial position of Munder Net50 (the “Fund”) (one of the portfolios constituting AEGON/Transamerica Series Trust) at December 31, 2007, the results of its operations for the year then ended, the changes in its net assets for each of the two years in the period then ended and the financial highlights for each of the periods presented, in conformity with accounting principles generally accepted in the United States of America. These financial statements and financial highlights (hereafter referred to as “financial statements”) are the responsibility of the Fund’s management; our responsibility is to express an opinion on these financial statements based on our audits. We conducted our audits of these financial statements in accordance with the standards of the Public Company Accounting Oversight Board (United States). Those standards require that we plan and perform the audit to obtain reasonable assurance about whether the financial statements are free of material misstatement. An audit includes examining, on a test basis, evidence supporting the amounts and disclosures in the financial statements, assessing the accounting principles used and significant estimates made by management, and evaluating the overall financial statement presentation. We believe that our audits, which included confirmation of securities at December 31, 2007 by correspondence with the custodian and brokers, provide a reasonable basis for our opinion.

Tampa, Florida
February 29, 2008
13
Munder Net50
SUPPLEMENTAL TAX INFORMATION (unaudited)
(all amounts in thousands)
For tax purposes, the Fund has made a Long-Term Capital Gain Designation of $1,895 for the year ended December 31, 2007.
RESULTS OF SHAREHOLDER PROXY (unaudited)
At a special meeting of shareholders held on October 30, 2007, the results of the Proposals were as follows:
Proposal 1: To elect a new Board:
Proposed
Trustee | | For | | Against | | Abstentions/Broker Non-
Votes | |
John K. Carter | | 2,274,998,840.817 | | 57,804,698.755 | | 35,433.883 | |
| | | | | | | |
Leo J. Hill | | 2,277,212,702.754 | | 55,590,836.819 | | 35,433.883 | |
| | | | | | | |
Neal M. Jewell | | 2,266,793,295.663 | | 66,010,243.909 | | 35,433.883 | |
| | | | | | | |
Russell A. Kimball, Jr. | | 2,274,825,235.835 | | 57,978,303.737 | | 35,433.883 | |
| | | | | | | |
Eugene M. Mannella | | 2,274,623,165.033 | | 58,180,374.539 | | 35,433.883 | |
| | | | | | | |
Norm R. Nielsen | | 2,275,050,055.885 | | 57,753,483.687 | | 35,433.883 | |
| | | | | | | |
Joyce Galpern Norden | | 2,270,278,122.250 | | 62,525,417.323 | | 35,433.883 | |
| | | | | | | |
Patricia L. Sawyer | | 2,275,737,737.456 | | 57,065,802.116 | | 35,433.883 | |
| | | | | | | |
John W. Waechter | | 2,276,615,120.140 | | 56,188,419.433 | | 35,433.883 | |
Proposal 2: To approve an amendment to the Agreement and Declaration of Trust:
| | | | Abstentions/Broker Non- | |
For | | Against | | Votes | |
2,182,022,669.110 | | 77,590,048.544 | | 73,226,255.801 | |
14
Munder Net50
INVESTMENT ADVISORY AND SUB-ADVISORY AGREEMENTS-REVIEW AND RENEWAL (unaudited)
At a meeting of the Board of Trustees of AEGON/Transamerica Series Trust (“ATST”) held on December 4th, 2007, the Board reviewed and considered the renewal of the investment advisory agreement (the “Investment Advisory Agreement”) between Munder Net50 (the “Fund”) and Transamerica Fund Advisors, Inc. (“TFAI”), as well as the renewal of the investment sub-advisory agreement (the “Sub- Advisory Agreement”) of the Fund between TFAI and Munder Capital Management (the “Sub-Adviser”), to determine whether the agreements should be renewed for a six-month period. It was noted that this review was interim in nature to align all the Funds on the same calendar, and that the Funds’ advisory arrangements would be reviewed again in the first half of 2008.
Following their review and consideration, the Trustees determined that the renewal of the Investment Advisory Agreement and the Sub- Advisory Agreement would enable shareholders of the Fund to obtain high quality services at a cost that is appropriate, fair, and in the best interests of its shareholders. The Board, including the independent members of the Board, unanimously approved the renewal of the Investment Advisory Agreement and Sub-Advisory Agreement. In reaching their decision, the Trustees requested and obtained from TFAI and the Sub-Adviser such information as they deemed reasonably necessary to evaluate the agreements, including information about fees and performance of comparable funds managed by the Sub-Adviser. The Trustees also carefully considered information they had previously received from TFAI and the Sub-Adviser throughout the year as part of their regular oversight of the Fund, as well as comparative fee, expense, and performance information prepared by Lipper Inc. (“Lipper”), an independent provider of mutual fund performance, fee and expense information and profitability data prepared by management. In considering the proposed continuation of the Investment Advisory and Sub-Advisory Agreements, the Trustees evaluated a number of considerations that they believed, in light of the legal advice furnished to them by independent legal counsel and their own business judgment, to be relevant. They based their decisions on a variety of factors, including the following considerations, among others, although they did not identify any consideration or particular information that was controlling of their decisions:
The nature, extent and quality of the advisory services to be provided. The Board considered the nature and quality of the services provided by TFAI and the Sub-Adviser to the Fund in the past, as well as the services anticipated to be provided in the future. The Board concluded that TFAI and the Sub-Adviser are capable of providing high quality services to the Fund, as indicated by the nature and quality of services provided in the past by TFAI and the Sub-Adviser for this series and the experience, capability and integrity of TFAI’s senior management, the financial resources of TFAI and the Sub-Adviser, TFAI’s management oversight process and the professional qualifications of the portfolio management team of the Sub-Adviser. The Trustees determined that TFAI and the Sub-Adviser can provide investment and related services that are appropriate in scope and extent in light of the Fund’s operations, the competitive landscape of the investment company business and investor needs.
The investment performance of the Fund. The Board examined the short and longer-term performance of the Fund, including relative performance against a peer universe of comparable mutual funds as prepared by Lipper for various trailing periods ended June 30, 2007. The Trustees noted that the Fund’s performance trailed its peer universe for the past 1-year period and was just below the median for its peer universe for the past 3-year period, but was quite strong compared to its peer universe for the past 5-year period. On the basis of the Board’s assessment of the nature, extent and quality of advisory services to be provided or procured by TFAI and the Sub-Adviser, the Board concluded that TFAI and the Sub-Adviser are capable of providing a level of investment performance that is appropriate in light of the Fund’s proposed investment objectives, policies and strategies and competitive with other similarly situated investment companies.
The cost of advisory services provided and the level of profitability. The Board reviewed profitability information of TFAI’s cost of procuring fund management services, as well as the costs of provision of administration, fund accounting and other services, to the Fund and to ATST as a whole by TFAI and its affiliates. The Board reviewed the management and sub-advisory fees for the Fund. The Trustees noted that the Fund’s contractual management fees were above the medians for its peer group and peer universe and that the total expenses of the Fund were above the median for its peer group, but below the median for the peer universe. Based on their review, the Trustees determined that the management fees of the Fund generally are appropriate in light of the services expected to be provided or procured, the management fees and the anticipated profitability of the relationship between the Fund, TFAI and its affiliates, and the Sub-Adviser. In making these observations and determinations, the Board reviewed , among other things comparative information provided by Lipper.
Whether fee levels reflect economies of scale and the extent to which economies of scale would be realized as the Fund grows. In evaluating the extent to which the management fees payable under the Investment Advisory and Sub-Advisory Agreements reflect economies of scale or will permit economies of scale to be realized in the future, the Board considered the specific reasons for the absence of breakpoints, and concluded that the absence of breakpoints was acceptable under the circumstances. The Trustees noted that the Fund currently has low assets, but also noted that TFAI has discussed with the Sub-Adviser and the Sub-Adviser has indicated willingness to consider breakpoints in the future should assets grow. The Trustees also concluded that they will have the opportunity to periodically reexamine whether the Fund has achieved economies of scale, and the appropriateness of management fees payable to TFAI and fees paid to the Sub-Adviser, in the future.
Benefits (such as soft dollars) to TFAI, its affiliates, or the Sub-Adviser from their relationship with the Fund. The Board concluded that other benefits anticipated to be derived by TFAI, its affiliates, and the Sub-Adviser from their relationships with the Fund are expected to be reasonable and fair, and consistent with industry practice and the best interests of the Fund and its shareholders. The Trustees noted that TFAI would not realize soft dollar benefits from its relationship with the Fund, and that the Sub-Adviser’s soft dollar trading is consistent with applicable law, including best execution requirements in particular. The Board also noted that the Sub-Adviser is participating in a brokerage program pursuant to which a portion of brokerage commissions paid by the Fund is recaptured for the
15
benefit of the Fund and its shareholders, thus limiting the amount of soft dollar arrangements the Sub-Adviser may engage in with respect to the Fund’s brokerage transactions.
Other considerations. The Board determined that TFAI has made a substantial commitment to the recruitment and retention of high quality personnel, and maintains the financial, compliance and operational resources reasonably necessary to manage the Fund in a professional manner that is consistent with the best interests of the Fund and its shareholders. In this regard, the Trustees favorably considered the procedures and policies in place by TFAI to enforce compliance with applicable laws and regulations and oversee the portfolio management activities of the Sub-Adviser. The Trustees also determined that TFAI has made a significant entrepreneurial commitment to the management and success of the Fund, reflected by TFAI’s expense limitation and fee waiver arrangements with the Fund which may result in TFAI waiving a substantial amount of management fees for the benefit of shareholders. With respect to the Sub-Adviser, the Trustees noted that the Sub-Adviser’s trading costs were generally higher than its peers for the previous four quarters and communicated to the Sub-Adviser a request and expectation for improvement.
16
PIMCO Total Return
MARKET ENVIRONMENT
The primary focus during the year centered on problems in the sub-prime mortgage sector. During most of the year, stronger economic data made it difficult for the Federal Reserve Board (“Fed”) to ease rates, given its focus on inflation concerns. Tight labor markets kept the unemployment rate relatively low and produced real wage gains for consumers, which helped offset headwinds from the residential property market. In addition, measures of core inflation (consumer price inflation with the volatile food and energy prices stripped out) remained above the Fed’s targeted range. Weakness in the sub-prime mortgage sector produced a significant tightening of credit conditions for lower quality and first-time borrowers, yet another blow to an already soft housing market.
The Fed remained on hold through most of the fiscal year after pausing in August 2006 with the federal funds rate at 5.25%. However, turmoil in the sub-prime market and a liquidity crunch in the asset-backed commercial paper market drove the Fed to take action. In August 2007, the Fed cut the discount rate by 50 basis points (bps), or one-half of a percentage point, to 5.75% to help alleviate liquidity concerns in the financial markets. Subsequently, at its September 18th meeting, the Fed cut both the federal funds (“fed funds”) and discount rates by 50 bps, to 4.75% and 5.25%, respectively. Credit markets seized up again late in the fourth quarter after a partial recovery from the initial sub-prime-related downturn in August and September. Continued write-downs of sub-prime assets by many of the world’s leading banks did little to assuage concerns about the soundness of their balance sheets.
To deal with this crisis, the Fed cut the fed funds rate by another 50 basis points during the fourth quarter, bringing its total rate reductions in 2007 to 100 basis points. In another move designed to get banks lending again, the Fed joined central banks in Canada, the United Kingdom (“UK”), the European Union and Switzerland to inject more than $90 billion of liquidity into the global financial system via money market auctions. At the end of 2007 the benchmark 10-year U.S. Treasury Note yielded 4.03%, 68 bps lower than at the start of the year.
PERFORMANCE
For the year ended December 31, 2007, PIMCO Total Return, Initial Class returned 8.95%. By comparison its benchmark, the Lehman Brothers Aggregate Bond Index, returned 6.97%.
STRATEGY REVIEW
PIMCO’s investment process is based upon a long-term approach, which utilizes both “top-down” and “bottom-up” strategies. Top-down strategies focus on duration, yield curve positioning, volatility and sector rotation while bottom-up strategies drive our security selection process and facilitate the identification and analysis of undervalued securities. As we believe that no single strategy should dominate returns, our Total Return strategy relies on multiple sources of value added in a highly diversified portfolio.
During the twelve-month reporting period the portfolio’s performance benefited from active management decisions, which emphasized high quality assets before the sub-prime debacle and added substantial value once the crisis hit in the second half of 2007. Curve steepening strategies were employed, an underweight to investment-grade corporate bonds, and an emphasis to emerging market currencies, all of which contributed to the portfolio’s outperformance during the year.
For the first part of the year, the portfolio’s main detractors were an above-benchmark duration, curve steepening strategies outside the United States (specifically in the UK), and an underweight to investment-grade corporate bonds. Strong monthly payroll and gross domestic readings in the U.S., a booming British economy, and strong earnings results meant higher yields in the U.S., with expectations for rate increases in the UK, and further tightening of investment-grade spreads. In the second part of this year, however, sub-prime mortgage headlines increased, the credit crunch took hold, and volatility soared. Investors sought the quality of U.S. Treasury bonds and bid up expectations of interest rate cuts by the Fed. In the UK, investors cut back on expectations of rate hikes by the Bank of England. And, in July and August, corporate bonds sold off, driving spreads significantly higher. As a result, curve- steepening strategies in the U.S. and UK and an underweight to corporate bonds proved valuable.
Pasi Hamalainen
Portfolio Manager
Pacific Investment Management Company LLC
AEGON/Transamerica Series Trust | Annual Report 2007 |
1
PIMCO Total Return
(unaudited)
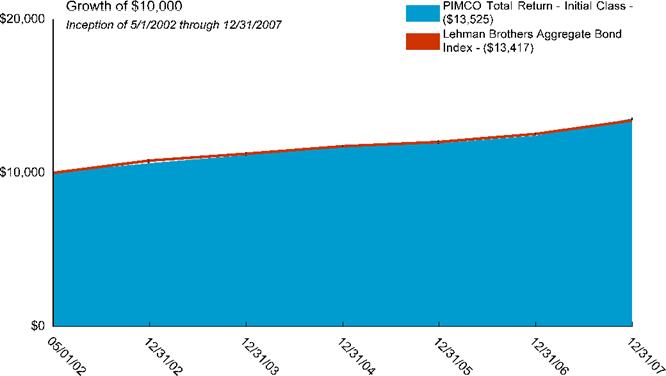
Average Annual Total Return for Periods Ended 12/31/2007
| | | | | | From | | Inception | |
| | 1 Year | | 5 Years | | Inception | | Date | |
| | | | | | | | | |
Initial Class | | 8.95 | % | 4.96 | % | 5.47 | % | 5/1/02 | |
Lehman Brothers Aggregate Bond Index(1) | | 6.97 | % | 4.42 | % | 5.32 | % | 5/1/02 | |
| | | | | | | | | |
Service Class | | 8.80 | % | — | % | 4.49 | % | 5/1/03 | |
NOTES
(1) The Lehman Brothers Aggregate Bond (LBAB) Index is an unmanaged index used as a general measure of market performance. Calculations assume dividends and capital gains are reinvested and do not include any managerial expenses. From inception, calculation is based on life of Initial Class shares.
The performance data presented represents past performance; future results may vary. The portfolio’s investment return and net asset value will fluctuate. Past performance does not guarantee future results. Investor’s units when redeemed may be worth more or less than their original cost.
Current performance may be lower or higher than performance quoted. Please visit your insurance company’s website for contract or policy level standardized total returns current to the most recent month end. Portfolio performance is net of investment fees and fund expenses, but not product charges, which, if included, would significantly lower the performance quoted.
This material must be preceded or accompanied by a current prospectus, which includes specific contents regarding the investment objectives, explanation of share classes and policies of this portfolio.
2
PIMCO Total Return
UNDERSTANDING YOUR FUND’S EXPENSES
(unaudited)
SHAREHOLDER EXPENSES
Fund shareholders may incur ongoing costs, including management and advisory fees, distribution and service fees, and other fund expenses.
The following Example is intended to help you understand your ongoing costs (in dollars and cents) of investing in the Fund and to compare these costs with the ongoing costs of investing in other funds.
The Example is based on an investment of $1,000 invested at July 1, 2007 and held for the entire period until December 31, 2007.
ACTUAL EXPENSES
The first line in the table below provides information about actual account values and actual expenses. You may use the information in this line, together with the amount you invested, to estimate the expenses that you paid over the period. Simply divide your account value by $1,000 (for example, an $8,600 account value divided by $1,000 = 8.6), then multiply the result by the number in the first line of your Fund under the heading entitled “Expenses Paid During Period” to estimate the expenses you paid on your account during this period.
HYPOTHETICAL EXAMPLE FOR COMPARISON PURPOSES
The second line in the table below provides information about hypothetical account values and hypothetical expenses based on the Fund’s actual expense ratio and an assumed rate of return of 5% per year before expenses, which is not the Fund’s actual return. The hypothetical account values and expenses may not be used to estimate the actual ending account balance or expenses you paid for the period. You may use this information to compare the ongoing costs of investing in your Fund and other funds. To do so, compare this 5% hypothetical example with the 5% hypothetical examples that appear in the shareholder reports of the other funds.
Please note that the expenses shown in the table are meant to highlight your ongoing costs only and do not reflect any transactional costs, such as sales charges, redemption fees, brokerage commissions paid on purchases and sales of fund shares. Therefore, the second line under the Fund in the table is useful in comparing ongoing costs only, and will not help you determine the relative total costs of owning different funds. If any of these transaction costs were included, your costs would be higher. The expenses shown in the table do not reflect any fees that may be charged to you by brokers, financial intermediaries or other financial institutions.
| | Beginning
Account
Value | | Ending
Account
Value | | Annualized
Expense
Ratio | | Expenses
Paid During
Period (a) | |
| | | | | | | | | |
Initial Class | | | | | | | | | |
Actual | | $ | 1,000.00 | | $ | 1,084.56 | | 0.71 | % | $ | 3.73 | |
Hypothetical (b) | | 1,000.00 | | 1,021.63 | | 0.71 | | 3.62 | |
| | | | | | | | | |
Service Class | | | | | | | | | |
Actual | | 1,000.00 | | 1,084.10 | | 0.96 | | 5.04 | |
Hypothetical (b) | | 1,000.00 | | 1,020.37 | | 0.96 | | 4.89 | |
| | | | | | | | | | | | |
(a) Expenses are calculated using the Fund’s annualized expense ratio (as disclosed in the table), multiplied by the average account value for the period, multiplied by the number of days in the period (184 days), and divided by the number of days in the year (365 days).
(b) 5% return per year before expenses.
GRAPHICAL PRESENTATION OF SCHEDULE OF INVESTMENTS
By Asset Type
At December 31, 2007
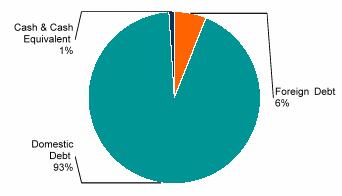
This chart shows the percentage breakdown by asset type of the Fund’s total investment securities.
3
PIMCO Total Return
SCHEDULE OF INVESTMENTS
At December 31, 2007
(all amounts except share amounts in thousands)
| | Principal | | Value | |
U.S. GOVERNMENT OBLIGATIONS (18.4%) | | | | | |
U.S. Government Obligation (18.4%) | | | | | |
U.S. Treasury Bill | | | | | |
Zero Coupon, due 02/28/2008 – 03/13/2008 | | $ | 8,890 | | $ | 8,838 | |
U.S. Treasury Bond | | | | | |
4.75%, due 02/15/2037 | | 16,800 | | 17,582 | |
5.00%, due 05/15/2037 | | 5,800 | | 6,321 | |
8.13%, due 08/15/2019 | | 41,000 | | 55,267 | |
8.88%, due 08/15/2017 | | 40,700 | | 56,001 | |
U.S. Treasury Inflation Indexed Bond, | | | | | |
2.38%, due 01/15/2025 – 01/15/2027 | | 3,417 | | 3,607 | |
U.S. Treasury Inflation Indexed Note, | | | | | |
0.88%, due 04/15/2010 | | 17,535 | | 17,476 | |
2.00%, due 07/15/2014 | | 5,320 | | 5,497 | |
2.38%, due 04/15/2011 | | 18,421 | | 8,777 | |
2.63%, due 07/15/2017 | | 11,492 | | 12,399 | |
3.00%, due 07/15/2012 | | 1,301 | | 1,409 | |
U.S. Treasury Note | | | | | |
4.63%, due 02/15/2017 | | 48,000 | | 50,182 | |
Total U.S. Government Obligations (cost $240,692) | | | | 243,356 | |
| | | | | |
U.S. GOVERNMENT AGENCY OBLIGATIONS (86.1%) | | | | | |
U.S. Government Agency Obligation | | | | | |
Fannie Mae | | | | | |
4.00%, due 08/01/2013 – 01/01/2014 | | 4,167 | | 4,135 | |
4.50%, due 03/01/2010 – 03/25/2017 | | 1,598 | | 1,596 | |
4.71%, due 09/01/2035 * | | 4,738 | | 4,746 | |
4.77%, due 05/01/2035 * | | 2,341 | | 2,364 | |
4.78%, due 08/01/2035 * | | 3,942 | | 3,972 | |
5.00%, due 02/01/2018 – 03/01/2036 | | 128,782 | | 127,055 | |
5.50%, due 03/01/2016 – 01/01/2038 | | 323,475 | | 323,600 | |
5.99%, due 06/01/2043 * | | 615 | | 614 | |
6.00%, due 01/01/2017 – 01/01/2038 | | 87,005 | | 88,362 | |
6.42%, due 08/01/2036 * | | 1,699 | | 1,752 | |
6.50%, due 05/01/2032 – 06/17/2038 | | 18,942 | | 19,524 | |
Fannie Mae, Convertible | | | | | |
7.11%, due 01/01/2028 * | | 117 | | 119 | |
Fannie Mae, TBA | | | | | |
5.00%, due 02/01/2037 – 01/01/2038 | | 27,000 | | 26,336 | |
5.50%, due 01/01/2020 – 01/01/2037 | | 252,400 | | 252,283 | |
6.00%, due 01/01/2037 | | 59,000 | | 59,866 | |
Freddie Mac | | | | | |
4.25%, due 09/15/2024 | | 1,889 | | 1,878 | |
4.50%, due 10/01/2013 – 06/15/2017 | | 4,660 | | 4,663 | |
4.75%, due 09/01/2035 * | | 4,055 | | 4,051 | |
5.00%, due 08/15/2016 – 05/15/2026 | | 35,632 | | 35,736 | |
5.31%, due 09/01/2035 * | | 3,551 | | 3,567 | |
5.38%, due 12/15/2029 * | | 140 | | 140 | |
5.50%, due 03/15/2017 | | 622 | | 632 | |
6.13%, due 10/25/2044 * | | 3,372 | | 3,379 | |
6.50%, due 07/25/2043 | | 176 | | 181 | |
7.18%, due 08/01/2023 * | | 127 | | 128 | |
Freddie Mac, TBA | | | | | |
5.50%, due 02/01/2038 | | 154,800 | | 154,365 | |
Ginnie Mae | | | | | |
5.50%, due 11/15/2032 – 02/15/2036 | | $ | 14,798 | | $ | 14,911 | |
6.50%, due 02/15/2029 – 06/20/2032 | | 303 | | 314 | |
| | | | | |
Total U.S. Government Agency Obligations (cost $1,131,976) | | | | 1,140,270 | |
| | | | | |
SOVEREIGN GOVERNMENT OBLIGATIONS (0.4%) | | | | | |
Hong Kong Government -144A | | | | | |
5.13%, due 08/01/2014 | | 2,700 | | 2,762 | |
Korea Expressway Corp. -144A | | | | | |
5.13%, due 05/20/2015 | | 850 | | 835 | |
Republic of Brazil | | | | | |
10.25%, due 01/10/2028 | BRL | | 2,800 | | 1,520 | |
Republic of South Africa | | | | | |
5.25%, due 05/16/2013 | EUR | | 65 | | 94 | |
| | | | | |
Total Sovereign Government Obligations (cost $4,890) | | | | 5,211 | |
| | | | | |
MORTGAGE-BACKED SECURITIES (11.9%) | | | | | |
Adjustable Rate Mortgage Trust | | | | | |
Series 2005-5, Class 2A1 | | | | | |
5.13%, due 09/25/2035 | | 562 | | 558 | |
American Home Mortgage Investment Trust | | | | | |
Series 2005-2, Class 5A2 | | | | | |
4.94%, due 09/25/2035 * | | 653 | | 652 | |
Banc of America Funding Corp. | | | | | |
Series 2005-D, Class A1 | | | | | |
4.11%, due 05/25/2035 * | | 356 | | 352 | |
Banc of America Funding Corp. | | | | | |
Series 2006-J, Class 4A1 | | | | | |
6.14%, due 01/20/2047 | | 356 | | 351 | |
Bear Stearns Adjustable Rate Mortgage Trust | | | | | |
Series 2003-5, Class 2A1 | | | | | |
4.53%, due 08/25/2033 | | 5,081 | | 4,958 | |
Bear Stearns Adjustable Rate Mortgage Trust | | | | | |
Series 2003-8, Class 2A1 | | | | | |
4.78%, due 01/25/2034 * | | 279 | | 275 | |
Bear Stearns Adjustable Rate Mortgage Trust | | | | | |
Series 2003-8, Class 4A1 | | | | | |
4.61%, due 01/25/2034 | | 425 | | 420 | |
Bear Stearns Adjustable Rate Mortgage Trust | | | | | |
Series 2003-9, Class 2A1 | | | | | |
4.49%, due 02/25/2034 | | 639 | | 631 | |
Bear Stearns Adjustable Rate Mortgage Trust | | | | | |
Series 2004-10, Class 22A1 | | | | | |
4.96%, due 01/25/2035 | | 546 | | 542 | |
Bear Stearns Adjustable Rate Mortgage Trust | | | | | |
Series 2005-2, Class A2 | | | | | |
4.13%, due 03/25/2035 * | | 3,040 | | 2,990 | |
The notes to the financial statements are an integral part of this report.
4
| | Principal | | Value | |
Bear Stearns Adjustable Rate Mortgage Trust | | | | | |
Series 2005-5, Class A1 | | | | | |
4.55%, due 08/25/2035 * | | $ | 53 | | $ | 53 | |
Bear Stearns Adjustable Rate Mortgage Trust | | | | | |
Series 2005-5, Class A2 | | | | | |
4.55%, due 08/25/2035 * | | 1,205 | | 1,183 | |
Bear Stearns Adjustable Rate Mortgage Trust | | | | | |
Series 2005-7, Class 22A1 | | | | | |
5.53%, due 09/25/2035 | | 1,140 | | 1,123 | |
Bear Stearns Adjustable Rate Mortgage Trust | | | | | |
Series 2005-9, Class A1 | | | | | |
4.63%, due 10/25/2035 * | | 2,909 | | 2,866 | |
Bear Stearns Adjustable Rate Mortgage Trust | | | | | |
Series 2006-6, Class 32A1 | | | | | |
5.81%, due 11/25/2036 | | 1,755 | | 1,728 | |
Bear Stearns Alt-A Trust | | | | | |
Series 2006-8, Class 3A1 | | | | | |
4.95%, due 02/25/2034 * | | 1,635 | | 1,552 | |
Bear Stearns Structured Products, Inc. | | | | | |
Series 2007-R6, Class 2A1 | | | | | |
5.79%, due 12/26/2046 | | 767 | | 756 | |
Citigroup Mortgage Loan Trust, Inc. | | | | | |
Series 2005-6, Class A1 | | | | | |
4.75%, due 08/25/2035 * | | 2,286 | | 2,254 | |
Citigroup Mortgage Loan Trust, Inc. | | | | | |
Series 2005-6, Class A2 | | | | | |
4.25%, due 08/25/2035 * | | 1,406 | | 1,378 | |
Citigroup Mortgage Loan Trust, Inc. | | | | | |
Series 2006-AR1, Class 1A1 | | | | | |
4.90%, due 10/25/2035 * | | 5,824 | | 5,790 | |
Countrywide Alternative Loan Trust | | | | | |
Series 2003-J1, Class 4A1 | | | | | |
6.00%, due 10/25/2032 | | 72 | | 72 | |
Countrywide Alternative Loan Trust | | | | | |
Series 2005-11CB, Class 2A8 | | | | | |
4.50%, due 06/25/2035 | | 583 | | 576 | |
Countrywide Alternative Loan Trust | | | | | |
Series 2005-81, Class A1 | | | | | |
5.15%, due 02/25/2037 * | | 2,712 | | 2,562 | |
Countrywide Alternative Loan Trust | | | | | |
Series 2006-OA1, Class 2A1 | | | | | |
4.95%, due 03/20/2046 * | | 2,304 | | 2,172 | |
Countrywide Alternative Loan Trust | | | | | |
Series 2006-OA19, Class A1 | | | | | |
4.92%, due 02/20/2047 * | | 2,464 | | 2,324 | |
Countrywide Alternative Loan Trust | | | | | |
Series 2007-HY4, Class 1A1 | | | | | |
5.51%, due 06/25/2037 | | 5,721 | | 5,676 | |
Countrywide Home Loan Mortgage | | | | | |
Pass-Through Trust | | | | | |
Series 2002-30, Class M | | | | | |
7.21%, due 10/19/2032 * | | 149 | | 148 | |
Countrywide Home Loan Mortgage | | | | | |
Pass-Through Trust | | | | | |
Series 2003-R4, Class 2A-144A | | | | | |
6.50%, due 01/25/2034 | | $ | 984 | | $ | 1,026 | |
Countrywide Home Loan Mortgage | | | | | |
Pass-Through Trust | | | | | |
Series 2004-12, Class 11A1 | | | | | |
6.16%, due 08/25/2034 | | 310 | | 308 | |
Countrywide Home Loan Mortgage | | | | | |
Pass-Through Trust | | | | | |
Series 2004-7, Class 5A2 | | | | | |
5.14%, due 05/25/2034 * | | 5 | | 5 | |
Countrywide Home Loan Mortgage | | | | | |
Pass-Through Trust | | | | | |
Series 2004-R1, Class 2A-144A | | | | | |
6.50%, due 11/25/2034 | | 1,442 | | 1,514 | |
CS First Boston Mortgage Securities Corp. | | | | | |
Series 2003-AR15, Class 2A1 | | | | | |
4.25%, due 06/25/2033 | | 2,422 | | 2,410 | |
DaimlerChrysler Finco Term | | | | | |
5.00%, due 08/03/2014 | | 4,988 | | 4,811 | |
First Horizon Asset Securities, Inc. | | | | | |
Series 2003-AR2, Class 2A1 | | | | | |
4.74%, due 07/25/2033 * | | 2,010 | | 2,000 | |
First Horizon Asset Securities, Inc. | | | | | |
Series 2005-AR3, Class 2A1 | | | | | |
5.37%, due 08/25/2035 * | | 258 | | 256 | |
Greenpoint Mortgage Pass-Through Certificates | | | | | |
Series 2003-1, Class A1 | | | | | |
4.38%, due 10/25/2033 * | | 758 | | 751 | |
GS Mortgage Securities Corp. II | | | | | |
Series 1998-C1, Class A2 | | | | | |
6.62%, due 10/18/2030 | | 900 | | 901 | |
GS Mortgage Securities Corp. II | | | | | |
Series 2007-EOP, Class A1-144A | | | | | |
4.63%, due 03/06/2020 * | | 2,177 | | 2,081 | |
GSR Mortgage Loan Trust | | | | | |
Series 2005-AR6, Class 2A1 | | | | | |
4.54%, due 09/25/2035 * | | 1,085 | | 1,076 | |
Harborview Mortgage Loan Trust | | | | | |
Series 2005-4, Class 4A | | | | | |
5.22%, due 07/19/2035 | | 1,272 | | 1,259 | |
Harborview Mortgage Loan Trust | | | | | |
Series 2006-1, Class 2A1A | | | | | |
4.93%, due 03/19/2037 * | | 3,845 | | 3,610 | |
Harborview Mortgage Loan Trust | | | | | |
Series 2007-1, Class 2A1A | | | | | |
5.00%, due 04/19/2038 * | | 2,552 | | 2,387 | |
HCA, Inc. | | | | | |
7.60%, due 11/14/2013 | | 4,665 | | 4,489 | |
IndyMac Index Mortgage Loan Trust | | | | | |
Series 2004-AR11, Class 2A | | | | | |
5.05%, due 12/25/2034 | | 151 | | 150 | |
The notes to the financial statements are an integral part of this report.
5
| | Principal | | Value | |
JPMorgan Mortgage Trust | | | | | |
Series 2005-A1, Class 6T1 | | | | | |
5.02%, due 02/25/2035 * | | $ | 1,024 | | $ | 1,003 | |
JPMorgan Mortgage Trust | | | | | |
Series 2007-A1, Class 5A5 | | | | | |
4.77%, due 07/25/2035 * | | 5,880 | | 5,827 | |
Master Adjustable Rate Mortgages Trust | | | | | |
Series 2004-13, Class 3A4 | | | | | |
3.79%, due 11/21/2034 * | | 1,088 | | 1,078 | |
Merrill Lynch Mortgage Investors, Inc. | | | | | |
Series 2005-A10, Class A | | | | | |
5.00%, due 02/25/2036 * | | 560 | | 539 | |
Mlcc Mortgage Investors, Inc. | | | | | |
Series 2005-2, Class 1A | | | | | |
5.98%, due 10/25/2035 * | | 26,344 | | 25,381 | |
Mlcc Mortgage Investors, Inc. | | | | | |
Series 2005-2, Class 2A | | | | | |
4.25%, due 10/25/2035 * | | 739 | | 724 | |
Mlcc Mortgage Investors, Inc. | | | | | |
Series 2005-2, Class 3A | | | | | |
5.79%, due 10/25/2035 * | | 198 | | 197 | |
Mlcc Mortgage Investors, Inc. | | | | | |
Series 2005-3, Class 4A | | | | | |
5.04%, due 11/25/2035 * | | 162 | | 157 | |
Morgan Stanley Capital I | | | | | |
Series 2007-XLFA, Class A1-144A | | | | | |
4.71%, due 10/15/2020 * | | 3,034 | | 2,966 | |
Nomura Asset Acceptance Corp. | | | | | |
Series 2004-R1, Class A1-144A | | | | | |
6.50%, due 03/25/2034 | | 1,281 | | 1,291 | |
Residential Accredit Loans, Inc. | | | | | |
Series 2006-QO7, Class 3A1 | | | | | |
4.97%, due 09/25/2046 * | | 614 | | 605 | |
Residential Funding Mortgage Securities I | | | | | |
Series 2003-S9, Class A1 | | | | | |
6.50%, due 03/25/2032 | | 72 | | 72 | |
Residential Funding Mortgage Securities I | | | | | |
Series 2005-SA4, Class 1A21 | | | | | |
5.22%, due 09/25/2035 | | 583 | | 574 | |
Sequoia Mortgage Trust | | | | | |
Series 10, Class 2A1 | | | | | |
5.33%, due 10/20/2027 * | | 174 | | 166 | |
SLM Corp. Bridge Loan | | | | | |
6.00%, due 06/30/2008 § 3 | | 4,400 | | 4,384 | |
Structured Adjustable Rate Mortgage Loan Trust | | | | | |
Series 2004-20, Class 3A1 | | | | | |
5.35%, due 01/25/2035 | | 488 | | 485 | |
Structured Adjustable Rate Mortgage Loan Trust | | | | | |
Series 2005-17, Class 3A1 | | | | | |
5.54%, due 08/25/2035 | | 179 | | 178 | |
Structured Asset Mortgage Investments, Inc. | | | | | |
Series 2002-AR3, Class A1 | | | | | |
5.30%, due 09/19/2032 * | | 67 | | 65 | |
Structured Asset Mortgage Investments, Inc. | | | | | |
Series 2005-AR5, Class A1 | | | | | |
4.94%, due 07/19/2035 * | | $ | 102 | | $ | 101 | |
Structured Asset Mortgage Investments, Inc. | | | | | |
Series 2005-AR5, Class A2 | | | | | |
4.94%, due 07/19/2035 * | | 237 | | 234 | |
Structured Asset Mortgage Investments, Inc. | | | | | |
Series 2005-AR5, Class A3 | | | | | |
4.94%, due 07/19/2035 * | | 429 | | 413 | |
Structured Asset Mortgage Investments, Inc. | | | | | |
Series 2005-AR8, Class A1A | | | | | |
5.07%, due 02/25/2036 * | | 489 | | 465 | |
Structured Asset Mortgage Investments, Inc. | | | | | |
Series 2006-AR3, Class 12A1 | | | | | |
5.09%, due 05/25/2036 * | | 2,978 | | 2,807 | |
Tbw Mortgage Backed Pass-Through Certificates | | | | | |
Series 2006-6, Class A1 | | | | | |
4.98%, due 01/25/2037 * | | 2,698 | | 2,642 | |
Wachovia Bank Commercial Mortgage Trust | | | | | |
Series 2006-WL7A, Class A1-144A | | | | | |
4.74%, due 09/15/2021 * | | 1,747 | | 1,721 | |
WAMU Mortgage Pass Through Certificates | | | | | |
Series 2006-AR9, Class 2A | | | | | |
5.73%, due 08/25/2046 * | | 2,772 | | 2,675 | |
WAMU Mortgage Pass-Through Certificates | | | | | |
Series 2002-AR2, Class A | | | | | |
5.63%, due 02/27/2034 * | | 217 | | 212 | |
WAMU Mortgage Pass-Through Certificates | | | | | |
Series 2003-AR9, Class 2A | | | | | |
4.05%, due 09/25/2033 * | | 7,535 | | 7,491 | |
WAMU Mortgage Pass-Through Certificates | | | | | |
Series 2003-R1, Class A1 | | | | | |
5.41%, due 12/25/2027 * | | 6,684 | | 6,389 | |
WAMU Mortgage Pass-Through Certificates | | | | | |
Series 2004-AR1, Class A | | | | | |
4.23%, due 03/25/2034 | | 817 | | 808 | |
WAMU Mortgage Pass-Through Certificates | | | | | |
Series 2006-AR19, Class 1A1A | | | | | |
5.52%, due 01/25/2047 * | | 411 | | 387 | |
WAMU Mortgage Pass-Through Certificates | | | | | |
Series 2006-AR3, Class A1A | | | | | |
5.86%, due 02/25/2046 * | | 1,757 | | 1,710 | |
WAMU Mortgage Pass-Through Certificates | | | | | |
Series 2006-AR7, Class 3A | | | | | |
5.73%, due 07/25/2046 * | | 2,451 | | 2,342 | |
Wells Fargo Mortgage Backed Securities Trust | | | | | |
Series 2003-13, Class A5 | | | | | |
4.50%, due 11/25/2018 | | 890 | | 878 | |
Wells Fargo Mortgage Backed Securities Trust | | | | | |
Series 2004-CC, Class A1 | | | | | |
4.95%, due 01/25/2035 * | | 1,386 | | 1,371 | |
Wells Fargo Mortgage Backed Securities Trust | | | | | |
Series 2006-AR8, Class 2A4 | | | | | |
5.24%, due 04/25/2036 | | 5,010 | | 4,972 | |
The notes to the financial statements are an integral part of this report.
6
| | Principal | | Value | |
Mortgage-Backed Securities (0.1%) | | | | | |
Bear Stearns Structured Products, Inc. | | | | | |
5.68%, due 01/26/2036 | | $ | 1,135 | | $ | 1,123 | |
Total Mortgage-Backed Securities (cost $158,940) | | | | 157,409 | |
| | | | | |
ASSET-BACKED SECURITIES (7.1%) | | | | | |
Aames Mortgage Investment Trust | | | | | |
Series 2006-1, Class A1 | | | | | |
4.85%, due 04/25/2036 * | | 152 | | 152 | |
American Express Credit Account Master Trust | | | | | |
Series 2005-3, Class A | | | | | |
4.65%, due 01/18/2011 * | | 700 | | 700 | |
Amortizing Residential Collateral Trust | | | | | |
Series 2002-BC4, Class A | | | | | |
5.16%, due 07/25/2032 * | | 6 | | 6 | |
Argent Securities, Inc. | | | | | |
Series 2006-W3, Class A2A | | | | | |
4.86%, due 04/25/2036 * | | 292 | | 291 | |
Asset Backed Funding Certificates | | | | | |
Series 2006-HE1, Class A2A | | | | | |
4.85%, due 01/25/2037 * | | 2,812 | | 2,768 | |
Aurum CLO | | | | | |
Series 2002-1A, Class A1-144A | | | | | |
5.67%, due 04/15/2014 * | | 4,048 | | 4,078 | |
Bank One Issuance Trust | | | | | |
Series 2003-A3, Class A3 | | | | | |
4.76%, due 12/15/2010 * | | 2,800 | | 2,801 | |
Bear Stearns Asset Backed Securities Trust | | | | | |
Series 2002-2, Class A1 | | | | | |
5.20%, due 10/25/2032 * | | 66 | | 64 | |
Bear Stearns Asset Backed Securities Trust | | | | | |
Series 2006-SD4, Class 1A1 | | | | | |
5.56%, due 10/25/2036 | | 1,502 | | 1,461 | |
Citigroup Mortgage Loan Trust, Inc. | | | | | |
Series 2006-WFH3, Class A1 | | | | | |
4.92%, due 10/25/2036 * | | 1,446 | | 1,417 | |
Citigroup Mortgage Loan Trust, Inc. | | | | | |
Series 2006-WFH3, Class A2 | | | | | |
4.88%, due 10/25/2036 * | | 2,300 | | 2,189 | |
Citigroup Mortgage Loan Trust, Inc. | | | | | |
Series 2007-AHL1, Class A2A | | | | | |
4.91%, due 12/25/2036 * | | 485 | | 471 | |
Countrywide Asset-Backed Certificates | | | | | |
Series 2006-11, Class 3AV1 | | | | | |
4.85%, due 09/25/2046 * | | 1,244 | | 1,229 | |
Countrywide Asset-Backed Certificates | | | | | |
Series 2006-13, Class 3AV1 | | | | | |
4.84%, due 01/25/2037 * | | 794 | | 784 | |
Countrywide Asset-Backed Certificates | | | | | |
Series 2006-24, Class 2A1 | | | | | |
4.84%, due 05/25/2037 * | | 3,405 | | 3,339 | |
Countrywide Asset-Backed Certificates | | | | | |
Series 2006-25, Class 2A1 | | | | | |
4.86%, due 06/25/2037 * | | 1,369 | | 1,335 | |
Countrywide Asset-Backed Certificates | | | | | |
Series 2006-8, Class 2A1 | | | | | |
4.90%, due 01/25/2046 * | | $ | 1,270 | | $ | 1,254 | |
Countrywide Asset-Backed Certificates | | | | | |
Series 2006-SD1, Class A1-144A | | | | | |
5.03%, due 02/25/2036 * | | 702 | | 682 | |
Countrywide Asset-Backed Certificates | | | | | |
Series 2007-5, Class 2A1 | | | | | |
4.89%, due 09/25/2047 * | | 3,298 | | 3,204 | |
First Franklin Mortgage Loan Asset | | | | | |
Backed Certificates | | | | | |
Series 2006-FF18, Class A2A | | | | | |
4.86%, due 12/25/2037 * | | 3,109 | | 3,038 | |
Home Equity Asset Trust | | | | | |
Series 2002-1, Class A4 | | | | | |
5.47%, due 11/25/2032 * | | 1 | | 1 | |
JPMorgan Mortgage Acquisition Corp. | | | | | |
Series 2007-CH3, Class A2 | | | | | |
4.87%, due 03/25/2037 * | | 694 | | 675 | |
Lehman XS Trust | | | | | |
Series 2006-10N, Class 1A1A | | | | | |
4.95%, due 07/25/2046 * | | 834 | | 827 | |
Lehman XS Trust | | | | | |
Series 2006-16N, Class A1A | | | | | |
4.95%, due 11/25/2046 * | | 2,370 | | 2,268 | |
Lehman XS Trust | | | | | |
Series 2006-17, Class WF11 | | | | | |
4.99%, due 11/25/2036 * | | 1,820 | | 1,818 | |
Long Beach Mortgage Loan Trust | | | | | |
Series 2006-3, Class 2A1 | | | | | |
4.93%, due 05/25/2046 * | | 60 | | 60 | |
Long Beach Mortgage Loan Trust | | | | | |
Series 2006-9, Class 2A1 | | | | | |
4.93%, due 10/25/2036 * | | 666 | | 650 | |
MBNA Credit Card Master Note Trust | | | | | |
Series 2003-A1, Class A1 | | | | | |
3.30%, due 07/15/2010 | | 2,400 | | 2,397 | |
MBNA Credit Card Master Note Trust | | | | | |
Series 2003-A3, Class A3 | | | | | |
4.77%, due 08/16/2010 * | | 5,600 | | 5,602 | |
MBNA Master Credit Card Trust | | | | | |
Series 1998-E, Class A | | | | | |
5.39%, due 09/15/2010 * | | 2,000 | | 2,001 | |
Merrill Lynch Mortgage Investors, Inc. | | | | | |
Series 2006-FF1, Class A2A | | | | | |
4.94%, due 08/25/2036 * | | 1,626 | | 1,604 | |
Merrill Lynch Mortgage Investors, Inc. | | | | | |
Series 2006-RM2, Class A2A | | | | | |
4.82%, due 05/25/2037 * | | 2,326 | | 2,294 | |
Morgan Stanley ABS Capital I | | | | | |
Series 2006-HE7, Class A2A | | | | | |
4.92%, due 09/25/2036 * | | 2,319 | | 2,258 | |
Morgan Stanley ABS Capital I | | | | | |
Series 2006-NC2, Class A2B | | | | | |
4.91%, due 02/25/2036 * | | 4,700 | | 4,621 | |
The notes to the financial statements are an integral part of this report.
7
| | Principal | | Value | |
Morgan Stanley ABS Capital I | | | | | |
Series 2006-WMC2, Class A2A | | | | | |
4.91%, due 07/25/2036 * | | $ | 1,202 | | $ | 1,182 | |
Morgan Stanley ABS Capital I | | | | | |
Series 2007-HE2, Class A2A | | | | | |
4.83%, due 01/25/2037 * | | 3,105 | | 3,037 | |
Morgan Stanley Mortgage Loan Trust | | | | | |
Series 2007-3XS, Class 2A1A | | | | | |
4.86%, due 01/25/2047 * | | 4,637 | | 4,535 | |
Quest Trust | | | | | |
Series 2004-X2, Class A1-144A | | | | | |
5.43%, due 06/25/2034 * | | 1 | | 1 | |
Residential Asset Mortgage Products, Inc. | | | | | |
Series 2006-RZ5, Class A1A | | | | | |
4.89%, due 08/25/2046 * | | 2,808 | | 2,758 | |
Residential Asset Securities Corp. | | | | | |
Series 2007-KS1, Class A1 | | | | | |
4.93%, due 01/25/2037 * | | 2,686 | | 2,598 | |
Securitized Asset Backed Receivables LLC Trust | | | | | |
Series 2007-NC2, Class A2A | | | | | |
4.83%, due 01/25/2037 * | | 2,980 | | 2,887 | |
SLM Student Loan Trust | | | | | |
Series 2003-11, Class A7-1 44A | | | | | |
3.80%, due 12/15/2038 | | 6,000 | | 5,881 | |
Small Business Administration Participation Certificates | | | | | |
Series 2003-20I, Class 1 | | | | | |
5.13%, due 09/01/2023 | | 464 | | 468 | |
Small Business Administration Participation Certificates | | | | | |
Series 2004-20C, Class 1 | | | | | |
4.34%, due 03/01/2024 | | 2,678 | | 2,569 | |
Small Business Administration | | | | | |
Series 2004-P10A, Class 1 | | | | | |
4.50%, due 02/01/2014 | | 1,128 | | 1,094 | |
Soundview Home Equity Loan Trust | | | | | |
Series 2006-3, Class A1 | | | | | |
4.91%, due 11/25/2036 * | | 732 | | 727 | |
Soundview Home Equity Loan Trust | | | | | |
Series 2006-EQ2, Class A1 | | | | | |
4.95%, due 01/25/2037 * | | 818 | | 802 | |
Structured Asset Securities Corp. | | | | | |
Series 2002-HF1, Class A | | | | | |
5.16%, due 01/25/2033 * | | 2 | | 2 | |
Structured Asset Securities Corp. | | | | | |
Series 2006-BC3, Class A2 | | | | | |
4.92%, due 10/25/2036 * | | 2,729 | | 2,626 | |
Structured Asset Securities Corp. | | | | | |
Series 2007-GEL1, Class A1-144A | | | | | |
4.89%, due 01/25/2037 * | | 2,549 | | 2,461 | |
Washington Mutual Asset-Backed Certificates | | | | | |
Series 2006-HE1, Class 2A1 | | | | | |
4.94%, due 04/25/2036 * | | $ | 128 | | $ | 127 | |
| Wells Fargo Home Equity Trust | | | | | | |
| Series 2007-1, Class A1 | | | | | | |
| 4.89%, due 03/25/2037 * | | $ | 1,615 | | $ | 1,582 | | |
| Total Asset-Backed Securities (cost $95,313) | | | | 93,676 | | |
| | | | | | | |
| MUNICIPAL GOVERNMENT OBLIGATIONS (0.6%) | | | | | | |
| Buckeye Tobacco Settlement Financing | | | | | | |
| 5.88%, due 06/01/2047 | | 1,500 | | 1,431 | | |
| City of Houston TX | | | | | | |
| 5.00%, due 11/15/2036 | | 900 | | 935 | | |
| Palomar Community College District | | | | | | |
| 4.75%, due 05/01/2032 | | 100 | | 102 | | |
| Tobacco Settlement Finance Authority of | | | | | | |
| 7.47%, due 06/01/2047 | | 2,700 | | 2,593 | | |
| Tobacco Settlement Financing Corp., LA | | | | | | |
| 5.88%, due 05/15/2039 | | 100 | | 96 | | |
| Tobacco Settlement Financing Corp./NJ Series 1 | | | | | | |
| 5.00%, due 06/01/2041 | | 3,200 | | 2,657 | | |
| Total Municipal Government Obligations (cost $7,759) | | | | 7,814 | | |
| | | | | | | |
| CORPORATE DEBT SECURITIES (25.9%) | | | | | | |
| Airlines (0.1%) | | | | | | |
| Continental Airlines, Inc. | | | | | | |
| 7.06%, due 09/15/2009 | | 1,000 | | 1,013 | | |
| United Airlines, Inc. | | | | | | |
| 6.20%, due 09/01/2008 | | 269 | | 267 | | |
| 6.60%, due 09/01/2013 | | 78 | | 77 | | |
| Automobiles (0.2%) | | | | | | |
| Daimler Finance North America LLC | | | | | | |
| 6.05%, due 03/13/2009 * | | 3,000 | | 2,983 | | |
| Capital Markets (4.5%) | | | | | | |
| Bear Stearns Cos., Inc. (The) | | | | | | |
| 7.63%, due 12/07/2009 | | 560 | | 575 | | |
| Goldman Sachs Group, Inc. | | | | | | |
| 6.75%, due 10/01/2037 | | 10,300 | | 10,092 | | |
| Goldman Sachs Group, Inc. (The) | | | | | | |
| 5.30%, due 12/22/2008 * | | 800 | | 798 | | |
| 6.25%, due 09/01/2017 | | 9,700 | | 10,091 | | |
| Lehman Brothers Holdings, Inc. | | | | | | |
| 5.26%, due 12/23/2008 * | | 4,800 | | 4,718 | | |
| 6.75%, due 12/28/2017 | | 4,000 | | 4,123 | | |
| Merrill Lynch & Co., Inc. | | | | | | |
| 5.24%, due 12/22/2008 * | | 4,800 | | 4,736 | | |
| 6.05%, due 08/15/2012 | | 400 | | 408 | | |
| Morgan Stanley | | | | | | |
| 4.93%, due 05/07/2009 * | | 4,100 | | 4,049 | | |
| 5.72%, due 10/15/2015 * | | 1,100 | | 1,031 | | |
| 5.95%, due 12/28/2017 | | 18,900 | | 18,886 | | |
| | | | | | | | | | | | | | | | |
The notes to the financial statements are an integral part of this report.
8
| | | | Principal | | Value | |
Commercial Banks (11.0%) | | | | | | | |
Bank of Ireland | | | | | | | |
5.61%, due 12/19/2008 * | | | | $ | 4,800 | | $ | 4,797 | |
Bank of Scotland PLC -144A | | | | | | | |
5.03%, due 07/17/2008 * | | | | 1,400 | | 1,399 | |
5.25%, due 07/17/2009 * | | | | 2,000 | | 1,997 | |
Barclays | | | | | | | |
5.45%, due 09/12/2012 | | | | 9,400 | | 9,635 | |
6.05%, due 12/04/2017 -144A | | | | 6,000 | | 6,046 | |
7.43%, due 12/15/2017 - 144A, Ž | | | | 2,000 | | 2,078 | |
China Development Bank | | | | | | | |
5.00%, due 10/15/2015 | | | | 300 | | 296 | |
Citigroup, Inc. | | | | | | | |
8.30%, due 12/21/2037 | | | | 3,300 | | 3,446 | |
Deutsche Bank AG London | | | | | | | |
6.00%, due 09/01/2017 | | | | 8,600 | | 8,918 | |
Fortis Bank | | | | | | | |
4.77%, due 06/30/2008 * | | | | 5,400 | | 5,395 | |
General Electric Capital Corp. | | | | | | | |
5.07%, due 10/24/2008 * | | | | 16,400 | | 16,371 | |
6.50%, due 09/15/2017-144A | | | | 3,800 | | 7,616 | |
Glitnir Banki Hf -144A | | | | | | | |
5.44%, due 04/20/2010 * | | | | 500 | | 489 | |
HSBC Bank USA NA/New York, NY | | | | | | | |
5.06%, due 07/28/2008 * | | | | 1,800 | | 1,802 | |
HSBC Capital Funding LP -144A | | | | | | | |
10.18%, due 06/30/2030 Ž, 2 | | | | 100 | | 126 | |
Nordea Bank Finland PLC | | | | | | | |
5.19%, due 12/01/2008 * | | | | 12,200 | | 12,185 | |
Nordea Bank Finland PLC/New York NY | | | | | | | |
4.99%, due 05/28/2008 * | | | | 5,300 | | 5,301 | |
Rabobank Capital Funding II -144A | | | | | | | |
5.26%, due 12/31/2013 Ž | | | | 1,000 | | 932 | |
Rabobank Capital Funding Trust -144A | | | | | | | |
5.25%, due 10/21/2016 Ž | | | | 1,480 | | 1,325 | |
Rabobank Nederland | | | | | | | |
0.20%, due 06/20/2008 | | JPY | | 1,028,000 | | 9,170 | |
5.26%, due 01/15/2009 * | | | | 3,800 | | 3,795 | |
Royal Bank of Scotland Group PLC | | | | | | | |
7.64%, due (missing date) Ž | | | | 7,000 | | 7,197 | |
Santander US Debt SA Unipersonal -144A | | | | | | | |
4.93%, due 02/06/2009 * | | | | 3,800 | | 3,778 | |
5.73%, due 11/20/2009 * | | | | 4,700 | | 4,642 | |
Skandinaviska Enskilda Banken AB | | | | | | | |
4.96%, due 08/21/2008 * | | | | 5,700 | | 5,696 | |
Skandinaviska Enskilda Banken AB/New | | | | | | | |
4.55%, due 02/04/2008 * | | | | 4,400 | | 4,400 | |
Sumitomo Mitsui Banking Corp. -144A | | | | | | | |
5.63%, due 10/15/2015 Ž, 2 | | | | 550 | | 514 | |
UBS AG/Stamford Branch | | | | | | | |
5.88%, due 12/20/2017 | | | | 5,600 | | 5,639 | |
Unicredit Luxembourg Finance SA -144A | | | | | | | |
5.14%, due 10/24/2008 * | | | | $ | 4,200 | | $ | 4,192 | |
Unicredito Italiano/New York NY | | | | | | | |
5.06%, due 05/29/2008 * | | | | 4,800 | | 4,799 | |
VTB Capital SA for Vneshtorgbank -144A | | | | | | | |
5.49%, due 08/01/2008 * | | | | 2,200 | | 2,178 | |
Commercial Services & Supplies (0.1%) | | | | | | | |
Allied Waste North America, Inc. | | | | | | | |
7.25%, due 03/15/2015 | | | | 100 | | 100 | |
7.88%, due 04/15/2013 | | | | 300 | | 307 | |
Waste Management, Inc. | | | | | | | |
7.38%, due 08/01/2010 | | | | 700 | | 739 | |
Communications Equipment (0.0%) | | | | | | | |
Nortel Networks, Ltd. -144A | | | | | | | |
10.13%, due 07/15/2013 | | | | 200 | | 206 | |
Computers & Peripherals (0.5%) | | | | | | | |
IBM Corp. | | | | | | | |
5.70%, due 09/14/2017 | | | | 6,200 | | 6,409 | |
Consumer Finance (2.0%) | | | | | | | |
American Express | | | | | | | |
6.15%, due 08/28/2017 | | | | 3,300 | | 3,387 | |
American Honda Finance Corp. -144A | | | | | | | |
4.87%, due 08/05/2008 * | | | | 2,000 | | 1,999 | |
Capital One Financial Co. | | | | | | | |
6.75%, due 09/15/2017 | | | | 3,400 | | 3,261 | |
Ford Motor Credit Co. LLC | | | | | | | |
4.95%, due 01/15/2008 | | | | 1,100 | | 1,099 | |
5.80%, due 01/12/2009 | | | | 1,100 | | 1,044 | |
7.80%, due 06/01/2012 | | | | 2,300 | | 2,016 | |
GMAC LLC | | | | | | | |
5.85%, due 01/14/2009 | | | | 700 | | 669 | |
6.12%, due 05/15/2009 * | | | | 100 | | 93 | |
6.63%, due 05/15/2012 | | | | 2,600 | | 2,161 | |
7.00%, due 02/01/2012 | | | | 2,800 | | 2,376 | |
HSBC Finance Corp. | | | | | | | |
4.98%, due 05/21/2008 * | | | | 2,700 | | 2,700 | |
5.78%, due 03/12/2010 * | | | | 3,200 | | 3,139 | |
6.38%, due 10/15/2011 | | | | 2,000 | | 2,061 | |
Containers & Packaging (0.0%) | | | | | | | |
Jefferson Smurfit Corp. US | | | | | | | |
8.25%, due 10/01/2012 | | | | 200 | | 197 | |
Diversified Financial Services (1.4%) | | | | | | | |
Caterpillar Financial Services Corp. | | | | | | | |
4.97%, due 05/18/2009 * | | | | 700 | | 698 | |
Citigroup, Inc. | | | | | | | |
5.29%, due 06/09/2009 * | | | | 2,000 | | 1,985 | |
5.88%, due 05/29/2037 | | | | 1,100 | | 1,026 | |
JPMorgan Chase & Co. | | | | | | | |
6.00%, due 01/15/2018 | | | | 10,000 | | 10,174 | |
Petroleum Export, Ltd. -144A | | | | | | | |
5.27%, due 06/15/2011 | | | | 547 | | 541 | |
The notes to the financial statements are an integral part of this report.
9
| | | | Principal | | Value | |
Santander Perpetual SA Unipersonal -144A | | | | | | | |
6.67%, due 10/27/2017 Ž | | | | $ | 2,100 | | $ | 2,106 | |
Williams Cos., Inc. Credit Linked Certificate Trust (The) -144A | | | | | | | |
6.75%, due 04/15/2009 | | | | 1,900 | | 1,921 | |
Diversified Telecommunication Services (1.0%) | | | | | | | |
AT&T, Inc. | | | | | | | |
4.13%, due 09/15/2009 | | | | 3,025 | | 3,006 | |
BellSouth Corp. | | | | | | | |
4.97%, due 08/15/2008 * | | | | 4,200 | | 4,193 | |
France Telecom SA , Reg S | | | | | | | |
6.75%, due 03/14/2008 | | EUR | | 1,569 | | 2,301 | |
KT Corp. -144A | | | | | | | |
4.88%, due 07/15/2015 | | | | 900 | | 857 | |
Qwest Corp. | | | | | | | |
5.63%, due 11/15/2008 | | | | 3,000 | | 2,985 | |
Electric Utilities (0.4%) | | | | | | | |
Columbus Southern Power Co. | | | | | | | |
5.50%, due 03/01/2013 | | | | 100 | | 99 | |
Entergy Gulf States, Inc. | | | | | | | |
5.70%, due 06/01/2015 | | | | 750 | | 730 | |
Florida Power Corp. | | | | | | | |
4.80%, due 03/01/2013 | | | | 1,960 | | 1,948 | |
Niagara Mohawk Power Corp. | | | | | | | |
7.75%, due 10/01/2008 | | | | 825 | | 842 | |
Ohio Power Co. | | | | | | | |
5.50%, due 02/15/2013 | | | | 100 | | 99 | |
Progress Energy, Inc. | | | | | | | |
6.85%, due 04/15/2012 | | | | 440 | | 471 | |
7.10%, due 03/01/2011 | | | | 282 | | 300 | |
PSEG Power LLC | | | | | | | |
6.95%, due 06/01/2012 | | | | 921 | | 982 | |
Food & Staples Retailing (0.4%) | | | | | | | |
Albertsons LLC | | | | | | | |
6.95%, due 08/01/2009 | | | | 300 | | 304 | |
Wal-Mart Stores, Inc. | | | | | | | |
5.59%, due 06/16/2008 * | | | | 4,800 | | 4,801 | |
Food Products (0.4%) | | | | | | | |
Kraft Foods, Inc. | | | | | | | |
5.63%, due 11/01/2011 | | | | 4,000 | | 4,091 | |
6.88%, due 02/01/2038 | | | | 700 | | 727 | |
Health Care Equipment & Supplies (0.0%) | | | | | | | |
Fresenius Medical Care Capital Trust II | | | | | | | |
7.88%, due 02/01/2008 | | | | 237 | | 237 | |
Health Care Providers & Services (0.0%) | | | | | | | |
HCA, Inc. | | | | | | | |
9.25%, due 11/15/2016 | | | | 600 | | 630 | |
Hotels, Restaurants & Leisure (0.3%) | | | | | | | |
Caesars Entertainment, Inc. | | | | | | | |
7.50%, due 09/01/2009 | | | | 800 | | 850 | |
Mandalay Resort Group | | | | | | | |
6.50%, due 07/31/2009 | | | | 2,300 | | 2,300 | |
9.50%, due 08/01/2008 | | | | 740 | | 755 | |
Independent Power Producers & Energy Traders (0.0%) | | | | | | | |
NRG Energy, Inc. | | | | | | | |
7.38%, due 02/01/2016 | | | | $ | 200 | | $ | 195 | |
Insurance (0.2%) | | | | | | | |
Metropolitan Life Global Funding I -144A | | | | | | | |
4.95%, due 05/17/2010 * | | | | 2,600 | | 2,581 | |
Machinery (0.1%) | | | | | | | |
Tyco International Group SA | | | | | | | |
6.38%, due 10/15/2011 | | | | 1,510 | | 1,563 | |
Media (0.0%) | | | | | | | |
Time Warner, Inc. | | | | | | | |
6.88%, due 05/01/2012 | | | | 410 | | 432 | |
Office Electronics (0.2%) | | | | | | | |
Xerox Corp. | | | | | | | |
9.75%, due 01/15/2009 | | | | 2,200 | | 2,300 | |
Oil, Gas & Consumable Fuels (1.3%) | | | | | | | |
Chesapeake Energy Corp. | | | | | | | |
7.00%, due 08/15/2014 | | | | 300 | | 301 | |
Dynegy Holdings, Inc. | | | | | | | |
7.50%, due 06/01/2015 | | | | 400 | | 374 | |
El Paso Corp. | | | | | | | |
7.75%, due 01/15/2032 | | | | 425 | | 431 | |
7.80%, due 08/01/2031 | | | | 125 | | 127 | |
El Paso Natural Gas | | | | | | | |
7.00%, due 06/15/2017 | | | | 100 | | 100 | |
Enterprise Products Operating, LP | | | | | | | |
4.95%, due 06/01/2010 | | | | 500 | | 500 | |
GAZ Capital for Gazprom , Reg S | | | | | | | |
8.63%, due 04/28/2034 | | | | 2,300 | | 2,875 | |
Kerr-McGee Corp. | | | | | | | |
6.88%, due 09/15/2011 | | | | 4,000 | | 4,257 | |
Ngpl Pipeco LLC -144A | | | | | | | |
7.12%, due 12/15/2017 | | | | 4,100 | | 4,204 | |
7.77%, due 12/15/2037 | | | | 1,700 | | 1,779 | |
Sonat, Inc. | | | | | | | |
7.63%, due 07/15/2011 | | | | 1,000 | | 1,022 | |
Southern Natural Gas Co. | | | | | | | |
8.00%, due 03/01/2032 | | | | 820 | | 914 | |
Williams Cos. | | | | | | | |
7.50%, due 01/15/2031 | | | | 300 | | 323 | |
Personal Products (0.3%) | | | | | | | |
Avon Products, Inc. | | | | | | | |
5.13%, due 01/15/2011 | | | | 4,000 | | 4,025 | |
Real Estate Investment Trusts (0.1%) | | | | | | | |
Ventas Realty, LP/Ventas Capital Corp. | | | | | | | |
8.75%, due 05/01/2009 | | | | 1,000 | | 1,025 | |
The notes to the financial statements are an integral part of this report.
10
| | | | Principal | | Value | |
Road & Rail (0.0%) | | | | | | | |
Norfolk Southern Corp. | | | | | | | |
6.75%, due 02/15/2011 | | | | $ | 550 | | $ | 589 | |
Thrifts & Mortgage Finance (0.9%) | | | | | | | |
Nykredit Realkredit A/S | | | | | | | |
5.00%, due 10/01/2038 * | | DKK | | 17,291 | | 3,210 | |
Realkredit Danmark A/S | | | | | | | |
5.00%, due 10/01/2038 * | | DKK | | 34,038 | | 6,292 | |
Wachovia Mortgage Fsb | | | | | | | |
5.64%, due 06/20/2008 * | | | | 2,000 | | 2,002 | |
Tobacco (0.1%) | | | | | | | |
Reynolds American, Inc. | | | | | | | |
7.63%, due 06/01/2016 | | | | 800 | | 850 | |
Wireless Telecommunication Services (0.4%) | | | | | | | |
America Movil SAB de CV | | | | | | | |
5.30%, due 06/27/2008 * | | | | 4,900 | | 4,875 | |
AT&T Mobility LLC | | | | | | | |
6.50%, due 12/15/2011 | | | | 560 | | 590 | |
| | | | | | | |
Total Corporate Debt Securities (cost $339,605) | | | | | | 343,659 | |
| | | | | | | | | |
| | | | Shares | | Value | |
PREFERRED STOCKS (0.5%) | | | | | | | |
Thrifts & Mortgage Finance (0.3%) | | | | | | | |
DG Funding Trust -144A * Ž, § | | | | 380 | | 4,010 | |
U.S. Government Agency Obligation (0.2%) | | | | | | | |
Fannie Mae ‡, Ž | | | | 101,000 | | 2,601 | |
Total Preferred Stocks (cost $6,567) | | | | | | 6,611 | |
| | | | Principal | | Value | |
COMMERCIAL PAPER (0.7%) | | | | | | | |
Commercial Banks (0.7%) | | | | | | | |
Abbey National NA LLC | | | | | | | |
4.25%, due 01/07/2008 | | | | $ | 9,100 | | $ | 9,094 | |
Total Commercial Paper (cost $9,094) | | | | | | 9,094 | |
| | | | | | | |
LOAN ASSIGNMENTS (0.3%) | | | | | | | |
Asset-Backed Securities (0.1%) | | | | | | | |
Kinder Morgan Term B | | | | | | | |
6.82%, due 05/24/2014 | | | | 2,000 | | 1,990 | |
Commercial Banks (0.2%) | | | | | | | |
Health Management Associates, Inc. | | | | | | | |
6.60%, due 02/28/2014 § | | | | 37 | | 34 | |
Health Management Associates, Inc. | | | | | | | |
6.58%, due 02/28/2014 ‡, § | | | | 2,749 | | 2,572 | |
Total Loan Assignments (cost $4,708) | | | | | | 4,596 | |
| | | | | | | | | |
| | Contracts (•) | | Value | |
PURCHASED OPTIONS (0.1%) | | | | | |
Covered Call Options (0.1%) | | | | | |
2 Year Note Future | | 400 | | $ | 6 | |
Call Strike $117.50 | | | | | |
Expires 02/22/2008 | | | | | |
2 Year Note Future | | 135 | | 2 | |
Call Strike $120.00 | | | | | |
Expires 02/22/2008 | | | | | |
2 Year Note Future | | 975 | | 15 | |
Call Strike $116.00 | | | | | |
Expires 02/22/2008 | | | | | |
5 Year Note Future | | 830 | | 13 | |
Call Strike $125.00 | | | | | |
Expires 01/25/2008 | | | | | |
5 Year Note Future | | 800 | | 13 | |
Call Strike $118.00 | | | | | |
Expires 02/22/2008 | | | | | |
90-Day Euro Dollar Futures | | 468 | | 614 | |
Call Strike $95.25 | | | | | |
Expires 03/17/2008 | | | | | |
90-Day Euro Dollar Futures | | 106 | | 84 | |
Call Strike $95.50 | | | | | |
Expires 03/17/2008 | | | | | |
JPY Currency Future | | 4,300,000 | | 4 | |
Call Strike $121.00 | | | | | |
Expires 01/18/2008 § | | | | | |
JPY Currency Future | | 6,800,000 | | 354 | |
Call Strike $104.00 | | | | | |
Expires 03/17/2010 § | | | | | |
JPY Currency Future | | 4,600,000 | | 206 | |
Call Strike $105.40 | | | | | |
Expires 03/31/2010 § | | | | | |
US Treasury Note Future | | 1,423 | | 22 | |
Call Strike $141.00 | | | | | |
Expires 02/22/2008 | | | | | |
Put Options (0.0%) | | | | | |
90-Day Euro Dollar Futures | | 332 | | 2 | |
Put Strike $91.50 | | | | | |
Expires 03/17/2008 | | | | | |
90-Day Euro Dollar Futures | | 852 | | 5 | |
Put Strike $91.75 | | | | | |
Expires 03/17/2008 | | | | | |
90-Day Euro Dollar Futures | | 565 | | 4 | |
Put Strike $93.00 | | | | | |
Expires 03/17/2008 | | | | | |
| | | | | | |
The notes to the financial statements are an integral part of this report.
11
| | Contracts (·) | | Value | |
Put Options (continued) | | | | | | |
90-Day Euro Dollar Futures | | 529 | | $ | 3 | |
Put Strike $92.50 | | | | | |
Expires 06/16/2008 | | | | | |
JPY Currency Future | | 6,800,000 | | 312 | |
Put Strike $104.00 | | | | | |
Expires 03/17/2010 § | | | | | |
JPY Currency Future | | 4,600,000 | | 238 | |
Put Strike $105.40 | | | | | |
Expires 03/31/2010 § | | | | | |
US Treasury Note Future | | 84 | | m | |
Put Strike $102.50 | | | | | |
Expires 02/22/2008 | | | | | |
| | | | | |
Total Purchased Options (cost $1,565) | | | | 1,897 | |
| | Notional Amount | | Value | |
PURCHASED SWAPTIONS (1.5%) | | | | | |
Covered Call Options (1.4%) | | | | | |
JPY Currency Future | | | | | |
Call Strike $104.00 | | | | | |
Expires 03/17/2010 § | | 1,500 | | $ | 78 | |
JPY Currency Future | | | | | |
Call Strike $148.40 | | | | | |
Expires 06/03/2010 § | | 1,800 | | 168 | |
LIBOR Rate Swaption | | | | | |
Call Strike $4.75 | | | | | |
Expires 02/01/2008 § | | 35,900 | | 274 | |
LIBOR Rate Swaption | | | | | |
Call Strike $5.00 | | | | | |
Expires 02/01/2008 § | | 32,600 | | 770 | |
LIBOR Rate Swaption | | | | | |
Call Strike $4.75 | | | | | |
Expires 03/31/2008 § | | 143,400 | | 2,933 | |
LIBOR Rate Swaption | | | | | |
Call Strike $4.75 | | | | | |
Expires 09/26/2008 § | | 68,500 | | 1,452 | |
LIBOR Rate Swaption | | | | | |
Call Strike $4.75 | | | | | |
Expires 09/26/2008 § | | 57,700 | | 1,223 | |
LIBOR Rate Swaption | | | | | |
Call Strike $4.75 | | | | | |
Expires 12/15/2008 § | | 101,900 | | 2,103 | |
LIBOR Rate Swaption | | | | | |
Call Strike $5.00 | | | | | |
Expires 12/15/2008 § | | 158,900 | | 3,882 | |
LIBOR Rate Swaption | | | | | |
Call Strike $5.30 | | | | | |
Expires 08/03/2009 § | | 155,300 | | 3,916 | |
OTC EURO vs USD Currency | | | | | |
Call Strike $1.36 | | | | | |
Expires 05/19/2008 § | | 3,000 | | 310 | |
OTC EURO vs USD Currency | | | | | |
Call Strike $1.36 | | | | | |
Expires 05/21/2008 § | | 1,300 | | 8 | |
OTC EURO vs USD Currency | | | | | |
Call Strike $1.36 | | | | | |
Expires 05/21/2008 § | | 1,300 | | 142 | |
OTC EURO vs USD Currency | | | | | |
Call Strike $1.38 | | | | | |
Expires 05/21/2010 § | | 1,000 | | 101 | |
OTC EURO vs USD Currency | | | | | |
Call Strike $1.38 | | | | | |
Expires 05/21/2010 § | | 2,500 | | 252 | |
OTC EURO vs USD Currency | | | | | |
Call Strike $1.38 | | | | | |
Expires 06/03/2010 § | | 2,600 | | 262 | |
USD LIBOR Rate Swaption | | | | | |
Call Strike $4.36 | | | | | |
Expires 06/18/2013 § | | 27,600 | | 539 | |
IRO EURO Swaption | | | | | |
Expires 09/14/2009 § | | 98,000 | | 427 | |
Put Options (0.1%) | | | | | |
Fannie Mae TBA | | | | | |
Put Strike $86.59 | | | | | |
Expires 02/05/2008 § | | 60,000 | | m | |
Fannie Mae TBA | | | | | |
Put Strike $86.47 | | | | | |
Expires 02/05/2008 § | | 40,000 | | m | |
Fannie Mae TBA | | | | | |
Put Strike $86.50 | | | | | |
Expires 02/05/2008 § | | 30,000 | | m | |
Fannie Mae TBA | | | | | |
Put Strike $84.02 | | | | | |
Expires 02/05/2008 § | | 5,000 | | m | |
Fannie Mae TBA | | | | | |
Put Strike $88.50 | | | | | |
Expires 02/05/2008 § | | 70,800 | | m | |
Fannie Mae TBA | | | | | |
Put Strike $91.00 | | | | | |
Expires 02/05/2008 § | | 51,000 | | m | |
Fannie Mae TBA | | | | | |
Put Strike $90.00 | | | | | |
Expires 02/05/2008 § | | 36,000 | | m | |
Fannie Mae TBA | | | | | |
Put Strike $87.78 | | | | | |
Expires 02/05/2008 § | | 13,000 | | m | |
Fannie Mae TBA | | | | | |
Put Strike $86.00 | | | | | |
Expires 03/05/2008 § | | 31,000 | | 1 | |
Fannie Mae TBA | | | | | |
Put Strike $91.00 | | | | | |
Expires 03/05/2008 § | | 39,000 | | 1 | |
Freddie Mac TBA | | | | | |
Put Strike $88.50 | | | | | |
Expires 02/05/2008 § | | 17,000 | | m | |
| | | | | | |
The notes to the financial statements are an integral part of this report.
12
| | Notional Amount | | Value | |
Put Options (continued) | | | | | |
JPY Currency Future | | | | | |
Put Strike $104.00 | | | | | |
Expires 03/17/2010 § | | 1,500 | | $ | 69 | |
JPY Currency Future | | | | | |
Put Strike $148.40 | | | | | |
Expires 06/03/2010 § | | 1,800 | | 144 | |
OTC EURO vs USD Currency | | | | | |
Put Strike $1.36 | | | | | |
Expires 05/19/2008 § | | 3,000 | | 22 | |
OTC EURO vs USD Currency | | | | | |
Put Strike $1.36 | | | | | |
Expires 05/21/2008 § | | 7,100 | | 777 | |
OTC EURO vs USD Currency | | | | | |
Putl Strike $1.38 | | | | | |
Expires 06/03/2010 § | | 2,600 | | 106 | |
OTC EURO vs USD Currency | | | | | |
Put Strike $1.38 | | | | | |
Expires 05/21/2010 § | | 2,500 | | 101 | |
OTC EURO vs USD Currency | | | | | |
Put Strike $1.36 | | | | | |
Expires 05/21/2008 § | | 7,100 | | 45 | |
OTC EURO vs USD Currency | | | | | |
Put Strike $1.38 | | | | | |
Expires 05/21/2010 § | | 1,000 | | 41 | |
Total Purchased Swaptions (cost $6,003) | | | | 20,147 | |
Total Investment Securities (cost $2,007,112) # | | | | $ | 2,033,740 | |
| | Contracts (•) | | Value | |
WRITTEN OPTIONS - 0.2% | | | | | |
1-Year EURO Dollar | | | | | |
Call Strike $95.75 | | | | | |
Expires 3/14/2008 | | 53 | | $ | 121 | |
Covered Call Options - 0.2% | | | | | |
1-Year EURO Dollar | | | | | |
Call Strike $95.88 | | | | | |
Expires 3/14/2008 | | 53 | | 106 | |
90-Day Euro Dollar Futures | | | | | |
Call Strike $95.75 | | | | | |
Expires 3/17/2008 | | 586 | | 245 | |
90-Day Euro Dollar Futures | | | | | |
Call Strike $96.00 | | | | | |
Expires 3/17/2008 | | 283 | | 57 | |
U.S. Treasury Bond Future | | | | | |
Call Strike $117.00 | | | | | |
Expires 2/22/2008 | | 218 | | 381 | |
US Treasury Note Future | | | | | |
Call Strike $111.00 | | | | | |
Expires 2/22/2008 | | 485 | | 1,379 | |
Put Options - 0.0% | | | | | |
10-Year U.S. Treasury Note Future | | 485 | | $ | 8 | |
Put Strike $106.00 | | | | | |
Expires 2/22/2008 | | | | | |
Total Written Options
(premiums: $1,485) | | | | $ | 2,297 | |
| | Notional Amount | | Value | |
WRITTEN SWAPTIONS - 1.0% | | | | | |
Put Swaptions - 0.1% | | | | | |
USD LIBOR Rate Swaption | | $ | 46,100 | | $ | 316 | |
Put Strike $5.40 | | | | | |
Expires 3/16/2009 | | | | | |
USD LIBOR Rate Swaption | | 46,100 | | 317 | |
Put Strike $5.40 | | | | | |
Expires 3/16/2009 | | | | | |
Covered Call Swaptions - 0.9% | | | | | |
LIBOR Rate Swaption | | 14,200 | | 600 | |
Call Strike $5.10 | | | | | |
Expires 2/1/2008 | | | | | |
LIBOR Rate Swaption | | 18,000 | | 670 | |
Call Strike $4.95 | | | | | |
Expires 3/31/2008 | | | | | |
LIBOR Rate Swaption | | 44,100 | | 1,557 | |
Call Strike $4.90 | | | | | |
Expires 3/31/2008 | | | | | |
LIBOR Rate Swaption | | 29,800 | | 1,104 | |
Call Strike $4.95 | | | | | |
Expires 9/26/2008 | | | | | |
LIBOR Rate Swaption | | 25,100 | | 930 | |
Call Strike $4.95 | | | | | |
Expires 9/26/2008 | | | | | |
LIBOR Rate Swaption | | 34,200 | | 1,364 | |
Call Strike $5.00 | | | | | |
Expires 12/15/2008 | | | | | |
LIBOR Rate Swaption | | 53,000 | | 2,538 | |
Call Strike $5.20 | | | | | |
Expires 12/15/2008 | | | | | |
LIBOR Rate Swaption | | 67,500 | | 3,305 | |
Call Strike $5.50 | | | | | |
Expires 8/3/2009 | | | | | |
LIBOR Rate Swaption | | 7,900 | | 265 | |
Call Strike $4.90 | | | | | |
Expires 2/5/2013 | | | | | |
IRO EURO Swaption | | 31,600 | | 378 | |
Call Strike $4.25 | | | | | |
Expires 9/14/2009 | | | | | |
Total Swaptions Written (premiums: $5,044) | | | | $ | 13,344 | |
| | | | | | | |
The notes to the financial statements are an integral part of this report.
13
SWAP AGREEMENTS
| | | | | | Net Unrealized | |
| | Expiration | | Notional | | Appreciation | |
| | Date | | Amount | | (Depreciation) | |
Receive a fixed rate equal to 0.06% and the Fund will pay to the counterparty at the notional amount in the event of default of American International Group Inc. 5.60% due 10/18/2016
Counterparty: Lehman Brothers | | 03/10/08 | | $ | 8,100 | | $ | (11 | ) |
| | | | | | | |
Receive a fixed rate equal to 0.26% and the Fund will pay to the counterparty at the notional amount in the event of default of Republic of Panama Government Bond 8.875% due 09/30/2027.
Counterparty: Barclays Bank PLC | | 12/20/08 | | 4,500 | | (9 | ) |
| | | | | | | |
Receive a fixed rate equal to 0.40% and the Fund will pay to the counterparty at the notional amount in the event of default of Republic of Indonesia Government Bond 6.75% due 03/10/2014.
Counterparty: Royal Bank of Scotland PLC | | 12/22/08 | | 700 | | (3 | ) |
| | | | | | | |
Receive a fixed rate equal to 0.463% and the Fund will pay to the counterparty in the event of default on any of the securities in the Dow Jones CDX.IG.5 10 Year Index the remaining interest payments on those defaulted securities.
Counterparty: Morgan Stanley | | 12/21/15 | | 9,600 | | (395 | ) |
| | | | | | | |
Receive a fixed rate equal to 0.48% and the Fund will pay in the event of default on any of the securities in the Dow Jones CDX.HY-8 100 Index, the remaining interest payments on those defaulted securities.
Counterparty: Barclays Bank PLC | | 06/20/12 | | 7,600 | | (107 | ) |
| | | | | | | |
Receive a fixed rate equal to 0.71% and the Fund will pay to the counterparty at the notional amount in the event of default of Ukraine Government Bond 7.65% due 06/11/2013.
Counterparty: Barclays Bank PLC | | 12/20/08 | | $ | 700 | | $ | (2 | ) |
| | | | | | | |
Receive a fixed rate equal to 0.72% and the Fund will pay to the counterparty at the notional amount in the event of default of Ukraine Government Bond 7.65% due 06/11/2013.
Counterparty: Deutsche Bank AG | | 12/20/08 | | 700 | | (2 | ) |
| | | | | | | |
Receive a fixed rate equal to 1.94% and the Fund will pay a floating rate based on FRC-Excluding Tobacco-Non-Revised Consumer Price Index.
Counterparty: Royal Bank of Scotland PLC | | 04/10/12 | | EUR | 1,600 | | (33 | ) |
| | | | | | | |
Receive a fixed rate equal to 1.94% and the Fund will pay a floating rate based on FRC-Excluding Tobacco-Non-Revised Consumer Price Index.
Counterparty: BNP Paribas | | 04/10/12 | | EUR | 1,500 | | (34 | ) |
| | | | | | | |
Receive a fixed rate equal to 1.95% and the Fund will pay a floating rate based on FRC-Excluding Tobacco-Non-Revised Consumer Price Index.
Counterparty: Barclays Bank PLC | | 03/15/12 | | EUR | 3,200 | | (61 | ) |
| | | | | | | | | | |
The notes to the financial statements are an integral part of this report.
14
| | | | | | Net Unrealized | |
| | Expiration | | Notional | | Appreciation | |
| | Date | | Amount | | (Depreciation) | |
Receive a fixed rate equal to 1.95% and the Fund will pay a floating rate based on FRC-Excluding Tobacco-Non-Revised Consumer Price Index.
Counterparty: JPMorgan Chase | | 03/15/12 | | EUR $ | 1,800 | | $ | (35 | ) |
| | | | | | | |
Receive a fixed rate equal to 1.95% and the Fund will pay a floating rate based on FRC-Excluding Tobacco-Non-Revised Consumer Price Index.
Counterparty: Royal Bank of Scotland | | 03/30/12 | | EUR | 1,100 | | (21 | ) |
| | | | | | | |
Receive a fixed rate equal to 1.98% and the Fund will pay a floating rate based on FRC-Excluding Tobacco-Non-Revised Consumer Price Index.
Counterparty: Barclays Bank PLC | | 04/30/12 | | EUR | 1,200 | | (23 | ) |
| | | | | | | |
Receive a fixed rate equal to 1.96% and the Fund will pay a floating rate based on FRC-Excluding Tobacco-Non-Revised Consumer Price Index.
Counterparty: Royal Bank of Scotland | | 03/28/12 | | EUR | 1,000 | | (18 | ) |
| | | | | | | |
Receive a fixed rate equal to 1.96% and the Fund will pay a floating rate based on FRC-Excluding Tobacco-Non-Revised Consumer Price Index.
Counterparty: Goldman Sachs | | 03/30/12 | | EUR | 1,100 | | (20 | ) |
| | | | | | | |
Receive a fixed rate equal to 1.96% and the Fund will pay a floating rate based on FRC-Excluding Tobacco-Non-Revised Consumer Price Index.
Counterparty: Barclays Bank PLC | | 04/05/12 | | EUR | 600 | | (11 | ) |
| | | | | | | |
Receive a fixed rate equal to 1.96% and the Fund will pay a floating rate based on FRC-Excluding Tobacco-Non-Revised Consumer Price Index.
Counterparty: JPMorgan Chase | | 04/10/12 | | EUR $ | 400 | | $ | (8 | ) |
| | | | | | | |
Receive a fixed rate equal to 1.97% and the Fund will pay a floating rate based on FRC-Excluding Tobacco-Non-Revised Consumer Price Index.
Counterparty: Lehman Brothers | | 03/15/12 | | EUR | 1,000 | | (16 | ) |
| | | | | | | |
Receive a fixed rate equal to 10.12% and the Fund will pay a floating rate based on the Brazilian Real-CDI.
Counterparty: Morgan Stanley | | 01/02/12 | | BRL | 44,400 | | (798 | ) |
| | | | | | | |
Receive a fixed rate equal to 10.15% and the Fund will pay a floating rate based on the Brazilian Real-CDI.
Counterparty: Goldman Sachs | | 01/02/12 | | BRL | 69,600 | | (2,739 | ) |
| | | | | | | |
Receive a fixed rate equal to 10.58% and the Fund will pay a floating rate based on the Brazilian Real-CDI.
Counterparty: UBS AG | | 01/02/12 | | BRL | 55,900 | | (979 | ) |
| | | | | | | |
Receive a fixed rate equal to 12.54% and the Fund will pay a floating rate based on the Brazilian Real-CDI.
Counterparty: Barclays Bank PLC | | 01/02/12 | | BRL | 27,500 | | (119 | ) |
| | | | | | | |
Receive a fixed rate equal to 12.54% and the Fund will pay a floating rate based on the Brazilian Real-CDI.
Counterparty: Merrill Lynch | | 01/02/12 | | BRL | 20,200 | | (37 | ) |
| | | | | | | | | | |
The notes to the financial statements are an integral part of this report.
15
| | | | | | Net Unrealized | |
| | Expiration | | Notional | | Appreciation | |
| | Date | | Amount | | (Depreciation) | |
Receive a fixed rate equal to 12.67% and the Fund will pay a floating rate based on the Brazilian Real-CDI.
Counterparty: Merrill Lynch | | 01/04/10 | | BRL $ | 15,700 | | $ | 74 | |
| | | | | | | |
Receive a fixed rate equal to 1.95% and the Fund will pay a floating rate based on FRC–Excluding Tobacco-Non-Revised Consumer Price Index.
Counterparty: Goldman Sachs Capital Markets | | 03/15/12 | | EUR | 3,300 | | (50 | ) |
| | | | | | | |
Receive a fixed rate equal to 2.09% and the Fund will pay a floating rate based on FRC Excluding Tobacco-Non-Revised Consumer Price Index.
Counterparty: BNP Paribas (§) | | 10/15/10 | | EUR | 5,000 | | 32 | |
| | | | | | | |
Receive a fixed rate equal to 2.1025% and the Fund will pay a floating rate based on FRC Excluding Tobacco-Non-Revised Consumer Price Index.
Counterparty: Barclays Bank PLC (§) | | 10/15/10 | | EUR | 2,500 | | 24 | |
| | | | | | | |
Receive a fixed rate equal to 2.1455% and the Fund will pay a floating rate based on FRC Excluding Tobacco-Non-Revised Consumer Price Index.
Counterparty: UBS AG (§) | | 10/15/10 | | EUR | 6,300 | | 64 | |
| | | | | | | |
Receive a fixed rate equal to 4.50% and pay a floating rate based on 6-month EURIBOR
Counterparty: Lehman Securities | | 03/19/10 | | EUR | 85,000 | | (190 | ) |
| | | | | | | |
Receive a fixed rate equal to 4.50% and pay a floating rate based on 6-month EURIBOR
Counterparty: Goldman Sachs | | 09/21/09 | | EUR | 2,800 | | (10 | ) |
| | | | | | | |
Receive a fixed rate equal to 5.00% and pay a floating rate based on 3-month United States Dollar-LIBOR.
Counterparty: Deutsche Bank AG | | 12/15/35 | | $ | 20,100 | | $ | (310 | ) |
| | | | | | | |
Pay a fixed rate equal to 6.00% and receive a floating rate based on 3-month United States Dollar-LIBOR.
Counterparty: Lehman Securities | | 06/19/34 | | EUR | 600 | | (14 | ) |
| | | | | | | |
Receive a fixed rate equal to 5.00% and pay a floating rate based on 6-month British Pound-LIBOR
Counterparty: Goldman Sachs Capital Markets | | 09/15/15 | | GBP | 900 | | (3 | ) |
| | | | | | | |
Receive a fixed rate equal to 5.00% and pay a floating rate based on 6-month EURIBOR
Counterparty: UBS AG (§) | | 07/13/37 | | EUR | 1,000 | | 17 | |
| | | | | | | |
Receive a fixed rate equal to 5.00% and the Fund will pay a floating rate based on 6-month British Pound– LIBOR
Counterparty: Barclays Bank PLC | | 09/15/10 | | BP | 16,300 | | 338 | |
| | | | | | | |
Receive a fixed rate equal to 5.00% and the Fund will pay a floating rate based on 6-month British Pound–LIBOR
Counterparty: Royal Bank of Scotland PLC | | 09/15/10 | | GBP | 3,100 | | 67 | |
| | | | | | | |
Pay a fixed rate equal to 5.00% and the Fund will receive a floating rate based on the 3-month United States Dollar- LIBOR.
Counterparty: Goldman Sachs | | 06/19/23 | | 64,900 | | (454 | ) |
| | | | | | | |
Receive a fixed rate equal to 5.00% and the Fund will pay a floating rate based on the 3-month United States Dollar-LIBOR.
Counterparty: UBS AG (§) | | 06/18/09 | | 105,600 | | 1,610 | |
The notes to the financial statements are an integral part of this report.
16
| | | | | | Net Unrealized | |
| | Expiration | | Notional | | Appreciation | |
| | Date | | Amount | | (Depreciation) | |
Receive a fixed rate equal to 5.50% and the Fund will pay a floating rate based on the 6-month Great British Pound-LIBOR.
Counterparty: Lehman Securities, Inc.(§) | | 03/20/13 | | GBP $ | 5,800 | | $ | 228 | |
| | | | | | | |
Receive a fixed rate equal to 7.00% and the Fund will pay a floating rate based on the 3-month Australian Dollar- Bank Bill Rate-BBSW (AUD-BBR-BBSW.)
Counterparty: Lehman Securities Inc. | | 09/15/09 | | AUD | 30,100 | | (58 | ) |
| | | | | | | |
Receive a fixed rate equal to 7.00% and the Fund will pay a floating rate based on the 3-month Australian Dollar- Bank Bill Rate-BBSW (AUD-BBR-BBSW.)
Counterparty: Citibank NA. | | 09/15/09 | | AUD | 22,700 | | (48 | ) |
| | | | | | | |
Receive a fixed rate equal to 7.00% and the Fund will pay a floating rate based on the 6-month Australian Dollar- Bank Bill Rate- BBSW (AUD-BBR-BBSW.)
Counterparty: Deutsche Bank AG | | 06/15/10 | | AUD | 62,900 | | (762 | ) |
| | | | | | | |
Receive a fixed rate equal to 7.00% and the Fund will pay a floating rate based on the 6-month Australian Dollar- Bank Bill Rate- BBSW (AUD-BBR-BBSW.)
Counterparty: Morgan Stanley | | 06/15/10 | | AUD | 30,100 | | (315 | ) |
| | | | | | | |
Receive a fixed rate equal to 7.91% and the Fund will pay a floating rate based on the Mexican Peso Interbank Equilibrium Interest Rate (TI IE)-Banxico.
Counterparty: Morgan Stanley | | 05/14/09 | | MXN | 258,000 | | (105 | ) |
| | | | | | | |
Receive a fixed rate equal to 7.91% and the Fund will pay a floating rate based on the Mexican Peso Interbank Equilibrium Interest Rate (TI IE)-Banxico.
Counterparty: Citibank NA. | | 05/14/09 | | MXN $ | 174,000 | | $ | (69 | ) |
| | | | | | | |
Receive a floating rate based on 6-month British Pound-LIBOR and pay a fixed rate equal to 4.00%.
Counterparty: Barclays Bank PLC (§) | | 12/17/35 | | GBP | 1,500 | | 96 | |
| | | | | | | |
Receive a floating rate based on 6-month British Pound-LIBOR and pay a fixed rate equal to 4.00%.
Counterparty: Morgan Stanley Capital Services Inc. (§) | | 12/17/35 | | GBP | 6,800 | | 3 | |
| | | | | | | |
Receive a floating rate based on 6-month British Pound-LIBOR and pay a fixed rate equal to 4.50%.
Counterparty: Deutsche Bank AG | | 12/17/35 | | GBP | 10,100 | | (357 | ) |
| | | | | | | |
Receive a floating rate based on 6-month British Pound-LIBOR and pay a fixed rate equal to 5.00%.
Counterparty: Deutsche Bank AG (§) | | 09/20/17 | | GBP | 10,800 | | (652 | ) |
| | | | | | | |
Receive a floating rate based on 6-month-EURIBOR and the Fund will pay a fixed rate equal to 4.00%.
Counterparty: Barclays Bank PLC (§) | | 12/15/11 | | EUR | 82,400 | | (425 | ) |
| | | | | | | | | | | | | | | |
The notes to the financial statements are an integral part of this report.
17
| | | | | | Net Unrealized | |
| | Expiration | | Notional | | Appreciation | |
| | Date | | Amount | | (Depreciation) | |
Pay a floating rate based on 6-month-EURIBOR and the Fund will receive a fixed rate equal to 4.50%.
Counterparty: JPMorgan Chase | | 03/19/10 | | EUR $ | 20,570 | | $ | 14 | |
| | | | | | | |
Pay a floating rate based on 6-month-EURIBOR and the Fund will receive a fixed rate equal to 4.50%.
Counterparty: Morgan Stanley | | 03/19/10 | | EUR | 13,130 | | 9 | |
| | | | | | | |
Receive a floating rate based on 6-month-Great Brish Pound-LIBOR and the Fund will pay a fixed rate equal to 6.00%.
Counterparty: Barclays Bank PLC | | 06/19/09 | | GBP | 22,600 | | (499 | ) |
| | | | | | | |
Receive a floating rate based on a 6-month Japanese Yen-LIBOR and pay a fixed rate equal to 1.50%.
Counterparty: Morgan Stanley | | 06/22/15 | | JPY | 960,00 | | (30 | ) |
| | | | | | | |
Pay a floating rate based on the 3-month United States Dollar-LIBOR and receive a fixed rate equal to 4.00%.
Counterparty: Deutsche Bank AG (§) | | 06/18/10 | | 39,500 | | 127 | |
| | | | | | | |
Pay a floating rate based on the 3-month United States Dollar-LIBOR and receive a fixed rate equal to 4.00%.
Counterparty: JPMorgan Chase | | 06/18/13 | | 103,100 | | 802 | |
| | | | | | | |
Pay a floating rate based on the 3-month United States Dollar-LIBOR and receive a fixed rate equal to 4.00%.
Counterparty: Royal Bank of Scotland PLC (§) | | 06/18/10 | | 113,000 | | 110 | |
| | | | | | | |
Pay a floating rate based on the 3-month United States Dollar-LIBOR and receive a fixed rate equal to 4.00%.
Counterparty: Merrill Lynch International (§) | | 06/18/10 | | $ | 76,700 | | $ | 94 | |
| | | | | | | |
Pay a floating rate based on the 3-month United States Dollar-LIBOR and receive a fixed rate equal to 4.00%.
Counterparty: Citibank NA. (§) | | 06/18/10 | | 41,200 | | 53 | |
| | | | | | | |
Pay a floating rate based on the 3-month United States Dollar-LIBOR and receive a fixed rate equal to 4.00%.
Counterparty: Barclays Bank PLC (§) | | 06/18/10 | | 122,900 | | 292 | |
| | | | | | | |
Pay a floating rate based on the 3-month United States Dollar-LIBOR and receive a fixed rate equal to 4.00%.
Counterparty: Merrill Lynch | | 06/18/13 | | 13,500 | | 45 | |
| | | | | | | |
Pay a floating rate based on the 3-month United States Dollar-LIBOR and receive a fixed rate equal to 4.00%.
Counterparty: Morgan Stanley Capital Services Inc. (§) | | 06/18/10 | | 21,100 | | 116 | |
| | | | | | | |
Receive a floating rate based on the 3-month United States Dollar-LIBOR and pay a fixed rate equal to 4.00%.
Counterparty: Royal Bank of Scotland PLC | | 06/18/13 | | 76,700 | | 735 | |
| | | | | | | | | | |
The notes to the financial statements are an integral part of this report.
18
| | | | | | Net Unrealized | |
| | Expiration | | Notional | | Appreciation | |
| | Date | | Amount | | (Depreciation) | |
Pay a floating rate based on the 3-month United States Dollar-LIBOR and receive a fixed rate equal to 4.00%.
Counterparty: Barclays Bank PLC | | 06/18/13 | | $ | 33,400 | | $ | 239 | |
| | | | | | | |
Pay a floating rate based on the 3-month United States Dollar-LIBOR and receive a fixed rate equal to 4.00%.
Counterparty: Morgan Stanley | | 06/18/13 | | 18,100 | | 134 | |
| | | | | | | |
Receive a floating rate based on the 3-month United States Dollar-LIBOR and pay a fixed rate equal to 5.00%.
Counterparty: JPMorgan Chase | | 03/18/14 | | 23,500 | | (616 | ) |
| | | | | | | |
Receive a floating rate based on the 3-month United States Dollar-LIBOR and pay a fixed rate equal to 5.00%.
Counterparty: Citibank NA. | | 03/18/14 | | 17,100 | | (467 | ) |
| | | | | | | |
Pay a floating rate based on the 3-month United States Dollar-LIBOR and receive a fixed rate equal to 5.00%.
Counterparty: Barclays Bank PLC (§) | | 06/18/10 | | 46,200 | | 202 | |
| | | | | | | |
Receive a floating rate based on the 3-month United States Dollar-LIBOR and pay a fixed rate equal to 5.00%.
Counterparty: Barclays Bank PLC | | 06/18/18 | | 18,700 | | 131 | |
| | | | | | | |
Receive a floating rate based on the 3-month United States Dollar-LIBOR and pay a fixed rate equal to 5.00%.
Counterparty: Royal Bank of Scotland PLC | | 06/18/18 | | $ | 26,200 | | $ | (183 | ) |
| | | | | | | |
Pay a floating rate based on the 3-month United States Dollar-LIBOR and receive a fixed rate equal to 5.00%.
Counterparty: Deutsche Bank AG (§) | | 06/18/15 | | 12,800 | | (9 | ) |
| | | | | | | |
Receive a floating rate based on the 3-month United States Dollar-LIBOR and pay a fixed rate equal to 5.00%.
Counterparty: Royal Bank of Scotland PLC (§) | | 06/18/38 | | 4,000 | | (101 | ) |
| | | | | | | |
Receive a floating rate based on the 3-month United States Dollar-LIBOR and pay a fixed rate equal to 5.00%.
Counterparty: Deutsche Bank AG (§) | | 06/18/38 | | 6,300 | | (170 | ) |
| | | | | | | |
Receive a floating rate based on the 3-month United States Dollar-LIBOR and pay a fixed rate equal to 5.00%.
Counterparty: Deutsche Bank AG | | 06/19/28 | | 12,700 | | (316 | ) |
| | | | | | | |
Receive a floating rate based on the 3-month United States Dollar-LIBOR and pay a fixed rate equal to 5.00%.
Counterparty: Deutsche Bank AG | | 06/19/23 | | 61,500 | | (1,276 | ) |
The notes to the financial statements are an integral part of this report.
19
| | | | | | Net Unrealized | |
| | Expiration | | Notional | | Appreciation | |
| | Date | | Amount | | (Depreciation) | |
Receive a floating rate based on the 3-month United States Dollar-LIBOR and pay a fixed rate equal to 5.00%.
Counterparty: Morgan Stanley Capital Services Inc. (§) | | 06/18/38 | | $ | 43,500 | | $ | (592 | ) |
| | | | | | | |
Receive from the Counterparty a fixed rate equal to 0.17% and the Fund will pay at the notional amount in the event of default of Goldman Sachs Group, Inc., 6.60%, due 1/15/2012.
Counterparty: UBS AG | | 09/22/08 | | 4,600 | | (19 | ) |
| | | | | | | |
Receive from the Counterparty a fixed rate equal to 0.19% and the Fund will pay at the notional amount in the event of default of Morgan Stanley, 6.60%, due 4/1/2012.
Counterparty: UBS AG | | 09/22/08 | | 4,600 | | (30 | ) |
| | | | | | | |
Pay from the Counterparty a fixed rate equal to 0.50% and the Fund will receive the notional amount in the event of default of JPMorgan Chase & Co., 6.00%, due 1/15/2018.
Counterparty: BNP Paribas (§) | | 12/20/17 | | 4,000 | | 2 | |
| | | | | | | |
Pay from the Counterparty a fixed rate equal to 0.56% and the Fund will receive the notional amount in the event of default of JPMorgan Chase & Co., 6.00%, due 1/15/2018.
Counterparty: BNP Paribas (§) | | 12/20/17 | | 6,000 | | 26 | |
| | | | | | | |
Receive from the Counterparty a fixed rate equal to 0.82% and the Fund will pay at the notional amount in the event of default of Goldman Sachs Group, Inc., 6.60%, due 1/15/2012.
Counterparty: BNP Paribas (§) | | 09/20/12 | | 200 | | 1 | |
| | | | | | | |
Receive from the Counterparty a fixed rate equal to 0.92% and the Fund will pay at the notional amount in the event of default of Goldman Sachs Group, Inc., 6.60%, due 1/15/2012.
Counterparty: Citibank NA (§) | | 09/20/12 | | $ | 1,400 | | $ | 15 | |
| | | | | | | |
Receive from the Counterparty a fixed rate equal to 0.95% and the Fund will pay at the notional amount in the event of default of Merrill Lynch & Co., 5.00%, due 1/15/2015.
Counterparty: UBS AG | | 09/20/12 | | 1,400 | | (19 | ) |
| | | | | | | |
Receive from the Counterparty a fixed rate equal to 1.28% and the Fund will pay at the notional amount in the event of default of Reynolds American Inc., 7.63%, due 6/1/2016.
Counterparty: Goldman Sachs Capital Markets, LP (§) | | 06/20/17 | | 2,100 | | 35 | |
| | | | | | | |
Receive from the Counterparty a fixed rate equal to 3.10% and the Fund will pay at the notional amount in the event of default of SLM Corp SP, 5.125%, due 8/27/2012.
Counterparty: Barclays Bank PLC | | 12/22/08 | | 4,000 | | (1 | ) |
| | | | | | | |
Receive from the Counterparty a fixed rate equal to 3.20% and the Fund will pay at the notional amount in the event of default of SLM Corp SP, 5.125%, due 8/27/2012.
Counterparty: BNP Paribas (§) | | 12/22/08 | | 4,000 | | 3 | |
| | | | | | | |
Receive from the Counterparty at the notional amount in the event of default of AutoZone, Inc., 5.88%, due 10/15/2012, and the Fund will pay a fixed rate equal to 0.67%.
Counterparty: Royal Bank of Scotland PLC | | 06/20/17 | | 3,900 | | (22 | ) |
The notes to the financial statements are an integral part of this report.
20
| | | | | | Net Unrealized | |
| | Expiration | | Notional | | Appreciation | |
| | Date | | Amount | | (Depreciation) | |
Receive from the Counterparty at the notional amount in the event of default of Avebury Finance CDO PLC 7.05% due 01/08/2051 and the Fund will pay a fixed rate equal to 1.80%.
Counterparty: Merrill Lynch International (§) | | 01/09/51 | | $ | 10,000 | | $ | 8,582 | |
| | | | | | | |
Receive from the Counterparty at the notional amount in the event of default of Avon Products Inc. 5.125% due 01/15/2011 and the Fund will pay a fixed rate equal to 0.15%.
Counterparty: Credit Suisse International (§) | | 03/21/11 | | 4,000 | | 10 | |
| | | | | | | |
Receive from the Counterparty at the notional amount in the event of default of BFC Genesee CDO, Ltd. 2006-1A A3L, 7.00%, due 1/10/2041 and the Fund will pay a fixed rate equal to 2.25%.
Counterparty: Citibank NA (§) | | 01/10/41 | | 2,460 | | 2,112 | |
| | | | | | | |
Receive from the Counterparty at the notional amount in the event of default of Diamond Offshore Drill, Zero Coupon, due 6/6/2020 and the Fund will pay a fixed rate equal to 0.44%.
Counterparty: Citibank NA (§) | | 06/20/17 | | 3,700 | | 21 | |
| | | | | | | |
Receive from the Counterparty at the notional amount in the event of default of Glitnir Banki, 5.62%, due 4/20/2010, and the Fund will pay a fixed rate equal to 0.17%.
Counterparty: Royal Bank of Scotland PLC (§) | | 06/21/10 | | 500 | | 25 | |
| | | | | | | |
Receive from the Counterparty at the notional amount in the event of default of HSBC Finance Corp BP, 6.38%, due 10/15/2011 and the Fund will pay a fixed rate equal to 0.20%.
Counterparty: Royal Bank of Scotland PLC (§) | | 12/20/11 | | 2,000 | | 25 | |
| | | | | | | |
Receive from the Counterparty at the notional amount in the event of default of Kerr-Mcgee, Corp., 5.88%, due 9/15/2011, and the Fund will pay a fixed rate equal to 0.16%.
Counterparty: Royal Bank of Scotland PLC | | 09/20/11 | | $ | 4,100 | | $ | (3 | ) |
| | | | | | | |
Receive from the Counterparty at the notional amount in the event of default of Kraft Foods Inc. 5.625% due 11/1/2011 and the Fund will pay a fixed rate equal to 0.15%.
Counterparty: Credit Suisse International (§) | | 12/20/11 | | 4,000 | | 43 | |
| | | | | | | |
Receive from the Counterparty at the notional amount in the event of default of Limited Brands BP, due 6/20/2017 and the Fund will pay a fixed rate equal to 1.03%.
Counterparty: Goldman Sachs Capital Markets, LP (§) | | 06/20/17 | | 11,000 | | 962 | |
| | | | | | | |
Receive from the Counterparty at the notional amount in the event of default of Montauk Point CDO, Ltd. 2006-2A A4, 6.80%, due 4/06/2046 and the Fund will pay a fixed rate equal to 2.22%.
Counterparty: Credit Suisse International (§) | | 01/08/46 | | 2,500 | | 1,870 | |
| | | | | | | |
Receive from the Counterparty at the notional amount in the event of default of Morgan Stanley BP 5.84% due 10/15/2015 and the Fund will pay a fixed rate equal to 0.275%.
Counterparty: Royal Bank of Scotland PLC (§) | | 12/21/15 | | 1,100 | | 45 | |
| | | | | | | |
Receive from the Counterparty at the notional amount in the event of default of Nabors Industries, 5.38%, due 8/15/2012, and the Fund will pay a fixed rate equal to 0.47%.
Counterparty: Credit Suisse | | 06/20/12 | | 3,600 | | (2 | ) |
The notes to the financial statements are an integral part of this report.
21
| | | | | | Net Unrealized | |
| | Expiration | | Notional | | Appreciation | |
| | Date | | Amount | | (Depreciation) | |
Receive from the Counterparty at the notional amount in the event of default of Nordstrom, Inc., 6.95%, due 3/15/2028, and the Fund will pay a fixed rate equal to 0.29%.
Counterparty: JP Morgan Chase (§) | | 12/20/12 | | $ | 5,700 | | $ | 65 | |
| | | | | | | |
Receive from the Counterparty at the notional amount in the event of default of Weyerhaeuser Co, 6.75%, due 3/15/2012 and the Fund will pay a fixed rate equal to 0.96%.
Counterparty: UBS AG (§) | | 06/20/17 | | 1,600 | | 28 | |
| | | | | | | |
Receive from the Counterparty in the event of default on any of the securities in the Dow Jones CDX.IG.5 7 year Index the remaining interest payments on those defaulted securities and the Fund will pay a fixed rate equal to 0.142%.
Counterparty: Morgan Stanley Capital Services Inc. (§) | | 12/20/12 | | 13,400 | | 406 | |
| | | | | | | |
Receive from the Counterparty in the event of default on any of the securities in the iTraxx Europe HiVol Series Version 1 Index the remaining interest payments on those defaulted securities and the Fund will pay a fixed rate equal to 0.85%.
Counterparty: HSBC Bank USA (§) | | 12/20/16 | | EUR | 8,600 | | 109 | |
| | | | | | | |
Receive from the Counterparty in the event of default on any of the securities in the iTraxx Europe HiVol Series Version 1 Index the remaining interest payments on those defaulted securities and the Fund will pay a fixed rate equal to 0.85%.
Counterparty: Deutsche Bank AG (§) | | 12/20/16 | | EUR | 7,900 | | 99 | |
| | | | | | | |
Receive from the Counterparty, in the event of default on any of the securities in the Dow Jones CDX.HY-8 Index, the remaining interest payments on those defaulted securities and the Fund will pay a fixed rate equal to 2.75%.
Counterparty: Lehman Securities, Inc. (§) | | 06/20/12 | | $ | 3,100 | | $ | 76 | |
| | | | | | | |
Receive from the Counterparty, in the event of default on any of the securities in the Dow Jones CDX.HY-8 Index, the remaining interest payments on those defaulted securities and the Fund will pay a fixed rate equal to 2.75%.
Counterparty: Lehman Securities | | 06/20/12 | | 5,175 | | (202 | ) |
| | | | | | | |
Receive from the Counterparty, in the event of default on any of the securities in the Dow Jones CDX.HY-8 Index, the remaining interest payments on those defaulted securities and the Fund will pay a fixed rate equal to 2.75%.
Counterparty: Credit Suisse International (§) | | 06/20/12 | | 5,175 | | 202 | |
| | | | | | | |
Pay the Counterparty, in the event of default on any of the securities in the Dow Jones CDX.HY-9, 5 year Index, the remaining interest payments on those defaulted securities and the Fund will receive a fixed rate equal to 1.40%.
Counterparty: Credit Suisse | | 12/20/12 | | 7,100 | | (92 | ) |
| | | | | | | |
Receive from the Counterparty, in the event of default on any of the securities in the Dow Jones CDX.IG 8.5 Year Index, the remaining interest payments on those defaulted securities and the Fund will pay a fixed rate equal to 0.17%.
Counterparty: Morgan Stanley Capital Services, Inc. (§) | | 06/20/12 | | 46,000 | | 4 | |
| | | | | | | | | | |
The notes to the financial statements are an integral part of this report.
22
| | | | | | Net Unrealized | |
| | Expiration | | Notional | | Appreciation | |
| | Date | | Amount | | (Depreciation) | |
Receive from the Counterparty, in the event of default on any of the securities in the Dow Jones CDX.IG.5 7 year Index, the remaining interest payments on those defaulted securities and the Fund will pay a fixed rate equal to 0.142%.
Counterparty: JPMorgan Chase | | 12/20/12 | | $ | 9,400 | | $ | (29 | ) |
| | | | | | | |
Total Swap Agreements (Premium $2,006) | | | | | | $ | 6,441 | |
| | | | | | | | | |
FUTURES CONTRACTS:
| | Contracts (·) | | Settlement
Date | | Amount | | Net Unrealized
Appreciation
(Depreciation) | |
10 Year Japan | | 8 | | 03/20/2008 | | $ | 1,094,480 | | $ | 1 | |
10 Year U.S. Note | | 951 | | 03/30/2008 | | 107,833 | | 470 | |
2-Year U.S. Note | | (1,605 | ) | 03/30/2008 | | (337,452 | ) | (8 | ) |
3 Month Euro EURIBOR | | 499 | | 03/17/2008 | | 119,099 | | (310 | ) |
3 Month Euro EURIBOR | | 20 | | 06/16/2008 | | 4,779 | | (14 | ) |
3 Month Euro EURIBOR | | 349 | | 09/15/2008 | | 83,455 | | (81 | ) |
3 Month Euro EURIBOR | | 209 | | 12/15/2008 | | 50,014 | | (2 | ) |
5-Year U.S. Note | | (1,638 | ) | 03/31/2008 | | (180,641 | ) | (1,031 | ) |
90-Day Euro Dollar | | 294 | | 03/16/2009 | | 71,023 | | 742 | |
90-Day Euro Dollar | | 327 | | 06/16/2008 | | 78,689 | | 709 | |
90-Day Euro Dollar | | 175 | | 09/15/2008 | | 42,223 | | 448 | |
90-Day Euro Dollar | | 1,087 | | 12/15/2008 | | 262,592 | | 2,686 | |
90-Day GBP-LIBOR | | 2,151 | | 03/19/2008 | | m | | (27 | ) |
90-Day GBP-LIBOR | | 539 | | 06/18/2008 | | m | | (7 | ) |
90-Day Sterling LIBOR | | 195 | | 03/19/2008 | | 23,015 | | 74 | |
90-Day Sterling LIBOR | | 202 | | 03/19/2009 | | 24,045 | | 364 | |
90-Day Sterling LIBOR | | 422 | | 06/17/2009 | | 50,229 | | 1,356 | |
90-Day Sterling LIBOR | | 646 | | 06/18/2008 | | 76,495 | | 532 | |
90-Day Sterling LIBOR | | 270 | | 09/16/2009 | | 32,117 | | 473 | |
90-Day Sterling LIBOR | | 1,234 | | 09/18/2008 | | 146,492 | | 2,674 | |
90-Day Sterling LIBOR | | 339 | | 12/17/2008 | | 40,315 | | 407 | |
Euro-BOBL Future | | 432 | | 03/10/2008 | | 46,630 | | (951 | ) |
Euro-BUND Future | | (140 | ) | 03/10/2008 | | (15,836 | ) | 469 | |
Euro-SHATZ Future | | (692 | ) | 03/10/2008 | | (71,521 | ) | 618 | |
Long Gilt Future | | (83 | ) | 03/31/2008 | | (9,149 | ) | (17 | ) |
U.S. Long Bond | | (608 | ) | 03/31/2008 | | (70,756 | ) | (432 | ) |
| | | | | | $ | 1,668,170 | | $ | 9,143 | |
The notes to the financial statements are an integral part of this report.
23
FORWARD FOREIGN CURRENCY CONTRACTS:
Currency | | Bought
(Sold) | | Settlement
Date | | Amount in
U.S. Dollars
Bought(Sold) | | Net Unrealized
Appreciation
(Depreciation) | |
| | | | | | | | | | | |
Australian Dollar | | (680 | ) | 01/24/2008 | | $ | (597 | ) | $ | m | |
Australian Dollar | | 7,072 | | 01/31/2008 | | 6,222 | | (21 | ) |
Brazil Real | | 5,422 | | 01/03/2008 | | 2,985 | | 61 | |
Brazil Real | | (5,422 | ) | 03/04/2008 | | (2,983 | ) | (64 | ) |
Brazil Real | | 28,817 | | 03/04/2008 | | 14,581 | | 1,460 | |
Brazil Real | | (8,950 | ) | 03/04/2008 | | (4,636 | ) | (346 | ) |
Brazil Real | | 82,112 | | 07/02/2008 | | 41,958 | | 2,974 | |
Brazil Real | | (13,620 | ) | 07/02/2008 | | (7,308 | ) | (145 | ) |
Canadian Dollar | | (398 | ) | 01/31/2008 | | (394 | ) | (9 | ) |
Chinese Yuan Renminbi | | 54,977 | | 01/10/2008 | | 7,503 | | 32 | |
Chinese Yuan Renminbi | | (54,977 | ) | 01/10/2008 | | (7,456 | ) | (77 | ) |
Chinese Yuan Renminbi | | 153,058 | | 07/02/2008 | | 21,101 | | 676 | |
Chinese Yuan Renminbi | | (130,190 | ) | 07/02/2008 | | (18,370 | ) | (154 | ) |
Chinese Yuan Renminbi | | (22,867 | ) | 08/02/2008 | | (3,223 | ) | (55 | ) |
Chinese Yuan Renminbi | | 53,089 | | 10/10/2008 | | 7,663 | | 63 | |
Chinese Yuan Renminbi | | (53,089 | ) | 10/10/2008 | | (7,733 | ) | 7 | |
Danish Krone | | (50,151 | ) | 03/06/2008 | | (9,877 | ) | 37 | |
Euro Dollar | | (19,077 | ) | 01/17/2008 | | (27,944 | ) | 46 | |
Japanese Yen | | (995,226 | ) | 02/07/2008 | | (8,959 | ) | 20 | |
Malaysian Ringgit | | 10,779 | | 05/12/2008 | | 3,265 | | 6 | |
Malaysian Ringgit | | 3,371 | | 08/04/2008 | | 993 | | 31 | |
Mexican Peso | | 127,136 | | 03/13/2008 | | 11,460 | | 132 | |
Mexican Peso | | (92,108 | ) | 03/13/2008 | | (8,427 | ) | 29 | |
Mexican Peso | | 80,376 | | 07/10/2008 | | 7,255 | | (5 | ) |
New Zealand Dollar | | (1,507 | ) | 01/03/2008 | | (1,131 | ) | (29 | ) |
New Zealand Dollar | | (1,507 | ) | 02/14/2008 | | (1,161 | ) | 6 | |
Poland Zloty | | 2,677 | | 03/13/2008 | | 1,061 | | 26 | |
Poland Zloty | | 10,225 | | 07/10/2008 | | 3,720 | | 411 | |
Republic of Korea Won | | 6,042,308 | | 01/30/2008 | | 6,677 | | (208 | ) |
Republic of Korea Won | | 3,238,374 | | 08/04/2008 | | 3,527 | | (39 | ) |
Russian Ruble | | 160,736 | | 01/11/2008 | | 6,352 | | 198 | |
Russian Ruble | | (160,736 | ) | 01/11/2008 | | (6,579 | ) | 29 | |
Russian Ruble | | 215,278 | | 07/10/2008 | | 8,532 | | 216 | |
Russian Ruble | | 160,736 | | 11/19/2008 | | 6,514 | | (26 | ) |
Singapore Dollar | | 2,419 | | 02/20/2008 | | 1,654 | | 32 | |
Singapore Dollar | | 5,471 | | 05/22/2008 | | 3,739 | | 92 | |
United Kingdom Pound Sterling | | (17,528 | ) | 01/31/2008 | | (35,260 | ) | 396 | |
| | | | | | $ | 14,724 | | $ | 5,802 | |
The notes to the financial statements are an integral part of this report.
24
NOTES TO SCHEDULE OF INVESTMENTS:
q | | Value is less than $1 |
* | | Floating or variable rate note. Rate is listed as of December 31, 2007. |
§ | | Illiquid. At December 31, 2007, these securities aggregated $27,692, or 1.36%, of total investment securities of the Fund. |
‡ | | Non-Income Producing. |
· | | Contract Amounts are not in thousands. |
(1) | | At December 31, 2007, all or a portion of this security is segregated with the custodian to cover margin requirements for open futures contracts. The value of all securities segregated at December 31, 2007 is $6,447. |
(2) | | Coupon rate is fixed for a predetermined period of time and then converts to a floating rate until maturity/call date. Rate is listed as of December 31, 2007. |
Ž | | The security has a perpetual maturity. The date shown is the next call date. |
# | | Aggregate cost for federal income tax purposes is $2,008,426. Aggregate gross unrealized appreciation for all securities in which there is an excess of value over tax cost and aggregate gross unrealized depreciation for all securities in which there is an excess of tax cost over value were $43,593 and $18,274, respectively. Net unrealized appreciation for tax purposes is $25,376. |
(3) | | Restricted security. At December 31, 2007, the Fund owned the following security (representing 0.33% of Net Assets) which was restricted as to public resale. |
Description | | Date of Acquisition | | Principal | | Cost | | Value | |
SLM Corp.
6.00% due 06/30/2008 | | 06/27/07 | | 4,400 | | $ | 4,378 | | $ | 4,384 | |
| | | | | | | | | | | |
DEFINITIONS:
144A | | 144A Securities are registered pursuant to Rule 144A of the Securities Act of 1933. These securities are deemed to be liquid for purposes of compliance limitations on holdings of illiquid securities and may be resold as transactions exempt from registration, normally to qualified institutional buyers. At December 31, 2007, these securities aggregated $88,610, or 6.69%, of net assets of the Fund. |
LIBOR | | London Interbank Offered Rates |
TBA | | To Be Announced |
AUD | | Australian Dollar |
BRL | | Brazil Real |
DKK | | Denmark Krone |
EUR | | Euro |
GBP | | United Kingdom Pound Sterling |
JPY | | Japan Yen |
MXN | | Mexican Peso |
The notes to the financial statements are an integral part of this report.
25
PIMCO Total Return
STATEMENT OF ASSETS AND LIABILITIES
At December 31, 2007
(all amounts except per share amounts in thousands)
Assets: | | | |
Investment securities, at value (cost: $2,007,112) | | $ | 2,033,740 | |
Cash | | 5,044 | |
Foreign currency | | 11,475 | |
Receivables: | | | |
Investment securities sold | | 477,896 | |
Shares sold | | 271 | |
Interest | | 12,086 | |
Income from loaned securities | | 7 | |
Swap agreements at value (premium $2,006) | | 8,447 | |
Unrealized appreciation on forward foreign currency contracts | | 6,980 | |
| | 2,555,946 | |
Liabilities: | | | |
Investment securities purchased | | 1,212,911 | |
Accounts payable and accrued liabilities: | | | |
Shares redeemed | | 471 | |
Management and advisory fees | | 705 | |
Distribution and service fees | | 7 | |
Administration fees | | 22 | |
Unrealized depreciation on forward foreign currency contracts | | 1,178 | |
Written options and swaptions (premium $6,529) | | 15,641 | |
Variation margin | | 187 | |
Other | | 202 | |
| | 1,231,324 | |
Net Assets | | $ | 1,324,622 | |
| | | |
Net Assets Consist of: | | | |
Capital Stock ($.01 par value) | | $ | 1,137 | |
Additional paid-in capital | | 1,218,807 | |
Undistributed (accumulated) net investment income | | 54,040 | |
Undistributed (accumulated) net realized gain from investment securities, futures, written option and swaption contracts, swap agreements and foreign currency transactions | | 11,748 | |
Net unrealized appreciation on investment securities | | 26,628 | |
Futures contracts | | 9,143 | |
Written option and swaption contracts | | (9,112 | ) |
Swap agreements | | 6,441 | |
Translation of assets and liabilities denominated in foreign currencies | | 5,790 | |
Net Assets | | $ | 1,324,622 | |
Net Assets by Class: | | | |
Initial Class | | $ | 1,292,286 | |
Service Class | | 32,336 | |
Shares Outstanding: | | | |
Initial Class | | 110,907 | |
Service Class | | 2,772 | |
Net Asset Value and Offering Price Per Share: | | | |
Initial Class | | $ | 11.65 | |
Service Class | | 11.67 | |
STATEMENT OF OPERATIONS
For the year ended December 31, 2007
(all amounts in thousands)
Investment Income: | | | |
Dividends | | $ | 293 | |
Interest | | 62,825 | |
Income from loaned securities-net | | 75 | |
| | 63,193 | |
| | | |
Expenses: | | | |
Management and advisory fees | | 7,763 | |
Printing and shareholder reports | | 103 | |
Custody fees | | 351 | |
Administration fees | | 244 | |
Legal fees | | 25 | |
Audit fees | | 22 | |
Trustees fees | | 41 | |
Distribution and service fees: | | | |
Service Class | | 69 | |
Other | | 22 | |
Total expenses | | 8,640 | |
| | | |
Net Investment Income | | 54,553 | |
| | | |
Net Realized Gain (Loss) from: | | | |
Investment securities | | 10,522 | |
Futures contracts | | (21,438 | ) |
Written option and swaption contracts | | 3,529 | |
Swap agreements | | 18,567 | |
Foreign currency transactions | | 842 | |
| | 12,022 | |
| | | |
Net Increase (Decrease) in Unrealized Appreciation (Depreciation) on: | | | |
Investment securities | | 27,450 | |
Futures contracts | | 12,706 | |
Written option and swaption contracts | | (8,890 | ) |
Swap agreements | | 5,228 | |
Translation of assets and liabilities denominated in foreign currencies | | 4,752 | |
| | 41,246 | |
Net Realized and Unrealized Gain: | | 53,268 | |
Net Increase In Net Assets Resulting from Operations | | $ | 107,821 | |
The notes to the financial statements are an integral part of this report.
26
PIMCO Total Return
STATEMENT OF CHANGES IN NET ASSETS
For the years ended
(all amounts in thousands)
| | December 31,
2007 | | December 31,
2006 | |
Increase (Decrease) in Net Assets From: | | | | | |
Operations: | | | | | |
Net investment income | | $ | 54,553 | | $ | 32,665 | |
Net realized gain (loss) from investment securities, futures contracts, written options and swaptions contracts, swaps and foreign currency transactions | | 12,022 | | (701 | ) |
Change in unrealized appreciation on investment securities, futures contracts, written options and swaptions, swaps and foreign currency translation | | 41,246 | | 449 | |
| | 107,821 | | 32,413 | |
Distributions to Shareholders: | | | | | |
From net investment income: | | | | | |
Initial Class | | (31,765 | ) | (25,276 | ) |
Service Class | | (691 | ) | (798 | ) |
| | (32,456 | ) | (26,074 | ) |
From net realized gains: | | | | | |
Initial Class | | (86 | ) | — | |
Service Class | | (2 | ) | — | |
| | (88 | ) | — | |
Capital Share Transactions: | | | | | |
Proceeds from shares sold: | | | | | |
Initial Class | | 377,229 | | 302,068 | |
Service Class | | 12,488 | | 7,191 | |
| | 389,717 | | 309,259 | |
Dividends and distributions reinvested: | | | | | |
Initial Class | | 31,852 | | 25,276 | |
Service Class | | 693 | | 798 | |
| | 32,545 | | 26,074 | |
Cost of shares redeemed: | | | | | |
Initial Class | | (166,748 | ) | (83,132 | ) |
Service Class | | (7,560 | ) | (6,848 | ) |
| | (174,308 | ) | (89,980 | ) |
| | 247,954 | | 245,353 | |
Net increase (decrease) in net assets | | 323,231 | | 251,692 | |
| | | | | |
Net Assets: | | | | | |
Beginning of year | | 1,001,391 | | 749,699 | |
End of year | | $ | 1,324,622 | | $ | 1,001,391 | |
Undistributed (Accumulated) Net Investment Income (Loss) | | $ | 54,040 | | $ | 30,512 | |
Share Activity: | | | | | |
Shares issued: | | | | | |
Initial Class | | 34,002 | | 27,674 | |
Service Class | | 1,112 | | 659 | |
| | 35,114 | | 28,333 | |
Shares issued-reinvested from distributions: | | | | | |
Initial Class | | 2,893 | | 2,356 | |
Service Class | | 63 | | 74 | |
| | 2,956 | | 2,430 | |
Shares redeemed: | | | | | |
Initial Class | | (14,933 | ) | (7,634 | ) |
Service Class | | (673 | ) | (627 | ) |
| | (15,606 | ) | (8,261 | ) |
Net increase (decrease) in shares outstanding: | | | | | |
Initial Class | | 21,962 | | 22,396 | |
Service Class | | 502 | | 106 | |
| | 22,464 | | 22,502 | |
The notes to the financial statements are an integral part of this report.
27
PIMCO Total Return
FINANCIAL HIGHLIGHTS
For a share outstanding throughout each period(a)
| | Initial Class | |
| | Year Ended December 31, | |
| | 2007 | | 2006 | | 2005 | | 2004 | | 2003 | |
Net Asset Value | | | | | | | | | | | |
Beginning of period | | $ | 10.98 | | $ | 10.91 | | $ | 11.12 | | $ | 10.98 | | $ | 10.62 | |
Investment Operations | | | | | | | | | | | |
Net investment income (loss) | | 0.50 | | 0.45 | | 0.36 | | 0.19 | | 0.22 | |
Net realized and unrealized gain (loss) | | 0.46 | | — | | (0.10 | ) | 0.29 | | 0.29 | |
Total operations | | 0.96 | | 0.45 | | 0.26 | | 0.48 | | 0.51 | |
Distributions | | | | | | | | | | | |
From net investment income | | (0.29 | ) | (0.38 | ) | (0.20 | ) | (0.17 | ) | (0.06 | ) |
From net realized gains | | — | (b) | — | | (0.27 | ) | (0.17 | ) | (0.09 | ) |
Total distributions | | (0.29 | ) | (0.38 | ) | (0.47 | ) | (0.34 | ) | (0.15 | ) |
Net Asset Value | | | | | | | | | | | |
End of period(c) | | $ | 11.65 | | $ | 10.98 | | $ | 10.91 | | $ | 11.12 | | $ | 10.98 | |
Total Return(d),(e) | | 8 .95 | % | 4.21 | % | 2.33 | % | 4.50 | % | 4 .90 | % |
Net Assets End of Period (000’s) | | $ | 1,292,286 | | $ | 976,434 | | $ | 726,038 | | $ | 633,493 | | $ | 552,494 | |
Ratio and Supplemental Data | | | | | | | | | | | |
Expenses to average net assets(f) | | 0.70 | % | 0.73 | % | 0.74 | % | 0.75 | % | 0.75 | % |
Net investment income (loss), to average net assets(f) | | 4.47 | % | 4.13 | % | 3.28 | % | 1.75 | % | 2..06 | % |
Portfolio turnover rate(e) | | 728 | % | 709 | % | 387 | % | 393 | % | 430 | % |
For a share outstanding throughout each period(a)
| | Service Class | |
| | Year Ended December 31, | | May 1 to Dec | |
| | 2007 | | 2006 | | 2005 | | 2004 | | 31, 2003 | |
Net Asset Value | | | | | | | | | | | |
Beginning of period | | $ | 11.00 | | $ | 10.93 | | $ | 11.16 | | $ | 11.02 | | $ | 10.89 | |
Investment Operations | | | | | | | | | | | |
Net investment income (loss) | | 0.47 | | 0.42 | | 0.34 | | 0.17 | | 0.12 | |
Net realized and unrealized gain (loss) | | 0.47 | | 0.01 | | (0.11 | ) | 0.29 | | 0.11 | |
Total operations | | 0.94 | | 0.43 | | 0.23 | | 0.46 | | 0.23 | |
Distributions | | | | | | | | | | | |
From net investment income | | (0.27 | ) | (0.36 | ) | (0.19 | ) | (0.15 | ) | (0.01 | ) |
From net realized gains | | — | (b) | — | | (0.27 | ) | (0.17 | ) | (0.09 | ) |
Total distributions | | (0.27 | ) | (0.36 | ) | (0.46 | ) | (0.32 | ) | (0.10 | ) |
Net Asset Value | | | | | | | | | | | |
End of period(c) | | $ | 11.67 | | $ | 11.00 | | $ | 10.93 | | $ | 11.16 | | $ | 11.02 | |
Total Return(d),(e) | | 8.80 | % | 3.90 | % | 2.03 | % | 4.22 | % | 2.14 | % |
Net Assets End of Period (000’s) | | $ | 32,336 | | $ | 24,957 | | $ | 23,661 | | $ | 14,590 | | $ | 3,044 | |
Ratio and Supplemental Data | | | | | | | | | | | |
Expenses to average net assets(f) | | 0.95 | % | 0.98 | % | 0.99 | % | 1.01 | % | 0.99 | % |
Net investment income (loss), to average net
assets(f) | | 4.23 | % | 3.86 | % | 3.10 | % | 1.54 | % | 1.67 | % |
Portfolio turnoverrate(e) | | 728 | % | 709 | % | 387 | % | 393 | % | 430 | % |
(a) Per share information is calculated based on average number of shares outstanding.
(b) Rounds to less than $0.01.
(c) PIMCO Total Return (the “Fund”) share class commenced operations as follows:
Initial Class - May 1, 2002
Service Class - May 1, 2003
(d) Total Return reflects all portfolio expenses and includes reinvestment of dividends and capital gains; it does not reflect the charges and deductions under the policies or annuity contracts.
(e) Not annualized.
(f) Annualized.
The notes to the financial statements are an integral part of this report.
28
PIMCO Total Return
NOTES TO FINANCIAL STATEMENTS
At December 31, 2007
(all amounts in thousands)
NOTE 1. ORGANIZATION AND SIGNIFICANT ACCOUNTING POLICIES
AEGON/Transamerica Series Trust (“ATST”) is an open-end management investment company registered under the Investment Company Act of 1940, as amended (the “1940 Act”). ATST serves as a funding vehicle for variable life insurance, variable annuity and group annuity products. PIMCO Total Return (the “Fund”) is part of ATST.
In the normal course of business, the Fund enters into contracts that contain a variety of representations that provide general indemnifications. The Fund’s maximum exposure under these arrangements is unknown, as this would involve future claims that may be made against the Fund and/or its affiliates that have not yet occurred. However, based on experience, the Fund expects the risk of loss to be remote.
This report should be read in conjunction with the current Fund prospectus, which contains more complete information about the Fund.
In preparing the Fund’s financial statements in accordance with accounting principles generally accepted in the United States of America (“GAAP”), estimates or assumptions (which could differ from actual results) may be used that affect reported amounts and disclosures. The following is a summary of significant accounting policies followed by the Fund.
Multiple class operations, income and expenses: The Fund currently offers two classes of shares, an Initial Class and a Service Class. Income, non-class specific expenses and realized and unrealized gains and losses, are allocated daily to each class, based upon the value of shares outstanding method as permitted under Rule 18f-3 of the 1940 Act. Each class bears its own specific expenses as well as a portion of general, common expenses.
Security valuations: The Fund values its investments at the close of the New York Stock Exchange (“NYSE”), normally 4 p.m. ET, each day the NYSE is open for business. Fund investments are valued at the last sale price or closing price on the day of valuation taken from the primary exchange where the security is principally traded.
Securities traded in the over-the-counter market and listed securities for which no sale was reported on that date are valued at the last quoted bid price.
Debt securities are valued based on a price quotation or other equivalent indication of value supplied by an exchange, a pricing service or a major market maker; however, those that mature in sixty days or less are valued at amortized cost, which approximates market.
Investment company securities are valued at the net asset value of the underlying portfolio.
Foreign securities generally are valued based on quotations from the primary market in which they are traded. Because many foreign securities markets and exchanges close prior to the close of the NYSE, closing prices for foreign securities in those markets or on those exchanges do not reflect the events that occur after that close. If a significant market event impacting the value of a portfolio security (e.g., natural disaster, company announcement, market volatility) occurs subsequent to the close of trading in the security, but prior to the calculation of the Fund’s net asset value per share, market quotations for that security may be determined to be unreliable and, accordingly, not “readily available.” As a result, foreign equity securities held by the Fund may be valued at fair market value as determined in good faith by the Fund’s Administrative Valuation Committee, using guidelines adopted by the Board of Trustees.
Other securities for which quotations are not readily available are valued at fair market value as determined in good faith by the Fund’s Administrative Valuation Committee, using guidelines adopted by the Board of Trustees.
Cash: The Fund may leave cash overnight in its cash account with the custodian, State Street Bank & Trust Company (“State Street”). On July 2, 2007, State Street acquired the parent company of Investors Bank & Trust Company. State Street has been contracted on behalf of the Fund to invest the excess cash into a savings account, which at December 31, 2007 was paying an interest rate of 2.60%.
TBA purchase commitments: The Fund may enter into “TBA” (to be announced) purchase commitments to purchase securities for a fixed price at a future date, typically not to exceed 45 days. TBA purchase commitments are considered securities in themselves, and involve a risk of loss if the value of the security to be purchased declines prior to settlement date, in addition to the risk of decline in the value of the Fund’s other assets. Unsettled TBA purchase commitments are valued at the current value of the underlying securities, according to the procedures described under Security Valuations.
Repurchase agreements: The Fund is authorized to enter into repurchase agreements. The Fund, through its custodian, State Street, receives delivery of the underlying securities, the value of which at the time of purchase is required to be an amount equal to at least 100% of the resale price. The Fund will bear the risk of value fluctuations until the security can be sold and may encounter delays and incur costs in liquidating the security. In the event of bankruptcy or insolvency of the seller, delays and costs may be incurred.
Securities lending: The Fund may lend securities to qualified borrowers, with State Street acting as the Fund’s lending agent. The Fund earns negotiated lenders’ fees. The Fund receives cash and/or securities as collateral against the loaned securities. Cash collateral received is invested in short-term, interest-bearing securities. The Fund monitors the market value of securities loaned on a daily basis and requires collateral in an amount at least equal to the value of the securities loaned. Income from loaned securities earned by State Street for its services shown in the Statement of Operations net of fees, in the amount of $32.
29
NOTES TO FINANCIAL STATEMENTS (continued)
At December 31, 2007
(all amounts in thousands)
NOTE 1. — (continued)
Loan participations/ assignments: The Fund may purchase participations/ assignments in commercial loans. Such indebtedness may be secured or unsecured. These investments may include standby financing commitments, including revolving credit facilities that obligate the Fund to supply additional cash to the borrower on demand. Loan participations/ assignments involve risks of insolvency of the lending bank or other financial intermediaries. As such, the Fund assumes the credit risk associated with the corporate borrower and may assume the credit risk associated with the interposed bank or other financial intermediary.
The Fund may be contractually obligated to receive approval from the agent bank and/or borrower prior to the sale of these investments. Loan participations typically represent direct participation in a loan to a corporate borrower, and generally are offered by banks or other financial institutions or lending syndicates. The Fund may participate in such syndications, or can buy part of a loan, becoming a part lender. A loan is often administered by an agent bank acting as agent for all holders. The agent bank administers the terms of the loan, as specified in the loan agreement. In addition, the agent bank is normally responsible for the collection of principal and interest payments from the corporate borrower and the apportionment of these payments to the credit of all institutions that are parties to the loan agreement, unless, under the terms of the loan or other indebtedness, the fund has direct recourse against the corporate borrower, the Fund may have to rely on the agent bank or other financial intermediary to apply appropriate credit remedies against a corporate borrower.
Foreign currency denominated investments: The accounting records of the Fund are maintained in U.S. dollars. Securities and other assets and liabilities denominated in foreign currencies are translated into U.S. dollars at the closing exchange rate each day. The cost of foreign securities is translated at the exchange rate in effect when the investment was acquired. The Fund combines fluctuations from currency exchange rates and fluctuations in value when computing net realized and unrealized gains or losses from investments.
Net foreign currency gains and losses resulting from changes in exchange rates include: 1) foreign currency fluctuations between trade date and settlement date of investment security transactions; 2) gains and losses on forward foreign currency contracts; and 3) the difference between the receivable amounts of interest and dividends recorded in the accounting records in U.S. dollars and the amounts actually received.
Foreign currency denominated assets may involve risks not typically associated with domestic transactions. These risks include revaluation of currencies, adverse fluctuations in foreign currency values and possible adverse political, social and economic developments, including those particular to a specific industry, country or region.
Forward foreign currency contracts: The Fund may enter into forward foreign currency contracts to hedge against exchange rate risk arising from investments in securities denominated in foreign currencies. Contracts are valued at the contractual forward rate and are marked to market daily, with the change in value recorded as an unrealized gain or loss. When the contracts are settled a realized gain or loss is incurred. Risks may arise from changes in market value of the underlying currencies and from the possible inability of counterparties to meet the terms of their contracts.
Open forward foreign currency contracts at December 31, 2007 are listed in the Schedule of Investments.
Swap agreements: The Fund may enter into swap agreements to manage its exposure to interest rates and credit risk. Interest rate swap agreements involve commitments to pay/receive interest in exchange for a market-linked return, both based on notional amounts. In a credit default swap, one party makes a stream of payments to another party in exchange for the right to receive a specified return in the event of a default by a third party, typically corporate issues or sovereign issues of an emerging country, on its obligation. The fund may use credit default swaps to provide a measure of protection against defaults of sovereign issuers (i.e., to reduce risk where the portfolio owns or has exposure to the sovereign issuer) or to take an active long or short position with respect to the likelihood of a particular issuer’s default.
Entering into these agreements involves elements of credit, market and documentation risk in excess of the amounts recognized on the Statement of Assets and Liabilities. Such risks involve the possibility that there will be no liquid market for these agreements, that the counterparty to the agreements may default on its obligation to perform or disagree as to the meaning of contractual terms in the agreements, and that there may be unfavorable changes in interest rates.
Swaps are marked to market daily based upon quotations from market makers and vendors and the change in value, if any, is recorded as unrealized gain or loss in the Statement of Operations. Payments received or made at the beginning of the measurement period are reflected as such on the Statement of Assets and Liabilities. A liquidation payment received or made at the termination of the swap is recorded as realized gain or loss in the Statement of Operations. Net periodic payments are included as part of realized gain or loss on the Statement of Operations.
Open swaps agreements at December 31, 2007 are listed in the Schedule of Investments.
Futures contracts: The Fund may enter into futures contracts to manage exposure to market, interest rate or currency fluctuations. Futures contracts are valued at the settlement price established each day by the board of trade or exchange on which they are traded. The primary risks associated with futures contracts are imperfect correlation between the change in market value of the securities held and the prices of futures contracts; the possibility of an illiquid market and inability of the counterparty to meet the contract terms.
30
NOTES TO FINANCIAL STATEMENTS (continued)
At December 31, 2007
(all amounts in thousands)
NOTE 1. — (continued)
The underlying face amounts of open futures contracts at December 31, 2007 are listed in the Schedule of Investments. The variation margin receivable or payable, as applicable, is included in the Statement of Assets and Liabilities. Variation margin represents the additional payment due or excess deposits made in order to maintain the equity account at the required margin level.
Option contracts: The Fund may enter into options contracts to manage exposure to market fluctuations. Options are valued at the average of the bid and ask (“Mean Quote”) established each day at the close of the board of trade or exchange on which they are traded. The primary risks associated with options are imperfect correlation between the change in value of the securities held and the prices of the options contracts; the possibility of an illiquid market; and inability of the counterparty to meet the contracts terms. When the Fund writes a covered call or put option, an amount equal to the premium received by the Fund is included in the Fund’s Statement of Assets and Liabilities as an asset and as an equivalent liability. Options are marked-to-market daily to reflect the current value of the option written.
Transactions in written options were as follows:
| | PIMCO Total Return | |
| | Premium | | Contracts* | |
Balance at December 31, 2006 | | $ | 304 | | 680 | |
Sales | | 2,237 | | 4,622 | |
Closing Buys | | (270 | ) | (485 | ) |
Expirations | | (786 | ) | (2,654 | ) |
Exercised | | 0 | | 0 | |
Balance at December 31, 2007 | | $ | 1,485 | | 2,163 | |
* Contracts not in thousands
Swaptions contracts: The Fund is authorized to write swaption contracts to manage exposure to fluctuations in interest rates and to enhance fund yield. Swaption contracts written by the Fund represent an option that gives the purchaser the right, but not the obligation, to enter into a previously agreed upon swap contract on a future date. If a written call option is exercised, the writer will enter a swap and is obligated to pay the fixed rate and receive a variable rate in exchange. Swaptions are marked-to-market daily based upon quotations from market makers.
When the Fund writes a swaption, the premium received is recorded as a liability and is subsequently adjusted to the current value of the swaption. Changes in the value of the swaption are reported as Unrealized gains or losses in written options in the Statement of Assets and Liabilities. Gain or loss is recognized when the swaption contract expires or is closed. Premiums received from writing swaptions that expire or are exercised are treated by the Fund as realized gains from written options. The difference between the premium and the amount paid on affecting a closing purchase transaction is treated as a realized gain or loss.
Transactions in written swaptions were as follows:
| | PIMCO Total Return | |
| | Premium | | Notional Amount | |
Balance at December 31, 2006 | | $ | 3,232 | | 277,700 | |
Sales | | 6,666 | | 697,200 | |
Closing Buys | | (2,089 | ) | (195,600 | ) |
Expirations | | (2,712 | ) | (342,700 | ) |
Exercised | | (53 | ) | (19,000 | ) |
Balance at December 31, 2007 | | $ | 5,044 | | 417,600 | |
Security transactions and investment income: Security transactions are recorded on the trade date. Security gains and losses are calculated on the first-in, first-out basis. Dividend income, if any, is recorded on the ex-dividend date or, in the case of foreign securities, as soon as the Fund is informed of the ex-dividend date. Interest income, including accretion of discounts and amortization of premiums, is recorded on the accrual basis commencing on the settlement date.
Dividend distributions: Dividends and capital gains distributions are typically declared and reinvested annually and are generally paid and reinvested on the business day following the ex-date.
NOTE 2. RELATED PARTY TRANSACTIONS
ATST serves as a funding vehicle for certain affiliated asset allocation portfolios and certain affiliated separate accounts of Western Reserve Life Assurance Co. of Ohio, Transamerica Life Insurance Company, Transamerica Financial Life Insurance Company, Inc., Monumental Life Insurance Company and Transamerica Occidental Life Insurance Company.
Transamerica Fund Advisors, Inc. (“TFAI”) is the Fund’s investment adviser. Transamerica Fund Services, Inc. (“TFS”) is the Fund’s administrator and transfer agent. Prior to May 1, 2007, AFSG Securities Corp. (“AFSG”), was the Fund’s distributor. Transamerica Capital Inc. (“TCI”) is now the Fund’s distributor. TFAI, TFS, AFSG, and TCI are affiliates of AEGON NV, a Netherlands corporation.
Certain officers and trustees of the Fund are also officers and/or directors of TFAI, TFS and TCI.
31
NOTES TO FINANCIAL STATEMENTS (continued)
At December 31, 2007
(all amounts in thousands)
NOTE 2. — (continued)
Investment advisory fee: The Fund pays management fees to TFAI based on average daily net assets (“ANA”) at the following breakpoints:
0.675% of the first $250 million of ANA
0.65% of the next $500 million of ANA
0.60% of ANA over $750 million
TFAI has contractually agreed to waive its advisory fee and will reimburse the Fund to the extent that operating expenses, excluding 12b-1 fees, exceed the following stated annual limit:
1.20% Expense Limit
If total Fund expenses fall below the annual expense limitation agreement agreed to by the adviser within the succeeding three years, the Fund may be required to pay the adviser a portion or all of the waived advisory fees.
There were no amounts recaptured during the year ended December 31, 2007. There are no amounts available for recapture at December 31, 2007.
The following schedule reflects the percentage of Fund assets owned by affiliated investment companies at December 31, 2007
| | Net
Assets | | % of Net
Assets | |
| | | | | |
Asset Allocation-Conservative Portfolio | | $ | 133,159 | | 10.05 | % |
Asset Allocation-Moderate Growth Portfolio | | 333,559 | | 25.18 | |
Asset Allocation-Moderate Portfolio | | 383,730 | | 28.97 | |
International Moderate Growth Fund | | 46,037 | | 3.48 | |
Total | | $ | 896,485 | | 67.68 | % |
Distribution and service fees: ATST entered into a Distribution Agreement with AFSG dated January 1, 1997, as amended. May 1, 2007, the Distribution Agreement was amended to replace AFSG with TCI as the Fund’s distributor. The Fund has also adopted a distribution plan (“Distribution Plan”) pursuant to Rule 12b-1 under the 1940 Act.
Under the Distribution Plan for the Initial Class shares, TCI, on behalf of the Fund, is authorized to pay various service providers, as direct payment for expenses incurred in connection with distribution of the Fund’s shares, amounts equal to actual expenses associated with distributing the shares.
The Distribution Plan for the Service Class shares requires ATST to pay distribution fees to TCI as compensation for its activities, not as reimbursement for specific expenses. The fee on the Service Class is paid to the insurance companies for providing services and account maintenance for their policyholders who invest in the variable insurance products which invest in the Service Class shares.
The Fund is authorized under the Distribution Plan to pay fees on each class up to the following limits:
Initial Class | | 0.15% |
Service Class | | 0.25% |
TCI has determined that it will not seek payment by the Fund of the distribution expenses incurred with respect to the Initial Class shares before April 30, 2009. Prior to TCI seeking reimbursement of future expenses, policy and contract owners will be notified in advance. The Fund will pay fees relating to Service Class shares.
Administrative services: The Fund has entered into an agreement with TFS for financial and legal fund administration services. The Fund pays TFS an annual fee of 0.02% of ANA. The Legal fees on the Statement of Operations are for fees paid to external legal counsel.
Deferred compensation plan: Each eligible independent Fund Trustee may elect participation in a non-qualified deferred compensation plan (“the Plan”). Under the Plan, such Trustees may defer payment of all or a portion of their total fees earned as a Fund Trustee. Each Trustee who is a participant in the Plan may elect that the earnings, losses or gains credited to his or her deferred fee amounts be determined based on a deemed investment in any series of Transamerica IDEX Mutual Funds. The right of a participant to receive a distribution from the Plan of the deferred fees is an unsecured claim against the general assets of all series of Transamerica IDEX Mutual Funds. The pro rata liability to the Fund of all deferred fees in the Plan amounted, as of December 31, 2007, to $64. Amounts deferred under the Deferred Compensation Plan are unfunded against the general assets of ATST.
Retirement plan: Under a retirement plan (the “Emeritus Plan”) available to the Independent Trustees, each Independent Trustee is deemed to have elected to serve as Trustee Emeritus of ATST upon his or her termination of service, other than removal for cause, is entitled to 50% of the trustee’s current retainer for a maximum period of five years determined by his or her years of service as a Trustee.
Such amounts shall be accrued by ATST on a pro rata basis allocable to each series of ATST fund based on the relative assets of the fund. If retainers increase in the future, past accruals (and credits) will be adjusted upward so that 50% of the Trustee’s current retainer is accrued and credited at all times. Upon death, disability or termination of service, other than removal for cause, amounts deferred become payable to a Trustee Emeritus (or his/her beneficiary). Upon the commencement of service as Trustee Emeritus, compensation will be paid on a quarterly basis during the time period that the Trustee Emeritus is allowed to serve as such.
32
NOTES TO FINANCIAL STATEMENTS (continued)
At December 31, 2007
(all amounts in thousands)
NOTE 2. — (continued)
Amounts accrued under the Emeritus Plan are unsecured claims against the general assets of ATST. For the year ended December 31, 2007, the amount related to the Emeritus Plan was $31. As of December 31, 2007, the Fund has not made any payments related to the Emeritus Plan.
The Emeritus Plan was terminated effective October 30, 2007. Upon the termination, the Fund shall continue to pay any remaining benefits in accordance with the Plan, but no further compensation shall accrue under the Plan.
NOTE 3. INVESTMENT TRANSACTIONS
The cost of securities purchased and proceeds from securities sold (excluding short-term securities) for the year ended December 31, 2007 were as follows:
Purchases of securities: | | | |
Long-term | | $ | 10,894,105 | |
U.S. Government | | 1,365,032 | |
| | | |
Proceeds from maturities and sales of securities: | | | |
Long-term | | 10,367,490 | |
U.S. Government | | 1,244,897 | |
| | | | |
NOTE 4. FEDERAL INCOME TAX MATTERS
The Fund has not made any provision for federal income or excise taxes due to its policy to distribute all of its taxable income and capital gains to its shareholders and otherwise qualify as a regulated investment company under Subchapter M of the Internal Revenue Code. Income and capital gain distributions are determined in accordance with income tax regulations, which may differ from GAAP. These differences are primarily due to differing treatment for items including, but not limited to, wash sales, foreign currency transactions, swaps, option contracts, futures contracts and Post October loss deferrals.
Therefore, distributions determined in accordance with tax regulations may differ significantly in amount or character from net investment income and realized gains for financial reporting purposes. Financial reporting records are adjusted for permanent book/tax differences to reflect tax character. Financial records are not adjusted for temporary differences. These reclassifications are as follows:
Undistributed (accumulated) net investment income (loss) | | $ | 1,432 | |
Undistributed (accumulated) net realized gain (loss) from investment securities | | $ | (1,432 | ) |
The tax character of distributions paid may differ from the character of distributions shown in the Statements of Changes in Net Assets due to short-term gains being treated as ordinary income for tax purposes. The tax character of distributions paid during 2006 and 2007 was as follows:
2006 Distributions paid from: | | | |
Ordinary Income | | $ | 26,074 | |
Long-term Capital Gain | | — | |
| | | |
2007 Distributions paid from: | | | |
Ordinary Income | | 32,457 | |
Long-term Capital Gain | | 88 | |
| | | | |
The tax basis components of distributable earnings as of December 31, 2007 are as follows:
Undistributed Ordinary Income | | $ | 82,082 | |
Undistributed Long-term Capital Gain | | $ | 621 | |
Capital Loss Carryforward | | $ | — | |
Post October Capital Loss Deferral | | $ | (5,495 | ) |
Post October Currency Loss Deferral | | $ | (2,009 | ) |
Net Unrealized Appreciation (Depreciation) | | $ | 29,479 | * |
*The amount includes unrealized appreciation (depreciation) from futures, written option and swaption contracts, swap agreements and foreign currency.
NOTE 5. REGULATORY PROCEEDINGS
There continues to be significant federal and state regulatory activity relating to financial services companies, particularly mutual fund companies and their investment advisers. As part of an ongoing investigation regarding potential market timing, recordkeeping and trading compliance issues and matters affecting the Fund’s investment adviser, TFAI, and certain affiliates and former employees of TFAI, the SEC staff has indicated that it is likely to take some action against TFAI and certain of its affiliates at the conclusion of the investigation. The potential timing and the scope of any such action is difficult to predict. Although the impact of any action brought against TFAI and/or its affiliates is difficult to assess at the present time, the Fund currently believes that the likelihood that any such action will have a material adverse impact is remote. It is important to note that the Fund is not aware of any allegation of wrongdoing against it and its Board at the time this annual report is printed. Although it is not anticipated that these developments will have an adverse impact on the Fund, there can be no assurance at this time. TFAI and its affiliates are actively working with the SEC in regard to this matter; however, the exact resolution cannot be determined at this time. TFAI will take such actions that it deems necessary or appropriate to continue providing management services to the Fund and to bring all matters to an appropriate conclusion.
TFAI and/or its affiliates, and not the Fund, will bear the costs regarding these regulatory matters.
33
NOTES TO FINANCIAL STATEMENTS (continued)
At December 31, 2007
(all amounts in thousands)
NOTE 6. RECENTLY ISSUED ACCOUNTING PRONOUNCEMENTS
In July 2006, the Financial Accounting Standards Board (“FASB”) released FASB Interpretation No. 48 “Accounting for Uncertainty in Income Taxes” (“FIN 48”), an interpretation of FASB Statement No. 109. FIN 48 provides guidance for how uncertain tax positions should be recognized, measured, presented and disclosed in the financial statements. FIN 48 requires the accounting and disclosure of tax positions taken or expected to be taken in the course of preparing the Fund’s tax returns to determine whether the tax positions are “more-likely-than-not” of being sustained by the applicable tax authority. Tax positions not deemed to meet the more-likely-than-not threshold would be recorded as a tax benefit or expense in the current year.
Adoption of FIN 48 is effective during the first required financial reporting period for fiscal years beginning after December 15, 2006. Management adopted FIN 48 on June 29, 2007.
Implementation of FIN 48 requires Management of the Fund to analyze all open tax years, as defined by the Statute of Limitations, for all major jurisdictions, which includes federal and certain states. Open tax years are those that are open for exam by taxing authorities (i.e., the last 4 tax year ends and the interim tax period since then). The Fund has no examinations in progress and none are expected at this time.
Management of the Fund has reviewed all open tax years and major jurisdictions and concluded the adoption of FIN 48 resulted in no impact to the Fund’s net assets or results of operations. There is no tax liability resulting from unrecognized tax benefits relating to uncertain income tax positions taken or expected to be taken in future tax returns. The Fund is also not aware of any tax positions for which it is reasonably possible that the total amounts of unrecognized tax benefits will significantly change in the next 12 months.
In September 2006, FASB issued its new Standard No. 157, “Fair Value Measurements” (“FAS 157”). FAS 157 is designed to unify guidance for the measurement of fair value of all types of assets, including financial instruments, and certain liabilities, throughout a number of accounting standards. FAS 157 also establishes a hierarchy for measuring fair value in generally accepted accounting principles and expands financial statement disclosures about fair value measurements that are relevant to mutual funds. FAS 157 is effective for financial statements issued for fiscal years beginning after November 15, 2007, and earlier application is permitted.
As of December 31, 2007, Management does not expect the adoption of FAS 157 to impact the amounts reported in the financial statements, however, additional disclosures will be required about the inputs used to develop the measurements of fair value and the effect of certain of the measurements reported in the statement of operations for a fiscal period.
NOTE 7. SUBSEQUENT EVENT
Effective January 1, 2008, TFAI changed its name to Transamerica Asset Management, Inc.
Effective May 1, 2008, AEGON/Transamerica Series Trust will change its name to Transamerica Series Trust. At that time, the Fund will also change its name to Transamerica PIMCO Total Return VP.
34
Report of Independent Registered Certified Public Accounting Firm
To the Board of Trustees and Shareholders of PIMCO Total Return:
In our opinion, the accompanying statement of assets and liabilities, including the schedule of investments, and the related statements of operations and of changes in net assets and the financial highlights present fairly, in all material respects, the financial position of PIMCO Total Return (the “Fund”) (one of the portfolios constituting AEGON/Transamerica Series Trust) at December 31, 2007, the results of its operations for the year then ended, the changes in its net assets for each of the two years in the period then ended and the financial highlights for each of the periods presented, in conformity with accounting principles generally accepted in the United States of America. These financial statements and financial highlights (hereafter referred to as “financial statements”) are the responsibility of the Fund’s management; our responsibility is to express an opinion on these financial statements based on our audits. We conducted our audits of these financial statements in accordance with the standards of the Public Company Accounting Oversight Board (United States). Those standards require that we plan and perform the audit to obtain reasonable assurance about whether the financial statements are free of material misstatement. An audit includes examining, on a test basis, evidence supporting the amounts and disclosures in the financial statements, assessing the accounting principles used and significant estimates made by management, and evaluating the overall financial statement presentation. We believe that our audits, which included confirmation of securities at December 31, 2007 by correspondence with the custodian and brokers, provide a reasonable basis for our opinion.

Tampa, Florida
February 29, 2008
35
PIMCO Total Return
SUPPLEMENTAL TAX INFORMATION (unaudited)
(all amounts in thousands)
For tax purposes, the Fund has made a Long-Term Capital Gain Designation of $88 for the year ended December 31, 2007.
RESULTS OF SHAREHOLDER PROXY (unaudited)
At a special meeting of shareholders held on October 30, 2007, the results of the Proposals were as follows:
Proposal 1: To elect a new Board:
Proposed
Trustee | | For | | Against | | Abstentions/Broker Non-
Votes | |
John K. Carter | | 2,274,998,840.817 | | 57,804,698.755 | | 35,433.883 | |
| | | | | | | |
Leo J. Hill | | 2,277,212,702.754 | | 55,590,836.819 | | 35,433.883 | |
| | | | | | | |
Neal M. Jewell | | 2,266,793,295.663 | | 66,010,243.909 | | 35,433.883 | |
| | | | | | | |
Russell A. Kimball, Jr. | | 2,274,825,235.835 | | 57,978,303.737 | | 35,433.883 | |
| | | | | | | |
Eugene M. Mannella | | 2,274,623,165.033 | | 58,180,374.539 | | 35,433.883 | |
| | | | | | | |
Norm R. Nielsen | | 2,275,050,055.885 | | 57,753,483.687 | | 35,433.883 | |
| | | | | | | |
Joyce Galpern Norden | | 2,270,278,122.250 | | 62,525,417.323 | | 35,433.883 | |
| | | | | | | |
Patricia L. Sawyer | | 2,275,737,737.456 | | 57,065,802.116 | | 35,433.883 | |
| | | | | | | |
John W. Waechter | | 2,276,615,120.140 | | 56,188,419.433 | | 35,433.883 | |
Proposal 2: To approve an amendment to the Agreement and Declaration of Trust:
| | | | Abstentions/Broker Non- | |
For | | Against | | Votes | |
2,182,022,669.110 | | 77,590,048.544 | | 73,226,255.801 | |
36
PIMCO Total Return
INVESTMENT ADVISORY AND SUB-ADVISORY AGREEMENTS-REVIEW AND RENEWAL (unaudited)
At a meeting of the Board of Trustees of AEGON/Transamerica Series Trust (“ATST”) held on December 4th, 2007, the Board reviewed and considered the renewal of the investment advisory agreement (the “Investment Advisory Agreement”) between PIMCO Total Return (the “Fund”) and Transamerica Fund Advisors, Inc. (“TFAI”), as well as the renewal of the investment sub-advisory agreement (the “Sub-Advisory Agreement”) of the Fund between TFAI and Pacific Investment Management Company LLC (the “Sub-Adviser”), to determine whether the agreements should be renewed for a six-month period. It was noted that this review was interim in nature to align all the Funds on the same calendar, and that the Funds’ advisory arrangements would be reviewed again in the first half of 2008.
Following their review and consideration, the Trustees determined that the renewal of the Investment Advisory Agreement and the Sub-Advisory Agreement would enable shareholders of the Fund to obtain high quality services at a cost that is appropriate, fair, and in the best interests of its shareholders. The Board, including the independent members of the Board, unanimously approved the renewal of the Investment Advisory Agreement and Sub-Advisory Agreement. In reaching their decision, the Trustees requested and obtained from TFAI and the Sub-Adviser such information as they deemed reasonably necessary to evaluate the agreements, including information about fees and performance of comparable funds managed by the Sub-Adviser. The Trustees also carefully considered information they had previously received from TFAI and the Sub-Adviser throughout the year as part of their regular oversight of the Fund, as well as comparative fee, expense, and performance information prepared by Lipper Inc. (“Lipper”), an independent provider of mutual fund performance, fee and expense information and profitability data prepared by management. In considering the proposed continuation of the Investment Advisory and Sub-Advisory Agreements, the Trustees evaluated a number of considerations that they believed, in light of the legal advice furnished to them by independent legal counsel and their own business judgment, to be relevant. They based their decisions on a variety of factors, including the following considerations, among others, although they did not identify any consideration or particular information that was controlling of their decisions:
The nature, extent and quality of the advisory services to be provided. The Board considered the nature and quality of the services provided by TFAI and the Sub-Adviser to the Fund in the past, as well as the services anticipated to be provided in the future. The Board concluded that TFAI and the Sub-Adviser are capable of providing high quality services to the Fund, as indicated by the nature and quality of services provided in the past by TFAI and the Sub-Adviser for this series and the experience, capability and integrity of TFAI’s senior management, the financial resources of TFAI and the Sub-Adviser, TFAI’s management oversight process and the professional qualifications of the portfolio management team of the Sub-Adviser. The Trustees determined that TFAI and the Sub-Adviser can provide investment and related services that are appropriate in scope and extent in light of the Fund’s operations, the competitive landscape of the investment company business and investor needs.
The investment performance of the Fund. The Board examined the short and longer-term performance of the Fund, including relative performance against a peer universe of comparable mutual funds as prepared by Lipper for various trailing periods ended June 30, 2007. The Trustees noted that the Fund’s performance was in line with the median for its peer universe for the past 1-, 3-and 5-year periods. On the basis of the Board’s assessment of the nature, extent and quality of advisory services to be provided or procured by TFAI and the Sub-Adviser, the Board concluded that TFAI and the Sub-Adviser are capable of providing a level of investment performance that is appropriate in light of the Fund’s proposed investment objectives, policies and strategies and competitive with other similarly situated investment companies.
The cost of advisory services provided and the level of profitability. The Board reviewed profitability information of TFAI’s cost of procuring fund management services, as well as the costs of provision of administration, fund accounting and other services, to the Fund and to ATST as a whole by TFAI and its affiliates. The Board reviewed the management and sub-advisory fees for the Fund. The Trustees noted that the Fund’s contractual management fees were above the medians for its peer group and peer universe. The Trustees further noted that the total expenses of the Fund were above the median for its peer group and slightly above the median for the peer universe. Based on their review, the Trustees determined that the management fees of the Fund generally are appropriate in light of the services expected to be provided or procured, the management fees and the anticipated profitability of the relationship between the Fund, TFAI and its affiliates, and the Sub-Adviser. In making these observations and determinations, the Board reviewed, among other things, comparative information provided by Lipper.
Whether fee levels reflect economies of scale and the extent to which economies of scale would be realized as the Fund grows. In evaluating the extent to which the management fees payable under the Investment Advisory and Sub-Advisory Agreements reflect economies of scale or will permit economies of scale to be realized in the future, the Board noted that TFAI offers breakpoints which appropriately benefit investors by passing on economies of scale in the form of lower management fees as the level of assets grows. The Trustees also concluded that they will have the opportunity to periodically reexamine whether the Fund has achieved economies of scale, and the appropriateness of management fees payable to TFAI and fees paid to the Sub-Adviser, in the future.
Benefits (such as soft dollars) to TFAI, its affiliates, or the Sub-Adviser from their relationship with the Fund. The Board concluded that other benefits anticipated to be derived by TFAI, its affiliates, and the Sub-Adviser from their relationships with the Fund are expected to be reasonable and fair, and consistent with industry practice and the best interests of the Fund and its shareholders. The Trustees noted that TFAI would not realize soft dollar benefits from its relationship with the Fund.
37
Other considerations. The Board determined that TFAI has made a substantial commitment to the recruitment and retention of high quality personnel, and maintains the financial, compliance and operational resources reasonably necessary to manage the Fund in a professional manner that is consistent with the best interests of the Fund and its shareholders. In this regard, the Trustees favorably considered the procedures and policies in place by TFAI to enforce compliance with applicable laws and regulations and oversee the portfolio management activities of the Sub-Adviser. The Trustees also determined that TFAI has made a significant entrepreneurial commitment to the management and success of the Fund, reflected by TFAI’s expense limitation and fee waiver arrangements with the Fund which may result in TFAI waiving a substantial amount of management fees for the benefit of shareholders.
38
T. Rowe Price Equity Income
MARKET ENVIRONMENT
Stocks hit record highs in 2007, before the housing, credit, and liquidity crises ultimately brought the party to a halt. For the year, value stocks produced negative returns across all capitalization ranges, lagging growth-oriented shares, as measured by the Standard and Poor’s Indexes. In the Standard and Poor’s 500 Composite Stock Index (“S&P 500”), energy (+34%) was the best-performing sector, followed by materials and utilities (+23% and +19%, respectively). Financial (–19%) and consumer discretionary (–13%) shares were the worst performers, weighed down by worry about fallout from ongoing financial and credit problems.
PERFORMANCE
For the year ended December 31, 2007, T. Rowe Price Equity Income, Initial Class returned 3.32%. By comparison its primary and secondary benchmarks, the S&P 500 and the Russell 1000 Value Index, returned 5.49% and (0.17)%, respectively.
STRATEGY REVIEW
Underperformance was primarily a result of positioning among information technology (“IT”) shares. The largest contribution to relative results came from stock picks among financials shares.
The main sources of weakness compared with the index were stock selection and an under weight position in IT stocks. Stock selection hurt in the computers and peripherals industry, where an underweight to Apple Inc. was the leading detractor. Positioning in the internet software and services industry also detracted behind an overweight to Yahoo! Inc. and underweight to Google Inc. Communication equipment holdings also detracted, as Alcatel-Lucent continued to work on turning around its business.
In materials, paper and forest products firm International Paper Company was a notable detractor because of a poor economic outlook and estimates of higher-than-expected costs and working capital use going forward. Stock picks also had a negative effect in chemicals, where it hurt to be underweight Monsanto Company and overweight International Flavors & Fragrances and E.I. du Pont de Nemours and Company.
Stock selection limited relative results in utilities, though it helped to be overweight in one of the best-performing sectors in the index. These stocks were attractive during a period of economic and market uncertainty because of their steady to improving fundamentals. Multi-utility NiSource Inc. underperformed as a result of disappointing earnings, and after a lengthy strategic review did not turn up ways to unlock shareholder value.
Looking at positive contributors, the main source of strength relative to the index was positioning in the financial sector, where it helped to be underweight the hard-hit banking and diversified financial services stocks—an underweight to Citigroup Inc. was a key source of relative strength. Capital market-related shares also helped relative results behind custody banks State Street Corporation and The Bank of New York Mellon Corporation. In addition, The Charles Schwab Corporation performed well on new client acquisition and asset growth.
An overweight position and stock selection among energy shares were further sources of relative strength. Stock picks contributed most among oil, gas, and consumable fuels shares, led by Hess Corporation, Murphy Oil Corporation, and ExxonMobil Corporation.
Brian C. Rogers
Portfolio Manager
T. Rowe Price Associates, Inc.
AEGON/Transamerica Series Trust | | Annual Report 2007 |
1
T. Rowe Price Equity Income
(unaudited)
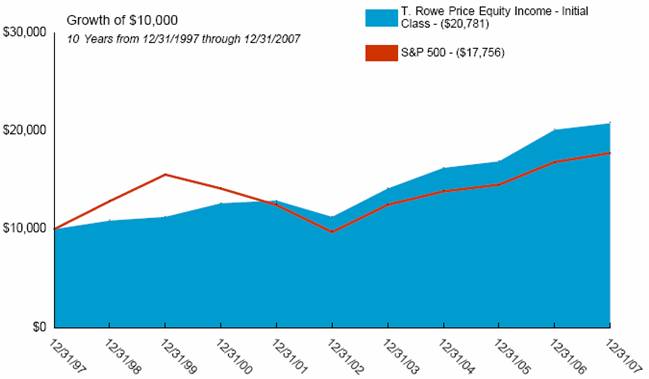
Average Annual Total Return for Periods Ended 12/31/2007
| | 1 Year | | 5 Years | | 10 Years | | From
Inception | | Inception
Date | |
| | | | | | | | | | | |
Initial Class | | 3.32 | % | 13.03 | % | 7.59 | % | 11.62 | % | 1/3/95 | |
S&P 500(1) | | 5.49 | % | 12.83 | % | 5.91 | % | 11.27 | % | 1/3/95 | |
Russell 1000 Value(1) | | (0.17 | )% | 14.63 | % | 7.68 | % | 12.78 | % | 1/3/95 | |
| | | | | | | | | | | |
Service Class | | 3.06 | % | — | % | — | % | 13.21 | % | 5/1/03 | |
NOTES
(1) The Standard and Poor’s 500 Composite Stock (S&P 500) Index and the Russell 1000 Value (Russell 1000 Value) Index are unmanaged indices used as a general measure of market performance. Calculations assume dividends and capital gains are reinvested and do not include any managerial expenses. From inception calculation is based on life of Initial Class shares.
The performance data presented represents past performance, future results may vary. The portfolio’s investment return and net asset value will fluctuate. Past performance does not guarantee future results. Investor’s units when redeemed, may be worth more or less than their original cost.
Current performance may be lower or higher than performance quoted. Please visit your insurance company’s website for contract or policy level standardized total returns current to the most recent month end. Portfolio performance is net of investment fees and fund expenses, but not product charges, which, if included, would significantly lower the performance quoted.
This material must be preceded or accompanied by a current prospectus, which includes specific contents regarding the investment objectives, explanation of share classes and policies of this portfolio.
2
T. Rowe Price Equity Income
UNDERSTANDING YOUR FUND’S EXPENSES
(unaudited)
SHAREHOLDER EXPENSES
Fund shareholders may incur ongoing costs, including management and advisory fees, distribution and service fees, and other fund expenses.
The following Example is intended to help you understand your ongoing costs (in dollars and cents) of investing in the Fund and to compare these costs with the ongoing costs of investing in other funds.
The Example is based on an investment of $1,000 invested at July 1, 2007 and held for the entire period until December 31, 2007.
ACTUAL EXPENSES
The first line in the table below provides information about actual account values and actual expenses. You may use the information in this line, together with the amount you invested, to estimate the expenses that you paid over the period. Simply divide your account value by $1,000 (for example, an $8,600 account value divided by $1,000 = 8.6), then multiply the result by the number in the first line of your Fund under the heading entitled “Expenses Paid During Period” to estimate the expenses you paid on your account during this period.
HYPOTHETICAL EXAMPLE FOR COMPARISON PURPOSES
The second line in the table below provides information about hypothetical account values and hypothetical expenses based on the Fund’s actual expense ratio and an assumed rate of return of 5% per year before expenses, which is not the Fund’s actual return. The hypothetical account values and expenses may not be used to estimate the actual ending account balance or expenses you paid for the period. You may use this information to compare the ongoing costs of investing in your Fund and other funds. To do so, compare this 5% hypothetical example with the 5% hypothetical examples that appear in the shareholder reports of the other funds.
Please note that the expenses shown in the table are meant to highlight your ongoing costs only and do not reflect any transactional costs, such as sales charges, redemption fees, brokerage commissions paid on purchases and sales of fund shares. Therefore, the second line under the Fund in the table is useful in comparing ongoing costs only, and will not help you determine the relative total costs of owning different funds. If any of these transaction costs were included, your costs would be higher. The expenses shown in the table do not reflect any fees that may be charged to you by brokers, financial intermediaries or other financial institutions.
| | Beginning
Account
Value | | Ending
Account
Value | | Annualized
Expense
Ratio | | Expenses
Paid During
Period (a) | |
| | | | | | | | | |
Initial Class | | | | | | | | | |
Actual | | $ | 1,000.00 | | $ | 955.56 | | 0.80 | % | $ | 3.94 | |
Hypothetical (b) | | 1,000.00 | | 1,021.17 | | 0.80 | | 4.08 | |
| | | | | | | | | |
Service Class | | | | | | | | | |
Actual | | 1,000.00 | | 954.30 | | 1.05 | | 5.17 | |
Hypothetical (b) | | 1,000.00 | | 1,019.91 | | 1.05 | | 5.35 | |
| | | | | | | | | | | | |
(a) | | Expenses are calculated using the Fund’s annualized expense ratio (as disclosed in the table), multiplied by the average account value for the period, multiplied by the number of days in the period (184 days), and divided by the number of days in the year (365 days). |
| | |
(b) | | 5% return per year before expenses. |
GRAPHICAL PRESENTATION OF SCHEDULE OF INVESTMENTS
By Sector
At December 31, 2007

This chart shows the percentage breakdown by sector of the Fund’s total investment securities.
3
T. Rowe Price Equity Income
SCHEDULE OF INVESTMENTS
At December 31, 2007
(all amounts except share amounts in thousands)
| | Principal | | Value | |
CONVERTIBLE BONDS (0.1%) | | | | | |
Automobiles (0.1%) | | | | | |
Ford Motor Co. , Convertible 4.25%, due 12/15/2036 | | $ | 824 | | $ | 819 | |
Total Convertible Bonds (cost $824) | | | | 819 | |
| | | | | | | |
| | Shares | | Value | |
| | | | | |
CONVERTIBLE PREFERRED STOCKS (0.1%) | | | | | |
Consumer Finance (0.1%) | | | | | |
SLM Corp. , Convertible ‡ | | 300 | | $ | 311 | |
Total Convertible Preferred Stocks (cost $300) | | | | 311 | |
| | | | | |
COMMON STOCKS (94.6%) | | | | | |
Aerospace & Defense (1.2%) | | | | | |
Honeywell International, Inc. | | 78,000 | | 4,803 | |
Raytheon Co. | | 30,100 | | 1,827 | |
Air Freight & Logistics (0.3%) | | | | | |
United Parcel Service, Inc. Class B | | 21,500 | | 1,520 | |
Airlines (0.3%) | | | | | |
Southwest Airlines Co. | | 121,400 | | 1,481 | |
Automobiles (0.8%) | | | | | |
Ford Motor Co. ‡^ | | 179,700 | | 1,210 | |
Harley-Davidson, Inc. | | 72,000 | | 3,363 | |
Beverages (1.9%) | | | | | |
Anheuser-Busch Cos., Inc. | | 121,500 | | 6,359 | |
Coca-Cola Co. (The) | | 73,800 | | 4,529 | |
Biotechnology (0.8%) | | | | | |
Amgen, Inc. ‡ | | 96,700 | | 4,491 | |
Building Products (1.1%) | | | | | |
Masco Corp. | | 196,800 | | 4,253 | |
USG Corp. ‡^ | | 62,900 | | 2,251 | |
Capital Markets (3.1%) | | | | | |
Charles Schwab Corp. (The) | | 24,000 | | 613 | |
Legg Mason, Inc. | | 54,000 | | 3,950 | |
Merrill Lynch & Co., Inc. | | 118,500 | | 6,361 | |
Och-Ziff Capital Management Group LLC Class A ^ | | 66,700 | | 1,753 | |
State Street Corp. | | 58,500 | | 4,750 | |
Chemicals (1.7%) | | | | | |
Ei DU Pont de Nemours & Co. | | 107,300 | | 4,731 | |
International Flavors & Fragrances, Inc. ^ | | 96,200 | | 4,630 | |
Commercial Banks (5.6%) | | | | | |
Bank of New York Mellon Corp. | | 154,880 | | 7,552 | |
Fifth Third Bancorp | | 168,100 | | 4,224 | |
KeyCorp | | 24,000 | | 563 | |
National City Corp. | | 86,300 | | 1,421 | |
PNC Financial Services Group, Inc. | | 1 | | q | |
Royal Bank of Scotland Group PLC | | 185,700 | | 1,641 | |
SunTrust Banks, Inc. | | 102,000 | | 6,374 | |
US Bancorp | | 220,600 | | 7,002 | |
Wells Fargo & Co. | | 84,040 | | 2,537 | |
Commercial Services & Supplies (1.3%) | | | | | |
Avery Dennison Corp. | | 91,000 | | 4,836 | |
Waste Management, Inc. | | 85,362 | | $ | 2,789 | |
Communications Equipment (0.9%) | | | | | |
Alcatel-Lucent | | 279,100 | | 2,043 | |
Motorola, Inc. | | 180,000 | | 2,887 | |
Computers & Peripherals (0.9%) | | | | | |
Dell, Inc. ‡ | | 201,300 | | 4,934 | |
Construction Materials (0.6%) | | | | | |
Vulcan Materials Co. | | 40,300 | | 3,187 | |
Consumer Finance (1.1%) | | | | | |
Capital One Financial Corp. | | 72,000 | | 3,403 | |
SLM Corp. | | 142,600 | | 2,872 | |
Diversified Consumer Services (0.6%) | | | | | |
H&R Block, Inc. | | 194,200 | | 3,606 | |
Diversified Financial Services (3.1%) | | | | | |
Citigroup, Inc. | | 141,659 | | 4,170 | |
JPMorgan Chase & Co. | | 310,422 | | 13,550 | |
Diversified Telecommunication Services (3.8%) | | | | | |
AT&T, Inc. | | 293,540 | | 12,199 | |
Qwest Communications International, Inc. ‡^ | | 571,000 | | 4,003 | |
Verizon Communications, Inc. | | 123,042 | | 5,376 | |
Electric Utilities (4.9%) | | | | | |
Duke Energy Corp. | | 170,700 | | 3,443 | |
Entergy Corp. | | 42,100 | | 5,032 | |
FirstEnergy Corp. | | 55,050 | | 3,982 | |
NiSource, Inc. | | 257,800 | | 4,870 | |
Pinnacle West Capital Corp. | | 51,800 | | 2,197 | |
Progress Energy, Inc. | | 82,700 | | 4,005 | |
TECO Energy, Inc. ^ | | 55,100 | | 948 | |
Xcel Energy, Inc. | | 151,500 | | 3,420 | |
Electrical Equipment (0.5%) | | | | | |
Cooper Industries, Ltd. Class A | | 51,714 | | 2,735 | |
Energy Equipment & Services (1.2%) | | | | | |
BJ Services Co. ^ | | 95,400 | | 2,315 | |
Schlumberger, Ltd. | | 47,000 | | 4,623 | |
Food & Staples Retailing (1.1%) | | | | | |
Walgreen Co. | | 6,000 | | 228 | |
Wal-Mart Stores, Inc. | | 121,500 | | 5,775 | |
Food Products (3.0%) | | | | | |
Campbell Soup Co. | | 50,200 | | 1,793 | |
General Mills, Inc. | | 80,600 | | 4,594 | |
Hershey Co. (The) | | 115,300 | | 4,543 | |
Kraft Foods, Inc. Class A | | 102,300 | | 3,338 | |
McCormick & Co., Inc. | | 62,800 | | 2,381 | |
Health Care Equipment & Supplies (0.7%) | | | | | |
Baxter International, Inc. | | 50,400 | | 2,925 | |
Boston Scientific Corp. ‡ | | 74,700 | | 869 | |
Health Care Providers & Services (0.1%) | | | | | |
Cardinal Health, Inc. | | 6,100 | | 352 | |
Household Durables (2.6%) | | | | | |
Dr Horton, Inc. | | 124,100 | | 1,634 | |
Fortune Brands, Inc. | | 57,400 | | 4,154 | |
Newell Rubbermaid, Inc. | | 179,000 | | 4,633 | |
The notes to the financial statements are an integral part of this report.
4
| | Shares | | Value | |
Household Durables (continued) | | | | | |
Sony Corp. | | 54,000 | | $ | 2,942 | |
Whirlpool Corp. | | 16,800 | | 1,371 | |
Household Products (2.4%) | | | | | |
Colgate-Palmolive Co. | | 54,000 | | 4,210 | |
Kimberly-Clark Corp. | | 46,800 | | 3,245 | |
Procter & Gamble Co. | | 79,200 | | 5,815 | |
Industrial Conglomerates (4.5%) | | | | | |
3M Co. | | 83,000 | | 6,999 | |
General Electric Co. | | 492,050 | | 18,240 | |
Insurance (5.6%) | | | | | |
American International Group, Inc. | | 114,500 | | 6,675 | |
Chubb Corp. | | 46,500 | | 2,538 | |
Genworth Financial, Inc. Class A | | 90,000 | | 2,290 | |
Lincoln National Corp. | | 91,166 | | 5,308 | |
Marsh & McLennan Cos., Inc. | | 288,800 | | 7,645 | |
Progressive Corp. (The) | | 136,800 | | 2,621 | |
Travelers Cos., Inc. (The) ‡ | | 83,010 | | 4,466 | |
Internet Software & Services (0.7%) | | | | | |
Yahoo!, Inc. ‡ | | 180,600 | | 4,201 | |
IT Services (0.6%) | | | | | |
Computer Sciences Corp. ‡ | | 50,300 | | 2,488 | |
Electronic Data Systems Corp. | | 54,600 | | 1,132 | |
Leisure Equipment & Products (1.1%) | | | | | |
Eastman Kodak Co. ^ | | 151,800 | | 3,320 | |
Mattel, Inc. | | 143,600 | | 2,734 | |
Machinery (1.0%) | | | | | |
Illinois Tool Works, Inc. | | 102,000 | | 5,461 | |
Media (5.4%) | | | | | |
Cablevision Systems Corp. Class A ‡ | | 84,900 | | 2,080 | |
CBS Corp. Class B | | 133,500 | | 3,638 | |
Comcast Corp. Class A ‡ | | 24,000 | | 438 | |
Gannett Co., Inc. | | 115,300 | | 4,497 | |
McGraw-Hill Cos., Inc. (The) ^ | | 120,000 | | 5,257 | |
New York Times Co. (The) Class A ^ | | 196,200 | | 3,439 | |
Time Warner, Inc. | | 363,800 | | 6,006 | |
Walt Disney Co. (The) ‡^ | | 157,200 | | 5,075 | |
Metals & Mining (0.6%) | | | | | |
Alcoa, Inc. | | 92,800 | | 3,392 | |
Oil, Gas & Consumable Fuels (11.7%) | | | | | |
Anadarko Petroleum Corp. | | 92,000 | | 6,043 | |
BP PLC | | 65,874 | | 4,820 | |
Chevron Corp. | | 149,650 | | 13,967 | |
Exxon Mobil Corp. | | 146,838 | | 13,757 | |
Hess Corp. | | 71,990 | | 7,261 | |
Murphy Oil Corp. | | 71,200 | | 6,041 | |
Royal Dutch Shell PLC Class A | | 125,400 | | 10,559 | |
Spectra Energy Corp. | | 101,800 | | 2,628 | |
Statoil ASA | | 30,400 | | 938 | |
Paper & Forest Products (2.0%) | | | | | |
International Paper Co. | | 245,293 | | 7,943 | |
MeadWestvaco Corp. | | 111,700 | | 3,496 | |
Personal Products (0.7%) | | | | | |
Avon Products, Inc. | | 103,300 | | 4,083 | |
Pharmaceuticals (7.4%) | | | | | |
Abbott Laboratories | | 71,900 | | $ | 4,037 | |
Bristol-Myers Squibb Co. | | 158,300 | | 4,198 | |
Eli Lilly & Co. | | 138,100 | | 7,373 | |
Johnson & Johnson | | 110,600 | | 7,377 | |
Merck & Co., Inc. | | 133,700 | | 7,770 | |
Pfizer, Inc. | | 272,200 | | 6,187 | |
Wyeth | | 106,900 | | 4,724 | |
Road & Rail (0.7%) | | | | | |
Union Pacific Corp. | | 30,000 | | 3,769 | |
Semiconductors & Semiconductor Equipment (1 .5%) | | | | | |
Analog Devices, Inc. | | 124,400 | | 3,944 | |
Applied Materials, Inc. | | 78,000 | | 1,385 | |
Intel Corp. | | 123,100 | | 3,282 | |
Software (2.0%) | | | | | |
Microsoft Corp. | | 312,100 | | 11,111 | |
Specialty Retail (1 .6%) | | | | | |
Bed Bath & Beyond, Inc. ‡^ | | 127,800 | | 3,756 | |
Home Depot, Inc. | | 198,100 | | 5,337 | |
Thrifts & Mortgage Finance (0.8%) | | | | | |
Countrywide Financial Corp. ^ | | 119,600 | | 1,069 | |
Fannie Mae | | 90,000 | | 3,598 | |
Tobacco (0.5%) | | | | | |
UST, Inc. ^ | | 50,100 | | 2,745 | |
Trading Companies & Distributors (0.5%) | | | | | |
Genuine Parts Co. | | 61,550 | | 2,850 | |
Wireless Telecommunication Services (0.6%) | | | | | |
Sprint Nextel Corp. | | 251,700 | | 3,305 | |
Total Common Stocks (cost $450,519) | | | | 535,709 | |
| | | | | |
Total Securities Lending Collateral (cost $32,385) (1) | | | | 32,385 | |
| | | | | |
Total Investment Securities (cost $484,028) # | | | | $ | 569,224 | |
The notes to the financial statements are an integral part of this report.
5
FORWARD FOREIGN CURRENCY CONTRACTS:
| | | | | | Amount in | | Net Unrealized | |
| | Bought | | Settlement | | U.S. Dollars | | Appreciation | |
Currency | | (Sold) | | Date | | Bought(Sold) | | (Depreciation) | |
Japanese Yen | | (38,053 | ) | 01/04/2008 | | $ | (332 | ) | $ | (8 | ) |
| | | | | | $ | (332 | ) | $ | (8 | ) |
NOTES TO SCHEDULE OF INVESTMENTS:
q | | Value is less than $1 |
^ | | At December 31, 2007, all or a portion of this security is on loan (see Note 1). The value at December 31, 2007, of all securities on loan is $30,755. |
‡ | | Non-Income Producing. |
(1) | | Cash collateral for the Repurchase Agreements, valued at $11, 739, that serves as collateral for securities lending, is invested in corporate bonds with interest rates and maturity dates ranging from 3.00% - 10.18% and 04/28/2008 - 12/01/2096, respectively. |
# | | Aggregate cost for federal income tax purposes is $485,071. Aggregate gross unrealized appreciation for all securities in which there is an excess of value over tax cost and aggregate gross unrealized depreciation for all securities in which there is an excess of tax cost over value were $119,915 and $35, 762, respectively. Net unrealized appreciation for tax purposes is $84,153. |
The notes to the financial statements are an integral part of this report.
6
T. Rowe Price Equity Income
STATEMENT OF ASSETS AND LIABILITIES
At December 31, 2007
(all amounts except per share amounts in thousands)
Assets: | | | |
Investment securities, at value (cost: $484,028)
(including securities loaned of $30,755) | | $ | 569,224 | |
Cash | | 24,876 | |
Receivables: | | | |
Investment securities sold | | 2,476 | |
Shares sold | | 50 | |
Interest | | 57 | |
Income from loaned securities | | 16 | |
Dividends | | 913 | |
Dividend reclaims | | 15 | |
| | 597,627 | |
Liabilities: | | | |
Investment securities purchased | | 1,340 | |
Accounts payable and accrued liabilities: | | | |
Shares redeemed | | 386 | |
Management and advisory fees | | 358 | |
Distribution and service fees | | 7 | |
Administration fees | | 10 | |
Payable for collateral for securities on loan | | 32,385 | |
Unrealized depreciation on forward foreign currency contracts | | 8 | |
Other | | 120 | |
| | 34,614 | |
Net Assets | | $ | 563,013 | |
| | | | |
Net Assets Consist of: | | | |
Capital Stock ($.01 par value) | | $ | 295 | |
Additional paid-in capital | | 343,372 | |
Undistributed (accumulated) net investment income | | 10,656 | |
Undistributed (accumulated) net realized gain from investment securities and foreign currency transactions | | 123,494 | |
Net unrealized appreciation on investment securities | | 85,196 | |
Net Assets | | $ | 563,013 | |
Net Assets by Class: | | | |
Initial Class | | $ | 531,387 | |
Service Class | | 31,626 | |
Shares Outstanding: | | | |
Initial Class | | 27,845 | |
Service Class | | 1,651 | |
Net Asset Value and Offering Price Per Share: | | | |
Initial Class | | $ | 19.08 | |
Service Class | | 19.15 | |
STATEMENT OF OPERATIONS
For the year ended December 31, 2007
(all amounts in thousands)
Investment Income: | | | |
Dividends (net of withholding taxes on foreign dividends of $92) | | $ | 14,715 | |
Interest | | 918 | |
Income from loaned securities-net | | 162 | |
| | 15,795 | |
| | | |
Expenses: | | | |
Management and advisory fees | | 4,686 | |
Printing and shareholder reports | | 73 | |
Custody fees | | 78 | |
Administration fees | | 126 | |
Legal fees | | 13 | |
Audit fees | | 21 | |
Trustees fees | | 22 | |
Distribution and service fees: | | | |
Service Class | | 78 | |
Other | | 10 | |
Total expenses | | 5,107 | |
| | | |
Net Investment Income | | 10,688 | |
| | | |
Net Realized Gain (Loss) from: | | | |
Investment securities | | 124,421 | |
Foreign currency transactions | | (32 | ) |
| | 124,389 | |
| | | |
Net Increase (Decrease) in Unrealized Appreciation (Depreciation) on: | | | |
Investment securities | | (113,040 | ) |
| | | |
Net Realized and Unrealized Gain: | | 11,349 | |
Net Increase In Net Assets Resulting from Operations | | $ | 22,037 | |
The notes to the financial statements are an integral part of this report.
7
T. Rowe Price Equity Income
STATEMENTS OF CHANGES IN NET ASSETS
For the years ended
(all amounts in thousands)
| | December 31,
2007 | | December 31,
2006 | |
Increase (Decrease) in Net Assets From: | | | | | |
Operations: | | | | | |
Net investment income | | $ | 10,688 | | $ | 13,051 | |
Net realized gain from investment securities and foreign currency transactions | | 124,389 | | 55,074 | |
Change in unrealized appreciation (depreciation) on investment securities and foreign currency translation | | (113,040 | ) | 75,433 | |
| | 22,037 | | 143,558 | |
Distributions to Shareholders: | | | | | |
From net investment income: | | | | | |
Initial Class | | (12,378 | ) | (14,402 | ) |
Service Class | | (620 | ) | (388 | ) |
| | (12,998 | ) | (14,790 | ) |
From net realized gains: | | | | | |
Initial Class | | (52,163 | ) | (84,697 | ) |
Service Class | | (2,860 | ) | (2,536 | ) |
| | (55,023 | ) | (87,233 | ) |
Capital Share Transactions: | | | | | |
Proceeds from shares sold: | | | | | |
Initial Class | | 33,416 | | 55,090 | |
Service Class | | 11,730 | | 8,931 | |
| | 45,146 | | 64,021 | |
Dividends and distributions reinvested: | | | | | |
Initial Class | | 64,541 | | 99,099 | |
Service Class | | 3,479 | | 2,924 | |
| | 68,020 | | 102,023 | |
Cost of shares redeemed: | | | | | |
Initial Class | | (364,579 | ) | (155,280 | ) |
Service Class | | (9,750 | ) | (5,767 | ) |
| | (374,329 | ) | (161,047 | ) |
| | (261,163 | ) | 4,997 | |
Net increase (decrease) in net assets | | (307,147 | ) | 46,532 | |
| | | | | |
Net Assets: | | | | | |
Beginning of year | | 870,160 | | 823,628 | |
End of year | | $ | 563,013 | | $ | 870,160 | |
Undistributed (Accumulated) Net Investment Income (Loss) | | $ | 10,656 | | $ | 13,008 | |
Share Activity: | | | | | |
Shares issued: | | | | | |
Initial Class | | 1,571 | | 2,771 | |
Service Class | | 556 | | 437 | |
| | 2,127 | | 3,208 | |
Shares issued-reinvested from distributions: | | | | | |
Initial Class | | 3,374 | | 5,288 | |
Service Class | | 181 | | 155 | |
| | 3,555 | | 5,443 | |
Shares redeemed: | | | | | |
Initial Class | | (17,519 | ) | (7,510 | ) |
Service Class | | (468 | ) | (278 | ) |
| | (17,987 | ) | (7,788 | ) |
Net increase (decrease) in shares outstanding: | | | | | |
Initial Class | | (12,574 | ) | 549 | |
Service Class | | 269 | | 314 | |
| | (12,305 | ) | 863 | |
The notes to the financial statements are an integral part of this report.
8
T. Rowe Price Equity Income
FINANCIAL HIGHLIGHTS
For a share outstanding throughout each period(a)
| | Initial Class | |
| | Year Ended December 31, | |
| | 2007 | | 2006 | | 2005 | | 2004 | | 2003 | |
Net Asset Value | | | | | | | | | | | |
Beginning of period | | $ | 20.81 | | $ | 20.12 | | $ | 21.32 | | $ | 18.96 | | $ | 15.29 | |
Investment Operations | | | | | | | | | | | |
Net investment income (loss) | | 0.36 | | 0.33 | | 0.33 | | 0.31 | | 0.30 | |
Net realized and unrealized gain (loss) | | 0.34 | | 3.18 | | 0.50 | | 2.45 | | 3.59 | |
Total operations | | 0.70 | | 3.51 | | 0.83 | | 2.76 | | 3.89 | |
Distributions | | | | | | | | | | | |
From net investment income | | (0.47 | ) | (0.41 | ) | (0.39 | ) | (0.26 | ) | (0.12 | ) |
From net realized gains | | (1.96 | ) | (2.41 | ) | (1.64 | ) | (0.14 | ) | (0.10 | ) |
Total distributions | | (2.43 | ) | (2.82 | ) | (2.03 | ) | (0.40 | ) | (0.22 | ) |
Net Asset Value | | | | | | | | | | | |
End of period(b) | | $ | 19.08 | | $ | 20.81 | | $ | 20.12 | | $ | 21.32 | | $ | 18.96 | |
Total Return(c),(d) | | 3.32 | % | 18.96 | % | 4.11 | % | 14.81 | % | 25.59 | % |
Net Assets End of Period (000’s) | | $ | 531,387 | | $ | 841,295 | | $ | 802,067 | | $ | 919,982 | | $ | 1,058,801 | |
Ratio and Supplemental Data | | | | | | | | | | | |
Expenses to average net assets(e) | | 0.80 | % | 0.80 | % | 0.79 | % | 0.78 | % | 0.78 | % |
Net investment income (loss), to average net assets(e) | | 1.70 | % | 1.61 | % | 1.60 | % | 1.57 | % | 1.80 | % |
Portfolio turnover rate(d) | | 22 | % | 14 | % | 22 | % | 22 | % | 14 | % |
For a share outstanding throughout each period(a)
| | Service Class | |
| | Year Ended December 31, | | May 1 to Dec | |
| | 2007 | | 2006 | | 2005 | | 2004 | | 31, 2003 | |
Net Asset Value | | | | | | | | | | | |
Beginning of period | | $ | 20.89 | | $ | 20.19 | | $ | 21.42 | | $ | 19.05 | | $ | 15.62 | |
Investment Operations | | | | | | | | | | | |
Net investment income (loss) | | 0.30 | | 0.28 | | 0.28 | | 0.29 | | 0.19 | |
Net realized and unrealized gain (loss) | | 0.35 | | 3.20 | | 0.50 | | 2.43 | | 3.35 | |
Total operations | | 0.65 | | 3.48 | | 0.78 | | 2.72 | | 3.54 | |
Distributions | | | | | | | | | | | |
From net investment income | | (0.43 | ) | (0.37 | ) | (0.37 | ) | (0.21 | ) | (0.01 | ) |
From net realized gains | | (1.96 | ) | (2.41 | ) | (1.64 | ) | (0.14 | ) | (0.10 | ) |
Total distributions | | (2.39 | ) | (2.78 | ) | (2.01 | ) | (0.35 | ) | (0.11 | ) |
Net Asset Value | | | | | | | | | | | |
End of period(b) | | $ | 19.15 | | $ | 20.89 | | $ | 20.19 | | $ | 21.42 | | $ | 19.05 | |
Total Return(c),(d) | | 3.06 | % | 18.71 | % | 3.81 | % | 14.56 | % | 22.74 | % |
Net Assets End of Period (000’s) | | $ | 31,626 | | $ | 28,865 | | $ | 21,561 | | $ | 11,765 | | $ | 1,476 | |
Ratio and Supplemental Data | | | | | | | | | | | |
Expenses to average net assets(e) | | 1.05 | % | 1.05 | % | 1.04 | % | 1.04 | % | 1.03 | % |
Net investment income (loss), to average net assets(e) | | 1.45 | % | 1.35 | % | 1.37 | % | 1.45 | % | 1.64 | % |
Portfolio turnover rate(d) | | 22 | % | 14 | % | 22 | % | 22 | % | 14 | % |
(a) | | Per share information is calculated based on average number of shares outstanding. |
(b) | | T. Rowe Price Equity Income (the “Fund”) share class commenced operations as follows: |
| | Initial Class - January 3, 1995 |
| | Service Class - May 1, 2003 |
(c) | | Total Return reflects all portfolio expenses and includes reinvestment of dividends and capital gains; it does not reflect the charges and deductions under the policies or annuity contracts. |
(d) | | Not annualized. |
(e) | | Annualized. |
The notes to the financial statements are an integral part of this report.
9
T. Rowe Price Equity Income
NOTES TO FINANCIAL STATEMENTS
At December 31, 2007
(all amounts in thousands)
NOTE 1. ORGANIZATION AND SIGNIFICANT ACCOUNTING POLICIES
AEGON/Transamerica Series Trust (“ATST”) is an open-end management investment company registered under the Investment Company Act of 1940, as amended (the “1940 Act”). ATST serves as a funding vehicle for variable life insurance, variable annuity and group annuity products. T. Rowe Price Equity Income (the “Fund”) is part of ATST.
In the normal course of business, the Fund enters into contracts that contain a variety of representations that provide general indemnifications. The Fund’s maximum exposure under these arrangements is unknown, as this would involve future claims that may be made against the Fund and/or its affiliates that have not yet occurred. However, based on experience, the Fund expects the risk of loss to be remote.
This report should be read in conjunction with the current Fund prospectus, which contains more complete information about the Fund.
In preparing the Fund’s financial statements in accordance with accounting principles generally accepted in the United States of America (“GAAP”), estimates or assumptions (which could differ from actual results) may be used that affect reported amounts and disclosures. The following is a summary of significant accounting policies followed by the Fund.
Multiple class operations, income and expenses: The Fund currently offers two classes of shares, an Initial Class and a Service Class. Income, non-class specific expenses and realized and unrealized gains and losses, are allocated daily to each class, based upon the value of shares outstanding method as permitted under Rule 18f-3 of the 1940 Act. Each class bears its own specific expenses as well as a portion of general, common expenses.
Security valuations: The Fund values its investments at the close of the New York Stock Exchange (“NYSE”), normally 4 p.m. ET, each day the NYSE is open for business. Fund investments are valued at the last sale price or closing price on the day of valuation taken from the primary exchange where the security is principally traded.
Securities traded in the over-the-counter market and listed securities for which no sale was reported on that date are valued at the last quoted bid price.
Debt securities are valued based on a price quotation or other equivalent indication of value supplied by an exchange, a pricing service or a major market maker; however, those that mature in sixty days or less are valued at amortized cost, which approximates market.
Investment company securities are valued at the net asset value of the underlying portfolio.
Foreign securities generally are valued based on quotations from the primary market in which they are traded. Because many foreign securities markets and exchanges close prior to the close of the NYSE, closing prices for foreign securities in those markets or on those exchanges do not reflect the events that occur after that close. If a significant market event impacting the value of a portfolio security (e.g., natural disaster, company announcement, market volatility) occurs subsequent to the close of trading in the security, but prior to the calculation of the Fund’s net asset value per share, market quotations for that security may be determined to be unreliable and, accordingly, not “readily available.” As a result, foreign equity securities held by the Fund may be valued at fair market value as determined in good faith by the Fund’s Administrative Valuation Committee, using guidelines adopted by the Board of Trustees.
Other securities for which quotations are not readily available are valued at fair market value as determined in good faith by the Fund’s Administrative Valuation Committee, using guidelines adopted by the Board of Trustees.
Cash: The Fund may leave cash overnight in its cash account with the custodian, State Street Bank & Trust Company (“State Street”). On July 2, 2007, State Street acquired the parent company of Investors Bank & Trust Company. State Street has been contracted on behalf of the Fund to invest the excess cash into a savings account, which at December 31, 2007 was paying an interest rate of 2.60%.
Repurchase agreements: The Fund is authorized to enter into repurchase agreements. The Fund, through its custodian, State Street, receives delivery of the underlying securities, the value of which at the time of purchase is required to be an amount equal to at least 100% of the resale price. The Fund will bear the risk of value fluctuations until the security can be sold and may encounter delays and incur costs in liquidating the security. In the event of bankruptcy or insolvency of the seller, delays and costs may be incurred.
Commission recapture: The sub-adviser, to the extent consistent with the best execution and usual commission rate policies and practices, may place security transactions of the Fund with broker/dealers with which ATST has established a Commission Recapture Program. A Commission Recapture Program is any arrangement under which a broker/dealer applies a portion of the commissions received by such broker/dealer on the security transactions to the Fund. In no event will commissions paid by the Fund be used to pay expenses that would otherwise be borne by any other funds within ATST, or by any other party.
Recaptured commissions during the year ended December 31, 2007 of $7 are included in net realized gains in the Statement of Operations.
Securities lending: The Fund may lend securities to qualified borrowers, with State Street acting as the Fund’s lending agent. The Fund earns negotiated lenders’ fees. The Fund receives cash and/or securities as collateral against the loaned securities. Cash collateral received is invested in short-term, interest-bearing securities. The Fund monitors the market value
10
NOTES TO FINANCIAL STATEMENTS (continued)
At December 31, 2007
(all amounts in thousands)
NOTE 1.–(continued)
of securities loaned on a daily basis and requires collateral in an amount at least equal to the value of the securities loaned. Income from loaned securities earned by State Street for its services, shown in the Statement of Operations is net of fees, in the amount of $70.
The Fund has invested the cash collateral received from securities loaned in the following short-term, interest-bearing securities:
Abbey National PLC, Eurodollar Term, 5.00%, 1/7/2008 | | $ | 1,398 | |
ABN AMRO Bank NV, Eurodollar Term, 5.18%, 1/4/2008 | | 1,118 | |
Bank of Nova Scotia, Eurodollar Term, 4.96%, 1/22/2008 | | 979 | |
Barclays, Eurodollar Term, 5.00%, 2/12/2008 | | 1,957 | |
BNP Paribas, Eurodollar Term, 5.01%, 1/11/2008 | | 1,817 | |
Calyon, Eurodollar Term, 5.12%, 3/3/2008 | | 419 | |
Credit Suisse First Boston Corp., Repurchase Agreement, 4.60%, 1/2/2008 | | 3,635 | |
Dexia Group, Eurodollar Term, 4.82%, 1/3/2008 | | 1,398 | |
HBOS Halifax Bank of Scotland, Eurodollar Term, 5.15%, 1/2/2008 | | 699 | |
JPMorgan Chase & Co., Eurodollar Term, 5.15%, 2/12/2008 | | 699 | |
Lloyds TSB Bank, Eurodollar Term, 5.15%, 1/24/2008 | | 1,398 | |
Merrill Lynch & Co. (RPG), Repurchase Agreement, 4.60%, 1/2/2008 | | 2,097 | |
Morgan Stanley & Co. (Corp. Repo), Repurchase Agreement, 4.60%, 1/2/2008 | | 5,732 | |
Rabobank Nederland, Eurodollar Term, 5.08%, 1/10/2008 | | 1,677 | |
Reserve Primary Money Market Fund, 4.95% | | 1,491 | |
Royal Bank of Scotland, Eurodollar Term, 5.00%, 2/25/2008 | | 1,677 | |
Societe Generale, Eurodollar Term, 5.15%, 3/3/2008 | | 839 | |
Toronto Dominion Bank, Eurodollar Term, 5.05%, 1/10/2008 | | 1,677 | |
UBS AG, Eurodollar Term, 4.92%, 1/11/2008 | | 979 | |
Wells Fargo, Bank Note, 4.75%, 1/8/2008 | | 699 | |
| | | |
| | $ | 32,385 | |
Security transactions and investment income: Security transactions are recorded on the trade date. Security gains and losses are calculated on the first-in, first-out basis. Dividend income, if any, is recorded on the ex-dividend date or, in the case of foreign securities, as soon as the Fund is informed of the ex-dividend date. Interest income, including accretion of discounts and amortization of premiums, is recorded on the accrual basis commencing on the settlement date.
Foreign currency denominated investments: The accounting records of the Fund are maintained in U.S. dollars. Securities and other assets and liabilities denominated in foreign currencies are translated into U.S. dollars at the closing exchange rate each day. The cost of foreign securities is translated at the exchange rate in effect when the investment was acquired. The Fund combines fluctuations from currency exchange rates and fluctuations in value when computing net realized and unrealized gains or losses from investments.
Net foreign currency gains and losses resulting from changes in exchange rates include: 1) foreign currency fluctuations between trade date and settlement date of investment security transactions; 2) gains and losses on forward foreign currency contracts; and 3) the difference between the receivable amounts of interest and dividends recorded in the accounting records in U.S. dollars and the amounts actually received.
Foreign currency denominated assets may involve risks not typically associated with domestic transactions. These risks include revaluation of currencies, adverse fluctuations in foreign currency values and possible adverse political, social and economic developments, including those particular to a specific industry, country or region.
Forward foreign currency contracts: The Fund may enter into forward foreign currency contracts to hedge against exchange rate risk arising from investments in securities denominated in foreign currencies. Contracts are valued at the contractual forward rate and are marked to market daily, with the change in value recorded as an unrealized gain or loss. When the contracts are settled a realized gain or loss is incurred. Risks may arise from changes in market value of the underlying currencies and from the possible inability of counterparties to meet the terms of their contracts.
Open forward foreign currency contracts at December 31, 2007 are listed in the Schedule of Investments.
Dividend distributions: Dividends and capital gains distributions are typically declared and reinvested annually and are generally paid and reinvested on the business day following the ex-date.
NOTE 2. RELATED PARTY TRANSACTIONS
ATST serves as a funding vehicle for certain affiliated asset allocation portfolios and certain affiliated separate accounts of Western Reserve Life Assurance Co. of Ohio, Transamerica Life Insurance Company, Transamerica Financial Life Insurance Company, Inc., Monumental Life Insurance Company and Transamerica Occidental Life Insurance Company.
Transamerica Fund Advisors, Inc. (“TFAI”) is the Fund’s investment adviser. Transamerica Fund Services, Inc. (“TFS”) is the Fund’s administrator and transfer agent. Prior to May 1, 2007, AFSG Securities Corp. (“AFSG”), was the Fund’s distributor. Transamerica Capital Inc. (“TCI”) is now the Fund’s distributor. TFAI, TFS, AFSG, and TCI are affiliates of AEGON NV, a Netherlands corporation.
Certain officers and trustees of the Fund are also officers and/or directors of TFAI, TFS and TCI.
The following schedule reflects the percentage of Fund assets owned by affiliated investment companies at December 31, 2007:
| | Net
Assets | | % of Net
Assets | |
Asset Allocation-Conservative Portfolio | | $ | 585 | | 0.11 | % |
Asset Allocation-Growth Portfolio | | 99 | | 0.02 | |
Asset Allocation-Moderate Growth Portfolio | | 918 | | 0.16 | |
Asset Allocation-Moderate Portfolio | | 1,033 | | 0.18 | |
Total | | $ | 2,635 | | 0.47 | % |
11
NOTES TO FINANCIAL STATEMENTS (continued)
At December 31, 2007
(all amounts in thousands)
NOTE 2.–(continued)
Investment advisory fee: The Fund pays management fees to TFAI based on average daily net assets (“ANA”) at the following breakpoints:
0.75% of the first $250 million of ANA
0.74% of the next $250 million of ANA
0.75% of ANA over $500 million
TFAI has contractually agreed to waive its advisory fee and will reimburse the Fund to the extent that operating expenses, excluding 12b-1 fees, exceed the following stated annual limit:
0.88% Expense Limit
If total Fund expenses fall below the annual expense limitation agreement agreed to by the adviser within the succeeding three years, the Fund may be required to pay the adviser a portion or all of the waived advisory fees.
There were no amounts recaptured during the year ended December 31, 2007. There are no amounts available for recapture at December 31, 2007.
The sub-adviser, T. Rowe Price, has agreed to a pricing discount based on aggregate assets that it manages in ATST. The amount of the discount received by the Fund at December 31, 2007 was $27.
Distribution and service fees: ATST entered into a Distribution Agreement with AFSG dated January 1, 1997, as amended. On May 1, 2007, the Distribution Agreement was amended to replace AFSG with TCI as the Fund’s distributor. The Fund has also adopted a distribution plan (“Distribution Plan”) pursuant to Rule 12b-1 under the 1940 Act.
Under the Distribution Plan for the Initial Class shares, TCI, on behalf of the Fund, is authorized to pay various service providers, as direct payment for expenses incurred in connection with distribution of the Fund’s shares, amounts equal to actual expenses associated with distributing the shares.
The Distribution Plan for the Service Class shares requires ATST to pay distribution fees to TCI as compensation for its activities, not as reimbursement for specific expenses. The fee on the Service Class is paid to the insurance companies for providing services and account maintenance for their policyholders who invest in the variable insurance products which invest in the Service Class shares.
The Fund is authorized under the Distribution Plan to pay fees on each class up to the following limits:
Initial Class | | 0.15 | % |
Service Class | | 0.25 | % |
TCI has determined that it will not seek payment by the Fund of the distribution expenses incurred with respect to the Initial Class shares before April 30, 2009. Prior to TCI seeking reimbursement of future expenses, policy and contract owners will be notified in advance. The Fund will pay fees relating to Service Class shares.
Administrative services: The Fund has entered into an agreement with TFS for financial and legal fund administration services. The Fund pays TFS an annual fee of 0.02% of ANA. The Legal fees on the Statement of Operations are for fees paid to external legal counsel.
Deferred compensation plan: Each eligible independent Fund Trustee may elect participation in a non-qualified deferred compensation plan (“the Plan”). Under the Plan, such Trustees may defer payment of all or a portion of their total fees earned as a Fund Trustee. Each Trustee who is a participant in the Plan may elect that the earnings, losses or gains credited to his or her deferred fee amounts be determined based on a deemed investment in any series of Transamerica IDEX Mutual Funds. The right of a participant to receive a distribution from the Plan of the deferred fees is an unsecured claim against the general assets of all series of Transamerica IDEX Mutual Funds. The pro rata liability to the Fund of all deferred fees in the Plan amounted, as of December 31, 2007, to $27. Amounts deferred under the Plan are unfunded against the general assets of ATST.
Retirement plan: Under a retirement plan (the “Emeritus Plan”) available to the Independent Trustees, each Independent Trustee is deemed to have elected to serve as Trustee Emeritus of ATST upon his or her termination of service, other than removal for cause, is entitled to 50% of the trustee’s current retainer for a maximum period of five years determined by his or her years of service as a Trustee.
Such amounts shall be accrued by ATST on a pro rata basis allocable to each series of ATST fund based on the relative assets of the series. If retainers increase in the future, past accruals (and credits) will be adjusted upward so that 50% of the Trustee’s current retainer is accrued and credited at all times. Upon death, disability or termination of service, other than removal for cause, amounts deferred become payable to a Trustee Emeritus (or his/her beneficiary). Upon the commencement of service as Trustee Emeritus, compensation will be paid on a quarterly basis during the time period that the Trustee Emeritus is allowed to serve as such.
Amounts accrued under the Emeritus Plan are unsecured claims against the general assets of ATST. For the year ended December 31, 2007, the amount related to the Emeritus Plan was $33. As of December 31, 2007, the Fund has not made any payments related to the Emeritus Plan.
The Emeritus Plan was terminated effective October 30, 2007. Upon the termination, the Fund shall continue to pay any remaining benefits in accordance with the Plan, but no further compensation shall accrue under the Plan.
12
NOTES TO FINANCIAL STATEMENTS (continued)
At December 31, 2007
(all amounts in thousands)
NOTE 3. INVESTMENT TRANSACTIONS
The cost of securities purchased and proceeds from securities sold (excluding short-term securities) for the year ended December 31, 2007 were as follows:
Purchases of securities: | | | |
Long-term | | $ | 132,999 | |
U.S. Government | | — | |
Proceeds from maturities and sales of securities: | | | |
Long-term | | 440,041 | |
U.S. Government | | — | |
| | | | |
NOTE 4. FEDERAL INCOME TAX MATTERS
The Fund has not made any provision for federal income or excise taxes due to its policy to distribute all of its taxable income and capital gains to its shareholders and otherwise qualify as a regulated investment company under Subchapter M of the Internal Revenue Code. Income and capital gain distributions are determined in accordance with income tax regulations, which may differ from GAAP. These differences are primarily due to differing treatment for items including, but not limited to, wash sales, REITs and foreign currency transactions.
Therefore, distributions determined in accordance with tax regulations may differ significantly in amount or character from net investment income and realized gains for financial reporting purposes. Financial reporting records are adjusted for permanent book/tax differences to reflect tax character. Financial records are not adjusted for temporary differences. These reclassifications are as follows:
Additional paid-in capital | | $ | — | |
Undistributed (accumulated) net investment income (loss) | | $ | (42 | ) |
Undistributed (accumulated) net realized gain (loss) from investment securities | | $ | 42 | |
The tax character of distributions paid may differ from the character of distributions shown in the Statements of Changes in Net Assets due to short-term gains being treated as ordinary income for tax purposes. The tax character of distributions paid during 2006 and 2007 was as follows:
2006 Distributions paid from: | | | |
Ordinary Income | | $ | 20,284 | |
Long-term Capital Gain | | 81,739 | |
| | | |
2007 Distributions paid from: | | | |
Ordinary Income | | 15,695 | |
Long-term Capital Gain | | 52,326 | |
| | | | |
The tax basis components of distributable earnings as of December 31, 2007 are as follows:
Undistributed Ordinary Income | | $ | 14,885 | |
Undistributed Long-term Capital Gain | | $ | 120,313 | |
Capital Loss Carryforward | | $ | — | |
Post October Capital Loss Deferral | | $ | — | |
Post October Currency Loss Deferral | | $ | (14 | ) |
Net Unrealized Appreciation (Depreciation) | | $ | 84,162 | |
NOTE 5. REGULATORY PROCEEDINGS
There continues to be significant federal and state regulatory activity relating to financial services companies, particularly mutual fund companies and their investment advisers. As part of an ongoing investigation regarding potential market timing, recordkeeping and trading compliance issues and matters affecting the Fund’s investment adviser, TFAI, and certain affiliates and former employees of TFAI, the SEC staff has indicated that it is likely to take some action against TFAI and certain of its affiliates at the conclusion of the investigation. The potential timing and the scope of any such action is difficult to predict. Although the impact of any action brought against TFAI and/or its affiliates is difficult to assess at the present time, the Fund currently believes that the likelihood that any such action will have a material adverse impact on it is remote. It is important to note that the Fund is not aware of any allegation of wrong doing against it and its Board at the time this annual report is printed. Although it is not anticipated that these developments will have an adverse impact on the Fund, there can be no assurance at this time. TFAI and its affiliates are actively working with the SEC in regard to this matter; however, the exact resolution cannot be determined at this time. TFAI will take such actions that it deems necessary or appropriate to continue providing management services to the Fund and to bring all matters to an appropriate conclusion.
TFAI and/or its affiliates, and not the Fund, will bear the costs regarding these regulatory matters.
NOTE 6. RECENTLY ISSUED ACCOUNTING PRONOUNCEMENTS
In July 2006, the Financial Accounting Standards Board (“FASB”) released FASB Interpretation No. 48 “Accounting for Uncertainty in Income Taxes” (“FIN 48”), an interpretation of FASB Statement No. 109. FIN 48 provides guidance for how uncertain tax positions should be recognized, measured, presented and disclosed in the financial statements. FIN 48 requires the accounting and disclosure of tax positions taken or expected to be taken in the course of preparing the Fund’s tax returns to determine whether the tax positions are “more-likely-than-not” of being sustained by the applicable tax authority. Tax positions not deemed to meet the more-likely-than-not threshold would be recorded as a tax benefit or expense in the current year.
13
NOTES TO FINANCIAL STATEMENTS (continued)
At December 31, 2007
(all amounts in thousands)
NOTE 6.–(continued)
Adoption of FIN 48 is effective during the first required financial reporting period for fiscal years beginning after December 15, 2006. Management adopted FIN 48 on June 29, 2007.
Implementation of FIN 48 requires Management of the Fund to analyze all open tax years, as defined by the Statute of Limitations, for all major jurisdictions, which includes federal and certain states. Open tax years are those that are open for exam by taxing authorities (i.e., the last 4 tax year ends and the interim tax period since then). The Fund has no examinations in progress and none are expected at this time.
Management of the Fund has reviewed all open tax years and major jurisdictions and concluded the adoption of FIN 48 resulted in no impact to the Fund’s net assets or results of operations. There is no tax liability resulting from unrecognized tax benefits relating to uncertain income tax positions taken or expected to be taken in future tax returns. The Fund is also not aware of any tax positions for which it is reasonably possible that the total amounts of unrecognized tax benefits will significantly change in the next 12 months.
In September 2006, FASB issued its new Standard No. 157, “Fair Value Measurements” (“FAS 157”). FAS 157 is designed to unify guidance for the measurement of fair value of all types of assets, including financial instruments, and certain liabilities, throughout a number of accounting standards. FAS 157 also establishes a hierarchy for measuring fair value in generally accepted accounting principles and expands financial statement disclosures about fair value measurements that are relevant to mutual funds. FAS 157 is effective for financial statements issued for fiscal years beginning after November 15, 2007, and earlier application is permitted.
As of December 31, 2007, Management does not expect the adoption of FAS 157 to impact the amounts reported in the financial statements, however, additional disclosures will be required about the inputs used to develop the measurements of fair value and the effect of certain of the measurements reported in the statement of operations for a fiscal period.
NOTE 7. SUBSEQUENT EVENT
Effective January 1, 2008, TFAI changed its name to Transamerica Asset Management, Inc.
Effective May 1, 2008, AEGON/Transamerica Series Trust will change its name to Transamerica Series Trust. At that time, the Fund will also change its name to Transamerica T. Rowe Price Equity Income VP.
14
Report of Independent Registered Certified Public Accounting Firm
To the Board of Trustees and Shareholders of
T. Rowe Price Equity Income:
In our opinion, the accompanying statement of assets and liabilities, including the schedule of investments, and the related statements of operations and of changes in net assets and the financial highlights present fairly, in all material respects, the financial position of T. Rowe Price Equity Income (the “Fund”) (one of the portfolios constituting AEGON/Transamerica Series Trust) at December 31, 2007, the results of its operations for the year then ended, the changes in its net assets for each of the two years in the period then ended and the financial highlights for each of the periods presented, in conformity with accounting principles generally accepted in the United States of America. These financial statements and financial highlights (hereafter referred to as “financial statements”) are the responsibility of the Fund’s management; our responsibility is to express an opinion on these financial statements based on our audits. We conducted our audits of these financial statements in accordance with the standards of the Public Company Accounting Oversight Board (United States). Those standards require that we plan and perform the audit to obtain reasonable assurance about whether the financial statements are free of material misstatement. An audit includes examining, on a test basis, evidence supporting the amounts and disclosures in the financial statements, assessing the accounting principles used and significant estimates made by management, and evaluating the overall financial statement presentation. We believe that our audits, which included confirmation of securities at December 31, 2007 by correspondence with the custodian and brokers, provide a reasonable basis for our opinion.

Tampa, Florida
February 29, 2008
15
T. Rowe Price Equity Income
SUPPLEMENTAL TAX INFORMATION (unaudited)
(all amounts in thousands)
For tax purposes, the Fund has made a Long-Term Capital Gain Designation of $52,326 for the year ended December 31, 2007.
RESULTS OF SHAREHOLDER PROXY (unaudited)
At a special meeting of shareholders held on October 30, 2007, the results of the Proposals were as follows:
Proposal 1: To elect a new Board:
Proposed Trustee | | For | | Against | | Abstentions/Broker Non-
Votes | |
John K. Carter | | 2,274,998,840.817 | | 57,804,698.755 | | 35,433.883 | |
| | | | | | | |
Leo J. Hill | | 2,277,212,702.754 | | 55,590,836.819 | | 35,433.883 | |
| | | | | | | |
Neal M. Jewell | | 2,266,793,295.663 | | 66,010,243.909 | | 35,433.883 | |
| | | | | | | |
Russell A. Kimball, Jr. | | 2,274,825,235.835 | | 57,978,303.737 | | 35,433.883 | |
| | | | | | | |
Eugene M. Mannella | | 2,274,623,165.033 | | 58,180,374.539 | | 35,433.883 | |
| | | | | | | |
Norm R. Nielsen | | 2,275,050,055.885 | | 57,753,483.687 | | 35,433.883 | |
| | | | | | | |
Joyce Galpern Norden | | 2,270,278,122.250 | | 62,525,417.323 | | 35,433.883 | |
| | | | | | | |
Patricia L. Sawyer | | 2,275,737,737.456 | | 57,065,802.116 | | 35,433.883 | |
| | | | | | | |
John W. Waechter | | 2,276,615,120.140 | | 56,188,419.433 | | 35,433.883 | |
Proposal 2: To approve an amendment to the Agreement and Declaration of Trust:
| | | | Abstentions/Broker Non- | |
For | | Against | | Votes | |
2,182,022,669.110 | | 77,590,048.544 | | 73,226,255.801 | |
16
T. Rowe Price Equity Income
INVESTMENT ADVISORY AND SUB-ADVISORY AGREEMENTS-REVIEW AND RENEWAL (unaudited)
At a meeting of the Board of Trustees of AEGON/Transamerica Series Trust (“ATST”) held on December 4th, 2007, the Board reviewed and considered the renewal of the investment advisory agreement (the “Investment Advisory Agreement”) between T. Rowe Price Equity Income (the “Fund”) and Transamerica Fund Advisors, Inc. (“TFAI”), as well as the renewal of the investment sub-advisory agreement (the “Sub-Advisory Agreement”) of the Fund between TFAI and T. Rowe Price Associates, Inc. (the “Sub-Adviser”), to determine whether the agreements should be renewed for a six-month period. It was noted that this review was interim in nature to align all the Funds on the same calendar, and that the Funds’ advisory arrangements would be reviewed again in the first half of 2008.
Following their review and consideration, the Trustees determined that the renewal of the Investment Advisory Agreement and the Sub-Advisory Agreement would enable shareholders of the Fund to obtain high quality services at a cost that is appropriate, fair, and in the best interests of its shareholders. The Board, including the independent members of the Board, unanimously approved the renewal of the Investment Advisory Agreement and Sub-Advisory Agreement. In reaching their decision, the Trustees requested and obtained from TFAI and the Sub-Adviser such information as they deemed reasonably necessary to evaluate the agreements, including information about fees and performance of comparable funds managed by the Sub-Adviser. The Trustees also carefully considered information they had previously received from TFAI and the Sub-Adviser throughout the year as part of their regular oversight of the Fund, as well as comparative fee, expense, and performance information prepared by Lipper Inc. (“Lipper”), an independent provider of mutual fund performance, fee and expense information and profitability data prepared by management. In considering the proposed continuation of the Investment Advisory and Sub-Advisory Agreements, the Trustees evaluated a number of considerations that they believed, in light of the legal advice furnished to them by independent legal counsel and their own business judgment, to be relevant. They based their decisions on a variety of factors, including the following considerations, among others, although they did not identify any consideration or particular information that was controlling of their decisions:
The nature, extent and quality of the advisory services to be provided. The Board considered the nature and quality of the services provided by TFAI and the Sub-Adviser to the Fund in the past, as well as the services anticipated to be provided in the future. The Board concluded that TFAI and the Sub-Adviser are capable of providing high quality services to the Fund, as indicated by the nature and quality of services provided in the past by TFAI and the Sub-Adviser for this series and the experience, capability and integrity of TFAI’s senior management, the financial resources of TFAI and the Sub-Adviser, TFAI’s management oversight process and the professional qualifications of the portfolio management team of the Sub-Adviser. The Trustees determined that TFAI and the Sub-Adviser can provide investment and related services that are appropriate in scope and extent in light of the Fund’s operations, the competitive landscape of the investment company business and investor needs.
The investment performance of the Fund. The Board examined the short and longer-term performance of the Fund, including relative performance against a peer universe of comparable mutual funds as prepared by Lipper for various trailing periods ended June 30, 2007. The Trustees noted that the Fund’s performance was above the median for its peer universe over the past 1-year period and in line with the median for its peer universe for the past 3-and 5-year periods. On the basis of the Board’s assessment of the nature, extent and quality of advisory services to be provided or procured by TFAI and the Sub-Adviser, the Board concluded that TFAI and the Sub-Adviser are capable of providing a level of investment performance that is appropriate in light of the Fund’s proposed investment objectives, policies and strategies and competitive with other similarly situated investment companies.
The cost of advisory services provided and the level of profitability. The Board reviewed profitability information of TFAI’s cost of procuring fund management services, as well as the costs of provision of administration, fund accounting and other services, to the Fund and to ATST as a whole by TFAI and its affiliates. The Board reviewed the management and sub-advisory fees for the Fund. The Trustees noted that the Fund’s contractual management fees were in line for the median for its peer group and slightly above the median of its peer universe and that the total expenses of the Fund were just above the median for its peer group, but below the median for the peer universe. Based on their review, the Trustees determined that the management fees of the Fund generally are appropriate in light of the services expected to be provided or procured, the management fees and the anticipated profitability of the relationship between the Fund, TFAI and its affiliates, and the Sub-Adviser. In making these observations and determinations, the Board reviewed, among other things, comparative information provided by Lipper.
Whether fee levels reflect economies of scale and the extent to which economies of scale would be realized as the Fund grows. In evaluating the extent to which the management fees payable under the Investment Advisory and Sub-Advisory Agreements reflect economies of scale or will permit economies of scale to be realized in the future, the Board noted that TFAI and the Sub-Adviser offer breakpoints which appropriately benefit investors by passing on economies of scale in the form of lower management fees as the level of assets grows. The Trustees also concluded that they will have the opportunity to periodically reexamine whether the Fund has achieved economies of scale, and the appropriateness of management fees payable to TFAI and fees paid to the Sub-Adviser, in the future.
Benefits (such as soft dollars) to TFAI, its affiliates, or the Sub-Adviser from their relationship with the Fund. The Board concluded that other benefits anticipated to be derived by TFAI, its affiliates, and the Sub-Adviser from their relationships with the Fund are expected to be reasonable and fair, and consistent with industry practice and the best interests of the Fund and its shareholders. The Trustees noted that TFAI would not realize soft dollar benefits from its relationship with the Fund. The Board also noted that the Sub-Adviser is participating in a brokerage program pursuant to which a portion of brokerage commissions paid by the Fund is recaptured for the benefit of the Fund and its shareholders, thus limiting the amount of soft dollar arrangements the Sub-Adviser may engage in with respect to the Fund’s brokerage transactions.
17
Other considerations. The Board determined that TFAI has made a substantial commitment to the recruitment and retention of high quality personnel, and maintains the financial, compliance and operational resources reasonably necessary to manage the Fund in a professional manner that is consistent with the best interests of the Fund and its shareholders. In this regard, the Trustees favorably considered the procedures and policies in place by TFAI to enforce compliance with applicable laws and regulations and oversee the portfolio management activities of the Sub-Adviser. The Trustees also determined that TFAI has made a significant entrepreneurial commitment to the management and success of the Fund, reflected by TFAI’s expense limitation and fee waiver arrangements with the Fund which may result in TFAI waiving a substantial amount of management fees for the benefit of shareholders. With respect to the Sub-Adviser, the Trustees noted that the Sub-Adviser’s trading costs generally had been lower than its peers for three of the previous four quarters.
18
T. Rowe Price Small Cap
MARKET ENVIRONMENT
Stocks hit record highs in 2007, before the housing, credit, and liquidity crises ultimately brought the party to a halt. For the year, small-cap stocks generally produced negative returns and lagged large- and mid-cap shares, while growth beat value across all capitalization ranges. In the Morgan Stanley Capital International US Small Cap Growth Index (“MSCI US Small Cap Growth”), energy shares performed best (up 39%), followed by materials (up 28%). Utilities also put up excellent returns (gaining 23%), but make up less than 1% of the index. Financial shares (down 14%) were by far the worst performers for the year. Consumer discretionary (down about 4%) stocks were the only other shares to have negative returns.
PERFORMANCE
For the year ended December 31, 2007, T. Rowe Price Small Cap, Initial Class returned 9.61%. By comparison its primary and former benchmarks, the MSCI US Small Cap Growth and the Russell 2000 Growth Index, returned 9.61% and 7.05%, respectively.
STRATEGY REVIEW
Relative to the index, out-performance was largely a result of stock selection among financial shares; information technology (“IT”) and consumer discretionary shares were other notable contributors. Positioning in the industrial sector was by far the leading detractor from relative results.
Stock selection among financials shares was the key source of strength, led by holdings in diversified financial services firms and commercials banks. In addition, it helped to be underweight in consumer finance names and real estate investment trusts. The leading contributors in this space were asset manager Affiliated Managers Group, Inc. and energy trader IntercontinentalExchange, Inc. These stocks benefited from the gains and volatility in 2007 in financial and commodity markets, respectively.
Stock picks drove relative results in the IT sector, led by holdings in the IT services and electronic equipment industry segments. In IT services, electronic payments processor CyberSource Corporation was a leading contributor as a result of soaring revenues, a positive outlook, and the expected divestiture of an underperforming business unit. That said, the largest contributor in the sector was in the electronic equipment segment. Here FLIR Systems, Inc., a maker of infrared camera equipment used by the military, beat estimates and provided a positive outlook. Internet software and services firm Taleo Corporation was another notable contributor, reporting rapid growth and profit gains in its corporate recruiting and tracking software business.
In the consumer discretionary sector, stock picks helped most in the specialty retail, internet and catalog retail, and media segments. The leading contributors in this space were priceline.com, Incorporated, which enjoyed growth in its international business and acquired overseas assets. Electronic game retailer GameStop Corp. was another top 10 contributor overall on the strength of an increase in sales driven by new hardware and software gaming cycles.
In the industrial sector, stock picks in the commercial services and supplies and airfreight and logistics industries were leading sources of weakness. In the commercial services industry, overweight positions in The Corporate Executive Board Company, Resources Connection, Inc., and Kenexa Corporation detracted because slower economic growth and a more difficult business environment took the wind out of the sails of corporate consulting firms. These account for some of the largest detractors for the entire portfolio for the year. In addition, freight logistics company UTi Worldwide Inc. (“UTi”) saw its stock fall to a three-year low late in 2007 after losing Wal-Mart Stores, Inc. as a customer. UTi was the number two detractor for the year.
Materials stocks also detracted from relative returns as a result of an underweight position in the best-performing segment of the benchmark. Telecommunication services was the only other sector to detract from relative results, due to stock selection. In this sector, Leap Wireless International, Inc. was the leading detractor from relative performance after restating earnings and giving poor guidance, while rejecting the buyout offer of MetroPCS Communications, Inc.
Sudhir Nanda, Ph.D., CFA
Portfolio Manager
T. Rowe Price Associates, Inc.
AEGON/Transamerica Series Trust | | Annual Report 2007 |
1
T. Rowe Price Small Cap
(unaudited)
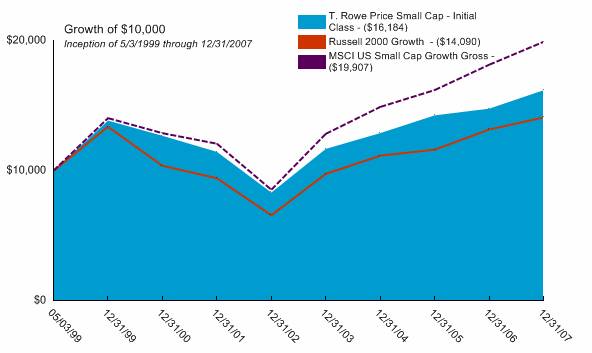
Average Annual Total Return for Periods Ended 12/31/2007
| | | | | | From | | Inception | |
| | 1 Year | | 5 Years | | Inception | | Date | |
Initial Class | | 9.61 | % | 14.24 | % | 5.71 | % | 5/3/99 | |
MSCI US Small Cap Growth Gross(1) | | 9.61 | % | 18.46 | % | 8.26 | % | 5/3/99 | |
Russell 2000 Growth (1) | | 7.05 | % | 16.50 | % | 4.04 | % | 5/3/99 | |
| | | | | | | | | |
Service Class | | 9.27 | % | — | % | 14.01 | % | 5/1/03 | |
NOTES
(1) The MSCI US Small Cap Growth (MSCI US Small Cap Growth) Index and the Russell 2000 Growth (Russell 2000 Growth) Index are unmanaged indexes used as a general measure of market performance. Calculations assume dividends and capital gains are reinvested and do not include any managerial expenses. From inception calculation is based on life of Initial Class shares. Prior to May 1, 2007, the Russell 2000 Growth served as the portfolio’s benchmark. The index was changed to the MSCI US Small Cap Growth Index to make more meaningful comparisons of the portfolio’s performance relative to the strategy it employs.
The performance data presented represents past performance, future results may vary. The portfolio’s investment return and net asset value will fluctuate. Past performance does not guarantee future results. Investor’s units when redeemed, may be worth more or less than their original cost.
Current performance may be lower or higher than performance quoted. Please visit your insurance company’s website for contract or policy level standardized total returns current to the most recent month end. Portfolio performance is net of investment fees and fund expenses, but not product charges, which, if included, would significantly lower the performance quoted.
This material must be preceded or accompanied by a current prospectus, which includes specific contents regarding the investment objectives, explanation of share classes and policies of this portfolio.
Investing in small cap stocks generally involves great volatility and risks so an investment in the portfolio may not be appropriate for everyone.
2
T. Rowe Price Small Cap
UNDERSTANDING YOUR FUNDS EXPENSES
(unaudited)
SHAREHOLDER EXPENSES
Fund shareholders may incur ongoing costs, including management and advisory fees, distribution and service fees, and other fund expenses.
The following Example is intended to help you understand your ongoing costs (in dollars and cents) of investing in the Fund and to compare these costs with the ongoing costs of investing in other funds.
The Example is based on an investment of $1,000 invested at July 1, 2007 and held for the entire period until December 31, 2007.
ACTUAL EXPENSES
The first line in the table below provides information about actual account values and actual expenses. You may use the information in this line, together with the amount you invested, to estimate the expenses that you paid over the period. Simply divide your account value by $1,000 (for example, an $8,600 account value divided by $1,000 = 8.6), then multiply the result by the number in the first line of your Fund under the heading entitled “Expenses Paid During Period” to estimate the expenses you paid on your account during this period.
HYPOTHETICAL EXAMPLE FOR COMPARISON PURPOSES
The second line in the table below provides information about hypothetical account values and hypothetical expenses based on the Fund’s actual expense ratio and an assumed rate of return of 5% per year before expenses, which is not the Fund’s actual return. The hypothetical account values and expenses may not be used to estimate the actual ending account balance or expenses you paid for the period. You may use this information to compare the ongoing costs of investing in your Fund and other funds. To do so, compare this 5% hypothetical example with the 5% hypothetical examples that appear in the shareholder reports of the other funds.
Please note that the expenses shown in the table are meant to highlight your ongoing costs only and do not reflect any transactional costs, such as sales charges, redemption fees, brokerage commissions paid on purchases and sales of fund shares. Therefore, the second line under the Fund in the table is useful in comparing ongoing costs only, and will not help you determine the relative total costs of owning different funds. If any of these transaction costs were included, your costs would be higher. The expenses shown in the table do not reflect any fees that may be charged to you by brokers, financial intermediaries or other financial institutions.
| | Beginning
Account
Value | | Ending
Account
Value | | Annualized
Expense
Ratio | | Expenses
Paid During
Period (a) | |
| | | | | | | | | |
Initial Class | | | | | | | | | |
Actual | | $ | 1,000.00 | | $ | 978.93 | | 0.82 | % | $ | 4.09 | |
Hypothetical (b) | | 1,000.00 | | 1,021.07 | | 0.82 | | 4.18 | |
| | | | | | | | | |
Service Class | | | | | | | | | |
Actual | | 1,000.00 | | 977.36 | | 1.07 | | 5.33 | |
Hypothetical (b) | | 1,000.00 | | 1,019.81 | | 1.07 | | 5.45 | |
| | | | | | | | | | | | |
(a) Expenses are calculated using the Fund’s annualized expense ratio (as disclosed in the table), multiplied by the average account value for the period, multiplied by the number of days in the period (184 days), and divided by the number of days in the year (365 days).
(b) 5% return per year before expenses.
GRAPHICAL PRESENTATION OF SCHEDULE OF INVESTMENTS
By Sector
At December 31, 2007
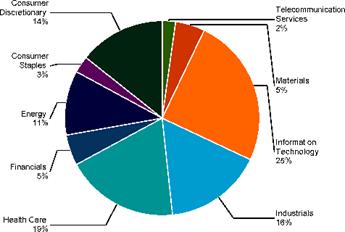
This chart shows the percentage breakdown by sector of the Fund’s total investment securities.
3
T. Rowe Price Small Cap
SCHEDULE OF INVESTMENTS
At December 31, 2007
(all amounts except share amounts in thousands)
| | Shares | | Value | |
COMMON STOCKS (99.7%) | | | | | |
Aerospace & Defense (2.1%) | | | | | |
Alliant Techsystems, Inc. ‡^ | | 9,000 | | $ | 1,024 | |
Be Aerospace, Inc. ‡ | | 12,900 | | 682 | |
Ceradyne, Inc. ‡ | | 25,500 | | 1,197 | |
DRS Technologies, Inc. ^ | | 10,910 | | 592 | |
Teledyne Technologies, Inc. ‡ | | 18,900 | | 1,008 | |
Transdigm Group, Inc. ‡ | | 10,500 | | 474 | |
Air Freight & Logistics (0.7%) | | | | | |
Hub Group, Inc. Class A ‡ | | 10,600 | | 282 | |
UTI Worldwide, Inc. | | 73,900 | | 1,448 | |
Airlines (0.2%) | | | | | |
Skywest, Inc. | | 18,500 | | 497 | |
Auto Components (0.4%) | | | | | |
Drew Industries, Inc. ‡ | | 7,600 | | 208 | |
Gentex Corp. | | 37,900 | | 674 | |
Automobiles (0.3%) | | | | | |
Thor Industries, Inc. ^ | | 21,600 | | 821 | |
Beverages (0.7%) | | | | | |
Boston Beer Co., Inc. Class A ‡ | | 22,100 | | 832 | |
Hansen Natural Corp. ‡^ | | 17,900 | | 793 | |
Biotechnology (4.7%) | | | | | |
Acadia Pharmaceuticals, Inc. ‡ | | 9,900 | | 110 | |
Alexion Pharmaceuticals, Inc. ‡ | | 13,900 | | 1,043 | |
Alkermes, Inc. ‡^ | | 33,000 | | 514 | |
Alnylam Pharmaceuticals, Inc. ‡^ | | 5,200 | | 151 | |
Array Biopharma, Inc. ‡ | | 6,600 | | 56 | |
BioMarin Pharmaceuticals, Inc. ‡ | | 32,900 | | 1,165 | |
Cubist Pharmaceuticals, Inc. ‡ | | 14,300 | | 293 | |
DeCode Genetics, Inc. ‡^ | | 48,300 | | 178 | |
Human Genome Sciences, Inc. ‡^ | | 21,200 | | 221 | |
Incyte Corp. ‡ | | 64,200 | | 645 | |
Isis Pharmaceuticals, Inc. ‡^ | | 7,200 | | 113 | |
Lexicon Pharmaceuticals, Inc. ‡ | | 29,600 | | 90 | |
LifeCell Corp. ‡ | | 6,300 | | 272 | |
Martek Biosciences Corp. ‡^ | | 10,300 | | 305 | |
Medarex, Inc. ‡^ | | 32,700 | | 341 | |
Myriad Genetics, Inc. ‡ | | 13,700 | | 636 | |
Onyx Pharmaceuticals, Inc. ‡^ | | 16,100 | | 895 | |
OSI Pharmaceuticals, Inc. ‡ | | 16,000 | | 776 | |
PDL Biopharma, Inc. ‡ | | 57,600 | | 1,009 | |
Pharmion Corp. ‡^ | | 8,300 | | 522 | |
Regeneron Pharmaceuticals, Inc. ‡ | | 13,800 | | 333 | |
Rigel Pharmaceuticals, Inc. ‡ | | 19,500 | | 495 | |
Seatlle Genetics, Inc. ‡ | | 10,800 | | 123 | |
Senomyx, Inc. ‡^ | | 39,900 | | 299 | |
Theravance, Inc. ‡ | | 14,200 | | 277 | |
United Therapeutics Corp. ‡^ | | 4,900 | | 478 | |
Capital Markets (2.4%) | | | | | |
Affiliated Managers Group, Inc. ‡^ | | 21,800 | | 2,560 | |
Cohen & Steers, Inc. ^ | | 6,700 | | 201 | |
GFI Group, Inc. ‡ | | 4,900 | | 469 | |
Greenhill & Co., Inc. ^ | | 21,000 | | 1,396 | |
Knight Capital Group, Inc. Class A ‡ | | 21,200 | | $ | 305 | |
Optionsxpress Holdings, Inc. | | 18,000 | | 609 | |
Penson Worldwide, Inc. ‡ | | 12,400 | | 178 | |
Chemicals (2.9%) | | | | | |
Airgas, Inc. | | 21,200 | | 1,105 | |
Cf Industries Holdings, Inc. | | 11,300 | | 1,243 | |
Hercules, Inc. | | 33,800 | | 654 | |
Koppers Holdings, Inc. | | 9,300 | | 402 | |
Nalco Holding Co. | | 58,100 | | 1,405 | |
Scotts Miracle-Gro Co. (The) Class A^ | | 17,500 | | 655 | |
Terra Industries, Inc. ‡^ | | 29,500 | | 1,409 | |
Commercial Banks (0.8%) | | | | | |
Boston Private Financial Holdings, Inc. ^ | | 17,200 | | 466 | |
Pinnacle Financial Partners, Inc. ‡ | | 7,500 | | 191 | |
SVB Financial Group ‡^ | | 10,800 | | 544 | |
UCBH Holdings, Inc. ^ | | 49,300 | | 698 | |
Commercial Services & Supplies (4.7%) | | | | | |
Administaff, Inc. ^ | | 14,400 | | 407 | |
Advisory Board Co. (The) ‡ | | 22,900 | | 1,470 | |
ChoicePoint, Inc. ‡ | | 17,500 | | 637 | |
Corporate Executive Board Co. ^ | | 18,700 | | 1,124 | |
Heidrick & Struggles International, Inc. | | 11,000 | | 408 | |
Huron Consulting Group, Inc. ‡ | | 4,500 | | 363 | |
IHS, Inc. Class A ‡ | | 13,000 | | 787 | |
Kenexa Corp. ‡ | | 25,500 | | 495 | |
Knoll, Inc. | | 10,800 | | 178 | |
Korn/Ferry International ‡ | | 18,000 | | 339 | |
Navigant Consulting, Inc. ‡^ | | 15,600 | | 213 | |
Resources Connection, Inc. | | 57,900 | | 1,052 | |
Stericycle, Inc. ‡^ | | 43,200 | | 2,566 | |
Waste Connections, Inc. ‡ | | 41,525 | | 1,283 | |
Communications Equipment (3.4%) | | | | | |
Adtran, Inc. ^ | | 27,300 | | 584 | |
Avocent Corp. ‡ | | 17,050 | | 398 | |
Blue Coat Systems, Inc. ‡ | | 12,100 | | 398 | |
Commscope, Inc. ‡ | | 25,600 | | 1,260 | |
Comtech Telecommunications Corp. ‡ | | 25,000 | | 1,350 | |
Dycom Industries, Inc. ‡ | | 15,100 | | 402 | |
F5 Networks, Inc. ‡ | | 47,100 | | 1,343 | |
Foundry Networks, Inc. ‡ | | 46,100 | | 808 | |
Netgear, Inc. ‡ | | 12,100 | | 432 | |
Plantronics, Inc. | | 15,900 | | 413 | |
Polycom, Inc. ‡ | | 28,812 | | 800 | |
Computers & Peripherals (0.2%) | | | | | |
Intermec, Inc. ‡^ | | 11,900 | | 241 | |
Palm, Inc. ^ | | 50,900 | | 323 | |
Construction & Engineering (1.0%) | | | | | |
Foster Wheeler, Ltd. ‡ | | 6,900 | | 1,070 | |
Perini Corp. ‡ | | 7,800 | | 323 | |
Quanta Services, Inc. ‡^ | | 39,476 | | 1,036 | |
Construction Materials (0.2%) | | | | | |
Eagle Materials, Inc. ^ | | 11,400 | | 404 | |
The notes to the financial statements are an integral part of this report.
4
| | Shares | | Value | |
Containers & Packaging (0.7%) | | | | | |
Crown Holdings, Inc. ‡ | | 45,500 | | $ | 1,167 | |
Greif, Inc. Class A | | 7,000 | | 458 | |
Diversified Consumer Services (2.5%) | | | | | |
Bright Horizons Family Solutions, Inc. ‡ | | 30,400 | | 1,050 | |
DeVry, Inc. | | 28,700 | | 1,491 | |
ITT Educational Services, Inc. ‡^ | | 18,200 | | 1,552 | |
Matthews International Corp. Class A | | 15,800 | | 741 | |
Sotheby’s ^ | | 20,400 | | 777 | |
Steiner Leisure, Ltd. ‡ | | 9,300 | | 411 | |
Diversified Financial Services (0.1%) | | | | | |
MSCI, Inc. Class A ‡ | | 5,800 | | 223 | |
Diversified Telecommunication Services (0.8%) | | | | | |
Cbeyond, Inc. ‡^ | | 16,200 | | 632 | |
Cogent Communications Group, Inc. ‡^ | | 15,300 | | 363 | |
Time Warner Telecom, Inc. Class A ‡ | | 39,800 | | 807 | |
Electrical Equipment (1.9%) | | | | | |
Ametek, Inc. | | 29,800 | | 1,396 | |
General Cable Corp. ‡ | | 17,900 | | 1,312 | |
II-VI, Inc. ‡ | | 30,500 | | 932 | |
Thomas & Betts Corp. ‡ | | 20,500 | | 1,005 | |
Electronic Equipment & Instruments (3.9%) | | | | | |
Cyberoptics Corp. ‡ | | 61,900 | | 743 | |
Dolby Laboratories, Inc. Class A ‡ | | 27,200 | | 1,352 | |
FLIR Systems, Inc. ‡ | | 86,600 | | 2,711 | |
Itron, Inc. ‡^ | | 9,100 | | 873 | |
Mettler Toledo International, Inc. ‡ | | 17,000 | | 1,935 | |
Orbotech, Ltd. ‡ | | 27,200 | | 477 | |
Rofin-Sinar Technologies, Inc. ‡ | | 9,000 | | 433 | |
Trimble Navigation, Ltd. ‡ | | 15,600 | | 472 | |
TTM Technologies, Inc. ‡ | | 38,300 | | 446 | |
Energy Equipment & Services (6.4%) | | | | | |
Atwood Oceanics, Inc. ‡ | | 11,000 | | 1,103 | |
Core Laboratories NV ‡ | | 14,600 | | 1,821 | |
Dresser-Rand Group, Inc. ‡ | | 29,300 | | 1,144 | |
Global Industries, Ltd. ‡ | | 57,600 | | 1,234 | |
Helix Energy Solutions Group, Inc. ‡ | | 36,400 | | 1,511 | |
Helmerich & Payne, Inc. | | 28,100 | | 1,126 | |
Ion Geophysical Corp. ‡ | | 33,200 | | 524 | |
Natco Group, Inc. Class A ‡ | | 12,900 | | 698 | |
Oceaneering International, Inc. ‡ | | 15,100 | | 1,017 | |
Oil States International, Inc. ‡^ | | 48,200 | | 1,644 | |
SEACOR Holdings, Inc. ‡ | | 6,500 | | 603 | |
Superior Energy Services, Inc. ‡ | | 29,500 | | 1,015 | |
TETRA Technologies, Inc. ‡ | | 40,200 | | 626 | |
Unit Corp. ‡ | | 8,000 | | 370 | |
W-H Energy Services, Inc. ‡ | | 18,400 | | 1,034 | |
Food & Staples Retailing (0.2%) | | | | | |
Pantry, Inc. (The) ‡^ | | 16,000 | | 418 | |
Food Products (0.3%) | | | | | |
Ralcorp Holdings, Inc. ‡ | | 6,500 | | $ | 395 | |
SunOpta, Inc. ‡^ | | 17,800 | | 238 | |
Health Care Equipment & Supplies (5.6%) | | | | | |
American Medical Systems Holdings, Inc. ‡^ | | 18,900 | | 273 | |
Arthrocare Corp. ‡^ | | 15,400 | | 740 | |
Edwards Lifesciences Corp. ‡ | | 22,700 | | 1,044 | |
GEN-Probe, Inc. ‡ | | 26,600 | | 1,674 | |
Hologic, Inc. ‡ | | 14,764 | | 1,013 | |
Idexx Laboratories, Inc. ‡ | | 19,800 | | 1,161 | |
Immucor, Inc. ‡ | | 36,500 | | 1,241 | |
Integra LifeSciences Holdings Corp. ‡^ | | 8,000 | | 335 | |
Mentor Corp. ^ | | 7,400 | | 289 | |
Meridian Bioscience, Inc. | | 49,350 | | 1,485 | |
ResMed, Inc. ‡^ | | 20,000 | | 1,051 | |
Respironics, Inc. ‡ | | 30,200 | | 1,978 | |
Stereotaxis, Inc. ‡^ | | 13,100 | | 160 | |
Steris Corp. | | 16,900 | | 487 | |
Thoratec Corp. ‡^ | | 31,900 | | 580 | |
Health Care Providers & Services (4.1%) | | | | | |
Air Methods Corp. ‡ | | 9,600 | | 477 | |
Amedisys, Inc. ‡^ | | 14,066 | | 682 | |
Centene Corp. ‡ | | 26,900 | | 738 | |
Chemed Corp. | | 16,100 | | 900 | |
Gentiva Health Services, Inc. ‡ | | 25,400 | | 484 | |
HealthExtras, Inc. ‡ | | 24,200 | | 631 | |
Healthspring, Inc. ‡ | | 18,900 | | 360 | |
Healthways, Inc. ‡^ | | 6,900 | | 403 | |
Inventiv Health, Inc. ‡ | | 16,800 | | 520 | |
LCA-Vision, Inc. ^ | | 6,400 | | 128 | |
LifePoint Hospitals, Inc. ‡^ | | 14,800 | | 440 | |
Pediatrix Medical Group, Inc. ‡ | | 19,700 | | 1,343 | |
Pss World Medical, Inc. ‡ | | 25,500 | | 499 | |
Psychiatric Solutions, Inc. ‡ | | 23,800 | | 774 | |
Sunrise Senior Living, Inc. ‡^ | | 13,200 | | 405 | |
VCA Antech, Inc. ‡ | | 24,700 | | 1,092 | |
Health Care Technology (0.5%) | | | | | |
Cerner Corp. ‡^ | | 15,000 | | 846 | |
Computer Programs & Systems, Inc. | | 8,500 | | 193 | |
Phase Forward, Inc. ‡ | | 9,700 | | 211 | |
Hotels, Restaurants & Leisure (2.8%) | | | | | |
BJ’s Restaurants, Inc. ‡^ | | 43,700 | | 711 | |
Burger King Holdings, Inc. | | 24,100 | | 687 | |
Chipotle Mexican Grill, Inc. Class B ‡ | | 9,300 | | 1,144 | |
Choice Hotels International, Inc. | | 12,000 | | 399 | |
Monarch Casino & Resort, Inc. ‡ | | 12,800 | | 308 | |
Orient-Express Hotels, Ltd. Class A | | 11,300 | | 650 | |
Sonic Corp. ‡ | | 47,643 | | 1,043 | |
WMS Industries, Inc. ‡^ | | 45,950 | | 1,684 | |
The notes to the financial statements are an integral part of this report.
5
| | Shares | | Value | |
Household Durables (0.6%) | | | | | |
iRobot Corp. ‡^ | | 8,800 | | $ | 159 | |
Jarden Corp. ‡^ | | 28,100 | | 664 | |
Tempur-Pedic International ^ | | 26,700 | | 693 | |
Household Products (0.5%) | | | | | |
Church & Dwight Co., Inc. | | 23,600 | | 1,276 | |
Insurance (1.5%) | | | | | |
HCC Insurance Holdings, Inc. | | 34,700 | | 995 | |
Max Capital Group, Ltd. | | 17,200 | | 481 | |
Philadelphia Consolidated Holding Corp. ‡ | | 23,500 | | 925 | |
Stancorp Financial Group, Inc. ‡ | | 23,600 | | 1,189 | |
Internet & Catalog Retail (1.3%) | | | | | |
Blue Nile, Inc. ‡^ | | 10,600 | | 722 | |
NutriSystem, Inc. ‡^ | | 11,300 | | 305 | |
priceline.com, Inc. ‡^ | | 18,400 | | 2,113 | |
Internet Software & Services (2.3%) | | | | | |
CNET Networks, Inc. ‡^ | | 94,500 | | 864 | |
Dealertrack Holdings, Inc. ‡ | | 17,600 | | 589 | |
Digital River, Inc. ‡ | | 18,800 | | 622 | |
j2 Global Communications, Inc. ‡ | | 27,000 | | 572 | |
SINA Corp. ‡ | | 17,800 | | 789 | |
Valueclick, Inc. ‡^ | | 38,700 | | 847 | |
Visual Sciences, Inc. ‡ | | 26,700 | | 493 | |
Websense, Inc. ‡ | | 42,100 | | 715 | |
IT Services (3.4%) | | | | | |
CACI International, Inc. Class A ‡ | | 18,400 | | 824 | |
Cybersource Corp. ‡ | | 61,200 | | 1,087 | |
Global Payments, Inc. | | 27,620 | | 1,285 | |
Heartland Payment Systems, Inc. ^ | | 30,100 | | 807 | |
NCI, Inc. Class A ‡ | | 69,200 | | 1,184 | |
NeuStar, Inc. Class A ‡^ | | 19,500 | | 559 | |
Perot Systems Corp. Class A ‡ | | 57,400 | | 775 | |
RightNow Technologies, Inc. ‡^ | | 53,500 | | 848 | |
SRA International, Inc. Class A ‡ | | 28,900 | | 851 | |
Leisure Equipment & Products (0.5%) | | | | | |
Polaris Industries, Inc. ^ | | 19,300 | | 922 | |
Pool Corp. ^ | | 13,687 | | 271 | |
Life Sciences Tools & Services (2.4%) | | | | | |
Affymetrix, Inc. ‡^ | | 19,600 | | 454 | |
Dionex Corp. ‡ | | 3,950 | | 327 | |
Exelixis, Inc. ‡ | | 30,700 | | 265 | |
Illumina, Inc. ‡^ | | 15,600 | | 925 | |
Invitrogen Corp. ‡ | | 13,900 | | 1,298 | |
Parexel International Corp. ‡ | | 17,600 | | 850 | |
Techne Corp. ‡ | | 16,400 | | 1,083 | |
Varian, Inc. ‡ | | 10,200 | | 666 | |
Machinery (4.9%) | | | | | |
Actuant Corp. Class A | | 79,800 | | 2,714 | |
Bucyrus International, Inc. Class A^ | | 9,200 | | 914 | |
Chart Industries, Inc. ‡ | | 10,700 | | $ | 331 | |
Gardner Denver, Inc. ‡ | | 14,600 | | 482 | |
Graco, Inc. | | 19,500 | | 727 | |
Kaydon Corp. ^ | | 24,000 | | 1,309 | |
Kennametal, Inc. | | 12,400 | | 469 | |
Manitowoc Co., Inc. (The) | | 26,500 | | 1,294 | |
Middleby Corp. ‡^ | | 8,800 | | 674 | |
Rbc Bearings, Inc. ‡ | | 18,700 | | 813 | |
Toro Co. ^ | | 24,700 | | 1,345 | |
Wabtec Corp. | | 17,400 | | 599 | |
Marine (0.1%) | | | | | |
Horizon Lines, Inc. Class A | | 11,800 | | 220 | |
Media (0.7%) | | | | | |
Interactive Data Corp. | | 16,100 | | 531 | |
John Wiley & Sons, Inc. Class A | | 14,700 | | 630 | |
Marvel Entertainment, Inc. ‡^ | | 19,200 | | 513 | |
Metals & Mining (1.2%) | | | | | |
Carpenter Technology Corp. | | 13,300 | | 1,000 | |
Cleveland-Cliffs, Inc. ^ | | 14,900 | | 1,502 | |
Steel Dynamics, Inc. | | 4,400 | | 262 | |
Multiline Retail (0.5%) | | | | | |
Big Lots, Inc. ‡^ | | 32,600 | | 521 | |
Saks, Inc. ‡ | | 29,400 | | 611 | |
Oil, Gas & Consumable Fuels (4.2%) | | | | | |
Bill Barrett Corp. ‡^ | | 16,100 | | 674 | |
Cabot Oil & Gas Corp. | | 46,700 | | 1,885 | |
Denbury Resources, Inc. ‡ | | 27,000 | | 803 | |
Foundation Coal Holdings, Inc. | | 22,600 | | 1,186 | |
Frontier Oil Corp. | | 28,900 | | 1,173 | |
Mariner Energy, Inc. ‡ | | 34,218 | | 783 | |
Penn Virginia Corp. | | 25,600 | | 1,117 | |
Petrohawk Energy Corp. ‡^ | | 42,500 | | 736 | |
Plains Exploration & Production Co. ‡ | | 17,900 | | 967 | |
St. Mary Land & Exploration Co. | | 22,000 | | 849 | |
Personal Products (1.2%) | | | | | |
Alberto-Culver Co. Class B | | 34,200 | | 839 | |
Chattem, Inc. ‡^ | | 9,500 | | 717 | |
Herbalife, Ltd. | | 16,800 | | 677 | |
Nbty, Inc. ‡ | | 20,800 | | 570 | |
Pharmaceuticals (1 .4%) | | | | | |
Medicines Co. (The) ‡ | | 13,500 | | 259 | |
Medicis Pharmaceutical Corp. Class A^ | | 37,500 | | 974 | |
Mgi Pharma, Inc. ‡ | | 18,200 | | 737 | |
Sciele Pharma, Inc. ‡ | | 13,900 | | 284 | |
Valeant Pharmaceuticals International ‡ | | 36,500 | | 437 | |
Viropharma, Inc. ‡ | | 18,100 | | 144 | |
Xenoport, Inc. ‡ | | 9,000 | | 503 | |
Real Estate Investment Trusts (0.0%) | | | | | |
PS Business Parks, Inc. REIT | | 2,100 | | 110 | |
Real Estate Management & Development (0.3%) | | | | | |
Jones Lang Lasalle, Inc. ^ | | 9,100 | | 647 | |
The notes to the financial statements are an integral part of this report.
6
| | Shares | | Value | |
Road & Rail (0.3%) | | | | | |
Landstar System, Inc. | | 18,900 | | $ | 797 | |
Semiconductors & Semiconductor Equipment (5.1%) | | | | | |
Advanced Energy Industries, Inc. ‡ | | 46,300 | | 606 | |
ATMI, Inc. ‡ | | 19,500 | | 629 | |
Cabot Microelectronics Corp. ‡^ | | 9,100 | | 327 | |
COHU, Inc. | | 27,500 | | 421 | |
Cymer, Inc. ‡ | | 26,500 | | 1,032 | |
Diodes, Inc. ‡ | | 14,300 | | 430 | |
Entegris, Inc. ‡ | | 70,200 | | 606 | |
EXAR Corp. ‡ | | 26,500 | | 211 | |
Integrated Device Technology, Inc. ‡ | | 67,520 | | 764 | |
Intersil Corp. Class A | | 28,460 | | 697 | |
Micrel, Inc. | | 49,700 | | 420 | |
ON Semiconductor Corp. ‡^ | | 180,800 | | 1,605 | |
Pericom Semiconductor Corp. ‡ | | 24,600 | | 460 | |
PMC - Sierra, Inc. ‡ | | 61,200 | | 400 | |
Semtech Corp. ‡ | | 51,700 | | 802 | |
Standard Microsystems Corp. ‡ | | 9,300 | | 363 | |
Varian Semiconductor Equipment Associates, Inc. ‡ | | 42,025 | | 1,555 | |
Verigy, Ltd. ‡ | | 20,700 | | 562 | |
Virage Logic Corp. ‡ | | 45,899 | | 383 | |
Software (6.4%) | | | | | |
Actuate Corp. ‡ | | 90,900 | | 706 | |
Ansoft Corp. ‡ | | 23,900 | | 618 | |
ANSYS, Inc. ‡ | | 30,100 | | 1,248 | |
Blackboard, Inc. ‡ | | 12,600 | | 507 | |
Epicor Software Corp. ‡ | | 36,700 | | 432 | |
FactSet Research Systems, Inc. | | 22,950 | | 1,278 | |
Fair Isaac Corp. | | 24,934 | | 802 | |
Informatica Corp. ‡ | | 99,400 | | 1,791 | |
Jack Henry & Associates, Inc. | | 20,300 | | 494 | |
Lawson Software, Inc. ‡ | | 33,800 | | 346 | |
Macrovision Corp. ‡ | | 28,900 | | 530 | |
Micros Systems, Inc. ‡ | | 11,900 | | 835 | |
MicroStrategy, Inc. Class A ‡ | | 3,800 | | 361 | |
Parametric Technology Corp. ‡ | | 19,800 | | $ | 354 | |
Progress Software Corp. ‡ | | 13,300 | | 448 | |
Quest Software, Inc. ‡^ | | 36,000 | | 664 | |
SPSS, Inc. ‡ | | 18,200 | | 654 | |
Synopsys, Inc. ‡ | | 22,600 | | 586 | |
Taleo Corp. Class A ‡ | | 40,200 | | 1,197 | |
THQ, Inc. ‡^ | | 29,900 | | 843 | |
TIBCO Software, Inc. ‡ | | 54,600 | | 441 | |
Wind River Systems, Inc. ‡ | | 38,000 | | 339 | |
Specialty Retail (2.9%) | | | | | |
AC Moore Arts & Crafts, Inc. ‡ | | 48,400 | | 666 | |
Aeropostale, Inc. ‡ | | 25,950 | | 688 | |
Dress Barn, Inc. ‡ | | 19,300 | | 241 | |
GameStop Corp. Class A ‡ | | 15,700 | | 975 | |
Guess?, Inc. | | 13,600 | | 515 | |
Gymboree Corp. ‡ | | 35,100 | | 1,069 | |
Hibbett Sports, Inc. ‡^ | | 29,200 | | 583 | |
J Crew Group, Inc. ‡ | | 12,500 | | 603 | |
JOS A Bank Clothiers, Inc. ‡^ | | 8,700 | | 248 | |
Tractor Supply Co. ‡^ | | 17,600 | | 633 | |
Zumiez, Inc. ‡^ | | 33,100 | | 806 | |
Textiles, Apparel & Luxury Goods (1 .7%) | | | | | |
Deckers Outdoor Corp. ‡ | | 6,000 | | 930 | |
Fossil, Inc. ‡ | | 21,812 | | 916 | |
Hanesbrands, Inc. ‡ | | 29,800 | | 810 | |
Iconix Brand Group, Inc. ‡^ | | 37,200 | | 731 | |
Warnaco Group, Inc. (The) ‡^ | | 22,400 | | 780 | |
Trading Companies & Distributors (0.4%) | | | | | |
Beacon Roofing Supply, Inc. ‡^ | | 21,900 | | 184 | |
MSC Industrial Direct Co. Class A | | 18,200 | | 737 | |
Wireless Telecommunication Services (1.4%) | | | | | |
Leap Wireless International, Inc. ‡ | | 19,600 | | 914 | |
SBA Communications Corp. Class A ‡ | | 62,800 | | 2,125 | |
Syniverse Holdings, Inc. ‡ | | 22,600 | | 352 | |
Total Common Stocks (cost $208,945) | | | | 239,688 | |
| | | | | |
Total Securities Lending Collateral (cost $59,750) (1) | | | | 59,750 | |
| | | | | |
Total Investment Securities (cost $268,695) # | | | | $ | 299,438 | |
NOTES TO SCHEDULE OF INVESTMENTS:
^ | At December 31, 2007, all or a portion of this security is on loan (see Note 1). The value at December 31, 2007, of all securities on loan is $57,555. |
‡ | Non Income Producing. |
(1) | Cash collateral for the Repurchase Agreements, valued at $21,658, that serve as collateral for securities lending, are invested in corporate bonds with interest rates and maturity dates ranging from 3.00% - 10.18% and 04/28/2008 - 12/01/2096, respectively. |
# | Aggregate cost for federal income tax purposes is $269,720. Aggregate gross unrealized appreciation for all securities in which there is an excess of value over tax cost and aggregate gross unrealized depreciation for all securities in which there is an excess of tax cost over value were $46,694 and $16,976, respectively. Net unrealized appreciation for tax purposes is $29,718. |
DEFINITIONS:
REIT Real Estate Investment Trust
The notes to the financial statements are an integral part of this report.
7
T. Rowe Price Small Cap
STATEMENT OF ASSETS AND LIABILITIES
At December 31, 2007
(all amounts except per share amounts in thousands)
Assets: | | | |
Investment securities, at value (cost: $268,695) (including securities loaned of $57,555) | | $ | 299,438 | |
Cash | | 1,098 | |
Receivables: | | | |
Shares sold | | 16 | |
Interest | | 12 | |
Income from loaned securities | | 22 | |
Dividends | | 38 | |
| | 300,624 | |
Liabilities: | | | |
Accounts payable and accrued liabilities: | | | |
Shares redeemed | | 116 | |
Management and advisory fees | | 153 | |
Distribution and service fees | | 4 | |
Administration fees | | 4 | |
Payable for collateral for securities on loan | | 59,750 | |
Other | | 81 | |
| | 60,108 | |
Net Assets | | $ | 240,516 | |
| | | |
Net Assets Consist of: | | | |
Capital Stock ($.01 par value) | | $ | 234 | |
Additional paid-in capital | | 176,004 | |
Undistributed (accumulated) net realized gain from investment securities | | 33,535 | |
Net unrealized appreciation on investment securities | | 30,743 | |
Net Assets | | $ | 240,516 | |
Net Assets by Class: | | | |
Initial Class | | $ | 224,187 | |
Service Class | | 16,329 | |
Shares Outstanding: | | | |
Initial Class | | 21,827 | |
Service Class | | 1,610 | |
Net Asset Value and Offering Price Per Share: | | | |
Initial Class | | $ | 10.27 | |
Service Class | | 10.14 | |
STATEMENT OF OPERATIONS
For the year ended December 31, 2007
(all amounts in thousands)
Investment Income: | | | |
Dividends | | $ | 783 | |
Interest | | 60 | |
Income from loaned securities-net | | 260 | |
| | 1,103 | |
Expenses: | | | |
Management and advisory fees | | 1,926 | |
Printing and shareholder reports | | 61 | |
Custody fees | | 47 | |
Administration fees | | 52 | |
Legal fees | | 5 | |
Audit fees | | 21 | |
Trustees fees | | 9 | |
Distribution and service fees: | | | |
Service Class | | 39 | |
Other | | 4 | |
Total expenses | | 2,164 | |
| | | |
Net Investment Loss | | (1,061 | ) |
| | | |
Net Realized Gain (Loss) from: | | | |
Investment securities | | 36,623 | |
| | | |
Net Increase (Decrease) in Unrealized Appreciation (Depreciation) on: | | | |
Investment securities | | (11,823 | ) |
| | | |
Net Realized and Unrealized Gain: | | 24,800 | |
Net Increase In Net Assets Resulting from Operations | | $ | 23,739 | |
The notes to the financial statements are an integral part of this report.
8
T. Rowe Price Small Cap
STATEMENT OF CHANGES IN NET ASSETS
For the years ended
(all amounts in thousands)
| | December 31,
2007 | | December 31,
2006 | |
Increase (Decrease) in Net Assets From: | | | | | |
Operations: | | | | | |
Net investment (loss) | | $ | (1,061 | ) | $ | (1,478 | ) |
Net realized gain from investment securities | | 36,623 | | 26,128 | |
Change in unrealized (depreciation) on investment securities | | (11,823 | ) | (13,969 | ) |
| | 23,739 | | 10,681 | |
Distributions to Shareholders: | | | | | |
From net realized gains: | | | | | |
Initial Class | | (22,442 | ) | (24,489 | ) |
Service Class | | (1,481 | ) | (1,409 | ) |
| | (23,923 | ) | (25,898 | ) |
Capital Share Transactions: | | | | | |
Proceeds from shares sold: | | | | | |
Initial Class | | 13,909 | | 35,662 | |
Service Class | | 5,863 | | 11,306 | |
| | 19,772 | | 46,968 | |
Dividends and distributions reinvested: | | | | | |
Initial Class | | 22,442 | | 24,489 | |
Service Class | | 1,481 | | 1,409 | |
| | 23,923 | | 25,898 | |
Cost of shares redeemed: | | | | | |
Initial Class | | (65,856 | ) | (118,848 | ) |
Service Class | | (8,194 | ) | (11,304 | ) |
| | (74,050 | ) | (130,152 | ) |
| | (30,355 | ) | (57,286 | ) |
Net increase (decrease) in net assets | | (30,539 | ) | (72,503 | ) |
| | | | | |
Net Assets: | | | | | |
Beginning of year | | 271,055 | | 343,558 | |
End of year | | $ | 240,516 | | $ | 271,055 | |
Undistributed (Accumulated) Net Investment Income (Loss) | | $ | — | | $ | — | |
Share Activity: | | | | | |
Shares issued: | | | | | |
Initial Class | | 1,268 | | 3,173 | |
Service Class | | 546 | | 1,040 | |
| | 1,814 | | 4,213 | |
Shares issued-reinvested from distributions: | | | | | |
Initial Class | | 2,200 | | 2,586 | |
Service Class | | 147 | | 150 | |
| | 2,347 | | 2,736 | |
Shares redeemed: | | | | | |
Initial Class | | (6,115 | ) | (10,771 | ) |
Service Class | | (782 | ) | (1,026 | ) |
| | (6,897 | ) | (11,797 | ) |
Net increase (decrease) in shares outstanding: | | | | | |
Initial Class | | (2,647 | ) | (5,012 | ) |
Service Class | | (89 | ) | 164 | |
| | (2,736 | ) | (4,848 | ) |
The notes to the financial statements are an integral part of this report.
9
T. Rowe Price Small Cap
FINANCIAL HIGHLIGHTS
For a share outstanding throughout each period(a)
| | Initial Class | |
| | Year Ended December 31, | |
| | 2007 | | 2006 | | 2005 | | 2004 | | 2003 | |
Net Asset Value | | | | | | | | | | | |
Beginning of period | | $ | 10.36 | | $ | 11.08 | | $ | 12.35 | | $ | 11.19 | | $ | 7.97 | |
Investment Operations | | | | | | | | | | | |
Net investment income (loss) | | (0.04 | ) | (0.05 | ) | (0.04 | ) | (0.06 | ) | (0.05 | ) |
Net realized and unrealized gain (loss) | | 1.03 | | 0.35 | | 1.21 | | 1.22 | | 3.27 | |
Total operations | | 0.99 | | 0.30 | | 1.17 | | 1.16 | | 3.22 | |
Distributions | | | | | | | | | | | |
From net investment income | | — | | — | | — | | — | | — | |
From net realized gains | | (1.08 | ) | (1.02 | ) | (2.44 | ) | — | | — | |
Total distributions | | (1.08 | ) | (1.02 | ) | (2.44 | ) | — | | — | |
Net Asset Value | | | | | | | | | | | |
End of period(b) | | $ | 10.27 | | $ | 10.36 | | $ | 11.08 | | $ | 12.35 | | $ | 11.19 | |
Total Return(c),(d) | | 9.61 | % | 3.59 | % | 10.61 | % | 10.37 | % | 40.40 | % |
Net Assets End of Period (000’s) | | $ | 224,187 | | $ | 253,644 | | $ | 326,681 | | $ | 308,252 | | $ | 543,942 | |
Ratio and Supplemental Data | | | | | | | | | | | |
Expenses to average net assets(e) | | 0.82 | % | 0.84 | % | 0.81 | % | 0.79 | % | 0.80 | % |
Net investment income (loss), to average net assets(e) | | (0.40 | )% | (0.48 | )% | (0.36 | )% | (0.51 | )% | (0.54 | )% |
Portfolio turnover rate(d) | | 45 | % | 34 | % | 49 | % | 27 | % | 17 | % |
For a share outstanding throughout each period(a)
| | Service Class | |
| | Year Ended December 31, | | May 1 to Dec | |
| | 2007 | | 2006 | | 2005 | | 2004 | | 31, 2003 | |
Net Asset Value | | | | | | | | | | | |
Beginning of period | | $ | 10.25 | | $ | 11.00 | | $ | 12.30 | | $ | 11.17 | | $ | 8.31 | |
Investment Operations | | | | | | | | | | | |
Net investment income (loss) | | (0.07 | ) | (0.08 | ) | (0.07 | ) | (0.08 | ) | (0.05 | ) |
Net realized and unrealized gain (loss) | | 1.01 | | 0.35 | | 1.21 | | 1.21 | | 2.91 | |
Total operations | | 0.94 | | 0.27 | | 1.14 | | 1.13 | | 2.86 | |
Distributions | | | | | | | | | | | |
From net investment income | | — | | — | | — | | — | | — | |
From net realized gains | | (1.05 | ) | (1.02 | ) | (2.44 | ) | — | | — | |
Total distributions | | (1.05 | ) | (1.02 | ) | (2.44 | ) | — | | — | |
Net Asset Value | | | | | | | | | | | |
End of period(b) | | $ | 10.14 | | $ | 10.25 | | $ | 11.00 | | $ | 12.30 | | $ | 11.17 | |
Total Return(c),(d) | | 9.27 | % | 3.34 | % | 10.40 | % | 10.12 | % | 34.42 | % |
Net Assets End of Period (000’s) | | $ | 16,329 | | $ | 17,411 | | $ | 16,877 | | $ | 7,525 | | $ | 1,538 | |
Ratio and Supplemental Data | | | | | | | | | | | |
Expenses to average net assets(e) | | 1.07 | % | 1.09 | % | 1.06 | % | 1.05 | % | 1.05 | % |
Net investment income (loss), to average net assets(e) | | (0.64 | )% | (0.73 | )% | (0.63 | )% | (0.74 | )% | (0.74 | )% |
Portfolio turnover rate(d) | | 45 | % | 34 | % | 49 | % | 27 | % | 17 | % |
(a) | Per share information is calculated based on average number of shares outstanding. |
(b) | T. Rowe Price Small Cap (the “Fund”) share class commenced operations as follows: |
| Initial Class - May 3, 1999 |
| Service Class - May 1, 2003 |
(c) | Total Return reflects all portfolio expenses and includes reinvestment of dividends and capital gains; it does not reflect the charges and deductions under the policies or annuity contracts. |
(d) | Not annualized. |
(e) | Annualized. |
The notes to the financial statements are an integral part of this report.
10
T. Rowe Price Small Cap
NOTES TO FINANCIAL STATEMENTS
At December 31, 2007
(all amounts in thousands)
NOTE 1. ORGANIZATION AND SIGNIFICANT ACCOUNTING POLICIES
AEGON/Transamerica Series Trust (“ATST”) is an open-end management investment company registered under the Investment Company Act of 1940, as amended (the “1940 Act”). ATST serves as a funding vehicle for variable life insurance, variable annuity and group annuity products. T. Rowe Price Small Cap (the “Fund”) is part of ATST.
In the normal course of business, the Fund enters into contracts that contain a variety of representations that provide general indemnifications. The Fund’s maximum exposure under these arrangements is unknown, as this would involve future claims that may be made against the Fund and/or its affiliates that have not yet occurred. However, based on experience, the Fund expects the risk of loss to be remote.
This report should be read in conjunction with the current Fund prospectus, which contains more complete information about the Fund.
In preparing the Fund’s financial statements in accordance with accounting principles generally accepted in the United States of America (“GAAP”), estimates or assumptions (which could differ from actual results) may be used that affect reported amounts and disclosures. The following is a summary of significant accounting policies followed by the Fund.
Multiple class operations, income and expenses: The Fund currently offers two classes of shares, an Initial Class and a Service Class. Income, non-class specific expenses and realized and unrealized gains and losses, are allocated daily to each class, based upon the value of shares outstanding method as permitted under Rule 18f-3 of the 1940 Act. Each class bears its own specific expenses as well as a portion of general, common expenses.
Security valuations: The Fund values its investments at the close of the New York Stock Exchange (“NYSE”), normally 4 p.m. ET, each day the NYSE is open for business. Fund investments are valued at the last sale price or closing price on the day of valuation taken from the primary exchange where the security is principally traded.
Securities traded in the over-the-counter market and listed securities for which no sale was reported on that date are valued at the last quoted bid price.
Debt securities are valued based on a price quotation or other equivalent indication of value supplied by an exchange, a pricing service or a major market maker; however, those that mature in sixty days or less are valued at amortized cost, which approximates market. Investment company securities are valued at the net asset value of the underlying portfolio.
Investment company securities are valued at the net asset value of the underlying portfolio.
Foreign securities generally are valued based on quotations from the primary market in which they are traded. Because many foreign securities markets and exchanges close prior to the close of the NYSE, closing prices for foreign securities in those markets or on those exchanges do not reflect the events that occur after that close. If a significant market event impacting the value of a portfolio security (e.g., natural disaster, company announcement, market volatility) occurs subsequent to the close of trading in the security, but prior to the calculation of the Fund’s net asset value per share, market quotations for that security may be determined to be unreliable and, accordingly, not “readily available.” As a result, foreign equity securities held by the Fund may be valued at fair market value as determined in good faith by the Fund’s Administrative Valuation Committee, under the supervision of the Board’s Valuation Committee, using guidelines adopted by the Board of Trustees.
Securities for which quotations are not readily available are valued at fair market value as determined in good faith by the Fund’s Administrative Valuation Committee, using guidelines adopted by the Board of Trustees.
Cash: The Fund may leave cash overnight in its cash account with the custodian, State Street Bank & Trust Company (“State Street”). On July 2, 2007, State Street acquired the parent company of Investors Bank & Trust Company. State Street has been contracted on behalf of the Fund to invest the excess cash into a savings account, which at December 31, 2007 was paying an interest rate of 2.60%.
Repurchase agreements: The Fund is authorized to enter into repurchase agreements. The Fund, through its custodian, State Street, receives delivery of the underlying securities, the value of which at the time of purchase is required to be an amount equal to at least 100% of the resale price. The Fund will bear the risk of value fluctuations until the security can be sold and may encounter delays and incur costs in liquidating the security. In the event of bankruptcy or insolvency of the seller, delays and costs may be incurred.
Commission recapture: The sub-adviser, to the extent consistent with the best execution and usual commission rate policies and practices, may place security transactions of the Fund with broker/dealers with which ATST has established a Commission Recapture Program. A Commission Recapture Program is any arrangement under which a broker/dealer applies a portion of the commissions received by such broker/dealer on the security transactions to the Fund. In no event will commissions paid by the Fund be used to pay expenses that would otherwise be borne by any other funds within ATST, or by any other party.
Recaptured commissions during the year ended December 31, 2007 of $2 are included in net realized gains in the Statement of Operations.
11
NOTES TO FINANCIAL STATEMENTS (continued)
At December 31, 2007
(all amounts in thousands)
NOTE 1.– (continued)
Securities lending: The Fund may lend securities to qualified borrowers, with State Street acting as the Fund’s lending agent. The Fund earns negotiated lenders’ fees. The Fund receives cash and/or securities as collateral against the loaned securities. Cash collateral received is invested in short-term, interest-bearing securities. The Fund monitors the market value of securities loaned on a daily basis and requires collateral in an amount at least equal to the value of the securities earned by State Street for loaned. Income from loaned securities its services, shown in the Statement of Operations is net of fees in the amount of $111.
The Fund has invested the cash collateral received from securities loaned in the following short-term, interest-bearing securities:
Abbey National PLC, Eurodollar Term, 5.00%, 1/7/2008 | | $ | 2,579 | |
ABN AMRO Bank NV, Eurodollar Term, 5.18%, 1/4/2008 | | 2 ,063 | |
Bank of Nova Scotia, Eurodollar Term, 4.96%, 1/22/2008 | | 1 ,805 | |
Barclays, Eurodollar Term, 5.00%, 2/12/2008 | | 3,611 | |
BNP Paribas, Eurodollar Term, 5.01%, 1/11/2008 | | 3,353 | |
Calyon, Eurodollar Term, 5.12%, 3/3/2008 | | 774 | |
Credit Suisse First Boston Corp., Repurchase Agreement, 4.60%, 1/2/2008 | | 6,706 | |
Dexia Group, Eurodollar Term, 4.82%, 1/3/2008 | | 2,579 | |
HBOS Halifax Bank of Scotland, Eurodollar Term, 5.15%, 1/2/2008 | | 1,290 | |
JPMorgan Chase & Co., Eurodollar Term, 5.15%, 2/12/2008 | | 1,290 | |
Lloyds TSB Bank, Eurodollar Term, 5.15%, 1/24/2008 | | 2 ,579 | |
Merrill Lynch & Co. (RPG), Repurchase Agreement, 4.60%, 1/2/2008 | | 3,869 | |
Morgan Stanley & Co. (Corp. Repo), Repurchase Agreement, 4.60%, 1/2/2008 | | 1 0 ,574 | |
Rabobank Nederland, Eurodollar Term, 5.08%, 1/10/2008 | | 3 ,095 | |
Reserve Primary Money Market Fund 4.95% | | 2 ,751 | |
Royal Bank of Scotland, Eurodollar Term, 5.00%, 2/25/2008 | | 3 ,095 | |
Societe Generale, Eurodollar Term, 5.15%, 3/3/2008 | | 1 ,547 | |
Toronto Dominion Bank, Eurodollar Term, 5. 05 %, 1/10/2008 | | 3 ,095 | |
UBS AG, Eurodollar Term, 4.92%, 1/11/2008 | | 1 ,805 | |
Wells Fargo, Bank Note, 4.75%, 1/8/2008 | | 1 ,290 | |
| | | |
| | $ | 59,750 | |
Real Estate Investment Trusts (“REITs”): There are certain additional risks involved in investing in REITs. These include, but are not limited to, economic conditions, changes in zoning laws, real estate values, property taxes and interest rates. Since the Fund invests in real estate securities, the net asset value per share may fluctuate more widely than the value of shares of a fund that invests in a broad range of industries.
Dividend income is recorded at management’s estimate of the income included in distributions from the REIT investments. Distributions received in excess of the estimated amount are recorded as a reduction of the cost of investments. The actual amounts of income, return of capital and capital gains are only determined by each REIT after the fiscal year end and may differ from the estimated amounts.
Security transactions and investment income: Security transactions are recorded on the trade date. Security gains and losses are calculated on the first-in, first-out basis. Dividend income, if any, is recorded on the ex-dividend date or, in the case of foreign securities, as soon as the Fund is informed of the ex-dividend date. Interest income, including accretion of discounts and amortization of premiums, is recorded on the accrual basis commencing on the settlement date.
Dividend distributions: Dividends and capital gains distributions are typically declared and reinvested annually and are generally paid and reinvested on the business day following the ex-date.
NOTE 2. RELATED PARTY TRANSACTIONS
ATST serves as a funding vehicle for certain affiliated asset allocation portfolios and certain affiliated separate accounts of Western Reserve Life Assurance Co. of Ohio, Transamerica Life Insurance Company, Transamerica Financial Life Insurance Company, Inc., Monumental Life Insurance Company and Transamerica Occidental Life Insurance Company.
Transamerica Fund Advisors, Inc. (“TFAI”) is the Fund’s investment adviser. Transamerica Fund Services, Inc. (“TFS”) is the Fund’s administrator and transfer agent. Prior to May 1, 2007, AFSG Securities Corp. (“AFSG”), was the Fund’s distributor. Transamerica Capital Inc. (“TCI”) is now the Fund’s distributor. TFAI, TFS, AFSG, and TCI are affiliates of AEGON NV, a Netherlands corporation.
Certain officers and trustees of the Fund are also officers and/or directors of TFAI, TFS and TCI.
The following schedule reflects the percentages of Fund assets owned by affiliated investment companies at December 31, 2007:
| | Net
Assets | | % of Net
Assets | |
| | | | | |
Asset Allocation-Conservative Portfolio | | $ | 5,740 | | 2.38 | % |
Asset Allocation-Moderate Portfolio | | 27,074 | | 11.26 | |
Total | | $ | 32,814 | | 13.64 | % |
Investment advisory fee: The Fund pays management fees to TFAI based on average daily net assets (“ANA”) at the following rate:
0.75% of ANA
TFAI has contractually agreed to waive its advisory fee and will reimburse the Fund to the extent that operating expenses, excluding 12b-1 fees, exceed the following stated annual limit:
1.00% Expense Limit
If total Fund expenses fall below the annual expense limitation agreement agreed to by the adviser within the succeeding three years, the Fund may be required to pay the adviser a portion or all of the waived advisory fees.
12
NOTES TO FINANCIAL STATEMENTS (continued)
At December 31, 2007
(all amounts in thousands)
NOTE 2.– (continued)
There were no amounts recaptured during the year ended December 31, 2007. There are no amounts available for recapture at December 31, 2007.
Distribution and service fees: ATST entered into a Distribution Agreement with AFSG dated January 1, 1997, as amended. On May 1, 2007, the Distribution Agreement was amended to replace AFSG with TCI as the Fund’s distributor. The Fund has also adopted a distribution plan (“Distribution Plan”) pursuant to Rule 12b-1 under the 1940 Act.
Under the Distribution Plan for the Initial Class shares, TCI, on behalf of the Fund, is authorized to pay various service providers, as direct payment for expenses incurred in connection with distribution of the Fund’s shares, amounts equal to actual expenses associated with distributing the shares.
The Distribution Plan for the Service Class shares requires ATST to pay distribution fees to TCI as compensation for its activities, not as reimbursement for specific expenses. The fee on the Service Class is paid to the insurance companies for providing services and account maintenance for their policyholders who invest in the variable insurance products which invest in the Service Class shares.
The Fund is authorized under the Distribution Plan to pay fees on each class up to the following limits:
Initial Class | | 0.15 | % |
Service Class | | 0.25 | % |
TCI has determined that it will not seek payment by the Fund of the distribution expenses incurred with respect to the Initial Class shares before April 30, 2009. Prior to TCI seeking reimbursement of future expenses, policy and contract owners will be notified in advance. The Fund will pay fees relating to Service Class shares.
Administrative services: The Fund has entered into an agreement with TFS for financial and legal fund administration services. The Fund pays TFS an annual fee of 0.02% of ANA. The Legal fees on the Statement of Operations are for fees paid to external legal counsel.
Deferred compensation plan: Each eligible independent Fund Trustee may elect participation in a non-qualified deferred compensation plan (“the Plan”). Under the Plan, such Trustees may defer payment of all or a portion of their total fees earned as a Fund Trustee. Each Trustee who is a participant in the Plan may elect that the earnings, losses or gains credited to his or her deferred fee amounts be determined based on a deemed investment in any series of Transamerica IDEX Mutual Funds. The right of a participant to receive a distribution from the Plan of the deferred fees is an unsecured claim against the general assets of all series of Transamerica IDEX Mutual Funds. The pro rata liability to the Fund of all deferred fees in the Plan amounted, as of December 31, 2007, to $12. Amounts deferred under the Deferred Compensation Plan are unfunded against the general assets of ATST.
Retirement plan: Under a retirement plan (the “Emeritus Plan”) available to the Independent Trustees, each Independent Trustee is deemed to have elected to serve as Trustee Emeritus of ATST upon his or her termination of service, other than removal for cause, is entitled to 50% of the trustee’s current retainer for a maximum period of five years determined by his or her years of service as a Trustee.
Such amounts shall be accrued by ATST on a pro rata basis allocable to each series of ATST based on the relative assets of the series. If retainers increase in the future, past accruals (and credits) will be adjusted upward so that 50% of the Trustee’s current retainer is accrued and credited at all times. Upon death, disability or termination of service, other than removal for cause, amounts deferred become payable to a Trustee Emeritus (or his/her beneficiary). Upon the commencement of service as Trustee Emeritus, compensation will be paid on a quarterly basis during the time period that the Trustee Emeritus is allowed to serve as such.
Amounts accrued under the Emeritus Plan are unsecured claims against the general assets of ATST. For the year ended December 31, 2007, the amount related to the Emeritus Plan was $13. As of December 31, 2007, the Fund has not made any payments related to the Emeritus Plan.
The Emeritus Plan was terminated effective October 30, 2007. Upon the termination, the Fund shall continue to pay any remaining benefits in accordance with the Plan, but no further compensation shall accrue under the Plan.
NOTE 3. INVESTMENT TRANSACTIONS
The cost of securities purchased and proceeds from securities sold (excluding short-term securities) for the year ended December 31, 2007 were as follows:
Purchases of securities: | | | |
Long-term | | $ | 116,467 | |
U.S. Government | | — | |
Proceeds from maturities and sales of securities: | | | |
Long-term | | 169,987 | |
U.S. Government | | — | |
| | | | |
NOTE 4. FEDERAL INCOME TAX MATTERS
The Fund has not made any provision for federal income or excise taxes due to its policy to distribute all of its taxable income and capital gains to its shareholders and otherwise qualify as a regulated investment company under Subchapter M of the Internal Revenue Code. Income and capital gain distributions are determined in accordance with income tax regulations, which may differ from GAAP. These differences are primarily due to differing treatment for items including, but not limited to, wash sales and net operating loss.
Therefore, distributions determined in accordance with tax regulations may differ significantly in amount or character from net investment income and realized gains for financial reporting purposes. Financial reporting records are adjusted for permanent book/tax differences to reflect tax character. Financial records are not adjusted for temporary differences. These reclassifications are as follows:
13
NOTES TO FINANCIAL STATEMENTS (continued)
At December 31, 2007
(all amounts in thousands)
NOTE 4.– (continued)
Additional paid-in capital | | $ | — | |
Undistributed (accumulated) net investment income (loss) | | $ | 1,061 | |
Undistributed (accumulated) net realized gain (loss) from investment securities | | $ | (1,061 | ) |
The tax character of distributions paid may differ from the character of distributions shown in the Statements of Changes in Net Assets due to short-term gains being treated as ordinary income for tax purposes. The tax character of distributions paid during 2006 and 2007 was as follows:
2006 Distributions paid from: | | | |
Ordinary Income | | $ | — | |
Long-term Capital Gain | | 25,898 | |
| | | |
2007 Distributions paid from: | | | |
Ordinary Income | | 496 | |
Long-term Capital Gain | | 23,426 | |
| | | | |
The tax basis components of distributable earnings as of December 31, 2007 are as follows:
Undistributed Ordinary Income | | $ | 2,623 | |
Undistributed Long-term Capital Gain | | $ | 31,937 | |
Capital Loss Carryforward | | $ | — | |
Net Unrealized Appreciation (Depreciation) | | $ | 29,718 | |
NOTE 5. REGULATORY PROCEEDINGS
There continues to be significant federal and state regulatory activity relating to financial services companies, particularly mutual fund companies and their investment advisers. As part of an ongoing investigation regarding potential market timing, recordkeeping and trading compliance issues and matters affecting the Fund’s investment adviser, TFAI, and certain affiliates and former employees of TFAI, the SEC staff has indicated that it is likely to take some action against TFAI and certain of its affiliates at the conclusion of the investigation. The potential timing and the scope of any such action is difficult to predict. Although the impact of any action brought against TFAI and/or its affiliates is difficult to assess at the present time, the Fund currently believes that the likelihood that any such action will have a material adverse impact on it is remote. It is important to note that the Fund is not aware of any allegation of wrong doing against it and its Board at the time this annual report is printed. Although it is not anticipated that these developments will have an adverse impact on the Fund, there can be no assurance at this time. TFAI and its affiliates are actively working with the SEC in regard to this matter; however, the exact resolution cannot be determined at this time. TFAI will take such actions that it deems necessary or appropriate to continue providing management services to the Fund and to bring all matters to an appropriate conclusion.
TFAI and/or its affiliates, and not the Fund, will bear the costs regarding these regulatory matters.
NOTE 6. RECENTLY ISSUED ACCOUNTING PRONOUNCEMENTS
In July 2006, the Financial Accounting Standards Board (“FASB”) released FASB Interpretation No. 48 “Accounting for Uncertainty in Income Taxes” (“FIN 48”), an interpretation of FASB Statement No. 109. FIN 48 provides guidance for how uncertain tax positions should be recognized, measured, presented and disclosed in the financial statements. FIN 48 requires the accounting and disclosure of tax positions taken or expected to be taken in the course of preparing the Fund’s tax returns to determine whether the tax positions are “more-likely-than-not” of being sustained by the applicable tax authority. Tax positions not deemed to meet the more-likely-than-not threshold would be recorded as a tax benefit or expense in the current year.
Adoption of FIN 48 is effective during the first required financial reporting period for fiscal years beginning after December 15, 2006. Management adopted FIN 48 on June 29, 2007.
Implementation of FIN 48 requires Management of the Fund to analyze all open tax years, as defined by the Statute of Limitations, for all major jurisdictions, which includes federal and certain states. Open tax years are those that are open for exam by taxing authorities (i.e., the last 4 tax year ends and the interim tax period since then). The Fund has no examinations in progress and none are expected at this time.
Management of the Fund has reviewed all open tax years and major jurisdictions and concluded the adoption of FIN 48 resulted in no impact to the Fund’s net assets or results of operations. There is no tax liability resulting from unrecognized tax benefits relating to uncertain income tax positions taken or expected to be taken in future tax returns. The Fund is also not aware of any tax positions for which it is reasonably possible that the total amounts of unrecognized tax benefits will significantly change in the next 12 months.
In September 2006, FASB issued its new Standard No. 157, “Fair Value Measurements” (“FAS 157”). FAS 157 is designed to unify guidance for the measurement of fair value of all types of assets, including financial instruments, and certain liabilities, throughout a number of accounting standards. FAS 157 also establishes a hierarchy for measuring fair value in generally accepted accounting principles and expands financial statement disclosures about fair value measurements that are relevant to mutual funds. FAS 157 is effective for financial statements issued for fiscal years beginning after November 15, 2007, and earlier application is permitted.
As of December 31, 2007, Management does not expect the adoption of FAS 157 to impact the amounts reported in the financial statements, however, additional disclosures will be required about the inputs used to develop the measurements of fair value and the effect of certain of the measurements reported in the statement of operations for a fiscal period.
14
NOTES TO FINANCIAL STATEMENTS (continued)
At December 31, 2007
(all amounts in thousands)
NOTE 7. SUBSEQUENT EVENT
Effective January 1, 2008, TFAI changed its name to Transamerica Asset Management, Inc.
Effective May 1, 2008, AEGON/Transamerica Series Trust will change its name to Transamerica Series Trust. At that time, the Fund will also change its name to Transamerica T. Rowe Price Small Cap VP.
15
Report of Independent Registered Certified Public Accounting Firm
To the Board of Trustees and Shareholders of
T. Rowe Price Small Cap:
In our opinion, the accompanying statement of assets and liabilities, including the schedule of investments, and the related statements of operations and of changes in net assets and the financial highlights present fairly, in all material respects, the financial position of T. Rowe Price Small Cap (the “Fund”) (one of the portfolios constituting AEGON/Transamerica Series Trust) at December 31, 2007, the results of its operations for the year then ended, the changes in its net assets for each of the two years in the period then ended and the financial highlights for each of the periods presented, in conformity with accounting principles generally accepted in the United States of America. These financial statements and financial highlights (hereafter referred to as “financial statements”) are the responsibility of the Fund’s management; our responsibility is to express an opinion on these financial statements based on our audits. We conducted our audits of these financial statements in accordance with the standards of the Public Company Accounting Oversight Board (United States). Those standards require that we plan and perform the audit to obtain reasonable assurance about whether the financial statements are free of material misstatement. An audit includes examining, on a test basis, evidence supporting the amounts and disclosures in the financial statements, assessing the accounting principles used and significant estimates made by management, and evaluating the overall financial statement presentation. We believe that our audits, which included confirmation of securities at December 31, 2007 by correspondence with the custodian and brokers, provide a reasonable basis for our opinion.

Tampa, Florida
February 29, 2008
16
T. Rowe Price Small Cap
SUPPLEMENTAL TAX INFORMATION (unaudited)
(all amounts in thousands)
For tax purposes, the Fund has made a Long-Term Capital Gain Designation of $23,426 for the year ended December 31, 2007.
RESULTS OF SHAREHOLDER PROXY (unaudited)
At a special meeting of shareholders held on October 30, 2007, the results of the Proposals were as follows:
Proposal 1: To elect a new Board:
Proposed
Trustee | | For | | Against | | Abstentions/Broker Non-
Votes | |
John K. Carter | | 2,274,998,840.817 | | 57,804,698.755 | | 35,433.883 | |
| | | | | | | |
Leo J. Hill | | 2,277,212,702.754 | | 55,590,836.819 | | 35,433.883 | |
| | | | | | | |
Neal M. Jewell | | 2,266,793,295.663 | | 66,010,243.909 | | 35,433.883 | |
| | | | | | | |
Russell A. Kimball, Jr. | | 2,274,825,235.835 | | 57,978,303.737 | | 35,433.883 | |
| | | | | | | |
Eugene M. Mannella | | 2,274,623,165.033 | | 58,180,374.539 | | 35,433.883 | |
| | | | | | | |
Norm R. Nielsen | | 2,275,050,055.885 | | 57,753,483.687 | | 35,433.883 | |
| | | | | | | |
Joyce Galpern Norden | | 2,270,278,122.250 | | 62,525,417.323 | | 35,433.883 | |
| | | | | | | |
Patricia L. Sawyer | | 2,275,737,737.456 | | 57,065,802.116 | | 35,433.883 | |
| | | | | | | |
John W. Waechter | | 2,276,615,120.140 | | 56,188,419.433 | | 35,433.883 | |
Proposal 2: To approve an amendment to the Agreement and Declaration of Trust:
| | | | Abstentions/Broker Non- | |
For | | Against | | Votes | |
2,182,022,669.110 | | 77,590,048.544 | | 73,226,255.801 | |
17
T. Rowe Price Small Cap
INVESTMENT ADVISORY AND SUB-ADVISORY AGREEMENTS-REVIEW AND RENEWAL (unaudited)
At a meeting of the Board of Trustees of AEGON/Transamerica Series Trust (“ATST”) held on December 4th, 2007, the Board reviewed and considered the renewal of the investment advisory agreement (the “Investment Advisory Agreement”) between T. Rowe Price Small Cap (the “Fund”) and Transamerica Fund Advisors, Inc. (“TFAI”), as well as the renewal of the investment sub-advisory agreement (the “Sub-Advisory Agreement”) of the Fund between TFAI and T. Rowe Price Associates, Inc. (the “Sub-Adviser”), to determine whether the agreements should be renewed for a six-month period. It was noted that this review was interim in nature to align all the Funds on the same calendar, and that the Funds’ advisory arrangements would be reviewed again in the first half of 2008.
Following their review and consideration, the Trustees determined that the renewal of the Investment Advisory Agreement and the Sub-Advisory Agreement would enable shareholders of the Fund to obtain high quality services at a cost that is appropriate, fair, and in the best interests of its shareholders. The Board, including the independent members of the Board, unanimously approved the renewal of the Investment Advisory Agreement and Sub-Advisory Agreement. In reaching their decision, the Trustees requested and obtained from TFAI and the Sub-Adviser such information as they deemed reasonably necessary to evaluate the agreements, including information about fees and performance of comparable funds managed by the Sub-Adviser. The Trustees also carefully considered information they had previously received from TFAI and the Sub-Adviser throughout the year as part of their regular oversight of the Fund, as well as comparative fee, expense, and performance information prepared by Lipper Inc. (“Lipper”), an independent provider of mutual fund performance, fee and expense information and profitability data prepared by management. In considering the proposed continuation of the Investment Advisory and Sub-Advisory Agreements, the Trustees evaluated a number of considerations that they believed, in light of the legal advice furnished to them by independent legal counsel and their own business judgment, to be relevant. They based their decisions on a variety of factors, including the following considerations, among others, although they did not identify any consideration or particular information that was controlling of their decisions:
The nature, extent and quality of the advisory services to be provided. The Board considered the nature and quality of the services provided by TFAI and the Sub-Adviser to the Fund in the past, as well as the services anticipated to be provided in the future. The Board concluded that TFAI and the Sub-Adviser are capable of providing high quality services to the Fund, as indicated by the nature and quality of services provided in the past by TFAI and the Sub-Adviser for this series and the experience, capability and integrity of TFAI’s senior management, the financial resources of TFAI and the Sub-Adviser, TFAI’s management oversight process and the professional qualifications of the portfolio management team of the Sub-Adviser. The Trustees determined that TFAI and the Sub-Adviser can provide investment and related services that are appropriate in scope and extent in light of the Fund’s operations, the competitive landscape of the investment company business and investor needs.
The investment performance of the Fund. The Board examined the short and longer-term performance of the Fund, including relative performance against a peer universe of comparable mutual funds as prepared by Lipper for various trailing periods ended June 30, 2007. The Trustees noted that the Fund’s performance was in line with the median for its peer universe for the past 1-and 5-year periods and below the median for the past 3-year period. The Trustees further noted that the Fund has a low level of relative risk as compared to its peer universe. The Trustees further noted that the Fund On the basis of the Board’s assessment of the nature, extent and quality of advisory services to be provided or procured by TFAI and the Sub-Adviser, the Board concluded that TFAI and the Sub-Adviser are capable of providing a level of investment performance that is appropriate in light of the Fund’s proposed investment objectives, policies and strategies and competitive with other similarly situated investment companies.
The cost of advisory services provided and the level of profitability. The Board reviewed profitability information of TFAI’s cost of procuring fund management services, as well as the costs of provision of administration, fund accounting and other services, to the Fund and to ATST as a whole by TFAI and its affiliates. The Board reviewed the management and sub-advisory fees for the Fund. The Trustees noted that the Fund’s contractual management fees were below the median for its peer group and that the total expenses of the Fund were well below the medians for its peer group and peer universe. Based on their review, the Trustees determined that the management fees of the Fund generally are appropriate in light of the services expected to be provided or procured, the management fees and the anticipated profitability of the relationship between the Fund, TFAI and its affiliates, and the Sub-Adviser. In making these observations and determinations, the Board reviewed, among other things, comparative information provided by Lipper.
Whether fee levels reflect economies of scale and the extent to which economies of scale would be realized as the Fund grows. In evaluating the extent to which the management fees payable under the Investment Advisory and Sub-Advisory Agreements reflect economies of scale or will permit economies of scale to be realized in the future, the Board considered the specific reasons for the absence of breakpoints, and concluded that the absence of breakpoints was acceptable under the circumstances. The Trustees also concluded that they will have the opportunity to periodically reexamine whether the Fund has achieved economies of scale, and the appropriateness of management fees payable to TFAI and fees paid to the Sub-Adviser, in the future.
Benefits (such as soft dollars) to TFAI, its affiliates, or the Sub-Adviser from their relationship with the Fund. The Board concluded that other benefits anticipated to be derived by TFAI, its affiliates, and the Sub-Adviser from their relationships with the Fund are expected to be reasonable and fair, and consistent with industry practice and the best interests of the Fund and its shareholders. The Trustees noted that TFAI would not realize soft dollar benefits from its relationship with the Fund. The Board also noted that the Sub-Adviser is participating in a brokerage program pursuant to which a portion of brokerage commissions paid by the Fund is recaptured for the benefit of the Fund and its shareholders, thus limiting the amount of soft dollar arrangements the Sub-Adviser may engage in with respect to the Fund’s brokerage transactions.
18
Other considerations. The Board determined that TFAI has made a substantial commitment to the recruitment and retention of high quality personnel, and maintains the financial, compliance and operational resources reasonably necessary to manage the Fund in a professional manner that is consistent with the best interests of the Fund and its shareholders. In this regard, the Trustees favorably considered the procedures and policies in place by TFAI to enforce compliance with applicable laws and regulations and oversee the portfolio management activities of the Sub-Adviser. The Trustees also determined that TFAI has made a significant entrepreneurial commitment to the management and success of the Fund, reflected by TFAI’s expense limitation and fee waiver arrangements with the Fund which may result in TFAI waiving a substantial amount of management fees for the benefit of shareholders. With respect to the Sub-Adviser, the Trustees noted that the Sub-Adviser’s trading costs generally had been lower than its peers for three of the previous four quarters.
19
T. Rowe Price Growth Stock
MARKET ENVIRONMENT
The U.S. equity markets broadly declined in the fourth quarter. Returns were led by utilities, which profited from improved fundamentals and credit ratings, and energy, on rising oil prices. Financials was the worst performing sector in the benchmark, followed by consumer discretionary. The ripple effects of the sub-prime lending fallout have spread to the credit markets and, along with higher gasoline prices, have significantly dampened consumer spending. Among major U.S. equity indexes, large-cap stocks surpassed small-caps, and large growth stocks outpaced value.
PERFORMANCE
For the year ended December 31, 2007, T. Rowe Price Growth Stock, Initial Class returned 9.91%. By comparison its primary and secondary benchmarks, the Standard and Poor’s 500 Composite Stock Index (“S&P 500”) and the Russell 1000 Growth Index, returned 5.49% and 11.81%, respectively.
STRATEGY REVIEW
The portfolio posted negative returns for the quarter ended December 31, 2007, but outperformed the benchmark S&P 500, which was also negative. Financials, information technology (“IT”), and industrials and business services were the leading portfolio sectors in relative performance. Energy and consumer staples sectors were the primary detractors from results against the benchmark.
The portfolio’s stock selection in financials, IT, and industrials and business services sectors was the main reason for relative outperformance against the S&P 500. Underweighting financials and overweighting IT sectors also contributed to positive relative results. Energy was a relative detractor due to underweighting and stock selection, while an underweight to consumer staples also had an adverse impact.
Although financials was the worst performing sector in the benchmark, it was the portfolio’s strongest relative outperformer, lifted by stock selection in the capital markets industry. State Street Corporation, a leader in trust services and asset management, continued to perform well despite fallout from the sub-prime mortgage slump. The longer term appears promising for this stock, despite apprehension over asset- backed commercial paper with mortgage exposure and the cloud of a lawsuit regarding the company’s troubled fixed income funds. The Charles Schwab Corporation, the brokerage and financials services firm, saw an increase in client assets despite notable market volatility. DLF Limited, a dominant real estate developer in India, offers quality exposure to the property sector in that country. While favoring capital markets stocks, the portfolio trimmed positions with credit concerns in the period.
IT remains the portfolio’s largest absolute sector and largest relative overweight. Quarterly results benefited from stock selection in the Internet software and services industry and the computers and peripherals industry. Google Inc., the global targeted-advertising and Internet search company, further increased its market share at a remarkable rate, led by domestic revenue acceleration and strong international growth. Apple Inc. computers reported strong earnings and raised its future guidance.
Industrials and business services outperformed on stock selection, particularly in the machinery industry. Danaher Corporation, a diversified maker of instruments, technology, and tools, announced record third-quarter results and is well- positioned to grow earnings. Foster Wheeler Ltd., an engineering infrastructure firm, we believe will grow on increased spending on energy, oil, and natural gas infrastructure. The portfolio was a net buyer in the sector and continues to be overweight relative to the benchmark.
Stock selection and an underweight had a negative impact on relative results of the energy sector. The portfolio was overweight the energy equipment and services industry. Oilfield services companies Schlumberger Limited and Baker Hughes Incorporated pulled back from previous quarter gains. However, both companies, we believe, will prosper from rising world demand for oil exploration and development.
Consumer staples underperformed against the benchmark on stock selection and underweighting. The portfolio’s focus in the food and staples retailing industry proved detrimental. Shares of Whole Foods Market, Inc. gave up gains from last quarter but we believe the world’s leading retailer of natural and organic foods is poised to deliver multi-years earnings growth and acceleration. The portfolio added to the sector in the period.
Robert W. Smith
Portfolio Manager
T. Rowe Price Associates, Inc.
AEGON/Transamerica Series Trust | Annual Report 2007 |
1
T. Rowe Price Growth Stock
(unaudited)
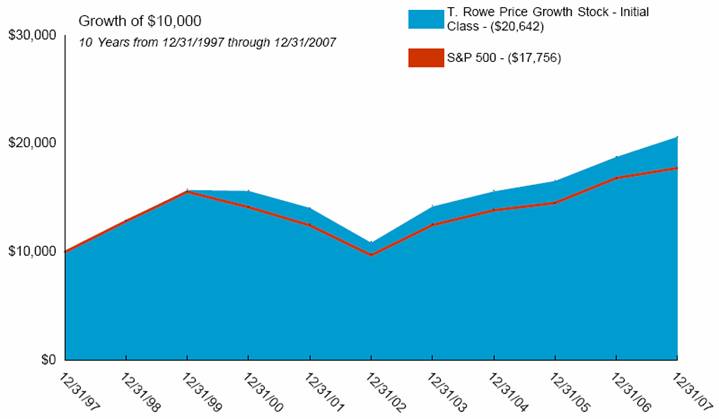
Average Annual Total Return for Periods Ended 12/31/2007
| | 1 Year | | 5 Years | | 10 Years | | From
Inception | | Inception
Date | |
Initial Class | | 9.91 | % | 13.70 | % | 7.52 | % | 12.07 | % | 1/3/95 | |
S&P 500(1) | | 5.49 | % | 12.83 | % | 5.91 | % | 11.27 | % | 1/3/95 | |
Russell 1000 Growth (1) | | 11.81 | % | 12.10 | % | 3.83 | % | 9.39 | % | 1/3/95 | |
| | | | | | | | | | | |
Service Class | | 9.61 | % | — | % | — | % | 12.90 | % | 5/1/03 | |
NOTES
(1) The Standard and Poor’s 500 Composite Stock (S&P 500) Index and the Russell 1000 Growth (Russell 1000 Growth) Index are unmanaged indices used as a general measure of market performance. Calculations assume dividends and capital gains are reinvested and do not include any managerial expenses. From inception calculation is based on life of Initial Class shares.
The performance data presented represents past performance, future results may vary. The portfolio’s investment return and net asset value will fluctuate. Past performance does not guarantee future results. Investor’s units when redeemed, may be worth more or less than their original cost.
Current performance may be lower or higher than performance quoted. Please visit your insurance company’s website for contract or policy level standardized total returns current to the most recent month end. Portfolio performance is net of investment fees and fund expenses, but not product charges, which, if included, would significantly lower the performance quoted.
This material must be preceded or accompanied by a current prospectus, which includes specific contents regarding the investment objectives, explanation of share classes and policies of this portfolio.
2
T. Rowe Price Growth Stock
UNDERSTANDING YOUR FUND’S EXPENSES
(unaudited)
SHAREHOLDER EXPENSES
Fund shareholders may incur ongoing costs, including management and advisory fees, distribution and service fees, and other fund expenses.
The following Example is intended to help you understand your ongoing costs (in dollars and cents) of investing in the Fund and to compare these costs with the ongoing costs of investing in other funds.
The Example is based on an investment of $1,000 invested at July 1, 2007 and held for the entire period until December 31, 2007.
ACTUAL EXPENSES
The first line in the table below provides information about actual account values and actual expenses. You may use the information in this line, together with the amount you invested, to estimate the expenses that you paid over the period. Simply divide your account value by $1,000 (for example, an $8,600 account value divided by $1,000 = 8.6), then multiply the result by the number in the first line of your Fund under the heading entitled “Expenses Paid During Period” to estimate the expenses you paid on your account during this period.
HYPOTHETICAL EXAMPLE FOR COMPARISON PURPOSES
The second line in the table below provides information about hypothetical account values and hypothetical expenses based on the Fund’s actual expense ratio and an assumed rate of return of 5% per year before expenses, which is not the Fund’s actual return. The hypothetical account values and expenses may not be used to estimate the actual ending account balance or expenses you paid for the period. You may use this information to compare the ongoing costs of investing in your Fund and other funds. To do so, compare this 5% hypothetical example with the 5% hypothetical examples that appear in the shareholder reports of the other funds.
Please note that the expenses shown in the table are meant to highlight your ongoing costs only and do not reflect any transactional costs, such as sales charges, redemption fees, brokerage commissions paid on purchases and sales of fund shares. Therefore, the second line under the Fund in the table is useful in comparing ongoing costs only, and will not help you determine the relative total costs of owning different funds. If any of these transaction costs were included, your costs would be higher. The expenses shown in the table do not reflect any fees that may be charged to you by brokers, financial intermediaries or other financial institutions.
| | Beginning
Account
Value | | Ending
Account
Value | | Annualized
Expense
Ratio | | Expenses
Paid During
Period (a) | |
Initial Class | | | | | | | | | |
Actual | | $ | 1,000.00 | | $ | 1,013.96 | | 0.86 | % | $ | 4.37 | |
Hypothetical (b) | | 1,000.00 | | 1,020.87 | | 0.86 | | 4.38 | |
| | | | | | | | | |
Service Class | | | | | | | | | |
Actual | | 1,000.00 | | 1,012.60 | | 1.11 | | 5.63 | |
Hypothetical (b) | | 1,000.00 | | 1,019.61 | | 1.11 | | 5.65 | |
| | | | | | | | | | | | |
(a) Expenses are calculated using the Fund’s annualized expense ratio (as disclosed in the table), multiplied by the average account value for the period, multiplied by the number of days in the period (184 days), and divided by the number of days in the year (365 days).
(b) 5% return per year before expenses.
GRAPHICAL PRESENTATION OF SCHEDULE OF INVESTMENTS
By Sector
At December 31, 2007
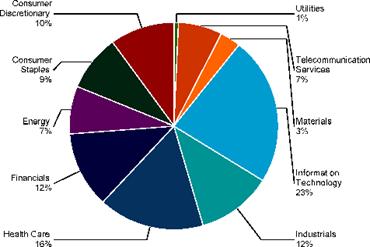
This chart shows the percentage breakdown by sector of the Fund’s total investment securities.
3
T. Rowe Price Growth Stock
SCHEDULE OF INVESTMENTS
At December 31, 2007
(all amounts except share amounts in thousands)
| | Shares | | Value | |
COMMON STOCKS (97.8%) | | | | | |
Aerospace & Defense (0.9%) | | | | | |
General Dynamics Corp. | | 51,300 | | $ | 4,565 | |
Air Freight & Logistics (0.5%) | | | | | |
Expeditors International Washington, Inc. | | 54,700 | | 2,444 | |
Airlines (0.8%) | | | | | |
Southwest Airlines Co. | | 309,100 | | 3,771 | |
Beverages (1.3%) | | | | | |
InBev NV | | 29,400 | | 2,450 | |
PepsiCo, Inc. | | 52,200 | | 3,962 | |
Biotechnology (2.5%) | | | | | |
Celgene Corp. ‡ | | 22,700 | | 1,049 | |
Genentech, Inc. ‡ | | 74,000 | | 4,963 | |
Gilead Sciences, Inc. ‡ | | 135,900 | | 6,253 | |
Capital Markets (5.3%) | | | | | |
BlackRock, Inc. Class A | | 10,400 | | 2,255 | |
Charles Schwab Corp. (The) | | 162,100 | | 4,142 | |
Franklin Resources, Inc. | | 39,000 | | 4,463 | |
Goldman Sachs Group, Inc. (The) | | 14,100 | | 3,032 | |
Morgan Stanley | | 26,500 | | 1,407 | |
Northern Trust Corp. | | 37,800 | | 2,895 | |
State Street Corp. | | 95,000 | | 7,714 | |
Chemicals (1.3%) | | | | | |
Monsanto Co. | | 39,800 | | 4,445 | |
Praxair, Inc. | | 22,200 | | 1,970 | |
Commercial Banks (0.5%) | | | | | |
Erste Bank DER Oesterreichischen Sparkassen AG | | 37,900 | | 2,676 | |
Communications Equipment (3.8%) | | | | | |
Cisco Systems, Inc. ‡ | | 219,900 | | 5,953 | |
Corning, Inc. | | 196,700 | | 4,719 | |
Juniper Networks, Inc. ‡ | | 114,800 | | 3,811 | |
Qualcomm, Inc. | | 103,200 | | 4,061 | |
Computers & Peripherals (3.5%) | | | | | |
Apple, Inc. ‡ | | 59,900 | | 11,865 | |
Dell, Inc. ‡ | | 102,100 | | 2,503 | |
EMC Corp. ‡ | | 142,100 | | 2,633 | |
Construction & Engineering (1.1%) | | | | | |
Foster Wheeler, Ltd. ‡ | | 34,700 | | 5,379 | |
Consumer Finance (0.4%) | | | | | |
American Express Co. | | 40,800 | | 2,122 | |
Diversified Financial Services (2.6%) | | | | | |
Bovespa Holding SA ‡ | | 262,400 | | 5,056 | |
CME Group, Inc. Class A | | 5,100 | | 3,499 | |
Moody’s Corp. ^ | | 118,500 | | 4,230 | |
Electrical Equipment (0.9%) | | | | | |
Schneider Electric SA | | 32,900 | | 4,458 | |
Electronic Equipment & Instruments (0.6%) | | | | | |
HON HAI Precision Industry Co., Ltd. | | 232,640 | | 2,885 | |
Energy Equipment & Services (3.6%) | | | | | |
Baker Hughes, Inc. | | 71,100 | | 5,766 | |
Schlumberger, Ltd. | | 123,500 | | 12,149 | |
Food & Staples Retailing (5.3%) | | | | | |
Costco Wholesale Corp. | | 68,400 | | $ | 4,772 | |
CVS Caremark Corp. | | 288,405 | | 11,464 | |
SYSCO Corp. | | 103,800 | | 3,240 | |
Walgreen Co. | | 89,000 | | 3,389 | |
Whole Foods Market, Inc. ^ | | 73,000 | | 2,978 | |
Food Products (0.4%) | | | | | |
Groupe Danone | | 20,800 | | 1,867 | |
Health Care Equipment & Supplies (4.7%) | | | | | |
Alcon, Inc. | | 19,800 | | 2,832 | |
Becton Dickinson & Co. | | 37,900 | | 3,168 | |
Covidien, Ltd. | | 71,800 | | 3,180 | |
Medtronic, Inc. | | 122,900 | | 6,178 | |
St Jude Medical, Inc. ‡ | | 52,900 | | 2,150 | |
Stryker Corp. ‡ | | 40,800 | | 3,049 | |
Zimmer Holdings, Inc. ‡ | | 36,000 | | 2,381 | |
Health Care Providers & Services (6.5%) | | | | | |
Aetna, Inc. | | 123,300 | | 7,118 | |
Cigna Corp. | | 51,800 | | 2,783 | |
Humana, Inc. ‡ | | 35,300 | | 2,658 | |
Laboratory Corp. of America Holdings ‡ | | 51,100 | | 3,860 | |
McKesson Corp. | | 42,100 | | 2,758 | |
Medco Health Solutions, Inc. ‡ | | 36,800 | | 3,732 | |
WellPoint, Inc. ‡ | | 102,200 | | 8,966 | |
Hotels, Restaurants & Leisure (2.9%) | | | | | |
International Game Technology | | 84,500 | | 3,712 | |
Las Vegas Sands Corp. ‡^ | | 28,200 | | 2,906 | |
Marriott International, Inc. Class A | | 62,500 | | 2,136 | |
MGM Mirage, Inc. ‡ | | 9,100 | | 765 | |
Yum! Brands, Inc. | | 123,100 | | 4,711 | |
Household Durables (0.9%) | | | | | |
Harman International Industries, Inc. | | 22,000 | | 1,622 | |
Tomtom NV ‡^ | | 36,920 | | 2,780 | |
Household Products (1.7%) | | | | | |
Procter & Gamble Co. | | 85,257 | | 6,259 | |
Reckitt Benckiser Group PLC ‡ | | 34,442 | | 1,998 | |
Independent Power Producers & Energy Traders (0.7%) | | | | | |
AES Corp. (The) ‡ | | 164,500 | | 3,519 | |
Industrial Conglomerates (4.2%) | | | | | |
General Electric Co. | | 504,200 | | 18,691 | |
McDermott International, Inc. ‡ | | 37,600 | | 2,219 | |
Insurance (1.3%) | | | | | |
Assurant, Inc. | | 35,400 | | 2,368 | |
Prudential Financial, Inc. | | 44,100 | | 4,103 | |
Internet & Catalog Retail (2.0%) | | | | | |
Amazon.Com, Inc. ‡ | | 57,900 | | 5,364 | |
B2w Com Global Do Varejo | | 27,400 | | 1,093 | |
Expedia, Inc.‡ | | 99,645 | | 3,151 | |
Internet Software & Services (4.6%) | | | | | |
Google, Inc. Class A ‡ | | 22,000 | | 15,213 | |
VeriSign, Inc.‡ | | 153,800 | | 5,784 | |
Yahoo!, Inc.‡ | | 69,700 | | 1,621 | |
The notes to the financial statements are an integral part of this report.
4
| | Shares | | Value | |
IT Services (2.9%) | | | | | |
Accenture, Ltd. Class A | | 148,300 | | $ | 5,343 | |
Automatic Data Processing, Inc. | | 116,800 | | 5,201 | |
Infosys Technologies, Ltd. | | 57,253 | | 2,569 | |
Redecard SA | | 69,400 | | 1,123 | |
Machinery (2.8%) | | | | | |
Danaher Corp. | | 112,300 | | 9,853 | |
Deere & Co. | | 24,800 | | 2,309 | |
Joy Global, Inc. | | 25,000 | | 1,646 | |
Media (2.6%) | | | | | |
EchoStar Communications | | 32,800 | | 1,237 | |
Corp. Class A ‡ | | | | | |
McGraw-Hill Cos., Inc. (The) | | 142,900 | | 6,261 | |
Nasionale Pers Beperk Class N | | 125,100 | | 2,965 | |
Shaw Communications, Inc. Class B ‡^ | | 99,000 | | 2,344 | |
Metals & Mining (1.8%) | | | | | |
BHP Billiton, Ltd. | | 168,916 | | 5,953 | |
Freeport-McMoRan Copper & Gold, Inc. | | 30,300 | | 3,104 | |
Multiline Retail (1.1%) | | | | | |
Kohl’s Corp. ‡ | | 60,900 | | 2,789 | |
Lojas Renner SA | | 54,700 | | 1,107 | |
Target Corp. | | 33,100 | | 1,655 | |
Oil, Gas & Consumable Fuels (3.5%) | | | | | |
EOG Resources, Inc. | | 38,700 | | 3,454 | |
Exxon Mobil Corp. | | 48,290 | | 4,525 | |
Murphy Oil Corp. | | 29,800 | | 2,528 | |
Total SA | | 83,525 | | 6,940 | |
Pharmaceuticals (2.4%) | | | | | |
Allergan, Inc. | | 72,300 | | 4,645 | |
Merck & Co., Inc. | | 41,900 | | 2,435 | |
Roche Holding AG | | 11,912 | | 2,059 | |
Schering-Plough Corp. | | 93,600 | | 2,493 | |
Real Estate Management & Development (0.9%) | | 164,000 | | 4,460 | |
Dlf Limited | | | | | |
Semiconductors & Semiconductor Equipment (1.5%) | | | | | |
Intel Corp. | | 94,600 | | $ | 2,522 | |
Marvell Technology Group, Ltd. ‡ | | 251,500 | | 3,516 | |
Maxim Integrated Products, Inc. | | 50,700 | | 1,343 | |
Software (5.8%) | | | | | |
Amdocs, Ltd. ‡ | | 86,200 | | 2,971 | |
CA, Inc. | | 22 | | 1 | |
Electronic Arts, Inc. ‡ | | 77,400 | | 4,521 | |
Microsoft Corp. | | 371,200 | | 13,215 | |
Nintendo Co., Ltd. | | 13,300 | | 7,809 | |
Specialty Retail (0.3%) | | | | | |
Bed Bath & Beyond, Inc. ‡^ | | 53,500 | | 1,572 | |
Thrifts & Mortgage Finance (0.6%) | | | | | |
Housing Development Finance Corp. | | 39,154 | | 2,853 | |
Trading Companies & Distributors (0.2%) | | | | | |
Fastenal Co. ^ | | 22,200 | | 897 | |
Wireless Telecommunication Services (6.6%) | | | | | |
America Movil SAB de CV Series R, Class R | | 115,300 | | 7,078 | |
American Tower Corp. Class A ‡ | | 129,200 | | 5,504 | |
Bharti Airtel, Ltd. ‡ | | 186,829 | | 4,714 | |
Crown Castle International Corp. ‡ | | 145,500 | | 6,053 | |
Idea Cellular, Ltd. ‡ | | 525,660 | | 1,867 | |
Leap Wireless International, Inc. ‡ | | 22,378 | | 1,044 | |
Metropcs Communications, Inc. ‡ | | 44,700 | | 869 | |
Rogers Communications, Inc. Class B ^ | | 121,300 | | 5,489 | |
Total Common Stocks (cost $406,445) | | | | 480,919 | |
| | | | | |
Total Securities Lending Collateral (cost $17,438) (1) | | | | 17,438 | |
| | | | | |
Total Investment Securities (cost $423,883) # | | | | $ | 498,357 | |
NOTES TO SCHEDULE OF INVESTMENTS:
^ At December 31, 2007, all or a portion of this security is on loan (see Note 1). The value at December 31, 2007,of all securities on loan is $16,835.
‡ Non-Income Producing.
(1) Cash collateral for the Repurchase Agreements, valued at $6,321, that serves as collateral for securities lending, is invested in corporate bonds with interest rates and maturity dates ranging from 3.00% - 10.18% and 04/28/2008 - 12/01/2096, respectively.
# Aggregate cost for federal income tax purposes is $424,351. Aggregate gross unrealized appreciation for all securities in which there is an excess of value over tax cost and aggregate gross unrealized depreciation for all securities in which there is an excess of tax cost over value were $88,887 and $14,881, respectively. Net unrealized appreciation for tax purposes is $74,006.
The notes to the financial statements are an integral part of this report.
5
T. Rowe Price Growth Stock
STATEMENT OF ASSETS AND LIABILITIES
At December 31, 2007
(all amounts except per share amounts in thousands)
Assets: | | | |
Investment securities, at value (cost: $423,883)
(including securities loaned of $16,835) | | $ | 498,357 | |
Cash | | 11,552 | |
Receivables: | | | |
Investment securities sold | | 885 | |
Shares sold | | 142 | |
Interest | | 38 | |
Income from loaned securities | | 5 | |
Dividends | | 376 | |
Dividend reclaims | | 42 | |
| | 511,397 | |
Liabilities: | | | |
Investment securities purchased | | 1 ,378 | |
Accounts payable and accrued liabilities: | | | |
Shares redeemed | | 205 | |
Management and advisory fees | | 328 | |
Distribution and service fees | | 2 | |
Deferred foreign taxes | | 280 | |
Administration fees | | 8 | |
Payable for collateral for securities on loan | | 17,438 | |
Other | | 85 | |
| | 19,724 | |
Net Assets | | $ | 491,673 | |
| | | |
Net Assets Consist of: | | $ | 192 | |
Capital Stock ($.01 par value) | | | |
Additional paid-in capital | | 389,280 | |
Undistributed (accumulated) net investment income | | 2,004 | |
Undistributed (accumulated) net realized gain from investment securities and foreign currrency transactions | | 25,999 | |
Net unrealized appreciation on investment securities | | 74,194 | |
Translation of assets and liabilities denominated in foreign currencies | | 4 | |
Net Assets | | $ | 491,673 | |
Net Assets by Class: | | | |
Initial Class | | $ | 484,693 | |
Service Class | | 6,980 | |
Shares Outstanding: | | | |
Initial Class | | 18,904 | |
Service Class | | 274 | |
Net Asset Value and Offering Price Per Share: | | | |
Initial Class | | $ | 25.64 | |
Service Class | | 25.46 | |
STATEMENT OF OPERATIONS
For the year ended December 31, 2007
(all amounts in thousands)
Investment Income: | | | |
Dividends (net of withholding taxes on foreign dividends of $167) | | $ | 5,685 | |
Interest | | 493 | |
Income from loaned securities-net | | 95 | |
| | 6,273 | |
| | | |
Expenses: | | | |
Management and advisory fees | | 3,750 | |
Printing and shareholder reports | | 30 | |
Custody fees | | 144 | |
Administration fees | | 96 | |
Legal fees | | 10 | |
Audit fees | | 26 | |
Trustees fees | | 16 | |
Distribution and service fees: | | | |
Service Class | | 17 | |
Other | | 6 | |
Total expenses | | 4,095 | |
| | | |
Net Investment Income | | 2,178 | |
| | | |
Net Realized Gain (Loss) from: | | | |
Investment securities | | 27,279 | |
Foreign currency transactions | | (435 | ) |
| | 26,844 | |
| | | |
Net Increase (Decrease) in Unrealized Appreciation (Depreciation) on: | | | |
Investment securities (Net of foreign capital gains tax of $280) | | 13,027 | |
Translation of assets and liabilities denominated in foreign currencies | | 2 | |
| | 13,029 | |
| | | |
Net Realized and Unrealized Gain: | | 39,873 | |
Net Increase In Net Assets Resulting from Operations | | $ | 42,051 | |
The notes to the financial statements are an integral part of this report.
6
T. Rowe Price Growth Stock
STATEMENTS OF CHANGES IN NET ASSETS
For the years ended
(all amounts in thousands)
| | December 31,
2007 | | December 31,
2006 | |
Increase (Decrease) in Net Assets From: | | | | | |
Operations: | | | | | |
Net investment income | | $ | 2,178 | | $ | 1,334 | |
Net realized gain from investment securities and foreign currency transactions | | 26,844 | | 26,761 | |
Change in unrealized appreciation on investment securities and foreign currency translation | | 13,029 | | 9,270 | |
| | 42,051 | | 37,365 | |
Distributions to Shareholders: | | | | | |
From net investment income: | | | | | |
Initial Class | | (1,274 | ) | (673 | ) |
Service Class | | (7 | ) | (2 | ) |
| | (1,281 | ) | (675 | ) |
From net realized gains: | | | | | |
Initial Class | | (25,860 | ) | (11,565 | ) |
Service Class | | (382 | ) | (205 | ) |
| | (26,242 | ) | (11,770 | ) |
Capital Share Transactions: | | | | | |
Proceeds from shares sold: | | | | | |
Initial Class | | 208,999 | | 21,703 | |
Service Class | | 2,318 | | 1,908 | |
| | 211,317 | | 23,611 | |
Dividends and distributions reinvested: | | | | | |
Initial Class | | 27,134 | | 12,238 | |
Service Class | | 389 | | 207 | |
| | 27,523 | | 12,445 | |
Cost of shares redeemed: | | | | | |
Initial Class | | (72,601 | ) | (63,551 | ) |
Service Class | | (1,637 | ) | (1,026 | ) |
| | (74,238 | ) | (64,577 | ) |
| | 164,602 | | (28,521 | ) |
Net increase (decrease) in net assets | | 179,130 | | (3,601 | ) |
| | | | | |
Net Assets: | | | | | |
Beginning of year | | 312,543 | | 316,144 | |
End of year | | $ | 491,673 | | $ | 312,543 | |
Undistributed (Accumulated) Net Investment Income (Loss) | | $ | 2,004 | | $ | 1,199 | |
Share Activity: | | | | | |
Shares issued: | | | | | |
Initial Class | | 8,235 | | 902 | |
Service Class | | 90 | | 82 | |
| | 8,325 | | 984 | |
Shares issued-reinvested from distributions: | | | | | |
Initial Class | | 1,107 | | 551 | |
Service Class | | 16 | | 9 | |
| | 1,123 | | 560 | |
Shares redeemed: | | | | | |
Initial Class | | (2,822 | ) | (2,720 | ) |
Service Class | | (65 | ) | (44 | ) |
| | (2,887 | ) | (2,764 | ) |
Net increase (decrease) in shares outstanding: | | | | | |
Initial Class | | 6,520 | | (1,267 | ) |
Service Class | | 41 | | 47 | |
| | 6,561 | | (1,220 | ) |
The notes to the financial statements are an integral part of this report.
7
T. Rowe Price Growth Stock
FINANCIAL HIGHLIGHTS
For a share outstanding throughout each period(a)
| | Initial Class | |
| | Year Ended December 31, | |
| | 2007 | | 2006 | | 2005 | | 2004 | | 2003 | |
| | | | | | | | | | | |
Net Asset Value | | | | | | | | | | | |
Beginning of period | | $ | 24.77 | | $ | 22.85 | | $ | 21.63 | | $ | 19.72 | | $ | 15.09 | |
Investment Operations | | | | | | | | | | | |
Net investment income (loss) | | 0.12 | | 0.10 | | 0.06 | | 0.11 | | 0.03 | |
Net realized and unrealized gain (loss) | | 2.26 | | 2.84 | | 1.27 | | 1.83 | | 4.61 | |
Total operations | | 2.38 | | 2.94 | | 1.33 | | 1.94 | | 4.64 | |
Distributions | | | | | | | | | | | |
From net investment income | | (0.07 | ) | (0.06 | ) | (0.11 | ) | (0.03 | ) | (0.01 | ) |
From net realized gains | | (1.44 | ) | (0.96 | ) | — | | — | | — | |
Total distributions | | (1.51 | ) | (1.02 | ) | (0.11 | ) | (0.03 | ) | (0.01 | ) |
Net Asset Value | | | | | | | | | | | |
End of period(b) | | $ | 25.64 | | $ | 24.77 | | $ | 22.85 | | $ | 21.63 | | $ | 19.72 | |
Total Return(c),(d) | | 9 .91 | % | 13.38 | % | 6.16 | % | 9.86 | % | 30 .76 | % |
Net Assets End of Period (000’s) | | $ | 484,693 | | $ | 306,805 | | $ | 311,913 | | $ | 333,533 | | $ | 325,035 | |
Ratio and Supplemental Data | | | | | | | | | | | |
Expenses to average net assets(e) | | 0 .85 | % | 0.87 | % | 0.86 | % | 0.84 | % | 0 .84 | % |
Net investment income (loss), to average net assets(e) | | 0 .46 | % | 0.45 | % | 0.26 | % | 0.53 | % | 0 .20 | % |
Portfolio turnover rate(d) | | 56 | % | 42 | % | 38 | % | 38 | % | 38 | % |
For a share outstanding throughout each period(a)
| | Service Class | |
| | Year Ended December 31, | | May 1 to Dec | |
| | 2007 | | 2006 | | 2005 | | 2004 | | 31, 2003 | |
| | | | | | | | | | | |
Net Asset Value | | | | | | | | | | | |
Beginning of period | | $ | 24.63 | | $ | 22.73 | | $ | 21.55 | | $ | 19.70 | | $ | 16.08 | |
Investment Operations | | | | | | | | | | | |
Net investment income (loss) | | 0.05 | | 0.04 | | — | (f) | 0.09 | | — | (f) |
Net realized and unrealized gain (loss) | | 2.25 | | 2.83 | | 1.27 | | 1.79 | | 3.62 | |
Total operations | | 2.30 | | 2.87 | | 1.27 | | 1.88 | | 3.62 | |
Distributions | | | | | | | | | | | |
From net investment income | | (0.03 | ) | (0.01 | ) | (0.09 | ) | (0.03 | ) | — | |
From net realized gains | | (1.44 | ) | (0.96 | ) | — | | — | | — | |
Total distributions | | (1.47 | ) | (0.97 | ) | (0.09 | ) | (0.03 | ) | — | |
Net Asset Value | | | | | | | | | | | |
End of period(b) | | $ | 25.46 | | $ | 24.63 | | $ | 22.73 | | $ | 21.55 | | $ | 19.70 | |
Total Return(c),(d) | | 9 .61 | % | 13.14 | % | 5.90 | % | 9.56 | % | 22 .51 | % |
Net Assets End of Period (000’s) | | $ | 6,980 | | $ | 5,738 | | $ | 4,231 | | $ | 2,966 | | $ | 678 | |
Ratio and Supplemental Data | | | | | | | | | | | |
Expenses to average net assets(e) | | 1 .10 | % | 1.12 | % | 1.11 | % | 1.10 | % | 1 .12 | % |
Net investment income (loss), to average net assets(e) | | 0 .19 | % | 0.18 | % | — | (f)% | 0.47 | % | 0 .01 | % |
Portfolio turnover rate(d) | | 56 | % | 42 | % | 38 | % | 38 | % | 38 | % |
| | | | | | | | | | | | | | | | | | | |
(a) | | Per share information is calculated based on average number of shares outstanding. |
(b) | | T. Rowe Price Growth Stock (the “fund”) share class commenced operations as follows: |
| | Initial Class - January 3, 1995 |
| | Service Class - May 1, 2003 |
(c) | | Total Return reflects all portfolio expenses and includes reinvestment of dividends and capital gains; it does not reflect the charges and deductions under the policies or annuity contracts. |
(d) | | Not Annualized. |
(e) | | Annualized. |
(f) | | Rounds to less than $0.01 or 0.01%. |
The notes to the financial statements are an integral part of this report.
8
T. Rowe Price Growth Stock
NOTES TO FINANCIAL STATEMENTS
At December 31, 2007
(all amounts in thousands)
NOTE 1. ORGANIZATION AND SIGNIFICANT ACCOUNTING POLICIES
AEGON/Transamerica Series Trust (“ATST”) is an open-end management investment company registered under the Investment Company Act of 1940, as amended (the “1940 Act”). ATST serves as a funding vehicle for variable life insurance, variable annuity and group annuity products. T. Rowe Price Growth Stock (the “Fund”) is part of ATST.
In the normal course of business, the Fund enters into contracts that contain a variety of representations that provide general indemnifications. The Fund’s maximum exposure under these arrangements is unknown, as this would involve future claims that may be made against the Fund and/or its affiliates that have not yet occurred. However, based on experience, the Fund expects the risk of loss to be remote.
This report should be read in conjunction with the current Fund prospectus, which contains more complete information about the Fund.
In preparing the Fund’s financial statements in accordance with accounting principles generally accepted in the United States of America (“GAAP”), estimates or assumptions (which could differ from actual results) may be used that affect reported amounts and disclosures. The following is a summary of significant accounting policies followed by the Fund.
Multiple class operations, income and expenses: The Fund currently offers two classes of shares, an Initial Class and a Service Class. Income, non-class specific expenses and realized and unrealized gains and losses, are allocated daily to each class, based upon the value of shares outstanding method as permitted under Rule 18f-3 of the 1940 Act. Each class bears its own specific expenses as well as a portion of general, common expenses.
Security valuations: The Fund values its investments at the close of the New York Stock Exchange (“NYSE”), normally 4 p.m. ET, each day the NYSE is open for business. Fund investments are valued at the last sale price or closing price on the day of valuation taken from the primary exchange where the security is principally traded.
Securities traded in the over-the-counter market and listed securities for which no sale was reported on that date are valued at the last quoted bid price.
Debt securities are valued based on a price quotation or other equivalent indication of value supplied by an exchange, a pricing service or a major market maker; however, those that mature in sixty days or less are valued at amortized cost, which approximates market.
Investment company securities are valued at the net asset value of the underlying portfolio.
Foreign securities generally are valued based on quotations from the primary market in which they are traded. Because many foreign securities markets and exchanges close prior to the close of the NYSE, closing prices for foreign securities in those markets or on those exchanges do not reflect the events that occur after that close. If a significant market event impacting the value of a portfolio security (e.g., natural disaster, company announcement, market volatility) occurs subsequent to the close of trading in the security, but prior to the calculation of the Fund’s net asset value per share, market quotations for that security may be determined to be unreliable and, accordingly, not “readily available”. As a result, foreign equity securities held by the Fund may be valued at fair market value as determined in good faith by the Fund’s Administrative Valuation Committee, using guidelines adopted by the Board of Trustees.
Other securities for which quotations are not readily available are valued at fair market value as determined in good faith by the Fund’s Administrative Valuation Committee, using guidelines adopted by the Board of Trustees.
Cash: The Fund may leave cash overnight in its cash account with the custodian, State Street Bank & Trust Company (“State Street”). On July 2, 2007, State Street acquired the parent company of Investors Bank & Trust Company. State Street has been contracted on behalf of the Fund to invest the excess cash into a savings account, which at December 31, 2007 was paying an interest rate of 2.60%.
Repurchase agreements: The Fund is authorized to enter into repurchase agreements. The Fund, through its custodian, State Street, receives delivery of the underlying securities, the value of which at the time of purchase is required to be an amount equal to at least 100% of the resale price. The Fund will bear the risk of value fluctuations until the security can be sold and may encounter delays and incur costs in liquidating the security. In the event of bankruptcy or insolvency of the seller, delays and costs may be incurred.
Commission recapture: The sub-adviser, to the extent consistent with the best execution and usual commission rate policies and practices, may place security transactions of the Fund with broker/dealers with which ATST has established a Commission Recapture Program. A Commission Recapture Program is any arrangement under which a broker/dealer applies a portion of the commissions received by such broker/dealer on the security transactions to the Fund. In no event will commissions paid by the Fund be used to pay expenses that would otherwise be borne by any other funds within ATST, or by any other party.
Recaptured commissions during the year ended December 31, 2007 of $14 are included in net realized gain in the Statement of Operations.
9
NOTES TO FINANCIAL STATEMENTS (continued)
At December 31, 2007
(all amounts in thousands)
NOTE 1.–(continued)
Securities lending: The Fund may lend securities to qualified borrowers, with State Street acting as the Fund’s lending agent. The Fund earns negotiated lenders’ fees. The Fund receives cash and/or securities as collateral against the loaned securities. Cash collateral received is invested in short-term, interest-bearing securities. The Fund monitors the market value of securities loaned on a daily basis and requires collateral in an amount at least equal to the value of the securities loaned. Income from loaned securities earned by State Street for its services, shown in the Statement of Operations is net of fees, in the amount of $41.
The Fund has invested the cash collateral received from securities loaned in the following short-term, interest-bearing securities:
Abbey National PLC, Eurodollar Term, 5.00%, 1/7/2008 | | $ | 753 | |
ABN AMRO Bank NV, Eurodollar Term, 5.18%, 1/4/2008 | | 602 | |
Bank of Nova Scotia, Eurodollar Term, 4.96%, 1/22/2008 | | 527 | |
Barclays, Eurodollar Term, 5.00%, 2/12/2008 | | 1,054 | |
BNP Paribas, Eurodollar Term, 5.01%, 1/11/2008 | | 979 | |
Calyon, Eurodollar Term, 5.12%, 3/3/2008 | | 226 | |
Credit Suisse First Boston Corp., Repurchase Agreement, 4.60%, 1/2/2008 | | 1,957 | |
Dexia Group, Eurodollar Term, 4.82%, 1/3/2008 | | 753 | |
HBOS Halifax Bank of Scotland, Eurodollar Term, 5.15%, 1/2/2008 | | 376 | |
JPMorgan Chase & Co., Eurodollar Term, 5.15%, 2/12/2008 | | 376 | |
Lloyds TSB Bank, Eurodollar Term, 5.15%, 1/24/2008 | | 753 | |
Merrill Lynch & Co. (RPG), Repurchase Agreement, 4.60%, 1/2/2008 | | 1,129 | |
Morgan Stanley & Co. (Corp. Repo), Repurchase Agreement, 4.60%, 1/2/2008 | | 3,086 | |
Rabobank Nederland, Eurodollar Term, 5.08%, 1/10/2008 | | 903 | |
Reserve Primary Money Market Fund, 4.95% | | 803 | |
Royal Bank of Scotland, Eurodollar Term, 5.00%, 2/25/2008 | | 903 | |
Societe Generale, Eurodollar Term, 5.15%, 3/3/2008 | | 452 | |
Toronto Dominion Bank, Eurodollar Term, 5.05%, 1/10/2008 | | 903 | |
UBS AG, Eurodollar Term, 4.92%, 1/11/2008 | | 527 | |
Wells Fargo, Bank Note, 4.75%, 1/8/2008 | | 376 | |
| | | |
| | $ | 17,438 | |
Security transactions and investment income: Security transactions are recorded on the trade date. Security gains and losses are calculated on the first-in, first-out basis. Dividend income, if any, is recorded on the ex-dividend date or, in the case of foreign securities, as soon as the Fund is informed of the ex-dividend date. Interest income, including accretion of discounts and amortization of premiums, is recorded on the accrual basis commencing on the settlement date.
Foreign currency denominated investments: The accounting records of the Funds are maintained in U.S. dollars. Securities and other assets and liabilities denominated in foreign currencies are translated into U.S. dollars at the closing exchange rate each day. The cost of foreign securities is translated at the exchange rate in effect when the investment was acquired. The Funds combine fluctuations from currency exchange rates and fluctuations in value when computing net realized and unrealized gains or losses from investments.
Net foreign currency gains and losses resulting from changes in exchange rates include: 1) foreign currency fluctuations between trade date and settlement date of investment security transactions; 2) gains and losses on forward foreign currency contracts; and 3) the difference between the receivable amounts of interest and dividends recorded in the accounting records in U.S. dollars and the amounts actually received.
Foreign currency denominated assets may involve risks not typically associated with domestic transactions. These risks include revaluation of currencies, adverse fluctuations in foreign currency values and possible adverse political, social and economic developments, including those particular to a specific industry, country or region.
Foreign capital gains taxes: The Fund may be subject to taxes imposed by countries in which it invests, with respect to its investment in issuers existing or operating in such countries. Such taxes are generally based on income earned or repatriated and capital gains realized on the sale of such investments. The Fund accrues such taxes when the related income or capital gains are earned. Some countries require governmental approval for the repatriation of investment income, capital or the proceeds of sales earned by foreign investors. In addition, if there is deterioration in a country’s balance of payments or for other reasons, a country may impose temporary restrictions on foreign capital remittances abroad.
Dividend distributions: Dividends and capital gains distributions are typically declared and reinvested annually and are generally paid and reinvested on the business day following the ex-date.
NOTE 2. RELATED PARTY TRANSACTIONS
ATST serves as a funding vehicle for certain affiliated asset allocation portfolios and certain affiliated separate accounts of Western Reserve Life Assurance Co. of Ohio, Transamerica Life Insurance Company, Transamerica Financial Life Insurance Company, Inc., Monumental Life Insurance Company and Transamerica Occidental Life Insurance Company.
Transamerica Fund Advisors, Inc. (“TFAI”) is the Fund’s investment adviser. Transamerica Fund Services, Inc. (“TFS”) is the Fund’s administrator and transfer agent. Prior to May 1, 2007, AFSG Securities Corp. (“AFSG”), was the Fund’s distributor. Transamerica Capital, Inc. (“TCI”) is now the Fund’s distributor. TFAI, TFS, AFSG, and TCI are affiliates of AEGON NV, a Netherlands corporation.
Certain officers and trustees of the Fund are also officers and/or directors of TFAI, TFS and TCI.
10
NOTES TO FINANCIAL STATEMENTS (continued)
At December 31, 2007
(all amounts in thousands)
NOTE 2.–(continued)
The following schedule reflects the percentage of Fund assets owned by affiliated investment companies at December 31, 2007:
| | Net
Assets | | % of Net
Assets | |
| | | | | |
Asset Allocation-Conservative Portfolio | | $ | 11,110 | | 2.26 | % |
Asset Allocation-Growth Portfolio | | 42,454 | | 8.64 | |
Asset Allocation-Moderate Growth Portfolio | | 120,611 | | 24.53 | |
Asset Allocation-Moderate Portfolio | | 50,557 | | 10.28 | |
| | | | | |
Total | | $ | 224,732 | | 45.71 | % |
Investment advisory fee: The Fund pays management fees to TFAI based on average daily net assets (“ANA”) at the following breakpoints:
0.80% of the first $250 million of ANA
0.775% of ANA over $250 million
TFAI has contractually agreed to waive its advisory fee and will reimburse the Fund to the extent that operating expenses, excluding 12b-1 fees, exceed the following stated annual limit:
0.89% Expense Limit
If total Fund expenses fall below the annual expense limitation agreement agreed to by the adviser within the succeeding three years, the Fund may be required to pay the adviser a portion or all of the waived advisory fees.
There were no amounts recaptured during the year ended December 31, 2007. There are no amounts available for recapture at December 31, 2007.
The sub-adviser, T. Rowe Price, has agreed to a pricing discount based on aggregate assets that it manages in ATST. The amount of the discount received by the Fund at December 31, 2007 was $20.
Distribution and service fees: ATST entered into a Distribution Agreement with AFSG dated January 1, 1997, as amended. On May 1, 2007, the Distribution Agreement was amended to replace AFSG with TCI as the Fund’s distributor.
The Fund has also adopted a distribution plan (“Distribution Plan”) pursuant to Rule 12b-1 under the 1940 Act.
Under the Distribution Plan for the Initial Class shares, TCI, on behalf of the Fund, is authorized to pay various service providers, as direct payment for expenses incurred in connection with distribution of the Fund’s shares, amounts equal to actual expenses associated with distributing the shares.
The Distribution Plan for the Service Class shares requires ATST to pay distribution fees to TCI as compensation for its activities, not as reimbursement for specific expenses. The fee on the Service Class is paid to the insurance companies for providing services and account maintenance for their policyholders who invest in the variable insurance products which invest in the Service Class shares.
The Fund is authorized under the Distribution Plan to pay fees on each class up to the following limits:
Initial Class | | 0.15 | % |
Service Class | | 0.25 | % |
TCI has determined that it will not seek payment by the Fund of the distribution expenses incurred with respect to the Initial Class shares before April 30, 2009. Prior to TCI seeking reimbursement of future expenses, policy and contract owners will be notified in advance. The Fund will pay fees relating to Service Class shares.
Administrative services: The Fund has entered into an agreement with TFS for financial and legal fund administration services. The Fund pays TFS an annual fee of 0.02% of ANA. The Legal fees on the Statement of Operations are for fees paid to external legal counsel.
Deferred compensation plan: Each eligible independent Fund Trustee may elect participation in a non-qualified deferred compensation plan (“the Plan”). Under the Plan, such Trustees may defer payment of all or a portion of their total fees earned as a Fund Trustee. Each Trustee who is a participant in the Plan may elect that the earnings, losses or gains credited to his or her deferred fee amounts be determined based on a deemed investment in any series of Transamerica IDEX Mutual Funds. The right of a participant to receive a distribution from the Plan of the deferred fees is an unsecured claim against the general assets of all series of Transamerica IDEX Mutual Funds. The pro rata liability to the Fund of all deferred fees in the Plan amounted, as of December 31, 2007, to $24. Amounts deferred under the Plan are unfunded against the general assets of ATST.
Retirement plan: Under a retirement plan (the “Emeritus Plan”) available to the Independent Trustees, each Independent Trustee is deemed to have elected to serve as Trustee Emeritus of ATST upon his or her termination of service, other than removal for cause, and is entitled to 50% of the trustee’s current retainer for a maximum period of five years determined by his or her years of service as a Trustee.
Such amounts shall be accrued by ATST on a pro rata basis allocable to each series of ATST fund based on the relative assets of the series. If retainers increase in the future, past accruals (and credits) will be adjusted upward so that 50% of the Trustee’s current retainer is accrued and credited at all times. Upon death, disability or termination of service, other than removal for cause, amounts deferred become payable to a Trustee Emeritus (or his/her beneficiary). Upon the commencement of service as Trustee Emeritus, compensation will be paid on a quarterly basis during the time period that the Trustee Emeritus is allowed to serve as such.
11
NOTES TO FINANCIAL STATEMENTS (continued)
At December 31, 2007
(all amounts in thousands)
NOTE 2.–(continued)
Amounts accrued under the Emeritus Plan are unsecured claims against the general assets of ATST. For the year ended December 31, 2007, the amount related to the Emeritus Plan was $12. As of December 31, 2007, the Fund has not made any payments related to the Emeritus Plan.
The Emeritus Plan was terminated effective October 30, 2007. Upon the termination, the Fund shall continue to pay any remaining benefits in accordance with the Plan, but no further compensation shall accrue under the Plan.
NOTE 3. INVESTMENT TRANSACTIONS
The cost of securities purchased and proceeds from securities sold (excluding short-term securities) for the year ended December 31, 2007 were as follows:
Purchases of securities: | | | |
Long-term | | $ | 398,010 | |
U.S. Government | | — | |
Proceeds from maturities and sales of securities: | | | |
Long-term | | 259,434 | |
U.S. Government | | — | |
| | | | |
NOTE 4. FEDERAL INCOME TAX MATTERS
The Fund has not made any provision for federal income or excise taxes due to its policy to distribute all of its taxable income and capital gains to its shareholders and otherwise qualify as a regulated investment company under Subchapter M of the Internal Revenue Code. Income and capital gain distributions are determined in accordance with income tax regulations, which may differ from GAAP. These differences are primarily due to differing treatment for items including, but not limited to, wash sales, foreign currency transactions and post October loss deferrals.
Therefore, distributions determined in accordance with tax regulations may differ significantly in amount or character from net investment income and realized gains for financial reporting purposes. Financial reporting records are adjusted for permanent book/tax differences to reflect tax character. Financial records are not adjusted for temporary differences. These reclassifications are as follows:
Additional paid-in capital | | $ | (1 | ) |
Undistributed (accumulated) net investment income (loss) | | $ | (92 | ) |
Undistributed (accumulated) net realized gain (loss) from investment securities | | $ | 93 | |
The tax character of distributions paid may differ from the character of distributions shown in the Statements of Changes in Net Assets due to short-term gains being treated as ordinary income for tax purposes. The tax character of distributions paid during 2006 and 2007 was as follows:
2006 Distributions paid from: | | | |
Ordinary Income | | $ | 1,558 | |
Long-term Capital Gain | | 10,887 | |
| | | |
2007 Distributions paid from: | | | |
Ordinary Income | | 5,123 | |
Long-term Capital Gain | | 22,400 | |
| | | | |
The tax basis components of distributable earnings as of December 31, 2007 are as follows:
Undistributed Ordinary Income | | $ | 3,272 | |
Undistributed Long-term Capital Gain | | $ | 25,362 | |
Capital Loss Carryforward | | $ | — | |
Post October Capital Loss Deferral | | $ | — | |
Post October Currency Loss Deferral | | $ | (163 | ) |
Net Unrealized Appreciation (Depreciation) | | $ | 73,730 | * |
*Amount includes unrealized appreciation (depreciation) on foreign currency denominated assets and liabilities.
NOTE 5. REGULATORY PROCEEDINGS
There continues to be significant federal and state regulatory activity relating to financial services companies, particularly mutual fund companies and their investment advisers. As part of an ongoing investigation regarding potential market timing, recordkeeping and trading compliance issues and matters affecting the Fund’s investment adviser, TFAI, and certain affiliates and former employees of TFAI, the SEC staff has indicated that it is likely to take some action against TFAI and certain of its affiliates at the conclusion of the investigation. The potential timing and the scope of any such action is difficult to predict. Although the impact of any action brought against TFAI and/or its affiliates is difficult to assess at the present time, the Fund currently believes that the likelihood that any such action will have a material adverse impact on it is remote. It is important to note that the Fund is not aware of any allegation of wrong doing against it and its Board at the time this annual report is printed. Although it is not anticipated that these developments will have an adverse impact on the Fund, there can be no assurance at this time. TFAI and its affiliates are actively working with the SEC in regard to this matter; however, the exact resolution cannot be determined at this time. TFAI will take such actions that it deems necessary or appropriate to continue providing management services to the Fund and to bring all matters to an appropriate conclusion.
TFAI and/or its affiliates, and not the Fund, will bear the costs regarding these regulatory matters.
12
NOTES TO FINANCIAL STATEMENTS (continued)
At December 31, 2007
(all amounts in thousands)
NOTE 6. RECENTLY ISSUED ACCOUNTING PRONOUNCEMENTS
In July 2006, the Financial Accounting Standards Board (“FASB”) released FASB Interpretation No. 48 “Accounting for Uncertainty in Income Taxes” (“FIN 48”), an interpretation of FASB Statement No. 109. FIN 48 provides guidance for how uncertain tax positions should be recognized, measured, presented and disclosed in the financial statements. FIN 48 requires the accounting and disclosure of tax positions taken or expected to be taken in the course of preparing the Fund’s tax returns to determine whether the tax positions are “more-likely-than-not” of being sustained by the applicable tax authority. Tax positions not deemed to meet the more-likely-than-not threshold would be recorded as a tax benefit or expense in the current year.
Adoption of FIN 48 is effective during the first required financial reporting period for fiscal years beginning after December 15, 2006. Management adopted FIN 48 on June 29, 2007.
Implementation of FIN 48 requires Management of the Fund to analyze all open tax years, as defined by the Statute of Limitations, for all major jurisdictions, which includes federal and certain states. Open tax years are those that are open for exam by taxing authorities (i.e., the last 4 tax year ends and the interim tax period since then). The Fund has no examinations in progress and none are expected at this time.
Management of the Fund has reviewed all open tax years and major jurisdictions and concluded the adoption of FIN 48 resulted in no impact to the Fund’s net assets or results of operations. There is no tax liability resulting from unrecognized tax benefits relating to uncertain income tax positions taken or expected to be taken in future tax returns. The Fund is also not aware of any tax positions for which it is reasonably possible that the total amounts of unrecognized tax benefits will significantly change in the next 12 months.
In September 2006, FASB issued its new Standard No. 157, “Fair Value Measurements” (“FAS 157”). FAS 157 is designed to unify guidance for the measurement of fair value of all types of assets, including financial instruments, and certain liabilities, throughout a number of accounting standards. FAS 157 also establishes a hierarchy for measuring fair value in generally accepted accounting principles and expands financial statement disclosures about fair value measurements that are relevant to mutual funds. FAS 157 is effective for financial statements issued for fiscal years beginning after November 15, 2007, and earlier application is permitted.
As of December 31, 2007, Management does not expect the adoption of FAS 157 to impact the amounts reported in the financial statements, however, additional disclosures will be required about the inputs used to develop the measurements of fair value and the effect of certain of the measurements reported in the statement of operations for a fiscal period.
NOTE 7. SUBSEQUENT EVENT
Effective January 1, 2008, TFAI changed its name to Transamerica Asset Management, Inc.
Effective May 1, 2008, AEGON/Transamerica Series Trust will change its name to Transamerica Series Trust. At that time, the Fund will also change its name to Transamerica T. Rowe Price Growth Stock VP.
13
Report of Independent Registered Certified Public Accounting Firm
To the Board of Trustees and Shareholders of
T. Rowe Price Growth Stock:
In our opinion, the accompanying statement of assets and liabilities, including the schedule of investments, and the related statements of operations and of changes in net assets and the financial highlights present fairly, in all material respects, the financial position of T. Rowe Price Growth Stock (the “Fund”) (one of the portfolios constituting AEGON/Transamerica Series Trust) at December 31, 2007, the results of its operations for the year then ended, the changes in its net assets for each of the two years in the period then ended and the financial highlights for each of the periods presented, in conformity with accounting principles generally accepted in the United States of America. These financial statements and financial highlights (hereafter referred to as “financial statements”) are the responsibility of the Fund’s management; our responsibility is to express an opinion on these financial statements based on our audits. We conducted our audits of these financial statements in accordance with the standards of the Public Company Accounting Oversight Board (United States). Those standards require that we plan and perform the audit to obtain reasonable assurance about whether the financial statements are free of material misstatement. An audit includes examining, on a test basis, evidence supporting the amounts and disclosures in the financial statements, assessing the accounting principles used and significant estimates made by management, and evaluating the overall financial statement presentation. We believe that our audits, which included confirmation of securities at December 31, 2007 by correspondence with the custodian and brokers, provide a reasonable basis for our opinion.

Tampa, Florida
February 29, 2008
14
T. Rowe Price Growth Stock
SUPPLEMENTAL TAX INFORMATION (unaudited)
(all amounts in thousands)
For tax purposes, the Fund has made a Long-Term Capital Gain Designation of $22,400 for the year ended December 31, 2007.
RESULTS OF SHAREHOLDER PROXY (unaudited)
At a special meeting of shareholders held on October 30, 2007, the results of the Proposals were as follows:
Proposal 1: To elect a new Board:
Proposed
Trustee | | For | | Against | | Abstentions/Broker Non-
Votes | |
John K. Carter | | 2,274,998,840.817 | | 57,804,698.755 | | 35,433.883 | |
| | | | | | | |
Leo J. Hill | | 2,277,212,702.754 | | 55,590,836.819 | | 35,433.883 | |
| | | | | | | |
Neal M. Jewell | | 2,266,793,295.663 | | 66,010,243.909 | | 35,433.883 | |
| | | | | | | |
Russell A. Kimball, Jr. | | 2,274,825,235.835 | | 57,978,303.737 | | 35,433.883 | |
| | | | | | | |
Eugene M. Mannella | | 2,274,623,165.033 | | 58,180,374.539 | | 35,433.883 | |
| | | | | | | |
Norm R. Nielsen | | 2,275,050,055.885 | | 57,753,483.687 | | 35,433.883 | |
| | | | | | | |
Joyce Galpern Norden | | 2,270,278,122.250 | | 62,525,417.323 | | 35,433.883 | |
| | | | | | | |
Patricia L. Sawyer | | 2,275,737,737.456 | | 57,065,802.116 | | 35,433.883 | |
| | | | | | | |
John W. Waechter | | 2,276,615,120.140 | | 56,188,419.433 | | 35,433.883 | |
Proposal 2: To approve an amendment to the Agreement and Declaration of Trust:
| | | | Abstentions/Broker Non- | |
For | | Against | | Votes | |
2,182,022,669.110 | | 77,590,048.544 | | 73,226,255.801 | |
15
T. Rowe Price Growth Stock
INVESTMENT ADVISORY AND SUB-ADVISORY AGREEMENTS-REVIEW AND RENEWAL (unaudited)
At a meeting of the Board of Trustees of AEGON/Transamerica Series Trust (“ATST”) held on December 4th, 2007, the Board reviewed and considered the renewal of the investment advisory agreement (the “Investment Advisory Agreement”) between T. Rowe Price Growth Stock (the “Fund”) and Transamerica Fund Advisors, Inc. (“TFAI”), as well as the renewal of the investment sub-advisory agreement (the “Sub-Advisory Agreement”) of the Fund between TFAI and T. Rowe Price Associates, Inc. (the “Sub-Adviser”), to determine whether the agreements should be renewed for a six-month period. It was noted that this review was interim in nature to align all the Funds on the same calendar, and that the Funds’ advisory arrangements would be reviewed again in the first half of 2008.
Following their review and consideration, the Trustees determined that the renewal of the Investment Advisory Agreement and the Sub-Advisory Agreement would enable shareholders of the Fund to obtain high quality services at a cost that is appropriate, fair, and in the best interests of its shareholders. The Board, including the independent members of the Board, unanimously approved the renewal of the Investment Advisory Agreement and Sub-Advisory Agreement. In reaching their decision, the Trustees requested and obtained from TFAI and the Sub-Adviser such information as they deemed reasonably necessary to evaluate the agreements, including information about fees and performance of comparable funds managed by the Sub-Adviser. The Trustees also carefully considered information they had previously received from TFAI and the Sub-Adviser throughout the year as part of their regular oversight of the Fund, as well as comparative fee, expense, and performance information prepared by Lipper Inc. (“Lipper”), an independent provider of mutual fund performance, fee and expense information and profitability data prepared by management. In considering the proposed continuation of the Investment Advisory and Sub-Advisory Agreements, the Trustees evaluated a number of considerations that they believed, in light of the legal advice furnished to them by independent legal counsel and their own business judgment, to be relevant. They based their decisions on a variety of factors, including the following considerations, among others, although they did not identify any consideration or particular information that was controlling of their decisions:
The nature, extent and quality of the advisory services to be provided. The Board considered the nature and quality of the services provided by TFAI and the Sub-Adviser to the Fund in the past, as well as the services anticipated to be provided in the future. The Board concluded that TFAI and the Sub-Adviser are capable of providing high quality services to the Fund, as indicated by the nature and quality of services provided in the past by TFAI and the Sub-Adviser for this series and the experience, capability and integrity of TFAI’s senior management, the financial resources of TFAI and the Sub-Adviser, TFAI’s management oversight process and the professional qualifications of the portfolio management team of the Sub-Adviser. The Trustees determined that TFAI and the Sub-Adviser can provide investment and related services that are appropriate in scope and extent in light of the Fund’s operations, the competitive landscape of the investment company business and investor needs.
The investment performance of the Fund. The Board examined the short and longer-term performance of the Fund, including relative performance against a peer universe of comparable mutual funds as prepared by Lipper for various trailing periods ended June 30, 2007. The Trustees noted that the Fund’s performance was consistently strong compared to its peer universe over the past 1-, 3- and 5-year periods. On the basis of the Board’s assessment of the nature, extent and quality of advisory services to be provided or procured by TFAI and the Sub-Adviser, the Board concluded that TFAI and the Sub-Adviser are capable of providing a level of investment performance that is appropriate in light of the Fund’s proposed investment objectives, policies and strategies and competitive with other similarly situated investment companies.
The cost of advisory services provided and the level of profitability. The Board reviewed profitability information of TFAI’s cost of procuring fund management services, as well as the costs of provision of administration, fund accounting and other services, to the Fund and to ATST as a whole by TFAI and its affiliates. The Board reviewed the management and sub-advisory fees for the Fund. The Trustees noted that the Fund’s contractual management fees were above the medians for its peer group and peer universe and that the total expenses of the Fund were above the median for its peer group, but below the median for the peer universe. Based on their review, the Trustees determined Based on their review, the Trustees determined that the management fees of the Fund generally are appropriate in light of the services expected to be provided or procured, the management fees and the anticipated profitability of the relationship between the Fund, TFAI and its affiliates, and the Sub-Adviser. In making these observations and determinations, the Board reviewed, among other things, comparative information provided by Lipper.
Whether fee levels reflect economies of scale and the extent to which economies of scale would be realized as the Fund grows. In evaluating the extent to which the management fees payable under the Investment Advisory and Sub-Advisory Agreements reflect economies of scale or will permit economies of scale to be realized in the future, the Board noted that TFAI and the Sub-Adviser offer breakpoints which appropriately benefit investors by passing on economies of scale in the form of lower management fees as the level of assets grows. The Trustees also concluded that they will have the opportunity to periodically reexamine whether the Fund has achieved economies of scale, and the appropriateness of management fees payable to TFAI and fees paid to the Sub-Adviser, in the future.
Benefits (such as soft dollars) to TFAI, its affiliates, or the Sub-Adviser from their relationship with the Fund. The Board concluded that other benefits anticipated to be derived by TFAI, its affiliates, and the Sub-Adviser from their relationships with the Fund are expected to be reasonable and fair, and consistent with industry practice and the best interests of the Fund and its shareholders. The Trustees noted that TFAI would not realize soft dollar benefits from its relationship with the Fund. The Board also noted that the Sub-Adviser is participating in a brokerage program pursuant to which a portion of brokerage commissions paid by the Fund is recaptured for the benefit of the Fund and its shareholders, thus limiting the amount of soft dollar arrangements the Sub-Adviser may engage in with respect to the Fund’s brokerage transactions.
16
Other considerations. The Board determined that TFAI has made a substantial commitment to the recruitment and retention of high quality personnel, and maintains the financial, compliance and operational resources reasonably necessary to manage the Fund in a professional manner that is consistent with the best interests of the Fund and its shareholders. In this regard, the Trustees favorably considered the procedures and policies in place by TFAI to enforce compliance with applicable laws and regulations and oversee the portfolio management activities of the Sub-Adviser. The Trustees also determined that TFAI has made a significant entrepreneurial commitment to the management and success of the Fund, reflected by TFAI’s expense limitation and fee waiver arrangements with the Fund which may result in TFAI waiving a substantial amount of management fees for the benefit of shareholders. With respect to the Sub-Adviser, the Trustees noted that the Sub-Adviser’s trading costs generally had been lower than its peers for three of the previous four quarters.
17
Templeton Transamerica Global
MARKET ENVIRONMENT
Templeton Investment Counsel, LLC
In spite of elevated energy prices and widespread fears of contagion from the deteriorating U.S. housing situation, the global economy remained resilient in 2007. Consumer and corporate demand strength, particularly in China and other developing economies, generally favorable employment, moderate but rising inflation, and accommodative monetary policies continued to underpin the current expansionary period that began in 2002.
These factors also contributed to the strength of global equity markets during 2007. However, concerns about slower growth and declining asset quality surfaced in the first quarter, initially centered on the U.S. sub-prime mortgage market but spreading in August to global capital markets. Difficulties in assessing risk and the value of collateral in the structured finance industry contributed to declining risk appetite among lenders and investors. The private equity industry, which relies on the availability of cheap credit, was particularly affected, and deal activity, which started the year strongly, slowed significantly in the second half of the year. Still, global merger and acquisition activity reached record levels as the staggering $4.5 trillion of deals announced in 2007 eclipsed the previous record from 2006 by 24%.
To alleviate the credit crunch and restore investor confidence, the world’s major central banks infused capital into the system, and the U.S. Federal Reserve Board reduced its target interest rate by a full percentage point. However, credit and equity markets continued to face headwinds as write-downs and losses from sub-prime mortgage financing prevailed among large financial institutions toward the end of the year, and equity prices remained volatile.
In this environment, most global equity markets posted strong, double-digit total returns. Many stock market indexes in the U.S. and most European countries reached six-year highs, and many emerging market indexes in Asia, Europe and Latin America neared or reached all-time highs. In addition, U.S. dollar weakness relative to the currencies of many major trading partners enhanced equity returns for U.S.-based investors holding stocks denominated in other currencies.
Transamerica Investment Management, LLC
U.S. equities faced significant challenges in the twelve months ended December 31, 2007, particularly in the second half of the year. After advancing early in the period, the Standard and Poor’s 500 Composite Stock Index gave back some gains, to end the year with a relatively modest total return of 5.49%.
Throughout the period, the market struggled against the implications of a weak U.S. housing market. Changing home values greatly influence consumer spending, creating a ripple effect in the economy. However, because consumer spending, unemployment levels and corporate earnings remained steady, stock prices advanced through mid-May. Thereafter, rising defaults for low-quality (sub-prime) mortgages triggered a crisis in the debt markets, making it harder for individuals and corporations to borrow capital. Market volatility increased dramatically as investors worried how this credit crisis, combined with the housing downturn, would affect companies that require large amounts of short-term financing or depend on robust consumer spending. As the period wore on, persistent concerns about inflation and significant signs of a flagging economy added to the market’s worries.
Capital infusions from the world’s central banks and the sovereign funds of foreign nations, plus a total of 1.0% in interest-rate cuts by the Federal Reserve Board were largely ineffective in resolving the issues. Quarterly earnings growth stalled, and it became increasingly apparent that the housing-and-credit malaise will undermine the economy in 2008.
Against this backdrop, growth indexes outperformed value measures, and large-cap stocks showed more resilience than small- or mid-cap equities.
PERFORMANCE
For the year ended December 31, 2007, Templeton Transamerica Global, Initial Class returned 15.24%. By comparison its benchmark, the Morgan Stanley Capital International World Index (“MSCIW”), returned 9.57%.
STRATEGY REVIEW
Templeton Investment Counsel, LLC
During the year under review, the portfolio benefited from an over-weighted allocation and stock selection in the telecommunication services sector relative to its benchmark, the MSCIW. Turkey’s leading cell phone services provider, Turkcell Iletisim Hizmetleri A.S., which is not an index component, was a significant contributor to portfolio performance during the review period, as the company increased its market share and expanded its interests to surrounding areas such as Ukraine. Other telecommunication services holdings that performed well during the review period were Spain’s Telefonica, S.A., Norway’s Telenor ASA and France Telecom. The portfolio also benefited from stock selection and an over-weighted allocation in the industrials sector as Denmark’s Vestas Wind Systems A/S, the world’s largest wind turbine manufacturer, which continued to benefit from strong international demand for its products. The company’s stock was among the portfolio’s top contributors to performance during the review period. The portfolio also benefited from its investment in German industrial conglomerate Siemens AG.
AEGON/Transamerica Series Trust | | | | Annual Report 2007 |
| | | | |
1
On a geographic basis, the portfolio benefited from stock selection in an underweighted allocation to Japan. Notably, Japanese game maker Nintendo Co., Ltd. was among the portfolio’s top contributors to performance. Stock selection in the United Kingdom (“UK”) aided the portfolio’s relative results due to the strong performance of several holdings such as pharmaceuticals, beauty and health retailer Alliance Boots plc and global security services provider G4S plc. The portfolio also benefited from its allocation to Latin America, which was not represented in the index largely due to the strong performance of Brazilian mining company Companhia Vale do Rio Doce.
The U.S. dollar depreciated versus most foreign currencies for the year, which also contributed to the portfolio’s performance because investments in securities with non-U.S. currency exposure gained value as the dollar weakened.
The portfolio, however, had some detractors from performance during the year. In the information technology sector, South Korean electronic products and chip manufacturer Samsung Electronics Co., Ltd. (not an index component) hindered results, as did German chip maker Infineon Technologies AG. Italian television network company Mediaset SpA in the consumer discretionary sector also detracted from the portfolio’s results. On a sector basis, the portfolio was hurt most by stock selection and its underweighted exposure to the materials sector as record-high commodity prices boosted the performance of many metals and mining companies. On a regional basis, major detractors were stock selection in and underweighted allocations to North America, Australia and New Zealand in addition to the portfolio’s weighting in South Korea, which was not represented in the index.
Transamerica Investment Management, LLC
We attribute the portfolio’s out-performance to our focus on two secular growth trends that were unaffected by the domestic economy’s troubles: demand for new personal technology; and rapid worldwide industrialization. The portfolio’s chief contributors to performance included Apple Inc. (“Apple”), Research in Motion Limited (“RIMM”), Google Inc. (“Google”) and Jacobs Engineering Group Inc. (“Jacobs”)
Apple’s success rests on its user-friendly personal electronics (e.g., iPods and iPhones) and a “halo” effect from these that has invigorated sales of its personal computers and laptops. RIMM, the maker of the BlackBerry personal communication devices, is expanding its product line for business customers and “smart phones” for consumers. Internet search engine Google, already dominant in the online advertising business, is extending its services (e.g., through contracts with major wireless phone companies). Jacobs, which designs and constructs major infrastructure projects and manufacturing facilities worldwide, won new contracts during the period.
Partially countering these gains were setbacks for McGraw-Hill Companies Inc., the parent company of debt-rating agency Standard & Poor’s Corp. (“Standard & Poor’s”); and for several consumer companies (e.g., Marriott International, Inc. (“Marriott”), Starbucks Corporation (“Starbucks”) and Nordstrom, Inc. (“Nordstrom”)). Earnings at these companies remained healthy, but their stock prices fell on fears that the credit-and-housing crisis would negatively affect bond market activity (a factor for Standard & Poor’s) and consumer spending (a potential issue for the others). We believe McGraw-Hill will recover as the credit crisis is resolved and believe consumers will continue to support high-end retailer Nordstrom. We exited Starbucks, which is involved in a costly, margin-squeezing overseas expansion; and hotelier Marriott, where the secular growth cycle has peaked.
Tina Sadler, CFA
Antonio T. Docal, CFA
Gary Motyl, CFA
Co-Portfolio Managers
Templeton Investment Counsel, LLC
Gary U. Rolle, CFA
Portfolio Manager
Transamerica Investment Management, LLC
2
Templeton Transamerica Global
(unaudited)
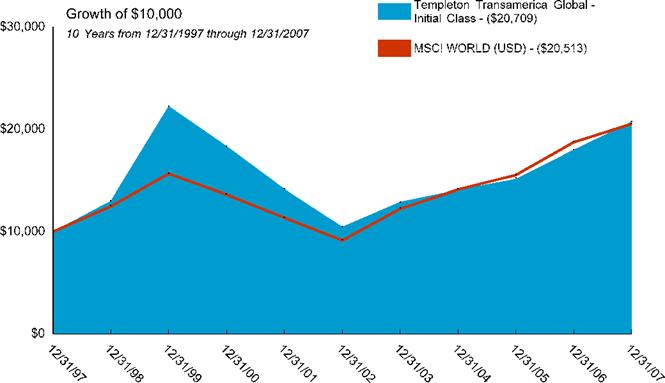
Average Annual Total Return for Periods Ended 12/31/2007
| | 1 Year | | 5 Years | | 10 Years | | From
Inception | | Inception
Date | |
| | | | | | | | | | | |
Initial Class | | 15.24 | % | 14.61 | % | 7.55 | % | 11.72 | % | 12/3/92 | |
MSCI WORLD ex USA Gross (USD)(1) | | 9.57 | % | 17.53 | % | 7.45 | % | 10.19 | % | 12/3/92 | |
| | | | | | | | | | | |
Service Class | | 14.98 | % | — | % | — | % | 5.84% | | 5/1/03 | |
NOTES
(1) The Morgan Stanley Capital International World (MSCIW) Index is an unmanaged index used as a general measure of market performance. Calculations assume dividends and capital gains are reinvested and do not include any managerial expenses. From inception calculation is based on life of Initial Class shares.
The performance data presented represents past performance, future results may vary. The portfolio’s investment return and net asset value will fluctuate. Past performance does not guarantee future results. Investor’s units when redeemed, may be worth more or less than their original cost.
Current performance may be lower or higher than performance quoted. Please visit your insurance company’s website for contract or policy level standardized total returns current to the most recent month end. Portfolio performance is net of investment fees and fund expenses, but not product charges, which, if included, would significantly lower the performance quoted.
This material must be preceded or accompanied by a current prospectus, which includes specific contents regarding the investment objectives, explanation of share classes and policies of this portfolio.
International investing involves special risks including fluctuations, political instability and different financial accounting standards.
3
Templeton Transamerica Global
UNDERSTANDING YOUR FUNDS EXPENSES
(unaudited)
SHAREHOLDER EXPENSES
Fund shareholders may incur ongoing costs, including management and advisory fees, distribution and service fees, and other fund expenses.
The following Example is intended to help you understand your ongoing costs (in dollars and cents) of investing in the Fund and to compare these costs with the ongoing costs of investing in other funds.
The Example is based on an investment of $1,000 invested at July 1, 2007 and held for the entire period until December 31, 2007.
ACTUAL EXPENSES
The first line in the table below provides information about actual account values and actual expenses. You may use the information in this line, together with the amount you invested, to estimate the expenses that you paid over the period. Simply divide your account value by $1,000 (for example, an $8,600 account value divided by $1,000 = 8.6), then multiply the result by the number in the first line of your Fund under the heading entitled “Expenses Paid During Period” to estimate the expenses you paid on your account during this period. If your account is an IRA, your expenses could have included a $15 annual fee. The amount of any fee paid through your account would increase the estimate of expenses you paid during the period and decrease your ending account value.
HYPOTHETICAL EXAMPLE FOR COMPARISON PURPOSES
The second line in the table below provides information about hypothetical account values and hypothetical expenses based on the Fund’s actual expense ratio and an assumed rate of return of 5% per year before expenses, which is not the Fund’s actual return. The hypothetical account values and expenses may not be used to estimate the actual ending account balance or expenses you paid for the period. You may use this information to compare the ongoing costs of investing in your Fund and other funds. To do so, compare this 5% hypothetical example with the 5% hypothetical examples that appear in the shareholder reports of the other funds.
Please note that the expenses shown in the table are meant to highlight your ongoing costs only and do not reflect any transactional costs, such as sales charges, redemption fees, brokerage commissions paid on purchases and sales of fund shares. Therefore, the second line under the Fund in the table is useful in comparing ongoing costs only, and will not help you determine the relative total costs of owning different funds. If any of these transaction costs were included, your costs would be higher. The expenses shown in the table do not reflect any fees that may be charged to you by brokers, financial intermediaries or other financial institutions.
| | Beginning
Account
Value | | Ending
Account
Value | | Annualized
Expense
Ratio | | Expenses
Paid During
Period (a) | |
Initial Class | | | | | | | | | |
Actual | | $ | 1,000.00 | | $ | 1,061.02 | | 0.84 | % | $ | 4.36 | |
Hypothetical (b) | | 1,000.00 | | 1,020.97 | | 0.84 | | 4.28 | |
| | | | | | | | | |
Service Class | | | | | | | | | |
Actual | | 1,000.00 | | 1,059.90 | | 1.09 | | 5.66 | |
Hypothetical (b) | | 1,000.00 | | 1,019.71 | | 1.09 | | 5.55 | |
| | | | | | | | | | | | |
(a) | Expenses are calculated using the Fund’s annualized expense ratio (as disclosed in the table), multiplied by the average account value for the period, multiplied by the number of days in the period (184 days), and divided by the number of days in the year (365 days). |
(b) | 5% return per year before expenses. |
GRAPHICAL PRESENTATION OF SCHEDULE OF INVESTMENTS
By Region
At December 31, 2007
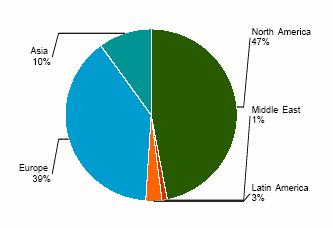
This chart shows the percentage breakdown by region of the Fund’s total investment securities.
4
Templeton Transamerica Global
SCHEDULE OF INVESTMENTS
At December 31, 2007
(all amounts except share amounts in thousands)
| | Shares | | Value | |
COMMON STOCKS (97.8%) | | | | | |
Australia (0.6%) | | | | | |
National Australia Bank, Ltd. | | 103,940 | | $ | 3,449 | |
Austria (0.5%) | | | | | |
Telekom Austria AG | | 122,840 | | 3,392 | |
Brazil (1.0%) | | | | | |
Cia Vale do Rio Doce ^ | | 96,510 | | 3,153 | |
Empresa Brasileira de Aeronautica SA ‡ | | 75,590 | | 3,446 | |
Canada (2.3%) | | | | | |
Jean Coutu Group PJC, Inc. (The) Class A | | 206,500 | | 2,337 | |
Research In Motion, Ltd. ‡ | | 106,000 | | 12,021 | |
Cayman Islands (0.6%) | | | | | |
ACE, Ltd. | | 61,040 | | 3,771 | |
Denmark (0.7%) | | | | | |
Vestas Wind Systems A/S ‡ | | 38,070 | | 4,111 | |
Finland (0.8%) | | | | | |
Stora ENSO OYJ Class R | | 193,910 | | 2,894 | |
UPM-Kymmene OYJ ^ | | 121,460 | | 2,458 | |
France (6.2%) | | | | | |
Accor SA | | 21,680 | | 1,734 | |
AXA SA | | 116,760 | | 4,676 | |
France Telecom SA | | 178,680 | | 6,432 | |
Michelin (C.G.D.E.) Class B | | 28,674 | | 3,291 | |
Sanofi-Aventis SA | | 57,895 | | 5,331 | |
Suez SA | | 63,300 | | 4,396 | |
Thomson | | 62,840 | | 881 | |
Thomson ‡ | | 143,540 | | 2,042 | |
Total SA | | 82,678 | | 6,869 | |
Vivendi | | 79,020 | | 3,625 | |
Germany (6.6%) | | | | | |
Bayerische Motoren Werke AG | | 65,120 | | 4,040 | |
Celesio AG | | 60,270 | | 3,729 | |
Daimler AG ^ | | 91,000 | | 8,702 | |
Deutsche Post AG | | 179,890 | | 6,177 | |
E.ON AG | | 77,460 | | 5,504 | |
Infineon Technologies AG ‡ | | 356,420 | | 4,202 | |
Muenchener Rueckversicherungs AG | | 12,400 | | 2,408 | |
Siemens AG | | 45,920 | | 7,301 | |
Hong Kong (0.8%) | | | | | |
Cheung Kong Holdings, Ltd. ‡ | | 151,000 | | 2,792 | |
Hutchison Whampoa International, Ltd. ‡ | | 186,000 | | 2,110 | |
Israel (0.4%) | | | | | |
Check Point Software Technologies ‡ | | 123,835 | | 2,719 | |
Italy (2.0%) | | | | | |
ENI SpA | | 65,505 | | 4,745 | |
Mediaset SpA ^ | | 395,514 | | 3,984 | |
Unicredito Italiano SpA | | 491,147 | | 4,040 | |
Japan (4.4%) | | | | | |
Aiful Corp. ^ | | 97,150 | | 1,707 | |
Fujifilm Holdings Corp. | | 54,300 | | 2,273 | |
Hitachi, Ltd. | | 205,000 | | 1,523 | |
Konica Minolta Holdings, Inc. | | 173,500 | | 3,042 | |
Mabuchi Motor Co., Ltd. ^ | | 37,100 | | 2,227 | |
Mitsubishi UFJ Financial Group, Inc. | | 126,400 | | $ | 1,179 | |
NGK Spark Plug Co., Ltd. | | 72,000 | | 1,248 | |
Nintendo Co., Ltd. | | 7,500 | | 4,404 | |
Olympus Corp. | | 63,300 | | 2,580 | |
Promise Co., Ltd. ^ | | 79,000 | | 1,945 | |
Sony Corp. | | 32,890 | | 1,786 | |
Takeda Pharmaceutical Co., Ltd. | | 32,900 | | 1,922 | |
Uss Co., Ltd. | | 35,670 | | 2,215 | |
Korea, Republic of (1.8%) | | | | | |
Kookmin Bank ‡ | | 25,790 | | 1,891 | |
Korea Electric Power Corp. ^ | | 73,030 | | 1,523 | |
KT Corp. | | 125,545 | | 3,239 | |
Samsung Electronics Co., Ltd. -144A | | 16,150 | | 4,728 | |
Netherlands (2.7%) | | | | | |
ING Groep NV | | 17,960 | | 699 | |
ING Groep NV | | 105,910 | | 4,142 | |
Koninklijke Philips Electronics NV | | 106,200 | | 4,583 | |
Reed Elsevier NV ^ | | 242,170 | | 4,833 | |
Vedior NV | | 101,110 | | 2,546 | |
Netherlands Antilles (1.2%) | | | | | |
Schlumberger, Ltd. | | 77,000 | | 7,574 | |
Norway (1.4%) | | | | | |
Telenor ASA ‡ | | 375,280 | | 8,905 | |
Portugal (0.4%) | | | | | |
Portugal Telecom SGPS SA | | 179,050 | | 2,338 | |
PT Multimedia Servicos de | | 25,219 | | 352 | |
Telecomunicacoes E Multimedia | | | | | |
SGPS SA | | | | | |
Singapore (1.8%) | | | | | |
DBS Group Holdings, Ltd. | | 5,190 | | 297 | |
DBS Group Holdings, Ltd. | | 300,000 | | 4,314 | |
Flextronics International, Ltd. ‡ | | 153,530 | | 1,852 | |
Singapore Telecommunications, Ltd. | | 1,774,000 | | 4,930 | |
South Africa (0.6%) | | | | | |
Sasol, Ltd. | | 82,500 | | 4,081 | |
Spain (1.7%) | | | | | |
Banco Santander Central Hispano SA | | 170,409 | | 3,681 | |
Telefonica SA | | 222,547 | | 7,214 | |
Sweden (1.2%) | | | | | |
Nordea Bank AB | | 203,350 | | 3,398 | |
Securitas AB Class B | | 109,010 | | 1,516 | |
Svenska Cellulosa AB Class B | | 144,510 | | 2,552 | |
Switzerland (2.7%) | | | | | |
Lonza Group AG | | 35,750 | | 4,324 | |
Nestle SA | | 38,840 | | 4,474 | |
Novartis AG | | 69,520 | | 3,776 | |
Swiss Reinsurance | | 26,690 | | 1,888 | |
UBS AG | | 57,600 | | 2,656 | |
UBS AG-New ‡ | | 6,220 | | 286 | |
Taiwan (0.6%) | | | | | |
Chunghwa Telecom Co., Ltd. | | 132,895 | | 2,805 | |
Lite-On Technology Corp. New | | 54,720 | | 955 | |
Turkey (0.6%) | | | | | |
Turkcell Iletisim Hizmet As ^ | | 146,280 | | 4,033 | |
The notes to the financial statements are an integral part of this report.
5
| | Shares | | Value | |
United Kingdom (11.2%) | | | | | |
Aviva PLC | | 277,440 | | $ | 3,717 | |
BAE Systems PLC | | 634,180 | | 6,287 | |
BP PLC | | 88,370 | | 6,466 | |
British Sky Broadcasting Group PLC | | 247,600 | | 3,051 | |
Cadbury Schweppes PLC | | 190,000 | | 2,349 | |
Compass Group PLC | | 856,890 | | 5,262 | |
GlaxoSmithKline PLC | | 188,207 | | 4,792 | |
Group 4 Securicor PLC | | 907,990 | | 4,424 | |
HSBC Holdings PLC | | 8,440 | | 706 | |
HSBC Holdings PLC | | 143,692 | | 2,408 | |
Kingfisher PLC ^ | | 196,100 | | 1,126 | |
Kingfisher PLC | | 328,470 | | 952 | |
Pearson PLC | | 194,220 | | 2,830 | |
Rentokil Initial PLC | | 856,290 | | 2,061 | |
Rolls-Royce Group PLC ‡ | | 368,530 | | 4,005 | |
Royal Bank of Scotland Group PLC | | 414,710 | | 3,665 | |
Royal Dutch Shell PLC Class B | | 149,842 | | 6,234 | |
Unilever PLC | | 107,594 | | 4,048 | |
Vodafone Group PLC | | 1,824,401 | | 6,820 | |
United States (43.0%) | | | | | |
Allergan, Inc. | | 140,000 | | 8,994 | |
American Express Co. | | 160,000 | | 8,323 | |
American International Group, Inc. | | 140,000 | | 8,162 | |
Ameriprise Financial, Inc. | | 156,000 | | 8,597 | |
Apple, Inc. ‡ | | 113,000 | | 22,383 | |
AT&T, Inc. | | 165,000 | | 6,857 | |
Boeing Co. | | 74,400 | | 6,507 | |
Caterpillar, Inc. | | 115,000 | | 8,344 | |
CME Group, Inc. Class A | | 25,000 | | 17,150 | |
Ecolab, Inc. | | 60,000 | | 3,073 | |
Electronic Arts, Inc. ‡ | | 170,000 | | 9,930 | |
Expeditors International Washington, Inc. | | 190,000 | | 8,489 | |
General Electric Co. | | 250,000 | | 9,268 | |
Gilead Sciences, Inc. ‡ | | 190,000 | | 8,742 | |
Google, Inc. Class A ‡ | | 21,000 | | 14,521 | |
Interpublic Group of Cos., Inc. ‡ | | 1 | | q | |
Jacobs Engineering Group, Inc. ‡ | | 155,000 | | 14,820 | |
Johnson Controls, Inc. | | 253,200 | | 9,125 | |
McGraw-Hill Cos., Inc. (The) ^ | | 230,000 | | 10,076 | |
MGM Mirage, Inc. ‡ | | 85,000 | | 7,142 | |
Microsoft Corp. | | 200,000 | | 7,120 | |
Nordstrom, Inc. | | 165,000 | | 6,060 | |
PACCAR, Inc. | | 165,000 | | 8,989 | |
Praxair, Inc. | | 150,000 | | 13,307 | |
Qualcomm, Inc. | | 155,000 | | 6,099 | |
Raytheon Co. | | 120,000 | | 7,284 | |
Sigma-Aldrich Corp. | | 60,000 | | 3,276 | |
State Street Corp. | | 120,000 | | 9,744 | |
T. Rowe Price Group, Inc. | | 82,000 | | 4,992 | |
Tyco Electronics, Ltd. | | 250,000 | | 9,283 | |
Varian Medical Systems, Inc. ‡ | | 126,000 | | 6,572 | |
Total Common Stocks (cost $468,667) | | | | 621,630 | |
Total Securities Lending Collateral (cost $23,733) (1) | | | | 23,733 | |
Total Investment Securities (cost $492,400) # | | | | $ | 645,363 | |
The notes to the financial statements are an integral part of this report.
6
(unaudited) | | Percentage of
Total Investments | | Value | |
INVESTMENTS BY INDUSTRY: | | | | | |
Diversified Telecommunication Services | | 7.1 | % | $ | 46,112 | |
Commercial Banks | | 4.5 | % | 29,029 | |
Media | | 4.5 | % | 28,752 | |
Oil, Gas & Consumable Fuels | | 4.4 | % | 28,395 | |
Aerospace & Defense | | 4.3 | % | 27,529 | |
Capital Markets | | 4.0 | % | 25,989 | |
Pharmaceuticals | | 3.8 | % | 24,814 | |
Insurance | | 3.8 | % | 24,622 | |
Software | | 3.7 | % | 24,173 | |
Computers & Peripherals | | 3.6 | % | 23,338 | |
Industrial Conglomerates | | 3.6 | % | 23,262 | |
Diversified Financial Services | | 3.4 | % | 22,277 | |
Chemicals | | 3.0 | % | 19,655 | |
Communications Equipment | | 2.8 | % | 18,120 | |
Machinery | | 2.7 | % | 17,334 | |
Electronic Equipment & Instruments | | 2.7 | % | 17,157 | |
Construction & Engineering | | 2.3 | % | 14,820 | |
Air Freight & Logistics | | 2.3 | % | 14,666 | |
Internet Software & Services | | 2.2 | % | 14,521 | |
Hotels, Restaurants & Leisure | | 2.2 | % | 14,138 | |
Auto Components | | 2.1 | % | 13,665 | |
Automobiles | | 2.0 | % | 12,743 | |
Consumer Finance | | 1.9 | % | 11,975 | |
Food Products | | 1.7 | % | 10,871 | |
Wireless Telecommunication Services | | 1.7 | % | 10,853 | |
Commercial Services & Supplies | | 1.6 | % | 10,546 | |
Health Care Equipment & Supplies | | 1.4 | % | 9,152 | |
Semiconductors & Semiconductor Equipment | | 1.4 | % | 8,929 | |
Biotechnology | | 1.4 | % | 8,742 | |
Paper & Forest Products | | 1.2 | % | 7,905 | |
Energy Equipment & Services | | 1.2 | % | 7,574 | |
Electric Utilities | | 1.1 | % | 7,026 | |
Multiline Retail | | 0.9 | % | 6,060 | |
Household Durables | | 0.7 | % | 4,709 | |
Multi-Utilities | | 0.7 | % | 4,396 | |
Life Sciences Tools & Services | | 0.7 | % | 4,324 | |
Specialty Retail | | 0.7 | % | 4,293 | |
Electrical Equipment | | 0.6 | % | 4,111 | |
Health Care Providers & Services | | 0.6 | % | 3,729 | |
Metals & Mining | | 0.5 | % | 3,153 | |
Office Electronics | | 0.5 | % | 3,042 | |
Real Estate Management & Development | | 0.4 | % | 2,792 | |
Food & Staples Retailing | | 0.4 | % | 2,337 | |
Investment Securities, at value | | 96.3 | % | 621,630 | |
Short-Term Investments | | 3.7 | % | 23, 733 | |
Total Investments | | 100.0 | % | $ | 645,363 | |
The notes to the financial statements are an integral part of this report.
7
FORWARD FOREIGN CURRENCY CONTRACTS:
Currency | | Bought
(Sold) | | Settlement
Date | | Amount in
U.S. Dollars
Bought(Sold) | | Net Unrealized Appreciation
(Depreciation) | |
| | | | | | | | | |
Japanese Yen | | 1,952 | | 01/08/2008 | | $ | 18 | | $ | q | |
| | | | | | $ | 18 | | $ | q | |
NOTES TO SCHEDULE OF INVESTMENTS:
q Value is less than $1.
^ At December 31, 2007, all or a portion of this security is on loan (see Note 1). The value at December 31, 2007, of all securities on loan is $22,863.
‡ Non Income Producing.
(1) Cash collateral for the Repurchase Agreements, valued at $8,603, that serve as collateral for securities lending, are invested in corporate bonds with interest rates and maturity dates ranging from 3.00% - 10.18% and 04/28/2008 - 12/01/2096, respectively.
# Aggregate cost for federal income tax purposes is $496,131. Aggregate gross unrealized appreciation for all securities in which there is an excess of value over tax cost and aggregate gross unrealized depreciation for all securities in which there is an excess of tax cost over value were $163,210 and $13,978 respectively. Net unrealized appreciation for tax purposes is $149,232.
DEFINITIONS:
144A | 144A Securities are registered pursuant to Rule 144A of the Securities Act of 1933. These securities are deemed to be liquid for purposes of compliance limitations on holdings of illiquid securities and may be resold as transactions exempt from registration, normally to qualified institutional buyers. At December 31, 2007, these securities aggregated $4,728 or 0.74% of net assets of the fund |
The notes to the financial statements are an integral part of this report.
8
Templeton Transamerica Global
STATEMENT OF ASSETS AND LIABILITIES
At December 31, 2007
(all amounts except per share amounts in thousands)
Assets: | | | |
Investment securities, at value (cost: $492,400) (including securities loaned of $22,863) | | $ | 645,363 | |
Cash | | 13,840 | |
Receivables: | | | |
Shares sold | | 399 | |
Interest | | 37 | |
Income from loaned securities | | 8 | |
Dividends | | 760 | |
Dividend reclaims | | 69 | |
| | 660,476 | |
Liabilities: | | | |
Investment securities purchased | | 18 | |
Accounts payable and accrued liabilities: | | | |
Shares redeemed | | 123 | |
Management and advisory fees | | 405 | |
Distribution and service fees | | 5 | |
Administration fees | | 11 | |
Payable for collateral for securities on loan | | 23,733 | |
Unrealized depreciation on forward foreign currency contracts | | — | (a) |
Other | | 271 | |
| | 24,566 | |
Net Assets | | $ | 635,910 | |
| | | |
Net Assets Consist of: | | | |
Capital Stock ($.01 par value) | | $ | 254 | |
Additional paid-in capital | | 713,417 | |
Undistributed (accumulated) net investment income | | 5 ,456 | |
Undistributed (accumulated) net realized loss from investment securities and foreign currency transactions | | (236,180 | ) |
Net unrealized appreciation on investment securities | | 152,963 | |
Net Assets | | $ | 635,910 | |
Net Assets by Class: | | | |
Initial Class | | $ | 611,618 | |
Service Class | | 24,292 | |
Shares Outstanding: | | | |
Initial Class | | 24,452 | |
Service Class | | 978 | |
Net Asset Value and Offering Price Per Share: | | | |
Initial Class | | $ | 25.01 | |
Service Class | | 24.85 | |
(a) Rounds to less than $1.
STATEMENT OF OPERATIONS
For the year ended December 31, 2007
(all amounts in thousands)
Investment Income: | | | |
Dividends (net of withholding taxes on foreign dividends of $897) | | $ | 12,808 | |
Interest | | 552 | |
Income from loaned securities-net | | 291 | |
| | 13,651 | |
| | | |
Expenses: | | | |
Management and advisory fees | | 4,705 | |
Printing and shareholder reports | | 267 | |
Custody fees | | 194 | |
Administration fees | | 126 | |
Legal fees | | 13 | |
Audit fees | | 25 | |
Trustees fees | | 22 | |
Distribution and service fees: | | | |
Service Class | | 54 | |
Other | | 20 | |
Total expenses | | 5,426 | |
| | | |
Net Investment Income | | 8,225 | |
| | | |
Net Realized Gain (Loss) from: | | | |
Investment securities (net of foreign capital gains tax of $25) | | 50,439 | |
Foreign currency transactions | | (182 | ) |
| | 50,257 | |
| | | |
Net Increase (Decrease) in Unrealized Appreciation (Depreciation) on: | | | |
Investment securities | | 30,288 | |
Translation of assets and liabilities denominated in foreign currencies | | (7 | ) |
| | 30,281 | |
| | | |
Net Realized and Unrealized Gain: | | 80,538 | |
Net Increase In Net Assets Resulting from Operations | | $ | 88,763 | |
The notes to the financial statements are an integral part of this report.
9
Templeton Transamerica Global
STATEMENT OF CHANGES IN NET ASSETS
For the years ended
(all amounts in thousands)
| | December 31,
2007 | | December 31,
2006 | |
Increase (Decrease) in Net Assets From: | | | | | |
Operations: | | | | | |
Net investment income | | $ | 8,225 | | $ | 7,904 | |
Net realized gain from investment securities and foreign currency transactions | | 50,257 | | 35,665 | |
Change in unrealized appreciation on investment securities and foreign currency translation | | 30,281 | | 57,898 | |
| | 88,763 | | 101,467 | |
Distributions to Shareholders: | | | | | |
From net investment income: | | | | | |
Initial Class | | (9,253 | ) | (7,316 | ) |
Service Class | | (279 | ) | (140 | ) |
| | (9,532 | ) | (7,456 | ) |
Capital Share Transactions: | | | | | |
Proceeds from shares sold: | | | | | |
Initial Class | | 38,554 | | 34,654 | |
Service Class | | 17,567 | | 8,224 | |
| | 56,121 | | 42,878 | |
Dividends and distributions reinvested: | | | | | |
Initial Class | | 9,253 | | 7,316 | |
Service Class | | 279 | | 140 | |
| | 9,532 | | 7,456 | |
Cost of shares redeemed: | | | | | |
Initial Class | | (111,395 | ) | (117,522 | ) |
Service Class | | (12,220 | ) | (1,781 | ) |
| | (123,615 | ) | (119,303 | ) |
| | (57,962 | ) | (68,969 | ) |
Net increase (decrease) in net assets | | 21,269 | | 25,042 | |
Net Assets: | | | | | |
Beginning of year | | 614,641 | | 589,599 | |
End of year | | $ | 635,910 | | $ | 614,641 | |
Undistributed (Accumulated) Net | | | | | |
Investment Income (Loss) | | $ | 5,456 | | $ | 6,383 | |
Share Activity: | | | | | |
Shares issued: | | | | | |
Initial Class | | 1,642 | | 1,709 | |
Service Class | | 750 | | 404 | |
| | 2,392 | | 2,113 | |
Shares issued-reinvested from distributions: | | | | | |
Initial Class | | 404 | | 371 | |
Service Class | | 12 | | 8 | |
| | 416 | | 379 | |
Shares redeemed: | | | | | |
Initial Class | | (4,731 | ) | (5,860 | ) |
Service Class | | (529 | ) | (90 | ) |
| | (5,260 | ) | (5,950 | ) |
Net increase (decrease) in shares outstanding: | | | | | |
Initial Class | | (2,685 | ) | (3,780 | ) |
Service Class | | 233 | | 322 | |
| | (2,452 | ) | (3,458 | ) |
(a) Per share information is calculated based on average number of shares outstanding.
The notes to the financial statements are an integral part of this report.
10
Templeton Transamerica Global
FINANCIAL HIGHLIGHTS
For a share outstanding throughout each period(a) | | Initial Class
Year Ended December 31, | |
| | 2007 | | 2006 | | 2005 | | 2004 | | 2003 | |
Net Asset Value | | | | | | | | | | | |
Beginning of period | | $ | 22.05 | | $ | 18.81 | | $ | 17.69 | | $ | 16.15 | | $ | 13.16 | |
Investment Operations | | | | | | | | | | | |
Net investment income (loss) | | 0.31 | | 0.27 | | 0.21 | | 0.14 | | 0.11 | |
Net realized and unrealized gain (loss) | | 3.02 | | 3.23 | | 1.10 | | 1.40 | | 2.88 | |
Total operations | | 3.33 | | 3.50 | | 1.31 | | 1.54 | | 2.99 | |
Distributions | | | | | | | | | | | |
From net investment income | | (0.37 | ) | (0.26 | ) | (0.19 | ) | — | | — | |
From net realized gains | | — | | — | | — | | — | | — | |
Total distributions | | (0.37 | ) | (0.26 | ) | (0.19 | ) | — | | — | |
Net Asset Value | | | | | | | | | | | |
End of period(b) | | $ | 25.01 | | $ | 22.05 | | $ | 18.81 | | $ | 17.69 | | $ | 16.15 | |
Total Return(c),(d) | | 15.24 | % | 18.79 | % | 7.47 | % | 9.54 | % | 22 .72 | % |
Net Assets End of Period (000’s) | | $ | 611,618 | | $ | 598,312 | | $ | 581,669 | | $ | 642,460 | | $ | 634,110 | |
Ratio and Supplemental Data | | | | | | | | | | | |
Expenses to average net assets(e) | | 0.85 | % | 0.87 | % | 0.90 | % | 0.95 | % | 0 . 94 | % |
Net investment income (loss), to average net assets(e) | | 1.31 | % | 1.35 | % | 1.20 | % | 0.84 | % | 0 .81 | % |
Portfolio turnover rate(d) | | 34 | % | 59 | % | 61 | % | 139 | % | 131 | % |
| | Service Class | | | |
| | Year Ended December 31, | | May 1 to Dec | |
For a share outstanding throughout each period(a) | | 2007 | | 2006 | | 2005 | | 2004 | | 31, 2003 | |
Net Asset Value | | | | | | | | | | | |
Beginning of period | | $ | 21.93 | | $ | 18.73 | | $ | 17.65 | | $ | 16.15 | | $ | 12.97 | |
Investment Operations | | | | | | | | | | | |
Net investment income (loss) | | 0.26 | | 0.21 | | 0.16 | | 0.12 | | (0.04 | ) |
Net realized and unrealized gain (loss) | | 2.99 | | 3.23 | | 1.10 | | 1.38 | | 3.22 | |
Total operations | | 3.25 | | 3.44 | | 1.26 | | 1.50 | | 3.18 | |
Distributions | | | | | | | | | | | |
From net investment income | | (0.33 | ) | (0.24 | ) | (0.18 | ) | — | | — | |
From net realized gains | | — | | — | | — | | — | | — | |
Total distributions | | (0.33 | ) | (0.24 | ) | (0.18 | ) | — | | — | |
Net Asset Value | | | | | | | | | | | |
End of period(b) | | $ | 24.85 | | $ | 21.93 | | $ | 18.73 | | $ | 17.65 | | $ | 16.15 | |
Total Return(c),(d) | | 14.98 | % | 18.45 | % | 7.23 | % | 9.29 | % | 24 .52 | % |
Net Assets End of Period (000’s) | | $ | 24,292 | | $ | 16,329 | | $ | 7,930 | | $ | 3,911 | | $ | 234 | |
Ratio and Supplemental Data | | | | | | | | | | | |
Expenses to average net assets(e) | | 1.10 | % | 1.12 | % | 1.15 | % | 1.19 | % | 1 .19 | % |
Net investment income (loss), to average net assets(e) | | 1.11 | % | 1.02 | % | 0.88 | % | 0.73 | % | (0 .39 | )% |
Portfolio turnover rate(d) | | 34 | % | 59 | % | 61 | % | 139 | % | 131 | % |
(a) | Per share information is calculated based on average number of shares outstanding. |
| |
(b) | Templeton Transamerica Global (the “Fund”) share classes commenced operations as follows: |
| Initial Class - December 3, 1992 |
| Service Class - May 1, 2003 |
| |
(c) | Total Return reflects all portfolio expenses and includes reinvestment of dividends and capital gains; it does not reflect the charges and deductions under the policies or annuity contracts. |
| |
(d) | Not annualized. |
| |
(e) | Annualized. |
The notes to the financial statements are an integral part of this report.
11
Templeton Transamerica Global
NOTES TO FINANCIAL STATEMENTS
At December 31, 2007
(all amounts in thousands)
NOTE 1. | ORGANIZATION AND SIGNIFICANT ACCOUNTING POLICIES |
AEGON/Transamerica Series Trust (“ATST”) is an open-end management investment company registered under the Investment Company Act of 1940, as amended (the “1940 Act”). ATST serves as a funding vehicle for variable life insurance, variable annuity and group annuity products. Templeton Transamerica Global (the “Fund”) is part of ATST.
In the normal course of business, the Fund enters into contracts that contain a variety of representations that provide general indemnifications. The Fund’s maximum exposure under these arrangements is unknown, as this would involve future claims that may be made against the Fund and/or its affiliates that have not yet occurred. However, based on experience, the Fund expects the risk of loss to be remote.
This report should be read in conjunction with the current Fund prospectus, which contains more complete information about the Fund.
In preparing the Fund’s financial statements in accordance with accounting principles generally accepted in the United States of America (“GAAP”), estimates or assumptions (which could differ from actual results) may be used that affect reported amounts and disclosures. The following is a summary of significant accounting policies followed by the Fund.
Multiple class operations, income and expenses: The Fund currently offers two classes of shares, an Initial Class and a Service Class. Income, non-class specific expenses and realized and unrealized gains and losses, are allocated daily to each class, based upon the value of shares outstanding method as permitted under Rule 1 8f-3 of the 1940 Act. Each class bears its own specific expenses as well as a portion of general, common expenses.
Security valuations: The Fund values its investments at the close of the New York Stock Exchange (“NYSE”), normally 4 p.m. ET, each day the NYSE is open for business. Fund investments are valued at the last sale price or closing price on the day of valuation taken from the primary exchange where the security is principally traded.
Securities traded in the over-the-counter market and listed securities for which no sale was reported on that date are valued at the last quoted bid price.
Debt securities are valued based on a price quotation or other equivalent indication of value supplied by an exchange, a pricing service or a major market maker; however, those that mature in sixty days or less are valued at amortized cost, which approximates market.
Investment company securities are valued at the net asset value of the underlying portfolio.
Foreign securities generally are valued based on quotations from the primary market in which they are traded. Because many foreign securities markets and exchanges close prior to the close of the NYSE, closing prices for foreign securities in those markets or on those exchanges do not reflect the events that occur after that close. If a significant market event impacting the value of a portfolio security (e.g., natural disaster, company announcement, market volatility) occurs subsequent to the close of trading in the security, but prior to the calculation of the Fund’s net asset value per share, market quotations for that security may be determined to be unreliable and, accordingly, not “readily available.” As a result, foreign equity securities held by the Fund may be valued at fair market value as determined in good faith by the Fund’s Administrative Valuation Committee, under the supervision of the Board’s Valuation Committee, using guidelines adopted by the Board of Trustees.
Other securities for which quotations are not readily available are valued at fair market value as determined in good faith by the Fund’s Administrative Valuation Committee, using guidelines adopted by the Board of Trustees.
Cash: The Fund may leave cash overnight in its cash account with the custodian, State Street Bank & Trust Company (“State Street”). On July 2, 2007, State Street acquired the parent company of Investors Bank & Trust Company. State Street has been contracted on behalf of the Fund to invest the excess cash into a savings account, which at December 31, 2007 was paying an interest rate of 2.60%.
Repurchase agreements: The Fund is authorized to enter into repurchase agreements. The Fund, through its custodian, State Street, receives delivery of the underlying securities, the value of which at the time of purchase is required to be an amount equal to at least 100% of the resale price. The Fund will bear the risk of value fluctuations until the security can be sold and may encounter delays and incur costs in liquidating the security. In the event of bankruptcy or insolvency of the seller, delays and costs may be incurred.
Commission recapture: The sub-adviser, to the extent consistent with the best execution and usual commission rate policies and practices, may place security transactions of the Fund with broker/dealers with which ATST has established a Commission Recapture Program. A Commission Recapture Program is any arrangement under which a broker/dealer applies a portion of the commissions received by such broker/dealer on the security transactions to the Fund. In no event will commissions paid by the Fund be used to pay expenses that would otherwise be borne by any other funds within ATST, or by any other party.
Recaptured commissions during the year ended December 31, 2007 of $7 are included in net realized gains in the Statement of Operations.
12
NOTES TO FINANCIAL STATEMENTS (continued)
At December 31, 2007
(all amounts in thousands)
NOTE 1. – (continued)
Securities lending: The Fund may lend securities to qualified borrowers, with State Street acting as the Fund’s lending agent. The Fund earns negotiated lenders’ fees. The Fund receives cash and/or securities as collateral against the loaned securities. Cash collateral received is invested in short term, interest bearing securities. The Fund monitors the market value of securities loaned on a daily basis and requires collateral in an amount at least equal to the value of the securities loaned. Income from loaned securities on the Statement of Operations is net of fees, in the amount of $124, earned by State Street for its services.
The Fund has invested the cash collateral received from securities loaned in the following short-term, interest-bearing securities:
Abbey National PLC, Eurodollar Term, 5.00%, 1/7/2008 | | $ | 1,025 | |
ABN AMRO Bank NV, Eurodollar Term, 5.18%, 1/4/2008 | | 820 | |
Bank of Nova Scotia, Eurodollar Term, 4.96%, 1/22/2008 | | 717 | |
Barclays, Eurodollar Term, 5.00%, 2/12/2008 | | 1,434 | |
BNP Paribas, Eurodollar Term, 5.01%, 1/11/2008 | | 1,332 | |
Calyon, Eurodollar Term, 5.12%, 3/3/2008 | | 307 | |
Credit Suisse First Boston Corp., Repurchase Agreement, 4.60%, 1/2/2008 | | 2,664 | |
Dexia Group, Eurodollar Term, 4.82%, 1/3/2008 | | 1,025 | |
HBOS Halifax Bank of Scotland, Eurodollar Term, 5.15%, 1/2/2008 | | 512 | |
JPMorgan Chase & Co., Eurodollar Term, 5.15%, 2/12/2008 | | 512 | |
Lloyds TSB Bank, Eurodollar Term, 5.15%, 1/24/2008 | | 1,024 | |
Merrill Lynch & Co. (RPG), Repurchase Agreement, 4.60%, 1/2/2008 | | 1,537 | |
Morgan Stanley & Co. (Corp. Repo), Repurchase Agreement, 4.60%, 1/2/2008 | | 4,200 | |
Rabobank Nederland, Eurodollar Term, 5.08%, 1/10/2008 | | 1,229 | |
Reserve Primary Money Market Fund, 4.95% | | 1,093 | |
Royal Bank of Scotland, Eurodollar Term, 5.00%, 2/25/2008 | | 1,229 | |
Societe Generale, Eurodollar Term, 5.15%, 3/3/2008 | | 615 | |
Toronto Dominion Bank, Eurodollar Term, 5.05%, 1/10/2008 | | 1,229 | |
UBS AG, Eurodollar Term, 4.92%, 1/11/2008 | | 717 | |
Wells Fargo, Bank Note, 4.75%, 1/8/2008 | | 512 | |
| | $ | 23,733 | |
Security transactions and investment income: Security transactions are recorded on the trade date. Security gains and losses are calculated on the first-in, first-out basis. Dividend income, if any, is recorded on the ex-dividend date or, in the case of foreign securities, as soon as the Fund is informed of the ex-dividend date. Interest income, including accretion of discounts and amortization of premiums, is recorded on the accrual basis commencing on the settlement date.
Foreign currency denominated investments: The accounting records of the Fund are maintained in U.S. dollars. Securities and other assets and liabilities denominated in foreign currencies are translated into U.S. dollars at the closing exchange rate each day. The cost of foreign securities is translated at the exchange rate in effect when the investment was acquired. The Fund combines fluctuations from currency exchange rates and fluctuations in value when computing net realized and unrealized gains or losses from investments.
Net foreign currency gains and losses resulting from changes in exchange rates include: 1) foreign currency fluctuations between trade date and settlement date of investment security transactions; 2) gains and losses on forward foreign currency contracts; and 3) the difference between the receivable amounts of interest and dividends recorded in the accounting records in U.S. dollars and the amounts actually received.
Foreign currency denominated assets may involve risks not typically associated with domestic transactions. These risks include revaluation of currencies, adverse fluctuations in foreign currency values and possible adverse political, social and economic developments, including those particular to a specific industry, country or region.
Foreign capital gains taxes: The Fund may be subject to taxes imposed by countries in which it invests, with respect to its investment in issuers existing or operating in such countries. Such taxes are generally based on income earned or repatriated and capital gains realized on the sale of such investments. The Fund accrues such taxes when the related income or capital gains are earned. Some countries require governmental approval for the repatriation of investment income, capital or the proceeds of sales earned by foreign investors. In addition, if there is deterioration in a country’s balance of payments or for other reasons, a country may impose temporary restrictions on foreign capital remittances abroad.
Forward foreign currency contracts: The Fund may enter into forward foreign currency contracts to hedge against exchange rate risk arising from investments in securities denominated in foreign currencies. Contracts are valued at the contractual forward rate and are marked to market daily, with the change in value recorded as an unrealized gain or loss. When the contracts are settled a realized gain or loss is incurred. Risks may arise from changes in market value of the underlying currencies and from the possible inability of counterparties to meet the terms of their contracts.
Open forward foreign currency contracts at December 31, 2007 are listed in the Schedule of Investments.
Dividend distributions: Dividends and capital gains distributions are typically declared and reinvested annually and are generally paid and reinvested on the business day following the ex-date.
NOTE 2. | | RELATED PARTY TRANSACTIONS |
ATST serves as a funding vehicle for certain affiliated asset allocation portfolios and certain affiliated separate accounts of Western Reserve Life Assurance Co. of Ohio, Transamerica Life Insurance Company, Transamerica Financial Life Insurance Company, Inc., Monumental Life Insurance Company and Transamerica Occidental Life Insurance Company.
Transamerica Fund Advisors, Inc. (“TFAI”) is the Fund’s investment adviser. Transamerica Fund Services, Inc. (“TFS”) is the Fund’s administrator and transfer agent. Prior to May 1, 2007, AFSG Securities Corp. (“AFSG”), was the Fund’s distributor. Transamerica Capital Inc. (“TCI”) is now the Fund’s distributor. TFAI, TFS, AFSG and TCI are affiliates of AEGON NV, a Netherlands corporation.
13
NOTES TO FINANCIAL STATEMENTS (continued)
At December 31, 2007
(all amounts in thousands)
NOTE 2. – (continued)
Transamerica Investment Management, LLC (“TIM”) is an affiliate of the Fund and is a sub-adviser to other funds within ATST.
Certain officers and trustees of the Fund are also officers and/or directors of TFAI, TFS and TCI.
Investment advisory fees: The Funds pay management fees to TFAI based on average daily net assets (“ANA”) at the following breakpoints:
0.75% of the first $500 million of ANA
0.725% of the next $1 billion of ANA
0.70% of ANA over $1.5 billion
TFAI has contractually agreed to waive its advisory fee and will reimburse the Fund to the extent that operating expenses, excluding 12b-1 fees, exceed the following stated annual limit:
1.00% Expense Limit
If total Fund expenses fall below the annual expense limitation agreement agreed to by the adviser within the succeeding three years, the Fund may be required to pay the adviser a portion or all of the waived advisory fees.
There were no amounts recaptured during the year ended December 31, 2007. There are no amounts available for recapture at December 31, 2007.
Distribution and service fees: ATST entered into a Distribution Agreement with AFSG dated January 1, 1997, as amended. On May 1, 2007, the Distribution Agreement was amended to replace AFSG with TCI as the Fund’s distributor. The Fund has also adopted a distribution plan (“Distribution Plan”) pursuant to Rule 12b-1 under the 1940 Act.
Under the Distribution Plan for the Initial Class shares, TCI, on behalf of the Fund, is authorized to pay various service providers, as direct payment for expenses incurred in connection with distribution of the Fund’s shares, amounts equal to actual expenses associated with distributing the shares.
The Distribution Plan for the Service Class shares requires ATST to pay distribution fees to TCI as compensation for its activities, not as reimbursement for specific expenses. The fee on the Service Class is paid to the insurance companies for providing services and account maintenance for their policyholders who invest in the variable insurance products which invest in the Service Class shares.
The Fund is authorized under the Distribution Plan to pay fees on each class up to the following limits:
Initial Class | | 0.15 | % |
Service Class | | 0.25 | % |
TCI has determined that it will not seek payment by the Fund of the distribution expenses incurred with respect to the Initial Class shares before April 30, 2009. Prior to TCI seeking reimbursement of future expenses, policy and contract owners will be notified in advance. The Fund will pay fees relating to Service Class shares.
Administrative services: The Fund has entered into an agreement with TFS for financial and legal fund administration services. The Fund pays TFS an annual fee of 0.02% of ANA. The Legal fees on the Statement of Operations are for fees paid to external legal counsel.
Deferred compensation plan: Each eligible independent Fund Trustee may elect participation in a non-qualified deferred compensation plan (“the Plan”). Under the Plan, such Trustees may defer payment of all or a portion of their total fees earned as a Fund Trustee. Each Trustee who is a participant in the Plan may elect that the earnings, losses or gains credited to his or her deferred fee amounts be determined based on a deemed investment in any series of Transamerica IDEX Mutual Funds. The right of a participant to receive a distribution from the Plan of the deferred fees is an unsecured claim against the general assets of all series of Transamerica IDEX Mutual Funds. The pro rata liability to the Fund of all deferred fees in the Plan amounted, as of December 31, 2007, to $31. Amounts deferred under the Deferred Compensation Plan are unfunded against the general assets of ATST.
Retirement plan: Under a retirement plan (the “Emeritus Plan”) available to the Independent Trustees, each Independent Trustee is deemed to have elected to serve as Trustee Emeritus of ATST upon his or her termination of service, other than removal for cause, is entitled to 50% of the trustee’s current retainer for a maximum period of five years determined by his or her years of service as a Trustee.
Such amounts shall be accrued by ATST on a pro rata basis allocable to each ATST fund based on the relative assets of the fund. If retainers increase in the future, past accruals (and credits) will be adjusted upward so that 50% of the Trustee’s current retainer is accrued and credited at all times. Upon death, disability or termination of service, other than removal for cause, amounts deferred become payable to an Emeritus Trustee (or his/her beneficiary). Upon the commencement of service as Trustee Emeritus, compensation will be paid on a quarterly basis during the time period that the Trustee Emeritus is allowed to serve as such.
Amounts accrued under the Emeritus Plans are unsecured claims against the general assets of ATST. For the year ended December 31, 2007, the amount related to the Emeritus Plan was $24. As of December 31, 2007, the Fund has not made any payments related to the Emeritus Plan.
The Emeritus Plan was terminated effective October 30, 2007. Upon the termination, the Fund shall continue to pay any remaining benefits in accordance with the Plan, but no further compensation shall accrue under the Plan.
14
NOTES TO FINANCIAL STATEMENTS (continued)
At December 31, 2007
(all amounts in thousands)
NOTE 3. | INVESTMENT TRANSACTIONS |
The cost of securities purchased and proceeds from securities sold (excluding short-term securities) for the year ended December 31, 2007 were as follows:
Purchases of securities: | | | |
Long-term | | $ | 210,558 | |
U.S. Government | | — | |
Proceeds from maturities and sales of securities: | | | |
Long-term | | 272,412 | |
U.S. Government | | — | |
| | | | |
NOTE 4. | FEDERAL INCOME TAX MATTERS |
The Fund has not made any provision for federal income or excise taxes due to its policy to distribute all of its taxable income and capital gains to its shareholders and otherwise qualify as a regulated investment company under Subchapter M of the Internal Revenue Code. Income and capital gain distributions are determined in accordance with income tax regulations, which may differ from GAAP. These differences are primarily due to differing treatment for items including, but not limited to, wash sales, passive foreign investment companies, post October loss deferrals, foreign currency transactions and capital loss carryforwards.
Therefore, distributions determined in accordance with tax regulations may differ significantly in amount or character from net investment income and realized gains for financial reporting purposes. Financial reporting records are adjusted for permanent book/tax differences to reflect tax character. Financial records are not adjusted for temporary differences. These reclassifications are as follows:
Additional paid-in capital | | $ | — | |
Undistributed (accumulated) net investment income (loss) | | $ | 380 | |
Undistributed (accumulated) net realized gain (loss) from investment securities | | $ | (380 | ) |
The capital loss carryforwards are available to offset future realized capital gains through the periods listed:
Capital Loss
Carryforwards | | Available Through | |
| | | |
$ | 45,010 | | December 31, 2011 | |
| | | |
$ | 190,887 | | December 31, 2010 | |
The capital loss carryforward utilized during the year ended December 31, 2007 was $49,933.
The tax character of distributions paid may differ from the character of distributions shown in the Statements of Changes in Net Assets due to short-term gains being treated as ordinary income for tax purposes. The tax character of distributions paid during 2006 and 2007 was as follows:
2006 Distributions paid from: | | | |
Ordinary Income | | $ | 7,456 | |
Long-term Capital Gain | | — | |
2007 Distributions paid from: | | | |
Ordinary Income | | 9,532 | |
Long-term Capital Gain | | — | |
| | | | |
The tax basis components of distributable earnings as of December 31, 2007 are as follows:
Undistributed Ordinary Income | | $ | 8,911 | |
Undistributed Long-term Capital Gain | | $ | — | |
Capital Loss Carryforward | | $ | (235,897 | ) |
Post October Capital Loss Deferral | | $ | — | |
Post October Currency Loss Deferral | | $ | (7 | ) |
Net Unrealized Appreciation (Depreciation) | | $ | 149,232 | |
NOTE 5. | REGULATORY PROCEEDINGS |
There continues to be significant federal and state regulatory activity relating to financial services companies, particularly mutual fund companies and their investment advisers. As part of an ongoing investigation regarding potential market timing, recordkeeping and trading compliance issues and matters affecting the Fund’s investment adviser, TFAI, and certain affiliates and former employees of TFAI, the SEC staff has indicated that it is likely to take some action against TFAI and certain of its affiliates at the conclusion of the investigation. The potential timing and the scope of any such action is difficult to predict. Although the impact of any action brought against TFAI and/or its affiliates is difficult to assess at the present time, the Fund currently believes that the likelihood that any such action will have a material adverse impact is remote. It is important to note that the Fund is not aware of any allegation of wrongdoing against it and its Board at the time this annual report is printed. Although it is not anticipated that these developments will have an adverse impact on the Fund, there can be no assurance at this time. TFAI and its affiliates are actively working with the SEC in regard to this matter; however, the exact resolution cannot be determined at this time. TFAI will take such actions that it deems necessary or appropriate to continue providing management services to the Fund and to bring all matters to an appropriate conclusion.
TFAI and/or its affiliates, and not the Fund, will bear the costs regarding these regulatory matters.
15
NOTES TO FINANCIAL STATEMENTS (continued)
At December 31, 2007
(all amounts in thousands)
NOTE 5. | RECENTLY ISSUED ACCOUNTING PRONOUNCEMENTS |
In July 2006, the Financial Accounting Standards Board (“FASB”) released FASB Interpretation No. 48 “Accounting for Uncertainty in Income Taxes” (“FIN 48”), an interpretation of FASB Statement No. 109. FIN 48 provides guidance for how uncertain tax positions should be recognized, measured, presented and disclosed in the financial statements. FIN 48 requires the accounting and disclosure of tax positions taken or expected to be taken in the course of preparing the Fund’s tax returns to determine whether the tax positions are “more-likely-than-not” of being sustained by the applicable tax authority. Tax positions not deemed to meet the more-likely-than-not threshold would be recorded as a tax benefit or expense in the current year.
Adoption of FIN 48 is effective during the first required financial reporting period for fiscal years beginning after December 15, 2006. Management adopted FIN 48 on June 29, 2007.
Implementation of FIN 48 requires Management of the Fund to analyze all open tax years, as defined by the Statute of Limitations, for all major jurisdictions, which includes federal and certain states. Open tax years are those that are open for exam by taxing authorities (i.e., the last 4 tax year ends and the interim tax period since then). The Fund has no examinations in progress and none are expected at this time.
Management of the Fund has reviewed all open tax years and major jurisdictions and concluded the adoption of FIN 48 resulted in no impact to the Fund’s net assets or results of operations. There is no tax liability resulting from unrecognized tax benefits relating to uncertain income tax positions taken or expected to be taken in future tax returns. The Fund is also not aware of any tax positions for which it is reasonably possible that the total amounts of unrecognized tax benefits will significantly change in the next 12 months.
In September 2006, FASB issued its new Standard No. 157, “Fair Value Measurements” (“FAS 157”). FAS 157 is designed to unify guidance for the measurement of fair value of all types of assets, including financial instruments, and certain liabilities, throughout a number of accounting standards. FAS 157 also establishes a hierarchy for measuring fair value in generally accepted accounting principles and expands financial statement disclosures about fair value measurements that are relevant to mutual funds. FAS 157 is effective for financial statements issued for fiscal years beginning after November 15, 2007, and earlier application is permitted.
As of December 31, 2007, Management does not expect the adoption of FAS 157 to impact the amounts reported in the financial statements, however, additional disclosures will be required about the inputs used to develop the measurements of fair value and the effect of certain of the measurements reported in the statement of operations for a fiscal period.
Effective January 1, 2008, TFAI changed its name to Transamerica Asset Management, Inc.
Effective May 1, 2008, AEGON/Transamerica Series Trust will change its name to Transamerica Series Trust. At that time, the Fund will also change its name to Transamerica Templeton Global VP.
16
Report of Independent Registered Certified Public Accounting Firm
To the Board of Trustees and Shareholders of
Templeton Transamerica Global:
In our opinion, the accompanying statement of assets and liabilities, including the schedule of investments, and the related statements of operations and of changes in net assets and the financial highlights present fairly, in all material respects, the financial position of Templeton Transamerica Global (the “Fund”) (one of the portfolios constituting AEGON/Transamerica Series Trust) at December 31, 2007, the results of its operations for the year then ended, the changes in its net assets for each of the two years in the period then ended and the financial highlights for each of the periods presented, in conformity with accounting principles generally accepted in the United States of America. These financial statements and financial highlights (hereafter referred to as “financial statements”) are the responsibility of the Fund’s management; our responsibility is to express an opinion on these financial statements based on our audits. We conducted our audits of these financial statements in accordance with the standards of the Public Company Accounting Oversight Board (United States). Those standards require that we plan and perform the audit to obtain reasonable assurance about whether the financial statements are free of material misstatement. An audit includes examining, on a test basis, evidence supporting the amounts and disclosures in the financial statements, assessing the accounting principles used and significant estimates made by management, and evaluating the overall financial statement presentation. We believe that our audits, which included confirmation of securities at December 31, 2007 by correspondence with the custodian and brokers, provide a reasonable basis for our opinion.

Tampa, Florida
February 29, 2008
17
Templeton Transamerica Global
RESULTS OF SHAREHOLDER PROXY (unaudited)
At a special meeting of shareholders held on October 30, 2007, the results of the Proposals were as follows:
Proposal 1: To elect a new Board:
Proposed
Trustee | | For | | Against | | Abstentions/Broker Non-
Votes | |
John K. Carter | | 2,274,998,840.817 | | 57,804,698.755 | | 35,433.883 | |
| | | | | | | |
Leo J. Hill | | 2,277,212,702.754 | | 55,590,836.819 | | 35,433.883 | |
| | | | | | | |
Neal M. Jewell | | 2,266,793,295.663 | | 66,010,243.909 | | 35,433.883 | |
| | | | | | | |
Russell A. Kimball, Jr. | | 2,274,825,235.835 | | 57,978,303.737 | | 35,433.883 | |
| | | | | | | |
Eugene M. Mannella | | 2,274,623,165.033 | | 58,180,374.539 | | 35,433.883 | |
| | | | | | | |
Norm R. Nielsen | | 2,275,050,055.885 | | 57,753,483.687 | | 35,433.883 | |
| | | | | | | |
Joyce Galpern Norden | | 2,270,278,122.250 | | 62,525,417.323 | | 35,433.883 | |
| | | | | | | |
Patricia L. Sawyer | | 2,275,737,737.456 | | 57,065,802.116 | | 35,433.883 | |
| | | | | | | |
John W. Waechter | | 2,276,615,120.140 | | 56,188,419.433 | | 35,433.883 | |
Proposal 2: To approve an amendment to the Agreement and Declaration of Trust:
For | | Against | | Abstentions/Broker Non-
Votes | |
2,182,022,669.110 | | 77,590,048.544 | | 73,226,255.801 | |
18
Templeton Transamerica Global
INVESTMENT ADVISORY AND SUB-ADVISORY AGREEMENTS-REVIEW AND RENEWAL (unaudited)
At a meeting of the Board of Trustees of AEGON/Transamerica Series Trust (“ATST”) held on December 4th, 2007, the Board reviewed and considered the renewal of the investment advisory agreement (the “Investment Advisory Agreement”) between Templeton Transamerica Global (the “Fund”) and Transamerica Fund Advisors, Inc. (“TFAI”), as well as the renewal of the investment sub-advisory agreement (the “Sub-Advisory Agreement”) of the Fund between TFAI and Templeton Investment Counsel, LLC (the “Sub-Adviser”), to determine whether the agreements should be renewed for a six-month period. It also was noted that this review was interim in nature to align all the Funds on the same calendar, and that the Funds’ advisory arrangements would be reviewed again in the first half of 2008.
Following their review and consideration, the Trustees determined that the renewal of the Investment Advisory Agreement and the Sub-Advisory Agreement would enable shareholders of the Fund to obtain high quality services at a cost that is appropriate, fair, and in the best interests of its shareholders. The Board, including the independent members of the Board, unanimously approved the renewal of the Investment Advisory Agreement and Sub-Advisory Agreement. In reaching their decision, the Trustees requested and obtained from TFAI and the Sub-Adviser such information as they deemed reasonably necessary to evaluate the agreements, including information about fees and performance of comparable funds managed by the Sub-Adviser. The Trustees also carefully considered information they had previously received from TFAI and the Sub-Adviser throughout the year as part of their regular oversight of the Fund, as well as comparative fee, expense, and performance information prepared by Lipper Inc. (“Lipper”), an independent provider of mutual fund performance, fee and expense information and profitability data prepared by management. In considering the proposed continuation of the Investment Advisory and Sub-Advisory Agreement, the Trustees evaluated a number of considerations that they believed, in light of the legal advice furnished to them by independent legal counsel and their own business judgment, to be relevant. They based their decisions on a variety of factors, including the following considerations, among others, although they did not identify any consideration or particular information that was controlling of their decisions:
The nature, extent and quality of the advisory services to be provided. The Board considered the nature and quality of the services provided by TFAI and the Sub-Adviser to the Fund in the past, as well as the services anticipated to be provided in the future. The Board concluded that TFAI and the Sub-Adviser are capable of providing high quality services to the Fund, as indicated by the nature and quality of services provided in the past by TFAI and the Sub-Adviser for this series and the experience, capability and integrity of TFAI’s senior management, the financial resources of TFAI and the Sub-Adviser, TFAI’s management oversight process and the professional qualifications of the portfolio management team of the Sub-Adviser. The Trustees determined that TFAI and the Sub-Adviser can provide investment and related services that are appropriate in scope and extent in light of the Fund’s operations, the competitive landscape of the investment company business and investor needs.
The investment performance of the Fund. The Board examined the short and longer-term performance of the Fund, including relative performance against a peer universe of comparable mutual funds as prepared by Lipper for various trailing periods ended June 30, 2007. The Trustees noted that the performance of the Fund was above the median for its peer universe for the past 1-year period, but below the median for the past 3- and 5-year periods. The Trustees recognized that the longer-term underperformance can be attributed to the Fund’s prior sub-advisers of the domestic portion of the Fund, noting that Transamerica Investment Management, Inc. only recently took over the management of the domestic portion of the Fund. On the basis of the Board’s assessment of the nature, extent and quality of advisory services to be provided or procured by TFAI and the Sub-Adviser, the Board concluded that TFAI and the Sub-Adviser are capable of providing a level of investment performance that is appropriate in light of the Fund’s proposed investment objectives, policies and strategies and competitive with other similarly situated investment companies, but that the Board would be monitoring performance closely.
The cost of advisory services provided and the level of profitability. The Board reviewed profitability information of TFAI’s cost of procuring fund management services, as well as the costs of provision of administration, fund accounting and other services, to the Fund and to ATST as a whole by TFAI and its affiliates. The Board reviewed the management and sub-advisory fees for the Fund. The Trustees noted that the Fund’s contractual management fees were just above the median for its peer group and above the median for the peer universe, but that the total expenses of the Fund were below the medians for its peer group and peer universe. Based on their review, the Trustees determined that the management fees of the Fund generally are appropriate in light of the services expected to be provided or procured, the management fees and the anticipated profitability of the relationship between the Fund, TFAI and its affiliates, and the Sub-Adviser. In making these observations and determinations, the Board reviewed, among other things, comparative information provided by Lipper.
Whether fee levels reflect economies of scale and the extent to which economies of scale would be realized as the Fund grows. In evaluating the extent to which the management fees payable under the Investment Advisory and Sub-Advisory Agreements reflect economies of scale or will permit economies of scale to be realized in the future, the Board noted that TFAI and the Sub-Adviser offer breakpoints which appropriately benefit investors by passing on economies of scale in the form of lower management fees as the level of assets grows. The Trustees also concluded that they will have the opportunity to periodically reexamine whether the Fund has achieved economies of scale, and the appropriateness of management fees payable to TFAI and fees paid to the Sub-Adviser, in the future.
Benefits (such as soft dollars) to TFAI, its affiliates, or the Sub-Adviser from their relationship with the Fund. The Board concluded that other benefits anticipated to be derived by TFAI, its affiliates, and the Sub-Adviser from their relationships with the Fund are expected to be reasonable and fair, and consistent with industry practice and the best interests of the Fund and its shareholders. The Trustees noted that TFAI would not realize soft dollar benefits from its relationship with the Fund, and that the Sub-Adviser’s soft dollar trading is consistent with applicable law, including best execution requirements in particular. The Board also noted that the Sub-Adviser is participating in a brokerage program pursuant to which a portion of brokerage commissions paid by the Fund is recaptured for the benefit of the Fund and its shareholders, thus limiting the amount of soft dollar arrangements the Sub-Adviser may engage in with respect to the Fund’s brokerage transactions.
19
Other considerations. The Board determined that TFAI has made a substantial commitment to the recruitment and retention of high quality personnel, and maintains the financial, compliance and operational resources reasonably necessary to manage the Fund in a professional manner that is consistent with the best interests of the Fund and its shareholders. In this regard, the Trustees favorably considered the procedures and policies in place by TFAI to enforce compliance with applicable laws and regulations and oversee the portfolio management activities of the Sub-Adviser. The Trustees also determined that TFAI has made a significant entrepreneurial commitment to the management and success of the Fund, reflected by TFAI’s expense limitation and fee waiver arrangements with the Fund which may result in TFAI waiving a substantial amount of management fees for the benefit of shareholders. With respect to the Sub-Adviser, the Trustees noted that the Sub-Adviser’s trading costs generally had been lower than their peers for the previous four quarters.
20
Third Avenue Value
MARKET ENVIRONMENT
While international markets, particularly in Asia, remain strong and continue to offer attractive growth prospects for the portfolio, the securities market in the U.S. is now in the midst of a real credit crisis. The crisis appears most severe for those companies which require access to the capital markets – whether debt or equity—on a regular basis. These are not the types of companies in which Third Avenue Value generally invests. We restrict our investments to securities of well–capitalized companies, which we consider to be reasonably well-managed and attractively priced at the time of our purchase. We invest for the long term and believe the current market dislocation has created attractive buying opportunities.
PERFORMANCE
For the year ended December 31, 2007, Third Avenue Value, Initial Class returned 1.20% By comparison its benchmark, the Russell 3000 Value Index, returned (1.01)%.
STRATEGY REVIEW
Our strategy does not change, regardless of general macro conditions and we do not manage portfolios in response to near-term market conditions. We remain opportunistic in the current market environment, focusing on attractively-priced issues of companies with robust balance sheets and strong management teams. We remain pleased with the overall quality of the portfolio and the business fundamentals of our holdings.
Korean steel maker POSCO was the portfolio’s top contributor for the calendar year as it was positively impacted by strong steel prices and a favorable global demand environment. This was followed by Canadian exploration and production company EnCana Corporation (which has benefited from a strong commodity environment in Energy). Hang Lung Properties Limited, Cheung Kong (Holdings) Limited and Henderson Land Development Company Limited were also among the top contributors, as they were positively influenced by favorable market conditions in Hong Kong, particularly in real estate.
On the downside, the portfolio was negatively impacted by declines in MBIA Inc., Ambac Financial Group, Inc., Forest City Enterprises, Inc. and The St. Joe Company, all of which have seen deterioration amid the recent credit crunch and mortgage upheaval in the U.S. Despite the macro environment, we believe our holdings remain well-capitalized and well-managed with valuations that have become even more compelling. Lexmark International, Inc. was another detractor, as the company has faced competitive headwinds and is now undergoing a restructuring process.
With regard to industries, on the positive side, materials (steel in particular) and select real estate stocks contributed to the portfolio’s performance, while the financial sector created the most notable negative impact on performance.
The countries that had greatest impact on the portfolio were Korea and Hong Kong (the Asia region), which had the most beneficial impact. On the downside, the U.S. market detracted from performance.
Ian Lapey
Curtis R. Jensen
Kathleen Crawford
Co-Portfolio Managers
Third Avenue Management LLC
AEGON/Transamerica Series Trust | | | | Annual Report 2007 |
1
Third Avenue Value
(unaudited)
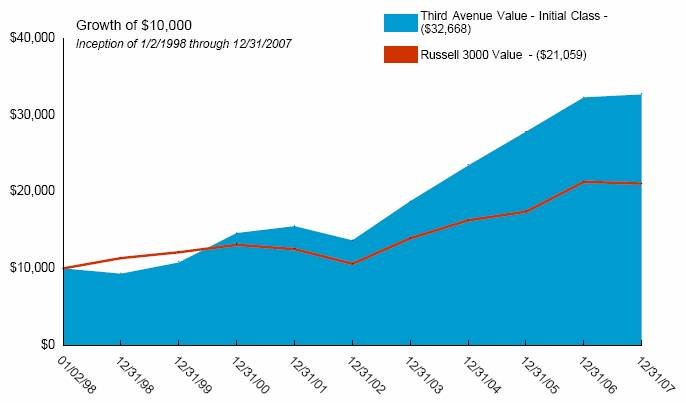
Average Annual Total Return for Periods Ended 12/31/2007
| | 1 Year | | 5 Years | | From
Inception | | Inception
Date | |
| | | | | | | | | |
Initial Class | | 1.20 | % | 19.04 | % | 12.57 | % | 1/2/98 | |
Russell 3000 Value (1) | | (1.01 | )% | 14.69 | % | 7.73 | % | 1/2/98 | |
| | | | | | | | | |
Service Class | | 0.94 | % | — | % | 19.98 | % | 5/1/03 | |
NOTES
(1) The Russell 3000 Value (Russell 3000 Value) Index is an unmanaged index used as a general measure of market performance. Calculations assume dividends and capital gains are reinvested and do not include any managerial expenses.
The performance data presented represents past performance, future results may vary. The portfolio’s investment return and net asset value will fluctuate. Past performance does not guarantee future results. Investor’s units when redeemed, may be worth more or less than their original cost.
Current performance may be lower or higher than performance quoted. Please visit your insurance company’s website for contract or policy level standardized total returns current to the most recent month end. Portfolio performance is net of investment fees and fund expenses, but not product charges, which, if included, would significantly lower the performance quoted.
Investments in a “non-diversified” portfolio may be subject to specific risks such as susceptibility to single economic, political, or regulatory events, and may be subject to greater loss than investments in a diversified portfolio.
This material must be preceded or accompanied by a current prospectus, which includes specific contents regarding the investment objectives, explanation of share classes and policies of this portfolio.
2
Third Avenue Value
UNDERSTANDING YOUR FUNDS EXPENSES
(unaudited)
SHAREHOLDER EXPENSES
Fund shareholders may incur ongoing costs, including management and advisory fees, distribution and service fees, and other fund expenses.
The following Example is intended to help you understand your ongoing costs (in dollars and cents) of investing in the Fund and to compare these costs with the ongoing costs of investing in other funds.
The Example is based on an investment of $1,000 invested at July 1, 2007 and held for the entire period until December 31, 2007.
ACTUAL EXPENSES
The first line in the table below provides information about actual account values and actual expenses. You may use the information in this line, together with the amount you invested, to estimate the expenses that you paid over the period. Simply divide your account value by $1,000 (for example, an $8,600 account value divided by $1,000 = 8.6), then multiply the result by the number in the first line of your Fund under the heading entitled “Expenses Paid During Period” to estimate the expenses you paid on your account during this period.
HYPOTHETICAL EXAMPLE FOR COMPARISON PURPOSES
The second line in the table below provides information about hypothetical account values and hypothetical expenses based on the Fund’s actual expense ratio and an assumed rate of return of 5% per year before expenses, which is not the Fund’s actual return. The hypothetical account values and expenses may not be used to estimate the actual ending account balance or expenses you paid for the period. You may use this information to compare the ongoing costs of investing in your Fund and other funds. To do so, compare this 5% hypothetical example with the 5% hypothetical examples that appear in the shareholder reports of the other funds.
Please note that the expenses shown in the table are meant to highlight your ongoing costs only and do not reflect any transactional costs, such as sales charges, redemption fees, brokerage commissions paid on purchases and sales of fund shares. Therefore, the second line under the Fund in the table is useful in comparing ongoing costs only, and will not help you determine the relative total costs of owning different funds. If any of these transaction costs were included, your costs would be higher. The expenses shown in the table do not reflect any fees that may be charged to you by brokers, financial intermediaries or other financial institutions.
| | Beginning
Account
Value | | Ending
Account
Value | | Annualized
Expense
Ratio | | Expenses
Paid During
Period (a) | |
Initial Class | | | | | | | | | |
Actual | | $ | 1,000.00 | | $ | 935.62 | | 0.87 | % | $ | 4.24 | |
Hypothetical (b) | | 1,000.00 | | 1,020.77 | | 0.87 | | 4.43 | |
| | | | | | | | | |
Service Class | | | | | | | | | |
Actual | | 1,000.00 | | 934.12 | | 1.12 | | 5.46 | |
Hypothetical (b) | | 1,000.00 | | 1,019.56 | | 1.12 | | 5.70 | |
| | | | | | | | | | | | |
(a) Expenses are calculated using the Fund’s annualized expense ratio (as disclosed in the table), multiplied by the average account value for the period, multiplied by the number of days in the period (184 days), and divided by the number of days in the year (365 days).
(b) 5% return per year before expenses.
GRAPHICAL PRESENTATION OF SCHEDULE OF INVESTMENTS
By Sector
At December 31, 2007
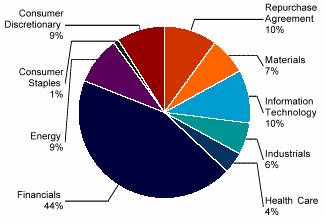
This chart shows the percentage breakdown by sector of the Fund’s total investment securities
3
Third Avenue Value
SCHEDULE OF INVESTMENTS
At December 31, 2007
(all amounts except share amounts in thousands)
| | Shares | | Value | |
COMMON STOCKS (90.6%) | | | | | |
Bermuda (3.4%) | | | | | |
Arch Capital Group, Ltd. ‡ | | 96,456 | | $ | 6,786 | |
Montpelier RE Holdings, Ltd. ^ | | 178,339 | | 3,034 | |
Nabors Industries, Ltd. ‡ | | 156,135 | | 4,276 | |
Canada (14.4%) | | | | | |
Brookfield Asset Management, Inc. Class A | | 485,176 | | 17,306 | |
Canfor Corp. ‡ | | 792,177 | | 7,007 | |
Canfor Pulp Income Fund | | 117,704 | | 1,312 | |
E-L Financial Corp., Ltd. | | 3,796 | | 2,115 | |
EnCana Corp. | | 239,000 | | 16,243 | |
Power Corp. of Canada | | 276,436 | | 11,240 | |
Timberwest Forest Corp. | | 262,500 | | 3,910 | |
Hong Kong (12.3%) | | | | | |
Cheung Kong Holdings, Ltd. ‡ | | 744,847 | | 13,775 | |
Chong Hing Bank, Ltd. | | 1,103,360 | | 2,623 | |
Hang Lung Group, Ltd. | | 304,308 | | 1,663 | |
Hang Lung Properties, Ltd. | | 1,351,251 | | 6,117 | |
Henderson Land Development Co., Ltd. | | 1,077,462 | | 10,149 | |
Hutchison Whampoa International, Ltd. ‡ | | 1,103,912 | | 12,522 | |
Wharf Holdings, Ltd. ‡ | | 712,116 | | 3,731 | |
Japan (10.7%) | | | | | |
AIOI Insurance Co., Ltd. | | 336,773 | | 1,590 | |
Daiichi Sankyo Co., Ltd. | | 206,514 | | 6,354 | |
Millea Holdings, Inc. | | 277,650 | | 9,321 | |
Mitsui Fudosan Co., Ltd. | | 229,538 | | 4,950 | |
Mitsui Sumitomo Insurance Co., Ltd. | | 334,827 | | 3,242 | |
Sapporo Breweries ^ | | 738,000 | | 5,942 | |
Toyota Industries Corp. | | 305,193 | | 12,374 | |
Korea, Republic of (4.1%) | | | | | |
POSCO ^ | | 111,839 | | 16,822 | |
Norway (0.5%) | | | | | |
Bw Gas ASA | | 181,506 | | 1,838 | |
Sweden (1.5%) | | | | | |
Investor AB Class A | | 283,254 | | 6,230 | |
United States (43.7%) | | | | | |
Alamo Group, Inc. | | 171,129 | | 3,101 | |
Alexander & Baldwin, Inc. ^ | | 53,233 | | 2,750 | |
Alliance Data Systems Corp. ‡^ | | 72,750 | | 5,455 | |
AMBAC Financial Group, Inc. | | 78,405 | | 2,020 | |
Applied Materials, Inc. | | 130,039 | | 2,309 | |
AVX Corp. ^ | | 541,695 | | 7,270 | |
Bank of New York Mellon Corp. | | 456,559 | | 22,262 | |
BEL Fuse, Inc. Class A | | 53,873 | | 1,858 | |
BEL Fuse, Inc. Class B | | 25,806 | | 755 | |
Borland Software Corp. ‡^ | | 538,973 | | 1,622 | |
Brookline Bancorp, Inc. | | 261,198 | | 2,654 | |
Capital Southwest Corp. | | 13,685 | | 1,620 | |
Cimarex Energy Co. | | 262,804 | | 11,177 | |
CIT Group, Inc. | | 81,083 | | 1,948 | |
Cross Country Healthcare, Inc. ‡ | | 175,994 | | 2,506 | |
Electro Scientific Industries, Inc. ‡ | | 160,398 | | 3,184 | |
Forest City Enterprises, Inc. Class A | | 191,423 | | $ | 8,507 | |
Handleman Co. ‡ | | 506,849 | | 867 | |
IDT Corp. Class B ^ | | 256,314 | | 2,166 | |
Intel Corp. | | 239,039 | | 6,373 | |
Jakks Pacific, Inc. ‡ | | 128,997 | | 3,046 | |
Leapfrog Enterprises, Inc. Class A ‡^ | | 540,651 | | 3,639 | |
Legg Mason, Inc. | | 111,479 | | 8,155 | |
Lexmark International, Inc. Class A ‡ | | 114,292 | | 3,984 | |
Liberty Media Corp. - Capital Series A, Class A ‡ | | 19,904 | | 2,319 | |
Liberty Media Corp. - Interactive Class A ‡ | | 99,519 | | 1,899 | |
MBIA, Inc. | | 165,801 | | 3,089 | |
MDC Holdings, Inc. | | 125,732 | | 4,668 | |
MGIC Investment Corp. | | 105,000 | | 2,355 | |
NewAlliance Bancshares, Inc. ^ | | 335,115 | | 3,860 | |
Pfizer, Inc. | | 340,577 | | 7,741 | |
Phoenix Cos., Inc. (The) | | 151,491 | | 1,798 | |
ProLogis REIT | | 38,289 | | 2,427 | |
Radian Group, Inc. | | 210,162 | | 2,455 | |
St Joe Co. (The) ^ | | 157,071 | | 5,578 | |
St. Mary Land & Exploration Co. | | 83,502 | | 3,224 | |
Superior Industries International, Inc. ^ | | 387,482 | | 7,041 | |
Sycamore Networks, Inc. ‡ | | 983,179 | | 3,775 | |
Tejon Ranch Co. ‡^ | | 60,731 | | 2,481 | |
Tellabs, Inc. ‡ | | 466,171 | | 3,049 | |
Trinity Industries, Inc. ^ | | 105,744 | | 2,935 | |
USG Corp. ‡^ | | 126,234 | | 4,518 | |
Westwood Holdings Group, Inc. | | 126,622 | | 4,761 | |
Total Common Stocks (cost $285,427) | | | | 371,673 | |
| | Principal | | Value | |
REPURCHASE AGREEMENTS (9.6%) | | | | | |
United States (9.6%) | | | | | |
State Street Repurchase Agreement £ 2.55%, dated 12/31/2007 to be repurchased at $39,616 on 01/02/2008 ± | | $ | 39,611 | | $ | 39,611 | |
Total Repurchase Agreements (cost $39,611) | | | | 39,611 | |
| | | | | |
Total Securities Lending Collateral (cost $68,776) (1) | | | | 68,776 | |
| | | | | | | |
| | Shares | | Value | |
RIGHTS (0.0%) | | | | | |
Hong Kong (0.0%) | | | | | |
Wharf Holdings, Ltd. | | 89,014 | | $ | 121 | |
Total Rights (cost $0) | | | | 121 | |
| | | | | |
Total Investment Securities (cost $393,814) # | | | | $ | 480,181 | |
The notes to the financial statements are an integral part of this report.
4
(unaudited) | | Percentage of
Total Investments | | Value | |
INVESTMENTS BY INDUSTRY: | | | | | |
Real Estate Management & Development | | 15.5 | % | $ | 74,379 | |
Insurance | | 9.2 | % | 44,235 | |
Oil, Gas & Consumable Fuels | | 6.8 | % | 32,482 | |
Commercial Banks | | 5.2 | % | 24,885 | |
Auto Components | | 4.0 | % | 19,414 | |
Metals & Mining | | 3.5 | % | 16,822 | |
Capital Markets | | 3.0 | % | 14,536 | |
Pharmaceuticals | | 2.9 | % | 14,096 | |
Industrial Conglomerates | | 2.6 | % | 12,522 | |
Paper & Forest Products | | 2.5 | % | 12,229 | |
Thrifts & Mortgage Finance | | 2.4 | % | 11,324 | |
Electronic Equipment & Instruments | | 2.2 | % | 10,453 | |
Communications Equipment | | 2.0 | % | 9,438 | |
Semiconductors & Semiconductor Equipment | | 1.8 | % | 8,682 | |
Diversified Financial Services | | 1.7 | % | 8,178 | |
Leisure Equipment & Products | | 1.4 | % | 6,684 | |
Machinery | | 1.3 | % | 6,036 | |
Beverages | | 1.2 | % | 5,942 | |
IT Services | | 1.1 | % | 5,456 | |
Household Durables | | 1.0 | % | 4,668 | |
Building Products | | 0.9 | % | 4,518 | |
Energy Equipment & Services | | 0.9 | % | 4,277 | |
Computers & Peripherals | | 0.8 | % | 3,984 | |
Marine | | 0.6 | % | 2,750 | |
Health Care Providers & Services | | 0.5 | % | 2,506 | |
Real Estate Investment Trusts | | 0.5 | % | 2,427 | |
Media | | 0.5 | % | 2,319 | |
Diversified Telecommunication Services | | 0.5 | % | 2,166 | |
Internet & Catalog Retail | | 0.4 | % | 1,899 | |
Software | | 0.3 | % | 1,622 | |
Trading Companies & Distributors | | 0.2 | % | 867 | |
Investment Securities, at value | | 77.4 | % | 371,796 | |
Short-Term Investments | | 22.6 | % | 108,385 | |
Total Investments | | 100.0 | % | $ | 480,181 | |
NOTES TO SCHEDULE OF INVESTMENTS:
^ At December 31, 2007, all or a portion of this security is on loan (see Note 1). The value at December 31, 2007, of all securities on loan is $66,028.
‡ Non-Income Producing.
(1) Cash collateral for the Repurchase Agreements, valued at $24,930, that serve as collateral for securities lending, are invested in corporate bonds with interest rates and maturity dates ranging from 3.00% - 10.18% and 04/28/2008 - 12/01/2096, respectively.
£ State Street serves as the accounting, custody and lending agent for the Fund and provides various administrative functions for the Funds.
± At December 31, 2007, repurchase agreements excluding collateral for securities on loan are collateralized by U.S. Government Agency Obligations with interest rates and maturity dates ranging from 5.18% - 5.38% and 05/15/2036 - 05/25/2036, respectively, and with a market value plus accrued interest of $40,410.
# Aggregate cost for federal income tax purposes is $403,575. Aggregate gross unrealized appreciation for all securities in which there is an excess of value over tax cost and aggregate gross unrealized depreciation for all securities in which there is an excess of tax cost over value were $105,810 and $29,204, respectively. Net unrealized appreciation for tax purposes is $76,606.
DEFINITIONS:
REIT Real Estate Investment Trust
The notes to the financial statements are an integral part of this report.
5
Third Avenue Value
STATEMENT OF ASSETS AND LIABILITIES
At December 31, 2007
(all amounts except per share amounts in thousands)
Assets: | | | |
Investment securities, at value (cost: $393,814) (including securities loaned of $66,028) | | $ | 480,181 | |
Cash | | 108 | |
Receivables: | | | |
Shares sold | | 27 | |
Interest | | 13 | |
Income from loaned securities | | 56 | |
Dividends | | 415 | |
| | 480,800 | |
Liabilities: | | | |
Investment securities purchased | | 961 | |
Accounts payable and accrued liabilities: | | | |
Shares redeemed | | 246 | |
Management and advisory fees | | 284 | |
Distribution and service fees | | 11 | |
Administration fees | | 7 | |
Payable for collateral for securities on loan | | 68,776 | |
Other | | 169 | |
| | 70,454 | |
Net Assets | | $ | 410,346 | |
| | | | |
Net Assets Consist of: | | | |
Capital Stock ($.01 par value) | | $ | 189 | |
Additional paid-in capital | | 34,536 | |
Undistributed (accumulated) net investment loss | | 2,409 | |
Undistributed (accumulated) net realized gain from investment securities and foreign currency transactions | | 286,844 | |
Net unrealized appreciation on investment securities | | 86,367 | |
Net unrealized appreciation on translation of assets and liabilities denominated in foreign currencies | | 1 | |
Net Assets | | $ | 410,346 | |
Net Assets by Class: | | | |
Initial Class | | $ | 358,128 | |
Service Class | | 52,218 | |
Shares Outstanding: | | | |
Initial Class | | 16,470 | |
Service Class | | 2,407 | |
Net Asset Value and Offering Price Per Share: | | | |
Initial Class | | $ | 21.75 | |
Service Class | | 21.70 | |
STATEMENT OF OPERATIONS
For the year ended December 31, 2007
(all amounts in thousands)
Investment Income: | | | |
Dividends (net of withholding taxes on foreign dividends of $400) | | $ | 9,056 | |
Interest | | 3,201 | |
Income from loaned securities-net | | 1,162 | |
| | 13,419 | |
| | | |
Expenses: | | | |
Management and advisory fees | | 5,608 | |
Printing and shareholder reports | | 115 | |
Custody fees | | 155 | |
Administration fees | | 140 | |
Legal fees | | 16 | |
Audit fees | | 20 | |
Trustees fees | | 28 | |
Distribution and service fees: | | | |
Service Class | | 144 | |
Other | | 14 | |
Total expenses | | 6,240 | |
| | | |
Net Investment Income | | 7,179 | |
| | | |
Net Realized Gain (Loss) from: | | | |
Investment securities | | 295,468 | |
Foreign currency transactions | | (231 | ) |
| | 295,237 | |
| | | |
Net Increase (Decrease) in Unrealized Appreciation (Depreciation) on: | | | |
Investment securities | | (254,019 | ) |
Translation of assets and liabilities denominated in foreign currencies | | 1 | |
| | (254,018 | ) |
| | | |
Net Realized and Unrealized Gain: | | 41,219 | |
Net Increase In Net Assets Resulting from Operations | | $ | 48,398 | |
The notes to the financial statements are an integral part of this report.
6
Third Avenue Value
STATEMENTS OF CHANGES IN NET ASSETS
For the years ended
(all amounts in thousands)
| | December 31,
2007 | | December 31,
2006 | |
Increase (Decrease) in Net Assets From:
Operations: | | | | | |
Net investment income | | $ | 7,179 | | $ | 10,878 | |
Net realized gain from investment securities and foreign currency transactions | | 295,237 | | 67,057 | |
Change in unrealized appreciation (depreciation) on investment securities and foreign currency translation | | (254,018 | ) | 85,497 | |
| | 48,398 | | 163,432 | |
Distributions to Shareholders: | | | | | |
From net investment income: | | | | | |
Initial Class | | (16,201 | ) | (8,555 | ) |
Service Class | | (2,100 | ) | (298 | ) |
| | (18,301 | ) | (8,853 | ) |
From net realized gains: | | | | | |
Initial Class | | (58,048 | ) | (57,756 | ) |
Service Class | | (7,924 | ) | (2,419 | ) |
| | (65,972 | ) | (60,175 | ) |
Capital Share Transactions: | | | | | |
Proceeds from shares sold: | | | | | |
Initial Class | | 39,625 | | 100,878 | |
Service Class | | 16,915 | | 21,600 | |
| | 56,540 | | 122,478 | |
Dividends and distributions reinvested: | | | | | |
Initial Class | | 74,248 | | 66,311 | |
Service Class | | 10,024 | | 2,717 | |
| | 84,272 | | 69,028 | |
Cost of shares redeemed: | | | | | |
Initial Class | | (851,516 | ) | (107,276 | ) |
Service Class | | (18,111 | ) | (11,006 | ) |
| | (869,627 | ) | (118,282 | ) |
| | (728,815 | ) | 73,224 | |
Net increase (decrease) in net assets | | (764,690 | ) | 167,628 | |
| | | | | |
Net Assets: | | | | | |
Beginning of year | | 1,175,036 | | 1,007,408 | |
End of year | | $ | 410,346 | | $ | 1,175,036 | |
Undistributed (Accumulated) Net Investment Income (Loss) | | $ | 2,409 | | $ | 5,138 | |
Share Activity: | | | | | |
Shares issued: | | | | | |
Initial Class | | 1,478 | | 3,954 | |
Service Class | | 637 | | 853 | |
| | 2,115 | | 4,807 | |
Shares issued-reinvested from distributions: | | | | | |
Initial Class | | 3,397 | | 2,756 | |
Service Class | | 459 | | 113 | |
| | 3,856 | | 2,869 | |
Shares redeemed: | | | | | |
Initial Class | | (31,009 | ) | (4,213 | ) |
Service Class | | (709 | ) | (436 | ) |
| | (31,718 | ) | (4,649 | ) |
Net increase (decrease) in shares outstanding: | | | | | |
Initial Class | | (26,134 | ) | 2,497 | |
Service Class | | 387 | | 530 | |
| | (25,747 | ) | 3,027 | |
The notes to the financial statements are an integral part of this report.
7
Third Avenue Value
FINANCIAL HIGHLIGHTS
For a share outstanding throughout each period(a)
| | Initial Class
Year Ended December 31, | |
| | 2007 | | 2006 | | 2005 | | 2004 | | 2003 | |
Net Asset Value | | | | | | | | | | | |
Beginning of period | | $ | 26.33 | | $ | 24.22 | | $ | 20.98 | | $ | 16.93 | | $ | 12.39 | |
Investment Operations | | | | | | | | | | | |
Net investment income (loss) | | 0.27 | | 0.25 | | 0.17 | | 0.09 | | 0.11 | |
Net realized and unrealized gain (loss) | | 0.07 | | 3.49 | | 3.74 | | 4.08 | | 4.50 | |
Total operations | | 0.34 | | 3.74 | | 3.91 | | 4.17 | | 4.61 | |
Distributions | | | | | | | | | | | |
From net investment income | | (1.07 | ) | (0.21 | ) | (0.12 | ) | (0.12 | ) | (0.05 | ) |
From net realized gains | | (3.85 | ) | (1.42 | ) | (0.55 | ) | — | | (0.02 | ) |
Total distributions | | (4.92 | ) | (1.63 | ) | (0.67 | ) | (0.12 | ) | (0.07 | ) |
Net Asset Value | | | | | | | | | | | |
End of period(b) | | $ | 21.75 | | $ | 26.33 | | $ | 24.22 | | $ | 20.98 | | $ | 16.93 | |
Total Return(c),(d) | | 1.20 | % | 16.07 | % | 18.81 | % | 24.81 | % | 37.26 | % |
Net Assets End of Period (000’s) | | $ | 358,128 | | $ | 1,121,918 | | $ | 971,322 | | $ | 574,721 | | $ | 468,411 | |
Ratio and Supplemental Data | | | | | | | | | | | |
Expenses to average net assets(e) | | 0.87 | % | 0.86 | % | 0.87 | % | 0.86 | % | 0.85 | % |
Net investment income (loss), to average net assets(e) | | 1.05 | % | 1.00 | % | 0.74 | % | 0.47 | % | 0.75 | % |
Portfolio turnover rate(d) | | 13 | % | 17 | % | 19 | % | 19 | % | 20 | % |
For a share outstanding throughout each period(a)
| | Service Class | |
| | Year Ended December 31, | | May 1 to Dec | |
| | 2007 | | 2006 | | 2005 | | 2004 | | 31, 2003 | |
Net Asset Value | | | | | | | | | | | |
Beginning of period | | $ | 26.30 | | $ | 24.21 | | $ | 21.02 | | $ | 16.96 | | $ | 12.50 | |
Investment Operations | | | | | | | | | | | |
Net investment income (loss) | | 0.19 | | 0.19 | | 0.12 | | 0.05 | | 0.10 | |
Net realized and unrealized gain (loss) | | 0.08 | | 3.49 | | 3.73 | | 4.09 | | 4.38 | |
Total operations | | 0.27 | | 3.68 | | 3.85 | | 4.14 | | 4.48 | |
Distributions | | | | | | | | | | | |
From net investment income | | (1.02 | ) | (0.17 | ) | (0.11 | ) | (0.08 | ) | — | |
From net realized gains | | (3.85 | ) | (1.42 | ) | (0.55 | ) | — | | (0.02 | ) |
Total distributions | | (4.87 | ) | (1.59 | ) | (0.66 | ) | (0.08 | ) | (0.02 | ) |
Net Asset Value | | | | | | | | | | | |
End of period(b) | | $ | 21.70 | | $ | 26.30 | | $ | 24.21 | | $ | 21.02 | | $ | 16.96 | |
Total Return(c),(d) | | 0.94 | % | 15.78 | % | 18.47 | % | 24.51 | % | 35.85 | % |
Net Assets End of Period (000’s) | | $ | 52,218 | | $ | 53,118 | | $ | 36,086 | | $ | 13,240 | | $ | 1,098 | |
Ratio and Supplemental Data | | | | | | | | | | | |
Expenses to average net assets(e) | | 1.12 | % | 1.11 | % | 1.12 | % | 1.12 | % | 1.11 | % |
Net investment income (loss), to average net assets(e) | | 0.74 | % | 0.74 | % | 0.53 | % | 0.29 | % | 0.93 | % |
Portfolio turnover rate(d) | | 13 | % | 17 | % | 19 | % | 19 | % | 20 | % |
(a) Per share information is calculated based on average number of shares outstanding.
(b) Third Avenue Value (the “Fund”) share class commenced operations as follows:
Initial Class - January 2, 1998
Service Class - May 1, 2003
(c) Total Return reflects all portfolio expenses and includes reinvestment of dividends and capital gains; it does not reflect the charges and deductions under the policies or annuity contracts.
(d) Not annualized.
(e) Annualized.
The notes to the financial statements are an integral part of this report.
8
Third Avenue Value
NOTES TO FINANCIAL STATEMENTS
At December 31, 2007
(all amounts in thousands)
NOTE 1. ORGANIZATION AND SIGNIFICANT ACCOUNTING POLICIES
AEGON/Transamerica Series Trust (“ATST”) is an open-end management investment company registered under the Investment Company Act of 1940, as amended (the “1940 Act”). ATST serves as a funding vehicle for variable life insurance, variable annuity and group annuity products. Third Avenue Value (the “Fund”) is part of ATST. The Fund is “non-diversified” under the 1940 Act.
In the normal course of business, the Fund enters into contracts that contain a variety of representations that provide general indemnifications. The Fund’s maximum exposure under these arrangements is unknown, as this would involve future claims that may be made against the Fund and/or its affiliates that have not yet occurred. However, based on experience, the Fund expects the risk of loss to be remote.
This report should be read in conjunction with the current Fund prospectus, which contains more complete information about the Fund.
In preparing the Fund’s financial statements in accordance with accounting principles generally accepted in the United States of America (“GAAP”), estimates or assumptions (which could differ from actual results) may be used that affect reported amounts and disclosures. The following is a summary of significant accounting policies followed by the Fund.
Multiple class operations, income and expenses: The Fund currently offers two classes of shares, an Initial Class and a Service Class. Income, non-class specific expenses and realized and unrealized gains and losses, are allocated daily to each class, based upon the value of shares outstanding method as permitted under Rule 1 8f-3 of the 1940 Act. Each class bears its own specific expenses as well as a portion of general, common expenses.
Security valuations: The Fund values its investments at the close of the New York Stock Exchange (“NYSE”), normally 4 p.m. ET, each day the NYSE is open for business. Fund investments are valued at the last sale price or closing price on the day of valuation taken from the primary exchange where the security is principally traded.
Securities traded in the over-the-counter market and listed securities for which no sale was reported on that date are valued at the last quoted bid price.
Debt securities are valued based on a price quotation or other equivalent indication of value supplied by an exchange, a pricing service or a major market maker; however, those that mature in sixty days or less are valued at amortized cost, which approximates market.
Investment company securities are valued at the net asset value of the underlying portfolio.
Foreign securities generally are valued based on quotations from the primary market in which they are traded. Because many foreign securities markets and exchanges close prior to the close of the NYSE, closing prices for foreign securities in those markets or on those exchanges do not reflect the events that occur after that close. If a significant market event impacting the value of a portfolio security (e.g., natural disaster, company announcement, market volatility) occurs subsequent to the close of trading in the security, but prior to the calculation of the Fund’s net asset value per share, market quotations for that security may be determined to be unreliable and, accordingly, not “readily available.” As a result, foreign equity securities held by the Fund may be valued at fair market value as determined in good faith by the Fund’s Administrative Valuation Committee, under the supervision of the Board’s Valuation Committee, using guidelines adopted by the Board of Trustees.
Other securities for which quotations are not readily available are valued at fair market value as determined in good faith by the Fund’s Administrative Valuation Committee, using guidelines adopted by the Board of Trustees.
Cash: The Fund may leave cash overnight in its cash account with the custodian, State Street Bank & Trust Company (“State Street”). On July 2, 2007, State Street acquired the parent company of Investors Bank & Trust Company. State Street has been contracted on behalf of the Fund to invest the excess cash into a savings account, which at December 31, 2007 was paying an interest rate of 2.60%.
Repurchase agreements: The Fund is authorized to enter into repurchase agreements. The Fund, through its custodian, State Street, receives delivery of the underlying securities, the value of which at the time of purchase is required to be an amount equal to at least 100% of the resale price. The Fund will bear the risk of value fluctuations until the security can be sold and may encounter delays and incur costs in liquidating the security. In the event of bankruptcy or insolvency of the seller, delays and costs may be incurred.
Commission recapture: The sub-adviser, to the extent consistent with the best execution and usual commission rate policies and practices, may place security transactions of the Fund with broker/dealers with which ATST has established a Commission Recapture Program. A Commission Recapture Program is any arrangement under which a broker/dealer applies a portion of the commissions received by such broker/dealer on the security transactions to the Fund. In no event will commissions paid by the Fund be used to pay expenses that would otherwise be borne by any other funds within ATST, or by any other party.
Recaptured commissions during the year ended December 31, 2007 of $9 are included in net realized gain (loss) in the Statement of Operations.
AEGON/Transamerica Series Trust | | Annual Report 2007 |
9
NOTES TO FINANCIAL STATEMENTS (continued)
At December 31, 2007
(all amounts in thousands)
NOTE 1.– (continued)
Securities lending: The Fund may lend securities to qualified borrowers, with State Street acting as the Fund’s lending agent. The Fund earns negotiated lenders’ fees. The Fund receives cash and/or securities as collateral against the loaned securities. Cash collateral received is invested in short term, interest bearing securities. The Fund monitors the market value of securities loaned on a daily basis and requires collateral in an amount at least equal to the value of the securities loaned. Income from loaned securities on the Statement of Operations is net of fees, in the amount of $498, earned by State Street for its services.
The Fund has invested the cash collateral received from securities loaned in the following short-term, interest-bearing securities:
Abbey National PLC, Eurodollar Term, 5.00%, 1/7/2008 | | $ | 2,969 | |
ABN AMRO Bank NV, Eurodollar Term, 5.18%, 1/4/2008 | | 2,375 | |
Bank of Nova Scotia, Eurodollar Term, 4.96%, 1/22/2008 | | 2,078 | |
Barclays, Eurodollar Term, 5.00%, 2/12/2008 | | 4,156 | |
BNP Paribas, Eurodollar Term, 5.01%, 1/11/2008 | | 3,859 | |
Calyon, Eurodollar Term, 5.12%, 3/3/2008 | | 891 | |
Credit Suisse First Boston Corp., Repurchase Agreement, 4.60%, 1/2/2008 | | 7,719 | |
Dexia Group, Eurodollar Term, 4.82%, 1/3/2008 | | 2,969 | |
HBOS Halifax Bank of Scotland, Eurodollar Term, 5.15%, 1/2/2008 | | 1,484 | |
JPMorgan Chase & Co., Eurodollar Term, 5.15%, 2/12/2008 | | 1,484 | |
Lloyds TSB Bank, Eurodollar Term, 5.15%, 1/24/2008 | | 2,969 | |
Merrill Lynch & Co. (RPG), Repurchase Agreement, 4.60%, 1/2/2008 | | 4,453 | |
Morgan Stanley & Co. (Corp. Repo), Repurchase Agreement, 4.60%, 1/2/2008 | | 12,172 | |
Rabobank Nederland, Eurodollar Term, 5.08%, 1/10/2008 | | 3,562 | |
Reserve Primary Money Market Fund, 4.95% | | 3,167 | |
Royal Bank of Scotland, Eurodollar Term, 5.00%, 2/25/2008 | | 3,563 | |
Societe Generale, Eurodollar Term, 5.15%, 3/3/2008 | | 1,781 | |
Toronto Dominion Bank, Eurodollar Term, 5.05%, 1/10/2008 | | 3,563 | |
UBS AG, Eurodollar Term, 4.92%, 1/11/2008 | | 2,078 | |
Wells Fargo, Bank Note, 4.75%, 1/8/2008 | | 1,484 | |
| | $ | 68,776 | |
Real Estate Investment Trusts (“REITs”): There are certain additional risks involved in investing in REITs. These include, but are not limited to, economic conditions, changes in zoning laws, real estate values, property taxes and interest rates.
Dividend income is recorded at management’s estimate of the income included in distributions from the REIT investments. Distributions received in excess of the estimated amount are recorded as a reduction of the cost of investments. The actual amounts of income, return of capital and capital gains are only determined by each REIT after the fiscal year end and may differ from the estimated amounts.
Security transactions and investment income: Security transactions are recorded on the trade date. Security gains and losses are calculated on the first-in, first-out basis. Dividend income, if any, is recorded on the ex-dividend date or, in the case of foreign securities, as soon as the Fund is informed of the ex-dividend date. Interest income, including accretion of discounts and amortization of premiums, is recorded on the accrual basis commencing on the settlement date.
Foreign currency denominated investments: The accounting records of the Fund are maintained in U.S. dollars. Securities and other assets and liabilities denominated in foreign currencies are translated into U.S. dollars at the closing exchange rate each day. The cost of foreign securities is translated at the exchange rate in effect when the investment was acquired. The Fund combines fluctuations from currency exchange rates and fluctuations in value when computing net realized and unrealized gains or losses from investments.
Net foreign currency gains and losses resulting from changes in exchange rates include: 1) foreign currency fluctuations between trade date and settlement date of investment security transactions; 2) gains and losses on forward foreign currency contracts; and 3) the difference between the receivable amounts of interest and dividends recorded in the accounting records in U.S. dollars and the amounts actually received.
Foreign currency denominated assets may involve risks not typically associated with domestic transactions. These risks include revaluation of currencies, adverse fluctuations in foreign currency values and possible adverse political, social and economic developments, including those particular to a specific industry, country or region.
Forward foreign currency contracts: The Fund may enter into forward foreign currency contracts to hedge against exchange rate risk arising from investments in securities denominated in foreign currencies. Contracts are valued at the contractual forward rate and are marked to market daily, with the change in value recorded as an unrealized gain or loss. When the contracts are settled a realized gain or loss is incurred. Risks may arise from changes in market value of the underlying currencies and from the possible inability of counterparties to meet the terms of their contracts.
There were no outstanding forward foreign currency contracts at December 31, 2007.
Dividend distributions: Dividends and capital gains distributions are typically declared and reinvested annually and are generally paid and reinvested on the business day following the ex-date.
NOTE 2. RELATED PARTY TRANSACTIONS
ATST serves as a funding vehicle for certain affiliated asset allocation portfolios and certain affiliated separate accounts of Western Reserve Life Assurance Co. of Ohio, Transamerica Life Insurance Company, Transamerica Financial Life Insurance Company, Inc., Monumental Life Insurance Company and Transamerica Occidental Life Insurance Company.
Transamerica Fund Advisors, Inc. (“TFAI”) is the Fund’s investment adviser. Transamerica Fund Services, Inc. (“TFS”) is the Fund’s administrator and transfer agent. Prior to May 1, 2007, AFSG Securities Corp. (“AFSG”), was the Fund’s distributor. Transamerica Capital Inc. (“TCI”) is now the Fund’s distributor. TFAI, TFS, AFSG, and TCI are affiliates of AEGON NV, a Netherlands corporation.
Certain officers and trustees of the Fund are also officers and/or directors of TFAI, TFS and TCI.
10
NOTES TO FINANCIAL STATEMENTS (continued)
At December 31, 2007
(all amounts in thousands)
NOTE 2.– (continued)
Investment advisory fee: The Fund pays management fees to TFAI based on average daily net assets (“ANA”) at the following rate:
0.80% of ANA
TFAI has contractually agreed to waive its advisory fee and will reimburse the Fund to the extent that operating expenses, excluding 12b-1 fees, exceed the following stated annual limit:
1.00% Expense Limit
If total Fund expenses fall below the annual expense limitation agreement agreed to by the adviser within the succeeding three years, the Fund may be required to pay the adviser a portion or all of the waived advisory fees.
There were no amounts recaptured during the year ended December 31, 2007. There are no amounts available for recapture at December 31, 2007.
Distribution and service fees: ATST entered into a Distribution Agreement with AFSG dated January 1, 1997, as amended. On May 1, 2007, the Distribution Agreement was amended to replace AFSG with TCI as the Fund’s distributor. The Fund has also adopted a distribution plan (“Distribution Plan”) pursuant to Rule 12b-1 under the 1940 Act.
Under the Distribution Plan for the Initial Class shares, TCI, on behalf of the Fund, is authorized to pay various service providers, as direct payment for expenses incurred in connection with distribution of the Fund’s shares, amounts equal to actual expenses associated with distributing the shares.
The Distribution Plan for the Service Class shares requires ATST to pay distribution fees to TCI as compensation for its activities, not as reimbursement for specific expenses. The fee on the Service Class is paid to the insurance companies for providing services and account maintenance for their policyholders who invest in the variable insurance products which invest in the Service Class shares.
The Fund is authorized under the Distribution Plan to pay fees on each class up to the following limits:
Initial Class | | 0.15 | % |
Service Class | | 0.25 | % |
TCI has determined that it will not seek payment by the Fund of the distribution expenses incurred with respect to the Initial Class shares before April 30, 2009. Prior to TCI seeking reimbursement of future expenses, policy and contract owners will be notified in advance. The Fund will pay fees relating to Service Class shares.
Administrative services: The Fund has entered into an agreement with TFS for financial and legal fund administration services. The Fund pays TFS an annual fee of 0.02% of ANA. The Legal fees on the Statement of Operations are for fees paid to external legal counsel.
Brokerage commissions: Brokerage commissions incurred on security transactions placed with an affiliate of the sub-adviser for the year ended December 31, 2007 were $508.
Deferred compensation plan: Each eligible independent Fund Trustee may elect participation in a non-qualified deferred compensation plan (“the Plan”). Under the Plan, such Trustees may defer payment of all or a portion of their total fees earned as a Fund Trustee. Each Trustee who is a participant in the Plan may elect that the earnings, losses or gains credited to his or her deferred fee amounts be determined based on a deemed investment in any series of Transamerica IDEX Mutual Funds. The right of a participant to receive a distribution from the Plan of the deferred fees is an unsecured claim against the general assets of all series of Transamerica IDEX Mutual Funds. The pro rata liability to the Fund of all deferred fees in the Plan amounted, as of December 31, 2007, to $20. Amounts deferred under the Deferred Compensation Plan are unfunded against the general assets of ATST.
Retirement plan: Under a retirement plan (the “Emeritus Plan”) available to the Independent Trustees, each Independent Trustee is deemed to have elected to serve as Trustee Emeritus of ATST upon his or her termination of service, other than removal for cause, is entitled to 50% of the trustee’s current retainer for a maximum period of five years determined by his or her years of service as a Trustee.
Such amounts shall be accrued by ATST on a pro rata basis allocable to each ATST fund based on the relative assets of the fund. If retainers increase in the future, past accruals (and credits) will be adjusted upward so that 50% of the Trustee’s current retainer is accrued and credited at all times. Upon death, disability or termination of service, other than removal for cause, amounts deferred become payable to an Emeritus Trustee (or his/her beneficiary). Upon the commencement of service as Trustee Emeritus, compensation will be paid on a quarterly basis during the time period that the Trustee Emeritus is allowed to serve as such.
Amounts accrued under the Emeritus Plans are unsecured claims against the general assets of ATST. For the year ended December 31, 2007, the amount related to the Emeritus Plan was $45. As of the year ended December 31, 2007, the Fund has not made any payments related to the Emeritus Plan.
The Emeritus Plan was terminated effective October 30, 2007. Upon the termination, the Fund shall continue to pay any remaining benefits in accordance with the Plan, but no further compensation shall accrue under the Plan.
11
NOTES TO FINANCIAL STATEMENTS (continued)
At December 31, 2007
(all amounts in thousands)
NOTE 3. INVESTMENT TRANSACTIONS
The cost of securities purchased and proceeds from securities sold (excluding short-term securities) for the year ended December 31, 2007 were as follows:
Purchases of securities: | | | |
Long-term | | $ | 81,724 | |
U.S. Government | | — | |
Proceeds from maturities and sales of securities: | | | |
Long-term | | 729,200 | |
U.S. Government | | — | |
| | | | |
NOTE 4. FEDERAL INCOME TAX MATTERS
The Fund has not made any provision for federal income or excise taxes due to its policy to distribute all of its taxable income and capital gains to its shareholders and otherwise qualify as a regulated investment company under Subchapter M of the Internal Revenue Code. Income and capital gain distributions are determined in accordance with income tax regulations, which may differ from GAAP. These differences are primarily due to differing treatment for items including, but not limited to, foreign currency transactions, and passive foreign investment companies and REITs.
Therefore, distributions determined in accordance with tax regulations may differ significantly in amount or character from net investment income and realized gains for financial reporting purposes. Financial reporting records are adjusted for permanent book/tax differences to reflect tax character. Financial records are not adjusted for temporary differences. These reclassifications are as follows:
Additional paid-in capital | | $ | — | |
Undistributed (accumulated) net investment income (loss) | | $ | 8,394 | |
Undistributed (accumulated) net realized gain (loss) from investment securities | | $ | (8,394) | |
The tax character of distributions paid may differ from the character of distributions shown in the Statements of Changes in Net Assets due to short-term gains being treated as ordinary income for tax purposes. The tax character of distributions paid during 2006 and 2007 were as follows:
2006 Distributions paid from: | | | |
Ordinary Income | | $ | 13,812 | |
Long-term Capital Gain | | 55,216 | |
2007 Distributions paid from: | | | |
Ordinary Income | | 19,161 | |
Long-term Capital Gain | | 65,112 | |
| | | | |
The tax basis components of distributable earnings as of December 31, 2007 are as follows:
Undistributed Ordinary Income | | $ | 18,142 | |
Undistributed Long-term Capital Gain | | $ | 280,871 | |
Capital Loss Carryforward | | $ | — | |
Net Unrealized Appreciation (Depreciation)* | | $ | 76,608 | |
*Amount includes unrealized appreciation (depreciation) from foreign currency)
NOTE 5. REGULATORY PROCEEDINGS
There continues to be significant federal and state regulatory activity relating to financial services companies, particularly mutual fund companies and their investment advisers. As part of an ongoing investigation regarding potential market timing, recordkeeping and trading compliance issues and matters affecting the Fund’s investment adviser, TFAI, and certain affiliates and former employees of TFAI, the SEC staff has indicated that it is likely to take some action against TFAI and certain of its affiliates at the conclusion of the investigation. The potential timing and the scope of any such action is difficult to predict. Although the impact of any action brought against TFAI and/or its affiliates is difficult to assess at the present time, the Fund currently believes that the likelihood that any such action will have a material adverse impact on it is remote. It is important to note that the Fund is not aware of any allegation of wrong doing against it and its Board at the time this annual report is printed. Although it is not anticipated that these developments will have an adverse impact on the Fund, there can be no assurance at this time. TFAI and its affiliates are actively working with the SEC in regard to this matter; however, the exact resolution cannot be determined at this time. TFAI will take such actions that it deems necessary or appropriate to continue providing management services to the Fund and to bring all matters to an appropriate conclusion.
TFAI and/or its affiliates, and not the Fund, will bear the costs regarding these regulatory matters.
NOTE 6. RECENTLY ISSUED ACCOUNTING PRONOUNCEMENTS
In July 2006, the Financial Accounting Standards Board (“FASB”) released FASB Interpretation No. 48 “Accounting for Uncertainty in Income Taxes” (“FIN 48”), an interpretation of FASB Statement No. 109. FIN 48 provides guidance for how uncertain tax positions should be recognized, measured, presented and disclosed in the financial statements. FIN 48 requires the accounting and disclosure of tax positions taken or expected to be taken in the course of preparing the Fund’s tax returns to determine whether the tax positions are “more-likely-than-not” of being sustained by the applicable tax authority. Tax positions not deemed to meet the more-likely-than-not threshold would be recorded as a tax benefit or expense in the current year.
Adoption of FIN 48 is effective during the first required financial reporting period for fiscal years beginning after December 15, 2006. Management adopted FIN 48 on June 29, 2007.
12
NOTES TO FINANCIAL STATEMENTS (continued)
At December 31, 2007
(all amounts in thousands)
NOTE 6.– (continued)
Implementation of FIN 48 requires Management of the Fund to analyze all open tax years, as defined by the Statute of Limitations, for all major jurisdictions, which includes federal and certain states. Open tax years are those that are open for exam by taxing authorities (i.e., the last 4 tax year ends and the interim tax period since then). The Fund has no examinations in progress and none are expected at this time.
Management of the Fund has reviewed all open tax years and major jurisdictions and concluded the adoption of FIN 48 resulted in no impact to the Fund’s net assets or results of operations. There is no tax liability resulting from unrecognized tax benefits relating to uncertain income tax positions taken or expected to be taken in future tax returns. The Fund is also not aware of any tax positions for which it is reasonably possible that the total amounts of unrecognized tax benefits will significantly change in the next 12 months.
In September 2006, FASB issued its new Standard No. 157, “Fair Value Measurements” (“FAS 157”). FAS 157 is designed to unify guidance for the measurement of fair value of all types of assets, including financial instruments, and certain liabilities, throughout a number of accounting standards. FAS 157 also establishes a hierarchy for measuring fair value in generally accepted accounting principles and expands financial statement disclosures about fair value measurements that are relevant to mutual funds. FAS 157 is effective for financial statements issued for fiscal years beginning after November 15, 2007, and earlier application is permitted.
As of December 31, 2007, Management does not expect the adoption of FAS 157 to impact the amounts reported in the financial statements, however, additional disclosures will be required about the inputs used to develop the measurements of fair value and the effect of certain of the measurements reported in the statement of operations for a fiscal period.
NOTE 7. SUBSEQUENT EVENT
Effective January 1, 2008, TFAI changed its name to Transamerica Asset Management, Inc.
Effective May 1, 2008, AEGON/Transamerica Series Trust will change its name to Transamerica Series Trust. At that time, the Fund will also change its name to Transamerica Third Avenue Value VP.
13
Report of Independent Registered Certified Public Accounting Firm
To the Board of Trustees and Shareholders of Third Avenue Value:
In our opinion, the accompanying statement of assets and liabilities, including the schedule of investments, and the related statements of operations and of changes in net assets and the financial highlights present fairly, in all material respects, the financial position of Third Avenue Value (the “Fund”) (one of the portfolios constituting AEGON/Transamerica Series Trust) at December 31, 2007, the results of its operations for the year then ended, the changes in its net assets for each of the two years in the period then ended and the financial highlights for each of the periods presented, in conformity with accounting principles generally accepted in the United States of America. These financial statements and financial highlights (hereafter referred to as “financial statements”) are the responsibility of the Fund’s management; our responsibility is to express an opinion on these financial statements based on our audits. We conducted our audits of these financial statements in accordance with the standards of the Public Company Accounting Oversight Board (United States). Those standards require that we plan and perform the audit to obtain reasonable assurance about whether the financial statements are free of material misstatement. An audit includes examining, on a test basis, evidence supporting the amounts and disclosures in the financial statements, assessing the accounting principles used and significant estimates made by management, and evaluating the overall financial statement presentation. We believe that our audits, which included confirmation of securities at December 31, 2007 by correspondence with the custodian and brokers, provide a reasonable basis for our opinion.

Tampa, Florida
February 29, 2008
14
Third Avenue Value
SUPPLEMENTAL TAX INFORMATION (unaudited)
(all amounts in thousands)
For tax purposes, the Fund has made a Long-Term Capital Gain Designation of $65,112 for the year ended December 31, 2007.
RESULTS OF SHAREHOLDER PROXY (unaudited)
At a special meeting of shareholders held on October 30, 2007, the results of the Proposals were as follows:
Proposal 1: To elect a new Board:
Proposed Trustee | | For | | Against | | Abstentions/Broker Non-
Votes | |
John K. Carter | | 2,274,998,840.817 | | 57,804,698.755 | | 35,433.883 | |
| | | | | | | |
Leo J. Hill | | 2,277,212,702.754 | | 55,590,836.819 | | 35,433.883 | |
| | | | | | | |
Neal M. Jewell | | 2,266,793,295.663 | | 66,010,243.909 | | 35,433.883 | |
| | | | | | | |
Russell A. Kimball, Jr. | | 2,274,825,235.835 | | 57,978,303.737 | | 35,433.883 | |
| | | | | | | |
Eugene M. Mannella | | 2,274,623,165.033 | | 58,180,374.539 | | 35,433.883 | |
| | | | | | | |
Norm R. Nielsen | | 2,275,050,055.885 | | 57,753,483.687 | | 35,433.883 | |
| | | | | | | |
Joyce Galpern Norden | | 2,270,278,122.250 | | 62,525,417.323 | | 35,433.883 | |
| | | | | | | |
Patricia L. Sawyer | | 2,275,737,737.456 | | 57,065,802.116 | | 35,433.883 | |
| | | | | | | |
John W. Waechter | | 2,276,615,120.140 | | 56,188,419.433 | | 35,433.883 | |
Proposal 2: To approve an amendment to the Agreement and Declaration of Trust:
For | | Against | | Abstentions/Broker Non-
Votes | |
2,182,022,669.110 | | 77,590,048.544 | | 73,226,255.801 | |
15
Third Avenue Value
INVESTMENT ADVISORY AND SUB-ADVISORY AGREEMENTS-REVIEW AND RENEWAL (unaudited)
At a meeting of the Board of Trustees of AEGON/Transamerica Series Trust (“ATST”) held on December 4th, 2007, the Board reviewed and considered the renewal of the investment advisory agreement (the “Investment Advisory Agreement”) between Third Avenue Value (the “Fund”) and Transamerica Fund Advisors, Inc. (“TFAI”), as well as the renewal of the investment sub-advisory agreement (the “Sub-Advisory Agreement”) of the Fund between TFAI and Third Avenue Management, LLC (the “Sub-Adviser”), to determine whether the agreements should be renewed for a six-month period. It was noted that this review was interim in nature to align all the Funds on the same calendar, and that the Funds’ advisory arrangements would be reviewed again in the first half of 2008.
Following their review and consideration, the Trustees determined that the renewal of the Investment Advisory Agreement and the Sub-Advisory Agreement would enable shareholders of the Fund to obtain high quality services at a cost that is appropriate, fair, and in the best interests of its shareholders. The Board, including the independent members of the Board, unanimously approved the renewal of the Investment Advisory Agreement and Sub-Advisory Agreement. In reaching their decision, the Trustees requested and obtained from TFAI and the Sub-Adviser such information as they deemed reasonably necessary to evaluate the agreements, including information about fees and performance of comparable funds managed by the Sub-Adviser. The Trustees also carefully considered information they had previously received from TFAI and the Sub-Adviser throughout the year as part of their regular oversight of the Fund, as well as comparative fee, expense, and performance information prepared by Lipper Inc. (“Lipper”), an independent provider of mutual fund performance, fee and expense information and profitability data prepared by management. In considering the proposed continuation of the Investment Advisory and Sub-Advisory Agreements, the Trustees evaluated a number of considerations that they believed, in light of the legal advice furnished to them by independent legal counsel and their own business judgment, to be relevant. They based their decisions on a variety of factors, including the following considerations, among others, although they did not identify any consideration or particular information that was controlling of their decisions:
The nature, extent and quality of the advisory services to be provided. The Board considered the nature and quality of the services provided by TFAI and the Sub-Adviser to the Fund in the past, as well as the services anticipated to be provided in the future. The Board concluded that TFAI and the Sub-Adviser are capable of providing high quality services to the Fund, as indicated by the nature and quality of services provided in the past by TFAI and the Sub-Adviser for this series and the experience, capability and integrity of TFAI’s senior management, the financial resources of TFAI and the Sub-Adviser, TFAI’s management oversight process and the professional qualifications of the portfolio management team of the Sub-Adviser. The Trustees determined that TFAI and the Sub-Adviser can provide investment and related services that are appropriate in scope and extent in light of the Fund’s operations, the competitive landscape of the investment company business and investor needs.
The investment performance of the Fund. The Board examined the short and longer-term performance of the Fund, including relative performance against a peer universe of comparable mutual funds as prepared by Lipper for various trailing periods ended June 30, 2007. The Board noted that the Fund’s performance was good compared to its peer universe over the past 3- and 5-year periods. The Board also noted that the Fund’s performance was below the median for its peer universe over the past 1-year period. The Board noted further that the Fund’s 1-year performance could be attributed in part to the Fund having taken early positions in certain value investments. On the basis of the Board’s assessment of the nature, extent and quality of advisory services to be provided or procured by TFAI and the Sub-Adviser, the Board concluded that TFAI and the Sub-Adviser are capable of providing a level of investment performance that is appropriate in light of the Fund’s proposed investment objectives, policies and strategies and competitive with other similarly situated investment companies.
The cost of advisory services provided and the level of profitability. The Board reviewed profitability information of TFAI’s cost of procuring fund management services, as well as the costs of its provision of administration, fund accounting and other services, to the Fund and to ATST as a whole by TFAI and its affiliates. The Board reviewed the management and sub-advisory fees for the Fund. The Board noted that the Fund’s contractual management fees were above the median of the peer group and peer universe but by a relatively small amount. The Board also noted that the Fund’s total expenses were below the median of the peer universe. Based on their review, the Trustees determined that the management fees of the Fund generally are appropriate in light of the services expected to be provided or procured, the management fees and the anticipated profitability of the relationship between the Fund, TFAI and its affiliates, and the Sub-Adviser. In making these observations and determinations, the Board reviewed, among other things, comparative information provided by Lipper.
Whether fee levels reflect economies of scale and the extent to which economies of scale would be realized as the Fund grows. In evaluating the extent to which the management fees payable under the Investment Advisory and Sub-Advisory Agreements reflect economies of scale or will permit economies of scale to be realized in the future, the Board considered the specific reasons for the absence of breakpoints, and concluded that the absence of breakpoints was acceptable under the circumstances. The Trustees also concluded that they will have the opportunity to periodically reexamine whether the Fund has achieved economies of scale, and the appropriateness of management fees payable to TFAI and fees paid to the Sub-Adviser, in the future.
Benefits (such as soft dollars) to TFAI, its affiliates, or the Sub-Adviser from their relationship with the Fund. The Board concluded that other benefits anticipated to be derived by TFAI, its affiliates, and the Sub-Adviser from their relationships with the Fund are expected to be reasonable and fair, and consistent with industry practice and the best interests of the Fund and its shareholders. The Trustees noted that TFAI would not realize soft dollar benefits from its relationship with the Fund, and that the Sub-Adviser’s soft dollar trading is consistent with applicable law, including best execution requirements in particular. The Board also noted that the Sub-Adviser is participating in a brokerage program pursuant to which a portion of brokerage commissions paid by the Fund is recaptured for the benefit of the Fund and its shareholders, thus limiting the amount of soft dollar arrangements the Sub-Adviser may engage in with respect to the Fund’s brokerage transactions.
16
Other considerations. The Board determined that TFAI has made a substantial commitment to the recruitment and retention of high quality personnel, and maintains the financial, compliance and operational resources reasonably necessary to manage the Fund in a professional manner that is consistent with the best interests of the Fund and its shareholders. In this regard, the Trustees favorably considered the procedures and policies in place by TFAI to enforce compliance with applicable laws and regulations and oversee the portfolio management activities of the Sub-Adviser. The Trustees also determined that TFAI has made a significant entrepreneurial commitment to the management and success of the Fund, reflected by TFAI’s expense limitation and fee waiver arrangements with the Fund which may result in TFAI waiving a substantial amount of management fees for the benefit of shareholders. The Board also noted the use by the Sub-Adviser of an affiliated broker for a sizeable portion of the Fund’s trades, but that the Fund’s trading costs were below the median of a peer group of comparable funds.
17
Transamerica Balanced
MARKET ENVIRONMENT
U.S. securities markets faced significant challenges in the twelve months ended December 31, 2007. The housing-market correction that began in 2006 gained momentum. Added to that were a credit-and-liquidity crisis triggered by rising defaults in sub-prime mortgages, concerns about inflation and mounting signs of an economic slowdown. After advancing early in the period, equities gave back some gains as quarterly earnings growth stalled out and it became evident that the housing and credit issues will linger into 2008, slowing the pace of consumer spending. The Standard and Poor’s 500 Composite Stock Index (“S&P 500”) ended the year with a relatively modest total return of 5.49%.
Despite the credit problems, fixed-income markets fared better than stocks in general. Initially, a relatively benign outlook for the economy and interest rates led investors to favor non-government securities. However, as the credit issues escalated over the course of the year, those sectors surrendered much of the early gains. Worried investors fled to the relative safety of Treasuries, which outperformed all other sectors of the fixed-income markets. Based largely on the strength of Treasuries, the Lehman Brothers U.S. Government/Credit Bond Index (“LBGC”) rose 7.23% for the full twelve-month period.
PERFORMANCE
For the year ended December 31, 2007, Transamerica Balanced, Initial Class returned 13.61%. By comparison its primary and secondary benchmarks, the S&P 500 and the LBGC, returned 5.49% and 7.23%, respectively.
STRATEGY REVIEW
The portfolio outperformed a 60% stocks/40% bonds blend of the abovementioned indices. Strongly positive returns for the equity portfolio, which represented 70%+ of assets throughout the year, more than compensated for underperformance by the fixed-income portfolio. We attribute the favorable equity-portfolio results to our focus on two secular growth trends that were uneffected by the domestic challanges: demand for new personal technology; and rapid worldwide industrialization. The portfolio’s chief contributors to performance included, among others, Jacobs Engineering Group Inc. (“Jacobs”), Apple Inc. (“Apple”), and PACCAR Inc. (“PACCAR”)
A worldwide boom in commercial construction was the driving force behind year-long gains for Jacobs, which designs and manages large-scale engineering projects. Apple chalked up strong sales of its user-friendly personal electronics (e.g., iPods and iPhones). The “halo” effect from these also invigorated sales of its personal computers and laptops. PACCAR, a leading manufacturer of heavy trucks, reported growth in domestic sales early in the year and higher international sales throughout the period.
Partially countering these gains were setbacks for companies vulnerable to the credit-market turmoil (e.g., McGraw-Hill Companies Inc.(“McGraw-Hill”), the parent company of debt-rating agency Standard & Poor’s Corp.), slower discretionary spending by consumers (Marriott International, Inc. (“Marriott”) and Nordstrom, Inc. (“Nordstrom”)), or a combination of the two (Harley-Davidson, Inc. (“Harley-Davidson”)) We believe McGraw-Hill will recover as the credit crisis is resolved and think well-to-do consumers will continue to support high-end retailer Nordstrom. We exited hotelier Marriott, where the secular growth cycle has peaked, and reduced the exposure to motorcycle maker Harley-Davidson, where sales have slowed, in part because the credit crunch has made it more difficult for motorcycle buyers to finance their purchases.
The fixed-income portfolio generated a positive total return but lagged the LBGC due to an overweighting in non-government sectors (i.e., corporate bonds and mortgage-related securities). Although we reduced the corporate allocation prior to the credit crunch and owned only quality mortgage securities, the portfolio did not keep pace with the index amidst the exceptional volatility in the second half of the year.
Gary U. Rollé, CFA
Heidi Y. Hu, CFA
Co-Portfolio Managers
Transamerica Investment Management, LLC
AEGON/Transamerica Series Trust | | Annual Report 2007 |
1
Transamerica Balanced
(unaudited)

Average Annual Total Return for Periods Ended 12/31/2007
| | 1 Year | | 5 Years | | From
Inception | | Inception
Date | |
| | | | | | | | | |
Initial Class | | 13.61 | % | 11.12 | % | 8.74 | % | 5/1/02 | |
S&P 500(1) | | 5.49 | % | 12.83 | % | 7.57 | % | 5/1/02 | |
Lehman Government/Credit Bond Index(1) | | 7.23 | % | 4.44 | % | 5.57 | % | 5/1/02 | |
| | | | | | | | | |
Service Class | | 13.38 | % | — | % | 11.09 | % | 5/1/03 | |
NOTES
(1) The Standard and Poor’s 500 Composite Stock (S&P 500) Index and Lehman Brothers U.S. Government/Credit (LBGC) Index are unmanaged indices used as a general measure of market performance. Calculations assume dividends and capital gains are reinvested and do not include any managerial expenses. From inception calculation is based on life of Initial Class shares.
The performance data presented represents past performance; future results may vary. The portfolio’s investment return and net asset value will fluctuate. Past performance does not guarantee future results. Investor’s units when redeemed may be worth more or less than their original cost.
Current performance may be lower or higher than performance quoted. Please visit your insurance company’s website for contract or policy level standardized total returns current to the most recent month end. Portfolio performance is net of investment fees and fund expenses, but not product charges, which, if included, would significantly lower the performance quoted.
This material must be preceded or accompanied by a current prospectus, which includes specific contents regarding the investment objectives, explanation of share classes and policies of this portfolio.
2
Transamerica Balanced
UNDERSTANDING YOUR FUND’S EXPENSES
(unaudited)
SHAREHOLDER EXPENSES
Fund shareholders may incur ongoing costs, including management and advisory fees, distribution and service fees, and other fund expenses.
The following Example is intended to help you understand your ongoing costs (in dollars and cents) of investing in the Fund and to compare these costs with the ongoing costs of investing in other funds.
The Example is based on an investment of $1,000 invested at July 1, 2007 and held for the entire period until December 31, 2007.
ACTUAL EXPENSES
The first line in the table below provides information about actual account values and actual expenses. You may use the information in this line, together with the amount you invested, to estimate the expenses that you paid over the period. Simply divide your account value by $1,000 (for example, an $8,600 account value divided by $1,000 = 8.6), then multiply the result by the number in the first line of your Fund under the heading entitled “Expenses Paid During Period” to estimate the expenses you paid on your account during this period.
HYPOTHETICAL EXAMPLE FOR COMPARISON PURPOSES
The second line in the table below provides information about hypothetical account values and hypothetical expenses based on the Fund’s actual expense ratio and an assumed rate of return of 5% per year before expenses, which is not the Fund’s actual return. The hypothetical account values and expenses may not be used to estimate the actual ending account balance or expenses you paid for the period. You may use this information to compare the ongoing costs of investing in your Fund and other funds. To do so, compare this 5% hypothetical example with the 5% examples that appear in the shareholder reports of the other funds.
Please note that the expenses shown in the table are meant to highlight your ongoing costs only and do not reflect any transactional costs, such as sales charges, redemption fees, brokerage commissions paid on purchases and sales of fund shares. Therefore, the second line under the Fund in the table is useful in comparing ongoing costs only, and will not help you determine the relative total costs of owning different funds. If any of these transaction costs were included, your costs would be higher. The expenses shown in the table do not reflect any fees that may be charged to you by brokers, financial intermediaries or other financial institutions.
| | Beginning
Account
Value | | Ending
Account
Value | | Annualized
Expense
Ratio | | Expenses
Paid During
Period (a) | |
| | | | | | | | | |
Initial Class | | | | | | | | | |
Actual | | $ | 1,000.00 | | $ | 1,056.69 | | 0.90 | % | $ | 4.67 | |
Hypothetical (b) | | 1,000.00 | | 1,020.67 | | 0.90 | | 4.58 | |
| | | | | | | | | |
Service Class | | | | | | | | | |
Actual | | 1,000.00 | | 1,055.93 | | 1.15 | | 5.96 | |
Hypothetical (b) | | 1,000.00 | | 1,019.41 | | 1.15 | | 5.85 | |
| | | | | | | | | | | | |
(a) | | Expenses are calculated using the Fund’s annualized expense ratio (as disclosed in the table), multiplied by the average account value for the period, multiplied by the number of days in the period (184 days), and divided by the number of days in the year (365 days). |
| | |
(b) | | 5% return per year before expenses. |
GRAPHICAL PRESENTATION OF SCHEDULE OF INVESTMENTS
By Asset Type
At December 31, 2007

This chart shows the percentage breakdown by asset type of the Fund’s total investment securities.
3
Transamerica Balanced
SCHEDULE OF INVESTMENTS
At December 31, 2007
(all amounts except share amounts in thousands)
| | Principal | | Value | |
U.S. GOVERNMENT OBLIGATIONS (5.4%) | | | | | |
U.S. Treasury Bond | | | | | |
4.50%, due 02/15/2036 ^ | | $ | 629 | | $ | 632 | |
4.75%, due 02/15/2037 ^ | | 867 | | 907 | |
8.00%, due 11/15/2021 | | 335 | | 459 | |
U.S. Treasury Inflation Indexed Note , TIPS | | | | | |
2.63%, due 07/15/2017 | | 988 | | 1,066 | |
U.S. Treasury Note | | | | | |
3.38%, due 11/20/2012 | | 145 | | 145 | |
4.00%, due 02/15/2015 | | 925 | | 938 | |
4.25%, due 09/30/2012 – 11/15/2017 ^ | | 1,100 | | 1,121 | |
4.50%, due 05/15/2010 – 05/15/2017 ^ | | 235 | | 243 | |
Total U.S. Government Obligations (cost $5,300) | | | | 5,511 | |
| | | | | |
U.S. GOVERNMENT AGENCY OBLIGATIONS (2.7%) | | | | | |
Fannie Mae | | | | | |
5.00%, due 04/25/2034 | | 500 | | 488 | |
Freddie Mac | | | | | |
4.25%, due 10/15/2026 | | 550 | | 545 | |
5.00%, due 10/15/2030 | | 720 | | 719 | |
5.35%, due 11/14/2011 | | 1,000 | | 1,009 | |
Total U.S. Government Agency | | | | | |
Obligations (cost $2,735) | | | | 2,761 | |
| | | | | |
MORTGAGE-BACKED SECURITIES (2.3%) | | | | | |
Bear Stearns Commercial Mortgage | | | | | |
Securities | | | | | |
Series 2006-PW14, Class A4 | | | | | |
5.20%, due 12/11/2038 | | 420 | | 416 | |
Citigroup/Deutsche Bank Commercial | | | | | |
Mortgage Trust | | | | | |
Series 2007-CD4, Class A4 | | | | | |
5.32%, due 12/11/2049 | | 215 | | 214 | |
Crown Castle Towers LLC | | | | | |
Series 2006-1A, Class AFX-144A | | | | | |
5.24%, due 11/15/2036 | | 383 | | 382 | |
Morgan Stanley Capital I | | | | | |
Series 2006-HQ10, Class A4 | | | | | |
5.33%, due 11/12/2041 | | 435 | | 435 | |
SBA CMBS Trust | | | | | |
Series 2006-1A, Class A-144A | | | | | |
5.31%, due 11/15/2036 | | 380 | | 380 | |
Wachovia Bank Commercial Mortgage | | | | | |
Trust | | | | | |
Series 2006-C28, Class A4 | | | | | |
5.57%, due 10/15/2048 | | 420 | | 427 | |
Wachovia Bank Commercial Mortgage Trust | | | | | |
Series 2007-C32, Class H-144A | | | | | |
5.93%, due 06/15/2049 | | $ | 120 | | $ | 83 | |
Total Mortgage-Backed Securities (cost $2,366) | | | | 2,337 | |
| | | | | |
ASSET-BACKED SECURITIES (0.3%) | | | | | |
USAA Auto Owner Trust | | | | | |
Series 2007-2, Class A3 | | | | | |
4.90%, due 02/15/2012 | | 310 | | 312 | |
Total Asset-Backed Securities (cost $310) | | | | 312 | |
| | | | | |
CORPORATE DEBT SECURITIES (17.0%) | | | | | |
Aerospace & Defense (0.4%) | | | | | |
Embraer Overseas, Ltd. | | | | | �� |
6.38%, due 01/24/2017 | | 202 | | 192 | |
Honeywell International | | | | | |
5.63%, due 08/01/2012 | | 195 | | 202 | |
Air Freight & Logistics (0.3%) | | | | | |
FedEx Corp. | | | | | |
9.65%, due 06/15/2012 | | 290 | | 340 | |
Airlines (0.4%) | | | | | |
American Airlines, Inc. Series 99-1 | | | | | |
7.02%, due 10/15/2009 | | 130 | | 131 | |
Delta Air Lines, Inc. | | | | | |
7.57%, due 11/18/2010 | | 120 | | 121 | |
United Airlines, Inc. | | | | | |
6.64%, due 07/02/2022 | | 166 | | 156 | |
Beverages (0.4%) | | | | | |
Anheuser-Busch Cos., Inc. | | | | | |
6.45%, due 09/01/2037 | | 125 | | 136 | |
Diageo Capital PLC | | | | | |
5.75%, due 10/23/2017 | | 235 | | 236 | |
Capital Markets (0.3%) | | | | | |
JP Morgan Chase Capital XVIII | | | | | |
6.95%, due 08/17/2036 | | 145 | | 138 | |
Nuveen Investments, Inc. | | | | | |
5.00%, due 09/15/2010 | | 150 | | 137 | |
Chemicals (1.1%) | | | | | |
ICI Wilmington, Inc. | | | | | |
4.38%, due 12/01/2008 | | 430 | | 429 | |
Lubrizol Corp. | | | | | |
4.63%, due 10/01/2009 | | 720 | | 723 | |
Commercial Banks (1.2%) | | | | | |
Barclays PLC | | | | | |
6.28%, due 12/15/2034 ^ Ž, 1 | | 145 | | 126 | |
General Electric Capital Corp. | | | | | |
5.50%, due 04/28/2011 | | 250 | | 257 | |
HBOS PLC -144A | | | | | |
6.66%, due 11/21/2049 * Ž, 1 | | 150 | | 124 | |
ICICI Bank, Ltd. -144A | | | | | |
6.63%, due 10/03/2012 | | 143 | | 142 | |
The notes to the financial statements are an integral part of this report.
4
| | Principal | | Value | |
Commercial Banks (continued) | | | | | |
Rabobank Capital Funding II -144A | | | | | |
5.26%, due 12/31/2013 Ž | | $ | 110 | | $ | 102 | |
Sumitomo Mitsui Banking Corp. -144A | | | | | |
5.63%, due 10/15/2015 Ž, (1) | | 125 | | 117 | |
Wachovia Capital Trust III | | | | | |
5.80%, due 03/15/2011 Ž, (1) | | 305 | | 273 | |
ZFS Finance USA Trust II -144A | | | | | |
6.45%, due 12/15/2065 (1) | | 125 | | 117 | |
Computers & Peripherals (0.1%) | | | | | |
Hewlett-Packard Co. | | | | | |
3.63%, due 03/15/2008 | | 133 | | 133 | |
Construction Materials (0.1%) | | | | | |
Lafarge SA | | | | | |
7.13%, due 07/15/2036 | | 136 | | 132 | |
Consumer Finance (0.9%) | | | | | |
Capital One Bank | | | | | |
5.75%, due 09/15/2010 | | 370 | | 370 | |
Discover Financial Services -144A | | | | | |
6.23%, due 06/11/2010 * | | 300 | | 286 | |
John Deere Capital Corp. | | | | | |
4.40%, due 07/15/2009 | | 300 | | 301 | |
Diversified Financial Services (1.0%) | | | | | |
Citigroup, Inc. | | | | | |
3.63%, due 02/09/2009 | | 110 | | 108 | |
Glencore Funding LLC -144A | | | | | |
6.00%, due 04/15/2014 | | 147 | | 148 | |
ILFC E-Capital Trust II -144A | | | | | |
6.25%, due 12/21/2065 (1) | | 205 | | 196 | |
Mizuho Preferred Capital Co. LLC -144A | | | | | |
8.79%, due 12/29/2049 Ž | | 402 | | 406 | |
Pemex Finance, Ltd. | | | | | |
9.03%, due 02/15/2011 | | 195 | | 206 | |
Diversified Telecommunication Services (0.3%) | | | | | |
Verizon Global Funding Corp. | | | | | |
4.00%, due 01/15/2008 | | 265 | | 265 | |
Electric Utilities (1.2%) | | | | | |
Dominion Resources, Inc. | | | | | |
5.687 due 05/15/2008 (2) | | 300 | | 301 | |
FPL Group Capital, Inc. | | | | | |
5.55%, due 02/16/2008 | | 350 | | 350 | |
Pacific Gas & Electric Co. | | | | | |
5.63%, due 11/30/2017 | | 275 | | 276 | |
Sempra Energy | | | | | |
7.95%, due 03/01/2010 | | 300 | | 320 | |
Energy Equipment & Services (0.2%) | | | | | |
Transocean, Inc. | | | | | |
6.80%, due 03/15/2038 | | 160 | | 163 | |
Food & Staples Retailing (0.9%) | | | | | |
Costco Wholesale Corp. | | | | | |
5.50%, due 03/15/2017 | | 252 | | 254 | |
Fred Meyer, Inc. | | | | | |
7.45%, due 03/01/2008 | | 290 | | 291 | |
Stater Brothers Holdings, Inc. | | | | | |
8.13%, due 06/15/2012 | | | 100 | | | 99 | |
Wal-Mart Stores, Inc. | | | | | |
6.50%, due 08/15/2037 | | 240 | | 253 | |
Food Products (0.7%) | | | | | |
Bunge, Ltd. Finance Corp. | | | | | |
4.38%, due 12/15/2008 | | 325 | | 323 | |
Cargill, Inc. -144A | | | | | |
5.00%, due 11/15/2013 | | 290 | | 285 | |
Michael Foods, Inc. | | | | | |
8.00%, due 11/15/2013 | | 100 | | 99 | |
Gas Utilities (0.7%) | | | | | |
Oneok, Inc. | | | | | |
5.51%, due 02/16/2008 | | 390 | | 390 | |
Southern Union Co. | | | | | |
6.15%, due 08/16/2008 | | 334 | | 335 | |
Hotels, Restaurants & Leisure (0.8%) | | | | | |
Las Vegas Sands Corp. | | | | | |
6.38%, due 02/15/2015 | | 100 | | 94 | |
McDonald’s Corp. | | | | | |
5.80%, due 10/15/2017 | | 220 | | 228 | |
Royal Caribbean Cruises, Ltd. | | | | | |
8.75%, due 02/02/2011 | | 270 | | 281 | |
Starbucks Corp. | | | | | |
6.25%, due 08/15/2017 | | 140 | | 145 | |
Wyndham Worldwide Corp. | | | | | |
6.00%, due 12/01/2016 | | 85 | | 81 | |
Household Products (0.1%) | | | | | |
Kimberly-Clark | | | | | |
6.63%, due 08/01/2037 | | 125 | | 138 | |
Independent Power Producers & Energy Traders (0.3%) | | | | | |
Empresa Nacional de Electricidad | | | | | |
SA/Chile Class B | | | | | |
8.50%, due 04/01/2009 | | 250 | | 261 | |
Insurance (0.5%) | | | | | |
Genworth Financial, Inc. | | | | | |
5.23%, due 05/16/2009 | | 250 | | 252 | |
Oil Insurance, Ltd. -144A | | | | | |
7.56%, due 06/30/2011 * Ž, (1) | | 250 | | 255 | |
Machinery (0.2%) | | | | | |
Tyco Electronics Group SA -144A | | | | | |
6.55%, due 10/01/2017 | | 199 | | 205 | |
Media (0.8%) | | | | | |
Amfm, Inc. | | | | | |
8.00%, due 11/01/2008 | | 225 | | 233 | |
Comcast Corp. | | | | | |
7.05%, due 03/15/2033 | | 110 | | 120 | |
McGraw-Hill Cos., Inc. | | | | | |
5.38%, due 11/15/2012 | | 220 | | 224 | |
News America Holdings, Inc. | | | | | |
7.75%, due 12/01/2045 | | 100 | | 108 | |
5
Media (continued) | | | | | |
Time Warner Entertainment Co., LP | | | | | |
8.38%, due 07/15/2033 | | $ | 150 | | $ | 181 | |
Multiline Retail (0.3%) | | | | | |
Neiman-Marcus Group, Inc. | | | | | |
9.00%, due 10/15/2015 | | 150 | | 155 | |
Target Corp. | | | | | |
6.50%, due 10/15/2037 | | 124 | | 124 | |
Office Electronics (0.1%) | | | | | |
Xerox Corp. | | | | | |
6.40%, due 03/15/2016 | | 100 | | 102 | |
Oil, Gas & Consumable Fuels (1.1%) | | | | | |
Husky Oil, Ltd. | | | | | |
8.90%, due 08/15/2028 (1) | | 105 | | 106 | |
Petrobras International Finance Co. | | | | | |
5.88%, due 03/01/2018 | | 210 | | 209 | |
PetroHawk Energy Corp. | | | | | |
9.13%, due 07/15/2013 | | 100 | | 105 | |
Teppco Partners, LP | | | | | |
7.00%, due 06/01/2067 * (1) | | 115 | | 105 | |
Valero Energy Corp. | | | | | |
3.50%, due 04/01/2009 | | 385 | | 379 | |
Valero Logistics Operations, LP | | | | | |
6.88%, due 07/15/2012 | | 200 | | 214 | |
Real Estate Investment Trusts (1.4%) | | | | | |
BRE Properties, Inc. | | | | | |
5.75%, due 09/01/2009 | | 380 | | 389 | |
Hospitality Properties Trust | | | | | |
6.75%, due 02/15/2013 | | 261 | | 268 | |
PPF Funding, Inc. -144A | | | | | |
5.35%, due 04/15/2012 | | 355 | | 354 | |
Weingarten Realty Investors | | | | | |
5.26%, due 05/15/2012 | | 130 | | 128 | |
Westfield Capital Corp., Ltd./Wt Finance | | | | | |
AUST Pty, Ltd./Wea Finance LLC | | | | | |
-1 44A | | | | | |
4.38%, due 11/15/2010 | | 330 | | 322 | |
Real Estate Management & Development (0.7%) | | | | | |
Duke Realty, LP | | | | | |
5.63%, due 08/15/2011 | | 290 | | 292 | |
ERP Operating, LP | | | | | |
5.38%, due 08/01/2016 | | 215 | | 203 | |
Post Apartment Homes, LP | | | | | |
6.30%, due 06/01/2013 | | 213 | | 223 | |
Road & Rail (0.2%) | | | | | |
Erac USA Finance Co. -144A | | | | | |
6.38%, due 10/15/2017 | | 170 | | 164 | |
Specialty Retail (0.2%) | | | | | |
Lowe’s Companies, Inc. | | | | | |
6.65%, due 09/15/2037 | | 100 | | 101 | |
Petro Stopping Centers, LP / Petro | | | | | |
9.00%, due 02/15/2012 | | 85 | | 89 | |
Wireless Telecommunication Services (0.1%) | | | | | |
Nextel Communications, Inc. | | | | | |
7.38%, due 08/01/2015 | | $ | 95 | | $ | 93 | |
Total Corporate Debt Securities (cost $17,429) | | | | 17,420 | |
| | Shares | | Value | |
PREFERRED STOCKS (0.0%) | | | | | |
Thrifts & Mortgage Finance (0.0%) | | | | | |
IndyMac Bank Fsb -144A | | 5,000 | | $ | 54 | |
Total Preferred Stocks (cost $125) | | | | 54 | |
| | | | | |
COMMON STOCKS (68.9%) | | | | | |
Aerospace & Defense (1.3%) | | | | | |
Boeing Co. | | 15,000 | | 1,312 | |
Air Freight & Logistics (2.0%) | | | | | |
Expeditors International Washington, | | 45,000 | | 2,011 | |
Inc. | | | | | |
Auto Components (3.4%) | | | | | |
BorgWarner, Inc. | | 34,000 | | 1,646 | |
Johnson Controls, Inc. | | 50,000 | | 1,802 | |
Automobiles (2.1%) | | | | | |
Daimler AG ^ | | 15,000 | | 1,435 | |
Harley-Davidson, Inc. | | 16,000 | | 747 | |
Biotechnology (1.5%) | | | | | |
Gilead Sciences, Inc. ‡ | | 34,000 | | 1,564 | |
Capital Markets (3.2%) | | | | | |
Ameriprise Financial, Inc. | | 30,000 | | 1,653 | |
Charles Schwab Corp. (The) | | 22,000 | | 562 | |
T. Rowe Price Group, Inc. | | 18,000 | | 1,096 | |
Chemicals (1.2%) | | | | | |
Sigma-Aldrich Corp. | | 22,000 | | 1,201 | |
Communications Equipment (2.8%) | | | | | |
Qualcomm, Inc. | | 44,000 | | 1,731 | |
Research In Motion, Ltd. ‡ | | 10,000 | | 1,134 | |
Computers & Peripherals (4.3%) | | | | | |
Apple, Inc. | | 22,000 | | 4,358 | |
Construction & Engineering (7.9%) | | | | | |
Jacobs Engineering Group, Inc. ‡ | | 85,000 | | 8,127 | |
Consumer Finance (2.0%) | | | | | |
American Express Co. | | 40,000 | | 2,081 | |
Diversified Financial Services (3.4%) | | | | | |
CME Group, Inc. Class A | | 5,000 | | 3,430 | |
Diversified Telecommunication Services (1.9%) | | | | | |
Verizon Communications, Inc. | | 45,000 | | 1,966 | |
Electronic Equipment & Instruments (1.3%) | | | | | |
Tyco Electronics, Ltd. | | 35,000 | | 1,300 | |
Energy Equipment & Services (1.5%) | | | | | |
Schlumberger, Ltd. | | 16,000 | | 1,574 | |
Food & Staples Retailing (0.5%) | | | | | |
Walgreen Co. | | 14,000 | | 533 | |
Health Care Equipment & Supplies (1.0%) | | | | | |
Varian Medical Systems, Inc. ‡ | | 19,000 | | 991 | |
Hotels, Restaurants & Leisure (2.1%) | | | | | |
Marriott International, Inc. Class A | | 28,000 | | 957 | |
| | | | | | |
6
| | Shares | | Value | |
Hotels, Restaurants & Leisure (continued) | | | | | |
MGM Mirage, Inc. ‡ | | 14,000 | | $ | 1,176 | |
Industrial Conglomerates (1.3%) | | | | | |
General Electric Co. | | 37,000 | | 1,372 | |
Insurance (1.5%) | | | | | |
American International Group, Inc. | | 27,000 | | 1,574 | |
Internet Software & Services (2.4%) | | | | | |
Google, Inc. Class A ‡ | | 3,500 | | 2,420 | |
Machinery (7.5%) | | | | | |
Caterpillar, Inc. | | 32,000 | | 2,322 | |
Kennametal, Inc. | | 70,000 | | 2,650 | |
PACCAR, Inc. | | 50,000 | | 2,724 | |
Media (2.1%) | | 50,000 | | 2,191 | |
McGraw-Hill Cos., Inc. (The) ^ | | | | | |
Multiline Retail (1.5%) | | 42,000 | | 1,543 | |
Nordstrom, Inc. | | | | | |
Oil, Gas & Consumable Fuels (1.1%) | | 10,000 | | 1,087 | |
Suncor Energy, Inc. | | | | | |
Pharmaceuticals (1.6%) | | | | | |
Allergan, Inc. | | 25,000 | | | 1,606 | |
Semiconductors & Semiconductor Equipment (1.6%) | | | | | |
Intel Corp. | | 60,000 | | 1,600 | |
Software (3.0%) | | | | | |
Microsoft Corp. | | 60,000 | | 2,136 | |
Salesforce.Com, Inc. ‡^ | | 15,000 | | 940 | |
Trading Companies & Distributors (1.9%) | | | | | |
WW Grainger, Inc. | | 22,000 | | 1,924 | |
Total Common Stocks (cost $51,607) | | | | 70,476 | |
| | | | | |
Total Securities Lending Collateral (cost $3,570) (3) | | | | 3,570 | |
| | | | | |
Total Investment Securities (cost $83,442) # | | | | $ | 102,441 | |
NOTES TO SCHEDULE OF INVESTMENTS:
^ | | At December 31, 2007, all or a portion of this security is on loan (see Note 1). The value at December 31, 2007, of all securities on loan is $3,489. |
* | | Floating or variable rate note. Rate is listed as of December 31, 2007. |
‡ | | Non-Income Producing. |
(1) | | Coupon rate is fixed for a predetermined period of time and then converts to a floating rate until maturity/call date. Rate is listed as of December 31, 2007. |
(2) | | Step Bond. Interest rate may increase or decrease as the credit rating changes. |
(3) | | Cash collateral for the Repurchase Agreements, valued at $1,294, that serves as collateral for securities lending, is invested in corporate bonds with interest rates and maturity dates ranging from 3.00% - 10.18% and 04/28/2008 - 12/01/2096, respectively. |
Ž | | The security has a perpetual maturity. The date shown is the next call date. |
# | | Aggregate cost for federal income tax purposes is $83,452. Aggregate gross unrealized appreciation for all securities in which there is an excess of value over tax cost and aggregate gross unrealized depreciation for all securities in which there is an excess of tax cost over value were $20,257 and $1,268, respectively. Net unrealized appreciation for tax purposes is $18,989. |
DEFINITIONS:
144A | | 144A Securities are registered pursuant to Rule 144A of the Securities Act of 1933. These securities are deemed to be liquid for purposes of compliance limitations on holdings of illiquid securities and may be resold as transactions exempt from registration, normally to qualified institutional buyers. At December 31, 2007, these securities aggregated $4,122, or 4.03%, of net assets of the Fund. |
TIPS | | Treasury Inflation Protected Security |
The notes to the financial statements are an integral part of this report.
7
Transamerica Balanced
STATEMENT OF ASSETS AND LIABILITIES
At December 31, 2007
(all amounts except per share amounts in thousands)
Assets: | | | |
Investment securities, at value (cost: $83,442) | | $ | 102,441 | |
(including securities loaned of $3,489) | | | |
Cash | | 2,880 | |
Receivables: | | | |
Shares sold | | 263 | |
Interest | | 392 | |
Income from loaned securities | | 2 | |
Dividends | | 85 | |
Dividend reclaims | | 2 | |
| | 106,065 | |
| | | |
Liabilities: | | | |
Accounts payable and accrued liabilities: | | | |
Shares redeemed | | 44 | |
Management and advisory fees | | 69 | |
Distribution and service fees | | 4 | |
Administration fees | | 2 | |
Payable for collateral for securities on loan | | 3,570 | |
Other | | 33 | |
| | 3,722 | |
Net Assets | | $ | 102,343 | |
| | | |
Net Assets Consist of: | | | |
Capital Stock ($.01 par value) | | $ | 75 | |
Additional paid-in capital | | 75,718 | |
Undistributed (accumulated) net investment income | | 1,328 | |
Undistributed (accumulated) net realized gain from investment securities | | 6,223 | |
Net unrealized appreciation on investment securities | | 18,999 | |
Net Assets | | $ | 102,343 | |
| | | |
Net Assets by Class: | | | |
Initial Class | | $ | 81,632 | |
Service Class | | 20,711 | |
Shares Outstanding: | | | |
Initial Class | | 5,957 | |
Service Class | | 1,518 | |
Net Asset Value and Offering Price Per Share: | | | |
Initial Class | | $ | 13.70 | |
Service Class | | 13.64 | |
STATEMENT OF OPERATIONS
For the period ended December 31, 2007
(all amounts in thousands)
Investment Income: | | | |
Dividends (net of withholding taxes on foreign dividends of $6) | | $ | 691 | |
Interest | | 1,472 | |
Income from loaned securities-net | | 23 | |
| | 2,186 | |
| | | |
Expenses: | | | |
Management and advisory fees | | 733 | |
Printing and shareholder reports | | 17 | |
Custody fees | | 25 | |
Administration fees | | 18 | |
Legal fees | | 2 | |
Audit fees | | 21 | |
Trustees fees | | 3 | |
Distribution and service fees: | | | |
Service Class | | 38 | |
Other | | 1 | |
Total expenses | | 858 | |
| | | |
Net Investment Income | | 1,328 | |
| | | |
Net Realized Gain (Loss) from: | | | |
Investment securities | | 6,225 | |
| | | |
Net Increase (Decrease) in Unrealized Appreciation (Depreciation) on: | | | |
Investment securities | | 3,891 | |
| | | |
Net Realized and Unrealized Gain: | | 10,116 | |
Net Increase In Net Assets Resulting from Operations | | $ | 11,444 | |
The notes to the financial statements are an integral part of this report.
8
Transamerica Balanced
STATEMENTS OF CHANGES IN NET ASSETS
For the years ended
(all amounts in thousands)
| | December 31,
2007 | | December 31,
2006 | |
Increase (Decrease) in Net Assets From: | | | | | |
Operations: | | | | | |
Net investment income | | $ | 1,328 | | $ | 998 | |
Net realized gain from investment securities | | 6,225 | | 391 | |
Change in unrealized appreciation on investment securities | | 3,891 | | 5,168 | |
| | 11,444 | | 6,557 | |
Distributions to Shareholders: | | | | | |
From net investment income: | | | | | |
Initial Class | | (834 | ) | (697 | ) |
Service Class | | (164 | ) | (59 | ) |
| | (998 | ) | (756 | ) |
From net realized gains: | | | | | |
Initial Class | | (321 | ) | (1,768 | ) |
Service Class | | (69 | ) | (170 | ) |
| | (390 | ) | (1,938 | ) |
Capital Share Transactions: | | | | | |
Proceeds from shares sold: | | | | | |
Initial Class | | 16,252 | | 20,354 | |
Service Class | | 13,255 | | 6,767 | |
| | 29,507 | | 27,121 | |
Dividends and distributions reinvested: | | | | | |
Initial Class | | 1,155 | | 2,466 | |
Service Class | | 233 | | 228 | |
| | 1,388 | | 2,694 | |
Cost of shares redeemed: | | | | | |
Initial Class | | (16,175 | ) | (16,109 | ) |
Service Class | | (4,054 | ) | (1,437 | ) |
| | (20,229 | ) | (17,546 | ) |
| | 10,666 | | 12,269 | |
Net increase (decrease) in net assets | | 20,722 | | 16,132 | |
| | | | | |
Net Assets: | | | | | |
Beginning of year | | 81,621 | | 65,489 | |
End of year | | $ | 102,343 | | $ | 81,621 | |
Undistributed (Accumulated) Net Investment Income (Loss) | | $ | 1,328 | | $ | 998 | |
Share Activity: | | | | | |
Shares issued: | | | | | |
Initial Class | | 1,229 | | 1,702 | |
Service Class | | 1,016 | | 566 | |
| | 2,245 | | 2,268 | |
Shares issued-reinvested from distributions: | | | | | |
Initial Class | | 90 | | 214 | |
Service Class | | 18 | | 20 | |
| | 108 | | 234 | |
Shares redeemed: | | | | | |
Initial Class | | (1,236 | ) | (1,345 | ) |
Service Class | | (308 | ) | (120 | ) |
| | (1,544 | ) | (1,465 | ) |
Net increase (decrease) in shares outstanding: | | | | | |
Initial Class | | 83 | | 571 | |
Service Class | | 726 | | 466 | |
| | 809 | | 1,037 | |
The notes to the financial statements are an integral part of this report.
9
Transamerica Balanced
FINANCIAL HIGHLIGHTS
For a share outstanding throughout each period(a)
| | Initial Class | |
| | Year Ended December 31, | |
| | 2007 | | 2006 | | 2005 | | 2004 | | 2003 | |
Net Asset Value | | | | | | | | | | | |
Beginning of period | | $ | 12.25 | | $ | 11.63 | | $ | 11.77 | | $ | 10.79 | | $ | 9.49 | |
Investment Operations | | | | | | | | | | | |
Net investment income (loss) | | 0.19 | | 0.16 | | 0.14 | | 0.16 | | 0.13 | |
Net realized and unrealized gain (loss) | | 1.47 | | 0.88 | | 0.74 | | 1.02 | | 1.19 | |
Total operations | | 1.66 | | 1.04 | | 0.88 | | 1.18 | | 1.32 | |
Distributions | | | | | | | | | | | |
From net investment income | | (0.15 | ) | (0.12 | ) | (0.16 | ) | (0.13 | ) | (0.02 | ) |
From net realized gains | | (0.06 | ) | (0.30 | ) | (0.86 | ) | (0.07 | ) | — | |
Total distributions | | (0.21 | ) | (0.42 | ) | (1.02 | ) | (0.20 | ) | (0.02 | ) |
Net Asset Value | | | | | | | | | | | |
End of period(b) | | $ | 13.70 | | $ | 12.25 | | $ | 11.63 | | $ | 11.77 | | $ | 10.79 | |
Total Return(c),(d) | | 13.61 | % | 9.12 | % | 7.96 | % | 11.16 | % | 13.90 | % |
Net Assets End of Period (000’s) | | $ | 81,632 | | $ | 71,949 | | $ | 61,698 | | $ | 62,934 | | $ | 61,419 | |
Ratio and Supplemental Data | | | | | | | | | | | |
Expenses to average net assets(e) | | 0.89 | % | 0.89 | % | 0.94 | % | 0.96 | % | 1.15 | % |
Net investment income (loss), to average net assets(e) | | 1.49 | % | 1.32 | % | 1.17 | % | 1.45 | % | 1.31 | % |
Portfolio turnover rate(d) | | 60 | % | 47 | % | 50 | % | 128 | % | 65 | % |
For a share outstanding throughout each period(a)
| | Service Class | |
| | Year Ended December 31, | | May 1 to Dec | |
| | 2007 | | 2006 | | 2005 | | 2004 | | 31, 2003 | |
Net Asset Value | | | | | | | | | | | |
Beginning of period | | $ | 12.21 | | $ | 11.61 | | $ | 11.77 | | $ | 10.79 | | $ | 9.73 | |
Investment Operations | | | | | | | | | | | |
Net investment income (loss) | | 0.16 | | 0.13 | | 0.11 | | 0.14 | | 0.08 | |
Net realized and unrealized gain (loss) | | 1.46 | | 0.87 | | 0.74 | | 1.01 | | 0.98 | |
Total operations | | 1.62 | | 1.00 | | 0.85 | | 1.15 | | 1.06 | |
Distributions | | | | | | | | | | | |
From net investment income | | (0.13 | ) | (0.10 | ) | (0.15 | ) | (0.10 | ) | — | |
From net realized gains | | (0.06 | ) | (0.30 | ) | (0.86 | ) | (0.07 | ) | — | |
Total distributions | | (0.19 | ) | (0.40 | ) | (1.01 | ) | (0.17 | ) | — | |
Net Asset Value | | | | | | | | | | | |
End of period(b) | | $ | 13.64 | | $ | 12.21 | | $ | 11.61 | | $ | 11.77 | | $ | 10.79 | |
Total Return(c),(d) | | 13.38 | % | 8.74 | % | 7.79 | % | 10.88 | % | 10.93 | % |
Net Assets End of Period (000’s) | | $ | 20,711 | | $ | 9,672 | | $ | 3,791 | | $ | 2,457 | | $ | 591 | |
Ratio and Supplemental Data | | | | | | | | | | | |
Expenses to average net assets(e) | | 1.14 | % | 1.14 | % | 1.19 | % | 1.19 | % | 1.38 | % |
Net investment income (loss), to average net assets(e) | | 1.25 | % | 1.11 | % | 0.91 | % | 1.31 | % | 1.14 | % |
Portfolio turnover rate(d) | | 60 | % | 47 | % | 50 | % | 128 | % | 65 | % |
(a) | | Per share information is calculated based on average number of shares outstanding. |
(b) | | Transamerica Balanced (the “Fund”) share class commenced operations as follows: |
| | Initial Class - May 1, 2002 |
| | Service Class - May 1, 2003 |
(c) | | Total Return reflects all portfolio expenses and includes reinvestment of dividends and capital gains; it does not reflect the charges and deductions under the policies or annuity contracts. |
(d) | | Not annualized. |
(e) | | Annualized. |
The notes to the financial statements are an integral part of this report.
10
Transamerica Balanced
NOTES TO FINANCIAL STATEMENTS
At December 31, 2007
(all amounts in thousands)
NOTE 1. ORGANIZATION AND SIGNIFICANT ACCOUNTING POLICIES
AEGON/Transamerica Series Trust (“ATST”) is an open-end management investment company registered under the Investment Company Act of 1940, as amended (the “1940 Act”). ATST serves as a funding vehicle for variable life insurance, variable annuity and group annuity products. Transamerica Balanced (the “Fund”) is part of ATST.
In the normal course of business, the Fund enters into contracts that contain a variety of representations that provide general indemnifications. The Fund’s maximum exposure under these arrangements is unknown, as this would involve future claims that may be made against the Fund and/or its affiliates that have not yet occurred. However, based on experience, the Fund expects the risk of loss to be remote.
This report should be read in conjunction with the current Fund prospectus, which contains more complete information about the Fund.
In preparing the Fund’s financial statements in accordance with accounting principles generally accepted in the United States of America (“GAAP”), estimates or assumptions (which could differ from actual results) may be used that affect reported amounts and disclosures. The following is a summary of significant accounting policies followed by the Fund.
Multiple class operations, income and expenses: The Fund currently offers two classes of shares, an Initial Class and a Service Class. Income, non-class specific expenses and realized and unrealized gains and losses, are allocated daily to each class, based upon the value of shares outstanding method as permitted under Rule 18f-3 of the 1940 Act. Each class bears its own specific expenses as well as a portion of general, common expenses.
Security valuations: The Fund values its investments at the close of the New York Stock Exchange (“NYSE”), normally 4 p.m. ET, each day the NYSE is open for business. Fund investments are valued at the last sale price or closing price on the day of valuation taken from the primary exchange where the security is principally traded.
Securities traded in the over-the-counter market and listed securities for which no sale was reported on that date are valued at the last quoted bid price.
Debt securities are valued based on a price quotation or other equivalent indication of value supplied by an exchange, a pricing service or a major market maker; however, those that mature in sixty days or less are valued at amortized cost, which approximates market.
Investment company securities are valued at the net asset value of the underlying portfolio.
Foreign securities generally are valued based on quotations from the primary market in which they are traded. Because many foreign securities markets and exchanges close prior to the close of the NYSE, closing prices for foreign securities in those markets or on those exchanges do not reflect the events that occur after that close. If a significant market event impacting the value of a portfolio security (e.g., natural disaster, company announcement, market volatility) occurs subsequent to the close of trading in the security, but prior to the calculation of the Fund’s net asset value per share, market quotations for that security may be determined to be unreliable and, accordingly, not “readily available.” As a result, foreign equity securities held by the Fund may be valued at fair market value as determined in good faith by the Fund’s Administrative Valuation Committee, under the supervision of the Board’s Valuation Committee, using guidelines adopted by the Board of Trustees.
Other securities for which quotations are not readily available are valued at fair market value as determined in good faith by the Fund’s Administrative Valuation Committee, using guidelines adopted by the Board of Trustees.
Cash: The Fund may leave cash overnight in its cash account with the custodian, State Street Bank & Trust Company (“State Street”). On July 2, 2007, State Street acquired the parent company of Investors Bank & Trust Company. State Street has been contracted on behalf of the Fund to invest the excess cash into a savings account, which at December 31, 2007 was paying an interest rate of 2.60%.
Repurchase agreements: The Fund is authorized to enter into repurchase agreements. The Fund, through its custodian, State Street, receives delivery of the underlying securities, the value of which at the time of purchase is required to be an amount equal to at least 100% of the resale price. The Fund will bear the risk of value fluctuations until the security can be sold and may encounter delays and incur costs in liquidating the security. In the event of bankruptcy or insolvency of the seller, delays and costs may be incurred.
Commission recapture: The sub-adviser, to the extent consistent with the best execution and usual commission rate policies and practices, may place security transactions of the Fund with broker/dealers with which ATST has established a Commission Recapture Program. A Commission Recapture Program is any arrangement under which a broker/dealer applies a portion of the commissions received by such broker/dealer on the security transactions to the Fund. In no event will commissions paid by the Fund be used to pay expenses that would otherwise be borne by any other funds within ATST, or by any other party.
Recaptured commissions during the year ended December 31, 2007 of $2 are included in net realized gains in the Statement of Operations.
11
NOTES TO FINANCIAL STATEMENTS (continued)
At December 31, 2007
(all amounts in thousands)
NOTE 1.– (continued)
Securities lending: The Fund may lend securities to qualified borrowers, with State Street acting as the Fund’s lending agent. The Fund earns negotiated lenders’ fees. The Fund receives cash and/or securities as collateral against the loaned securities. Cash collateral received is invested in short term, interest bearing securities. The Fund monitors the market value of securities loaned on a daily basis and requires collateral in an amount at least equal to the value of the securities loaned. Income from loaned securities on the Statement of Operations is net of fees, in the amount of $10, earned by State Street for its services.
The Fund has invested the cash collateral received from securities loaned in the following short-term, interest-bearing securities:
Abbey National PLC, Eurodollar Term, 5.00%, 1/7/2008 | | $ | 154 | |
ABN AMRO Bank NV, Eurodollar Term, 5.18%, 1/4/2008 | | 123 | |
Bank of Nova Scotia, Eurodollar Term, 4.96%, 1/22/2008 | | 108 | |
Barclays, Eurodollar Term, 5.00%, 2/12/2008 | | 216 | |
BNP Paribas, Eurodollar Term, 5.01%, 1/11/2008 | | 200 | |
Calyon, Eurodollar Term, 5.12%, 3/3/2008 | | 46 | |
Credit Suisse First Boston Corp., Repurchase Agreement, 4.60%, 1/2/2008 | | 401 | |
Dexia Group, Eurodollar Term, 4.82%, 1/3/2008 | | 154 | |
HBOS Halifax Bank of Scotland, Eurodollar Term, 5.15%, 1/2/2008 | | 77 | |
JPMorgan Chase & Co., Eurodollar Term, 5.15%, 2/12/2008 | | 77 | |
Lloyds TSB Bank, Eurodollar Term, 5.15%, 1/24/2008 | | 154 | |
Merrill Lynch & Co. (RPG), Repurchase Agreement, 4.60%, 1/2/2008 | | 231 | |
Morgan Stanley & Co. (Corp. Repo), Repurchase Agreement, 4.60%, 1/2/2008 | | 632 | |
Rabobank Nederland, Eurodollar Term, 5.08%, 1/10/2008 | | 185 | |
Reserve Primary Money Market Fund, 4.95% | | 164 | |
Royal Bank of Scotland, Eurodollar Term, 5.00%, 2/25/2008 | | 185 | |
Societe Generale, Eurodollar Term, 5.15%, 3/3/2008 | | 92 | |
Toronto Dominion Bank, Eurodollar Term, 5.05%, 1/10/2008 | | 185 | |
UBS AG, Eurodollar Term, 4.92%, 1/11/2008 | | 108 | |
Wells Fargo, Bank Note, 4.75%, 1/8/2008 | | 78 | |
| | $ | 3,570 | |
Real Estate Investment Trusts (“REITs”): There are certain additional risks involved in investing in REITs. These include, but are not limited to, economic conditions, changes in zoning laws, real estate values, property taxes and interest rates.
Security transactions and investment income: Security transactions are recorded on the trade date. Security gains and losses are calculated on the first-in, first-out basis. Dividend income, if any, is recorded on the ex-dividend date or, in the case of foreign securities, as soon as the Fund is informed of the ex-dividend date. Interest income, including accretion of discounts and amortization of premiums, is recorded on the accrual basis commencing on the settlement date.
Foreign currency denominated investments: The accounting records of the Fund are maintained in U.S. dollars. Securities and other assets and liabilities denominated in foreign currencies are translated into U.S. dollars at the closing exchange rate each day. The cost of foreign securities is translated at the exchange rate in effect when the investment was acquired. The Fund combines fluctuations from currency exchange rates and fluctuations in value when computing net realized and unrealized gains or losses from investments.
Net foreign currency gains and losses resulting from changes in exchange rates include: 1) foreign currency fluctuations between trade date and settlement date of investment security transactions; 2) gains and losses on forward foreign currency contracts; and 3) the difference between the receivable amounts of interest and dividends recorded in the accounting records in U.S. dollars and the amounts actually received.
Foreign currency denominated assets may involve risks not typically associated with domestic transactions. These risks include revaluation of currencies, adverse fluctuations in foreign currency values and possible adverse political, social and economic developments, including those particular to a specific industry, country or region.
Dividend distributions: Dividends and capital gains distributions are typically declared and reinvested annually and are generally paid and reinvested on the business day following the ex-date.
NOTE 2. RELATED PARTY TRANSACTIONS
ATST serves as a funding vehicle for certain affiliated asset allocation portfolios and certain affiliated separate accounts of Western Reserve Life Assurance Co. of Ohio, Transamerica Life Insurance Company, Transamerica Financial Life Insurance Company, Inc., Monumental Life Insurance Company and Transamerica Occidental Life Insurance Company.
Transamerica Fund Advisors, Inc. (“TFAI”) is the Fund’s investment adviser. Transamerica Fund Services, Inc. (“TFS”) is the Fund’s administrator and transfer agent. Prior to May 1, 2007, AFSG Securities Corp. (“AFSG”), was the Fund’s distributor. Transamerica Capital Inc. (“TCI”) is now the Fund’s distributor. TFAI, TFS AFSG, and TCI are affiliates of AEGON NV, a Netherlands corporation.
Transamerica Investment Management , LLC (“TIM”) is both an affiliate of the Fund and a sub-advisor of the Fund.
Certain officers and trustees of the Fund are also officers and/or directors of TFAI, TFS and AFSG.
Investment advisory fee: The Fund pays management fees to TFAI based on average daily net assets (“ANA”) at the following breakpoints:
0.80% of the first $250 million of ANA
0.75% of the next $250 million of ANA
0.70% of the next $1 billion of ANA
0.625% of ANA over $1.5 billion
12
NOTES TO FINANCIAL STATEMENTS (continued)
At December 31, 2007
(all amounts in thousands)
NOTE 2.– (continued)
TFAI has contractually agreed to waive its advisory fee and will reimburse the Fund to the extent that operating expenses, excluding 12b-1 fees, exceed the following stated annual limit:
1.40% Expense Limit
If total Fund expenses fall below the annual expense limitation agreement agreed to by the adviser within the succeeding three years, the Fund may be required to pay the adviser a portion or all of the waived advisory fees.
There were no amounts recaptured during the year ended December 31, 2007. There are no amounts available for recapture at December 31, 2007.
Distribution and service fees: ATST entered into a Distribution Agreement with AFSG dated January 1, 1997, as amended. On May 1, 2007, the Distribution Agreement was amended to replace AFSG with TCI as the Fund’s distributor.
The Fund has also adopted a distribution plan (“Distribution Plan”) pursuant to Rule 12b-1 under the 1940 Act.
Under the Distribution Plan for the Initial Class shares, TCI, on behalf of the Fund, is authorized to pay various service providers, as direct payment for expenses incurred in connection with distribution of the Fund’s shares, amounts equal to actual expenses associated with distributing the shares.
The Distribution Plan for the Service Class shares requires ATST to pay distribution fees to TCI as compensation for its activities, not as reimbursement for specific expenses. The fee on the Service Class is paid to the insurance companies for providing services and account maintenance for their policyholders who invest in the variable insurance products which invest in the Service Class shares.
The Fund is authorized under the Distribution Plan to pay fees on each class up to the following limits:
Initial Class | | 0.15 | % |
Service Class | | 0.25 | % |
TCI has determined that it will not seek payment by the Fund of the distribution expenses incurred with respect to the Initial Class shares before April 30, 2009. Prior to TCI seeking reimbursement of future expenses, policy and contract owners will be notified in advance. The Fund will pay fees relating to Service Class shares.
Administrative services: The Fund has entered into an agreement with TFS for financial and legal fund administration services. The Fund pays TFS an annual fee of 0.02% of ANA. The Legal fees on the Statement of Operations are for fees paid to external legal counsel.
Deferred compensation plan: Each eligible independent Fund Trustee may elect participation in a non-qualified deferred compensation plan (“the Plan”). Under the Plan, such Trustees may defer payment of all or a portion of their total fees earned as a Fund Trustee. Each Trustee who is a participant in the Plan may elect that the earnings, losses or gains credited to his or her deferred fee amounts be determined based on a deemed investment in any series of Transamerica IDEX Mutual Funds. The right of a participant to receive a distribution from the Plan of the deferred fees is an unsecured claim against the general assets of all series of Transamerica IDEX Mutual Funds. The pro rata liability to the Fund of all deferred fees in the Plan amounted, as of December 31, 2007, to $5. Amounts deferred under the Deferred Compensation Plan are unfunded against the general assets of ATST.
Retirement plan: Under a retirement plan (the “Emeritus Plan”) available to the Independent Trustees, each Independent Trustee is deemed to have elected to serve as Trustee Emeritus of ATST upon his or her termination of service, other than removal for cause, is entitled to 50% of the trustee’s current retainer for a maximum period of five years determined by his or her years of service as a Trustee.
Such amounts shall be accrued by ATST on a pro rata basis allocable to each series of ATST fund based on the relative assets of the series. If retainers increase in the future, past accruals (and credits) will be adjusted upward so that 50% of the Trustee’s current retainer is accrued and credited at all times. Upon death, disability or termination of service, other than removal for cause, amounts deferred become payable to a Trustee Emeritus (or his/her beneficiary). Upon the commencement of service as Trustee Emeritus, compensation will be paid on a quarterly basis during the time period that the Trustee Emeritus is allowed to serve as such.
Amounts accrued under the Emeritus Plan are unsecured claims against the general assets of ATST. For the year ended December 31, 2007, the amounts related to the Emeritus Plan was $3. As of December 31, 2007, the Fund has not made any payments related to the Emeritus Plan.
The Emeritus Plan was terminated effective October 30, 2007. Upon the termination, the Fund shall continue to pay any remaining benefits in accordance with the Plan, but no further compensation shall accrue under the Plan.
NOTE 3. INVESTMENT TRANSACTIONS
The cost of securities purchased and proceeds from securities sold (excluding short-term securities) for the year ended December 31, 2007 were as follows:
Purchases of securities: | | | |
Long-term | | $ | 63,946 | |
U.S. Government | | — | |
Proceeds from maturities and sales of securities: | | | |
Long-term | | 22,209 | |
U.S. Government | | 31,366 | |
| | | | |
13
NOTES TO FINANCIAL STATEMENTS (continued)
At December 31, 2007
(all amounts in thousands)
NOTE 4. FEDERAL INCOME TAX MATTERS
The Fund has not made any provision for federal income or excise taxes due to its policy to distribute all of its taxable income and capital gains to its shareholders and otherwise qualify as a regulated investment company under Subchapter M of the Internal Revenue Code. Income and capital gain distributions are determined in accordance with income tax regulations, which may differ from GAAP. These differences are primarily due to differing treatment for items including, but not limited to, wash sales, and return of capital.
The tax character of distributions paid may differ from the character of distributions shown in the Statements of Changes
In Net Assets due to short-term gains being treated as ordinary income for tax purposes. The tax character of distributions paid during 2006 and 2007 was as follows:
2006 Distributions paid from: | | | |
Ordinary Income | | $ | 1,010 | |
Long-term Capital Gain | | 1,684 | |
| | | |
2007 Distributions paid from: | | | |
Ordinary Income | | 998 | |
Long-term Capital Gain | | 390 | |
| | | | |
The tax basis components of distributable earnings as of December 31, 2007 are as follows:
Undistributed Ordinary Income | | $ | 1,371 | |
Undistributed Long-term Capital Gain | | $ | 6,190 | |
Net Unrealized Appreciation (Depreciation) | | $ | 18,989 | |
NOTE 5. REGULATORY PROCEEDINGS
There continues to be significant federal and state regulatory activity relating to financial services companies, particularly mutual fund companies and their investment advisers. As part of an ongoing investigation regarding potential market timing, recordkeeping and trading compliance issues and matters affecting the Fund’s investment adviser, TFAI, and certain affiliates and former employees of TFAI, the SEC staff has indicated that it is likely to take some action against TFAI and certain of its affiliates at the conclusion of the investigation. The potential timing and the scope of any such action is difficult to predict. Although the impact of any action brought against TFAI and/or its affiliates is difficult to assess at the present time, the Fund currently believes that the likelihood that any such action will have a material adverse impact is remote. It is important to note that the Fund is not aware of any allegation of wrong doing against it and its Board at the time this annual report is printed. Although it is not anticipated that these developments will have an adverse impact on the Fund, there can be no assurance at this time. TFAI and its affiliates are actively working with the SEC in regard to this matter; however, the exact resolution cannot be determined at this time. TFAI will take such actions that it deems necessary or appropriate to continue providing management services to the Fund and to bring all matters to an appropriate conclusion.
TFAI and/or its affiliates, and not the Fund, will bear the costs regarding these regulatory matters.
NOTE 6. RECENTLY ISSUED ACCOUNTING PRONOUNCEMENTS
In July 2006, the Financial Accounting Standards Board (“FASB”) released FASB Interpretation No. 48 “Accounting for Uncertainty in Income Taxes” (“FIN 48”), an interpretation of FASB Statement No. 109. FIN 48 provides guidance for how uncertain tax positions should be recognized, measured, presented and disclosed in the financial statements. FIN 48 requires the accounting and disclosure of tax positions taken or expected to be taken in the course of preparing the Fund’s tax returns to determine whether the tax positions are “more-likely-than-not” of being sustained by the applicable tax authority. Tax positions not deemed to meet the more-likely-than-not threshold would be recorded as a tax benefit or expense in the current year.
Adoption of FIN 48 is effective during the first required financial reporting period for fiscal years beginning after December 15, 2006. Management adopted FIN 48 on June 29, 2007.
Implementation of FIN 48 requires Management of the Fund to analyze all open tax years, as defined by the Statute of Limitations, for all major jurisdictions, which includes federal and certain states. Open tax years are those that are open for exam by taxing authorities (i.e., the last 4 tax year ends and the interim tax period since then). The Fund has no examinations in progress and none are expected at this time.
Management of the Fund has reviewed all open tax years and major jurisdictions and concluded the adoption of FIN 48 resulted in no impact to the Fund’s net assets or results of operations. There is no tax liability resulting from unrecognized tax benefits relating to uncertain income tax positions taken or expected to be taken in future tax returns. The Fund is also not aware of any tax positions for which it is reasonably possible that the total amounts of unrecognized tax benefits will significantly change in the next 12 months.
In September 2006, FASB issued its new Standard No. 157, “Fair Value Measurements” (“FAS 157”). FAS 157 is designed to unify guidance for the measurement of fair value of all types of assets, including financial instruments, and certain liabilities, throughout a number of accounting standards. FAS 157 also establishes a hierarchy for measuring fair value in generally accepted accounting principles and expands financial statement disclosures about fair value measurements that are relevant to mutual funds. FAS 157 is effective for financial statements issued for fiscal years beginning after November 15, 2007, and earlier application is permitted.
As of December 31, 2007, Management does not expect the adoption of FAS 157 to impact the amounts reported in the financial statements, however, additional disclosures will be required about the inputs used to develop the measurements of
14
NOTES TO FINANCIAL STATEMENTS (continued)
At December 31, 2007
(all amounts in thousands)
NOTE 6.– (continued)
fair value and the effect of certain of the measurements reported in the statement of operations for a fiscal period.
NOTE 7. SUBSEQUENT EVENT
Effective January 1, 2008, TFAI changed its name to Transamerica Asset Management, Inc.
Effective May 1, 2008, AEGON/Transamerica Series Trust will change its name to Transamerica Series Trust. At that time, the Fund will also change its name to Transamerica Balanced VP.
15
Report of Independent Registered Certified Public Accounting Firm
To the Board of Trustees and Shareholders of
Transamerica Balanced:
In our opinion, the accompanying statement of assets and liabilities, including the schedule of investments, and the related statements of operations and of changes in net assets and the financial highlights present fairly, in all material respects, the financial position of Transamerica Balanced (the “Fund”) (one of the portfolios constituting AEGON/Transamerica Series Trust) at December 31, 2007, the results of its operations for the year then ended, the changes in its net assets for each of the two years in the period then ended and the financial highlights for each of the periods presented, in conformity with accounting principles generally accepted in the United States of America. These financial statements and financial highlights (hereafter referred to as “financial statements”) are the responsibility of the Fund’s management; our responsibility is to express an opinion on these financial statements based on our audits. We conducted our audits of these financial statements in accordance with the standards of the Public Company Accounting Oversight Board (United States). Those standards require that we plan and perform the audit to obtain reasonable assurance about whether the financial statements are free of material misstatement. An audit includes examining, on a test basis, evidence supporting the amounts and disclosures in the financial statements, assessing the accounting principles used and significant estimates made by management, and evaluating the overall financial statement presentation. We believe that our audits, which included confirmation of securities at December 31, 2007 by correspondence with the custodian and brokers, provide a reasonable basis for our opinion.

Tampa, Florida
February 29, 2008
16
Transamerica Balanced
SUPPLEMENTAL TAX INFORMATION (unaudited)
(all amounts in thousands)
For tax purposes, the Fund has made a Long-Term Capital Gain Designation of $390 for the year ended December 31, 2007.
RESULTS OF SHAREHOLDER PROXY (unaudited)
At a special meeting of shareholders held on October 30, 2007, the results of the Proposals were as follows:
Proposal 1: To elect a new Board:
Proposed Trustee | | For | | Against | | Abstentions/Broker Non- Votes | |
John K. Carter | | 2,274,998,840.817 | | 57,804,698.755 | | 35,433.883 | |
| | | | | | | |
Leo J. Hill | | 2,277,212,702.754 | | 55,590,836.819 | | 35,433.883 | |
| | | | | | | |
Neal M. Jewell | | 2,266,793,295.663 | | 66,010,243.909 | | 35,433.883 | |
| | | | | | | |
Russell A. Kimball, Jr. | | 2,274,825,235.835 | | 57,978,303.737 | | 35,433.883 | |
| | | | | | | |
Eugene M. Mannella | | 2,274,623,165.033 | | 58,180,374.539 | | 35,433.883 | |
| | | | | | | |
Norm R. Nielsen | | 2,275,050,055.885 | | 57,753,483.687 | | 35,433.883 | |
| | | | | | | |
Joyce Galpern Norden | | 2,270,278,122.250 | | 62,525,417.323 | | 35,433.883 | |
| | | | | | �� | |
Patricia L. Sawyer | | 2,275,737,737.456 | | 57,065,802.116 | | 35,433.883 | |
| | | | | | | |
John W. Waechter | | 2,276,615,120.140 | | 56,188,419.433 | | 35,433.883 | |
Proposal 2: To approve an amendment to the Agreement and Declaration of Trust:
| | | | Abstentions/Broker Non- | |
For | | Against | | Votes | |
2,182,022,669.110 | | 77,590,048.544 | | 73,226,255.801 | |
17
Transamerica Balanced
INVESTMENT ADVISORY AND SUB-ADVISORY AGREEMENTS-REVIEW AND RENEWAL (unaudited)
At a meeting of the Board of Trustees of AEGON/Transamerica Series Trust (“ATST”) held on December 4th, 2007, the Board reviewed and considered the renewal of the investment advisory agreement (the “Investment Advisory Agreement”) between Transamerica Balanced (the “Fund”) and Transamerica Fund Advisors, Inc. (“TFAI”), as well as the renewal of the investment sub-advisory agreement (the “Sub-Advisory Agreement”) of the Fund between TFAI and Transamerica Investment Management, LLC (the “Sub-Adviser”), to determine whether the agreements should be renewed for a six-month period. It was noted that this review was interim in nature to align all the Funds on the same calendar, and that the Funds’ advisory arrangements would be reviewed again in the first half of 2008.
Following their review and consideration, the Trustees determined that the renewal of the Investment Advisory Agreement and the Sub-Advisory Agreement would enable shareholders of the Fund to obtain high quality services at a cost that is appropriate, fair, and in the best interests of its shareholders. The Board, including the independent members of the Board, unanimously approved the renewal of the Investment Advisory Agreement and Sub-Advisory Agreement. In reaching their decision, the Trustees requested and obtained from TFAI and the Sub-Adviser such information as they deemed reasonably necessary to evaluate the agreements, including information about fees and performance of comparable funds managed by the Sub-Adviser. The Trustees also carefully considered information they had previously received from TFAI and the Sub-Adviser throughout the year as part of their regular oversight of the Fund, as well as comparative fee, expense, and performance information prepared by Lipper Inc. (“Lipper”), an independent provider of mutual fund performance, fee and expense information and profitability data prepared by management. In considering the proposed continuation of the Investment Advisory and Sub-Advisory Agreements, the Trustees evaluated a number of considerations that they believed, in light of the legal advice furnished to them by independent legal counsel and their own business judgment, to be relevant. They based their decisions on a variety of factors, including the following considerations, among others, although they did not identify any consideration or particular information that was controlling of their decisions:
The nature, extent and quality of the advisory services to be provided. The Board considered the nature and quality of the services provided by TFAI and the Sub-Adviser to the Fund in the past, as well as the services anticipated to be provided in the future. The Board concluded that TFAI and the Sub-Adviser are capable of providing high quality services to the Fund, as indicated by the nature and quality of services provided in the past by TFAI and the Sub-Adviser for this series and the experience, capability and integrity of TFAI’s senior management, the financial resources of TFAI and the Sub-Adviser, TFAI’s management oversight process and the professional qualifications of the portfolio management team of the Sub-Adviser. The Trustees determined that TFAI and the Sub-Adviser can provide investment and related services that are appropriate in scope and extent in light of the Fund’s operations, the competitive landscape of the investment company business and investor needs.
The investment performance of the Fund. The Board examined the short and longer-term performance of the Fund, including relative performance against a peer universe of comparable mutual funds as prepared by Lipper for various trailing periods ended June 30, 2007. The Board noted that the Fund’s performance was near the median for its peer universe over the past 3-year period but was below the median for its peer universe over the past 1- and 5-year periods. The Board noted further that the long-term performance of the Fund could be attributed in part to the prior sub-adviser, which the current Sub-Adviser replaced in June 2004. On the basis of the Board’s assessment of the nature, extent and quality of advisory services to be provided or procured by TFAI and the Sub-Adviser, the Board concluded that TFAI and the Sub-Adviser are capable of providing a level of investment performance that is appropriate in light of the Fund’s proposed investment objectives, policies and strategies and competitive with other similarly situated investment companies, but that the Board would be monitoring performance closely.
The cost of advisory services provided and the level of profitability. The Board reviewed profitability information of TFAI’s cost of procuring fund management services, as well as the costs of its provision of administration, fund accounting and other services, to the Fund and to ATST as a whole by TFAI and its affiliates. The Board reviewed the management and sub-advisory fees for the Fund. The Board noted that the Fund’s contractual management fees and total expenses were above the median of the peer group and peer universe. Based on their review, the Trustees determined that the management fees of the Fund generally are appropriate in light of the services expected to be provided or procured, the management fees and the anticipated profitability of the relationship between the Fund, TFAI and its affiliates, and the Sub-Adviser. In making these observations and determinations, the Board reviewed, among other things, comparative information provided by Lipper.
Whether fee levels reflect economies of scale and the extent to which economies of scale would be realized as the Fund grows. In evaluating the extent to which the management fees payable under the Investment Advisory and Sub-Advisory Agreements reflect economies of scale or will permit economies of scale to be realized in the future, the Board noted that TFAI and the Sub-Adviser offer breakpoints which appropriately benefit investors by passing on economies of scale in the form of lower management fees as the level of assets grows. The Board noted that the advisory fee breakpoints are designed to coincide with fee breakpoints from the Sub-Adviser. The Trustees also concluded that they will have the opportunity to periodically reexamine whether the Fund has achieved economies of scale, and the appropriateness of management fees payable to TFAI and fees paid to the Sub-Adviser, in the future.
Benefits (such as soft dollars) to TFAI, its affiliates, or the Sub-Adviser from their relationship with the Fund. The Board concluded that other benefits anticipated to be derived by TFAI, its affiliates, and the Sub-Adviser from their relationships with the Fund are expected to be reasonable and fair, and consistent with industry practice and the best interests of the Fund and its shareholders. The Trustees noted that TFAI would not realize soft dollar benefits from its relationship with the Fund, and that the Sub-Adviser’s soft dollar trading is consistent with applicable law, including best execution requirements in particular. The Board also noted that the Sub-Adviser is participating in a brokerage program pursuant to which a portion of brokerage commissions paid by the Fund is recaptured for the benefit of the Fund and its shareholders, thus limiting the amount of soft dollar arrangements the Sub-Adviser may engage in with respect to the Fund’s brokerage transactions.
18
Other considerations. The Board determined that TFAI has made a substantial commitment to the recruitment and retention of high quality personnel, and maintains the financial, compliance and operational resources reasonably necessary to manage the Fund in a professional manner that is consistent with the best interests of the Fund and its shareholders. In this regard, the Trustees favorably considered the procedures and policies in place by TFAI to enforce compliance with applicable laws and regulations and oversee the portfolio management activities of the Sub-Adviser. The Trustees also determined that TFAI has made a significant entrepreneurial commitment to the management and success of the Fund, reflected by TFAI’s expense limitation and fee waiver arrangements with the Fund which may result in TFAI waiving a substantial amount of management fees for the benefit of shareholders.
19
Transamerica Convertible Securities
MARKET ENVIRONMENT
During the twelve months ended December 31, 2007, convertible securities were challenged by exceptional volatility in the stock and bond markets.
Initially, returns were positive, buoyed by steady corporate earnings and widespread expectations that the Federal Reserve Board would reduce interest rates to bolster the slowing U.S. economy. As the year progressed, however, markets reacted strongly to fallout from continued deterioration of the U.S. housing market and higher delinquencies in sub-prime mortgages. The sub-prime issues triggered problems in other investments underpinned by the risky loans, generating multi-billion-dollar losses for investors and lenders. As banks and mortgage companies, unwilling or unable to lend, hoarded cash, the flow of capital (i.e., liquidity) dried up, causing corporations and consumers to reduce their spending and adding to concerns about the economy.
Throughout the second half of the year, investors increasingly flocked to the relative safety of Treasuries. Other bond sectors, as well as many areas of the equity and convertibles markets, surrendered some of the gains achieved earlier in the period. The Standard and Poor’s 500 Composite Stock Index rose 5.49% for the twelve-month period.
PERFORMANCE
For the year ended December 31, 2007, Transamerica Convertible Securities, Initial Class returned 18.63%. By comparison its benchmark, the Merrill Lynch All U.S. Convertibles Index, returned 4.55%.
STRATEGY REVIEW
We seek the convertibles of well-run companies that generate free cash flow and stand to benefit from positive changes in the companies, their industries, or the external forces driving their businesses. For example, we believe that, driven by global growth, demand for energy sources will continue to expand; and that people’s desire to be connected to information, entertainment and each other will sustain growth of the personal electronics industry. For the most part, our investment in companies related to these trends paid off handsomely during the period.
The portfolio’s healthy returns were driven largely by gains from our investment in SunPower Corporation (“SunPower”). SunPower, a provider of solar energy panels, is vertically integrated, with manufacturing, distribution and installation capabilities. This competitive advantage, combined with a powerful wave of demand for more affordable energy sources, led to strong sales growth throughout 2007.
Other key detractors included Ford Motor Company and General Motors Corporation. An economic slowdown in the U.S. will likely depress automotive and truck sales in the near team. On the other hand, changes in the companies’ cost structures (i.e., shedding health care and pension costs) should make them more competitive in the long run.
Kirk J. Kim
Peter O. Lopez
Co-Portfolio Managers
Transamerica Investment Management, LLC
AEGON/Transamerica Series Trust | | Annual Report 2007 |
1
Transamerica Convertible Securities
(unaudited)
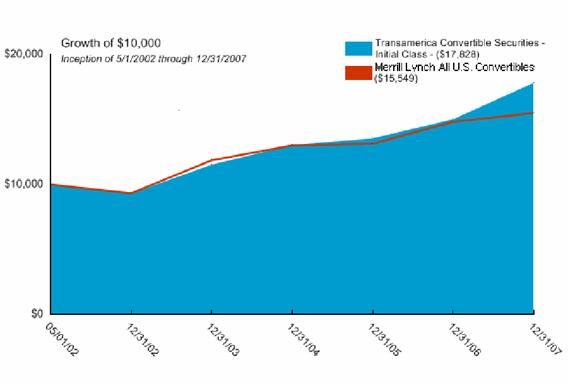
Average Annual Total Return for Periods Ended 12/31/2007
| | | | | | From | | Inception | |
| | 1 Year | | 5 Years | | Inception | | Date | |
| | | | | | | | | |
Initial Class | | 18.63 | % | 13.85 | % | 10.73 | % | 5/1/02 | |
Merrill Lynch All U.S. Convertibles(1) | | 4.55 | % | 10.67 | % | 8.09 | % | 5/1/02 | |
| | | | | | | | | |
Service Class | | 18.29 | % | — | % | 13.23 | % | 5/1/03 | |
NOTES
(1) The Merrill Lynch All U.S. Convertibles (MLCI) Index is an unmanaged index used as a general measure of market performance. Calculations assume dividends and capital gains are reinvested and do not include any managerial expenses. From inception, calculation is based on life of Initial Class shares.
The performance data presented represents past performance; future results may vary. The portfolio’s investment return and net asset value will fluctuate. Past performance does not guarantee future results. Investor’s units when redeemed may be worth more or less than their original cost.
Current performance may be lower or higher than performance quoted. Please visit your insurance company’s website for contract or policy level standardized total returns current to the most recent month end. Portfolio performance is net of investment fees and fund expenses, but not product charges, which, if included, would significantly lower the performance quoted.
This material must be preceded or accompanied by a current prospectus, which includes specific contents regarding the investment objectives, explanation of share classes and policies of this portfolio.
2
Transamerica Convertible Securities
UNDERSTANDING YOUR FUND’S EXPENSES
(unaudited)
SHAREHOLDER EXPENSES
Fund shareholders may incur ongoing costs, including management and advisory fees, distribution and service fees, and other fund expenses.
The following Example is intended to help you understand your ongoing costs (in dollars and cents) of investing in the Fund and to compare these costs with the ongoing costs of investing in other funds.
The Example is based on an investment of $1,000 invested at July 1, 2007 and held for the entire period until December 31, 2007.
ACTUAL EXPENSES
The first line in the table below provides information about actual account values and actual expenses. You may use the information in this line, together with the amount you invested, to estimate the expenses that you paid over the period. Simply divide your account value by $1,000 (for example, an $8,600 account value divided by $1,000 = 8.6), then multiply the result by the number in the first line of your Fund under the heading entitled “Expenses Paid During Period” to estimate the expenses you paid on your account during this period.
HYPOTHETICAL EXAMPLE FOR COMPARISON PURPOSES
The second line in the table below provides information about hypothetical account values and hypothetical expenses based on the Fund’s actual expense ratio and an assumed rate of return of 5% per year before expenses, which is not the Fund’s actual return. The hypothetical account values and expenses may not be used to estimate the actual ending account balance or expenses you paid for the period. You may use this information to compare the ongoing costs of investing in your Fund and other funds. To do so, compare this 5% hypothetical example with the 5% hypothetical examples that appear in the shareholder reports of the other funds.
Please note that the expenses shown in the table are meant to highlight your ongoing costs only and do not reflect any transactional costs, such as sales charges, redemption fees, brokerage commissions paid on purchases and sales of fund shares. Therefore, the second line under the Fund in the table is useful in comparing ongoing costs only, and will not help you determine the relative total costs of owning different funds. If any of these transaction costs were included, your costs would be higher. The expenses shown in the table do not reflect any fees that may be charged to you by brokers, financial intermediaries or other financial institutions.
| | Beginning
Account
Value | | Ending
Account
Value | | Annualized
Expense
Ratio | | Expenses
Paid During
Period(a) | |
| | | | | | | | | |
Initial Class | | | | | | | | | |
| Actual | | $ | 1,000.00 | | $ | 1,103.69 | | 0.79 | % | $ | 4.19 | |
| Hypothetical(b) | | 1,000.00 | | 1,021.22 | | 0.79 | | 4.02 | |
| | | | | | | | | |
Service Class | | | | | | | | | |
| Actual | | 1,000.00 | | 1,102.80 | | 1.04 | | 5.51 | |
| Hypothetical(b) | | 1,000.00 | | 1,019.96 | | 1.04 | | 5.30 | |
| | | | | | | | | | | | | |
(a) | | Expenses are calculated using the Fund’s annualized expense ratio (as disclosed in the table), multiplied by the average account value for the period, multiplied by the number of days in the period (184 days), and divided by the number of days in the year (365 days). |
| | |
(b) | | 5% return per year before expenses. |
GRAPHICAL PRESENTATION OF SCHEDULE OF INVESTMENTS
By Sector
At December 31, 2007
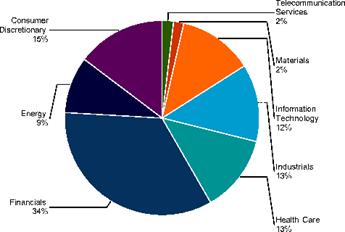
This chart shows the percentage breakdown by sector of the Fund’s total investment securities.
3
Transamerica Convertible Securities
SCHEDULE OF INVESTMENTS
At December 31, 2007
(all amounts except share amounts in thousands)
| | Shares | | Value | |
CONVERTIBLE PREFERRED STOCKS (10.6%) | | | | | |
Aerospace & Defense (2.0%) | | | | | |
Lockheed Martin Corp. * | | 3,990,000 | | $ | 5,860 | |
Automobiles (1.8%) | | | | | |
General Motors Corp. ^ | | 260,000 | | 5,070 | |
Capital Markets (2.0%) | | | | | |
Credit Suisse First Boston USA, Inc. | | 65,090 | | 5,626 | |
Chemicals (1.6%) | | | | | |
Celanese Corp. Ž | | 86,465 | | 4,691 | |
Insurance (1.7%) | | | | | |
MetLife, Inc. | | 162,380 | | 4,973 | |
Oil, Gas & Consumable Fuels (0.9%) | | | | | |
Dune Energy, Inc. -144A Ž | | 2,742 | | 2,586 | |
Pharmaceuticals (0.6%) | | | | | |
Schering-Plough | | 7,615 | | 1,848 | |
Total Convertible Preferred Stocks (cost $26,629) | | | | 30,654 | |
| | | | | | |
CONVERTIBLE BONDS (86.2%) | | | | | |
Aerospace & Defense (3.1%) | | | | | |
Alliant Techsystems, Inc. | | | | | |
2.75%, due 02/15/2024 ^ | | 6,005 | | 8,895 | |
Automobiles (3.1%) | | | | | |
Ford Motor Co. | | | | | |
4.25%, due 12/15/2036 | | 9,100 | | 9,043 | |
Biotechnology (2.4%) | | | | | |
Gilead Sciences, Inc. | | | | | |
0.63%, due 05/01/2013 | | 5,241 | | 7,036 | |
Capital Markets (13.6%) | | | | | |
BlackRock, Inc. | | | | | |
2.63%, due 02/15/2035 | | 4,080 | | 8,782 | |
Eksportfinans | | | | | |
0.25%, due 07/30/2014 § | | 8,216 | | 7,668 | |
Goldman Sachs Group, Inc. (The) | | | | | |
-144A, | | | | | |
0.25%, due 01/25/2017 § | | 7,760 | | 14,686 | |
Lehman Brothers Holdings, Inc. | | | | | |
0.25%, due 12/12/2013 | | 8,550 | | 8,025 | |
Commercial Banks (7.5%) | | | | | |
Credit Suisse/New York NY | | | | | |
0.25%, due 04/21/2014 | | 5,112 | | 5,402 | |
Deutsche Bank AG/London -144A, | | | | | |
0.25%, due 04/11/2013 § | | 3,050 | | 4,752 | |
Wachovia Bank NA -144A, | | | | | |
0.25%, due 01/30/2014 § | | 5,199 | | 11,526 | |
Commercial Services & Supplies (1.4%) | | | | | |
Covanta Holding Corp. | | | | | |
1.00%, due 02/01/2027 | | 3,700 | | 4,126 | |
| | Principal | | Value | |
Computers & Peripherals (3.8%) | | | | | |
EMC CORP, | | | | | |
1.75%, due 12/01/2013 ^ | | $ | 8,075 | | $ | 11,073 | |
Diversified Financial Services (5.6%) | | | | | |
Allegro Investment Corp. SA -144A, | | | | | |
0.25%, due 06/06/2017 | | 5,661 | | 6,417 | |
WMT Debt Exchangeable Trust -144A, | | | | | |
0.25%, due 05/02/2013 § | | 592 | | 9,830 | |
Electrical Equipment (3.8%) | | | | | |
Sunpower Corp. , | | | | | |
1.25%, due 02/15/2027 | | 4,618 | | 10,789 | |
Electronic Equipment & Instruments (3.6%) | | | | | |
Itron, Inc. | | | | | |
2.50%, due 08/01/2026 | | 6,500 | | 10,424 | |
Energy Equipment & Services (6.4%) | | | | | |
Core Laboratories, LP , | | | | | |
0.25%, due 10/31/2011 | | 4,479 | | 6,377 | |
Schlumberger, Ltd. , | | | | | |
2.13%, due 06/01/2023 | | 2,405 | | 5,937 | |
Transocean, Inc. | | | | | |
1.50%, due 12/15/2037 | | 5,635 | | 6,121 | |
Health Care Equipment & Supplies (6.8%) | | | | | |
Hologic, Inc. | | | | | |
2.00%, due 12/15/2037 | | 10,650 | | 11,515 | |
Inverness Medical Innovations, Inc. | | | | | |
3.00%, due 05/15/2016 | | 6,150 | | 8,203 | |
Hotels, Restaurants & Leisure (0.9%) | | | | | |
Scientific Games Corp. , | | | | | |
0.75 due 12/01/2024 (2) | | 2,040 | | 2,535 | |
Machinery (2.2%) | | | | | |
Trinity Industries, Inc. | | | | | |
3.88%, due 06/01/2036 | | 6,915 | | 6,198 | |
Media (2.7%) | | | | | |
Lamar Advertising Co. Class B, | | | | | |
2.88%, due 12/31/2010 | | 6,600 | | 7,664 | |
Multiline Retail (1.8%) | | | | | |
Saks, Inc. Convertible Saks, Inc. | | | | | |
2.00%, due 03/15/2024 | | 2,880 | | 5,108 | |
Oil, Gas & Consumable Fuels (1.8%) | | | | | |
Chesapeake Energy Corp. | | | | | |
2.50%, due 05/15/2037 | | 4,625 | | 5,140 | |
Pharmaceuticals (2.5%) | | | | | |
Allergan, Inc./U.S. | | | | | |
1.50%, due 04/01/2026 | | 6,120 | | 7,168 | |
Real Estate Investment Trusts (2.7%) | | | | | |
BRE Properties, Inc. , | | | | | |
4.13%, due 08/15/2026 | | 4,220 | | 3,882 | |
Vornado Realty Trust | | | | | |
3.63%, due 11/15/2026 | | 4,201 | | 3,860 | |
| | | | | | | |
The notes to the financial statements are an integral part of this report.
4
| | Principal | | Value | |
Software (4.6%) | | | | | |
Informatica Corp. | | | | | |
3.00%, due 03/15/2026 | | $ | 6,315 | | $ | 7,152 | |
Macrovision Corp. | | 6,450 | | 6,079 | |
2.63%, due 08/15/2011 | | | | | |
Specialty Retail (2.2%) | | | | | |
Penske Auto Group, Inc. | | 6,440 | | 6,360 | |
3.50%, due 04/01/2026 | | | | | |
Textiles, Apparel & Luxury Goods (1.8%) | | | | | |
Iconix Brand Group, Inc. -144A | | 5,475 | | 5,283 | |
1.88%, due 06/30/2012 | | | | | |
Wireless Telecommunication Services (1.9%) | | | | | |
NII Holdings, Inc. | | | | | |
2.75%, due 08/15/2025 | | 1,490 | | 1,816 | |
3.13%, due 06/15/2012 -144A | | 4,188 | | 3,591 | |
Total Convertible Bonds (cost $210,468) | | | | 248,463 | |
| | | | | |
Total Securities Lending Collateral (cost $10,619) (1) | | | | 10,619 | |
| | | | | |
Total Investment Securities (cost $247,716) # | | | | $ | 289,736 | |
| | | | | | | |
NOTES TO SCHEDULE OF INVESTMENTS
^ At December 31, 2007, all or a portion of this security is on loan (see Note 1). The value at December 31, 2007, of all securities on loan is $10,090.
* Floating or variable rate note. Rate is listed as of December 31, 2007.
§ Illiquid. At December 31, 2007, these securities aggregated $48,463, or 16.73%, of total investment securities of the Fund.
(1) Cash collateral for the Repurchase Agreements, valued at $3,849, that serves as collateral for securities lending, is invested in corporate bonds with interest rates and maturity dates ranging from 3.00% - 10.18% and 04/28/2008 - 12/01/2096, respectively.
(2) Step Bond. Interest rate may increase or decrease as the credit rating changes.
Ž The security has a perpetual maturity. The date shown is the next call date.
# Aggregate cost for federal income tax purposes is $247, 716. Aggregate gross unrealized appreciation for all securities in which there is an excess of value over tax cost and aggregate gross unrealized depreciation for all securities in which there is an excess of tax cost over value were $51,448 and $9,428, respectively. Net unrealized appreciation for tax purposes is $42,020.
DEFINITIONS:
144A 144A Securities are registered pursuant to Rule 144A of the Securities Act of 1933. These securities are deemed to be liquid for purposes of compliance limitations on holdings of illiquid securities and may be resold as transactions exempt from registration, normally to qualified institutional buyers. At December 31, 2007, these securities aggregated $58,671, or 20.35%, of net assets of the Fund.
The notes to the financial statements are an integral part of this report.
5
Transamerica Convertible Securities
STATEMENT OF ASSETS AND LIABILITIES
At December 31, 2007
(all amounts except per share amounts in thousands)
Assets: | | | |
Investment securities, at value (cost: $247,716) | | $ | 289,736 | |
(including securities loaned of $10,090) | | | |
Cash | | 8,478 | |
Receivables: | | | |
Shares sold | | 82 | |
Interest | | 882 | |
Income from loaned securities | | 1 | |
Dividends | | 203 | |
| | 299,382 | |
Liabilities: | | | |
Accounts payable and accrued liabilities: | | | |
Shares redeemed | | 149 | |
Management and advisory fees | | 182 | |
Distribution and service fees | | 4 | |
Administration fees | | 5 | |
Payable for collateral for securities on loan | | 10,619 | |
Other | | 48 | |
| | 11,007 | |
Net Assets | | $ | 288,375 | |
| | | |
Net Assets Consist of: | | | |
Capital Stock ($.01 par value) | | $ | 231 | |
Additional paid-in capital | | 193,156 | |
Undistributed (accumulated) net investment income | | 4,106 | |
Undistributed (accumulated) net realized gain from investment securities | | 48,862 | |
Net unrealized appreciation on investment securities | | 42,020 | |
Net Assets | | $ | 288,375 | |
Net Assets by Class: | | | |
Initial Class | | $ | 270,218 | |
Service Class | | 18,157 | |
Shares Outstanding: | | | |
Initial Class | | 21,654 | |
Service Class | | 1,462 | |
Net Asset Value and Offering Price Per Share: | | | |
Initial Class | | $ | 12.48 | |
Service Class | | 12.42 | |
STATEMENT OF OPERATIONS
For the year ended December 31, 2007
(all amounts in thousands)
Investment Income: | | | |
Dividends | | $ | 1,890 | |
Interest | | 4,718 | |
Income from loaned securities-net | | 46 | |
| | 6,654 | |
| | | |
Expenses: | | | |
Management and advisory fees | | 2,352 | |
Printing and shareholder reports | | 13 | |
Custody fees | | 37 | |
Administration fees | | 64 | |
Legal fees | | 7 | |
Audit fees | | 20 | |
Trustees fees | | 11 | |
Distribution and service fees: | | | |
Service Class | | 40 | |
Other | | 6 | |
Total expenses | | 2,550 | |
Net Investment Income | | 4,104 | |
Net Realized Gain (Loss) from: | | | |
Investment securities | | 48,868 | |
| | | |
Net Increase (Decrease) in Unrealized Appreciation | | | |
(Depreciation) on: | | | |
Investment securities | | (1,847 | ) |
| | | |
Net Realized and Unrealized Gain: | | 47,021 | |
Net Increase In Net Assets Resulting from | | | |
Operations | | $ | 51,125 | |
The notes to the financial statements are an integral part of this report.
6
Transamerica Convertible Securities
STATEMENT OF CHANGES IN NET ASSETS
For the years ended
(all amounts in thousands)
| | December 31,
2007 | | December 31,
2006 | |
Increase (Decrease) in Net Assets From: | | | | | |
Operations: | | | | | |
Net investment income | | $ | 4,104 | | $ | 5,248 | |
Net realized gain from investment securities | | 48,868 | | 27,562 | |
Change in unrealized appreciation (depreciation) on investment securities | | (1,847 | ) | 6,598 | |
| | 51,125 | | 39,408 | |
Distributions to Shareholders: | | | | | |
From net investment income: | | | | | |
Initial Class | | (4,951 | ) | (6,824 | ) |
Service Class | | (296 | ) | (182 | ) |
| | (5,247 | ) | (7,006 | ) |
From net realized gains: | | | | | |
Initial Class | | (25,852 | ) | (6,506 | ) |
Service Class | | (1,708 | ) | (193 | ) |
| | (27,560 | ) | (6,699 | ) |
Capital Share Transactions: | | | | | |
Proceeds from shares sold: | | | | | |
Initial Class | | 46,978 | | 111,673 | |
Service Class | | 5,468 | | 4,966 | |
| | 52,446 | | 116,639 | |
Dividends and distributions reinvested: | | | | | |
Initial Class | | 30,803 | | 13,330 | |
Service Class | | 2,005 | | 375 | |
| | 32,808 | | 13,705 | |
Cost of shares redeemed: | | | | | |
Initial Class | | (255,112 | ) | (34,355 | ) |
Service Class | | (4,002 | ) | (2,838 | ) |
| | (259,114 | ) | (37,193 | ) |
| | (173,860 | ) | 93,151 | |
Net increase (decrease) in net assets | | (155,542 | ) | 118,854 | |
| | | | | |
Net Assets: | | | | | |
Beginning of year | | 443,917 | | 325,063 | |
End of year | | $ | 288,375 | | $ | 443,917 | |
Undistributed (Accumulated) Net | | | | | |
Investment Income (Loss) | | $ | 4,106 | | $ | 5,249 | |
Share Activity: | | | | | |
Shares issued: | | | | | |
Initial Class | | 3,762 | | 9,412 | |
Service Class | | 437 | | 423 | |
| | 4,199 | | 9,835 | |
Shares issued-reinvested from distributions: | | | | | |
Initial Class | | 2,709 | | 1,188 | |
Service Class | | 177 | | 33 | |
| | 2,886 | | 1,221 | |
Shares redeemed: | | | | | |
Initial Class | | (20,563 | ) | (2,915 | ) |
Service Class | | (326 | ) | (241 | ) |
| | (20,889 | ) | (3,156 | ) |
Net increase (decrease) in shares outstanding: | | | | | |
Initial Class | | (14,092 | ) | 7,685 | |
Service Class | | 288 | | 215 | |
| | (13,804 | ) | 7,900 | |
The notes to the financial statements are an integral part of this report.
7
Transamerica Convertible Securities
FINANCIAL HIGHLIGHTS
For a share outstanding throughout each period(a)
| | Initial Class | |
| | Year Ended December 31, | |
| | 2007 | | 2006 | | 2005 | | 2004 | | 2003 | |
Net Asset Value | | | | | | | | | | | |
Beginning of period | | $ | 12.03 | | $ | 11.20 | | $ | 12.24 | | $ | 11.51 | | $ | 9.32 | |
Investment Operations | | | | | | | | | | | |
Net investment income (loss) | | 0.16 | | 0.15 | | 0.22 | | 0.24 | | 0.31 | |
Net realized and unrealized gain (loss) | | 1.91 | | 1.05 | | 0.19 | | 1.16 | | 1.89 | |
Total operations | | 2.07 | | 1.20 | | 0.41 | | 1.40 | | 2.20 | |
Distributions | | | | | | | | | | | |
From net investment income | | (0.26 | ) | (0.19 | ) | (0.27 | ) | (0.23 | ) | (0.01 | ) |
From net realized gains | | (1.36 | ) | (0.18 | ) | (1.18 | ) | (0.44 | ) | — | |
Total distributions | | (1.62 | ) | (0.37 | ) | (1.45 | ) | (0.67 | ) | (0.01 | ) |
Net Asset Value | | | | | | | | | | | |
End of period(b) | | $ | 12.48 | | $ | 12.03 | | $ | 11.20 | | $ | 12.24 | | $ | 11.51 | |
Total Return(c),(d) | | 18.63 | % | 10.90 | % | 3.88 | % | 13.18 | % | 23.66 | % |
Net Assets End of Period (000’s) | | $ | 270,218 | | $ | 429,852 | | $ | 314,353 | | $ | 351,386 | | $ | 380,387 | |
Ratio and Supplemental Data | | | | | | | | | | | |
Expenses to average net assets(e) | | 0.79 | % | 0.78 | % | 0.79 | % | 0.84 | % | 0.84 | % |
Net investment income (loss), to average net assets(e) | | 1.30 | % | 1.26 | % | 1.95 | % | 2.04 | % | 2.88 | % |
Portfolio turnover rate(d) | | 79 | % | 64 | % | 85 | % | 138 | % | 139 | % |
For a share outstanding throughout each period(a)
| | Service Class | |
| | Year Ended December 31, | | May 1 to Dec 31, | |
| | 2007 | | 2006 | | 2005 | | 2004 | | 2003 | |
Net Asset Value | | | | | | | | | | | |
Beginning of period | | $ | 11.98 | | $ | 11.17 | | $ | 12.24 | | $ | 11.50 | | $ | 9.86 | |
Investment Operations | | | | | | | | | | | |
Net investment income (loss) | | 0.13 | | 0.12 | | 0.19 | | 0.20 | | 0.18 | |
Net realized and unrealized gain (loss) | | 1.91 | | 1.04 | | 0.18 | | 1.18 | | 1.46 | |
Total operations | | 2.04 | | 1.16 | | 0.37 | | 1.38 | | 1.64 | |
Distributions | | | | | | | | | | | |
From net investment income | | (0.24 | ) | (0.17 | ) | (0.26 | ) | (0.20 | ) | — | |
From net realized gains | | (1.36 | ) | (0.18 | ) | (1.18 | ) | (0.44 | ) | — | |
Total distributions | | (1.60 | ) | (0.35 | ) | (1.44 | ) | (0.64 | ) | — | |
Net Asset Value | | | | | | | | | | | |
End of period(b) | | $ | 12.42 | | $ | 11.98 | | $ | 11.17 | | $ | 12.24 | | $ | 11.50 | |
Total Return(c),(d) | | 18.29 | % | 10.65 | % | 3.54 | % | 12.99 | % | 16.69 | % |
Net Assets End of Period (000’s) | | $ | 18,157 | | $ | 14,065 | | $ | 10,710 | | $ | 6,006 | | $ | 883 | |
Ratio and Supplemental Data | | | | | | | | | | | |
Expenses to average net assets(e) | | 1.04 | % | 1.03 | % | 1.04 | % | 1.10 | % | 1.09 | % |
Net investment income (loss), to average net assets(e) | | 1.02 | % | 1.01 | % | 1.65 | % | 1.72 | % | 2.41 | % |
Portfolio turnover rate(d) | | 79 | % | 64 | % | 85 | % | 138 | % | 139 | % |
(a) | | Per share information is calculated based on average number of shares outstanding. |
(b) | | Transamerica Convertible Securities (the “Fund”) share class commenced operations as follows: |
| | Initial Class - May 1, 2002 |
| | Service Class - May 1, 2003 |
(c) | | Total Return reflects all portfolio expenses and includes reinvestment of dividends and capital gains; it does not reflect the charges and deductions under the policies or annuity contracts. |
(d) | | Not annualized. |
(e) | | Annualized. |
The notes to the financial statements are an integral part of this report.
8
Transamerica Convertible Securities
NOTES TO FINANCIAL STATEMENTS
At December 31, 2007
(all amounts in thousands)
NOTE 1. ORGANIZATION AND SIGNIFICANT ACCOUNTING POLICIES
AEGON/Transamerica Series Trust (“ATST”) is an open-end management investment company registered under the Investment Company Act of 1940, as amended (the “1940 Act”). ATST serves as a funding vehicle for variable life insurance, variable annuity and group annuity products. Transamerica Convertible Securities (the “Fund”) is part of ATST.
In the normal course of business, the Fund enters into contracts that contain a variety of representations that provide general indemnifications. The Fund’s maximum exposure under these arrangements is unknown, as this would involve future claims that may be made against the Fund and/or its affiliates that have not yet occurred. However, based on experience, the Fund expects the risk of loss to be remote.
This report should be read in conjunction with the current Fund prospectus, which contains more complete information about the Fund.
In preparing the Fund’s financial statements in accordance with accounting principles generally accepted in the United States of America (“GAAP”), estimates or assumptions (which could differ from actual results) may be used that affect reported amounts and disclosures. The following is a summary of significant accounting policies followed by the Fund.
Multiple class operations, income and expenses: The Fund currently offers two classes of shares, an Initial Class and a Service Class. Income, non-class specific expenses and realized and unrealized gains and losses, are allocated daily to each class, based upon the value of shares outstanding method as permitted under Rule 1 8f-3 of the 1940 Act. Each class bears its own specific expenses as well as a portion of general, common expenses.
Security valuations: The Fund values its investments at the close of the New York Stock Exchange (“NYSE”), normally 4 p.m. ET, each day the NYSE is open for business. Fund investments are valued at the last sale price or closing price on the day of valuation taken from the primary exchange where the security is principally traded.
Securities traded in the over-the-counter market and listed securities for which no sale was reported on that date are valued at the last quoted bid price.
Debt securities are valued based on a price quotation or other equivalent indication of value supplied by an exchange, a pricing service or a major market maker; however, those that mature in sixty days or less are valued at amortized cost, which approximates market.
Investment company securities are valued at the net asset value of the underlying portfolio.
Securities for which quotations are not readily available are valued at fair market value as determined in good faith by the Fund’s Administrative Valuation Committee, using guidelines adopted by the Board of Trustees.
Cash: The Fund may leave cash overnight in its cash account with the custodian, State Street Bank & Trust Company (“State Street”). On July 2, 2007, State Street acquired the parent company of Investors Bank & Trust Company. State Street has been contracted on behalf of the Fund to invest the excess cash into a savings account, which at December 31, 2007 was paying an interest rate of 2.60%.
Repurchase agreements: The Fund is authorized to enter into repurchase agreements. The Fund, through its custodian, State Street, receives delivery of the underlying securities, the value of which at the time of purchase is required to be an amount equal to at least 100% of the resale price. The Fund will bear the risk of value fluctuations until the security can be sold and may encounter delays and incur costs in liquidating the security. In the event of bankruptcy or insolvency of the seller, delays and costs may be incurred.
Securities lending: The Fund may lend securities to qualified borrowers, with State Street acting as the Fund’s lending agent. The Fund earns negotiated lenders’ fees. The Fund receives cash and/or securities as collateral against the loaned securities. Cash collateral received is invested in short-term, interest-bearing securities. The Fund monitors the market value of securities loaned on a daily basis and requires collateral in an amount at least equal to the value of the securities loaned. Income from loaned securities earned by State Street for its services, show in the Statement of Operations is net of fees, in the amount of $20.
The Fund has invested the cash collateral received from securities loaned in the following short-term, interest-bearing securities:
Abbey National PLC, Eurodollar Term, 5.00%, 1/7/2008 | $ | 458 |
ABN AMRO Bank NV, Eurodollar Term, 5.18%, 1/4/2008 | 367 |
Bank of Nova Scotia, Eurodollar Term, 4.96%, 1/22/2008 | 321 |
Barclays, Eurodollar Term, 5.00%, 2/12/2008 | 642 |
BNP Paribas, Eurodollar Term, 5.01%, 1/11/2008 | 596 |
Calyon, Eurodollar Term, 5.12%, 3/3/2008 | 138 |
Credit Suisse First Boston Corp., Repurchase Agreement, 4.60%, 1/2/2008 | 1,192 |
Dexia Group, Eurodollar Term, 4.82%, 1/3/2008 | 458 |
HBOS Halifax Bank of Scotland, Eurodollar Term, 5.15%, 1/2/2008 | 229 |
JPMorgan Chase & Co., Eurodollar Term, 5.15%, 2/12/2008 | 229 |
Lloyds TSB Bank, Eurodollar Term, 5.15%, 1/24/2008 | 458 |
Merrill Lynch & Co. (RPG), Repurchase Agreement, 4.60%, 1/2/2008 | 688 |
Morgan Stanley & Co. (Corp. Repo), Repurchase Agreement, 4.60%, 1/2/2008 | 1,879 |
Rabobank Nederland, Eurodollar Term, 5.08%, 1/10/2008 | 550 |
Reserve Primary Money Market Fund, 4.95% | 489 |
Royal Bank of Scotland, Eurodollar Term, 5.00%, 2/25/2008 | 550 |
Societe Generale, Eurodollar Term, 5.15%, 3/3/2008 | 275 |
Toronto Dominion Bank, Eurodollar Term, 5.05%, 1/10/2008 | 550 |
UBS AG, Eurodollar Term, 4.92%, 1/11/2008 | 321 |
Wells Fargo, Bank Note, 4.75%, 1/8/2008 | 229 |
| $ | 10,619 |
9
NOTES TO FINANCIAL STATEMENTS (continued)
At December 31, 2007
(all amounts in thousands)
NOTE 1.– (continued)
Security transactions and investment income: Security transactions are recorded on the trade date. Security gains and losses are calculated on the first-in, first-out basis. Dividend income, if any, is recorded on the ex-dividend date or, in the case of foreign securities, as soon as the Fund is informed of the ex-dividend date. Interest income, including accretion of discounts and amortization of premiums, is recorded on the accrual basis commencing on the settlement date.
Dividend distributions: Dividends and capital gains distributions are typically declared and reinvested annually and are generally paid and reinvested on the business day following the ex-date.
NOTE 2. RELATED PARTY TRANSACTIONS
ATST serves as a funding vehicle for certain affiliated asset allocation portfolios and certain affiliated separate accounts of Western Reserve Life Assurance Co. of Ohio, Transamerica Life Insurance Company, Transamerica Financial Life Insurance Company, Inc., Monumental Life Insurance Company and Transamerica Occidental Life Insurance Company.
Transamerica Fund Advisors, Inc. (“TFAI”) is the Fund’s investment adviser. Transamerica Fund Services, Inc. (“TFS”) is the Fund’s administrator and transfer agent. Prior to May 1, 2007, AFSG Securities Corp. (“AFSG”), was the Fund’s distributor. Transamerica Capital Inc. (“TCI”) is now the Fund’s distributor. TFAI, TFS, AFSG and TCI are affiliates of AEGON NV, a Netherlands corporation.
Transamerica Investment Management, LLC (“TIM”) is an affiliate of the Fund and a sub-adviser to the Fund.
Certain officers and trustees of the Fund are also officers and/or directors of TFAI, TFS, AFSG, and TCI.
The following schedule reflects the percentage of Fund assets owned by affiliated investment companies at December 31, 2007:
| | Net
Assets | | % of Net
Assets | |
Asset Allocation-Conservative Portfolio | | $ | 31,901 | | 11.06 | % |
Asset Allocation-Moderate Growth Portfolio | | 74,163 | | 25.72 | |
Asset Allocation-Moderate Portfolio | | 78,421 | | 27.19 | |
Total | | $ | 184,485 | | 63.97 | % |
Investment advisory fee: The Fund pays management fees to TFAI based on average daily net assets (“ANA”) at the following breakpoints:
0.75% of the first $250 million of ANA
0.70% of ANA over $250 million
TFAI has contractually agreed to waive its advisory fee and will reimburse the Fund to the extent that operating expenses, excluding 12b-1 fees, exceed the following stated annual limit:
1.25% Expense Limit
If total Fund expenses fall below the annual expense limitation agreement agreed to by the adviser within the succeeding three years, the Fund may be required to pay the adviser a portion or all of the waived advisory fees.
There were no amounts recaptured during the year ended December 31, 2007. There are no amounts available for recapture at December 31, 2007.
Distribution and service fees: ATST entered into a Distribution Agreement with AFSG dated January 1, 1997, as amended. On May 1, 2007, the Distribution Agreement was amended to replace AFSG with TCI as the Fund’s distributor. The Fund has also adopted a distribution plan (“Distribution Plan”) pursuant to Rule 12b-1 under the 1940 Act.
Under the Distribution Plan for the Initial Class shares, TCI, on behalf of the Fund, is authorized to pay various service providers, as direct payment for expenses incurred in connection with distribution of the Fund’s shares, amounts equal to actual expenses associated with distributing the shares.
The Distribution Plan for the Service Class shares requires ATST to pay distribution fees to TCI as compensation for its activities, not as reimbursement for specific expenses. The fee on the Service Class is paid to the insurance companies for providing services and account maintenance for their policyholders who invest in the variable insurance products which invest in the Service Class shares.
The Fund is authorized under the Distribution Plan to pay fees on each class up to the following limits:
Initial Class | 0.15% |
Service Class | 0.25% |
TCI has determined that it will not seek payment by the Fund of the distribution expenses incurred with respect to the Initial Class shares before April 30, 2009. Prior to TCI seeking reimbursement of future expenses, policy and contract owners will be notified in advance. The Fund will pay fees relating to Service Class shares.
Administrative services: The Fund has entered into an agreement with TFS for financial and legal fund administration services. The Fund pays TFS an annual fee of 0.02% of ANA. The Legal fees on the Statement of Operations are for fees paid to external legal counsel.
10
NOTES TO FINANCIAL STATEMENTS (continued)
At December 31, 2007
(all amounts in thousands)
NOTE 2.– (continued)
Deferred compensation plan: Each eligible independent Fund Trustee may elect participation in a non-qualified deferred compensation plan (“the Plan”). Under the Plan, such Trustees may defer payment of all or a portion of their total fees earned as a Fund Trustee. Each Trustee who is a participant in the Plan may elect that the earnings, losses or gains credited to his or her deferred fee amounts be determined based on a deemed investment in any series of Transamerica IDEX Mutual Funds. The right of a participant to receive a distribution from the Plan of the deferred fees is an unsecured claim against the general assets of all series of Transamerica IDEX Mutual Funds. The pro rata liability to the Fund of all deferred fees in the Plan amounted, as of December 31, 2007, to $14. Amounts deferred under the Deferred Compensation Plan are unfunded against the general assets of ATST.
Retirement plan: Under a retirement plan (the “Emeritus Plan”) available to the Independent Trustees, each Independent Trustee is deemed to have elected to serve as Trustee Emeritus of ATST upon his or her termination of service, other than removal for cause, is entitled to 50% of the trustee’s current retainer for a maximum period of five years determined by his or her years of service as a Trustee. Such amounts shall be accrued by ATST on a pro rata basis allocable to each series of ATST based on the relative assets of the series. If retainers increase in the future, past accruals (and credits) will be adjusted upward so that 50% of the Trustee’s current retainer is accrued and credited at all times. Upon death, disability or termination of service, other than removal for cause, amounts deferred become payable to a Trustee Emeritus (or his/her beneficiary). Upon the commencement of service as Trustee Emeritus, compensation will be paid on a quarterly basis during the time period that the Trustee Emeritus is allowed to serve as such.
Amounts accrued under the Emeritus Plan are unsecured claims against the general assets of ATST. For the year ended December 31, 2007, the amount related to the Emeritus Plan was $17. As of December 31, 2007, the Fund has not made any payments related to the Emeritus Plan.
The Emeritus Plan was terminated effective October 30, 2007. Upon the termination, the Fund shall continue to pay any remaining benefits in accordance with the Plan, but no further compensation shall accrue under the Plan.
NOTE 3. INVESTMENT TRANSACTIONS
The cost of securities purchased and proceeds from securities sold (excluding short-term securities) for the year ended December 31, 2007 were as follows:
Purchases of securities: | | | |
Long-term | | $ | 243,817 | |
U.S. Government | | — | |
Proceeds from maturities and sales of securities: | | | |
Long-term | | 445,843 | |
U.S. Government | | — | |
| | | | |
NOTE 4. FEDERAL INCOME TAX MATTERS
The Fund has not made any provision for federal income or excise taxes due to its policy to distribute all of its taxable income and capital gains to its shareholders and otherwise qualify as a regulated investment company under Subchapter M of the Internal Revenue Code. Income and capital gain distributions are determined in accordance with income tax regulations, which may differ from GAAP. These differences are primarily due to differing treatment for items including, but not limited to, wash sales, and post October loss deferrals..
The tax character of distributions paid may differ from the character of distributions shown in the Statements of Changes in Net Assets due to short-term gains being treated as ordinary income for tax purposes. The tax character of distributions paid during 2006 and 2007 was as follows:
2006 Distributions paid from: | | | |
Ordinary Income | | $ | 9,401 | |
Long-term Capital Gain | | 4,304 | |
2007 Distributions paid from: | | | |
Ordinary Income | | 8,489 | |
Long-term Capital Gain | | 24,318 | |
| | | | |
The tax basis components of distributable earnings as of December 31, 2007 are as follows:
Undistributed Ordinary Income | | $ | 13,695 | |
Undistributed Long-term Capital Gain | | $ | 39,870 | |
Capital Loss Carryforward | | $ | — | |
Post October Capital Loss Deferral | | $ | (597 | ) |
Post October Currency Loss Deferral | | $ | — | |
Net Unrealized Appreciation (Depreciation) | | $ | 42,020 | |
11
NOTES TO FINANCIAL STATEMENTS (continued)
At December 31, 2007
(all amounts in thousands)
NOTE 5. REGULATORY PROCEEDINGS
There continues to be significant federal and state regulatory activity relating to financial services companies, particularly mutual fund companies and their investment advisers. As part of an ongoing investigation regarding potential market timing, recordkeeping and trading compliance issues and matters affecting the Fund’s investment adviser, TFAI, and certain affiliates and former employees of TFAI, the SEC staff has indicated that it is likely to take some action against TFAI and certain of its affiliates at the conclusion of the investigation. The potential timing and the scope of any such action is difficult to predict. Although the impact of any action brought against TFAI and/or its affiliates is difficult to assess at the present time, the Fund currently believes that the likelihood that any such action will have a material adverse impact is remote. It is important to note that the Fund is not aware of any allegation of wrongdoing against it and its Board at the time this annual report is printed. Although it is not anticipated that these developments will have an adverse impact on the Fund, there can be no assurance at this time. TFAI and its affiliates are actively working with the SEC in regard to this matter; however, the exact resolution cannot be determined at this time. TFAI will take such actions that it deems necessary or appropriate to continue providing management services to the Fund and to bring all matters to an appropriate conclusion.
TFAI and/or its affiliates, and not the Fund, will bear the costs regarding these regulatory matters.
NOTE 6. RECENTLY ISSUED ACCOUNTING PRONOUNCEMENTS
In July 2006, the Financial Accounting Standards Board (“FASB”) released FASB Interpretation No. 48 “Accounting for Uncertainty in Income Taxes” (“FIN 48”), an interpretation of FASB Statement No. 109. FIN 48 provides guidance for how uncertain tax positions should be recognized, measured, presented and disclosed in the financial statements. FIN 48 requires the accounting and disclosure of tax positions taken or expected to be taken in the course of preparing the Fund’s tax returns to determine whether the tax positions are “more-likely- than-not” of being sustained by the applicable tax authority. Tax positions not deemed to meet the more-likely-than-not threshold would be recorded as a tax benefit or expense in the current year.
Adoption of FIN 48 is effective during the first required financial reporting period for fiscal years beginning after December 15, 2006. Management adopted FIN 48 on June 29, 2007.
Implementation of FIN 48 requires Management of the Fund to analyze all open tax years, as defined by the Statute of Limitations, for all major jurisdictions, which includes federal and certain states. Open tax years are those that are open for exam by taxing authorities (i.e., the last 4 tax year ends and the interim tax period since then). The Fund has no examinations in progress and none are expected at this time.
Management of the Fund has reviewed all open tax years and major jurisdictions and concluded the adoption of FIN 48 resulted in no impact to the Fund’s net assets or results of operations. There is no tax liability resulting from unrecognized tax benefits relating to uncertain income tax positions taken or expected to be taken in future tax returns. The Fund is also not aware of any tax positions for which it is reasonably possible that the total amounts of unrecognized tax benefits will significantly change in the next 12 months.
In September 2006, FASB issued its new Standard No. 157, “Fair Value Measurements” (“FAS 157”). FAS 157 is designed to unify guidance for the measurement of fair value of all types of assets, including financial instruments, and certain liabilities, throughout a number of accounting standards. FAS 157 also establishes a hierarchy for measuring fair value in generally accepted accounting principles and expands financial statement disclosures about fair value measurements that are relevant to mutual funds. FAS 157 is effective for financial statements issued for fiscal years beginning after November 15, 2007, and earlier application is permitted.
As of December 31, 2007, Management does not expect the adoption of FAS 157 to impact the amounts reported in the financial statements, however, additional disclosures will be required about the inputs used to develop the measurements of fair value and the effect of certain of the measurements reported in the statement of operations for a fiscal period.
NOTE 7. SUBSEQUENT EVENT
Effective January 1, 2008, TFAI changed its name to Transamerica Asset Management, Inc.
Effective May 1, 2008, AEGON/Transamerica Series Trust will change its name to Transamerica Series Trust. At that time, the Fund will also change its name to Transamerica Convertible Securities VP.
12
Report of Independent Registered Certified Public Accounting Firm
To the Board of Trustees and Shareholders of Transamerica Convertible Securities:
In our opinion, the accompanying statement of assets and liabilities, including the schedule of investments, and the related statements of operations and of changes in net assets and the financial highlights present fairly, in all material respects, the financial position of Transamerica Convertible Securities (the “Fund”) (one of the portfolios constituting AEGON/Transamerica Series Trust) at December 31, 2007, the results of its operations for the year then ended, the changes in its net assets for each of the two years in the period then ended and the financial highlights for each of the periods presented, in conformity with accounting principles generally accepted in the United States of America. These financial statements and financial highlights (hereafter referred to as “financial statements”) are the responsibility of the Fund’s management; our responsibility is to express an opinion on these financial statements based on our audits. We conducted our audits of these financial statements in accordance with the standards of the Public Company Accounting Oversight Board (United States). Those standards require that we plan and perform the audit to obtain reasonable assurance about whether the financial statements are free of material misstatement. An audit includes examining, on a test basis, evidence supporting the amounts and disclosures in the financial statements, assessing the accounting principles used and significant estimates made by management, and evaluating the overall financial statement presentation. We believe that our audits, which included confirmation of securities at December 31, 2007 by correspondence with the custodian and brokers, provide a reasonable basis for our opinion.

Tampa, Florida
February 29, 2008
13
Transamerica Convertible Securities
SUPPLEMENTAL TAX INFORMATION (unaudited)
(all amounts in thousands)
For tax purposes, the Fund has made a Long-Term Capital Gain Designation of $24,318 for the year ended December 31, 2007.
RESULTS OF SHAREHOLDER PROXY (unaudited)
At a special meeting of shareholders held on October 30, 2007, the results of the Proposals were as follows:
Proposal 1: To elect a new Board:
Proposed Trustee | | For | | Against | | Abstentions/Broker Non-
Votes |
John K. Carter | | 2,274,998,840.817 | | 57,804,698.755 | | 35,433.883 |
| | | | | | |
Leo J. Hill | | 2,277,212,702.754 | | 55,590,836.819 | | 35,433.883 |
| | | | | | |
Neal M. Jewell | | 2,266,793,295.663 | | 66,010,243.909 | | 35,433.883 |
| | | | | | |
Russell A. Kimball, Jr. | | 2,274,825,235.835 | | 57,978,303.737 | | 35,433.883 |
| | | | | | |
Eugene M. Mannella | | 2,274,623,165.033 | | 58,180,374.539 | | 35,433.883 |
| | | | | | |
Norm R. Nielsen | | 2,275,050,055.885 | | 57,753,483.687 | | 35,433.883 |
| | | | | | |
Joyce Galpern Norden | | 2,270,278,122.250 | | 62,525,417.323 | | 35,433.883 |
| | | | | | |
Patricia L. Sawyer | | 2,275,737,737.456 | | 57,065,802.116 | | 35,433.883 |
| | | | | | |
John W. Waechter | | 2,276,615,120.140 | | 56,188,419.433 | | 35,433.883 |
Proposal 2: To approve an amendment to the Agreement and Declaration of Trust:
| | | | Abstentions/Broker Non- |
For | | Against | | Votes |
2,182,022,669.110 | | 77,590,048.544 | | 73,226,255.801 |
14
Transamerica Convertible Securities
INVESTMENT ADVISORY AND SUB-ADVISORY AGREEMENTS-REVIEW AND RENEWAL (unaudited)
At a meeting of the Board of Trustees of AEGON/Transamerica Series Trust (“ATST”) held on December 4th, 2007, the Board reviewed and considered the renewal of the investment advisory agreement (the “Investment Advisory Agreement”) between Transamerica Convertible Securities (the “Fund”) and Transamerica Fund Advisors, Inc. (“TFAI”), as well as the renewal of the investment sub-advisory agreement (the “Sub-Advisory Agreement”) of the Fund between TFAI and Transamerica Investment Management, LLC (the “Sub-Adviser”), to determine whether the agreements should be renewed for a six-month period. It was noted that this review was interim in nature to align all the Funds on the same calendar, and that the Funds’ advisory arrangements would be reviewed again in the first half of 2008.
Following their review and consideration, the Trustees determined that the renewal of the Investment Advisory Agreement and the Sub-Advisory Agreement would enable shareholders of the Fund to obtain high quality services at a cost that is appropriate, fair, and in the best interests of its shareholders. The Board, including the independent members of the Board, unanimously approved the renewal of the Investment Advisory Agreement and Sub-Advisory Agreement. In reaching their decision, the Trustees requested and obtained from TFAI and the Sub-Adviser such information as they deemed reasonably necessary to evaluate the agreements, including information about fees and performance of comparable funds managed by the Sub-Adviser. The Trustees also carefully considered information they had previously received from TFAI and the Sub-Adviser throughout the year as part of their regular oversight of the Fund, as well as comparative fee, expense, and performance information prepared by Lipper Inc. (“Lipper”), an independent provider of mutual fund performance, fee and expense information and profitability data prepared by management. In considering the proposed continuation of the Investment Advisory and Sub-Advisory Agreements, the Trustees evaluated a number of considerations that they believed, in light of the legal advice furnished to them by independent legal counsel and their own business judgment, to be relevant. They based their decisions on a variety of factors, including the following considerations, among others, although they did not identify any consideration or particular information that was controlling of their decisions:
The nature, extent and quality of the advisory services to be provided. The Board considered the nature and quality of the services provided by TFAI and the Sub-Adviser to the Fund in the past, as well as the services anticipated to be provided in the future. The Board concluded that TFAI and the Sub-Adviser are capable of providing high quality services to the Fund, as indicated by the nature and quality of services provided in the past by TFAI and the Sub-Adviser for this series and the experience, capability and integrity of TFAI’s senior management, the financial resources of TFAI and the Sub-Adviser, TFAI’s management oversight process and the professional qualifications of the portfolio management team of the Sub-Adviser. The Trustees determined that TFAI and the Sub-Adviser can provide investment and related services that are appropriate in scope and extent in light of the Fund’s operations, the competitive landscape of the investment company business and investor needs.
The investment performance of the Fund. The Board examined the short and longer-term performance of the Fund, including relative performance against a peer universe of comparable mutual funds as prepared by Lipper for various trailing periods ended June 30, 2007. The Board noted that the Fund’s performance was above the median for its peer universe over the past 5-year period, was near the median for its peer universe over the past 3-year period, and was below the median for its peer universe over the past 1-year period. The Board also noted that the Lipper peer universe may not reflect all the characteristics of funds that it believes are the peers of the Fund. As a result, the Board used other rankings as part of its assessment of the Fund’s performance. On the basis of the Board’s assessment of the nature, extent and quality of advisory services to be provided or procured by TFAI and the Sub-Adviser, the Board concluded that TFAI and the Sub-Adviser are capable of providing a level of investment performance that is appropriate in light of the Fund’s proposed investment objectives, policies and strategies and competitive with other similarly situated investment companies, but that the Board would be monitoring performance closely.
The cost of advisory services provided and the level of profitability. The Board reviewed profitability information of TFAI’s cost of procuring fund management services, as well as the costs of its provision of administration, fund accounting and other services, to the Fund and to ATST as a whole by TFAI and its affiliates. The Board reviewed the management and sub-advisory fees for the Fund, and noted that the contractual management fees were generally in line with the Fund’s peer group and universe. Based on their review, the Trustees determined that the management fees of the Fund generally are appropriate in light of the services expected to be provided or procured, the management fees and the anticipated profitability of the relationship between the Fund, TFAI and its affiliates, and the Sub-Adviser. In making these observations and determinations, the Board reviewed, among other things, comparative information provided by Lipper.
Whether fee levels reflect economies of scale and the extent to which economies of scale would be realized as the Fund grows. In evaluating the extent to which the management fees payable under the Investment Advisory and Sub-Advisory Agreements reflect economies of scale or will permit economies of scale to be realized in the future, the Board noted that TFAI offers breakpoints which appropriately benefit investors by passing on economies of scale in the form of lower management fees as the level of assets grows. The Trustees also concluded that they will have the opportunity to periodically reexamine whether the Fund has achieved economies of scale, and the appropriateness of management fees payable to TFAI and fees paid to the Sub-Adviser, in the future.
Benefits (such as soft dollars) to TFAI, its affiliates, or the Sub-Adviser from their relationship with the Fund. The Board concluded that other benefits anticipated to be derived by TFAI, its affiliates, and the Sub-Adviser from their relationships with the Fund are expected to be reasonable and fair, and consistent with industry practice and the best interests of the Fund and its shareholders. The Trustees noted that TFAI would not realize soft dollar benefits from its relationship with the Fund, and that the Sub-
Adviser’s soft dollar trading is consistent with applicable law, including best execution requirements in particular.
15
Other considerations. The Board determined that TFAI has made a substantial commitment to the recruitment and retention of high quality personnel, and maintains the financial, compliance and operational resources reasonably necessary to manage the Fund in a professional manner that is consistent with the best interests of the Fund and its shareholders. In this regard, the Trustees favorably considered the procedures and policies in place by TFAI to enforce compliance with applicable laws and regulations and oversee the portfolio management activities of the Sub-Adviser. The Trustees also determined that TFAI has made a significant entrepreneurial commitment to the management and success of the Fund, reflected by TFAI’s expense limitation and fee waiver arrangements with the Fund which may result in TFAI waiving a substantial amount of management fees for the benefit of shareholders.
16
Transamerica Equity
MARKET ENVIRONMENT
U.S. equities faced significant challenges in the twelve months ended December 31, 2007, particularly in the second half of the year. After advancing early in the period, the Standard and Poor’s 500 Composite Stock Index gave back some gains, to end the year with a relatively modest total return of 5.49%.
Throughout the period, the market struggled against the implications of a weak U.S. housing market. Changing home values greatly influence consumer spending, creating a ripple effect in the economy. However, because consumer spending, unemployment levels and corporate earnings remained steady, stock prices advanced through mid-May. Thereafter, rising defaults for low-quality (sub-prime) mortgages triggered a crisis in the debt markets, making it harder for individuals and corporations to borrow capital. Market volatility increased dramatically as investors worried how this credit crisis, combined with the housing downturn, would affect companies that require large amounts of short-term financing or depend on robust consumer spending. As the period wore on, persistent concerns about inflation and significant signs of a flagging economy added to the market’s worries.
Capital infusions from the world’s central banks and the sovereign funds of foreign nations, plus a total of 1.0% in interest-rate cuts by the Federal Reserve Board were largely ineffective in resolving the issues. Quarterly earnings growth stalled, and it became increasingly apparent that the housingand-credit malaise will undermine the economy in 2008.
Against this backdrop, growth indexes outperformed value measures, and large-cap stocks showed more resilience than small- or mid-cap equities.
PERFORMANCE
For the year ended December 31, 2007, Transamerica Equity, Initial Class returned 16.29%. By comparison its benchmark, the Russell 1000 Growth Index, returned 11.81%.
STRATEGY REVIEW
We attribute the portfolio’s out-performance to our focus on two secular growth trends that were uneffected by the domestic economy’s troubles: demand for new personal technology; and rapid worldwide industrialization. The portfolio’s chief contributors to performance included Apple Inc. (“Apple”), Research in Motion Limited (“RIMM”), Google Inc. (“Google”) and Jacobs Engineering Group Inc. (“Jacobs”)
Apple’s success rests on its user-friendly personal electronics (e.g., iPods and iPhones) and a “halo” effect from these that has invigorated sales of its personal computers and laptops. RIMM, the maker of the BlackBerry personal communication devices, is expanding its product line for business customers and “smart phones” for consumers. Internet search engine Google, already dominant in the online advertising business, is extending its services (e.g., through contracts with major wireless phone companies). Jacobs, which designs and constructs major infrastructure projects and manufacturing facilities worldwide, won new contracts during the period.
Partially countering these gains were setbacks for McGraw-Hill Companies Inc. (“McGraw-Hill”), the parent company of debt-rating agency Standard & Poor’s Corp. (“Standard & Poor’s”); and for several consumer companies (e.g., Marriott International, Inc. (“Marriott”), Starbucks Corporation (“Starbucks”) and Nordstrom, Inc. (“Nordstrom”)). Earnings at these companies remained healthy, but their stock prices fell on fears that the credit-and-housing crisis would negatively affect bond market activity (a factor for Standard & Poor’s) and consumer spending (a potential issue for the others). We believe McGraw-Hill will recover as the credit crisis is resolved and believe consumers will continue to support high-end retailer Nordstrom. We exited Starbucks, which is involved in a costly, margin-squeezing overseas expansion; and hotelier Marriott, where the secular growth cycle has peaked.
Gary U. Rollé, CFA
Portfolio Manager
Transamerica Investment Management, LLC
AGEON/Transamerica Series Trust | Annual Report 2007 |
1
Transamerica Equity
(unaudited)

Average Annual Total Return for Periods Ended 12/31/2007
| | | | | | | | From | | Inception | |
| | 1 Year | | 5 Years | | 10 Years | | Inception | | Date | |
Initial Class | | 16.29 | % | 17.49 | % | 9.84 | % | 15.93 | % | 12/31/80 | |
Russell 1000 Growth (1) | | 11.81 | % | 12.10 | % | 3.83 | % | 10.55 | % | 12/31/80 | |
| | | | | | | | | | | |
Service Class | | 16.04 | % | — | % | — | % | 16.88 | % | 5/1/03 | |
NOTES
(1) The Russell 1000 Growth (Russell 1000 Growth) Index is an unmanaged index used as a general measure of market performance. Calculations assume dividends and capital gains are reinvested and do not include any managerial expenses. From inception calculation is based on life of Initial Class shares.
The performance data presented represents past performance, future results may vary. The portfolio’s investment return and net asset value will fluctuate. Past performance does not guarantee future results. Investor’s units when redeemed, may be worth more or less than their original cost.
Current performance may be lower or higher than performance quoted. Please visit your insurance company’s website for contract or policy level standardized total returns current to the most recent month end. Portfolio performance is net of investment fees and fund expenses, but not product charges, which, if included, would significantly lower the performance quoted.
This material must be preceded or accompanied by a current prospectus, which includes specific contents regarding the investment objectives, explanation of share classes and policies of this portfolio.
The historical financial information for periods prior to May 1, 2002, has been derived from the financial history of the predecessor portfolio, Growth Portfolio of Transamerica Variable Insurance Fund, Inc.
2
Transamerica Equity
UNDERSTANDING YOUR FUND’S EXPENSES
(unaudited)
SHAREHOLDER EXPENSES
Fund shareholders may incur ongoing costs, including management and advisory fees, distribution and service fees, and other fund expenses.
The following Example is intended to help you understand your ongoing costs (in dollars and cents) of investing in the Fund and to compare these costs with the ongoing costs of investing in other funds.
The Example is based on an investment of $1,000 invested at July 1, 2007 and held for the entire period until December 31, 2007.
ACTUAL EXPENSES
The first line in the table below provides information about actual account values and actual expenses. You may use the information in this line, together with the amount you invested, to estimate the expenses that you paid over the period. Simply divide your account value by $1,000 (for example, an $8,600 account value divided by $1,000 = 8.6), then multiply the result by the number in the first line of your Fund under the heading entitled “Expenses Paid During Period” to estimate the expenses you paid on your account during this period.
HYPOTHETICAL EXAMPLE FOR COMPARISON PURPOSES
The second line in the table below provides information about hypothetical account values and hypothetical expenses based on the Fund’s actual expense ratio and an assumed rate of return of 5% per year before expenses, which is not the Fund’s actual return. The hypothetical account values and expenses may not be used to estimate the actual ending account balance or expenses you paid for the period. You may use this information to compare the ongoing costs of investing in your Fund and other funds. To do so, compare this 5% hypothetical example with the 5% hypothetical examples that appear in the shareholder reports of the other funds.
Please note that the expenses shown in the table are meant to highlight your ongoing costs only and do not reflect any transactional costs, such as sales charges, redemption fees, brokerage commissions paid on purchases and sales of fund shares. Therefore, the second line under the Fund in the table is useful in comparing ongoing costs only, and will not help you determine the relative total costs of owning different funds. If any of these transaction costs were included, your costs would be higher. The expenses shown in the table do not reflect any fees that may be charged to you by brokers, financial intermediaries, or other financial institutions.
| | Beginning
Account
Value | | Ending
Account
Value | | Annualized
Expense
Ratio | | Expenses
Paid During
Period (a) | |
| | | | | | | | | |
Initial Class | | | | | | | | | |
Actual | | $ | 1,000.00 | | $ | 1,091.73 | | 0.74 | % | $ | 3.90 | |
Hypothetical (b) | | 1,000.00 | | 1,021.48 | | 0.74 | | 3.77 | |
| | | | | | | | | |
Service Class | | | | | | | | | |
Actual | | 1,000.00 | | 1,090.51 | | 0.99 | | 5.22 | |
Hypothetical (b) | | 1,000.00 | | 1,020.21 | | 0.99 | | 5.04 | |
| | | | | | | | | | | | |
(a) Expenses are calculated using the Fund’s annualized expense ratio (as disclosed in the table), multiplied by the average account value for the period, multiplied by the number of days in the period (184 days), and divided by the number of days in the year (365 days).
(b) 5% return per year before expenses.
GRAPHICAL PRESENTATION OF SCHEDULE OF INVESTMENTS
By Sector
At December 31, 2007

This chart shows the percentage breakdown by sector of the Fund’s total investment securities.
3
Transamerica Equity
SCHEDULE OF INVESTMENTS
At December 31, 2007
(all amounts except share amounts in thousands)
| | Shares | | Value | |
COMMON STOCKS (98.9%) | | | | | |
Aerospace & Defense (4.5%) | | | | | |
Boeing Co. | | 733,000 | | $ | 64,108 | |
Raytheon Co. | | 1,200,000 | | 72,840 | |
Air Freight & Logistics (2.7%) | | | | | |
Expeditors International Washington, | | 1,798,210 | | 80,344 | |
Inc. | | | | | |
Auto Components (3.0%) | | | | | |
Johnson Controls, Inc. | | 2,542,300 | | 91,624 | |
Automobiles (2.9%) | | | | | |
Daimler AG ^ | | 900,000 | | 86,067 | |
Biotechnology (2.9%) | | | | | |
Gilead Sciences, Inc. ‡ | | 1,910,000 | | 87,879 | |
Capital Markets (6.0%) | | | | | |
Ameriprise Financial, Inc. | | 1,500,000 | | 82,665 | |
State Street Corp. ^ | | 1,195,000 | | 97,034 | |
Chemicals (5.7%) | | | | | |
Ecolab, Inc. | | 600,000 | | 30,726 | |
Praxair, Inc. | | 1,220,000 | | 108,226 | |
Sigma-Aldrich Corp. | | 570,000 | | 31,122 | |
Communications Equipment (6.0%) | | | | | |
Qualcomm, Inc. | | 1,525,000 | | 60,009 | |
Research In Motion, Ltd. ‡ | | 1,050,000 | | 119,070 | |
Computers & Peripherals (7.9%) | | | | | |
Apple, Inc. ‡ | | 1,200,000 | | 237,696 | |
Construction & Engineering (6.3%) | | | | | |
Jacobs Engineering Group, Inc. ‡ | | 1,980,000 | | 189,308 | |
Consumer Finance (2.9%) | | | | | |
American Express Co. | | 1,700,000 | | 88,434 | |
Diversified Financial Services (5.8%) | | | | | |
CME Group, Inc. Class A | | 255,000 | | 174,930 | |
Diversified Telecommunication Services (2.3%) | | | | | |
AT&T, Inc. | | 1,650,000 | | $ | 68,574 | |
Electronic Equipment & Instruments (3.0%) | | | | | |
Tyco Electronics, Ltd. | | 2,460,000 | | 91,340 | |
Energy Equipment & Services (2.5%) | | | | | |
Schlumberger, Ltd. | | 780,000 | | 76,729 | |
Health Care Equipment & Supplies (2.2%) | | | | | |
Varian Medical Systems, Inc. ‡ | | 1,250,000 | | 65,200 | |
Hotels, Restaurants & Leisure (2.3%) | | | | | |
MGM Mirage, Inc. ‡ | | 840,000 | | 70,577 | |
Industrial Conglomerates (3.1%) | | | | | |
General Electric Co. | | 2,500,000 | | 92,675 | |
Insurance (2.5%) | | | | | |
American International Group, Inc. | | 1,285,000 | | 74,915 | |
Internet Software & Services (4.6%) | | | | | |
Google, Inc. Class A ‡ | | 202,000 | | 139,679 | |
Machinery (5.6%) | | | | | |
Caterpillar, Inc. ^ | | 1,126,000 | | 81,703 | |
PACCAR, Inc. | | 1,600,000 | | 87,168 | |
Media (3.4%) | | | | | |
McGraw-Hill Cos., Inc. (The) | | 2,325,000 | | 101,858 | |
Multiline Retail (2.0%) | | | | | |
Nordstrom, Inc. | | 1,600,000 | | 58,768 | |
Pharmaceuticals (3.2%) | | | | | |
Allergan, Inc. | | 1,480,000 | | 95,075 | |
Software (5.6%) | | | | | |
Electronic Arts, Inc. ‡ | | 1,665,000 | | 97,253 | |
Microsoft Corp. | | 2,030,000 | | 72,268 | |
Total Common Stocks (cost $2,248,125) | | | | 2,975,864 | |
| | | | | |
Total Securities Lending Collateral (cost $72,374) (2) | | | | 72,374 | |
| | | | | |
Total Investment Securities (cost $2,320,499) # | | | | $ | 3,048,238 | |
NOTES TO SCHEDULE OF INVESTMENTS:
^ At December 31, 2007, all or a portion of this security is on loan (see Note 1). The value at December 31, 2007, of all securities on loan is $70,184.
‡ Non-Income Producing.
(2) Cash collateral for the Repurchase Agreements, valued at $26,235, that serves as collateral for securities lending, is invested in corporate bonds with interest rates and maturity dates ranging from 3.00% - 10.18% and 04/28/2008 - 12/01/2096, respectively.
# Aggregate cost for federal income tax purposes is $2,321,344. Aggregate gross unrealized appreciation for all securities in which there is an excess of value over tax cost and aggregate gross unrealized depreciation for all securities in which there is an excess of tax cost over value were $823,262 and $96,368 respectively. Net unrealized appreciation for tax purposes is $726,894.
The notes to the financial statements are an integral part of this report.
4
Transamerica Equity
STATEMENT OF ASSETS AND LIABILITIES
At December 31, 2007
(all amounts except per share amounts in thousands)
Assets: | | | |
Investment securities, at value (cost: $2,320,499) | | $ | 3,048,238 | |
(including securities loaned of $70,184) | | | |
Cash | | 31,728 | |
Receivables: | | | |
Shares sold | | 208 | |
Interest | | 89 | |
Income from loaned securities | | 12 | |
Dividends | | 3,780 | |
Dividend reclaims | | 20 | |
| | 3,084,075 | |
Liabilities: | | | |
Accounts payable and accrued liabilities: | | | |
Shares redeemed | | 1,360 | |
Management and advisory fees | | 1,795 | |
Distribution and service fees | | 15 | |
Administration fees | | 51 | |
Payable for collateral for securities on loan | | 72,374 | |
Other | | 559 | |
| | 76,154 | |
Net Assets | | $ | 3,007,921 | |
| | | |
Net Assets Consist of: | | | |
Capital Stock ($.01 par value) | | $ | 1,041 | |
Additional paid-in capital | | 2,460,839 | |
Undistributed (accumulated) net investment | | | |
income | | 5,245 | |
Undistributed (accumulated) net realized loss from | | | |
investment securities and foreign currency | | | |
transactions | | (186,945 | ) |
Net unrealized appreciation on investment | | | |
securities | | 727,739 | |
Translation of assets and liabilities denominated | | | |
in foreign currencies | | 2 | |
Net Assets | | $ | 3,007,921 | |
Net Assets by Class: | | | |
Initial Class | | $ | 2,938,220 | |
Service Class | | 69,701 | |
Shares Outstanding: | | | |
Initial Class | | 101,653 | |
Service Class | | 2,438 | |
Net Asset Value and Offering Price Per Share: | | | |
Initial Class | | $ | 28.90 | |
Service Class | | 28.59 | |
STATEMENT OF OPERATIONS
For the year ended December 31, 2007
(all amounts in thousands)
Investment Income: | | | |
Dividends (net of withholding taxes on foreign | | | |
dividends of $244) | | $ | 26,821 | |
Interest | | 929 | |
Income from loaned securities-net | | 409 | |
| | 28,159 | |
| | | |
Expenses: | | | |
Management and advisory fees | | 21,099 | |
Printing and shareholder reports | | 422 | |
Custody fees | | 423 | |
Administration fees | | 603 | |
Legal fees | | 61 | |
Trustees fees | | 106 | |
Distribution and service fees: | | | |
Service Class | | 169 | |
Other | | 42 | |
Total expenses | | 22,925 | |
| | | |
Net Investment Income | | 5,234 | |
| | | |
Net Realized Gain (Loss) from: | | | |
Investment securities | | 424,525 | |
Foreign currency transactions | | 11 | |
| | 424,536 | |
| | | |
Net Increase (Decrease) in Unrealized Appreciation | | | |
(Depreciation) on: | | | |
Investment securities | | 27,125 | |
Translation of assets and liabilities denominated in | | | |
foreign currencies | | 2 | |
| | 27,127 | |
| | | |
Net Realized and Unrealized Gain: | | 451,663 | |
Net Increase In Net Assets Resulting from | | | |
Operations | | $ | 456,897 | |
The notes to the financial statements are an integral part of this report.
5
Transamerica Equity
STATEMENT OF CHANGES IN NET ASSETS
For the years ended
(all amounts in thousands)
| | December 31,
2007 | | December 31,
2006 | |
Increase (Decrease) in Net Assets From: | | | | | |
Operations: | | | | | |
Net investment income | | $ | 5,234 | | $ | 666 | |
Net realized gain from investment securities and foreign currency transactions | | 424,536 | | 182,206 | |
Change in unrealized appreciation (depreciation) on investment securities and foreign currency translation | | 27,127 | | (3,741 | ) |
| | 456,897 | | 179,131 | |
Distributions to Shareholders: | | | | | |
From net investment income: | | | | | |
Initial Class | | (666 | ) | — | |
| | (666 | ) | — | |
From net realized gains: | | | | | |
Initial Class | | (117,292 | ) | — | |
Service Class | | (2,784 | ) | — | |
| | (120,076 | ) | — | |
Capital Share Transactions: | | | | | |
Proceeds from shares sold: | | | | | |
Initial Class | | 117,201 | | 94,460 | |
Service Class | | 9,439 | | 23,298 | |
| | 126,640 | | 117,758 | |
Proceeds from fund acquisition | | | | | |
Initial Class | | — | | 1,654,442 | |
Service Class | | — | | 9,299 | |
| | — | | 1,663,741 | |
Dividends and distributions reinvested: | | | | | |
Initial Class | | 117,958 | | — | |
Service Class | | 2,784 | | — | |
| | 120,742 | | — | |
Cost of shares redeemed: | | | | | |
Initial Class | | (950,077 | ) | (270,140 | ) |
Service Class | | (14,437 | ) | (9,686 | ) |
| | (964,514 | ) | (279,826 | ) |
| | (717,132 | ) | 1,501,673 | |
Net increase (decrease) in net assets | | (380,977 | ) | 1,680,804 | |
| | | | | |
Net Assets: | | | | | |
Beginning of year | | 3,388,898 | | 1,708,094 | |
End of year | | $ | 3,007,921 | | $ | 3,388,898 | |
Undistributed (Accumulated) Net Investment Income (Loss) | | $ | 5,245 | | $ | 666 | |
Share Activity: | | | | | |
Shares issued: | | | | | |
Initial Class | | 4,285 | | 3,806 | |
Service Class | | 349 | | 949 | |
| | 4,634 | | 4,755 | |
Shares issued-reinvested from distributions: | | | | | |
Initial Class | | 4,468 | | — | |
Service Class | | 107 | | — | |
| | 4,575 | | — | |
Shares issued on fund acquisition: | | | | | |
Initial Class | | — | | 65,136 | |
Service Class | | — | | 369 | |
| | — | | 65,505 | |
Shares redeemed: | | | | | |
Initial Class | | (35,215 | ) | (10,799 | ) |
Service Class | | (533 | ) | (395 | ) |
| | (35,748 | ) | (11,194 | ) |
Net increase (decrease) in shares outstanding: | | | | | |
Initial Class | | (26,462 | ) | 58,143 | |
Service Class | | (77 | ) | 923 | |
| | (26,539 | ) | 59,066 | |
The notes to the financial statements are an integral part of this report.
6
Transamerica Equity
FINANCIAL HIGHLIGHTS
For a share outstanding throughout each period(a)
| | Initial Class | |
| | Year Ended December 31, | |
| | 2007 | | 2006 | | 2005 | | 2004 | | 2003 | |
Net Asset Value | | | | | | | | | | | |
Beginning of period | | $ | 25.95 | | $ | 23.87 | | $ | 20.88 | | $ | 18.03 | | $ | 13.74 | |
Investment Operations | | | | | | | | | | | |
Net investment income (loss) | | 0.05 | | 0.01 | | (0.02 | ) | 0.09 | | (0.02 | ) |
Net realized and unrealized gain (loss) | | 4.07 | | 2.07 | | 3.43 | | 2.76 | | 4.31 | |
Total operations | | 4.12 | | 2.08 | | 3.41 | | 2.85 | | 4.29 | |
Distributions | | | | | | | | | | | |
From net investment income | | (0.01 | ) | — | | (0.08 | ) | — | | — | |
From net realized gains | | (1.16 | ) | — | | (0.34 | ) | — | | — | |
Total distributions | | (1.17 | ) | — | | (0.42 | ) | — | | — | |
Net Asset Value | | | | | | | | | | | |
End of period(b) | | $ | 28.90 | | $ | 25.95 | | $ | 23.87 | | $ | 20.88 | | $ | 18.03 | |
Total Return(c),(d) | | 16.29 | % | 8.71 | % | 16.54 | % | 15.81 | % | 31.22 | % |
Net Assets End of Period (000’s) | | $ | 2,938,220 | | $ | 3,324,168 | | $ | 1,670,310 | | $ | 1,229,731 | | $ | 640,555 | |
Ratio and Supplemental Data | | | | | | | | | | | |
Expenses to average net assets(e) | | 0.76 | % | 0.77 | % | 0.80 | % | 0.81 | % | 0.78 | % |
Net investment income (loss), to average net assets(e) | | 0.18 | % | 0.04 | % | (0.10 | )% | 0.48 | % | (0.11 | )% |
Portfolio turnover rate(d) | | 38 | % | 47 | % | 34 | % | 69 | % | 19 | % |
For a share outstanding throughout each period(a)
| | Service Class | |
| | Year Ended December 31, | | May 1 to Dec | |
| | 2007 | | 2006 | | 2005 | | 2004 | | 31, 2003 | |
Net Asset Value | | | | | | | | | | | |
Beginning of period | | $ | 25.73 | | $ | 23.73 | | $ | 20.80 | | $ | 17.99 | | $ | 14.68 | |
Investment Operations | | | | | | | | | | | |
Net investment income (loss) | | (0.02 | ) | (0.05 | ) | (0.07 | ) | 0.09 | | (0.04 | ) |
Net realized and unrealized gain (loss) | | 4.04 | | 2.05 | | 3.40 | | 2.72 | | 3.35 | |
Total operations | | 4.02 | | 2.00 | | 3.33 | | 2.81 | | 3.31 | |
Distributions | | | | | | | | | | | |
From net investment income | | — | | — | | (0.06 | ) | — | | — | |
From net realized gains | | (1.16 | ) | — | | (0.34 | ) | — | | — | |
Total distributions | | (1.16 | ) | — | | (0.40 | ) | — | | — | |
Net Asset Value | | | | | | | | | | | |
End of period(b) | | $ | 28.59 | | $ | 25.73 | | $ | 23.73 | | $ | 20.80 | | $ | 17.99 | |
Total Return(c),(d) | | 16.04 | % | 8.38 | % | 16.28 | % | 15.62 | % | 22.55 | % |
Net Assets End of Period (000’s) | | $ | 69,701 | | $ | 64,730 | | $ | 37,784 | | $ | 18,159 | | $ | 1,600 | |
Ratio and Supplemental Data | | | | | | | | | | | |
Expenses to average net assets(e) | | 1.01 | % | 1.02 | % | 1.05 | % | 1.08 | % | 1.05 | % |
Net investment income (loss), to average net assets(e) | | (0.07 | )% | (0.22 | )% | (0.35 | )% | 0.49 | % | (0.34 | )% |
Portfolio turnover rate(d) | | 38 | % | 47 | % | 34 | % | 69 | % | 19 | % |
(a) Per share information is calculated based on average number of shares outstanding.
(b) Transamerica Equity (the “Fund”) share class commenced operations as follows:
Initial Class - December 31, 1980
Service Class - May 1, 2003
(c) Total Return reflects all portfolio expenses and includes reinvestment of dividends and capital gains; it does not reflect the charges and deductions under the policies or annuity contracts.
(e) Annualized.
The notes to the financial statements are an integral part of this report.
7
Transamerica Equity
NOTES TO FINANCIAL STATEMENTS
At December 31, 2007
(all amounts in thousands)
NOTE 1. ORGANIZATION AND SIGNIFICANT ACCOUNTING POLICIES
AEGON/Transamerica Series Trust (“ATST”) is an open-end management investment company registered under the Investment Company Act of 1940, as amended (the “1940 Act”). ATST serves as a funding vehicle for variable life insurance, variable annuity and group annuity products. Transamerica Equity (the “Fund”) is part of ATST.
In the normal course of business, the Fund enters into contracts that contain a variety of representations that provide general indemnifications. The Fund’s maximum exposure under these arrangements is unknown, as this would involve future claims that may be made against the Fund and/or its affiliates that have not yet occurred. However, based on experience, the Fund expects the risk of loss to be remote.
This report should be read in conjunction with the current Fund prospectus, which contains more complete information about the Fund.
In preparing the Fund’s financial statements in accordance with accounting principles generally accepted in the United States of America (“GAAP”), estimates or assumptions (which could differ from actual results) may be used that affect reported amounts and disclosures. The following is a summary of significant accounting policies followed by the Fund.
Multiple class operations, income and expenses: The Fund currently offers two classes of shares, an Initial Class and a Service Class. Income, non-class specific expenses and realized and unrealized gains and losses, are allocated daily to each class, based upon the value of shares outstanding method as permitted under Rule 18f-3 of the 1940 Act. Each class bears its own specific expenses as well as a portion of general, common expenses.
Security valuations: The Fund values its investments at the close of the New York Stock Exchange (“NYSE”), normally 4 p.m. ET, each day the NYSE is open for business. Fund investments are valued at the last sale price or closing price on the day of valuation taken from the primary exchange where the security is principally traded.
Securities traded in the over-the-counter market and listed securities for which no sale was reported on that date are valued at the last quoted bid price.
Debt securities are valued based on a price quotation or other equivalent indication of value supplied by an exchange, a pricing service or a major market maker; however, those that mature in sixty days or less are valued at amortized cost, which approximates market.
Investment company securities are valued at the net asset value of the underlying portfolio.
Securities for which quotations are not readily available are valued at fair market value as determined in good faith by the Fund’s Administrative Valuation Committee, using guidelines adopted by the Board of Trustees.
Cash: The Fund may leave cash overnight in its cash account with the custodian, State Street Bank & Trust Company (“State Street”). On July 2, 2007, State Street acquired the parent company of Investors Bank & Trust Company. State Street has been contracted on behalf of the Fund to invest the excess cash into a savings account, which at December 31, 2007 was paying an interest rate of 2.60%.
Repurchase agreements: The Fund is authorized to enter into repurchase agreements. The Fund, through its custodian, State Street, receives delivery of the underlying securities, the value of which at the time of purchase is required to be an amount equal to at least 100% of the resale price. The Fund will bear the risk of value fluctuations until the security can be sold and may encounter delays and incur costs in liquidating the security. In the event of bankruptcy or insolvency of the seller, delays and costs may be incurred.
Commission recapture: The sub-adviser, to the extent consistent with the best execution and usual commission rate policies and practices, may place security transactions of the Fund with broker/dealers with which ATST has established a Commission Recapture Program. A Commission Recapture Program is any arrangement under which a broker/dealer applies a portion of the commissions received by such broker/dealer on the security transactions to the Fund. In no event will commissions paid by the Fund be used to pay expenses that would otherwise be borne by any other funds within ATST, or by any other party.
Recaptured commissions during the year ended December 31, 2007 of $128 are included in net realized gains in the Statement of Operations.
Securities lending: The Fund may lend securities to qualified borrowers, with State Street acting as the Fund’s lending agent. The Fund earns negotiated lenders’ fees. The Fund receives cash and/or securities as collateral against the loaned securities. Cash collateral received is invested in short-term, interest-bearing securities. The Fund monitors the market value of securities loaned on a daily basis and requires collateral in an amount at least equal to the value of the securities loaned. Income from loaned securities earned by State Street for its services, shown in the Statement of Operations is net of fees, in the amount of $175.
The Fund has invested the cash collateral received from securities loaned in the following short-term, interest-bearing securities:
Abbey National PLC, Eurodollar Term, 5.00%, 1/7/2008 | $ | 3,124 |
ABN AMRO Bank NV, Eurodollar Term, 5.18%, 1/4/2008 | 2,499 |
Bank of Nova Scotia, Eurodollar Term, 4.96%, 1/22/2008 | 2,187 |
Barclays, Eurodollar Term, 5.00%, 2/12/2008 | 4,374 |
BNP Paribas, Eurodollar Term, 5.01%, 1/11/2008 | 4,061 |
Calyon, Eurodollar Term, 5.12%, 3/3/2008 | 937 |
Credit Suisse First Boston Corp., Repurchase Agreement, 4.60%, 1/2/2008 | 8,123 |
Dexia Group, Eurodollar Term, 4.82%, 1/3/2008 | 3,124 |
HBOS Halifax Bank of Scotland, Eurodollar Term, 5.15%, 1/2/2008 | 1,562 |
JPMorgan Chase & Co., Eurodollar Term, 5.15%, 2/12/2008 | 1,562 |
Lloyds TSB Bank, Eurodollar Term, 5.15%, 1/24/2008 | 3,124 |
Merrill Lynch & Co. (RPG), Repurchase Agreement, 4.60%, 1/2/2008 | 4,686 |
Morgan Stanley & Co. (Corp. Repo), Repurchase Agreement, 4.60%, 1/2/2008 | 12,809 |
Rabobank Nederland, Eurodollar Term, 5.08%, 1/10/2008 | 3,749 |
Reserve Primary Money Market Fund, 4.95% | 3,332 |
Royal Bank of Scotland, Eurodollar Term, 5.00%, 2/25/2008 | 3,749 |
Societe Generale, Eurodollar Term, 5.15%, 3/3/2008 | 1,874 |
Toronto Dominion Bank, Eurodollar Term, 5.05%, 1/10/2008 | 3,749 |
UBS AG, Eurodollar Term, 4.92%, 1/11/2008 | 2,187 |
Wells Fargo, Bank Note, 4.75%, 1/8/2008 | 1,562 |
| $ | 72,374 |
8
NOTES TO FINANCIAL STATEMENTS (continued)
At December 31, 2007
(all amounts in thousands)
NOTE 1.– (continued)
Security transactions and investment income: Security transactions are recorded on the trade date. Security gains and losses are calculated on the first-in, first-out basis. Dividend income, if any, is recorded on the ex-dividend date or, in the case of foreign securities, as soon as the Fund is informed of the ex-dividend date. Interest income, including accretion of discounts and amortization of premiums, is recorded on the accrual basis commencing on the settlement date.
Dividend distributions: Dividends and capital gains distributions are typically declared and reinvested annually and are generally paid and reinvested on the business day following the ex-date.
NOTE 2. RELATED PARTY TRANSACTIONS
ATST serves as a funding vehicle for certain affiliated asset allocation portfolios and certain affiliated separate accounts of Western Reserve Life Assurance Co. of Ohio, Transamerica Life Insurance Company, Transamerica Financial Life Insurance Company, Inc., Monumental Life Insurance Company and Transamerica Occidental Life Insurance Company.
Transamerica Fund Advisors, Inc. (“TFAI”) is the Fund’s investment adviser. Transamerica Fund Services, Inc. (“TFS”) is the Fund’s administrator and transfer agent. Prior to May 1, 2007, AFSG Securities Corp. (“AFSG”), was the Fund’s distributor. Transamerica Capital Inc. (“TCI”) is now the Fund’s distributor. TFAI, TFS, AFSG, and TCI are affiliates of AEGON NV, a Netherlands corporation.
Transamerica Investment Management, LLC (“TIM”) is an affiliate of the Fund and a sub-adviser to the Fund.
Certain officers and trustees of the Fund are also officers and/or directors of TFAI, TFS and TCI. .
The following schedule reflects the percentage of Fund Assets owned by affiliated investment companies at December 31, 2007:
| | Net
Assets | | % of Net
Assets | |
| | | | | |
Asset Allocation-Conservative Portfolio | | $ | 32,772 | | 1.09 | % |
Asset Allocation-Growth Portfolio | | 115,574 | | 3.84 | |
Asset Allocation-Moderate Growth Portfolio | | 299,351 | | 9.95 | |
Asset Allocation-Moderate Portfolio | | 141,326 | | 4.70 | |
Total | | $ | 589,023 | | 19.58 | % |
Investment advisory fee: The Fund pays management fees to TFAI based on average daily net assets (“ANA”) at the following breakpoints:
0.75% of the first $500 million of ANA
0.70% of the next $2 billion of ANA
0.65% of ANA over $2.5 billion
TFAI has contractually agreed to waive its advisory fee and will reimburse the Fund to the extent that operating expenses, excluding 12b-1 fees, exceed the following stated annual limit:
0.85% Expense Limit
If total Fund expenses fall below the annual expense limitation agreement agreed to by the adviser within the succeeding three years, the Fund may be required to pay the adviser a portion or all of the waived advisory fees.
There were no amounts recaptured during the year ended December 31, 2007. There are no amounts available for recapture at December 31, 2007.
Distribution and service fees: ATST entered into a Distribution Agreement with AFSG dated January 1, 1997, as amended. On May 1, 2007, the Distribution Agreement was amended to replace AFSG with TCI as the Fund’s distributor. The Fund has also adopted a distribution plan (“Distribution Plan”) pursuant to Rule 12b-1 under the 1940 Act.
Under the Distribution Plan for the Initial Class shares, TCI, on behalf of the Fund, is authorized to pay various service providers, as direct payment for expenses incurred in connection with distribution of the Fund’s shares, amounts equal to actual expenses associated with distributing the shares.
The Distribution Plan for the Service Class shares requires ATST to pay distribution fees to TCI as compensation for its activities, not as reimbursement for specific expenses. The fee on the Service Class is paid to the insurance companies for providing services and account maintenance for their policyholders who invest in the variable insurance products which invest in the Service Class shares.
The Fund is authorized under the Distribution Plan to pay fees on each class up to the following limits:
Initial Class | 0.15% |
Service Class | 0.25% |
TCI has determined that it will not seek payment by the Fund of the distribution expenses incurred with respect to the Initial
9
NOTES TO FINANCIAL STATEMENTS (continued)
At December 31, 2007
(all amounts in thousands)
NOTE 2.– (continued)
Class shares before April 30, 2009. Prior to TCI seeking reimbursement of future expenses, policy and contract owners will be notified in advance. The Fund will pay fees relating to Service Class shares.
Administrative services: The Fund has entered into an agreement with TFS for financial and legal fund administration services. The Fund pays TFS an annual fee of 0.02% of ANA. The Legal fees on the Statement of Operations are for fees paid to external legal counsel.
Deferred compensation plan: Each eligible independent Fund Trustee may elect participation in a non-qualified deferred compensation plan (“the Plan”). Under the Plan, such Trustees may defer payment of all or a portion of their total fees earned as a Fund Trustee. Each Trustee who is a participant in the Plan may elect that the earnings, losses or gains credited to his or her deferred fee amounts be determined based on a deemed investment in any series of Transamerica IDEX Mutual Funds. The right of a participant to receive a distribution from the Plan of the deferred fees is an unsecured claim against the general assets of all series of Transamerica IDEX Mutual Funds. The pro rata liability to the Fund of all deferred fees in the Plan amounted, as of December 31, 2007, to $144. Amounts deferred under the Deferred Compensation Plan are unfunded against the general assets of ATST.
Retirement plan: Under a retirement plan (the “Emeritus Plan”) available to the Independent Trustees, each Independent Trustee is deemed to have elected to serve as Trustee Emeritus of ATST upon his or her termination of service, other than removal for cause, is entitled to 50% of the trustee’s current retainer for a maximum period of five years determined by his or her years of service as a Trustee.
Such amounts shall be accrued by ATST on a pro rata basis allocable to each series of ATST fund based on the relative assets of the series. If retainers increase in the future, past accruals (and credits) will be adjusted upward so that 50% of the Trustee’s current retainer is accrued and credited at all times. Upon death, disability or termination of service, other than removal for cause, amounts deferred become payable to a Trustee Emeritus (or his/her beneficiary). Upon the commencement of service as Trustee Emeritus, compensation will be paid on a quarterly basis during the time period that the Trustee Emeritus is allowed to serve as such.
Amounts accrued under the Emeritus Plan are unsecured claims against the general assets of ATST. For the year ended December 31, 2007, the amount related to the Emeritus Plan was $146. As of December 31, 2007, the Fund has not made any payments related to the Emeritus Plan.
The Emeritus Plan was terminated effective October 30, 2007. Upon the termination, the Fund shall continue to pay any remaining benefits in accordance with the Plan, but no further compensation shall accrue under the Plan.
NOTE 3. INVESTMENT TRANSACTIONS
The cost of securities purchased and proceeds from securities sold (excluding short-term securities) for the year ended December 31, 2007 were as follows:
Purchases of securities: | | | |
Long-term | | $ | 1,128,277 | |
U.S. Government | | — | |
Proceeds from maturities and sales of securities: | | | |
Long-term | | 1,982,858 | |
U.S. Government | | — | |
| | | | |
NOTE 4. FEDERAL INCOME TAX MATTERS
The Fund has not made any provision for federal income or excise taxes due to its policy to distribute all of its taxable income and capital gains to its shareholders and otherwise qualify as a regulated investment company under Subchapter M of the Internal Revenue Code. Income and capital gain distributions are determined in accordance with income tax regulations, which may differ from GAAP. These differences are primarily due to differing treatment for items including, but not limited to, wash sales, return of capital, capital loss carryforwards and foreign currency transactions.
Therefore, distributions determined in accordance with tax regulations may differ significantly in amount or character from net investment income and realized gains for financial reporting purposes. Financial reporting records are adjusted for permanent book/tax differences to reflect tax character. Financial records are not adjusted for temporary differences. These reclassifications are as follows:
Additional paid-in capital | | $ | — |
Undistributed (accumulated) net investment income (loss) | | $ | 11 |
Undistributed (accumulated) net realized gain (loss) from investment securities | | $ | (11) |
The capital loss carryforwards are available to offset future realized capital gains through the periods listed:
Capital Loss | | | |
Carryforwards | | Available Through | |
$ | 176,103 | | December 31, 2008 | |
$ | 19,818 | | December 31, 2009 | |
$ | 81,035 | | December 31, 2010 | |
10
NOTES TO FINANCIAL STATEMENTS (continued)
At December 31, 2007
(all amounts in thousands)
NOTE 4.– (continued)
The capital loss carryforward utilized during the year ended December 31, 2007 was $333,900.
The capital loss carryforwards are available to offset future realized gains, subject to certain limitations under the Internal Revenue Code, through the periods listed.
The tax character of distributions paid may differ from the character of distributions shown in the Statements of Changes in Net Assets due to short-term gains being treated as ordinary income for tax purposes. The tax character of distributions paid during 2006 and 2007 was as follows:
2006 Distributions paid from: | | | |
Ordinary Income | | $ | — | |
Long-term Capital Gain | | — | |
| | | |
2007 Distributions paid from: | | | |
Ordinary Income | | 666 | |
Long-term Capital Gain | | 120,076 | |
| | | | |
The tax basis components of distributable earnings as of December 31, 2007 are as follows:
Undistributed Ordinary Income | | $ | 5,260 | |
Undistributed Long-term Capital Gain | | $ | 90,840 | |
Capital Loss Carryforward | | $ | (276,955 | ) |
Net Unrealized Appreciation (Depreciation) | | $ | 726,896 | * |
*The amount includes unrealized appreciation (depreciation) from foreign currency.
NOTE 5. REGULATORY PROCEEDINGS
There continues to be significant federal and state regulatory activity relating to financial services companies, particularly mutual fund companies and their investment advisers. As part of an ongoing investigation regarding potential market timing, recordkeeping and trading compliance issues and matters affecting the Fund’s investment adviser, TFAI, and certain affiliates and former employees of TFAI, the SEC staff has indicated that it is likely to take some action against TFAI and certain of its affiliates at the conclusion of the investigation. The potential timing and the scope of any such action is difficult to predict. Although the impact of any action brought against TFAI and/or its affiliates is difficult to assess at the present time, the Fund currently believes that the likelihood that any such action will have a material adverse impact on it is remote. It is important to note that the Fund is not aware of any allegation of wrong doing against it and its Board at the time this annual report is printed. Although it is not anticipated that these developments will have an adverse impact on the Fund, there can be no assurance at this time. TFAI and its affiliates are actively working with the SEC in regard to this matter; however, the exact resolution cannot be determined at this time. TFAI will take such actions that it deems necessary or appropriate to continue providing management services to the Fund and to bring all matters to an appropriate conclusion.
TFAI and/or its affiliates, and not the Fund, will bear the costs regarding these regulatory matters.
NOTE 6. RECENTLY ISSUED ACCOUNTING PRONOUNCEMENTS
In July 2006, the Financial Accounting Standards Board (“FASB”) released FASB Interpretation No. 48 “Accounting for Uncertainty in Income Taxes” (“FIN 48”), an interpretation of FASB Statement No. 109. FIN 48 provides guidance for how uncertain tax positions should be recognized, measured, presented and disclosed in the financial statements. FIN 48 requires the accounting and disclosure of tax positions taken or expected to be taken in the course of preparing the Fund’s tax returns to determine whether the tax positions are “more-likely-than-not” of being sustained by the applicable tax authority. Tax positions not deemed to meet the more-likely-than-not threshold would be recorded as a tax benefit or expense in the current year.
Adoption of FIN 48 is effective during the first required financial reporting period for fiscal years beginning after December 15, 2006. Management adopted FIN 48 on June 29, 2007.
Implementation of FIN 48 requires Management of the Fund to analyze all open tax years, as defined by the Statute of Limitations, for all major jurisdictions, which includes federal and certain states. Open tax years are those that are open for exam by taxing authorities (i.e., the last 4 tax year ends and the interim tax period since then). The Fund has no examinations in progress and none are expected at this time.
Management of the Fund has reviewed all open tax years and major jurisdictions and concluded the adoption of FIN 48 resulted in no impact to the Fund’s net assets or results of operations. There is no tax liability resulting from unrecognized tax benefits relating to uncertain income tax positions taken or expected to be taken in future tax returns. The Fund is also not aware of any tax positions for which it is reasonably possible that the total amounts of unrecognized tax benefits will significantly change in the next 12 months.
In September 2006, FASB issued its new Standard No. 157, “Fair Value Measurements” (“FAS 157”). FAS 157 is designed to unify guidance for the measurement of fair value of all types of assets, including financial instruments, and certain liabilities, throughout a number of accounting standards. FAS 157 also establishes a hierarchy for measuring fair value in generally accepted accounting principles and expands financial statement disclosures about fair value measurements that are relevant to mutual funds. FAS 157 is effective for financial statements issued for fiscal years beginning after November 15, 2007, and earlier application is permitted.
As of December 31, 2007, Management does not expect the adoption of FAS 157 to impact the amounts reported in the financial statements, however, additional disclosures will be required about the inputs used to develop the measurements of fair value and the effect of certain of the measurements reported in the statement of operations for a fiscal period.
11
NOTES TO FINANCIAL STATEMENTS (continued)
At December 31, 2007
(all amounts in thousands)
NOTE 7. SUBSEQUENT EVENT
Effective January 1, 2008, TFAI changed its name to Transamerica Asset Management, Inc.
Effective May 1, 2008, AEGON/Transamerica Series Trust will change its name to Transamerica Series Trust. At that time, the Fund will also change its name to Transamerica Equity VP.
12
Report of Independent Registered Certified Public Accounting Firm
To the Board of Trustees and Shareholders of Transamerica Equity:
In our opinion, the accompanying statement of assets and liabilities, including the schedule of investments, and the related statements of operations and of changes in net assets and the financial highlights present fairly, in all material respects, the financial position of Transamerica Equity (the “Fund”) (one of the portfolios constituting AEGON/Transamerica Series Trust) at December 31, 2007, the results of its operations for the year then ended, the changes in its net assets for each of the two years in the period then ended and the financial highlights for each of the periods presented, in conformity with accounting principles generally accepted in the United States of America. These financial statements and financial highlights (hereafter referred to as “financial statements”) are the responsibility of the Fund’s management; our responsibility is to express an opinion on these financial statements based on our audits. We conducted our audits of these financial statements in accordance with the standards of the Public Company Accounting Oversight Board (United States). Those standards require that we plan and perform the audit to obtain reasonable assurance about whether the financial statements are free of material misstatement. An audit includes examining, on a test basis, evidence supporting the amounts and disclosures in the financial statements, assessing the accounting principles used and significant estimates made by management, and evaluating the overall financial statement presentation. We believe that our audits, which included confirmation of securities at December 31, 2007 by correspondence with the custodian and brokers, provide a reasonable basis for our opinion.

Tampa, Florida
February 29, 2008
13
Transamerica Equity
SUPPLEMENTAL TAX INFORMATION (unaudited)
(all amounts in thousands)
For tax purposes, the Fund has made a Long-Term Capital Gain Designation of $120,076 for the year ended December 31, 2007.
RESULTS OF SHAREHOLDER PROXY (unaudited)
At a special meeting of shareholders held on October 30, 2007, the results of the Proposals were as follows:
Proposal 1: To elect a new Board:
Proposed
Trustee | | For | | Against | | Abstentions/Broker Non-
Votes |
John K. Carter | | 2,274,998,840.817 | | 57,804,698.755 | | 35,433.883 |
| | | | | | |
Leo J. Hill | | 2,277,212,702.754 | | 55,590,836.819 | | 35,433.883 |
| | | | | | |
Neal M. Jewell | | 2,266,793,295.663 | | 66,010,243.909 | | 35,433.883 |
| | | | | | |
Russell A. Kimball, Jr. | | 2,274,825,235.835 | | 57,978,303.737 | | 35,433.883 |
| | | | | | |
Eugene M. Mannella | | 2,274,623,165.033 | | 58,180,374.539 | | 35,433.883 |
| | | | | | |
Norm R. Nielsen | | 2,275,050,055.885 | | 57,753,483.687 | | 35,433.883 |
| | | | | | |
Joyce Galpern Norden | | 2,270,278,122.250 | | 62,525,417.323 | | 35,433.883 |
| | | | | | |
Patricia L. Sawyer | | 2,275,737,737.456 | | 57,065,802.116 | | 35,433.883 |
| | | | | | |
John W. Waechter | | 2,276,615,120.140 | | 56,188,419.433 | | 35,433.883 |
Proposal 2: To approve an amendment to the Agreement and Declaration of Trust:
| | | | Abstentions/Broker Non- |
For | | Against | | Votes |
2,182,022,669.110 | | 77,590,048.544 | | 73,226,255.801 |
14
Transamerica Equity
INVESTMENT ADVISORY AND SUB-ADVISORY AGREEMENTS-REVIEW AND RENEWAL (unaudited)
At a meeting of the Board of Trustees of AEGON/Transamerica Series Trust (“ATST”) held on December 4th, 2007, the Board reviewed and considered the renewal of the investment advisory agreement (the “Investment Advisory Agreement”) between Transamerica Equity (the “Fund”) and Transamerica Fund Advisors, Inc. (“TFAI”), as well as the renewal of the investment sub-advisory agreement (the “Sub-Advisory Agreement”) of the Fund between TFAI and Transamerica Investment Management, LLC (the “Sub-Adviser”), to determine whether the agreements should be renewed for a six-month period. It was noted that this review was interim in nature to align all the Funds on the same calendar, and that the Funds’ advisory arrangements would be reviewed again in the first half of 2008.
Following their review and consideration, the Trustees determined that the renewal of the Investment Advisory Agreement and the Sub-Advisory Agreement would enable shareholders of the Fund to obtain high quality services at a cost that is appropriate, fair, and in the best interests of its shareholders. The Board, including the independent members of the Board, unanimously approved the renewal of the Investment Advisory Agreement and Sub-Advisory Agreement. In reaching their decision, the Trustees requested and obtained from TFAI and the Sub-Adviser such information as they deemed reasonably necessary to evaluate the agreements, including information about fees and performance of comparable funds managed by the Sub-Adviser. The Trustees also carefully considered information they had previously received from TFAI and the Sub-Adviser throughout the year as part of their regular oversight of the Fund, as well as comparative fee, expense, and performance information prepared by Lipper Inc. (“Lipper”), an independent provider of mutual fund performance, fee and expense information and profitability data prepared by management. In considering the proposed continuation of the Investment Advisory and Sub-Advisory Agreements, the Trustees evaluated a number of considerations that they believed, in light of the legal advice furnished to them by independent legal counsel and their own business judgment, to be relevant. They based their decisions on a variety of factors, including the following considerations, among others, although they did not identify any consideration or particular information that was controlling of their decisions:
The nature, extent and quality of the advisory services to be provided. The Board considered the nature and quality of the services provided by TFAI and the Sub-Adviser to the Fund in the past, as well as the services anticipated to be provided in the future. The Board concluded that TFAI and the Sub-Adviser are capable of providing high quality services to the Fund, as indicated by the nature and quality of services provided in the past by TFAI and the Sub-Adviser for this series and the experience, capability and integrity of TFAI’s senior management, the financial resources of TFAI and the Sub-Adviser, TFAI’s management oversight process and the professional qualifications of the portfolio management team of the Sub-Adviser. The Trustees determined that TFAI and the Sub-Adviser can provide investment and related services that are appropriate in scope and extent in light of the Fund’s operations, the competitive landscape of the investment company business and investor needs.
The investment performance of the Fund. The Board examined the short and longer-term performance of the Fund, including relative performance against a peer universe of comparable mutual funds as prepared by Lipper for various trailing periods ended June 30, 2007. The Board noted that the Fund’s performance was good compared to its peer universe over the past 5-year period. The Board also noted that the Fund’s performance was above the median for its peer universe over the past 3-year period. The Board noted further that the Fund’s performance was below the median for its peer universe over the past 1-year period. On the basis of the Board’s assessment of the nature, extent and quality of advisory services to be provided or procured by TFAI and the Sub-Adviser, the Board concluded that TFAI and the Sub-Adviser are capable of providing a level of investment performance that is appropriate in light of the Fund’s proposed investment objectives, policies and strategies and competitive with other similarly situated investment companies, but that the Board would be monitoring performance closely.
The cost of advisory services provided and the level of profitability. The Board reviewed profitability information of TFAI’s cost of procuring fund management services, as well as the costs of its provision of administration, fund accounting and other services, to the Fund and to ATST as a whole by TFAI and its affiliates. The Board reviewed the management and sub-advisory fees for the Fund, and noted that the contractual management fees were generally in line with the Fund’s peer group and universe. Based on their review, the Trustees determined that the management fees of the Fund generally are appropriate in light of the services expected to be provided or procured, the management fees and the anticipated profitability of the relationship between the Fund, TFAI and its affiliates, and the Sub-Adviser. In making these observations and determinations, the Board reviewed, among other things, comparative information provided by Lipper.
Whether fee levels reflect economies of scale and the extent to which economies of scale would be realized as the Fund grows. In evaluating the extent to which the management fees payable under the Investment Advisory and Sub-Advisory Agreements reflect economies of scale or will permit economies of scale to be realized in the future, the Board noted that TFAI and the Sub-Adviser offer breakpoints which appropriately benefit investors by passing on economies of scale in the form of lower management fees as the level of assets grows. The Trustees also concluded that they will have the opportunity to periodically reexamine whether the Fund has achieved economies of scale, and the appropriateness of management fees payable to TFAI and fees paid to the Sub-Adviser, in the future.
Benefits (such as soft dollars) to TFAI, its affiliates, or the Sub-Adviser from their relationship with the Fund. The Board concluded that other benefits anticipated to be derived by TFAI, its affiliates, and the Sub-Adviser from their relationships with the Fund are expected to be reasonable and fair, and consistent with industry practice and the best interests of the Fund and its shareholders. The Trustees noted that TFAI would not realize soft dollar benefits from its relationship with the Fund, and that the Sub-Adviser’s soft dollar trading is consistent with applicable law, including best execution requirements in particular. The Board also noted that the Sub-Adviser is participating in a brokerage program pursuant to which a portion of brokerage commissions paid by the Fund is recaptured for the benefit of the Fund and its shareholders, thus limiting the amount of soft dollar arrangements the Sub-Adviser may engage in with respect to the Fund’s brokerage transactions.
15
Other considerations. The Board determined that TFAI has made a substantial commitment to the recruitment and retention of high quality personnel, and maintains the financial, compliance and operational resources reasonably necessary to manage the Fund in a professional manner that is consistent with the best interests of the Fund and its shareholders. In this regard, the Trustees favorably considered the procedures and policies in place by TFAI to enforce compliance with applicable laws and regulations and oversee the portfolio management activities of the Sub-Adviser. The Trustees also determined that TFAI has made a significant entrepreneurial commitment to the management and success of the Fund, reflected by TFAI’s expense limitation and fee waiver arrangements with the Fund which may result in TFAI waiving a substantial amount of management fees for the benefit of shareholders.
16
Transamerica Equity II
MARKET ENVIRONMENT
U.S. equities faced significant challenges in the twelve months ended December 31, 2007, particularly in the second half of the year. After advancing early in the period, the Standard and Poor’s 500 Composite Stock Index gave back some gains, to end the year with a relatively modest total return of 5.49%.
Throughout the period, the market struggled against the implications of a weak U.S. housing market. Changing home values greatly influence consumer spending, creating a ripple effect in the economy. However, because consumer spending, unemployment levels and corporate earnings remained steady, stock prices advanced through mid-May. Thereafter, rising defaults for low-quality (sub-prime) mortgages triggered a crisis in the debt markets, making it harder for individuals and corporations to borrow capital. Market volatility increased dramatically as investors worried how this credit crisis, combined with the housing downturn, would affect companies that require large amounts of short-term financing or depend on robust consumer spending. As the period wore on, persistent concerns about inflation and significant signs of a flagging economy added to the market’s worries.
Capital infusions from the world’s central banks and the sovereign funds of foreign nations, plus a total of 1.0% in interest-rate cuts by the Federal Reserve Board were largely ineffective in resolving the issues. Quarterly earnings growth stalled, and it became increasingly apparent that the housingand-credit malaise will undermine the economy in 2008.
Against this backdrop, growth indexes outperformed value measures, and large-cap stocks showed more resilience than small- or mid-cap equities.
PERFORMANCE
For the year ended December 31, 2007, Transamerica Equity II returned 17.72%. By comparison its benchmark, the Russell 1000 Growth Index, returned 11.81%.
STRATEGY REVIEW
We attribute the portfolio’s out-performance to our focus on two secular growth trends that were uneffected by the domestic economy’s troubles: demand for new personal technology; and rapid worldwide industrialization. The portfolio’s chief contributors to performance included Apple Inc. (“Apple”), Research in Motion Limited (“RIMM”), Google Inc. (“Google”) and Jacobs Engineering Group Inc. (“Jacobs”)
Apple’s success rests on its user-friendly personal electronics (e.g., iPods and iPhones) and a “halo” effect from these that has invigorated sales of its personal computers and laptops. RIMM, the maker of the BlackBerry personal communication devices, is expanding its product line for business customers and “smart phones” for consumers. Internet search engine Google, already dominant in the online advertising business, is extending its services (e.g., through contracts with major wireless phone companies). Jacobs, which designs and constructs major infrastructure projects and manufacturing facilities worldwide, won new contracts during the period.
Partially countering these gains were setbacks for McGraw-Hill Companies Inc. (“McGraw-Hill”), the parent company of debt- rating agency Standard & Poor’s Corp. (“Standard & Poor’s”); and for several consumer companies (e.g., Marriott International, Inc. (“Marriott”), Starbucks Corporation (“Starbucks”) and Nordstrom, Inc. (“Nordstrom”)). Earnings at these companies remained healthy, but their stock prices fell on fears that the credit-and-housing crisis would negatively affect bond market activity (a factor for Standard & Poor’s) and consumer spending (a potential issue for the others). We believe McGraw-Hill will recover as the credit crisis is resolved and believe consumers will continue to support high-end retailer Nordstrom. We exited Starbucks, which is involved in a costly, margin-squeezing overseas expansion; and hotelier Marriott, where the secular growth cycle has peaked.
Gary U. Rollé, CFA
Portfolio Manager
Transamerica Investment Management, LLC
AEGON/Transamerica Series Trust | | Annual Report 2007 |
1
Transamerica Equity II
(unaudited)
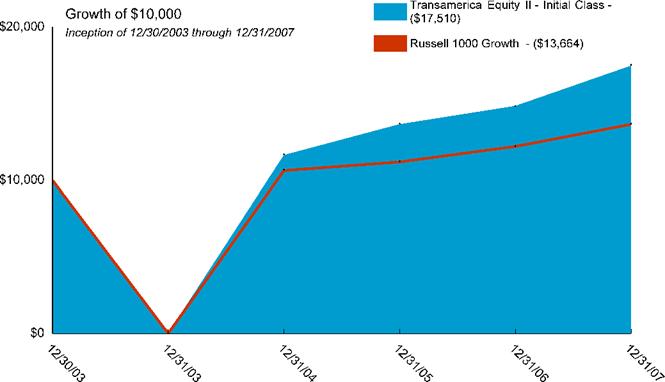
Average Annual Total Return for Periods Ended 12/31/2007
| | 1 Year | | From
Inception | | Inception
Date | |
Initial Class | | 17.72 | % | 15.01 | % | 12/30/03 | |
Russell 1000 Growth (1) | | 11.81 | % | 8.10 | % | 12/30/03 | |
NOTES
(1) The Russell 1000 Growth (Russell 1000 Growth) Index is an unmanaged index used as a general measure of market performance. Calculations assume dividends and capital gains are reinvested and do not include any managerial expenses. From inception calculation is based on life of Initial Class shares.
The performance data presented represents past performance, future results may vary. The portfolio’s investment return and net asset value will fluctuate. Past performance does not guarantee future results. Investor’s units when redeemed, may be worth more or less than their original cost.
Current performance may be lower or higher than performance quoted. Please visit your insurance company’s website for contract or policy level standardized total returns current to the most recent month end. Portfolio performance is net of investment fees and fund expenses, but not product charges, which, if included, would significantly lower the performance quoted.
This material must be preceded or accompanied by a current prospectus, which includes specific contents regarding the investment objectives, explanation of share classes and policies of this portfolio.
2
Transamerica Equity II
UNDERSTANDING YOUR FUND’S EXPENSES
(unaudited)
SHAREHOLDER EXPENSES
Fund shareholders may incur ongoing costs, including management and advisory fees, and other fund expenses.
The following Example is intended to help you understand your ongoing costs (in dollars and cents) of investing in the Fund and to compare these costs with the ongoing costs of investing in other funds.
The Example is based on an investment of $1,000 invested at July 1, 2007 and held for the entire period until December 31, 2007.
ACTUAL EXPENSES
The first line in the table below provides information about actual account values and actual expenses. You may use the information in this line, together with the amount you invested, to estimate the expenses that you paid over the period. Simply divide your account value by $1,000 (for example, an $8,600 account value divided by $1,000 = 8.6), then multiply the result by the number in the first line of your Fund under the heading entitled “Expenses Paid During Period” to estimate the expenses you paid on your account during this period.
HYPOTHETICAL EXAMPLE FOR COMPARISON PURPOSES
The second line in the table below provides information about hypothetical account values and hypothetical expenses based on the Fund’s actual expense ratio and an assumed rate of return of 5% per year before expenses, which is not the Fund’s actual return. The hypothetical account values and expenses may not be used to estimate the actual ending account balance or expenses you paid for the period. You may use this information to compare the ongoing costs of investing in your Fund and other funds. To do so, compare this 5% hypothetical example with the 5% hypothetical examples that appear in the shareholder reports of the other funds.
Please note that the expenses shown in the table are meant to highlight your ongoing costs only and do not reflect any transactional costs, such as sales charges, redemption fees, brokerage commissions paid on purchases and sales of fund shares. Therefore, the second line under the Fund in the table is useful in comparing ongoing costs only, and will not help you determine the relative total costs of owning different funds. If any of these transaction costs were included, your costs would be higher. The expenses shown in the table do not reflect any fees that may be charged to you by brokers, financial intermediaries or other financial institutions.
| | Beginning | | Ending | | Annualized | | Expenses | |
| | Account | | Account | | Expense | | Paid During | |
| | Value | | Value | | Ratio | | Period (a) | |
Initial Class | | | | | | | | | |
Actual | | $ | 1,000.00 | | $ | 1,097.50 | | 0.30 | % | $ | 1.59 | |
Hypothetical (b) | | 1,000.00 | | 1,023.69 | | 0.30 | | 1.53 | |
| | | | | | | | | | | | |
(a) | | Expenses are calculated using the Fund’s annualized expense ratio (as disclosed in the table), multiplied by the average account value for the period, multiplied by the number of days in the period (184 days), and divided by the number of days in the year (365 days). |
| | |
(b) | | 5% return per year before expenses. |
GRAPHICAL PRESENTATION OF SCHEDULE OF INVESTMENTS
By Sector
At December 31, 2007

This chart shows the percentage breakdown by sector of the Fund’s total investment securities.
3
Transamerica Equity II
SCHEDULE OF INVESTMENTS
At December 31, 2007
(all amounts except share amounts in thousands)
| | Shares | | Value | |
COMMON STOCKS (99.1%) | | | | | |
Aerospace & Defense (4.5%) | | | | | |
Boeing Co. | | 5,200 | | $ | 455 | |
Raytheon Co. | | 8,500 | | 516 | |
Air Freight & Logistics (2.9%) | | | | | |
Expeditors International Washington, Inc. | | 14,000 | | 626 | |
Auto Components (3.0%) | | | | | |
Johnson Controls, Inc. | | 18,200 | | 656 | |
Automobiles (2.8%) | | | | | |
Daimler AG | | 6,400 | | 612 | |
Biotechnology (2.8%) | | | | | |
Gilead Sciences, Inc. ‡ | | 13,000 | | 598 | |
Capital Markets (5.0%) | | | | | |
Ameriprise Financial, Inc. | | 7,000 | | 386 | |
State Street Corp. | | 8,600 | | 698 | |
Chemicals (7.4%) | | | | | |
Ecolab, Inc. | | 4,500 | | 231 | |
Praxair, Inc. | | 13,000 | | 1,153 | |
Sigma-Aldrich Corp. | | 4,000 | | 218 | |
Communications Equipment (6.0%) | | | | | |
Qualcomm, Inc. | | 11,000 | | 433 | |
Research In Motion, Ltd. ‡ | | 7,500 | | 850 | |
Computers & Peripherals (7.8%) | | | | | |
Apple, Inc. ‡ | | 8,500 | | 1,684 | |
Construction & Engineering (5.2%) | | | | | |
Jacobs Engineering Group, Inc. ‡ | | 11,700 | | 1,119 | |
Consumer Finance (3.1%) | | | | | |
American Express Co. | | 12,990 | | 676 | |
Diversified Financial Services (5.6%) | | | | | |
CME Group, Inc. Class A | | 1,750 | | 1,201 | |
Diversified Telecommunication Services (2.3%) | | | | | |
AT&T, Inc. | | 12,000 | | 499 | |
Electronic Equipment & Instruments (3.1%) | | | | | |
Tyco Electronics, Ltd. | | 18,000 | | $ | 668 | |
Energy Equipment & Services (2.3%) | | | | | |
Schlumberger, Ltd. | | 5,000 | | 492 | |
Health Care Equipment & Supplies (2.2%) | | | | | |
Varian Medical Systems, Inc. ‡ | | 9,000 | | 469 | |
Hotels, Restaurants & Leisure (2.3%) | | | | | |
MGM Mirage, Inc. ‡ | | 6,000 | | 504 | |
Industrial Conglomerates (3.1%) | | | | | |
General Electric Co. | | 18,000 | | 667 | |
Insurance (2.5%) | | | | | |
American International Group, Inc. | | 9,200 | | 536 | |
Internet Software & Services (5.1%) | | | | | |
Google, Inc. Class A ‡ | | 1,600 | | 1,106 | |
Machinery (5.9%) | | | | | |
Caterpillar, Inc. | | 8,930 | | 648 | |
PACCAR, Inc. | | 11,500 | | 627 | |
Media (3.5%) | | | | | |
McGraw-Hill Cos., Inc. (The) | | 17,000 | | 745 | |
Multiline Retail (2.0%) | | | | | |
Nordstrom, Inc. | | 11,500 | | 422 | |
Pharmaceuticals (3.0%) | | | | | |
Allergan, Inc. | | 10,000 | | 642 | |
Software (5.7%) | | | | | |
Electronic Arts, Inc. ‡ | | 12,000 | | 701 | |
Microsoft Corp. | | 14,500 | | 517 | |
Total Common Stocks (cost $15,266) | | | | 21,355 | |
| | | | | |
Total Investment Securities (cost $15,266) # | | | | $ | 21,355 | |
NOTES TO SCHEDULE OF INVESTMENTS:
‡ Non-Income Producing.
# Aggregate cost for federal income tax purposes is $15,305. Aggregate gross unrealized appreciation for all securities in which there is an excess of value over tax cost and aggregate gross unrealized depreciation for all securities in which there is an excess of tax cost over value were $6,503 and $453, respectively. Net unrealized appreciation for tax purposes is $6,050.
The notes to the financial statements are an integral part of this report.
4
Transamerica Equity II
STATEMENT OF ASSETS AND LIABILITIES
At December 31, 2007
(all amounts except per share amounts in thousands)
Assets: | | | |
Investment securities, at value (cost: $15,266) | | $ | 21,355 | |
Cash | | 191 | |
Receivables: | | | |
Dividends | | 27 | |
| | 21,573 | |
Liabilities: | | | |
Accounts payable and accrued liabilities: | | | |
Shares redeemed | | 2 | |
Management and advisory fees | | 4 | |
Other | | 16 | |
| | 22 | |
Net Assets | | $ | 21,551 | |
Net Assets Consist of: | | | |
Capital Stock ($.01 par value) | | $ | 21 | |
Additional paid-in capital | | 12,603 | |
Undistributed (accumulated) net investment income | | 132 | |
Undistributed (accumulated) net realized gain from investment securities | | 2,706 | |
Net unrealized appreciation on investment securities | | 6,089 | |
Net Assets | | $ | 21,551 | |
Net Assets by Class: | | | |
Initial Class | | $ | 21,551 | |
Shares Outstanding: | | | |
Initial Class | | 2,088 | |
Net Asset Value and Offering Price Per Share: | | | |
Initial Class | | $ | 10.32 | |
STATEMENT OF OPERATIONS
For the year ended December 31, 2007
(all amounts in thousands)
Investment Income: | | | |
Dividends | | $ | 183 | |
Interest | | 11 | |
| | 194 | |
| | | |
Expenses: | | | |
Management and advisory fees | | 62 | |
Printing and shareholder reports | | 2 | |
Custody fees | | 6 | |
Administration fees | | 4 | |
Audit fees | | 21 | |
Trustees fees | | 1 | |
Other | | 0 | |
Total expenses | | 96 | |
Less management and advisory fee waiver | | (34 | ) |
Net expenses | | 62 | |
Net Investment Income | | 132 | |
Net Realized Gain (Loss) from: | | | |
Investment securities | | 2,749 | |
| | | |
Net Increase (Decrease) in Unrealized Appreciation | | | |
(Depreciation) on: | | | |
Investment securities | | 509 | |
| | | |
Net Realized and Unrealized Gain: | | 3,258 | |
Net Increase In Net Assets Resulting from | | | |
Operations | | $ | 3,390 | |
0 Rounds to less than $1.
The notes to the financial statements are an integral part of this report.
5
Transamerica Equity II
STATEMENT OF CHANGES IN NET ASSETS
For the years ended
(all amounts in thousands)
| | December 31,
2007 | | December 31,
2006 | |
Increase (Decrease) in Net Assets From: | | | | | |
Operations: | | | | | |
Net investment income | | $ | 132 | | $ | 96 | |
Net realized gain from investment securities | | 2,749 | | 1,477 | |
Change in unrealized appreciation on investment securities | | 509 | | 64 | |
| | 3,390 | | 1,637 | |
Distributions to Shareholders: | | | | | |
From net investment income: | | | | | |
Initial Class | | (96 | ) | (68 | ) |
| | (96 | ) | (68 | ) |
From net realized gains: | | | | | |
Initial Class | | (1,477 | ) | (1,387 | ) |
| | (1,477 | ) | (1,387 | ) |
Capital Share Transactions: | | | | | |
Proceeds from shares sold: | | | | | |
Initial Class | | 5 | | 52 | |
| | 5 | | 52 | |
Dividends and distributions reinvested: | | | | | |
Initial Class | | 1,573 | | 1,455 | |
| | 1,573 | | 1,455 | |
Cost of shares redeemed: | | | | | |
Initial Class | | (1,253 | ) | (2,271 | ) |
| | (1,253 | ) | (2,271 | ) |
| | 325 | | (764 | ) |
Net increase (decrease) in net assets | | 2,142 | | (582 | ) |
| | | | | |
Net Assets: | | | | | |
Beginning of year | | 19,409 | | 19,991 | |
End of year | | $ | 21,551 | | $ | 19,409 | |
Undistributed (Accumulated) Net Investment Income (Loss) | | $ | 132 | | $ | 96 | |
Share Activity: | | | | | |
Shares issued: | | — | (a) | 5 | |
Initial Class | | — | (a) | 5 | |
| | | | | |
Shares issued-reinvested from | | | | | |
distributions: | | | | | |
Initial Class | | 168 | | 167 | |
| | 168 | | 167 | |
Shares redeemed: | | | | | |
Initial Class | | (124 | ) | (235 | ) |
| | (124 | ) | (235 | ) |
Net increase (decrease) in shares outstanding: | | | | | |
Initial Class | | 44 | | (63 | ) |
| | 44 | | (63 | ) |
(a) Rounds to less than $1 per share.
The notes to the financial statements are an integral part of this report.
6
Transamerica Equity II
FINANCIAL HIGHLIGHTS
For a share outstanding throughout each period (a)
| | Initial Class | |
| | Year Ended December 31, | | Dec 30 to | |
| | 2007 | | 2006 | | 2005 | | 2004 | | Dec 31, 2003 | |
Net Asset Value | | | | | | | | | | | |
Beginning of period | | $ | 9.50 | | 9.49 | | 11.66 | | 10.02 | | 10.00 | |
Investment Operations | | | | | | | | | | | |
Net investment income (loss) | | 0.06 | | 0.05 | | 0.04 | | 0.09 | | (0.03 | ) |
Net realized and unrealized gain (loss) | | 1.55 | | 0.72 | | 1.62 | | 1.55( | h) | 0.05 | |
Total operations | | 1.61 | | 0.77 | | 1.66 | | 1.64 | | 0.02 | |
Distributions | | | | | | | | | | | |
From net investment income | | (0.05 | ) | (0.04 | ) | (0.14 | ) | — | | — | |
From net realized gains | | (0.74 | ) | (0.72 | ) | (3.69 | ) | — | | — | |
Total distributions | | (0.79 | ) | (0.76 | ) | (3.83 | ) | — | | — | |
Net Asset Value | | | | | | | | | | | |
End of period(b) | | $ | 10.32 | | $ | 9.50 | | $ | 9.49 | | $ | 11.66 | | $ | 10.02 | |
Total Return(c), (d) | | 17.72 | % | 8.76 | % | 17.29 | % | 16.37 | %(h) | 0.20 | % |
Net Assets End of Period (000’s) | | $ | 21,551 | | $ | 19,409 | | $ | 19,991 | | $ | 19,171 | | $ | 85,723 | |
Ratio and Supplemental Data | | | | | | | | | | | |
Expenses to average net assets(e) | | | | | | | | | | | |
After reimbursement/fee waiver(f) | | 0.30 | % | 0.30 | % | 0.30 | % | 0.30 | % | 0 30 | % |
Before reimbursement/fee waiver(g) | | 0.47 | % | 0.45 | % | 0.44 | % | 0.36 | % | 0.34 | % |
Net investment income (loss), to average net assets(e) | | 0.64 | % | 0.49 | % | 0.36 | % | 0.84 | % | (0.30 | )% |
Portfolio turnover rate(d) | | 47 | % | 19 | % | 29 | % | 33 | % | — | % |
(a) Per share information is calculated based on average number of shares outstanding.
(b) Transamerica Equity II (the “Fund”) share class commenced operations as follows: Initial Class - December 30, 2003
(c) Total Return reflects all portfolio expenses and includes reinvestment of dividends and capital gains; it does not reflect the charges and deductions under the policies or annuity contracts.
(d) Not annualized.
(e) Annualized.
(f) Ratio of Net Expenses to Average Net Assets is net of advisory fee waivers (see note 2).
(g) Ratio of Total Expenses to Average Net Assets includes all expenses before advisory fee waivers.
(h) The capital contribution from affiliates is included in net realized and unrealized gain (loss) of $0.21. The capital contribution from affiliates increased total return by 2.10% for the year ended December 31, 2004.
The notes to the financial statements are an integral part of this report.
7
Transamerica Equity II
NOTES TO FINANCIAL STATEMENTS
At December 31, 2007
(all amounts in thousands)
NOTE 1. ORGANIZATION AND SIGNIFICANT ACCOUNTING POLICIES
AEGON/Transamerica Series Trust (“ATST”) is an open-end management investment company registered under the Investment Company Act of 1940, as amended (the “1940 Act”). ATST serves as a funding vehicle for variable life insurance, variable annuity and group annuity products. Transamerica Equity II (the “Fund”) is part of ATST.
In the normal course of business, the Fund enters into contracts that contain a variety of representations that provide general indemnifications. The Fund’s maximum exposure under these arrangements is unknown, as this would involve future claims that may be made against the Fund and/or its affiliates that have not yet occurred. However, based on experience, the Fund expects the risk of loss to be remote.
This report should be read in conjunction with the current Fund prospectus, which contains more complete information about the Fund.
In preparing the Fund’s financial statements in accordance with accounting principles generally accepted in the United States of America (“GAAP”), estimates or assumptions (which could differ from actual results) may be used that affect reported amounts and disclosures. The following is a summary of significant accounting policies followed by the Fund.
Security valuations: The Fund values its investments at the close of the New York Stock Exchange (“NYSE”), normally 4 p.m. ET, each day the NYSE is open for business. Fund investments are valued at the last sale price or closing price on the day of valuation taken from the primary exchange where the security is principally traded.
Securities traded in the over-the-counter market and listed securities for which no sale was reported on that date are valued at the last quoted bid price.
Securities for which quotations are not readily available are valued at fair market value as determined in good faith by the Fund’s Administrative Valuation Committee, using guidelines adopted by the Board of Trustees.
Cash: The Fund may leave cash overnight in its cash account with the custodian, State Street Bank & Trust Company (“State Street”). On July 2, 2007, State Street acquired the parent company of Investors Bank & Trust Company. State Street has been contracted on behalf of the Fund to invest the excess cash into a savings account, which at December 31, 2007 was paying an interest rate of 2.60%.
Security transactions and investment income: Security transactions are recorded on the trade date. Security gains and losses are calculated on the first-in, first-out basis. Dividend income, if any, is recorded on the ex-dividend date or, in the case of foreign securities, as soon as the Fund is informed of the ex-dividend date. Interest income, including accretion of discounts and amortization of premiums, is recorded on the accrual basis commencing on the settlement date.
Dividend distributions: Dividends and capital gains distributions are typically declared and reinvested annually and are generally paid and reinvested on the business day following the ex-date.
NOTE 2. RELATED PARTY TRANSACTIONS
ATST serves as a funding vehicle for certain affiliated asset allocation portfolios and certain affiliated separate accounts of Western Reserve Life Assurance Co. of Ohio, Transamerica Life Insurance Company, Transamerica Financial Life Insurance Company, Inc., Monumental Life Insurance Company and Transamerica Occidental Life Insurance Company.
Transamerica Fund Advisors, Inc. (“TFAI”) is the Fund’s investment adviser. Transamerica Fund Services, Inc. (“TFS”) is the Fund’s administrator and transfer agent. AFSG Securities Corp. (“AFSG”) was the Fund’s distributor. Effective May 1, 2007, Transamerica Capital, Inc. (“TCI”) became the Fund’s distributor. TFAI, TFS, AFSG, and TCI are affiliates of AEGON NV, a Netherlands corporation.
Transamerica Investment Management, LLC is both an affiliate of the Fund and a sub-adviser to the Fund.
Certain officers and trustees of the Fund are also officers and/or directors of TFAI, TFS and TCI.
Investment advisory fee: The Fund pays management fees to TFAI based on average daily net assets (“ANA”) at the following rate:
0.30% of ANA
TFAI has contractually agreed to waive its advisory fee and will reimburse the Fund to the extent that operating expenses, excluding 12b-1 fees, exceed the following stated annual limit:
0.30% Expense Limit
If total Fund expenses fall below the annual expense limitation agreement agreed to by the adviser within the succeeding three years, the Fund may be required to pay the adviser a portion or all of the waived advisory fees.
There were no amounts recaptured during the year ended December 31, 2007. The amounts available for recapture at December 31, 2007 were as follows:
| | Advisory Fee | | Available for | |
| | Waived | | Recapture Through | |
| | | | | |
Fiscal Year 2007: | | $ | 34 | | 12/31/2010 | |
Fiscal Year 2006: | | 30 | | 12/31/2009 | |
Fiscal Year 2005: | | 26 | | 12/31/2008 | |
| | | | | | |
Distribution and service fees: ATST entered into a Distribution Agreement with AFSG dated January 1, 1997, as amended. On May 1, 2007, the Distribution Agreement was amended to replace AFSG with TCI as the Fund’s distributor. The Fund has also adopted a distribution plan (“Distribution Plan”) pursuant to Rule 12b-1 under the 1940 Act.
8
NOTES TO FINANCIAL STATEMENTS (continued)
At December 31, 2007
(all amounts in thousands)
NOTE 2.– (continued)
Under the Distribution Plan, TCI, on behalf of the Fund, is authorized to pay various service providers, as direct payment for expenses incurred in connection with distribution of the Fund’s shares, amounts equal to actual expenses associated with distributing the shares.
The Fund is authorized under the Distribution Plan to pay fees up to a limit of 0.15%.
TCI has determined that it will not seek payment by the Fund of the distribution expenses incurred before April 30, 2009. Prior to TCI seeking reimbursement of future expenses, policy and contract owners will be notified in advance.
Administrative services: The Fund has entered into an agreement with TFS for financial and legal fund administration services. The Fund pays TFS an annual fee of 0.02% of ANA. The Legal fees on the Statement of Operations are for fees paid to external legal counsel.
Deferred compensation plan: Each eligible independent Fund Trustee may elect participation in a non-qualified deferred compensation plan (“the Plan”). Under the Plan, such Trustees may defer payment of all or a portion of their total fees earned as a Fund Trustee. Each Trustee who is a participant in the Plan may elect that the earnings, losses or gains credited to his or her deferred fee amounts be determined based on a deemed investment in any series of Transamerica IDEX Mutual Funds. The right of a participant to receive a distribution from the Plan of the deferred fees is an unsecured claim against the general assets of all series of Transamerica IDEX Mutual Funds. The pro rata liability to the Fund of all deferred fees in the Plan amounted, as of December 31, 2007, to $1. Amounts deferred under the Deferred Compensation Plan are unfunded against the general assets of ATST.
Retirement plan: Under a retirement plan (the “Emeritus Plan”) available to the Independent Trustees, each Independent Trustee is deemed to have elected to serve as Trustee Emeritus of ATST upon his or her termination of service, other than removal for cause, is entitled to 50% of the trustee’s current retainer for a maximum period of five years determined by his or her years of service as a Trustee.
Such amounts shall be accrued by ATST on a pro rata basis allocable to each series of ATST fund based on the relative assets of the series. If retainers increase in the future, past accruals (and credits) will be adjusted upward so that 50% of the Trustee’s current retainer is accrued and credited at all times. Upon death, disability or termination of service, other than removal for cause, amounts deferred become payable to a Trustee Emeritus (or his/her beneficiary). Upon the commencement of service as Trustee Emeritus, compensation will be paid on a quarterly basis during the time period that the Trustee Emeritus is allowed to serve as such.
Amounts accrued under the Emeritus Plan are unsecured claims against the general assets of ATST. For the year ended December 31, 2007, the amount related to the Emeritus Plan was $1. As of December 31, 2007, the Fund has not made any payments related to the Emeritus Plan.
The Emeritus Plan was terminated effective October 30, 2007. Upon the termination, the Fund shall continue to pay any remaining benefits in accordance with the Plan, but no further compensation shall accrue under the Plan.
NOTE 3. INVESTMENT TRANSACTIONS
The cost of securities purchased and proceeds from securities sold (excluding short-term securities) for the year ended December 31, 2007 were as follows:
Purchases of securities: | | | |
Long-term | | $ | 9,494 | |
U.S. Government | | — | |
Proceeds from maturities and sales of securities: | | | |
Long-term | | 10,539 | |
U.S. Government | | — | |
| | | | |
NOTE 4. FEDERAL INCOME TAX MATTERS
The Fund has not made any provision for federal income or excise taxes due to its policy to distribute all of its taxable income and capital gains to its shareholders and otherwise qualify as a regulated investment company under Subchapter M of the Internal Revenue Code. Income and capital gain distributions are determined in accordance with income tax regulations, which may differ from GAAP. These differences are primarily due to differing treatment for items including, but not limited to, wash sales.
The tax character of distributions paid may differ from the character of distributions shown in the Statements of Changes in Net Assets due to short-term gains being treated as ordinary income for tax purposes. The tax character of distributions paid during 2006 and 2007 was as follows:
2006 Distributions paid from: | | | |
Ordinary Income | | $ | 68 | |
Long-term Capital Gain | | 1,387 | |
2007 Distributions paid from: | | | |
Ordinary Income | | 96 | |
Long-term Capital Gain | | 1,477 | |
| | | | |
The tax basis components of distributable earnings as of December 31, 2007 are as follows:
Undistributed Ordinary Income | | $ | 141 | |
Undistributed Long-term Capital Gain | | $ | 2,736 | |
Capital Loss Carryforward | | $ | — | |
Net Unrealized Appreciation (Depreciation) | | $ | 6,050 | |
9
NOTES TO FINANCIAL STATEMENTS (continued)
At December 31, 2007
(all amounts in thousands)
NOTE 5. REGULATORY PROCEEDINGS
There continues to be significant federal and state regulatory activity relating to financial services companies, particularly mutual fund companies and their investment advisers. As part of an ongoing investigation regarding potential market timing, recordkeeping and trading compliance issues and matters affecting the Fund’s investment adviser, TFAI, and certain affiliates and former employees of TFAI, the SEC staff has indicated that it is likely to take some action against TFAI and certain of its affiliates at the conclusion of the investigation. The potential timing and the scope of any such action is difficult to predict. Although the impact of any action brought against TFAI and/or its affiliates is difficult to assess at the present time, the Fund currently believes that the likelihood that any such action will have a material adverse impact on it is remote. It is important to note that the Fund is not aware of any allegation of wrong doing against it and its Board at the time this annual report is printed. Although it is not anticipated that these developments will have an adverse impact on the Fund, there can be no assurance at this time. TFAI and its affiliates are actively working with the SEC in regard to this matter; however, the exact resolution cannot be determined at this time. TFAI will take such actions that it deems necessary or appropriate to continue providing management services to the Fund and to bring all matters to an appropriate conclusion.
TFAI and/or its affiliates, and not the Fund, will bear the costs regarding these regulatory matters.
NOTE 6. RECENTLY ISSUED ACCOUNTING PRONOUNCEMENTS
In July 2006, the Financial Accounting Standards Board (“FASB”) released FASB Interpretation No. 48 “Accounting for Uncertainty in Income Taxes” (“FIN 48”), an interpretation of FASB Statement No. 109. FIN 48 provides guidance for how uncertain tax positions should be recognized, measured, presented and disclosed in the financial statements. FIN 48 requires the accounting and disclosure of tax positions taken or expected to be taken in the course of preparing the Fund’s tax returns to determine whether the tax positions are “more-likely-than-not” of being sustained by the applicable tax authority. Tax positions not deemed to meet the more-likely-than-not threshold would be recorded as a tax benefit or expense in the current year.
Adoption of FIN 48 is effective during the first required financial reporting period for fiscal years beginning after December 15, 2006. Management adopted FIN 48 on June 29, 2007.
Implementation of FIN 48 requires Management of the Fund to analyze all open tax years, as defined by the Statute of Limitations, for all major jurisdictions, which includes federal and certain states. Open tax years are those that are open for exam by taxing authorities (i.e., the last 4 tax year ends and the interim tax period since then). The Fund has no examinations in progress and none are expected at this time.
Management of the Fund has reviewed all open tax years and major jurisdictions and concluded the adoption of FIN 48 resulted in no impact to the Fund’s net assets or results of operations. There is no tax liability resulting from unrecognized tax benefits relating to uncertain income tax positions taken or expected to be taken in future tax returns. The Fund is also not aware of any tax positions for which it is reasonably possible that the total amounts of unrecognized tax benefits will significantly change in the next 12 months.
In September 2006, FASB issued its new Standard No. 157, “Fair Value Measurements” (“FAS 157”). FAS 157 is designed to unify guidance for the measurement of fair value of all types of assets, including financial instruments, and certain liabilities, throughout a number of accounting standards. FAS 157 also establishes a hierarchy for measuring fair value in generally accepted accounting principles and expands financial statement disclosures about fair value measurements that are relevant to mutual funds. FAS 157 is effective for financial statements issued for fiscal years beginning after November 15, 2007, and earlier application is permitted.
As of December 31, 2007, Management does not expect the adoption of FAS 157 to impact the amounts reported in the financial statements, however, additional disclosures will be required about the inputs used to develop the measurements of fair value and the effect of certain of the measurements reported in the statement of operations for a fiscal period.
NOTE 7. SUBSEQUENT EVENT
Effective January 1, 2008, TFAI changed its name to Transamerica Asset Management, Inc.
Effective May 1, 2008, AEGON/Transamerica Series Trust will change its name to Transamerica Series Trust. At that time, the Fund will also change its name to Transamerica Equity II VP.
10
Report of Independent Registered Certified Public Accounting Firm
To the Board of Trustees and Shareholders of Transamerica Equity II:
In our opinion, the accompanying statement of assets and liabilities, including the schedule of investments, and the related statements of operations and of changes in net assets and the financial highlights present fairly, in all material respects, the financial position of Transamerica Equity II (the “Fund”) (one of the portfolios constituting AEGON/Transamerica Series Trust) at December 31, 2007, the results of its operations for the year then ended, the changes in its net assets for each of the two years in the period then ended and the financial highlights for each of the periods presented, in conformity with accounting principles generally accepted in the United States of America. These financial statements and financial highlights (hereafter referred to as “financial statements”) are the responsibility of the Fund’s management; our responsibility is to express an opinion on these financial statements based on our audits. We conducted our audits of these financial statements in accordance with the standards of the Public Company Accounting Oversight Board (United States). Those standards require that we plan and perform the audit to obtain reasonable assurance about whether the financial statements are free of material misstatement. An audit includes examining, on a test basis, evidence supporting the amounts and disclosures in the financial statements, assessing the accounting principles used and significant estimates made by management, and evaluating the overall financial statement presentation. We believe that our audits, which included confirmation of securities at December 31, 2007 by correspondence with the custodian and brokers, provide a reasonable basis for our opinion.

Tampa, Florida
February 29, 2008
11
Transamerica Equity II
SUPPLEMENTAL TAX INFORMATION (unaudited)
(all amounts in thousands)
For tax purposes, the Fund has made a Long-Term Capital Gain Designation of $1,477 for the year ended December 31, 2007.
RESULTS OF SHAREHOLDER PROXY (unaudited)
At a special meeting of shareholders held on October 30, 2007, the results of the Proposals were as follows:
Proposal 1: To elect a new Board:
Proposed Trustee | | For | | Against | | Abstentions/Broker Non-Votes | |
John K. Carter | | 2,274,998,840.817 | | 57,804,698.755 | | 35,433.883 | |
| | | | | | | |
Leo J. Hill | | 2,277,212,702.754 | | 55,590,836.819 | | 35,433.883 | |
| | | | | | | |
Neal M. Jewell | | 2,266,793,295.663 | | 66,010,243.909 | | 35,433.883 | |
| | | | | | | |
Russell A. Kimball, Jr. | | 2,274,825,235.835 | | 57,978,303.737 | | 35,433.883 | |
| | | | | | | |
Eugene M. Mannella | | 2,274,623,165.033 | | 58,180,374.539 | | 35,433.883 | |
| | | | | | | |
Norm R. Nielsen | | 2,275,050,055.885 | | 57,753,483.687 | | 35,433.883 | |
| | | | | | | |
Joyce Galpern Norden | | 2,270,278,122.250 | | 62,525,417.323 | | 35,433.883 | |
| | | | | | | |
Patricia L. Sawyer | | 2,275,737,737.456 | | 57,065,802.116 | | 35,433.883 | |
| | | | | | | |
John W. Waechter | | 2,276,615,120.140 | | 56,188,419.433 | | 35,433.883 | |
Proposal 2: To approve an amendment to the Agreement and Declaration of Trust:
For | | Against | | Abstentions/Broker Non-
Votes | |
2,182,022,669.110 | | 77,590,048.544 | | 73,226,255.801 | |
12
Transamerica Equity II
INVESTMENT ADVISORY AND SUB-ADVISORY AGREEMENTS-REVIEW AND RENEWAL (unaudited)
At a meeting of the Board of Trustees of AEGON/Transamerica Series Trust (“ATST”) held on December 4th, 2007, the Board reviewed and considered the renewal of the investment advisory agreement (the “Investment Advisory Agreement”) between Transamerica Equity II (the “Fund”) and Transamerica Fund Advisors, Inc. (“TFAI”), as well as the renewal of the investment sub-advisory agreement (the “Sub-Advisory Agreement”) of the Fund between TFAI and Transamerica Investment Management, LLC (the “Sub-Adviser”), to determine whether the agreements should be renewed for a six-month period. It was noted that this review was interim in nature to align all the Funds on the same calendar, and that the Funds’ advisory arrangements would be reviewed again in the first half of 2008.
Following their review and consideration, the Trustees determined that the renewal of the Investment Advisory Agreement and the Sub-Advisory Agreement would enable shareholders of the Fund to obtain high quality services at a cost that is appropriate, fair, and in the best interests of its shareholders. The Board, including the independent members of the Board, unanimously approved the renewal of the Investment Advisory Agreement and Sub-Advisory Agreement. In reaching their decision, the Trustees requested and obtained from TFAI and the Sub-Adviser such information as they deemed reasonably necessary to evaluate the agreements, including information about fees and performance of comparable funds managed by the Sub-Adviser. The Trustees also carefully considered information they had previously received from TFAI and the Sub-Adviser throughout the year as part of their regular oversight of the Fund, as well as comparative fee, expense, and performance information prepared by Lipper Inc. (“Lipper”), an independent provider of mutual fund performance, fee and expense information and profitability data prepared by management. In considering the proposed continuation of the Investment Advisory and Sub-Advisory Agreements, the Trustees evaluated a number of considerations that they believed, in light of the legal advice furnished to them by independent legal counsel and their own business judgment, to be relevant. They based their decisions on a variety of factors, including the following considerations, among others, although they did not identify any consideration or particular information that was controlling of their decisions:
The nature, extent and quality of the advisory services to be provided. The Board considered the nature and quality of the services provided by TFAI and the Sub-Adviser to the Fund in the past, as well as the services anticipated to be provided in the future. The Board concluded that TFAI and the Sub-Adviser are capable of providing high quality services to the Fund, as indicated by the nature and quality of services provided in the past by TFAI and the Sub-Adviser for this series and the experience, capability and integrity of TFAI’s senior management, the financial resources of TFAI and the Sub-Adviser, TFAI’s management oversight process and the professional qualifications of the portfolio management team of the Sub-Adviser. The Trustees determined that TFAI and the Sub-Adviser can provide investment and related services that are appropriate in scope and extent in light of the Fund’s operations, the competitive landscape of the investment company business and investor needs.
The investment performance of the Fund. The Board examined the short and longer-term performance of the Fund, including relative performance against a peer universe of comparable mutual funds as prepared by Lipper for various trailing periods ended June 30, 2007. The Board noted that the Fund’s performance was above the median for its peer universe over the past 3-year period. The Board also noted that the Fund’s performance was below the median for its peer universe over the past 1-year period. On the basis of the Board’s assessment of the nature, extent and quality of advisory services to be provided or procured by TFAI and the Sub-Adviser, the Board concluded that TFAI and the Sub-Adviser are capable of providing a level of investment performance that is appropriate in light of the Fund’s proposed investment objectives, policies and strategies and competitive with other similarly situated investment companies.
The cost of advisory services provided and the level of profitability. The Board reviewed profitability information of TFAI’s cost of procuring fund management services, as well as the costs of its provision of administration, fund accounting and other services, to the Fund and to ATST as a whole by TFAI and its affiliates. The Board reviewed the management and sub-advisory fees for the Fund. The Board noted that the Fund’s fees and total expenses were low compared to the Fund’s peer group and universe. Based on their review, the Trustees determined that the management fees of the Fund generally are appropriate in light of the services expected to be provided or procured, the management fees and the anticipated profitability of the relationship between the Fund, TFAI and its affiliates, and the Sub-Adviser. In making these observations and determinations, the Board reviewed, among other things, comparative information provided by Lipper.
Whether fee levels reflect economies of scale and the extent to which economies of scale would be realized as the Fund grows.
In evaluating the extent to which the management fees payable under the Investment Advisory and Sub-Advisory Agreements reflect economies of scale or will permit economies of scale to be realized in the future, the Board considered the specific reasons for the absence of breakpoints, and concluded that the absence of breakpoints was acceptable under the circumstances. The Trustees also concluded that they will have the opportunity to periodically reexamine whether the Fund has achieved economies of scale, and the appropriateness of management fees payable to TFAI and fees paid to the Sub-Adviser, in the future.
Benefits (such as soft dollars) to TFAI, its affiliates, or the Sub-Adviser from their relationship with the Fund. The Board concluded that other benefits anticipated to be derived by TFAI, its affiliates, and the Sub-Adviser from their relationships with the Fund are expected to be reasonable and fair, and consistent with industry practice and the best interests of the Fund and its shareholders. The Trustees noted that TFAI would not realize soft dollar benefits from its relationship with the Fund, and that the Sub-Adviser’s soft dollar trading is consistent with applicable law, including best execution requirements in particular.
Other considerations. The Board determined that TFAI has made a substantial commitment to the recruitment and retention of high quality personnel, and maintains the financial, compliance and operational resources reasonably necessary to manage the Fund in a professional manner that is consistent with the best interests of the Fund and its shareholders. In this regard, the Trustees favorably considered the procedures and policies in place by TFAI to enforce compliance with applicable laws and regulations and oversee the portfolio management activities of the Sub-Adviser. The Trustees also determined that TFAI has made a significant entrepreneurial commitment to the management and success of the Fund, reflected by TFAI’s expense limitation and fee waiver arrangements with the Fund which may result in TFAI waiving a substantial amount of management fees for the benefit of shareholders.
13
Transamerica Growth Opportunities
MARKET ENVIRONMENT
The twelve months ended December 31, 2007, might be described as “a tale of two halves.” Throughout the year, the market struggled against the implications of a weak U.S. housing market, which affects two contributors to economic growth: employment in the home-construction industry; and consumer spending. Despite the softness in housing, stock prices generally advanced through spring, buoyed by stable consumer spending and employment levels, rising global demand for U.S. exports and steady corporate earnings.
By summer rising defaults for sub-prime mortgages triggered a rapid reduction in the availability of credit. Equity market volatility increased dramatically as investors worried how this credit crunch, combined with the housing slump, would affect companies that require large amounts of short-term financing or depend on robust consumer spending. As the period wore on, fresh evidence that the sub-prime and housing problems were spilling over to the broader economy, and that the credit issues will take some time and considerable capital to resolve, weighed on the market. Quarterly earnings growth stalled, particularly in the hard-hit financial sector.
Against this backdrop, growth and value equity returns diverged sharply. Most growth indexes registered positive, even double- digit, returns, while value indexes declined.
PERFORMANCE
For the year ended December 31, 2007, Transamerica Growth Opportunities, Initial Class returned 23.09%. By comparison its benchmark, the Russell Midcap Growth Index, returned 11.43%.
STRATEGY REVIEW
We focus on companies with the potential to outperform over a three- to five-year time horizon, due to a combination of capable management, sustainable competitive advantages, and the ability to benefit from positive secular growth trends. Major themes in recent years have included strong global economic growth and new technologies. This emphasis paid off handsomely during the period.
For example, two of the portfolio’s largest contributors to performance were health care companies involved in the development of new medical products: Intuitive Surgical, Inc. (“Intuitive”) and Covance Inc. (“Covance”) Intuitive designs and manufactures the DaVinci system for robotically assisted, minimally invasive surgery. Rapid sales led to double-digit earning growth during 2007. Covance contracts with pharmaceuticals companies to conduct trials for new pharmaceutical treatments. Its business is growing as major pharmaceutical makers seek to reduce costs through outsourcing.
Other major contributors were companies leveraged to global economic growth and development (e.g., Jacobs Engineering Group Inc. (“Jacobs”) and Cameron International Corporation (“Cameron”). Cameron, which manufactures pressure-control systems used in deep-sea drilling, benefited from strong energy prices and the continued exploration for oil. Jacobs, a designer and manager of large-scale engineering projects worldwide, won new contracts throughout the year.
Key detractors from annual results included VeriFone Holdings, Inc. (“VeriFone”), Macrovision Corporation (“Macrovision”) and Global Payments Inc. (“Global Payments”) VeriFone, an electronics payment company, caught investors off guard with an announcement of accounting irregularities relating in part to a merger than occurred in 2006. We exited the position. Macrovision, which provides copy protection and other rights management technologies to entertainment companies, also surprised investors, by reporting a large and complicated acquisition. Though the acquisition may have long-term strategic advantages, the costs will likely reduce Macrovision’s free cash flow in the nearer term. We pared the position. As for Global Payments, a credit card processing company, we sold our holdings early in the year because the secular drivers of growth for its business were waning.
John Huber, CFA
Edward S. Han
Co-Portfolio Managers
Transamerica Investment Management, LLC
AEGON/Transamerica Series Trust | | Annual Report 2007 |
| | |
1
Transamerica Growth Opportunities
(unaudited)
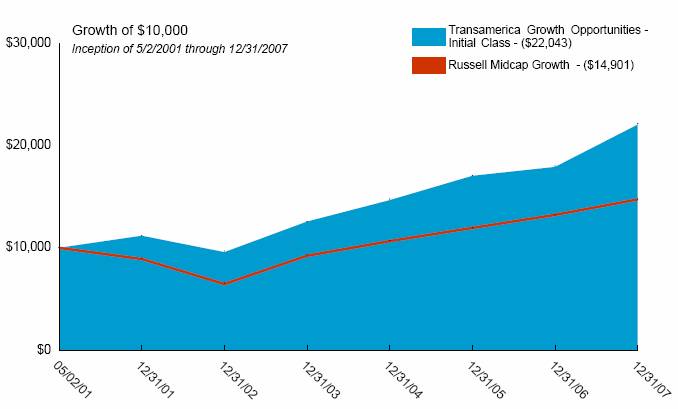
Average Annual Total Return for Periods Ended 12/31/2007
| | | | | | From | | Inception | |
| | 1 Year | | 5 Years | | Inception | | Date | |
| | | | | | | | | |
Initial Class | | 23.09 | % | 18.14 | % | 12.58 | % | 5/2/01 | |
Russell Midcap Growth (1) | | 11.43 | % | 17.90 | % | 6.16 | % | 5/2/01 | |
Service Class | | 22.74 | % | — | % | 18.49 | | 5/1/03 | |
NOTES
(1) The Russell Midcap Growth (Russell Midcap Growth) Index is an unmanaged index used as a general measure of market performance. Calculations assume dividends and capital gains are reinvested and do not include any managerial expenses. From inception calculation is based on life of Initial Class shares.
The performance data presented represents past performance, future results may vary. The portfolio’s investment return and net asset value will fluctuate. Past performance does not guarantee future results. Investor’s units when redeemed, may be worth more or less than their original cost.
Current performance may be lower or higher than performance quoted. Please visit your insurance company’s website for contract or policy level standardized total returns current to the most recent month end. Portfolio performance is net of investment fees and fund expenses, but not product charges, which, if included, would significantly lower the performance quoted.
This material must be preceded or accompanied by a current prospectus, which includes specific contents regarding the investment objectives, explanation of share classes and policies of this portfolio.
2
Transamerica Growth Opportunities
UNDERSTANDING YOUR FUND’S EXPENSES
(unaudited)
SHAREHOLDER EXPENSES
Fund shareholders may incur ongoing costs, including management and advisory fees, distribution and service fees, and other fund expenses.
The following Example is intended to help you understand your ongoing costs (in dollars and cents) of investing in the Fund and to compare these costs with the ongoing costs of investing in other funds.
The Example is based on an investment of $1,000 invested at July 1, 2007 and held for the entire period until December 31, 2007.
ACTUAL EXPENSES
The first line in the table below provides information about actual account values and actual expenses. You may use the information in this line, together with the amount you invested, to estimate the expenses that you paid over the period. Simply divide your account value by $1,000 (for example, an $8,600 account value divided by $1,000 = 8.6), then multiply the result by the number in the first line of your Fund under the heading entitled “Expenses Paid During Period” to estimate the expenses you paid on your account during this period. If your account is an IRA, your expenses could have included a $15 annual fee. The amount of any fee paid through your account would increase the estimate of expenses you paid during the period and decrease your ending account value.
HYPOTHETICAL EXAMPLE FOR COMPARISON PURPOSES
The second line in the table below provides information about hypothetical account values and hypothetical expenses based on the Fund’s actual expense ratio and an assumed rate of return of 5% per year before expenses, which is not the Fund’s actual return. The hypothetical account values and expenses may not be used to estimate the actual ending account balance or expenses you paid for the period. You may use this information to compare the ongoing costs of investing in your Fund and other funds. To do so, compare this 5% hypothetical example with the 5% hypothetical examples that appear in the shareholder reports of the other funds.
Please note that the expenses shown in the table are meant to highlight your ongoing costs only and do not reflect any transactional costs, such as sales charges, redemption fees, brokerage commissions paid on purchases and sales of fund shares. Therefore, the second line under the Fund in the table is useful in comparing ongoing costs only, and will not help you determine the relative total costs of owning different funds. If any of these transaction costs were included, your costs would be higher. The expenses shown in the table do not reflect any fees that may be charged to you by brokers, financial intermediaries or other financial institutions.
| | Beginning
Account
Value | | Ending
Account
Value | | Annualized
Expense
Ratio | | Expenses
Paid During
Period (a) | |
| | | | | | | | | |
Initial Class | | | | | | | | | |
Actual | | $ | 1,000.00 | | $ | 1,134.36 | | 0.83 | % | $ | 4.47 | |
Hypothetical (b) | | 1,000.00 | | 1,021.02 | | 0.83 | | 4.23 | |
| | | | | | | | | |
Service Class | | | | | | | | | |
Actual | | 1,000.00 | | 1,133.19 | | 1.08 | | 5.81 | |
Hypothetical (b) | | 1,000.00 | | 1,019.76 | | 1.08 | | 5.50 | |
| | | | | | | | | | | | |
(a) | Expenses are calculated using the Fund’s annualized expense ratio (as disclosed in the table), multiplied by the average account value for the period, multiplied by the number of days in the period (184 days), and divided by the number of days in the year (365 days). |
| |
(b) | 5% return per year before expenses. |
GRAPHICAL PRESENTATION OF SCHEDULE OF INVESTMENTS
By Sector
At December 31, 2007
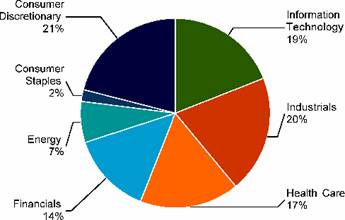
This chart shows the percentage breakdown by sector of the Fund’s total investment securities.
3
Transamerica Growth Opportunities
SCHEDULE OF INVESTMENTS
At December 31, 2007
(all amounts except share amounts in thousands)
| | Shares | | Value | |
COMMON STOCKS (95.8%) | | | | | |
Aerospace & Defense (1.0%) | | | | | |
Rockwell Collins, Inc. | | 68,630 | | $ | 4,939 | |
Air Freight & Logistics (3.3%) | | | | | |
Expeditors International Washington, Inc. | | 368,600 | | 16,469 | |
Auto Components (3.7%) | | | | | |
BorgWarner, Inc. | | 386,600 | | 18,715 | |
Capital Markets (6.3%) | | | | | |
Ameriprise Financial, Inc. | | 252,540 | | 13,917 | |
T. Rowe Price Group, Inc. | | 291,650 | | 17,756 | |
Commercial Banks (1.1%) | | | | | |
Signature Bank ‡ | | 160,500 | | 5,417 | |
Commercial Services & Supplies (0.5%) | | | | | |
Costar Group, Inc. ‡ | | 50,000 | | 2,363 | |
Communications Equipment (1.8%) | | | | | |
Foundry Networks, Inc. ‡ | | 381,000 | | 6,675 | |
Riverbed Technology, Inc. ‡ | | 86,000 | | 2,300 | |
Construction & Engineering (4.3%) | | | | | |
Jacobs Engineering Group, Inc. ‡ | | 226,000 | | 21,608 | |
Diversified Consumer Services (3.5%) | | | | | |
Strayer Education, Inc. ^ | | 104,000 | | 17,740 | |
Diversified Financial Services (5.7%) | | | | | |
CME Group, Inc. Class A | | 21,140 | | 14,502 | |
Nymex Holdings, Inc. ^ | | 106,445 | | 14,222 | |
Electrical Equipment (0.5%) | | | | | |
Sunpower Corp. Class A ‡^ | | 21,200 | | 2,764 | |
Electronic Equipment & Instruments (2.7%) | | | | | |
Trimble Navigation, Ltd. ‡ | | 458,000 | | 13,850 | |
Energy Equipment & Services (5.2%) | | | | | |
Cameron International Corp. ‡ | | 375,800 | | 18,087 | |
Core Laboratories NV ‡ | | 65,800 | | 8,207 | |
Food & Staples Retailing (2.0%) | | | | | |
Whole Foods Market, Inc. ^ | | 244,700 | | 9,984 | |
Health Care Equipment & Supplies (9.0%) | | | | | |
Arthrocare Corp. ‡^ | | 186,300 | | 8,952 | |
Hologic, Inc. ‡^ | | 81,300 | | 5,580 | |
Idexx Laboratories, Inc. ‡ | | 68,000 | | 3,987 | |
Intuitive Surgical, Inc. ‡^ | | 65,700 | | 21,319 | |
Varian Medical Systems, Inc. ‡ | | 110,500 | | 5,764 | |
Health Care Technology (2.5%) | | | | | |
Cerner Corp. ‡^ | | 226,000 | | 12,747 | |
Hotels, Restaurants & Leisure (3.8%) | | | | | |
Burger King Holdings, Inc. | | 46,000 | | $ | 1,312 | |
International Game Technology | | 274,300 | | 12,050 | |
Las Vegas Sands Corp. ‡^ | | 58,000 | | 5,977 | |
Household Durables (0.7%) | | | | | |
Harman International Industries, Inc. | | 48,500 | | 3,575 | |
Internet Software & Services (1.2%) | | | | | |
Valueclick, Inc. ‡^ | | 288,500 | | 6,318 | |
IT Services (2.1%) | | | | | |
NeuStar, Inc. Class A ‡^ | | 367,500 | | 10,540 | |
Life Sciences Tools & Services (5.3%) | | | | | |
Covance, Inc. ‡ | | 219,780 | | 19,037 | |
Techne Corp. ‡ | | 116,454 | | 7,692 | |
Machinery (6.5%) | | | | | |
Donaldson Co., Inc. | | 9,526 | | 442 | |
Joy Global, Inc. | | 246,500 | | 16,224 | |
Kennametal, Inc. | | 425,824 | | 16,122 | |
Media (3.1%) | | | | | |
Lamar Advertising Co. Class A ^ | | 324,700 | | 15,608 | |
Multiline Retail (2.8%) | | | | | |
Saks, Inc. ‡^ | | 692,400 | | 14,374 | |
Oil, Gas & Consumable Fuels (1.7%) | | | | | |
Range Resources Corp. | | 168,500 | | 8,654 | |
Semiconductors & Semiconductor Equipment (3.1%) | | | | | |
NVIDIA Corp. ‡ | | 140,000 | | 4,763 | |
Sirf Technology Holdings, Inc. ‡^ | | 432,200 | | 10,861 | |
Software (7.0%) | | | | | |
Activision, Inc. ‡ | | 405,235 | | 12,036 | |
Intuit, Inc. ‡ | | 210,000 | | 6,638 | |
Macrovision Corp. ‡^ | | 391,000 | | 7,167 | |
Salesforce.Com, Inc. ‡^ | | 152,500 | | 9,560 | |
Specialty Retail (2.3%) | | | | | |
Guess?, Inc. ^ | | 301,500 | | 11,424 | |
Trading Companies & Distributors (3.1%) | | | | | |
WW Grainger, Inc. | | 180,050 | | 15,758 | |
Total Common Stocks (cost $402,987) | | | | 483,996 | |
| | | | | |
Total Securities Lending Collateral (cost $118,683) (1) | | | | 118,683 | |
| | | | | |
Total Investment Securities (cost $521,670) # | | | | $ | 602,679 | |
NOTES TO SCHEDULE OF INVESTMENTS:
^ | At December 31, 2007, all or a portion of this security is on loan (see Note 1). The value at December 31, 2007, of all securities on loan is $114,983. |
‡ | Non-Income Producing. |
(1) | Cash collateral for the Repurchase Agreements, valued at $43,021, that serves as collateral for securities lending, is invested in corporate bonds with interest rates and maturity dates ranging from 3.00% - 10.18% and 04/28/2008 - 12/01/2096, respectively. |
# | Aggregate cost for federal income tax purposes is $521,901. Aggregate gross unrealized appreciation for all securities in which there is an excess of value over tax cost and aggregate gross unrealized depreciation for all securities in which there is an excess of tax cost over value were $95,800 and $15,022, respectively. Net unrealized appreciation for tax purposes is $80,778. |
The notes to the financial statements are an integral part of this report.
4
Transamerica Growth Opportunities
STATEMENT OF ASSETS AND LIABILITIES
At December 31, 2007
(all amounts except per share amounts in thousands)
Assets: | | | |
Investment securities, at value (cost: $521,670)
(including securities loaned of $114,983) | | $ | 602,679 | |
Cash | | 21,215 | |
Receivables: | | | |
Shares sold | | 437 | |
Interest | | 68 | |
Income from loaned securities | | 21 | |
Dividends | | 452 | |
| | 624,872 | |
Liabilities: | | | |
Investment securities purchased | | 357 | |
Accounts payable and accrued liabilities: | | | |
Shares redeemed | | 156 | |
Management and advisory fees | | 336 | |
Distribution and service fees | | 4 | |
Administration fees | | 9 | |
Payable for collateral for securities on loan | | 118,683 | |
Other | | 103 | |
| | 119,648 | |
Net Assets | | $ | 505,224 | |
| | | |
Net Assets Consist of: | | | |
Capital Stock ($.01 par value) | | $ | 278 | |
Additional paid-in capital | | 340,665 | |
Undistributed (accumulated) net realized gain from investment securities | | 83,272 | |
Net unrealized appreciation on investment securities | | 81,009 | |
Net Assets | | $ | 505,224 | |
Net Assets by Class: | | | |
Initial Class | | $ | 485,162 | |
Service Class | | 20,062 | |
Shares Outstanding: | | | |
Initial Class | | 26,688 | |
Service Class | | 1,114 | |
Net Asset Value and Offering Price Per Share: | | | |
Initial Class | | $ | 18.18 | |
Service Class | | 18.00 | |
STATEMENT OF OPERATIONS
For the year ended December 31, 2007
(all amounts in thousands)
Investment Income: | | | |
Dividends | | $ | 2,645 | |
Interest | | 529 | |
Income from loaned securities-net | | 395 | |
| | 3,569 | |
Expenses: | | | |
Management and advisory fees | | 3,682 | |
Printing and shareholder reports | | 74 | |
Custody fees | | 53 | |
Administration fees | | 95 | |
Legal fees | | 10 | |
Audit fees | | 20 | |
Trustees fees | | 16 | |
Distribution and service fees | | | |
Service Class | | 43 | |
Other | | 7 | |
Total expenses | | 4,000 | |
| | | |
Net Investment Loss | | (431 | ) |
| | | |
Net Realized Gain (Loss) from: | | | |
Investment securities | | 98,220 | |
| | | |
Net Increase (Decrease) in Unrealized Appreciation (Depreciation) on: | | | |
Investment securities | | (310 | ) |
| | | |
Net Realized and Unrealized Gain: | | 97,910 | |
Net Increase In Net Assets Resulting from Operations | | $ | 97,479 | |
The notes to the financial statements are an integral part of this report.
5
Transamerica Growth Opportunities
STATEMENT OF CHANGES IN NET ASSETS
For the years ended
(all amounts in thousands)
| | Year Ended | | Year Ended | |
| | December 31, | | December 31, | |
| | 2007 | | 2006 | |
Increase (Decrease) in Net Assets From: | | | | | |
Operations: | | | | | |
Net investment income (loss) | | $ | (431 | ) | $ | 210 | |
Net realized gain from investment securities | | 98,220 | | 45,992 | |
Change in unrealized (depreciation) on investment securities | | (310 | ) | (25,363 | ) |
Net increase (decrease) in net assets resulting from operations | | 97,479 | | 20,839 | |
Distributions to Shareholders: | | | | | |
From net investment income: | | | | | |
Initial Class | | (211 | ) | (1,141 | ) |
Service Class | | — | | (13 | ) |
| | (211) | | (1,154 | ) |
From net realized gains: | | | | | |
Initial Class | | (33,887 | ) | (12,967 | ) |
Service Class | | (1,235 | ) | (442 | ) |
| | (35,122) | | (13,409 | ) |
Capital Share Transactions: | | | | | |
Proceeds from shares sold: | | | | | |
Initial Class | | 51,567 | | 98,842 | |
Service Class | | 10,479 | | 8,310 | |
| | 62,046 | | 107,152 | |
Dividends and distributions reinvested: | | | | | |
Initial Class | | 34,097 | | 14,108 | |
Service Class | | 1,235 | | 455 | |
| | 35,332 | | 14,563 | |
Cost of shares redeemed: | | | | | |
Initial Class | | (139,495 | ) | (85,682 | ) |
Service Class | | (10,615 | ) | (7,240 | ) |
| | (150,110 | ) | (92,922 | |
| | (52,732 | | 28,793 | |
Net increase (decrease) in net assets | | 9,414 | | 35,069 | |
| | | | | |
Net Assets: | | | | | |
Beginning of year | | 495,810 | | 460,741 | |
End of year | | $ | 505,224 | | $ | 495,810 | |
Undistributed (Accumulated) Net Investment Income (Loss) | | $ | — | | $ | 210 | |
Share Activity: | | | | | |
Shares issued: | | | | | |
Initial Class | | 2,957 | | 5,979 | |
Service Class | | 600 | | 522 | |
| | 3,557 | | 6,501 | |
Shares issued-reinvested from | | | | | |
distributions: | | | | | |
Initial Class | | 2,031 | | 962 | |
Service Class | | 74 | | 31 | |
| | 2,105 | | 993 | |
Shares redeemed: | | | | | |
Initial Class | | (8,245 | ) | (5,407 | ) |
Service Class | | (620 | ) | (453 | ) |
| | (8,865) | | (5,860 | ) |
Net increase (decrease) in shares outstanding: | | | | | |
Initial Class | | (3,257 | ) | 1,534 | |
Service Class | | 54 | | 100 | |
| | (3,203) | | 1,634 | |
The notes to the financial statements are an integral part of this report.
6
Transamerica Growth Opportunities
FINANCIAL HIGHLIGHTS
For a share outstanding throughout each period(a)
| | Initial Class | | |
| | Year Ended December 31, | | |
| | 2007 | | 2006 | | 2005 | | 2004 | | 2003 | | |
Net Asset Value | | | | | | | | | | | | |
Beginning of period | | $ | 16.00 | | $ | 15.69 | | $ | 14.66 | | $ | 12.57 | | $ | 9.58 | |
Investment Operations | | | | | | | | | | | | |
Net investment income (loss) | | (0.01 | ) | 0.01 | | 0.04 | | — | (f) | (0.02 | ) | |
Net realized and unrealized gain (loss) | | 3.58 | | 0.76 | | 2.18 | | 2.09 | | 3.01 | | |
Total operations | | 3.57 | | 0.77 | | 2.22 | | 2.09 | | 2.99 | | |
Distributions | | | | | | | | | | | | |
From net investment income | | (0.01 | ) | (0.04 | ) | — | | — | | — | | |
From net realized gains | | (1.38 | ) | (0.42 | ) | (1.19 | ) | — | | — | | |
Total distributions | | (1.39 | ) | (0.46 | ) | (1.19 | ) | — | | — | | |
Net Asset Value | | | | | | | | | | | | |
End of period(b) | | $ | 18.18 | | $ | 16.00 | | $ | 15.69 | | $ | 14.66 | | $ | 12.57 | | |
Total Return(c)(d) | | 23.09 | % | 5.10 | % | 16.23 | % | 16.63 | % | 31.21 | % | |
Net Assets End of Period (000’s) | | $ | 485,162 | | $ | 478,963 | | $ | 445,761 | | $ | 416,126 | | $ | 242,433 | | |
Ratio and Supplemental Data | | | | | | | | | | | | |
Expenses to average net assets(e) | | 0.83 | % | 0.84 | % | 0.86 | % | 0.88 | % | 0.90 | % | |
Net investment income (loss), to average net assets(e) | | (0.08) | % | 0.05 | % | 0.30 | % | –– | %(f) | (0.16) | % | |
Portfolio turnover rate(d) | | 73 | % | 68 | % | 44 | % | 63 | % | 23 | % | |
| | | | | | | | | | | | | | | | | | | | | |
For a share outstanding throughout each period(a)
| | Service Class | |
| | Year Ended December 31, | | May 1 to Dec | |
| | 2007 | | 2006 | | 2005 | | 2004 | | 31, 2003 | |
Net Asset Value | | | | | | | | | | | |
Beginning of period | | $ | 15.88 | | $ | 15.59 | | $ | 14.61 | | $ | 12.54 | | $ | 9.87 | |
Investment Operations | | | | | | | | | | | |
Net investment income (loss) | | (0.06 | ) | (0.03 | ) | — | (f) | (0.04 | ) | (0.02 | ) |
Net realized and unrealized gain (loss) | | 3.56 | | 0.75 | | 2.17 | | 2.11 | | 2.69 | |
Total operations | | 3.50 | | 0.72 | | 2.17 | | 2.07 | | 2.67 | |
Distributions | | | | | | | | | | | |
From net investment income | | — | | (0.01 | ) | — | | — | | — | |
From net realized gains | | (1.38 | ) | (0.42 | ) | (1.19 | ) | — | | — | |
Total distributions | | (1.38 | ) | (0.43 | ) | (1.19 | ) | — | | — | |
Net Asset Value | | | | | | | | | | | |
End of period(b) | | $ | 18.00 | | $ | 15.88 | | $ | 15.59 | | $ | 14.61 | | $ | 12.54 | |
Total Return(c), (d) | | 22.74 | % | 4.90 | % | 15.93 | % | 16.51 | % | 27.05 | % |
Net Assets End of Period (000’s) | | $ | 20,062 | | $ | 16,847 | | $ | 14,980 | | $ | 7,545 | | $ | 619 | |
Ratio and Supplemental Data | | | | | | | | | | | |
Expenses to average net assets(e) | | 1.08 | % | 1.09 | % | 1.11 | % | 1.14 | % | 1.15 | % |
Net investment income (loss), to average net assets(e) | | (0.33 | )% | (0.20 | )% | 0.03 | % | (0.31 | )% | (0.22 | )% |
Portfolio turnover rate(d) | | 73 | % | 68 | % | 44 | % | 63 | % | 23 | % |
(a) | Per share information is calculated based on average number of shares outstanding. |
(b) | Transamerica Growth Opportunities (the “Fund”) share classes commenced operations as follows: |
| Initial Class - May 2, 2001 |
| Service Class - May 1, 2003 |
(c) | Total Return reflects all portfolio expenses and includes reinvestment of dividends and capital gains; it does not reflect the charges and deductions under the policies or annuity contracts. |
(d) | Not annualized |
(e) | Annualized. |
(f) | Amounts round to less than $0.01 or 0.01%. |
The notes to the financial statements are an integral part of this report.
7
Transamerica Growth Opportunities
NOTES TO FINANCIAL STATEMENTS
At December 31, 2007
(all amounts in thousands)
NOTE 1. ORGANIZATION AND SIGNIFICANT ACCOUNTING POLICIES
AEGON/Transamerica Series Trust (“ATST”) is an open-end management investment company registered under the Investment Company Act of 1940, as amended (the “1940 Act”). ATST serves as a funding vehicle for variable life insurance, variable annuity and group annuity products. Transamerica Growth Opportunities (the “Fund”) is part of ATST.
In the normal course of business, the Fund enters into contracts that contain a variety of representations that provide general indemnifications. The Fund’s maximum exposure under these arrangements is unknown, as this would involve future claims that may be made against the Fund and/or its affiliates that have not yet occurred. However, based on experience, the Fund expects the risk of loss to be remote.
This report should be read in conjunction with the current Fund prospectus, which contains more complete information about the Fund.
In preparing the Fund’s financial statements in accordance with accounting principles generally accepted in the United States of America (“GAAP”), estimates or assumptions (which could differ from actual results) may be used that affect reported amounts and disclosures. The following is a summary of significant accounting policies followed by the Fund.
Multiple class operations, income and expenses: The Fund currently offers two classes of shares, an Initial Class and a Service Class. Income, non-class specific expenses and realized and unrealized gains and losses, are allocated daily to each class, based upon the value of shares outstanding method as permitted under Rule 18f-3 of the 1940 Act. Each class bears its own specific expenses as well as a portion of general, common expenses.
Security valuations: The Fund values its investments at the close of the New York Stock Exchange (“NYSE”), normally 4 p.m. ET, each day the NYSE is open for business. Fund investments are valued at the last sale price or closing price on the day of valuation taken from the primary exchange where the security is principally traded.
Securities traded in the over-the-counter market and listed securities for which no sale was reported on that date are valued at the last quoted bid price.
Debt securities are valued based on a price quotation or other equivalent indication of value supplied by an exchange, a pricing service or a major market maker; however, those that mature in sixty days or less are valued at amortized cost, which approximates market.
Investment company securities are valued at the net asset value of the underlying portfolio.
Foreign securities generally are valued based on quotations from the primary market in which they are traded. Because many foreign securities markets and exchanges close prior to the close of the NYSE, closing prices for foreign securities in those markets or on those exchanges do not reflect the events that occur after that close. If a significant market event impacting the value of a portfolio security (e.g., natural disaster, company announcement, market volatility) occurs subsequent to the close of trading in the security, but prior to the calculation of the Fund’s net asset value per share, market quotations for that security may be determined to be unreliable and, accordingly, not “readily available.” As a result, foreign equity securities held by the Fund may be valued at fair market value as determined in good faith by the Fund’s Administrative Valuation Committee, under the supervision of the Board’s Valuation Committee, using guidelines adopted by the Board of Trustees.
Other securities for which quotations are not readily available are valued at fair market value as determined in good faith by the Fund’s Administrative Valuation Committee, using guidelines adopted by the Board of Trustees.
Cash: The Fund may leave cash overnight in its cash account with the custodian, State Street Bank & Trust Company (“State Street”). On July 2, 2007, State Street acquired the parent company of Investors Bank & Trust Company. State Street has been contracted on behalf of the Fund to invest the excess cash into a savings account, which at December 31, 2007 was paying an interest rate of 2.60%.
Repurchase agreements: The Fund is authorized to enter into repurchase agreements. The Fund, through its custodian, State Street, receives delivery of the underlying securities, the value of which at the time of purchase is required to be an amount equal to at least 100% of the resale price. The Fund will bear the risk of value fluctuations until the security can be sold and may encounter delays and incur costs in liquidating the security. In the event of bankruptcy or insolvency of the seller, delays and costs may be incurred.
Commission recapture: The sub-adviser, to the extent consistent with the best execution and usual commission rate policies and practices, may place security transactions of the Fund with broker/dealers with which ATST has established a Commission Recapture Program. A Commission Recapture Program is any arrangement under which a broker/dealer applies a portion of the commissions received by such broker/dealer on the security transactions to the Fund. In no event will commissions paid by the Fund be used to pay expenses that would otherwise be borne by any other funds within ATST, or by any other party.
Recaptured commissions during the year ended December 31, 2007 of $47 are included in net realized gains in the Statement of Operations.
8
NOTES TO FINANCIAL STATEMENTS (continued)
At December 31, 2007
(all amounts in thousands)
NOTE 1.–(continued)
Securities lending: The Fund may lend securities to qualified borrowers, with State Street acting as the Fund’s lending agent. The Fund earns negotiated lenders’ fees. The Fund receives cash and/or securities as collateral against the loaned securities. Cash collateral received is invested in short-term, interest-bearing securities. The Fund monitors the market value of securities loaned on a daily basis and requires collateral in an amount at least equal to the value of the securities loaned. Income from loaned securities earned by State Street for its services, shown in the Statement of Operations is net of fees, in the amount of $169, earned by State Street for its services.
The Fund has invested the cash collateral received from securities loaned in the following short-term, interest-bearing securities:
Abbey National PLC, Eurodollar Term, 5.00%, 1/7/2008 | $ | 5,123 | |
ABN AMRO Bank NV, Eurodollar Term, 5.18%, 1/4/2008 | 4,098 | |
Bank of Nova Scotia, Eurodollar Term, 4.96%, 1/22/2008 | 3,586 | |
Barclays, Eurodollar Term, 5.00%, 2/12/2008 | 7,172 | |
BNP Paribas, Eurodollar Term, 5.01%, 1/11/2008 | 6,660 | |
Calyon, Eurodollar Term, 5.12%, 3/3/2008 | 1,537 | |
Credit Suisse First Boston Corp., Repurchase Agreement, 4.60%, 1/2/2008 | 13,320 | |
Dexia Group, Eurodollar Term, 4.82%, 1/3/2008 | 5,123 | |
HBOS Halifax Bank of Scotland, Eurodollar Term, 5.15%, 1/2/2008 | 2,561 | |
JPMorgan Chase & Co., Eurodollar Term, 5.15%, 2/12/2008 | 2,561 | |
Lloyds TSB Bank, Eurodollar Term, 5.15%, 1/24/2008 | 5,123 | |
Merrill Lynch & Co. (RPG), Repurchase Agreement, 4.60%, 1/2/2008 | 7,685 | |
Morgan Stanley & Co. (Corp. Repo), Repurchase Agreement, 4.60%, 1/2/2008 | 21,004 | |
Rabobank Nederland, Eurodollar Term, 5.08%, 1/10/2008 | 6,148 | |
Reserve Primary Money Market Fund, 4.95% | 5,464 | |
Royal Bank of Scotland, Eurodollar Term, 5.00%, 2/25/2008 | 6,148 | |
Societe Generale, Eurodollar Term, 5.15%, 3/3/2008 | 3,074 | |
Toronto Dominion Bank, Eurodollar Term, 5.05%, 1/10/2008 | 6,148 | |
UBS AG, Eurodollar Term, 4.92%, 1/11/2008 | 3,586 | |
Wells Fargo, Bank Note, 4.75%, 1/8/2008 | 2,562 | |
| $ | 118,683 | |
Security transactions and investment income: Security transactions are recorded on the trade date. Security gains and losses are calculated on the first-in, first-out basis. Dividend income, if any, is recorded on the ex-dividend date or, in the case of foreign securities, as soon as the Fund is informed of the ex-dividend date. Interest income, including accretion of discounts and amortization of premiums, is recorded on the accrual basis commencing on the settlement date.
Dividend distributions: Dividends and capital gains distributions are typically declared and reinvested annually and are generally paid and reinvested on the business day following the ex-date.
NOTE 2. RELATED PARTY TRANSACTIONS
ATST serves as a funding vehicle for certain affiliated asset allocation portfolios and certain affiliated separate accounts of Western Reserve Life Assurance Co. of Ohio, Transamerica Life Insurance Company, Transamerica Financial Life Insurance Company, Inc., Monumental Life Insurance Company and Transamerica Occidental Life Insurance Company.
Transamerica Fund Advisors, Inc. (“TFAI”) is the Fund’s investment adviser. Transamerica Fund Services, Inc. (“TFS”) is the Fund’s administrator and transfer agent. Prior to May 1, 2007, AFSG Securities Corp. (“AFSG”), was the Fund’s distributor. Transamerica Capital Inc. (“TCI”) is now the Fund’s distributor. TFAI, TFS, AFSG, and TCI are affiliates of AEGON NV, a Netherlands corporation.
Transamerica Investment Management, LLC (“TIM”) is both an affiliate of the Fund and a sub-adviser to the Fund.
Certain officers and trustees of the Fund are also officers and/or directors of TFAI, TFS and TCI.
The following schedule reflects the percentage of Fund assets owned by affiliated investment companies at December 31, 2007:
| | Net
Assets | | % of Net
Assets | |
Asset Allocation-Conservative Portfolio | | $ | 13,323 | | 2.64 | % |
Asset Allocation-Growth Portfolio | | 36,340 | | 7.19 | |
Asset Allocation-Moderate Growth Portfolio | | 114,896 | | 22.74 | |
Asset Allocation-Moderate Portfolio | | 77,606 | | 15.36 | |
Total | | $ | 242,165 | | 47.93 | % |
Investment advisory fee: The Fund pays management fees to TFAI based on average daily net assets (“ANA”) at the following breakpoints:
0.80% of the first $250 million of ANA
0.75% of the next $250 million of ANA
0.70% of ANA over $500 million
TFAI has contractually agreed to waive its advisory fee and will reimburse the Fund to the extent that operating expenses, excluding 12b-1 fees, exceed the following stated annual limit:
1.15% Expense Limit
If total Fund expenses fall below the annual expense limitation agreement agreed to by the adviser within the succeeding three years, the Fund may be required to pay the adviser a portion or all of the waived advisory fees.
There were no amounts recaptured during the year ended December 31, 2007. There are no amounts available for recapture at December 31, 2007.
9
NOTES TO FINANCIAL STATEMENTS (continued)
At December 31, 2007
(all amounts in thousands)
NOTE 2.–(continued)
Distribution and service fees: ATST entered into a Distribution Agreement with AFSG dated January 1, 1997, as amended. On May 1, 2007, the Distribution Agreement was amended to replace AFSG with TCI as the Fund’s distributor. The Fund has also adopted a distribution plan (“Distribution Plan”) pursuant to Rule 12b-1 under the 1940 Act.
Under the Distribution Plan for the Initial Class shares, TCI, on behalf of the Fund, is authorized to pay various service providers, as direct payment for expenses incurred in connection with distribution of the Fund’s shares, amounts equal to actual expenses associated with distributing the shares.
The Distribution Plan for the Service Class shares requires ATST to pay distribution fees to TCI as compensation for its activities, not as reimbursement for specific expenses. The fee on the Service Class is paid to the insurance companies for providing services and account maintenance for their policyholders who invest in the variable insurance products which invest in the Service Class shares.
The Fund is authorized under the Distribution Plan to pay fees on each class up to the following limits:
Initial Class | | 0.15 | % |
Service Class | | 0.25 | % |
TCI has determined that it will not seek payment by the Fund of the distribution expenses incurred with respect to the Initial Class shares before April 30, 2009. Prior to TCI seeking reimbursement of future expenses, policy and contract owners will be notified in advance. The Fund will pay fees relating to Service Class shares.
Administrative services: The Fund has entered into an agreement with TFS for financial and legal fund administration services. The Fund pays TFS an annual fee of 0.02% of ANA. The Legal fees on the Statement of Operations are for fees paid to external legal counsel.
Deferred compensation plan: Each eligible independent Fund Trustee may elect participation in a non-qualified deferred compensation plan (“the Plan”). Under the Plan, such Trustees may defer payment of all or a portion of their total fees earned as a Fund Trustee. Each Trustee who is a participant in the Plan may elect that the earnings, losses or gains credited to his or her deferred fee amounts be determined based on a deemed investment in any series of Transamerica IDEX Mutual Funds. The right of a participant to receive a distribution from the Plan of the deferred fees is an unsecured claim against the general assets of all series of Transamerica IDEX Mutual Funds. The pro rata liability to the Fund of all deferred fees in the Plan amounted, as of December 31, 2007, to $24. Amounts deferred under the Deferred Compensation Plan are unfunded against the general assets of ATST.
Retirement plan: Under a retirement plan (the “Emeritus Plan”) available to the Independent Trustees, each Independent Trustee is deemed to have elected to serve as Trustee Emeritus of ATST upon his or her termination of service, other than removal for cause, is entitled to 50% of the trustee’s current retainer for a maximum period of five years determined by his or her years of service as a Trustee.
Such amounts shall be accrued by ATST on a pro rata basis allocable to each series of ATST fund based on the relative assets of the series. If retainers increase in the future, past accruals (and credits) will be adjusted upward so that 50% of the Trustee’s current retainer is accrued and credited at all times. Upon death, disability or termination of service, other than removal for cause, amounts deferred become payable to a Trustee Emeritus (or his/her beneficiary). Upon the commencement of service as Trustee Emeritus, compensation will be paid on a quarterly basis during the time period that the Trustee Emeritus is allowed to serve as such.
Amounts accrued under the Emeritus Plan are unsecured claims against the general assets of ATST. For the year ended December 31, 2007, the amount related to the Emeritus Plan was $21. As of December 31, 2007, the Fund has not made any payments related to the Emeritus Plan.
The Emeritus Plan was terminated effective October 30, 2007. Upon the termination, the Fund shall continue to pay any remaining benefits in accordance with the Plan, but no further compensation shall accrue under the Plan.
NOTE 3. INVESTMENT TRANSACTIONS
The cost of securities purchased and proceeds from securities sold (excluding short-term securities) for the year ended December 31, 2007 were as follows:
Purchases of securities: | | | |
Long-term | | $ | 337,051 | |
U.S. Government | | — | |
| | | |
Proceeds from maturities and sales of securities: | | | |
Long-term | | 429,173 | |
U.S. Government | | — | |
| | | | |
NOTE 4. FEDERAL INCOME TAX MATTERS
The Fund has not made any provision for federal income or excise taxes due to its policy to distribute all of its taxable income and capital gains to its shareholders and otherwise qualify as a regulated investment company under Subchapter M of the Internal Revenue Code. Income and capital gain distributions are determined in accordance with income tax regulations, which may differ from GAAP. These differences are primarily due to differing treatment for items including, but not limited to, wash sales, capital loss carryforwards, REITs and net operating loss.
Additional paid-in capital | | $ | — | |
Undistributed (accumulated) net investment income (loss) | | $ | 432 | |
Undistributed (accumulated) net realized gain (loss) from investment securities | | $ | (432 | ) |
10
NOTES TO FINANCIAL STATEMENTS (continued)
At December 31, 2007
(all amounts in thousands)
NOTE 4.–(continued)
The capital loss carryforwards are available to offset future realized capital gains through the periods listed:
Capital Loss | | | |
Carryforwards | | Available Through | |
$ | 7,971 | | December 31, 2009 | |
$ | 432 | | December 31, 2011 | |
The capital loss carryforward utilized during the year ended December 31, 2007 was $5,959.
The tax character of distributions paid may differ from the character of distributions shown in the Statements of Changes in Net Assets due to short-term gains being treated as ordinary income for tax purposes. The tax character of distributions paid during 2006 and 2007 was as follows:
2006 Distributions paid from: | | | |
Ordinary Income | | $ | 1,154 | |
Long-term Capital Gain | | 13,409 | |
| | | |
2007 Distributions paid from: | | | |
Ordinary Income | | 1,488 | |
Long-term Capital Gain | | 33,844 | |
| | | | |
The tax basis components of distributable earnings as of December 31, 2007 are as follows:
Undistributed Ordinary Income | | $ | 11,432 | |
Undistributed Long-term Capital Gain | | $ | 80,474 | |
Capital Loss Carryforward | | $ | (8,403 | ) |
Net Unrealized Appreciation (Depreciation) | | $ | 80,778 | |
NOTE 5. REGULATORY PROCEEDINGS
There continues to be significant federal and state regulatory activity relating to financial services companies, particularly mutual fund companies and their investment advisers. As part of an ongoing investigation regarding potential market timing, recordkeeping and trading compliance issues and matters affecting the Fund’s investment adviser, TFAI, and certain affiliates and former employees of TFAI, the SEC staff has indicated that it is likely to take some action against TFAI and certain of its affiliates at the conclusion of the investigation. The potential timing and the scope of any such action is difficult to predict. Although the impact of any action brought against TFAI and/or its affiliates is difficult to assess at the present time, the Fund currently believes that the likelihood that any such action will have a material adverse impact is remote. It is important to note that the Fund is not aware of any allegation of wrongdoing against it and its Board at the time this annual report is printed. Although it is not anticipated that these developments will have an adverse impact on the Fund, there can be no assurance at this time. TFAI and its affiliates are actively working with the SEC in regard to this matter; however, the exact resolution cannot be determined at this time. TFAI will take such actions that it deems necessary or appropriate to continue providing management services to the Fund and to bring all matters to an appropriate conclusion.
TFAI and/or its affiliates, and not the Fund, will bear the costs regarding these regulatory matters.
NOTE 6. RECENTLY ISSUED ACCOUNTING PRONOUNCEMENTS
In July 2006, the Financial Accounting Standards Board (“FASB”) released FASB Interpretation No. 48 “Accounting for Uncertainty in Income Taxes” (“FIN 48”), an interpretation of FASB Statement No. 109. FIN 48 provides guidance for how uncertain tax positions should be recognized, measured, presented and disclosed in the financial statements. FIN 48 requires the accounting and disclosure of tax positions taken or expected to be taken in the course of preparing the Fund’s tax returns to determine whether the tax positions are “more-likely- than-not” of being sustained by the applicable tax authority. Tax positions not deemed to meet the more-likely-than-not threshold would be recorded as a tax benefit or expense in the current year.
Adoption of FIN 48 is effective during the first required financial reporting period for fiscal years beginning after December 15, 2006. Management adopted FIN 48 on June 29, 2007.
Implementation of FIN 48 requires Management of the Fund to analyze all open tax years, as defined by the Statute of Limitations, for all major jurisdictions, which includes federal and certain states. Open tax years are those that are open for exam by taxing authorities (i.e., the last 4 tax year ends and the interim tax period since then). The Fund has no examinations in progress and none are expected at this time.
Management of the Fund has reviewed all open tax years and major jurisdictions and concluded the adoption of FIN 48 resulted in no impact to the Fund’s net assets or results of operations. There is no tax liability resulting from unrecognized tax benefits relating to uncertain income tax positions taken or expected to be taken in future tax returns. The Fund is also not aware of any tax positions for which it is reasonably possible that the total amounts of unrecognized tax benefits will significantly change in the next 12 months.
In September 2006, FASB issued its new Standard No. 157, “Fair Value Measurements” (“FAS 157”). FAS 157 is designed to unify guidance for the measurement of fair value of all types of assets, including financial instruments, and certain liabilities, throughout a number of accounting standards. FAS 157 also establishes a hierarchy for measuring fair value in generally accepted accounting principles and expands financial statement disclosures about fair value measurements that are relevant to mutual funds. FAS 157 is effective for financial statements issued for fiscal years beginning after November 15, 2007, and earlier application is permitted.
As of December 31, 2007, Management does not expect the adoption of FAS 157 to impact the amounts reported in the financial statements, however, additional disclosures will be required about the inputs used to develop the measurements of fair value and the effect of certain of the measurements reported in the statement of operations for a fiscal period.
11
NOTES TO FINANCIAL STATEMENTS (continued)
At December 31, 2007
(all amounts in thousands)
NOTE 7. SUBSEQUENT EVENT
Effective January 1, 2008, TFAI changed its name to Transamerica Asset Management, Inc.
Effective May 1, 2008, AEGON/Transamerica Series Trust will change its name to Transamerica Series Trust. At that time, the Fund will also change its name to Transamerica Growth Opportunities VP.
12
Report of Independent Registered Certified Public Accounting Firm
To the Board of Trustees and Shareholders of
Transamerica Growth Opportunities:
In our opinion, the accompanying statement of assets and liabilities, including the schedule of investments, and the related statements of operations and of changes in net assets and the financial highlights present fairly, in all material respects, the financial position of Transamerica Growth Opportunities (the “Fund”) (one of the portfolios constituting AEGON/Transamerica Series Trust) at December 31, 2007, the results of its operations for the year then ended, the changes in its net assets for each of the two years in the period then ended and the financial highlights for each of the periods presented, in conformity with accounting principles generally accepted in the United States of America. These financial statements and financial highlights (hereafter referred to as “financial statements”) are the responsibility of the Fund’s management; our responsibility is to express an opinion on these financial statements based on our audits. We conducted our audits of these financial statements in accordance with the standards of the Public Company Accounting Oversight Board (United States). Those standards require that we plan and perform the audit to obtain reasonable assurance about whether the financial statements are free of material misstatement. An audit includes examining, on a test basis, evidence supporting the amounts and disclosures in the financial statements, assessing the accounting principles used and significant estimates made by management, and evaluating the overall financial statement presentation. We believe that our audits, which included confirmation of securities at December 31, 2007 by correspondence with the custodian and brokers, provide a reasonable basis for our opinion.

Tampa, Florida
February 29, 2008
13
Transamerica Growth Opportunities
SUPPLEMENTAL TAX INFORMATION (unaudited)
(all amounts in thousands)
For tax purposes, the Fund has made a Long-Term Capital Gain Designation of $33,844 for the year ended December 31, 2007.
RESULTS OF SHAREHOLDER PROXY (unaudited)
At a special meeting of shareholders held on October 30, 2007, the results of the Proposals were as follows:
Proposal 1: To elect a new Board:
Proposed
Trustee | | For | | Against | | Abstentions/Broker Non-
Votes | |
John K. Carter | | 2,274,998,840.817 | | 57,804,698.755 | | 35,433.883 | |
| | | | | | | |
Leo J. Hill | | 2,277,212,702.754 | | 55,590,836.819 | | 35,433.883 | |
| | | | | | | |
Neal M. Jewell | | 2,266,793,295.663 | | 66,010,243.909 | | 35,433.883 | |
| | | | | | | |
Russell A. Kimball, Jr. | | 2,274,825,235.835 | | 57,978,303.737 | | 35,433.883 | |
| | | | | | | |
Eugene M. Mannella | | 2,274,623,165.033 | | 58,180,374.539 | | 35,433.883 | |
| | | | | | | |
Norm R. Nielsen | | 2,275,050,055.885 | | 57,753,483.687 | | 35,433.883 | |
| | | | | | | |
Joyce Galpern Norden | | 2,270,278,122.250 | | 62,525,417.323 | | 35,433.883 | |
| | | | | | | |
Patricia L. Sawyer | | 2,275,737,737.456 | | 57,065,802.116 | | 35,433.883 | |
| | | | | | | |
John W. Waechter | | 2,276,615,120.140 | | 56,188,419.433 | | 35,433.883 | |
Proposal 2: To approve an amendment to the Agreement and Declaration of Trust:
| | | | Abstentions/Broker Non- | |
For | | Against | | Votes | |
2,182,022,669.110 | | 77,590,048.544 | | 73,226,255.801 | |
14
Transamerica Growth Opportunities
INVESTMENT ADVISORY AND SUB-ADVISORY AGREEMENTS-REVIEW AND RENEWAL (unaudited)
At a meeting of the Board of Trustees of AEGON/Transamerica Series Trust (“ATST”) held on December 4th, 2007, the Board reviewed and considered the renewal of the investment advisory agreement (the “Investment Advisory Agreement”) between Transamerica Growth Opportunities (the “Fund”) and Transamerica Fund Advisors, Inc. (“TFAI”), as well as the renewal of the investment sub-advisory agreement (the “Sub-Advisory Agreement”) of the Fund between TFAI and Transamerica Investment Management, LLC (the “Sub-Adviser”), to determine whether the agreements should be renewed for a six-month period. It was noted that this review was interim in nature to align all the Funds on the same calendar, and that the Funds’ advisory arrangements would be reviewed again in the first half of 2008.
Following their review and consideration, the Trustees determined that the renewal of the Investment Advisory Agreement and the Sub-Advisory Agreement would enable shareholders of the Fund to obtain high quality services at a cost that is appropriate, fair, and in the best interests of its shareholders. The Board, including the independent members of the Board, unanimously approved the renewal of the Investment Advisory Agreement and Sub-Advisory Agreement. In reaching their decision, the Trustees requested and obtained from TFAI and the Sub-Adviser such information as they deemed reasonably necessary to evaluate the agreements, including information about fees and performance of comparable funds managed by the Sub-Adviser. The Trustees also carefully considered information they had previously received from TFAI and the Sub-Adviser throughout the year as part of their regular oversight of the Fund, as well as comparative fee, expense, and performance information prepared by Lipper Inc. (“Lipper”), an independent provider of mutual fund performance, fee and expense information and profitability data prepared by management. In considering the proposed continuation of the Investment Advisory and Sub-Advisory Agreements, the Trustees evaluated a number of considerations that they believed, in light of the legal advice furnished to them by independent legal counsel and their own business judgment, to be relevant. They based their decisions on a variety of factors, including the following considerations, among others, although they did not identify any consideration or particular information that was controlling of their decisions:
The nature, extent and quality of the advisory services to be provided. The Board considered the nature and quality of the services provided by TFAI and the Sub-Adviser to the Fund in the past, as well as the services anticipated to be provided in the future. The Board concluded that TFAI and the Sub-Adviser are capable of providing high quality services to the Fund, as indicated by the nature and quality of services provided in the past by TFAI and the Sub-Adviser for this series and the experience, capability and integrity of TFAI’s senior management, the financial resources of TFAI and the Sub-Adviser, TFAI’s management oversight process and the professional qualifications of the portfolio management team of the Sub-Adviser. The Trustees determined that TFAI and the Sub-Adviser can provide investment and related services that are appropriate in scope and extent in light of the Fund’s operations, the competitive landscape of the investment company business and investor needs.
The investment performance of the Fund. The Board examined the short and longer-term performance of the Fund, including relative performance against a peer universe of comparable mutual funds as prepared by Lipper for various trailing periods ended June 30, 2007. The Board noted that the Fund’s performance was below the median for its peer universe over the past 1- and 5-year periods. The Board also noted that the Fund’s performance was near the median for its peer universe over the past 3-year period. The Board noted further that the Fund’s portfolio holdings in securities of small and mid-sized companies could affect the volatility of the Fund’s performance over a short-term period. In addition, the Board noted that the Sub-Adviser’s current management team assumed management of the Fund in 2005. As a result, the Board noted that the longer-term performance of the Fund could not be attributed completely to the current management team. On the basis of the Board’s assessment of the nature, extent and quality of advisory services to be provided or procured by TFAI and the Sub-Adviser, the Board concluded that TFAI and the Sub-Adviser are capable of
providing a level of investment performance that is appropriate in light of the Fund’s proposed investment objectives, policies and strategies and competitive with other similarly situated investment companies, but that the Board would be monitoring performance closely.
The cost of advisory services provided and the level of profitability. The Board reviewed profitability information of TFAI’s cost of procuring fund management services, as well as the costs of its provision of administration, fund accounting and other services, to the Fund and to ATST as a whole by TFAI and its affiliates. The Board reviewed the management and sub-advisory fees for the Fund. The Board noted that the Fund’s contractual management fees were near the median of the Fund’s peer group and universe. Based on their review, the Trustees determined that the management fees of the Fund generally are appropriate in light of the services expected to be provided or procured, the management fees and the anticipated profitability of the relationship between the Fund, TFAI and its affiliates, and the Sub-Adviser. In making these observations and determinations, the Board reviewed, among other things, comparative information provided by Lipper.
Whether fee levels reflect economies of scale and the extent to which economies of scale would be realized as the Fund grows. In evaluating the extent to which the management fees payable under the Investment Advisory and Sub-Advisory Agreements reflect economies of scale or will permit economies of scale to be realized in the future, the Board noted that TFAI and the Sub-Adviser offer breakpoints which appropriately benefit investors by passing on economies of scale in the form of lower management fees as the level of assets grows. The Trustees also concluded that they will have the opportunity to periodically reexamine whether the Fund has achieved economies of scale, and the appropriateness of management fees payable to TFAI and fees paid to the Sub-Adviser, in the future.
Benefits (such as soft dollars) to TFAI, its affiliates, or the Sub-Adviser from their relationship with the Fund. The Board concluded that other benefits anticipated to be derived by TFAI, its affiliates, and the Sub-Adviser from their relationships with the Fund are expected to be reasonable and fair, and consistent with industry practice and the best interests of the Fund and its shareholders. The Trustees noted that TFAI would not realize soft dollar benefits from its relationship with the Fund, and that the Sub-Adviser’s soft dollar trading is consistent with applicable law, including best execution requirements in particular. The Board also noted that the Sub-Adviser is participating in a brokerage program pursuant to which a portion of brokerage commissions paid by the Fund is recaptured for the benefit
15
of the Fund and its shareholders, thus limiting the amount of soft dollar arrangements the Sub-Adviser may engage in with respect to the Fund’s brokerage transactions.
Other considerations. The Board determined that TFAI has made a substantial commitment to the recruitment and retention of high quality personnel, and maintains the financial, compliance and operational resources reasonably necessary to manage the Fund in a professional manner that is consistent with the best interests of the Fund and its shareholders. In this regard, the Trustees favorably considered the procedures and policies in place by TFAI to enforce compliance with applicable laws and regulations and oversee the portfolio management activities of the Sub-Adviser. The Trustees also determined that TFAI has made a significant entrepreneurial commitment to the management and success of the Fund, reflected by TFAI’s expense limitation and fee waiver arrangements with the Fund which may result in TFAI waiving a substantial amount of management fees for the benefit of shareholders.
16
Transamerica Money Market
UNDERSTANDING YOUR FUND’S EXPENSES
(unaudited)
SHAREHOLDER EXPENSES
Fund shareholders may incur ongoing costs, including management and advisory fees, distribution and service fees, and other fund expenses.
The following Example is intended to help you understand your ongoing costs (in dollars and cents) of investing in the Fund and to compare these costs with the ongoing costs of investing in other funds.
The Example is based on an investment of $1,000 invested at July 1, 2007 and held for the entire period until December 31, 2007.
ACTUAL EXPENSES
The first line in the table below provides information about actual account values and actual expenses. You may use the information in this line, together with the amount you invested, to estimate the expenses that you paid over the period. Simply divide your account value by $1,000 (for example, an $8,600 account value divided by $1,000 = 8.6), then multiply the result by the number in the first line of your Fund under the heading entitled “Expenses Paid During Period” to estimate the expenses you paid on your account during this period.
HYPOTHETICAL EXAMPLE FOR COMPARISON PURPOSES
The second line in the table below provides information about hypothetical account values and hypothetical expenses based on the Fund’s actual expense ratio and an assumed rate of return of 5% per year before expenses, which is not the Fund’s actual return. The hypothetical account values and expenses may not be used to estimate the actual ending account balance or expenses you paid for the period. You may use this information to compare the ongoing costs of investing in your Fund and other funds. To do so, compare this 5% hypothetical example with the 5% hypothetical examples that appear in the shareholder reports of the other funds.
Please note that the expenses shown in the table are meant to highlight your ongoing costs only and do not reflect any transactional costs, such as sales charges, redemption fees, brokerage commissions paid on purchases and sales of fund shares. Therefore, the second line under the Fund in the table is useful in comparing ongoing costs only, and will not help you determine the relative total costs of owning different funds. If any of these transaction costs were included, your costs would be higher. The expenses shown in the table do not reflect any fees that may be charged to you by brokers, financial intermediaries or other financial institutions.
| | Beginning
Account
Value | | Ending
Account
Value | | Annualized
Expense
Ratio | | Expenses
Paid During
Period (a) | |
| | | | | | | | | |
Initial Class | | | | | | | | | |
Actual | | $ | 1,000.00 | | $ | 1,023.76 | | 0.40 | % | $ | 2.04 | |
Hypothetical (b) | | 1,000.00 | | 1,023.19 | | 0.40 | | 2.04 | |
| | | | | | | | | |
Service Class | | | | | | | | | |
Actual | | 1,000.00 | | 1,022.52 | | 0.65 | | 3.31 | |
Hypothetical (b) | | 1,000.00 | | 1,021.93 | | 0.65 | | 3.31 | |
| | | | | | | | | | | | |
(a) | | Expenses are calculated using the Fund’s annualized expense ratio (as disclosed in the table), multiplied by the average account value for the period, multiplied by the number of days in the period (184 days), and divided by the number of days in the year (365 days). |
| | |
(b) | | 5% return per year before expenses. |
GRAPHICAL PRESENTATION OF SCHEDULE OF INVESTMENTS
By Maturity Distribution (in days)
At December 31, 2007

This chart shows the percentage breakdown by maturity distribution of the Fund’s total investment securities.
AEGON/Transamerica Series Trust | | Annual Report 2007 |
1
Transamerica Money Market
SCHEDULE OF INVESTMENTS
At December 31, 2007
(all amounts in thousands)
| | Principal | | Value | |
COMMERCIAL PAPER (97.3%) | | | | | |
Commercial Banks (28.9%) | | | | | |
Bank of America Corp. | | | | | |
4.50%, due 04/09/2008 | | $ | 10,000 | | $ | 9,876 | |
4.82%, due 03/14/2008 | | 8,850 | | 8,764 | |
Canadian Imper. Hlds | | | | | |
4.65%, due 01/16/2008 | | 1,350 | | 1,347 | |
4.74%, due 02/08/2008 | | 4,300 | | 4,278 | |
4.79%, due 02/07/2008 – 02/13/2008 | | 14,200 | | 14,121 | |
4.86%, due 02/25/2008 | | 5,600 | | 5,558 | |
Canadian Imperial Holdings, Inc. | | | | | |
4.65%, due 01/02/2008 | | 3,800 | | 3,800 | |
Royal Bank of Scotland -144A | | | | | |
5.07%, due 03/03/2008 | | 10,500 | | 10,408 | |
5.08%, due 03/04/2008 | | 10,000 | | 9,911 | |
Royal BK of Scotland | | | | | |
4.97%, due 02/29/2008 | | 9,500 | | 9,423 | |
State Street Boston | | | | | |
4.61%, due 01/11/2008 – 01/29/2008 | | 20,525 | | 20,475 | |
Toronto Domin Holding -144A | | | | | |
4.67%, due 01/24/2008 | | 6,100 | | 6,082 | |
4.94%, due 01/31/2008 | | 10,500 | | 10,457 | |
4.99%, due 02/27/2008 | | 10,500 | | 10,417 | |
5.08%, due 01/14/2008 | | 3,250 | | 3,244 | |
UBS Finance (Delw) | | | | | |
4.66%, due 02/05/2008 | | 8,850 | | 8,810 | |
UBS Finance Delaware LLC | | | | | |
5.01%, due 01/28/2008 | | 8,000 | | 7,972 | |
UBS Finance, Inc. | | | | | |
4.68%, due 02/06/2008 | | 10,500 | | 10,451 | |
Wells Fargo & Co. | | | | | |
4.30%, due 01/07/2008 – 01/16/2008 | | 15,500 | | 15,479 | |
Computers & Peripherals (2.0%) | | | | | |
IBM Corp. -144A | | | | | |
4.25%, due 01/28/2008 | | 11,550 | | 11,513 | |
Diversified Financial Services (47.3%) | | | | | |
American Exp Crt CP | | | | | |
4.65%, due 02/08/2008 | | 13,200 | | 13,134 | |
4.70%, due 02/04/2008 | | 5,300 | | 5,276 | |
American Express Credit Corp. | | | | | |
4.65%, due 02/07/2008 | | 11,400 | | 11,346 | |
American Honda Finance | | | | | |
4.50%, due 02/13/2008 | | 4,220 | | 4,197 | |
4.51%, due 01/03/2008 | | 21,500 | | 21,495 | |
CAFCO LLC -144A | | | | | |
4.85%, due 02/04/2008 | | 8,500 | | 8,461 | |
5.05%, due 01/29/2008 | | 1,000 | | 996 | |
Caterpillar Finance Dcp | | | | | |
3.50%, due 01/02/2008 | | 9,300 | | 9,299 | |
CIESCO, LLC -144A | | | | | |
5.05%, due 01/29/2008 | | 11,200 | | 11,156 | |
General Electric Capt Corp. | | | | | |
4.25%, due 01/15/2008 | | 3,100 | | 3,100 | |
4.37%, due 03/25/2008 – 04/25/2008 | | 19,000 | | 18,772 | |
4.55%, due 02/26/2008 | | 6,500 | | 6,454 | |
International Lease Finance | | | | | |
4.55%, due 02/01/2008 | | $ | 10,000 | | $ | 9,961 | |
4.62%, due 01/18/2008 – 01/23/2008 | | 17,850 | | 17,805 | |
Nestle Capital Corp. -144A | | | | | |
4.25%, due 01/25/2008 | | 28,741 | | 28,659 | |
Old Line Funding Corp. -144A | | | | | |
4.72%, due 01/22/2008 | | 4,850 | | 4,836 | |
4.90%, due 02/13/2008 | | 7,000 | | 6,959 | |
5.90%, due 01/09/2008 | | 9,700 | | 9,687 | |
Old Line Funding LLC -144A | | | | | |
5.10%, due 01/18/2008 | | 7,550 | | 7,532 | |
Rabobank USA FINL Corp. | | | | | |
4.33%, due 01/02/2008 | | 4,000 | | 4,000 | |
4.63%, due 01/15/2008 | | 11,000 | | 10,980 | |
4.64%, due 01/16/2008 | | 4,000 | | 3,992 | |
4.86%, due 01/04/2008 | | 9,350 | | 9,346 | |
Ranger Funding Co. LLC -144A | | | | | |
5.00%, due 01/24/2008 | | 3,900 | | 3,888 | |
5.13%, due 01/03/2008 | | 5,906 | | 5,904 | |
State Street Boston | | | | | |
4.97%, due 01/14/2008 | | 8,250 | | 8,235 | |
Toyota Motor Credit Co. | | | | | |
4.44%, due 02/14/2008 – 03/18/2008 | | 13,500 | | 13,397 | |
4.62%, due 03/07/2008 | | 8,700 | | 8,626 | |
4.72%, due 02/28/2008 | | 7,000 | | 6,947 | |
Unilever Capital CRP -144A | | | | | |
4.25%, due 01/11/2008 | | 5,150 | | 5,144 | |
Health Care Equipment & Supplies (4.9%) | | | | | |
Medtronic, Inc. -144A | | | | | |
4.25%, due 01/22/2008 | | 15,350 | | 15,312 | |
4.45%, due 01/08/2008 | | 13,750 | | 13,738 | |
Insurance (4.9%) | | | | | |
Prudential FNDG LLC | | | | | |
4.55%, due 02/11/2008 | | 10,700 | | 10,645 | |
4.64%, due 01/31/2008 | | 9,200 | | 9,164 | |
Prudential Funding | | | | | |
4.64%, due 01/30/2008 | | 9,200 | | 9,166 | |
Metals & Mining (5.0%) | | | | | |
BHP Bill Finance USA, Ltd. -144A | | | | | |
4.80%, due 01/17/2008 | | 10,400 | | 10,378 | |
5.40%, due 01/04/2008 | | 6,500 | | 6,497 | |
5.50%, due 01/07/2008 – 01/10/2008 | | 12,100 | | 12,086 | |
Oil, Gas & Consumable Fuels (4.3%) | | | | | |
BP Capital Markets PLC -144A | | | | | |
4.20%, due 03/27/2008 | | 6,350 | | 6,286 | |
4.21%, due 03/28/2008 | | 19,850 | | 19,649 | |
Total Commercial Paper (cost $574,891) | | | | $ | 574,891 | |
The notes to the financial statements are an integral part of this report.
2
| | Principal | | Value | |
| | | | | |
CERTIFICATE OF DEPOSIT (2.8%) | | | | | |
Diversified Financial Services (2.8%) | | | | | |
HBOS Treasury Service PLC | | | | | |
4.50%, due 01/14/2008 | | $ | 16,275 | | $ | 16,279 | |
Total Certificate of Deposit (cost $16,279) | | | | 16,279 | |
| | | | | |
Total Investment Securities (cost $591,170) # | | | | $ | 591,170 | |
| | | | | | | |
NOTES TO SCHEDULE OF INVESTMENTS:
# Aggregate cost for federal income tax purposes is $591,170.
DEFINITIONS:
144A 144A Securities are registered pursuant to Rule 144A of the Securities Act of 1933. These securities are deemed to be liquid for purposes of compliance limitations on holdings of illiquid securities and may be resold as transactions exempt from registration, normally to qualified institutional buyers. At December 31, 2007, these securities aggregated $239,199 or 40.50% of net assets of the fund.
3
Transamerica Money Market
STATEMENT OF ASSETS AND LIABILITIES
At December 31, 2007
(all amounts except per share amounts in thousands)
Assets: | | | |
Investment securities, at value (cost: $591,170) | | $ | 591,170 | |
Cash | | 75 | |
Receivables: | | | |
Shares sold | | 386 | |
Interest | | 691 | |
| | 592,322 | |
Liabilities: | | | |
Accounts payable and accrued liabilities: | | | |
Shares redeemed | | 1 ,439 | |
Management and advisory fees | | 179 | |
Distribution and service fees | | 21 | |
Administration fees | | 10 | |
Other | | 77 | |
| | 1 ,726 | |
Net Assets | | $ | 590,596 | |
| | | |
Net Assets Consist of: | | | |
Capital Stock ($.01 par value) | | $ | 5 ,906 | |
Additional paid-in capital | | 584,690 | |
Net Assets | | $ | 590,596 | |
Net Assets by Class: | | | |
Initial Class | | $ | 495,893 | |
Service Class | | 94,703 | |
Shares Outstanding: | | | |
Initial Class | | 495,893 | |
Service Class | | 94,703 | |
Net Asset Value and Offering Price Per Share: | | | |
Initial Class | | $ | 1.00 | |
Service Class | | 1.00 | |
STATEMENT OF OPERATIONS
For the year ended December 31, 2007
(all amounts in thousands)
Investment Income: | | | |
Interest | | $ | 29,746 | |
| | 29,746 | |
Expenses: | | | |
Management and advisory fees | | 1 ,971 | |
Printing and shareholder reports | | 37 | |
Custody fees | | 64 | |
Administration fees | | 113 | |
Legal fees | | 11 | |
Audit fees | | 21 | |
Trustees fees | | 19 | |
Distribution and service fees: | | | |
Service Class | | 191 | |
Other | | 8 | |
Total expenses | | 2,435 | |
| | | |
Net Investment Income | | 27,311 | |
| | | |
Net Increase In Net Assets Resulting from Operations | | $ | 27,311 | |
The notes to the financial statements are an integral part of this report.
4
Transamerica Money Market
STATEMENT OF CHANGES IN NET ASSETS
For the years ended
(all amounts in thousands)
| | December 31,
2007 | | December 31,
2006 | |
Increase (Decrease) in Net Assets From: | | | | | |
Operations: | | | | | |
Net investment income | | $ | 27,311 | | $ | 21,959 | |
Net realized gain from investment securities | | — | | — | |
Change in unrealized appreciation on investment securities | | — | | — | |
| | 27,311 | | 21,959 | |
Distributions to Shareholders: | | | | | |
From net investment income: | | | | | |
Initial Class | | (23,783 | ) | (20,059 | ) |
Service Class | | (3,528 | ) | (1,900 | ) |
| | (27,311 | ) | (21,959 | ) |
Capital Share Transactions: | | | | | |
Proceeds from shares sold: | | | | | |
Initial Class | | 607,016 | | 539,416 | |
Service Class | | 208,265 | | 125,584 | |
| | 815,281 | | 665,000 | |
Dividends and distributions reinvested: | | | | | |
Initial Class | | 23,905 | | 20,009 | |
Service Class | | 3,539 | | 1,895 | |
| | 27,444 | | 21,904 | |
Cost of shares redeemed: | | | | | |
Initial Class | | (589,813 | ) | (451,991 | ) |
Service Class | | (160,763 | ) | (113,218 | ) |
| | (750,576 | ) | (565,209 | ) |
| | 92,149 | | 121,695 | |
| | | | | |
Net increase (decrease) in net assets | | 92,149 | | 121,695 | |
| | | | | |
Net Assets: | | | | | |
Beginning of year | | 498,447 | | 376,752 | |
End of year | | $ | 590,596 | | $ | 498,447 | |
| | | | | |
Undistributed (Accumulated) Net Investment Income (Loss) | | $ | — | | $ | — | |
Share Activity: | | | | | |
Shares issued: | | | | | |
Initial Class | | 607,017 | | 539,416 | |
Service Class | | 208,265 | | 125,584 | |
| | 815,282 | | 665,000 | |
Shares issued-reinvested from distributions: | | | | | |
Initial Class | | 23,905 | | 20,009 | |
Service Class | | 3,539 | | 1,895 | |
| | 27,444 | | 21,904 | |
Shares redeemed: | | | | | |
Initial Class | | (589,813 | ) | (451,991 | ) |
Service Class | | (160,764 | ) | (113,218 | ) |
| | (750,577 | ) | (565,209 | ) |
Net increase (decrease) in shares outstanding: | | | | | |
Initial Class | | 41,109 | | 107,434 | |
Service Class | | 51,040 | | 14,261 | |
| | 92,149 | | 121,695 | |
The notes to the financial statements are an integral part of this report.
5
Transamerica Money Market
FINANCIAL HIGHLIGHTS
For a share outstanding throughout each period(a)
| | Initial Class | |
| | Year Ended December 31, | |
| | 2007 | | 2006 | | 2005 | | 2004 | | 2003 | |
Net Asset Value | | | | | | | | | | | |
Beginning of period | | $ | 1.00 | | $ | 1.00 | | $ | 1.00 | | $ | 1.00 | | $ | 1.00 | |
Investment Operations | | | | | | | | | | | |
Net investment income (loss) | | 0.05 | | 0.05 | | 0.03 | | 0.01 | | 0.01 | |
Net realized and unrealized gain (loss) | | — | | — | | — | | — | | — | |
Total operations | | 0.05 | | 0.05 | | 0.03 | | 0.01 | | 0.01 | |
Distributions | | | | | | | | | | | |
From net investment income | | (0.05 | ) | (0.05 | ) | (0.03 | ) | (0.01 | ) | (0.01 | ) |
From net realized gains | | — | | — | | — | | — | | — | |
Total distributions | | (0.05 | ) | (0.05 | ) | (0.03 | ) | (0.01 | ) | (0.01 | ) |
Net Asset Value | | | | | | | | | | | |
End of period(b) | | $ | 1.00 | | $ | 1.00 | | $ | 1.00 | | $ | 1.00 | | $ | 1.00 | |
Total Return(c),(d) | | 4.91 | % | 4.74 | % | 2.89 | % | 0.99 | % | 0.81 | % |
Net Assets End of Period (000’s) | | $ | 495,893 | | $ | 454,784 | | $ | 347,350 | | $ | 496,821 | | $ | 597,512 | |
Ratio and Supplemental Data | | | | | | | | | | | |
Expenses to average net assets(e) | | 0.40 | % | 0.40 | % | 0.40 | % | 0.39 | % | 0.38 | % |
Net investment income (loss), to average net
assets(e) | | 4.88 | % | 4.69 | % | 2.84 | % | 1.00 | % | 0.78 | % |
For a share outstanding throughout each period(a)
| | Service Class | |
| | Year Ended December 31, | | May 1 to Dec | |
| | 2007 | | 2006 | | 2005 | | 2004 | | 31, 2003 | |
Net Asset Value | | | | | | | | | | | |
Beginning of period | | $ | 1.00 | | $ | 1.00 | | $ | 1.00 | | $ | 1.00 | | $ | 1.00 | |
Investment Operations | | | | | | | | | | | |
Net investment income (loss) | | 0.05 | | 0.04 | | 0.03 | | 0.01 | | — | |
Net realized and unrealized gain (loss) | | — | | — | | — | | — | | — | |
Total operations | | 0.05 | | 0.04 | | 0.03 | | 0.01 | | — | |
Distributions | | | | | | | | | | | |
From net investment income | | (0.05 | ) | (0.04 | ) | (0.03 | ) | (0.01 | ) | — | |
From net realized gains | | — | | — | | — | | — | | — | |
Total distributions | | (0.05 | ) | (0.04 | ) | (0.03 | ) | (0.01 | ) | — | |
Net Asset Value | | | | | | | | | | | |
End of period(b) | | $ | 1.00 | | $ | 1.00 | | $ | 1.00 | | $ | 1.00 | | $ | 1.00 | |
Total Return(c),(d) | | 4.65 | % | 4.48 | % | 2.63 | % | 0.72 | % | 0.30 | % |
Net Assets End of Period (000’s) | | $ | 94,703 | | $ | 43,663 | | $ | 29,402 | | $ | 18,930 | | $ | 6,591 | |
Ratio and Supplemental Data | | | | | | | | | | | |
Expenses to average net assets(e) | | 0.65 | % | 0.65 | % | 0.65 | % | 0.64 | % | 0.64 | % |
Net investment income (loss), to average net assets(e) | | 4.62 | % | 4.47 | % | 2.69 | % | 0.87 | % | 0.44 | % |
(a) Per share information is calculated based on average number of shares outstanding.
(b) Transamerica Money Market (the “Fund”) share class commenced operations as follows:
Initial Class - October 2, 1986
Service Class - May 1, 2003
(c) Total Return reflects all portfolio expenses and includes reinvestment of dividends and capital gains; it does not reflect the charges and deductions under the policies or annuity contracts.
(d) Not annualized.
(e) Annualized.
The notes to the financial statements are an integral part of this report.
6
Transamerica Money Market
NOTES TO FINANCIAL STATEMENTS
At December 31, 2007
(all amounts in thousands)
NOTE 1. ORGANIZATION AND SIGNIFICANT ACCOUNTING POLICIES
AEGON/Transamerica Series Trust (“ATST”) is an open-end management investment company registered under the Investment Company Act of 1940, as amended (the “1940 Act”). ATST serves as a funding vehicle for variable life insurance, variable annuity and group annuity products. Transamerica Money Market (the “Fund”) is part of ATST.
In the normal course of business, the Fund enters into contracts that contain a variety of representations that provide general indemnifications. The Fund’s maximum exposure under these arrangements is unknown, as this would involve future claims that may be made against the Fund and/or its affiliates that have not yet occurred. However, based on experience, the Fund expects the risk of loss to be remote.
This report should be read in conjunction with the current Fund prospectus, which contains more complete information about the Fund.
In preparing the Fund’s financial statements in accordance with accounting principles generally accepted in the United States of America (“GAAP”), estimates or assumptions (which could differ from actual results) may be used that affect reported amounts and disclosures. The following is a summary of significant accounting policies followed by the Fund.
Multiple class operations, income and expenses: The Fund currently offers two classes of shares, an Initial Class and a Service Class. Income, non-class specific expenses and realized and unrealized gains and losses are allocated daily to each class, based upon the value of shares outstanding method as permitted under Rule 18f-3 of the 1940 Act. Each class bears its own specific expenses as well as a portion of general, common expenses.
Securities valuations: As permitted under Rule 2a-7 of the 1940 Act, the securities held by the Fund are valued on the basis of amortized cost, which approximates market value.
Cash: The Fund may leave cash overnight in its cash account with the custodian, State Street Bank & Trust Company (“State Street”). On July 2, 2007, State Street acquired the parent company of Investors Bank & Trust Company. State Street has been contracted on behalf of the Fund to invest the excess cash into a savings account, which at December 31, 2007 was paying an interest rate of 2.60%.
Security transactions and investment income: Security transactions are recorded on the trade date. Security gains and losses are calculated on the first-in, first-out basis. Interest income, if any, is recorded on the ex-dividend date or, in the case of foreign securities, as soon as the Fund is informed of the ex-dividend date. Interest income, including accretion of discounts and amortization of premiums, is recorded on the accrual basis commencing on the settlement date.
Dividend distributions: Dividends to shareholders are declared daily and reinvested monthly.
NOTE 2. RELATED PARTY TRANSACTIONS
ATST serves as a funding vehicle for certain affiliated asset allocation portfolios and certain affiliated separate accounts of Western Reserve Life Assurance Co. of Ohio, Transamerica Life Insurance Company, Transamerica Financial Life Insurance Company, Inc., Monumental Life Insurance Company and Transamerica Occidental Life Insurance Company.
Transamerica Fund Advisors, Inc. (“TFAI”) is the Fund’s investment adviser. Transamerica Fund Services, Inc. (“TFS”) is the Fund’s administrator and transfer agent. Prior to May 1, 2007, AFSG Securities Corp. (“AFSG”), was the Fund’s distributor. Transamerica Capital Inc. (“TCI”) is now the Fund’s distributor. TFAI, TFS, AFSG, and TCI are affiliates of AEGON NV, a Netherlands corporation.
Transamerica Investment Management, LLC (“TIM”) is an affiliate of the Fund and is a sub-adviser to the Fund.
Certain officers and trustees of the Fund are also officers and/or directors of TFAI, TFS and TCI.
The following schedule reflects the percentage of Fund assets owned by affiliated investment companies at December 31, 2007:
| | Net
Assets | | % of Net
Assets | |
| | | | | |
Asset Allocation-Conservative Portfolio | | $ | 17,950 | | 3.04 | % |
Asset Allocation-Growth Portfolio | | 4,292 | | 0.73 | |
Asset Allocation-Moderate Growth Portfolio | | 29,550 | | 5.00 | |
Asset Allocation-Moderate Portfolio | | 23,567 | | 3.99 | |
Total | | $ | 75,359 | | 12.76 | % |
Investment advisory fee: The Fund pays management fees to TFAI based on average daily net assets (“ANA”) at the following rate:
0.35% of ANA
TFAI has contractually agreed to waive its advisory fee and will reimburse the Fund to the extent that operating expenses, excluding 12b-1 fees, exceed the following stated annual limit:
0.57% Expense Limit
If total Fund expenses fall below the annual expense limitation agreement agreed to by the adviser within the succeeding three years, the Fund may be required to pay the adviser a portion or all of the waived advisory fees.
There were no amounts recaptured during the year ended December 31, 2007. There are no amounts available for recapture at December 31, 2007.
7
NOTES TO FINANCIAL STATEMENTS (continued)
At December 31, 2007
(all amounts in thousands)
NOTE 2.–(continued)
Distribution and service fees: ATST entered into a Distribution Agreement with AFSG dated January 1, 1997, as amended. On May 1, 2007, the Distribution Agreement was amended to replace AFSG with TCI as the Fund’s distributor. The Fund has also adopted a distribution plan (“Distribution Plan”) pursuant to Rule 12b-1 under the 1940 Act.
Under the Distribution Plan for the Initial Class shares, TCI, on behalf of the Fund, is authorized to pay various service providers, as direct payment for expenses incurred in connection with distribution of the Fund’s shares, amounts equal to actual expenses associated with distributing the shares.
The Distribution Plan for the Service Class shares requires ATST to pay distribution fees to TCI as compensation for its activities, not as reimbursement for specific expenses. The fee on the Service Class is paid to the insurance companies for providing services and account maintenance for their policyholders who invest in the variable insurance products which invest in the Service Class shares.
The Fund is authorized under the Distribution Plan to pay fees on each class up to the following limits:
Initial Class | | 0.15 | % |
Service Class | | 0.25 | % |
TCI has determined that it will not seek payment by the Fund of the distribution expenses incurred with respect to the Initial Class shares before April 30, 2009. Prior to TCI seeking reimbursement of future expenses, policy and contract owners will be notified in advance. The Fund will pay fees relating to Service Class shares.
Administrative services: The Fund has entered into an agreement with TFS for financial and legal fund administration services. The Fund pays TFS an annual fee of 0.02% of ANA. The Legal fees on the Statement of Operations are for fees paid to external legal counsel.
Deferred compensation plan: Each eligible independent Fund Trustee may elect participation in a non-qualified deferred compensation plan (“the Plan”). Under the Plan, such Trustees may defer payment of all or a portion of their total fees earned as a Fund Trustee. Each Trustee who is a participant in the Plan may elect that the earnings, losses or gains credited to his or her deferred fee amounts be determined based on a deemed investment in any series of Transamerica IDEX Mutual Funds. The right of a participant to receive a distribution from the Plan of the deferred fees is an unsecured claim against the general assets of all series of Transamerica IDEX Mutual Funds. The pro rata liability to the Fund of all deferred fees in the Plan amounted, as of December 31, 2007, to $28. Amounts deferred under the Deferred Compensation Plan are unfunded against the general assets of ATST.
Retirement plan: Under a retirement plan (the “Emeritus Plan”) available to the Independent Trustees, each Independent Trustee is deemed to have elected to serve as Trustee Emeritus of ATST upon his or her termination of service, other than removal for cause, and is entitled to 50% of the trustee’s current retainer for a maximum period of five years determined by his or her years of service as a Trustee.
Such amounts shall be accrued by ATST on a pro rata basis allocable to each series of ATST fund based on the relative assets of the series. If retainers increase in the future, past accruals (and credits) will be adjusted upward so that 50% of the Trustee’s current retainer is accrued and credited at all times. Upon death, disability or termination of service, other than removal for cause, amounts deferred become payable to a Trustee Emeritus (or his/her beneficiary). Upon the commencement of service as Trustee Emeritus, compensation will be paid on a quarterly basis during the time period that the Trustee Emeritus is allowed to serve as such.
Amounts accrued under the Emeritus Plan are unsecured claims against the general assets of ATST. For the year ended December 31, 2007, the amount related to the Emeritus Plan was $19. As of December 31, 2007, the Fund has not made any payments related to the Emeritus Plan.
The Emeritus Plan was terminated effective October 30, 2007. Upon termination, the Fund shall continue to pay any remaining benefits in accordance with the Plan, but no further compensation shall accrue under the Plan.
NOTE 3. FEDERAL INCOME TAX MATTERS
The Fund has not made any provision for federal income or excise taxes due to its policy to distribute all of its taxable income and capital gains to its shareholders and otherwise qualify as a regulated investment company under Subchapter M of the Internal Revenue Code. Income and capital gain distributions are determined in accordance with income tax regulations, which may differ from GAAP. These differences are primarily due to differing treatment for items including, but not limited to, distributions payable.
The tax character of distributions paid may differ from the character of distributions shown in the Statements of Changes in Net Assets due to short-term gains being treated as ordinary income for tax purposes. The tax character of distributions paid during 2006 and 2007 was as follows:
2006 Distributions paid from: | | | |
Ordinary Income | | $ | 21,959 | |
Long-term Capital Gain | | — | |
| | | |
2007 Distributions paid from: | | | |
Ordinary Income | | 27,311 | |
Long-term Capital Gain | | — | |
| | | | |
8
NOTES TO FINANCIAL STATEMENTS (continued)
At December 31, 2007
(all amounts in thousands)
NOTE 3.–(continued)
The capital loss carryforwards are available to offset future realized capital gains through the periods listed:
Capital Loss
Carryforwards | | Available Through | |
| | | |
$ | 1 | | December 31, 2013 | |
| | | |
$ | 1 | | December 31, 2014 | |
The tax basis components of distributable earnings as of year ended December 31, 2007 are as follows:
Undistributed Ordinary Income | | $ | — | |
Undistributed Long-term Capital Gain | | $ | — | |
Capital Loss Carryforward | | $ | (2 | ) |
Post October Capital Loss Deferral | | $ | — | |
Post October Currency Loss Deferral | | $ | — | |
Net Unrealized Appreciation (Depreciation) | | $ | — | |
NOTE 4. REGULATORY PROCEEDINGS
There continues to be significant federal and state regulatory activity relating to financial services companies, particularly mutual fund companies and their investment advisers. As part of an ongoing investigation regarding potential market timing, recordkeeping and trading compliance issues and matters affecting the Fund’s investment adviser, TFAI, and certain affiliates and former employees of TFAI, the SEC staff has indicated that it is likely to take some action against TFAI and certain of its affiliates at the conclusion of the investigation. The potential timing and the scope of any such action is difficult to predict. Although the impact of any action brought against TFAI and/or its affiliates is difficult to assess at the present time, the Fund currently believes that the likelihood that any such action will have a material adverse impact is remote. It is important to note that the Fund is not aware of any allegation of wrongdoing against it and its Board at the time this annual report is printed. Although it is not anticipated that these developments will have an adverse impact on the Fund, there can be no assurance at this time. TFAI and its affiliates are actively working with the SEC in regard to this matter; however, the exact resolution cannot be determined at this time. TFAI will take such actions that it deems necessary or appropriate to continue providing management services to the Fund and to bring all matters to an appropriate conclusion.
TFAI and/or its affiliates, and not the Fund, will bear the costs regarding these regulatory matters.
NOTE 5. RECENTLY ISSUED ACCOUNTING PRONOUNCEMENTS
In July 2006, the Financial Accounting Standards Board (“FASB”) released FASB Interpretation No. 48 “Accounting for Uncertainty in Income Taxes” (“FIN 48”), an interpretation of FASB Statement No. 109. FIN 48 provides guidance for how uncertain tax positions should be recognized, measured, presented and disclosed in the financial statements. FIN 48 requires the accounting and disclosure of tax positions taken or expected to be taken in the course of preparing the Fund’s tax returns to determine whether the tax positions are “more-likely-than-not” of being sustained by the applicable tax authority. Tax positions not deemed to meet the more-likely-than-not threshold would be recorded as a tax benefit or expense in the current year.
Adoption of FIN 48 is effective during the first required financial reporting period for fiscal years beginning after December 15, 2006. Management adopted FIN 48 on June 29, 2007.
Implementation of FIN 48 requires Management of the Fund to analyze all open tax years, as defined by the Statute of Limitations, for all major jurisdictions, which includes federal and certain states. Open tax years are those that are open for exam by taxing authorities (i.e., the last 4 tax year ends and the interim tax period since then). The Fund has no examinations in progress and none are expected at this time.
Management of the Fund has reviewed all open tax years and major jurisdictions and concluded the adoption of FIN 48 resulted in no impact to the Fund’s net assets or results of operations. There is no tax liability resulting from unrecognized tax benefits relating to uncertain income tax positions taken or expected to be taken in future tax returns. The Fund is also not aware of any tax positions for which it is reasonably possible that the total amounts of unrecognized tax benefits will significantly change in the next 12 months.
In September 2006, FASB issued its new Standard No. 157, “Fair Value Measurements” (“FAS 157”). FAS 157 is designed to unify guidance for the measurement of fair value of all types of assets, including financial instruments, and certain liabilities, throughout a number of accounting standards. FAS 157 also establishes a hierarchy for measuring fair value in generally accepted accounting principles and expands financial statement disclosures about fair value measurements that are relevant to mutual funds. FAS 157 is effective for financial statements issued for fiscal years beginning after November 15, 2007, and earlier application is permitted.
As of December 31, 2007, Management does not expect the adoption of FAS 157 to impact the amounts reported in the financial statements, however, additional disclosures will be required about the inputs used to develop the measurements of fair value and the effect of certain of the measurements reported in the statement of operations for a fiscal period.
NOTE 6. SUBSEQUENT EVENT
Effective January 1, 2008, TFAI changed its name to Transamerica Asset Management, Inc.
Effective May 1, 2008, AEGON/Transamerica Series Trust will change its name to Transamerica Series Trust. At that time, the Fund will also change its name to Transamerica Money Market VP.
9
Report of Independent Registered Certified Public Accounting Firm
To the Board of Trustees and Shareholders of
Transamerica Money Market:
In our opinion, the accompanying statement of assets and liabilities, including the schedule of investments, and the related statements of operations and of changes in net assets and the financial highlights present fairly, in all material respects, the financial position of Transamerica Money Market (the “Fund”) (one of the portfolios constituting AEGON/Transamerica Series Trust) at December 31, 2007, the results of its operations for the year then ended, the changes in its net assets for each of the two years in the period then ended and the financial highlights for each of the periods presented, in conformity with accounting principles generally accepted in the United States of America. These financial statements and financial highlights (hereafter referred to as “financial statements”) are the responsibility of the Fund’s management; our responsibility is to express an opinion on these financial statements based on our audits. We conducted our audits of these financial statements in accordance with the standards of the Public Company Accounting Oversight Board (United States). Those standards require that we plan and perform the audit to obtain reasonable assurance about whether the financial statements are free of material misstatement. An audit includes examining, on a test basis, evidence supporting the amounts and disclosures in the financial statements, assessing the accounting principles used and significant estimates made by management, and evaluating the overall financial statement presentation. We believe that our audits, which included confirmation of securities at December 31, 2007 by correspondence with the custodian and brokers, provide a reasonable basis for our opinion.

Tampa, Florida
February 29, 2008
10
Transamerica Money Market
RESULTS OF SHAREHOLDER PROXY (unaudited)
At a special meeting of shareholders held on October 30, 2007, the results of the Proposals were as follows:
Proposal 1: To elect a new Board:
Proposed
Trustee | | For | | Against | | Abstentions/Broker Non-
Votes | |
John K. Carter | | 2,274,998,840.817 | | 57,804,698.755 | | 35,433.883 | |
| | | | | | | |
Leo J. Hill | | 2,277,212,702.754 | | 55,590,836.819 | | 35,433.883 | |
| | | | | | | |
Neal M. Jewell | | 2,266,793,295.663 | | 66,010,243.909 | | 35,433.883 | |
| | | | | | | |
Russell A. Kimball, Jr. | | 2,274,825,235.835 | | 57,978,303.737 | | 35,433.883 | |
| | | | | | | |
Eugene M. Mannella | | 2,274,623,165.033 | | 58,180,374.539 | | 35,433.883 | |
| | | | | | | |
Norm R. Nielsen | | 2,275,050,055.885 | | 57,753,483.687 | | 35,433.883 | |
| | | | | | | |
Joyce Galpern Norden | | 2,270,278,122.250 | | 62,525,417.323 | | 35,433.883 | |
| | | | | | | |
Patricia L. Sawyer | | 2,275,737,737.456 | | 57,065,802.116 | | 35,433.883 | |
| | | | | | | |
John W. Waechter | | 2,276,615,120.140 | | 56,188,419.433 | | 35,433.883 | |
Proposal 2: To approve an amendment to the Agreement and Declaration of Trust:
| | | | Abstentions/Broker Non- | |
For | | Against | | Votes | |
2,182,022,669.110 | | 77,590,048.544 | | 73,226,255.801 | |
11
Transamerica Money Market
INVESTMENT ADVISORY AND SUB-ADVISORY AGREEMENTS-REVIEW AND RENEWAL (unaudited)
At a meeting of the Board of Trustees of AEGON/Transamerica Series Trust (“ATST”) held on December 4th, 2007, the Board reviewed and considered the renewal of the investment advisory agreement (the “Investment Advisory Agreement”) between Transamerica Money Market (the “Fund”) and Transamerica Fund Advisors, Inc. (“TFAI”), as well as the renewal of the investment sub-advisory agreement (the “Sub-Advisory Agreement”) of the Fund between TFAI and Transamerica Investment Management, LLC (the “Sub-Adviser”), to determine whether the agreements should be renewed for a six-month period. It was noted that this review was interim in nature to align all the Funds on the same calendar, and that the Funds’ advisory arrangements would be reviewed again in the first half of 2008.
Following their review and consideration, the Trustees determined that the renewal of the Investment Advisory Agreement and the Sub-Advisory Agreement would enable shareholders of the Fund to obtain high quality services at a cost that is appropriate, fair, and in the best interests of its shareholders. The Board, including the independent members of the Board, unanimously approved the renewal of the Investment Advisory Agreement and Sub-Advisory Agreement. In reaching their decision, the Trustees requested and obtained from TFAI and the Sub-Adviser such information as they deemed reasonably necessary to evaluate the agreements, including information about fees and performance of comparable funds managed by the Sub-Adviser. The Trustees also carefully considered information they had previously received from TFAI and the Sub-Adviser throughout the year as part of their regular oversight of the Fund, as well as comparative fee, expense, and performance information prepared by Lipper Inc. (“Lipper”), an independent provider of mutual fund performance, fee and expense information and profitability data prepared by management. In considering the proposed continuation of the Investment Advisory and Sub-Advisory Agreements, the Trustees evaluated a number of considerations that they believed, in light of the legal advice furnished to them by independent legal counsel and their own business judgment, to be relevant. They based their decisions on a variety of factors, including the following considerations, among others, although they did not identify any consideration or particular information that was controlling of their decisions:
The nature, extent and quality of the advisory services to be provided. The Board considered the nature and quality of the services provided by TFAI and the Sub-Adviser to the Fund in the past, as well as the services anticipated to be provided in the future. The Board concluded that TFAI and the Sub-Adviser are capable of providing high quality services to the Fund, as indicated by the nature and quality of services provided in the past by TFAI and the Sub-Adviser for this series and the experience, capability and integrity of TFAI’s senior management, the financial resources of TFAI and the Sub-Adviser, TFAI’s management oversight process and the professional qualifications of the portfolio management team of the Sub-Adviser. The Trustees determined that TFAI and the Sub-Adviser can provide investment and related services that are appropriate in scope and extent in light of the Fund’s operations, the competitive landscape of the investment company business and investor needs.
The investment performance of the Fund. The Board examined the short and longer-term performance of the Fund, including relative performance against a peer universe of comparable mutual funds as prepared by Lipper for various trailing periods ended June 30, 2007. The Board noted that the Fund’s performance was good compared to its peer universe over the past 1-, 3- and 5-year periods. The Board also noted that the Fund performed above the median for its peer universe over the past 10-year period. On the basis of the Board’s assessment of the nature, extent and quality of advisory services to be provided or procured by TFAI and the Sub-Adviser, the Board concluded that TFAI and the Sub-Adviser are capable of providing a level of investment performance that is appropriate in light of the Fund’s proposed investment objectives, policies and strategies and competitive with other similarly situated investment companies.
The cost of advisory services provided and the level of profitability. The Board reviewed profitability information of TFAI’s cost of procuring fund management services, as well as the costs of its provision of administration, fund accounting and other services, to the Fund and to ATST as a whole by TFAI and its affiliates. The Board reviewed the management and sub-advisory fees for the Fund. The Board noted that the Fund’s contractual management fees and total expenses were below the median of the Fund’s peer group and universe. Based on their review, the Trustees determined that the management fees of the Fund generally are appropriate in light of the services expected to be provided or procured, the management fees and the anticipated profitability of the relationship between the Fund, TFAI and its affiliates, and the Sub-Adviser. In making these observations and determinations, the Board reviewed, among other things, comparative information provided by Lipper.
Whether fee levels reflect economies of scale and the extent to which economies of scale would be realized as the Fund grows. In evaluating the extent to which the management fees payable under the Investment Advisory and Sub-Advisory Agreements reflect economies of scale or will permit economies of scale to be realized in the future, the Board considered the specific reasons for the absence of breakpoints, and concluded that the absence of breakpoints was acceptable under the circumstances. The Trustees also concluded that they will have the opportunity to periodically reexamine whether the Fund has achieved economies of scale, and the appropriateness of management fees payable to TFAI and fees paid to the Sub-Adviser, in the future.
Benefits (such as soft dollars) to TFAI, its affiliates, or the Sub-Adviser from their relationship with the Fund. The Board concluded that other benefits anticipated to be derived by TFAI, its affiliates, and the Sub-Adviser from their relationships with the Fund are expected to be reasonable and fair, and consistent with industry practice and the best interests of the Fund and its shareholders. The Trustees noted that TFAI would not realize soft dollar benefits from its relationship with the Fund, and that the Sub-Adviser’s soft dollar trading is consistent with applicable law, including best execution requirements in particular..
12
Other considerations. The Board determined that TFAI has made a substantial commitment to the recruitment and retention of high quality personnel, and maintains the financial, compliance and operational resources reasonably necessary to manage the Fund in a professional manner that is consistent with the best interests of the Fund and its shareholders. In this regard, the Trustees favorably considered the procedures and policies in place by TFAI to enforce compliance with applicable laws and regulations and oversee the portfolio management activities of the Sub-Adviser. The Trustees also determined that TFAI has made a significant entrepreneurial commitment to the management and success of the Fund, reflected by TFAI’s expense limitation and fee waiver arrangements with the Fund which may result in TFAI waiving a substantial amount of management fees for the benefit of shareholders.
13
Transamerica Science & Technology
MARKET ENVIRONMENT
U.S. securities markets faced significant challenges in the twelve months ended December 31, 2007. The housing-market correction that began in 2006 gained momentum. Added to that were a credit-and-liquidity crisis triggered by rising defaults in sub-prime mortgages, concerns about inflation and mounting signs of an economic slowdown. After advancing early in the period, equities gave back some gains as quarterly earnings growth stalled out and it became evident that the housing and credit issues will linger into 2008, slowing the pace of consumer spending.
Against this backdrop, sector results varied greatly. Broadly speaking, defensive sectors (e.g., healthcare) and sectors with large exposure to booming foreign economies (e.g., materials/processing) held up best. However, within the healthcare segment, individual company results were highly mixed – as they were for technology stocks, where some industries (e.g., personal electronics/communications) experienced strongly positive returns and others made little or no headway (e.g., semiconductors).
Telecommunications stocks generally fared poorly as investors worried that, in the face of uncertainty and higher costs for core items like food and energy, consumers will spend less on wireless services.
PERFORMANCE
For the year ended December 31, 2007, Transamerica Science & Technology, Initial Class returned 32.75%. By comparison its benchmark, the Dow Jones U.S. Technology Index, returned 15.72%.
STRATEGY REVIEW
The portfolio was invested in a mix of well-run businesses positioned to benefit from at least one of several long-term secular trends. Among these are the digitization of media for mass consumer adoption; development and delivery of alternative energy; and the development of biotechnology products and treatments for large markets. This positioning paid off during the year.
Key contributors included Research in Motion Limited (“RIMM”), Apple Inc. (“Apple”), Intuitive Surgical, Inc. (“Intuitive”), and SunPower Corporation (“SunPower”). RIMM, which manufactures smart phones with email capabilities, continued to see growth in both its business and consumer segments. Buoyed by rising sales of iPods, iPhones and, increasingly, its laptop and personal computers, Apple maintained its double- digit growth rate. Intuitive designs and manufactures robotic systems for minimally invasive surgery. Adoption of its technology is growing very rapidly. SunPower, a provider of solar energy panels, is vertically integrated, with manufacturing, distribution and installation capabilities. This competitive advantage, combined with a powerful wave of demand for more affordable energy sources, led to strong sales growth throughout 2007.
In contrast, falling demand from consumers (or the fear thereof) led to a decline for MetroPCS Communications, Inc., a niche- market wireless communications provider. We like the company’s low-cost, competitive business model and maintained the position. Another key detractor was Akamai Technologies, Inc. (“Akamai”), which provides a hardware product that can be added to networks to speed up the transmission of data. To date, Akamai has no major competition for this network-enhancing product. Nonetheless, concern that competition could materialize weighed on the stock. Although that remains to be seen, we reduced the position by half as a precaution.
Kirk J. Kim
Gary U. Rollé, CFA
Joshua D. Shaskan, CFA
Jeffrey J. Hoo, CFA
Co-Portfolio Managers
Transamerica Investment Management, LLC
AEGON/Transamerica Series Trust | Annual Report 2007 |
1
Transamerica Science & Technology
(unaudited)
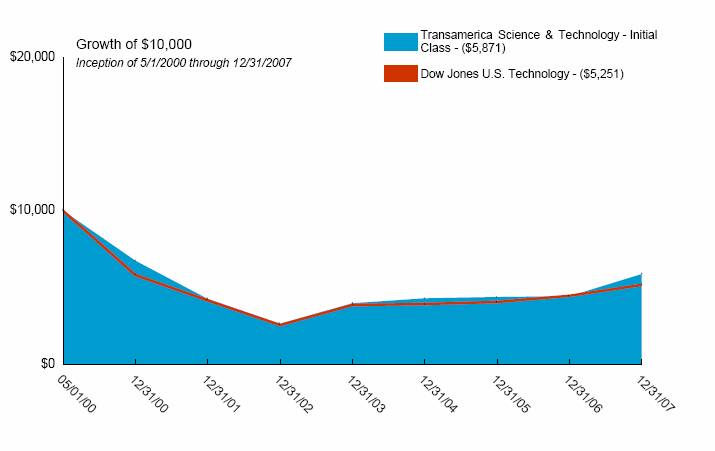
Average Annual Total Return for Periods Ended 12/31/2007
| | | | | | From | | Inception | |
| | 1 Year | | 5 Years | | Inception | | Date | |
| | | | | | | | | |
Initial Class | | 32.75 | % | 17.42 | % | (6.71 | )% | 5/1/00 | |
Dow Jones U.S. Technology(1) | | 15.72 | % | 15.13 | % | (8.05 | )% | 5/1/00 | |
| | | | | | | | | |
Service Class | | 32.50 | % | — | % | 15.19 | % | 5/1/03 | |
NOTES
(1) The Dow Jones U.S. Technology (DJ Technology) Index is an unmanaged index used as a general measure of market performance. Calculations assume dividends and capital gains are reinvested and do not include any managerial expenses. From inception calculation is based on life of Initial Class shares.
The performance data presented represents past performance, future results may vary. The portfolio’s investment return and net asset value will fluctuate. Past performance does not guarantee future results. Investor’s units when redeemed, may be worth more or less than their original cost.
Current performance may be lower or higher than performance quoted. Please visit your insurance company’s website for contract or policy level standardized total returns current to the most recent month end. Portfolio performance is net of investment fees and fund expenses, but not product charges, which, if included, would significantly lower the performance quoted.
This material must be preceded or accompanied by a current prospectus, which includes specific contents regarding the investment objectives, explanation of share classes and policies of this portfolio.
Investing in technology stocks generally involves greater volatility and risks so an investment in the portfolio may not be appropriate for everyone.
2
Transamerica Science & Technology
UNDERSTANDING YOUR FUND’S EXPENSES
(unaudited)
SHAREHOLDER EXPENSES
Fund shareholders may incur ongoing costs, including management and advisory fees, distribution and service fees, and other fund expenses.
The following Example is intended to help you understand your ongoing costs (in dollars and cents) of investing in the Fund and to compare these costs with the ongoing costs of investing in other funds.
The Example is based on an investment of $1,000 invested at July 1, 2007 and held for the entire period until December 31, 2007.
ACTUAL EXPENSES
The first line in the table below provides information about actual account values and actual expenses. You may use the information in this line, together with the amount you invested, to estimate the expenses that you paid over the period. Simply divide your account value by $1,000 (for example, an $8,600 account value divided by $1,000 = 8.6), then multiply the result by the number in the first line of your Fund under the heading entitled “Expenses Paid During Period” to estimate the expenses you paid on your account during this period. If your account is an IRA, your expenses could have included a $15 annual fee. The amount of any fee paid through your account would increase the estimate of expenses you paid during the period and decrease your ending account value.
HYPOTHETICAL EXAMPLE FOR COMPARISON PURPOSES
The second line in the table below provides information about hypothetical account values and hypothetical expenses based on the Fund’s actual expense ratio and an assumed rate of return of 5% per year before expenses, which is not the Fund’s actual return. The hypothetical account values and expenses may not be used to estimate the actual ending account balance or expenses you paid for the period. You may use this information to compare the ongoing costs of investing in your Fund and other funds. To do so, compare this 5% hypothetical example with the 5% hypothetical examples that appear in the shareholder reports of the other funds.
Please note that the expenses shown in the table are meant to highlight your ongoing costs only and do not reflect any transactional costs, such as sales charges, redemption fees, brokerage commissions paid on purchases and sales of fund shares. Therefore, the second line under the Fund in the table is useful in comparing ongoing costs only, and will not help you determine the relative total costs of owning different funds. If any of these transaction costs were included, your costs would be higher. The expenses shown in the table do not reflect any fees that may be charged to you by brokers, financial intermediaries or other financial institutions.
| | Beginning
Account
Value | | Ending
Account
Value | | Annualized
Expense
Ratio | | Expenses
Paid During
Period (a) | |
| | | | | | | | | |
Initial Class | | | | | | | | | |
Actual | | $ | 1,000.00 | | $ | 1,170.68 | | 0.85 | % | $ | 4.65 | |
Hypothetical (b) | | 1,000.00 | | 1,020.97 | | 0.85 | | 4.33 | |
| | | | | | | | | |
Service Class | | | | | | | | | |
Actual | | 1,000.00 | | 1,169.98 | | 1.10 | | 6.02 | |
Hypothetical (b) | | 1,000.00 | | 1,019.66 | | 1.10 | | 5.60 | |
| | | | | | | | | | | | |
(a) Expenses are calculated using the Fund’s annualized expense ratio (as disclosed in the table), multiplied by the average account value for the period, multiplied by the number of days in the period (184 days), and divided by the number of days in the year (365 days).
(b) 5% return per year before expenses.
GRAPHICAL PRESENTATION OF SCHEDULE OF INVESTMENTS
By Industry
At December 31, 2007
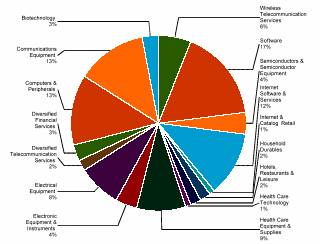
This chart shows the percentage breakdown by industry of the Fund’s total investment securities.
3
Transamerica Science & Technology
SCHEDULE OF INVESTMENTS
At December 31, 2007
(all amounts except share amounts in thousands)
| | Shares | | Value | |
COMMON STOCKS (97.6%) | | | | | |
Biotechnology (2.6%) | | | | | |
Gilead Sciences, Inc. ‡ | | 112,200 | | $ | 5,162 | |
Communications Equipment (12.8%) | | | | | |
F5 Networks, Inc. ‡ | | 124,400 | | 3,548 | |
Foundry Networks, Inc. ‡ | | 139,700 | | 2,447 | |
Polycom, Inc. ‡ | | 134,300 | | 3,731 | |
Research In Motion, Ltd. ‡ | | 115,500 | | 13,098 | |
Riverbed Technology, Inc. ‡ | | 108,300 | | 2,896 | |
Computers & Peripherals (12.6%) | | | | | |
Apple, Inc. ‡ | | 70,000 | | 13,866 | |
EMC Corp. ‡ | | 347,600 | | 6,441 | |
Logitech International ‡ | | 132,800 | | 4,866 | |
Diversified Financial Services (3.1%) | | | | | |
CME Group, Inc. Class A | | 8,900 | | 6,105 | |
Diversified Telecommunication Services (1.6%) | | | | | |
AT&T, Inc. | | 76,800 | | 3,192 | |
Electrical Equipment (7.4%) | | | | | |
Fuelcell Energy, Inc. ‡^ | | 350,000 | | 3,472 | |
Sunpower Corp. Class A ‡^ | | 87,100 | | 11,357 | |
Electronic Equipment & Instruments (4.0%) | | | | | |
Itron, Inc. ‡^ | | 49,200 | | 4,722 | |
Trimble Navigation, Ltd. ‡ | | 110,300 | | 3,335 | |
Health Care Equipment & Supplies (9.3%) | | | | | |
Intuitive Surgical, Inc. ‡ | | 39,200 | | 12,721 | |
NuVasive, Inc. ‡^ | | 151,500 | | 5,987 | |
Health Care Technology (1.4%) | | | | | |
Cerner Corp. ‡ | | 51,100 | | 2,882 | |
Hotels, Restaurants & Leisure (1.6%) | | | | | |
International Game Technology | | 70,800 | | 3,110 | |
Household Durables (1.6%) | | | | | |
Harman International Industries, Inc. | | 44,300 | | $ | 3,265 | |
Internet & Catalog Retail (1.4%) | | | | | |
Shutterfly, Inc. ‡^ | | 108,900 | | 2,790 | |
Internet Software & Services (11.8%) | | | | | |
Akamai Technologies, Inc. ‡^ | | 87,600 | | 3,031 | |
Equinix, Inc. ‡^ | | 70,800 | | 7,156 | |
Google, Inc. Class A ‡ | | 14,800 | | 10,234 | |
Valueclick, Inc. ‡ | | 141,700 | | 3,103 | |
Semiconductors & Semiconductor Equipment (4.0%) | | | | | |
NVIDIA Corp. ‡ | | 115,700 | | 3,936 | |
Sirf Technology Holdings, Inc. ‡^ | | 162,800 | | 4,091 | |
Software (16.8%) | | | | | |
Activision, Inc. ‡ | | 188,800 | | 5,607 | |
Adobe Systems, Inc. ‡ | | 82,137 | | 3,510 | |
Informatica Corp. ‡ | | 238,000 | | 4,289 | |
Macrovision Corp. ‡ | | 265,000 | | 4,857 | |
Nintendo Co., Ltd. | | 3,500 | | 2,055 | |
Nuance Communications, Inc. ‡^ | | 142,600 | | 2,664 | |
Salesforce.Com, Inc. ‡^ | | 107,800 | | 6,758 | |
Synchronoss Technologies, Inc. ‡^ | | 111,300 | | 3,945 | |
Wireless Telecommunication Services (5.6%) | | | | | |
American Tower Corp. Class A ‡ | | 74,800 | | 3,187 | |
Metropcs Communications, Inc. ‡^ | | 264,600 | | 5,146 | |
NII Holdings, Inc. ‡ | | 57,500 | | 2,778 | |
Total Common Stocks (cost $144,863) | | | | 195,340 | |
| | | | | |
Total Securities Lending Collateral (cost $45,812) (1) | | | | 45,812 | |
| | | | | |
Total Investment Securities (cost $190,675) # | | | | $ | 241,152 | |
NOTES TO SCHEDULE OF INVESTMENTS:
^ | | At December 31, 2007, all or a portion of this security is on loan (see Note 1). The value at December 31, 2007, of all securities on loan is $44,501. |
‡ | | Non-Income Producing. |
(1) | | Cash collateral for the Repurchase Agreements, valued at $16,606, that serves as collateral for securities lending, is invested in corporate bonds with interest rates and maturity dates ranging from 3.00% - 10.18% and 04/28/2008 - 12/01/2096, respectively. |
# | | Aggregate cost for federal income tax purposes is $190,784. Aggregate gross unrealized appreciation for all securities in which there is an excess of value over tax cost and aggregate gross unrealized depreciation for all securities in which there is an excess of tax cost over value were $57,644 and $7,276, respectively. Net unrealized appreciation for tax purposes is $50,368. |
The notes to the financial statements are an integral part of this report.
4
Transamerica Science & Technology
STATEMENT OF ASSETS AND LIABILITIES
At December 31, 2007
(all amounts except per share amounts in thousands)
Assets: | | | |
Investment securities, at value (cost: $190,675)
(including securities loaned of $44,501) | | $ | 241,152 | |
Cash | | 4,786 | |
Foreign currency (cost: $27) | | 28 | |
Receivables: | | | |
Shares sold | | 152 | |
Interest | | 17 | |
Income from loaned securities | | 36 | |
Dividends | | 15 | |
| | 246,186 | |
Liabilities: | | | |
Accounts payable and accrued liabilities: | | | |
Shares redeemed | | 49 | |
Management and advisory fees | | 131 | |
Distribution and service fees | | 2 | |
Administration fees | | 3 | |
Payable for collateral for securities on loan | | 45,812 | |
Other | | 39 | |
| | 46,036 | |
Net Assets | | $ | 200,150 | |
| | | |
Net Assets Consist of: | | | |
Capital Stock ($.01 par value) | | $ | 374 | |
Additional paid-in capital | | 142,171 | |
Undistributed (accumulated) net investment loss | | (2 | ) |
Undistributed (accumulated) net realized gain from investment securities | | 7,129 | |
Net unrealized appreciation on investment securities | | 50,477 | |
Net unrealized appreciation on translation of assets and liabilities denominated in foreign currencies | | 1 | |
Net Assets | | $ | 200,150 | |
Net Assets by Class: | | | |
Initial Class | | $ | 193,067 | |
Service Class | | 7,083 | |
Shares Outstanding: | | | |
Initial Class | | 36,084 | |
Service Class | | 1,337 | |
Net Asset Value and Offering Price Per Share: | | | |
Initial Class | | $ | 5.35 | |
Service Class | | 5.30 | |
STATEMENT OF OPERATIONS
For the year ended December 31, 2007
(all amounts in thousands)
Investment Income: | | | |
Dividends | | $ | 247 | |
Interest | | 97 | |
Income from loaned securities-net | | 400 | |
| | 744 | |
| | | |
Expenses: | | | |
Management and advisory fees | | 1,242 | |
Printing and shareholder reports | | 21 | |
Custody fees | | 24 | |
Administration fees | | 32 | |
Legal fees | | 3 | |
Audit fees | | 20 | |
Trustees fees | | 5 | |
Distribution and service fees: | | | |
Service Class | | 10 | |
Other | | 2 | |
Total expenses | | 1,359 | |
| | | |
Net Investment Loss | | (615 | ) |
| | | |
Net Realized Gain (Loss) from: | | | |
Investment securities | | 9,236 | |
| | | |
Net Increase (Decrease) in Unrealized Appreciation (Depreciation) on: | | | |
Investment securities | | 35,919 | |
| | | |
Net Realized and Unrealized Gain: | | 45,155 | |
Net Increase In Net Assets Resulting from Operations | | $ | 44,540 | |
The notes to the financial statements are an integral part of this report.
5
Transamerica Science & Technology
STATEMENT OF CHANGES IN NET ASSETS
For the years ended
(all amounts in thousands)
| | Year Ended
December 31,
2007 | | Year Ended
December 31,
2006 | |
Increase (Decrease) in Net Assets From: | | | | | |
Operations: | | | | | |
Net investment (loss) | | $ | (615 | ) | $ | (481 | ) |
Net realized gain (loss) from investment securities | | 9,236 | | (364 | ) |
Change in unrealized appreciation on investment securities | | 35,919 | | 2,148 | |
Net increase (decrease) in net assets resulting from operations | | 44,540 | | 1,303 | |
Distributions to Shareholders: | | | | | |
From net realized gains: | | | | | |
Initial Class | | — | | (10,896 | ) |
Service Class | | — | | (177 | ) |
| | — | | (11,073 | ) |
Capital Share Transactions: | | | | | |
Proceeds from shares sold: | | | | | |
Initial Class | | 38,229 | | 8,552 | |
Service Class | | 6,385 | | 1,106 | |
| | 44,614 | | 9,658 | |
Dividends and distributions reinvested: | | | | | |
Initial Class | | — | | 10,896 | |
Service Class | | — | | 177 | |
| | — | | 11,073 | |
Cost of shares redeemed: | | | | | |
Initial Class | | (24,486 | ) | (27,188 | ) |
Service Class | | (2,900 | ) | (889 | ) |
| | (27,386 | ) | (28,077 | ) |
| | 17,228 | | (7,346 | ) |
Net increase (decrease) in net assets | | 61,768 | | (17,116 | ) |
| | | | | |
Net Assets: | | | | | |
Beginning of year | | 138,382 | | 155,498 | |
End of year | | $ | 200,150 | | $ | 138,382 | |
Undistributed (Accumulated) Net Investment Income (Loss) | | $ | (2 | ) | $ | (2 | ) |
Share Activity: | | | | | |
Shares issued: | | | | | |
Initial Class | | 7,774 | | 2,060 | |
Service Class | | 1,321 | | 272 | |
| | 9,095 | | 2,332 | |
Shares issued-reinvested from distributions: | | | | | |
Initial Class | | — | | 2,993 | |
Service Class | | — | | 49 | |
| | — | | 3,042 | |
Shares redeemed: | | | | | |
Initial Class | | (5,393 | ) | (6,506 | ) |
Service Class | | (610 | ) | (214 | ) |
| | (6,003 | ) | (6,720 | ) |
Net increase (decrease) in shares outstanding: | | | | | |
Initial Class | | 2,381 | | (1,453 | ) |
Service Class | | 711 | | 107 | |
| | 3,092 | | (1,346 | ) |
The notes to the financial statements are an integral part of this report.
6
Transamerica Science & Technology
FINANCIAL HIGHLIGHTS
For a share outstanding throughout each period(a)
| | Initial Class | |
| | Year Ended December 31, | |
| | 2007 | | 2006 | | 2005 | | 2004 | | 2003 | |
Net Asset Value | | | | | | | | | | | |
Beginning of period | | $ | 4.03 | | $ | 4.36 | | $ | 4.29 | | $ | 3.97 | | $ | 2.63 | |
Investment Operations | | | | | | | | | | | |
Net investment income (loss) | | (0.02 | ) | (0.01 | ) | (0.01 | ) | 0.02 | | (0.02 | ) |
Net realized and unrealized gain (loss) | | 1.34 | | 0.02 | | 0.10 | | 0.30 | | 1.36 | |
Total operations | | 1.32 | | 0.01 | | 0.09 | | 0.32 | | 1.34 | |
Distributions | | | | | | | | | | | |
From net investment income | | — | | — | | (0.02 | ) | — | | — | |
From net realized gains | | — | | (0.34 | ) | — | | — | | — | |
Total distributions | | — | | (0.34 | ) | (0.02 | ) | — | | — | |
Net Asset Value | | | | | | | | | | | |
End of period(b) | | $ | 5.35 | | $ | 4.03 | | $ | 4.36 | | $ | 4.29 | | $ | 3.97 | |
Total Return(c),(d) | | 32.75 | % | 1.01 | % | 2.06 | % | 8.06 | % | 50.95 | % |
Net Assets End of Period (000’s) | | $ | 193,067 | | $ | 135,878 | | $ | 153,247 | | $ | 209,049 | | $ | 213,164 | |
Ratio and Supplemental Data | | | | | | | | | | | |
Expenses to average net assets(e) | | 0.85 | % | 0.85 | % | 0.88 | % | 0.85 | % | 0.87 | % |
Net investment income (loss), to average net assets(e) | | (0.38 | )% | (0.33 | )% | (0.22 | )% | 0.38 | % | (0.57 | )% |
Portfolio turnover rate(d) | | 62 | % | 93 | % | 91 | % | 35 | % | 40 | % |
| | | | | | | | | | | |
For a share outstanding throughout each period(a) | | | | | | | | |
| | | | | | | | |
| | Service Class |
| | Year Ended December 31, | | May 1 to Dec | |
| | 2007 | | 2006 | | 2005 | | 2004 | | 31, 2003 | |
Net Asset Value | | | | | | | | | | | |
Beginning of period | | $ | 4.00 | | $ | 4.34 | | $ | 4.28 | | $ | 3.97 | | $ | 3.00 | |
Investment Operations | | | | | | | | | | | |
Net investment income (loss) | | (0.03 | ) | (0.02 | ) | (0.02 | ) | 0.02 | | (0.02 | ) |
Net realized and unrealized gain (loss) | | 1.33 | | 0.02 | | 0.09 | | 0.29 | | 0.99 | |
Total operations | | 1.30 | | — | | 0.07 | | 0.31 | | 0.97 | |
Distributions | | | | | | | | | | | |
From net investment income | | — | | — | | (0.01 | ) | — | | — | |
From net realized gains | | — | | (0.34 | ) | — | | — | | — | |
Total distributions | | — | | (0.34 | ) | (0.01 | ) | — | | — | |
Net Asset Value | | | | | | | | | | | |
End of period(b) | | $ | 5.30 | | $ | 4.00 | | $ | 4.34 | | $ | 4.28 | | $ | 3.97 | |
Total Return(c),(d) | | 32.50 | % | 0.76 | % | 1.86 | % | 7.56 | % | 32.33 | % |
Net Assets End of Period (000’s) | | $ | 7,083 | | $ | 2,504 | | $ | 2,251 | | $ | 2,324 | | $ | 740 | |
Ratio and Supplemental Data | | | | | | | | | | | |
Expenses to average net assets(e) | | 1.10 | % | 1.10 | % | 1.13 | % | 1.15 | % | 1.12 | % |
Net investment income (loss), to average net assets(e) | | (0.65 | )% | (0.59 | )% | (0.47 | )% | 0.48 | % | (0.83 | )% |
Portfolio turnover rate(d) | | 62 | % | 93 | % | 91 | % | 35 | % | 40 | % |
(a) | | Per share information is calculated based on average number of shares outstanding. |
(b) | | Transamerica Science & Technology (the “Fund”) share class commenced operations as follows: |
| | Initial Class - May 1, 2000 |
| | Service Class - May 1, 2003 |
(c) | | Total Return reflects all portfolio expenses and includes reinvestment of dividends and capital gains; it does not reflect the charges and deductions under the policies or annuity contracts. |
(d) | | Not annualized. |
(e) | | Annualized. |
The notes to the financial statements are an integral part of this report.
7
Transamerica Science & Technology
NOTES TO FINANCIAL STATEMENTS
At December 31, 2007
(all amounts in thousands)
NOTE 1. ORGANIZATION AND SIGNIFICANT ACCOUNTING POLICIES
AEGON/Transamerica Series Trust (“ATST”) is an open-end management investment company registered under the Investment Company Act of 1940, as amended (the “1940 Act”). ATST serves as a funding vehicle for variable life insurance, variable annuity and group annuity products. Transamerica Science & Technology (the “Fund”) is part of ATST. The Fund is “non-diversified” under the 1940 Act.
In the normal course of business, the Fund enters into contracts that contain a variety of representations that provide general indemnifications. The Fund’s maximum exposure under these arrangements is unknown, as this would involve future claims that may be made against the Fund and/or its affiliates that have not yet occurred. However, based on experience, the Fund expects the risk of loss to be remote.
This report should be read in conjunction with the current Fund prospectus, which contains more complete information about the Fund.
In preparing the Fund’s financial statements in accordance with accounting principles generally accepted in the United States of America (“GAAP”), estimates or assumptions (which could differ from actual results) may be used that affect reported amounts and disclosures. The following is a summary of significant accounting policies followed by the Fund.
Multiple class operations, income and expenses: The Fund currently offers two classes of shares, an Initial Class and a Service Class. Income, non-class specific expenses and realized and unrealized gains and losses, are allocated daily to each class, based upon the value of shares outstanding method as permitted under Rule 1 8f-3 of the 1940 Act. Each class bears its own specific expenses as well as a portion of general, common expenses.
Security valuations: The Fund values its investments at the close of the New York Stock Exchange (“NYSE”), normally 4 p.m. ET, each day the NYSE is open for business. Fund investments are valued at the last sale price or closing price on the day of valuation taken from the primary exchange where the security is principally traded.
Securities traded in the over-the-counter market and listed securities for which no sale was reported on that date are valued at the last quoted bid price.
Debt securities are valued based on a price quotation or other equivalent indication of value supplied by an exchange, a pricing service or a major market maker; however, those that mature in sixty days or less are valued at amortized cost, which approximates market.
Investment company securities are valued at the net asset value of the underlying portfolio.
Foreign securities generally are valued based on quotations from the primary market in which they are traded. Because many foreign securities markets and exchanges close prior to the close of the NYSE, closing prices for foreign securities in those markets or on those exchanges do not reflect the events that occur after that close. If a significant market event impacting the value of a portfolio security (e.g., natural disaster, company announcement, market volatility) occurs subsequent to the close of trading in the security, but prior to the calculation of the Fund’s net asset value per share, market quotations for that security may be determined to be unreliable and, accordingly, not “readily available.” As a result, foreign equity securities held by the Fund may be valued at fair market value as determined in good faith by the Fund’s Administrative Valuation Committee, using guidelines adopted by the Board of Trustees.
Securities for which quotations are not readily available are valued at fair market value as determined in good faith by the Fund’s Administrative Valuation Committee, using guidelines adopted by the Board of Trustees.
Cash: The Fund may leave cash overnight in its cash account with the custodian, State Street Bank & Trust Company (“State Street”). On July 2, 2007, State Street acquired the parent company of Investors Bank & Trust Company. State Street has been contracted on behalf of the Fund to invest the excess cash into a savings account, which at December 31, 2007 was paying an interest rate of 2.60%.
Repurchase agreements: The Fund is authorized to enter into repurchase agreements. The Fund, through its custodian, State Street, receives delivery of the underlying securities, the value of which at the time of purchase is required to be an amount equal to at least 100% of the resale price. The Fund will bear the risk of value fluctuations until the security can be sold and may encounter delays and incur costs in liquidating the security. In the event of bankruptcy or insolvency of the seller, delays and costs may be incurred.
Commission recapture: The sub-adviser, to the extent consistent with the best execution and usual commission rate policies and practices, may place security transactions of the Fund with broker/dealers with which ATST has established a Commission Recapture Program. A Commission Recapture Program is any arrangement under which a broker/dealer applies a portion of the commissions received by such broker/dealer on the security transactions to the Fund. In no event will commissions paid by the Fund be used to pay expenses that would otherwise be borne by any other funds within ATST, or by any other party. There were no recaptured commissions during the year ended December 31, 2007.
Securities lending: The Fund may lend securities to qualified borrowers, with State Street acting as the Fund’s lending agent. The Fund earns negotiated lenders’ fees. The Fund receives cash and/or securities as collateral against the loaned securities. Cash collateral received is invested in short-term, interest-bearing securities. The Fund monitors the market value of securities loaned on a daily basis and requires collateral in an amount at least equal to the value of the securities loaned. Income from loaned securities earned by State Street for its services, shown in the Statement of Operations is net of fees, in the amount of $172.
8
NOTES TO FINANCIAL STATEMENTS (continued)
At December 31, 2007
(all amounts in thousands)
NOTE 1.–(continued)
The Fund has invested the cash collateral received from securities loaned in the following short-term interest bearing securities:
Abbey National PLC, Eurodollar Term, 5.00%, 1/7/2008 | | $ | 1,977 | |
ABN AMRO Bank NV, Eurodollar Term, 5.18%, 1/4/2008 | | 1,582 | |
Bank of Nova Scotia, Eurodollar Term, 4.96%, 1/22/2008 | | 1,384 | |
Barclays, Eurodollar Term, 5.00%, 2/12/2008 | | 2,768 | |
BNP Paribas, Eurodollar Term, 5.01%, 1/11/2008 | | 2,571 | |
Calyon, Eurodollar Term, 5.12%, 3/3/2008 | | 593 | |
Credit Suisse First Boston Corp., Repurchase Agreement, 4.60%, 1/2/2008 | | 5,141 | |
Dexia Group, Eurodollar Term, 4.82%, 1/3/2008 | | 1,978 | |
HBOS Halifax Bank of Scotland, Eurodollar Term, 5.15%, 1/2/2008 | | 989 | |
JPMorgan Chase & Co., Eurodollar Term, 5.15%, 2/12/2008 | | 989 | |
Lloyds TSB Bank, Eurodollar Term, 5.15%, 1/24/2008 | | 1,978 | |
Merrill Lynch & Co. (RPG), Repurchase Agreement, 4.60%, 1/2/2008 | | 2,966 | |
Morgan Stanley & Co. (Corp. Repo), Repurchase Agreement, 4.60%, 1/2/2008 | | 8,108 | |
Rabobank Nederland, Eurodollar Term, 5.08%, 1/10/2008 | | 2,373 | |
Reserve Primary Money Market Fund, 4.95% | | 2,109 | |
Royal Bank of Scotland, Eurodollar Term, 5.00%, 2/25/2008 | | 2,373 | |
Societe Generale, Eurodollar Term, 5.15%, 3/3/2008 | | 1,187 | |
Toronto Dominion Bank, Eurodollar Term, 5.05%, 1/10/2008 | | 2,373 | |
UBS AG, Eurodollar Term, 4.92%, 1/11/2008 | | 1,384 | |
Wells Fargo, Bank Note, 4.75%, 1/8/2008 | | 989 | |
| | | |
| | $ | 45,812 | |
Security transactions and investment income: Security transactions are recorded on the trade date. Security gains and losses are calculated on the first-in, first-out basis. Dividend income, if any, is recorded on the ex-dividend date or, in the case of foreign securities, as soon as the Fund is informed of the ex-dividend date. Interest income, including accretion of discounts and amortization of premiums, is recorded on the accrual basis commencing on the settlement date.
Dividend distributions: Dividends and capital gains distributions are typically declared and reinvested annually and are generally paid and reinvested on the business day following the ex-date.
NOTE 2. RELATED PARTY TRANSACTIONS
ATST serves as a funding vehicle for certain affiliated asset allocation portfolios and certain affiliated separate accounts of Western Reserve Life Assurance Co. of Ohio, Transamerica Life Insurance Company, Transamerica Financial Life Insurance Company, Inc., Monumental Life Insurance Company and Transamerica Occidental Life Insurance Company.
Transamerica Fund Advisors, Inc. (“TFAI”) is the Fund’s investment adviser. Transamerica Fund Services, Inc. (“TFS”) is the Fund’s administrator and transfer agent. Prior to May 1, 2007, AFSG Securities Corp. (“AFSG”), was the Fund’s distributor. Transamerica Capital Inc. (“TCI”) is now the Fund’s distributor. TFAI, TFS, AFSG, and TCI are affiliates of AEGON NV, a Netherlands corporation.
Transamerica Investment Management, LLC (“TIM”) is an affiliate of the Fund and is a sub-adviser to the Fund.
Certain officers and trustees of the Fund are also officers and/or directors of TFAI, TFS and TCI.
The following schedule reflects the percentage of Fund assets owned by affiliated investment companies at December 31, 2007:
| | Net | | % of Net | |
| | Assets | | Assets | |
| | | | | |
Asset Allocation-Growth Portfolio | | 2,802 | | 1.40 | |
Asset Allocation-Moderate Growth Portfolio | | 60,700 | | 30.33 | |
Asset Allocation-Moderate Portfolio | | 46,626 | | 23.29 | |
Total | | $ | 110,128 | | 55.02 | % |
| | | | | | |
Investment advisory fee: The Fund pays management fees to TFAI based on average daily net assets (“ANA”) at the following breakpoints:
0.78% of the first $500 million of ANA
0.70% of ANA over $500 million
TFAI has contractually agreed to waive its advisory fee and will reimburse the Fund to the extent that operating expenses, excluding 12b-1 fees, exceed the following stated annual limit:
0.98% Expense Limit
If total Fund expenses fall below the annual expense limitation agreement agreed to by the adviser within the succeeding three years, the Fund may be required to pay the adviser a portion or all of the waived advisory fees.
There were no amounts recaptured during the year ended December 31, 2007. There are no amounts available for recapture at December 31, 2007.
Distribution and service fees: ATST entered into a Distribution Agreement with AFSG dated January 1, 1997, as amended. On May 1, 2007, the Distribution Agreement was amended to replace AFSG with TCI as the Fund’s distributor. The Fund has also adopted a distribution plan (“Distribution Plan”) pursuant to Rule 12b-1 under the 1940 Act.
Under the Distribution Plan for the Initial Class shares, TCI, on behalf of the Fund, is authorized to pay various service providers, as direct payment for expenses incurred in connection with distribution of the Fund’s shares, amounts equal to actual expenses associated with distributing the shares.
The Distribution Plan for the Service Class shares requires ATST to pay distribution fees to TCI as compensation for its activities, not as reimbursement for specific expenses. The fee on the Service Class is paid to the insurance companies for providing services and account maintenance for their
9
NOTES TO FINANCIAL STATEMENTS (continued)
At December 31, 2007
(all amounts in thousands)
NOTE 2.–(continued)
policyholders who invest in the variable insurance products which invest in the Service Class shares.
The Fund is authorized under the Distribution Plan to pay fees on each class up to the following limits:
Initial Class | | 0.15% |
Service Class | | 0.25% |
TCI has determined that it will not seek payment by the Fund of the distribution expenses incurred with respect to the Initial Class shares before April 30, 2009. Prior to TCI seeking reimbursement of future expenses, policy and contract owners will be notified in advance. The Fund will pay fees relating to Service Class shares.
Administrative services: The Fund has entered into an agreement with TFS for financial and legal fund administration services. The Fund pays TFS an annual fee of 0.02% of ANA. The Legal fees on the Statement of Operations are for fees paid to external legal counsel.
Deferred compensation plan: Each eligible independent Fund Trustee may elect participation in a non-qualified deferred compensation plan (“the Plan”). Under the Plan, such Trustees may defer payment of all or a portion of their total fees earned as a Fund Trustee. Each Trustee who is a participant in the Plan may elect that the earnings, losses or gains credited to his or her deferred fee amounts be determined based on a deemed investment in any series of Transamerica IDEX Mutual Funds. The right of a participant to receive a distribution from the Plan of the deferred fees is an unsecured claim against the general assets of all series of Transamerica IDEX Mutual Funds. The pro rata liability to the Fund of all deferred fees in the Plan amounted, as of December 31, 2007, to $10. Amounts deferred under the Deferred Compensation Plan are unfunded against the general assets of ATST.
Retirement plan: Under a retirement plan (the “Emeritus Plan”) available to the Independent Trustees, each Independent Trustee is deemed to have elected to serve as Trustee Emeritus of ATST upon his or her termination of service, other than removal for cause, is entitled to 50% of the trustee’s current retainer for a maximum period of five years determined by his or her years of service as a Trustee.
Such amounts shall be accrued by ATST on a pro rata basis allocable to each series of ATST fund based on the relative assets of the series. If retainers increase in the future, past accruals (and credits) will be adjusted upward so that 50% of the Trustee’s current retainer is accrued and credited at all times. Upon death, disability or termination of service, other than removal for cause, amounts deferred become payable to a Trustee Emeritus (or his/her beneficiary). Upon the commencement of service as Trustee Emeritus, compensation will be paid on a quarterly basis during the time period that the Trustee Emeritus is allowed to serve as such.
Amounts accrued under the Emeritus Plan are unsecured claims against the general assets of ATST. For the year ended December 31, 2007, the amount related to the Emeritus Plan was $6. As of December 31, 2007, the Fund has not made any payments related to the Emeritus Plan.
The Emeritus Plan was terminated effective October 30, 2007. Upon the termination, the Fund shall continue to pay any remaining benefits in accordance with the Plan, but no further compensation shall accrue under the Plan.
NOTE 3. INVESTMENT TRANSACTIONS
The cost of securities purchased and proceeds from securities sold (excluding short-term securities) for the year ended December 31, 2007 were as follows:
Purchases of securities: | | | |
Long-term | | $ | 111,203 | |
U.S. Government | | — | |
Proceeds from maturities and sales of securities: | | | |
Long-term | | 97,372 | |
U.S. Government | | — | |
| | | | |
NOTE 4. FEDERAL INCOME TAX MATTERS
The Fund has not made any provision for federal income or excise taxes due to its policy to distribute all of its taxable income and capital gains to its shareholders and otherwise qualify as a regulated investment company under Subchapter M of the Internal Revenue Code. Income and capital gain distributions are determined in accordance with income tax regulations, which may differ from GAAP. These differences are primarily due to differing treatment for items including, but not limited to, wash sales, net operating losses, and capital loss carryforwards.
Therefore, distributions determined in accordance with tax regulations may differ significantly in amount or character from net investment income and realized gains for financial reporting purposes. Financial reporting records are adjusted for permanent book/tax differences to reflect tax character. Financial records are not adjusted for temporary differences. These reclassifications are as follows:
Additional paid-in capital | | $ | (6 | ) |
Undistributed (accumulated) net investment income (loss) | | $ | 615 | |
Undistributed (accumulated) net realized gain (loss) from investment securities | | $ | (609 | ) |
The capital loss carryforward utilized during the year ended December 31, 2007 was $1,440.
10
NOTES TO FINANCIAL STATEMENTS (continued)
At December 31, 2007
(all amounts in thousands)
NOTE 4.–(continued)
The tax character of distributions paid may differ from the character of distributions shown in the Statements of Changes in Net Assets due to short-term gains being treated as ordinary income for tax purposes. The tax character of distributions paid during 2006 and 2007 was as follows:
2006 Distributions paid from: | | | |
Ordinary Income | | $ | 4,618 | |
Long-term Capital Gain | | 6,455 | |
| | | |
2007 Distributions paid from: | | | |
Ordinary Income | | — | |
Long-term Capital Gain | | — | |
| | | | |
The tax basis components of distributable earnings as of December 31, 2007 are as follows:
Undistributed Ordinary Income | | $ | — | |
Undistributed Long-term Capital Gain | | $ | 7,237 | |
Capital Loss Carryforward | | $ | — | |
Net Unrealized Appreciation (Depreciation) | | $ | 50,368 | |
NOTE 5. REGULATORY PROCEEDINGS
There continues to be significant federal and state regulatory activity relating to financial services companies, particularly mutual fund companies and their investment advisers. As part of an ongoing investigation regarding potential market timing, recordkeeping and trading compliance issues and matters affecting the Fund’s investment adviser, TFAI, and certain affiliates and former employees of TFAI, the SEC staff has indicated that it is likely to take some action against TFAI and certain of its affiliates at the conclusion of the investigation. The potential timing and the scope of any such action is difficult to predict. Although the impact of any action brought against TFAI and/or its affiliates is difficult to assess at the present time, the Fund currently believes that the likelihood that any such action will have a material adverse impact is remote. It is important to note that the Fund is not aware of any allegation of wrongdoing against it and its Board at the time this annual report is printed. Although it is not anticipated that these developments will have an adverse impact on the Fund, there can be no assurance at this time. TFAI and its affiliates are actively working with the SEC in regard to this matter; however, the exact resolution cannot be determined at this time. TFAI will take such actions that it deems necessary or appropriate to continue providing management services to the Fund and to bring all matters to an appropriate conclusion.
TFAI and/or its affiliates, and not the Fund, will bear the costs regarding these regulatory matters.
NOTE 6. RECENTLY ISSUED ACCOUNTING PRONOUNCEMENTS
In July 2006, the Financial Accounting Standards Board (“FASB”) released FASB Interpretation No. 48 “Accounting for Uncertainty in Income Taxes” (“FIN 48”), an interpretation of FASB Statement No. 109. FIN 48 provides guidance for how uncertain tax positions should be recognized, measured, presented and disclosed in the financial statements. FIN 48 requires the accounting and disclosure of tax positions taken or expected to be taken in the course of preparing the Fund’s tax returns to determine whether the tax positions are “more-likely- than-not” of being sustained by the applicable tax authority. Tax positions not deemed to meet the more-likely-than-not threshold would be recorded as a tax benefit or expense in the current year.
Adoption of FIN 48 is effective during the first required financial reporting period for fiscal years beginning after December 15, 2006. Management adopted FIN 48 on June 29, 2007.
Implementation of FIN 48 requires Management of the Fund to analyze all open tax years, as defined by the Statute of Limitations, for all major jurisdictions, which includes federal and certain states. Open tax years are those that are open for exam by taxing authorities (i.e., the last 4 tax year ends and the interim tax period since then). The Fund has no examinations in progress and none are expected at this time.
Management of the Fund has reviewed all open tax years and major jurisdictions and concluded the adoption of FIN 48 resulted in no impact to the Fund’s net assets or results of operations. There is no tax liability resulting from unrecognized tax benefits relating to uncertain income tax positions taken or expected to be taken in future tax returns. The Fund is also not aware of any tax positions for which it is reasonably possible that the total amounts of unrecognized tax benefits will significantly change in the next 12 months.
In September 2006, FASB issued its new Standard No. 157, “Fair Value Measurements” (“FAS 157”). FAS 157 is designed to unify guidance for the measurement of fair value of all types of assets, including financial instruments, and certain liabilities, throughout a number of accounting standards. FAS 157 also establishes a hierarchy for measuring fair value in generally accepted accounting principles and expands financial statement disclosures about fair value measurements that are relevant to mutual funds. FAS 157 is effective for financial statements issued for fiscal years beginning after November 15, 2007, and earlier application is permitted.
As of December 31, 2007, Management does not expect the adoption of FAS 157 to impact the amounts reported in the financial statements, however, additional disclosures will be required about the inputs used to develop the measurements of fair value and the effect of certain of the measurements reported in the statement of operations for a fiscal period.
NOTE 7. SUBSEQUENT EVENT
Effective January 1, 2008, TFAI changed its name to Transamerica Asset Management, Inc.
Effective May 1, 2008, AEGON/Transamerica Series Trust will change its name to Transamerica Series Trust. At that time, the Fund will also change its name to Transamerica Science & Technology VP.
11
Report of Independent Registered Certified Public Accounting Firm
To the Board of Trustees and Shareholders of
Transamerica Science & Technology:
In our opinion, the accompanying statement of assets and liabilities, including the schedule of investments, and the related statements of operations and of changes in net assets and the financial highlights present fairly, in all material respects, the financial position of Transamerica Science & Technology (the “Fund”) (one of the portfolios constituting AEGON/Transamerica Series Trust) at December 31, 2007, the results of its operations for the year then ended, the changes in its net assets for each of the two years in the period then ended and the financial highlights for each of the periods presented, in conformity with accounting principles generally accepted in the United States of America. These financial statements and financial highlights (hereafter referred to as “financial statements”) are the responsibility of the Fund’s management; our responsibility is to express an opinion on these financial statements based on our audits. We conducted our audits of these financial statements in accordance with the standards of the Public Company Accounting Oversight Board (United States). Those standards require that we plan and perform the audit to obtain reasonable assurance about whether the financial statements are free of material misstatement. An audit includes examining, on a test basis, evidence supporting the amounts and disclosures in the financial statements, assessing the accounting principles used and significant estimates made by management, and evaluating the overall financial statement presentation. We believe that our audits, which included confirmation of securities at December 31, 2007 by correspondence with the custodian and brokers, provide a reasonable basis for our opinion.

Tampa, Florida
February 29, 2008
12
Transamerica Science & Technology
RESULTS OF SHAREHOLDER PROXY (unaudited)
At a special meeting of shareholders held on October 30, 2007, the results of the Proposals were as follows:
Proposal 1: To elect a new Board:
Proposed
Trustee | | For | | Against | | Abstentions/Broker Non-
Votes | |
John K. Carter | | 2,274,998,840.817 | | 57,804,698.755 | | 35,433.883 | |
| | | | | | | |
Leo J. Hill | | 2,277,212,702.754 | | 55,590,836.819 | | 35,433.883 | |
| | | | | | | |
Neal M. Jewell | | 2,266,793,295.663 | | 66,010,243.909 | | 35,433.883 | |
| | | | | | | |
Russell A. Kimball, Jr. | | 2,274,825,235.835 | | 57,978,303.737 | | 35,433.883 | |
| | | | | | | |
Eugene M. Mannella | | 2,274,623,165.033 | | 58,180,374.539 | | 35,433.883 | |
| | | | | | | |
Norm R. Nielsen | | 2,275,050,055.885 | | 57,753,483.687 | | 35,433.883 | |
| | | | | | | |
Joyce Galpern Norden | | 2,270,278,122.250 | | 62,525,417.323 | | 35,433.883 | |
| | | | | | | |
Patricia L. Sawyer | | 2,275,737,737.456 | | 57,065,802.116 | | 35,433.883 | |
| | | | | | | |
John W. Waechter | | 2,276,615,120.140 | | 56,188,419.433 | | 35,433.883 | |
Proposal 2: To approve an amendment to the Agreement and Declaration of Trust:
| | | | Abstentions/Broker Non- | |
For | | Against | | Votes | |
2,182,022,669.110 | | 77,590,048.544 | | 73,226,255.801 | |
13
Transamerica Science & Technology
INVESTMENT ADVISORY AND SUB-ADVISORY AGREEMENTS-REVIEW AND RENEWAL (unaudited)
At a meeting of the Board of Trustees of AEGON/Transamerica Series Trust (“ATST”) held on December 4th, 2007, the Board reviewed and considered the renewal of the investment advisory agreement (the “Investment Advisory Agreement”) between Transamerica Science & Technology (the “Fund”) and Transamerica Fund Advisors, Inc. (“TFAI”), as well as the renewal of the investment sub-advisory agreement (the “Sub-Advisory Agreement”) of the Fund between TFAI and Transamerica Investment Management, LLC (the “Sub- Adviser”), to determine whether the agreements should be renewed for a six-month period. It was noted that this review was interim in nature to align all the Funds on the same calendar, and that the Funds’ advisory arrangements would be reviewed again in the first half of 2008.
Following their review and consideration, the Trustees determined that the renewal of the Investment Advisory Agreement and the Sub-Advisory Agreement would enable shareholders of the Fund to obtain high quality services at a cost that is appropriate, fair, and in the best interests of its shareholders. The Board, including the independent members of the Board, unanimously approved the renewal of the Investment Advisory Agreement and Sub-Advisory Agreement. In reaching their decision, the Trustees requested and obtained from TFAI and the Sub-Adviser such information as they deemed reasonably necessary to evaluate the agreements, including information about fees and performance of comparable funds managed by the Sub-Adviser. The Trustees also carefully considered information they had previously received from TFAI and the Sub-Adviser throughout the year as part of their regular oversight of the Fund, as well as comparative fee, expense, and performance information prepared by Lipper Inc. (“Lipper”), an independent provider of mutual fund performance, fee and expense information and profitability data prepared by management. In considering the proposed continuation of the Investment Advisory and Sub-Advisory Agreements, the Trustees evaluated a number of considerations that they believed, in light of the legal advice furnished to them by independent legal counsel and their own business judgment, to be relevant. They based their decisions on a variety of factors, including the following considerations, among others, although they did not identify any consideration or particular information that was controlling of their decisions:
The nature, extent and quality of the advisory services to be provided. The Board considered the nature and quality of the services provided by TFAI and the Sub-Adviser to the Fund in the past, as well as the services anticipated to be provided in the future. The Board concluded that TFAI and the Sub-Adviser are capable of providing high quality services to the Fund, as indicated by the nature and quality of services provided in the past by TFAI and the Sub-Adviser for this series and the experience, capability and integrity of TFAI’s senior management, the financial resources of TFAI and the Sub-Adviser, TFAI’s management oversight process and the professional qualifications of the portfolio management team of the Sub-Adviser. The Trustees determined that TFAI and the Sub-Adviser can provide investment and related services that are appropriate in scope and extent in light of the Fund’s operations, the competitive landscape of the investment company business and investor needs.
The investment performance of the Fund. The Board examined the short and longer-term performance of the Fund, including relative performance against a peer universe of comparable mutual funds as prepared by Lipper for various trailing periods ended June 30, 2007. The Board noted that the Fund’s performance was below the median for its peer universe over the past 1-, 3- and 5- year periods. The Board also noted that the long-term performance of the Fund could be attributed in part to the Fund’s prior sub-adviser, Great Companies, which was replaced by the Sub-Adviser in August 2006. On the basis of the Board’s assessment of the nature, extent and quality of advisory services to be provided or procured by TFAI and the Sub-Adviser, the Board concluded that TFAI and the Sub-Adviser are capable of providing a level of investment performance that is appropriate in light of the Fund’s proposed investment objectives, policies and strategies and competitive with other similarly situated investment companies, but that the Board would be monitoring performance closely.
The cost of advisory services provided and the level of profitability. The Board reviewed profitability information of TFAI’s cost of procuring fund management services, as well as the costs of its provision of administration, fund accounting and other services, to the Fund and to ATST as a whole by TFAI and its affiliates. The Board reviewed the management and sub-advisory fees for the Fund. The Board noted that the Fund’s contractual management fees were above the median of the peer group and near the median of the peer universe. The Board also noted that the Fund’s total expenses were below the median of the peer group and were low compared to the peer universe. Based on their review, the Trustees determined that the management fees of the Fund generally are appropriate in light of the services expected to be provided or procured, the management fees and the anticipated profitability of the relationship between the Fund, TFAI and its affiliates, and the Sub-Adviser. In making these observations and determinations, the Board reviewed, among other things, comparative information provided by Lipper.
Whether fee levels reflect economies of scale and the extent to which economies of scale would be realized as the Fund grows. In evaluating the extent to which the management fees payable under the Investment Advisory and Sub-Advisory Agreements reflect economies of scale or will permit economies of scale to be realized in the future, the Board noted that TFAI and the Sub-Adviser offer breakpoints which appropriately benefit investors by passing on economies of scale in the form of lower management fees as the level of assets grows. The Trustees also concluded that they will have the opportunity to periodically reexamine whether the Fund has achieved economies of scale, and the appropriateness of management fees payable to TFAI and fees paid to the Sub-Adviser, in the future.
Benefits (such as soft dollars) to TFAI, its affiliates, or the Sub-Adviser from their relationship with the Fund. The Board concluded that other benefits anticipated to be derived by TFAI, its affiliates, and the Sub-Adviser from their relationships with the Fund are expected to be reasonable and fair, and consistent with industry practice and the best interests of the Fund and its shareholders. The Trustees noted that TFAI would not realize soft dollar benefits from its relationship with the Fund, and that the Sub-Adviser’s soft dollar trading is consistent with applicable law, including best execution requirements in particular. The Board also noted that the Sub-Adviser is participating in a brokerage program pursuant to which a portion of brokerage commissions paid by the Fund is recaptured for the benefit of the Fund and its shareholders, thus limiting the amount of soft dollar arrangements the Sub-Adviser may engage in with respect to the Fund’s brokerage transactions.
14
Other considerations. The Board determined that TFAI has made a substantial commitment to the recruitment and retention of high quality personnel, and maintains the financial, compliance and operational resources reasonably necessary to manage the Fund in a professional manner that is consistent with the best interests of the Fund and its shareholders. In this regard, the Trustees favorably considered the procedures and policies in place by TFAI to enforce compliance with applicable laws and regulations and oversee the portfolio management activities of the Sub-Adviser. The Trustees also determined that TFAI has made a significant entrepreneurial commitment to the management and success of the Fund, reflected by TFAI’s expense limitation and fee waiver arrangements with the Fund which may result in TFAI waiving a substantial amount of management fees for the benefit of shareholders.
15
Transamerica Small/Mid Cap Value
MARKET ENVIRONMENT
After several years of outperforming growth stocks, value stocks ceded leadership in the year ended December 31, 2007. The lagging results for the value group can be attributed to second-half turmoil in the various corners of the financial industry, which comprises the largest portion of many value indexes, and to weakness among consumer discretionary stocks.
At the center of the turbulence was the U.S. housing market, which continued the downward spiral that began in 2007. The problem took on new, far-reaching dimensions when defaults on lower-quality (sub-prime) home loans rose sharply, toppling a complex structure of investment vehicles that were underpinned by the risky loans. Lenders responded by tightening their standards. As credit became more difficult to obtain, spending contracted. Attempts to resolve the housing and credit issues and prop up the economy – a total of 1.0% in interest-rate reductions by the Federal Reserve Board (“Fed”) and capital infusions for some of the hardest-hit financial institutions – were largely ineffective. The contagion spread to the broader economy, and corporate earnings growth stalled out.
PERFORMANCE
For the year ended December 31, 2007, Transamerica Small/Mid Cap Value, Initial Class returned 24.74%. By comparison its benchmark, the Russell 2500 Value Index, returned (7.27)%.
STRATEGY REVIEW
Throughout the period, we believed that an economic slowdown was merely a matter of time; the underlying housing-related issues – overbuilding and excessive lending to poorly qualified buyers – are sizable and will take time to resolve. Furthermore, we believed the Fed’s ability to mitigate the situation, by reducing interest rates, was limited by the larger, global environment. Enormous global demand for finished goods, services and, most importantly, raw materials continued to exert inflationary pressures, making it difficult for the Fed to reduce rates; it did so only when the housing- and credit-related issues reached crisis proportions.
In keeping with this viewpoint, we overweighted businesses in industries that stood to benefit from rising demand for commodities (e.g., energy, materials/processing, producer durables and shipping), while underweighting companies dependent on U.S. interest rates (mostly financials) and being highly selective about consumer stocks.
The top contributors to performance included DryShips Inc. and Genco Shipping & Trading Limited, both transporters of dry bulk items. Because the supply of tankers has not kept pace with the worldwide need for shipping capacity, charter prices set new highs this year, boosting profits for shippers. Other major contributors were McDermott International, Inc. (“McDermott”) and FTI Consulting, Inc. (“FTI”) McDermott provides engineering and construction services to oil and gas production companies, nuclear power plants and coal-fired power generators. FTI advises on corporate governance, compliance and strategic management issues. Its international sales are on the rise and we believe demand for FTI’s forensic accounting services may rise along with corporate bankruptcies and restructurings in the coming year.
The only sector where our holdings were net detractors from performance was financial services. We sold stocks most directly affected by the credit-market upheaval (e.g., bond insurer Ambac Financial Group, Inc.) but opted to hold on to others, such as Host Hotels & Resorts, Inc. This real estate investment trust purchases and refurbishes mid-range hotels. Its financial position is solid, and the stock pays a very attractive dividend.
Michelle E. Stevens, CFA
Portfolio Manager
Transamerica Investment Management, LLC
AEGON/Transamerica Series Trust | | Annual Report 2007 |
1
Transamerica Small/Mid Cap Value
(unaudited)
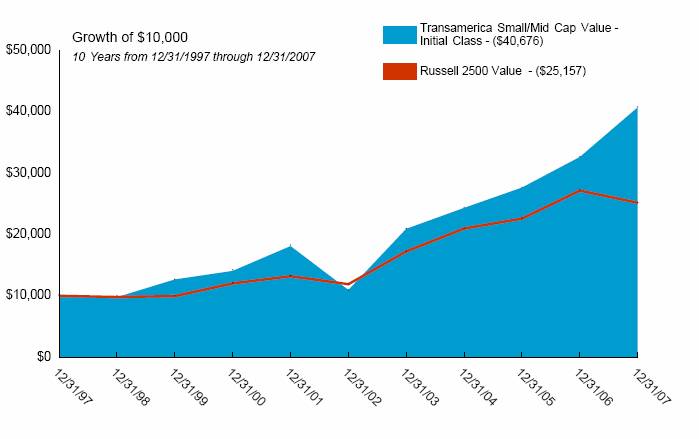
Average Annual Total Return for Periods Ended 12/31/2007
| | 1 Year | | 5 Years | | 10 Years | | From
Inception | | Inception
Date | |
| | | | | | | | | | | |
Initial Class | | 24.74 | % | 30.00 | % | 15.06 | % | 15.27 | % | 5/4/93 | |
Russell 2500 Value (1) | | (7.27 | )% | 16.17 | % | 9.66 | % | 12.82 | % | 5/4/93 | |
| | | | | | | | | | | |
Service Class | | 24.39 | % | — | % | — | % | 19.29 | % | 5/3/04 | |
NOTES
(1) The Russell 2500 Value (Russell 2500 Value) Index is an unmanaged index used as a general measure of market performance. Calculations assume dividends and capital gains are reinvested and do not include any managerial expenses. From inception calculation is based on life of Initial Class shares.
The performance data presented represents past performance, future results may vary. The portfolio’s investment return and net asset value will fluctuate. Past performance does not guarantee future results. Investor’s units when redeemed, may be worth more or less than their original cost.
Current performance may be lower or higher than performance quoted. Please visit your insurance company’s website for contract or policy level standardized total returns current to the most recent month end. Portfolio performance is net of investment fees and fund expenses, but not product charges, which, if included, would significantly lower the performance quoted.
Investing in small-cap stocks generally involves greater risk and volatility, therefore an investment in the Fund may not be appropriate for everyone. Companies with small capitalization have the potential for greater volatility than companies with larger capitalization.
This material must be preceded or accompanied by a current prospectus, which includes specific contents regarding the investment objectives, explanation of share classes and policies of this portfolio.
The historical financial information for periods prior to May 1, 2002 has been derived from the financial history of the predecessor portfolio, Dreyfus Small Cap Value Portfolio, of the Endeavor Series Trust. The Dreyfus Corporation had been the portfolio’s subadviser since September 16, 1996 to April 30, 2004. Prior to that date a different firm managed the portfolio and the performance set forth above, prior to September 16, 1996 is attributable to that firm.
2
Transamerica Small/Mid Cap Value
UNDERSTANDING YOUR FUND’S EXPENSES
(unaudited)
SHAREHOLDER EXPENSES
Fund shareholders may incur ongoing costs, including management and advisory fees, distribution and service fees, and other fund expenses.
The following Example is intended to help you understand your ongoing costs (in dollars and cents) of investing in the Fund and to compare these costs with the ongoing costs of investing in other funds.
The Example is based on an investment of $1,000 invested at July 1, 2007 and held for the entire period until December 31, 2007.
ACTUAL EXPENSES
The first line in the table below provides information about actual account values and actual expenses. You may use the information in this line, together with the amount you invested, to estimate the expenses that you paid over the period. Simply divide your account value by $1,000 (for example, an $8,600 account value divided by $1,000 = 8.6), then multiply the result by the number in the first line of your Fund under the heading entitled “Expenses Paid During Period” to estimate the expenses you paid on your account during this period.
HYPOTHETICAL EXAMPLE FOR COMPARISON PURPOSES
The second line in the table below provides information about hypothetical account values and hypothetical expenses based on the Fund’s actual expense ratio and an assumed rate of return of 5% per year before expenses, which is not the Fund’s actual return. The hypothetical account values and expenses may not be used to estimate the actual ending account balance or expenses you paid for the period. You may use this information to compare the ongoing costs of investing in your Fund and other funds. To do so, compare this 5% hypothetical example with the 5% hypothetical examples that appear in the shareholder reports of the other funds.
Please note that the expenses shown in the table are meant to highlight your ongoing costs only and do not reflect any transactional costs, such as sales charges, redemption fees, brokerage commissions paid on purchases and sales of fund shares. Therefore, the second line under the Fund in the table is useful in comparing ongoing costs only, and will not help you determine the relative total costs of owning different funds. If any of these transaction costs were included, your costs would be higher. The expenses shown in the table do not reflect any fees that may be charged to you by brokers, financial intermediaries or other financial institutions.
| | Beginning
Account
Value | | Ending
Account
Value | | Annualized
Expense
Ratio | | Expenses
Paid During
Period (a) | |
| | | | | | | | | |
Initial Class | | | | | | | | | |
Actual | | $ | 1,000.00 | | $ | 1,064.69 | | 0.85 | % | $ | 4.42 | |
Hypothetical (b) | | 1,000.00 | | 1,020.92 | | 0.85 | | 4.33 | |
| | | | | | | | | |
Service Class | | | | | | | | | |
Actual | | 1,000.00 | | 1,063.23 | | 1.10 | | 5.72 | |
Hypothetical (b) | | 1,000.00 | | 1,019.66 | | 1.10 | | 5.60 | |
| | | | | | | | | | | | |
(a) Expenses are calculated using the Fund’s annualized expense ratio (as disclosed in the table), multiplied by the average account value for the period, multiplied by the number of days in the period (184 days), and divided by the number of days in the year (365 days).
(b) 5% return per year before expenses.
GRAPHICAL PRESENTATION OF SCHEDULE OF INVESTMENTS
By Sector
At December 31, 2007

This chart shows the percentage breakdown by sector of the Fund’s total investment securities.
3
Transamerica Small/Mid Cap Value
SCHEDULE OF INVESTMENTS
At December 31, 2007
(all amounts except share amounts in thousands)
| | Shares | | Value | |
COMMON STOCKS (94.1%) | | | | | |
Chemicals (0.4%) | | | | | |
Zep, Inc. ‡^ | | 137,500 | | $ | 1,907 | |
Commercial Services & Supplies (8.0%) | | | | | |
FTI Consulting, Inc. ‡ | | 398,000 | | 24,533 | |
Navigant Consulting, Inc. ‡^ | | 410,982 | | 5,618 | |
Republic Services, Inc. Class A | | 307,500 | | 9,640 | |
Computers & Peripherals (0.8%) | | | | | |
ActivIdentity Corp. ‡ | | 175,800 | | 682 | |
Hypercom Corp. ‡ | | 670,000 | | 3,337 | |
Diversified Telecommunication Services (2.2%) | | | | | |
Citizens Communications Co. | | 870,000 | | 11,075 | |
Electric Utilities (4.4%) | | | | | |
ALLETE, Inc. ^ | | 151,666 | | 6,003 | |
CMS Energy Corp. ^ | | 580,000 | | 10,080 | |
Uil Holdings Corp. | | 152,900 | | 5,650 | |
Electrical Equipment (5.2%) | | | | | |
Acuity Brands, Inc. | | 275,000 | | 12,375 | |
Genlyte Group, Inc. ‡ | | 140,000 | | 13,328 | |
Electronic Equipment & Instruments (1.5%) | | | | | |
Cogent, Inc. ‡^ | | 670,305 | | 7,474 | |
Energy Equipment & Services (11.1%) | | | | | |
Allis-Chalmers Energy, Inc. ‡^ | | 188,800 | | 2,785 | |
Bronco Drilling Co., Inc. ‡^ | | 201,625 | | 2,994 | |
Helix Energy Solutions Group, Inc. ‡ | | 258,100 | | 10,711 | |
Hercules Offshore, Inc. ‡^ | | 329,079 | | 7,826 | |
Superior Energy Services, Inc. ‡ | | 620,000 | | 21,340 | |
Transocean, Inc. | | 64,219 | | 9,193 | |
Food Products (2.0%) | | | | | |
Dean Foods Co. | | 377,400 | | 9,760 | |
Health Care Equipment & Supplies (2.0%) | | | | | |
Orthofix International NV ‡ | | 170,000 | | 9,855 | |
Health Care Providers & Services (3.0%) | | | | | |
Chemed Corp. | | 266,700 | | 14,903 | |
Hotels, Restaurants & Leisure (0.8%) | | | | | |
O’Charley’s, Inc. | | 255,000 | | 3,820 | |
Household Durables (1.4%) | | | | | |
Jarden Corp. ‡ | | 295,000 | | 6,965 | |
Industrial Conglomerates (8.1%) | | | | | |
McDermott International, Inc. ‡ | | 680,000 | | 40,140 | |
Insurance (4.3%) | | | | | |
HCC Insurance Holdings, Inc. | | 397,500 | | $ | 11,400 | |
PartnerRe, Ltd. ^ | | 122,000 | | 10,069 | |
IT Services (1.9%) | | | | | |
Wright Express Corp. ‡ | | 270,000 | | 9,582 | |
Life Sciences Tools & Services (2.1%) | | | | | |
Thermo Fisher Scientific, Inc. ‡ | | 178,000 | | 10,267 | |
Marine (10.4%) | | | | | |
Aries Maritime Transport, Ltd. ^ | | 992,000 | | 6,448 | |
DryShips, Inc. ^ | | 216,800 | | 16,780 | |
Genco Shipping & Trading, Ltd. ^ | | 419,700 | | 22,983 | |
Omega Navigation Enterprises, | | 329,800 | | 5,194 | |
Inc. Class A ^ | | | | | |
Metals & Mining (1.1%) | | | | | |
Claymont Steel Holdings, Inc. ‡ | | 237,970 | | 5,557 | |
Oil, Gas & Consumable Fuels (4.9%) | | | | | |
Aurora Oil & Gas Corp. ‡^ | | 1,454,260 | | 2,254 | |
Cabot Oil & Gas Corp. | | 143,000 | | 5,773 | |
Edge Petroleum Corp. ‡^ | | 150,000 | | 889 | |
Newfield Exploration Co. ‡ | | 150,000 | | 7,905 | |
StealthGas, Inc. | | 510,600 | | 6,934 | |
Teekay Tankers, Ltd. Class A ‡ | | 14,000 | | 308 | |
Real Estate Investment Trusts (11.1%) | | | | | |
Annaly Capital Management, Inc. REIT | | 1,095,000 | | 19,907 | |
Host Hotels & Resorts, Inc. REIT ^ | | 550,000 | | 9,372 | |
LTC Properties, Inc. REIT | | 450,000 | | 11,273 | |
Omega Healthcare Investors, Inc. REIT | | 341,000 | | 5,473 | |
Parkway Properties, Inc. REIT ^ | | 79,000 | | 2,921 | |
Sunstone Hotel Investors, Inc. REIT ^ | | 325,000 | | 5,944 | |
Software (1.9%) | | | | | |
Fair Isaac Corp. ^ | | 290,000 | | 9,324 | |
Textiles, Apparel & Luxury Goods (1.9%) | | | | | |
Hanesbrands, Inc. ‡ | | 348,700 | | 9,474 | |
Transportation Infrastructure (3.6%) | | | | | |
Aegean Marine Petroleum Network, Inc. | | 463,140 | | 17,781 | |
Total Common Stocks (cost $321,613) | | | | 465,806 | |
| | | | | |
Total Securities Lending Collateral (cost $87,060) 1 | | | | 87,060 | |
| | | | | |
Total Investment Securities (cost $408,673) # | | | | $ | 552,866 | |
NOTES TO SCHEDULE OF INVESTMENTS:
^ At December 31, 2007, all or a portion of this security is on loan (see Note 1). The value at December 31, 2007, of all securities on loan is $83,867.
‡ Non Income Producing.
1 Cash collateral for the Repurchase Agreements, valued at $31,558, that serves as collateral for securities lending, is invested in corporate bonds with interest rates and maturity dates ranging from 3.00% - 10.18% and 04/28/2008 - 12/01/2096, respectively.
# Aggregate cost for federal income tax purposes is $408,566. Aggregate gross unrealized appreciation for all securities in which there is an excess of value over tax cost and aggregate gross unrealized depreciation for all securities in which there is an excess of tax cost over value were $169,493, and $25,193, respectively. Net unrealized appreciation for tax purposes is $144,300.
DEFINITIONS:
REIT Real Estate Investment Trust
The notes to the financial statements are an integral part of this report.
4
Transamerica Small/Mid Cap Value
STATEMENT OF ASSETS AND LIABILITIES
At December 31, 2007
(all amounts except per share amounts in thousands)
Assets: | | | |
Investment securities, at value (cost: $408,673) (including securities loaned of $83,867) | | $ | 552,866 | |
Cash | | 24,584 | |
Receivables: | | | |
Investment securities sold | | 4,499 | |
Shares sold | | 250 | |
Interest | | 84 | |
Income from loaned securities | | 24 | |
Dividends | | 1,091 | |
| | 583,398 | |
Liabilities: | | | |
Investment securities purchased | | 525 | |
Accounts payable and accrued liabilities: | | | |
Shares redeemed | | 360 | |
Management and advisory fees | | 339 | |
Distribution and service fees | | 7 | |
Administration fees | | 8 | |
Payable for collateral for securities on loan | | 87,060 | |
Other | | 78 | |
| | 88,377 | |
Net Assets | | $ | 495,021 | |
| | | |
Net Assets Consist of: | | | |
Capital Stock ($.01 par value) | | $ | 224 | |
Additional paid-in capital | | 295,446 | |
Undistributed (accumulated) net investment income | | | |
| | 7,071 | |
Undistributed (accumulated) net realized gain from investment securities | | | |
| | 48,087 | |
Net unrealized appreciation on investment securities | | | |
| | 144,193 | |
Net Assets | | $ | 495,021 | |
Net Assets by Class: | | | |
Initial Class | | $ | 463,795 | |
Service Class | | 31,226 | |
Shares Outstanding: | | | |
Initial Class | | 20,992 | |
Service Class | | 1,423 | |
Net Asset Value and Offering Price Per Share: | | | |
Initial Class | | $ | 22.10 | |
Service Class | | 21.94 | |
STATEMENT OF OPERATIONS | | | |
For the year ended December 31, 2007 | | | |
(all amounts in thousands) | | | |
| | | |
Investment Income: | | | |
Dividends | | $ | 10,345 | |
Interest | | 666 | |
Income from loaned securities-net | | 323 | |
| | 11,334 | |
| | | |
Expenses: | | | |
Management and advisory fees | | 3,749 | |
Printing and shareholder reports | | 45 | |
Custody fees | | 48 | |
Administration fees | | 94 | |
Legal fees | | 10 | |
Audit fees | | 21 | |
Trustees fees | | 16 | |
Distribution and service fees: | | | |
Service Class | | 60 | |
Other | | 6 | |
Total expenses | | 4,049 | |
| | | |
Net Investment Income | | 7,285 | |
| | | |
Net Realized Gain (Loss) from: | | | |
Investment securities | | 47,931 | |
| | | |
Net Increase (Decrease) in Unrealized Appreciation (Depreciation) on: | | | |
Investment securities | | 45,202 | |
| | | |
Net Realized and Unrealized Gain: | | 93,133 | |
Net Increase In Net Assets Resulting from Operations | | $ | 100,418 | |
The notes to the financial statements are an integral part of this report.
5
Transamerica Small/Mid Cap Value
STATEMENTS OF CHANGES IN NET ASSETS
For the years ended
(all amounts in thousands)
| | December 31,
2007 | | December 31,
2006 | |
Increase (Decrease) in Net Assets From: | | | | | |
Operations: | | | | | |
Net investment income | | $ | 7,285 | | $ | 4,126 | |
Net realized gain from investment securities | | 47,931 | | 40,122 | |
Change in unrealized appreciation on investment securities | | 45,202 | | 26,115 | |
| | 100,418 | | 70,363 | |
Distributions to Shareholders: | | | | | |
From net investment income: | | | | | |
Initial Class | | (4,088 | ) | (3,604 | ) |
Service Class | | (203 | ) | (98 | ) |
| | (4,291 | ) | (3,702 | ) |
From net realized gains: | | | | | |
Initial Class | | (37,856 | ) | (33,840 | ) |
Service Class | | (2,181 | ) | (1,049 | ) |
| | (40,037 | ) | (34,889 | ) |
Capital Share Transactions: | | | | | |
Proceeds from shares sold: | | | | | |
Initial Class | | 73,257 | | 30,863 | |
Service Class | | 18,004 | | 8,219 | |
| | 91,261 | | 39,082 | |
Dividends and distributions reinvested: | | | | | |
Initial Class | | 41,944 | | 37,444 | |
Service Class | | 2,385 | | 1,147 | |
| | 44,329 | | 38,591 | |
Cost of shares redeemed: | | | | | |
Initial Class | | (115,226 | ) | (96,680 | ) |
Service Class | | (7,134 | ) | (5,132 | ) |
| | (122,360 | ) | (101,812 | ) |
| | 13,230 | | (24,139 | ) |
Net increase (decrease) in net assets | | 69,320 | | 7,633 | |
| | | | | |
Net Assets: | | | | | |
Beginning of year | | 425,701 | | 418,068 | |
End of year | | $ | 495,021 | | $ | 425,701 | |
Undistributed (Accumulated) Net Investment Income (Loss) | | $ | 7,071 | | $ | 4,291 | |
Share Activity: | | | | | |
Shares issued: | | | | | |
Initial Class | | 3,323 | | 1,593 | |
Service Class | | 829 | | 426 | |
| | 4,152 | | 2,019 | |
Shares issued-reinvested from distributions: | | | | | |
Initial Class | | 2,035 | | 2,096 | |
Service Class | | 116 | | 64 | |
| | 2,151 | | 2,160 | |
Shares redeemed: | | | | | |
Initial Class | | (5,297 | ) | (4,984 | ) |
Service Class | | (334 | ) | (265 | ) |
| | (5,631 | ) | (5,249 | ) |
Net increase (decrease) in shares outstanding: | | | | | |
Initial Class | | 61 | | (1,295 | ) |
Service Class | | 611 | | 225 | |
| | 672 | | (1,070 | ) |
The notes to the financial statements are an integral part of this report.
6
Transamerica Small/Mid Cap Value
FINANCIAL HIGHLIGHTS
For a share outstanding throughout each period(a)
| | Initial Class | |
| | Year Ended December 31, | |
| | 2007 | | 2006 | | 2005 | | 2004 | | 2003 | |
Net Asset Value | | | | | | | | | | | |
Beginning of period | | $ | 19.58 | | $ | 18.33 | | $ | 16.94 | | $ | 14.56 | | $ | 7.63 | |
Investment Operations | | | | | | | | | | | |
Net investment income (loss) | | 0.34 | | 0.19 | | 0.16 | | 0.07 | | (0.05 | ) |
Net realized and unrealized gain (loss) | | 4.35 | | 2.94 | | 2.11 | | 2.31 | | 6.98 | |
Total operations | | 4.69 | | 3.13 | | 2.27 | | 2.38 | | 6.93 | |
Distributions | | | | | | | | | | | |
From net investment income | | (0.21 | ) | (0.18 | ) | (0.08 | ) | — | | — | |
From net realized gains | | (1.96 | ) | (1.70 | ) | (0.80 | ) | — | | — | |
Total distributions | | (2.17 | ) | (1.88 | ) | (0.88 | ) | — | | — | |
Net Asset Value | | | | | | | | | | | |
End of period(b) | | $ | 22.10 | | $ | 19.58 | | $ | 18.33 | | $ | 16.94 | | $ | 14.56 | |
Total Return(c),(d) | | 24.74 | % | 18.05 | % | 13.56 | % | 16.35 | % | 90.83 | % |
Net Assets End of Period (000’s) | | $ | 463,795 | | $ | 409,879 | | $ | 407,351 | | $ | 421,079 | | $ | 360,057 | |
Ratio and Supplemental Data | | | | | | | | | | | |
| | | | | | | | | | | |
Expenses to average net assets(e) | | | | | | | | | | | |
After reimbursement/fee waiver | | 0.85 | % | 0.86 | % | 0.86 | % | 0.84 | % | 0.88 | %(g) |
Before reimbursement/fee waiver(f) | | 0.85 | % | 0.86 | % | 0.86 | % | 0.84 | % | 0.88 | %(g) |
Net investment income (loss), to average net assets(e) | | 1.57 | % | 0.98 | % | 0.92 | % | 0.48 | % | (0.49 | )% |
Portfolio turnover rate(d) | | 18 | % | 24 | % | 33 | % | 139 | % | 140 | % |
For a share outstanding throughout each period(a)
| | Service Class | | | |
| | Year Ended December 31, | | May 3 to Dec | | | |
| | 2007 | | 2006 | | 2005 | | 31, 2004 | | | |
Net Asset Value | | | | | | | | | | | |
Beginning of period | | $ | 19.48 | | $ | 18.26 | | $ | 16.92 | | $ | 14.71 | | | |
Investment Operations | | | | | | | | | | | |
Net investment income (loss) | | 0.27 | | 0.14 | | 0.15 | | 0.10 | | | |
Net realized and unrealized gain (loss) | | 4.33 | | 2.94 | | 2.06 | | 2.11 | | | |
Total operations | | 4.60 | | 3.08 | | 2.21 | | 2.21 | | | |
Distributions | | | | | | | | | | | |
From net investment income | | (0.18 | ) | (0.16 | ) | (0.07 | ) | — | | | |
From net realized gains | | (1.96 | ) | (1.70 | ) | (0.80 | ) | — | | | |
Total distributions | | (2.14 | ) | (1.86 | ) | (0.87 | ) | — | | | |
Net Asset Value | | | | | | | | | | | |
End of period(b) | | $ | 21.94 | | $ | 19.48 | | $ | 18.26 | | $ | 16.92 | | | |
Total Return(c),(d) | | 24.39 | % | 17.82 | % | 13.26 | % | 15.02 | % | | |
Net Assets End of Period (000’s) | | $ | 31,226 | | $ | 15,822 | | $ | 10,717 | | $ | 1,443 | | | |
Ratio and Supplemental Data | | | | | | | | | | | |
Expenses to average net assets(e) | | | | | | | | | | | |
After reimbursement/fee waiver | | 1.10 | % | 1.11 | % | 1.11 | % | 1.11 | % | | |
Before reimbursement/fee waiver(f) | | 1.10 | % | 1.11 | % | 1.11 | % | 1.11 | % | | |
Net investment income (loss), to average net assets(e) | | 1.27 | % | 0.73 | % | 0.82 | % | 0.94 | % | | |
Portfolio turnover rate(d) | | 18 | % | 24 | % | 33 | % | 139 | % | | |
(a) Per share information is calculated based on average number of shares outstanding.
(b) Transamerica Small/Mid Cap Value (the “Fund”) share class commenced operations as follows:
Initial Class - May 4, 1993
Service Class - May 3, 2004
(c) Total Return reflects all portfolio expenses and includes reinvestment of dividends and capital gains; it does not reflect the charges and deductions under the policies or annuity contracts.
(d) Not annualized.
(e) Annualized.
(f) Ratio of Total Expenses to Average Net Assets includes all expenses before fee waivers and reimbursements by the investment advisor.
(g) Ratio of Total Expenses to Average Net Assets and Net Expenses to Average Net Assets are inclusive of recaptured expenses by the investment advisor. The impact of recaptured expenses was 0.04% for Initial Class (See Note 2).
The notes to the financial statements are an integral part of this report.
7
Transamerica Small/Mid Cap Value
NOTES TO FINANCIAL STATEMENTS
At December 31, 2007
(all amounts in thousands)
NOTE 1. ORGANIZATION AND SIGNIFICANT ACCOUNTING POLICIES
AEGON/Transamerica Series Trust (“ATST”) is an open-end management investment company registered under the Investment Company Act of 1940, as amended (the “1940 Act”). ATST serves as a funding vehicle for variable life insurance, variable annuity and group annuity products. Transamerica Small/Mid Cap Value (the “Fund”) is part of ATST.
In the normal course of business, the Fund enters into contracts that contain a variety of representations that provide general indemnifications. The Fund’s maximum exposure under these arrangements is unknown, as this would involve future claims that may be made against the Fund and/or its affiliates that have not yet occurred. However, based on experience, the Fund expects the risk of loss to be remote.
This report should be read in conjunction with the current Fund prospectus, which contains more complete information about the Fund.
In preparing the Fund’s financial statements in accordance with accounting principles generally accepted in the United States of America (“GAAP”), estimates or assumptions (which could differ from actual results) may be used that affect reported amounts and disclosures. The following is a summary of significant accounting policies followed by the Fund.
Multiple class operations, income and expenses: The Fund currently offers two classes of shares, an Initial Class and a Service Class. Income, non-class specific expenses and realized and unrealized gains and losses, are allocated daily to each class, based upon the value of shares outstanding method as permitted under Rule 18f-3 of the 1940 Act. Each class bears its own specific expenses as well as a portion of general, common expenses.
Security valuations: The Fund values its investments at the close of the New York Stock Exchange (“NYSE”), normally 4 p.m. ET, each day the NYSE is open for business. Fund investments are valued at the last sale price or closing price on the day of valuation taken from the primary exchange where the security is principally traded.
Securities traded in the over-the-counter market and listed securities for which no sale was reported on that date are valued at the last quoted bid price.
Debt securities are valued based on a price quotation or other equivalent indication of value supplied by an exchange, a pricing service or a major market maker; however, those that mature in sixty days or less are valued at amortized cost, which approximates market.
Investment company securities are valued at the net asset value of the underlying portfolio.
Securities for which quotations are not readily available are valued at fair market value as determined in good faith by the Fund’s Administrative Valuation Committee, using guidelines adopted by the Board of Trustees.
Cash: The Fund may leave cash overnight in its cash account with the custodian, State Street Bank & Trust Company (“State Street”). On July 2, 2007, State Street acquired the parent company of Investors Bank & Trust Company. State Street has been contracted on behalf of the Fund to invest the excess cash into a savings account, which at December 31, 2007 was paying an interest rate of 2.60%.
Repurchase agreements: The Fund is authorized to enter into repurchase agreements. The Fund, through its custodian, State Street, receives delivery of the underlying securities, the value of which at the time of purchase is required to be an amount equal to at least 100% of the resale price. The Fund will bear the risk of value fluctuations until the security can be sold and may encounter delays and incur costs in liquidating the security. In the event of bankruptcy or insolvency of the seller, delays and costs may be incurred.
Commission recapture: The sub-adviser, to the extent consistent with the best execution and usual commission rate policies and practices, may place security transactions of the Fund with broker/dealers with which ATST has established a Commission Recapture Program. A Commission Recapture Program is any arrangement under which a broker/dealer applies a portion of the commissions received by such broker/dealer on the security transactions to the Fund. In no event will commissions paid by the Fund be used to pay expenses that would otherwise be borne by any other funds within ATST, or by any other party.
Recaptured commissions during the year ended December 31, 2007 of $7 are included in net realized gains in the Statement of Operations.
Securities lending: The Fund may lend securities to qualified borrowers, with State Street acting as the Fund’s lending agent. The Fund earns negotiated lenders’ fees. The Fund receives cash and/or securities as collateral against the loaned securities. Cash collateral received is invested in short-term, interest-bearing securities. The Fund monitors the market value of securities loaned on a daily basis and requires collateral in an amount at least equal to the value of the securities loaned. Income from loaned securities earned by State Street for its services, shown in the Statement of Operations is net of fees, in the amount of $138.
8
NOTES TO FINANCIAL STATEMENTS (continued)
At December 31, 2007
(all amounts in thousands)
NOTE 1.–(continued)
The Fund has invested the cash collateral received from securities loaned in the following short-term, interest-bearing securities:
Abbey National PLC, Eurodollar Term, 5.00%, 1/7/2008 | | $ | 3,758 | |
ABN AMRO Bank NV, Eurodollar Term, 5.18%, 1/4/2008 | | 3,006 | |
Bank of Nova Scotia, Eurodollar Term, 4.96%, 1/22/2008 | | 2,631 | |
Barclays, Eurodollar Term, 5.00%, 2/12/2008 | | 5,261 | |
BNP Paribas, Eurodollar Term, 5.01%, 1/11/2008 | | 4,885 | |
Calyon, Eurodollar Term, 5.12%, 3/3/2008 | | 1,127 | |
Credit Suisse First Boston Corp., Repurchase Agreement, 4.60%, 1/2/2008 | | 9,771 | |
Dexia Group, Eurodollar Term, 4.82%, 1/3/2008 | | 3,758 | |
HBOS Halifax Bank of Scotland, Eurodollar Term, 5.15%, 1/2/2008 | | 1,879 | |
JPMorgan Chase & Co., Eurodollar Term, 5.15%, 2/12/2008 | | 1,879 | |
Lloyds TSB Bank, Eurodollar Term, 5.15%, 1/24/2008 | | 3,758 | |
Merrill Lynch & Co. (RPG), Repurchase Agreement, 4.60%, 1/2/2008 | | 5,637 | |
Morgan Stanley & Co. (Corp. Repo), Repurchase Agreement, 4.60%, 1/2/2008 | | 15,408 | |
Rabobank Nederland, Eurodollar Term, 5.08%, 1/10/2008 | | 4,510 | |
Reserve Primary Money Market Fund, 4.95% | | 4,008 | |
Royal Bank of Scotland, Eurodollar Term, 5.00%, 2/25/2008 | | 4,510 | |
Societe Generale, Eurodollar Term, 5.15%, 3/3/2008 | | 2,255 | |
Toronto Dominion Bank, Eurodollar Term, 5.05%, 1/10/2008 | | 4,509 | |
UBS AG, Eurodollar Term, 4.92%, 1/11/2008 | | 2,631 | |
Wells Fargo, Bank Note, 4.75%, 1/8/2008 | | 1,879 | |
| | | |
| | $ | 87,060 | |
Real Estate Investment Trusts (“REITs”): There are certain additional risks involved in investing in REITs. These include, but are not limited to, economic conditions, changes in zoning laws, real estate values, property taxes and interest rates.
Dividend income is recorded at management’s estimate of the income included in distributions from the REIT investments. Distributions received in excess of the estimated amount are recorded as a reduction of the cost of investments. The actual amounts of income, return of capital and capital gains are only determined by each REIT after the fiscal year end and may differ from the estimated amounts.
Security transactions and investment income: Security transactions are recorded on the trade date. Security gains and losses are calculated on the first-in, first-out basis. Dividend income, if any, is recorded on the ex-dividend date or, in the case of foreign securities, as soon as the Fund is informed of the ex-dividend date. Interest income, including accretion of discounts and amortization of premiums, is recorded on the accrual basis commencing on the settlement date.
Dividend distributions: Dividends and capital gains distributions are typically declared and reinvested annually and are generally paid and reinvested on the business day following the ex-date.
NOTE 2. RELATED PARTY TRANSACTIONS
ATST serves as a funding vehicle for certain affiliated asset allocation portfolios and certain affiliated separate accounts of Western Reserve Life Assurance Co. of Ohio, Transamerica Life Insurance Company, Transamerica Financial Life Insurance Company, Inc., Monumental Life Insurance Company and Transamerica Occidental Life Insurance Company.
��
Transamerica Fund Advisors, Inc. (“TFAI”) is the Fund’s investment adviser. Transamerica Fund Services, Inc. (“TFS”) is the Fund’s administrator and transfer agent. Prior to May 1, 2007, AFSG Securities Corp. (“AFSG”), was the Fund’s distributor. Transamerica Capital Inc. (“TCI”) is now the Fund’s distributor. TFAI, TFS, AFSG and TCI are affiliates of AEGON NV, a Netherlands corporation.
Transamerica Investment Management, LLC (“TIM”) is an affiliate of the Fund and is a sub-adviser to the Fund.
Certain officers and trustees of the Fund are also officers and/or directors of TFAI, TFS and TCI.
The following schedule reflects the percentage of Fund assets owned by affiliated investment companies at December 31, 2007:
| | Net
Assets | | % of Net
Assets | |
| | | | | |
Asset Allocation-Conservative Portfolio | | $ | 1,607 | | 0.32 | % |
Asset Allocation-Growth Portfolio | | 44,899 | | 9.07 | |
Asset Allocation-Moderate Growth Portfolio | | 25,379 | | 5.13 | |
Asset Allocation-Moderate Portfolio | | 35,753 | | 7.22 | |
| | | | | |
Total | | $ | 107,638 | | 21.74 | % |
Investment advisory fee: The Fund pays management fees to TFAI based on average daily net assets (“ANA”) at the following breakpoints:
0.80% of the first $500 million of ANA
0.75% of ANA over $500 million
TFAI has contractually agreed to waive its advisory fee and will reimburse the Fund to the extent that operating expenses, excluding 12b-1 fees, exceed the following stated annual limit:
0.89% Expense Limit
If total Fund expenses fall below the annual expense limitation agreement agreed to by the adviser within the succeeding three years, the Fund may be required to pay the adviser a portion or all of the waived advisory fees.
There were no amounts recaptured during the year ended December 31, 2007. There are no amounts available for recapture at December 31, 2007.
Distribution and service fees: ATST entered into a Distribution Agreement with AFSG dated January 1, 1997, as amended. On May 1, 2007, the Distribution Agreement was amended to replace AFSG with TCI as the Fund’s distributor. The Fund has also adopted a distribution plan (“Distribution Plan”) pursuant to Rule 12b-1 under the 1940 Act.
9
NOTES TO FINANCIAL STATEMENTS (continued)
At December 31, 2007
(all amounts in thousands)
NOTE 2.–(continued)
Under the Distribution Plan for the Initial Class shares, TCI, on behalf of the Fund, is authorized to pay various service providers, as direct payment for expenses incurred in connection with distribution of the Fund’s shares, amounts equal to actual expenses associated with distributing the shares.
The Distribution Plan for the Service Class shares requires ATST to pay distribution fees to TCI as compensation for its activities, not as reimbursement for specific expenses. The fee on the Service Class is paid to the insurance companies for providing services and account maintenance for their policyholders who invest in the variable insurance products which invest in the Service Class shares.
The Fund is authorized under the Distribution Plan to pay fees on each class up to the following limits:
Initial Class | | 0.15 | % |
Service Class | | 0.25 | % |
TCI has determined that it will not seek payment by the Fund of the distribution expenses incurred with respect to the Initial Class shares before April 30, 2009. Prior to TCI seeking reimbursement of future expenses, policy and contract owners will be notified in advance. The Fund will pay fees relating to Service Class shares.
Administrative services: The Fund has entered into an agreement with TFS for financial and legal fund administration services. The Fund pays TFS an annual fee of 0.02% of ANA. The Legal fees on the Statement of Operations are for fees paid to external legal counsel.
Deferred compensation plan: Each eligible independent Fund Trustee may elect participation in a non-qualified deferred compensation plan (“the Plan”). Under the Plan, such Trustees may defer payment of all or a portion of their total fees earned as a Fund Trustee. Each Trustee who is a participant in the Plan may elect that the earnings, losses or gains credited to his or her deferred fee amounts be determined based on a deemed investment in any series of Transamerica IDEX Mutual Funds. The right of a participant to receive a distribution from the Plan of the deferred fees is an unsecured claim against the general assets of all series of Transamerica IDEX Mutual Funds. The pro rata liability to the Fund of all deferred fees in the Plan amounted, as of December 31, 2007, to $24 Amounts deferred under the Plan are unfunded against the general assets of ATST.
Retirement plan: Under a retirement plan (the “Emeritus Plan”) available to the Independent Trustees, each Independent Trustee is deemed to have elected to serve as Trustee Emeritus of ATST upon his or her termination of service, other than removal for cause, and is entitled to 50% of the trustee’s current retainer for a maximum period of five years determined by his or her years of service as a Trustee.
Such amounts shall be accrued by ATST on a pro rata basis allocable to each series of ATST fund based on the relative assets of the series. If retainers increase in the future, past accruals (and credits) will be adjusted upward so that 50% of the Trustee’s current retainer is accrued and credited at all times. Upon death, disability or termination of service, other than removal for cause, amounts deferred become payable to a Trustee Emeritus (or his/her beneficiary). Upon the commencement of service as Trustee Emeritus, compensation will be paid on a quarterly basis during the time period that the Trustee Emeritus is allowed to serve as such.
Amounts accrued under the Emeritus Plan are unsecured claims against the general assets of ATST. For the year ended December 31, 2007, the amount related to the Emeritus Plan was $18. As of December 31, 2007, the Fund has not made any payments related to the Emeritus Plan.
The Emeritus Plan was terminated effective October 30, 2007. Upon the termination, the Fund shall continue to pay any remaining benefits in accordance with the Plan, but no further compensation shall accrue under the Plan.
NOTE 3. INVESTMENT TRANSACTIONS
The cost of securities purchased and proceeds from securities sold (excluding short-term securities) for the year ended December 31, 2007 were as follows:
Purchases of securities: | | | |
Long-term | | $ | 79,980 | |
U.S. Government | | — | |
Proceeds from maturities and sales of securities: | | | |
Long-term | | 114,437 | |
U.S. Government | | — | |
| | | | |
NOTE 4. FEDERAL INCOME TAX MATTERS
The Fund has not made any provision for federal income or excise taxes due to its policy to distribute all of its taxable income and capital gains to its shareholders and otherwise qualify as a regulated investment company under Subchapter M of the Internal Revenue Code. Income and capital gain distributions are determined in accordance with income tax regulations, which may differ from GAAP. These differences are primarily due to differing treatment for items including, but not limited to, wash sales and REITs.
Therefore, distributions determined in accordance with tax regulations may differ significantly in amount or character from net investment income and realized gains for financial reporting purposes. Financial reporting records are adjusted for permanent book/tax differences to reflect tax character. Financial records are not adjusted for temporary differences. These reclassifications are as follows:
Additional paid-in capital | | $ | — | |
Undistributed (accumulated) net investment income (loss) | | $ | (214 | ) |
Undistributed (accumulated) net realized gain (loss) from investment securities | | $ | 214 | |
10
NOTES TO FINANCIAL STATEMENTS (continued)
At December 31, 2007
(all amounts in thousands)
NOTE 4.–(continued)
The tax character of distributions paid may differ from the character of distributions shown in the Statements of Changes in Net Assets due to short-term gains being treated as ordinary income for tax purposes. The tax character of distributions paid during 2006 and 2007 was as follows:
2006 Distributions paid from: | | | |
Ordinary Income | | $ | 5,121 | |
Long-term Capital Gain | | 33,470 | |
2007 Distributions paid from: | | | |
Ordinary Income | | 5,056 | |
Long-term Capital Gain | | 39,272 | |
| | | | |
The tax basis components of distributable earnings as of December 31, 2007 are as follows:
Undistributed Ordinary Income | | $ | 8,488 | |
Undistributed Long-term Capital Gain | | $ | 46,563 | |
Capital Loss Carryforward | | $ | — | |
Post October Capital Loss Deferral | | $ | — | |
Post October Currency Loss Deferral | | $ | — | |
Net Unrealized Appreciation (Depreciation) | | $ | 144,300 | |
NOTE 5. REGULATORY PROCEEDINGS
There continues to be significant federal and state regulatory activity relating to financial services companies, particularly mutual fund companies and their investment advisers. As part of an ongoing investigation regarding potential market timing, recordkeeping and trading compliance issues and matters affecting the Fund’s investment adviser, TFAI, and certain affiliates and former employees of TFAI, the SEC staff has indicated that it is likely to take some action against TFAI and certain of its affiliates at the conclusion of the investigation. The potential timing and the scope of any such action is difficult to predict. Although the impact of any action brought against TFAI and/or its affiliates is difficult to assess at the present time, the Fund currently believes that the likelihood that any such action will have a material adverse impact on it is remote. It is important to note that the Fund is not aware of any allegation of wrong doing against it and its Board at the time this annual report is printed. Although it is not anticipated that these developments will have an adverse impact on the Fund, there can be no assurance at this time. TFAI and its affiliates are actively working with the SEC in regard to this matter; however, the exact resolution cannot be determined at this time. TFAI will take such actions that it deems necessary or appropriate to continue providing management services to the Fund and to bring all matters to an appropriate conclusion.
TFAI and/or its affiliates, and not the Fund, will bear the costs regarding these regulatory matters.
NOTE 6. RECENTLY ISSUED ACCOUNTING PRONOUNCEMENTS
In July 2006, the Financial Accounting Standards Board (“FASB”) released FASB Interpretation No. 48 “Accounting for Uncertainty in Income Taxes” (“FIN 48”), an interpretation of FASB Statement No. 109. FIN 48 provides guidance for how uncertain tax positions should be recognized, measured, presented and disclosed in the financial statements. FIN 48 requires the accounting and disclosure of tax positions taken or expected to be taken in the course of preparing the Fund’s tax returns to determine whether the tax positions are “more-likely- than-not” of being sustained by the applicable tax authority. Tax positions not deemed to meet the more-likely-than-not threshold would be recorded as a tax benefit or expense in the current year.
Adoption of FIN 48 is effective during the first required financial reporting period for fiscal years beginning after December 15, 2006. Management adopted FIN 48 on June 29, 2007.
Implementation of FIN 48 requires Management of the Fund to analyze all open tax years, as defined by the Statute of Limitations, for all major jurisdictions, which includes federal and certain states. Open tax years are those that are open for exam by taxing authorities (i.e., the last 4 tax year ends and the interim tax period since then). The Fund has no examinations in progress and none are expected at this time.
Management of the Fund has reviewed all open tax years and major jurisdictions and concluded the adoption of FIN 48 resulted in no impact to the Fund’s net assets or results of operations. There is no tax liability resulting from unrecognized tax benefits relating to uncertain income tax positions taken or expected to be taken in future tax returns. The Fund is also not aware of any tax positions for which it is reasonably possible that the total amounts of unrecognized tax benefits will significantly change in the next 12 months.
In September 2006, FASB issued its new Standard No. 157, “Fair Value Measurements” (“FAS 157”). FAS 157 is designed to unify guidance for the measurement of fair value of all types of assets, including financial instruments, and certain liabilities, throughout a number of accounting standards. FAS 157 also establishes a hierarchy for measuring fair value in generally accepted accounting principles and expands financial statement disclosures about fair value measurements that are relevant to mutual funds. FAS 157 is effective for financial statements issued for fiscal years beginning after November 15, 2007, and earlier application is permitted.
As of December 31, 2007, Management does not expect the adoption of FAS 157 to impact the amounts reported in the financial statements, however, additional disclosures will be required about the inputs used to develop the measurements of fair value and the effect of certain of the measurements reported in the statement of operations for a fiscal period.
NOTE 7. SUBSEQUENT EVENT
Effective January 1, 2008, TFAI changed its name to Transamerica Asset Management, Inc.
Effective May 1, 2008, AEGON/Transamerica Series Trust will change its name to Transamerica Series Trust. At that time, the Fund will also change its name to Transamerica Small/Mid Cap Value VP.
11
Report of Independent Registered Certified Public Accounting Firm
To the Board of Trustees and Shareholders of
Transamerica Small/Mid Cap Value:
In our opinion, the accompanying statement of assets and liabilities, including the schedule of investments, and the related statements of operations and of changes in net assets and the financial highlights present fairly, in all material respects, the financial position of Transamerica Small/Mid Cap Value (the “Fund”) (one of the portfolios constituting AEGON/Transamerica Series Trust) at December 31, 2007, the results of its operations for the year then ended, the changes in its net assets for each of the two years in the period then ended and the financial highlights for each of the periods presented, in conformity with accounting principles generally accepted in the United States of America. These financial statements and financial highlights (hereafter referred to as “financial statements”) are the responsibility of the Fund’s management; our responsibility is to express an opinion on these financial statements based on our audits. We conducted our audits of these financial statements in accordance with the standards of the Public Company Accounting Oversight Board (United States). Those standards require that we plan and perform the audit to obtain reasonable assurance about whether the financial statements are free of material misstatement. An audit includes examining, on a test basis, evidence supporting the amounts and disclosures in the financial statements, assessing the accounting principles used and significant estimates made by management, and evaluating the overall financial statement presentation. We believe that our audits, which included confirmation of securities at December 31, 2007 by correspondence with the custodian and brokers, provide a reasonable basis for our opinion.

Tampa, Florida
February 29, 2008
12
Transamerica Small/Mid Cap Value
SUPPLEMENTAL TAX INFORMATION (unaudited)
(all amounts in thousands)
For tax purposes, the Fund has made a Long-Term Capital Gain Designation of $39,273 for the year ended December 31, 2007.
RESULTS OF SHAREHOLDER PROXY (unaudited)
At a special meeting of shareholders held on October 30, 2007, the results of the Proposals were as follows:
Proposal 1: To elect a new Board:
Proposed
Trustee | | For | | Against | | Abstentions/Broker Non-
Votes | |
John K. Carter | | 2,274,998,840.817 | | 57,804,698.755 | | 35,433.883 | |
| | | | | | | |
Leo J. Hill | | 2,277,212,702.754 | | 55,590,836.819 | | 35,433.883 | |
| | | | | | | |
Neal M. Jewell | | 2,266,793,295.663 | | 66,010,243.909 | | 35,433.883 | |
| | | | | | | |
Russell A. Kimball, Jr. | | 2,274,825,235.835 | | 57,978,303.737 | | 35,433.883 | |
| | | | | | | |
Eugene M. Mannella | | 2,274,623,165.033 | | 58,180,374.539 | | 35,433.883 | |
| | | | | | | |
Norm R. Nielsen | | 2,275,050,055.885 | | 57,753,483.687 | | 35,433.883 | |
| | | | | | | |
Joyce Galpern Norden | | 2,270,278,122.250 | | 62,525,417.323 | | 35,433.883 | |
| | | | | | | |
Patricia L. Sawyer | | 2,275,737,737.456 | | 57,065,802.116 | | 35,433.883 | |
| | | | | | | |
John W. Waechter | | 2,276,615,120.140 | | 56,188,419.433 | | 35,433.883 | |
Proposal 2: To approve an amendment to the Agreement and Declaration of Trust:
For | | Against | | Abstentions/Broker Non-
Votes | |
2,182,022,669.110 | | 77,590,048.544 | | 73,226,255.801 | |
13
Transamerica Small/Mid Cap Value
INVESTMENT ADVISORY AND SUB-ADVISORY AGREEMENTS-REVIEW AND RENEWAL (unaudited)
At a meeting of the Board of Trustees of AEGON/Transamerica Series Trust (“ATST”) held on December 4th, 2007, the Board reviewed and considered the renewal of the investment advisory agreement (the “Investment Advisory Agreement”) between Transamerica Small/Mid Cap Value (the “Fund”) and Transamerica Fund Advisors, Inc. (“TFAI”), as well as the renewal of the investment sub-advisory agreement (the “Sub-Advisory Agreement”) of the Fund between TFAI and Transamerica Investment Management, LLC (the “Sub- Adviser”), to determine whether the agreements should be renewed for a six-month period. It was noted that this review was interim in nature to align all the Funds on the same calendar, and that the Funds’ advisory arrangements would be reviewed again in the first half of 2008.
Following their review and consideration, the Trustees determined that the renewal of the Investment Advisory Agreement and the Sub-Advisory Agreement would enable shareholders of the Fund to obtain high quality services at a cost that is appropriate, fair, and in the best interests of its shareholders. The Board, including the independent members of the Board, unanimously approved the renewal of the Investment Advisory Agreement and Sub-Advisory Agreement. In reaching their decision, the Trustees requested and obtained from TFAI and the Sub-Adviser such information as they deemed reasonably necessary to evaluate the agreements, including information about fees and performance of comparable funds managed by the Sub-Adviser. The Trustees also carefully considered information they had previously received from TFAI and the Sub-Adviser throughout the year as part of their regular oversight of the Fund, as well as comparative fee, expense, and performance information prepared by Lipper Inc. (“Lipper”), an independent provider of mutual fund performance, fee and expense information and profitability data prepared by management. In considering the proposed continuation of the Investment Advisory and Sub-Advisory Agreements, the Trustees evaluated a number of considerations that they believed, in light of the legal advice furnished to them by independent legal counsel and their own business judgment, to be relevant. They based their decisions on a variety of factors, including the following considerations, among others, although they did not identify any consideration or particular information that was controlling of their decisions:
The nature, extent and quality of the advisory services to be provided. The Board considered the nature and quality of the services provided by TFAI and the Sub-Adviser to the Fund in the past, as well as the services anticipated to be provided in the future. The Board concluded that TFAI and the Sub-Adviser are capable of providing high quality services to the Fund, as indicated by the nature and quality of services provided in the past by TFAI and the Sub-Adviser for this series and the experience, capability and integrity of TFAI’s senior management, the financial resources of TFAI and the Sub-Adviser, TFAI’s management oversight process and the professional qualifications of the portfolio management team of the Sub-Adviser. The Trustees determined that TFAI and the Sub-Adviser can provide investment and related services that are appropriate in scope and extent in light of the Fund’s operations, the competitive landscape of the investment company business and investor needs.
The investment performance of the Fund. The Board examined the short and longer-term performance of the Fund, including relative performance against a peer universe of comparable mutual funds as prepared by Lipper for various trailing periods ended June 30, 2007. The Board noted that the Fund’s performance was good compared to its peer universe over the past 1-, 3- and 5-year periods. The Board also noted that the Fund’s 5-year performance could not be attributed completely to the Sub-Adviser’s current management team, which assumed management of the Fund in March 2004. On the basis of the Board’s assessment of the nature, extent and quality of advisory services to be provided or procured by TFAI and the Sub-Adviser, the Board concluded that TFAI and the Sub-Adviser are capable of providing a level of investment performance that is appropriate in light of the Fund’s proposed investment objectives, policies and strategies and competitive with other similarly situated investment companies.
The cost of advisory services provided and the level of profitability. The Board reviewed profitability information of TFAI’s cost of procuring fund management services, as well as the costs of its provision of administration, fund accounting and other services, to the Fund and to ATST as a whole by TFAI and its affiliates. The Board reviewed the management and sub-advisory fees for the Fund. The Board noted that the Fund’s contractual management fees were near the median of the Fund’s peer group and universe. The Board also noted that the Fund’s total expenses were near the median of the peer group and were low compared to the peer universe. Based on their review, the Trustees determined that the management fees of the Fund generally are appropriate in light of the services expected to be provided or procured, the management fees and the anticipated profitability of the relationship between the Fund, TFAI and its affiliates, and the Sub-Adviser. In making these observations and determinations, the Board reviewed, among other things, comparative information provided by Lipper.
Whether fee levels reflect economies of scale and the extent to which economies of scale would be realized as the Fund grows. In evaluating the extent to which the management fees payable under the Investment Advisory and Sub-Advisory Agreements reflect economies of scale or will permit economies of scale to be realized in the future, the Board noted that TFAI and the Sub-Adviser offer breakpoints which appropriately benefit investors by passing on economies of scale in the form of lower management fees as the level of assets grows. The Trustees also concluded that they will have the opportunity to periodically reexamine whether the Fund has achieved economies of scale, and the appropriateness of management fees payable to TFAI and fees paid to the Sub-Adviser, in the future.
Benefits (such as soft dollars) to TFAI, its affiliates, or the Sub-Adviser from their relationship with the Fund. The Board concluded that other benefits anticipated to be derived by TFAI, its affiliates, and the Sub-Adviser from their relationships with the Fund are expected to be reasonable and fair, and consistent with industry practice and the best interests of the Fund and its shareholders. The Trustees noted that TFAI would not realize soft dollar benefits from its relationship with the Fund, and that the Sub-Adviser’s soft dollar trading is consistent with applicable law, including best execution requirements in particular. The Board also noted that the Sub-Adviser is participating in a brokerage program pursuant to which a portion of brokerage commissions paid by the Fund is recaptured for the benefit of the Fund and its shareholders, thus limiting the amount of soft dollar arrangements the Sub-Adviser may engage in with respect to the Fund’s brokerage transactions.
14
Other considerations. The Board determined that TFAI has made a substantial commitment to the recruitment and retention of high quality personnel, and maintains the financial, compliance and operational resources reasonably necessary to manage the Fund in a professional manner that is consistent with the best interests of the Fund and its shareholders. In this regard, the Trustees favorably considered the procedures and policies in place by TFAI to enforce compliance with applicable laws and regulations and oversee the portfolio management activities of the Sub-Adviser. The Trustees also determined that TFAI has made a significant entrepreneurial commitment to the management and success of the Fund, reflected by TFAI’s expense limitation and fee waiver arrangements with the Fund which may result in TFAI waiving a substantial amount of management fees for the benefit of shareholders.
15
Transamerica U.S. Government Securities
MARKET ENVIRONMENT
During the twelve months ended December 31, 2007, government securities outperformed all other fixed-income sectors as well as large portions of the stock market, as the economic and market environments changed dramatically.
Initially, with housing prices in steady decline, the economy appeared to be slowing. Believing that the Federal Reserve Board (“Fed”) was likely to cut interest rates to stimulate economic growth, investors favored non-government securities (e.g., corporate bonds and mortgage-related securities). In the Fed’s estimation, however, the weakening economy posed less of a threat than inflation. It left interest rates unchanged, causing considerable turmoil in fixed-income markets by spring. Investors took a more cautious stance toward riskier asset classes.
The volatility later increased after defaults in sub-prime mortgages climbed sharply higher; the sub-prime problems spilled over to other areas of the markets; and lenders tightened their lending standards, triggering a credit crisis. Banks and other financial entities that were major investors in sub-prime mortgages were forced to recognize multi-billion losses. Although many sold their holdings to raise capital, their ability to make new loans was still greatly reduced. As a result, cash flowing in the financial system (i.e., liquidity) dried up rapidly. Efforts to alleviate the crisis, such as capital infusions and a total of 100 basis points in interest-rate reductions by the Fed, were largely ineffective. Finally, in mid-December, a term auction facility sponsored by the Fed helped alleviate constrained levels of liquidity.
Throughout the second half, investors repeatedly fled other asset classes for the relative safety of Treasuries, and the interest-rate yield curve steepened as short-term yields fell in anticipation of more Fed rate cuts.
PERFORMANCE
For the year ended December 31, 2007, Transamerica U.S. Government Securities, Initial Class returned 6.05%. By comparison its benchmark, the Lehman Brothers U.S. Government Index, returned 8.66%.
STRATEGY REVIEW
Throughout the year, the portfolio was diversified among Treasury, investment-grade corporate and mortgage-backed securities, complemented by a very modest allocation to high- yield securities. The mortgage-backed securities were prime- quality and backed by U.S. agency guarantees. The non- government securities added to yields and, in the more benign environment that prevailed early in the year, boosted performance as the riskier asset classes outperformed Treasuries. The portfolio’s duration (i.e., its sensitivity to changing interest rates) was also a positive factor in the initial months, when yields fell and prices, which move opposite to yields, rose.
Once conditions degraded and turmoil increased, we reduced the corporate allocation, trimming exposure to financial services companies while increasing the bias toward fundamentally sound industrial companies benefiting from strong global growth. In addition, we focused on shorter-maturity positions with particularly good total return prospects. We also shortened the duration to levels near those of the index and positioned the portfolio to benefit from a steepening yield curve (i.e., to capture price gains when yields on short-term securities declined). These precautions, though helpful, could not keep the portfolio from underperforming as the government sector surged ahead in the second half of the period.
Heidi Y. Hu, CFA
Derek S. Brown, CFA
Greg D. Haendel, CFA
Co-Portfolio Managers
Transamerica Investment Management, LLC
AEGON/Transamerica Series Trust | Annual Report 2007 |
1
Transamerica U.S. Government Securities
(unaudited)
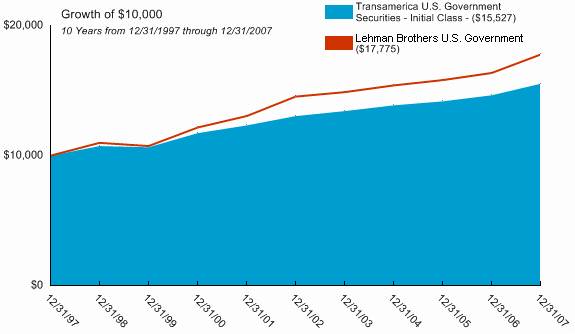
Average Annual Total Return for Periods Ended 12/31/2007
| | | | | | | | From | | Inception | |
| | 1 Year | | 5 Years | | 10 Years | | Inception | | Date | |
| | | | | | | | | | | |
Initial Class | | 6.05 | % | 3.55 | % | 4.50 | % | 5.16% | | 5/13/94 | |
Lehman Brothers U.S. Government Index(1) | | 8.66 | % | 4.10 | % | 5.92 | % | 6.65% | | 5/13/94 | |
| | | | | | | | | | | |
Service Class | | 5.78 | % | — | % | — | % | 3.07% | | 5/1/03 | |
NOTES
(1) Lehman Brothers U.S. Government (LBG) Index is an unmanaged index used as a general measure of market performance. Calculations assume dividends and capital gains are reinvested and do not include any managerial expenses. From inception calculation is based on life of Initial Class shares.
The performance data presented represents past performance; future results may vary. The portfolio’s investment return and net asset value will fluctuate. Past performance does not guarantee future results. Investor’s units when redeemed may be worth more or less than their original cost.
Current performance may be lower or higher than performance quoted. Please visit your insurance company’s website for contract or policy level standardized total returns current to the most recent month end. Portfolio performance is net of investment fees and fund expenses, but not product charges, which, if included, would significantly lower the performance quoted.
This material must be preceded or accompanied by a current prospectus, which includes specific contents regarding the investment objectives, explanation of share classes and policies of this portfolio.
2
Transamerica U.S. Government Securities
UNDERSTANDING YOUR FUND’S EXPENSES
(unaudited)
SHAREHOLDER EXPENSES
Fund shareholders may incur ongoing costs, including management and advisory fees, distribution and service fees, and other fund expenses.
The following Example is intended to help you understand your ongoing costs (in dollars and cents) of investing in the Fund and to compare these costs with the ongoing costs of investing in other funds.
The Example is based on an investment of $1,000 invested at July 1, 2007 and held for the entire period until December 31, 2007.
ACTUAL EXPENSES
The first line in the table below provides information about actual account values and actual expenses. You may use the information in this line, together with the amount you invested, to estimate the expenses that you paid over the period. Simply divide your account value by $1,000 (for example, an $8,600 account value divided by $1,000 = 8.6), then multiply the result by the number in the first line of your Fund under the heading entitled “Expenses Paid During Period” to estimate the expenses you paid on your account during this period.
HYPOTHETICAL EXAMPLE FOR COMPARISON PURPOSES
The second line in the table below provides information about hypothetical account values and hypothetical expenses based on the Fund’s actual expense ratio and an assumed rate of return of 5% per year before expenses, which is not the Fund’s actual return. The hypothetical account values and expenses may not be used to estimate the actual ending account balance or expenses you paid for the period. You may use this information to compare the ongoing costs of investing in your Fund and other funds. To do so, compare this 5% hypothetical example with the 5% hypothetical examples that appear in the shareholder reports of the other funds.
Please note that the expenses shown in the table are meant to highlight your ongoing costs only and do not reflect any transactional costs, such as sales charges, redemption fees, brokerage commissions paid on purchases and sales of fund shares. Therefore, the second line under the Fund in the table is useful in comparing ongoing costs only, and will not help you determine the relative total costs of owning different funds. If any of these transaction costs were included, your costs would be higher. The expenses shown in the table do not reflect any fees that may be charged to you by brokers, financial intermediaries or other financial institutions.
| | Beginning
Account
Value | | Ending
Account
Value | | Annualized
Expense
Ratio | | Expenses
Paid During
Period (a) | |
Initial Class | | | | | | | | | |
Actual | | $ | 1,000.00 | | $ | 1,052.50 | | 0.61 | % | $ | 3.16 | |
Hypothetical (b) | | 1,000.00 | | 1,022.13 | | 0.61 | | 3.11 | |
| | | | | | | | | |
Service Class | | | | | | | | | |
Actual | | 1,000.00 | | 1,050.86 | | 0.86 | | 4.45 | |
Hypothetical (b) | | 1,000.00 | | 1,020.87 | | 0.86 | | 4.38 | |
| | | | | | | | | | | | |
(a) Expenses are calculated using the Fund’s annualized expense ratio (as disclosed in the table), multiplied by the average account value for the period, multiplied by the number of days in the period (184 days), and divided by the number of days in the year (365 days).
(b) 5% return per year before expenses.
GRAPHICAL PRESENTATION OF SCHEDULE OF INVESTMENTS
By Bond Type
At December 31, 2007

This chart shows the percentage breakdown by bond type of the Fund’s total investment securities.
3
Transamerica U.S. Government Securities
SCHEDULE OF INVESTMENTS
At December 31, 2007
(all amounts except share amounts in thousands)
| | Principal | | Value | |
U.S. GOVERNMENT OBLIGATIONS (44.0%) | | | | | |
U.S. Treasury Bond | | | | | |
4.75%, due 02/15/2037 ^ | | $ | 3,474 | | $ | 3,636 | |
8.00%, due 11/15/2021 ^ | | 9,000 | | 12,317 | |
U.S Treasury Inflation Index Bond | | | | | |
3.38%, due 04/15/2032 | | 3,531 | | 4,523 | |
U.S Treasury Inflation Index Bond | | | | | |
2.38%, due 04/15/2011 | | 3,158 | | 3,291 | |
2.63%, due 07/15/2017 | | 6,678 | | 7,206 | |
U.S. Treasury Note | | | | | |
3.00%, due 11/30/2009 ^ | | 7,100 | | 7,108 | |
3.63%, due 10/31/2009 ^ | | 5,000 | | 5,049 | |
4.00%, due 02/15/2015 | | 11,000 | | 11,156 | |
4.25%, due 11/15/2013 – 11/15/2017 ^ | | 21,018 | | 21,605 | |
4.75%, due 05/31/2012 | | 1,450 | | 1,530 | |
Total U.S. Government Obligations (cost $74,724) | | | | 77,421 | |
| | | | | |
U.S. GOVERNMENT AGENCY OBLIGATIONS (38.1%) | | | | | |
Fannie Mae | | | | | |
5.00%, due 04/25/2034 | | 4,100 | | 3,999 | |
5.10%, due 01/18/2011 | | 9,000 | | 9,004 | |
5.25%, due 08/01/2012 | | 2,000 | | 2,079 | |
Federal Agricultural Mortgage Corp. -144A | | | | | |
5.50%, due 07/15/2011 | | 10,000 | | 10,591 | |
Federal Home Loan Bank | | | | | |
3.00%, due 04/15/2009 | | 13,000 | | 12,872 | |
Freddie Mac | | | | | |
5.00%, due 10/15/2030 – 11/15/2032 | | 11,802 | | 11,787 | |
5.35%, due 11/14/2011 | | 7,500 | | 7,569 | |
5.50%, due 02/22/2013 – 01/15/2029 | | 9,000 | | 9,051 | |
Total U.S. Government Agency Obligations (cost $65,813) | | | | 66,952 | |
| | | | | |
ASSET-BACKED SECURITIES (1.1%) | | | | | |
USAA Auto Owner Trust Series 2007-2, Class A2 | | | | | |
5.04%, due 04/15/2010 | | 2,000 | | 2,006 | |
Total Asset-Backed Securities (cost $2,000) | | | | 2,006 | |
| | | | | |
CORPORATE DEBT SECURITIES (12.4%) | | | | | |
Airlines (0.6%) | | | | | |
Delta Air Lines, Inc. | | | | | |
7.57%, due 11/18/2010 | | 1,000 | | 1,010 | |
Chemicals (0.6%) | | | | | |
Nalco Co. | | | | | |
7.75%, due 11/15/2011 | | 1,000 | | 1,013 | |
Commercial Banks (1.0%) | | | | | |
Rabobank Capital Funding II -144A | | | | | |
5.26%, due 12/31/2013 Ž | | $ | 1,000 | | $ | 932 | |
Wachovia Capital Trust III | | | | | |
5.80%, due 03/15/2011 Ž, 1 | | 1,000 | | 893 | |
Diversified Financial Services (0.8%) | | | | | |
Mizuho Preferred Capital Co. LLC -144A | | | | | |
8.79%, due 12/29/2049 Ž | | 800 | | 807 | |
Pemex Finance, Ltd. | | | | | |
9.03%, due 02/15/2011 | | 611 | | 646 | |
Food Products (1.4%) | | | | | |
Cargill, Inc. -144A | | | | | |
5.60%, due 09/15/2012 | | 1,000 | | 1,016 | |
Michael Foods, Inc. | | | | | |
8.00%, due 11/15/2013 | | 1,500 | | 1,485 | |
Leisure Equipment & Products (0.5%) | | | | | |
Leslie’ Poolmart | | | | | |
7.75%, due 02/01/2013 | | 1,000 | | 950 | |
Media (1.1%) | | | | | |
McGraw-Hill Cos., Inc. | | | | | |
5.38%, due 11/15/2012 | | 1,000 | | 1,018 | |
News America, Inc. | | | | | |
6.63%, due 01/09/2008 | | 870 | | 870 | |
Oil, Gas & Consumable Fuels (0.9%) | | | | | |
Husky Oil, Ltd. | | | | | |
8.90%, due 08/15/2028 | | 1,615 | | 1,629 | |
Real Estate Investment Trusts (2.4%) | | | | | |
Hospitality Properties Trust | | | | | |
6.75%, due 02/15/2013 | | 1,000 | | 1,029 | |
Tanger Properties, LP | | | | | |
9.13%, due 02/15/2008 | | 2,284 | | 2,292 | |
Westfield Capital Corp., Ltd./Wt Finance AUST Pty, Ltd./Wea Finance LLC -144A | | | | | |
4.38%, due 11/15/2010 | | 1,000 | | 976 | |
Real Estate Management & Development (0.6%) | | | | | |
Duke Realty, LP | | | | | |
5.63%, due 08/15/2011 | | 1,000 | | 1,006 | |
Specialty Retail (1.8%) | | | | | |
Petro Stopping Centers, LP / Petro | | | | | |
9.00%, due 02/15/2012 | | 3,000 | | 3,134 | |
Thrifts & Mortgage Finance (0.7%) | | | | | |
Sovereign Capital Trust VI | | | | | |
7.91%, due 06/13/2036 | | 1,200 | | 1,159 | |
Total Corporate Debt Securities (cost $22,504) | | | | 21,865 | |
The notes to the financial statements are an integral part of this report.
4
SCHEDULE OF INVESTMENTS (continued)
At December 31, 2007
(all amounts in thousands)
| | Shares | | Value | |
PREFERRED STOCKS (0.3%) | | | | | |
Thrifts & Mortgage Finance (0.3%) | | | | | |
IndyMac Bank Fsb -144A | | 40,000 | | $ | 433 | |
| | | | | |
Total Preferred Stocks (cost $1,000) | | | | 433 | |
| | | | | | |
| | Principal | | Value | |
COMMERCIAL PAPER (2.6%) | | | | | |
Diversified Financial Services (1.2%) | | | | | |
Moody’s Corp. | | | | | |
5.45%, due 01/04/2008 | | $ | 2,000 | | $ | 1,999 | |
Oil, Gas & Consumable Fuels (1.4%) | | | | | |
Sempra Energy Holdings | | | | | |
5.05%, due 01/03/2008 | | 2,500 | | 2,499 | |
Total Commercial Paper (cost $4,498) | | | | 4,498 | |
| | | | | |
Total Securities Lending Collateral (cost $21,300) (2) | | | | 21,300 | |
| | | | | |
Total Investment Securities (cost $191,839) # | | | | $ | 194,475 | |
| | | | | | | |
NOTES TO SCHEDULE OF INVESTMENTS:
^ At December 31, 2007, all or a portion of this security is on loan (see Note 1). The value at December 31, 2007, of all securities on loan is $20,830.
(1) Coupon rate is fixed for a predetermined period of time and then converts to a floating rate until maturity/call date. Rate is listed as ofDecember 31, 2007.
(2) Cash collateral for the Repurchase Agreements, valued at $7, 721, that serves as collateral for securities lending, is invested in corporate bonds withinterest rates and maturity dates ranging from 3.00% - 10.18% and 04/28/2008 - 12/01/2096, respectively.
Ž The security has a perpetual maturity. The date shown is the next call date.
# Aggregate cost for federal income tax purposes is $191,848. Aggregate gross unrealized appreciation for all securities in which there is an excess of value over tax cost and aggregate gross unrealized depreciation for all securities in which there is an excess of tax cost over value were $4,029 and $1,402, respectively. Net unrealized appreciation for tax purposes is $2,627.
DEFINITIONS:
144A 144A Securities are registered pursuant to Rule 144A of the Securities Act of 1933. These securities are deemed to be liquid for purposes of compliance limitations on holdings of illiquid securities and may be resold as transactions exempt from registration, normally to qualified institutional buyers. At December 31, 2007, these securities aggregated $14,755, or 8.39%, of net assets of the Fund.
The notes to the financial statements are an integral part of this report.
5
Transamerica U.S. Government Securities
STATEMENT OF ASSETS AND LIABILITIES
At December 31, 2007
(all amounts except per share amounts in thousands)
Assets: | | | |
Investment securities, at value (cost: $191,839) (including securities loaned of $20,830) | | $ | 194,475 | |
Cash | | 896 | |
Receivables: | | | |
Shares sold | | 7 | |
Interest | | 1,999 | |
Income from loaned securities | | 19 | |
Dividend reclaims | | 1 | |
| | 197,397 | |
Liabilities: | | | |
Accounts payable and accrued liabilities: | | | |
Shares redeemed | | 89 | |
Management and advisory fees | | 84 | |
Distribution and service fees | | 5 | |
Administration fees | | 3 | |
Payable for collateral for securities on loan | | 21,300 | |
Other | | 39 | |
| | 21,520 | |
Net Assets | | $ | 175,877 | |
| | | |
Net Assets Consist of: | | | |
Capital Stock ($.01 par value) | | $ | 146 | |
Additional paid-in capital | | 170,412 | |
Undistributed (accumulated) net investment income | | 7,628 | |
Undistributed (accumulated) net realized loss from investment securities | | (4,945 | ) |
Net unrealized appreciation on investment securities | | 2,636 | |
Net Assets | | $ | 175,877 | |
Net Assets by Class: | | | |
Initial Class | | $ | 149,664 | |
Service Class | | 26,213 | |
Shares Outstanding: | | | |
Initial Class | | 12,475 | |
Service Class | | 2 | |
Net Asset Value and Offering Price Per Share: | | 2,143 | |
Initial Class | | $ | 12.00 | |
Service Class | | 12.23 | |
STATEMENT OF OPERATIONS
For the year ended December 31, 2007
(all amounts in thousands)
Investment Income: | | | |
Dividends | | $ | 46 | |
Interest | | 8,515 | |
Income from loaned securities-net | | 131 | |
| | 8,692 | |
| | | |
Expenses: | | | |
Management and advisory fees | | 924 | |
Printing and shareholder reports | | 16 | |
Custody fees | | 28 | |
Administration fees | | 34 | |
Legal fees | | 3 | |
Audit fees | | 20 | |
Trustees fees | | 6 | |
Distribution and service fees: | | | |
Service Class | | 32 | |
Other | | 2 | |
Total expenses | | 1,065 | |
Net Investment Income | | 7,627 | |
Net Realized Gain (Loss) from: | | | |
| | | |
Investment securities | | (951 | ) |
| | | |
Net Increase (Decrease) in Unrealized Appreciation (Depreciation) on: | | | |
Investment securities | | 3,140 | |
| | | |
Net Realized and Unrealized Gain: | | 2,189 | |
| | | |
Net Increase In Net Assets Resulting from Operations | | $ | 9,816 | |
The notes to the financial statements are an integral part of this report.
6
Transamerica U.S. Government Securities
STATEMENTS OF CHANGES IN NET ASSETS
For the years ended
(all amounts in thousands)
| | December 31, 2007 | | December 31,
2006 | |
Increase (Decrease) in Net Assets From: | | | | | |
Operations: | | | | | |
Net investment income | | $ | 7,627 | | $ | 8,189 | |
Net realized (loss) from investment securities | | (951 | ) | (2,916 | ) |
Change in unrealized appreciation on investment securities | | 3,140 | | 908 | |
| | 9,816 | | 6,181 | |
Distributions to Shareholders: | | | | | |
From net investment income: | | | | | |
Initial Class | | (7,070 | ) | (6,216 | ) |
Service Class | | (1,119 | ) | (1,020 | ) |
| | (8,189 | ) | (7,236 | ) |
From net realized gains: | | | | | |
Initial Class | | — | | (225 | ) |
Service Class | | — | | (37 | ) |
| | — | | (262 | ) |
Capital Share Transactions: | | | | | |
Proceeds from shares sold: | | | | | |
Initial Class | | 27,588 | | 18,809 | |
Service Class | | 40,835 | | 27,524 | |
| | 68,423 | | 46,333 | |
Dividends and distributions reinvested: | | | | | |
Initial Class | | 7,070 | | 6,441 | |
Service Class | | 1,118 | | 1,057 | |
| | 8,188 | | 7,498 | |
Cost of shares redeemed: | | | | | |
Initial Class | | (50,975 | ) | (46,380 | ) |
Service Class | | (24,028 | ) | (27,385 | ) |
| | (75,003 | ) | (73,765 | ) |
| | 1,608 | | (19,934 | ) |
Net increase (decrease) in net assets | | 3,235 | | (21,251 | ) |
| | | | | |
Net Assets: | | | | | |
Beginning of year | | 172,642 | | 193,893 | |
End of year | | $ | 175,877 | | $ | 172,642 | |
Undistributed (Accumulated) Net Investment Income (Loss) | | $ | 7,628 | | $ | 8,190 | |
Share Activity: | | | | | |
Shares issued: | | | | | |
Initial Class | | 2,303 | | 1,588 | |
Service Class | | 3,340 | | 2,284 | |
| | 5,643 | | 3,872 | |
Shares issued-reinvested from distributions: | | | | | |
Initial Class | | 610 | | 555 | |
Service Class | | 95 | | 90 | |
| | 705 | | 645 | |
Shares redeemed: | | | | | |
Initial Class | | (4,273 | ) | (3,919 | ) |
Service Class | | (2,001 | ) | (2,285 | ) |
| | (6,274 | ) | (6,204 | ) |
Net increase (decrease) in shares outstanding: | | | | | |
Initial Class | | (1,360 | ) | (1,776 | ) |
Service Class | | 1,434 | | 89 | |
| | 74 | | (1,687 | ) |
The notes to the financial statements are an integral part of this report.
7
Transamerica U.S. Government Securities
FINANCIAL HIGHLIGHTS
For a share outstanding throughout each period(a)
| | Initial Class | |
| | Year Ended December 31, | |
| | 2007 | | 2006 | | 2005 | | 2004 | | 2003 | |
Net Asset Value | | | | | | | | | | | |
Beginning of period | | $ | 11.86 | | $ | 11.94 | | 12.32 | | 12.42 | | 12.32 | |
Investment Operations | | | | | | | | | | | |
Net investment income (loss) | | 0.54 | | 0.52 | | 0.43 | | 0.40 | | 0.36 | |
Net realized and unrealized gain (loss) | | 0.16 | | (0.14 | ) | (0.15 | ) | — | | (0.01 | ) |
Total operations | | 0.70 | | 0.38 | | 0.28 | | 0.40 | | 0.35 | |
Distributions | | | | | | | | | | | |
From net investment income | | (0.56 | ) | (0.44 | ) | (0.50 | ) | (0.44 | ) | (0.25 | ) |
From net realized gains | | — | | (0.02 | ) | (0.16 | ) | (0.06 | ) | — | |
Total distributions | | (0.56 | ) | (0.46 | ) | (0.66 | ) | (0.50 | ) | (0.25 | ) |
Net Asset Value | | | | | | | | | | | |
End of period(b) | | $ | 12.00 | | $ | 11.86 | | $ | 11.94 | | $ | 12.32 | | $ | 12.42 | |
Total Return(c),(d) | | 6.05 | % | 3.27 | % | 2.23 | % | 3.30 | % | 2.95 | % |
Net Assets End of Period (000’s) | | $ | 149,664 | | $ | 164,070 | | $ | 186,335 | | $ | 211,847 | | $ | 275,208 | |
Ratio and Supplemental Data | | | | | | | | | | | |
Expenses to average net assets(e), | | 0.62 | % | 0.62 | % | 0.67 | % | 0.72 | % | 0.69 | % |
Net investment income (loss), to average net assets(e) | | 4.56 | % | 4.41 | % | 3.50 | % | 3.19 | % | 2.89 | % |
Portfolio turnover rate(d) | | 170 | % | 184 | % | 92 | % | 82 | % | 124 | % |
For a share outstanding throughout each period(a)
| | Service Class | |
| | Year Ended December 31, | | May 1 to Dec | |
| | 2007 | | 2006 | | 2005 | | 2004 | | 31, 2003 | |
Net Asset Value | | | | | | | | | | | |
Beginning of period | | $ | 12.09 | | $ | 12.18 | | $ | 12.53 | | $ | 12.64 | | $ | 12.58 | |
Investment Operations | | | | | | | | | | | |
Net investment income (loss) | | 0.52 | | 0.51 | | 0.41 | | 0.37 | | 0.38 | |
Net realized and unrealized gain (loss) | | 0.16 | | (0.14 | ) | (0.16 | ) | (0.01 | ) | (0.29 | ) |
Total operations | | 0.68 | | 0.37 | | 0.25 | | 0.36 | | 0.09 | |
Distributions | | | | | | | | | | | |
From net investment income | | (0.54 | ) | (0.44 | ) | (0.44 | ) | (0.41 | ) | (0.03 | ) |
From net realized gains | | — | | (0.02 | ) | (0.16 | ) | (0.06 | ) | — | |
Total distributions | | (0.54 | ) | (0.46 | ) | (0.60 | ) | (0.47 | ) | (0.03 | ) |
Net Asset Value | | | | | | | | | | | |
End of period(b) | | $ | 12.23 | | $ | 12.09 | | $ | 12.18 | | $ | 12.53 | | $ | 12.64 | |
Total Return(c),(d) | | 5.78 | % | 3.06 | % | 1.98 | % | 2.90 | % | 0.68 | % |
Net Assets End of Period (000’s) | | $ | 26,213 | | $ | 8,572 | | $ | 7,558 | | $ | 5,250 | | $ | 1,421 | |
Ratio and Supplemental Data | | | | | | | | | | | |
Expenses to average net assets(e), | | 0.87 | % | 0.87 | % | 0.92 | % | 0.97 | % | 0.96 | % |
Net investment income (loss), to average net assets(e) | | 4.29 | % | 4.27 | % | 3.27 | % | 2.97 | % | 4.53 | % |
Portfolio turnover rate(d) | | 170 | % | 184 | % | 92 | % | 82 | % | 124 | % |
(a) | | Per share information is calculated based on average number of shares outstanding. |
(b) | | Transamerica U.S. Government Securities (the “Fund”) share class commenced operations as follows: |
| | Initial Class - May 13, 1994 |
| | Service Class - May 1, 2003 |
(c) | | Total Return reflects all portfolio expenses and includes reinvestment of dividends and capital gains; it does not reflect the charges and deductions under the policies or annuity contracts. |
(d) | | Not annualized. |
(e) | | Annualized. |
The notes to the financial statements are an integral part of this report.
8
Transamerica U.S. Government Securities
NOTES TO FINANCIAL STATEMENTS
At December 31, 2007
(all amounts in thousands)
NOTE 1. ORGANIZATION AND SIGNIFICANT ACCOUNTING POLICIES
AEGON/Transamerica Series Trust (“ATST”) is an open-end management investment company registered under the Investment Company Act of 1940, as amended (the “1940 Act”). ATST serves as a funding vehicle for variable life insurance, variable annuity and group annuity products. Transamerica U.S. Government Securities (the “Fund”) is part of ATST.
In the normal course of business, the Fund enters into contracts that contain a variety of representations that provide general indemnifications. The Fund’s maximum exposure under these arrangements is unknown, as this would involve future claims that may be made against the Fund and/or its affiliates that have not yet occurred. However, based on experience, the Fund expects the risk of loss to be remote.
This report should be read in conjunction with the current Fund prospectus, which contains more complete information about the Fund.
In preparing the Fund’s financial statements in accordance with accounting principles generally accepted in the United States of America (“GAAP”), estimates or assumptions (which could differ from actual results) may be used that affect reported amounts and disclosures. The following is a summary of significant accounting policies followed by the Fund.
Multiple class operations, income and expenses: The Fund currently offers two classes of shares, an Initial Class and a Service Class. Income, non-class specific expenses and realized and unrealized gains and losses, are allocated daily to each class, based upon the value of shares outstanding method as permitted under Rule 1 8f-3 of the 1940 Act. Each class bears its own specific expenses as well as a portion of general, common expenses.
Security valuations: The Fund values its investments at the close of the New York Stock Exchange (“NYSE”), normally 4 p.m. ET, each day the NYSE is open for business. Fund investments are valued at the last sale price or closing price on the day of valuation taken from the primary exchange where the security is principally traded.
Securities traded in the over-the-counter market and listed securities for which no sale was reported on that date are valued at the last quoted bid price.
Debt securities are valued based on a price quotation or other equivalent indication of value supplied by an exchange, a pricing service or a major market maker; however, those that mature in sixty days or less are valued at amortized cost, which approximates market.
Investment company securities are valued at the net asset value of the underlying portfolio.
Foreign securities generally are valued based on quotations from the primary market in which they are traded. Because many foreign securities markets and exchanges close prior to the close of the NYSE, closing prices for foreign securities in those markets or on those exchanges do not reflect the events that occur after that close. If a significant market event impacting the value of a portfolio security (e.g., natural disaster, company announcement, market volatility) occurs subsequent to the close of trading in the security, but prior to the calculation of the Fund’s net asset value per share, market quotations for that security may be determined to be unreliable and, accordingly, not “readily available.” As a result, foreign equity securities held by the Fund may be valued at fair market value as determined in good faith by the Fund’s Administrative Valuation Committee, using guidelines adopted by the Board of Trustees.
Securities for which quotations are not readily available are valued at fair market value as determined in good faith by the Fund’s Administrative Valuation Committee, using guidelines adopted by the Board of Trustees.
Cash: The Fund may leave cash overnight in its cash account with the custodian, State Street Bank & Trust Company (“State Street”). On July 2, 2007, State Street acquired the parent company of Investors Bank & Trust Company. State Street has been contracted on behalf of the Fund to invest the excess cash into a savings account, which at December 31, 2007 was paying an interest rate of 2.60%.
Repurchase agreements: The Fund is authorized to enter into repurchase agreements. The Fund, through its custodian, State Street, receives delivery of the underlying securities, the value of which at the time of purchase is required to be an amount equal to at least 100% of the resale price. The Fund will bear the risk of value fluctuations until the security can be sold and may encounter delays and incur costs in liquidating the security. In the event of bankruptcy or insolvency of the seller, delays and costs may be incurred.
Securities lending: The Fund may lend securities to qualified borrowers, with State Street acting as the Fund’s lending agent. The Fund earns negotiated lenders’ fees. The Fund receives cash and/or securities as collateral against the loaned securities. Cash collateral received is invested in short-term, interest-bearing securities. The Fund monitors the market value of securities loaned on a daily basis and requires collateral in an amount at least equal to the value of the securities loaned. Income from loaned securities earned by State Street for its services, shown in the Statement of Operations is net of fees, in the amount of $56.
The Fund has invested the cash collateral received from securities loaned in the following short-term, interest-bearing securities.
Abbey National PLC, Eurodollar Term, 5.00%, 1/7/2008 | | $ | 919 | |
ABN AMRO Bank NV, Eurodollar Term, 5.18%, 1/4/2008 | | 736 | |
Bank of Nova Scotia, Eurodollar Term, 4.96%, 1/22/2008 | | 644 | |
Barclays, Eurodollar Term, 5.00%, 2/12/2008 | | 1,287 | |
BNP Paribas, Eurodollar Term, 5.01%, 1/11/2008 | | 1,195 | |
Calyon, Eurodollar Term, 5.12%, 3/3/2008 | | 276 | |
Credit Suisse First Boston Corp., Repurchase Agreement, 4.60%, 1/2/2008 | | 2,390 | |
Dexia Group, Eurodollar Term, 4.82%, 1/3/2008 | | 919 | |
HBOS Halifax Bank of Scotland, Eurodollar Term, 5.15%, 1/2/2008 | | 460 | |
JPMorgan Chase & Co., Eurodollar Term, 5.15%, 2/12/2008 | | 460 | |
Lloyds TSB Bank, Eurodollar Term, 5.15%, 1/24/2008 | | 919 | |
9
NOTES TO FINANCIAL STATEMENTS (continued)
At December 31, 2007
(all amounts in thousands)
NOTE 1. – (continued)
Merrill Lynch & Co. (RPG), Repurchase Agreement, 4.60%, 1/2/2008 | | 1 ,379 | |
Morgan Stanley & Co. (Corp. Repo), Repurchase Agreement, 4.60%, 1/2/2008 | | 3,770 | |
Rabobank Nederland, Eurodollar Term, 5.08%, 1/10/2008 | | 1,103 | |
Reserve Primary Money Market Fund, 4.95% | | 981 | |
Royal Bank of Scotland, Eurodollar Term, 5.00%, 2/25/2008 | | 1 ,103 | |
Societe Generale, Eurodollar Term, 5.15%, 3/3/2008 | | 552 | |
Toronto Dominion Bank, Eurodollar Term, 5.05%, 1 /1 0/2008 | | 1 ,103 | |
UBS AG, Eurodollar Term, 4.92%, 1/11/2008 | | 644 | |
Wells Fargo, Bank Note, 4.75%, 1/8/2008 | | 460 | |
| | | |
| | $ | 21,300 | |
| | | | |
Security transactions and investment income: Security transactions are recorded on the trade date. Security gains and losses are calculated on the first-in, first-out basis. Dividend income, if any, is recorded on the ex-dividend date or, in the case of foreign securities, as soon as the Fund is informed of the ex-dividend date. Interest income, including accretion of discounts and amortization of premiums, is recorded on the accrual basis commencing on the settlement date.
Dividend distributions: Dividends and capital gains distributions are typically declared and reinvested annually and are generally paid and reinvested on the business day following the ex-date.
NOTE 2. RELATED PARTY TRANSACTIONS
ATST serves as a funding vehicle for certain affiliated asset allocation portfolios and certain affiliated separate accounts of Western Reserve Life Assurance Co. of Ohio, Transamerica Life Insurance Company, Transamerica Financial Life Insurance Company, Inc., Monumental Insurance Company and Transamerica Occidental Life Insurance Company.
Transamerica Fund Advisors, Inc. (“TFAI”) is the Fund’s investment adviser. Transamerica Fund Services, Inc. (“TFS”) is the Fund’s administrator and transfer agent. Prior to May 1, 2007, AFSG Securities Corp. (“AFSG”), was the Fund’s distributor. Transamerica Capital Inc. (“TCI”) is now the Fund’s distributor. TFAI, TFS, AFSG, and TCI are affiliates of AEGON NV, a Netherlands corporation.
Transamerica Investment Management, LLC (“TIM”) is an affiliate of the Fund and a sub-adviser to the Fund.
Certain officers and trustees of the Fund are also officers and/or directors of TFAI, TFS and TCI.
The following schedule reflects the percentage of Fund assets owned by affiliated investment companies at December 31, 2007:
| | Net | | % of Net | |
| | Assets | | Assets | |
| | | | | |
Asset Allocation-Conservative Portfolio | | $ | 643 | | 0.37 | % |
Total | | $ | 643 | | 0.37 | % |
Investment advisory fee: The Fund pays management fees to TFAI based on average daily net assets (“ANA”) at the following rate:
TFAI has contractually agreed to waive its advisory fee and will reimburse the Fund to the extent that operating expenses, excluding 12b-1 fees, exceed the following stated annual limit:
If total Fund expenses fall below the annual expense limitation agreement agreed to by the adviser within the succeeding three years, the Fund may be required to pay the adviser a portion or all of the waived advisory fees.
There were no amounts recaptured during the year ended December 31, 2007. There are no amounts available for recapture at December 31, 2007.
Distribution and service fees: ATST entered into a Distribution Agreement with AFSG dated January 1, 1997, as amended. On May 1, 2007, the Distribution Agreement was amended to replace AFSG with TCI as the Fund’s distributor. The Fund has also adopted a distribution plan (“Distribution Plan”) pursuant to Rule 12b-1 under the 1940 Act.
Under the Distribution Plan for the Initial Class shares, TCI, on behalf of the Fund, is authorized to pay various service providers, as direct payment for expenses incurred in connection with distribution of the Fund’s shares, amounts equal to actual expenses associated with distributing the shares.
The Distribution Plan for the Service Class shares requires ATST to pay distribution fees to TCI as compensation for its activities, not as reimbursement for specific expenses. The fee on the Service Class is paid to the insurance companies for providing services and account maintenance for their policyholders who invest in the variable insurance products which invest in the Service Class shares.
The Fund is authorized under the Distribution Plan to pay fees on each class up to the following limits:
Initial Class | | 0.15 | % |
Service Class | | 0.25 | % |
TCI has determined that it will not seek payment by the Fund of the distribution expenses incurred with respect to the Initial Class shares before April 30, 2009. Prior to TCI seeking reimbursement of future expenses, policy and contract owners will be notified in advance. The Fund will pay fees relating to Service Class shares.
Administrative services: The Fund has entered into an agreement with TFS for financial and legal fund administration services. The Fund pays TFS an annual fee of 0.02% of ANA. The Legal fees on the Statement of Operations are for fees paid to external legal counsel.
Deferred compensation plan: Each eligible independent Fund Trustee may elect participation in a non-qualified deferred compensation plan (“the Plan”).
10
NOTES TO FINANCIAL STATEMENTS (continued)
At December 31, 2007
(all amounts in thousands)
NOTE 2. – (continued)
Under the Plan, such Trustees may defer payment of all or a portion of their total fees earned as a Fund Trustee. Each Trustee who is a participant in the Plan may elect that the earnings, losses or gains credited to his or her deferred fee amounts be determined based on a deemed investment in any series of Transamerica IDEX Mutual Funds. The right of a participant to receive a distribution from the Plan of the deferred fees is an unsecured claim against the general assets of all series of Transamerica IDEX Mutual Funds. The pro rata liability to the Fund of all deferred fees in the Plan amounted, as of December 31, 2007, to $8. Amounts deferred under the Deferred Compensation Plan are unfunded against the general assets of ATST.
Retirement plan: Under a retirement plan (the “Emeritus Plan”) available to the Independent Trustees, each Independent Trustee is deemed to have elected to serve as Trustee Emeritus of ATST upon his or her termination of service, other than removal for cause, and is entitled to 50% of the trustee’s current retainer for a maximum period of five years determined by his or her years of service as a Trustee.
Such amounts shall be accrued by ATST on a pro rata basis allocable to each series of ATST fund based on the relative assets of the series. If retainers increase in the future, past accruals (and credits) will be adjusted upward so that 50% of the Trustee’s current retainer is accrued and credited at all times. Upon death, disability or termination of service, other than removal for cause, amounts deferred become payable to a Trustee Emeritus (or his/her beneficiary). Upon the commencement of service as Trustee Emeritus, compensation will be paid on a quarterly basis during the time period that the Trustee Emeritus is allowed to serve as such.
Amounts accrued under the Emeritus Plan are unsecured claims against the general assets of ATST. For the year ended December 31, 2007, the amount related to the Emeritus Plan was $8. As of December 31, 2007, the Fund has not made any payments related to the Emeritus Plan.
The Emeritus Plan was terminated effective October 30, 2007. Upon the termination, the Fund shall continue to pay any remaining benefits in accordance with the Plan, but no further compensation shall accrue under the Plan.
NOTE 3. INVESTMENT TRANSACTIONS
The cost of securities purchased and proceeds from securities sold (excluding short-term securities) for the year ended December 31, 2007 were as follows:
Purchases of securities: | | | |
Long-term | | $ | 73,816 | |
U.S. Government | | 197,553 | |
Proceeds from maturities and sales of securities: | | | |
Long-term | | 79,937 | |
U.S. Government | | 226,909 | |
| | | | |
NOTE 4. FEDERAL INCOME TAX MATTERS
The Fund has not made any provision for federal income or excise taxes due to its policy to distribute all of its taxable income and capital gains to its shareholders and otherwise qualify as a regulated investment company under Subchapter M of the Internal Revenue Code. Income and capital gain distributions are determined in accordance with income tax regulations, which may differ from GAAP. These differences are primarily due to differing treatment for items including, but not limited to, wash sales and capital loss carryover.
The tax character of distributions paid may differ from the character of distributions shown in the Statements of Changes in Net Assets due to short-term gains being treated as ordinary income for tax purposes. The tax character of distributions paid during 2006 and 2007 was as follows:
2006 Distributions paid from: | | | |
Ordinary Income | | $ | 7,236 | |
Long-term Capital Gain | | 262 | |
2007 Distributions paid from: | | | |
Ordinary Income | | 8,188 | |
Long-term Capital Gain | | — | |
| | | | |
The capital loss carryforwards are available to offset future realized capital gains through the periodS listed:
Capital Loss
Carryforwards | | Available Through | |
| | | |
$ | 3,973 | | December 31, 2014 | |
$ | 623 | | December 31, 2015 | |
The tax basis components of distributable earnings as of December 31, 2007 are as follows:
Undistributed Ordinary Income | | $ | 7,627 | |
Undistributed Long-term Capital Gain | | $ | — | |
Capital Loss Carryforward | | $ | (4,596 | ) |
Post October Capital Loss Deferral | | $ | (339 | ) |
Post October Currency Loss Deferral | | $ | — | |
Net Unrealized Appreciation (Depreciation) | | $ | 2,627 | |
11
NOTES TO FINANCIAL STATEMENTS (continued)
At December 31, 2007
(all amounts in thousands)
NOTE 5. REGULATORY PROCEEDINGS
There continues to be significant federal and state regulatory activity relating to financial services companies, particularly mutual fund companies and their investment advisers. As part of an ongoing investigation regarding potential market timing, recordkeeping and trading compliance issues and matters affecting the Fund’s investment adviser, TFAI, and certain affiliates and former employees of TFAI, the SEC staff has indicated that it is likely to take some action against TFAI and certain of its affiliates at the conclusion of the investigation. The potential timing and the scope of any such action is difficult to predict. Although the impact of any action brought against TFAI and/or its affiliates is difficult to assess at the present time, the Fund currently believes that the likelihood that any such action will have a material adverse impact on it is remote. It is important to note that the Fund is not aware of any allegation of wrong doing against it and its Board at the time this annual report is printed. Although it is not anticipated that these developments will have an adverse impact on the Fund, there can be no assurance at this time. TFAI and its affiliates are actively working with the SEC in regard to this matter; however, the exact resolution cannot be determined at this time. TFAI will take such actions that it deems necessary or appropriate to continue providing management services to the Fund and to bring all matters to an appropriate conclusion. TFAI and/or its affiliates, and not the Fund, will bear the costs regarding these regulatory matters.
NOTE 6. RECENTLY ISSUED ACCOUNTING PRONOUNCEMENTS
In July 2006, the Financial Accounting Standards Board (“FASB”) released FASB Interpretation No. 48 “Accounting for Uncertainty in Income Taxes” (“FIN 48”), an interpretation of FASB Statement No. 109. FIN 48 provides guidance for how uncertain tax positions should be recognized, measured, presented and disclosed in the financial statements. FIN 48 requires the accounting and disclosure of tax positions taken or expected to be taken in the course of preparing the Fund’s tax returns to determine whether the tax positions are “more-likely- than-not” of being sustained by the applicable tax authority. Tax positions not deemed to meet the more-likely-than-not threshold would be recorded as a tax benefit or expense in the current year.
Adoption of FIN 48 is effective during the first required financial reporting period for fiscal years beginning after December 15, 2006. Management adopted FIN 48 on June 29, 2007.
Implementation of FIN 48 requires Management of the Fund to analyze all open tax years, as defined by the Statute of Limitations, for all major jurisdictions, which includes federal and certain states. Open tax years are those that are open for exam by taxing authorities (i.e., the last 4 tax year ends and the interim tax period since then). The Fund has no examinations in progress and none are expected at this time.
Management of the Fund has reviewed all open tax years and major jurisdictions and concluded the adoption of FIN 48 resulted in no impact to the Fund’s net assets or results of operations. There is no tax liability resulting from unrecognized tax benefits relating to uncertain income tax positions taken or expected to be taken in future tax returns. The Fund is also not aware of any tax positions for which it is reasonably possible that the total amounts of unrecognized tax benefits will significantly change in the next 12 months.
In September 2006, FASB issued its new Standard No. 157, “Fair Value Measurements” (“FAS 157”). FAS 157 is designed to unify guidance for the measurement of fair value of all types of assets, including financial instruments, and certain liabilities, throughout a number of accounting standards. FAS 157 also establishes a hierarchy for measuring fair value in generally accepted accounting principles and expands financial statement disclosures about fair value measurements that are relevant to mutual funds. FAS 157 is effective for financial statements issued for fiscal years beginning after November 15, 2007, and earlier application is permitted.
As of December 31, 2007, Management does not expect the adoption of FAS 157 to impact the amounts reported in the financial statements, however, additional disclosures will be required about the inputs used to develop the measurements of fair value and the effect of certain of the measurements reported in the statement of operations for a fiscal period.
NOTE 7. SUBSEQUENT EVENT
Effective January 1, 2008, TFAI changed its name to Transamerica Asset Management, Inc.
Effective May 1, 2008, AEGON/Transamerica Series Trust will change its name to Transamerica Series Trust. At that time, the Fund will also change its name to Transamerica U.S. Government Securities VP.
12
Report of Independent Registered Certified Public Accounting Firm
To the Board of Trustees and Shareholders of
Transamerica U.S. Government Securities:
In our opinion, the accompanying statement of assets and liabilities, including the schedule of investments, and the related statements of operations and of changes in net assets and the financial highlights present fairly, in all material respects, the financial position of Transamerica U.S. Government Securities (the “Fund”) (one of the portfolios constituting AEGON/Transamerica Series Trust) at December 31, 2007, the results of its operations for the year then ended, the changes in its net assets for each of the two years in the period then ended and the financial highlights for each of the periods presented, in conformity with accounting principles generally accepted in the United States of America. These financial statements and financial highlights (hereafter referred to as “financial statements”) are the responsibility of the Fund’s management; our responsibility is to express an opinion on these financial statements based on our audits. We conducted our audits of these financial statements in accordance with the standards of the Public Company Accounting Oversight Board (United States). Those standards require that we plan and perform the audit to obtain reasonable assurance about whether the financial statements are free of material misstatement. An audit includes examining, on a test basis, evidence supporting the amounts and disclosures in the financial statements, assessing the accounting principles used and significant estimates made by management, and evaluating the overall financial statement presentation. We believe that our audits, which included confirmation of securities at December 31, 2007 by correspondence with the custodian and brokers, provide a reasonable basis for our opinion.

Tampa, Florida
February 29, 2008
13
Transamerica U.S. Government Securities
RESULTS OF SHAREHOLDER PROXY (unaudited)
At a special meeting of shareholders held on October 30, 2007, the results of the Proposals were as follows:
Proposal 1: To elect a new Board:
Proposed
Trustee | | For | | Against | | Abstentions/Broker Non-
Votes | |
John K. Carter | | 2,274,998,840.817 | | 57,804,698.755 | | 35,433.883 | |
| | | | | | | |
Leo J. Hill | | 2,277,212,702.754 | | 55,590,836.819 | | 35,433.883 | |
| | | | | | | |
Neal M. Jewell | | 2,266,793,295.663 | | 66,010,243.909 | | 35,433.883 | |
| | | | | | | |
Russell A. Kimball, Jr. | | 2,274,825,235.835 | | 57,978,303.737 | | 35,433.883 | |
| | | | | | | |
Eugene M. Mannella | | 2,274,623,165.033 | | 58,180,374.539 | | 35,433.883 | |
| | | | | | | |
Norm R. Nielsen | | 2,275,050,055.885 | | 57,753,483.687 | | 35,433.883 | |
| | | | | | | |
Joyce Galpern Norden | | 2,270,278,122.250 | | 62,525,417.323 | | 35,433.883 | |
| | | | | | | |
Patricia L. Sawyer | | 2,275,737,737.456 | | 57,065,802.116 | | 35,433.883 | |
| | | | | | | |
John W. Waechter | | 2,276,615,120.140 | | 56,188,419.433 | | 35,433.883 | |
Proposal 2: To approve an amendment to the Agreement and Declaration of Trust:
For | | Against | | Abstentions/Broker Non-
Votes | |
| | | | | |
2,182,022,669.110 | | 77,590,048.544 | | 73,226,255.801 | |
14
Transamerica U.S. Government Securities
INVESTMENT ADVISORY AND SUB-ADVISORY AGREEMENTS-REVIEW AND RENEWAL (unaudited)
At a meeting of the Board of Trustees of AEGON/Transamerica Series Trust (“ATST”) held on December 4th, 2007, the Board reviewed and considered the renewal of the investment advisory agreement (the “Investment Advisory Agreement”) between Transamerica U.S. Government Securities (the “Fund”) and Transamerica Fund Advisors, Inc. (“TFAI”), as well as the renewal of the investment sub- advisory agreement (the “Sub-Advisory Agreement”) of the Fund between TFAI and Transamerica Investment Management, LLC (the “Sub-Adviser”), to determine whether the agreements should be renewed for a six-month period. It was noted that this review was interim in nature to align all the Funds on the same calendar, and that the Funds’ advisory arrangements would be reviewed again in the first half of 2008.
Following their review and consideration, the Trustees determined that the renewal of the Investment Advisory Agreement and the Sub-Advisory Agreement would enable shareholders of the Fund to obtain high quality services at a cost that is appropriate, fair, and in the best interests of its shareholders. The Board, including the independent members of the Board, unanimously approved the renewal of the Investment Advisory Agreement and Sub-Advisory Agreement. In reaching their decision, the Trustees requested and obtained from TFAI and the Sub-Adviser such information as they deemed reasonably necessary to evaluate the agreements, including information about fees and performance of comparable funds managed by the Sub-Adviser. The Trustees also carefully considered information they had previously received from TFAI and the Sub-Adviser throughout the year as part of their regular oversight of the Fund, as well as comparative fee, expense, and performance information prepared by Lipper Inc. (“Lipper”), an independent provider of mutual fund performance, fee and expense information and profitability data prepared by management. In considering the proposed continuation of the Investment Advisory and Sub-Advisory Agreements, the Trustees evaluated a number of considerations that they believed, in light of the legal advice furnished to them by independent legal counsel and their own business judgment, to be relevant. They based their decisions on a variety of factors, including the following considerations, among others, although they did not identify any consideration or particular information that was controlling of their decisions:
The nature, extent and quality of the advisory services to be provided. The Board considered the nature and quality of the services provided by TFAI and the Sub-Adviser to the Fund in the past, as well as the services anticipated to be provided in the future. The Board concluded that TFAI and the Sub-Adviser are capable of providing high quality services to the Fund, as indicated by the nature and quality of services provided in the past by TFAI and the Sub-Adviser for this series and the experience, capability and integrity of TFAI’s senior management, the financial resources of TFAI and the Sub-Adviser, TFAI’s management oversight process and the professional qualifications of the portfolio management team of the Sub-Adviser. The Trustees determined that TFAI and the Sub-Adviser can provide investment and related services that are appropriate in scope and extent in light of the Fund’s operations, the competitive landscape of the investment company business and investor needs.
The investment performance of the Fund. The Board examined the short and longer-term performance of the Fund, including relative performance against a peer universe of comparable mutual funds as prepared by Lipper for various trailing periods ended June 30, 2007. The Board noted that the Fund’s performance was above the median for its peer universe over the past 1- and 3-year periods. The Board also noted that the Fund’s performance was below the median for its peer universe over the past 5-year period. The Board noted further that, for the 5-year period, the Fund’s performance had been compared to a smaller number of peer funds due to the closing or merger of weaker funds during that period. In addition, the Board noted that the Sub-Adviser’s performance had improved since the prior year and that the Fund’s trailing returns were at or above the median for its peer universe. On the basis of the Board’s assessment of the nature, extent and quality of advisory services to be provided or procured by TFAI and the Sub-Adviser, the Board concluded that TFAI and the Sub-Adviser are capable of providing a level of investment performance that is appropriate in light of the Fund’s proposed investment objectives, policies and strategies and competitive with other similarly situated investment companies.
The cost of advisory services provided and the level of profitability. The Board reviewed profitability information of TFAI’s cost of procuring fund management services, as well as the costs of its provision of administration, fund accounting and other services, to the Fund and to ATST as a whole by TFAI and its affiliates. The Board reviewed the management and sub-advisory fees for the Fund. The Board noted that the Fund’s contractual management fees were above the median of the Fund’s peer group and universe, but by a relatively small margin. The Board also noted that the Adviser had lowered its fees in 2006. The Board noted further that the Sub-Adviser’s flat fee was quite competitive. In addition, the Board noted that the Fund’s total expenses were near the median of the peer group and below the median of the peer universe. Based on their review, the Trustees determined that the management fees of the Fund generally are appropriate in light of the services expected to be provided or procured, the management fees and the anticipated profitability of the relationship between the Fund, TFAI and its affiliates, and the Sub-Adviser. In making these observations and determinations, the Board reviewed, among other things, comparative information provided by Lipper.
Whether fee levels reflect economies of scale and the extent to which economies of scale would be realized as the Fund grows. In evaluating the extent to which the management fees payable under the Investment Advisory and Sub-Advisory Agreements reflect economies of scale or will permit economies of scale to be realized in the future, the Board considered the specific reasons for the absence of breakpoints (fees had been lowered in 2006), and concluded that the absence of breakpoints was acceptable under the circumstances. The Trustees also concluded that they will have the opportunity to periodically reexamine whether the Fund has achieved economies of scale, and the appropriateness of management fees payable to TFAI and fees paid to the Sub-Adviser, in the future.
Benefits (such as soft dollars) to TFAI, its affiliates, or the Sub-Adviser from their relationship with the Fund. The Board concluded that other benefits anticipated to be derived by TFAI, its affiliates, and the Sub-Adviser from their relationships with the Fund are expected to be reasonable and fair, and consistent with industry practice and the best interests of the Fund and its shareholders. The Trustees noted that TFAI would not realize soft dollar benefits from its relationship with the Fund, and that the Sub-Adviser’s soft dollar trading is consistent with applicable law, including best execution requirements in particular..
15
Other considerations. The Board determined that TFAI has made a substantial commitment to the recruitment and retention of high quality personnel, and maintains the financial, compliance and operational resources reasonably necessary to manage the Fund in a professional manner that is consistent with the best interests of the Fund and its shareholders. In this regard, the Trustees favorably considered the procedures and policies in place by TFAI to enforce compliance with applicable laws and regulations and oversee the portfolio management activities of the Sub-Adviser. The Trustees also determined that TFAI has made a significant entrepreneurial commitment to the management and success of the Fund, reflected by TFAI’s expense limitation and fee waiver arrangements with the Fund which may result in TFAI waiving a substantial amount of management fees for the benefit of shareholders.
16
Transamerica Value Balanced
MARKET ENVIRONMENT
After several years of out performance, value stocks ceded leadership to growth stocks in the year ended December 31, 2007. The lagging results for the value group can be attributed to second-half turmoil in the various corners of the financial industry, which comprises the largest portion of many value indexes.
At the center of the turbulence were the deteriorating U.S. housing market and rising defaults on lower-quality (sub-prime) home loans. The sharply higher defaults toppled a complex structure of investment vehicles that were underpinned by the risky loans. Attempts to resolve the housing and credit issues and prop up the economy – a total of 1.0% in interest-rate reductions by the Federal Reserve Board (“Fed”) and capital infusions for some of the hardest-hit financial institutions – were largely ineffective. The contagion spread to the broader economy, and corporate earnings growth stalled out.
Unsettled by the credit crisis, fixed-income investors sought safety in government securities, which outperformed all other sectors of the bond market. Based largely on the strength of Treasuries, the Lehman Brothers Aggregate Index rose for the full twelve-month period.
PERFORMANCE
For the year ended December 31, 2007, Transamerica Value Balanced, Initial Class returned 6.72%. By comparison its primary and secondary benchmarks, the Russell 1000 Value Index and the Lehman Brothers Aggregate Bond Index, returned (0.17)% and 6.97%, respectively.
STRATEGY REVIEW
The portfolio outperformed a 60% stocks/40% bonds blend of the abovementioned indices.Throughout the period, we believed that an economic slowdown was merely a matter of time. Furthermore, we believed the Fed’s ability to mitigate the situation, by reducing interest rates, was limited by the larger, global environment. Enormous global demand for finished goods, services and raw materials continued to exert inflationary pressures, making it difficult for the Fed to reduce rates; it did so only when the housing- and credit-related issues reached crisis proportions.
In keeping with this viewpoint, we shifted the weighting in the equity portfolio, increasing the emphasis on industries that stood to benefit from rising demand for commodities (e.g., energy, materials/processing, producer durables and shipping), paring back companies dependent on U.S. interest rates (mostly financials) and being highly selective about consumer stocks.
The top contributors to performance included commodities- related businesses (Marathon Oil Corporation and Brazilian iron-ore producer Companhia Vale Do Rio Doce), Microsoft Corporation and two businesses that moved out from under longstanding clouds of litigation (pharmaceuticals maker Merck & Co., Inc. (“Merck”) and tobacco company Altria Group, Inc. (“Altria”)). As investors focused less on the litigation loads at Merck and Altria and more on their solid fundamentals, these core holdings posted double-digit gains.
These and other gains more than offset losses among our financial holdings and positive but lagging returns for the fixed- income portfolio. We reduced the allocation to stocks directly in the path of the credit-market upheaval (e.g., Washington Mutual, Inc. and Bank of America Corporation) – but not quickly or thoroughly enough to prevent some damage when these companies announced multi-billion-dollar writedowns. As for the fixed-income portfolio, the underperformance can be attributed to an overweighting in non-government sectors (i.e., corporate bonds and mortgage-related securities). Although we reduced the corporate allocation prior to the credit crunch and owned only quality mortgage securities, the portfolio did not keep pace with the index amidst the exceptional volatility in the second half of the year.
Heidi Y. Hu, CFA
Michelle E. Stevens, CFA
Co-Portfolio Managers
Transamerica Investment Management, LLC
AEGON/Transamerica Series Trust | Annual Report 2007 |
1
Transamerica Value Balanced
(unaudited)
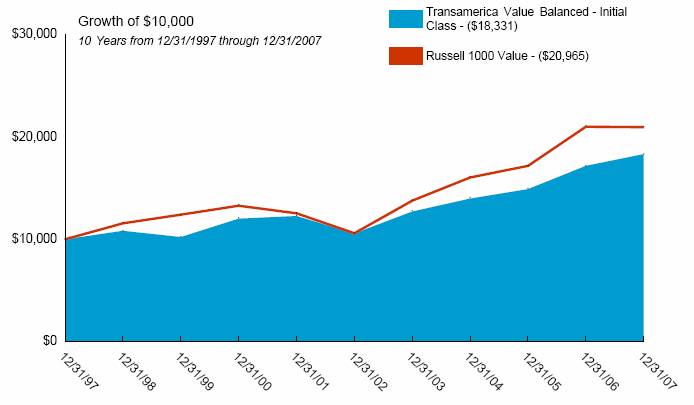
Average Annual Total Return for Periods Ended 12/31/2007
| | 1 Year | | 5 Years | | 10 Years | | From
Inception | | Inception
Date | |
Initial Class | | 6.72 | % | 11.62 | % | 6.25 | % | 8.64 | % | 1/3/95 | |
Russell 1000 Value(1) | | (0.17 | )% | 14.63 | % | 7.68 | % | 12.78 | % | 1/3/95 | |
Lehman Brothers Aggregate Bond Index(1) | | 6.97 | % | 4.42 | % | 5.97 | % | 6.99 | % | 1/3/95 | |
| | | | | | | | | | | |
Service Class | | 6.46 | % | — | % | — | % | 11.30 | % | 5/1/03 | |
NOTES
(1) The Russell 1000 Value (Russell 1000 Value) Index and the Lehman Brothers Aggregate Bond (LBAB) Index are unmanaged indices used as a general measure of market performance. Calculations assume dividends and capital gains are reinvested and do not include any managerial expenses. From inception calculation is based on life of Initial Class shares.
The performance data presented represents past performance, future results may vary. The portfolio’s investment return and net asset value will fluctuate. Past performance does not guarantee future results. Investor’s units when redeemed, may be worth more or less than their original cost.
Current performance may be lower or higher than performance quoted. Please visit your insurance company’s website for contract or policy level standardized total returns current to the most recent month end. Portfolio performance is net of investment fees and fund expenses, but not product charges, which, if included, would significantly lower the performance quoted.
This material must be preceded or accompanied by a current prospectus, which includes specific contents regarding the investment objectives, explanation of share classes and policies of this portfolio.
2
Transamerica Value Balanced
UNDERSTANDING YOUR FUND’S EXPENSES
(unaudited)
SHAREHOLDER EXPENSES
Fund shareholders may incur ongoing costs, including management and advisory fees, distribution and service fees, and other fund expenses.
The following Example is intended to help you understand your ongoing costs (in dollars and cents) of investing in the Fund and to compare these costs with the ongoing costs of investing in other funds.
The Example is based on an investment of $1,000 invested at July 1, 2007 and held for the entire period until December 31, 2007
ACTUAL EXPENSES
The first line in the table below provides information about actual account values and actual expenses. You may use the information in this line, together with the amount you invested, to estimate the expenses that you paid over the period. Simply divide your account value by $1,000 (for example, an $8,600 account value divided by $1,000 = 8.6), then multiply the result by the number in the first line of your Fund under the heading entitled “Expenses Paid During Period” to estimate the expenses you paid on your account during this period.
HYPOTHETICAL EXAMPLE FOR COMPARISON PURPOSES
The second line in the table below provides information about hypothetical account values and hypothetical expenses based on the Fund’s actual expense ratio and an assumed rate of return of 5% per year before expenses, which is not the Fund’s actual return. The hypothetical account values and expenses may not be used to estimate the actual ending account balance or expenses you paid for the period. You may use this information to compare the ongoing costs of investing in your Fund and other funds. To do so, compare this 5% hypothetical example with the 5% hypothetical examples that appear in the shareholder reports of the other funds.
Please note that the expenses shown in the table are meant to highlight your ongoing costs only and do not reflect any transactional costs, such as sales charges, redemption fees, brokerage commissions paid on purchases and sales of fund shares. Therefore, the second line under the Fund in the table is useful in comparing ongoing costs only, and will not help you determine the relative total costs of owning different funds. If any of these transaction costs were included, your costs would be higher. The expenses shown in the table do not reflect any fees that may be charged to you by brokers, financial intermediaries or other financial institutions.
| | Beginning
Account
Value | | Ending
Account
Value | | Annualized
Expense
Ratio | | Expenses
Paid During
Period (a) | |
| | | | | | | | | |
Initial Class | | | | | | | | | |
Actual | | $ | 1,000.00 | | $ | 1,004.23 | | 0.83 | % | $ | 4.19 | |
Hypothetical (b) | | 1,000.00 | | 1,021.02 | | 0.83 | | 4.23 | |
| | | | | | | | | |
Service Class | | | | | | | | | |
Actual | | 1,000.00 | | 1,002.96 | | 1.08 | | 5.45 | |
Hypothetical (b) | | 1,000.00 | | 1,019.76 | | 1.08 | | 5.50 | |
| | | | | | | | | | | | |
(a) | Expenses are calculated using the Fund’s annualized expense ratio (as disclosed in the table), multiplied by the average account value for the period, multiplied by the number of days in the period (184 days), and divided by the number of days in the year (365 days). |
| |
(b) | 5% return per year before expenses. |
GRAPHICAL PRESENTATION OF SCHEDULE OF INVESTMENTS
By Asset Type
At December 31, 2007
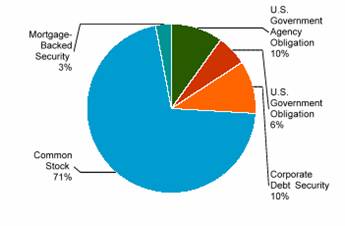
This chart shows the percentage breakdown by asset type of the Fund’s total investment.
3
Transamerica Value Balanced
SCHEDULE OF INVESTMENTS
At December 31, 2007
(all amounts except share amounts in thousands)
| | Principal | | Value | |
U.S. GOVERNMENT OBLIGATIONS (5.9%) | | | | | |
U.S. Treasury Bond | | | | | |
4.50%, due 02/15/2036 | | $ | 963 | | $ | 968 | |
4.75%, due 02/15/2037 | | 1,007 | | 1,054 | |
8.00%, due 11/15/2021 | | 240 | | 328 | |
U.S. Treasury Inflation Indexed Note, TIPS | | | | | |
2.63%, due 07/15/2017 | | 4,214 | | 4,546 | |
U.S. Treasury Note | | | | | |
3.63%, due 10/31/2009 | | 2,000 | | 2,020 | |
4.25%, due 11/15/2013 – 08/15/2014 | | 11,500 | | 11,911 | |
4.75%, due 08/15/2017 | | 2,773 | | 2,929 | |
Total U.S. Government Obligations (cost $23,274) | | | | 23,756 | |
| | | | | |
U.S. GOVERNMENT AGENCY OBLIGATIONS (9.8%) | | | | | |
Fannie Mae | | | | | |
5.00%, due 05/01/2018 | | 934 | | 936 | |
5.50%, due 08/01/2017 – 07/01/2036 | | 9,621 | | 9,633 | |
6.00%, due 01/01/2018 – 08/01/2036 | | 8,629 | | 8,783 | |
Freddie Mac | | | | | |
4.25%, due 10/15/2026 | | 3,000 | | 2,972 | |
5.00%, due 04/01/2018 – 11/15/2032 | | 5,024 | | 5,026 | |
5.35%, due 11/14/2011 | | 3,800 | | 3,835 | |
5.50%, due 09/01/2018 – 01/01/2036 | | 4,361 | | 4,388 | |
6.00%, due 11/01/2033 – 12/01/2033 | | 2,250 | | 2,289 | |
Ginnie Mae | | | | | |
6.00%, due 02/20/2034 – 08/20/2034 | | 881 | | 900 | |
6.50%, due 10/15/2027 | | 521 | | 541 | |
Total U.S. Government Agency Obligations (cost $39,272) | | | | 39,303 | |
| | | | | |
MORTGAGE-BACKED SECURITIES (3.0%) | | | | | |
American Tower Trust | | | | | |
Series 2007-1A, Class C -144A | | | | | |
5.62%, due 04/15/2037 | | 1,090 | | 1,026 | |
Bear Stearns Commercial Mortgage Securities | | | | | |
Series 2006-PW14, Class A4 | | | | | |
5.20%, due 12/11/2038 | | 2,250 | | 2,228 | |
Crown Castle Towers LLC | | | | | |
Series 2006-1A, Class AFX-144A | | | | | |
5.24%, due 11/15/2036 | | 2,022 | | 2,018 | |
Morgan Stanley Capital I | | | | | |
Series 2006-HQ10, Class A4 | | | | | |
5.33%, due 11/12/2041 | | 2,320 | | 2,319 | |
SBA CMBS Trust | | | | | |
Series 2006-1A, Class A-144A | | | | | |
5.31%, due 11/15/2036 | | 1,800 | | 1,801 | |
Wachovia Bank Commercial Mortgage Trust | | | | | |
Series 2006-C28, Class A4 | | | | | |
5.57%, due 10/15/2048 | | 2,249 | | 2,285 | |
Wachovia Bank Commercial Mortgage Trust | | | | | |
Series 2007-C32, Class H-144A | | | | | |
5.93%, due 06/15/2049 | | $ | 570 | | $ | 395 | |
Total Mortgage-Backed Securities (cost $12,263) | | | | 12,072 | |
| | | | | |
CORPORATE DEBT SECURITIES (10.0%) | | | | | |
Aerospace & Defense (0.2%) | | | | | |
Honeywell International | | | | | |
5.63%, due 08/01/2012 | | 900 | | 932 | |
Airlines (0.3%) | | | | | |
Delta Air Lines, Inc. | | | | | |
7.57%, due 11/18/2010 | | 580 | | 586 | |
United Airlines, Inc. | | | | | |
6.64%, due 07/02/2022 | | 804 | | 755 | |
Beverages (0.3%) | | | | | |
Diageo Capital PLC | | | | | |
5.75%, due 10/23/2017 | | 1,025 | | 1,031 | |
Building Products (0.2%) | | | | | |
CRH America, Inc. | | | | | |
5.30%, due 10/15/2013 | | 650 | | 636 | |
Capital Markets (0.2%) | | | | | |
JP Morgan Chase Capital XVIII | | | | | |
6.95%, due 08/17/2036 | | 650 | | 617 | |
Commercial Banks (0.6%) | | | | | |
ICICI Bank, Ltd. -144A | | | | | |
4.92%, due 01/12/2010 * | | 925 | | 913 | |
Rabobank Capital Funding II -144A | | | | | |
5.26%, due 12/31/2013 Ž | | 480 | | 447 | |
Wachovia Capital Trust III | | | | | |
5.80%, due 03/15/2011 Ž, (1) | | 560 | | 500 | |
ZFS Finance USA Trust II -144A | | | | | |
6.45%, due 12/15/2065 (1) | | 575 | | 536 | |
Consumer Finance (0.4%) | | | | | |
Discover Financial Services -144A | | | | | |
6.23%, due 06/11/2010 * | | 1,625 | | 1,547 | |
Diversified Financial Services (0.9%) | | | | | |
Glencore Funding LLC -144A | | | | | |
6.00%, due 04/15/2014 | | 935 | | 941 | |
ILFC E-Capital Trust II -144A | | | | | |
6.25%, due 12/21/2065 (1) | | 920 | | 879 | |
Mizuho JGB Investment LLC -144A | | | | | |
9.87%, due 06/30/2008 * Ž, (1) | | 790 | | 797 | |
Pemex Finance, Ltd. | | | | | |
9.03%, due 02/15/2011 | | 845 | | 894 | |
Energy Equipment & Services (0.2%) | | | | | |
Transocean, Inc. | | | | | |
6.80%, due 03/15/2038 | | 655 | | 668 | |
Food & Staples Retailing (0.1%) | | | | | |
Stater Brothers Holdings, Inc. | | | | | |
8.13%, due 06/15/2012 | | 600 | | 592 | |
The notes to the financial statements are an integral part of this report.
4
| | Principal | | Value | |
Food Products (0.9%) | | | | | |
Bunge, Ltd. Finance Corp. | | | | | | | |
4.38%, due 12/15/2008 | | $ | 1,955 | | $ | 1,942 | |
Cargill, Inc. -144A | | | | | |
5.60%, due 09/15/2012 | | 1,083 | | 1,101 | |
Michael Foods, Inc. | | | | | |
8.00%, due 11/15/2013 | | 700 | | 693 | |
Hotels, Restaurants & Leisure (0.4%) | | | | | |
Las Vegas Sands Corp. | | | | | |
6.38%, due 02/15/2015 | | 700 | | 658 | |
Royal Caribbean Cruises, Ltd. | | | | | |
8.75%, due 02/02/2011 | | 1,000 | | 1,043 | |
Household Products (0.2%) | | | | | |
Kimberly-Clark | | | | | |
6.63%, due 08/01/2037 | | 565 | | 625 | |
Independent Power Producers & Energy Traders (0.3%) | | | | | |
Empresa Nacional de Electricidad SA/Chile Class B | | | | | |
8.50%, due 04/01/2009 | | 1,300 | | 1,359 | |
Insurance (0.4%) | | | | | |
Oil Insurance, Ltd. -144A | | | | | |
7.56%, due 06/30/2011 * Ž, (1) | | 650 | | 662 | |
Travelers Cos., Inc. (The) | | | | | |
6.75%, due 06/20/2036 | | 1,030 | | 1,075 | |
Machinery (0.2%) | | | | | |
Tyco Electronics Group SA -144A | | | | | |
6.55%, due 10/01/2017 | | 652 | | 671 | |
Media (0.5%) | | | | | |
Amfm, Inc. | | | | | |
8.00%, due 11/01/2008 | | 1,275 | | 1,318 | |
News America Holdings, Inc. | | | | | |
7.75%, due 12/01/2045 | | 610 | | 661 | |
Multiline Retail (0.3%) | | | | | |
Neiman-Marcus Group, Inc. | | | | | |
9.00%, due 10/15/2015 | | 500 | | 515 | |
Target Corp. | | | | | |
6.50%, due 10/15/2037 | | 540 | | 543 | |
Oil, Gas & Consumable Fuels (0.5%) | | | | | |
Husky Oil, Ltd. | | | | | |
8.90%, due 08/15/2028 (1) | | 1,320 | | 1,331 | |
PetroHawk Energy Corp. | | | | | |
9.13%, due 07/15/2013 | | 720 | | 758 | |
Paper & Forest Products (0.3%) | | | | | |
Celulosa Arauco y Constitucion SA | | | | | |
8.63%, due 08/15/2010 | | 1,240 | | 1,354 | |
Real Estate Investment Trusts (1.2%) | | | | | |
iStar Financial, Inc. | | | | | |
4.88%, due 01/15/2009 | | 2,000 | | 1,931 | |
PPF Funding, Inc. -144A | | | | | |
5.35%, due 04/15/2012 | | 1,800 | | 1,796 | |
Westfield Group -144A | | | | | |
5.40%, due 10/01/2012 | | 1,155 | | 1,153 | |
Real Estate Management & Development (0.8%) | | | | | |
Duke Realty, LP | | | | | | | |
5.63%, due 08/15/2011 | | $ | 1,230 | | $ | 1,237 | |
ERP Operating, LP | | | | | |
5.38%, due 08/01/2016 | | 925 | | 872 | |
Post Apartment Homes, LP | | | | | |
6.30%, due 06/01/2013 | | 1,247 | | 1,309 | |
Road & Rail (0.2%) | | | | | |
Hertz Corp. (The) | | | | | |
8.88%, due 01/01/2014 | | 650 | | 659 | |
Specialty Retail (0.2%) | | | | | |
Lowe’s Companies, Inc. | | | | | |
6.65%, due 09/15/2037 | | 450 | | 456 | |
Petro Stopping Centers, LP / Petro | | | | | |
9.00%, due 02/15/2012 | | 435 | | 455 | |
Wireless Telecommunication Services (0.2%) | | | | | |
Nextel Communications, Inc. | | | | | |
7.38%, due 08/01/2015 | | 728 | | 717 | |
Total Corporate Debt Securities (cost $40,548) | | | | 40,165 | |
| | | | | |
| | Shares | | Value | |
PREFERRED STOCKS (0.1%) | | | | | |
Thrifts & Mortgage Finance (0.1%) | | | | | |
IndyMac Bank Fsb -144A | | 25,600 | | $ | 277 | |
Total Preferred Stocks (cost $640) | | | | 277 | |
| | | | | |
COMMON STOCKS (70.5%) | | | | | |
Capital Markets (5.7%) | | | | | |
AllianceBernstein Holding, LP | | 235,800 | | 17,744 | |
Jefferies Group, Inc. | | 77,900 | | 1,795 | |
Raymond James Financial, Inc. | | 100,000 | | 3,266 | |
Commercial Banks (2.2%) | | | | | |
PNC Financial Services Group, Inc. | | 70,000 | | 4,596 | |
Wachovia Corp. | | 67,640 | | 2,572 | |
Wells Fargo & Co. | | 60,000 | | 1,811 | |
Diversified Financial Services (2.2%) | | | | | |
Bank of America Corp. | | 211,844 | | 8,741 | |
Electric Utilities (1.5%) | | | | | |
Dominion Resources, Inc. | | 90,000 | | 4,270 | |
Duke Energy Corp. | | 92,000 | | 1,856 | |
Energy Equipment & Services (1.3%) | | | | | |
Transocean, Inc. | | 37,489 | | 5,367 | |
Food Products (0.9%) | | | | | |
Kraft Foods, Inc. Class A | | 110,723 | | 3,613 | |
Household Products (1.8%) | | | | | |
Colgate-Palmolive Co. | | 56,000 | | 4,366 | |
Kimberly-Clark Corp. | | 40,000 | | 2,773 | |
Industrial Conglomerates (3.7%) | | | | | |
General Electric Co. | | 165,000 | | 6,117 | |
McDermott International, Inc. ‡ | | 145,000 | | 8,559 | |
Insurance (1.2%) | | | | | |
American International Group, Inc. | | 80,000 | | 4,664 | |
| | | | | | | | |
The notes to the financial statements are an integral part of this report.
5
| | Shares | | Value | |
IT Services (1.4%) | | | | | |
Fiserv, Inc. ‡ | | 101,380 | | $ | 5,626 | |
Marine (2.6%) | | | | | |
Genco Shipping & Trading, Ltd. | | 192,300 | | 10,530 | |
Media (4.9%) | | | | | |
Time Warner, Inc. | | 856,700 | | 14,144 | |
Walt Disney Co. (The) | | 175,000 | | 5,649 | |
Metals & Mining (3.1%) | | | | | |
Cia Vale do Rio Doce | | 246,000 | | 8,037 | |
Fording Canadian Coal Trust | | 110,000 | | 4,246 | |
Oil, Gas & Consumable Fuels (11.0%) | | | | | |
Anadarko Petroleum Corp. | | 110,000 | | 7,226 | |
BP PLC | | 175,000 | | 12,805 | |
Chesapeake Energy Corp. | | 49,800 | | 1,952 | |
Exxon Mobil Corp. | | 55,000 | | 5,153 | |
Marathon Oil Corp. | | 160,000 | | 9,737 | |
Valero Energy Corp. | | 105,000 | | 7,353 | |
Pharmaceuticals (10.7%) | | | | | |
Bristol-Myers Squibb Co. | | 595,000 | | 15,779 | |
Merck & Co., Inc. | | 298,200 | | 17,329 | |
Pfizer, Inc. | | 180,600 | | 4,105 | |
Schering-Plough Corp. | | 210,000 | | 5,594 | |
Road & Rail (1.3%) | | | | | |
Union Pacific Corp. | | 40,000 | | $ | 5,025 | |
Software (5.8%) | | | | | |
Microsoft Corp. | | 658,700 | | 23,450 | |
Textiles, Apparel & Luxury Goods (1.3%) | | | | | |
Hanesbrands, Inc. ‡ | | 191,200 | | 5,195 | |
Thrifts & Mortgage Finance (0.1%) | | | | | |
Washington Mutual, Inc. | | 30,000 | | 408 | |
Tobacco (4.9%) | | | | | |
Altria Group, Inc. | | 160,000 | | 12,093 | |
Loews Corp. - Carolina Group | | 90,000 | | 7,677 | |
Transportation Infrastructure (2.3%) | | | | | |
Aegean Marine Petroleum Network, Inc. | | 240,600 | | 9,237 | |
Wireless Telecommunication Services (0.6%) | | | | | |
Sprint Nextel Corp. | | 175,000 | | 2,297 | |
Total Common Stocks (cost $211,341) | | | | 282,757 | |
| | | | | |
Total Investment Securities (cost $327,338) # | | | | $ | 398,330 | |
NOTES TO SCHEDULE OF INVESTMENTS:
* | Floating or variable rate note. Rate is listed as of December 31, 2007. |
‡ | Non-Income Producing. |
(1) | Coupon rate is fixed for a predetermined period of time and then converts to a floating rate until maturity/call date. Rate is listed as of December 31, 2007. |
Ž | The security has a perpetual maturity. The date shown is the next call date. |
# | Aggregate cost for federal income tax purposes is $326,509. Aggregate gross unrealized appreciation for all securities in which there is an excess of value over tax cost and aggregate gross unrealized depreciation for all securities in which there is an excess of tax cost over value were $78,406 and $6,585 respectively. Net unrealized appreciation for tax purposes is $71,821. |
DEFINITIONS:
144A | 144A Securities are registered pursuant to Rule 144A of the Securities Act of 1933. These securities are deemed to be liquid for purposes of compliance limitations on holdings of illiquid securities and may be resold as transactions exempt from registration, normally to qualified institutional buyers. At December 31, 2007, these securities aggregated $16,960, or 4.23%, of net assets of the Fund. |
TIPS | Treasury Inflation Protected Security |
The notes to the financial statements are an integral part of this report.
6
Transamerica Value Balanced
STATEMENT OF ASSETS AND LIABILITIES
At December 31, 2007
(all amounts except per share amounts in thousands)
Assets: | | | |
Investment securities, at value (cost: $327,338) | | $ | 398,330 | |
Cash | | 1,657 | |
Receivables: | | | |
Interest | | 1,226 | |
Dividends | | 477 | |
Dividend reclaims | | 1 | |
| | 401,691 | |
Liabilities: | | | |
Accounts payable and accrued liabilities: | | | |
Shares redeemed | | 157 | |
Management and advisory fees | | 260 | |
Distribution and service fees | | 2 | |
Administration fees | | 7 | |
Other | | 149 | |
| | 575 | |
Net Assets | | $ | 401,116 | |
| | | |
Net Assets Consist of: | | | |
Capital Stock ($.01 par value) | | $ | 283 | |
Additional paid-in capital | | 288,806 | |
Undistributed (accumulated) net investment income | | 12,261 | |
Undistributed (accumulated) net realized gain from investment securities, written option and swaption contracts | | 28,774 | |
Net unrealized appreciation on investment securities | | 70,992 | |
Net Assets | | $ | 401,116 | |
Net Assets by Class: | | | |
Initial Class | | $ | 393,632 | |
Service Class | | 7,484 | |
Shares Outstanding: | | | |
Initial Class | | 27,744 | |
Service Class | | 511 | |
Net Asset Value and Offering Price Per Share: | | | |
Initial Class | | $ | 14.19 | |
Service Class | | 14.64 | |
STATEMENT OF OPERATIONS
For the year ended December 31, 2007
(all amounts in thousands)
Investment Income: | | | |
Dividends (net of withholding taxes on foreign dividends of $13) | | $ | 8,904 | |
Interest | | 6,710 | |
| | 15,614 | |
| | | |
Expenses: | | | |
Management and advisory fees | | 3,241 | |
Printing and shareholder reports | | 139 | |
Custody fees | | 61 | |
Administration fees | | 86 | |
Legal fees | | 9 | |
Audit fees | | 21 | |
Trustees fees | | 15 | |
Distribution and service fees: | | | |
Service Class | | 19 | |
Other | | 6 | |
Total expenses | | 3,597 | |
Net Investment Income | | 12,017 | |
| | | |
Net Realized Gain (Loss) from: | | | |
Investment securities | | 26,548 | |
Written option and swaption contracts | | 4,012 | |
| | 30,560 | |
| | | |
Net Increase (Decrease) in Unrealized Appreciation (Depreciation) on: | | | |
Investment securities | | (11,627 | ) |
Written option and swaption contracts | | (2,265 | ) |
| | (13,892 | ) |
| | | |
Net Realized and Unrealized Gain: | | 16,668 | |
Net Increase In Net Assets Resulting from Operations | | $ | 28,685 | |
The notes to the financial statements are an integral part of this report.
7
Transamerica Value Balanced
STATEMENTS OF CHANGES IN NET ASSETS
For the years ended
(all amounts in thousands)
| | December 31, | | December 31, | |
| | 2007 | | 2006 | |
Increase (Decrease) in Net Assets From: | | | | | |
Operations: | | | | | |
Net investment income | | $ | 12,017 | | $ | 12,181 | |
Net realized gain from investment securities , written options and swaptions contracts | | 30,560 | | 17,200 | |
Change in unrealized appreciation (depreciation) on investment securities , written options and swaptions | | (13,892 | ) | 34,958 | |
| | 28,685 | | 64,339 | |
Distributions to Shareholders: | | | | | |
From net investment income: | | | | | |
Initial Class | | (10,590 | ) | (11,258 | ) |
Service Class | | (186 | ) | (127 | ) |
| | (10,776 | ) | (11,385 | ) |
From net realized gains: | | | | | |
Initial Class | | (6,513 | ) | (17,068 | ) |
Service Class | | (123 | ) | (210 | ) |
| | (6,636 | ) | (17,278 | ) |
Capital Share Transactions: | | | | | |
Proceeds from shares sold: | | | | | |
Initial Class | | 12,437 | | 15,807 | |
Service Class | | 2,569 | | 2,851 | |
| | 15,006 | | 18,658 | |
Dividends and distributions reinvested: | | | | | |
Initial Class | | 17,103 | | 28,326 | |
Service Class | | 310 | | 337 | |
| | 17,413 | | 28,663 | |
Cost of shares redeemed: | | | | | |
Initial Class | | (88,531 | ) | (100,749 | ) |
Service Class | | (2,105 | ) | (2,334 | ) |
| | (90,636 | ) | (103,083 | ) |
| | (58,217 | ) | (55,762 | ) |
Net increase (decrease) in net assets | | (46,944 | ) | (20,086 | ) |
| | | | | |
Net Assets: | | | | | |
Beginning of year | | 448,060 | | 468,146 | |
End of year | | $ | 401,116 | | $ | 448,060 | |
Undistributed (Accumulated) Net Investment Income (Loss) | | $ | 12,261 | | $ | 12,020 | |
Share Activity: | | | | | |
Shares issued: | | | | | |
Initial Class | | 875 | | 1,189 | |
Service Class | | 173 | | 208 | |
| | 1,048 | | 1,397 | |
Shares issued-reinvested from distributions: | | | | | |
Initial Class | | 1,244 | | 2,225 | |
Service Class | | 22 | | 26 | |
| | 1,266 | | 2,251 | |
Shares redeemed: | | | | | |
Initial Class | | (6,176 | ) | (7,567 | ) |
Service Class | | (143 | ) | (170 | ) |
| | (6,319 | ) | (7,737 | ) |
Net increase (decrease) in shares outstanding: | | | | | |
Initial Class | | (4,057 | ) | (4,153 | ) |
Service Class | | 52 | | 64 | |
| | (4,005 | ) | (4,089 | ) |
The notes to the financial statements are an integral part of this report.
8
Transamerica Value Balanced
FINANCIAL HIGHLIGHTS
For a share outstanding throughout each period(a)
| | Initial Class | |
| | Year Ended December 31, | |
| | 2007 | | 2006 | | 2005 | | 2004 | | 2003 | |
Net Asset Value | | | | | | | | | | | |
Beginning of period | | $ | 13.88 | | $ | 12.88 | | $ | 13.48 | | $ | 12.41 | | $ | 10.66 | |
Investment Operations | | | | | | | | | | | |
Net investment income (loss) | | 0.40 | | 0.36 | | 0.31 | | 0.36 | | 0.30 | |
Net realized and unrealized gain (loss) | | 0.51 | | 1.52 | | 0.51 | | 0.86 | | 1.81 | |
Total operations | | 0.91 | | 1.88 | | 0.82 | | 1.22 | | 2.11 | |
Distributions | | | | | | | | | | | |
From net investment income | | (0.37 | ) | (0.35 | ) | (0.36 | ) | (0.15 | ) | (0.36 | ) |
From net realized gains | | (0.23 | ) | (0.53 | ) | (1.06 | ) | — | | — | |
Total distributions | | (0.60 | ) | (0.88 | ) | (1.42 | ) | (0.15 | ) | (0.36 | ) |
Net Asset Value | | | | | | | | | | | |
End of period(b) | | $ | 14.19 | | $ | 13.88 | | $ | 12.88 | | $ | 13.48 | | $ | 12.41 | |
Total Return(c),(d) | | 6.72 | % | 15.27 | % | 6.59 | % | 9.96 | % | 20.16 | % |
Net Assets End of Period (000’s) | | $ | 393,632 | | $ | 441,492 | | $ | 462,906 | | $ | 525,519 | | $ | 249,184 | |
Ratio and Supplemental Data | | | | | | | | | | | |
Expenses to average net assets(e) | | 0.83 | % | 0.83 | % | 0.85 | % | 0.84 | % | 0.82 | % |
Net investment income (loss), to average net assets(e) | | 2.79 | % | 2.70 | % | 2.34 | % | 2.88 | % | 2.68 | % |
Portfolio turnover rate(d) | | 45 | % | 41 | % | 58 | % | 98 | % | 53 | % |
For a share outstanding throughout each period(a)
| | Service Class | |
| | Year Ended December 31, | | May 1 to Dec | |
| | 2007 | | 2006 | | 2005 | | 2004 | | 31, 2003 | |
Net Asset Value | | | | | | | | | | | |
Beginning of period | | $ | 14.31 | | $ | 13.25 | | $ | 13.86 | | $ | 12.74 | | $ | 11.08 | |
Investment Operations | | | | | | | | | | | |
Net investment income (loss) | | 0.37 | | 0.34 | | 0.28 | | 0.37 | | 0.18 | |
Net realized and unrealized gain (loss) | | 0.54 | | 1.57 | | 0.52 | | 0.87 | | 1.52 | |
Total operations | | 0.91 | | 1.91 | | 0.80 | | 1.24 | | 1.70 | |
Distributions | | | | | | | | | | | |
From net investment income | | (0.35 | ) | (0.32 | ) | (0.35 | ) | (0.12 | ) | (0.04 | ) |
From net realized gains | | (0.23 | ) | (0.53 | ) | (1.06 | ) | — | | — | |
Total distributions | | (0.58 | ) | (0.85 | ) | (1.41 | ) | (0.12 | ) | (0.04 | ) |
Net Asset Value | | | | | | | | | | | |
End of period(b) | | $ | 14.64 | | $ | 14.31 | | $ | 13.25 | | $ | 13.86 | | $ | 12.74 | |
Total Return(c),(d) | | 6.46 | % | 15.04 | % | 6.21 | % | 9.83 | % | 15 .40 | % |
Net Assets End of Period (000’s) | | $ | 7,484 | | $ | 6,568 | | $ | 5,240 | | $ | 3,711 | | $ | 462 | |
Ratio and Supplemental Data | | | | | | | | | | | |
Expenses to average net assets(e) | | 1.08 | % | 1.08 | % | 1.10 | % | 1.10 | % | 1.09 | % |
Net investment income (loss), to average net assets(e) | | 2.53 | % | 2.45 | % | 2.09 | % | 2.81 | % | 2 .26 | % |
Portfolio turnover rate(d) | | 45 | % | 41 | % | 58 | % | 98 | % | 53 | % |
(a) | Per share information is calculated based on average number of shares outstanding. |
(b) | Transamerica Value Balanced (the “Fund”) share class commenced operations as follows: |
| Initial Class - January 3, 1995 |
| Service Class - May 1, 2003 |
(c) | Total Return reflects all portfolio expenses and includes reinvestment of dividends and capital gains; it does not reflect the charges and deductions under the policies or annuity contracts. |
(d) | Not annualized |
(e) | Annualized |
The notes to the financial statements are an integral part of this report.
9
Transamerica Value Balanced
NOTES TO FINANCIAL STATEMENTS
At December 31, 2007
(all amounts in thousands)
NOTE 1. ORGANIZATION AND SIGNIFICANT ACCOUNTING POLICIES
AEGON/Transamerica Series Trust (“ATST”) is an open-end management investment company registered under the Investment Company Act of 1940, as amended (the “1940 Act”). ATST serves as a funding vehicle for variable life insurance, variable annuity and group annuity products. Transamerica Value Balanced (the “Fund”) is part of ATST.
In the normal course of business, the Fund enters into contracts that contain a variety of representations that provide general indemnifications. The Fund’s maximum exposure under these arrangements is unknown, as this would involve future claims that may be made against the Fund and/or its affiliates that have not yet occurred. However, based on experience, the Fund expects the risk of loss to be remote.
This report should be read in conjunction with the current Fund prospectus, which contains more complete information about the Fund.
In preparing the Fund’s financial statements in accordance with accounting principles generally accepted in the United States of America (“GAAP”), estimates or assumptions (which could differ from actual results) may be used that affect reported amounts and disclosures. The following is a summary of significant accounting policies followed by the Fund.
Multiple class operations, income and expenses: The Fund currently offers two classes of shares, an Initial Class and a Service Class. Income, non-class specific expenses and realized and unrealized gains and losses, are allocated daily to each class, based upon the value of shares outstanding method as permitted under Rule 18f-3 of the 1940 Act. Each class bears its own specific expenses as well as a portion of general, common expenses.
Security valuations: The Fund values its investments at the close of the New York Stock Exchange (“NYSE”), normally 4 p.m. ET, each day the NYSE is open for business. Fund investments are valued at the last sale price or closing price on the day of valuation taken from the primary exchange where the security is principally traded.
Securities traded in the over-the-counter market and listed securities for which no sale was reported on that date are valued at the last quoted bid price.
Debt securities are valued based on a price quotation or other equivalent indication of value supplied by an exchange, a pricing service or a major market maker; however, those that mature in sixty days or less are valued at amortized cost, which approximates market.
Investment company securities are valued at the net asset value of the underlying portfolio.
Securities for which quotations are not readily available are valued at fair market value as determined in good faith by the Fund’s Administrative Valuation Committee, under the supervision of the Board’s Valuation Committee, using guidelines adopted by the Board of Trustees.
Cash: The Fund may leave cash overnight in its cash account with the custodian, State Street Bank & Trust Company (“State Street”). On July 2, 2007, State Street acquired the parent company of Investors Bank & Trust Company. State Street has been contracted on behalf of the Fund to invest the excess cash into a savings account, which at December 31, 2007 was paying an interest rate of 2.60%.
Commission recapture: The sub-adviser, to the extent consistent with the best execution and usual commission rate policies and practices, may place security transactions of the Fund with broker/dealers with which ATST has established a Commission Recapture Program. A Commission Recapture Program is any arrangement under which a broker/dealer applies a portion of the commissions received by such broker/dealer on the security transactions to the Fund. In no event will commissions paid by the Fund be used to pay expenses that would otherwise be borne by any other funds within ATST, or by any other party.
Recaptured commissions during the year ended December 31, 2007 of $6 are included in net realized gains in the Statement of Operations.
Real Estate Investment Trusts (“REITs”): There are certain additional risks involved in investing in REITs. These include, but are not limited to, economic conditions, changes in zoning laws, real estate values, property taxes and interest rates. Dividend income is recorded at management’s estimate of the income included in distributions from the REIT investments. Distributions received in excess of the estimated amount are recorded as a reduction of the cost of investments. The actual amounts of income, return of capital and capital gains are only determined by each REIT after the fiscal year end and may differ from the estimated amounts.
Security transactions and investment income: Security transactions are recorded on the trade date. Security gains and losses are calculated on the first-in, first-out basis. Dividend income, if any, is recorded on the ex-dividend date or, in the case of foreign securities, as soon as the Fund is informed of the ex-dividend date. Interest income, including accretion of discounts and amortization of premiums, is recorded on the accrual basis commencing on the settlement date.
Option contracts: The Fund may enter into options contracts to manage exposure to market fluctuations. Options are valued at the average of the bid and ask (“Mean Quote”) established each day at the close of the board of trade or exchange on which they are traded. The primary risks associated with options are imperfect correlation between the change in value of the securities held and the prices of the options contracts; the possibility of an illiquid market; and inability of the counterparty to meet the contracts terms. When the Fund writes a covered call or put option, an amount equal to the premium received by the Fund is included in the Fund’s Statement of Assets and Liabilities as an asset and as an equivalent liability. Options are marked-to-market daily to reflect the current value of the option written. The underlying face amounts of open contracts at December 31, 2007 are listed in the Schedule of Investments.
10
NOTES TO FINANCIAL STATEMENTS (continued)
At December 31, 2007
(all amounts in thousands)
NOTE 1.– (continued)
Transactions in written call and put options were as follows:
| | Premium | | Contracts * | |
Balance at December 31, 2006 | | $ | 4,266 | | 39,491 | |
Sales | | 3,966 | | 31,900 | |
Closing Buys | | (3,078 | ) | (23,250 | ) |
Expirations | | (4,049 | ) | (39,139 | ) |
Exercised | | (1,105 | ) | (9,002 | ) |
Balance at December 31, 2007 | | $ | 0 | | 0 | |
*Contracts not in thousands
Dividend distributions: Dividends and capital gains distributions are typically declared and reinvested annually and are generally paid and reinvested on the business day following the ex-date.
NOTE 2. RELATED PARTY TRANSACTIONS
ATST serves as a funding vehicle for certain affiliated asset allocation portfolios and certain affiliated separate accounts of Western Reserve Life Assurance Co. of Ohio, Transamerica Life Insurance Company, Transamerica Financial Life Insurance Company, Inc., Monumental Life Insurance Company and Transamerica Occidental Life Insurance Company.
Transamerica Fund Advisors, Inc. (“TFAI”) is the Fund’s investment adviser. Transamerica Fund Services, Inc. (“TFS”) is the Fund’s administrator and transfer agent. Prior to May 1, 2007, AFSG Securities Corp. (“AFSG”), was the Fund’s distributor. Transamerica Capital Inc. (“TCI”) is now the Fund’s distributor. TFAI, TFS, AFSG, and TCI are affiliates of AEGON NV, a Netherlands corporation.
Certain officers and trustees of the Fund are also officers and/or directors of TFAI, TFS and TCI.
Transamerica Investment Management, LLC (“TIM”) is both an affiliate of the Fund and a sub-adviser to the Fund.
Investment advisory fee: The Fund pays management fees to TFAI based on average daily net assets (“ANA”) at the following breakpoints:
0.75% of the first $500 million of ANA
0.65% of the next $500 million of ANA
0.60% of ANA over $1 billion
TFAI has contractually agreed to waive its advisory fee and will reimburse the Fund to the extent that operating expenses, excluding 12b-1 fees, exceed the following stated annual limit:
1.00% Expense Limit
If total Fund expenses fall below the annual expense limitation agreement agreed to by the adviser within the succeeding three years, the Fund may be required to pay the adviser a portion or all of the waived advisory fees.
There were no amounts recaptured during the year ended December 31, 2007. There are no amounts available for recapture at December 31, 2007.
Distribution and service fees: ATST entered into a Distribution Agreement with AFSG dated January 1, 1997, as amended. On May 1, 2007, the Distribution Agreement was amended to replace AFSG with TCI as the Fund’s distributor. The Fund has also adopted a distribution plan (“Distribution Plan”) pursuant to Rule 12b-1 under the 1940 Act.
Under the Distribution Plan for the Initial Class shares, TCI, on behalf of the Fund, is authorized to pay various service providers, as direct payment for expenses incurred in connection with distribution of the Fund’s shares, amounts equal to actual expenses associated with distributing the shares.
The Distribution Plan for the Service Class shares requires ATST to pay distribution fees to TCI as compensation for its activities, not as reimbursement for specific expenses. The fee on the Service Class is paid to the insurance companies for providing services and account maintenance for their policyholders who invest in the variable insurance products which invest in the Service Class shares.
The Fund is authorized under the Distribution Plan to pay fees on each class up to the following limits:
Initial Class | | 0.15 | % |
Service Class | | 0.25 | % |
TCI has determined that it will not seek payment by the Fund of the distribution expenses incurred with respect to the Initial Class shares before April 30, 2009. Prior to TCI seeking reimbursement of future expenses, policy and contract owners will be notified in advance. The Fund will pay fees relating to Service Class shares.
Administrative services: The Fund has entered into an agreement with TFS for financial and legal fund administration services. The Fund pays TFS an annual fee of 0.02% of ANA. The Legal fees on the Statement of Operations are for fees paid to external legal counsel.
Deferred compensation plan: Each eligible independent Fund Trustee may elect participation in a non-qualified deferred compensation plan (“the Plan”). Under the Plan, such Trustees may defer payment of all or a portion of their total fees earned as a Fund Trustee. Each Trustee who is a participant in the Plan may elect that the earnings, losses or gains credited to his or her deferred fee amounts be determined based on a deemed investment in any series of Transamerica IDEX Mutual Funds. The right of a participant to receive a distribution from the Plan of the deferred fees is an unsecured claim against the general assets of all series of Transamerica IDEX Mutual Funds. The pro rata liability to the Fund of all deferred fees in the Plan amounted, as of December 31, 2007, to $19. Amounts deferred under the Plan are unfunded against the general assets of ATST.
11
NOTES TO FINANCIAL STATEMENTS (continued)
At December 31, 2007
(all amounts in thousands)
NOTE 2.– (continued)
Retirement plan: Under a retirement plan (the “Emeritus Plan”) available to the Independent Trustees, each Independent Trustee is deemed to have elected to serve as Trustee Emeritus of ATST upon his or her termination of service, other than removal for cause, is entitled to 50% of the trustee’s current retainer for a maximum period of five years determined by his or her years of service as a Trustee.
Such amounts shall be accrued by ATST on a pro rata basis allocable to each series of ATST fund based on the relative assets of the series. If retainers increase in the future, past accruals (and credits) will be adjusted upward so that 50% of the Trustee’s current retainer is accrued and credited at all times. Upon death, disability or termination of service, other than removal for cause, amounts deferred become payable to a Trustee Emeritus (or his/her beneficiary). Upon the commencement of service as Trustee Emeritus, compensation will be paid on a quarterly basis during the time period that the Trustee Emeritus is allowed to serve as such.
Amounts accrued under the Emeritus Plan are unsecured claims against the general assets of ATST. For the year ended December 31, 2007, the amount related to the Emeritus Plan was $19. As of December 31, 2007, the Fund has not made any payments related to the Emeritus Plan.
The Emeritus Plan was terminated effective October 30, 2007. Upon the termination, the Fund shall continue to pay any remaining benefits in accordance with the Plan, but no further compensation shall accrue under the Plan.
NOTE 3. INVESTMENT TRANSACTIONS
The cost of securities purchased and proceeds from securities sold (excluding short-term securities) for the year ended December 31, 2007 were as follows:
Purchases of securities: | | | |
Long-term | | $ | 122,020 | |
U.S. Government | | 69,710 | |
Proceeds from maturities and sales of securities: | | | |
Long-term | | 188,004 | |
U.S. Government | | 56,501 | |
| | | | |
NOTE 4. FEDERAL INCOME TAX MATTERS
The Fund has not made any provision for federal income or excise taxes due to its policy to distribute all of its taxable income and capital gains to its shareholders and otherwise qualify as a regulated investment company under Subchapter M of the Internal Revenue Code. Income and capital gain distributions are determined in accordance with income tax regulations, which may differ from GAAP. These differences are primarily due to differing treatment for items including, but not limited to, wash sales, investment in partnership, REITs and capital loss carryforwards.
Therefore, distributions determined in accordance with tax regulations may differ significantly in amount or character from net investment income and realized gains for financial reporting purposes. Financial reporting records are adjusted for permanent book/tax differences to reflect tax character. Financial records are not adjusted for temporary differences. These reclassifications are as follows:
Additional paid-in capital | | $ | — | |
Undistributed (accumulated) net investment income (loss) | | $ | (1 ,000 | ) |
Undistributed (accumulated) net realized gain (loss) from investment securities | | $ | 1,000 | |
The capital loss carryforward utilized during the December 31, 2007 was $2,049.
The tax character of distributions paid may differ from the character of distributions shown in the Statements of Changes in Net Assets due to short-term gains being treated as ordinary income for tax purposes. The tax character of distributions paid during 2006 and 2007 was as follows:
2006 Distributions paid from: | | | |
Ordinary Income | | $ | 11,385 | |
Long-term Capital Gain | | 17,278 | |
| | | |
2007 Distributions paid from: | | | |
Ordinary Income | | 12,884 | |
Long-term Capital Gain | | 4,528 | |
| | | | |
The tax basis components of distributable earnings as of December 31, 2007 are as follows:
Undistributed Ordinary Income | | $ | 14,111 | |
Undistributed Long-term Capital Gain | | $ | 26,836 | |
Capital Loss Carryforward | | $ | — | |
Post October Capital Loss Deferral | | $ | (740 | ) |
Post October Currency Loss Deferral | | $ | — | |
Net Unrealized Appreciation (Depreciation) | | $ | 71,820 | |
12
NOTES TO FINANCIAL STATEMENTS (continued)
At December 31, 2007
(all amounts in thousands)
NOTE 5. REGULATORY PROCEEDINGS
There continues to be significant federal and state regulatory activity relating to financial services companies, particularly mutual fund companies and their investment advisers. As part of an ongoing investigation regarding potential market timing, recordkeeping and trading compliance issues and matters affecting the Fund’s investment adviser, TFAI, and certain affiliates and former employees of TFAI, the SEC staff has indicated that it is likely to take some action against TFAI and certain of its affiliates at the conclusion of the investigation. The potential timing and the scope of any such action is difficult to predict. Although the impact of any action brought against TFAI and/or its affiliates is difficult to assess at the present time, the Fund currently believes that the likelihood that any such action will have a material adverse impact on it is remote. It is important to note that the Fund is not aware of any allegation of wrong doing against it and its Board at the time this annual report is printed. Although it is not anticipated that these developments will have an adverse impact on the Fund, there can be no assurance at this time. TFAI and its affiliates are actively working with the SEC in regard to this matter; however, the exact resolution cannot be determined at this time. TFAI will take such actions that it deems necessary or appropriate to continue providing management services to the Fund and to bring all matters to an appropriate conclusion.
TFAI and/or its affiliates, and not the Fund, will bear the costs regarding these regulatory matters.
NOTE 6. RECENTLY ISSUED ACCOUNTING PRONOUNCEMENTS
In July 2006, the Financial Accounting Standards Board (“FASB”) released FASB Interpretation No. 48 “Accounting for Uncertainty in Income Taxes” (“FIN 48”), an interpretation of FASB Statement No. 109. FIN 48 provides guidance for how uncertain tax positions should be recognized, measured, presented and disclosed in the financial statements. FIN 48 requires the accounting and disclosure of tax positions taken or expected to be taken in the course of preparing the Fund’s tax returns to determine whether the tax positions are “more-likely- than-not” of being sustained by the applicable tax authority. Tax positions not deemed to meet the more-likely-than-not threshold would be recorded as a tax benefit or expense in the current year.
Adoption of FIN 48 is effective during the first required financial reporting period for fiscal years beginning after December 15, 2006. Management adopted FIN 48 on June 29, 2007.
Implementation of FIN 48 requires Management of the Fund to analyze all open tax years, as defined by the Statute of Limitations, for all major jurisdictions, which includes federal and certain states. Open tax years are those that are open for exam by taxing authorities (i.e., the last 4 tax year ends and the interim tax period since then). The Fund has no examinations in progress and none are expected at this time.
Management of the Fund has reviewed all open tax years and major jurisdictions and concluded the adoption of FIN 48 resulted in no impact to the Fund’s net assets or results of operations. There is no tax liability resulting from unrecognized tax benefits relating to uncertain income tax positions taken or expected to be taken in future tax returns. The Fund is also not aware of any tax positions for which it is reasonably possible that the total amounts of unrecognized tax benefits will significantly change in the next 12 months.
In September 2006, FASB issued its new Standard No. 157, “Fair Value Measurements” (“FAS 157”). FAS 157 is designed to unify guidance for the measurement of fair value of all types of assets, including financial instruments, and certain liabilities, throughout a number of accounting standards. FAS 157 also establishes a hierarchy for measuring fair value in generally accepted accounting principles and expands financial statement disclosures about fair value measurements that are relevant to mutual funds. FAS 157 is effective for financial statements issued for fiscal years beginning after November 15, 2007, and earlier application is permitted.
As of December 31, 2007, Management does not expect the adoption of FAS 157 to impact the amounts reported in the financial statements, however, additional disclosures will be required about the inputs used to develop the measurements of fair value and the effect of certain of the measurements reported in the statement of operations for a fiscal period.
NOTE 7. SUBSEQUENT EVENT
Effective January 1, 2008, TFAI changed its name to Transamerica Asset Management, Inc.
Effective May 1, 2008, AEGON/Transamerica Series Trust will change its name to Transamerica Series Trust. At that time, the Fund will also change its name to Transamerica Value Balanced VP.
13
Report of Independent Registered Certified Public Accounting Firm
To the Board of Trustees and Shareholders of
Transamerica Value Balanced:
In our opinion, the accompanying statement of assets and liabilities, including the schedule of investments, and the related statements of operations and of changes in net assets and the financial highlights present fairly, in all material respects, the financial position of Transamerica Value Balanced (the “Fund”) (one of the portfolios constituting AEGON/Transamerica Series Trust) at December 31, 2007, the results of its operations for the year then ended, the changes in its net assets for each of the two years in the period then ended and the financial highlights for each of the periods presented, in conformity with accounting principles generally accepted in the United States of America. These financial statements and financial highlights (hereafter referred to as “financial statements”) are the responsibility of the Fund’s management; our responsibility is to express an opinion on these financial statements based on our audits. We conducted our audits of these financial statements in accordance with the standards of the Public Company Accounting Oversight Board (United States). Those standards require that we plan and perform the audit to obtain reasonable assurance about whether the financial statements are free of material misstatement. An audit includes examining, on a test basis, evidence supporting the amounts and disclosures in the financial statements, assessing the accounting principles used and significant estimates made by management, and evaluating the overall financial statement presentation. We believe that our audits, which included confirmation of securities at December 31, 2007 by correspondence with the custodian and brokers, provide a reasonable basis for our opinion.

Tampa, Florida
February 29, 2008
14
Transamerica Value Balanced
SUPPLEMENT TAX INFORMATION (unaudited)
(all amounts in thousands)
For tax purposes, the Fund has made a Long-Term Capital Gain Designation of $4,528 for the year ended December 31, 2007.
RESULTS OF SHAREHOLDER PROXY (unaudited)
At a special meeting of shareholders held on October 30, 2007, the results of the Proposals were as follows:
Proposal 1: To elect a new Board:
Proposed
Trustee | | For | | Against | | Abstentions/Broker Non-
Votes | |
John K. Carter | | 2,274,998,840.817 | | 57,804,698.755 | | 35,433.883 | |
| | | | | | | |
Leo J. Hill | | 2,277,212,702.754 | | 55,590,836.819 | | 35,433.883 | |
| | | | | | | |
Neal M. Jewell | | 2,266,793,295.663 | | 66,010,243.909 | | 35,433.883 | |
| | | | | | | |
Russell A. Kimball, Jr. | | 2,274,825,235.835 | | 57,978,303.737 | | 35,433.883 | |
| | | | | | | |
Eugene M. Mannella | | 2,274,623,165.033 | | 58,180,374.539 | | 35,433.883 | |
| | | | | | | |
Norm R. Nielsen | | 2,275,050,055.885 | | 57,753,483.687 | | 35,433.883 | |
| | | | | | | |
Joyce Galpern Norden | | 2,270,278,122.250 | | 62,525,417.323 | | 35,433.883 | |
| | | | | | | |
Patricia L. Sawyer | | 2,275,737,737.456 | | 57,065,802.116 | | 35,433.883 | |
| | | | | | | |
John W. Waechter | | 2,276,615,120.140 | | 56,188,419.433 | | 35,433.883 | |
Proposal 2: To approve an amendment to the Agreement and Declaration of Trust:
| | | | Abstentions/Broker Non- | |
For | | Against | | Votes | |
2,182,022,669.110 | | 77,590,048.544 | | 73,226,255.801 | |
15
Transamerica Value Balanced
INVESTMENT ADVISORY AND SUB-ADVISORY AGREEMENTS-REVIEW AND RENEWAL (unaudited)
At a meeting of the Board of Trustees of AEGON/Transamerica Series Trust (“ATST”) held on December 4th, 2007, the Board reviewed and considered the renewal of the investment advisory agreement (the “Investment Advisory Agreement”) between Transamerica Value Balanced (the “Fund”) and Transamerica Fund Advisors, Inc. (“TFAI”), as well as the renewal of the investment sub-advisory agreement (the “Sub-Advisory Agreement”) of the Fund between TFAI and Transamerica Investment Management, LLC (the “Sub-Adviser”), to determine whether the agreements should be renewed for a six-month period. It was noted that this review was interim in nature to align all the Funds on the same calendar, and that the Funds’ advisory arrangements would be reviewed again in the first half of 2008.
Following their review and consideration, the Trustees determined that the renewal of the Investment Advisory Agreement and the Sub-Advisory Agreement would enable shareholders of the Fund to obtain high quality services at a cost that is appropriate, fair, and in the best interests of its shareholders. The Board, including the independent members of the Board, unanimously approved the renewal of the Investment Advisory Agreement and Sub-Advisory Agreement. In reaching their decision, the Trustees requested and obtained from TFAI and the Sub-Adviser such information as they deemed reasonably necessary to evaluate the agreements, including information about fees and performance of comparable funds managed by the Sub-Adviser. The Trustees also carefully considered information they had previously received from TFAI and the Sub-Adviser throughout the year as part of their regular oversight of the Fund, as well as comparative fee, expense, and performance information prepared by Lipper Inc. (“Lipper”), an independent provider of mutual fund performance, fee and expense information and profitability data prepared by management. In considering the proposed continuation of the Investment Advisory and Sub-Advisory Agreements, the Trustees evaluated a number of considerations that they believed, in light of the legal advice furnished to them by independent legal counsel and their own business judgment, to be relevant. They based their decisions on a variety of factors, including the following considerations, among others, although they did not identify any consideration or particular information that was controlling of their decisions:
The nature, extent and quality of the advisory services to be provided. The Board considered the nature and quality of the services provided by TFAI and the Sub-Adviser to the Fund in the past, as well as the services anticipated to be provided in the future. The Board concluded that TFAI and the Sub-Adviser are capable of providing high quality services to the Fund, as indicated by the nature and quality of services provided in the past by TFAI and the Sub-Adviser for this series and the experience, capability and integrity of TFAI’s senior management, the financial resources of TFAI and the Sub-Adviser, TFAI’s management oversight process and the professional qualifications of the portfolio management team of the Sub-Adviser. The Trustees determined that TFAI and the Sub-Adviser can provide investment and related services that are appropriate in scope and extent in light of the Fund’s operations, the competitive landscape of the investment company business and investor needs.
The investment performance of the Fund. The Board examined the short and longer-term performance of the Fund, including relative performance against a peer universe of comparable mutual funds as prepared by Lipper for various trailing periods ended June 30, 2007. The Board noted that the Fund’s performance was good compared to its peer universe for the past 1-, 3- and 5-year periods. On the basis of the Board’s assessment of the nature, extent and quality of advisory services to be provided or procured by TFAI and the Sub-Adviser, the Board concluded that TFAI and the Sub-Adviser are capable of providing a level of investment performance that is appropriate in light of the Fund’s proposed investment objectives, policies and strategies and competitive with other investment companies.
The cost of advisory services provided and the level of profitability. The Board reviewed profitability information of TFAI’s cost of procuring fund management services, as well as the costs of its provision of administration, fund accounting and other services, to the Fund and to ATST as a whole by TFAI and its affiliates. The Board reviewed the management and sub-advisory fees for the Fund, and noted that the contractual management fees were still above average for the Fund’s peer group and universe, but by a relatively small margin. The Board noted that the Fund’s total expenses were above the median of the peer group, but below the median of the peer universe. Based on their review, the Trustees determined that the management fees of the Fund generally are appropriate in light of the services expected to be provided or procured, the management fees and the anticipated profitability of the relationship between the Fund, TFAI and its affiliates, and the Sub-Adviser. In making these observations and determinations, the Board reviewed, among other things, comparative information provided by Lipper.
Whether fee levels reflect economies of scale and the extent to which economies of scale would be realized as the Fund grows. In evaluating the extent to which the management fees payable under the Investment Advisory and Sub-Advisory Agreements reflect economies of scale or will permit economies of scale to be realized in the future, the Board noted that TFAI and the Sub-Adviser offer breakpoints which appropriately benefit investors by passing on economies of scale in the form of lower management fees as the level of assets grows. The Trustees also concluded that they will have the opportunity to periodically reexamine whether the Fund has achieved economies of scale, and the appropriateness of management fees payable to TFAI and fees paid to the Sub-Adviser, in the future.
Benefits (such as soft dollars) to TFAI, its affiliates, or the Sub-Adviser from their relationship with the Fund. The Board concluded that other benefits anticipated to be derived by TFAI, its affiliates, and the Sub-Adviser from their relationships with the Fund are expected to be reasonable and fair, and consistent with industry practice and the best interests of the Fund and its shareholders. The Trustees noted that TFAI would not realize soft dollar benefits from its relationship with the Fund, and that the Sub-Adviser’s soft dollar trading is consistent with applicable law, including best execution requirements in particular. The Board also noted that the Sub-Adviser is participating in a brokerage program pursuant to which a portion of brokerage commissions paid by the Fund is recaptured for the benefit of the Fund and its shareholders, thus limiting the amount of soft dollar arrangements the Sub-Adviser may engage in with respect to the Fund’s brokerage transactions.
16
Other considerations. The Board determined that TFAI has made a substantial commitment to the recruitment and retention of high quality personnel, and maintains the financial, compliance and operational resources reasonably necessary to manage the Fund in a professional manner that is consistent with the best interests of the Fund and its shareholders. In this regard, the Trustees favorably considered the procedures and policies in place by TFAI to enforce compliance with applicable laws and regulations and oversee the portfolio management activities of the Sub-Adviser. The Trustees also determined that TFAI has made a significant entrepreneurial commitment to the management and success of the Fund, reflected by TFAI’s expense limitation and fee waiver arrangements with the Fund which may result in TFAI waiving a substantial amount of management fees for the benefit of shareholders.
17
Van Kampen Active International Allocation
MARKET ENVIRONMENT
For the twelve-month period ended December 31, 2007, international markets as measured by the Morgan Stanley Capital International EAFE Index (“MSCI-EAFE”) returned 11.63% in U.S. dollar terms. Among developed markets, Asia ex-Japan led the group, followed by Europe ex-United Kingdom (“UK”). Japan was the only major market with a negative return during the period, and the U.S. market had a modestly positive gain. The emerging markets again outperformed the developed regions. The major local currencies all gained against the U.S. dollar.
The U.S. economy continued to slow during the period. Consensus estimates for fourth quarter U.S. gross domestic product (“GDP”) continued to be revised lower, with broad-based weakening across the U.S. economy and the housing sector especially fragile.
European economic growth (excluding the UK) generally deteriorated as the year progressed, but ticked upward at year end. Inflationary pressures mounted due to energy and food price increases, and given these strong inflation readings, the European Central Bank (“ECB”) remained hawkish going into the new year. The UK economy also slowed during the quarter. The UK housing sector has been an issue – not due to overinvestment, but rather because of sharp price rises from greater demand than supply.
The Japanese economy was weak overall during the year. Housing starts have recovered from their lows and construction expectations are moving up. While real income growth is flat to down (i.e. still lousy), Japan’s unemployment rate fell again and headline inflation rose. We believe this should be a positive for Japan, but caution is warranted as core inflation is still negative. Japanese equities were the worst performing major market in the year, although the yen has rebounded from its lows. We believe relative equity valuations have been getting more and more compelling here.
Global equities faced increasing headwinds in the fourth quarter of 2007, which continued to buffet markets in early 2008. The U.S. sub-prime mortgage crisis clearly spread to other areas of the financial markets and mind-boggling write-offs were announced by many firms. The authorities have responded, but with less than conviction than the markets crave – and credit spreads have remained wide. While seemingly pedantic, the distinction between whether the U.S. is in (or entering) a recession or a mid-cycle slowdown is an important one. In general, a recession would mean rising unemployment, sharp earnings drops and a negative global stock market bias. A mid-cycle slowdown, on the other hand, would generally bring sideways employment, mildly negative to flat earnings, followed by economic resurgence and global equities moving decisively up, out of their multi-month trading range. While we remain in the mid-cycle slowdown camp, we are admittedly worried by poor recent stock market action, continued financial distress, falling earnings and poor economic numbers. Positive offsets to this are good corporate and consumer balance sheets/wealth, still decent disposable income growth, and very low real bond yields combined with (hopefully more) prospective rate cuts.
PERFORMANCE
For the year ended December 31, 2007, Van Kampen Active International Allocation, Initial Class returned 15.60%. By comparison its benchmark, the MSCI-EAFE, returned 11.63%.
STRATEGY REVIEW
Portfolio returns were aided by the allocation to Germany, Hong Kong, Singapore and the emerging markets. However, underexposure to consumer staples in the developed markets and the UK detracted from performance, as did the above Index allocation to Japan earlier in the year. The portfolio was underweight financials throughout the year.
At year end, we have positioned the portfolio more defensively – which we have been doing for the past couple quarters. We trimmed emerging market and cyclical positions, added to defensive sectors and raised cash to about 5% of the portfolio. With the exception of global financial and retailing sectors, we do not think a significant slowdown has been priced into global equities. We remain watchful.
Ann D. Thivierge
Portfolio Manager
Morgan Stanley Investment Management Inc.
AEGON/Transamerica Series Trust | Annual Report 2007 |
1
Van Kampen Active International Allocation
(unaudited)
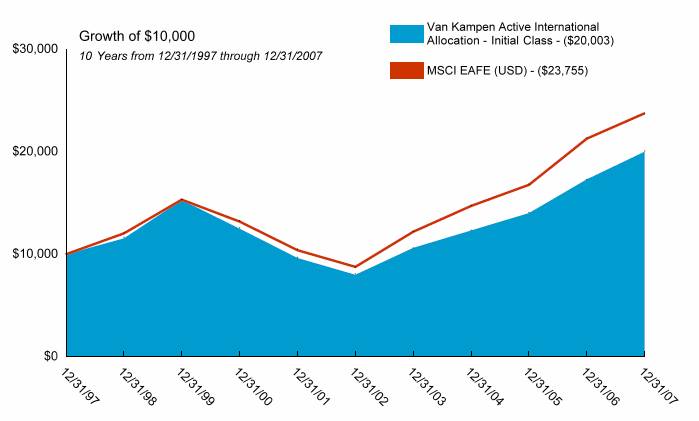
Average Annual Total Return for Periods Ended 12/31/2007
| | | | | | | | From | | Inception | |
| | 1 Year | | 5 Years | | 10 Years | | Inception | | Date | |
Initial Class | | 15.60 | % | 20.15 | % | 7.18 | % | 6.70 | % | 4/8/91 | |
MSCI EAFE (USD)(1) | | 11.63 | % | 22.08 | % | 9.04 | % | 8.31 | % | 4/8/91 | |
| | | | | | | | | | | |
Service Class | | 15.27 | % | — | % | — | % | 21 .56 | % | 5/1/03 | |
NOTES
(1) The Morgan Stanley Capital International-Europe, Australasia, and Far East (MSCI-EAFE) Index is a widely recognized unmanaged index used as a general measure of market performance. Calculations assume dividends and capital gains are reinvested and do not include any managerial expenses. From inception calculation is based on life of Initial Class shares.
The performance data presented represents past performance, future results may vary. The portfolio’s investment return and net asset value will fluctuate. Past performance does not guarantee future results. Investor’s units when redeemed, may be worth more or less than their original cost.
Current performance may be lower or higher than performance quoted. Please visit your insurance company’s website for contract or policy level standardized total returns current to the most recent month end. Portfolio performance is net of investment fees and fund expenses, but not product charges, which, if included, would significantly lower the performance quoted.
This material must be preceded or accompanied by a current prospectus, which includes specific contents regarding the investment objectives, explanation of share classes and policies of this portfolio.
International investing involves special risks including fluctuations, political instability and different financial accounting standards.
2
Van Kampen Active International Allocation
UNDERSTANDING YOUR FUND’S EXPENSES
(unaudited)
SHAREHOLDER EXPENSES
Fund shareholders may incur ongoing costs, including management and advisory fees, distribution and service fees, and other fund expenses.
The following Example is intended to help you understand your ongoing costs (in dollars and cents) of investing in the Fund and to compare these costs with the ongoing costs of investing in other funds.
The Example is based on an investment of $1,000 invested at July 1, 2007 and held for the entire period until December 31, 2007.
ACTUAL EXPENSES
The first line in the table below provides information about actual account values and actual expenses. You may use the information in this line, together with the amount you invested, to estimate the expenses that you paid over the period. Simply divide your account value by $1,000 (for example, an $8,600 account value divided by $1,000 = 8.6), then multiply the result by the number in the first line of your Fund under the heading entitled “Expenses Paid During Period” to estimate the expenses you paid on your account during this period. If your account is an IRA, your expenses could have included a $15 annual fee. The amount of any fee paid through your account would increase the estimate of expenses you paid during the period and decrease your ending account value.
HYPOTHETICAL EXAMPLE FOR COMPARISON PURPOSES
The second line in the table below provides information about hypothetical account values and hypothetical expenses based on the Fund’s actual expense ratio and an assumed rate of return of 5% per year before expenses, which is not the Fund’s actual return. The hypothetical account values and expenses may not be used to estimate the actual ending account balance or expenses you paid for the period. You may use this information to compare the ongoing costs of investing in your Fund and other funds. To do so, compare this 5% hypothetical example with the 5% hypothetical examples that appear in the shareholder reports of the other funds.
Please note that the expenses shown in the table are meant to highlight your ongoing costs only and do not reflect any transactional costs, such as sales charges, redemption fees, brokerage commissions paid on purchases and sales of fund shares. Therefore, the second line under the Fund in the table is useful in comparing ongoing costs only, and will not help you determine the relative total costs of owning different funds. If any of these transaction costs were included, your costs would be higher. The expenses shown in the table do not reflect any fees that may be charged to you by brokers, financial intermediaries or other financial institutions.
| | Beginning
Account
Value | | Ending
Account
Value | | Annualized
Expense
Ratio | | Expenses
Paid During
Period (a) | |
Initial Class | | | | | | | | | |
Actual | | $ | 1,000.00 | | $ | 1,024.68 | | 1.07 | % | $ | 5.46 | |
Hypothetical (b) | | 1,000.00 | | 1,019.81 | | 1.07 | | 5.45 | |
| | | | | | | | | |
Service Class | | | | | | | | | |
Actual | | 1,000.00 | | 1,023.47 | | 1.32 | | 6.73 | |
Hypothetical (b) | | 1,000.00 | | 1,018.55 | | 1.32 | | 6.72 | |
| | | | | | | | | | | | |
(a) | | Expenses are calculated using the Fund’s annualized expense ratio (as disclosed in the table), multiplied by the average account value for the period, multiplied by the number of days in the period (184 days), and divided by the number of days in the year (365 days). |
| | |
(b) | | 5% return per year before expenses. |
GRAPHICAL PRESENTATION OF SCHEDULE OF INVESTMENTS
By Region
At December 31, 2007
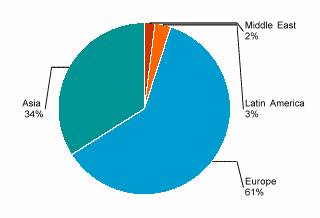
This chart shows the percentage breakdown by region of the Fund’s total investment securities.
3
Van Kampen Active International Allocation
SCHEDULE OF INVESTMENTS
At December 31, 2007
(all amounts except share amounts in thousands)
| | Shares | | Value | |
CONVERTIBLE PREFERRED STOCKS (0.3%) | | | | | |
Australia (0.0%) | | | | | |
Bbi Eps, Ltd. , Convertible * | | 230 | | $ | q | |
Brazil (0.1%) | | | | | |
All America Latina Logistica SA | | 20,300 | | 263 | |
Turkey (0.2%) | | | | | |
Turkiye Garanti Bankasi As | | 61,771 | | 553 | |
Total Convertible Preferred Stocks (cost $744) | | | | 816 | |
| | | | | |
PREFERRED STOCKS (1.6%) | | | | | |
Brazil (1.3%) | | | | | |
Aracruz Celulose SA Class B | | 3,914 | | 28 | |
Banco Bradesco SA | | 8,112 | | 260 | |
Banco Itau Holding Financeira SA | | 11,372 | | 291 | |
Brasil Telecom Participacoes SA | | 2,362 | | 35 | |
Centrais Eletricas Brasileiras SA Class B, ‡ | | 2,256 | | 29 | |
Cia de Bebidas das Americas | | 3,179 | | 230 | |
Cia Energetica de Minas Gerais | | 2,951 | | 54 | |
Cia Vale do Rio Doce | | 25,506 | | 727 | |
Contax Participacoes SA | | 235 | | 7 | |
Embratel Participacoes SA (1) | | 4,412,694 | | 17 | |
Gerdau SA | | 3,587 | | 105 | |
Klabin SA | | 7,833 | | 29 | |
Petroleo Brasileiro SA | | 22,960 | | 1,140 | |
Sadia SA | | 42,003 | | 239 | |
Usinas Siderurgicas de Minas Gerais SA Class A | | 2,348 | | 107 | |
Vivo Participacoes SA | | 7,084 | | 37 | |
Votorantim Celulose e Papel SA | | 372 | | 11 | |
Germany (0.3%) | | | | | |
Henkel KGAA | | 3,104 | | 175 | |
Porsche AG | | 215 | | 434 | |
RWE AG | | 604 | | 73 | |
Volkswagen AG | | 1,584 | | 233 | |
Korea, Republic of (0.0%) | | | | | |
Samsung Electronics | | 62 | | 28 | |
Total Preferred Stocks (cost $2,220) | | | | 4,289 | |
| | | | | |
COMMON STOCKS (87.5%) | | | | | |
Australia (4.5%) | | | | | |
AGL Energy, Ltd. | | 5,245 | | 61 | |
Alumina, Ltd. | | 29,755 | | 167 | |
Amcor, Ltd. | | 23,105 | | 140 | |
AMP, Ltd. | | 15,002 | | 131 | |
Ansell, Ltd. | | 1,835 | | 20 | |
Apa Group | | 911 | | 3 | |
Asciano Group | | 2,862 | | 18 | |
Australia & New Zealand Banking Group, Ltd. | | 16,751 | | 404 | |
BHP Billiton, Ltd. | | 73,235 | | 2,581 | |
BlueScope Steel, Ltd. | | 20,404 | | 173 | |
Boral, Ltd. | | 15,307 | | 82 | |
Brambles, Ltd. | | 11,167 | | 113 | |
Caltex Australia, Ltd. | | 10,136 | | 172 | |
Coca-Cola Amatil, Ltd. | | 6,040 | | 50 | |
Commonwealth Bank of Australia | | 13,478 | | 699 | |
CSL, Ltd. | | 2,424 | | 77 | |
CSR, Ltd. | | 25,337 | | $ | 69 | |
Fairfax Media, Ltd. | | 11,649 | | 48 | |
Foster’s Group, Ltd. | | 23,028 | | 133 | |
Insurance Australia Group, Ltd. | | 19,171 | | 69 | |
Leighton Holdings, Ltd. ^ | | 2,026 | | 109 | |
Lend Lease Corp., Ltd. | | 5,605 | | 85 | |
Macquarie Group, Ltd. | | 2,358 | | 158 | |
Macquarie Infrastructure Group | | 26,280 | | 70 | |
National Australia Bank, Ltd. | | 18,067 | | 600 | |
Newcrest Mining, Ltd. | | 8,522 | | 248 | |
OneSteel, Ltd. | | 14,572 | | 79 | |
Orica, Ltd. | | 7,489 | | 209 | |
Origin Energy, Ltd. | | 72,622 | | 564 | |
PaperlinX, Ltd. | | 11,828 | | 28 | |
QBE Insurance Group, Ltd. | | 7,831 | | 229 | |
Rio Tinto, Ltd. ^ | | 6,659 | | 783 | |
Santos, Ltd. | | 53,330 | | 661 | |
Sonic Healthcare, Ltd. | | 1,548 | | 23 | |
Stockland REIT | | 413 | | 3 | |
Suncorp-Metway, Ltd. | | 6,220 | | 92 | |
Symbion Health, Ltd. | | 10,157 | | 36 | |
Tabcorp Holdings, Ltd. | | 4,577 | | 59 | |
Telstra Corp., Ltd. | | 24,350 | | 100 | |
Toll Holdings, Ltd. | | 2,895 | | 29 | |
Transurban Group ‡ | | 8,674 | | 52 | |
Wesfarmers, Ltd. ‡ | | 1,722 | | 62 | |
Wesfarmers, Ltd. | | 4,341 | | 154 | |
Westpac Banking Corp. | | 19,060 | | 467 | |
Woodside Petroleum, Ltd. | | 30,129 | | 1,333 | |
Woolworths, Ltd. | | 11,826 | | 353 | |
Austria (0.8%) | | | | | |
Andritz AG | | 1,028 | | 62 | |
Boehler-Uddeholm AG | | 599 | | 61 | |
Erste Bank DER Oesterreichischen Sparkassen AG | | 2,027 | | 143 | |
Flughafen Wien AG | | 386 | | 45 | |
Immofinanz AG | | 9,810 | | 99 | |
Mayr-Melnhof Karton AG | | 314 | | 34 | |
OMV AG | | 7,252 | | 585 | |
Raiffeisen International Bank Holding AG (1) | | 1,327 | | 200 | |
Telekom Austria AG | | 12,939 | | 357 | |
Verbund - Oesterreichische Elektrizitaetswirtschafts AG Class A | | 2,330 | | 162 | |
Voestalpine AG | | 2,600 | | 186 | |
Wiener Staedtische Versicherung AG | | 753 | | 60 | |
Wienerberger AG (1) | | 2,178 | | 120 | |
Belgium (0.7%) | | | | | |
AGFA-Gevaert NV | | 1,638 | | 25 | |
Bekaert SA | | 84 | | 11 | |
Belgacom SA | | 1,764 | | 87 | |
Delhaize Group | | 605 | | 53 | |
Dexia SA | | 15,324 | | 386 | |
Fortis | | 17,219 | | 454 | |
The notes to the financial statements are an integral part of this report.
4
| | Shares | | Value | |
Belgium (continued) | | | | | |
InBev NV | | 3,145 | | $ | 262 | |
KBC Groep NV | | 2,107 | | 296 | |
Solvay SA Class A | | 848 | | 119 | |
UCB SA | | 1,637 | | 74 | |
Umicore | | 361 | | 90 | |
Bermuda (0.5%) | | | | | |
Cheung Kong Infrastructure Holdings, Ltd. | | 7,000 | | 26 | |
China Water Affairs Group, Ltd. ‡ | | 422,806 | | 260 | |
Chow Sang Sang Holding | | 14,000 | | 24 | |
Cosco Pacific, Ltd. | | 38,000 | | 101 | |
Esprit Holdings, Ltd. | | 8,900 | | 132 | |
Frontline, Ltd. | | 950 | | 45 | |
Johnson Electric Holdings, Ltd. | | 24,018 | | 13 | |
Kerry Properties, Ltd. | | 4,987 | | 40 | |
LI & Fung, Ltd. | | 61,614 | | 249 | |
NWS Holdings, Ltd. | | 31,581 | | 101 | |
Rexcapital Financial Holdings, Ltd. ‡ | | 218,789 | | 42 | |
Shangri-La Asia, Ltd. | | 9,125 | | 29 | |
Ship Finance International, Ltd. | | 205 | | 6 | |
Ship Finance International, Ltd. ^ | | 306 | | 9 | |
Sinofert Holdings, Ltd. | | 218,000 | | 204 | |
YUE Yuen Industrial Holdings, Ltd. | | 7,000 | | 25 | |
Brazil (0.6%) | | | | | |
Banco Do Brasil SA | | 16,300 | | 278 | |
Cia Brasileira de Distribuicao Grupo PAO de Acucar | | 350 | | 13 | |
Cia de Bebidas das Americas | | 671 | | 47 | |
Cia Siderurgica Nacional SA | | 344 | | 31 | |
Empresa Brasileira de Aeronautica SA ‡ | | 5,665 | | 64 | |
GOL Linhas Aereas Inteligentes SA ^ | | 9,600 | | 238 | |
Lojas Renner SA | | 8,300 | | 168 | |
Perdigao SA ‡ | | 9,900 | | 246 | |
Souza Cruz SA | | 2,373 | | 64 | |
Tele Norte Leste Participacoes SA | | 3,620 | | 70 | |
Unibanco - Uniao de Bancos Brasileiros SA ‡ | | 2,050 | | 286 | |
Cayman Islands (0.2%) | | | | | |
Chaoda Modern Agriculture | | 48,600 | | 44 | |
China Infrastructure Machinery Holdings, Ltd. | | 55,000 | | 87 | |
China Resources Land, Ltd. | | 36,000 | | 79 | |
Hopewell Highway Infrastructure, Ltd. | | 83,425 | | 72 | |
Hutchison Telecommunications International, Ltd. | | 13,000 | | 19 | |
Kingboard Chemical Holdings, Ltd. | | 6,500 | | 39 | |
LI Ning Co., Ltd. | | 26,000 | | 97 | |
New World China Land, Ltd. | | 66,600 | | 60 | |
Prime Success International Group, Ltd. | | 91,900 | | 68 | |
Wasion Meters Group, Ltd. | | 43,225 | | 26 | |
China (0.9%) | | | | | |
Air China, Ltd. | | 32,000 | | $ | 48 | |
Aluminum Corp. of China, Ltd. | | 32,000 | | 66 | |
Angang Steel Co., Ltd. Class H | | 2,000 | | 5 | |
Anhui Expressway Co. Class H | | 90,000 | | 83 | |
Bank of China, Ltd. Class H | | 169,000 | | 82 | |
Bank of Communications Co., Ltd. Class H | | 111,000 | | 155 | |
China Communications Construction Co., Ltd. Class H | | 78,000 | | 205 | |
China Construction Bank Corp. Class H | | 414,444 | | 351 | |
China Cosco Holdings Co., Ltd. Class H | | 28,175 | | 78 | |
China Life Insurance Co., Ltd. Class H | | 55,000 | | 285 | |
China Petroleum & Chemical Corp. Class H | | 128,000 | | 193 | |
China Shenhua Energy Co., Ltd. Class H | | 26,500 | | 158 | |
China Shipping Development Co., Ltd. Class H | | 12,973 | | 34 | |
China Telecom Corp., Ltd. | | 122,000 | | 97 | |
Datang International Power Generation Co., Ltd. Class H | | 30,000 | | 27 | |
Dongfeng Motor Group Co., Ltd. Class H | | 31,581 | | 22 | |
Guangzhou R&F Properties Co., Ltd. Class H | | 8,000 | | 29 | |
Huaneng Power International, Inc. Class H | | 32,000 | | 34 | |
Jiangxi Copper Co., Ltd. Class H | | 11,000 | | 27 | |
PetroChina Co., Ltd. | | 122,000 | | 217 | |
Ping An Insurance Group Co. of China, Ltd. Class H | | 10,000 | | 107 | |
Shanghai Electric Group Co., Ltd. Class H | | 14,000 | | 12 | |
Sinopec Shanghai Petrochemical Co., Ltd. Class H | | 10,000 | | 6 | |
Yanzhou Coal Mining Co., Ltd. Class H | | 18,000 | | 36 | |
Zhejiang Expressway Co., Ltd. Class H | | 10,000 | | 16 | |
Zijin Mining Group Co., Ltd. | | 29,500 | | 46 | |
Colombia (0.1%) | | | | | |
Bancolombia SA | | 4,000 | | 136 | |
Denmark (0.6%) | | | | | |
Danske Bank A/S Class R | | 13,864 | | 542 | |
DSV A/S | | 3,000 | | 66 | |
GN Store Nord ‡ | | 8,266 | | 65 | |
NOVO Nordisk A/S Class B | | 6,972 | | 455 | |
Novozymes A/S | | 786 | | 89 | |
Vestas Wind Systems A/S ‡ | | 2,300 | | 248 | |
Finland (1.5%) | | | | | |
Cargotec Corp. Class B | | 646 | | 30 | |
Fortum OYJ | | 4,428 | | 199 | |
Kesko OYJ Class B | | 2,710 | | 148 | |
Kone OYJ Class B | | 1,292 | | 90 | |
Metso OYJ | | 6,741 | | 365 | |
The notes to the financial statements are an integral part of this report.
5
| | Shares | | Value | |
Finland (continued) | | | | | |
Neste Oil OYJ | | 1,357 | | $ | 48 | |
Nokia OYJ | | 62,681 | | 2,408 | |
Outokumpu OYJ | | 2,264 | | 70 | |
Rautaruukki OYJ | | 1,488 | | 64 | |
Sampo OYJ Class A | | 4,754 | | 125 | |
Stora ENSO OYJ Class R | | 9,824 | | 147 | |
Tietoenator OYJ | | 2,144 | | 48 | |
UPM-Kymmene OYJ | | 8,551 | | 173 | |
Uponor OYJ | | 495 | | 12 | |
Wartsila OYJ | | 796 | | 60 | |
France (7.6%) | | | | | |
Accor SA | | 3,853 | | 308 | |
Air Liquide | | 4,195 | | 624 | |
Alcatel-Lucent | | 27,203 | | 197 | |
Alstom | | 5,450 | | 1,171 | |
Arkema ‡ | | 812 | | 53 | |
Atos Origin ‡ | | 183 | | 9 | |
AXA SA | | 20,776 | | 832 | |
BNP Paribas | | 12,567 | | 1,364 | |
Bouygues | | 4,424 | | 369 | |
Business Objects SA ‡ | | 673 | | 41 | |
Capital Gemini SA | | 2,418 | | 152 | |
Carrefour SA | | 7,048 | | 549 | |
Casino Guichard Perrachon SA | | 949 | | 103 | |
Cie de Saint-Gobain | | 4,028 | | 380 | |
Cie Generale D’Optique Essilor International SA | | 2,382 | | 152 | |
CNP Assurances | | 1,290 | | 168 | |
Credit Agricole SA | | 4,512 | | 152 | |
Dassault Systemes SA | | 627 | | 37 | |
France Telecom SA | | 23,361 | | 841 | |
Gecina SA REIT | | 562 | | 88 | |
Groupe Danone | | 5,254 | | 472 | |
Hermes International | | 2,605 | | 329 | |
Imerys SA | | 521 | | 43 | |
Klepierre REIT | | 1,422 | | 73 | |
Lafarge SA | | 3,680 | | 670 | |
Lagardere Sca | | 1,928 | | 145 | |
L’Oreal SA | | 2,958 | | 424 | |
LVMH Moet Hennessy Louis Vuitton SA | | 7,157 | | 865 | |
Michelin (C.G.D.E.) Class B | | 1,068 | | 123 | |
Neopost SA | | 763 | | 79 | |
Pernod-Ricard SA | | 121 | | 28 | |
Peugeot SA | | 1,217 | | 92 | |
PPR SA | | 635 | | 102 | |
Publicis Groupe | | 938 | | 37 | |
Renault SA | | 1,252 | | 178 | |
Safran SA | | 814 | | 17 | |
Sanofi-Aventis SA | | 12,591 | | 1,159 | |
Sanofi-Aventis | | 1,124 | | 103 | |
Schneider Electric SA | | 5,042 | | 683 | |
Societe BIC SA | | 377 | | 27 | |
Societe Generale | | 4,945 | | 715 | |
Societe Television Francaise (1) | | 2,955 | | $ | 79 | |
Sodexho Alliance SA | | 2,055 | | 126 | |
Suez SA | | 8,183 | | 557 | |
Suez SA | | 1,004 | | 68 | |
Technip SA | | 963 | | 77 | |
Thales SA | | 1,604 | | 96 | |
Thomson ‡ | | 2,434 | | 35 | |
Total SA | | 39,322 | | 3,267 | |
Unibail-Rodamco | | 639 | | 140 | |
Valeo SA | | 886 | | 36 | |
Vallourec | | 606 | | 164 | |
Veolia Environnement | | 8,480 | | 774 | |
Vinci SA | | 3,684 | | 273 | |
Vivendi | | 8,819 | | 405 | |
Zodiac SA | | 138 | | 9 | |
Germany (7.7%) | | | | | |
Adidas AG | | 4,562 | | 339 | |
Allianz SE | | 6,029 | | 1,299 | |
Altana AG | | 1,045 | | 25 | |
Arcandor AG ‡ | | 1,347 | | 32 | |
BASF AG | | 7,725 | | 1,146 | |
Bayer AG | | 9,909 | | 906 | |
Beiersdorf AG | | 2,141 | | 166 | |
Celesio AG | | 3,160 | | 196 | |
Commerzbank AG | | 10,236 | | 389 | |
Continental AG | | 2,232 | | 292 | |
Daimler AG | | 13,759 | | 1,334 | |
Deutsche Bank AG | | 3,328 | | 435 | |
Deutsche Boerse AG | | 3,199 | | 631 | |
Deutsche Lufthansa AG | | 3,854 | | 103 | |
Deutsche Post AG | | 12,131 | | 417 | |
Deutsche Postbank AG | | 933 | | 83 | |
Deutsche Telekom AG | | 53,028 | | 1,167 | |
E.ON AG | | 12,123 | | 2,577 | |
Fresenius Medical Care AG | | 7,406 | | 398 | |
Heidelberger Druckmaschinen AG | | 894 | | 30 | |
Hochtief AG | | 959 | | 129 | |
HYPO Real Estate Holding AG (1) | | 3,652 | | 193 | |
Infineon Technologies AG ‡ | | 8,918 | | 105 | |
Linde AG | | 2,074 | | 275 | |
Man AG | | 2,610 | | 433 | |
Merck KGAA | | 1,085 | | 140 | |
Metro AG | | 5,026 | | 423 | |
Muenchener Rueckversicherungs AG | | 3,017 | | 586 | |
Puma AG Rudolf Dassler Sport | | 188 | | 74 | |
RWE AG | | 7,805 | | 1,094 | |
SAP AG | | 29,431 | | 1,515 | |
Siemens AG | | 13,606 | | 2,163 | |
Suedzucker AG | | 7,130 | | 169 | |
ThyssenKrupp AG | | 6,175 | | 348 | |
TUI AG ‡^ | | 3,842 | | 107 | |
Volkswagen AG | | 2,642 | | 607 | |
The notes to the financial statements are an integral part of this report.
6
| | Shares | | Value | |
Greece (0.7%) | | | | | |
Alpha Bank A.E. | | 10,365 | | $ | 378 | |
EFG Eurobank Ergasias SA | | 5,852 | | 206 | |
National Bank of Greece SA | | 11,399 | | 783 | |
Opap SA | | 2,900 | | 116 | |
Piraeus Bank SA | | 10,100 | | 394 | |
Titan Cement Co. SA | | 900 | | 41 | |
Hong Kong (1.2%) | | | | | |
Agile Property Holdings, Ltd. | | 71,444 | | 130 | |
Bank of East Asia, Ltd. | | 14,967 | | 102 | |
BOC Hong Kong Holdings, Ltd. | | 34,000 | | 95 | |
Cathay Pacific Airways, Ltd. | | 10,000 | | 26 | |
Cheung Kong Holdings, Ltd. ‡ | | 14,000 | | 259 | |
China Resources Enterprise | | 30,000 | | 129 | |
China Travel International INV Hk, Ltd. | | 190,000 | | 125 | |
CLP Holdings, Ltd. | | 16,003 | | 109 | |
Guangdong Investment, Ltd. | | 356,000 | | 203 | |
Hang Lung Properties, Ltd. | | 54,000 | | 245 | |
Hang Seng Bank, Ltd. | | 6,700 | | 138 | |
Henderson Land Development Co., Ltd. | | 7,000 | | 66 | |
Hong Kong & China Gas Co. | | 39,610 | | 122 | |
Hong Kong Exchanges and Clearing, Ltd. | | 10,000 | | 284 | |
HongKong Electric Holdings | | 13,000 | | 75 | |
Hopewell Holdings, Ltd. | | 6,000 | | 28 | |
Hutchison Whampoa International, Ltd. ‡ | | 19,920 | | 226 | |
Hysan Development Co., Ltd. ‡ | | 8,362 | | 24 | |
Link (The) REIT | | 15,813 | | 34 | |
MTR Corp. | | 13,939 | | 51 | |
New World Development, Ltd. ‡ | | 23,016 | | 82 | |
PCCW, Ltd. | | 35,220 | | 21 | |
Sino Land Co. | | 11,287 | | 40 | |
Sun Hung KAI Properties, Ltd. | | 19,500 | | 414 | |
Swire Pacific, Ltd.‡ | | 8,500 | | 117 | |
Techtronic Industries Co. | | 11,000 | | 11 | |
Television Broadcasts, Ltd. | | 3,000 | | 18 | |
Wharf Holdings, Ltd. ‡ | | 12,016 | | 63 | |
India (1 .1%) | | | | | |
ABB, Ltd./India | | 980 | | 38 | |
Associated Cement Co., Ltd. | | 254 | | 7 | |
Axis Bank, Ltd. | | 1,600 | | 39 | |
Bajaj Auto, Ltd. | | 404 | | 27 | |
Bharat Forge, Ltd. | | 856 | | 8 | |
Bharat Heavy Electricals, Ltd. | | 1,745 | | 114 | |
Bharti Airtel, Ltd.: | | 9,713 | | 245 | |
Cipla, Ltd. | | 1,590 | | 9 | |
Dish Tv India, Ltd.‡ | | 1,022 | | 3 | |
Dr. Reddy’s Laboratories, Ltd. | | 1,315 | | 25 | |
Gail India, Ltd. | | 3,347 | | 46 | |
Glenmark Pharmaceuticals, Ltd. | | 1,056 | | 16 | |
Grasim Industries, Ltd. | | 515 | | 48 | |
HDFC Bank, Ltd. | | 2,495 | | 109 | |
Hero Honda Motors, Ltd. | | 1,073 | | 19 | |
Hindalco Industries, Ltd. | | 7,000 | | 38 | |
Hindustan Lever, Ltd. | | 10,629 | | $ | 58 | |
Housing Development Finance Corp. | | 2,364 | | 172 | |
ICICI Bank, Ltd. ^ | | 1,400 | | 86 | |
ICICI Bank, Ltd. | | 8,076 | | 252 | |
I-Flex Solutions, Ltd. ‡ | | 156 | | 6 | |
Infosys Technologies, Ltd. | | 5,096 | | 229 | |
ITC, Ltd. | | 14,100 | | 75 | |
Larsen & Toubro, Ltd. | | 1,335 | | 141 | |
Mahindra & Mahindra, Ltd. | | 1,340 | | 29 | |
Maruti Udyog, Ltd. | | 907 | | 23 | |
Oil & Natural Gas Corp., Ltd. | | 3,133 | | 98 | |
Ranbaxy Laboratories, Ltd. | | 1,939 | | 21 | |
Reliance Communications, Ltd. | | 16,300 | | 309 | |
Reliance Energy, Ltd. | | 351 | | 19 | |
Reliance Industries, Ltd. | | 5,792 | | 423 | |
Satyam Computer Services, Ltd. | | 5,983 | | 68 | |
Sun Pharma Advanced Research Co., Ltd. ‡ | | 407 | | 2 | |
Sun Pharmaceuticals Industries, Ltd. | | 416 | | 13 | |
Tata Consultancy Services, Ltd. | | 1,655 | | 45 | |
Tata Motors, Ltd. | | 2,476 | | 47 | |
Tata Steel, Ltd. (1) | | 1,734 | | 41 | |
Wipro, Ltd. | | 2,585 | | 34 | |
Wire And Wireless India, Ltd. ‡ | | 889 | | 2 | |
ZEE Entertainment Enterprises, Ltd. | | 2,670 | | 22 | |
ZEE News, Ltd. ‡ | | 803 | | 2 | |
Indonesia (0.5%) | | | | | |
Bank Central Asia | | 478,500 | | 367 | |
Bank Mandiri Persero | | 210,500 | | 77 | |
Bank Rakyat Indonesia | | 132,000 | | 103 | |
Bumi Resources | | 464,500 | | 291 | |
Astra International | | 74,000 | | 212 | |
United Tractors | | 323,000 | | 368 | |
Italy (0.7%) | | | | | |
Assicurazioni Generali SpA | | 14,937 | | 676 | |
Bulgari SpA | | 6,158 | | 87 | |
Intesa Sanpaolo SpA | | 47,583 | | 374 | |
Unicredito Italiano SpA | | 88,001 | | 724 | |
Unione DI Banche Italiane Scpa | | 2,406 | | 66 | |
Japan (18.4%) | | | | | |
77 Bank, Ltd. (The) | | 11,000 | | 68 | |
ACOM Co., Ltd. | | 440 | | 9 | |
Advantest Corp. | | 4,300 | | 122 | |
AEON Co., Ltd. | | 9,600 | | 140 | |
AEON Credit Service Co., Ltd. | | 500 | | 7 | |
Aiful Corp. ^ | | 425 | | 7 | |
Ajinomoto Co., Inc. | | 13,000 | | 147 | |
ALPS Electric Co., Ltd. | | 3,300 | | 43 | |
Amada Co., Ltd. | | 7,000 | | 61 | |
Asahi Breweries, Ltd. | | 6,600 | | 111 | |
Asahi Glass Co., Ltd. | | 24,000 | | 317 | |
Asahi Kasei Corp. | | 22,000 | | 145 | |
Asatsu-DK, Inc. | | 300 | | 8 | |
The notes to the financial statements are an integral part of this report.
7
| | Shares | | Value | |
Japan (continued) | | | | | |
Astellas Pharma, Inc. | | 8,800 | | $ | 382 | |
Bank of Kyoto, Ltd. (The) | | 9,000 | | 107 | |
Bank of Yokohama, Ltd. (The) | | 36,000 | | 251 | |
Benesse Corp. | | 600 | | 25 | |
Bridgestone Corp. | | 18,000 | | 318 | |
Canon, Inc. | | 18,550 | | 849 | |
Casio Computer Co., Ltd. | | 8,100 | | 94 | |
Central Japan Railway Co. | | 33 | | 281 | |
Chiba Bank, Ltd. (The) | | 22,000 | | 177 | |
Chiyoda Corp. | | 5,000 | | 56 | |
Chubu Electric Power Co., Inc. | | 8,800 | | 229 | |
Chugai Pharmaceutical Co., Ltd. | | 5,302 | | 76 | |
Chuo Mitsui Trust Holdings, Inc. | | 19,000 | | 145 | |
Citizen Holdings Co., Ltd. | | 6,900 | | 67 | |
COMSYS Holdings Corp. | | 4,000 | | 33 | |
Credit Saison Co., Ltd. | | 1,100 | | 30 | |
CSK Holdings Corp. | | 1,500 | | 48 | |
DAI Nippon Printing Co., Ltd. | | 8,000 | | 117 | |
Daicel Chemical Industries, Ltd. | | 3,000 | | 18 | |
Daiichi Sankyo Co., Ltd. | | 12,056 | | 371 | |
Daikin Industries, Ltd. | | 3,700 | | 206 | |
Dainippon Ink & Chemical, Inc. | | 12,000 | | 60 | |
Daito Trust Construction Co., Ltd. | | 3,100 | | 170 | |
Daiwa House Industry Co., Ltd. | | 18,000 | | 230 | |
Daiwa Securities Group, Inc. | | 32,000 | | 287 | |
Denki Kagaku Kogyo K K | | 7,000 | | 30 | |
Denso Corp. | | 13,000 | | 529 | |
Dowa Mining Co., Ltd. | | 9,000 | | 63 | |
East Japan Railway Co. | | 77 | | 633 | |
Ebara Corp. | | 7,000 | | 24 | |
Eisai Co., Ltd. | | 4,300 | | 168 | |
Familymart Co., Ltd. | | 1,200 | | 38 | |
Fanuc, Ltd. | | 3,700 | | 359 | |
Fast Retailing Co., Ltd. | | 2,000 | | 143 | |
Fuji Electric Holdings Co., Ltd. | | 4,000 | | 14 | |
Fuji Soft, Inc. | | 900 | | 14 | |
Fujifilm Holdings Corp. | | 9,100 | | 381 | |
Fujikura, Ltd. | | 5,000 | | 25 | |
Fujitsu, Ltd. | | 34,000 | | 227 | |
Fukuoka Financial Group, Inc. | | 19,000 | | 111 | |
Furukawa Electric Co., Ltd. | | 14,000 | | 54 | |
Hirose Electric Co., Ltd. | | 600 | | 69 | |
Hitachi Construction Machinery Co., Ltd. | | 700 | | 21 | |
Hitachi, Ltd. | | 61,000 | | 453 | |
Hokuhoku Financial Group, Inc. | | 35,000 | | 101 | |
Honda Motor Co., Ltd. | | 31,100 | | 1,027 | |
Hoya Corp. | | 7,400 | | 234 | |
Ibiden Co., Ltd. | | 2,300 | | 159 | |
Ihi Corp. | | 22,000 | | 45 | |
Index Holdings | | 26 | | 8 | |
INPEX Holdings, Inc. | | 8 | | 87 | |
Isetan Co., Ltd. | | 3,800 | | 51 | |
ITOCHU Corp. | | 33,000 | | 318 | |
ITOCHU Techno-Solutions Corp. | | 700 | | $ | 23 | |
J Front Retailing Co., Ltd. ‡ | | 7,000 | | 62 | |
Japan Airlines Corp. ‡^ | | 16,000 | | 36 | |
Japan Real Estate Investment Corp. Class A REIT | | 20 | | 248 | |
Japan Retail Fund Investment Corp. Class A REIT | | 14 | | 99 | |
Japan Tobacco, Inc. | | 88 | | 520 | |
JFE Holdings, Inc. | | 6,900 | | 346 | |
JGC Corp. | | 6,000 | | 103 | |
Joyo Bank, Ltd. (The) | | 24,000 | | 134 | |
JS Group Corp. | | 4,400 | | 70 | |
JSR Corp. | | 2,800 | | 72 | |
Kajima Corp. | | 25,000 | | 81 | |
Kaneka Corp. | | 5,000 | | 41 | |
Kansai Electric Power Co., Inc. (The) | | 16,900 | | 394 | |
KAO Corp. | | 13,000 | | 391 | |
Kawasaki Heavy Industries, Ltd. | | 22,000 | | 64 | |
Keihin Electric Express Railway Co., Ltd. | | 6,000 | | 37 | |
KEIO Corp. | | 2,000 | | 12 | |
Keyence Corp. | | 720 | | 177 | |
Kikkoman Corp. | | 3,000 | | 41 | |
Kintetsu Corp. | | 36,000 | | 112 | |
Kirin Holdings Co., Ltd. | | 19,000 | | 279 | |
Kobe Steel, Ltd. | | 38,000 | | 123 | |
Komatsu, Ltd. | | 21,400 | | 574 | |
Konami Corp. | | 2,300 | | 75 | |
Konica Minolta Holdings, Inc. | | 9,000 | | 158 | |
Kubota Corp. | | 32,000 | | 215 | |
Kuraray Co., Ltd. | | 6,500 | | 78 | |
Kurita Water Industries, Ltd. | | 4,800 | | 145 | |
Kyocera Corp. | | 3,000 | | 265 | |
Kyowa Hakko Kogyo Co., Ltd. | | 6,011 | | 64 | |
Kyushu Electric Power Co., Inc. | | 5,100 | | 125 | |
Lawson, Inc. | | 800 | | 28 | |
Leopalace21 Corp. | | 3,300 | | 89 | |
Mabuchi Motor Co., Ltd. | | 500 | | 30 | |
Marubeni Corp. | | 61,000 | | 427 | |
Marui Group Co., Ltd. | | 8,200 | | 81 | |
Matsui Securities Co., Ltd. | | 4,400 | | 34 | |
Matsushita Electric Industrial Co., Ltd. | | 42,000 | | 861 | |
Matsushita Electric Works, Ltd. | | 7,000 | | 77 | |
Meiji Seika Kaisha, Ltd. | | 3,000 | | 13 | |
Meitec Corp. | | 300 | | 9 | |
Millea Holdings, Inc. | | 15,548 | | 522 | |
Minebea Co., Ltd. | | 8,000 | | 51 | |
Mitsubishi Chemical Holdings Corp. | | 15,500 | | 118 | |
Mitsubishi Corp. | | 28,700 | | 777 | |
Mitsubishi Electric Corp. | | 42,000 | | 435 | |
Mitsubishi Estate Co., Ltd. | | 31,000 | | 739 | |
Mitsubishi Heavy Industries, Ltd. | | 71,000 | | 302 | |
Mitsubishi Materials Corp. | | 35,000 | | 148 | |
The notes to the financial statements are an integral part of this report.
8
| | Shares | | Value | |
Japan (continued) | | | | | |
Mitsubishi Rayon Co., Ltd. | | 9,000 | | $ | 43 | |
Mitsubishi UFJ Financial Group, Inc. | | 199,340 | | 1,880 | |
Mitsui & Co., Ltd. | | 34,000 | | 710 | |
Mitsui Chemicals, Inc. | | 8,000 | | 52 | |
Mitsui Fudosan Co., Ltd. | | 23,000 | | 496 | |
Mitsui Mining & Smelting Co., Ltd. | | 21,000 | | 84 | |
Mitsui O.S.K. Lines, Ltd. | | 2,000 | | 25 | |
Mitsui Sumitomo Insurance Co., Ltd. | | 27,000 | | 261 | |
Mitsukoshi, Ltd. | | 4,000 | | 18 | |
Mizuho Financial Group, Inc. | | 232 | | 1,105 | |
Murata Manufacturing Co., Ltd. | | 3,600 | | 207 | |
NEC Corp. | | 38,000 | | 175 | |
NEC Electronics Corp. ‡ | | 1,100 | | 26 | |
NET One Systems Co., Ltd. | | 16 | | 18 | |
NGK Insulators, Ltd. | | 8,000 | | 215 | |
NGK Spark Plug Co., Ltd. | | 5,000 | | 87 | |
Nidec Corp. | | 2,100 | | 152 | |
Nikon Corp. | | 6,000 | | 204 | |
Nintendo Co., Ltd. | | 1,500 | | 881 | |
Nippon Building Fund, Inc. Class A REIT | | 20 | | 279 | |
Nippon Electric Glass Co., Ltd. | | 6,000 | | 98 | |
Nippon Express Co., Ltd. | | 19,000 | | 97 | |
Nippon Meat Packers, Inc. | | 3,000 | | 30 | |
Nippon Mining Holdings, Inc. | | 11,500 | | 73 | |
Nippon Oil Corp. | | 32,000 | | 259 | |
Nippon Paper Group, Inc. | | 52 | | 157 | |
Nippon Sheet Glass Co., Ltd. | | 8,000 | | 40 | |
Nippon Steel Corp. | | 93,000 | | 569 | |
Nippon Telegraph & Telephone Corp. | | 54 | | 268 | |
Nippon Yusen Kabushiki Kaisha | | 22,000 | | 173 | |
Nishi-Nippon City Bank, Ltd. (The) | | 10,000 | | 25 | |
Nissan Chemical Industries, Ltd. | | 3,000 | | 39 | |
Nissan Motor Co., Ltd. | | 45,500 | | 497 | |
Nisshin Seifun Group, Inc. | | 5,500 | | 55 | |
Nissin Food Products Co., Ltd. | | 1,600 | | 52 | |
Nitto Denko Corp. | | 4,500 | | 237 | |
Nomura Holdings, Inc. | | 46,600 | | 781 | |
Nomura Research Institute, Ltd. | | 2,400 | | 79 | |
NSK, Ltd. | | 14,000 | | 144 | |
NTN Corp. | | 10,000 | | 87 | |
NTT Data Corp. | | 26 | | 115 | |
NTT DoCoMo, Inc. | | 78 | | 128 | |
Obayashi Corp. | | 20,000 | | 100 | |
OBIC Co., Ltd. | | 170 | | 31 | |
OJI Paper Co., Ltd. | | 21,000 | | 103 | |
Oki Electric Industry Co., Ltd. ‡^ | | 12,000 | | 19 | |
Okumura Corp. | | 5,000 | | 24 | |
Olympus Corp. | | 3,000 | | 122 | |
Omron Corp. | | 4,200 | | 99 | |
Onward Kashiyama Co., Ltd. | | 3,000 | | 31 | |
Oracle Corp. | | 1,000 | | 44 | |
Oriental Land Co., Ltd. | | 1,400 | | 84 | |
Osaka Gas Co., Ltd. | | 41,000 | | 161 | |
Pioneer Corp. | | 3,100 | | $ | 28 | |
Promise Co., Ltd. | | 600 | | 15 | |
Resona Holdings, Inc. | | 120 | | 213 | |
Ricoh Co., Ltd. | | 11,000 | | 201 | |
ROHM Co., Ltd. | | 3,200 | | 278 | |
Sanken Electric Co., Ltd. | | 3,000 | | 16 | |
Sanyo Electric Co., Ltd. ‡ | | 36,000 | | 49 | |
SBI E*Trade Securities Co., Ltd. | | 46 | | 42 | |
Secom Co., Ltd. | | 2,800 | | 153 | |
Seiko Epson Corp. | | 2,200 | | 47 | |
Sekisui Chemical Co., Ltd. | | 7,000 | | 47 | |
Sekisui House, Ltd. | | 20,000 | | 214 | |
Seven & I Holdings Co., Ltd. | | 14,060 | | 409 | |
Sharp Corp. | | 18,000 | | 321 | |
Shimachu Co., Ltd. | | 1,200 | | 34 | |
Shimamura Co., Ltd. | | 500 | | 42 | |
Shimano, Inc. | | 1,700 | | 61 | |
Shimizu Corp. | | 20,000 | | 87 | |
Shin-Etsu Chemical Co., Ltd. | | 7,500 | | 466 | |
Shinko Securities Co., Ltd. | | 14,000 | | 57 | |
Shinsei Bank, Ltd. | | 30,000 | | 109 | |
Shionogi & Co., Ltd. | | 6,000 | | 106 | |
Shiseido Co., Ltd. | | 6,000 | | 142 | |
Shizuoka Bank, Ltd. (The) | | 19,000 | | 208 | |
Showa Denko KK | | 12,000 | | 43 | |
Showa Shell Sekiyu KK | | 1,700 | | 19 | |
SMC Corp./Japan | | 1,300 | | 155 | |
Softbank Corp. | | 17,900 | | 367 | |
Sompo Japan Insurance, Inc. | | 18,000 | | 161 | |
Sony Corp. | | 14,400 | | 785 | |
Stanley Electric Co., Ltd. | | 1,000 | | 25 | |
Sumitomo Bakelite Co., Ltd. | | 3,000 | | 18 | |
Sumitomo Chemical Co., Ltd. | | 26,000 | | 230 | |
Sumitomo Corp. | | 21,600 | | 302 | |
Sumitomo Electric Industries, Ltd. | | 13,700 | | 216 | |
Sumitomo Heavy Industries, Ltd. | | 8,000 | | 73 | |
Sumitomo Metal Industries, Ltd. | | 53,000 | | 242 | |
Sumitomo Metal Mining Co., Ltd. | | 20,000 | | 338 | |
Sumitomo Mitsui Financial Group, Inc. ^ | | 144 | | 1,066 | |
Sumitomo Realty & Development Co., Ltd. | | 11,000 | | 269 | |
Sumitomo Trust & Banking Co., Ltd. (The) | | 39,000 | | 257 | |
T&D Holdings, Inc. | | 4,900 | | 249 | |
Taiheiyo Cement Corp. | | 12,000 | | 28 | |
Taisei Corp. | | 25,000 | | 67 | |
Taisho Pharmaceutical Co., Ltd. | | 2,911 | | 56 | |
Taiyo Yuden Co., Ltd. | | 1,000 | | 16 | |
Takashimaya Co., Ltd. | | 8,000 | | 96 | |
Takeda Pharmaceutical Co., Ltd. | | 14,600 | | 853 | |
Takefuji Corp. | | 730 | | 18 | |
TDK Corp. | | 2,300 | | 169 | |
Teijin, Ltd. | | 17,000 | | 72 | |
Terumo Corp. | | 4,100 | | 214 | |
THK Co., Ltd. | | 800 | | 16 | |
The notes to the financial statements are an integral part of this report.
9
| | Shares | | Value | |
Japan (continued) | | | | | |
TIS, Inc. | | 800 | | $ | 14 | |
Tobu Railway Co., Ltd. | | 21,000 | | 98 | |
Toho Co., Ltd./Tokyo | | 800 | | 18 | |
Tohoku Electric Power Co., Inc. | | 8,100 | | 182 | |
Tokyo Broadcasting System, Inc. | | 2,100 | | 45 | |
Tokyo Electric Power Co., Inc. (The) | | 26,900 | | 696 | |
Tokyo Electron, Ltd. | | 4,500 | | 274 | |
Tokyo Gas Co., Ltd. | | 45,000 | | 210 | |
Tokyo Tatemono Co., Ltd. | | 8,000 | | 75 | |
Tokyu Corp. | | 23,000 | | 150 | |
TonenGeneral Sekiyu KK | | 8,000 | | 79 | |
Toppan Printing Co., Ltd. | | 8,000 | | 78 | |
Toray Industries, Inc. | | 22,000 | | 171 | |
Toshiba Corp. ^ | | 62,000 | | 458 | |
Tosoh Corp. | | 8,000 | | 34 | |
Toto, Ltd. ^ | | 10,000 | | 79 | |
Toyo Seikan Kaisha, Ltd. | | 3,100 | | 55 | |
Toyota Industries Corp. | | 1,900 | | 77 | |
Toyota Motor Corp. | | 50,300 | | 2,679 | |
Trend Micro, Inc. | | 2,000 | | 71 | |
Uni-Charm Corp. | | 400 | | 25 | |
Uniden Corp. | | 1,000 | | 6 | |
UNY Co., Ltd. | | 1,000 | | 8 | |
Ushio, Inc. | | 1,000 | | 22 | |
West Japan Railway Co. | | 4 | | 20 | |
Yahoo! Japan Corp. | | 328 | | 146 | |
Yamada Denki Co., Ltd. | | 2,160 | | 244 | |
Yamaha Corp. | | 1,900 | | 43 | |
Yamaha Motor Co., Ltd. | | 700 | | 17 | |
Yamato Holdings Co., Ltd. | | 5,000 | | 72 | |
Yamazaki Baking Co., Ltd. | | 1,000 | | 10 | |
Yokogawa Electric Corp. | | 4,100 | | 45 | |
Jersey, C.I. (0.0%) | | | | | |
Experian Group, Ltd. | | 7,320 | | 58 | |
Meinl European Land, Ltd. ‡ | | 3,219 | | 44 | |
Korea, Republic of (0.4%) | | | | | |
Daelim Industrial Co. | | 100 | | 19 | |
Daewoo Shipbuilding & Marine Engineering Co., Ltd. ‡ | | 340 | | 19 | |
Doosan Heavy Industries And Construction Co., Ltd. | | 130 | | 17 | |
Doosan Infracore Co., Ltd. | | 370 | | 12 | |
GS Engineering & Construction Corp. | | 160 | | 26 | |
Hana Financial Group, Inc. | | 490 | | 26 | |
Hyundai Engineering & Construction Co., Ltd. ‡ | | 240 | | 22 | |
Hyundai Heavy Industries Co., Ltd. | | 120 | | 56 | |
Hyundai Mipo Dockyard | | 40 | | 12 | |
Hyundai Mobis | | 140 | | 13 | |
Hyundai Motor Co. | | 470 | | 36 | |
KIA Motors Corp. ‡ | | 960 | | 10 | |
Kookmin Bank | | 1,050 | | $ | 77 | |
Korea Electric Power Corp. | | 920 | | 39 | |
Korean Air Lines Co., Ltd. | | 210 | | 17 | |
KT Corp. | | 850 | | 44 | |
KT&G Corp. | | 440 | | 37 | |
LG Chem, Ltd. | | 260 | | 25 | |
LG Electronics, Inc. | | 310 | | 33 | |
LG.Philips LCD Co., Ltd. ‡ | | 350 | | 18 | |
NHN Corp. ‡ | | 145 | | 35 | |
POSCO | | 230 | | 139 | |
Samsung Corp. | | 470 | | 36 | |
Samsung Electronics Co., Ltd. | | 355 | | 209 | |
Samsung Engineering Co., Ltd. | | 130 | | 13 | |
Samsung Fire & Marine Insurance Co., Ltd. | | 120 | | 32 | |
Samsung Securities Co., Ltd. | | 250 | | 24 | |
Shinhan Financial Group Co., Ltd. | | 1,170 | | 66 | |
Shinsegae Co., Ltd. | | 58 | | 45 | |
SK Corp. | | 80 | | 17 | |
S-Oil Corp. | | 180 | | 15 | |
Luxembourg (0.4%) | | | | | |
Arcelor (1) | | 14,021 | | 1,090 | |
Malaysia (0.2%) | | | | | |
IJM Corp. Berhad ‡ | | 74,000 | | 193 | |
IOI Corp. BHD ‡ | | 63,300 | | 148 | |
Kuala Lumpur Kepong BHD ‡ | | 14,400 | | 76 | |
Mexico (0.2%) | | | | | |
Corp. Geo SAB de CV Series B, Class B ‡ | | 22,900 | | 66 | |
Desarrolladora Homex SAB de CV ‡ | | 2,100 | | 104 | |
Grupo Financiero Banorte SAB de CV Class O | | 57,100 | | 236 | |
URBI Desarrollos Urbanos SA de CV ‡ | | 11,600 | | 40 | |
Wal-Mart de Mexico SAB de CV Series V, Class V | | 46,700 | | 163 | |
Netherlands (3.4%) | | | | | |
AKZO Nobel NV | | 3,688 | | 295 | |
ASML Holding NV ‡ | | 7,782 | | 246 | |
Corio NV REIT | | 1,098 | | 89 | |
European Aeronautic Defense and Space Co. | | 3,760 | | 120 | |
Heineken NV | | 14,633 | | 946 | |
ING Groep NV | | 22,256 | | 870 | |
James Hardie Industries NV | | 12,239 | | 69 | |
Koninklijke DSM | | 2,113 | | 100 | |
Koninklijke Philips Electronics NV | | 14,448 | | 624 | |
OCE NV | | 1,999 | | 36 | |
Qiagen NV ‡ | | 2,303 | | 50 | |
Reed Elsevier NV ‡ | | 9,168 | | 183 | |
Royal Dutch Shell PLC Class A | | 62,892 | | 2,643 | |
Royal KPN NV | | 27,721 | | 504 | |
STMicroelectronics NV | | 12,420 | | 178 | |
TNT NV | | 14,999 | | 620 | |
The notes to the financial statements are an integral part of this report.
10
| | Shares | | Value | |
Netherlands (continued) | | | | | |
Unilever NV | | 29,687 | | $ | 1,092 | |
Wereldhave NV REIT | | 447 | | 49 | |
Wolters Kluwer NV | | 5,098 | | 168 | |
New Zealand (0.0%) | | | | | |
Telecom Corp. of New Zealand, Ltd. | | 4,768 | | 16 | |
Norway (1.4%) | | | | | |
DNB NOR ASA | | 6,404 | | 97 | |
Norsk Hydro ASA | | 12,940 | | 184 | |
Norske Skogindustrier ASA ^ | | 2,900 | | 24 | |
Orkla ASA | | 11,150 | | 214 | |
Renewable Energy Corp. As ‡ | | 3,500 | | 176 | |
Statoil ASA | | 64,356 | | 1,985 | |
Tandberg ASA | | 3,196 | | 66 | |
Telenor ASA ‡ | | 11,500 | | 273 | |
Yara International ASA | | 13,847 | | 637 | |
Philippines (0.6%) | | | | | |
Ayala Corp. | | 12,070 | | 163 | |
Ayala Land, Inc. | | 910,604 | | 309 | |
Banco de Oro-Epci, Inc. | | 74,601 | | 109 | |
Bank of The Philippine Islands | | 105,510 | | 157 | |
Globe Telecom, Inc. | | 2,500 | | 95 | |
Manila Electric Co. | | 42,400 | | 84 | |
Megaworld Corp. | | 835,000 | | 74 | |
Metropolitan Bank & Trust | | 37,600 | | 49 | |
Philippine Long Distance Telephone Co. | | 4,650 | | 356 | |
Pnoc Energy Development Corp. | | 566,188 | | 88 | |
SM Investments Corp. | | 13,610 | | 111 | |
SM Prime Holdings, Inc. | | 343,000 | | 83 | |
Poland (0.6%) | | | | | |
Agora SA | | 1,257 | | 28 | |
Bank Bph SA | | 319 | | 13 | |
Bank Pekao SA | | 5,495 | | 507 | |
Bank Zachodni WBK SA | | 877 | | 89 | |
Grupa Kety SA | | 43 | | 3 | |
KGHM Polska Miedz SA | | 4,349 | | 186 | |
Polski Koncern Naftowy Orlen ‡ | | 10,198 | | 215 | |
Powszechna Kasa Oszczednosci Bank Polski SA | | 12,748 | | 272 | |
Prokom Software SA | | 380 | | 20 | |
Telekomunikacja Polska SA | | 23,583 | | 215 | |
Portugal (0.2%) | | | | | |
Banco Comercial Portugues SA | | 38,473 | | 164 | |
Brisa Class V | | 5,252 | | 77 | |
Energias de Portugal SA | | 548 | | 4 | |
Portugal Telecom SGPS SA | | 10,587 | | 138 | |
PT Multimedia Servicos de Telecomunicacoes E Multimedia SGPS SA | | 5,032 | | 70 | |
Russian Federation (1.8%) | | | | | |
Gazprom OAO | | 17,615 | | 987 | |
LUKOIL | | 6,809 | | 574 | |
MMC Norilsk Nickel | | 2,681 | | 721 | |
Mobile Telesystems OJSC | | 3,900 | | 397 | |
Novolipetsk Steel OJSC | | 2,900 | | $ | 116 | |
OAO Gazprom | | 4,737 | | 269 | |
Polyus Gold Co. ^ | | 2,200 | | 101 | |
Sberbank | | 279 | | 155 | |
Severstal | | 5,600 | | 130 | |
Surgutneftegaz | | 1,600 | | 99 | |
Surgutneftegaz ^ | | 3,200 | | 193 | |
Tatneft | | 1,400 | | 169 | |
Unified Energy System ‡ | | 1,748 | | 227 | |
Vimpel-Communications | | 10,000 | | 416 | |
Wimm-Bill-Dann Foods OJSC | | 1,600 | | 210 | |
Singapore (2.0%) | | | | | |
Ascendas Real Estate Investment Trust REIT ‡ | | 39,000 | | 67 | |
Capitaland, Ltd. | | 44,000 | | 192 | |
CapitaMall Trust REIT ‡ | | 31,800 | | 76 | |
Chartered Semiconductor Manufacturing, Ltd. ‡ | | 52,000 | | 35 | |
City Developments, Ltd. | | 19,484 | | 192 | |
ComfortDelgro Corp., Ltd. | | 69,598 | | 89 | |
Cosco Corp. Singapore, Ltd. | | 31,000 | | 124 | |
Creative Technology, Ltd. | | 3,450 | | 15 | |
DBS Group Holdings, Ltd. | | 39,788 | | 572 | |
Fraser And Neave, Ltd. | | 42,000 | | 172 | |
Hyflux, Ltd. | | 24,000 | | 53 | |
Jardine Cycle & Carriage, Ltd. | | 5,013 | | 76 | |
Keppel Corp., Ltd. | | 40,000 | | 361 | |
Keppel Land, Ltd. | | 14,000 | | 71 | |
K-REIT Asia REIT ‡ | | 2,600 | | 4 | |
Neptune Orient Lines, Ltd. | | 24,000 | | 65 | |
Olam International, Ltd. | | 38,000 | | 76 | |
Oversea-Chinese Banking Corp. | | 89,568 | | 516 | |
Parkway Holdings, Ltd. | | 23,000 | | 63 | |
Raffles Education Corp., Ltd. | | 6,486 | | 14 | |
SembCorp Industries, Ltd. | | 31,617 | | 127 | |
SembCorp Marine, Ltd. | | 29,400 | | 83 | |
Singapore Airlines, Ltd. | | 19,269 | | 233 | |
Singapore Exchange, Ltd. | | 27,713 | | 258 | |
Singapore Land, Ltd. | | 8,000 | | 44 | |
Singapore Post, Ltd. | | 56,000 | | 44 | |
Singapore Press Holdings, Ltd. | | 55,622 | | 174 | |
Singapore Technologies Engineering, Ltd. | | 49,184 | | 128 | |
Singapore Telecommunications, Ltd. | | 259,482 | | 721 | |
United Overseas Bank, Ltd. | | 41,219 | | 570 | |
Uol Group, Ltd. | | 22,651 | | 71 | |
Venture Corp., Ltd. | | 9,879 | | 88 | |
South Africa (0.0%) | | | | | |
Mondi, Ltd. | | 3,762 | | 36 | |
Spain (2.4%) | | | | | |
Altadis SA | | 8,105 | | 588 | |
Antena 3 de Television SA ^ | | 1,622 | | 25 | |
Banco Bilbao Vizcaya Argentaria SA | | 30,636 | | 746 | |
The notes to the financial statements are an integral part of this report.
11
| | Shares | | Value | |
Spain (continued) | | | | | |
Banco Popular Espanol SA ^ | | 8,474 | | $ | 144 | |
Banco Santander Central Hispano SA | | 53,326 | | 1,152 | |
Gamesa Corp. Tecnologica SA | | 3,180 | | 147 | |
Iberdrola SA ‡ | | 16,544 | | 251 | |
Inditex SA | | 2,351 | | 142 | |
Indra Sistemas SA | | 1,323 | | 36 | |
Repsol YPF SA | | 11,196 | | 399 | |
Telefonica SA | | 87,450 | | 2,835 | |
Sweden (2.1%) | | | | | |
Alfa Laval AB | | 300 | | 17 | |
ASSA Abloy AB Class B | | 4,627 | | 93 | |
Atlas Copco AB Class A | | 39,738 | | 591 | |
Atlas Copco AB Class B | | 6,600 | | 90 | |
Electrolux AB Series B, Class B | | 2,840 | | 47 | |
Eniro AB | | 2,049 | | 18 | |
Getinge AB Class B | | 4,049 | | 108 | |
Hennes & Mauritz AB Class B | | 4,530 | | 274 | |
Holmen AB Class B | | 850 | | 31 | |
Husqvarna AB Class B | | 2,840 | | 34 | |
Husqvarna AB Class A | | 852 | | 10 | |
Modern Times Group AB Class B | | 1,151 | | 80 | |
Nordea Bank AB | | 45,137 | | 756 | |
Sandvik AB | | 38,855 | | 666 | |
Scania AB Class B | | 5,600 | | 133 | |
Skandinaviska Enskilda Banken AB Class A | | 7,621 | | 195 | |
Skanska AB Class B | | 5,344 | | 100 | |
SKF AB | | 3,632 | | 61 | |
SSAB Svenskt Stal AB Series A, Class A | | 3,000 | | 81 | |
Svenska Cellulosa AB Class B | | 9,300 | | 164 | |
Svenska Handelsbanken AB Class A | | 12,760 | | 408 | |
Swedish Match AB | | 5,766 | | 137 | |
Tele2 AB Class B | | 1,950 | | 39 | |
Telefonaktiebolaget LM Ericsson Class B | | 321,705 | | 753 | |
TeliaSonera AB | | 23,635 | | 221 | |
Volvo AB Class A | | 7,045 | | 117 | |
Volvo AB Class B | | 15,210 | | 255 | |
Switzerland (5.7%) | | | | | |
ABB, Ltd. | | 11,600 | | 334 | |
ABB, Ltd. | | 28,850 | | 832 | |
Ciba Specialty Chemicals AG | | 1,038 | | 48 | |
Clariant AG ‡ | | 3,520 | | 33 | |
Compagnie Financiere Richemont SA Class A | | 18,945 | | 1,294 | |
Credit Suisse Group | | 8,042 | | 484 | |
Geberit AG | | 560 | | 76 | |
Givaudan SA | | 93 | | 90 | |
Holcim, Ltd. | | 4,455 | | 475 | |
Keuhne & Nagel International | | 419 | | 40 | |
Kudelski SA | | 690 | | 14 | |
Logitech International SA ‡ | | 3,894 | | 142 | |
Lonza Group AG | | 597 | | $ | 72 | |
Micronas Semiconductor Hold ‡ | | 594 | | 6 | |
Nestle SA | | 9,161 | | 4,207 | |
Nobel Biocare Holding AG | | 911 | | 243 | |
Novartis AG | | 30,706 | | 1,679 | |
Oc Oerlikon Corp. AG ‡ | | 116 | | 48 | |
Roche Holding AG | | 9,234 | | 1,596 | |
Schindler Holding AG | | 1,340 | | 86 | |
Straumann Holding AG | | 390 | | 107 | |
Swatch Group AG | | 2,122 | | 638 | |
Swatch Group AG | | 888 | | 52 | |
Swiss Reinsurance | | 7,837 | | 554 | |
Swisscom AG | | 299 | | 117 | |
Syngenta AG | | 3,101 | | 787 | |
UBS AG | | 14,392 | | 664 | |
Zurich Financial Services AG | | 1,004 | | 295 | |
Thailand (0.1%) | | | | | |
Banpu PCL ‡ | | 14,100 | | 171 | |
Turkey (1.2%) | | | | | |
Akbank TAS | | 66,756 | | 495 | |
Aksigorta AS | | 11,053 | | 65 | |
Anadolu EFES Biracilik VE Malt Sanayii As | | 15,415 | | 183 | |
Arcelik | | 8,700 | | 61 | |
Dogan Sirketler Grubu Holdings ‡ | | 35,790 | | 68 | |
Dogan Yayin Holding ‡ | | 16,620 | | 68 | |
Eregli Demir VE Celik Fabrikalari TAS | | 26,114 | | 229 | |
Ford Otomotiv Sanayi AS | | 9,863 | | 102 | |
Haci OMER Sabanci Holding As | | 31,617 | | 174 | |
KOC Holding AS ‡ | | 27,385 | | 148 | |
Migros Turk TAS | | 6,503 | | 127 | |
Trakya CAM Sanayi As | | 1 | | q | |
Tupras Turkiye Petrol Rafine | | 8,236 | | 241 | |
Turk Sise VE CAM Fabrikalari As | | 30,986 | | 62 | |
Turkcell Iletisim Hizmet AS | | 34,174 | | 373 | |
Turkiye Is Bankasi Class C | | 83,579 | | 524 | |
Turkiye Vakiflar Bankasi Tao Class D | | 50,675 | | 179 | |
Yapi VE Kredi Bankasi As ‡ | | 41,883 | | 147 | |
United Kingdom (16.4%) | | | | | |
3i Group PLC | | 6,962 | | 139 | |
Aegis Group PLC | | 10,618 | | 25 | |
AMEC PLC | | 4,244 | | 71 | |
Anglo American PLC | | 30,829 | | 1,890 | |
Arm Holdings PLC | | 24,470 | | 60 | |
Arriva PLC | | 1,921 | | 30 | |
AstraZeneca PLC | | 26,399 | | 1,137 | |
Aviva PLC | | 51,358 | | 688 | |
BAE Systems PLC | | 50,551 | | 501 | |
Balfour Beatty PLC | | 8,297 | | 82 | |
Barclays PLC | | 85,110 | | 854 | |
Barratt Developments PLC | | 2,360 | | 21 | |
BBA Aviation PLC | | 7,008 | | 29 | |
Berkeley Group Holdings PLC | | 1,109 | | 30 | |
The notes to the financial statements are an integral part of this report.
12
| | Shares | | Value | |
United Kingdom (continued) | | | | | |
BG Group PLC | | 56,375 | | $ | 1,291 | |
BHP Billiton PLC | | 49,272 | | 1,516 | |
Biffa PLC | | 7,594 | | 50 | |
BP PLC | | 279,819 | | 3,426 | |
British Airways PLC ‡ | | 8,169 | | 50 | |
British American Tobacco PLC | | 26,450 | | 1,035 | |
British Land Co. PLC REIT | | 5,848 | | 110 | |
British Sky Broadcasting Group PLC | | 25,835 | | 318 | |
BT Group PLC Class A | | 137,941 | | 749 | |
Bunzl PLC | | 6,075 | | 86 | |
Burberry Group PLC | | 12,006 | | 136 | |
Cadbury Schweppes PLC | | 25,723 | | 318 | |
Capita Group PLC | | 2,000 | | 28 | |
Carnival PLC | | 3,342 | | 148 | |
Centrica PLC | | 36,480 | | 261 | |
Close Brothers Group PLC | | 3,977 | | 75 | |
Cobham PLC | | 17,722 | | 74 | |
Compass Group PLC | | 40,407 | | 248 | |
CSR PLC ‡ | | 2,347 | | 28 | |
Daily Mail & General Trust | | 4,130 | | 41 | |
Diageo PLC | | 48,719 | | 1,047 | |
DSG International PLC | | 18,341 | | 36 | |
Electrocomponents PLC | | 8,861 | | 37 | |
EMAP PLC | | 2,876 | | 53 | |
Enterprise Inns PLC | | 13,734 | | 133 | |
Fiberweb PLC | | 2,085 | | 2 | |
FirstGroup PLC | | 6,306 | | 102 | |
Friends Provident PLC | | 38,246 | | 124 | |
GKN PLC | | 6,509 | | 37 | |
GlaxoSmithKline PLC | | 90,338 | | 2,300 | |
Group 4 Securicor PLC | | 3,563 | | 17 | |
Hammerson PLC REIT | | 3,192 | | 65 | |
Hays PLC | | 4,978 | | 11 | |
HBOS PLC | | 50,950 | | 745 | |
Home Retail Group PLC | | 7,805 | | 51 | |
HSBC Holdings PLC | | 138,026 | | 2,313 | |
ICAP PLC | | 1,517 | | 22 | |
IMI PLC | | 6,643 | | 52 | |
Imperial Chemical Industries PLC | | 15,325 | | 204 | |
Imperial Tobacco Group PLC | | 12,173 | | 657 | |
Intercontinental Hotels Group PLC | | 6,680 | | 118 | |
International Personal Finance | | 798 | | 3 | |
International Power PLC | | 4,604 | | 42 | |
Invensys PLC ‡ | | 1,777 | | 8 | |
J Sainsbury PLC | | 17,056 | | 144 | |
Johnson Matthey PLC | | 6,608 | | 247 | |
Kelda Group PLC (1) | | 6,287 | | 136 | |
KESA Electricals PLC | | 2,470 | | 11 | |
Kingfisher PLC | | 11,088 | | 32 | |
Ladbrokes PLC | | 10,893 | | 70 | |
Land Securities Group PLC REIT | | 5,236 | | 157 | |
Legal & General Group PLC | | 131,530 | | 342 | |
Liberty International PLC REIT | | 2,962 | | 64 | |
Lloyds TSB Group PLC | | 85,115 | | $ | 800 | |
LogicaCMG PLC | | 15,691 | | 37 | |
London Stock Exchange Group PLC | | 858 | | 34 | |
Man Group PLC | | 21,881 | | 248 | |
Marks & Spencer Group PLC | | 15,040 | | 168 | |
Meggitt PLC | | 7,991 | | 53 | |
Misys PLC | | 7,450 | | 27 | |
Mondi PLC | | 9,407 | | 80 | |
National Express Group PLC | | 1,908 | | 47 | |
National Grid PLC | | 46,428 | | 771 | |
Next PLC | | 2,340 | | 76 | |
Pearson PLC | | 9,935 | | 145 | |
Persimmon PLC | | 2,486 | | 40 | |
Provident Financial PLC | | 399 | | 7 | |
Prudential PLC | | 37,714 | | 535 | |
Punch Taverns PLC | | 4,892 | | 74 | |
Reckitt Benckiser Group PLC ‡ | | 14,980 | | 869 | |
Reed Elsevier PLC | | 15,707 | | 212 | |
Rentokil Initial PLC | | 5,658 | | 14 | |
Resolution PLC | | 621 | | 9 | |
Reuters Group PLC | | 18,431 | | 234 | |
Rexam PLC | | 8,365 | | 70 | |
Rio Tinto PLC | | 23,025 | | 2,437 | |
Rolls-Royce Group PLC | | 28,832 | | 313 | |
Royal Bank of Scotland Group PLC | | 130,111 | | 1,150 | |
Royal Dutch Shell PLC Class B | | 43,934 | | 1,828 | |
Sabmiller PLC | | 9,331 | | 263 | |
Sage Group PLC | | 22,155 | | 101 | |
Schroders PLC | | 2,146 | | 56 | |
Scottish & Southern Energy PLC | | 14,577 | | 475 | |
Segro PLC REIT | | 4,495 | | 42 | |
Serco Group PLC | | 1,448 | | 13 | |
Severn Trent PLC | | 4,776 | | 145 | |
Signet Group PLC | | 14,749 | | 20 | |
Smith & Nephew PLC | | 15,973 | | 184 | |
Smiths Group PLC | | 5,716 | | 115 | |
Stagecoach Group PLC | | 4,640 | | 26 | |
Tate & Lyle PLC | | 8,917 | | 79 | |
Taylor Wimpey PLC | | 11,144 | | 45 | |
Tesco PLC | | 97,818 | | 929 | |
Tomkins PLC | | 14,810 | | 52 | |
Unilever PLC | | 16,952 | | 638 | |
United Business Media PLC | | 3,359 | | 43 | |
United Utilities PLC | | 2,726 | | 41 | |
Vodafone Group PLC | | 857,729 | | 3,206 | |
Whitbread PLC | | 3,796 | | 106 | |
William Hill PLC | | 7,914 | | 83 | |
Wolseley PLC | | 9,102 | | 134 | |
WPP Group PLC | | 31,203 | | 402 | |
Xstrata PLC | | 15,582 | | 1,101 | |
Yell Group PLC | | 8,382 | | 67 | |
The notes to the financial statements are an integral part of this report.
13
| | Shares | | Value | |
United States (0.1%) | | | | | |
Synthes, Inc. | | 1,925 | | $ | 239 | |
Total Common Stocks (cost $169,175) | | | | 231,876 | |
| | | | | |
Total Securities Lending Collateral (cost $3,389) (2) | | | | 3,389 | |
| | | | | |
RIGHTS (0.0%) | | | | | |
Japan (0.0%) | | | | | |
Dowa Holdings Co Ltd. (1) | | 10,000 | | q | |
Total Rights (cost $ q) | | | | q | |
Total Investment Securities (cost $175,528) # | | | | $ | 240,370 | |
FUTURES CONTRACTS:
| | Contracts (•) | | Settlement
Date | | Amount | | Net Unrealized
Appreciation
(Depreciation) | |
| | | | | | | | | | | |
CAC40 10 Euro | | 32 | | 01/18/2008 | | $ | 1,799 | | $ | 46 | |
DAX Index | | 27 | | 03/20/2008 | | 5,498 | | 123 | |
FTSE 100 Index | | 25 | | 03/21/2008 | | 1,614 | | 84 | |
Hang Seng Index | | 29 | | 01/30/2008 | | 40,470 | | (57 | ) |
IBEX 35 Index | | 10 | | 01/31/2008 | | 1,511 | | q | |
MSCI SING IX ETS | | 17 | | 01/30/2008 | | 1,446 | | 4 | |
MSCI Taiwan Index | | 74 | | 01/30/2008 | | 106 | | 106 | |
S&P/MIB Index | | 2 | | 03/20/2008 | | 2,468 | | 8 | |
SPI 200 Index | | 19 | | 03/15/2008 | | 3,015 | | 67 | |
TOPIX Index | | (21 | ) | 03/10/2008 | | (308,700 | ) | 191 | |
| | | | | | $ | (250,773 | ) | $ | 572 | |
FORWARD FOREIGN CURRENCY CONTRACTS:
Currency | | Bought
(Sold) | | Settlement
Date | | Amount in U.S. Dollars Bought (Sold) | | Net Unrealized Appreciation
(Depreciation) | |
Australian Dollar | | 2,271 | | 03/13/2008 | | $ | 2,005 | | $ | (20 | ) |
Euro Dollar | | (26 | ) | 01/03/2008 | | (39 | ) | q | |
Euro Dollar | | 15,903 | | 03/13/2008 | | 23,069 | | 200 | |
Hong Kong Dollar | | (53,769 | ) | 03/13/2008 | | (6,918 | ) | 5 | |
Japanese Yen | | (497,308 | ) | 03/13/2008 | | (4,416 | ) | (68 | ) |
Swedish Krona | | 5,687 | | 03/13/2008 | | 889 | | (9 | ) |
United Kingdom Pound | | 3,106 | | 03/13/2008 | | 6,314 | | (143 | ) |
United Kingdom Pound | | (471 | ) | 03/13/2008 | | (932 | ) | (3 | ) |
| | | | | | $ | 19,972 | | $ | (38 | ) |
The notes to the financial statements are an integral part of this report.
14
| | Percentage of | | | |
(unaudited) | | Total Investments | | Value | |
INVESTMENTS BY INDUSTRY: | | | | | |
Commercial Banks | | 14.2 | % | $ | 34,014 | |
Oil, Gas & Consumable Fuels | | 10.1 | % | 24,268 | |
Metals & Mining | | 7.4 | % | 17,789 | |
Pharmaceuticals | | 4.5 | % | 10,805 | |
Diversified Telecommunication Services | | 3.7 | % | 8,931 | |
Insurance | | 3.5 | % | 8,499 | |
Food Products | | 3.5 | % | 8,284 | |
Chemicals | | 3.4 | % | 8,179 | |
Automobiles | | 3.2 | % | 7,577 | |
Machinery | | 2.7 | % | 6,596 | |
Wireless Telecommunication Services | | 2.6 | % | 6,318 | |
Electric Utilities | | 2.5 | % | 5,956 | |
Real Estate Management & Development | | 2.0 | % | 4,721 | |
Electrical Equipment | | 1.9 | % | 4,648 | |
Industrial Conglomerates | | 1.9 | % | 4,568 | |
Food & Staples Retailing | | 1.7 | % | 3,965 | |
Textiles, Apparel & Luxury Goods | | 1.6 | % | 3,939 | |
Household Durables | | 1.5 | % | 3,696 | |
Beverages | | 1.5 | % | 3,579 | |
Capital Markets | | 1.5 | % | 3,547 | |
Communications Equipment | | 1.4 | % | 3,430 | |
Trading Companies & Distributors | | 1.4 | % | 3,244 | |
Media | | 1.3 | % | 3,184 | |
Multi-Utilities | | 1.3 | % | 3,144 | |
Tobacco | | 1.3 | % | 3,114 | |
Electronic Equipment & Instruments | | 1.2 | % | 2,877 | |
Software | | 1.2 | % | 2,813 | |
Diversified Financial Services | | 1.0 | % | 2,415 | |
Road & Rail | | 0.9 | % | 2,131 | |
Construction & Engineering | | 0.8 | % | 1,951 | |
Hotels, Restaurants & Leisure | | 0.8 | % | 1,935 | |
Semiconductors & Semiconductor Equipment | | 0.7 | % | 1,659 | |
Real Estate Investment Trusts | | 0.6 | % | 1,547 | |
Auto Components | | 0.6 | % | 1,544 | |
Household Products | | 0.6 | % | 1,517 | |
Construction Materials | | 0.6 | % | 1,463 | |
Health Care Equipment & Supplies | | 0.6 | % | 1,454 | |
Building Products | | 0.6 | % | 1,395 | |
Aerospace & Defense | | 0.6 | % | 1,375 | |
Office Electronics | | 0.6 | % | 1,322 | |
Air Freight & Logistics | | 0.5 | % | 1,181 | |
Specialty Retail | | 0.5 | % | 1,136 | |
Computers & Peripherals | | 0.4 | % | 1,064 | |
IT Services | | 0.4 | % | 1,008 | |
Paper & Forest Products | | 0.4 | % | 982 | |
Multiline Retail | | 0.4 | % | 854 | |
Airlines | | 0.3 | % | 751 | |
Personal Products | | 0.3 | % | 733 | |
Health Care Providers & Services | | 0.3 | % | 715 | |
Commercial Services & Supplies | | 0.3 | % | 696 | |
Energy Equipment & Services | | 0.3 | % | 634 | |
| | | | | | |
The notes to the financial statements are an integral part of this report.
15
(unaudited) | | Percentage of
Total Investments | | Value | |
Transportation Infrastructure | | 0.2 | % | $ | 573 | |
Gas Utilities | | 0.2 | % | 542 | |
Marine | | 0.2 | % | 541 | |
Water Utilities | | 0.2 | % | 484 | |
Leisure Equipment & Products | | 0.2 | % | 405 | |
Containers & Packaging | | 0.1 | % | 328 | |
Independent Power Producers & Energy Traders | | 0.1 | % | 190 | |
Internet Software & Services | | 0.1 | % | 189 | |
Thrifts & Mortgage Finance | | 0.1 | % | 172 | |
Life Sciences Tools & Services | | 0.1 | % | 122 | |
Consumer Finance | | 0.0 | % | 96 | |
Biotechnology | | 0.0 | % | 77 | |
Internet & Catalog Retail | | 0.0 | % | 51 | |
Diversified Consumer Services | | 0.0 | % | 39 | |
Health Care Technology | | 0.0 | % | 25 | |
Investment Securities, at value | | 98.6 | % | 236,981 | |
Short-Term Investments | | 1.4 | % | 3,389 | |
Total Investments | | 100.0 | % | $ | 240,370 | |
NOTES TO SCHEDULE OF INVESTMENTS:
q | Value is less than $1 |
^ | At December 31, 2007, all or a portion of this security is on loan (see Note 1). The value at December 31, 2007 of all securities on loan is $3,218. |
* | Floating or variable rate note. Rate is listed as of December 31, 2007. |
‡ | Non- Income Producing |
• | Contract amounts are not in thousands. |
(1) | Fair Valued |
(2) | Cash collateral for the Repurchase Agreements, valued at $1,229, that serves as collateral for securities lending, is invested in corporate bonds with interest rates and maturity dates ranging from 3.00% - 10.18% and 04/28/2008 - 12/01/2096, respectively. |
# | Aggregate cost for federal income tax purposes is $177,451. Aggregate gross unrealized appreciation for all securities in which there is an excess of value over tax cost and aggregate gross unrealized depreciation for all securities in which there is an excess of tax cost over value were $67, 750, and $4,831, respectively. Net unrealized appreciation for tax purposes is $62,919. |
DEFINITIONS:
PLC | Public Limited Company |
REIT | Real Estate Investment Trust |
The notes to the financial statements are an integral part of this report.
16
Van Kampen Active International Allocation
STATEMENT OF ASSETS AND LIABILITIES
At December 31, 2007
(all amounts except per share amounts in thousands)
Assets: | | | |
Investment securities, at value (cost: $175,528) (including securities loaned of $3,218) | | $ | 240,370 | |
Cash | | 22,066 | |
Cash on deposit with broker | | 2,797 | |
Foreign currency (cost $1,162) | | 1,158 | |
Receivables: | | | |
Investment securities sold | | 378 | |
Shares sold | | 59 | |
Interest | | 42 | |
Income from loaned securities | | 3 | |
Dividends | | 283 | |
Dividend reclaims | | 118 | |
Variation margin | | 1,837 | |
Unrealized appreciation on forward foreign currency contracts | | 205 | |
| | 269,316 | |
Liabilities: | | | |
Accounts payable and accrued liabilities: | | | |
Shares redeemed | | 144 | |
Management and advisory fees | | 179 | |
Distribution and service fees | | 4 | |
Deferred foreign taxes | | 82 | |
Administration fees | | 5 | |
Payable for collateral for securities on loan | | 3,389 | |
Unrealized depreciation on forward foreign currency contracts | | 243 | |
Other | | 128 | |
| | 4,174 | |
Net Assets | | $ | 265,142 | |
| | | | |
Net Assets Consist of: | | | |
Capital Stock ($.01 par value) | | $ | 155 | |
Additional paid-in capital | | 168,138 | |
Undistributed (accumulated) net investment income | | 6,114 | |
Undistributed (accumulated) net realized gain from investment securities, futures and foreign currency transactions | | 25,434 | |
Net unrealized appreciation on: | | 64,760 | |
Investment securities | | | |
Futures contracts | | 572 | |
Net realized (depreciation) on translation of assets and liabilities denominated in foreign currencies | | (31 | ) |
Net Assets | | $ | 265,142 | |
Net Assets by Class: | | | |
Initial Class | | $ | 247,159 | |
Service Class | | 17,983 | |
Shares Outstanding: | | | |
Initial Class | | 14,404 | |
Service Class | | 1,050 | |
Net Asset Value and Offering Price Per Share: | | | |
Initial Class | | $ | 17.16 | |
Service Class | | 17.12 | |
STATEMENT OF OPERATIONS
For the year ended December 31, 2007
(all amounts in thousands)
Investment Income: | | | |
Dividends (net of withholding taxes on foreign dividends of $482) | | $ | 6,281 | |
Interest | | 844 | |
Income from loaned securities-net | | 130 | |
| | 7,255 | |
Expenses: | | | |
Management and advisory fees | | 2,218 | |
Printing and shareholder reports | | 53 | |
Custody fees | | 360 | |
Administration fees | | 52 | |
Legal fees | | 5 | |
Audit fees | | 24 | |
Trustees fees | | 9 | |
Distribution and service fees:
Service Class | | 39 | |
Other | | 4 | |
Total expenses | | 2,764 | |
Less management and advisory fee waiver | | (51 | ) |
Net expenses | | 2,713 | |
| | | |
Net Investment Income | | 4,542 | |
| | | | |
Net Realized Gain (Loss) from: | | | |
Investment securities (net of foreign capital gains tax of $76) | | 27,788 | |
Futures contracts | | (255 | ) |
Foreign currency transactions | | 2,555 | |
| | 30,088 | |
Net Increase (Decrease) in Unrealized Appreciation (Depreciation) on: | | | |
Investment securities (Net of foreign capital gains tax of $82) | | 2,187 | |
Futures contracts | | 90 | |
Translation of assets and liabilities denominated in foreign currencies | | (359 | ) |
| | 1,918 | |
Net Realized and Unrealized Gain: | | 32,006 | |
Net Increase In Net Assets Resulting from Operations | | $ | 36,548 | |
| | | | |
The notes to the financial statements are an integral part of this report.
17
Van Kampen Active International Allocation
STATEMENT OF CHANGES IN NET ASSETS
For the years ended
(all amounts in thousands)
| | December 31,
2007 | | December 31,
2006 | |
Increase (Decrease) in Net Assets From: | | | | | |
Operations: | | | | | |
Net investment income | | $ | 4,542 | | $ | 3,954 | |
Net realized gain from investment securities, futures contracts and foreign currency transactions | | 30,088 | | 11,641 | |
Change in unrealized appreciation on investment securities, futures contracts and foreign currency translation | | 1,918 | | 29,881 | |
| | 36,548 | | 45,476 | |
Distributions to Shareholders: | | | | | |
From net investment income: | | | | | |
Initial Class | | (6,827 | ) | (674 | ) |
Service Class | | (419 | ) | (15 | ) |
| | (7,246 | ) | (689 | ) |
Capital Share Transactions: | | | | | |
Proceeds from shares sold: | | | | | |
Initial Class | | 37,967 | | 40,730 | |
Service Class | | 8,804 | | 7,895 | |
| | 46,771 | | 48,625 | |
Dividends and distributions reinvested: | | | | | |
Initial Class | | 6,827 | | 674 | |
Service Class | | 419 | | 15 | |
| | 7,246 | | 689 | |
Cost of shares redeemed: | | | | | |
Initial Class | | (55,895 | ) | (44,930 | ) |
Service Class | | (5,067 | ) | (2,178 | ) |
| | (60,962 | ) | (47,108 | ) |
| | (6,945 | ) | 2,206 | |
Net increase (decrease) in net assets | | 22,357 | | 46,993 | |
| | | | | |
Net Assets: | | | | | |
Beginning of year | | 242,785 | | 195,792 | |
End of year | | $ | 265,142 | | $ | 242,785 | |
Undistributed (Accumulated) Net Investment Income (Loss) | | $ | 6,114 | | $ | 6,069 | |
Share Activity: | | | | | |
Shares issued: | | | | | |
Initial Class | | 2,275 | | 2,953 | |
Service Class | | 530 | | 564 | |
| | 2,805 | | 3,517 | |
Shares issued-reinvested from distributions: | | | | | |
Initial Class | | 436 | | 48 | |
Service Class | | 27 | | 1 | |
| | 463 | | 49 | |
Shares redeemed: | | | | | |
Initial Class | | (3,386 | ) | (3,287 | ) |
Service Class | | (302 | ) | (166 | ) |
| | (3,688 | ) | (3,453 | ) |
Net increase (decrease) in shares outstanding: | | | | | |
Initial Class | | (675 | ) | (286 | ) |
Service Class | | 255 | | 399 | |
| | (420 | ) | 113 | |
The notes to the financial statements are an integral part of this report.
18
Van Kampen Active International Allocation
FINANCIAL HIGHLIGHTS
For a share outstanding throughout each period(a)
| | Initial Class | |
| | Year Ended December 31, | |
| | 2007 | | 2006 | | 2005 | | 2004 | | 2003 | |
Net Asset Value | | | | | | | | | | | |
Beginning of period | | $ | 15.29 | | $ | 12.42 | | $ | 11.30 | | $ | 9.98 | | $ | 7.59 | |
Investment Operations | | | | | | | | | | | |
Net investment income (loss) | | 0.29 | | 0.25 | | 0.18 | | 0.11 | | 0.10 | |
Net realized and unrealized gain (loss) | | 2.05 | | 2.67 | | 1.34 | | 1.45 | | 2.37 | |
Total operations | | 2.34 | | 2.92 | | 1.52 | | 1.56 | | 2.47 | |
Distributions | | | | | | | | | | | |
From net investment income | | (0.47 | ) | (0.05 | ) | (0.40 | ) | (0.24 | ) | (0.08 | ) |
Total distributions | | (0.47 | ) | (0.05 | ) | (0.40 | ) | (0.24 | ) | (0.08 | ) |
Net Asset Value | | | | | | | | | | | |
End of period(b) | | $ | 17.16 | | $ | 15.29 | | $ | 12.42 | | $ | 11.30 | | $ | 9.98 | |
Total Return(c),(d) | | 15.60 | % | 23.51 | % | 13.79 | % | 16.04 | % | 32.81 | % |
Net Assets End of Period (000’s) | | $ | 247,159 | | $ | 230,638 | | $ | 190,875 | | $ | 151,185 | | $ | 187,949 | |
Ratio and Supplemental Data | | | | | | | | | | | |
Expenses to average net assets(e) | | | | | | | | | | | |
After reimbursement/fee waiver | | 1.02 | % | 0.94 | % | 0.94 | % | 0.99 | % | 0.99 | % |
Before reimbursement/fee waiver(f) | | 1.04 | % | 1.05 | % | 1.12 | % | 1.12 | % | 1.17 | % |
Net investment income (loss), to average net assets (e) | | 1.75 | % | 1.84 | % | 1.62 | % | 1.13 | % | 1.20 | % |
Portfolio turnover rate(d) | | 27 | % | 17 | % | 22 | % | 63 | % | 53 | % |
| | | | | | | | | | | |
For a share outstanding throughout each period (a) | | | | | | | | |
| | | | | | | | | | | |
| | Service Class | |
| | Year Ended December 31, | | May 1 to Dec | |
| | 2007 | | 2006 | | 2005 | | 2004 | | 31, 2003 | |
Net Asset Value | | | | | | | | | | | |
Beginning of period | | $ | 15.28 | | $ | 12.43 | | $ | 11.32 | | $ | 10.00 | | $ | 7.50 | |
Investment Operations | | | | | | | | | | | |
Net investment income (loss) | | 0.25 | | 0.21 | | 0.15 | | 0.05 | | — | |
Net realized and unrealized gain (loss) | | 2.04 | | 2.67 | | 1.36 | | 1.48 | | 2.50 | |
Total operations | | 2.29 | | 2.88 | | 1.51 | | 1.53 | | 2.50 | |
Distributions | | | | | | | | | | | |
From net investment income | | (0.45 | ) | (0.03 | ) | (0.40 | ) | (0.21 | ) | — | |
Total distributions | | (0.45 | ) | (0.03 | ) | (0.40 | ) | (0.21 | ) | — | |
Net Asset Value | | | | | | | | | | | |
End of period(b) | | $ | 17.12 | | $ | 15.28 | | $ | 12.43 | | $ | 11.32 | | $ | 10.00 | |
Total Return(c),(d) | | 15.27 | % | 23.18 | % | 13.61 | % | 15.71 | % | 33.36 | % |
Net Assets End of Period (000’s) | | $ | 17,983 | | $ | 12,147 | | $ | 4,917 | | $ | 2,293 | | $ | 116 | |
Ratio and Supplemental Data | | | | | | | | | | | |
Expenses to average net assets(e) | | | | | | | | | | | |
After reimbursement/fee waiver | | 1.27 | % | 1.19 | % | 1.19 | % | 1.24 | % | 1.24 | % |
Before reimbursement/fee waiver(f) | | 1.29 | % | 1.30 | % | 1.37 | % | 1.37 | % | 1.49 | % |
Net investment income (loss), to average net assets (e) | | 1.47 | % | 1.48 | % | 1.27 | % | 0.50 | % | 0.05 | % |
Portfolio turnover rate(d) | | 27 | % | 17 | % | 22 | % | 63 | % | 53 | % |
(a) | | Per share information is calculated based on average number of shares outstanding. |
(b) | | Van Kampen Active International Allocation (the “fund”) share class commenced operations as follows: |
| | Initial Class - April 8, 1991 |
| | Service Class - May 1, 2003 |
(c) | | Total Return reflects all portfolio expenses and includes reinvestment of dividends and capital gains; it does not reflect the charges and deductions under the policies or annuity contracts. |
(d) | | Not annualized. |
(e) | | Annualized. |
(f) | | Ratio of Total Expenses to Average Net Assets includes all expenses before fee waivers and reimbursements by the investment advisor. |
The notes to the financial statements are an integral part of this report.
19
Van Kampen Active International Allocation
NOTES TO FINANCIAL STATEMENTS
At December 31, 2007
(all amounts in thousands)
NOTE 1. ORGANIZATION AND SIGNIFICANT ACCOUNTING POLICIES
AEGON/Transamerica Series Trust (“ATST”) is an open-end management investment company registered under the Investment Company Act of 1940, as amended (the “1940 Act”). ATST serves as a funding vehicle for variable life insurance, variable annuity and group annuity products. Van Kampen Active International Allocation (the “Fund”) is part of ATST.
In the normal course of business, the Fund enters into contracts that contain a variety of representations that provide general indemnifications. The Fund’s maximum exposure under these arrangements is unknown, as this would involve future claims that may be made against the Fund and/or its affiliates that have not yet occurred. However, based on experience, the Fund expects the risk of loss to be remote.
This report should be read in conjunction with the current Fund prospectus, which contains more complete information about the Fund.
In preparing the Fund’s financial statements in accordance with accounting principles generally accepted in the United States of America (“GAAP”), estimates or assumptions (which could differ from actual results) may be used that affect reported amounts and disclosures. The following is a summary of significant accounting policies followed by the Fund.
Multiple class operations, income and expenses: The Fund currently offers two classes of shares, an Initial Class and a Service Class. Income, non-class specific expenses and realized and unrealized gains and losses, are allocated daily to each class, based upon the value of shares outstanding method as permitted under Rule 1 8f-3 of the 1940 Act. Each class bears its own specific expenses as well as a portion of general, common expenses.
Security valuations: The Fund values its investments at the close of the New York Stock Exchange (“NYSE”), normally 4 p.m. ET, each day the NYSE is open for business. Fund investments are valued at the last sale price or closing price on the day of valuation taken from the primary exchange where the security is principally traded.
Securities traded in the over-the-counter market and listed securities for which no sale was reported on that date are valued at the last quoted bid price.
Debt securities are valued based on a price quotation or other equivalent indication of value supplied by an exchange, a pricing service or a major market maker; however, those that mature in sixty days or less are valued at amortized cost, which approximates market.
Investment company securities are valued at the net asset value of the underlying portfolio.
Foreign securities generally are valued based on quotations from the primary market in which they are traded. Because many foreign securities markets and exchanges close prior to the close of the NYSE, closing prices for foreign securities in those markets or on those exchanges do not reflect the events that occur after that close. If a significant market event impacting the value of a portfolio security (e.g., natural disaster, company announcement, market volatility) occurs subsequent to the close of trading in the security, but prior to the calculation of the Fund’s net asset value per share, market quotations for that security may be determined to be unreliable and, accordingly, not “readily available.” As a result, foreign equity securities held by the Fund may be valued at fair market value as determined in good faith by the Fund’s Administrative Valuation Committee, using guidelines adopted by the Board of Trustees.
Other securities for which quotations are not readily available are valued at fair market value as determined in good faith by the Fund’s Administrative Valuation Committee, using guidelines adopted by the Board of Trustees.
Cash: The Fund may leave cash overnight in its cash account with the custodian, State Street Bank & Trust Company (“State Street”). On July 2, 2007, State Street acquired the parent company of Investors Bank & Trust Company. State Street has been contracted on behalf of the Fund to invest the excess cash into a savings account, which at December 31, 2007 was paying an interest rate of 2.60%.
Repurchase agreements: The Fund is authorized to enter into repurchase agreements. The Fund, through its custodian, State Street, receives delivery of the underlying securities, the value of which at the time of purchase is required to be an amount equal to at least 100% of the resale price. The Fund will bear the risk of value fluctuations until the security can be sold and may encounter delays and incur costs in liquidating the security. In the event of bankruptcy or insolvency of the seller, delays and costs may be incurred.
Securities lending: The Fund may lend securities to qualified borrowers, with State Street acting as the Fund’s lending agent. The Fund earns negotiated lenders’ fees. The Fund receives cash and/or securities as collateral against the loaned securities. Cash collateral received is invested in short-term, interest-bearing securities. The Fund monitors the market value of securities loaned on a daily basis and requires collateral in an amount at least equal to the value of the securities loaned. Income from loaned securities earned by State Street for its services, shown in the Statement of Operations is net of fees, in the amount of $56.
20
NOTES TO FINANCIAL STATEMENTS (continued)
At December 31, 2007
(all amounts in thousands)
NOTE 1.– (continued)
The Fund has invested the cash collateral received from securities loaned in the following short-term, interest-bearing securities:
Abbey National PLC, Eurodollar Term, 5.00%, 1/7/2008 | | $ | 146 | |
ABN AMRO Bank NV, Eurodollar Term, 5.16%, 1/4/2008 | | 117 | |
Bank of Nova Scotia, Eurodollar Term, 4.96%, 1/22/2008 | | 102 | |
Barclays, Eurodollar Term, 5.15%, 1/4/2008 | | 205 | |
BNP Paribas, Eurodollar Term, 5.20%, 1/2/2008 | | 190 | |
Calyon, Eurodollar Term, 5.12%, 3/3/2008 | | 44 | |
Credit Suisse First Boston Corp., Repurchase Agreement, 4.60%, 1/2/2008 | | 380 | |
Dexia Group, Eurodollar Term, 4.82%, 1/3/2008 | | 146 | |
HBOS Halifax Bank of Scotland, Eurodollar Term, 5.15%, 1/2/2008 | | 73 | |
JPMorgan Chase & Co., Eurodollar Term, 5.15%, 2/12/2008 | | 73 | |
Lloyds TSB Bank, Eurodollar Term, 4.75%, 1/3/2008 | | 146 | |
Merrill Lynch & Co. (RPG), Repurchase Agreement, 4.60%, 1/2/2008 | | 220 | |
Morgan Stanley & Co. (Corp. Repo), Repurchase Agreement, 4.60%, 1/2/2008 | | 600 | |
Rabobank Nederland, Eurodollar Term, 4.88%, 1/9/2008 | | 176 | |
Reserve Primary Money Market Fund, 4.95% | | 156 | |
Royal Bank of Scotland, Eurodollar Term, 5.00%, 2/25/2008 | | 176 | |
Societe Generale, Eurodollar Term, 5.15%, 3/3/2008 | | 88 | |
Toronto Dominion Bank, Eurodollar Term, 5.05 %, 1/10/2008 | | 176 | |
UBS AG, Eurodollar Term, 4.92%, 1/11/2008 | | 102 | |
Wells Fargo, Bank Note, 4.75%, 1/8/2008 | | 73 | |
| | $ | 3,389 | |
Real Estate Investment Trusts (“REITs”): There are certain additional risks involved in investing in REITs. These include, but are not limited to, economic conditions, changes in zoning laws, real estate values, property taxes and interest rates.
Dividend income is recorded at management’s estimate of the income included in distributions from the REIT investments. Distributions received in excess of the estimated amount are recorded as a reduction of the cost of investments. The actual amounts of income, return of capital and capital gains are only determined by each REIT after the fiscal year end and may differ from the estimated amounts.
Security transactions and investment income: Security transactions are recorded on the trade date. Security gains and losses are calculated on the first-in, first-out basis. Dividend income, if any, is recorded on the ex-dividend date or, in the case of foreign securities, as soon as the Fund is informed of the ex-dividend date. Interest income, including accretion of discounts and amortization of premiums, is recorded on the accrual basis commencing on the settlement date.
Foreign currency denominated investments: The accounting records of the Fund are maintained in U.S. dollars. Securities and other assets and liabilities denominated in foreign currencies are translated into U.S. dollars at the closing exchange rate each day. The cost of foreign securities is translated at the exchange rate in effect when the investment was acquired. The Fund combines fluctuations from currency exchange rates and fluctuations in value when computing net realized and unrealized gains or losses from investments.
Net foreign currency gains and losses resulting from changes in exchange rates include: 1) foreign currency fluctuations between trade date and settlement date of investment security transactions; 2) gains and losses on forward foreign currency contracts; and 3) the difference between the receivable amounts of interest and dividends recorded in the accounting records in U.S. dollars and the amounts actually received.
Foreign currency denominated assets may involve risks not typically associated with domestic transactions. These risks include revaluation of currencies, adverse fluctuations in foreign currency values and possible adverse political, social and economic developments, including those particular to a specific industry, country or region.
Foreign capital gains taxes: The Fund may be subject to taxes imposed by countries in which it invests, with respect to its investment in issuers existing or operating in such countries. Such taxes are generally based on income earned or repatriated and capital gains realized on the sale of such investments. The Fund accrues such taxes when the related income or capital gains are earned. Some countries require governmental approval for the repatriation of investment income, capital or the proceeds of sales earned by foreign investors. In addition, if there is deterioration in a country’s balance of payments or for other reasons, a country may impose temporary restrictions on foreign capital remittances abroad. The Fund’s investments in India and Thailand are subject to a governmental capital gains tax. Such taxes are due upon sale of individual securities. The Fund accrues for taxes on the capital gains throughout the holding period of the underlying securities.
Forward foreign currency contracts: The Fund may enter into forward foreign currency contracts to hedge against exchange rate risk arising from investments in securities denominated in foreign currencies. Contracts are valued at the contractual forward rate and are marked to market daily, with the change in value recorded as an unrealized gain or loss. When the contracts are settled a realized gain or loss is incurred. Risks may arise from changes in market value of the underlying currencies and from the possible inability of counterparties to meet the terms of their contracts.
Open forward foreign currency contracts at December 31, 2007 are listed in the Schedule of Investments.
Futures contracts: The Fund may enter into futures contracts to manage exposure to market, interest rate or currency fluctuations. Futures contracts are valued at the settlement price established each day by the board of trade or exchange on which they are traded. The primary risks associated with futures contracts are imperfect correlation between the change in market value of the securities held and the prices of futures contracts; the possibility of an illiquid market and inability of the counterparty to meet the contract terms.
The underlying face amount of open futures contracts at December 31, 2007 are listed on the Schedule of Investments. The variation margin receivable or payable, as applicable, is included in the Statement of Assets and Liabilities. Variation margin represents the additional payments due or excess deposits made in order to maintain the equity account at the required margin level.
21
NOTES TO FINANCIAL STATEMENTS (continued)
At December 31, 2007
(all amounts in thousands)
NOTE 1.– (continued)
Dividend distributions: Dividends and capital gains distributions are typically declared and reinvested annually and are generally paid and reinvested on the business day following the ex-date.
NOTE 2. RELATED PARTY TRANSACTIONS
ATST serves as a funding vehicle for certain affiliated asset allocation portfolios and certain affiliated separate accounts of Western Reserve Life Assurance Co. of Ohio, Transamerica Life Insurance Company, Transamerica Financial Life Insurance Company, Inc., Monumental Life Insurance Company and Transamerica Occidental Life Insurance Company.
Transamerica Fund Advisors, Inc. (“TFAI”) is the Fund’s investment adviser. Transamerica Fund Services, Inc. (“TFS”) is the Fund’s administrator and transfer agent. Prior to May 1, 2007, AFSG Securities Corp. (“AFSG”), was the Fund’s distributor. Transamerica Capital Inc. (“TCI”) is now the Fund’s distributor. TFAI, TFS, AFSG, and TCI are affiliates of AEGON NV, a Netherlands corporation.
Certain officers and trustees of the Fund are also officers and/or directors of TFAI, TFS and TCI.
Investment advisory fee: The Fund pays management fees to TFAI based on average daily net assets (“ANA”) at the following breakpoints:
0.85% of the first $250 million of ANA
0.80% of the next $750 million of ANA
0.775% of ANA over $1 billion
TFAI has contractually agreed to waive its advisory fee and will reimburse the Fund to the extent that operating expenses, excluding 12b-1 fees, exceed the following stated annual limit; effective May 1, 2007:
1.07% Expense Limit
Prior to April 30, 2007 the Fund had an annual limit of 0.94%, excluding 12b-1 fees.
If total Fund expenses fall below the annual expense limitation agreement agreed to by the adviser within the succeeding three years, the Fund may be required to pay the adviser a portion or all of the waived advisory fees.
There were no amounts recaptured during the year ended December 31, 2007. The following amounts were available for recapture at December 31, 2007:
| | Reimbursement of | | Available for | |
| | Class Expenses | | Recapture Through | |
Fiscal Year 2007: | | $ | 51 | | 12/31/2010 | |
Fiscal Year 2006: | | 233 | | 12/31/2009 | |
Fiscal Year 2005: | | 308 | | 12/31/2008 | |
| | | | | | |
Distribution and service fees: ATST entered into a Distribution Agreement with AFSG dated January 1, 1997, as amended. On May 1, 2007, the Distribution Agreement was amended to replace AFSG with TCI as the Fund’s distributor. The Fund has also adopted a distribution plan (“Distribution Plan”) pursuant to Rule 12b-1 under the 1940 Act.
Under the Distribution Plan for the Initial Class shares, TCI, on behalf of the Fund, is authorized to pay various service providers, as direct payment for expenses incurred in connection with distribution of the Fund’s shares, amounts equal to actual expenses associated with distributing the shares.
The Distribution Plan for the Service Class shares requires ATST to pay distribution fees to TCI as compensation for its activities, not as reimbursement for specific expenses. The fee on the Service Class is paid to the insurance companies for providing services and account maintenance for their policyholders who invest in the variable insurance products which invest in the Service Class shares.
The Fund is authorized under the Distribution Plan to pay fees on each class up to the following limits:
Initial Class | | 0.15 | % |
Service Class | | 0.25 | % |
TCI has determined that it will not seek payment by the Fund of the distribution expenses incurred with respect to the Initial Class shares before April 30, 2009. Prior to TCI seeking reimbursement of future expenses, policy and contract owners will be notified in advance. The Fund will pay fees relating to Service Class shares.
Administrative services: The Fund has entered into an agreement with TFS for financial and legal fund administration services. The Fund pays TFS an annual fee of 0.02% of ANA. The Legal fees on the Statement of Operations are for fees paid to external legal counsel.
22
NOTES TO FINANCIAL STATEMENTS (continued)
At December 31, 2007
(all amounts in thousands)
NOTE 2.– (continued)
Deferred compensation plan: Each eligible independent Fund Trustee may elect participation in a non-qualified deferred compensation plan (“the Plan”). Under the Plan, such Trustees may defer payment of all or a portion of their total fees earned as a Fund Trustee. Each Trustee who is a participant in the Plan may elect that the earnings, losses or gains credited to his or her deferred fee amounts be determined based on a deemed investment in any series of Transamerica IDEX Mutual Funds. The right of a participant to receive a distribution from the Plan of the deferred fees is an unsecured claim against the general assets of all series of Transamerica IDEX Mutual Funds. The pro rata liability to the Fund of all deferred fees in the Plan amounted, as of December 31, 2007, to $13. Amounts deferred under the Deferred Compensation Plan are unfunded against the general assets of ATST.
Retirement plan: Under a retirement plan (the “Emeritus Plan”) available to the Independent Trustees, each Independent Trustee is deemed to have elected to serve as Trustee Emeritus of ATST upon his or her termination of service, other than removal for cause and is entitled to 50% of the trustee’s current retainer for a maximum period of five years determined by his or her years of service as a Trustee.
Such amounts shall be accrued by ATST on a pro rata basis allocable to each series of ATST fund based on the relative assets of the series. If retainers increase in the future, past accruals (and credits) will be adjusted upward so that 50% of the Trustee’s current retainer is accrued and credited at all times. Upon death, disability or termination of service, other than removal for cause, amounts deferred become payable to an Emeritus Trustee (or his/her beneficiary). Upon the commencement of service as Trustee Emeritus, compensation will be paid on a quarterly basis during the time period that the Trustee Emeritus is allowed to serve as such.
Amounts accrued under the Emeritus Plan are unsecured claims against the general assets of ATST. For the year ended December 31, 2007, the amount related to the Emeritus Plan was $9. As of December 31, 2007, the Fund has not made any payments related to the Emeritus Plan.
The Emeritus Plan was terminated effective October 30, 2007. Upon the termination, the Fund shall continue to pay any remaining benefits in accordance with the Plan, but no further compensation shall accrue under the plan.
NOTE 3. INVESTMENT TRANSACTIONS
The cost of securities purchased and proceeds from securities sold (excluding short-term securities) for the year ended December 31, 2007 were as follows:
Purchases of securities: | | | |
Long-term | | $ | 63,159 | |
U.S. Government | | — | |
Proceeds from maturities and sales of securities: | | | |
Long-term | | 69,300 | |
U.S. Government | | — | |
| | | | |
NOTE 4. FEDERAL INCOME TAX MATTERS
The Fund has not made any provision for federal income or excise taxes due to its policy to distribute all of its taxable income and capital gains to its shareholders and otherwise qualify as a regulated investment company under Subchapter M of the Internal Revenue Code. Income and capital gain distributions are determined in accordance with income tax regulations, which may differ from GAAP. These differences are primarily due to differing treatment for items including, but not limited to, wash sales, foreign currency transactions, mark to market on derivative contracts, passive foreign investment companies and capital loss carryforwards.
Therefore, distributions determined in accordance with tax regulations may differ significantly in amount or character from net investment income and realized gains for financial reporting purposes. Financial reporting records are adjusted for permanent book/tax differences to reflect tax character. Financial records are not adjusted for temporary differences. These reclassifications are as follows:
Additional paid-in capital | | $ | 7 | |
Undistributed (accumulated) net investment income (loss) | | $ | 2,749 | |
Undistributed (accumulated) net realized gain (loss) from investment securities | | $ | (2,756 | ) |
The capital loss carryforward utilized during the year ended December 31, 2007 was $684.
The tax character of distributions paid may differ from the character of distributions shown in the Statements of Changes in Net Assets due to short-term gains being treated as ordinary income for tax purposes. The tax character of distributions paid during 2006 and 2007 was as follows:
2006 Distributions paid from: | | | |
Ordinary Income | | $ | 689 | |
Long-term Capital Gain | | — | |
| | | |
2007 Distributions paid from: | | | |
Ordinary Income | | 7,246 | |
Long-term Capital Gain | | — | |
| | | | |
The tax basis components of distributable earnings as of December 31, 2007 are as follows:
Undistributed Ordinary Income | | $ | 10,433 | |
Undistributed Long-term Capital Gain | | $ | 23,204 | |
Capital Loss Carryforward | | $ | — | |
Post October Capital Loss Deferral | | $ | — | |
Post October Currency Loss Deferral | | $ | (213 | ) |
Net Unrealized Appreciation (Depreciation) | | $ | 63,425 | |
23
NOTES TO FINANCIAL STATEMENTS (continued)
At December 31, 2007
(all amounts in thousands)
NOTE 5. REGULATORY PROCEEDINGS
There continues to be significant federal and state regulatory activity relating to financial services companies, particularly mutual fund companies and their investment advisers. As part of an ongoing investigation regarding potential market timing, recordkeeping and trading compliance issues and matters affecting the Fund’s investment adviser, TFAI, and certain affiliates and former employees of TFAI, the SEC staff has indicated that it is likely to take some action against TFAI and certain of its affiliates at the conclusion of the investigation. The potential timing and the scope of any such action is difficult to predict. Although the impact of any action brought against TFAI and/or its affiliates is difficult to assess at the present time, the Fund currently believes that the likelihood that any such action will have a material adverse impact on it is remote. It is important to note that the Fund is not aware of any allegation of wrongdoing against it and its Board at the time this annual report is printed. Although it is not anticipated that these developments will have an adverse impact on the Fund, there can be no assurance at this time. TFAI and its affiliates are actively working with the SEC in regard to this matter; however, the exact resolution cannot be determined at this time. TFAI will take such actions that it deems necessary or appropriate to continue providing management services to the Fund and to bring all matters to an appropriate conclusion.
TFAI and/or its affiliates, and not the Fund, will bear the costs regarding these regulatory matters.
NOTE 6. RECENTLY ISSUED ACCOUNTING PRONOUNCEMENTS
In July 2006, the Financial Accounting Standards Board (“FASB”) released FASB Interpretation No. 48 “Accounting for Uncertainty in Income Taxes” (“FIN 48”), an interpretation of FASB Statement No. 109. FIN 48 provides guidance for how uncertain tax positions should be recognized, measured, presented and disclosed in the financial statements. FIN 48 requires the accounting and disclosure of tax positions taken or expected to be taken in the course of preparing the Fund’s tax returns to determine whether the
tax positions are “more-likely- than-not” of being sustained by the applicable tax authority. Tax positions not deemed to meet the more-likely-than-not threshold would be recorded as a tax benefit or expense in the current year.
Adoption of FIN 48 is effective during the first required financial reporting period for fiscal years beginning after December 15, 2006. Management adopted FIN 48 on June 29, 2007.
Implementation of FIN 48 requires Management of the Fund to analyze all open tax years, as defined by the Statute of Limitations, for all major jurisdictions, which includes federal and certain states. Open tax years are those that are open for exam by taxing authorities (i.e., the last 4 tax year ends and the interim tax period since then). The Fund has no examinations in progress and none are expected at this time.
Management of the Fund has reviewed all open tax years and major jurisdictions and concluded the adoption of FIN 48 resulted in no impact to the Fund’s net assets or results of operations. There is no tax liability resulting from unrecognized tax benefits relating to uncertain income tax positions taken or expected to be taken in future tax returns. The Fund is also not aware of any tax positions for which it is reasonably possible that the total amounts of unrecognized tax benefits will significantly change in the next 12 months.
In September 2006, FASB issued its new Standard No. 157, “Fair Value Measurements” (“FAS 157”). FAS 157 is designed to unify guidance for the measurement of fair value of all types of assets, including financial instruments, and certain liabilities, throughout a number of accounting standards. FAS 157 also establishes a hierarchy for measuring fair value in generally accepted accounting principles and expands financial statement disclosures about fair value measurements that are relevant to mutual funds. FAS 157 is effective for financial statements issued for fiscal years beginning after November 15, 2007, and earlier application is permitted.
As of December 31, 2007, Management does not expect the adoption of FAS 157 to impact the amounts reported in the financial statements, however, additional disclosures will be required about the inputs used to develop the measurements of fair value and the effect of certain of the measurements reported in the statement of operations for a fiscal period.
NOTE 7. SUBSEQUENT EVENT
Effective January 1, 2008, TFAI changed its name to Transamerica Asset Management, Inc.
Effective May 1, 2008, AEGON/Transamerica Series Trust will change its name to Transamerica Series Trust. At that time, the Fund will also change its name to Transamerica Van Kampen Active International Allocation VP.
24
Report of Independent Registered Certified Public Accounting Firm
To the Board of Trustees and Shareholders of
Van Kampen Active International Allocation:
In our opinion, the accompanying statement of assets and liabilities, including the schedule of investments, and the related statements of operations and of changes in net assets and the financial highlights present fairly, in all material respects, the financial position of Van Kampen Active International Allocation (the “Fund”) (one of the portfolios constituting AEGON/Transamerica Series Trust) at December 31, 2007, the results of its operations for the year then ended, the changes in its net assets for each of the two years in the period then ended and the financial highlights for each of the periods presented, in conformity with accounting principles generally accepted in the United States of America. These financial statements and financial highlights (hereafter referred to as “financial statements”) are the responsibility of the Fund’s management; our responsibility is to express an opinion on these financial statements based on our audits. We conducted our audits of these financial statements in accordance with the standards of the Public Company Accounting Oversight Board (United States). Those standards require that we plan and perform the audit to obtain reasonable assurance about whether the financial statements are free of material misstatement. An audit includes examining, on a test basis, evidence supporting the amounts and disclosures in the financial statements, assessing the accounting principles used and significant estimates made by management, and evaluating the overall financial statement presentation. We believe that our audits, which included confirmation of securities at December 31, 2007 by correspondence with the custodian and brokers, provide a reasonable basis for our opinion.

Tampa, Florida
February 29, 2008
25
Van kampen Action International Allocation
RESULTS OF SHAREHOLDER PROXY (unaudited)
At a special meeting of shareholders held on October 30, 2007, the results of the Proposals were as follows:
Proposal 1: To elect a new Board:
Proposed
Trustee | | For | | Against | | Abstentions/Broker Non-
Votes | |
John K. Carter | | 2,274,998,840.817 | | 57,804,698.755 | | 35,433.883 | |
| | | | | | | |
Leo J. Hill | | 2,277,212,702.754 | | 55,590,836.819 | | 35,433.883 | |
| | | | | | | |
Neal M. Jewell | | 2,266,793,295.663 | | 66,010,243.909 | | 35,433.883 | |
| | | | | | | |
Russell A. Kimball, Jr. | | 2,274,825,235.835 | | 57,978,303.737 | | 35,433.883 | |
| | | | | | | |
Eugene M. Mannella | | 2,274,623,165.033 | | 58,180,374.539 | | 35,433.883 | |
| | | | | | | |
Norm R. Nielsen | | 2,275,050,055.885 | | 57,753,483.687 | | 35,433.883 | |
| | | | | | | |
Joyce Galpern Norden | | 2,270,278,122.250 | | 62,525,417.323 | | 35,433.883 | |
| | | | | | | |
Patricia L. Sawyer | | 2,275,737,737.456 | | 57,065,802.116 | | 35,433.883 | |
| | | | | | | |
John W. Waechter | | 2,276,615,120.140 | | 56,188,419.433 | | 35,433.883 | |
Proposal 2: To approve an amendment to the Agreement and Declaration of Trust:
| | | | Abstentions/Broker Non- |
For | | Against | | Votes |
2,182,022,669.110 | | 77,590,048.544 | | 73,226,255.801 |
26
Van kampen Action International Allocation
INVESTMENT ADVISORY AND SUB-ADVISORY AGREEMENTS-REVIEW AND RENEWAL (unaudited)
At a meeting of the Board of Trustees of AEGON/Transamerica Series Trust (“ATST”) held on December 4th, 2007, the Board reviewed and considered the renewal of the investment advisory agreement (the “Investment Advisory Agreement”) between Van Kampen Active International Allocation (the “Fund”) and Transamerica Fund Advisors, Inc. (“TFAI”), as well as the renewal of the investment sub-advisory agreement (the “Sub-Advisory Agreement”) of the Fund between TFAI and Morgan Stanley Investment Management, Inc. (the “Sub-Adviser”), to determine whether the agreements should be renewed for a six-month period. It was noted that this review was interim in nature to align all the Funds on the same calendar, and that the Funds’ advisory arrangements would be reviewed again in the first half of 2008.
Following their review and consideration, the Trustees determined that the renewal of the Investment Advisory Agreement and the Sub- Advisory Agreement would enable shareholders of the Fund to obtain high quality services at a cost that is appropriate, fair, and in the best interests of its shareholders. The Board, including the independent members of the Board, unanimously approved the renewal of the Investment Advisory Agreement and Sub-Advisory Agreement. In reaching their decision, the Trustees requested and obtained from TFAI and the Sub-Adviser such information as they deemed reasonably necessary to evaluate the agreements, including information about fees and performance of comparable funds managed by the Sub-Adviser. The Trustees also carefully considered information they had previously received from TFAI and the Sub-Adviser throughout the year as part of their regular oversight of the Fund, as well as comparative fee, expense, and performance information prepared by Lipper Inc. (“Lipper”), an independent provider of mutual fund performance, fee and expense information and profitability data prepared by management. In considering the proposed continuation of the Investment Advisory and Sub-Advisory Agreements, the Trustees evaluated a number of considerations that they believed, in light of the legal advice furnished to them by independent legal counsel and their own business judgment, to be relevant. They based their decisions on a variety of factors, including the following considerations, among others, although they did not identify any consideration or particular information that was controlling of their decisions:
The nature, extent and quality of the advisory services to be provided. The Board considered the nature and quality of the services provided by TFAI and the Sub-Adviser to the Fund in the past, as well as the services anticipated to be provided in the future. The Board concluded that TFAI and the Sub-Adviser are capable of providing high quality services to the Fund, as indicated by the nature and quality of services provided in the past by TFAI and the Sub-Adviser for this series and the experience, capability and integrity of TFAI’s senior management, the financial resources of TFAI and the Sub-Adviser, TFAI’s management oversight process and the professional qualifications of the portfolio management team of the Sub-Adviser. The Trustees determined that TFAI and the Sub-Adviser can provide investment and related services that are appropriate in scope and extent in light of the Fund’s operations, the competitive landscape of the investment company business and investor needs.
The investment performance of the Fund. The Board examined the short and longer-term performance of the Fund, including relative performance against a peer universe of comparable mutual funds as prepared by Lipper for various trailing periods ended June 30, 2007. The Board noted that the Fund’s performance has been approximately average as compared to its peers for the 1-,
3- and 5-year periods. On the basis of the Board’s assessment of the nature, extent and quality of advisory services to be provided or procured by TFAI and the Sub-Adviser, the Board concluded that TFAI and the Sub-Adviser are capable of providing a level of investment performance that is appropriate in light of the Fund’s proposed investment objectives, policies and strategies and competitive with other similarly situated investment companies.
The cost of advisory services provided and the level of profitability. The Board reviewed profitability information of TFAI’s cost of procuring fund management services, as well as the costs of provision of administration, fund accounting and other services, to the Fund and to ATST as a whole by TFAI and its affiliates. The Board reviewed the management and sub-advisory fees for the Fund. The Board noted the contractual fees of the Fund are in line with the Fund’s peer group and expense universe. Based on their review, the Trustees determined that the management fees of the Fund generally are appropriate in light of the services expected to be provided or procured, the management fees and the anticipated profitability of the relationship between the Fund, TFAI and its affiliates, and the Sub-Adviser. In making these observations and determinations, the Board reviewed, among other things, comparative information provided by Lipper.
Whether fee levels reflect economies of scale and the extent to which economies of scale would be realized as the Fund grows. In evaluating the extent to which the management fees payable under the Investment Advisory and Sub-Advisory Agreements reflect economies of scale or will permit economies of scale to be realized in the future, the Board noted that TFAI and the Sub-Adviser offer breakpoints which appropriately benefit investors by passing on economies of scale in the form of lower management fees as the level of assets grows. The Trustees also concluded that they will have the opportunity to periodically reexamine whether the Fund has achieved economies of scale, and the appropriateness of management fees payable to TFAI and fees paid to the Sub-Adviser, in the future.
Benefits (such as soft dollars) to TFAI, its affiliates, or the Sub-Adviser from their relationship with the Fund. The Board concluded that other benefits anticipated to be derived by TFAI, its affiliates, and the Sub-Adviser from their relationships with the Fund are expected to be reasonable and fair, and consistent with industry practice and the best interests of the Fund and its shareholders. The Trustees noted that TFAI would not realize soft dollar benefits from its relationship with the Fund. The Board also noted that the Sub- Adviser is participating in a brokerage program pursuant to which a portion of brokerage commissions paid by the Fund is recaptured for the benefit of the Fund and its shareholders, thus limiting the amount of soft dollar arrangements the Sub-Adviser may engage in with respect to the Fund’s brokerage transactions.
27
Other considerations. The Board determined that TFAI has made a substantial commitment to the recruitment and retention of high quality personnel, and maintains the financial, compliance and operational resources reasonably necessary to manage the Fund in a professional manner that is consistent with the best interests of the Fund and its shareholders. In this regard, the Trustees favorably considered the procedures and policies in place by TFAI to enforce compliance with applicable laws and regulations and oversee the portfolio management activities of the Sub-Adviser. The Trustees also determined that TFAI has made a significant entrepreneurial commitment to the management and success of the Fund, reflected by TFAI’s expense limitation and fee waiver arrangements with the Fund which may result in TFAI waiving a substantial amount of management fees for the benefit of shareholders.
28
Van Kampen Large Cap Core
MARKET ENVIRONMENT
After a positive start to the year ended December 31, 2007, the second half of the year saw equity market returns dampened by concerns about economic growth amid rising oil prices, slackening retail sales and a weakening housing market. In the third quarter, negative year-over-year corporate earnings growth fell into negative territory for the first time since 2002, giving weight to fears that an economic slowdown will begin to hurt corporate profitability. Moreover, several large financial institutions reported sizeable losses related to the mortgage related investments and other debt obligations. Although the Federal Reserve Board’s (“Fed”) policy actions did spur the market into short-term rallies at several points in the third and fourth quarters, investors worried that inflation pressures could keep the Fed from further monetary easing.
PERFORMANCE
For the year ended December 31, 2007, Van Kampen Large Cap Core, Initial Class returned 9.25%. By comparison its benchmark, the Standard and Poor’s 500 Composite Stock Index (“S&P 500”), returned 5.49%.
STRATEGY REVIEW
Growth - The growth stock portion of the portfolio is managed by the U.S. Growth Team. The team uses intensive fundamental research process to seek high-quality growth companies. The team’s investment discipline favors companies that have a sustainable competitive advantage, business visibility, rising return on invested capital, free cash flow and a favorable risk-reward profile. Because the team emphasizes secular growth, short-term market events are not as meaningful in the stock selection process.
In the twelve-month period, the portfolio’s growth component significantly outperformed the S&P 500. The sectors that most contributed to performance were technology, financial services and consumer discretionary. In the technology sector, stock selection in the communication technology and computer technology segments provided the largest positive impact on performance. A sector underweight in financial services further bolstered performance, as did selection among the diversified financial services, banking and “miscellaneous financials” segments. In the consumer discretionary sector, strong stock selection added to relative returns. The portfolio’s lack of exposure to the integrated oils sector was the largest detractor from overall performance, followed by underweight allocations in the consumer staples and producer durables sectors.
Value - The value portion of the portfolio is managed by the Multi-Cap Value Team. The team focuses on stocks with reasonable valuations relative to the team’s assessment of fair value. Their disciplined, bottom-up stock selection process combines rigorous fundamental and quantitative research that applies different measures of value to different industries. A strong contrarian element guides this investment approach, which often uncovers underappreciated or overlooked companies suffering from short-term problems or negative news. The team strives to be ahead of the curve when it comes to identifying potential opportunities and typically looks to sell into strength.
In the twelve-month period, the portfolio’s value component underperformed the benchmark S&P 500. We note that the portfolio’s sector over- and under-weights relative to the S&P 500 are a result of our bottom-up stock selection process and do not reflect deliberate top-down decisions. An underweight allocation in the energy sector was the primary detractor from relative performance. The portfolio did not own any energy stocks during the period, based on our view that valuations are too expensive for our risk-reward criteria. An overweight allocation in financials sector also dampened relative performance, as the sector was among the weakest performing groups in the S&P 500 during the period. The health care sector was another area of relative weakness. Two pharmaceutical holdings declined after the Food and Drug Administration (“FDA”) did not approve their late-stage medicinal remedies. Conversely, stock selection and a resulting overweight allocation in the consumer staples sector were chief contributors to performance during the period. Stock selection in the telecommunication services sector also added to relative performance.
Dennis P. Lynch | | Jason Leder |
David S. Cohen | | Kevin Holt |
Sam G. Chainani | | Devin E. Armstrong |
Alexander T. Norton | | James N. Warwick |
B. Robert Baker | | |
Co-Portfolio Managers
Morgan Stanley Investment Management Inc.
AEGON/Transamerica Series Trust | | Annual Report 2007 |
1
Van Kampen Large Cap Core
(unaudited)
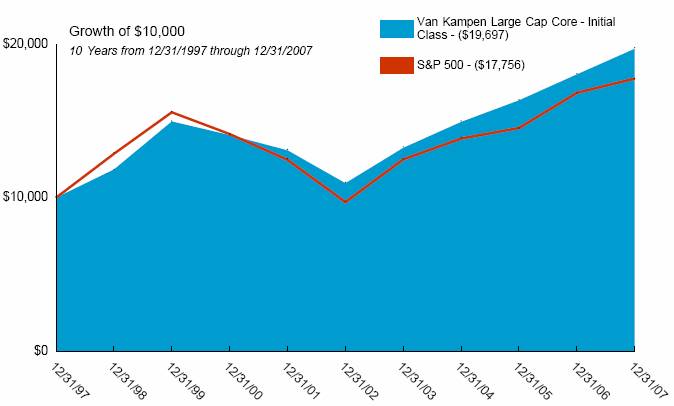
Average Annual Total Return for Periods Ended 12/31/2007
| | 1 Year | | 5 Years | | 10 Years | | From
Inception | | Inception
Date | |
| | | | | | | | | | | |
Initial Class | | 9.25 | % | 12.48 | % | 7.01 | % | 9.69 | % | 4/8/91 | |
S&P 500(1) | | 5.49 | % | 12.83 | % | 5.91 | % | 10.69 | % | 4/8/91 | |
| | | | | | | | | | | |
Service Class | | 8.94 | % | — | % | — | % | 12.17 | % | 5/1/03 | |
NOTES
(1) The Standard and Poor’s 500 Composite Stock (S&P 500) Index is an unmanaged index used as a general measure of market performance. Calculations assume dividends and capital gains are reinvested and do not include any managerial expenses. From inception calculation is based on life of Initial Class shares.
The performance data presented represents past performance, future results may vary. The portfolio’s investment return and net asset value will fluctuate. Past performance does not guarantee future results. Investor’s units when redeemed, may be worth more or less than their original cost.
Current performance may be lower or higher than performance quoted. Please visit your insurance company’s website for contract or policy level standardized total returns current to the most recent month end. Portfolio performance is net of investment fees and fund expenses, but not product charges, which, if included, would significantly lower the performance quoted.
This material must be preceded or accompanied by a current prospectus, which includes specific contents regarding the investment objectives, explanation of share classes and policies of this portfolio.
2
Van Kampen Large Cap Core
UNDERSTANDING YOUR FUND’S EXPENSES
(unaudited)
SHAREHOLDER EXPENSES
Fund shareholders may incur ongoing costs, including management and advisory fees, distribution and service fees, and other fund expenses.
The following Example is intended to help you understand your ongoing costs (in dollars and cents) of investing in the Fund and to compare these costs with the ongoing costs of investing in other funds.
The Example is based on an investment of $1,000 invested at July 1, 2007 and held for the entire period until December 31, 2007.
ACTUAL EXPENSES
The first line in the table below provides information about actual account values and actual expenses. You may use the information in this line, together with the amount you invested, to estimate the expenses that you paid over the period. Simply divide your account value by $1,000 (for example, an $8,600 account value divided by $1,000 = 8.6), then multiply the result by the number in the first line of your Fund under the heading entitled “Expenses Paid During Period” to estimate the expenses you paid on your account during this period.
HYPOTHETICAL EXAMPLE FOR COMPARISON PURPOSES
The second line in the table below provides information about hypothetical account values and hypothetical expenses based on the Fund’s actual expense ratio and an assumed rate of return of 5% per year before expenses, which is not the Fund’s actual return. The hypothetical account values and expenses may not be used to estimate the actual ending account balance or expenses you paid for the period. You may use this information to compare the ongoing costs of investing in your Fund and other funds. To do so, compare this 5% hypothetical example with the 5% hypothetical examples that appear in the shareholder reports of the other funds.
Please note that the expenses shown in the table are meant to highlight your ongoing costs only and do not reflect any transactional costs, such as sales charges, redemption fees, brokerage commissions paid on purchases and sales of fund shares. Therefore, the second line under the Fund in the table is useful in comparing ongoing costs only, and will not help you determine the relative total costs of owning different funds. If any of these transaction costs were included, your costs would be higher. The expenses shown in the table do not reflect any fees that may be charged to you by brokers, financial intermediaries or other financial institutions.
| | Beginning
Account
Value | | Ending
Account
Value | | Annualized
Expense
Ratio | | Expenses
Paid During
Period (a) | |
Initial Class | | | | | | | | | |
Actual | | $ | 1,000.00 | | $ | 1,010.49 | | 0.82 | % | $ | 4.16 | |
Hypothetical (b) | | 1,000.00 | | 1,021.07 | | 0.82 | | 4.18 | |
| | | | | | | | | |
Service Class | | | | | | | | | |
Actual | | 1,000.00 | | 1,008.89 | | 1.07 | | 5.42 | |
Hypothetical (b) | | 1,000.00 | | 1,019.76 | | 1.07 | | 5.45 | |
| | | | | | | | | | | | |
(a) Expenses are calculated using the Fund’s annualized expense ratio (as disclosed in the table), multiplied by the average account value for the period, multiplied by the number of days in the period (184 days), and divided by the number of days in the year (365 days).
(b) 5% return per year before expenses.
GRAPHICAL PRESENTATION OF SCHEDULE OF INVESTMENTS
By Sector
At December 31, 2007

This chart shows the percentage breakdown by sector of the Fund’s total investment securities.
3
Van Kampen Large Cap Core
SCHEDULE OF INVESTMENTS
At December 31, 2007
(all amounts except share amounts in thousands)
| | Shares | | Value | |
COMMON STOCKS (96.8%) | | | | | |
Air Freight & Logistics (1.6%) | | | | | |
CH Robinson Worldwide, Inc. | | 25,811 | | $ | 1,397 | |
Expeditors International Washington, Inc. | | 22,804 | | 1,019 | |
Airlines (0.3%) | | | | | |
Southwest Airlines Co. | | 40,200 | | 490 | |
Beverages (1.5%) | | | | | |
Anheuser-Busch Cos., Inc. | | 13,110 | | 686 | |
Coca-Cola Co. (The) | | 25,800 | | 1,583 | |
Capital Markets (1.3%) | | | | | |
Bear Stearns Cos., Inc. (The) ^ | | 4,000 | | 353 | |
Franklin Resources, Inc. | | 8,261 | | 945 | |
Merrill Lynch & Co., Inc. | | 14,900 | | 800 | |
Chemicals (5.5%) | | | | | |
Ei DU Pont de Nemours & Co. | | 43,200 | | 1,905 | |
Monsanto Co. | | 52,429 | | 5,856 | |
ROHM & Haas Co. | | 13,500 | | 716 | |
Commercial Banks (4.0%) | | | | | |
Bank of New York Mellon Corp. | | 29,924 | | 1,459 | |
Barclays | | 2,700 | | 109 | |
PNC Financial Services Group, Inc. | | 11,940 | | 784 | |
US Bancorp | | 14,600 | | 463 | |
Wachovia Corp. | | 52,000 | | 1,977 | |
Wells Fargo & Co. | | 45,100 | | 1,362 | |
Commercial Services & Supplies (1.6%) | | | | | |
Corporate Executive Board Co. ^ | | 17,976 | | 1,080 | |
Monster Worldwide, Inc. ‡ | | 21,426 | | 694 | |
Stericycle, Inc. ‡ | | 11,019 | | 655 | |
Communications Equipment (3.1%) | | | | | |
Alcatel-Lucent | | 5,200 | | 38 | |
Cisco Systems, Inc.‡ | | 56,816 | | 1,538 | |
Research In Motion, Ltd. ‡ | | 26,232 | | 2,975 | |
Telefonaktiebolaget LM Ericsson | | 8,000 | | 187 | |
Computers & Peripherals (2.9%) | | | | | |
Apple, Inc. ‡ | | 12,914 | | 2,558 | |
Dell, Inc. ‡ | | 29,900 | | 733 | |
Hewlett-Packard Co. | | 9,500 | | 479 | |
International Business Machines Corp. | | 7,360 | | 796 | |
Construction Materials (1.7%) | | | | | |
Cemex SAB de CV ‡ | | 58,154 | | 1,503 | |
Martin Marietta Materials, Inc. ^ | | 9,120 | | 1,210 | |
Consumer Finance (1.3%) | | | | | |
American Express Co. | | 38,833 | | 2,020 | |
Diversified Financial Services (4.8%) | | | | | |
Bank of America Corp. | | 64,100 | | 2,645 | |
Citigroup, Inc. | | 67,300 | | 1,981 | |
CME Group, Inc. Class A | | 2,396 | | 1,644 | |
JPMorgan Chase & Co. | | 26,600 | | 1,161 | |
Diversified Telecommunication Services (2.3%) | | | | | |
AT&T, Inc. | | 28,000 | | 1,164 | |
Verizon Communications, Inc. | | 54,800 | | 2,394 | |
Electronic Equipment & Instruments (0.1%) | | | | | |
Flextronics International, Ltd. ‡ | | 16,600 | | $ | 200 | |
Food & Staples Retailing (3.3%) | | | | | |
Costco Wholesale Corp. | | 17,197 | | 1,200 | |
CVS Caremark Corp. | | 36,400 | | 1,447 | |
Wal-Mart Stores, Inc. | | 51,400 | | 2,443 | |
Food Products (3.6%) | | | | | |
Cadbury Schweppes PLC | | 34,600 | | 1,708 | |
Kraft Foods, Inc. Class A | | 48,241 | | 1,574 | |
Sara Lee Corp. | | 15,800 | | 254 | |
Unilever NV | | 55,500 | | 2,024 | |
Health Care Equipment & Supplies (0.6%) | | | | | |
Boston Scientific Corp. ‡ | | 39,700 | | 462 | |
GEN-Probe, Inc. ‡ | | 7,917 | | 498 | |
Health Care Providers & Services (1.0%) | | | | | |
Cardinal Health, Inc. | | 18,200 | | 1,051 | |
UnitedHealth Group, Inc. | | 5,400 | | 314 | |
WellPoint, Inc. ‡ | | 3,000 | | 263 | |
Hotels, Restaurants & Leisure (2.8%) | | | | | |
Starbucks Corp. ‡ | | 89,089 | | 1,824 | |
Wynn Resorts, Ltd. | | 21,997 | | 2,466 | |
Household Products (1.2%) | | | | | |
Kimberly-Clark Corp. | | 17,000 | | 1,179 | |
Procter & Gamble Co. | | 10,000 | | 734 | |
Industrial Conglomerates (0.6%) | | | | | |
General Electric Co. | | 27,000 | | 1,001 | |
Insurance (6.3%) | | | | | |
Aflac, Inc. | | 6,000 | | 376 | |
American International Group, Inc. | | 13,600 | | 793 | |
Berkshire Hathaway, Inc. Class B ‡ | | 586 | | 2,775 | |
Chubb Corp. | | 35,080 | | 1,915 | |
Genworth Financial, Inc. Class A | | 10,500 | | 267 | |
Hartford Financial Services Group, Inc. | | 2,000 | | 174 | |
Loews Corp. | | 39,857 | | 2,006 | |
MBIA, Inc. ^ | | 5,000 | | 93 | |
MetLife, Inc. | | 12,700 | | 783 | |
Travelers Cos., Inc. (The) ‡ | | 11,000 | | 592 | |
Internet & Catalog Retail (3.3%) | | | | | |
Amazon.Com, Inc. ‡ | | 47,381 | | 4,389 | |
Liberty Media Corp. - Interactive Class A ‡^ | | 38,125 | | 728 | |
Internet Software & Services (8.3%) | | | | | |
Baidu.Com ‡^ | | 3,659 | | 1,428 | |
eBay, Inc. ‡ | | 99,936 | | 3,317 | |
Google, Inc. Class A ‡ | | 8,601 | | 5,947 | |
Tencent Holdings, Ltd. | | 134,000 | | 1,015 | |
Yahoo!, Inc. ‡^ | | 50,473 | | 1,174 | |
IT Services (1.2%) | | | | | |
Computer Sciences Corp. ‡ | | 5,100 | | 252 | |
Mastercard, Inc. Class A ^ | | 5,734 | | 1,234 | |
Western Union Co. (The) | | 16,100 | | 391 | |
Life Sciences Tools & Services (0.4%) | | | | | |
Illumina, Inc. ‡^ | | 10,394 | | 616 | |
The notes to the financial statements are an integral part of this report.
4
| | Shares | | Value | |
Media (5.7%) | | | | | |
Aeroplan Income Fund -144A ‡ | | 4,988 | | $ | 120 | |
Aeroplan Income Fund ^ | | 42,609 | | 1,023 | |
Comcast Corp. Class A ‡ | | 102,300 | | 1,868 | |
Liberty Media Corp. - Capital Series A, Class A ‡ | | 7,385 | | 860 | |
News Corp. Class B | | 42,700 | | 908 | |
Time Warner, Inc. | | 108,000 | | 1,783 | |
Viacom, Inc. Class B ‡^ | | 51,050 | | 2,242 | |
Metals & Mining (1.0%) | | | | | |
Alcoa, Inc. | | 15,700 | | 574 | |
Newmont Mining Corp. | | 2,600 | | 127 | |
Nucor Corp. | | 13,242 | | 784 | |
Multiline Retail (0.8%) | | | | | |
Sears Holdings Corp. ‡^ | | 11,739 | | 1,198 | |
Multi-Utilities (0.5%) | | | | | |
Veolia Environnement | | 8,396 | | 764 | |
Office Electronics (0.0%) | | | | | |
Seagate Technology, Inc. - Escrow Shares ‡, (2) | | 36,900 | | q | |
Oil, Gas & Consumable Fuels (3.3%) | | | | | |
Southwestern Energy Co. ‡ | | 20,463 | | 1,140 | |
Ultra Petroleum Corp. ‡ | | 55,729 | | 3,985 | |
Paper & Forest Products (1.9%) | | | | | |
International Paper Co. | | 90,250 | | 2,922 | |
Pharmaceuticals (7.6%) | | | | | |
Abbott Laboratories | | 24,200 | | 1,359 | |
Bristol-Myers Squibb Co. | | 103,300 | | 2,740 | |
Eli Lilly & Co. | | 23,700 | | 1,265 | |
GlaxoSmithKline PLC | | 14,600 | | 736 | |
Pfizer, Inc. | | 61,600 | | 1,400 | |
Roche Holding AG | | 4,020 | | 347 | |
Schering-Plough Corp. | | 75,500 | | 2,011 | |
Wyeth | | 43,500 | | 1,922 | |
Real Estate Management & Development (2.2%) | | | | | |
Brookfield Asset Management, | | 96,906 | | 3,457 | |
Inc. Class A ^ | | | | | |
Semiconductors & Semiconductor Equipment (0.6%) | | | | | |
Intel Corp. | | 17,600 | | $ | 469 | |
KLA-Tencor Corp. | | 5,100 | | 246 | |
Texas Instruments, Inc. | | 7,600 | | 254 | |
Software (1.1%) | | 18,000 | | 641 | |
Microsoft Corp. | | | | | |
Vmware, Inc. Class A ‡^ | | 12,435 | | 1,057 | |
Specialty Retail (1.2%) | | | | | |
Abercrombie & Fitch Co. Class A | | 17,754 | | 1,420 | |
Home Depot, Inc. | | 8,700 | | 234 | |
Lowe’s Cos., Inc. ^ | | 11,200 | | 253 | |
Textiles, Apparel & Luxury Goods (0.8%) | | | | | |
Coach, Inc. ‡ | | 39,162 | | 1,197 | |
Thrifts & Mortgage Finance (0.6%) | | | | | |
Fannie Mae | | 5,980 | | 239 | |
Freddie Mac | | 19,700 | | 671 | |
Tobacco (0.9%) | | | | | |
Altria Group, Inc. | | 17,900 | | 1,353 | |
Trading Companies & Distributors (1.0%) | | | | | |
LI & Fung, Ltd. | | 368,000 | | 1,487 | |
Transportation Infrastructure (0.7%) | | | | | |
China Merchants Holdings International Co., Ltd. | | 182,000 | | 1,132 | |
Wireless Telecommunication Services (2.3%) | | | | | |
America Movil SAB de CV Series R, Class R | | 40,134 | | 2,464 | |
China Mobile, Ltd. | | 13,019 | | 1,131 | |
Total Common Stocks (cost $126,542) | | | | 150,049 | |
| | | | | |
Total Securities Lending Collateral (cost $10,482) (3) | | | | 10,482 | |
| | | | | |
Total Investment Securities (cost $137,024) # | | | | $ | 160,531 | |
NOTES TO SCHEDULE OF INVESTMENTS:
q | | Value is less than $1. |
^ | | At December 31, 2007, all or a portion of this security is on loan (see Note 1). The value at December 31, 2007, of all securities on loan is $10,170. |
‡ | | Non-Income Producing. |
(2) | | Fair Valued |
(3) | | Cash collateral for the Repurchase Agreements, valued at $3,800, that serves as collateral for securities lending, is invested in corporate bonds with interest rates and maturity dates ranging from 3.00% - 10.18% and 04/28/2008 - 12/01/2096, respectively. |
# | | Aggregate cost for federal income tax purposes is $138,211. Aggregate gross unrealized appreciation for all securities in which there is an excess of value over tax cost and aggregate gross unrealized depreciation for all securities in which there is an excess of tax cost over value were $30,915 and $8,595, respectively. Net unrealized appreciation for tax purposes is $22,320. |
DEFINITIONS:
144A | 144A Securities are registered pursuant to Rule 144A of the Securities Act of 1933. These securities are deemed to be liquid for purposes of compliance limitations on holdings of illiquid securities and may be resold as transactions exempt from registration, normally to qualified institutional buyers. At December 31, 2007, these securities aggregated $120, or 0.08%, of net assets of the Fund. |
The notes to the financial statements are an integral part of this report.
5
Van Kampen Large Cap Core
STATEMENT OF ASSETS AND LIABILITIES | | | |
At December 31, 2007 | | | |
(all amounts except per share amounts in thousands) | | | |
| | | |
Assets: | | | |
Investment securities, at value (cost: $137,024) (including securities loaned of $10,170) | | $ | 160,531 | |
Cash | | 6,442 | |
Receivables: | | | |
Investment securities sold | | 667 | |
Interest | | 18 | |
Income from loaned securities | | 7 | |
Dividends | | 112 | |
Dividend reclaims | | 2 | |
| | 167,779 | |
Liabilities: | | | |
Investment securities purchased | | 1,790 | |
Accounts payable and accrued liabilities: | | | |
Shares redeemed | | 181 | |
Management and advisory fees | | 101 | |
Administration fees | | 3 | |
Foreign currency due to custodian | | 110 | |
Payable for collateral for securities on loan | | 10,482 | |
Other | | 42 | |
| | 12,709 | |
Net Assets | | $ | 155,070 | |
| | | |
Net Assets Consist of: | | | |
Capital Stock ($.01 par value) | | $ | 81 | |
Additional paid-in capital | | 111,746 | |
Undistributed (accumulated) net investment income | | 1,673 | |
Undistributed (accumulated) net realized gain from investment securities and foreign currency transactions | | 18,065 | |
Net unrealized appreciation on investment securities | | 23,507 | |
Net unrealized (depreciation) on translation of assets and liabilities denominated in foreign currencies | | (2 | ) |
Net Assets | | $ | 155,070 | |
Net Assets by Class: | | | |
Initial Class | | $ | 153,192 | |
Service Class | | 1,878 | |
Shares Outstanding: | | | |
Initial Class | | 8,048 | |
Service Class | | 97 | |
Net Asset Value and Offering Price Per Share: | | | |
Initial Class | | $ | 19.04 | |
Service Class | | 19.36 | |
STATEMENT OF OPERATIONS | | | |
For the year ended December 31, 2007 | | | |
(all amounts in thousands) | | | |
| | | |
Investment Income: | | | |
Dividends (net of withholding taxes on foreign dividends of $43) | | $ | 2,842 | |
Interest | | 185 | |
Income from loaned securities-net | | 51 | |
| | 3,078 | |
Expenses: | | | |
Management and advisory fees | | 1,286 | |
Printing and shareholder reports | | 16 | |
Custody fees | | 41 | |
Administration fees | | 34 | |
Legal fees | | 4 | |
Audit fees | | 21 | |
Trustees fees | | 6 | |
Distribution and service fees: | | | |
Service Class | | 4 | |
Other | | 2 | |
Total expenses | | 1,414 | |
| | | |
Net Investment Income | | 1,664 | |
| | | |
Net Realized Gain (Loss) from: | | | |
Investment securities | | 19,205 | |
Foreign currency transactions | | (3 | ) |
| | 19,202 | |
Net Increase (Decrease) in Unrealized Appreciation (Depreciation) on: | | | |
Investment securities | | (5,125 | ) |
Translation of assets and liabilities denominated in foreign currencies | | (2 | ) |
| | (5,127 | ) |
Net Realized and Unrealized Gain: | | 14,075 | |
Net Increase In Net Assets Resulting from Operations | | $ | 15,739 | |
The notes to the financial statements are an integral part of this report.
6
Van Kampen Large Cap Core
STATEMENTS OF CHANGES IN NET ASSETS
For the years ended
(all amounts in thousands)
| | December 31,
2007 | | December 31,
2006 | |
Increase (Decrease) in Net Assets From: | | | | | |
Operations: | | | | | | | |
Net investment income | | $ | 1,664 | | $ | 1,540 | |
Net realized gain from investment securities and foreign currency transactions | | 19,202 | | 9,904 | |
Change in unrealized appreciation (depreciation) on investment securities and foreign currency translation | | (5,127 | ) | 6,701 | |
| | 15,739 | | 18,145 | |
Distributions to Shareholders: | | | | | |
From net investment income: | | | | | |
Initial Class | | (1,527 | ) | (1,773 | ) |
Service Class | | (13 | ) | (10 | ) |
| | (1,540 | ) | (1,783 | ) |
From net realized gains: | | | | | |
Initial Class | | (9,655 | ) | (10,407 | ) |
Service Class | | (100 | ) | (72 | ) |
| | (9,755 | ) | (10,479 | ) |
Capital Share Transactions: | | | | | |
Proceeds from shares sold: | | | | | |
Initial Class | | 2,845 | | 2,406 | |
Service Class | | 1,026 | | 442 | |
| | 3,871 | | 2,848 | |
Dividends and distributions reinvested: | | | | | |
Initial Class | | 11,183 | | 12,180 | |
Service Class | | 113 | | 82 | |
| | 11,296 | | 12,262 | |
Cost of shares redeemed: | | | | | |
Initial Class | | (45,699 | ) | (48,100 | ) |
Service Class | | (713 | ) | (217 | ) |
| | (46,412 | ) | (48,317 | ) |
| | (31,245 | ) | (33,207 | ) |
Net increase (decrease) in net assets | | (26,801 | ) | (27,324 | ) |
| | | | | |
Net Assets: | | | | | |
Beginning of year | | 181,871 | | 209,195 | |
End of year | | $ | 155,070 | | $ | 181,871 | |
Undistributed (Accumulated) Net Investment Income (Loss) | | $ | 1,673 | | $ | 1,539 | |
Share Activity: | | | | | |
Shares issued: | | | | | |
Initial Class | | 144 | | 132 | |
Service Class | | 52 | | 24 | |
| | 196 | | 156 | |
Shares issued-reinvested from distributions: | | | | | |
Initial Class | | 604 | | 722 | |
Service Class | | 6 | | 5 | |
| | 610 | | 727 | |
Shares redeemed: | | | | | |
Initial Class | | (2,335 | ) | (2,637 | ) |
Service Class | | (36 | ) | (12 | ) |
| | (2,371 | ) | (2,649 | ) |
Net increase (decrease) in shares outstanding: | | | | | |
Initial Class | | (1,587 | ) | (1,783 | ) |
Service Class | | 22 | | 17 | |
| | (1,565 | ) | (1,766 | ) |
The notes to the financial statements are an integral part of this report.
7
Van Kampen Large Cap Core
FINANCIAL HIGHLIGHTS
For a share outstanding throughout each period(a)
| | Initial Class | |
| | Year Ended December 31, | |
| | 2007 | | 2006 | | 2005 | | 2004 | | 2003 | |
Net Asset Value | | | | | | | | | | | |
Beginning of period | | $ | 18.73 | | $ | 18.23 | | $ | 16.90 | | $ | 15.26 | | $ | 12.85 | |
Investment Operations | | | | | | | | | | | |
Net investment income (loss) | | 0.19 | | 0.15 | | 0.14 | | 0.19 | | 0.22 | |
Net realized and unrealized gain (loss) | | 1.50 | | 1.59 | | 1.43 | | 1.71 | | 2.46 | |
Total operations | | 1.69 | | 1.74 | | 1.57 | | 1.90 | | 2.68 | |
Distributions | | | | | | | | | | | |
From net investment income | | (0.19 | ) | (0.18 | ) | (0.24 | ) | (0.26 | ) | (0.27 | ) |
From net realized gains | | (1.19 | ) | (1.06 | ) | — | | — | | — | |
Total distributions | | (1.38 | ) | (1.24 | ) | (0.24 | ) | (0.26 | ) | (0.27 | ) |
Net Asset Value | | | | | | | | | | | |
End of period(b) | | $ | 19.04 | | $ | 18.73 | | $ | 18.23 | | $ | 16.90 | | $ | 15.26 | |
Total Return(c),(d) | | 9.25 | % | 10.33 | % | 9.41 | % | 12.75 | % | 21.08 | % |
Net Assets End of Period (000’s) | | $ | 153,192 | | $ | 180,443 | | $ | 208,119 | | $ | 234,150 | | $ | 246,502 | |
Ratio and Supplemental Data | | | | | | | | | | | |
Expenses to average net assets(e) | | 0.82 | % | 0.82 | % | 0.82 | % | 0.82 | % | 0.83 | % |
Net investment income (loss), to average net assets(e) | | 0.97 | % | 0.81 | % | 0.84 | % | 1.23 | % | 1.62 | % |
Portfolio turnover rate(d) | | 37 | % | 40 | % | 50 | % | 175 | % | 180 | % |
For a share outstanding throughout each period(a)
| | Service Class | | | |
| | Year Ended December 31, | | May 1 to Dec | |
| | 2007 | | 2006 | | 2005 | | 2004 | | 31, 2003 | |
Net Asset Value | | | | | | | | | | | |
Beginning of period | | $ | 19.04 | | $ | 18.52 | | $ | 17.19 | | $ | 15.51 | | $ | 13.37 | |
Investment Operations | | | | | | | | | | | |
Net investment income (loss) | | 0.15 | | 0.10 | | 0.10 | | 0.16 | | 0.13 | |
Net realized and unrealized gain (loss) | | 1.51 | | 1.63 | | 1.45 | | 1.75 | | 2.03 | |
Total operations | | 1.66 | | 1.73 | | 1.55 | | 1.91 | | 2.16 | |
Distributions | | | | | | | | | | | |
From net investment income | | (0.15 | ) | (0.15 | ) | (0.22 | ) | (0.23 | ) | (0.02 | ) |
From net realized gains | | (1.19 | ) | (1.06 | ) | — | | — | | — | |
Total distributions | | (1.34 | ) | (1.21 | ) | (0.22 | ) | (0.23 | ) | (0.02 | ) |
Net Asset Value | | | | | | | | | | | |
End of period(b) | | $ | 19.36 | | $ | 19.04 | | $ | 18.52 | | $ | 17.19 | | $ | 15.51 | |
Total Return(c),(d) | | 8.94 | % | 10.06 | % | 9.12 | % | 12.53 | % | 16.14 | % |
Net Assets End of Period (000’s) | | $ | 1,878 | | $ | 1,428 | | $ | 1,076 | | $ | 805 | | $ | 225 | |
Ratio and Supplemental Data | | | | | | | | | | | |
Expenses to average net assets(e) | | 1.07 | % | 1.07 | % | 1.07 | % | 1.07 | % | 1.08 | % |
Net investment income (loss), to average net assets(e) | | 0.74 | % | 0.55 | % | 0.59 | % | 1.03 | % | 1.31 | % |
Portfolio turnover rate(d) | | 37 | % | 40 | % | 50 | % | 175 | % | 180 | % |
(a) Per share information is calculated based on average number of shares outstanding.
(b) Van Kampen Large Cap Core (the “Fund”) share class commenced operations as follows:
Initial Class - April 8, 1991
Service Class - May 1, 2003
(c) Total Return reflects all portfolio expenses and includes reinvestment of dividends and capital gains; it does not reflect the charges and deductions under the policies or annuity contracts.
(d) Not annualized.
(e) Annualized.
The notes to the financial statements are an integral part of this report.
8
Van Kampen Large Cap Core
NOTES TO FINANCIAL STATEMENTS
At December 31, 2007
(all amounts in thousands)
NOTE 1. ORGANIZATION AND SIGNIFICANT ACCOUNTING POLICIES
AEGON/Transamerica Series Trust (“ATST”) is an open-end management investment company registered under the Investment Company Act of 1940, as amended (the “1940 Act”). ATST serves as a funding vehicle for variable life insurance, variable annuity and group annuity products. Van Kampen Large Cap Core (the “Fund”) is part of ATST.
In the normal course of business, the Fund enters into contracts that contain a variety of representations that provide general indemnifications. The Fund’s maximum exposure under these arrangements is unknown, as this would involve future claims that may be made against the Fund and/or its affiliates that have not yet occurred. However, based on experience, the Fund expects the risk of loss to be remote.
This report should be read in conjunction with the current Fund prospectus, which contains more complete information about the Fund.
In preparing the Fund’s financial statements in accordance with accounting principles generally accepted in the United States of America (“GAAP”), estimates or assumptions (which could differ from actual results) may be used that affect reported amounts and disclosures. The following is a summary of significant accounting policies followed by the Fund.
Multiple class operations, income and expenses: The Fund currently offers two classes of shares, an Initial Class and a Service Class. Income, non-class specific expenses and realized and unrealized gains and losses, are allocated daily to each class, based upon the value of shares outstanding method as permitted under Rule 1 8f-3 of the 1940 Act. Each class bears its own specific expenses as well as a portion of general, common expenses.
Security valuations: The Fund values its investments at the close of the New York Stock Exchange (“NYSE”), normally 4 p.m. ET, each day the NYSE is open for business. Fund investments are valued at the last sale price or closing price on the day of valuation taken from the primary exchange where the security is principally traded.
Securities traded in the over-the-counter market and listed securities for which no sale was reported on that date are valued at the last quoted bid price.
Debt securities are valued based on a price quotation or other equivalent indication of value supplied by an exchange, a pricing service or a major market maker; however, those that mature in sixty days or less are valued at amortized cost, which approximates market.
Investment company securities are valued at the net asset value of the underlying portfolio.
Securities for which quotations are not readily available are valued at fair market value as determined in good faith by the Fund’s Administrative Valuation Committee, using guidelines adopted by the Board of Trustees.
Cash: The Fund may leave cash overnight in its cash account with the custodian, State Street Bank & Trust Company (“State Street”). On July 2, 2007, State Street acquired the parent company of Investors Bank & Trust Company. State Street has been contracted on behalf of the Fund to invest the excess cash into a savings account, which at December 31, 2007 was paying an interest rate of 2.60%.
Repurchase agreements: The Fund is authorized to enter into repurchase agreements. The Fund, through its custodian, State Street, receives delivery of the underlying securities, the value of which at the time of purchase is required to be an amount equal to at least 100% of the resale price. The Fund will bear the risk of value fluctuations until the security can be sold and may encounter delays and incur costs in liquidating the security. In the event of bankruptcy or insolvency of the seller, delays and costs may be incurred.
Commission recapture: The sub-adviser, to the extent consistent with the best execution and usual commission rate policies and practices, may place security transactions of the Fund with broker/dealers with which ATST has established a Commission Recapture Program. A Commission Recapture Program is any arrangement under which a broker/dealer applies a portion of the commissions received by such broker/dealer on the security transactions to the Fund. In no event will commissions paid by the Fund be used to pay expenses that would otherwise be borne by any other funds within ATST, or by any other party.
Recaptured commissions during the year ended December 31, 2007 of $11 are included in net realized gains in the Statement of Operations.
Securities lending: The Fund may lend securities to qualified borrowers, with State Street acting as the Fund’s lending agent. The Fund earns negotiated lenders’ fees. The Fund receives cash and/or securities as collateral against the loaned securities. Cash collateral received is invested in short-term, interest-bearing securities. The Fund monitors the market value of securities loaned on a daily basis and requires collateral in an amount at least equal to the value of the securities loaned. Income from loaned securities earned by State Street for its services, shown in the Statement of Operations is net of fees, in the amount of $22.
9
NOTES TO FINANCIAL STATEMENTS (continued)
At December 31, 2007
(all amounts in thousands)
NOTE 1.– (continued)
The Funds have invested the cash collateral received from securities loaned in the following short-term, interest-bearing securities:
Abbey National PLC, Eurodollar Term, 5.00%, 1/7/2008 | | $ | 452 | |
ABN AMRO Bank NV, Eurodollar Term, 5.18%, 1/4/2008 | | 362 | |
Bank of Nova Scotia, Eurodollar Term, 4.96%, 1/22/2008 | | 317 | |
Barclays, Eurodollar Term, 5.00%, 2/12/2008 | | 633 | |
BNP Paribas, Eurodollar Term, 5.01%, 1/11/2008 | | 588 | |
Calyon, Eurodollar Term, 5.12%, 3/3/2008 | | 136 | |
Credit Suisse First Boston Corp., Repurchase Agreement, 4.60%, 1/2/2008 | | 1,176 | |
Dexia Group, Eurodollar Term, 4.82%, 1/3/2008 | | 453 | |
HBOS Halifax Bank of Scotland, Eurodollar Term, 5.15%, 1/2/2008 | | 226 | |
JPMorgan Chase & Co., Eurodollar Term, 5.15%, 2/12/2008 | | 226 | |
Lloyds TSB Bank, Eurodollar Term, 5.15%, 1/24/2008 | | 452 | |
Merrill Lynch & Co. (RPG), Repurchase Agreement, 4.60%, 1/2/2008 | | 679 | |
Morgan Stanley & Co. (Corp. Repo), Repurchase Agreement, 4.60%, 1/2/2008 | | 1,855 | |
Rabobank Nederland, Eurodollar Term, 5.08%, 1/10/2008 | | 543 | |
Reserve Primary Money Market Fund, 4.95% | | 483 | |
Royal Bank of Scotland, Eurodollar Term, 5.00%, 2/25/2008 | | 543 | |
Societe Generale, Eurodollar Term, 5.15%, 3/3/2008 | | 272 | |
Toronto Dominion Bank, Eurodollar Term, 5.05%, 1/10/2008 | | 543 | |
UBS AG, Eurodollar Term, 4.92%, 1/11/2008 | | 317 | |
Wells Fargo, Bank Note, 4.75%, 1/8/2008 | | 226 | |
| | | |
| | $ | 10,482 | |
Security transactions and investment income: Security transactions are recorded on the trade date. Security gains and losses are calculated on the first-in, first-out basis. Dividend income, if any, is recorded on the ex-dividend date or, in the case of foreign securities, as soon as the Fund is informed of the ex-dividend date. Interest income, including accretion of discounts and amortization of premiums, is recorded on the accrual basis commencing on the settlement date.
Dividend distributions: Dividends and capital gains distributions are typically declared and reinvested annually and are generally paid and reinvested on the business day following the ex-date.
NOTE 2. RELATED PARTY TRANSACTIONS
ATST serves as a funding vehicle for certain affiliated asset allocation portfolios and certain affiliated separate accounts of Western Reserve Life Assurance Co. of Ohio, Transamerica Life Insurance Company, Transamerica Financial Life Insurance Company, Inc., Monumental Life Insurance Company and Transamerica Occidental Life Insurance Company.
Transamerica Fund Advisors, Inc. (“TFAI”) is the Fund’s investment adviser. Transamerica Fund Services, Inc. (“TFS”) is the Fund’s administrator and transfer agent. Prior to May 1, 2007, AFSG Securities Corp. (“AFSG”), was the Fund’s distributor. Transamerica Capital Inc. (“TCI”) is now the Fund’s distributor. TFAI, TFS, AFSG and TCI are affiliates of AEGON NV, a Netherlands corporation.
Certain officers and trustees of the Fund are also officers and/or directors of TFAI, TFS and TCI.
Investment advisory fee: The Fund pays management fees to TFAI based on average daily net assets (“ANA”) at the following breakpoints:
0.75% of the first $250 million of ANA
0.70% of ANA over $250 million
TFAI has contractually agreed to waive its advisory fee and will reimburse the Fund to the extent that operating expenses, excluding 12b-1 fees, exceed the following stated annual limit:
0.84% Expense Limit
If total Fund expenses fall below the annual expense limitation agreement agreed to by the adviser within the succeeding three years, the Fund may be required to pay the adviser a portion or all of the waived advisory fees.
There were no amounts recaptured during the year ended December 31, 2007. There are no amounts available for recapture at December 31, 2007.
Distribution and service fees: ATST entered into a Distribution Agreement with AFSG dated May 1, 2007, as amended. On May 1, 2007, the Distribution Agreement was amended to replace AFSG with TCI as the Fund’s distributor. The Fund has also adopted a distribution plan (“Distribution Plan”) pursuant to Rule 12b-1 under the 1940 Act.
Under the Distribution Plan for the Initial Class shares, TCI, on behalf of the Fund, is authorized to pay various service providers, as direct payment for expenses incurred in connection with distribution of the Fund’s shares, amounts equal to actual expenses associated with distributing the shares.
The Distribution Plan for the Service Class shares requires ATST to pay distribution fees to TCI as compensation for its activities, not as reimbursement for specific expenses. The fee on the Service Class is paid to the insurance companies for providing services and account maintenance for their policyholders who invest in the variable insurance products which invest in the Service Class shares.
The Fund is authorized under the Distribution Plan to pay fees on each class up to the following limits:
Initial Class | | 0.15 | % |
Service Class | | 0.25 | % |
TCI has determined that it will not seek payment by the Fund of the distribution expenses incurred with respect to the Initial Class shares before April 30, 2009. Prior to TCI seeking reimbursement of future expenses, policy and contract owners will be notified in advance. The Fund will pay fees relating to Service Class shares.
10
NOTES TO FINANCIAL STATEMENTS (continued)
(all amounts in thousands)
At December 31, 2007
NOTE 2.– (continued)
Administrative services: The Fund has entered into an agreement with TFS for financial and legal fund administration services. The Fund pays TFS an annual fee of 0.02% of ANA. The Legal fees on the Statement of Operations are for fees paid to external legal counsel.
Brokerage commissions: Brokerage commissions incurred on security transactions placed with an affiliate of the sub-adviser for the year ended December 31, 2007 were $22.
Deferred compensation plan: Each eligible independent Fund Trustee may elect participation in a non-qualified deferred compensation plan (“the Plan”). Under the Plan, such Trustees may defer payment of all or a portion of their total fees earned as a Fund Trustee. Each Trustee who is a participant in the Plan may elect that the earnings, losses or gains credited to his or her deferred fee amounts be determined based on a deemed investment in any series of Transamerica IDEX Mutual Funds. The right of a participant to receive a distribution from the Plan of the deferred fees is an unsecured claim against the general assets of all series of Transamerica IDEX Mutual Funds. The pro rata liability to the Fund of all deferred fees in the Plan amounted, as of December 31, 2007, to $7. Amounts deferred under the Plan are unfunded against the general assets of ATST.
Retirement plan: Under a retirement plan (the “Emeritus Plan”) available to the Independent Trustees, each Independent Trustee is deemed to have elected to serve as Trustee Emeritus of ATST upon his or her termination of service, other than removal for cause, is entitled to 50% of the trustee’s current retainer for a maximum period of five years determined by his or her years of service as a Trustee.
Such amounts shall be accrued by ATST on a pro rata basis allocable to each Series of ATST based on the relative assets of the series. If retainers increase in the future, past accruals (and credits) will be adjusted upward so that 50% of the Trustee’s current retainer is accrued and credited at all times. Upon death, disability or termination of service, other than removal for cause, amounts deferred become payable to a Trustee Emeritus (or his/her beneficiary). Upon the commencement of service as Trustee Emeritus, compensation will be paid on a quarterly basis during the time period that the Trustee Emeritus is allowed to serve as such.
Amounts accrued under the Emeritus Plan are unsecured claims against the general assets of ATST. For the year ended December 31, 2007, the amount related to the Emeritus Plan was $8. As of December 31, 2007, the Fund has not made any payments related to the Emeritus Plan.
The Emeritus Plan was terminated effective October 30, 2007. Upon the termination, the Fund shall continue to pay any remaining benefits in accordance with the Plan, but no further compensation shall accrue under the Plan.
NOTE 3. INVESTMENT TRANSACTIONS
The cost of securities purchased and proceeds from securities sold (excluding short-term securities) for the year ended December 31, 2007 were as follows:
Purchases of securities: | | | |
Long-term | | $ | 61,083 | |
U.S. Government | | — | |
Proceeds from maturities and sales of securities: | | | |
Long-term | | 99,798 | |
U.S. Government | | — | |
| | | | |
NOTE 4. FEDERAL INCOME TAX MATTERS
The Fund has not made any provision for federal income or excise taxes due to its policy to distribute all of its taxable income and capital gains to its shareholders and otherwise qualify as a regulated investment company under Subchapter M of the Internal Revenue Code. Income and capital gain distributions are determined in accordance with income tax regulations, which may differ from GAAP. These differences are primarily due to differing treatment for items including, but not limited to, wash sales.
Therefore, distributions determined in accordance with tax regulations may differ significantly in amount or character from net investment income and realized gains for financial reporting purposes. Financial reporting records are adjusted for permanent book/tax differences to reflect tax character. Financial records are not adjusted for temporary differences. These reclassifications are as follows:
Additional paid-in capital | | $ | — | |
Undistributed (accumulated) net investment income (loss) | | $ | 9 | |
Undistributed (accumulated) net realized gain (loss) from investment securities | | $ | (9 | ) |
The tax character of distributions paid may differ from the character of distributions shown in the Statements of Changes in Net Assets due to short-term gains being treated as ordinary income for tax purposes. The tax character of distributions paid during 2006 and 2007 was as follows:
2006 Distributions paid from: | | | |
Ordinary Income | | $ | 3,771 | |
Long-term Capital Gain | | 8,491 | |
| | | |
2007 Distributions paid from: | | | |
Ordinary Income | | 2,684 | |
Long-term Capital Gain | | 8,611 | |
| | | | |
11
NOTES TO FINANCIAL STATEMENTS (continued)
At December 31, 2007
(all amounts in thousands)
NOTE 4.– (continued)
The tax basis components of distributable earnings as of December 31, 2007 are as follows:
Undistributed Ordinary Income | | $ | 4,610 | |
Undistributed Long-term Capital Gain | | $ | 16,334 | |
Capital Loss Carryforward | | $ | — | |
Post October Capital Loss Deferral | | $ | — | |
Post October Currency Loss Deferral | | $ | (14 | ) |
Net Unrealized Appreciation (Depreciation) | | $ | 22,313 | |
NOTE 5. REGULATORY PROCEEDINGS
There continues to be significant federal and state regulatory activity relating to financial services companies, particularly mutual fund companies and their investment advisers. As part of an ongoing investigation regarding potential market timing, recordkeeping and trading compliance issues and matters affecting the Fund’s investment adviser, TFAI, and certain affiliates and former employees of TFAI, the SEC staff has indicated that it is likely to take some action against TFAI and certain of its affiliates at the conclusion of the investigation. The potential timing and the scope of any such action is difficult to predict. Although the impact of any action brought against TFAI and/or its affiliates is difficult to assess at the present time, the Fund currently believes that the likelihood that any such action will have a material adverse impact on it is remote. It is important to note that the Fund is not aware of any allegation of wrong doing against it and its Board at the time this annual report is printed. Although it is not anticipated that these developments will have an adverse impact on the Fund, there can be no assurance at this time. TFAI and its affiliates are actively working with the SEC in regard to this matter; however, the exact resolution cannot be determined at this time. TFAI will take such actions that it deems necessary or appropriate to continue providing management services to the Fund and to bring all matters to an appropriate conclusion.
TFAI and/or its affiliates, and not the Fund, will bear the costs regarding these regulatory matters.
NOTE 6. RECENTLY ISSUED ACCOUNTING PRONOUNCEMENTS
In July 2006, the Financial Accounting Standards Board (“FASB”) released FASB Interpretation No. 48 “Accounting for Uncertainty in Income Taxes” (“FIN 48”), an interpretation of FASB Statement No. 109. FIN 48 provides guidance for how uncertain tax positions should be recognized, measured, presented and disclosed in the financial statements. FIN 48 requires the accounting and disclosure of tax positions taken or expected to be taken in the course of preparing the Fund’s tax returns to determine whether the tax positions are “more-likely- than-not” of being sustained by the applicable tax authority. Tax positions not deemed to meet the more-likely-than-not threshold would be recorded as a tax benefit or expense in the current year.
Adoption of FIN 48 is effective during the first required financial reporting period for fiscal years beginning after December 15, 2006. Management adopted FIN 48 on June 29, 2007.
Implementation of FIN 48 requires Management of the Fund to analyze all open tax years, as defined by the Statute of Limitations, for all major jurisdictions, which includes federal and certain states. Open tax years are those that are open for exam by taxing authorities (i.e., the last 4 tax year ends and the interim tax period since then). The Fund has no examinations in progress and none are expected at this time.
Management of the Fund has reviewed all open tax years and major jurisdictions and concluded the adoption of FIN 48 resulted in no impact to the Fund’s net assets or results of operations. There is no tax liability resulting from unrecognized tax benefits relating to uncertain income tax positions taken or expected to be taken in future tax returns. The Fund is also not aware of any tax positions for which it is reasonably possible that the total amounts of unrecognized tax benefits will significantly change in the next 12 months.
In September 2006, FASB issued its new Standard No. 157, “Fair Value Measurements” (“FAS 157”). FAS 157 is designed to unify guidance for the measurement of fair value of all types of assets, including financial instruments, and certain liabilities, throughout a number of accounting standards. FAS 157 also establishes a hierarchy for measuring fair value in generally accepted accounting principles and expands financial statement disclosures about fair value measurements that are relevant to mutual funds. FAS 157 is effective for financial statements issued for fiscal years beginning after November 15, 2007, and earlier application is permitted.
As of December 31, 2007, Management does not expect the adoption of FAS 157 to impact the amounts reported in the financial statements, however, additional disclosures will be required about the inputs used to develop the measurements of fair value and the effect of certain of the measurements reported in the statement of operations for a fiscal period.
NOTE 7. SUBSEQUENT EVENT
Effective January 1, 2008, TFAI changed its name to Transamerica Asset Management, Inc.
Effective May 1, 2008, AEGON/Transamerica Series Trust will change its name to Transamerica Series Trust. At that time, the Fund will also change its name to Transamerica Van Kampen Large Cap Core VP.
12
Report of Independent Registered Certified Public Accounting Firm
To the Board of Trustees and Shareholders of
Van Kampen Large Cap Core:
In our opinion, the accompanying statement of assets and liabilities, including the schedule of investments, and the related statements of operations and of changes in net assets and the financial highlights present fairly, in all material respects, the financial position of Van Kampen Large Cap Core (the “Fund”) (one of the portfolios constituting AEGON/Transamerica Series Trust) at December 31, 2007, the results of its operations for the year then ended, the changes in its net assets for each of the two years in the period then ended and the financial highlights for each of the periods presented, in conformity with accounting principles generally accepted in the United States of America. These financial statements and financial highlights (hereafter referred to as “financial statements”) are the responsibility of the Fund’s management; our responsibility is to express an opinion on these financial statements based on our audits. We conducted our audits of these financial statements in accordance with the standards of the Public Company Accounting Oversight Board (United States). Those standards require that we plan and perform the audit to obtain reasonable assurance about whether the financial statements are free of material misstatement. An audit includes examining, on a test basis, evidence supporting the amounts and disclosures in the financial statements, assessing the accounting principles used and significant estimates made by management, and evaluating the overall financial statement presentation. We believe that our audits, which included confirmation of securities at December 31, 2007 by correspondence with the custodian and brokers, provide a reasonable basis for our opinion.

Tampa, Florida
February 29, 2008
13
Van Kampen Large Cap Core
SUPPLEMENTAL TAX INFORMATION (unaudited)
(all amounts in thousands)
For tax purposes, the Fund has made a Long-Term Capital Gain Designation of $8,611 for the year ended December 31, 2007.
RESULTS OF SHAREHOLDER PROXY (unaudited)
At a special meeting of shareholders held on October 30, 2007, the results of the Proposals were as follows:
Proposal 1: To elect a new Board:
Proposed
Trustee | | For | | Against | | Abstentions/Broker Non-
Votes |
John K. Carter | | 2,274,998,840.817 | | 57,804,698.755 | | 35,433.883 |
| | | | | | |
Leo J. Hill | | 2,277,212,702.754 | | 55,590,836.819 | | 35,433.883 |
| | | | | | |
Neal M. Jewell | | 2,266,793,295.663 | | 66,010,243.909 | | 35,433.883 |
| | | | | | |
Russell A. Kimball, Jr. | | 2,274,825,235.835 | | 57,978,303.737 | | 35,433.883 |
| | | | | | |
Eugene M. Mannella | | 2,274,623,165.033 | | 58,180,374.539 | | 35,433.883 |
| | | | | | |
Norm R. Nielsen | | 2,275,050,055.885 | | 57,753,483.687 | | 35,433.883 |
| | | | | | |
Joyce Galpern Norden | | 2,270,278,122.250 | | 62,525,417.323 | | 35,433.883 |
| | | | | | |
Patricia L. Sawyer | | 2,275,737,737.456 | | 57,065,802.116 | | 35,433.883 |
| | | | | | |
John W. Waechter | | 2,276,615,120.140 | | 56,188,419.433 | | 35,433.883 |
Proposal 2: To approve an amendment to the Agreement and Declaration of Trust:
For | | Against | | Abstentions/Broker Non-
Votes |
2,182,022,669.110 | | 77,590,048.544 | | 73,226,255.801 |
14
Van Kampen Large Cap Core
INVESTMENT ADVISORY AND SUB-ADVISORY AGREEMENTS-REVIEW AND RENEWAL (unaudited)
At a meeting of the Board of Trustees of AEGON/Transamerica Series Trust (“ATST”) held on December 4th, 2007, the Board reviewed and considered the renewal of the investment advisory agreement (the “Investment Advisory Agreement”) between Van Kampen Large Cap Core (the “Fund”) and Transamerica Fund Advisors, Inc. (“TFAI”), as well as the renewal of the investment sub-advisory agreement (the “Sub-Advisory Agreement”) of the Fund between TFAI and Morgan Stanley Investment Management, Inc. (the “Sub-Adviser”), to determine whether the agreements should be renewed for a six-month period. It was noted that this review was interim in nature to align all the Funds on the same calendar, and that the Funds’ advisory arrangements would be reviewed again in the first half of 2008.
Following their review and consideration, the Trustees determined that the renewal of the Investment Advisory Agreement and the Sub-Advisory Agreement would enable shareholders of the Fund to obtain high quality services at a cost that is appropriate, fair, and in the best interests of its shareholders. The Board, including the independent members of the Board, unanimously approved the renewal of the Investment Advisory Agreement and Sub-Advisory Agreement. In reaching their decision, the Trustees requested and obtained from TFAI and the Sub-Adviser such information as they deemed reasonably necessary to evaluate the agreements, including information about fees and performance of comparable funds managed by the Sub-Adviser. The Trustees also carefully considered information they had previously received from TFAI and the Sub-Adviser throughout the year as part of their regular oversight of the Fund, as well as comparative fee, expense, and performance information prepared by Lipper Inc. (“Lipper”), an independent provider of mutual fund performance, fee and expense information and profitability data prepared by management. In considering the proposed continuation of the Investment Advisory and Sub-Advisory Agreements, the Trustees evaluated a number of considerations that they believed, in light of the legal advice furnished to them by independent legal counsel and their own business judgment, to be relevant. They based their decisions on a variety of factors, including the following considerations, among others, although they did not identify any consideration or particular information that was controlling of their decisions:
The nature, extent and quality of the advisory services to be provided. The Board considered the nature and quality of the services provided by TFAI and the Sub-Adviser to the Fund in the past, as well as the services anticipated to be provided in the future. The Board concluded that TFAI and the Sub-Adviser are capable of providing high quality services to the Fund, as indicated by the nature and quality of services provided in the past by TFAI and the Sub-Adviser for this series and the experience, capability and integrity of TFAI’s senior management, the financial resources of TFAI and the Sub-Adviser, TFAI’s management oversight process and the professional qualifications of the portfolio management team of the Sub-Adviser. The Trustees determined that TFAI and the Sub-Adviser can provide investment and related services that are appropriate in scope and extent in light of the Fund’s operations, the competitive landscape of the investment company business and investor needs.
The investment performance of the Fund. The Board examined the short and longer-term performance of the Fund, including relative performance against a peer universe of comparable mutual funds as prepared by Lipper for various trailing periods ended June 30, 2007. The Board noted that there were challenges in finding the appropriate peer group for performance comparisons, but that performance was above median compared to both peer groups. On the basis of the Board’s assessment of the nature, extent and quality of advisory services to be provided or procured by TFAI and the Sub-Adviser, the Board concluded that TFAI and the Sub-Adviser are capable of providing a level of investment performance that is appropriate in light of the Fund’s proposed investment objectives, policies and strategies and competitive with other similarly situated investment companies.
The cost of advisory services provided and the level of profitability. The Board reviewed profitability information of TFAI’s cost of procuring fund management services, as well as the costs of provision of administration, fund accounting and other services, to the Fund and to ATST as a whole by TFAI and its affiliates. The Board reviewed the management and sub-advisory fees for the Fund. The Board noted that the contractual fees are close to the expense group median and approximately in line with the expense universe median. Based on their review, the Trustees determined that the management fees of the Fund generally are appropriate in light of the services expected to be provided or procured, the management fees and the anticipated profitability of the relationship between the Fund, TFAI and its affiliates, and the Sub-Adviser. In making these observations and determinations, the Board reviewed, among other things, comparative information provided by Lipper.
Whether fee levels reflect economies of scale and the extent to which economies of scale would be realized as the Fund grows. In evaluating the extent to which the management fees payable under the Investment Advisory and Sub-Advisory Agreements reflect economies of scale or will permit economies of scale to be realized in the future, the Board noted that despite a flat fee schedule from the Sub-Adviser, TFAI offers a breakpoint which appropriately benefit investors by passing on economies of scale in the form of lower management fees as the level of assets grow. The Trustees also concluded that they will have the opportunity to periodically reexamine whether the Fund has achieved economies of scale, and the appropriateness of management fees payable to TFAI and fees paid to the Sub-Adviser, in the future.
Benefits (such as soft dollars) to TFAI, its affiliates, or the Sub-Adviser from their relationship with the Fund. The Board concluded that other benefits anticipated to be derived by TFAI, its affiliates, and the Sub-Adviser from their relationships with the Fund are expected to be reasonable and fair, and consistent with industry practice and the best interests of the Fund and its shareholders. The Trustees noted that TFAI would not realize soft dollar benefits from its relationship with the Fund. The Board also noted that the Sub-Adviser is participating in a brokerage program pursuant to which a portion of brokerage commissions paid by the Fund is recaptured for the benefit of the Fund and its shareholders, thus limiting the amount of soft dollar arrangements the Sub-Adviser may engage in with respect to the Fund’s brokerage transactions.
15
Other considerations. The Board determined that TFAI has made a substantial commitment to the recruitment and retention of high quality personnel, and maintains the financial, compliance and operational resources reasonably necessary to manage the Fund in a professional manner that is consistent with the best interests of the Fund and its shareholders. In this regard, the Trustees favorably considered the procedures and policies in place by TFAI to enforce compliance with applicable laws and regulations and oversee the portfolio management activities of the Sub-Adviser. The Trustees also determined that TFAI has made a significant entrepreneurial commitment to the management and success of the Fund, reflected by TFAI’s expense limitation and fee waiver arrangements with the Fund which may result in TFAI waiving a substantial amount of management fees for the benefit of shareholders.
16
Van Kampen Mid-Cap Growth
MARKET ENVIRONMENT
The broad equity market made a modest gain for the twelvemonth period ended December 31, 2007, despite experiencing a decline in the second half of the year as investors succumbed to the ongoing pressures caused by the deterioration of the housing and mortgage markets. In the first half of the reporting period, a generally favorable economic environment of controlled inflation, solid consumer spending and the continued healthy pace of merger and acquisition and private equity activities bolstered stock prices. Investors were cautiously optimistic that contagion from the sub-prime mortgage market (i.e., loans given to less creditworthy customers) would be contained to a relatively small portion of the overall economy, and focused their attention on large capitalization companies.
In the third quarter, however, the sub-prime mortgage market suffered a complete collapse under the weight of rising loan defaults and home foreclosures, which in turn led to the demise of several hedge funds invested in mortgage-backed securities and the bankruptcies of a number mortgage lenders. Credit significantly tightened during this period as liquidity decreased, and consumers were far more cautious in their expenditures, particularly as gasoline prices once again increased. In response to this rising volatility, the Federal Reserve Board (“Fed”) began a series of cuts to the target federal funds rate and the discount rate (the rate at which member banks borrow from the central bank). Although each announced rate reduction temporarily boosted investor sentiment, the broad market declined in the fourth quarter, reflecting investors’ concerns about the health of the financial markets in 2008.
PERFORMANCE
For the year ended December 31, 2007, Van Kampen Mid-Cap Growth, Initial Class returned 22.53%. By comparison its benchmark, the Russell Midcap Growth Index (“Russell Midcap Growth”) returned 11.43%.
STRATEGY REVIEW
The U.S. Growth Team uses intensive fundamental research to seek high-quality growth companies. The team’s investment discipline favor companies that have sustainable competitive advantages, business visibility, rising return on invested capital, free cash flow and a favorable risk/reward profile. Because the team emphasizes secular growth, short-term market events are not as meaningful in the stock selection process.
The top contributing sectors to the portfolio relative to the Russell Midcap Growth (the index against which the portfolio is actively managed) were technology, consumer discretionary and health care. An underweight allocation and stock selection in the technology sector contributed most significantly to the portfolio’s performance, and investment within the computer services software and systems segment was particularly beneficial. In the consumer discretionary sector, stock picking in the retail, education services, commercial services, consumer electronics, and communications and media areas also had a positive effect on relative returns. Additionally, the portfolio’s focus on medical and dental instruments in the health care sector was advantageous to performance.
The bottom contributing sectors were materials and processing, other energy and producer durables. Within the materials and processing sector, a modest underweight allocation together with investments in real estate companies and an engineering and contracting services firm, and a lack of exposure to the metal fabricating industry all detracted from performance. In the other energy sector, an underweight allocation and an avoidance of oil well equipment firms and coal and offshore drilling companies offset the gains made through our stock selection in crude oil producers. Finally, stock selection in the producer durables sector dampened relative returns.
At the end of the period, consumer discretionary represented the largest sector weight and overweight in the portfolio, followed by the financial services and technology sectors. The financial services and technology sectors were underweighted versus the Russell Midcap Growth.
Dennis P. Lynch
David S. Cohen
Sam G. Chainani
Alexander T. Norton
Co-Portfolio Managers
Van Kampen Asset Management
AEGON/Transamerica Series Trust | Annual Report 2007 |
1
Van Kampen Mid-Cap Growth
(unaudited)
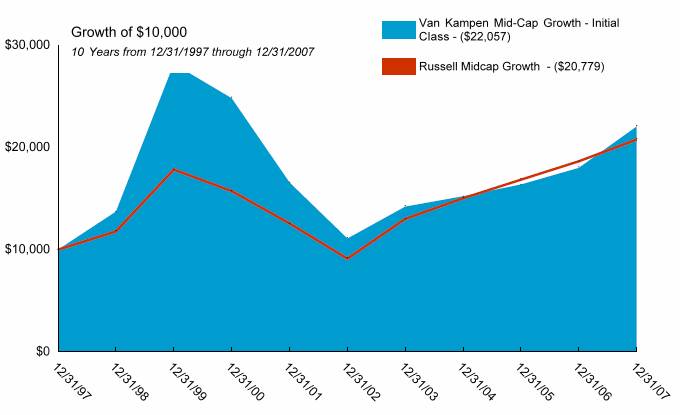
Average Annual Total Return for Periods Ended 12/31/2007
| | | | | | | | From | | Inception | |
| | 1 Year | | 5 Years | | 10 Years | | Inception | | Date | |
| | | | | | | | | | | |
Initial Class | | 22.53 | % | 14.74 | % | 8.23 | % | 12.04 | % | 3/1/93 | |
Russell Midcap Growth (1) | | 11.43 | % | 17.90 | % | 7.59 | % | 10.58 | % | 3/1/93 | |
| | | | | | | | | | | |
Service Class | | 22.24 | % | — | % | — | % | 14.05 | % | 5/1/03 | |
NOTES
(1) The Russell Midcap Growth (Russell Midcap Growth) Index is an unmanaged index used as a general measure of market performance. Calculations assume dividends and capital gains are reinvested and do not include any managerial expenses. From inception calculation is based on life of Initial Class shares.
The performance data presented represents past performance, future results may vary. The portfolio’s investment return and net asset value will fluctuate. Past performance does not guarantee future results. Investor’s units when redeemed, may be worth more or less than their original cost.
Current performance may be lower or higher than performance quoted. Please visit your insurance company’s website for contract or policy level standardized total returns current to the most recent month end. Portfolio performance is net of investment fees and fund expenses, but not product charges, which, if included, would significantly lower the performance quoted.
This material must be preceded or accompanied by a current prospectus, which includes specific contents regarding the investment objectives, explanation of share classes and policies of this portfolio.
2
Van Kampen Mid-Cap Growth
UNDERSTANDING YOUR FUND’S EXPENSES
(unaudited)
SHAREHOLDER EXPENSES
Fund shareholders may incur ongoing costs, including management and advisory fees, distribution and service fees, and other fund expenses.
The following Example is intended to help you understand your ongoing costs (in dollars and cents) of investing in the Fund and to compare these costs with the ongoing costs of investing in other funds.
The Example is based on an investment of $1,000 invested at July 1, 2007 and held for the entire period until December 31, 2007.
ACTUAL EXPENSES
The first line in the table below provides information about actual account values and actual expenses. You may use the information in this line, together with the amount you invested, to estimate the expenses that you paid over the period. Simply divide your account value by $1,000 (for example, an $8,600 account value divided by $1,000 = 8.6), then multiply the result by the number in the first line of your Fund under the heading entitled “Expenses Paid During Period” to estimate the expenses you paid on your account during this period.
HYPOTHETICAL EXAMPLE FOR COMPARISON PURPOSES
The second line in the table below provides information about hypothetical account values and hypothetical expenses based on the Fund’s actual expense ratio and an assumed rate of return of 5% per year before expenses, which is not the Fund’s actual return. The hypothetical account values and expenses may not be used to estimate the actual ending account balance or expenses you paid for the period. You may use this information to compare the ongoing costs of investing in your Fund and other funds. To do so, compare this 5% hypothetical example with the 5% hypothetical examples that appear in the shareholder reports of the other funds.
Please note that the expenses shown in the table are meant to highlight your ongoing costs only and do not reflect any transactional costs, such as sales charges, redemption fees, brokerage commissions paid on purchases and sales of fund shares. Therefore, the second line under the Fund in the table is useful in comparing ongoing costs only, and will not help you determine the relative total costs of owning different funds. If any of these transaction costs were included, your costs would be higher. The expenses shown in the table do not reflect any fees that may be charged to you by brokers, financial intermediaries or other financial institutions.
| | Beginning
Account
Value | | Ending
Account
Value | | Annualized
Expense
Ratio | | Expenses
Paid During
Period (a) | |
Initial Class | | | | | | | | | |
Actual | | $ | 1,000.00 | | $ | 1,090.80 | | 0.88 | % | $ | 4.64 | |
Hypothetical (b) | | 1,000.00 | | 1,020.77 | | 0.88 | | 4.48 | |
Service Class | | | | | | | | | |
Actual | | 1,000.00 | | 1,089.52 | | 1.13 | | 5.95 | |
Hypothetical (b) | | 1,000.00 | | 1,019.51 | | 1.13 | | 5.75 | |
| | | | | | | | | | | | |
(a) | Expenses are calculated using the Fund’s annualized expense ratio (as disclosed in the table), multiplied by the average account value for the period, multiplied by the number of days in the period (184 days), and divided by the number of days in the year (365 days). |
| |
(b) | 5% return per year before expenses. |
GRAPHICAL PRESENTATION OF SCHEDULE OF INVESTMENTS
By Sector
At December 31, 2007
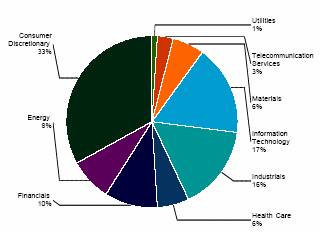
This chart shows the percentage breakdown by sector of the Fund’s total investment securities.
3
Van Kampen Mid-Cap Growth
SCHEDULE OF INVESTMENTS
At December 31, 2007
(all amounts except share amounts in thousands)
| | Shares | | Value | |
COMMON STOCKS (93.9%) | | | | | |
Air Freight & Logistics (4.1%) | | | | | |
CH Robinson Worldwide, Inc. | | 286,774 | | $ | 15,520 | |
Expeditors International Washington, Inc. ^ | | 265,113 | | 11,845 | |
Airlines (0.8%) | | | | | |
UAL Corp. ‡ | | 154,097 | | 5,495 | |
Capital Markets (2.4%) | | | | | |
Calamos Asset Management, Inc. Class A | | 323,412 | | 9,631 | |
Glg Partners, Inc. ‡^ | | 452,421 | | 6,153 | |
Chemicals (2.0%) | | | | | |
Nalco Holding Co. | | 531,935 | | 12,862 | |
Commercial Services & Supplies (7.9%) | | | | | |
ChoicePoint, Inc. ‡ | | 216,658 | | 7,891 | |
Corporate Executive Board Co. ^ | | 215,863 | | 12,973 | |
IHS, Inc. Class A ‡^ | | 135,613 | | 8,213 | |
Monster Worldwide, Inc. ‡ | | 278,566 | | 9,026 | |
Stericycle, Inc. ‡ | | 234,689 | | 13,940 | |
Construction & Engineering (0.7%) | | | | | |
Aecom Technology Corp. ‡ | | 163,943 | | 4,684 | |
Construction Materials (3.4%) | | | | | |
Martin Marietta Materials, Inc. ^ | | 120,578 | | 15,989 | |
Texas Industries, Inc. | | 87,217 | | 6,114 | |
Diversified Consumer Services (1.3%) | | | | | |
Apollo Group, Inc. Class A ‡ | | 120,812 | | 8,475 | |
Diversified Financial Services (3.9%) | | | | | |
IntercontinentalExchange, Inc. ‡ | | 76,169 | | 14,663 | |
Leucadia National Corp. ‡ | | 233,781 | | 11,011 | |
Gas Utilities (1.4%) | | | | | |
Questar Corp. | | 168,449 | | 9,113 | |
Health Care Equipment & Supplies (1.6%) | | | | | |
GEN-Probe, Inc. ‡ | | 168,634 | | 10,612 | |
Hotels, Restaurants & Leisure (10.6%) | | | | | |
Chipotle Mexican Grill, Inc. Class B ‡ | | 82,611 | | 10,165 | |
Choice Hotels International, Inc. | | 166,300 | | 5,521 | |
Ctrip.Com International, Ltd. | | 168,513 | | 9,685 | |
Marriott International, Inc. Class A | | 252,314 | | 8,624 | |
Starbucks Corp. ‡ | | 734,297 | | 15,031 | |
Wynn Resorts, Ltd. ‡ | | 186,407 | | 20,902 | |
Household Durables (1.6%) | | | | | |
Mohawk Industries, Inc. ‡^ | | 77,256 | | 5,748 | |
NVR, Inc. ‡^ | | 9,409 | | 4,930 | |
Insurance (1.1%) | | | | | |
Alleghany Corp. ‡^ | | 18,581 | | 7,470 | |
Internet & Catalog Retail (1.5%) | | | | | |
priceline.com, Inc. ‡^ | | 85,041 | | $ | 9,768 | |
Internet Software & Services (9.4%) | | | | | |
Alibaba.Com, Ltd. ‡ | | 1,274,500 | | 4,519 | |
Baidu.Com ‡^ | | 51,769 | | 20,210 | |
Equinix, Inc. ‡^ | | 118,081 | | 11,934 | |
NHN Corp. ‡ | | 41,910 | | 9,994 | |
Tencent Holdings, Ltd. | | 2,050,000 | | 15,525 | |
IT Services (3.6%) | | | | | |
Iron Mountain, Inc. ‡ | | 270,483 | | 10,013 | |
Mastercard, Inc. Class A ^ | | 63,630 | | 13,693 | |
Life Sciences Tools & Services (3.9%) | | | | | |
Illumina, Inc. ‡^ | | 230,532 | | 13,661 | |
Techne Corp. ‡ | | 185,401 | | 12,246 | |
Media (8.2%) | | | | | |
Aeroplan Income Fund ^ | | 791,678 | | 19,011 | |
Discovery Holding Co. Class A ‡ | | 389,295 | | 9,787 | |
Focus Media Holding, Ltd. ‡^ | | 133,603 | | 7,590 | |
Grupo Televisa SA | | 383,997 | | 9,127 | |
Lamar Advertising Co. Class A ^ | | 177,964 | | 8,555 | |
Oil, Gas & Consumable Fuels (7.9%) | | | | | |
Southwestern Energy Co. ‡ | | 341,884 | | 19,050 | |
Ultra Petroleum Corp. ‡ | | 467,209 | | 33,405 | |
Real Estate Management & Development (2.3%) | | | | | |
Brookfield Asset Management, Inc. Class A ^ | | 234,329 | | 8,359 | |
Forest City Enterprises, Inc. Class A | | 159,683 | | 7,096 | |
Software (2.5%) | | | | | |
Autodesk, Inc. ‡ | | 116,448 | | 5,795 | |
Salesforce.Com, Inc. ‡^ | | 165,802 | | 10,394 | |
Specialty Retail (2.7%) | | | | | |
Abercrombie & Fitch Co. Class A | | 219,093 | | 17,521 | |
Textiles, Apparel & Luxury Goods (3.0%) | | | | | |
Coach, Inc. ‡ | | 326,335 | | 9,979 | |
Lululemon Athletica, Inc. ‡^ | | 201,370 | | 9,539 | |
Trading Companies & Distributors (2.2%) | | | | | |
LI & Fung, Ltd. | | 3,576,000 | | 14,446 | |
Transportation Infrastructure (1.1%) | | | | | |
Grupo Aeroportuario del Pacifico SA de CV | | 165,579 | | 7,390 | |
Wireless Telecommunication Services (2.8%) | | | | | |
Crown Castle International Corp. ‡ | | 208,600 | | 8,678 | |
NII Holdings, Inc. ‡ | | 205,064 | | 9,908 | |
Total Common Stocks (cost $533,161) | | | | 619,479 | |
| | | | | |
Total Securities Lending Collateral (cost $140,756) (1) | | | | 140,756 | |
| | | | | |
Total Investment Securities (cost $673,917) # | | | | $ | 760,235 | |
| | | | | | | |
The notes to the financial statements are an integral part of this report.
4
NOTES TO SCHEDULE OF INVESTMENTS:
^ | | At December 31, 2007, all or a portion of this security is on loan (see Note 1). The value at December 31, 2007, of all securities on loan is $137,197. |
‡ | | Non-Income Producing. |
(1) | | Cash collateral for the Repurchase Agreements, valued at $51,022, that serves as collateral for securities lending, is invested in corporate bonds with interest rates and maturity dates ranging from 3.00% - 10.18% and 04/28/2008 - 12/01/2096, respectively. |
# | | Aggregate cost for federal income tax purposes is $681,509. Aggregate gross unrealized appreciation for all securities in which there is an excess of value over tax cost and aggregate gross unrealized depreciation for all securities in which there is an excess of tax cost over value were $105,192 and $26,466, respectively. Net unrealized appreciation for tax purposes is $78,726. |
The notes to the financial statements are an integral part of this report.
5
Van Kampen Mid-Cap Growth
STATEMENT OF ASSETS AND LIABILITIES
At December 31, 2007
(all amounts except per share amounts in thousands)
Assets: | | | |
Investment securities, at value (cost: $673,917) (including securities loaned of $137,197) | | $ | 760,235 | |
Cash | | 43,242 | |
Receivables: | | | |
Shares sold | | 118 | |
Interest | | 73 | |
Income from loaned securities | | 114 | |
Dividends | | 175 | |
| | 803,957 | |
Liabilities: | | | |
Investment securities purchased | | 2,228 | |
Accounts payable and accrued liabilities: | | | |
Shares redeemed | | 123 | |
Management and advisory fees | | 454 | |
Distribution and service fees | | 3 | |
Administration fees | | 11 | |
Payable for collateral for securities on loan | | 140,756 | |
Other | | 257 | |
| | 143,832 | |
Net Assets | | $ | 660,125 | |
| | | |
Net Assets Consist of: | | | |
Capital Stock ($.01 par value) | | $ | 256 | |
Additional paid-in capital | | 957,634 | |
Undistributed (accumulated) net investment income | | 4,495 | |
Undistributed (accumulated) net realized loss from investment securities and foreign currency transactions | | (388,578 | ) |
Net unrealized appreciation on investment securities | | 86,318 | |
Net Assets | | $ | 660,125 | |
Net Assets by Class: | | | |
Initial Class | | $ | 648,069 | |
Service Class | | 12,056 | |
Shares Outstanding: | | | |
Initial Class | | 25,089 | |
Service Class | | 472 | |
Net Asset Value and Offering Price Per Share: | | | |
Initial Class | | $ | 25.83 | |
Service Class | | 25.56 | |
STATEMENT OF OPERATIONS
For the year ended December 31, 2007
(all amounts in thousands)
Investment Income: | | | |
Dividends (net of withholding taxes on foreign dividends of $114) | | $ | 7,490 | |
Interest | | 514 | |
Income from loaned securities-net | | 670 | |
| | 8,674 | |
| | | |
Expenses: | | | |
Management and advisory fees | | 5,105 | |
Printing and shareholder reports | | 260 | |
Custody fees | | 110 | |
Administration fees | | 128 | |
Legal fees | | 13 | |
Audit fees | | 21 | |
Trustees fees | | 22 | |
Distribution and service fees: | | 23 | |
Service Class | | | |
Other | | 9 | |
Total expenses | | 5,691 | |
| | | |
Net Investment Income | | 2,983 | |
| | | |
Net Realized Gain (Loss) from: | | | |
Investment securities | | 82,566 | |
Foreign currency transactions | | 43 | |
| | 82,609 | |
| | | |
Net Increase (Decrease) in Unrealized Appreciation (Depreciation) on: | | | |
Investment securities | | 42,073 | |
Translation of assets and liabilities denominated in foreign currencies | | (1 | ) |
| | 42,072 | |
| | | |
Net Realized and Unrealized Gain: | | 124,681 | |
Net Increase In Net Assets Resulting from Operations | | $ | 127,664 | |
The notes to the financial statements are an integral part of this report.
6
Van Kampen Mid-Cap Growth
STATEMENTS OF CHANGES IN NET ASSETS
For the years ended
(all amounts in thousands)
| | December 31, | | December 31, | |
| | 2007 | | 2006 | |
Increase (Decrease) in Net Assets From: | | | | | |
Operations: | | | | | |
Net investment income | | $ | 2,983 | | $ | 1,509 | |
Net realized gain from investment securities and foreign currency transactions | | 82,609 | | 41,245 | |
Change in unrealized appreciation on investment securities and foreign currency translation | | 42,072 | | 15,076 | |
| | 127,664 | | 57,830 | |
Capital Share Transactions: | | | | | |
Proceeds from shares sold: | | | | | |
Initial Class | | 36,884 | | 31,836 | |
Service Class | | 7,159 | | 6,815 | |
| | 44,043 | | 38,651 | |
Cost of shares redeemed: | | | | | |
Initial Class | | (108,211 | ) | (138,183 | ) |
Service Class | | (3,380 | ) | (5,543 | ) |
| | (111,591 | ) | (143,726 | ) |
| | (67,548 | ) | (105,075 | ) |
Net increase (decrease) in net assets | | 60,116 | | (47,245 | ) |
| | | | | |
Net Assets: | | | | | |
Beginning of year | | 600,009 | | 647,254 | |
End of year | | $ | 660,125 | | $ | 600,009 | |
Undistributed (Accumulated) Net Investment Income (Loss) | | $ | 4,495 | | $ | 1,513 | |
Share Activity: | | | | | |
Shares issued: | | | | | |
Initial Class | | 1,546 | | 1,591 | |
Service Class | | 295 | | 350 | |
| | 1,841 | | 1,941 | |
Shares redeemed: | | | | | |
Initial Class | | (4,604 | ) | (6,937 | ) |
Service Class | | (140 | ) | (282 | ) |
| | (4,744 | ) | (7,219 | ) |
Net increase (decrease) in shares outstanding: | | | | | |
Initial Class | | (3,058 | ) | (5,346 | ) |
Service Class | | 155 | | 68 | |
| | (2,903 | ) | (5,278 | ) |
The notes to the financial statements are an integral part of this report.
7
Van Kampen Mid-Cap Growth
FINANCIAL HIGHLIGHTS
For a share outstanding throughout each period(a)
| | Initial Class | |
| | Year Ended December 31, | |
| | 2007 | | 2006 | | 2005 | | 2004 | | 2003 | |
Net Asset Value | | | | | | | | | | | |
Beginning of period | | $ | 21.08 | | $ | 19.18 | | $ | 17.85 | | $ | 16.66 | | $ | 13.00 | |
Investment Operations | | | | | | | | | | | | |
Net investment income (loss) | | 0.11 | | 0.05 | | (0.02 | ) | 0.01 | | (0.06 | ) |
Net realized and unrealized gain (loss) | | 4.64 | | 1.85 | | 1.37 | | 1.18 | | 3.72 | |
Total operations | | 4.75 | | 1.90 | | 1.35 | | 1.19 | | 3.66 | |
Distributions | | | | | | | | | | | |
From net investment income | | — | | — | | (0.02 | ) | — | | — | |
From net realized gains | | — | | — | | — | | — | | — | |
Total distributions | | — | | — | | (0.02 | ) | — | | — | |
Net Asset Value | | | | | | | | | | | |
End of period(b) | | $ | 25.83 | | $ | 21.08 | | $ | 19.18 | | $ | 17.85 | | $ | 16.66 | |
Total Return(c),(d) | | 22 .53 | % | 9 .91 | % | 7 .55 | % | 7 .14 | % | 28 .15 | % |
Net Assets End of Period (000’s) | | $ | 648,069 | | $ | 593,375 | | $ | 642,496 | | $ | 702,974 | | $ | 762,732 | |
Ratio and Supplemental Data | | | | | | | | | | | |
Expenses to average net assets(e) | | 0 .89 | % | 0 .89 | % | 0 .92 | % | 0 .89 | % | 0 .86 | % |
Net investment income (loss), to average net assets(e) | | 0 .47 | % | 0 .24 | % | (0 .13 | )% | 0 .09 | % | (0 .39 | )% |
Portfolio turnover rate(d) | | 76 | % | 65 | % | 177 | % | 170 | % | 171 | % |
For a share outstanding throughout each period(a)
| | Service Class | |
| | Year Ended December 31, | | May 1 to Dec | |
| | 2007 | | 2006 | | 2005 | | 2004 | | 31, 2003 | |
Net Asset Value | | | | | | | | | | | |
Beginning of period | | $ | 20.91 | | $ | 19.07 | | $ | 17.78 | | $ | 16.63 | | $ | 13.83 | |
Investment Operations | | | | | | | | | | | | |
Net investment income (loss) | | 0.05 | | — | (f) | (0.07 | ) | 0.01 | | (0.06 | ) |
Net realized and unrealized gain (loss) | | 4.60 | | 1.84 | | 1.36 | | 1.14 | | 2.86 | |
Total operations | | 4.65 | | 1.84 | | 1.29 | | 1.15 | | 2.80 | |
Distributions | | | | | | | | | | | |
From net investment income | | — | | — | | — | | — | | — | |
From net realized gains | | — | | — | | — | | — | | — | |
Total distributions | | — | | — | | — | | — | | — | |
Net Asset Value | | | | | | | | | | | |
End of period(b) | | $ | 25.56 | | $ | 20.91 | | $ | 19.07 | | $ | 17.78 | | $ | 16.63 | |
Total Return(c),(d) | | 22 .24 | % | 9 .59 | % | 7 .31 | % | 6 .92 | % | 20 .25 | % |
Net Assets End of Period(000’s) | | $ | 12,056 | | $ | 6,634 | | $ | 4,758 | | $ | 2,971 | | $ | 548 | |
Ratio and Supplemental Data | | | | | | | | | | | |
Expenses to average net assets(e) | | 1 .14 | % | 1 .14 | % | 1 .17 | % | 1 .15 | % | 1 .12 | % |
Net investment income (loss), to average net assets(e) | | 0 .21 | % | — | (f) | (0 .40 | )% | 0 .06 | % | (0 .61 | )% |
Portfolio turnover rate(d) | | 76 | % | 65 | % | 177 | % | 170 | % | 171 | % |
(a) | | Per share information is calculated based on average number of shares outstanding. |
(b) | | Van Kampen Mid-Cap Growth (the “Fund”) share class commenced operations as follows: |
| | Initial Class - March 1, 1993 |
| | Service Class - May 1, 2003 |
(c) | | Total Return reflects all portfolio expenses and includes reinvestment of dividends and capital gains; it does not reflect the charges and deductions under the policies or annuity contracts. |
(d) | | Not Annualized. |
(e) | | Annualized. |
(f) | | Rounds to less than $0.01 or 0.01%. |
The notes to the financial statements are an integral part of this report.
8
Van Kampen Mid-Cap Growth
NOTES TO FINANCIAL STATEMENTS
At December 31, 2007
(all amounts in thousands)
NOTE 1. ORGANIZATION AND SIGNIFICANT ACCOUNTING POLICIES
AEGON/Transamerica Series Trust (“ATST”) is an open-end management investment company registered under the Investment Company Act of 1940, as amended (the “1940 Act”). ATST serves as a funding vehicle for variable life insurance, variable annuity and group annuity products. Van Kampen Mid- Cap Growth (the “Fund”) is part of ATST.
In the normal course of business, the Fund enters into contracts that contain a variety of representations that provide general indemnifications. The Fund’s maximum exposure under these arrangements is unknown, as this would involve future claims that may be made against the Fund and/or its affiliates that have not yet occurred. However, based on experience, the Fund expects the risk of loss to be remote.
This report should be read in conjunction with the current Fund prospectus, which contains more complete information about the Fund.
In preparing the Fund’s financial statements in accordance with accounting principles generally accepted in the United States of America (“GAAP”), estimates or assumptions (which could differ from actual results) may be used that affect reported amounts and disclosures. The following is a summary of significant accounting policies followed by the Fund.
Multiple class operations, income and expenses: The Fund currently offers two classes of shares, an Initial Class and a Service Class. Income, non-class specific expenses and realized and unrealized gains and losses, are allocated daily to each class, based upon the value of shares outstanding method as permitted under Rule 1 8f-3 of the 1940 Act. Each class bears its own specific expenses as well as a portion of general, common expenses.
Security valuations: The Fund values its investments at the close of the New York Stock Exchange (“NYSE”), normally 4 p.m. ET, each day the NYSE is open for business. Fund investments are valued at the last sale price or closing price on the day of valuation taken from the primary exchange where the security is principally traded.
Securities traded in the over-the-counter market and listed securities for which no sale was reported on that date are valued at the last quoted bid price.
Debt securities are valued based on a price quotation or other equivalent indication of value supplied by an exchange, a pricing service or a major market maker; however, those that mature in sixty days or less are valued at amortized cost, which approximates market.
Investment company securities are valued at the net asset value of the underlying portfolio.
Securities for which quotations are not readily available are valued at fair market value as determined in good faith by the Fund’s Administrative Valuation Committee, using guidelines adopted by the Board of Trustees.
Cash: The Fund may leave cash overnight in its cash account with the custodian, State Street Bank & Trust Company (“State Street”). On July 2, 2007, State Street acquired the parent company of Investors Bank & Trust Company. State Street has been contracted on behalf of the Fund to invest the excess cash into a savings account, which at December 31, 2007 was paying an interest rate of 2.60%.
Repurchase agreements: The Fund is authorized to enter into repurchase agreements. The Fund, through its custodian, State Street, receives delivery of the underlying securities, the value of which at the time of purchase is required to be an amount equal to at least 100% of the resale price. The Fund will bear the risk of value fluctuations until the security can be sold and may encounter delays and incur costs in liquidating the security. In the event of bankruptcy or insolvency of the seller, delays and costs may be incurred.
Commission recapture: The sub-adviser, to the extent consistent with the best execution and usual commission rate policies and practices, may place security transactions of the Fund with broker/dealers with which ATST has established a Commission Recapture Program. A Commission Recapture Program is any arrangement under which a broker/dealer applies a portion of the commissions received by such broker/dealer on the security transactions to the Fund. In no event will commissions paid by the Fund be used to pay expenses that would otherwise be borne by any other funds within ATST, or by any other party.
Recaptured commissions during the year ended December 31, 2007 of $112 are included in net realized gains in the Statement of Operations.
Securities lending: The Fund may lend securities to qualified borrowers, with State Street acting as the Fund’s lending agent. The Fund earns negotiated lenders’ fees. The Fund receives cash and/or securities as collateral against the loaned securities. Cash collateral received is invested in short term, interest bearing securities. The Fund monitors the market value of securities loaned on a daily basis and requires collateral in an amount at least equal to the value of the securities loaned. Income from loaned securities earned by State Street, shown in the Statement of Operations is net of fees, in the amount of $287.
The Fund has invested the cash collateral received from securities loaned in the following short-term, interest-bearing securities:
9
NOTES TO FINANCIAL STATEMENTS (continued)
At December 31, 2007
(all amounts in thousands)
NOTE 1.– (continued)
Abbey National PLC, Eurodollar Term, 5.00%, 1/7/2008 | | $ | 6,076 | |
ABN AMRO Bank NV, Eurodollar Term, 5.18%, 1/4/2008 | | 4 ,860 | |
Bank of Nova Scotia, Eurodollar Term, 4.96%, 1/22/2008 | | 4 ,253 | |
Barclays, Eurodollar Term, 5.00%, 2/12/2008 | | 8 ,506 | |
BNP Paribas, Eurodollar Term, 5.01%, 1/11/2008 | | 7 ,898 | |
Calyon, Eurodollar Term, 5.12%, 3/3/2008 | | 1,823 | |
Credit Suisse First Boston Corp., Repurchase Agreement, 4.60%, 1/2/2008 | | 1 5 ,797 | |
Dexia Group, Eurodollar Term, 4.82%, 1/3/2008 | | 6,076 | |
HBOS Halifax Bank of Scotland, Eurodollar Term, 5.15%, 1/2/2008 | | 3,038 | |
JPMorgan Chase & Co., Eurodollar Term, 5.15%, 2/12/2008 | | 3,038 | |
Lloyds TSB Bank, Eurodollar Term, 5.15%, 1/24/2008 | | 6,076 | |
Merrill Lynch & Co. (RPG), Repurchase Agreement, 4.60%, 1/2/2008 | | 9,114 | |
Morgan Stanley & Co. (Corp. Repo), Repurchase Agreement, 4.60%, 1/2/2008 | | 2 4 ,911 | |
Rabobank Nederland, Eurodollar Term, 5.08%, 1/10/2008 | | 7 ,291 | |
Reserve Primary Money Market Fund, 4.95% | | 6,481 | |
Royal Bank of Scotland, Eurodollar Term, 5.00%, 2/25/2008 | | 7,291 | |
Societe Generale, Eurodollar Term, 5.15%, 3/3/2008 | | 3,645 | |
Toronto Dominion Bank, Eurodollar Term, 5.05%, 1/10/2008 | | 7,291 | |
UBS AG, Eurodollar Term, 4.92%, 1/11/2008 | | 4,253 | |
Wells Fargo, Bank Note, 4.75%, 1/8/2008 | | 3,038 | |
| | $ | 140,756 | |
Security transactions and investment income: Security transactions are recorded on the trade date. Security gains and losses are calculated on the first-in, first-out basis. Dividend income, if any, is recorded on the ex-dividend date or, in the case of foreign securities, as soon as the Fund is informed of the ex-dividend date. Interest income, including accretion of discounts and amortization of premiums, is recorded on the accrual basis commencing on the settlement date.
Dividend distributions: Dividends and capital gains distributions are typically declared and reinvested annually and are generally paid and reinvested on the business day following the ex-date.
NOTE 2. RELATED PARTY TRANSACTIONS
ATST serves as a funding vehicle for certain affiliated asset allocation portfolios and certain affiliated separate accounts of Western Reserve Life Assurance Co. of Ohio, Transamerica Life Insurance Company, Transamerica Financial Life Insurance Company, Inc., Monumental Life Insurance Company and Transamerica Occidental Life Insurance Company.
Transamerica Fund Advisors, Inc. (“TFAI”) is the Fund’s investment adviser. Transamerica Fund Services, Inc. (“TFS”) is the Fund’s administrator and transfer agent. Prior to May 1, 2007, AFSG Securities Corp. (“AFSG”), was the Fund’s distributor. Transamerica Capital Inc. (“TCI”) is now the Fund’s distributor. TFAI, TFS, AFSG, and TCI are affiliates of AEGON NV, a Netherlands corporation.
Certain officers and trustees of the Fund are also officers and/or directors of TFAI, TFS and TCI.
Investment advisory fee: The Fund pays management fees to TFAI based on average daily net assets (“ANA”) at the following breakpoints:
0.80% of the first $1 billion of ANA
0.775% of ANA over $1 billion
TFAI has contractually agreed to waive its advisory fee and will reimburse the Fund to the extent that operating expenses, excluding 12b-1 fees, exceed the following stated annual limit:
1.00% Expense Limit
If total Fund expenses fall below the annual expense limitation agreement agreed to by the adviser within the succeeding three years, the Fund may be required to pay the adviser a portion or all of the waived advisory fees.
There were no amounts recaptured during the year ended December 31, 2007. There are no amounts available for recapture at December 31, 2007.
Distribution and service fees: ATST entered into a Distribution Agreement with AFSG dated January 1, 1997, as amended. On May 1, 2007, the Distribution Agreement was amended to replace AFSG with TCI as the Fund’s distributor. The Fund has also adopted a distribution plan (“Distribution Plan”) pursuant to Rule 12b-1 under the 1940 Act.
Under the Distribution Plan for the Initial Class shares, TCI, on behalf of the Fund, is authorized to pay various service providers, as direct payment for expenses incurred in connection with distribution of the Fund’s shares, amounts equal to actual expenses associated with distributing the shares.
The Distribution Plan for the Service Class shares requires ATST to pay distribution fees to TCI as compensation for its activities, not as reimbursement for specific expenses. The fee on the Service Class is paid to the insurance companies for providing services and account maintenance for their policyholders who invest in the variable insurance products which invest in the Service Class shares.
The Fund is authorized under the Distribution Plan to pay fees on each class up to the following limits:
| Initial Class | 0.15% |
| Service Class | 0.25% |
TCI has determined that it will not seek payment by the Fund of the distribution expenses incurred with respect to the Initial Class shares before April 30, 2009. Prior to TCI seeking reimbursement of future expenses, policy and contract owners will be notified in advance. The Fund will pay fees relating to Service Class shares.
Administrative services: The Fund has entered into an agreement with TFS for financial and legal fund administration services. The Fund pays TFS an annual fee of 0.02% of ANA. The Legal fees on the Statement of Operations are for fees paid to external legal counsel.
Brokerage commissions: Brokerage commissions incurred on security transactions placed with an affiliate of the sub-adviser for the year ended December 31, 2007 were $287.
10
NOTES TO FINANCIAL STATEMENTS (continued)
At December 31, 2007
(all amounts in thousands)
NOTE 2.– (continued)
Deferred compensation plan: Each eligible independent Fund Trustee may elect participation in a non-qualified deferred compensation plan (“the Plan”). Under the Plan, such Trustees may defer payment of all or a portion of their total fees earned as a Fund Trustee. Each Trustee who is a participant in the Plan may elect that the earnings, losses or gains credited to his or her deferred fee amounts be determined based on a deemed investment in any series of Transamerica IDEX Mutual Funds. The right of a participant to receive a distribution from the Plan of the deferred fees is an unsecured claim against the general assets of all series of Transamerica IDEX Mutual Funds. The pro rata liability to the Fund of all deferred fees in the Plan amounted, as of December 31, 2007, to $32. Amounts deferred under the Plan are unfunded against the general assets of ATST.
Retirement plan: Under a retirement plan (the “Emeritus Plan”) available to the Independent Trustees, each Independent Trustee is deemed to have elected to serve as Trustee Emeritus of ATST upon his or her termination of service, other than removal for cause and is entitled to 50% of the trustee’s current retainer for a maximum period of five years determined by his or her years of service as a Trustee.
Such amounts shall be accrued by ATST on a pro rata basis allocable to each series of ATST fund based on the relative assets of the series. If retainers increase in the future, past accruals (and credits) will be adjusted upward so that 50% of the Trustee’s current retainer is accrued and credited at all times. Upon death, disability or termination of service, other than removal for cause, amounts deferred become payable to a Trustee Emeritus (or his/her beneficiary). Upon the commencement of service as Trustee Emeritus, compensation will be paid on a quarterly basis during the time period that the Trustee Emeritus is allowed to serve as such.
Amounts accrued under the Emeritus Plans are unsecured claims against the general assets of ATST. For the year ended December 31, 2007, the amount related to the Emeritus Plan was $26. As of December 31, 2007, the Fund has not made any payments related to the Emeritus Plan.
The Emeritus Plan was terminated effective October 30, 2007. Upon the termination, the Fund shall continue to pay any remaining benefits in accordance with the Plan, but no further compensation shall accrue under the Plan.
NOTE 3. INVESTMENT TRANSACTIONS
The cost of securities purchased and proceeds from securities sold (excluding short-term securities) for the year ended December 31, 2007 were as follows:
Purchases of securities: | | | |
Long-term | | $ | 472,626 | |
U.S. Government | | — | |
Proceeds from maturities and sales of securities: | | | |
Long-term | | 552,705 | |
U.S. Government | | — | |
| | | | |
NOTE 4. FEDERAL INCOME TAX MATTERS
The Fund has not made any provision for federal income or excise taxes due to its policy to distribute all of its taxable income and capital gains to its shareholders and otherwise qualify as a regulated investment company under Subchapter M of the Internal Revenue Code. Income and capital gain distributions are determined in accordance with income tax regulations, which may differ from GAAP. These differences are primarily due to differing treatment for items including, but not limited to, wash sales, foreign currency, capital loss carryforwards, PFICS and return of capital from investment.
Therefore, distributions determined in accordance with tax regulations may differ significantly in amount or character from net investment income and realized gains for financial reporting purposes. Financial reporting records are adjusted for permanent book/tax differences to reflect tax character. Financial records are not adjusted for temporary differences. These reclassifications are as follows:
Additional paid-in capital | | $ | (86 | ) |
Undistributed (accumulated) net investment income (loss) | | $ | (1 | ) |
Undistributed (accumulated) net realized gain (loss) from investment securities | | $ | 87 | |
The capital loss carryforwards are available to offset future realized capital gains through the periods listed:
Capital Loss | | | |
Carryforwards | | Available Through | |
| | | |
$ | 285,142 | | December 31, 2010 | |
| | | |
$ | 102,512 | | December 31, 2009 | |
The capital loss carryforward utilized during the year ended December 31, 2007 was $81,898.
The tax character of distributions paid may differ from the character of distributions shown in the Statements of Changes in Net Assets due to short-term gains being treated as ordinary income for tax purposes.
11
NOTES TO FINANCIAL STATEMENTS (continued)
At December 31, 2007
(all amounts in thousands)
NOTE 4.– (continued)
The tax character of distributions paid during 2006 and 2007 was as follows:
2006 Distributions paid from: | | | |
Ordinary Income | | $ | — | |
Long-term Capital Gain | | — | |
| | | |
2007 Distributions paid from: | | | |
Ordinary Income | | — | |
Long-term Capital Gain | | — | |
| | | | |
The tax basis components of distributable earnings as of December 31, 2007 are as follows:
Undistributed Ordinary Income | | $ | 11,164 | |
Undistributed Long-term Capital Gain | | $ | — | |
Capital Loss Carryforward | | $ | (387,654 | ) |
Post October Capital Loss Deferral | | $ | — | |
Post October Currency Loss Deferral | | $ | (1 | ) |
Net Unrealized Appreciation (Depreciation) | | $ | 78,726 | |
NOTE 5. REGULATORY PROCEEDINGS
There continues to be significant federal and state regulatory activity relating to financial services companies, particularly mutual fund companies and their investment advisers. As part of an ongoing investigation regarding potential market timing, recordkeeping and trading compliance issues and matters affecting the Fund’s investment adviser, TFAI, and certain affiliates and former employees of TFAI, the SEC staff has indicated that it is likely to take some action against TFAI and certain of its affiliates at the conclusion of the investigation. The potential timing and the scope of any such action is difficult to predict. Although the impact of any action brought against TFAI and/or its affiliates is difficult to assess at the present time, the Fund currently believes that the likelihood that any such action will have a material adverse impact on it is remote. It is important to note that the Fund is not aware of any allegation of wrong doing against it and its Board at the time this annual report is printed. Although it is not anticipated that these developments will have an adverse impact on the Fund, there can be no assurance at this time. TFAI and its affiliates are actively working with the SEC in regard to this matter; however, the exact resolution cannot be determined at this time. TFAI will take such actions that it deems necessary or appropriate to continue providing management services to the Fund and to bring all matters to an appropriate conclusion.
TFAI and/or its affiliates, and not the Fund, will bear the costs regarding these regulatory matters.
NOTE 6. RECENTLY ISSUED ACCOUNTING PRONOUNCEMENTS
In July 2006, the Financial Accounting Standards Board (“FASB”) released FASB Interpretation No. 48 “Accounting for Uncertainty in Income Taxes” (“FIN 48”), an interpretation of FASB Statement No. 109. FIN 48 provides guidance for how uncertain tax positions should be recognized, measured, presented and disclosed in the financial statements. FIN 48 requires the accounting and disclosure of tax positions taken or expected to be taken in the course of preparing the Fund’s tax returns to determine whether the tax positions are “more-likely- than-not” of being sustained by the applicable tax authority. Tax positions not deemed to meet the more-likely-than-not threshold would be recorded as a tax benefit or expense in the current year.
Adoption of FIN 48 is effective during the first required financial reporting period for fiscal years beginning after December 15, 2006. Management adopted FIN 48 on June 29, 2007.
Implementation of FIN 48 requires Management of the Fund to analyze all open tax years, as defined by the Statute of Limitations, for all major jurisdictions, which includes federal and certain states. Open tax years are those that are open for exam by taxing authorities (i.e., the last 4 tax year ends and the interim tax period since then). The Fund has no examinations in progress and none are expected at this time.
Management of the Fund has reviewed all open tax years and major jurisdictions and concluded the adoption of FIN 48 resulted in no impact to the Fund’s net assets or results of operations. There is no tax liability resulting from unrecognized tax benefits relating to uncertain income tax positions taken or expected to be taken in future tax returns. The Fund is also not aware of any tax positions for which it is reasonably possible that the total amounts of unrecognized tax benefits will significantly change in the next 12 months.
In September 2006, FASB issued its new Standard No. 157, “Fair Value Measurements” (“FAS 157”). FAS 157 is designed to unify guidance for the measurement of fair value of all types of assets, including financial instruments, and certain liabilities, throughout a number of accounting standards. FAS 157 also establishes a hierarchy for measuring fair value in generally accepted accounting principles and expands financial statement disclosures about fair value measurements that are relevant to mutual funds. FAS 157 is effective for financial statements issued for fiscal years beginning after November 15, 2007, and earlier application is permitted.
As of December 31, 2007, Management does not expect the adoption of FAS 157 to impact the amounts reported in the financial statements, however, additional disclosures will be required about the inputs used to develop the measurements of fair value and the effect of certain of the measurements reported in the statement of operations for a fiscal period.
NOTE 7. SUBSEQUENT EVENT
Effective January 1, 2008, TFAI changed its name to Transamerica Asset Management, Inc.
Effective May 1, 2008, AEGON/Transamerica Series Trust will change its name to Transamerica Series Trust. At that time, the Fund will also change its name to Transamerica Van Kampen Mid-Cap Growth VP.
12
Report of Independent Registered Certified Public Accounting Firm
To the Board of Trustees and Shareholders of
Van Kampen Mid-Cap Growth:
In our opinion, the accompanying statement of assets and liabilities, including the schedule of investments, and the related statements of operations and of changes in net assets and the financial highlights present fairly, in all material respects, the financial position of Van Kampen Mid-Cap Growth (the “Fund”) (one of the portfolios constituting AEGON/Transamerica Series Trust) at December 31, 2007, the results of its operations for the year then ended, the changes in its net assets for each of the two years in the period then ended and the financial highlights for each of the periods presented, in conformity with accounting principles generally accepted in the United States of America. These financial statements and financial highlights (hereafter referred to as “financial statements”) are the responsibility of the Fund’s management; our responsibility is to express an opinion on these financial statements based on our audits. We conducted our audits of these financial statements in accordance with the standards of the Public Company Accounting Oversight Board (United States). Those standards require that we plan and perform the audit to obtain reasonable assurance about whether the financial statements are free of material misstatement. An audit includes examining, on a test basis, evidence supporting the amounts and disclosures in the financial statements, assessing the accounting principles used and significant estimates made by management, and evaluating the overall financial statement presentation. We believe that our audits, which included confirmation of securities at December 31, 2007 by correspondence with the custodian and brokers, provide a reasonable basis for our opinion.

Tampa, Florida
February 29, 2008
13
Van Kampen Mid-Cap Growth
RESULTS OF SHAREHOLDER PROXY (unaudited)
At a special meeting of shareholders held on October 30, 2007, the results of the Proposals were as follows:
Proposal 1: To elect a new Board:
Proposed
Trustee | | For | | Against | | Abstentions/Broker Non-
Votes | |
John K. Carter | | 2,274,998,840.817 | | 57,804,698.755 | | 35,433.883 | |
| | | | | | | |
Leo J. Hill | | 2,277,212,702.754 | | 55,590,836.819 | | 35,433.883 | |
| | | | | | | |
Neal M. Jewell | | 2,266,793,295.663 | | 66,010,243.909 | | 35,433.883 | |
| | | | | | | |
Russell A. Kimball, Jr. | | 2,274,825,235.835 | | 57,978,303.737 | | 35,433.883 | |
| | | | | | | |
Eugene M. Mannella | | 2,274,623,165.033 | | 58,180,374.539 | | 35,433.883 | |
| | | | | | | |
Norm R. Nielsen | | 2,275,050,055.885 | | 57,753,483.687 | | 35,433.883 | |
| | | | | | | |
Joyce Galpern Norden | | 2,270,278,122.250 | | 62,525,417.323 | | 35,433.883 | |
| | | | | | | |
Patricia L. Sawyer | | 2,275,737,737.456 | | 57,065,802.116 | | 35,433.883 | |
| | | | | | | |
John W. Waechter | | 2,276,615,120.140 | | 56,188,419.433 | | 35,433.883 | |
Proposal 2: To approve an amendment to the Agreement and Declaration of Trust:
| | | | Abstentions/Broker Non- | |
For | | Against | | Votes | |
2,182,022,669.110 | | 77,590,048.544 | | | 73,226,255.801 | | |
| | | | | | | |
14
Van Kampen Mid-Cap Growth
INVESTMENT ADVISORY AND SUB-ADVISORY AGREEMENTS-REVIEW AND RENEWAL (unaudited)
At a meeting of the Board of Trustees of AEGON/Transamerica Series Trust (“ATST”) held on December 4th, 2007, the Board reviewed and considered the renewal of the investment advisory agreement (the “Investment Advisory Agreement”) between Van Kampen Mid- Cap Growth (the “Fund”) and Transamerica Fund Advisors, Inc. (“TFAI”), as well as the renewal of the investment sub-advisory agreement (the “Sub-Advisory Agreement”) of the Fund between TFAI and Van Kampen Asset Management (the “Sub-Adviser”), to determine whether the agreements should be renewed for a six-month period. It was noted that this review was interim in nature to align all the Funds on the same calendar, and that the Funds’ advisory arrangements would be reviewed again in the first half of 2008.
Following their review and consideration, the Trustees determined that the renewal of the Investment Advisory Agreement and the Sub- Advisory Agreement would enable shareholders of the Fund to obtain high quality services at a cost that is appropriate, fair, and in the best interests of its shareholders. The Board, including the independent members of the Board, unanimously approved the renewal of the Investment Advisory Agreement and Sub-Advisory Agreement. In reaching their decision, the Trustees requested and obtained from TFAI and the Sub-Adviser such information as they deemed reasonably necessary to evaluate the agreements, including information about fees and performance of comparable funds managed by the Sub-Adviser. The Trustees also carefully considered information they had previously received from TFAI and the Sub-Adviser throughout the year as part of their regular oversight of the Fund, as well as comparative fee, expense, and performance information prepared by Lipper Inc. (“Lipper”), an independent provider of mutual fund performance, fee and expense information and profitability data prepared by management. In considering the proposed continuation of the Investment Advisory and Sub-Advisory Agreements, the Trustees evaluated a number of considerations that they believed, in light of the legal advice furnished to them by independent legal counsel and their own business judgment, to be relevant. They based their decisions on a variety of factors, including the following considerations, among others, although they did not identify any consideration or particular information that was controlling of their decisions:
The nature, extent and quality of the advisory services to be provided. The Board considered the nature and quality of the services provided by TFAI and the Sub-Adviser to the Fund in the past, as well as the services anticipated to be provided in the future. The Board concluded that TFAI and the Sub-Adviser are capable of providing high quality services to the Fund, as indicated by the nature and quality of services provided in the past by TFAI and the Sub-Adviser for this series and the experience, capability and integrity of TFAI’s senior management, the financial resources of TFAI and the Sub-Adviser, TFAI’s management oversight process and the professional qualifications of the portfolio management team of the Sub-Adviser. The Trustees determined that TFAI and the Sub-Adviser can provide investment and related services that are appropriate in scope and extent in light of the Fund’s operations, the competitive landscape of the investment company business and investor needs.
The investment performance of the Fund. The Board examined the short and longer-term performance of the Fund, including relative performance against a peer universe of comparable mutual funds as prepared by Lipper for various trailing periods ended June 30, 2007. The Board noted that 1-year performance was near median, but longer-term performance of the Fund was below median relative to its peers. This was partially reflective of the older emerging growth strategy used by a different management team at the Sub-Adviser. On the basis of the Board’s assessment of the nature, extent and quality of advisory services to be provided or procured by TFAI and the Sub-Adviser, the Board concluded that TFAI and the Sub-Adviser are capable of providing a level of investment performance that is appropriate in light of the Fund’s proposed investment objectives, policies and strategies and competitive with other similarly situated investment companies.
The cost of advisory services provided and the level of profitability. The Board reviewed profitability information of TFAI’s cost of procuring fund management services, as well as the costs of provision of administration, fund accounting and other services, to the Fund and to ATST as a whole by TFAI and its affiliates. The Board reviewed the management and sub-advisory fees for the Fund. The Board noted that the Fund’s contractual advisory fees were higher than the median for the comparable expense group and universe of funds, but by a relatively small margin. The Board further noted that the Sub-Advisor has indicated that the current sub-advisory rate is competitive. Based on their review, the Trustees determined that the management fees of the Fund generally are appropriate in light of the services expected to be provided or procured, the management fees and the anticipated profitability of the relationship between the Fund, TFAI and its affiliates, and the Sub-Adviser. In making these observations and determinations, the Board reviewed, among other things, comparative information provided by Lipper.
Whether fee levels reflect economies of scale and the extent to which economies of scale would be realized as the Fund grows. In evaluating the extent to which the management fees payable under the Investment Advisory and Sub-Advisory Agreements reflect economies of scale or will permit economies of scale to be realized in the future, the Board noted that TFAI and the Sub-Adviser offer a breakpoint which appropriately benefit investors by passing on economies of scale in the form of lower management fees as the level of assets grows. The Trustees also concluded that they will have the opportunity to periodically reexamine whether the Fund has achieved economies of scale, and the appropriateness of management fees payable to TFAI and fees paid to the Sub-Adviser, in the future.
Benefits (such as soft dollars) to TFAI, its affiliates, or the Sub-Adviser from their relationship with the Fund. The Board concluded that other benefits anticipated to be derived by TFAI, its affiliates, and the Sub-Adviser from their relationships with the Fund are expected to be reasonable and fair, and consistent with industry practice and the best interests of the Fund and its shareholders. The Trustees noted that TFAI would not realize soft dollar benefits from its relationship with the Fund. The Board also noted that the Sub- Adviser is participating in a brokerage program pursuant to which a portion of brokerage commissions paid by the Fund is recaptured for the benefit of the Fund and its shareholders, thus limiting the amount of soft dollar arrangements the Sub-Adviser may engage in with respect to the Fund’s brokerage transactions.
15
Other considerations. The Board determined that TFAI has made a substantial commitment to the recruitment and retention of high quality personnel, and maintains the financial, compliance and operational resources reasonably necessary to manage the Fund in a professional manner that is consistent with the best interests of the Fund and its shareholders. In this regard, the Trustees favorably considered the procedures and policies in place by TFAI to enforce compliance with applicable laws and regulations and oversee the portfolio management activities of the Sub-Adviser. The Trustees also determined that TFAI has made a significant entrepreneurial commitment to the management and success of the Fund, reflected by TFAI’s expense limitation and fee waiver arrangements with the Fund which may result in TFAI waiving a substantial amount of management fees for the benefit of shareholders.
16
AEGON/Transamerica Series Trust
MANAGEMENT OF THE TRUST
TRUSTEES AND OFFICERS
The Trust is governed by a Board of Trustees. Subject to the supervision of the Board of Trustees, the assets of each portfolio are managed by an investment adviser and sub-advisers, and the respective portfolio managers. The Board of Trustees is responsible for managing the business and affairs of the Trust and oversees the operation of the Trust by its officers. It also reviews the management of the portfolios’ assets by the investment adviser and sub-advisers. Information about the Trustees and Officers of the Trust is as follows:
Name, Address*** and Age | | Position(s)
Held | | Length of
Time
Served* | | Principal Occupation(s)
During Past Five Years | | Number of
Funds
in Fund
Complex
Overseen
by Trustee | | Other Board
Memberships |
| | | | | | | | | | |
Independent Trustees:** | | | | | | | | | | |
| | | | | | | | | | |
Leo J. Hill
(DOB: 3/27/56) | | Trustee | | Since 2001 | | Principal, Advisor Network Solutions, LLC (business consulting) (2006 to present); Trustee, Diversified Investors Portfolios (“DIP”), The Diversified Investors Funds Group (“DIFG”), The Diversified Investors Funds Group II (“DIFG II”) and Diversified Investors Strategic Variable Funds (“DISVF”) (2007 to present); Trustee, Transamerica IDEX Mutual Funds (“TA IDEX”) (2002 to present); Director, Transamerica Income Shares, Inc. (“TIS”) (2002 to present); Trustee, AEGON/Transamerica Series Trust (“ATST”) (2001 to present); Owner and President, Prestige Automotive Group(2001 to 2005); President, L. J. Hill & Company (1999 to present); Market President, Nations Bank of Sun Coast Florida (1998 to 1999); President and Chief Executive Officer, Barnett Banks of Treasure Coast Florida (1994 to 1998); Executive Vice President and Senior Credit Officer, Barnett Banks of Jacksonville, Florida (1991 to 1994); Senior Vice President and Senior Loan Administration Officer, Wachovia Bank of Georgia (1976 to 1991). | | 171 | | None |
| | | | |
| | | | |
| | | | |
| | | | |
| | | | |
| | | | |
| | | | |
| | | | |
| | | | |
| | | | |
| | | | |
| | | | |
| | | | |
| | | | |
| | | | |
| | | | | | | | | | |
Russell A. Kimball, Jr. (DOB: 8/17/44) | | Trustee | | Since 1986 | | Trustee, DIP, DIFG, DIFG II and DISVF (2007 to present); Trustee, TA IDEX (2002 to present); Director, TIS (2002 to present); Trustee, ATST (1986 to present); General Manager, Sheraton Sand Key Resort (1975 to present). | | 171 | | None |
| | | | | | | | |
| | | | | | | | | | |
Norm R. Nielsen
(DOB: 5/11/39) | | Trustee | | Since 2006 | | Retired (2005 to present); Trustee, DIP, DIFG, DIFG II and DISVF (2007 to present); Trustee, TA IDEX (2006 to present); Director, TIS (2006 to present); Trustee, ATST (2006 to present); Director, Iowa City Area Development (1996 to 2004); Director, Iowa Health Systems (1994 to 2003); Director, U.S. Bank (1987 to 2006); President, Kirkwood Community College (1979 to 2005). | | 171 | | Buena Vista University Board of Trustees (2004 to present) |
Name, Address*** and Age | | Position(s)
Held | | Length of
Time
Served* | | Principal Occupation(s)
During Past Five Years | | Number of
Funds
in Fund
Complex
Overseen
by Trustee | | Other Board
Memberships |
| | | | | | | | | | |
John W. Waechter
(DOB: 2/25/52) | | Trustee | | Since 2004 | | Retired (2004 to present): Trustee, DIP, DIFG, DIFG II and DISVF (2007 to present); Trustee, TA IDEX (2005 to present); Director, TIS (2004 to present); Trustee, ATST (2004 to present); employee, RBC Dain Rauscher (securities dealer) (March 2004 to May 2004); Executive Vice President, Chief Financial Officer and Chief Compliance Officer, William R. Hough & Co. (securities dealer) (1979 to 2004); Treasurer, The Hough Group of Funds (1993 to 2004). | | 171 | | None |
| | | | | | | | | | |
Neal M. Jewell
(DOB: 2/12/35) | | Trustee | | Since 2007 | | Retired (2004 to present); Trustee, TA IDEX and ATST (2007 to present); Director, TIS (2007 to present); Trustee, DIP, DIFG, DIFG II and DISVF (1993 to present); Independent Trustee, EAI Select Managers Equity Fund (mutual fund) (1996 to 2004). | | 171 | | None |
| | | | | | | | | | |
Eugene M. Mannella
(DOB: 2/1/54) | | Trustee | | Since 2007 | | Self-employed consultant (2006 to present); President, Arapain Partners LLC (limited purpose broker-dealer) (1998 to present); Trustee, TA IDEX and ATST (2007 to present); Director, TIS (2007 to present); Trustee, DIP, DIFG, DIFG II and DISVF (1994 to present); President, International Fund Services (alternative asset administration) (1993 to 2005). | | 171 | | None |
| | | | | | | | | | |
Joyce Galpern Norden (DOB: 6/1/39) | | Trustee | | Since 2007 | | Retired (2004 to present); Trustee, TA IDEX and ATST (2007 to present); Director, TIS (2007 to present); Trustee, DIP (2002 to present); Trustee, DIFG, DIFG II, and DISVF (1993 to present); Vice President, Institutional Advancement, Reconstructionist Rabbinical College (1996 to 2004). | | 171 | | Board of Governors, Reconstructionist Rabbinical College (2007 to present) |
| | | | | | | | | | |
Patricia L. Sawyer
(DOB: 7/1/50) | | Trustee | | Since 2007 | | Trustee, TA IDEX and ATST (2007 to present); Director, TIS (2007 to present); Trustee, DIP, DIFG, DIFG II, and DISVF (1993 to present); President and Executive Search Consultant, Smith & Sawyer LLC (consulting) (1989 to present). | | 171 | | None |
| | | | | | | | Number of | | |
| | | | | | | | Funds | | |
| | | | | | | | in Fund | | |
Name, Address*** and Age | | Position(s)
Held | | Length of
Time
Served* | | Principal Occupation(s)
During Past Five Years | | Complex
Overseen
by Trustee | | Other Board
Memberships |
| | | | | | | | | | |
Interested Trustee:**** | | | | | | | | | | |
| | | | | | | | | | |
John K. Carter
(DOB: 4/24/61) | | Chairman and Trustee | | Since 2006 | | President and Chief Executive Officer, DIP, DIFG, DIFG II and DISVF (July 2007 to present); Chairman and Trustee, DIP, DIFG, DIFG II, and DISVF (October 2007 to present); Chairman (October 2007 to present), Trustee (September 2006 to present), President and Chief Executive Officer (July 2006 to present), Senior Vice President (1999 to June 2006), Chief Compliance Officer, General Counsel and Secretary (1999 to August 2006), TA IDEX; Chairman (October 2007 to present), Trustee (September 2006 to present), President and Chief Executive Officer (July 2006 to present), Senior Vice President (1999 to June 2006), Chief Compliance Officer, General Counsel and Secretary (1999 to August 2006), ATST; Chairman (October 2007 to present), Director (September 2006 to present), President and Chief Executive Officer (July 2006 to present), Senior Vice President (2002 to June 2006), General Counsel, Secretary and Chief Compliance Officer (2002 to August 2006), TIS; President and Chief Executive Officer (July 2006 to present), Senior Vice President (1999 to June 2006), Director (2000 to present), General Counsel and Secretary (2000 to August 2006), Chief Compliance Officer (2004 to August 2006), TFAI; President and Chief Executive Officer (July 2006 to present), Senior Vice President (1999 to June 2006), Director (2001 to present), General Counsel and Secretary (2001 to August 2006), (“TFS”); Vice President, AFSG Securities Corporation (2001 to present); President (November 2007 to present), Chief Executive Officer (July 2006 to present), Vice President, Secretary and Chief Compliance Officer (2003 to August 2006), Transamerica Investors, Inc. (“TII”); Senior Vice President, General Counsel and Secretary, Transamerica Index Funds, Inc. (2002 to 2004); Vice President, Transamerica Investment Services, Inc. (“TISI”) (2003 to 2005) and Transamerica Investment Management, LLC (“TIM”) (2001 to 2005). | | 171 | | None |
Officers
Name, Address*** and Age | | Position(s) Held | | Length of
Time
Served† | | Principal Occupation(s)
During the Past Five Years |
| | | | | | |
John K. Carter
(DOB: 4/24/61) | | Chief Executive Officer and President | | Since 1999 | | See the table above. |
| | | | | | |
Dennis P. Gallagher
(DOB: 12/19/70) | | Vice President, General Counsel and Secretary | | Since 2006 | | Vice President, General Counsel and Secretary, TA IDEX, ATST and TIS (September 2006 to present); Vice President, General Counsel and Secretary, DIP, DIFG, DIFG II and DISVF (August 2007 to present); Vice President and Secretary, TII (September 2006 to present); Assistant Vice President, TCI; Director, Senior Vice President, General Counsel and Secretary, TFAI and TFS (September 2006 to present); Director, Deutsche Asset Management (1998 to 2006). |
| | | | | | |
Elizabeth L. Belanger
(DOB: 1/7/72) | | Deputy General Counsel, Assistant Secretary and Conflicts of Interest Officer | | Since 2007 | | Deputy General Counsel, Assistant Secretary and Conflicts of Interest Officer, TII (November 2007 to present); Deputy General Counsel, Assistant Secretary and Conflicts of Interest Officer, TA IDEX, ATST and TIS (July 2007 to present); Deputy General Counsel and Conflicts of Interest Officer (August 2007 to present), Assistant Secretary (August 2005 to present), DIP, DIFG, DIFG II and DISVF; Vice President and Senior Counsel, Diversified (with Diversified since 2005); Director, TFLIC (April 2006 to present); Director of Compliance, Domini Social Investments LLC (November 2003 to May 2005); Associate, Bingham McCutchen LLP (September 1997 to October 2003). |
| | | | | | |
Joseph P. Carusone
(DOB: 9/8/65) | | Vice President, Treasurer and Principal FinancialOfficer | | Since 2007 | | Vice President, Treasurer and Principal Financial Officer, TII (November 2007 to present); Vice President, Treasurer and Principal Financial Officer, TA IDEX, ATST and TIS (July 2007 to present); Vice President (August 2007 to present), Treasurer and Principal Financial Officer (2001 to present), DIP, DIFG, DIFG II and DISVF; Vice President, Diversified (since 1999); President, Diversified Investors Securities Corp. (“DISC”) (February 2007 to present); Senior Vice President, TFAI and TFS (2007 to present), Director, TFLIC (2004 to present). |
| | | | | | |
Christopher A. Staples
(DOB: 8/14/70) | | Vice President and Chief Investment Officer | | Since 2004 | | Vice President and Chief Investment Officer (November 2007 to present); Vice President, Investment Administration (2004 to 2007), TII; Vice President (July 2007 to present), Chief Investment Officer (June 2007 to present), Senior Vice President (June 2007 to July 2007), Senior Vice President - Investment Management (July 2006 to June 2007), Vice President - Investment Management (2004 to July 2006), TA IDEX, ATST and TIS; Vice President and Chief Investment Officer, DIP, DIFG, DIFG II and DISVF (August 2007 to present); Director, Senior Vice President – Investment Management and Chief Investment Officer, TFAI (July 2006 to present), Director, TFS (2005 to present); Assistant Vice President, Raymond James & Associates (1999 to 2004). |
| | | | | | |
Rick B. Resnick
(DOB: 1/24/67) | | Vice President and Chief Compliance Officer | | Since 2008 | | Vice President and Chief Compliance Officer (January 2008 – present), Transamerica Funds, ATST, TII, and TIS; Vice President and Chief Compliance Officer, DISVF, DIFG, DIFG II and DIP (1998 – present); Senior Vice President and Chief Compliance Officer, TFAI (2008 – present); Senior Vice President, TFS (2008 – present); Director, Vice President and Chief Compliance Officer, Diversified Investors Securities Corp. (1999 – present). |
| | | | | | |
Michael A. Masson
(DOB: 1/21/71) | | Assistant Treasurer | | Since 2005 | | Assistant Treasurer, TII (November 2007 to present); Assistant Treasurer (July 2007 to present), Assistant Vice President (2005 to 2007), TA IDEX, ATST and TIS; Assistant Treasurer, DIP, DIFG, DIFG II and DISVF (August 2007 to present); Director of Financial Reporting (2007 to present); Assistant Vice President, TFS and TFAI (2005 to 2007); Assistant Vice President, JPMorgan Chase & Co. (1999 to 2005). |
| | | | | | |
Suzanne Valerio- Montemurro
(DOB: 8/13/64) | | Assistant Treasurer | | Since 2007 | | Assistant Treasurer, TII (November 2007 to present); TA IDEX, ATST and TIS (July 2007 to present); Assistant Treasurer, DIP, DIFG, DIFG II and DISVF (August 2007 to present); Vice President, Diversified (with Diversified since 1998). |
|
* | | Each Trustee shall hold office until: 1) his or her successor is elected and qualified or 2) he or she resigns or his or her term as a Trustee is terminated in accordance with the AEGON/Transamerica Series Trust by-laws. |
** | | Independent trustee (“Independent Trustee”) means a trustee who is not an “interested person” (as defined under the 1940 Act) of the Trust (the “Independent Trustees”). |
*** | | The mailing address of each Trustee and Officer is c/o Secretary of the Funds, 570 Carillon Parkway, St. Petersburg, Florida 33716. |
**** | | May be deemed an “interested person” (as that term is defined in Section 2(a)(19) of the 1940 Act) of the Trust because of his employment with theAdvisor or an affiliate of the Advisor. |
† | | If an officer has held offices for different Funds for different periods of time, the earliest applicable date is shown. |
| | |
Additional information about the AEGON/Transamerica Series Trust can be found in the Statement of Additional Information, available without charge, upon request, by calling toll free 1-888-851-9777. |
PROXY VOTING POLICIES AND PROCEDURES AND QUARTERLY PORTFOLIO HOLDINGS
A description of the AEGON/Transamerica Series Trusts’ proxy voting policies and procedures is available in the Statement of Additional Information of the Funds, available without charge upon request by calling 1-800-851-9777 (toll free) or on the Securities and Exchange Commission website (www.sec.gov).
In addition, the Funds are required to file Form N-PX, with their complete proxy voting records for the 12 months ended June 30th, no later than August 31st of each year. The Form is available without charge: (1) from the Funds, upon request by calling 1-800-851-9777; and (2) on the SEC’s website at www.sec.gov.
The Funds file their complete schedule of portfolio holdings with the SEC for the first and third quarter of each fiscal year on Form N-Q which is available on the Commission’s website at www.sec.gov. The Funds’ Form N-Q may be reviewed and copied at the Commission’s Public Reference Room in Washington, D.C. Information on the operation of the Public Reference Room may be obtained by calling 1-800-SEC-0330.
P.O. Box 9012 |
Clearwater, FL 33758-9012 |
|
Distributor: Transamerica Capital, Inc., |
| 4600 South Syracuse Street |
| Denver, CO 80237 |
|
| Customer Service: 1-800-851-9777 |
| | |
Item 2: Code of Ethics.
(a) Registrant has adopted a code of ethics that applies to its principal executive officer, principal financial officer, and any other officers who serve a similar function.
(b) Registrant’s code of ethics is reasonably designed as described in this Form N-CSR.
(c) During the period covered by the report, the code of ethics was amended to reflect an internal consolidation of certain related entities as approved by the Registrant’s Board of Trustees on November 7, 2007, and by shareholders of the Registrant on October 30, 2007. The changes were non-material in nature, other than to include the names of each applicable entity, including the Registrant, as follows: Transamerica IDEX Mutual Funds, Transamerica Income Shares, Inc., Diversified Investors Portfolios, The Diversified Investors Funds Group, The Diversified Investors Funds Group II and Diversified Investors Strategic Variable Funds. In addition, the Registrant’s investment adviser, Transamerica Fund Advisors, Inc., changed its name to Transamerica Asset Management, Inc. on January 1, 2008. The code of ethics has also been amended to reflect this name change. No other changes were made to the existing code of ethics as previously filed with this Form
N-CSR.
(d) During the period covered by the report, Registrant did not grant any waivers, including implicit waivers, from the provisions of this code of ethics.
(e) Not Applicable
(f) Registrant has filed this code of ethics as an exhibit pursuant to Item 12(a)(1) of Form N-CSR.
Item 3: Audit Committee Financial Experts.
Registrant’s Board of Trustees has determined that John W. Waechter and Eugene M. Mannella are “audit committee financial experts,” as such term is defined in Item 3 of Form N-CSR. Mr. Waechter and Mr. Mannella are “independent” under the standards set forth in Item 3 of Form N-CSR. The designation of Mr. Waechter and Mr. Mannella as “audit committee financial experts” pursuant to Item 3 of Form N-CSR does not (i) impose upon them any duties, obligations, or liabilities that are greater than the duties, obligations and liabilities imposed upon them as a member of the Registrant’s audit committee or Board of Trustees in the absence of such designation; or (ii) affect the duties, obligations or liabilities of any other member of the Registrant’s audit committee or Board of Trustees.
Item 4: Principal Accountant Fees and Services.
| | | | Fiscal Year Ended 12/31 | |
| | (in thousands) | | 2007 | | 2006 | |
(a) | | Audit Fees | | 602 | | 566 | |
(b) | | Audit-related Fees | | — | | 32 | |
(c) | | Tax Fees | | 194 | | 52 | |
(d) | | All Other Fees | | N/A | | N/A | |
(e) (1) | | Pre-approval policy* (see below) | | | | | |
(e) (2) | | % of above that were pre-approved | | 0 | % | 0 | % |
(f) | | If greater than 50%, disclose hours | | N/A | | N/A | |
(g) | | Non-audit fees rendered to Adviser (or affiliate that provided services to Registrant) | | 369 | | N/A | |
(h) | | Disclose whether the Audit Committee has considered whether the provisions of non-audit services rendered to the Adviser that were NOT pre-approved is compatible with maintaining the auditor’s independence. | | Yes | | Yes | |
3
* (e) (1) | | The Audit Committee may delegate any portion of its authority, including the authority to grant pre-approvals of audit and permitted non-audit services, to one or more members or a subcommittee. Any decision of the subcommittee to grant pre-approvals shall be presented to the full Audit Committee at its next regularly scheduled meeting. |
Item 5: Audit Committee of Listed Registrant.
The following individuals comprise the standing Audit Committee: Leo J. Hill, Neal M. Jewell, Russell A. Kimball, Jr., Eugene M. Mannella, Norm R. Nielsen, Joyce Galpern Norden, Patricia L. Sawyer and John W. Waechter.
Item 6: Schedule of Investments.
The schedules of investments are included in the annual report to shareholders filed under Item 1 of this Form N-CSR.
Item 7: Disclosure of Proxy Voting Policies and Procedures for Closed-End Management Investment Companies. Not applicable.
Item 8: Portfolio Managers of Closed-End Management Investment Companies. Not applicable.
Item 9. Purchases of Equity Securities by Closed-End Management Investment Company and Affiliated Purchasers. Not applicable.
Item 10: Submission of Matters to a Vote of Security Holders
The Registrant’s Nominating Committee’s provisions with respect to nominations of Trustees to its Board are as follows:
A candidate for nomination as Trustee submitted by a shareholder will not be deemed to be properly submitted to the Committee for the Committee’s consideration unless the following requirements have been met and procedures followed:
1. Each eligible shareholder or shareholder group may submit no more than one nominee each calendar year.
2. The nominee must satisfy all qualifications provided herein and in the Fund’s organizational documents, including qualification as a possible Independent Trustee if the nominee is to serve in that capacity.
4
· The nominee may not be the nominating shareholder, a member of the nominating shareholder group or a member of the immediate family of the nominating shareholder or any member of the nominating shareholder group.(1)
· Neither the nominee nor any member of the nominee’s immediate family may be currently employed or employed within the year prior to the nomination by any nominating shareholder entity or entity in a nominating shareholder group.
· Neither the nominee nor any immediate family member of the nominee is permitted to have accepted directly or indirectly, during the year of the election for which the nominee’s name was submitted, during the immediately preceding calendar year, or during the year when the nominee’s name was submitted, any consulting, advisory, or other compensatory fee from the nominating shareholder or any member of a nominating shareholder group.
· The nominee may not be an executive officer, director or person fulfilling similar functions of the nominating shareholder or any member of the nominating shareholder group, or of an affiliate of the nominating shareholder or any such member of the nominating shareholder group.
· The nominee may not control the nominating shareholder or any member of the nominating shareholder group (or, in the case of a holder or member that is a fund, an interested person of such holder or member as defined by Section 2(a)(19) of the 1940 Act).
· A shareholder or shareholder group may not submit for consideration a nominee which has previously been considered by the Committee.
3. In order for the Committee to consider shareholder submissions, the following requirements must be satisfied regarding the shareholder or shareholder group submitting the proposed nominee:
· Any shareholder or shareholder group submitting a proposed nominee must beneficially own, either individually or in the aggregate, more than 5% of a Fund’s (or a series thereof) securities that are eligible to vote both at the time of submission of the nominee and at the time of the Board member election. Each of the securities used for purposes of calculating this ownership must have been held continuously for at least two years as of the date of the nomination. In addition, such securities must continue to be held through the date of the meeting. The nominating shareholder or shareholder group must also bear the economic risk of the investment.
· The nominating shareholder or shareholder group must also submit a certification which provides the number of shares which the person or group has (a) sole power to vote or direct the vote; (b) shared power to vote or direct the vote; (c) sole power to dispose or direct the disposition of such shares; and (d) shared power to dispose or direct the disposition of such shares. In addition the certification shall provide that the shares have been held continuously for at least two years.
4. Shareholders or shareholder groups submitting proposed nominees must substantiate compliance with the above requirements at the time of submitting their proposed nominee as part of their written submission to the attention of the Fund’s Secretary, who will provide all submissions to the Committee. This submission to the Fund must include:
· the shareholder’s contact information;
(1) Terms such as “immediate family member” and “control” shall be interpreted in accordance with the federal securities laws.
5
· the nominee’s contact information and the number of applicable Fund shares owned by the proposed nominee;
· all information regarding the nominee that would be required to be disclosed in solicitations of proxies for elections of directors required by Regulation 14A under the Securities Exchange Act of 1934; and
· a notarized letter executed by the nominee, stating his or her intention to serve as a nominee and be named in a Fund’s proxy statement, if so designated by the Committee and the Fund’s Board.
5. The Committee will consider all submissions meeting the applicable requirements stated herein that are received by December 31 of the most recently completed calendar year.
Item 11: Controls and Procedures.
(a) The Registrant’s principal executive officer and principal financial officer evaluated the Registrant’s disclosure controls and procedures within 90 days of this filing and have concluded that the Registrant’s disclosure controls and procedures (as defined in Rule 30a-3(c) under the Investment Company Act of 1940) are appropriately designed to ensure that information required to be disclosed by Registrant in the reports that it files on Form N-CSR (a) is accumulated and communicated to Registrant’s management, including its principal executive officer and principal financial officer, to allow timely decisions regarding required disclosure, and (b) is recorded, processed, summarized and reported, within the time periods specified in the rules and forms adopted by the U.S. Securities and Exchange Commission.
(b) The Registrant’s principal executive officer and principal financial officer are aware of no change in the Registrant’s internal control over financial reporting that occurred during the Registrant’s most recent fiscal quarter that has materially affected, or is reasonably likely to materially affect, the Registrant’s internal control over financial reporting.
Item 12: Exhibits.
(a) (1) Registrant’s code of ethics (that is the subject of the disclosure required by Item 2(a)) is attached.
(2) Separate certifications for Registrant’s principal executive officer and principal financial officer, as required by Rule 30a-2(a) under the 1940 Act, are attached.
(3) Not applicable.
(b) A certification for Registrant’s principal executive officer and principal financial officer, as required by Rule 30a-2(b) under the 1940 Act, is attached. The certification furnished pursuant to this paragraph is not deemed to be “filed” for purposes of Section 18 of the Securities Act of 1934, or otherwise subject to liability of that section. Such certification is not deemed to be incorporated by reference into any filing under the Securities Act of 1933 or the Securities Exchange Act of 1934, except to the extent that the Registrant specifically incorporates it by reference
6
SIGNATURES
Pursuant to the requirements of the Securities Exchange Act of 1934 and the Investment Company Act of 1940, the Registrant has duly caused this report to be signed on its behalf by the undersigned, thereunto duly authorized.
| AEGON/Transamerica Series Trust |
| (Registrant) |
| |
| By: | /s/ John K. Carter |
| | John K. Carter |
| | Chief Executive Officer |
| | Date: March 7, 2008 |
| | |
Pursuant to the requirements of the Securities Exchange Act of 1934 and the Investment Company Act of 1940, this report has been signed below by the following persons on behalf of the Registrant and in the capacities and on the dates indicated.
| By: | /s/ John K. Carter | |
| | John K. Carter | |
| | Chief Executive Officer | |
| | Date: March 7, 2008 | |
| | |
| | |
| By: | /s/ Joseph P. Carusone | |
| | Joseph P. Carusone | |
| | Principal Financial Officer | |
| | Date: March 7, 2008 | |
7
EXHIBIT INDEX
Exhibit No. | | Description of Exhibit |
| | |
12(a)(1) | | Code of Ethics for Principal Executive and Principal Financial Officers |
12(a)(2)(i) | | Section 302 N-CSR Certification of Principal Executive Officer |
12(a)(2)(ii) | | Section 302 N-CSR Certification of Principal Financial Officer |
12(b) | | Section 906 N-CSR Certification of Principal Executive Officer and Principal Financial Officer |
8