UNITED STATES
SECURITIES AND EXCHANGE COMMISSION
Washington, D.C. 20549
FORM N-CSR
CERTIFIED SHAREHOLDER REPORT OF REGISTERED
MANAGEMENT INVESTMENT COMPANIES
Investment Company Act file number | 811-04409 |
|
Eaton Vance Municipals Trust |
(Exact name of registrant as specified in charter) |
|
The Eaton Vance Building, 255 State Street, Boston, Massachusetts | | 02109 |
(Address of principal executive offices) | | (Zip code) |
|
Alan R. Dynner
The Eaton Vance Building, 255 State Street, Boston, Massachusetts 02109 |
(Name and address of agent for service) |
|
Registrant’s telephone number, including area code: | (617) 482-8260 | |
|
Date of fiscal year end: | July 31 | |
|
Date of reporting period: | January 31, 2005 | |
| | | | | | | | |
Item 1. Reports to Stockholders
[Note to Filers: Insert Shareholder Report Here]

IMPORTANT NOTICES REGARDING PRIVACY,
DELIVERY OF SHAREHOLDER DOCUMENTS,
PORTFOLIO HOLDINGS, AND PROXY VOTING
Privacy. The Eaton Vance organization is committed to ensuring your financial privacy. Each of the financial institutions identified below has in effect the following policy (“Privacy Policy”) with respect to nonpublic personal information about its customers:
• Only such information received from you, through application forms or otherwise, and information about your Eaton Vance fund transactions will be collected. This may include information such as name, address, social security number, tax status, account balances and transactions.
• None of such information about you (or former customers) will be disclosed to anyone, except as permitted by law (which includes disclosure to employees necessary to service your account). In the normal course of servicing a customer’s account, Eaton Vance may share information with unaffiliated third parties that perform various required services such as transfer agents, custodians and broker/dealers.
• Policies and procedures (including physical, electronic and procedural safeguards) are in place that are designed to protect the confidentiality of such information.
• We reserve the right to change our Privacy Policy at any time upon proper notification to you. Customers may want to review our Policy periodically for changes by accessing the link on our homepage: www.eatonvance.com.
Our pledge of privacy applies to the following entities within the Eaton Vance organization: the Eaton Vance Family of Funds, Eaton Vance Management, Eaton Vance Investment Counsel, Boston Management and Research, and Eaton Vance Distributors, Inc.
In addition, our Privacy Policy only applies to those Eaton Vance customers who are individuals and who have a direct relationship with us. If a customer’s account (i.e., fund shares) is held in the name of a third-party financial adviser/ broker-dealer, it is likely that only such adviser’s privacy policies apply to the customer. This notice supersedes all previously issued privacy disclosures.
For more information about Eaton Vance’s Privacy Policy, please call 1-800-262-1122.
Delivery of Shareholder Documents. The Securities and Exchange Commission permits funds to deliver only one copy of shareholder documents, including prospectuses, proxy statements and shareholder reports, to fund investors with multiple accounts at the same residential or post office box address. This practice is often called “householding” and it helps eliminate duplicate mailings to shareholders.
Eaton Vance, or your financial adviser, may household the mailing of your documents indefinitely unless you instruct Eaton Vance, or your financial adviser, otherwise.
If you would prefer that your Eaton Vance documents not be householded, please contact Eaton Vance at 1-800-262-1122, or contact your financial adviser.
Your instructions that householding not apply to delivery of your Eaton Vance documents will be effective within 30 days of receipt by Eaton Vance or your financial adviser.
Portfolio Holdings. Each Eaton Vance Fund and its underlying Portfolio (if applicable) will file a schedule of its portfolio holdings on Form N-Q with the Securities and Exchange Commission for the first and third quarters of each fiscal year. The Form N-Q will be available on the Eaton Vance website www.eatonvance.com, by calling Eaton Vance at 1-800-262-1122 or in the EDGAR database on the Securities and Exchange Commision’s website at www.sec.gov. Form N-Q may also be reviewed and copied at the SEC’s public reference room in Washington, D.C. (call 1-800-732-0330 for information on the operation of the public reference room).
Proxy Voting. From time to time, funds are required to vote proxies related to the securities held by the funds. The Eaton Vance Funds or their underlying Portfolios (if applicable) vote proxies according to a set of policies and procedures approved by the Funds’ and Portfolios’ Boards. You may obtain a description of these policies and procedures and information on how the Funds or Portfolios voted proxies relating to portfolio securities during the most recent 12 month period ended June 30, without charge, upon request, by calling 1-800-262-1122. This description is also available on the Securities and Exchange Commission’s website at www.sec.gov.
Eaton Vance Municipals Funds as of January 31, 2005
T A B L E O F C O N T E N T S
1
Eaton Vance Municipals Funds as of January 31, 2005
L E T T E R T O S H A R E H O L D E R S

Thomas J. Fetter
President
The municipal bond market is a center of capital formation for states, municipalities and, in some cases, private economic initiatives. In this edition of our continuing educational series, we will discuss industrial development revenue (IDR) bonds. IDR bonds have long been used as a financing mechanism by local governments to provide assistance to local employers and encourage job retention and creation within their communities.
IDR bonds finance private activities that benefit the public...
IDR bonds are issued by municipal authorities to finance projects and facilities used by private corporations. Historically, IDR bonds have represented a partnership between the private and public sectors – a source of dedicated funding for companies and a source of job creation in projects beneficial to local communities. The “Private-Activities” provision of the Tax Reform Act of 1986 permits issuance of tax-exempt bonds for specific activities, including pollution control; gas and electric service; water distribution; wastewater systems; solid waste disposal; airports and selected transportation projects; and other industrial projects.
The Act also placed a cap on the dollar amount that may be raised for IDR bonds in each state, limiting the amount to $50 per person/per state/per year, with a $150 million maximum. These limitations provide protection against potential abuse and ensure that tax-exempt IDR bonds will indeed be issued for projects that will benefit the public.
IDR bonds finance utility-related projects and other industrial initiatives...
Typically, IDR bond projects provide financing for manufacturing, processing or utility facilities. Historically, about one-half of these bonds have been issued to finance pollution control facilities for manufacturers and electric utilities. As many utilities and manufacturers have been ordered to comply with stricter environmental and fuel standards, pollution control bonds have helped finance the retrofits of existing plants. Other IDR bonds have served as inducements from state and local issuers to locate plants or build new facilities, in the hope that such construction might generate further economic growth for a community.
IDR bonds are secured by corporate revenues – not those of state or local governments...
IDR bond issues are secured by the credit of the underlying corporation. The municipal issuing authority acts solely as a conduit to permit tax-exempt financing. The corporation pledges to make payments sufficient to meet all debt service obligations. Unlike some revenue issues, IDR bonds are backed by revenues of the entire corporation, not solely by those of the project being financed.
Because IDR bonds are backed by corporate revenues and not by the taxing authority of a state or local jurisdiction, they have historically provided coupon premiums above those of general obligations and other more traditional revenue bonds. Bonds may be either collateralized or unsecured. Collateralized bonds have a lien against the company’s assets, which may provide bond holders enhanced bargaining power in the event of a bankruptcy. Unsecured bonds have no such lien.
While providing new opportunities, IDR bonds require rigorous analysis...
While IDR bonds may provide unusual investment opportunities, they also may entail increased risk, and therefore, demand especially intensive analysis. At Eaton Vance, we have credit analysts and resources dedicated to IDR bond research.
IDR bonds represent a key segment of the municipal bond market and should remain an important source of capital formation. In our view, the experience and resources needed to evaluate these issues further demonstrates the value of professional management. We will continue to look for opportunities in this sector of the municipal market.
| Sincerely, |
| 
|
| Thomas J. Fetter |
| President |
| March 9, 2005 |
Fund shares are not insured by the FDIC and are not deposits or other obligations of, or guaranteed by, any depository institution. Shares are subject to investment risks, including possible loss of principal invested.
2
Eaton Vance Municipals Funds as of January 31, 2005
M A R K E T R E C A P
Despite rising core inflation, an alarming jump in the Federal budget deficit and a hike in short-term interest rates, the U.S. economy remained on track for moderate growth in the six months ended January 31, 2005. One major factor for fixed-income investors during the period was the spike in gasoline and energy prices. Nonetheless, consumers remained fairly upbeat, with holiday season spending actually exceeding last year’s levels.
The U.S. economy continued its recovery in 2004, as manufacturing rebounded...
The nation’s Gross Domestic Product grew by 3.1% in the fourth quarter of 2004, according to preliminary Commerce Department figures, following a 4.0% rise in the third quarter. Economic activity was uneven, with some segments slowing and others growing at varying rates. For example, manufacturing activity gained strength, as capital spending picked up among businesses. Transportation equipment, electrical equipment, building materials and machine tools were in especially strong demand.
Demand was not uniform across the board, however, as evidenced by declines in the shipments of textiles, automobiles and some technology products. The residential construction sector remained strong, despite rising mortgage rates. The commercial segment, which has lagged significantly, showed some signs of renewal, with office vacancy rates moving lower.
After a sluggish first half, job growth gained traction in the second half of the fiscal year...
2004 brought some improvement on the job front. After posting minimal job growth in the first half of 2004, the second half brought increased hiring in selected industries. Manufacturing jobs gained, as did hiring in the service sectors, tourism, some transportation areas and the financial sector.
Having postponed new hiring for many months, some businesses apparently became increasingly convinced of the staying power of the recovery. As a result of increased job growth, the nation’s unemployment rate fell to 5.2% in January 2005, down from 5.7% a year earlier.
The Federal Reserve raised short-term interest rates in 2004...
The Federal Reserve pushed short-term rates higher, suggesting it will continue to raise rates in order to keep the economy from growing too quickly and, thereby, reviving inflation. Beginning in June 2004, the Fed increased its Federal Funds rate – a key short-term interest rate barometer – on six occasions, raising that benchmark from 1.00% to 2.50%.
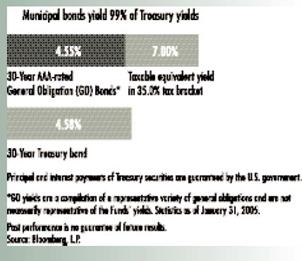
In a difficult environment, the municipal bond market managed a respectable gain for the period. For the six months ended January 31, 2005, the Lehman Brothers Municipal Bond Index had a total return of 4.80%.*
* It is not possible to invest directly in an Index. The Index’s total return does not reflect commissions or expenses that would have been incurred if an investor individually purchased or sold the securities represented in the Index.
The views expressed throughout this report are those of the portfolio managers and are current only through the end of the period of the report as stated on the cover. These views are subject to change at any time based upon market or other conditions, and the investment adviser disclaims any responsibility to update such views. These views may not be relied on as investment advice and, because investment decisions for a fund are based on many factors, may not be relied on as an indication of trading intent on behalf of any Eaton Vance fund.
3
Eaton Vance Arizona Municipals Fund as of January 31, 2005
M A N A G E M E N T’ S D I S C U S S I O N O F F U N D P E R F O R M A N C E

Craig Brandon
Portfolio Manager
The Fund
• The Fund’s Class A shares had a total return of 4.30% during the six months ended January 31, 2005.(1) This return was the result of an increase in net asset value (NAV) to $9.82 per share on January 31, 2005, from $9.65 on July 31, 2004, and the reinvestment of $0.241 in dividends.(2)
• The Fund’s Class B shares had a total return of 4.12% during the six months ended January 31, 2005.(1) This return was the result of an increase in NAV to $10.92 per share on January 31, 2005, from $10.73 on July 31, 2004, and the reinvestment of $0.248 in dividends.(2)
• For comparison, the Lehman Brothers Municipal Bond Index had a total return of 4.80% for the six months ended January 31, 2005.(3)
• Based on the Fund’s most recent dividends and NAVs on January 31, 2005, of $9.82 per share for Class A and $10.92 for Class B, the Fund’s distribution rates were 4.78% and 4.04%, respectively.(4) The distribution rates of Class A and Class B are equivalent to taxable rates of 7.74% and 6.55%, respectively.(5)
• The SEC 30-day yields for Class A and Class B shares at January 31, 2005, were 3.47% and 2.90%, respectively.(6) The SEC 30-day yields of Class A and Class B are equivalent to taxable yields of 5.62% and 4.70%, respectively.(5)
Fund Statistics**
• Number of Issues: | | 53 |
• Average Maturity: | | 17.8 years |
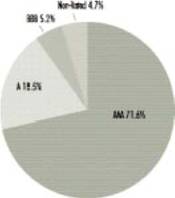
• Average Rating: | | AA |
• Average Call: | | 6.9 years |
• Average Dollar Price: | | $100.77 |
** Fund Statistics are as of January 31, 2005, and are subject to change due to active management.
Management Discussion
• Arizona’s employment picture ended 2004 on an upward trend. The unemployment rate in December 2004 was 4.2%, down from 4.5% the previous month and 5.0% in December 2003. The state’s population growth fueled growth in the construction sector, which added 15,000 jobs during the past year. Despite job losses in manufacturing, that sector still gained strength.
• Escrowed/prerefunded bonds remained the Fund’s largest sector weighting at January 31, 2005. Escrowed bonds are prerefunded and backed by Treasury obligations, most often as the result of refunding of existing higher-coupon debt. Escrowed issues are valued for their high quality and above-average coupons.
• Insured* hospital bonds were prominent holdings in the Fund. Given the intense industry competition, management focused on institutions we believe have sound financial structures and good management and are well-positioned in their local markets.
• The Fund held a number of Puerto Rico bonds, which provided issuer diversification and a more varied coupon mix. Puerto Rico investments included insured* electric utilities, insured* transportation, and insured* lease revenue bonds.
• The Fund was well served by its broad diversification. In addition to diversifying according to issuer, sector and insurer, management had a mixed coupon allocation, balancing income-oriented higher-coupons with performance-minded lower coupons.
* Private insurance does not decrease the risk of loss of principal associated with this investment.
Past performance is no guarantee of future results. Returns are historical and are calculated by determining the percentage change in net asset value or offering price (as applicable) with all distributions reinvested. Investment return and principal value will fluctuate so that shares, when redeemed, may be worth more or less than their original cost. Performance is for the stated time period only; due to market volatility, the Fund’s current performance may be lower or higher than the quoted return. For performance as of the most recent month end, please refer to www.eatonvance.com.
(1) These returns do not include the 4.75% maximum sales charge for the Fund’s Class A shares or the applicable contingent deferred sales charges (CDSC) for Class B shares. If sales charges were deducted, returns would be lower. (2) A portion of the Fund’s income may be subject to federal, state and local income taxes and/or alternative minimum tax. (3) It is not possible to invest directly in an Index. The Index’s total return does not reflect the commissions or expenses that would have been incurred if an investor individually purchased or sold the securities represented in the Index. (4) The Fund’s distribution rate represents actual distributions paid to shareholders and is calculated by dividing the last distribution per share (annualized) by the net asset value. (5) Taxable-equivalent rates assume maximum 38.28% federal and state income tax rate. A lower rate would result in lower tax-equivalent figures. (6) The Fund’s SEC yield is calculated by dividing the net investment income per share for the 30-day period by the offering price at the end of the period and annualizing the result.
4
Eaton Vance Arizona Municipals Fund as of January 31, 2005
F U N D P E R F O R M A N C E
Performance* | | Class A | | Class B | |
Average Annual Total Returns (at net asset value) | | | | | |
One Year | | 4.83 | % | 4.28 | % |
Five Years | | 6.89 | | 6.15 | |
Ten Years | | 5.98 | | 5.33 | |
Life of Fund† | | 4.99 | | 5.73 | |
SEC Average Annual Total Returns (including sales charge or applicable CDSC) | | | | | |
One Year | | -0.14 | % | -0.71 | % |
Five Years | | 5.86 | | 5.83 | |
Ten Years | | 5.47 | | .33 | |
Life of Fund† | | 4.53 | | .73 | |
†Inception date: Class A: 12/13/93; Class B: 7/25/91
* Average annual total returns do not include the 4.75% maximum sales charge for Class A shares or the applicable contingent deferred sales charges (CDSC) for Class B shares. If sales charges were deducted, returns would be lower. SEC average annual total returns for Class A reflect the maximum 4.75% sales charge. SEC returns for Class B reflect applicable CDSC based on the following schedule: 5% - 1st and 2nd years; 4% - 3rd year; 3% - 4th year; 2% - 5th year; 1% - 6th year.
Past performance is no guarantee of future results. Returns are historical and are calculated by determining the percentage change in net asset value or offering price (as applicable) with all distributions reinvested. Investment return and principal value will fluctuate so that shares, when redeemed, may be worth more or less than their original cost. Performance is for the stated time period only; due to market volatility, the Fund’s current performance may be lower or higher than the quoted return. For performance as of the most recent month end, please refer to www.eatonvance.com.
Rating Distribution**
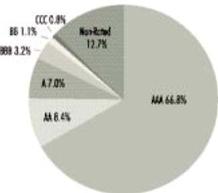
** Rating Distributions are as of January 31, 2005, and are subject to change due to active management.
5
Eaton Vance Colorado Municipals Fund as of January 31, 2005
M A N A G E M E N T’ S D I S C U S S I O N O F F U N D P E R F O R M A N C E

William H. Ahern
Portfolio Manager
The Fund
• The Fund’s Class A shares had a total return of 4.33% during the six months ended January 31, 2005.(1) This return was the result of an increase in net asset value (NAV) to $9.75 per share on January 31, 2005, from $9.57 on July 31, 2004, and the reinvestment of $0.230 in dividends.(2)
• The Fund’s Class B shares had a total return of 4.06% during the six months ended January 31, 2005.(1) This return was the result of an increase in NAV to $10.61 per share on January 31, 2005, from $10.42 on July 31, 2004, and the reinvestment of $0.230 in dividends.(2)
• For comparison, the Lehman Brothers Municipal Bond Index had a total return of 4.80% for the six months ended January 31, 2005.(3)
• Based on the Fund’s most recent dividends and NAVs on January 31, 2005 of $9.75 per share for Class A and $10.61 for Class B, the Fund’s distribution rates were 4.61% and 3.86%, respectively.(4) The distribution rates of Class A and Class B are equivalent to taxable rates of 7.44% and 6.23%, respectively.(5)
• The SEC 30-day yields for Class A and Class B shares at January 31, 2005 were 4.05% and 3.51%, respectively.(6) The SEC 30-day yields of Class A and Class B are equivalent to taxable yields of 6.53% and 5.66%, respectively.(5)
Fund Statistics**
• Number of Issues: | | 40 |
• Average Maturity: | | 20.5 years |
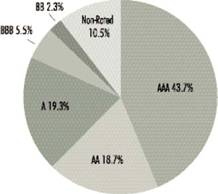
• Average Rating: | | AA |
• Average Call: | | 7.9 years |
• Average Dollar Price: | | $96.75 |
** Fund Statistics are as of January 31, 2005, and are subject to change due to active management.
Management Discussion
• Colorado’s economic recovery gained strength through 2004 and ended the year on a positive note. A renewed surge in technology spending by businesses boosted the state’s economy, which had been sent into a severe slump after the “dotcom” bust of recent years. Moreover, employment, retail, and construction data all showed significant improvement.
• Representing 22.6% of net assets, insured* transportation bonds were the Fund’s largest sector weighting at January 31, 2005. Investments included issues for highways from various issuers, both in Colorado and in Puerto Rico. Typically, Puerto Rico issues offer good quality and further opportunities for diversification, as well as being tax-exempt in Colorado.
• Hospital bonds were significant investments for the Fund, representing a geographically diverse range of institutions throughout the state. Management emphasized hospitals with sound cost structures, good market share and in-demand health care specialities.
• Insured* general obligation bonds (GOs) were another focus for the Fund. Secured by local property taxes, they are deemed very high quality debt. Investments included a water and wastewater public improvement GO, as well as an issue for a Pueblo County school district. Such GOs are valued by investors in an economy in which there are lingering uncertainties about some industrial issuers.
• Industrial development revenue bonds were among the top sector weightings for the Fund at January 31, 2005. Management remained selective, focusing on one of the better-performing airlines, as well as several Puerto Rico issuers.
* Private insurance does not decrease the risk of loss of principal associated with this investment.
Past performance is no guarantee of future results. Returns are historical and are calculated by determining the percentage change in net asset value or offering price (as applicable) with all distributions reinvested. Investment return and principal value will fluctuate so that shares, when redeemed, may be worth more or less than their original cost. Performance is for the stated time period only; due to market volatility, the Fund’s current performance may be lower or higher than the quoted return. For performance as of the most recent month end, please refer to www.eatonvance.com.
(1) These returns do not include the 4.75% maximum sales charge for the Fund’s Class A shares or the applicable contingent deferred sales charges (CDSC) for Class B shares. If sales charges were deducted, returns would be lower. (2) A portion of the Fund’s income may be subject to federal, state and local income taxes and/or alternative minimum tax. (3) It is not possible to invest directly in an Index. The Index’s total return does not reflect the commissions or expenses that would have been incurred if an investor individually purchased or sold the securities represented in the Index. (4) The Fund’s distribution rate represents actual distributions paid to shareholders and is calculated by dividing the last distribution per share (annualized) by the net asset value. (5)Taxable-equivalent rates assume maximum 38.01% federal and state income tax rate. A lower rate would result in lower tax-equivalent figures. (6) The Fund’s SEC yield is calculated by dividing the net investment income per share for the 30-day period by the offering price at the end of the period and annualizing the result.
6
Eaton Vance Colorado Municipals Fund as of January 31, 2005
F U N D P E R F O R M A N C E
Performance* | | Class A | | Class B | |
Average Annual Total Returns (at net asset value) | | | | | |
One Year | | 4.54 | % | 3.86 | % |
Five Years | | 7.41 | | 6.64 | |
Ten Years | | 6.18 | | 5.53 | |
Life of Fund† | | 5.01 | | 5.26 | |
SEC Average Annual Total Returns (including sales charge or applicable CDSC) | | | | | |
One Year | | -0.45 | % | -1.12 | % |
Five Years | | 6.36 | | 6.33 | |
Ten Years | | 5.67 | | 5.53 | |
Life of Fund† | | 4.56 | | 5.26 | |
†Inception date: Class A: 12/10/93; Class B: 8/25/92
* Average annual total returns do not include the 4.75% maximum sales charge for Class A shares or the applicable contingent deferred sales charges (CDSC) for Class B shares. If sales charges were deducted, returns would be lower. SEC average annual total returns for Class A reflect the maximum 4.75% sales charge. SEC returns for Class B reflect applicable CDSC based on the following schedule: 5% - 1st and 2nd years; 4% - 3rd year; 3% - 4th year; 2% - 5th year; 1% - 6th year.
Past performance is no guarantee of future results. Returns are historical and are calculated by determining the percentage change in net asset value or offering price (as applicable) with all distributions reinvested. Investment return and principal value will fluctuate so that shares, when redeemed, may be worth more or less than their original cost. Performance is for the stated time period only; due to market volatility, the Fund’s current performance may be lower or higher than the quoted return. For performance as of the most recent month end, please refer to www.eatonvance.com.
Rating Distribution**
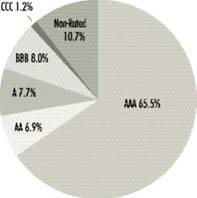
** Rating Distributions are as of January 31, 2005, and are subject to change due to active management.
7
Eaton Vance Connecticut Municipals Fund as of January 31, 2005
M A N A G E M E N T ’S D I S C U S S I O N O F F U N D P E R F O R M A N C E

William H. Ahern
Portfolio Manager
The Fund
• The Fund’s Class A shares had a total return of 3.92% during the six months ended January 31, 2005.(1) This return was the result of an increase in net asset value (NAV) to $10.78 per share on January 31, 2005, from $10.61 on July 31, 2004, and the reinvestment of $0.243 in dividends.(2)
• The Fund’s Class B shares had a total return of 3.62% during the six months ended January 31, 2005.(1) This return was the result of an increase in NAV to $10.72 per share on January 31, 2005, from $10.56 on July 31, 2004, and the reinvestment of $0.218 in dividends.(2)
• For comparison, the Lehman Brothers Municipal Bond Index had a total return of 4.80% for the six months ended January 31, 2005.(3)
• Based on the Fund’s most recent dividends and NAVs on January 31, 2005 of $10.78 per share for Class A and $10.72 for Class B, the Fund’s distribution rates were 4.35% and 3.61%, respectively.(4) The distribution rates of Class A and Class B are equivalent to taxable rates of 7.04% and 5.85%, respectively.(5)
• The SEC 30-day yields for Class A and Class B shares at January 31, 2005 were 3.45% and 2.88%, respectively.(6) The SEC 30-day yields of Class A and Class B are equivalent to taxable yields of 5.59% and 4.66%, respectively.(5)
Fund Statistics**
• Number of Issues: | | 75 | |
• Average Maturity: | | 18.1 years | |
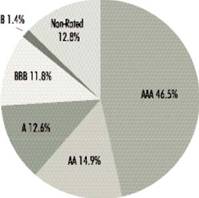
• Average Rating: | | AA | |
• Average Call: | | 7.3 years | |
• Average Dollar Price: | | $108.40 | |
** Fund Statistics are as of January 31, 2005, and are subject to change due to active management.
Management Discussion
• While Connecticut’s gross state product slowed slightly from its 2003 growth rate of 4.0%, the state’s economy still profited from the improvement of the national economy. Increased defense spending, for example, benefited Connecticut’s manufacturing sector. The unemployment rate was 4.6% in December 2004.
• Insured* general obligations remained the Fund’s largest sector weighting at January 31, 2005 and provided a high-quality investment in a still-recovering economy. With a slow recovery constraining tax revenue growth, the Fund focused on communities that management believes can maintain property values and stable revenues.
• Insured* education bonds were the Fund’s next largest sector weighting. The issuers in this group have enjoyed stable revenues despite the recent economic fluctuations and included bonds from the state’s higher education system as well as some of its esteemed private institutes, such as Fairfield University and Trinity College.
• Insured* transportation bonds were another investment focus for the Fund. Investments included issues for the Bradley International Airport in Windsor Locks, CT, and highway bonds issued by the Puerto Rico Highway and Transportation Authority. Typically, Puerto Rico issues offer good quality and further opportunities for diversification, as well as being tax-exempt in Connecticut.
• Management continued to focus on upgrading the Fund’s call protection. As low interest rates prompt refundings, call protection remains an important concern for municipal investors.
* Private insurance does not decrease the risk of loss of principal associated with this investment.
Past performance is no guarantee of future results. Returns are historical and are calculated by determining the percentage change in net asset value or offering price (as applicable) with all distributions reinvested. Investment return and principal value will fluctuate so that shares, when redeemed, may be worth more or less than their original cost. Performance is for the stated time period only; due to market volatility, the Fund’s current performance may be lower or higher than the quoted return. For performance as of the most recent month end, please refer to www.eatonvance.com.
(1) These returns do not include the 4.75% maximum sales charge for the Fund’s Class A shares or the applicable contingent deferred sales charges (CDSC) for Class B shares. If sales charges were deducted, returns would be lower. (2) A portion of the Fund’s income may be subject to federal, state and local income taxes and/or alternative minimum tax. (3) It is not possible to invest directly in an Index. The Index’s total return does not reflect the commissions or expenses that would have been incurred if an investor individually purchased or sold the securities represented in the Index. (4)The Fund’s distribution rate represents actual distributions paid to shareholders and is calculated by dividing the last distribution per share (annualized) by the net asset value. (5) Taxable-equivalent rates assume maximum 38.25% federal and state income tax rate. A lower rate would result in lower tax-equivalent figures. (6) The Fund’s SEC yield is calculated by dividing the net investment income per share for the 30-day period by the offering price at the end of the period and annualizing the result.
8
Eaton Vance Connecticut Municipals Fund as of January 31, 2005
F U N D P E R F O R M A N C E
Performance* | | Class A | | Class B | |
Average Annual Total Returns (at net asset value) | | | | | |
One Year | | 4.04 | % | 3.32 | % |
Five Years | | 6.99 | | 6.20 | |
Ten Years | | 6.24 | | 5.44 | |
Life of Fund† | | 5.94 | | 5.16 | |
SEC Average Annual Total Returns (including sales charge or applicable CDSC) | | | | | |
One Year | | -0.90 | % | -1.64 | % |
Five Years | | 5.94 | | 5.88 | |
Ten Years | | 5.73 | | 5.44 | |
Life of Fund† | | 5.47 | | 5.16 | |
†Inception date: Class A: 4/19/94; Class B: 5/1/92
* Average annual total returns do not include the 4.75% maximum sales charge for Class A shares or the applicable contingent deferred sales charges (CDSC) for Class B shares. If sales charges were deducted, returns would be lower. SEC average annual total returns for Class A reflect the maximum 4.75% sales charge. SEC returns for Class B reflect applicable CDSC based on the following schedule: 5% - 1st and 2nd years; 4% - 3rd year; 3% - 4th year; 2% - 5th year; 1% - 6th year.
Past performance is no guarantee of future results. Returns are historical and are calculated by determining the percentage change in net asset value or offering price (as applicable) with all distributions reinvested. Investment return and principal value will fluctuate so that shares, when redeemed, may be worth more or less than their original cost. Performance is for the stated time period only; due to market volatility, the Fund’s current performance may be lower or higher than the quoted return. For performance as of the most recent month end, please refer to www.eatonvance.com.
Rating Distribution**
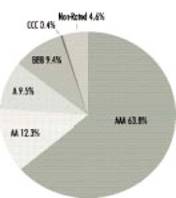
**Rating Distributions are as of January 31, 2005, and are subject to change due to active management.
9
Eaton Vance Michigan Municipals Fund as of January 31, 2005
M A N A G E M E N T ’S D I S C U S S I O N O F F U N D P E R F O R M A N C E

William H. Ahern
Portfolio Manager
The Fund
• The Fund’s Class A shares had a total return of 4.34% during the six months ended January 31, 2005.(1) This return was the result of an increase in net asset value (NAV) to $9.66 per share on January 31, 2005, from $9.48 on July 31, 2004, and the reinvestment of $0.228 in dividends.(2)
• The Fund’s Class B shares had a total return of 4.22% during the six months ended January 31, 2005.(1) This return was the result of an increase in NAV to $10.79 per share on January 31, 2005, from $10.58 on July 31, 2004, and the reinvestment of $0.232 in dividends.(2)
• For comparison, the Lehman Brothers Municipal Bond Index had a total return of 4.80% for the six months ended January 31, 2005.(3)
• Based on the Fund’s most recent dividends and NAVs on January 31, 2005 of $9.66 per share for Class A and $10.79 for Class B, the Fund’s distribution rates were 4.57% and 3.83%, respectively.(4) The distribution rates of Class A and Class B are equivalent to taxable rates of 7.32% and 6.13%, respectively.(5)
• The SEC 30-day yields for Class A and Class B shares at January 31, 2005 were 3.63% and 3.07%, respectively.(6)The SEC 30-day yields of Class A and Class B are equivalent to taxable yields of 5.81% and 4.92%, respectively.(5)
Fund Statistics**
• Number of Issues: | | 48 | |
• Average Maturity: | | 20.4 years | |
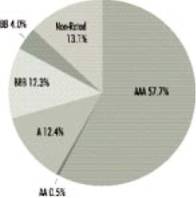
• Average Rating: | | AA+ | |
• Average Call: | | 7.3 years | |
• Average Dollar Price: | | $101.75 | |
**Fund Statistics are as of January 31, 2005, and are subject to change due to active management.
Management Discussion
• Michigan’s economic recovery stalled in 2004 and employment gains lagged the rest of the nation’s. The state continued to lose jobs, but at a slower pace than in the previous 3 years. Manufacturing, which accounts for about 16 percent of Michigan employment, lost the most jobs in 2004. The motor vehicle and parts industry (about one-third of Michigan’s manufacturing jobs) accounted for 84 percent of lost manufacturing jobs.
• At 41.5% of net assets, insured* general obligations were the Fund’s largest sector weighting at January 31, 2005 and provided a high-quality investment in a still-recovering economy. The Fund’s investments were diversified among local school district issuers. Given the slow recovery of the Michigan economy, insured* GOs provided an added measure of security.
• Hospital bonds were also prominent investments for the Fund. With cost containment increasingly a requisite for survival in the hospital industry, management seeks issuers with strong underlying fundamentals, attractive health care specialties and high utilization rates. The Fund added a new holding that management believed to meet this criteria, a bond for the Otsego Memorial Hospital Association.
• Insured* education bonds were among the Fund’s larger sector weightings at January 31, 2005. Investments included bonds from Michigan’s state university system. Historically, these institutions have enjoyed strong applicant demand and stable-to-rising tuition income.
• With continued low interest rates, management continued to adjust coupon structure and upgrade call characteristics, as market conditions dictated. Coupon structure and call features can have a significant influence on the Fund’s performance.
* Private insurance does not decrease the risk of loss of principal associated with this investment.
Past performance is no guarantee of future results. Returns are historical and are calculated by determining the percentage change in net asset value or offering price (as applicable) with all distributions reinvested. Investment return and principal value will fluctuate so that shares, when redeemed, may be worth more or less than their original cost. Performance is for the stated time period only; due to market volatility, the Fund’s current performance may be lower or higher than the quoted return. For performance as of the most recent month end, please refer to www.eatonvance.com.
(1) These returns do not include the 4.75% maximum sales charge for the Fund’s Class A shares or the applicable contingent deferred sales charges (CDSC) for Class B shares. If sales charges were deducted, returns would be lower. (2) A portion of the Fund’s income may be subject to federal, state and local income taxes and/or alternative minimum tax. (3) It is not possible to invest directly in an Index. The Index’s total return does not reflect the commissions or expenses that would have been incurred if an investor individually purchased or sold the securities represented in the Index. (4) The Fund’s distribution rate represents actual distributions paid to shareholders and is calculated by dividing the last distribution per share (annualized) by the net asset value. (5) Taxable-equivalent rates assume maximum 37.57% federal and state income tax rate. A lower rate would result in lower tax-equivalent figures. (6) The Fund’s SEC yield is calculated by dividing the net investment income per share for the 30-day period by the offering price at the end of the period and annualizing the result.
10
Eaton Vance Michigan Municipals Fund as of January 31, 2005
F U N D P E R F O R M A N C E
Performance* | | Class A | | Class B | |
Average Annual Total Returns (at net asset value) | | | | | |
One Year | | 4.75 | % | 4.16 | % |
Five Years | | 7.61 | | 6.83 | |
Ten Years | | 5.97 | | 5.35 | |
Life of Fund† | | 4.83 | | 5.51 | |
SEC Average Annual Total Returns (including sales charge or applicable CDSC) | | | | | |
One Year | | -0.20 | % | -0.84 | % |
Five Years | | 6.57 | | 6.52 | |
Ten Years | | 5.45 | | 5.35 | |
Life of Fund† | | 4.37 | | 5.51 | |
†Inception date: Class A: 12/7/93; Class B: 4/19/91
* Average annual total returns do not include the 4.75% maximum sales charge for Class A shares or the applicable contingent deferred sales charges (CDSC) for Class B shares. If sales charges were deducted, returns would be lower. SEC average annual total returns for Class A reflect the maximum 4.75% sales charge. SEC returns for Class B reflect applicable CDSC based on the following schedule: 5% - 1st and 2nd years; 4% - 3rd year; 3% - 4th year; 2% - 5th year; 1% - 6th year.
Past performance is no guarantee of future results. Returns are historical and are calculated by determining the percentage change in net asset value or offering price (as applicable) with all distributions reinvested. Investment return and principal value will fluctuate so that shares, when redeemed, may be worth more or less than their original cost. Performance is for the stated time period only; due to market volatility, the Fund’s current performance may be lower or higher than the quoted return. For performance as of the most recent month end, please refer to www.eatonvance.com.
Rating Distribution**
**Rating Distributions are as of January 31, 2005, and are subject to change due to active management.
11
Eaton Vance Minnesota Municipals Fund as of January 31, 2005
M A N A G E M E N T ’S D I S C U S S I O N O F F U N D P E R F O R M A N C E

Craig Brandon
Portfolio Manager
The Fund
• The Fund’s Class A shares had a total return of 4.99% during the six months ended January 31, 2005.(1) This return was the result of an increase in net asset value (NAV) to $9.35 per share on January 31, 2005, from $9.11 on July 31, 2004, and the reinvestment of $0.209 in dividends.(2)
• The Fund’s Class B shares had a total return of 4.67% during the six months ended January 31, 2005.(1)This return was the result of an increase in NAV to $10.06 per share on January 31, 2005, from $9.81 on July 31, 2004, and the reinvestment of $0.204 in dividends.(2)
• For comparison, the Lehman Brothers Municipal Bond Index had a total return of 4.80% for the six months ended January 31, 2005.(3)
• Based on the Fund’s most recent dividends and NAVs on January 31, 2005 of $9.35 per share for Class A and $10.06 for Class B, the Fund’s distribution rates were 4.48% and 3.74%, respectively.(4) The distribution rates of Class A and Class B are equivalent to taxable rates of 7.48% and 6.24%, respectively.(5)
• The SEC 30-day yields for Class A and Class B shares at January 31, 2005 were 3.96% and 3.42%, respectively.(6) The SEC 30-day yields of Class A and Class B are equivalent to taxable yields of 6.61% and 5.71%, respectively.(5)
Fund Statistics**
• Number of Issues: | | 41 | |
• Average Maturity: | | 21.3 years | |
• Average Rating: | | AA | |
• Average Call: | | 6.7 years | |
• Average Dollar Price: | | $98.62 | |
**Fund Statistics are as of January 31, 2005, and are subject to change due to active management.
Management Discussion
• After outperforming the national economy in 2003, Minnesota job creation ground to a halt mid-year and lagged the U.S. average in 2004. All but 5,000 of the state’s 23,000 new jobs were created in the first 4 months of 2004. However, at 4.4% in January 2005, the unemployment rate was healthier than the national average.
• Insured* and uninsured electric utility bonds remained a primary focus for the Fund, contributing to the Fund’s performance for the period ended January 31, 2005. The Fund increased its electric utilities holdings in the past six months.
• Management reduced the Fund’s holdings in general obligations (GOs) over the six-month period. Management was able to sell some of its investments in GOs, typically considered among the highest-quality and most liquid municipal bonds available, at attractive prices.
• One of the Fund’s holdings, issued by the city of Minneapolis for its Art Center Facilities, helped to finance a major expansion at the renowned Walker Art Center that nearly doubles the size of the facility.
• Management continued to emphasize the Fund’s call protection. Faced with the prospect of a faster pace of refundings, management believes that call protection remains an important strategic aspect for municipal bond investors.
* Private insurance does not decrease the risk of loss of principal associated with this investment.
Past performance is no guarantee of future results. Returns are historical and are calculated by determining the percentage change in net asset value or offering price (as applicable) with all distributions reinvested. Investment return and principal value will fluctuate so that shares, when redeemed, may be worth more or less than their original cost. Performance is for the stated time period only; due to market volatility, the Fund’s current performance may be lower or higher than the quoted return. For performance as of the most recent month end, please refer to www.eatonvance.com.
(1) These returns do not include the 4.75% maximum sales charge for the Fund’s Class A shares or the applicable contingent deferred sales charges (CDSC) for Class B shares. If sales charges were deducted, returns would be lower. (2) A portion of the Fund’s income may be subject to federal, state and local income taxes and/or alternative minimum tax. (3) It is not possible to invest directly in an Index. The Index’s total return does not reflect the commissions or expenses that would have been incurred if an investor individually purchased or sold the securities represented in the Index. (4)The Fund’s distribution rate represents actual distributions paid to shareholders and is calculated by dividing the last distribution per share (annualized) by the net asset value. (5) Taxable-equivalent rates assume maximum 40.10% federal and state income tax rate. A lower rate would result in lower tax-equivalent figures. (6) The Fund’s SEC yield is calculated by dividing the net investment income per share for the 30-day period by the offering price at the end of the period and annualizing the result.
12
Eaton Vance Minnesota Municipals Fund as of January 31, 2005
FUND PERFORMANCE
Performance* | | Class A | | Class B | |
Average Annual Total Returns (at net asset value) | | | | | |
One Year | | 5.11 | % | 4.46 | % |
Five Years | | 6.70 | | 5.95 | |
Ten Years | | 5.65 | | 4.96 | |
Life of Fund† | | 4.63 | | 4.92 | |
SEC Average Annual Total Returns (including sales charge or applicable CDSC) | | | | | |
One Year | | 0.16 | % | -0.54 | % |
Five Years | | 5.68 | | 5.63 | |
Ten Years | | 5.14 | | 4.96 | |
Life of Fund† | | 4.17 | | 4.92 | |
†Inception date: Class A: 12/9/93; Class B: 7/29/91
* Average annual total returns do not include the 4.75% maximum sales charge for Class A shares or the applicable contingent deferred sales charges (CDSC) for Class B shares. If sales charges were deducted, returns would be lower. SEC average annual total returns for Class A reflect the maximum 4.75% sales charge. SEC returns for Class B reflect applicable CDSC based on the following schedule: 5% - 1st and 2nd years; 4% - 3rd year; 3% - 4th year; 2% - 5th year; 1% - 6th year.
Past performance is no guarantee of future results. Returns are historical and are calculated by determining the percentage change in net asset value or offering price (as applicable) with all distributions reinvested. Investment return and principal value will fluctuate so that shares, when redeemed, may be worth more or less than their original cost. Performance is for the stated time period only; due to market volatility, the Fund’s current performance may be lower or higher than the quoted return. For performance as of the most recent month end, please refer to www.eatonvance.com.
Rating Distribution**
**Rating Distributions are as of January 31, 2005, and are subject to change due to active management.
13
Eaton Vance New Jersey Municipals Fund as of January 31, 2005
M A N A G E M E N T’ S D I S C U S S I O N O F F U N D P E R F O R M A N C E

Robert B. MacIntosh
Portfolio Manager
The Fund
• The Fund’s Class A shares had a total return of 5.65% during the six months ended January 31, 2005.(1) This return was the result of an increase in net asset value (NAV) to $10.45 per share on January 31, 2005, from $10.13 on July 31, 2004, and the reinvestment of $0.246 in dividends.(2)
• The Fund’s Class B shares had a total return of 5.49% during the six months ended January 31, 2005.(1) This return was the result of an increase in NAV to $10.91 per share on January 31, 2005, from $10.57 on July 31, 2004, and the reinvestment of $0.235 in dividends.(2)
• For comparison, the Lehman Brothers Municipal Bond Index had a total return of 4.80% for the six months ended January 31, 2005.(3)
• Based on the Fund’s most recent dividends and NAVs on January 31, 2005 of $10.45 per share for Class A and $10.91 for Class B, the Fund’s distribution rates were 4.62% and 3.88%, respectively.(4) The distribution rates of Class A and Class B are equivalent to taxable rates of 7.81% and 6.56%, respectively.(5)
• The SEC 30-day yields for Class A and Class B shares at January 31, 2005 were 4.22% and 3.69%, respectively.(6) The SEC 30-day yields of Class A and Class B are equivalent to taxable yields of 7.13% and 6.24%, respectively.(5)
Fund Statistics**
• Number of Issues: | | 88 | |
• Average Maturity: | | 26.9 years | |
• Average Rating: | | AA- | |
• Average Call: | | 10.9 years | |
• Average Dollar Price: | | $99.87 | |
** Fund Statistics are as of January 31, 2005, and are subject to change due to active management.
Management Discussion
• New Jersey maintained a healthy employment profile in 2004. The state’s unemployment rate was 4.2% for December 2004, well below the national average. New job creation was led by the natural resources/mining and construction industries, with manufacturing the only sector posting net losses.
• Insured* transportation bonds represented the Fund’s largest sector weighting at January 31, 2005. Investments included bonds for river authorities, port facilities, turnpike authorities and a marine terminal – all key segments of New Jersey’s economic infrastructure.
• Hospital bonds were also a prominent investment for the Fund. Management was selective within this sector, given the industry’s competitive and operating pressures, focusing on issues of well-managed facilities with sound underlying fundamentals and good cost controls. With these criteria in mind, we added to two of the Fund’s positions in this sector, purchasing bonds for the Cooper Health System and the Robert Wood Johnson University Hospital.
• The Fund also added a new insured* general obligation (GO) bond for the Elmwood Park Board of Education. Secured by local property taxes, GOs are generally deemed very high quality debt. and are valued by investors in an economy in which there are lingering uncertainties about some industrial issuers.
• Management continued to focus on increasing the Fund’s call protection. As low interest rates prompt refundings, call protection remains an important concern for municipal investors.
* Private insurance does not decrease the risk of loss of principal associated with this investment.
Past performance is no guarantee of future results. Returns are historical and are calculated by determining the percentage change in net asset value or offering price (as applicable) with all distributions reinvested. Investment return and principal value will fluctuate so that shares, when redeemed, may be worth more or less than their original cost. Performance is for the stated time period only; due to market volatility, the Fund’s current performance may be lower or higher than the quoted return. For performance as of the most recent month end, please refer to www.eatonvance.com.
(1) These returns do not include the 4.75% maximum sales charge for the Fund’s Class A shares or the applicable contingent deferred sales charges (CDSC) for Class B shares. If sales charges were deducted, returns would be lower. (2) A portion of the Fund’s income may be subject to federal, state and local income taxes and/or alternative minimum tax. (3) It is not possible to invest directly in an Index. The Index’s total return does not reflect the commissions or expenses that would have been incurred if an investor individually purchased or sold the securities represented in the Index. (4) The Fund’s distribution rate represents actual distributions paid to shareholders and is calculated by dividing the last distribution per share (annualized) by the net asset value. (5) Taxable-equivalent rates assume maximum 40.83% federal and state income tax rate. A lower rate would result in lower tax-equivalent figures. (6) The Fund’s SEC yield is calculated by dividing the net investment income per share for the 30-day period by the offering price at the end of the period and annualizing the result.
14
Eaton Vance New Jersey Municipals Fund as of January 31, 2005
F U N D P E R F O R M A N C E
Performance* | | Class A | | Class B | |
Average Annual Total Returns (at net asset value) | | | | | |
One Year | | 4.79 | % | 4.18 | % |
Five Years | | 7.74 | | 7.00 | |
Ten Years | | 6.30 | | 5.50 | |
Life of Fund† | | 6.02 | | 5.77 | |
SEC Average Annual Total Returns (including sales charge or applicable CDSC) | | | | | |
One Year | | -0.16 | % | -0.80 | % |
Five Years | | 6.68 | | 6.69 | |
Ten Years | | 5.79 | | 5.50 | |
Life of Fund† | | 5.54 | | 5.77 | |
†Inception date: Class A: 4/13/94; Class B: 1/8/91
* Average annual total returns do not include the 4.75% maximum sales charge for Class A shares or the applicable contingent deferred sales charges (CDSC) for Class B shares. If sales charges were deducted, returns would be lower. SEC average annual total returns for Class A reflect the maximum 4.75% sales charge. SEC returns for Class B reflect applicable CDSC based on the following schedule: 5% - 1st and 2nd years; 4% - 3rd year; 3% - 4th year; 2% - 5th year; 1% - 6th year.
Past performance is no guarantee of future results. Returns are historical and are calculated by determining the percentage change in net asset value or offering price (as applicable) with all distributions reinvested. Investment return and principal value will fluctuate so that shares, when redeemed, may be worth more or less than their original cost. Performance is for the stated time period only; due to market volatility, the Fund’s current performance may be lower or higher than the quoted return. For performance as of the most recent month end, please refer to www.eatonvance.com.
Rating Distribution**
**Rating Distributions are as of January 31, 2005, and are subject to change due to active management.
15
Eaton Vance Pennsylvania Municipals Fund as of January 31, 2005
M A N A G E M E N T’S D I S C U S S I O N OF F U N D P E R F O R M A N C E

Cynthia J. Clemson
Portfolio Manager
The Fund
• The Fund’s Class A shares had a total return of 4.92% during the six months ended January 31, 2005.(1) This return was the result of an increase in net asset value (NAV) to $9.95 per share on January 31, 2005, from $9.73 on July 31, 2004, and the reinvestment of $0.254 in dividends.(2)
• The Fund’s Class B shares had a total return of 4.75% during the six months ended January 31, 2005.(1) This return was the result of an increase in NAV to $10.29 per share on January 31, 2005, from $10.06 on July 31, 2004, and the reinvestment of $0.243 individends.(2)
• For comparison, the Lehman Brothers Municipal Bond Index had a total return of 4.80% for the six months ended January 31, 2005.(3)
• Based on the Fund’s most recent dividends and NAVs on January 31, 2005 of $9.95 per share for Class A and $10.29 for Class B, the Fund’s distribution rates were 4.95% and 4.20%, respectively.(4) The distribution rates of Class A and Class B are equivalent to taxable rates of 7.86% and 6.67%, respectively.(5)
• The SEC 30-day yields for Class A and Class B shares at January 31, 2005 were 4.20% and 3.67%, respectively.(6) The SEC 30-day yields of Class A and Class B are equivalent to taxable yields of 6.67% and 5.83%, respectively.(5)
Fund Statistics**
• Number of Issues: | | 101 | |
• Average Maturity: | | 20.6 years | |
• Average Rating: | | AA- | |
• Average Call: | | 6.9 years | |
• Average Dollar Price: | | $97.88 | |
** Fund Statistics are as of January 31, 2005, and are subject to change due to active management.
Management Discussion
• Pennsylvania’s job situation improved in 2004, following three years of job losses. Employment gains were spread across a range of industries, including retail, business services, education, health care, leisure and tourism.
• Insured* general obligations (GOs) remained the Fund’s largest sector weighting at January 31, 2005 and provided a high-quality investment in a recovering economy. The Fund’s GO investments were focused on school district issues, which historically have had fairly stable revenues.
• Insured* escrowed/prerefunded bonds were another major investment for the Fund. Escrowed bonds are generally considered to be of the highest quality, warranting a AAA credit rating, because they have been prerefunded or escrowed to maturity by their issuers and because they are backed by Treasury bonds. They are also attractive investments because they generally provide a reliable stream of income.
• The Fund also added a new holding in the insured* education sector. Issued by Pennsylvania HEFA, the bond helps finance projects at the University of the Sciences in Philadelphia, a distinguished institution training students in the pharmaceutical and health care fields.
• With cost containment increasingly a requisite for survival in the hospital industry, management is highly selective in this sector, seeking issuers with strong underlying fundamentals, attractive health care specialties and high utilization rates. The Fund added a new holding that management believed to meet this criteria, a bond for the St. Mary Hospital Authority’s Catholic Health East.
• Effective February 1, 2005, Thomas Metzold assumed management responsibilities for the Fund. A vice president of Eaton Vance Management and Boston Research and Management, Mr. Metzold joined Eaton Vance in 1987, and has been a portfolio manager of several Eaton Vance funds since 1991.
* Private insurance does not decrease the risk of loss of principal associated with this investment.
Past performance is no guarantee of future results. Returns are historical and are calculated by determining the percentage change in net asset value or offering price (as applicable) with all distributions reinvested. Investment return and principal value will fluctuate so that shares, when redeemed, may be worth more or less than their original cost. Performance is for the stated time period only; due to market volatility, the Fund’s current performance may be lower or higher than the quoted return. For performance as of the most recent month end, please refer to www.eatonvance.com.
(1) These returns do not include the 4.75% maximum sales charge for the Fund’s Class A shares or the applicable contingent deferred sales charges (CDSC) for Class B shares. If sales charges were deducted, returns would be lower. (2) A portion of the Fund’s income may be subject to federal, state and local income taxes and/or alternative minimum tax. (3) It is not possible to invest directly in an Index. The Index’s total return does not reflect the commissions or expenses that would have been incurred if an investor individually purchased or sold the securities represented in the Index. (4) The Fund’s distribution rate represents actual distributions paid to shareholders and is calculated by dividing the last distribution per share (annualized) by the net asset value. (5) Taxable-equivalent rates assume maximum 37.00% federal and state income tax rate. A lower rate would result in lower tax-equivalent figures. (6) The Fund’s SEC yield is calculated by dividing the net investment income per share for the 30-day period by the offering price at the end of the period and annualizing the result.
16
Eaton Vance Pennsylvania Municipals Fund as of January 31, 2005
F U N D P E R F O R M A N C E
Performance* | | Class A | | Class B | |
Average Annual Total Returns (at net asset value) | | | | | |
One Year | | 5.19 | % | 4.59 | % |
Five Years | | 7.15 | | 6.38 | |
Ten Years | | 6.06 | | 5.25 | |
Life of Fund† | | 5.68 | | 5.48 | |
SEC Average Annual Total Returns (including sales charge or applicable CDSC) | | | | | |
One Year | | 0.16 | % | -0.40 | % |
Five Years | | 6.11 | | 6.07 | |
Ten Years | | 5.54 | | 5.25 | |
Life of Fund† | | 5.20 | | 5.48 | |
†Inception date: Class A: 6/1/94; Class B: 1/8/91
* Average annual total returns do not include the 4.75% maximum sales charge for Class A shares or the applicable contingent deferred sales charges (CDSC) for Class B shares. If sales charges were deducted, returns would be lower. SEC average annual total returns for Class A reflect the maximum 4.75% sales charge. SEC returns for Class B reflect applicable CDSC based on the following schedule: 5% - 1st and 2nd years; 4% - 3rd year; 3% - 4th year; 2% - 5th year; 1% - 6th year.
Past performance is no guarantee of future results. Returns are historical and are calculated by determining the percentage change in net asset value or offering price (as applicable) with all distributions reinvested. Investment return and principal value will fluctuate so that shares, when redeemed, may be worth more or less than their original cost. Performance is for the stated time period only; due to market volatility, the Fund’s current performance may be lower or higher than the quoted return. For performance as of the most recent month end, please refer to www.eatonvance.com.
Rating Distribution**
** Rating Distributions are as of January 31, 2005, and are subject to change due to active management.
17
Eaton Vance Municipals Funds as of January 31, 2005
D I S C L O S U R E O F F U N D E X P E N S E S
Example: As a shareholder of a Fund, you incur two types of costs: (1) transaction costs, including sales charges (loads) on purchases and redemption fees (if applicable); and (2) ongoing costs, including management fees; distribution or service fees; and other Fund expenses. This Example is intended to help you understand your ongoing costs (in dollars) of investing in a Fund and to compare these costs with the ongoing costs of investing in other mutual funds. The Example is based on an investment of $1,000 invested at the beginning of the period and held for the entire period (August 1, 2004 – January 31, 2005).
Actual Expenses: The first section of each table below provides information about actual account values and actual expenses. You may use the information in this line, together with the amount you invested, to estimate the expenses that you paid over the period. Simply divide your account value by $1,000 (for example, an $8,600 account value divided by $1,000 = 8.6), then multiply the result by the number in the first line under the heading entitled “Expenses Paid During Period” to estimate the expenses you paid on your account during this period.
Hypothetical Example for Comparison Purposes: The second section of each table below provides information about hypothetical account values and hypothetical expenses based on a Fund’s actual expense ratio and an assumed rate of return of 5% per year (before expenses), which is not the actual return of the Fund. The hypothetical account values and expenses may not be used to estimate the actual ending account balance or expenses you paid for the period. You may use this information to compare the ongoing costs of investing in the Funds and other funds. To do so, compare this 5% hypothetical example with the 5% hypothetical examples that appear in the shareholder reports of the other funds.
Please note that the expenses shown in the table are meant to highlight your ongoing costs only and do not reflect any transactional costs, such as sales charges (loads) or redemption fees (if applicable). Therefore, the second section of the table is useful in comparing ongoing costs only, and will not help you determine the relative total costs of owning different funds. In addition, if these transactional costs were included, your costs would have been higher.
Eaton Vance Arizona Municipals Fund
| | Beginning Account Value
(8/1/04) | | Ending Account Value
(1/31/05) | | Expenses Paid During Period*
(8/1/04 - 1/31/05) | |
| | | | | | | |
Actual | | | | | | | |
Class A | | $ | 1,000.00 | | $ | 1,043.00 | | $ | 3.97 | |
Class B | | $ | 1,000.00 | | $ | 1,041.20 | | $ | 7.82 | |
Hypothetical | | | | | | | |
(5% return per year before expenses) | | | | | | | |
Class A | | $ | 1,000.00 | | $ | 1,021.30 | | $ | 3.92 | |
Class B | | $ | 1,000.00 | | $ | 1,017.50 | | $ | 7.73 | |
* Expenses are equal to the Fund’s annualized expense ratio of 0.77% for Class A shares and 1.52% for Class B shares multiplied by the average account value over the period, multiplied by 184/365 (to reflect the one-half year period). The Example assumes that the $1,000 was invested at the net asset value per share determined at the close of business on July 31, 2004.
Eaton Vance Colorado Municipals Fund
| | Beginning Account Value
(8/1/04) | | Ending Account Value
(1/31/05) | | Expenses Paid During Period*
(8/1/04 - 1/31/05) | |
| | | | | | | |
Actual | | | | | | | |
Class A | | $ | 1,000.00 | | $ | 1,043.30 | | $ | 3.71 | |
Class B | | $ | 1,000.00 | | $ | 1,040.60 | | $ | 7.56 | |
Hypothetical | | | | | | | |
(5% return per year before expenses) | | | | | | | |
Class A | | $ | 1,000.00 | | $ | 1,021.60 | | $ | 3.67 | |
Class B | | $ | 1,000.00 | | $ | 1,017.80 | | $ | 7.48 | |
* Expenses are equal to the Fund’s annualized expense ratio of 0.72% for Class A shares and 1.47% for Class B shares multiplied by the average account value over the period, multiplied by 184/365 (to reflect the one-half year period). The Example assumes that the $1,000 was invested at the net asset value per share determined at the close of business on July 31, 2004.
18
Eaton Vance Connecticut Municipals Fund
| | Beginning Account Value
(8/1/04) | | Ending Account Value
(1/31/05) | | Expenses Paid During Period*
(8/1/04 - 1/31/05) | |
| | | | | | | |
Actual | | | | | | | |
Class A | | $ | 1,000.00 | | $ | 1,039.20 | | $ | 3.91 | |
Class B | | $ | 1,000.00 | | $ | 1,036.20 | | $ | 7.75 | |
Hypothetical | | | | | | | |
(5% return per year before expenses) | | | | | | | |
Class A | | $ | 1,000.00 | | $ | 1,021.40 | | $ | 3.87 | |
Class B | | $ | 1,000.00 | | $ | 1,017.60 | | $ | 7.68 | |
* Expenses are equal to the Fund’s annualized expense ratio of 0.76% for Class A shares and 1.51% for Class B shares multiplied by the average account value over the period, multiplied by 184/365 (to reflect the one-half year period). The Example assumes that the $1,000 was invested at the net asset value per share determined at the close of business on July 31, 2004.
Eaton Vance Michigan Municipals Fund
| | Beginning Account Value
(8/1/04) | | Ending Account Value
(1/31/05) | | Expenses Paid During Period*
(8/1/04 - 1/31/05) | |
| | | | | | | |
Actual | | | | | | | |
Class A | | $ | 1,000.00 | | $ | 1,043.40 | | $ | 4.07 | |
Class B | | $ | 1,000.00 | | $ | 1,042.20 | | $ | 7.93 | |
Hypothetical | | | | | | | |
(5% return per year before expenses) | | | | | | | |
Class A | | $ | 1,000.00 | | $ | 1,021.20 | | $ | 4.02 | |
Class B | | $ | 1,000.00 | | $ | 1,017.40 | | $ | 7.83 | |
* Expenses are equal to the Fund’s annualized expense ratio of 0.79% for Class A shares and 1.54% for Class B shares multiplied by the average account value over the period, multiplied by 184/365 (to reflect the one-half year period). The Example assumes that the $1,000 was invested at the net asset value per share determined at the close of business on July 31, 2004.
Eaton Vance Minnesota Municipals Fund
| | Beginning Account Value
(8/1/04) | | Ending Account Value
(1/31/05) | | Expenses Paid During Period*
(8/1/04 - 1/31/05) | |
| | | | | | | |
Actual | | | | | | | |
Class A | | $ | 1,000.00 | | $ | 1,049.90 | | $ | 3.82 | |
Class B | | $ | 1,000.00 | | $ | 1,046.70 | | $ | 7.69 | |
Hypothetical | | | | | | | |
(5% return per year before expenses) | | | | | | | |
Class A | | $ | 1,000.00 | | $ | 1,021.50 | | $ | 3.77 | |
Class B | | $ | 1,000.00 | | $ | 1,017.70 | | $ | 7.58 | |
* Expenses are equal to the Fund’s annualized expense ratio of 0.74% for Class A shares and 1.49% for Class B shares multiplied by the average account value over the period, multiplied by 184/365 (to reflect the one-half year period). The Example assumes that the $1,000 was invested at the net asset value per share determined at the close of business on July 31, 2004.
19
Eaton Vance New Jersey Municipals Fund
| | Beginning Account Value
(8/1/04) | | Ending Account Value
(1/31/05) | | Expenses Paid During Period*
(8/1/04 - 1/31/05) | |
| | | | | | | |
Actual | | | | | | | |
Class A | | $ | 1,000.00 | | $ | 1,056.50 | | $ | 4.09 | |
Class B | | $ | 1,000.00 | | $ | 1,054.90 | | $ | 7.98 | |
Hypothetical | | | | | | | |
(5% return per year before expenses) | | | | | | | |
Class A | | $ | 1,000.00 | | $ | 1,021.20 | | $ | 4.02 | |
Class B | | $ | 1,000.00 | | $ | 1,017.40 | | $ | 7.83 | |
* Expenses are equal to the Fund’s annualized expense ratio of 0.79% for Class A shares and 1.54% for Class B shares multiplied by the average account value over the period, multiplied by 184/365 (to reflect the one-half year period). The Example assumes that the $1,000 was invested at the net asset value per share determined at the close of business on July 31, 2004.
Eaton Vance Pennsylvania Municipals Fund
| | Beginning Account Value
(8/1/04) | | Ending Account Value
(1/31/05) | | Expenses Paid During Period*
(8/1/04 - 1/31/05) | |
| | | | | | | |
Actual | | | | | | | |
Class A | | $ | 1,000.00 | | $ | 1,049.20 | | $ | 4.34 | |
Class B | | $ | 1,000.00 | | $ | 1,047.50 | | $ | 8.21 | |
Hypothetical | | | | | | | |
(5% return per year before expenses) | | | | | | | |
Class A | | $ | 1,000.00 | | $ | 1,021.00 | | $ | 4.28 | |
Class B | | $ | 1,000.00 | | $ | 1,017.20 | | $ | 8.08 | |
* Expenses are equal to the Fund’s annualized expense ratio of 0.84% for Class A shares and 1.59% for Class B shares multiplied by the average account value over the period, multiplied by 184/365 (to reflect the one-half year period). The Example assumes that the $1,000 was invested at the net asset value per share determined at the close of business on July 31, 2004.
20
Eaton Vance Arizona Municipals Fund as of January 31, 2005
PORTFOLIO OF INVESTMENTS (Unaudited)
| | Tax-Exempt Investments - 98.1% | | | | | | | | |
Principal Amount
(000's omitted) | |
Security | |
Value | |
| | Education - 0.8% | | | | | | | | |
| $ | 500 | | | Glendale, IDA, (Midwestern University),
5.75%, 5/15/21 | | $ | 549,020 | | |
| | | | | | | $ | 549,020 | | |
| | Electric Utilities - 2.7% | | | | | | | | |
| $ | 700 | | | Pima County, IDA, (Tucson Electric Power Co.),
6.00%, 9/1/29 | | $ | 700,000 | | |
| | 1,000 | | | Salt River, Agriculture Improvements and Power District,
5.00%, 1/1/31 | | | 1,044,810 | | |
| | | | | | | $ | 1,744,810 | | |
| | Escrowed / Prerefunded - 16.0% | | | | | | | | |
| $ | 1,250 | | | Maricopa County, IDA, (Place Five and The Greenery),
Escrowed to Maturity, 8.625%, 1/1/27 | | $ | 1,462,487 | | |
| | 7,500 | | | Maricopa County, Single Family, Escrowed to Maturity,
0.00%, 2/1/16 | | | 4,711,650 | | |
| | 6,500 | | | Phoenix, IDA, Single Family, Escrowed to Maturity,
0.00%, 12/1/14 | | | 4,379,180 | | |
| | | | | | | $ | 10,553,317 | | |
| | General Obligations - 3.6% | | | | | | | | |
| $ | 1,125 | | | Puerto Rico, 0.00%, 7/1/18 | | $ | 631,541 | | |
| | 1,500 | | | Tucson, 5.375%, 7/1/21 | | | 1,732,485 | | |
| | | | | | | $ | 2,364,026 | | |
| | Health Care-Miscellaneous - 1.9% | | | | | | | | |
| $ | 800 | | | Coconino County, IDA, Health Care Institution, (Guidance
Center, Inc.), 5.80%, 6/1/11 | | $ | 758,512 | | |
| | 500 | | | Yavapai County, IDA, Health Care Institution, (West Yavapai
Guidance), 6.625%, 8/15/24 | | | 471,570 | | |
| | | | | | | $ | 1,230,082 | | |
| | Hospital - 6.0% | | | | | | | | |
| $ | 650 | | | Arizona Health Facilities Authority, (John C. Lincoln Health
Network), 5.75%, 12/1/32 | | $ | 682,338 | | |
| | 1,350 | | | Maricopa County, IDA, (Catholic Healthcare),
5.50%, 7/1/26 | | | 1,409,414 | | |
| | 1,000 | | | Scottsdale, IDA, (Scottsdale Healthcare), 5.70%, 12/1/21 | | | 1,078,270 | | |
| | 1,000 | | | Winslow, IDA, (Winslow Memorial Hospital),
5.50%, 6/1/22 | | | 771,180 | | |
| | | | | | | $ | 3,941,202 | | |
Principal Amount
(000's omitted) | |
Security | |
Value | |
| | Housing - 1.8% | | | | | | | | |
| $ | 835 | | | Maricopa County, IDA, (National Health Facilities II),
6.375%, 1/1/19 | | $ | 673,369 | | |
| | 500 | | | Phoenix, IDA, (Woodstone and Silver Springs Apartments),
(Asset Guaranty), 6.25%, 4/1/23 | | | 502,140 | | |
| | | | | | | $ | 1,175,509 | | |
| | Industrial Development Revenue - 2.3% | | | | | | | | |
| $ | 1,000 | | | Casa Grande, (Frito Lay, Inc.), 6.60%, 12/1/10 | | $ | 1,030,200 | | |
| | 650 | | | Phoenix Airport Authority, (America West Airlines, Inc.),
(AMT), 6.25%, 6/1/19 | | | 504,049 | | |
| | | | | | | $ | 1,534,249 | | |
| | Insured-Education - 2.9% | | | | | | | | |
| $ | 1,800 | | | Northern Arizona University, (Research Projects), (AMBAC),
5.00%, 9/1/30 | | $ | 1,888,668 | | |
| | | | | | | $ | 1,888,668 | | |
| | Insured-Electric Utilities - 4.2% | | | | | | | | |
| $ | 755 | | | Pima County, IDA, (Tucson Electric Power Co.), (FSA),
7.25%, 7/15/10 | | $ | 789,277 | | |
| | 670 | | | Puerto Rico Electric Power Authority, (FSA), Variable Rate,
11.528%, 7/1/29(1)(2) | | | 844,267 | | |
| | 500 | | | Puerto Rico Electric Power Authority, (MBIA),
5.00%, 7/1/32 | | | 525,925 | | |
| | 400 | | | Puerto Rico Electric Power Authority, (MBIA), Variable Rate,
12.295%, 7/1/16(1)(2) | | | 611,248 | | |
| | | | | | | $ | 2,770,717 | | |
| | Insured-Escrowed / Prerefunded - 7.0% | | | | | | | | |
| $ | 1,000 | | | Maricopa County, IDA, (Samaritan Health Services),
(MBIA), Escrowed to Maturity, 7.00%, 12/1/16 | | $ | 1,279,230 | | |
| | 1,000 | | | Pima County, IDA, (Carondolet Health Care Corp.), (MBIA),
Escrowed to Maturity, 5.25%, 7/1/11 | | | 1,118,960 | | |
| | 1,000 | | | Puerto Rico, (FGIC), Prerefunded to 7/1/12,
5.00%, 7/1/32 | | | 1,115,530 | | |
| | 1,000 | | | Yuma, IDA, (Yuma Regional Medical Center), (FSA),
Prerefunded to 8/1/11, 5.00%, 8/1/31 | | | 1,113,330 | | |
| | | | | | | $ | 4,627,050 | | |
| | Insured-General Obligations - 1.0% | | | | | | | | |
| $ | 500 | | | Puerto Rico, (FSA), Variable Rate, 9.459%, 7/1/27(1)(2) | | $ | 641,540 | | |
| | | | | | | $ | 641,540 | | |
See notes to financial statements
21
Eaton Vance Arizona Municipals Fund as of January 31, 2005
PORTFOLIO OF INVESTMENTS (Unaudited) CONT'D
Principal Amount
(000's omitted) | |
Security | |
Value | |
| Insured-Hospital - 11.0% | | | | | |
| $ | 1,195 | | | Arizona Health Facilities Authority, (Arizona Healthcare
Systems), (FGIC), 5.50%, 6/1/15 | | $ | 1,372,505 | | |
| | 1,000 | | | Arizona Health Facilities Authority, (Northern Arizona
Healthcare System), (AMBAC), 4.75%, 10/1/30 | | | 1,011,080 | | |
| | 2,000 | | | Maricopa County, IDA, (Mayo Clinic Hospital), (AMBAC),
5.25%, 11/15/37(3) | | | 2,133,940 | | |
| | 1,000 | | | Mesa IDA, (Discovery Health System), (MBIA),
5.625%, 1/1/29 | | | 1,099,810 | | |
| | 1,500 | | | Scottsdale, IDA, (Scottsdale Memorial Hospital), (AMBAC),
6.125%, 9/1/17 | | | 1,652,445 | | |
| | | | | | | $ | 7,269,780 | | |
Insured-Lease Revenue / Certificates of
Participation - 5.6% | | | | | |
| $ | 1,000 | | | Arizona State University, (Research Infrastructure Projects),
(AMBAC), 5.00%, 9/1/30 | | $ | 1,049,260 | | |
| | 550 | | | Marana, Municipal Facilities, (Municipal Property Corp.),
(AMBAC), 5.00%, 7/1/28 | | | 577,126 | | |
| | 480 | | | Prescott Municipal Property Corp., (MBIA), 5.00%, 7/1/34 | | | 502,934 | | |
| | 1,000 | | | Puerto Rico Public Finance Corp., (AMBAC), Variable Rate,
7.86%, 6/1/26(1)(4) | | | 1,171,600 | | |
| | 290 | | | Puerto Rico Public Finance Corp., (AMBAC), Variable Rate,
12.857%, 6/1/24(1)(2) | | | 406,334 | | |
| | | | | | | $ | 3,707,254 | | |
| Insured-Special Tax Revenue - 5.3% | | | | | |
| $ | 1,000 | | | Arizona Tourism and Sports Authority, (Multipurpose Stadium
Facility), (MBIA), 5.00%, 7/1/25 | | $ | 1,066,340 | | |
| | 750 | | | Arizona Tourism and Sports Authority, (Multipurpose Stadium
Facility), (MBIA), 5.00%, 7/1/28 | | | 788,070 | | |
| | 1,400 | | | Puerto Rico Infrastructure Financing Authority, (AMBAC),
Variable Rate, 10.286%, 7/1/28(1)(2) | | | 1,631,448 | | |
| | | | | | | $ | 3,485,858 | | |
| Insured-Transportation - 7.7% | | | | | |
| $ | 3,000 | | | Phoenix Civic Improvements Corp., Airport Revenue, (FGIC),
(AMT), 5.25%, 7/1/27 | | $ | 3,142,350 | | |
| | 1,250 | | | Puerto Rico Highway and Transportation Authority, (MBIA),
5.50%, 7/1/36 | | | 1,406,650 | | |
| | 500 | | | Tucson Street and Highway Revenue, (FGIC),
5.00%, 7/1/18 | | | 541,190 | | |
| | | | | | | $ | 5,090,190 | | |
Principal Amount
(000's omitted) | |
Security | |
Value | |
| | Insured-Water and Sewer - 4.8% | | | | | | | | |
| $ | 1,000 | | | Cottonwood, Property Corp., Water Revenue, (XLCA),
5.00%, 7/1/29 | | $ | 1,044,640 | | |
| | 1,000 | | | Phoenix Civic Improvements Corp., Water System Revenue,
(FGIC), 5.00%, 7/1/22 | | | 1,076,290 | | |
| | 1,000 | | | Phoenix, Civic Improvement Corp., Wastewater System,
(MBIA), 5.00%, 7/1/29 | | | 1,052,510 | | |
| | | | | | | $ | 3,173,440 | | |
| | Other Revenue - 2.6% | | | | | | | | |
| $ | 1,750 | | | Arizona Health Facilities Authority, (Blood Systems, Inc.),
4.75%, 4/1/25 | | $ | 1,740,900 | | |
| | | | | | | $ | 1,740,900 | | |
| | Pooled Loans - 6.2% | | | | | | | | |
| $ | 2,000 | | | Arizona Educational Loan Marketing Corp., (AMT),
6.25%, 6/1/06 | | $ | 2,067,660 | | |
| | 2,000 | | | Arizona Educational Loan Marketing Corp., (AMT),
6.30%, 12/1/08 | | | 2,022,800 | | |
| | | | | | | $ | 4,090,460 | | |
| | Senior Living / Life Care - 2.2% | | | | | | | | |
| $ | 1,800 | | | Arizona Health Facilities Authority, (Care Institute,
Inc. - Mesa), 7.625%, 1/1/26(5) | | $ | 1,447,596 | | |
| | | | | | | $ | 1,447,596 | | |
| | Transportation - 0.8% | | | | | | | | |
| $ | 500 | | | Puerto Rico Highway and Transportation Authority,
5.00%, 7/1/42 | | $ | 513,385 | | |
| | | | | | | $ | 513,385 | | |
| | Water and Sewer - 1.7% | | | | | | | | |
| $ | 1,000 | | | Central Arizona Water Conservation District,
5.50%, 11/1/09 | | $ | 1,115,250 | | |
| | | | | | | $ | 1,115,250 | | |
| | Total Tax-Exempt Investments - 98.1%
(identified cost $58,584,523) | | | | | $ | 64,654,303 | | |
| | Other Assets, Less Liabilities - 1.9% | | | | | $ | 1,275,419 | | |
| | Net Assets - 100.0% | | | | | $ | 65,929,722 | | |
See notes to financial statements
22
Eaton Vance Arizona Municipals Fund as of January 31, 2005
PORTFOLIO OF INVESTMENTS (Unaudited) CONT'D
AMBAC - AMBAC Financial Group, Inc.
AMT - Interest earned from these securities may be considered a tax preference item for purposes of the Federal Alternative Minimum Tax.
FGIC - Financial Guaranty Insurance Company
FSA - Financial Security Assurance, Inc.
MBIA - Municipal Bond Insurance Association
XLCA - XL Capital Assurance, Inc.
The Fund invests primarily in debt securities issued by Arizona municipalities. The ability of the issuers of the debt securities to meet their obligations may be affected by economic developments in a specific industry or municipality. In order to reduce the risk associated with such economic developments, at January 31, 2005, 50.5% of the securities in the portfolio of investments are backed by bond insurance of various financial institutions and financial guaranty assurance agencies. The aggregate percentage insured by an individual financial institution ranged from 1.6% to 17.8% of total investments.
(1) Security exempt from registration under Rule 144A of the Securities Act of 1933. These securities may be sold in transactions exempt from registration, normally to qualified institutional buyers. At January 31, 2005, the aggregate value of the securities is $5,306,437 or 8.0% of the Fund's net assets.
(2) Security has been issued as a leveraged inverse floater bond. The stated interest rate represents the rate in effect at January 31, 2005.
(3) Security (or a portion thereof) has been segregated to cover margin requirements on open financial futures contracts.
(4) Security has been issued as an inverse floater bond. The stated interest rate represents the rate in effect at January 31, 2005.
(5) Security is in default and making only partial interest payments.
See notes to financial statements
23
Eaton Vance Colorado Municipals Fund as of January 31, 2005
PORTFOLIO OF INVESTMENTS (Unaudited)
| Tax-Exempt Investments - 99.6% | | | | | |
Principal Amount
(000's omitted) | |
Security | |
Value | |
| Education - 5.2% | | | | | |
| $ | 1,000 | | | Colorado Educational and Cultural Facilities Authority,
(Alexander Dawson School), 5.30%, 2/15/29 | | $ | 1,041,790 | | |
| | 500 | | | Colorado Springs, (Colorado College), 5.25%, 6/1/24 | | | 544,930 | | |
| | | | | | | $ | 1,586,720 | | |
| Electric Utilities - 3.4% | | | | | |
| $ | 500 | | | Colorado Springs, Utilities, 4.75%, 11/15/34 | | $ | 507,205 | | |
| | 500 | | | Colorado Springs, Utilities, 5.00%, 11/15/33 | | | 520,715 | | |
| | | | | | | $ | 1,027,920 | | |
| Escrowed / Prerefunded - 4.3% | | | | | |
| $ | 3,000 | | | Dawson Ridge, Metropolitan District #1,
Escrowed to Maturity, 0.00%, 10/1/22 | | $ | 1,311,240 | | |
| | | | | | | $ | 1,311,240 | | |
| Hospital - 12.0% | | | | | |
| $ | 350 | | | Aspen Valley, Hospital District, 6.80%, 10/15/24 | | $ | 378,444 | | |
| | 650 | | | Colorado Health Facilities Authority, (Catholic Health
Initiatives), 5.25%, 9/1/21 | | | 689,065 | | |
| | 500 | | | Colorado Health Facilities Authority, (Parkview Medical
Center), 5.00%, 9/1/25 | | | 506,515 | | |
| | 250 | | | Colorado Health Facilities Authority, (Parkview Medical
Center), 6.125%, 9/1/25 | | | 256,927 | | |
| | 500 | | | Colorado Health Facilities Authority, (Portercare Adventist
Health), 6.50%, 11/15/31 | | | 555,585 | | |
| | 500 | | | Colorado Health Facilities Authority, (Vail Valley Medical
Center), 5.80%, 1/15/27 | | | 529,200 | | |
| | 715 | | | University of Colorado Hospital Authority,
5.60%, 11/15/25 | | | 747,919 | | |
| | | | | | | $ | 3,663,655 | | |
| Housing - 7.8% | | | | | |
| $ | 1,000 | | | Denver, Multifamily, (Bank Lofts), (FHA), (AMT),
6.15%, 12/1/16 | | $ | 1,031,970 | | |
| | 345 | | | Lake Creek, (Affordable Housing Corp.), Multifamily,
6.25%, 12/1/23 | | | 320,660 | | |
| | 1,000 | | | Lakewood, Multifamily, (FHA), (AMT),
6.65%, 10/1/25 | | | 1,030,330 | | |
| | | | | | | $ | 2,382,960 | | |
Principal Amount
(000's omitted) | |
Security | |
Value | |
| Industrial Development Revenue - 6.8% | | | | | |
| $ | 500 | | | Colorado HFA, (Waste Management, Inc.), (AMT),
5.70%, 7/1/18 | | $ | 523,660 | | |
| | 500 | | | Denver Airport Special Facilities, (United Airlines), (AMT),
6.875%, 10/1/32(1) | | | 427,500 | | |
| | 750 | | | Puerto Rico Industrial, Medical and Environmental Pollution
Control Facility Finance Authority, (American Home
Products), 5.10%, 12/1/18 | | | 770,168 | | |
| | 500 | | | Puerto Rico Port Authority, (American Airlines), (AMT),
6.25%, 6/1/26 | | | 353,560 | | |
| | | | | | | $ | 2,074,888 | | |
| Insured-Education - 3.9% | | | | | |
| $ | 300 | | | Colorado School of Mines, (MBIA), 0.00%, 12/1/21 | | $ | 138,606 | | |
| | 1,000 | | | University of Colorado, (FGIC), 5.00%, 6/1/27 | | | 1,045,810 | | |
| | | | | | | $ | 1,184,416 | | |
| Insured-General Obligations - 8.0% | | | | | |
| $ | 1,000 | | | Arapahoe County, Water and Wastewater, Public
Improvements District, (MBIA), 5.125%, 12/1/32 | | $ | 1,052,890 | | |
| | 1,000 | | | Pueblo County, School District #70, (FGIC),
5.00%, 12/1/19 | | | 1,127,180 | | |
| | 200 | | | Puerto Rico, (FSA), Variable Rate,
9.459%, 7/1/27(2)(3) | | | 256,616 | | |
| | | | | | | $ | 2,436,686 | | |
| Insured-Housing - 4.9% | | | | | |
| $ | 500 | | | Colorado Educational and Cultural Facilities Authority,
(Student Housing Foundation/University of Colorado),
(AMBAC), 5.00%, 7/1/27 | | $ | 523,140 | | |
| | 955 | | | Thornton, SCA Realty Multifamily, (FSA), 7.10%, 1/1/30 | | | 975,370 | | |
| | | | | | | $ | 1,498,510 | | |
Insured-Lease Revenue / Certificates of
Participation - 1.8% | | | | | |
| $ | 400 | | | Puerto Rico Public Finance Corp., (AMBAC), Variable Rate,
12.857%, 6/1/24(2)(3) | | $ | 560,460 | | |
| | | | | | | $ | 560,460 | | |
| Insured-Special Tax Revenue - 3.6% | | | | | |
| $ | 1,000 | | | Sand Creek, Metropolitan District, (XLCA),
5.375%, 12/1/27 | | $ | 1,088,600 | | |
| | | | | | | $ | 1,088,600 | | |
See notes to financial statements
24
Eaton Vance Colorado Municipals Fund as of January 31, 2005
PORTFOLIO OF INVESTMENTS (Unaudited) CONT'D
Principal Amount
(000's omitted) | |
Security | |
Value | |
| Insured-Transportation - 22.6% | | | | | |
| $ | 3,500 | | | E-470 Colorado Public Highway Authority, (MBIA),
0.00%, 9/1/16 | | $ | 2,127,790 | | |
| | 1,750 | | | Northwest Parkway Public Highway Authority, (FSA),
5.25%, 6/15/41 | | | 1,857,555 | | |
| | 3,095 | | | Puerto Rico Highway and Transportation Authority, (AMBAC),
0.00%, 7/1/18 | | | 1,797,824 | | |
| | 1,000 | | | Puerto Rico Highway and Transportation Authority, (MBIA),
5.50%, 7/1/36(4) | | | 1,125,320 | | |
| | | | | | | $ | 6,908,489 | | |
| Insured-Water and Sewer - 3.5% | | | | | |
| $ | 1,000 | | | Widefield, Water and Sanitation District, (MBIA),
5.00%, 12/1/25 | | $ | 1,071,760 | | |
| | | | | | | $ | 1,071,760 | | |
| Senior Living / Life Care - 1.3% | | | | | |
| $ | 425 | | | Logan County, Industrial Development, (TLC Care Choices,
Inc.), 6.875%, 12/1/23 | | $ | 389,984 | | |
| | | | | | | $ | 389,984 | | |
| Special Tax Revenue - 5.6% | | | | | |
| $ | 400 | | | Bachelor Gulch, Metropolitan District,
6.70%, 11/15/19 | | $ | 432,364 | | |
| | 360 | | | Bell Mountain Ranch, Metropolitan District,
6.625%, 11/15/25 | | | 369,587 | | |
| | 395 | | | Black Hawk, Business Improvement District,
6.50%, 12/1/11 | | | 390,995 | | |
| | 500 | | | Cottonwood, Water and Sanitation District,
7.75%, 12/1/20 | | | 524,825 | | |
| | | | | | | $ | 1,717,771 | | |
| Transportation - 1.3% | | | | | |
| $ | 400 | | | Eagle County, (Eagle County Airport Terminal), (AMT),
7.50%, 5/1/21 | | $ | 408,456 | | |
| | | | | | | $ | 408,456 | | |
Principal Amount
(000's omitted) | |
Security | |
Value | |
| Water and Sewer - 3.6% | | | | | | | |
| $ | 1,000 | | | Colorado Water Resources, Power Development Authority,
5.00%, 9/1/21 | | $ | 1,088,530 | | |
| | | | | $ | 1,088,530 | | |
Total Tax-Exempt Investments - 99.6%
(identified cost $28,246,416) | | | | $ | 30,401,045 | | |
| Other Assets, Less Liabilities - 0.4% | | | | $ | 133,895 | | |
| Net Assets - 100.0% | | | | $ | 30,534,940 | | |
AMBAC - AMBAC Financial Group, Inc.
AMT - Interest earned from these securities may be considered a tax preference item for purposes of the Federal Alternative Minimum Tax.
FGIC - Financial Guaranty Insurance Company
FSA - Financial Security Assurance, Inc.
MBIA - Municipal Bond Insurance Association
XLCA - XL Capital Assurance, Inc.
The Fund invests primarily in debt securities issued by Colorado municipalities. The ability of the issuers of the debt securities to meet their obligations may be affected by economic developments in a specific industry or municipality. In order to reduce the risk associated with such economic developments, at January 31, 2005, 48.5% of the securities in the portfolio of investments are backed by bond insurance of various financial institutions and financial guaranty assurance agencies. The aggregate percentage insured by an individual financial institution ranged from 3.6% to 18.1% of total investments.
(1) Defaulted bond.
(2) Security exempt from registration under Rule 144A of the Securities Act of 1933. These securities may be sold in transactions exempt from registration, normally to qualified institutional buyers. At January 31, 2005, the aggregate value of the securities is $817,076 or 2.7% of the Fund's net assets.
(3) Security has been issued as a leveraged inverse floater bond. The stated interest rate represents the rate in effect at January 31, 2005.
(4) Security (or a portion thereof) has been segregated to cover margin requirements on open financial futures contracts.
See notes to financial statements
25
Eaton Vance Connecticut Municipals Fund as of January 31, 2005
PORTFOLIO OF INVESTMENTS (Unaudited)
| Tax-Exempt Investments - 99.4% | | | | | |
Principal Amount
(000's omitted) | |
Security | |
Value | |
| Education - 7.6% | | | | | |
| $ | 1,500 | | | Connecticut HEFA, (Loomis Chaffee School),
5.25%, 7/1/31 | | $ | 1,595,010 | | |
| | 2,500 | | | Connecticut HEFA, (University of Hartford),
5.25%, 7/1/32 | | | 2,635,800 | | |
| | 2,000 | | | Connecticut HEFA, (Yale University), 5.00%, 7/1/42 | | | 2,078,440 | | |
| | 2,500 | | | Connecticut HEFA, (Yale University), 5.125%, 7/1/27 | | | 2,663,775 | | |
| | 1,350 | | | University of Connecticut, 5.00%, 5/15/23 | | | 1,434,982 | | |
| | | | | | | $ | 10,408,007 | | |
| Electric Utilities - 4.7% | | | | | |
| $ | 3,135 | | | Connecticut Development Authority, (Connecticut Light
and Power), 5.85%, 9/1/28 | | $ | 3,355,641 | | |
| | 800 | | | Connecticut Development Authority, (Western Mass
Electric), Variable Rate, 9.163%, 9/1/28(1)(2) | | | 910,912 | | |
| | 2,000 | | | Puerto Rico Electric Power Authority, 5.125%, 7/1/29 | | | 2,102,440 | | |
| | | | | | | $ | 6,368,993 | | |
| Escrowed / Prerefunded - 3.1% | | | | | |
| $ | 3,010 | | | Connecticut Clean Water Fund, Prerefunded to 10/1/11,
5.50%, 10/1/19 | | $ | 3,433,176 | | |
| | 170 | | | Puerto Rico Public Finance Corp., Escrowed to Maturity,
6.00%, 8/1/26 | | | 210,145 | | |
| | 545 | | | University of Connecticut, Prerefunded to 4/1/12,
5.375%, 4/1/18 | | | 617,926 | | |
| | | | | | | $ | 4,261,247 | | |
| General Obligations - 5.2% | | | | | |
| $ | 1,750 | | | Connecticut, 0.00%, 11/1/09 | | $ | 1,515,850 | | |
| | 1,270 | | | Danbury, 4.50%, 2/1/14 | | | 1,378,763 | | |
| | 1,065 | | | Puerto Rico, 0.00%, 7/1/15 | | | 700,323 | | |
| | 1,000 | | | Puerto Rico, 5.00%, 7/1/25 | | | 1,056,080 | | |
| | 400 | | | Redding, 5.50%, 10/15/18 | | | 471,396 | | |
| | 650 | | | Redding, 5.625%, 10/15/19 | | | 778,186 | | |
| | 535 | | | Wilton, 5.25%, 7/15/18 | | | 620,102 | | |
| | 535 | | | Wilton, 5.25%, 7/15/19 | | | 622,285 | | |
| | | | | | | $ | 7,142,985 | | |
| Housing - 0.7% | | | | | |
| $ | 1,000 | | | Connecticut HFA, 4.70%, 5/15/28 | | $ | 1,008,540 | | |
| | | | | | | $ | 1,008,540 | | |
Principal Amount
(000's omitted) | |
Security | |
Value | |
| | Industrial Development Revenue - 6.9% | | | | | | | | |
| $ | 3,065 | | | Connecticut Development Authority, Airport Facility,
(Signature Flight), (AMT), 6.625%, 12/1/14 | | $ | 2,997,263 | | |
| | 4,500 | | | Eastern Connecticut Resource Recovery Authority,
(Wheelabrator Lisbon), (AMT), 5.50%, 1/1/20 | | | 4,557,150 | | |
| | 700 | | | Puerto Rico Port Authority, (American Airlines), (AMT),
6.25%, 6/1/26 | | | 494,984 | | |
| | 1,350 | | | Sprague, Environmental Improvement, (International
Paper Co.), (AMT), 5.70%, 10/1/21 | | | 1,384,843 | | |
| | | | | | | $ | 9,434,240 | | |
| | Insured-Education - 13.0% | | | | | | | | |
| $ | 1,250 | | | Connecticut HEFA, (Choate Rosemary College), (MBIA),
5.00%, 7/1/27 | | $ | 1,311,088 | | |
| | 1,550 | | | Connecticut HEFA, (Connecticut College), (MBIA),
5.00%, 7/1/32 | | | 1,623,098 | | |
| | 2,500 | | | Connecticut HEFA, (Fairfield University), (MBIA),
5.25%, 7/1/25 | | | 2,708,600 | | |
| | 1,000 | | | Connecticut HEFA, (Greenwich Academy), (FSA),
5.00%, 3/1/32 | | | 1,042,010 | | |
| | 1,970 | | | Connecticut HEFA, (Trinity College), (MBIA),
5.00%, 7/1/22 | | | 2,132,092 | | |
| | 5,305 | | | Connecticut HEFA, (Trinity College), (MBIA),
5.50%, 7/1/21 | | | 6,323,242 | | |
| | 1,440 | | | Connecticut HEFA, (Westminster School), (MBIA),
5.00%, 7/1/29 | | | 1,516,435 | | |
| | 1,000 | | | University of Connecticut, (FGIC), 5.00%, 11/15/29 | | | 1,054,090 | | |
| | | | | | | $ | 17,710,655 | | |
| | Insured-Electric Utilities - 4.1% | | | | | | | | |
| $ | 3,000 | | | Puerto Rico Electric Power Authority, (FSA),
4.75%, 7/1/24 | | $ | 3,082,770 | | |
| | 1,000 | | | Puerto Rico Electric Power Authority, (MBIA), Variable
Rate, 12.295%, 7/1/16(1)(3) | | | 1,528,120 | | |
| | 830 | | | Puerto Rico Electric Power Authority, DRIVERS, (FSA),
Variable Rate, 12.902%, 7/1/29(1)(3) | | | 1,045,883 | | |
| | | | | | | $ | 5,656,773 | | |
| | Insured-Escrowed / Prerefunded - 1.2% | | | | | | | | |
| $ | 1,000 | | | Connecticut Special Tax Transportation Infrastructure,
(FSA), Prerefunded to 10/1/11, 5.00%, 10/1/21 | | $ | 1,109,470 | | |
| | 515 | | | Puerto Rico, (FGIC), Prerefunded to 7/1/12,
5.00%, 7/1/32 | | | 574,498 | | |
| | | | | | | $ | 1,683,968 | | |
See notes to financial statements
26
Eaton Vance Connecticut Municipals Fund as of January 31, 2005
PORTFOLIO OF INVESTMENTS (Unaudited) CONT'D
Principal Amount
(000's omitted) | |
Security | |
Value | |
| | Insured-General Obligations - 14.9% | | | | | | | | |
| $ | 3,870 | | | Bridgeport, (FGIC), 4.75%, 8/15/21 | | $ | 4,038,886 | | |
| | 2,305 | | | Bridgeport, (FGIC), 5.375%, 8/15/19 | | | 2,585,933 | | |
| | 1,000 | | | Connecticut, (FGIC), 5.00%, 4/1/24 | | | 1,074,860 | | |
| | 2,000 | | | Connecticut, (FSA), 5.00%, 10/15/19 | | | 2,176,880 | | |
| | 1,000 | | | New Britain, (MBIA), 6.00%, 3/1/12 | | | 1,150,530 | | |
| | 3,500 | | | New Haven, (FGIC), 5.00%, 11/1/18 | | | 3,817,940 | | |
| | 1,265 | | | New Milford, (AMBAC), 5.00%, 1/15/14 | | | 1,421,468 | | |
| | 350 | | | Puerto Rico, (FSA), Variable Rate, 9.459%, 7/1/27(1)(3) | | | 449,078 | | |
| | 3,500 | | | Suffield, (MBIA), 4.75%, 6/15/21 | | | 3,649,205 | | |
| | | | | | | $ | 20,364,780 | | |
| | Insured-Hospital - 5.0% | | | | | | | | |
| $ | 1,000 | | | Connecticut HEFA, (Bridgeport Hospital), (MBIA),
6.625%, 7/1/18 | | $ | 1,002,950 | | |
| | 3,190 | | | Connecticut HEFA, (Children's Medical Center), (MBIA),
5.00%, 7/1/21 | | | 3,457,705 | | |
| | 1,000 | | | Connecticut HEFA, (Danbury Hospital), (AMBAC),
5.375%, 7/1/17 | | | 1,043,880 | | |
| | 1,350 | | | Connecticut HEFA, (Lawrence and Memorial Hospital),
(MBIA), 5.00%, 7/1/22 | | | 1,360,085 | | |
| | | | | | | $ | 6,864,620 | | |
| | Insured-Housing - 0.6% | | | | | | | | |
| $ | 815 | | | Connecticut HFA, (Housing Mortgage Finance Program),
(MBIA), (AMT), 5.30%, 5/15/33 | | $ | 815,880 | | |
| | | | | | | $ | 815,880 | | |
| | Insured-Lease Revenue / Certificates of
Participation - 3.7% | | | | | | | | |
| $ | 3,250 | | | Puerto Rico Public Building Authority, (AMBAC),
5.50%, 7/1/21 | | $ | 3,878,193 | | |
| | 800 | | | Puerto Rico Public Finance Corp., (AMBAC), Variable Rate,
12.857%, 6/1/24(1)(3) | | | 1,120,920 | | |
| | | | | | | $ | 4,999,113 | | |
| | Insured-Other Revenue - 1.3% | | | | | | | | |
| $ | 550 | | | Connecticut HEFA, (Child Care Facility Program), (AMBAC),
5.00%, 7/1/31 | | $ | 571,907 | | |
| | 1,150 | | | Connecticut HEFA, (Village Families & Children), (AMBAC),
5.00%, 7/1/32 | | | 1,200,117 | | |
| | | | | | | $ | 1,772,024 | | |
Principal Amount
(000's omitted) | |
Security | |
Value | |
| | Insured-Pooled Loans - 1.1% | | | | | | | | |
| $ | 1,360 | | | Connecticut Higher Education Supplemental Loan
Authority, (MBIA), (AMT), 5.25%, 11/15/21 | | $ | 1,438,975 | | |
| | | | | | | $ | 1,438,975 | | |
| | Insured-Special Tax Revenue - 0.3% | | | | | | | | |
| $ | 375 | | | Puerto Rico Infrastructure Financing Authority, (AMBAC),
Variable Rate, 7.595%, 7/1/28(1)(2) | | $ | 416,329 | | |
| | | | | | | $ | 416,329 | | |
| | Insured-Transportation - 7.6% | | | | | | | | |
| $ | 5,500 | | | Connecticut Airport, (Bradley International Airport),
(FGIC), (AMT), 5.125%, 10/1/26 | | $ | 5,702,785 | | |
| | 500 | | | Guam International Airport Authority, (MBIA),
5.25%, 10/1/23 | | | 553,665 | | |
| | 1,750 | | | Puerto Rico Highway and Transportation Authority,
(AMBAC), 0.00%, 7/1/16 | | | 1,116,570 | | |
| | 1,630 | | | Puerto Rico Highway and Transportation Authority,
(AMBAC), Variable Rate, 10.207%, 7/1/28(1)(3) | | | 1,926,236 | | |
| | 1,000 | | | Puerto Rico Highway and Transportation Authority, (FSA),
4.75%, 7/1/38 | | | 1,036,690 | | |
| | | | | | | $ | 10,335,946 | | |
| | Insured-Water and Sewer - 3.8% | | | | | | | | |
| $ | 1,340 | | | South Central Connecticut Regional Water Authority, (FGIC),
5.125%, 8/1/29 | | $ | 1,433,653 | | |
| | 1,530 | | | South Central Connecticut Regional Water Authority, (MBIA),
5.00%, 8/1/25 | | | 1,640,359 | | |
| | 2,000 | | | South Central Connecticut Regional Water Authority, (MBIA),
5.00%, 8/1/28 | | | 2,118,660 | | |
| | | | | | | $ | 5,192,672 | | |
| | Lease Revenue / Certificates of Participation - 1.6% | | | | | | | | |
| $ | 1,830 | | | Puerto Rico Public Finance Corp., (Commonwealth
Appropriation), 6.00%, 8/1/26 | | $ | 2,218,546 | | |
| | | | | | | $ | 2,218,546 | | |
| | Pooled Loans - 0.4% | | | | | | | | |
| $ | 515 | | | Connecticut Higher Education Supplemental Loan
Authority, (AMT), 6.20%, 11/15/09 | | $ | 516,633 | | |
| | | | | | | $ | 516,633 | | |
See notes to financial statements
27
Eaton Vance Connecticut Municipals Fund as of January 31, 2005
PORTFOLIO OF INVESTMENTS (Unaudited) CONT'D
Principal Amount
(000's omitted) | |
Security | |
Value | |
| Solid Waste - 5.0% | | | | | |
| $ | 2,335 | | | Bristol Resource Recovery Facility, (Ogden Martin
Systems), 6.50%, 7/1/14 | | $ | 2,420,951 | | |
| | 4,250 | | | Connecticut Resources Recovery Authority, (American
REF-FUEL Co.), (AMT), 6.45%, 11/15/22 | | | 4,350,088 | | |
| | | | | | | $ | 6,771,039 | | |
| Special Tax Revenue - 4.5% | | | | | |
| $ | 3,180 | | | Connecticut Special Tax Transportation Infrastructure,
6.125%, 9/1/12(4) | | $ | 3,703,110 | | |
| | 2,000 | | | Connecticut Special Tax Transportation Infrastructure,
6.50%, 10/1/12 | | | 2,426,520 | | |
| | | | | | | $ | 6,129,630 | | |
| Transportation - 1.2% | | | | | |
| $ | 1,000 | | | Puerto Rico Highway and Transportation Authority,
5.00%, 7/1/42 | | $ | 1,026,770 | | |
| | 500 | | | Puerto Rico Highway and Transportation Authority,
5.50%, 7/1/15 | | | 570,690 | | |
| | | | | | | $ | 1,597,460 | | |
| Water and Sewer - 1.9% | | | | | |
| $ | 1,250 | | | Connecticut Clean Water Fund, 6.00%, 10/1/12 | | $ | 1,466,275 | | |
| | 1,100 | | | Stamford, Water Pollution Control System and Facilities,
5.00%, 11/15/32 | | | 1,151,282 | | |
| | | | | | | $ | 2,617,557 | | |
| | Total Tax-Exempt Investments - 99.4%
(identified cost $125,118,393) | | | | | $ | 135,726,612 | | |
| | Other Assets, Less Liabilities - 0.6% | | | | | $ | 849,394 | | |
| | Net Assets - 100.0% | | | | | $ | 136,576,006 | | |
AMBAC - AMBAC Financial Group, Inc.
AMT - Interest earned from these securities may be considered a tax preference item for purposes of the Federal Alternative Minimum Tax.
FGIC - Financial Guaranty Insurance Company
FSA - Financial Security Assurance, Inc.
MBIA - Municipal Bond Insurance Association
The Fund invests primarily in debt securities issued by Connecticut municipalities. The ability of the issuers of the debt securities to meet their obligations may be affected by economic developments in a specific industry or municipality. In order to reduce the risk associated with such economic developments, at January 31, 2005, 56.8% of the securities in the portfolio of investments are backed
by bond insurance of various financial institutions and financial guaranty assurance agencies. The aggregate percentage insured by an individual financial institution ranged from 7.3% to 25.3% of total investments.
(1) Security exempt from registration under Rule 144A of the Securities Act of 1933. These securities may be sold in transactions exempt from registration, normally to qualified institutional buyers. At January 31, 2005, the aggregate value of the securities is $7,397,478 or 5.4% of the Fund's net assets.
(2) Security has been issued as an inverse floater bond. The stated interest rate represents the rate in effect at January 31, 2005.
(3) Security has been issued as a leveraged inverse floater bond. The stated interest rate represents the rate in effect at January 31, 2005.
(4) Security (or a portion thereof) has been segregated to cover margin requirements on open financial futures contracts.
See notes to financial statements
28
Eaton Vance Michigan Municipals Fund as of January 31, 2005
PORTFOLIO OF INVESTMENTS (Unaudited)
| Tax-Exempt Investments - 98.7% | | | | | |
Principal Amount
(000's omitted) | |
Security | |
Value | |
| Bond Bank - 0.0% | | | | | |
| $ | 30 | | | Michigan Municipal Bond Authority Local
Government Loan, 6.90%, 5/1/21 | | $ | 30,104 | | |
| | | | | | | $ | 30,104 | | |
| Education - 2.0% | | | | | |
| $ | 1,250 | | | Michigan Higher Education Facilities Authority,
(Creative Studies), 5.85%, 12/1/22 | | $ | 1,294,675 | | |
| | | | | | | $ | 1,294,675 | | |
| Electric Utilities - 1.6% | | | | | |
| $ | 1,000 | | | Puerto Rico Electric Power Authority, 5.125%, 7/1/29 | | $ | 1,051,220 | | |
| | | | | | | $ | 1,051,220 | | |
| General Obligations - 2.1% | | | | | |
| $ | 1,250 | | | Puerto Rico Public Buildings Authority,
Commonwealth Guaranteed, 5.25%, 7/1/29 | | $ | 1,339,112 | | |
| | | | | | | $ | 1,339,112 | | |
| Health Care-Miscellaneous - 1.6% | | | | | |
| $ | 1,070 | | | Pittsfield Township EDC, (Arbor Hospice),
7.875%, 8/15/27 | | $ | 1,045,722 | | |
| | | | | | | $ | 1,045,722 | | |
| Hospital - 14.3% | | | | | |
| $ | 500 | | | Allegan Hospital Finance Authority,
(Allegan General Hospital), 7.00%, 11/15/21 | | $ | 520,719 | | |
| | 275 | | | Gaylord Hospital Finance Authority, (Otsego
Memorial Hospital Association), 6.20%, 1/1/25 | | | 271,763 | | |
| | 745 | | | Mecosta County, (Michigan General Hospital),
5.75%, 5/15/09 | | | 764,877 | | |
| | 2,000 | | | Michigan Hospital Finance Authority, (Central
Michigan Community Hospital), 6.25%, 10/1/27 | | | 2,041,840 | | |
| | 3,250 | | | Michigan Hospital Finance Authority, (McLaren
Obligated Group), 4.50%, 10/15/21 | | | 3,250,357 | | |
| | 1,500 | | | Michigan Hospital Finance Authority,
(Oakwood Hospital), 5.75%, 4/1/32 | | | 1,591,380 | | |
| | 750 | | | Michigan Hospital Finance Authority, (Sparrow
Obligation Group), 5.625%, 11/15/36 | | | 781,395 | | |
| | | | | | | $ | 9,222,331 | | |
Principal Amount
(000's omitted) | |
Security | |
Value | |
| | Insured-Education - 6.8% | | | | | | | | |
| $ | 500 | | | Central Michigan University, (AMBAC),
4.75%, 10/1/29 | | $ | 511,105 | | |
| | 1,000 | | | Ferris State University, (AMBAC),
5.00%, 10/1/23(1) | | | 1,055,760 | | |
| | 700 | | | Michigan Technological University, (XLCA),
5.00%, 10/1/33 | | | 729,246 | | |
| | 2,000 | | | Western Michigan University, (FGIC),
5.125%, 11/15/22 | | | 2,111,980 | | |
| | | | | | | $ | 4,408,091 | | |
| | Insured-Electric Utilities - 3.9% | | | | | | | | |
| $ | 2,000 | | | Michigan Strategic Fund Resource Recovery,
(Detroit Edison Co.), (MBIA), (AMT), 5.55%, 9/1/29 | | $ | 2,123,600 | | |
| | 300 | | | Michigan Strategic Fund, (Detroit Edison Co.),
(FGIC), 6.95%, 5/1/11 | | | 361,722 | | |
| | | | | | | $ | 2,485,322 | | |
| | Insured-Escrowed / Prerefunded - 6.5% | | | | | | | | |
| $ | 3,000 | | | Kent Hospital Finance Authority, (Butterworth
Health System), Prerefunded to 1/15/06,
(MBIA), 6.125%, 1/15/21 | | $ | 3,167,610 | | |
| | 1,000 | | | Lake Orion, School District, Prerefunded to
5/1/05, (AMBAC), 7.00%, 5/1/20 | | | 1,022,390 | | |
| | | | | | | $ | 4,190,000 | | |
| | Insured-General Obligations - 41.5% | | | | | | | | |
| $ | 1,250 | | | Ann Arbor, School District, (MBIA), 4.75%, 5/1/29 | | $ | 1,274,775 | | |
| | 1,005 | | | Brighton School District, (AMBAC), 0.00%, 5/1/18 | | | 571,202 | | |
| | 2,000 | | | Detroit School District, (FGIC), 5.25%, 5/1/28 | | | 2,152,960 | | |
| | 1,000 | | | Detroit, City School District, (FSA), 6.00%, 5/1/29 | | | 1,248,250 | | |
| | 1,000 | | | Grand Blanc Community Schools, (FSA), 5.00%, 5/1/28 | | | 1,053,280 | | |
| | 1,000 | | | Healthsource Saginaw, Inc., (MBIA), 5.00%, 5/1/29 | | | 1,056,190 | | |
| | 1,900 | | | Holland School District, (AMBAC), 0.00%, 5/1/17 | | | 1,129,626 | | |
| | 1,000 | | | Hudsonville Public Schools, (FSA), 5.00%, 5/1/29 | | | 1,051,720 | | |
| | 3,000 | | | Lake Orion, Community School District, (FGIC),
5.125%, 5/1/23 | | | 3,187,530 | | |
| | 1,000 | | | Novi Building Authority, (FSA), 5.50%, 10/1/25 | | | 1,107,980 | | |
| | 2,410 | | | Okemos Public Schools, (MBIA), 0.00%, 5/1/16 | | | 1,511,022 | | |
| | 2,790 | | | Parchment School District, (MBIA), 5.00%, 5/1/25 | | | 3,102,340 | | |
| | 1,000 | | | Plymouth-Canton, Community School District, (FGIC),
5.00%, 5/1/29 | | | 1,051,720 | | |
| | 350 | | | Puerto Rico, (FSA), Variable Rate,
9.459%, 7/1/27(2)(3) | | | 449,078 | | |
| | 1,400 | | | Redford Union School District No.1, (AMBAC),
5.00%, 5/1/22 | | | 1,564,794 | | |
| | 1,450 | | | Saginaw, City School District, (FSA), 5.00%, 5/1/34 | | | 1,517,121 | | |
See notes to financial statements
29
Eaton Vance Michigan Municipals Fund as of January 31, 2005
PORTFOLIO OF INVESTMENTS (Unaudited) CONT'D
Principal Amount
(000's omitted) | |
Security | |
Value | |
| | Insured-General Obligations (continued) | | | | | | | | |
| $ | 2,500 | | | Wyoming Public Schools, (FGIC), 5.125%, 5/1/23 | | $ | 2,656,275 | | |
| | 1,000 | | | Zeeland Public Schools, (FGIC), 5.25%, 5/1/22 | | | 1,079,860 | | |
| | | | | | | $ | 26,765,723 | | |
| | Insured-Housing - 0.6% | | | | | | | | |
| $ | 385 | | | Michigan HDA, Rental Housing, (MBIA), (AMT),
5.30%, 10/1/37 | | $ | 393,682 | | |
| | | | | | | $ | 393,682 | | |
| | Insured-Lease Revenue / Certificates of
Participation - 1.6% | | | | | | | | |
| $ | 1,000 | | | Michigan Building Authority, (Facilities Program),
(MBIA), 5.00%, 10/15/29 | | $ | 1,049,210 | | |
| | | | | | | $ | 1,049,210 | | |
| | Insured-Special Tax Revenue - 0.4% | | | | | | | | |
| $ | 250 | | | Wayne Charter County, (Airport
Hotel-Detroit Metropolitan Airport),
(MBIA), 5.00%, 12/1/30 | | $ | 259,750 | | |
| | | | | | | $ | 259,750 | | |
| | Insured-Transportation - 3.8% | | | | | | | | |
| $ | 345 | | | Puerto Rico Highway and Transportation Authority,
(MBIA), Variable Rate, 11.707%, 7/1/26(2)(3) | | $ | 405,989 | | |
| | 2,000 | | | Wayne Charter County Airport, Residual
Certificates, (MBIA), (AMT), Variable Rate,
7.84%, 12/1/28(2)(4) | | | 2,077,720 | | |
| | | | | | | $ | 2,483,709 | | |
| | Insured-Water and Sewer - 3.7% | | | | | | | | |
| $ | 2,165 | | | Warren, Water and Sewer, (FSA), 5.25%, 11/1/26 | | $ | 2,369,116 | | |
| | | | | | | $ | 2,369,116 | | |
| | Special Tax Revenue - 4.2% | | | | | | | | |
| $ | 3,050 | | | Detroit, Downtown Tax Increment, 0.00%, 7/1/16 | | $ | 1,783,610 | | |
| | 2,000 | | | Detroit, Downtown Tax Increment, 0.00%, 7/1/20 | | | 938,300 | | |
| | | | | | | $ | 2,721,910 | | |
Principal Amount
(000's omitted) | |
Security | |
Value | |
| Transportation - 4.1% | | | | | | | |
| $ | 1,500 | | | Kent County Airport Facility, Variable Rate,
7.84%, 1/1/25(2)(4) | | $ | 1,592,070 | | |
| | 1,000 | | | Puerto Rico Highway and Transportation Authority,
5.00%, 7/1/36 | | | 1,041,770 | | |
| | | | | $ | 2,633,840 | | |
Total Tax-Exempt Investments - 98.7%
(identified cost $56,725,531) | | | | $ | 63,743,517 | | |
| Other Assets, Less Liabilities - 1.3% | | | | $ | 834,326 | | |
| Net Assets - 100.0% | | | | $ | 64,577,843 | | |
AMBAC - AMBAC Financial Group, Inc.
AMT - Interest earned from these securities may be considered a tax preference item for purposes of the Federal Alternative Minimum Tax.
FGIC - Financial Guaranty Insurance Company
FSA - Financial Security Assurance, Inc.
MBIA - Municipal Bond Insurance Association
XLCA - XL Capital Assurance, Inc.
The Fund invests primarily in debt securities issued by Michigan municipalities. The ability of the issuers of the debt securities to meet their obligations may be affected by economic developments in a specific industry or municipality. In order to reduce the risk associated with such economic developments, at January 31, 2005, 69.7% of the securities in the portfolio of investments are backed by bond insurance of various financial institutions and financial guaranty assurance agencies. The aggregate percentage insured by an individual financial institution ranged from 1.1% to 25.8% of total investments.
(1) Security (or a portion thereof) has been segregated to cover margin requirements on open financial futures contracts.
(2) Security exempt from registration under Rule 144A of the Securities Act of 1933. These securities may be sold in transactions exempt from registration, normally to qualified institutional buyers. At January 31, 2005, the aggregate value of the securities is $4,524,857 or 7.0% of the Fund's net assets.
(3) Security has been issued as a leveraged inverse floater bond. The stated interest rate represents the rate in effect at January 31, 2005.
(4) Security has been issued as an inverse floater bond. The stated interest rate represents the rate in effect at January 31, 2005.
See notes to financial statements
30
Eaton Vance Minnesota Municipals Fund as of January 31, 2005
PORTFOLIO OF INVESTMENTS (Unaudited)
| | Tax-Exempt Investments - 99.3% | | | | | | | | |
Principal Amount
(000's omitted) | |
Security | |
Value | |
| | Education - 11.2% | | | | | | | | |
| $ | 1,000 | | | Hopkins, (Blake School), 5.50%, 9/1/24 | | $ | 1,063,030 | | |
| | 1,250 | | | Minnesota Higher Education Facilities Authority,
(Hamline University), 6.00%, 10/1/29 | | | 1,315,950 | | |
| | 575 | | | Minnesota Higher Education Facilities Authority,
(Minneapolis College of Art), 5.375%, 5/1/21 | | | 604,181 | | |
| | 500 | | | Minnesota Higher Education Facilities Authority,
(St. John's University), 5.25%, 10/1/26 | | | 529,330 | | |
| | 1,380 | | | St. Cloud Housing and Redevelopment Authority,
(University Foundation), 5.00%, 5/1/23 | | | 1,468,706 | | |
| | | | | | | $ | 4,981,197 | | |
| | Electric Utilities - 14.3% | | | | | | | | |
| $ | 2,000 | | | Chaska, Electric, 6.10%, 10/1/30 | | $ | 2,247,480 | | |
| | 750 | | | Cohasset, PCR, (Allete, Inc.), 4.95%, 7/1/22 | | | 768,697 | | |
| | 750 | | | Minnesota Municipal Power Agency, 5.00%, 10/1/34 | | | 776,708 | | |
| | 400 | | | Puerto Rico Electric Power Authority, Variable Rate,
7.70%, 7/1/29(1)(2) | | | 440,976 | | |
| | 1,980 | | | Rochester Electric, 5.25%, 12/1/30 | | | 2,077,574 | | |
| | | | | | | $ | 6,311,435 | | |
| | General Obligations - 7.6% | | | | | | | | |
| $ | 750 | | | Dakota County, Community Development Agency,
(Senior Housing Facilities), 5.00%, 1/1/21 | | $ | 796,763 | | |
| | 1,500 | | | Minneapolis and St. Paul General Obligation,
Metropolitan Airport Commission, (AMT), 4.50%, 1/1/15 | | | 1,549,950 | | |
| | 1,000 | | | Minnesota State, (Duluth Airport), (AMT), 6.25%, 8/1/14 | | | 1,018,310 | | |
| | | | | | | $ | 3,365,023 | | |
| | Hospital - 9.0% | | | | | | | | |
| $ | 700 | | | Martin County, (Fairmont Community Hospital Association),
6.625%, 9/1/22 | | $ | 723,758 | | |
| | 1,500 | | | Rochester Health Care Facilities, (Mayo Clinic), Variable Rate,
8.84%, 11/15/27(1)(2) | | | 1,728,930 | | |
| | 500 | | | Shakopee Health Care Facilities, (St. Francis Regional
Medical Center), 5.25%, 9/1/34 | | | 513,620 | | |
| | 1,000 | | | St. Louis Park, Health Care Facilities Revenue,
(Nicollet Health Services), 5.25%, 7/1/30 | | | 1,028,390 | | |
| | | | | | | $ | 3,994,698 | | |
Principal Amount
(000's omitted) | |
Security | |
Value | |
| | Housing - 6.3% | | | | | | | | |
| $ | 500 | | | Columbia Heights, Multifamily, (Housing Crest),
6.625%, 4/20/43 | | $ | 544,225 | | |
| | 500 | | | Minneapolis, Multifamily, (Bottineau Commons), (AMT),
5.45%, 4/20/43 | | | 517,220 | | |
| | 1,650 | | | Minnetonka, Multifamily, (Archer Heights Apartments),
(AMT), 6.00%, 1/20/27 | | | 1,711,166 | | |
| | | | | | | $ | 2,772,611 | | |
| | Industrial Development Revenue - 6.0% | | | | | | | | |
| $ | 1,000 | | | Cloquet, (Potlach Corp.), 5.90%, 10/1/26 | | $ | 1,010,550 | | |
| | 1,605 | | | Minneapolis, Community Development Agency,
Common Bond Fund, (AMT), 6.80%, 12/1/24 | | | 1,637,565 | | |
| | | | | | | $ | 2,648,115 | | |
| | Insured-Education - 1.2% | | | | | | | | |
| $ | 500 | | | Minnesota State Colleges and University,
(St. Cloud St. University), (FSA), 5.00%, 10/1/19 | | $ | 545,285 | | |
| | | | | | | $ | 545,285 | | |
| | Insured-Electric Utilities - 14.3% | | | | | | | | |
| $ | 500 | | | Northern Minnesota Municipal Power Agency, (AMBAC),
4.75%, 1/1/20 | | $ | 525,370 | | |
| | 500 | | | Puerto Rico Electric Power Authority, RITES, (FSA),
Variable Rate, 11.003%, 7/1/29(1)(3) | | | 630,050 | | |
| | 950 | | | Southern Minnesota Municipal Power Agency, (MBIA),
0.00%, 1/1/21(4) | | | 470,773 | | |
| | 10,000 | | | Southern Minnesota Municipal Power Agency, (MBIA),
0.00%, 1/1/25 | | | 4,018,700 | | |
| | 45 | | | Southern Minnesota Municipal Power Agency, (MBIA),
5.75%, 1/1/18 | | | 49,272 | | |
| | 565 | | | Western Minnesota Municipal Power Agency, (AMBAC),
5.50%, 1/1/16 | | | 630,331 | | |
| | | | | | | $ | 6,324,496 | | |
| | Insured-General Obligations - 1.7% | | | | | | | | |
| $ | 695 | | | Freeborn County, (Criminal Justice Center), (FGIC),
5.00%, 2/1/23 | | $ | 745,575 | | |
| | | | | | | $ | 745,575 | | |
| | Insured-Hospital - 3.4% | | | | | | | | |
| $ | 450 | | | Plymouth, (Westhealth), (FSA), 6.25%, 6/1/16 | | $ | 471,240 | | |
| | 1,000 | | | Willmar, (Rice Memorial Hospital), (FSA), 5.00%, 2/1/32 | | | 1,045,240 | | |
| | | | | | | $ | 1,516,480 | | |
See notes to financial statements
31
Eaton Vance Minnesota Municipals Fund as of January 31, 2005
PORTFOLIO OF INVESTMENTS (Unaudited) CONT'D
Principal Amount
(000's omitted) | |
Security | |
Value | |
| | Insured-Housing - 3.5% | | | | | | | | |
| $ | 1,500 | | | SCA MFMR Receipts, Burnsville, (FSA), 7.10%, 1/1/30 | | $ | 1,531,995 | | |
| | | | | | | $ | 1,531,995 | | |
| | Insured-Lease Revenue / Certificates of
Participation - 3.1% | | | | | | | | |
| $ | 1,270 | | | Hopkins, Housing and Redevelopment Authority,
(Public Works and Fire Station), (MBIA), 5.00%, 2/1/20 | | $ | 1,376,655 | | |
| | | | | | | $ | 1,376,655 | | |
| | Insured-Other Revenue - 2.0% | | | | | | | | |
| $ | 800 | | | St. Paul, Housing and Redevelopment Authority,
(Block 19), (FSA), 5.35%, 8/1/29 | | $ | 873,728 | | |
| | | | | | | $ | 873,728 | | |
| | Insured-Special Tax Revenue - 2.4% | | | | | | | | |
| $ | 1,000 | | | Washington County, Housing and Redevelopment Authority,
(Annual Appropriation), (MBIA), 5.50%, 2/1/32 | | $ | 1,074,060 | | |
| | | | | | | $ | 1,074,060 | | |
| | Insured-Transportation - 3.6% | | | | | | | | |
| $ | 1,500 | | | Minneapolis and St. Paul Metropolitan Airport Commission,
(FGIC), 5.25%, 1/1/32 | | $ | 1,598,280 | | |
| | | | | | | $ | 1,598,280 | | |
| | Miscellaneous - 4.8% | | | | | | | | |
| $ | 2,000 | | | Minneapolis, Art Center Facilities, (Walker Art Center),
5.125%, 7/1/21 | | $ | 2,131,760 | | |
| | | | | | | $ | 2,131,760 | | |
| | Senior Living / Life Care - 4.9% | | | | | | | | |
| $ | 1,000 | | | Columbia Heights, Multifamily, (Crestview Corp.),
6.00%, 3/1/33 | | $ | 963,200 | | |
| | 670 | | | Minneapolis, (Walker Methodist Senior Services),
6.00%, 11/15/28 | | | 530,097 | | |
| | 975 | | | St. Paul, Housing and Redevelopment,
(Care Institute, Inc.-Highland), 8.75%, 11/1/24(5) | | | 682,305 | | |
| | | | | | | $ | 2,175,602 | | |
| | Total Tax-Exempt Investments - 99.3%
(identified cost $40,852,846) | | | | | $ | 43,966,995 | | |
| | Other Assets, Less Liabilities - 0.7% | | | | | $ | 294,235 | | |
| | Net Assets - 100.0% | | | | | $ | 44,261,230 | | |
AMBAC - AMBAC Financial Group, Inc.
AMT - Interest earned from these securities may be considered a tax preference item for purposes of the Federal Alternative Minimum Tax.
FGIC - Financial Guaranty Insurance Company
FSA - Financial Security Assurance, Inc.
MBIA - Municipal Bond Insurance Association
The Fund invests primarily in debt securities issued by Minnesota municipalities. The ability of the issuers of the debt securities to meet their obligations may be affected by economic developments in a specific industry or municipality. In order to reduce the risk associated with such economic developments, at January 31, 2005, 35.5% of the securities in the portfolio of investments are backed by bond insurance of various financial institutions and financial guaranty assurance agencies. The aggregate percentage insured by an individual financial institution ranged from 2.6% to 15.9% of total investments.
(1) Security exempt from registration under Rule 144A of the Securities Act of 1933. These securities may be sold in transactions exempt from registration, normally to qualified institutional buyers. At January 31, 2005, the aggregate value of the securities is $2,799,956 or 6.3% of the Fund's net assets.
(2) Security has been issued as an inverse floater bond. The stated interest rate represents the rate in effect at January 31, 2005.
(3) Security has been issued as a leveraged inverse floater bond. The stated interest rate represents the rate in effect at January 31, 2005.
(4) Security (or a portion thereof) has been segregated to cover margin requirements on open financial futures contracts.
(5) Security is in default and making only partial interest payments.
See notes to financial statements
32
Eaton Vance New Jersey Municipals Fund as of January 31, 2005
PORTFOLIO OF INVESTMENTS (Unaudited)
| | Tax-Exempt Investments - 99.7% | | | | | | | | |
Principal Amount
(000's omitted) | | Security | | Value | |
| | Cogeneration - 0.7% | | | | | | | | |
| $ | 1,700 | | | New Jersey EDA, (Trigen Trenton), (AMT),
6.20%, 12/1/07 | | $ | 1,715,045 | | |
| | | | | | | $ | 1,715,045 | | |
| | Education - 0.4% | | | | | | | | |
| $ | 1,000 | | | New Jersey Educational Facilities Authority,
(Stevens Institute of Technology), 5.25%, 7/1/32 | | $ | 1,036,770 | | |
| | | | | | | $ | 1,036,770 | | |
| | Electric Utilities - 4.7% | | | | | | | | |
| $ | 9,000 | | | Puerto Rico Electric Power Authority, 0.00%, 7/1/17 | | $ | 5,510,610 | | |
| | 2,000 | | | Puerto Rico Electric Power Authority, 0.00%, 7/1/17 | | | 1,224,580 | | |
| | 2,000 | | | Puerto Rico Electric Power Authority, Variable Rate,
7.70%, 7/1/29(1)(2) | | | 2,204,880 | | |
| | 2,500 | | | Salem County, Pollution Control Financing, (Public Services
Enterprise Group, Inc.), (AMT), 5.75%, 4/1/31 | | | 2,687,900 | | |
| | | | | | | $ | 11,627,970 | | |
| | General Obligations - 1.4% | | | | | | | | |
| $ | 3,000 | | | Mercer County Improvement Authority, 0.00%, 4/1/10 | | $ | 2,539,710 | | |
| | 1,500 | | | Puerto Rico, 0.00%, 7/1/16 | | | 935,880 | | |
| | | | | | | $ | 3,475,590 | | |
| | Health Care-Miscellaneous - 0.5% | | | | | | | | |
| $ | 1,255 | | | New Jersey EDA, (Hudson County Occupational Center),
6.50%, 7/1/18 | | $ | 1,191,472 | | |
| | | | | | | $ | 1,191,472 | | |
| | Hospital - 12.7% | | | | | | | | |
| $ | 500 | | | Camden County, Improvement Authority, (Cooper Health
System), 5.75%, 2/15/34 | | $ | 525,995 | | |
| | 3,750 | | | Camden County, Improvement Authority, (Cooper Health
System), 6.00%, 2/15/27 | | | 3,891,225 | | |
| | 2,000 | | | New Jersey Health Care Facilities Financing Authority,
(Atlantic City Medical Center), 5.75%, 7/1/25 | | | 2,172,500 | | |
| | 3,000 | | | New Jersey Health Care Facilities Financing Authority,
(Capital Health System), 5.25%, 7/1/17 | | | 3,117,090 | | |
| | 910 | | | New Jersey Health Care Facilities Financing Authority,
(Capital Health System), 5.25%, 7/1/27 | | | 924,997 | | |
| | 2,625 | | | New Jersey Health Care Facilities Financing Authority,
(Capital Health System), 5.375%, 7/1/33 | | | 2,722,860 | | |
Principal Amount
(000's omitted) | |
Security | |
Value | |
| Hospital (continued) | | | | | |
| $ | 1,505 | | | New Jersey Health Care Facilities Financing Authority,
(Hackensack University Medical Center), 6.00%, 1/1/34 | | $ | 1,613,194 | | |
| | 2,700 | | | New Jersey Health Care Facilities Financing Authority,
(Hackensack University Medical Center), 6.00%, 1/1/25 | | | 2,922,642 | | |
| | 3,865 | | | New Jersey Health Care Facilities Financing Authority,
(Robert Wood Johnson University Hospital), 5.75%, 7/1/31 | | | 4,214,319 | | |
| | 1,800 | | | New Jersey Health Care Facilities Financing Authority,
(Saint Peters University Hospital), 6.875%, 7/1/30 | | | 2,005,668 | | |
| | 1,800 | | | New Jersey Health Care Facilities Financing Authority,
(Saint Peters University Hospital), 6.875%, 7/1/20 | | | 2,039,418 | | |
| | 550 | | | New Jersey Health Care Facilities Financing Authority,
(St. Elizabeth's Hospital), 6.00%, 7/1/20 | | | 574,865 | | |
| | 2,000 | | | New Jersey Health Care Facilities Financing Authority,
(St. Elizabeth's Hospital), 6.00%, 7/1/27 | | | 2,071,880 | | |
| | 2,500 | | | New Jersey Health Care Facilities Financing Authority,
(Trinitas Hospital), 7.50%, 7/1/30 | | | 2,829,500 | | |
| | | | | | | $ | 31,626,153 | | |
| Industrial Development Revenue - 5.1% | | | | | |
| $ | 1,875 | | | New Jersey EDA, (Continental Airlines), (AMT),
6.25%, 9/15/29 | | $ | 1,496,662 | | |
| | 1,875 | | | New Jersey EDA, (Continental Airlines), (AMT),
9.00%, 6/1/33 | | | 1,921,425 | | |
| | 1,500 | | | New Jersey EDA, (Holt Hauling), 7.90%, 3/1/27(3) | | | 1,447,500 | | |
| | 5,640 | | | New Jersey EDA, (Holt Hauling), (AMT),
8.95%, 12/15/18(3) | | | 4,520,460 | | |
| | 3,000 | | | New Jersey EDA, (The Seeing Eye, Inc.), 6.20%, 12/1/24 | | | 3,362,040 | | |
| | | | | | | $ | 12,748,087 | | |
| Insured-Education - 3.0% | | | | | |
| $ | 1,635 | | | New Jersey Educational Facilities Authority,
(Rowan University), (FGIC), 5.25%, 7/1/20 | | $ | 1,810,713 | | |
| | 5,375 | | | University of Medicine and Dentistry, Certificates of
Participation, (MBIA), 5.00%, 6/15/36 | | | 5,619,401 | | |
| | | | | | | $ | 7,430,114 | | |
| Insured-Electric Utilities - 1.4% | | | | | |
| $ | 1,300 | | | Puerto Rico Electric Power Authority, (MBIA), Variable Rate,
12.295%, 7/1/16(1)(4) | | $ | 1,986,556 | | |
| | 1,180 | | | Puerto Rico Electric Power Authority, DRIVERS, (FSA),
Variable Rate, 12.902%, 7/1/29(1)(4) | | | 1,486,918 | | |
| | | | | | | $ | 3,473,474 | | |
See notes to financial statements
33
Eaton Vance New Jersey Municipals Fund as of January 31, 2005
PORTFOLIO OF INVESTMENTS (Unaudited) CONT'D
Principal Amount
(000's omitted) | |
Security | |
Value | |
| Insured-Escrowed / Prerefunded - 1.9% | | | | | |
| $ | 2,155 | | | New Jersey EDA, RITES, (FSA), Prerefunded to 5/1/09,
Variable Rate, 10.161%, 5/1/18(1)(4) | | $ | 2,724,954 | | |
| | 1,565 | | | New Jersey Turnpike Authority, (MBIA), Escrowed to
Maturity, 6.50%, 1/1/16 | | | 1,907,344 | | |
| | | | | | | $ | 4,632,298 | | |
| Insured-General Obligations - 7.8% | | | | | |
| $ | 2,000 | | | Branchburg Township Board of Education, (FSA),
5.00%, 2/1/26 | | $ | 2,091,100 | | |
| | 1,325 | | | Colts Neck Township Board of Education, (FSA),
5.00%, 2/1/23 | | | 1,474,274 | | |
| | 1,650 | | | Colts Neck Township Board of Education, (FSA),
5.00%, 2/1/27 | | | 1,795,051 | | |
| | 2,132 | | | Elmwood Park Board of Education, (FSA), 4.50%, 8/1/29 | | | 2,152,041 | | |
| | 1,000 | | | High Bridge Board of Education, (FSA), 5.00%, 2/15/26 | | | 1,117,740 | | |
| | 5,350 | | | Irvington Township, (FSA), 0.00%, 7/15/22 | | | 2,433,180 | | |
| | 5,350 | | | Irvington Township, (FSA), 0.00%, 7/15/23 | | | 2,304,940 | | |
| | 2,000 | | | Irvington Township, (FSA), 0.00%, 7/15/24 | | | 813,880 | | |
| | 1,900 | | | Irvington Township, (MBIA), 5.00%, 7/15/33 | | | 1,987,248 | | |
| | 1,885 | | | Pohatcong Township School District, (FSA),
5.20%, 7/15/22 | | | 2,160,775 | | |
| | 900 | | | Washington Township, Mercer County Board of Education,
(FGIC), 5.00%, 1/1/26 | | | 943,623 | | |
| | | | | | | $ | 19,273,852 | | |
| Insured-Hospital - 5.4% | | | | | |
| $ | 4,250 | | | New Jersey EDA, (Hillcrest Health Services), (AMBAC),
0.00%, 1/1/19 | | $ | 2,298,783 | | |
| | 3,000 | | | New Jersey EDA, (Hillcrest Health Services), (AMBAC),
0.00%, 1/1/21 | | | 1,458,000 | | |
| | 10,970 | | | New Jersey EDA, (St. Barnabas Medical Center), (MBIA),
0.00%, 7/1/26 | | | 3,959,731 | | |
| | 2,890 | | | New Jersey Health Care Facilities Financing Authority,
(St. Barnabas Health Center), (MBIA), Variable Rate,
9.411%, 7/1/28(1)(4) | | | 2,995,774 | | |
| | 6,000 | | | New Jersey Health Care Facilities Financing Authority,
(St. Barnabas Medical Center), (MBIA), 0.00%, 7/1/23 | | | 2,589,540 | | |
| | | | | | | $ | 13,301,828 | | |
| Insured-Housing - 0.6% | | | | | |
| $ | 1,500 | | | New Jersey Housing and Mortgage Finance Agency, (FGIC),
4.50%, 11/1/19(5) | | $ | 1,500,000 | | |
| | | | | | | $ | 1,500,000 | | |
Principal Amount
(000's omitted) | |
Security | |
Value | |
| Insured-Special Tax Revenue - 6.5% | | | | | |
| $ | 6,620 | | | Garden State Preservation Trust, (FSA),
0.00%, 11/1/24 | | $ | 2,657,533 | | |
| | 10,000 | | | Garden State Preservation Trust, (FSA), 0.00%, 11/1/27 | | | 3,417,900 | | |
| | 3,000 | | | New Jersey EDA, (Motor Vehicle Surcharges), (MBIA),
5.25%, 7/1/26(6) | | | 3,430,440 | | |
| | 2,000 | | | New Jersey Sports & Exposition Authority, (MBIA),
5.50%, 3/1/22 | | | 2,353,640 | | |
| | 3,775 | | | Puerto Rico Infrastructure Financing Authority, (AMBAC),
Variable Rate, 7.595%, 7/1/28(1)(2) | | | 4,191,043 | | |
| | | | | | | $ | 16,050,556 | | |
| Insured-Transportation - 18.8% | | | | | |
| $ | 1,675 | | | Delaware River Port Authority, (FSA), 5.20%, 1/1/25 | | $ | 1,826,504 | | |
| | 3,250 | | | Delaware River Port Authority, (FSA), 5.20%, 1/1/27 | | | 3,443,408 | | |
| | 5,500 | | | Delaware River Port Authority, (FSA), 5.75%, 1/1/26 | | | 6,083,110 | | |
| | 435 | | | New Jersey Turnpike Authority, (MBIA), 6.50%, 1/1/16 | | | 531,409 | | |
| | 5,000 | | | New Jersey Turnpike Authority, RITES, (MBIA), Variable Rate,
9.613%, 1/1/16(2) | | | 7,169,400 | | |
| | 2,410 | | | Newark Housing Authority, (Newark Marine Terminal),
(MBIA), 5.00%, 1/1/23 | | | 2,573,326 | | |
| | 2,000 | | | Newark Housing Authority, (Newark Marine Terminal),
(MBIA), 5.00%, 1/1/24 | | | 2,127,860 | | |
| | 1,500 | | | Newark Housing Authority, (Newark Marine Terminal),
(MBIA), 5.00%, 1/1/25 | | | 1,589,010 | | |
| | 2,500 | | | Newark Housing Authority, (Newark Marine Terminal),
(MBIA), 5.00%, 1/1/37 | | | 2,607,675 | | |
| | 4,200 | | | Puerto Rico Highway and Transportation Authority, (FSA),
4.75%, 7/1/38 | | | 4,354,098 | | |
| | 4,325 | | | Puerto Rico Highway and Transportation Authority, (MBIA),
5.50%, 7/1/36 | | | 4,867,009 | | |
| | 7,325 | | | Puerto Rico Highway and Transportation Authority, (XLCA),
5.50%, 7/1/36 | | | 8,242,969 | | |
| | 1,100 | | | South Jersey Transportation Authority, (FGIC),
5.00%, 11/1/33 | | | 1,156,881 | | |
| | | | | | | $ | 46,572,659 | | |
| Insured-Water and Sewer - 3.8% | | | | | |
| $ | 1,380 | | | Bayonne, Municipal Utilities Authority, (XLCA),
4.50%, 4/1/28 | | $ | 1,386,955 | | |
| | 2,500 | | | Middlesex County Utilities Authority, (MBIA),
6.25%, 8/15/10 | | | 2,778,125 | | |
| | 13,840 | | | North Hudson Sewer Authority, (MBIA), 0.00%, 8/1/25 | | | 5,323,833 | | |
| | | | | | | $ | 9,488,913 | | |
See notes to financial statements
34
Eaton Vance New Jersey Municipals Fund as of January 31, 2005
PORTFOLIO OF INVESTMENTS (Unaudited) CONT'D
Principal Amount
(000's omitted) | |
Security | |
Value | |
| Lease Revenue / Certificates of Participation - 4.5% | | | | | |
| $ | 720 | | | Atlantic City, Public Facilities Lease Agreement,
8.875%, 1/15/14 | | $ | 965,484 | | |
| | 785 | | | Atlantic City, Public Facilities Lease Agreement,
8.875%, 1/15/15 | | | 1,069,445 | | |
| | 1,440 | | | Bergen County Improvement Authority, (Community Action
Program), 4.50%, 12/1/28 | | | 1,453,032 | | |
| | 2,591 | | | New Jersey Building Authority, (Garden State Savings Bonds),
0.00%, 6/15/10 | | | 2,170,792 | | |
| | 1,650 | | | New Jersey EDA, (Economic Recovery), Contract Lease,
0.00%, 9/15/09 | | | 1,428,174 | | |
| | 5,500 | | | New Jersey EDA, (Economic Recovery), Contract Lease,
0.00%, 3/15/13 | | | 4,080,010 | | |
| | | | | | | $ | 11,166,937 | | |
| Other Revenue - 1.7% | | | | | |
| $ | 2,000 | | | Puerto Rico Infrastructure Financing Authority, Variable Rate,
10.099%, 10/1/34(1)(4) | | $ | 2,620,260 | | |
| | 1,500 | | | Tobacco Settlement Financing Corp., Variable Rate,
11.379%, 6/1/39(1)(2)(9) | | | 1,552,125 | | |
| | | | | | | $ | 4,172,385 | | |
| Pooled Loans - 0.7% | | | | | |
| $ | 2,400 | | | New Jersey Higher Educational Student Loan Bonds, (AMT),
0.00%, 7/1/10 | | $ | 1,710,528 | | |
| | | | | | | $ | 1,710,528 | | |
| Senior Living / Life Care - 2.7% | | | | | |
| $ | 2,650 | | | New Jersey EDA, (Fellowship Village), 5.50%, 1/1/18 | | $ | 2,707,585 | | |
| | 2,115 | | | New Jersey EDA, (Fellowship Village), 5.50%, 1/1/25 | | | 2,128,007 | | |
| | 3,390 | | | New Jersey EDA, (Forsgate), (AMT), 8.625%, 6/1/25(7) | | | 1,852,635 | | |
| | | | | | | $ | 6,688,227 | | |
| Special Tax Revenue - 1.6% | | | | | |
| $ | 3,500 | | | New Jersey EDA, (Cigarette Tax), Variable Rate,
8.93%, 6/15/34(1)(2) | | $ | 3,891,230 | | |
| | | | | | | $ | 3,891,230 | | |
| Transportation - 11.5% | | | | | |
| $ | 5,000 | | | Port Authority of New York and New Jersey,
5.375%, 3/1/28 | | $ | 5,682,400 | | |
| | 19,000 | | | Port Authority of New York and New Jersey,
6.125%, 6/1/94(8) | | | 22,805,890 | | |
| | | | | | | $ | 28,488,290 | | |
Principal Amount
(000's omitted) | |
Security | |
Value | |
| Water and Sewer - 2.3% | | | | | | | |
| $ | 5,685 | | | New Jersey EDA, (Atlantic City Sewer), (AMT),
5.45%, 4/1/28 | | $ | 5,842,475 | | |
| | | | | $ | 5,842,475 | | |
Total Tax-Exempt Investments - 99.7%
(identified cost $222,203,567) | | | | $ | 247,104,853 | | |
| Other Assets, Less Liabilities - 0.3% | | | | $ | 770,929 | | |
| Net Assets - 100.0% | | | | $ | 247,875,782 | | |
AMBAC - AMBAC Financial Group, Inc.
AMT - Interest earned from these securities may be considered a tax preference item for purposes of the Federal Alternative Minimum Tax.
FGIC - Financial Guaranty Insurance Company
FSA - Financial Security Assurance, Inc.
MBIA - Municipal Bond Insurance Association
XLCA - XL Capital Assurance, Inc.
The Fund invests primarily in debt securities issued by New Jersey municipalities. The ability of the issuers of the debt securities to meet their obligations may be affected by economic developments in a specific industry or municipality. In order to reduce the risk associated with such economic developments, at January 31, 2005, 49.3% of the securities in the portfolio of investments are backed by bond insurance of various financial institutions and financial guaranty assurance agencies. The aggregate percentage insured by an individual financial institution ranged from 2.2% to 22.8% of total investments.
(1) Security exempt from registration under Rule 144A of the Securities Act of 1933. These securities may be sold in transactions exempt from registration, normally to qualified institutional buyers. At January 31, 2005, the aggregate value of the securities is $23,653,740 or 9.5% of the Fund's net assets.
(2) Security has been issued as an inverse floater bond. The stated interest rate represents the rate in effect at January 31, 2005.
(3) Defaulted bond.
(4) Security has been issued as a leveraged inverse floater bond. The stated interest rate represents the rate in effect at January 31, 2005.
(5) When-issued security.
(6) Security (or a portion thereof) has been segregated to cover when-issued securities.
(7) Security is in default and making only partial interest payments.
(8) Security (or a portion thereof) has been segregated to cover margin requirements on open financial futures contracts.
(9) Security is subject to a shortfall and forbearance agreement.
See notes to financial statements
35
Eaton Vance Pennsylvania Municipals Fund as of January 31, 2005
PORTFOLIO OF INVESTMENTS (Unaudited)
| | Tax-Exempt Investments - 99.3% | | | | | | | | |
Principal Amount
(000's omitted) | | Security | | Value | |
| | Cogeneration - 5.3% | | | | | | | | |
| $ | 1,585 | | | Carbon County IDA, (Panther Creek Partners), (AMT),
6.65%, 5/1/10 | | $ | 1,721,643 | | |
| | 4,500 | | | Pennsylvania EDA, (Colver), (AMT), 7.125%, 12/1/15 | | | 4,604,130 | | |
| | 5,000 | | | Pennsylvania EDA, (Northampton Generating), (AMT),
6.50%, 1/1/13 | | | 5,054,200 | | |
| | | | | | | $ | 11,379,973 | | |
| | Education - 0.5% | | | | | | | | |
| $ | 1,100 | | | Lehigh County, General Purpose Authority,
(Cedar Crest College), 6.70%, 4/1/26 | | $ | 1,150,853 | | |
| | | | | | | $ | 1,150,853 | | |
| | Electric Utilities - 2.1% | | | | | | | | |
| $ | 2,000 | | | Pennsylvania, EDA, (Reliant Energy, Inc.), (AMT),
6.75%, 12/1/36 | | $ | 2,109,940 | | |
| | 2,250 | | | York County IDA, Pollution Control, (Public Service
Enterprise Group, Inc.), 5.50%, 9/1/20 | | | 2,365,155 | | |
| | | | | | | $ | 4,475,095 | | |
| | Escrowed / Prerefunded - 1.3% | | | | | | | | |
| $ | 2,565 | | | Delaware IDA, (Glen Riddle), (AMT), Prerefunded to
9/1/05, 8.625%, 9/1/25 | | $ | 2,731,109 | | |
| | | | | | | $ | 2,731,109 | | |
| | General Obligations - 1.0% | | | | | | | | |
| $ | 1,000 | | | Puerto Rico, 4.75%, 7/1/23 | | $ | 1,020,050 | | |
| | 1,000 | | | Radnor Township, 5.125%, 7/15/34 | | | 1,060,250 | | |
| | | | | | | $ | 2,080,300 | | |
| | Health Care-Miscellaneous - 3.0% | | | | | | | | |
| $ | 2,000 | | | Allegheny County IDA, (Residential Resources, Inc.),
6.50%, 9/1/21 | | $ | 2,123,820 | | |
| | 700 | | | Allegheny County, (Residential Resources, Inc.),
6.60%, 9/1/31 | | | 739,242 | | |
| | 3,500 | | | Chester County HEFA, (Devereux Foundation),
6.00%, 11/1/29 | | | 3,685,395 | | |
| | | | | | | $ | 6,548,457 | | |
Principal Amount
(000's omitted) | |
Security | |
Value | |
| Hospital - 12.6% | | | | | |
| $ | 3,060 | | | Hazelton Health Service Authority, (Hazelton General
Hospital), 5.50%, 7/1/27 | | $ | 2,704,550 | | |
| | 1,150 | | | Horizon Hospital Systems Authority, (Horizon Hospital
Systems, Inc.), 6.35%, 5/15/26 | | | 1,200,358 | | |
| | 2,500 | | | Lancaster County, Hospital Authority, 5.50%, 3/15/26 | | | 2,597,725 | | |
| | 2,000 | | | Lebanon County Health Facility Authority, (Good Samaritan
Hospital), 5.00%, 11/15/18 | | | 2,037,740 | | |
| | 2,150 | | | Lebanon County Health Facility Authority, (Good Samaritan
Hospital), 6.00%, 11/15/35 | | | 2,272,399 | | |
| | 5,000 | | | Lehigh County, General Purpose Authority, (Lehigh Valley
Health Network), 5.25%, 7/1/32 | | | 5,153,600 | | |
| | 2,000 | | | Monroe County, Hospital Authority, (Pocono Medical Center),
6.00%, 1/1/43 | | | 2,122,420 | | |
| | 1,110 | | | Montgomery County Higher Education and Health Authority,
(Catholic Health East), 5.375%, 11/15/34 | | | 1,158,951 | | |
| | 4,100 | | | Pennsylvania HEFA, (UPMC Health System),
6.00%, 1/15/31 | | | 4,557,519 | | |
| | 1,400 | | | St. Mary Hospital Authority, (Catholic Health East),
5.375%, 11/15/34 | | | 1,467,312 | | |
| | 1,885 | | | Washington County Hospital Authority, (Monongahela
Hospital), 5.50%, 6/1/17 | | | 2,036,083 | | |
| | | | | | | $ | 27,308,657 | | |
| Industrial Development Revenue - 2.8% | | | | | |
| $ | 500 | | | Erie IDA, (International Paper), (AMT), 5.85%, 12/1/20 | | $ | 519,640 | | |
| | 4,000 | | | Franklin County IDA, (Corning, Inc.), 6.25%, 8/1/05 | | | 4,000,080 | | |
| | 1,500 | | | New Morgan IDA, (Browning-Ferris Industries, Inc.), (AMT),
6.50%, 4/1/19 | | | 1,475,340 | | |
| | | | | | | $ | 5,995,060 | | |
| Insured-Education - 2.6% | | | | | |
| $ | 1,000 | | | Chester County, IDA Educational Facility, (Westtown School),
(AMBAC), 5.00%, 1/1/31 | | $ | 1,036,310 | | |
| | 1,350 | | | Lycoming County Authority, (Pennsylvania College of
Technology), (AMBAC), 5.25%, 5/1/32(1) | | | 1,447,740 | | |
| | 3,020 | | | Pennsylvania HEFA, (University of the Science in Philadelphia),
(XLCA), 4.75%, 11/1/33(2) | | | 3,042,982 | | |
| | | | | | | $ | 5,527,032 | | |
| Insured-Electric Utilities - 4.9% | | | | | |
| $ | 8,000 | | | Beaver IDA, (Ohio Edison Co.), (AMBAC),
7.05%, 10/1/20(3) | | $ | 8,409,760 | | |
| | 1,665 | | | Puerto Rico Electric Power Authority, (FSA), Variable Rate,
11.528%, 7/1/29(4)(5) | | | 2,098,067 | | |
| | | | | | | $ | 10,507,827 | | |
See notes to financial statements
36
Eaton Vance Pennsylvania Municipals Fund as of January 31, 2005
PORTFOLIO OF INVESTMENTS (Unaudited) CONT'D
Principal Amount
(000's omitted) | |
Security | |
Value | |
| | Insured-Escrowed / Prerefunded - 7.5% | | | | | | | | |
| $ | 2,500 | | | Erie School District, (MBIA), Escrowed to Maturity,
0.00%, 5/1/19 | | $ | 1,338,975 | | |
| | 2,625 | | | Erie School District, (MBIA), Escrowed to Maturity,
0.00%, 5/1/20 | | | 1,331,663 | | |
| | 2,625 | | | Erie School District, (MBIA), Escrowed to Maturity,
0.00%, 5/1/21 | | | 1,259,633 | | |
| | 3,625 | | | Erie School District, (MBIA), Escrowed to Maturity,
0.00%, 5/1/22 | | | 1,645,895 | | |
| | 1,365 | | | Pennsylvania Turnpike Commission, (AMBAC), Escrowed to
Maturity, 4.75%, 12/1/27 | | | 1,413,458 | | |
| | 1,000 | | | Philadelphia School District, (FSA), Prerefunded to 2/1/12,
5.50%, 2/1/31 | | | 1,139,730 | | |
| | 4,845 | | | Westmoreland Municipal Authority, (FGIC), Escrowed to
Maturity, 0.00%, 8/15/19 | | | 2,544,158 | | |
| | 5,400 | | | Westmoreland Municipal Authority, (FGIC), Escrowed to
Maturity, 0.00%, 8/15/20 | | | 2,704,428 | | |
| | 5,780 | | | Westmoreland Municipal Authority, (FGIC), Escrowed to
Maturity, 0.00%, 8/15/20 | | | 2,872,833 | | |
| | | | | | | $ | 16,250,773 | | |
| | Insured-General Obligations - 22.7% | | | | | | | | |
| $ | 1,000 | | | Butler School District, (FGIC), 5.00%, 10/1/26 | | $ | 1,053,620 | | |
| | 2,170 | | | Elizabeth Forward School District, (MBIA), 0.00%, 9/1/20 | | | 1,079,705 | | |
| | 2,170 | | | Elizabeth Forward School District, (MBIA), 0.00%, 9/1/21 | | | 1,022,396 | | |
| | 2,170 | | | Elizabeth Forward School District, (MBIA), 0.00%, 9/1/22 | | | 967,017 | | |
| | 2,170 | | | Elizabeth Forward School District, (MBIA), 0.00%, 9/1/23 | | | 916,890 | | |
| | 4,350 | | | Erie School District, (AMBAC), 0.00%, 9/1/30 | | | 1,251,321 | | |
| | 2,390 | | | Gateway, School District Alleghany County, (FGIC),
5.00%, 10/15/32 | | | 2,497,024 | | |
| | 1,075 | | | Greater Nanticoke Area School District, (MBIA),
0.00%, 10/15/28 | | | 331,949 | | |
| | 1,075 | | | Greater Nanticoke Area School District, (MBIA),
0.00%, 10/15/29 | | | 314,674 | | |
| | 2,365 | | | Harrisburg, (AMBAC), 0.00%, 3/15/17 | | | 1,399,702 | | |
| | 5,175 | | | Hazelton School District, (FGIC), 0.00%, 3/1/21 | | | 2,494,195 | | |
| | 1,000 | | | Hopewell School District, (FSA), 0.00%, 9/1/22 | | | 443,340 | | |
| | 2,000 | | | Hopewell School District, (FSA), 0.00%, 9/1/26 | | | 707,960 | | |
| | 1,315 | | | Lake Lehman School District, (MBIA), 0.00%, 4/1/26 | | | 474,912 | | |
| | 1,430 | | | Mars Area School District, (MBIA), 0.00%, 3/1/14 | | | 1,008,021 | | |
| | 3,420 | | | McKeesport Area School District, (AMBAC), 0.00%, 10/1/25 | | | 1,288,382 | | |
| | 2,340 | | | McKeesport Area School District, (AMBAC), 0.00%, 10/1/27 | | | 786,240 | | |
| | 5,400 | | | Northampton County, (FSA), 5.25%, 10/1/30 | | | 5,796,630 | | |
| | 7,000 | | | Philadelphia School District, (FGIC), 5.125%, 6/1/34 | | | 7,395,010 | | |
| | 2,530 | | | Philadelphia, (FSA), 5.00%, 3/15/28 | | | 2,614,932 | | |
| | 3,355 | | | Philadelphia, (FSA), 5.25%, 9/15/25 | | | 3,661,211 | | |
| | 290 | | | Puerto Rico, (FSA), 5.125%, 7/1/30 | | | 309,851 | | |
| | 3,300 | | | Puerto Rico, (FSA), Variable Rate, 9.459%, 7/1/27(4)(5) | | | 4,234,164 | | |
Principal Amount
(000's omitted) | |
Security | |
Value | |
| Insured-General Obligations (continued) | | | | | |
| $ | 500 | | | Puerto Rico, (MBIA), Variable Rate,
12.335%, 7/1/20(4)(5) | | $ | 788,610 | | |
| | 655 | | | Rochester Area School District, (AMBAC), 0.00%, 5/1/10 | | | 551,359 | | |
| | 4,000 | | | Spring Ford School District, (FGIC), 4.75%, 3/1/25 | | | 4,062,880 | | |
| | 1,400 | | | Upper Darby School District, (AMBAC), 5.00%, 5/1/19 | | | 1,500,184 | | |
| | | | | | | $ | 48,952,179 | | |
| Insured-Hospital - 4.3% | | | | | |
| $ | 3,750 | | | Allegheny County Hospital Authority, (Magee-Womens
Hospital), (FGIC), 0.00%, 10/1/15 | | $ | 2,412,825 | | |
| | 4,000 | | | Pennsylvania Higher Educational Facilities Authority,
(UPMC Health System), (FSA), 5.00%, 8/1/29 | | | 4,139,000 | | |
| | 1,250 | | | Sharon Health System Authority, (Sharon Regional Health
System), (MBIA), 5.00%, 12/1/28 | | | 1,286,850 | | |
| | 1,310 | | | Washington County Hospital Authority, (Washington Hospital),
(AMBAC), 5.50%, 7/1/17 | | | 1,509,801 | | |
| | | | | | | $ | 9,348,476 | | |
Insured-Lease Revenue / Certificates of
Participation - 0.3% | | | | | |
| $ | 500 | | | Puerto Rico Public Finance Corp., (AMBAC), Variable Rate,
12.857%, 6/1/24(4)(5) | | $ | 700,575 | | |
| | | | | | | $ | 700,575 | | |
| Insured-Special Tax Revenue - 0.3% | | | | | |
| $ | 635 | | | Pennsylvania Turnpike Commission, Franchise Tax Revenue,
(AMBAC), 4.75%, 12/1/27 | | $ | 643,484 | | |
| | | | | | | $ | 643,484 | | |
| Insured-Transportation - 3.0% | | | | | |
| $ | 1,600 | | | Allegheny County Port Authority, (FGIC), 5.00%, 3/1/29 | | $ | 1,663,248 | | |
| | 3,750 | | | Pennsylvania Turnpike Commission, (AMBAC),
5.00%, 7/15/41 | | | 3,881,925 | | |
| | 865 | | | Puerto Rico Highway and Transportation Authority, (MBIA),
Variable Rate, 11.707%, 7/1/26(4)(5) | | | 1,017,915 | | |
| | | | | | | $ | 6,563,088 | | |
| Insured-Utilities - 4.5% | | | | | |
| $ | 5,500 | | | Philadelphia Gas Works Revenue, (FSA), 5.00%, 7/1/28 | | $ | 5,752,175 | | |
| | 2,700 | | | Philadelphia Gas Works Revenue, (FSA), Variable Rate,
11.92%, 7/1/17(4)(5) | | | 3,879,738 | | |
| | | | | | | $ | 9,631,913 | | |
See notes to financial statements
37
Eaton Vance Pennsylvania Municipals Fund as of January 31, 2005
PORTFOLIO OF INVESTMENTS (Unaudited) CONT'D
Principal Amount
(000's omitted) | |
Security | |
Value | |
| Insured-Water and Sewer - 6.4% | | | | | |
| $ | 3,000 | | | Allegheny County Sanitation Authority, (MBIA),
5.50%, 12/1/30 | | $ | 3,331,740 | | |
| | 1,000 | | | Harrisburg Authority Water Revenue, (FSA),
5.00%, 7/15/29 | | | 1,041,310 | | |
| | 1,750 | | | Lower Moreland Township Authority, Sewer Revenue, (FSA),
5.00%, 8/1/29 | | | 1,824,795 | | |
| | 2,500 | | | Philadelphia Water and Wastewater, (FGIC), Variable Rate,
12.355%, 11/1/31(4)(5) | | | 2,789,800 | | |
| | 3,000 | | | Pittsburgh Water and Sewer Authority, (AMBAC),
5.125%, 12/1/27 | | | 3,177,120 | | |
| | 1,600 | | | Unity Township Municipal Authority, (FSA),
5.00%, 12/1/34 | | | 1,677,824 | | |
| | | | | | | $ | 13,842,589 | | |
| Machine Tools - 0.2% | | | | | |
| $ | 500 | | | Montgomery County Higher Education and Health Authority,
(Faulkeways at Gwynedd), 6.75%, 11/15/24 | | $ | 532,755 | | |
| | | | | | | $ | 532,755 | | |
| Nursing Home - 4.0% | | | | | |
| $ | 2,000 | | | Allegheny County HDA, (Villa St. Joseph),
6.00%, 8/15/28 | | $ | 1,875,640 | | |
| | 930 | | | Chartiers Valley IDA, (Beverly Enterprises, Inc.),
5.375%, 6/1/07 | | | 930,149 | | |
| | 1,510 | | | Green County IDA, (Beverly Enterprises, Inc.),
5.75%, 3/1/13 | | | 1,512,416 | | |
| | 3,150 | | | Montgomery IDA, (Advancement of Geriatric Health Care
Institute), 8.375%, 7/1/23 | | | 2,979,459 | | |
| | 1,310 | | | Westmoreland County IDA, (Highland Health Systems, Inc.),
9.25%, 6/1/22 | | | 1,313,576 | | |
| | | | | | | $ | 8,611,240 | | |
| Senior Living / Life Care - 8.7% | | | | | |
| $ | 1,210 | | | Bucks County IDA, (Pennswood), 6.00%, 10/1/27 | | $ | 1,282,201 | | |
| | 5,000 | | | Chester IDA, (Senior Life Choice of Kimberton), (AMT),
8.50%, 9/1/25 | | | 5,177,550 | | |
| | 1,860 | | | Cliff House Trust, (AMT), 6.625%, 6/1/27 | | | 1,432,367 | | |
| | 1,700 | | | Crawford County Hospital Authority, (Wesbury United
Methodist Community), 6.25%, 8/15/29 | | | 1,750,609 | | |
| | 4,050 | | | Delaware County, (White Horse Village), 7.50%, 7/1/18 | | | 4,175,712 | | |
| | 1,865 | | | Grove City, Area Hospital Authority, (Grove Manor),
6.625%, 8/15/29 | | | 1,944,374 | | |
| | 1,835 | | | Lancaster County, Hospital Authority, (Willow Valley
Retirement Communities), 5.875%, 6/1/31 | | | 1,933,448 | | |
| | 1,100 | | | Philadelphia HEFA, (The Philadelphia Protestant Home),
6.50%, 7/1/27 | | | 1,106,490 | | |
| | | | | | | $ | 18,802,751 | | |
Principal Amount
(000's omitted) | |
Security | |
Value | |
| Transportation - 1.3% | | | | | |
| $ | 1,000 | | | Delaware River Joint Toll Bridge Commission,
5.00%, 7/1/28 | | $ | 1,038,930 | | |
| | 1,000 | | | Erie Municipal Airport Authority, (AMT), 5.875%, 7/1/16 | | | 1,009,210 | | |
| | 750 | | | Pennsylvania EDA, (Amtrak), (AMT), 6.25%, 11/1/31 | | | 787,523 | | |
| | | | | | | $ | 2,835,663 | | |
| | Total Tax-Exempt Investments - 99.3%
(identified cost $197,860,432) | | | | | $ | 214,419,849 | | |
| | Other Assets, Less Liabilities - 0.7% | | | | | $ | 1,404,448 | | |
| | Net Assets - 100.0% | | | | | $ | 215,824,297 | | |
AMBAC - AMBAC Financial Group, Inc.
AMT - Interest earned from these securities may be considered a tax preference item for purposes of the Federal Alternative Minimum Tax.
FGIC - Financial Guaranty Insurance Company
FSA - Financial Security Assurance, Inc.
MBIA - Municipal Bond Insurance Association
XLCA - XL Capital Assurance, Inc.
The Fund invests primarily in debt securities issued by Pennsylvania municipalities. The ability of the issuers of the debt securities to meet their obligations may be affected by economic developments in a specific industry or municipality. In order to reduce the risk associated with such economic developments, at January 31, 2005, 56.9% of the securities in the portfolio of investments are backed by bond insurance of various financial institutions and financial guaranty assurance agencies. The aggregate percentage insured by an individual financial institution ranged from 1.4% to 18.3% of total investments.
(1) Security (or a portion thereof) has been segregated to cover margin requirements on open financial futures contracts.
(2) When-issued security.
(3) Security (or a portion thereof) has been segregated to cover when-issued securities.
(4) Security exempt from registration under Rule 144A of the Securities Act of 1933. These securities may be sold in transactions exempt from registration, normally to qualified institutional buyers. At January 31, 2005, the aggregate value of the securities is $15,508,869 or 7.2% of the Fund's net assets.
(5) Security has been issued as a leveraged inverse floater bond. The stated interest rate represents the rate in effect at January 31, 2005.
See notes to financial statements
38
Eaton Vance Municipals Funds as of January 31, 2005
FINANCIAL STATEMENTS (Unaudited)
Statements of Assets and Liabilities
As of January 31, 2005
| | | Arizona Fund | | Colorado Fund | | Connecticut Fund | | Michigan Fund | |
| Assets | | | |
| Investments - | | | | | | | | | | | | | | | | | |
| Identified cost | | $ | 58,584,523 | | | $ | 28,246,416 | | | $ | 125,118,393 | | | $ | 56,725,531 | | |
| Unrealized appreciation | | | 6,069,780 | | | | 2,154,629 | | | | 10,608,219 | | | | 7,017,986 | | |
| Investments, at value | | $ | 64,654,303 | | | $ | 30,401,045 | | | $ | 135,726,612 | | | $ | 63,743,517 | | |
| Cash | | $ | 821,558 | | | $ | - | | | $ | - | | | $ | 349,203 | | |
| Receivable for Fund shares sold | | | 234,594 | | | | 6,225 | | | | 136,111 | | | | 7,146 | | |
| Interest receivable | | | 547,192 | | | | 348,981 | | | | 1,438,120 | | | | 716,591 | | |
| Total assets | | $ | 66,257,647 | | | $ | 30,756,251 | | | $ | 137,300,843 | | | $ | 64,816,457 | | |
| Liabilities | | | |
| Payable for Fund shares redeemed | | $ | 141,187 | | | $ | 11,124 | | | $ | 146,472 | | | $ | 57,002 | | |
| Payable for daily variation margin on open financial futures contracts | | | 19,766 | | | | 13,312 | | | | 41,313 | | | | 21,984 | | |
| Demand note payable | | | - | | | | 100,000 | | | | 200,000 | | | | - | | |
| Dividends payable | | | 125,381 | | | | 41,775 | | | | 205,287 | | | | 110,978 | | |
| Due to bank | | | - | | | | 25,634 | | | | 69,070 | | | | - | | |
| Payable to affiliate for service fees | | | 11,081 | | | | 5,177 | | | | 23,124 | | | | 10,940 | | |
| Accrued expenses | | | 30,510 | | | | 24,289 | | | | 39,571 | | | | 37,710 | | |
| Total liabilities | | $ | 327,925 | | | $ | 221,311 | | | $ | 724,837 | | | $ | 238,614 | | |
| Net Assets | | $ | 65,929,722 | | | $ | 30,534,940 | | | $ | 136,576,006 | | | $ | 64,577,843 | | |
| Sources of Net Assets | | | |
| Paid-in capital | | $ | 63,543,841 | | | $ | 29,344,208 | | | $ | 128,920,700 | | | $ | 59,611,613 | | |
| Accumulated net realized loss (computed on the basis of identified cost) | | | (3,259,893 | ) | | | (689,481 | ) | | | (1,768,310 | ) | | | (1,605,132 | ) | |
Accumulated undistributed (distributions in excess of) net
investment income | | | 98,743 | | | | (57,726 | ) | | | (313,679 | ) | | | (21,829 | ) | |
| Net unrealized appreciation (computed on the basis of identified cost) | | | 5,547,031 | | | | 1,937,939 | | | | 9,737,295 | | | | 6,593,191 | | |
| Total | | $ | 65,929,722 | | | $ | 30,534,940 | | | $ | 136,576,006 | | | $ | 64,577,843 | | |
| Class A Shares | | | |
| Net Assets | | $ | 47,861,414 | | | $ | 20,377,791 | | | $ | 102,276,016 | | | $ | 55,088,581 | | |
| Shares Outstanding | | | 4,874,061 | | | | 2,089,566 | | | | 9,490,278 | | | | 5,701,617 | | |
Net Asset Value, Price and Redemption Price Per Share
(net assets ÷ shares of beneficial interest outstanding) | | $ | 9.82 | | | $ | 9.75 | | | $ | 10.78 | | | $ | 9.66 | | |
Maximum Offering Price Per Share
(100 ÷ 95.25 of net assets value per share) | | $ | 10.31 | | | $ | 10.24 | | | $ | 11.32 | | | $ | 10.14 | | |
| Class B Shares | | | |
| Net Assets | | $ | 18,068,308 | | | $ | 10,157,149 | | | $ | 34,299,990 | | | $ | 9,489,262 | | |
| Shares Outstanding | | | 1,655,326 | | | | 956,993 | | | | 3,198,984 | | | | 879,281 | | |
Net Asset Value, Offering Price and Redemption Price Per Share
(net assets ÷ shares of beneficial interest outstanding) | | $ | 10.92 | | | $ | 10.61 | | | $ | 10.72 | | | $ | 10.79 | | |
On sales of $25,000 or more, the offering price of Class A shares is reduced.
See notes to financial statements
39
Eaton Vance Municipals Funds as of January 31, 2005
FINANCIAL STATEMENTS (Unaudited) CONT'D
Statements of Assets and Liabilities
As of January 31, 2005
| | | Minnesota Fund | | New Jersey Fund | | Pennsylvania Fund | |
| Assets | | | |
| Investments - | | | | | | | | | | | | | |
| Identified cost | | $ | 40,852,846 | | | $ | 222,203,567 | | | $ | 197,860,432 | | |
| Unrealized appreciation | | | 3,114,149 | | | | 24,901,286 | | | | 16,559,417 | | |
| Investments, at value | | $ | 43,966,995 | | | $ | 247,104,853 | | | $ | 214,419,849 | | |
| Cash | | $ | - | | | $ | - | | | $ | 336,272 | | |
| Receivable for investments sold | | | - | | | | 1,500,000 | | | | 1,884,216 | | |
| Receivable for Fund shares sold | | | 1,462 | | | | 129,154 | | | | 570,855 | | |
| Interest receivable | | | 532,451 | | | | 3,024,340 | | | | 2,526,491 | | |
| Total assets | | $ | 44,500,908 | | | $ | 251,758,347 | | | $ | 219,737,683 | | |
| Liabilities | | | |
| Payable for Fund shares redeemed | | $ | 29,253 | | | $ | 147,649 | | | $ | 331,457 | | |
| Payable for daily variation margin on open financial futures contracts | | | 10,922 | | | | 88,673 | | | | 77,812 | | |
| Demand note payable | | | 100,000 | | | | 1,600,000 | | | | - | | |
| Dividends payable | | | 60,309 | | | | 356,622 | | | | 389,445 | | |
| Payable for when-issued securities | | | - | | | | 1,500,000 | | | | 3,006,004 | | |
| Due to bank | | | 4,014 | | | | 85,666 | | | | - | | |
| Payable to affiliate for service fees | | | 7,471 | | | | 41,823 | | | | 36,342 | | |
| Accrued expenses | | | 27,709 | | | | 62,132 | | | | 72,326 | | |
| Total liabilities | | $ | 239,678 | | | $ | 3,882,565 | | | $ | 3,913,386 | | |
| Net Assets | | $ | 44,261,230 | | | $ | 247,875,782 | | | $ | 215,824,297 | | |
| Sources of Net Assets | | | |
| Paid-in capital | | $ | 43,084,209 | | | $ | 232,324,533 | | | $ | 215,992,844 | | |
| Accumulated net realized loss (computed on the basis of identified cost) | | | (1,610,083 | ) | | | (6,927,556 | ) | | | (14,699,406 | ) | |
| Accumulated undistributed (distributions in excess of) net investment income | | | (39,426 | ) | | | 109,898 | | | | (165,779 | ) | |
| Net unrealized appreciation (computed on the basis of identified cost) | | | 2,826,530 | | | | 22,368,907 | | | | 14,696,638 | | |
| Total | | $ | 44,261,230 | | | $ | 247,875,782 | | | $ | 215,824,297 | | |
| Class A Shares | | | |
| Net Assets | | $ | 29,392,917 | | | $ | 170,221,110 | | | $ | 165,048,678 | | |
| Shares Outstanding | | | 3,142,650 | | | | 16,286,980 | | | | 16,586,049 | | |
Net Asset Value, Price and Redemption Price Per Share
(net assets ÷ shares of beneficial interest outstanding) | | $ | 9.35 | | | $ | 10.45 | | | $ | 9.95 | | |
Maximum Offering Price Per Share
(100 ÷ 95.25 of net assets value per share) | | $ | 9.82 | | | $ | 10.97 | | | $ | 10.45 | | |
| Class B Shares | | | |
| Net Assets | | $ | 14,868,313 | | | $ | 77,654,672 | | | $ | 50,775,619 | | |
| Shares Outstanding | | | 1,477,473 | | | | 7,118,775 | | | | 4,933,583 | | |
Net Asset Value, Offering Price and Redemption Price Per Share
(net assets ÷ shares of beneficial interest outstanding) | | $ | 10.06 | | | $ | 10.91 | | | $ | 10.29 | | |
On sales of $25,000 or more, the offering price of Class A shares is reduced.
See notes to financial statements
40
Eaton Vance Municipals Funds as of January 31, 2005
FINANCIAL STATEMENTS (Unaudited) CONT'D
Statements of Operations
For the Six Months Ended January 31, 2005
| | | Arizona Fund | | Colorado Fund | | Connecticut Fund | | Michigan Fund | |
| Investment Income | | | |
| Interest | | $ | 1,394,408 | | | $ | 598,288 | | | $ | 2,569,442 | | | $ | 1,294,920 | | |
| Interest allocated from Portfolio | | | 511,487 | | | | 219,010 | | | | 920,216 | | | | 474,837 | | |
| Expenses allocated from Portfolio | | | (36,757 | ) | | | (15,278 | ) | | | (83,876 | ) | | | (36,079 | ) | |
| Total investment income | | $ | 1,869,138 | | | $ | 802,020 | | | $ | 3,405,782 | | | $ | 1,733,678 | | |
| Expenses | | | |
| Investment adviser fee | | $ | 79,935 | | | $ | 22,943 | | | $ | 193,759 | | | $ | 77,036 | | |
| Trustees fees and expenses | | | 2,484 | | | | 480 | | | | 2,768 | | | | 2,441 | | |
| Distribution and service fees - | | | | | | | | | | | | | | | | | |
| Class A | | | 48,052 | | | | 19,937 | | | | 100,441 | | | | 55,314 | | |
| Class B | | | 90,328 | | | | 49,957 | | | | 169,345 | | | | 50,041 | | |
| Legal and accounting services | | | 17,715 | | | | 11,987 | | | | 15,444 | | | | 16,507 | | |
| Printing and postage | | | 3,477 | | | | 2,786 | | | | 8,389 | | | | 5,070 | | |
| Custodian fee | | | 20,030 | | | | 12,385 | | | | 33,396 | | | | 23,835 | | |
| Transfer and dividend disbursing agent fees | | | 18,446 | | | | 8,847 | | | | 37,612 | | | | 23,883 | | |
| Registration fees | | | 4,171 | | | | 200 | | | | 500 | | | | 2,683 | | |
| Miscellaneous | | | 9,302 | | | | 5,079 | | | | 9,987 | | | | 10,066 | | |
| Total expenses | | $ | 293,940 | | | $ | 134,601 | | | $ | 571,641 | | | $ | 266,876 | | |
Deduct -
Reduction of custodian fee | | $ | 2,701 | | | $ | 954 | | | $ | 5,460 | | | $ | 2,115 | | |
| Total expense reductions | | $ | 2,701 | | | $ | 954 | | | $ | 5,460 | | | $ | 2,115 | | |
| Net expenses | | $ | 291,239 | | | $ | 133,647 | | | $ | 566,181 | | | $ | 264,761 | | |
| Net investment income | | $ | 1,577,899 | | | $ | 668,373 | | | $ | 2,839,601 | | | $ | 1,468,917 | | |
| Realized and Unrealized Gain (Loss) | | | |
| Net realized gain (loss) - | | | | | | | | | | | | | | | | | |
| Investment transactions (identified cost basis) | | $ | (1,088,638 | ) | | $ | 103,818 | | | $ | 294,250 | | | $ | 601,706 | | |
| Investment transactions from Portfolio (identified cost basis) | | | 109,122 | | | | 55,966 | | | | 140,195 | | | | 517,756 | | |
| Financial futures contracts | | | (88,132 | ) | | | (202,372 | ) | | | (555,331 | ) | | | (393,176 | ) | |
| Financial futures contracts from Portfolio | | | (926,864 | ) | | | (194,379 | ) | | | (717,261 | ) | | | (405,041 | ) | |
| Net realized gain (loss) | | $ | (1,994,512 | ) | | $ | (236,967 | ) | | $ | (838,147 | ) | | $ | 321,245 | | |
| Change in unrealized appreciation (depreciation) - | | | | | | | | | | | | | | | | | |
| Investments (identified cost basis) | | $ | 1,894,741 | | | $ | 473,789 | | | $ | 1,717,368 | | | $ | 465,491 | | |
| Investments from Portfolio (identified cost basis) | | | 1,283,573 | | | | 558,799 | | | | 2,209,150 | | | | 954,773 | | |
| Financial futures contracts | | | (361,112 | ) | | | (92,302 | ) | | | (422,408 | ) | | | (180,726 | ) | |
| Financial futures contracts from Portfolio | | | 304,669 | | | | (128,997 | ) | | | (457,064 | ) | | | (249,054 | ) | |
| Net change in unrealized appreciation (depreciation) | | $ | 3,121,871 | | | $ | 811,289 | | | $ | 3,047,046 | | | $ | 990,484 | | |
| Net realized and unrealized gain | | $ | 1,127,359 | | | $ | 574,322 | | | $ | 2,208,899 | | | $ | 1,311,729 | | |
| Net increase in net assets from operations | | $ | 2,705,258 | | | $ | 1,242,695 | | | $ | 5,048,500 | | | $ | 2,780,646 | | |
See notes to financial statements
41
Eaton Vance Municipals Funds as of January 31, 2005
FINANCIAL STATEMENTS (Unaudited) CONT'D
Statements of Operations
For the Six Months Ended January 31, 2005
| | | Minnesota Fund | | New Jersey Fund | | Pennsylvania Fund | |
| Investment Income | | | |
| Interest | | $ | 880,586 | | | $ | 4,944,733 | | | $ | 4,623,313 | | |
| Interest allocated from Portfolio | | | 315,648 | | | | 1,809,444 | | | | 1,657,966 | | |
| Expenses allocated from Portfolio | | | (22,529 | ) | | | (163,010 | ) | | | (141,984 | ) | |
| Total investment income | | $ | 1,173,705 | | | $ | 6,591,167 | | | $ | 6,139,295 | | |
| Expenses | | | |
| Investment adviser fee | | $ | 41,253 | | | $ | 384,607 | | | $ | 340,276 | | |
| Trustees fees and expenses | | | 494 | | | | 4,118 | | | | 4,478 | | |
| Distribution and service fees - | | | | | | | | | | | | | |
| Class A | | | 29,510 | | | | 167,271 | | | | 163,103 | | |
| Class B | | | 71,793 | | | | 373,996 | | | | 246,718 | | |
| Legal and accounting services | | | 16,732 | | | | 26,701 | | | | 32,859 | | |
| Printing and postage | | | 3,538 | | | | 14,495 | | | | 17,999 | | |
| Custodian fee | | | 14,334 | | | | 47,451 | | | | 52,156 | | |
| Transfer and dividend disbursing agent fees | | | 17,408 | | | | 79,366 | | | | 88,257 | | |
| Registration fees | | | - | | | | 900 | | | | 1,650 | | |
| Miscellaneous | | | 6,077 | | | | 12,804 | | | | 15,355 | | |
| Total expenses | | $ | 201,139 | | | $ | 1,111,709 | | | $ | 962,851 | | |
Deduct -
Reduction of custodian fee | | $ | 1,459 | | | $ | 9,738 | | | $ | 9,981 | | |
| Total expense reductions | | $ | 1,459 | | | $ | 9,738 | | | $ | 9,981 | | |
| Net expenses | | $ | 199,680 | | | $ | 1,101,971 | | | $ | 952,870 | | |
| Net investment income | | $ | 974,025 | | | $ | 5,489,196 | | | $ | 5,186,425 | | |
| Realized and Unrealized Gain (Loss) | | | |
| Net realized gain (loss) - | | | | | | | | | | | | | |
| Investment transactions (identified cost basis) | | $ | 119,194 | | | $ | 1,476,596 | | | $ | 725,518 | | |
| Investment transactions from Portfolio (identified cost basis) | | | 66,110 | | | | 268,111 | | | | 221,590 | | |
| Financial futures contracts | | | (64,189 | ) | | | (286,706 | ) | | | (327,820 | ) | |
| Financial futures contracts from Portfolio | | | (709,588 | ) | | | (4,738,210 | ) | | | (3,090,513 | ) | |
| Net realized loss | | $ | (588,473 | ) | | $ | (3,280,209 | ) | | $ | (2,471,225 | ) | |
| Change in unrealized appreciation (depreciation) - | | | | | | | | | | | | | |
| Investments (identified cost basis) | | $ | 814,218 | | | $ | 5,182,865 | | | $ | 3,595,243 | | |
| Investments from Portfolio (identified cost basis) | | | 856,718 | | | | 6,241,905 | | | | 4,104,007 | | |
| Financial futures contracts | | | (179,040 | ) | | | (1,757,976 | ) | | | (1,322,929 | ) | |
| Financial futures contracts from Portfolio | | | 214,431 | | | | 1,378,996 | | | | 1,014,275 | | |
| Net change in unrealized appreciation (depreciation) | | $ | 1,706,327 | | | $ | 11,045,790 | | | $ | 7,390,596 | | |
| Net realized and unrealized gain | | $ | 1,117,854 | | | $ | 7,765,581 | | | $ | 4,919,371 | | |
| Net increase in net assets from operations | | $ | 2,091,879 | | | $ | 13,254,777 | | | $ | 10,105,796 | | |
See notes to financial statements
42
Eaton Vance Municipals Funds as of January 31, 2005
FINANCIAL STATEMENTS (Unaudited) CONT'D
Statements of Changes in Net Assets
For the Six Months Ended January 31, 2005
| Increase (Decrease) in Net Assets | | Arizona Fund | | Colorado Fund | | Connecticut Fund | | Michigan Fund | |
| From operations - | | | | | | | | | | | | | | | | | |
| Net investment income | | $ | 1,577,899 | | | $ | 668,373 | | | $ | 2,839,601 | | | $ | 1,468,917 | | |
| Net realized gain (loss) from investment transactions and financial futures contracts | | | (1,994,512 | ) | | | (236,967 | ) | | | (838,147 | ) | | | 321,245 | | |
Net change in unrealized appreciation (depreciation) from investments and
financial futures contracts | | | 3,121,871 | | | | 811,289 | | | | 3,047,046 | | | | 990,484 | | |
| Net increase in net assets from operations | | $ | 2,705,258 | | | $ | 1,242,695 | | | $ | 5,048,500 | | | $ | 2,780,646 | | |
| Distributions to shareholders - | | | | | | | | | | | | | | | | | |
| From net investment income | | | | | | | | | | | | | | | | | |
| Class A | | $ | (1,175,229 | ) | | $ | (471,101 | ) | | $ | (2,259,468 | ) | | $ | (1,304,046 | ) | |
| Class B | | | (396,431 | ) | | | (209,608 | ) | | | (667,815 | ) | | | (208,677 | ) | |
| Total distributions to shareholders | | $ | (1,571,660 | ) | | $ | (680,709 | ) | | $ | (2,927,283 | ) | | $ | (1,512,723 | ) | |
| Transactions in shares of beneficial interest - | | | | | | | | | | | | | | | | | |
| Proceeds from sale of shares | | | | | | | | | | | | | | | | | |
| Class A | | $ | 2,964,030 | | | $ | 950,040 | | | $ | 7,210,780 | | | $ | 1,547,034 | | |
| Class B | | | 495,234 | | | | 105,656 | | | | 777,659 | | | | 68,125 | | |
Net asset value of shares issued to shareholders in payment of
distributions declared | | | |
| Class A | | | 611,047 | | | | 315,916 | | | | 1,275,943 | | | | 732,562 | | |
| Class B | | | 191,689 | | | | 123,369 | | | | 398,744 | | | | 108,793 | | |
| Cost of shares redeemed | | | | | | | | | | | | | | | | | |
| Class A | | | (5,183,010 | ) | | | (1,283,641 | ) | | | (5,803,223 | ) | | | (3,169,317 | ) | |
| Class B | | | (1,699,191 | ) | | | (518,149 | ) | | | (2,481,995 | ) | | | (1,455,099 | ) | |
| Net asset value of shares exchanged | | | | | | | | | | | | | | | | | |
| Class A | | | 710,878 | | | | 325,436 | | | | 1,470,107 | | | | 583,740 | | |
| Class B | | | (710,878 | ) | | | (325,436 | ) | | | (1,470,107 | ) | | | (583,740 | ) | |
| Net increase (decrease) in net assets from Fund share transactions | | $ | (2,620,201 | ) | | $ | (306,809 | ) | | $ | 1,377,908 | | | $ | (2,167,902 | ) | |
| Net increase (decrease) in net assets | | $ | (1,486,603 | ) | | $ | 255,177 | | | $ | 3,499,125 | | | $ | (899,979 | ) | |
| Net Assets | | | |
| At beginning of period | | $ | 67,416,325 | | | $ | 30,279,763 | | | $ | 133,076,881 | | | $ | 65,477,822 | | |
| At end of period | | $ | 65,929,722 | | | $ | 30,534,940 | | | $ | 136,576,006 | | | $ | 64,577,843 | | |
Accumulated undistributed
(distributions in excess of) net
investment income included in net assets | | | |
| At end of period | | $ | 98,743 | | | $ | (57,726 | ) | | $ | (313,679 | ) | | $ | (21,829 | ) | |
See notes to financial statements
43
Eaton Vance Municipals Funds as of January 31, 2005
FINANCIAL STATEMENTS (Unaudited) CONT'D
Statements of Changes in Net Assets
For the Six Months Ended January 31, 2005
| Increase (Decrease) in Net Assets | | Minnesota Fund | | New Jersey Fund | | Pennsylvania Fund | |
| From operations - | | | | | | | | | | | | | |
| Net investment income | | $ | 974,025 | | | $ | 5,489,196 | | | $ | 5,186,425 | | |
| Net realized loss from investment transactions and financial futures contracts | | | (588,473 | ) | | | (3,280,209 | ) | | | (2,471,225 | ) | |
| Net change in unrealized appreciation (depreciation) from investments and financial futures contracts | | | 1,706,327 | | | | 11,045,790 | | | | 7,390,596 | | |
| Net increase in net assets from operations | | $ | 2,091,879 | | | $ | 13,254,777 | | | $ | 10,105,796 | | |
| Distributions to shareholders - | | | | | | | | | | | | | |
| From net investment income | | | | | | | | | | | | | |
| Class A | | $ | (665,504 | ) | | $ | (3,970,742 | ) | | $ | (4,174,573 | ) | |
| Class B | | | (284,090 | ) | | | (1,574,171 | ) | | | (1,132,182 | ) | |
| Total distributions to shareholders | | $ | (949,594 | ) | | $ | (5,544,913 | ) | | $ | (5,306,755 | ) | |
| Transactions in shares of beneficial interest - | | | | | | | | | | | | | |
| Proceeds from sale of shares | | | | | | | | | | | | | |
| Class A | | $ | 367,519 | | | $ | 6,490,839 | | | $ | 8,819,549 | | |
| Class B | | | 238,206 | | | | 4,088,026 | | | | 2,153,087 | | |
| Net asset value of shares issued to shareholders in payment of distributions declared | | | | | | | | | | | | | |
| Class A | | | 437,017 | | | | 2,485,652 | | | | 2,394,999 | | |
| Class B | | | 168,516 | | | | 987,045 | | | | 578,720 | | |
| Cost of shares redeemed | | | | | | | | | | | | | |
| Class A | | | (1,807,166 | ) | | | (8,561,879 | ) | | | (7,904,482 | ) | |
| Class B | | | (865,488 | ) | | | (5,714,769 | ) | | | (3,453,989 | ) | |
| Net asset value of shares exchanged | | | | | | | | | | | | | |
| Class A | | | 272,780 | | | | 2,601,595 | | | | 1,636,809 | | |
| Class B | | | (272,780 | ) | | | (2,601,595 | ) | | | (1,636,809 | ) | |
| Net increase (decrease) in net assets from Fund share transactions | | $ | (1,461,396 | ) | | $ | (225,086 | ) | | $ | 2,587,884 | | |
| Net increase (decrease) in net assets | | $ | (319,111 | ) | | $ | 7,484,778 | | | $ | 7,386,925 | | |
| Net Assets | | | | | | | | | | | | | |
| At beginning of period | | $ | 44,580,341 | | | $ | 240,391,004 | | | $ | 208,437,372 | | |
| At end of period | | $ | 44,261,230 | | | $ | 247,875,782 | | | $ | 215,824,297 | | |
Accumulated undistributed
(distributions in excess of) net
investment income included in net assets | | | | | | | | | | | | | |
| At end of period | | $ | (39,426 | ) | | $ | 109,898 | | | $ | (165,779 | ) | |
See notes to financial statements
44
Eaton Vance Municipals Funds as of January 31, 2005
FINANCIAL STATEMENTS CONT'D
Statements of Changes in Net Assets
For the Year Ended July 31, 2004
| Increase (Decrease) in Net Assets | | Arizona Fund | | Colorado Fund | | Connecticut Fund | | Michigan Fund | |
| From operations - | | | | | | | | | | | | | | | | | |
| Net investment income | | $ | 3,115,046 | | | $ | 1,450,404 | | | $ | 5,787,401 | | | $ | 3,009,128 | | |
Net realized gain (loss) from investment transactions
and financial futures contracts | | | 930,322 | | | | (65,416 | ) | | | (228,437 | ) | | | 1,061,994 | | |
Net change in unrealized appreciation (depreciation)
from investments and financial futures contracts | | | (301,793 | ) | | | 724,503 | | | | 1,227,778 | | | | (482,076 | ) | |
| Net increase in net assets from operations | | $ | 3,743,575 | | | $ | 2,109,491 | | | $ | 6,786,742 | | | $ | 3,589,046 | | |
| Distributions to shareholders - | | | | | | | | | | | | | | | | | |
| From net investment income | | | | | | | | | | | | | | | | | |
| Class A | | $ | (1,095,645 | ) | | $ | (599,997 | ) | | $ | (2,285,756 | ) | | $ | (1,061,178 | ) | |
| Class B | | | (1,932,367 | ) | | | (861,289 | ) | | | (3,514,124 | ) | | | (1,929,024 | ) | |
| Total distributions to shareholders | | $ | (3,028,012 | ) | | $ | (1,461,286 | ) | | $ | (5,799,880 | ) | | $ | (2,990,202 | ) | |
| Transactions in shares of beneficial interest - | | | | | | | | | | | | | | | | | |
| Proceeds from sale of shares | | | | | | | | | | | | | | | | | |
| Class A | | $ | 26,378,756 | | | $ | 5,410,577 | | | $ | 24,035,272 | | | $ | 19,746,314 | | |
| Class B | | | 1,586,589 | | | | 1,649,620 | | | | 2,152,181 | | | | 1,309,419 | | |
Net asset value of shares issued to shareholders in payment of
distributions declared | | | |
| Class A | | | 567,978 | | | | 398,138 | | | | 1,295,536 | | | | 559,050 | | |
| Class B | | | 1,007,411 | | | | 465,293 | | | | 1,963,941 | | | | 1,122,567 | | |
| Cost of shares redeemed | | | | | | | | | | | | | | | | | |
| Class A | | | (4,499,424 | ) | | | (3,751,682 | ) | | | (14,659,349 | ) | | | (3,896,988 | ) | |
| Class B | | | (26,914,076 | ) | | | (11,491,707 | ) | | | (30,729,293 | ) | | | (24,647,831 | ) | |
| Net asset value of shares exchanged | | | | | | | | | | | | | | | | | |
| Class A | | | 17,010,710 | | | | 9,070,213 | | | | 62,456,978 | | | | 35,107,221 | | |
| Class B | | | (17,010,710 | ) | | | (9,070,213 | ) | | | (62,456,978 | ) | | | (35,107,221 | ) | |
| Net decrease in net assets from Fund share transactions | | $ | (1,872,766 | ) | | $ | (7,319,761 | ) | | $ | (15,941,712 | ) | | $ | (5,807,469 | ) | |
| Net decrease in net assets | | $ | (1,157,203 | ) | | $ | (6,671,556 | ) | | $ | (14,954,850 | ) | | $ | (5,208,625 | ) | |
| Net Assets | | | |
| At beginning of year | | $ | 68,573,528 | | | $ | 36,951,319 | | | $ | 148,031,731 | | | $ | 70,686,447 | | |
| At end of year | | $ | 67,416,325 | | | $ | 30,279,763 | | | $ | 133,076,881 | | | $ | 65,477,822 | | |
Accumulated undistributed
(distributions in excess of) net
investment income included in net assets | | | |
| At end of year | | $ | 92,504 | | | $ | (45,390 | ) | | $ | (225,997 | ) | | $ | 21,977 | | |
See notes to financial statements
45
Eaton Vance Municipals Funds as of January 31, 2005
FINANCIAL STATEMENTS CONT'D
Statements of Changes in Net Assets
For the Year Ended July 31, 2004
| Increase (Decrease) in Net Assets | | Minnesota Fund | | New Jersey Fund | | Pennsylvania Fund | |
| From operations - | | | | | | | | | | | | | |
| Net investment income | | $ | 2,020,561 | | | $ | 11,256,288 | | | $ | 10,313,699 | | |
| Net realized gain on investment transactions and financial futures contracts | | | 1,195,918 | | | | 4,657,139 | | | | 2,557,636 | | |
Net change in unrealized appreciation (depreciation) from investments and
financial futures contracts | | | (957,843 | ) | | | (2,316,453 | ) | | | (1,385,537 | ) | |
| Net increase in net assets from operations | | $ | 2,258,636 | | | $ | 13,596,974 | | | $ | 11,485,798 | | |
| Distributions to shareholders - | | | | | | | | | | | | | |
| From net investment income | | | | | | | | | | | | | |
| Class A | | $ | (765,869 | ) | | $ | (3,843,079 | ) | | $ | (3,478,332 | ) | |
| Class B | | | (1,306,570 | ) | | | (8,008,771 | ) | | | (6,839,387 | ) | |
| Total distributions to shareholders | | $ | (2,072,439 | ) | | $ | (11,851,850 | ) | | $ | (10,317,719 | ) | |
| Transactions in shares of beneficial interest - | | | | | | | | | | | | | |
| Proceeds from sale of shares | | | | | | | | | | | | | |
| Class A | | $ | 10,556,394 | | | $ | 59,840,963 | | | $ | 53,496,624 | | |
| Class B | | | 1,545,843 | | | | 7,043,549 | | | | 5,763,186 | | |
| Net asset value of shares issued to shareholders in payment of distributions declared | | | | | | | | | | | | | |
| Class A | | | 467,656 | | | | 2,247,048 | | | | 1,888,995 | | |
| Class B | | | 892,578 | | | | 5,077,688 | | | | 3,689,421 | | |
| Cost of shares redeemed | | | | | | | | | | | | | |
| Class A | | | (3,998,481 | ) | | | (17,859,206 | ) | | | (12,738,376 | ) | |
| Class B | | | (15,304,903 | ) | | | (77,827,020 | ) | | | (66,026,431 | ) | |
| Net asset value of shares exchanged | | | | | | | | | | | | | |
| Class A | | | 13,897,232 | | | | 90,689,869 | | | | 100,530,574 | | |
| Class B | | | (13,897,232 | ) | | | (90,689,869 | ) | | | (100,530,574 | ) | |
| Net decrease in net assets from Fund share transactions | | $ | (5,840,913 | ) | | $ | (21,476,978 | ) | | $ | (13,926,581 | ) | |
| Net decrease in net assets | | $ | (5,654,716 | ) | | $ | (19,731,854 | ) | | $ | (12,758,502 | ) | |
| Net Assets | | | |
| At beginning of year | | $ | 50,235,057 | | | $ | 260,122,858 | | | $ | 221,195,874 | | |
| At end of year | | $ | 44,580,341 | | | $ | 240,391,004 | | | $ | 208,437,372 | | |
Accumulated undistributed
(distributions in excess of) net
investment income included in net assets | | | |
| At end of year | | $ | (63,857 | ) | | $ | 165,615 | | | $ | (45,449 | ) | |
See notes to financial statements
46
Eaton Vance Municipals Funds as of January 31, 2005
FINANCIAL STATEMENTS CONT'D
Financial Highlights
| | | Arizona Fund - Class A | |
| | | Six Months Ended
January 31, 2005 | | Year Ended July 31, | |
| | | (Unaudited) | | 2004 | | 2003 | | 2002(2) | | 2001 | | 2000 | |
| Net asset value - Beginning of period | | $ | 9.650 | | | $ | 9.550 | | | $ | 9.730 | | | $ | 9.680 | | | $ | 9.480 | | | $ | 9.850 | | |
| Income (loss) from operations | | | |
| Net investment income(1) | | $ | 0.242 | | | $ | 0.493 | | | $ | 0.482 | | | $ | 0.485 | | | $ | 0.529 | | | $ | 0.495 | | |
| Net realized and unrealized gain (loss) | | | 0.169 | | | | 0.088 | | | | (0.182 | ) | | | 0.045 | | | | 0.163 | | | | (0.363 | ) | |
| Total income from operations | | $ | 0.411 | | | $ | 0.581 | | | $ | 0.300 | | | $ | 0.530 | | | $ | 0.692 | | | $ | 0.132 | | |
| Less distributions | | | |
| From net investment income | | $ | (0.241 | ) | | $ | (0.481 | ) | | $ | (0.480 | ) | | $ | (0.480 | ) | | $ | (0.492 | ) | | $ | (0.502 | ) | |
| Total distributions | | $ | (0.241 | ) | | $ | (0.481 | ) | | $ | (0.480 | ) | | $ | (0.480 | ) | | $ | (0.492 | ) | | $ | (0.502 | ) | |
| Net asset value - End of period | | $ | 9.820 | | | $ | 9.650 | | | $ | 9.550 | | | $ | 9.730 | | | $ | 9.680 | | | $ | 9.480 | | |
| Total Return(3) | | | 4.30 | % | | | 6.15 | % | | | 3.06 | % | | | 5.67 | % | | | 7.46 | % | | | 1.56 | % | |
| Ratios/Supplemental Data | | | |
| Net assets, end of period (000's omitted) | | $ | 47,861 | | | $ | 47,945 | | | $ | 9,174 | | | $ | 7,342 | | | $ | 5,413 | | | $ | 5,064 | | |
| Ratios (As a percentage of average daily net assets): | | | | | | | | | | | | | | | | | | | | | | | | | |
| Expenses(4) | | | 0.77 | %(5) | | | 0.78 | % | | | 0.76 | % | | | 0.78 | % | | | 0.84 | % | | | 0.89 | % | |
| Expenses after custodian fee reduction(4) | | | 0.77 | %(5) | | | 0.77 | % | | | 0.75 | % | | | 0.78 | % | | | 0.82 | % | | | 0.88 | % | |
| Net investment income | | | 4.92 | %(5) | | | 5.10 | % | | | 4.90 | % | | | 5.05 | % | | | 5.50 | % | | | 5.30 | % | |
| Portfolio Turnover of the Portfolio(6) | | | 0 | % | | | 10 | % | | | 6 | % | | | 27 | % | | | 26 | % | | | 25 | % | |
| Portfolio Turnover of the Fund | | | 7 | % | | | - | | | | - | | | | - | | | | - | | | | - | | |
(1) Net investment income per share was computed using average shares outstanding.
(2) The Fund, through its investment in the Portfolio, has adopted the provisions of the revised AICPA Audit and Accounting Guide for Investment Companies and began using the interest method to amortize premiums on fixed-income securities. The effect of this change for the year ended July 31, 2002 was to increase net investment income per share by $0.001, decrease net realized and unrealized gains per share by $0.001 and increase the ratio of net investment income to average net assets from 5.04% to 5.05%. Per-share data and ratios for the pe riods prior to August 1, 2001 have not been restated to reflect this change in presentation.
(3) Returns are historical and are calculated by determining the percentage change in net asset value with all distributions reinvested. Total return is not computed on an annualized basis.
(4) Includes the Fund's share of its corresponding Portfolio's allocated expenses.
(5) Annualized.
(6) Portfolio turnover represents the rate of portfolio activity for the period while the Fund was making investments directly into the Portfolio.
See notes to financial statements
47
Eaton Vance Municipals Funds as of January 31, 2005
FINANCIAL STATEMENTS CONT'D
Financial Highlights
| | | Arizona Fund - Class B | |
| | | Six Months Ended
January 31, 2005 | | Year Ended July 31, | |
| | | (Unaudited) | | 2004 | | 2003 | | 2002(2) | | 2001 | | 2000 | |
| Net asset value - Beginning of period | | $ | 10.730 | | | $ | 10.620 | | | $ | 10.830 | | | $ | 10.770 | | | $ | 10.540 | | | $ | 10.950 | | |
| Income (loss) from operations | | | | | | | | | | | | | | | | | | | | | | | | | |
| Net investment income(1) | | $ | 0.228 | | | $ | 0.470 | | | $ | 0.456 | | | $ | 0.461 | | | $ | 0.494 | | | $ | 0.476 | | |
| Net realized and unrealized gain (loss) | | | 0.190 | | | | 0.096 | | | | (0.211 | ) | | | 0.054 | | | | 0.203 | | | | (0.409 | ) | |
| Total income from operations | | $ | 0.418 | | | $ | 0.566 | | | $ | 0.245 | | | $ | 0.515 | | | $ | 0.697 | | | $ | 0.067 | | |
| Less distributions | | | | | | | | | | | | | | | | | | | | | | | | | |
| From net investment income | | $ | (0.228 | ) | | $ | (0.456 | ) | | $ | (0.455 | ) | | $ | (0.455 | ) | | $ | (0.467 | ) | | $ | (0.477 | ) | |
| Total distributions | | $ | (0.228 | ) | | $ | (0.456 | ) | | $ | (0.455 | ) | | $ | (0.455 | ) | | $ | (0.467 | ) | | $ | (0.477 | ) | |
| Net asset value - End of period | | $ | 10.920 | | | $ | 10.730 | | | $ | 10.620 | | | $ | 10.830 | | | $ | 10.770 | | | $ | 10.540 | | |
| Total Return(3) | | | 4.12 | %(4) | | | 5.38 | % | | | 2.22 | % | | | 4.92 | % | | | 6.73 | % | | | 0.81 | % | |
| Ratios/Supplemental Data | | | | | | | | | | | | | | | | | | | | | | | | | |
| Net assets, end of period (000's omitted) | | $ | 18,068 | | | $ | 19,471 | | | $ | 59,399 | | | $ | 63,117 | | | $ | 66,376 | | | $ | 68,378 | | |
| Ratios (As a percentage of average daily net assets): | | | | | | | | | | | | | | | | | | | | | | | | | |
| Expenses(5) | | | 1.52 | %(6) | | | 1.53 | % | | | 1.51 | % | | | 1.53 | % | | | 1.59 | % | | | 1.63 | % | |
| Expenses after custodian fee reduction(5) | | | 1.52 | %(6) | | | 1.52 | % | | | 1.50 | % | | | 1.53 | % | | | 1.57 | % | | | 1.62 | % | |
| Net investment income | | | 4.17 | %(6) | | | 4.33 | % | | | 4.17 | % | | | 4.32 | % | | | 4.62 | % | | | 4.58 | % | |
| Portfolio Turnover of the Portfolio(7) | | | 0 | % | | | 10 | % | | | 6 | % | | | 27 | % | | | 26 | % | | | 25 | % | |
| Portfolio Turnover of the Fund | | | 7 | % | | | - | | | | - | | | | - | | | | - | | | | - | | |
(1) Net investment income per share was computed using average shares outstanding.
(2) The Fund, through its investment in the Portfolio, has adopted the provisions of the revised AICPA Audit and Accounting Guide for Investment Companies and began using the interest method to amortize premiums on fixed-income securities. The effect of this change for the year ended July 31, 2002 was to increase net investment income per share by $0.001, decrease net realized and unrealized gains per share by $0.001 and increase the ratio of net investment income to average net assets from 4.31% to 4.32%. Per-share data and ratios for the pe riods prior to August 1, 2001 have not been restated to reflect this change in presentation.
(3) Returns are historical and are calculated by determining the percentage change in net asset value with all distributions reinvested. Total return is not computed on an annualized basis.
(4) Total return reflects an increase of 0.15% due to a change in the timing of the payment and reinvestment of distributions.
(5) Includes the Fund's share of its corresponding Portfolio's allocated expenses.
(6) Annualized.
(7) Portfolio turnover represents the rate of portfolio activity for the period while the Fund was making investments directly into the Portfolio.
See notes to financial statements
48
Eaton Vance Municipals Funds as of January 31, 2005
FINANCIAL STATEMENTS CONT'D
Financial Highlights
| | | Colorado Fund - Class A | |
| | | Six Months Ended
January 31, 2005 | | Year Ended July 31, | |
| | | (Unaudited)(1) | | 2004(1) | | 2003(1) | | 2002(1)(2) | | 2001 | | 2000 | |
| Net asset value - Beginning of period | | $ | 9.570 | | | $ | 9.440 | | | $ | 9.680 | | | $ | 9.680 | | | $ | 9.160 | | | $ | 9.570 | | |
| Income (loss) from operations | | | | | | | | | | | | | | | | | | | | | | | | | |
| Net investment income | | $ | 0.226 | | | $ | 0.460 | | | $ | 0.464 | | | $ | 0.481 | | | $ | 0.479 | | | $ | 0.495 | | |
| Net realized and unrealized gain (loss) | | | 0.184 | | | | 0.132 | | | | (0.228 | ) | | | (0.001 | )(3) | | | 0.535 | | | | (0.402 | ) | |
| Total income from operations | | $ | 0.410 | | | $ | 0.592 | | | $ | 0.236 | | | $ | 0.480 | | | $ | 1.014 | | | $ | 0.093 | | |
| Less distributions | | | | | | | | | | | | | | | | | | | | | | | | | |
| From net investment income | | $ | (0.230 | ) | | $ | (0.462 | ) | | $ | (0.476 | ) | | $ | (0.480 | ) | | $ | (0.494 | ) | | $ | (0.503 | ) | |
| Total distributions | | $ | (0.230 | ) | | $ | (0.462 | ) | | $ | (0.476 | ) | | $ | (0.480 | ) | | $ | (0.494 | ) | | $ | (0.503 | ) | |
| Net asset value - End of period | | $ | 9.750 | | | $ | 9.570 | | | $ | 9.440 | | | $ | 9.680 | | | $ | 9.680 | | | $ | 9.160 | | |
| Total Return(4) | | | 4.33 | % | | | 6.33 | % | | | 2.42 | % | | | 5.13 | % | | | 11.35 | % | | | 1.18 | % | |
| Ratios/Supplemental Data | | | | | | | | | | | | | | | | | | | | | | | | | |
| Net assets, end of period (000's omitted) | | $ | 20,378 | | | $ | 19,700 | | | $ | 8,709 | | | $ | 6,379 | | | $ | 2,726 | | | $ | 2,026 | | |
| Ratios (As a percentage of average daily net assets): | | | | | | | | | | | | | | | | | | | | | | | | | |
| Expenses(5) | | | 0.73 | %(6) | | | 0.75 | % | | | 0.73 | % | | | 0.80 | % | | | 0.86 | % | | | 0.78 | % | |
| Expenses after custodian fee reduction(5) | | | 0.72 | %(6) | | | 0.75 | % | | | 0.71 | % | | | 0.78 | % | | | 0.82 | % | | | 0.75 | % | |
| Net investment income | | | 4.64 | %(6) | | | 4.78 | % | | | 4.78 | % | | | 5.01 | % | | | 5.06 | % | | | 5.48 | % | |
| Portfolio Turnover of the Portfolio(7) | | | 3 | % | | | 6 | % | | | 21 | % | | | 18 | % | | | 18 | % | | | 14 | % | |
| Portfolio Turnover of the Fund | | | 7 | % | | | - | | | | - | | | | - | | | | - | | | | - | | |
(1) Net investment income per share was computed using average shares outstanding.
(2) The Fund, through its investment in the Portfolio, has adopted the provisions of the revised AICPA Audit and Accounting Guide for Investment Companies and began using the interest method to amortize premiums on fixed-income securities.The effect of this change for the year ended July 31, 2002 was to increase net investment income per share by $0.001, increase net realized and unrealized losses per share by $0.001 and increase the ratio of net investment income to average net assets from 4.99% to 5.01%. Per-share data and ratios for the pe riods prior to August 1, 2001 have not been restated to reflect this change in presentation.
(3) Per share amount is not in accord with the net realized and unrealized gain (loss) on investments for the period because of the timing of sales of Fund shares and the amount of the per share realized and unrealized gains and losses at such time.
(4) Returns are historical and are calculated by determining the percentage change in net asset value with all distributions reinvested. Total return is not computed on an annualized basis.
(5) Includes the Fund's share of its corresponding Portfolio's allocated expenses.
(6) Annualized.
(7) Portfolio turnover represents the rate of portfolio activity for the period while the Fund was making investments directly into the Portfolio.
See notes to financial statements
49
Eaton Vance Municipals Funds as of January 31, 2005
FINANCIAL STATEMENTS CONT'D
Financial Highlights
| | | Colorado Fund - Class B | |
| | | Six Months Ended
January 31, 2005 | | Year Ended July 31, | |
| | | (Unaudited)(1) | | 2004(1) | | 2003(1) | | 2002(1)(2) | | 2001 | | 2000 | |
| Net asset value - Beginning of period | | $ | 10.420 | | | $ | 10.280 | | | $ | 10.540 | | | $ | 10.540 | | | $ | 9.970 | | | $ | 10.410 | | |
| Income (loss) from operations | | | | | | | | | | | | | | | | | | | | | | | | | |
| Net investment income | | $ | 0.207 | | | $ | 0.421 | | | $ | 0.427 | | | $ | 0.447 | | | $ | 0.444 | | | $ | 0.468 | | |
| Net realized and unrealized gain (loss) | | | 0.194 | | | | 0.143 | | | | (0.244 | ) | | | 0.001 | | | | 0.588 | | | | (0.440 | ) | |
| Total income from operations | | $ | 0.401 | | | $ | 0.564 | | | $ | 0.183 | | | $ | 0.448 | | | $ | 1.032 | | | $ | 0.028 | | |
| Less distributions | | | | | | | | | | | | | | | | | | | | | | | | | |
| From net investment income | | $ | (0.211 | ) | | $ | (0.424 | ) | | $ | (0.443 | ) | | $ | (0.448 | ) | | $ | (0.462 | ) | | $ | (0.468 | ) | |
| Total distributions | | $ | (0.211 | ) | | $ | (0.424 | ) | | $ | (0.443 | ) | | $ | (0.448 | ) | | $ | (0.462 | ) | | $ | (0.468 | ) | |
| Net asset value - End of period | | $ | 10.610 | | | $ | 10.420 | | | $ | 10.280 | | | $ | 10.540 | | | $ | 10.540 | | | $ | 9.970 | | |
| Total Return(3) | | | 4.06 | %(4) | | | 5.53 | % | | | 1.70 | % | | | 4.37 | % | | | 10.58 | % | | | 0.45 | % | |
| Ratios/Supplemental Data | | | | | | | | | | | | | | | | | | | | | | | | | |
| Net assets, end of period (000's omitted) | | $ | 10,157 | | | $ | 10,579 | | | $ | 28,242 | | | $ | 30,116 | | | $ | 27,730 | | | $ | 28,446 | | |
| Ratios (As a percentage of average daily net assets): | | | | | | | | | | | | | | | | | | | | | | | | | |
| Expenses(5) | | | 1.48 | %(6) | | | 1.50 | % | | | 1.48 | % | | | 1.55 | % | | | 1.62 | % | | | 1.52 | % | |
| Expenses after custodian fee reduction(5) | | | 1.47 | %(6) | | | 1.50 | % | | | 1.46 | % | | | 1.53 | % | | | 1.58 | % | | | 1.49 | % | |
| Net investment income | | | 3.90 | %(6) | | | 4.00 | % | | | 4.04 | % | | | 4.28 | % | | | 4.33 | % | | | 4.75 | % | |
| Portfolio Turnover of the Portfolio(7) | | | 3 | % | | | 6 | % | | | 21 | % | | | 18 | % | | | 18 | % | | | 14 | % | |
| Portfolio Turnover of the Fund | | | 7 | % | | | - | | | | - | | | | - | | | | - | | | | - | | |
(1) Net investment income per share was computed using average shares outstanding.
(2) The Fund, through its investment in the Portfolio, has adopted the provisions of the revised AICPA Audit and Accounting Guide for Investment Companies and began using the interest method to amortize premiums on fixed-income securities. The effect of this change for the year ended July 31, 2002 was to increase net investment income per share by $0.001, decrease net realized and unrealized gains per share by $0.001 and increase the ratio of net investment income to average net assets from 4.26% to 4.28%. Per-share data and ratios for the pe riods prior to August 1, 2001 have not been restated to reflect this change in presentation.
(3) Returns are historical and are calculated by determining the percentage change in net asset value with all distributions reinvested. Total return is not computed on an annualized basis.
(4) Total return reflects an increase of 0.13% due to a change in the timing of the payment and reinvestment of distributions.
(5) Includes the Fund's share of its corresponding Portfolio's allocated expenses.
(6) Annualized.
(7) Portfolio turnover represents the rate of portfolio activity for the period while the Fund was making investments directly into the Portfolio.
See notes to financial statements
50
Eaton Vance Municipals Funds as of January 31, 2005
FINANCIAL STATEMENTS CONT'D
Financial Highlights
| | | Connecticut Fund - Class A | |
| | | Six Months Ended
January 31, 2005 | | Year Ended July 31, | |
| | | (Unaudited)(1) | | 2004(1) | | 2003(1) | | 2002(1)(2) | | 2001(1) | | 2000 | |
| Net asset value - Beginning of period | | $ | 10.610 | | | $ | 10.540 | | | $ | 10.750 | | | $ | 10.750 | | | $ | 10.140 | | | $ | 10.460 | | |
| Income (loss) from operations | | | |
| Net investment income | | $ | 0.236 | | | $ | 0.488 | | | $ | 0.494 | | | $ | 0.508 | | | $ | 0.518 | | | $ | 0.521 | | |
| Net realized and unrealized gain (loss) | | | 0.177 | | | | 0.070 | | | | (0.195 | ) | | | 0.007 | | | | 0.601 | | | | (0.323 | ) | |
| Total income from operations | | $ | 0.413 | | | $ | 0.558 | | | $ | 0.299 | | | $ | 0.515 | | | $ | 1.119 | | | $ | 0.198 | | |
| Less distributions | | | |
| From net investment income | | $ | (0.243 | ) | | $ | (0.488 | ) | | $ | (0.509 | ) | | $ | (0.515 | ) | | $ | (0.509 | ) | | $ | (0.518 | ) | |
| Total distributions | | $ | (0.243 | ) | | $ | (0.488 | ) | | $ | (0.509 | ) | | $ | (0.515 | ) | | $ | (0.509 | ) | | $ | (0.518 | ) | |
| Net asset value - End of period | | $ | 10.780 | | | $ | 10.610 | | | $ | 10.540 | | | $ | 10.750 | | | $ | 10.750 | | | $ | 10.140 | | |
| Total Return(3) | | | 3.92 | % | | | 5.34 | % | | | 2.76 | % | | | 4.92 | % | | | 11.30 | % | | | 2.09 | % | |
| Ratios/Supplemental Data | | | |
| Net assets, end of period (000's omitted) | | $ | 102,276 | | | $ | 96,559 | | | $ | 25,210 | | | $ | 22,436 | | | $ | 12,752 | | | $ | 8,851 | | |
| Ratios (As a percentage of average daily net assets): | | | | | | | | | | | | | | | | | | | | | | | | | |
| Expenses(4) | | | 0.77 | %(5) | | | 0.79 | % | | | 0.77 | % | | | 0.82 | % | | | 0.86 | % | | | 0.82 | % | |
| Expenses after custodian fee reduction(4) | | | 0.76 | %(5) | | | 0.79 | % | | | 0.77 | % | | | 0.80 | % | | | 0.83 | % | | | 0.80 | % | |
| Net investment income | | | 4.37 | %(5) | | | 4.58 | % | | | 4.55 | % | | | 4.76 | % | | | 4.95 | % | | | 5.23 | % | |
| Portfolio Turnover of the Portfolio(6) | | | 2 | % | | | 15 | % | | | 19 | % | | | 22 | % | | | 14 | % | | | 20 | % | |
| Portfolio Turnover of the Fund | | | 5 | % | | | - | | | | - | | | | - | | | | - | | | | - | | |
(1) Net investment income per share was computed using average shares outstanding.
(2) The Fund, through its investment in the Portfolio, has adopted the provisions of the revised AICPA Audit and Accounting Guide for Investment Companies and began using the interest method to amortize premiums on fixed-income securities. The effect of this change for the year ended July 31, 2002 was to increase net investment income per share by $0.001, decrease net realized and unrealized gains per share by $0.001 and increase the ratio of net investment income to average net assets from 4.75% to 4.76%. Per-share data and ratios for the pe riods prior to August 1, 2001 have not been restated to reflect this change in presentation.
(3) Returns are historical and are calculated by determining the percentage change in net asset value with all distributions reinvested. Total return is not computed on an annualized basis.
(4) Includes the Fund's share of its corresponding Portfolio's allocated expenses.
(5) Annualized.
(6) Portfolio turnover represents the rate of portfolio activity for the period while the Fund was making investments directly into the Portfolio.
See notes to financial statements
51
Eaton Vance Municipals Funds as of January 31, 2005
FINANCIAL STATEMENTS CONT'D
Financial Highlights
| | | Connecticut Fund - Class B | |
| | | Six Months Ended
January 31, 2005 | | Year Ended July 31, | |
| | | (Unaudited)(1) | | 2004(1) | | 2003(1) | | 2002(1)(2) | | 2001(1) | | 2000 | |
| Net asset value - Beginning of period | | $ | 10.560 | | | $ | 10.490 | | | $ | 10.700 | | | $ | 10.700 | | | $ | 10.090 | | | $ | 10.400 | | |
| Income (loss) from operations | | | | | | | | | | | | | | | | | | | | | | | | | |
| Net investment income | | $ | 0.194 | | | $ | 0.404 | | | $ | 0.411 | | | $ | 0.429 | | | $ | 0.440 | | | $ | 0.439 | | |
| Net realized and unrealized gain (loss) | | | 0.167 | | | | 0.071 | | | | (0.194 | ) | | | 0.004 | | | | 0.598 | | | | (0.321 | ) | |
| Total income from operations | | $ | 0.361 | | | $ | 0.475 | | | $ | 0.217 | | | $ | 0.433 | | | $ | 1.038 | | | $ | 0.118 | | |
| Less distributions | | | | | | | | | | | | | | | | | | | | | | | | | |
| From net investment income | | $ | (0.201 | ) | | $ | (0.405 | ) | | $ | (0.427 | ) | | $ | (0.433 | ) | | $ | (0.428 | ) | | $ | (0.428 | ) | |
| Total distributions | | $ | (0.201 | ) | | $ | (0.405 | ) | | $ | (0.427 | ) | | $ | (0.433 | ) | | $ | (0.428 | ) | | $ | (0.428 | ) | |
| Net asset value - End of period | | $ | 10.720 | | | $ | 10.560 | | | $ | 10.490 | | | $ | 10.700 | | | $ | 10.700 | | | $ | 10.090 | | |
| Total Return(3) | | | 3.62 | %(4) | | | 4.55 | % | | | 1.99 | % | | | 4.13 | % | | | 10.48 | % | | | 1.31 | % | |
| Ratios/Supplemental Data | | | | | | | | | | | | | | | | | | | | | | | | | |
| Net assets, end of period (000's omitted) | | $ | 34,300 | | | $ | 36,518 | | | $ | 122,822 | | | $ | 128,349 | | | $ | 126,304 | | | $ | 123,978 | | |
| Ratios (As a percentage of average daily net assets): | | | | | | | | | | | | | | | | | | | | | | | | | |
| Expenses(5) | | | 1.52 | %(6) | | | 1.54 | % | | | 1.52 | % | | | 1.57 | % | | | 1.60 | % | | | 1.60 | % | |
| Expenses after custodian fee reduction(5) | | | 1.51 | %(6) | | | 1.54 | % | | | 1.52 | % | | | 1.55 | % | | | 1.57 | % | | | 1.58 | % | |
| Net investment income | | | 3.62 | %(6) | | | 3.77 | % | | | 3.82 | % | | | 4.03 | % | | | 4.24 | % | | | 4.46 | % | |
| Portfolio Turnover of the Portfolio(7) | | | 2 | % | | | 15 | % | | | 19 | % | | | 22 | % | | | 14 | % | | | 20 | % | |
| Portfolio Turnover of the Fund | | | 5 | % | | | - | | | | - | | | | - | | | | - | | | | - | | |
(1) Net investment income per share was computed using average shares outstanding.
(2) The Fund, through its investment in the Portfolio, has adopted the provisions of the revised AICPA Audit and Accounting Guide for Investment Companies and began using the interest method to amortize premiums on fixed-income securities. The effect of this change for the year ended July 31, 2002 was to increase net investment income per share by $0.001, decrease net realized and unrealized gains per share by $0.001 and increase the ratio of net investment income to average net assets from 4.02% to 4.03%. Per-share data and ratios for the pe riods prior to August 1, 2001 have not been restated to reflect this change in presentation.
(3) Returns are historical and are calculated by determining the percentage change in net asset value with all distributions reinvested. Total return is not computed on an annualized basis.
(4) Total return reflects an increase of 0.13% due to a change in the timing of the payment and reinvestment of distributions.
(5) Includes the Fund's share of its corresponding Portfolio's allocated expenses.
(6) Annualized.
(7) Portfolio turnover represents the rate of portfolio activity for the period while the Fund was making investments directly into the Portfolio.
See notes to financial statements
52
Eaton Vance Municipals Funds as of January 31, 2005
FINANCIAL STATEMENTS CONT'D
Financial Highlights
| | | Michigan Fund - Class A | |
| | | Six Months Ended
January 31, 2005 | | Year Ended July 31, | |
| | | (Unaudited)(1) | | 2004(1) | | 2003(1) | | 2002(1)(2) | | 2001(1) | | 2000(1) | |
| Net asset value - Beginning of period | | $ | 9.480 | | | $ | 9.400 | | | $ | 9.590 | | | $ | 9.570 | | | $ | 9.040 | | | $ | 9.430 | | |
| Income (loss) from operations | | | | | | | | | | | | | | | | | | | | | | | | | |
| Net investment income | | $ | 0.221 | | | $ | 0.456 | | | $ | 0.476 | | | $ | 0.486 | | | $ | 0.479 | | | $ | 0.480 | | |
| Net realized and unrealized gain (loss) | | | 0.187 | | | | 0.086 | | | | (0.190 | ) | | | 0.010 | | | | 0.526 | | | | (0.356 | ) | |
| Total income from operations | | $ | 0.408 | | | $ | 0.542 | | | $ | 0.286 | | | $ | 0.496 | | | $ | 1.005 | | | $ | 0.124 | | |
| Less distributions | | | | | | | | | | | | | | | | | | | | | | | | | |
| From net investment income | | $ | (0.228 | ) | | $ | (0.462 | ) | | $ | (0.476 | ) | | $ | (0.476 | ) | | $ | (0.475 | ) | | $ | (0.471 | ) | |
| From net realized gain | | | - | | | | - | | | | - | | | | - | | | | - | | | | (0.043 | ) | |
| Total distributions | | $ | (0.228 | ) | | $ | (0.462 | ) | | $ | (0.476 | ) | | $ | (0.476 | ) | | $ | (0.475 | ) | | $ | (0.514 | ) | |
| Net asset value - End of period | | $ | 9.660 | | | $ | 9.480 | | | $ | 9.400 | | | $ | 9.590 | | | $ | 9.570 | | | $ | 9.040 | | |
| Total Return(3) | | | 4.34 | % | | | 5.83 | % | | | 2.96 | % | | | 5.34 | % | | | 11.37 | % | | | 1.55 | % | |
| Ratios/Supplemental Data | | | | | | | | | | | | | | | | | | | | | | | | | |
| Net assets, end of period (000's omitted) | | $ | 55,089 | | | $ | 54,332 | | | $ | 4,079 | | | $ | 3,308 | | | $ | 2,838 | | | $ | 2,701 | | |
| Ratios (As a percentage of average daily net assets): | | | | | | | | | | | | | | | | | | | | | | | | | |
| Expenses(4) | | | 0.80 | %(5) | | | 0.81 | % | | | 0.79 | % | | | 0.80 | % | | | 0.86 | % | | | 0.81 | % | |
| Expenses after custodian fee reduction(4) | | | 0.79 | %(5) | | | 0.80 | % | | | 0.78 | % | | | 0.80 | % | | | 0.85 | % | | | 0.81 | % | |
| Net investment income | | | 4.58 | %(5) | | | 4.81 | % | | | 4.92 | % | | | 5.11 | % | | | 5.12 | % | | | 5.40 | % | |
| Portfolio Turnover of the Portfolio(6) | | | 2 | % | | | 16 | % | | | 12 | % | | | 7 | % | | | 8 | % | | | 30 | % | |
| Portfolio Turnover of the Fund | | | 7 | % | | | - | | | | - | | | | - | | | | - | | | | - | | |
(1) Net investment income per share was computed using average shares outstanding.
(2) The Fund, through its investment in the Portfolio, has adopted the provisions of the revised AICPA Audit and Accounting Guide for Investment Companies and began using the interest method to amortize premiums on fixed-income securities. The effect of this change for the year ended July 31, 2002 was to increase net investment income per share by $0.001, decrease net realized and unrealized gains per share by $0.001, and increase the ratio of net investment income to average net assets from 5.10% to 5.11%. Per-share data and ratios for the p eriods prior to August 1, 2001 have not been restated to reflect this change in presentation.
(3) Returns are historical and are calculated by determining the percentage change in net asset value with all distributions reinvested. Total return is not computed on an annualized basis.
(4) Includes the Fund's share of its corresponding Portfolio's allocated expenses.
(5) Annualized.
(6) Portfolio turnover represents the rate of portfolio activity for the period while the Fund was making investments directly into the Portfolio.
See notes to financial statements
53
Eaton Vance Municipals Funds as of January 31, 2005
FINANCIAL STATEMENTS CONT'D
Financial Highlights
| | | Michigan Fund - Class B | |
| | | Six Months Ended
January 31, 2005 | | Year Ended July 31, | |
| | | (Unaudited)(1) | | 2004(1) | | 2003(1) | | 2002(1)(2) | | 2001(1) | | 2000(1) | |
| Net asset value - Beginning of period | | $ | 10.580 | | | $ | 10.500 | | | $ | 10.710 | | | $ | 10.690 | | | $ | 10.090 | | | $ | 10.520 | | |
| Income (loss) from operations | | | | | | | | | | | | | | | | | | | | | | | | | |
| Net investment income | | $ | 0.207 | | | $ | 0.445 | | | $ | 0.453 | | | $ | 0.461 | | | $ | 0.457 | | | $ | 0.459 | | |
| Net realized and unrealized gain (loss) | | | 0.216 | | | | 0.071 | | | | (0.213 | ) | | | 0.009 | | | | 0.592 | | | | (0.401 | ) | |
| Total income from operations | | $ | 0.423 | | | $ | 0.516 | | | $ | 0.240 | | | $ | 0.470 | | | $ | 1.049 | | | $ | 0.058 | | |
| Less distributions | | | | | | | | | | | | | | | | | | | | | | | | | |
| From net investment income | | $ | (0.213 | ) | | $ | (0.436 | ) | | $ | (0.450 | ) | | $ | (0.450 | ) | | $ | (0.449 | ) | | $ | (0.445 | ) | |
| From net realized gain | | | - | | | | - | | | | - | | | | - | | | | - | | | | (0.043 | ) | |
| Total distributions | | $ | (0.213 | ) | | $ | (0.436 | ) | | $ | (0.450 | ) | | $ | (0.450 | ) | | $ | (0.449 | ) | | $ | (0.488 | ) | |
| Net asset value - End of period | | $ | 10.790 | | | $ | 10.580 | | | $ | 10.500 | | | $ | 10.710 | | | $ | 10.690 | | | $ | 10.090 | | |
| Total Return(3) | | | 4.22 | %(4) | | | 4.96 | % | | | 2.19 | % | | | 4.50 | % | | | 10.59 | % | | | 0.75 | % | |
| Ratios/Supplemental Data | | | | | | | | | | | | | | | | | | | | | | | | | |
| Net assets, end of period (000's omitted) | | $ | 9,489 | | | $ | 11,146 | | | $ | 66,608 | | | $ | 73,107 | | | $ | 77,957 | | | $ | 82,580 | | |
| Ratios (As a percentage of average daily net assets): | | | | | | | | | | | | | | | | | | | | | | | | | |
| Expenses(5) | | | 1.55 | %(6) | | | 1.56 | % | | | 1.54 | % | | | 1.55 | % | | | 1.60 | % | | | 1.60 | % | |
| Expenses after custodian fee reduction(5) | | | 1.54 | %(6) | | | 1.55 | % | | | 1.53 | % | | | 1.55 | % | | | 1.59 | % | | | 1.60 | % | |
| Net investment income | | | 3.84 | %(6) | | | 4.14 | % | | | 4.20 | % | | | 4.34 | % | | | 4.38 | % | | | 4.61 | % | |
| Portfolio Turnover of the Portfolio(7) | | | 2 | % | | | 16 | % | | | 12 | % | | | 7 | % | | | 8 | % | | | 30 | % | |
| Portfolio Turnover of the Fund | | | 7 | % | | | - | | | | - | | | | - | | | | - | | | | - | | |
(1) Net investment income per share was computed using average shares outstanding.
(2) The Fund, through its investment in the Portfolio, has adopted the provisions of the revised AICPA Audit and Accounting Guide for Investment Companies and began using the interest method to amortize premiums on fixed-income securities. The effect of this change for the year ended July 31, 2002 was to increase net investment income per share by $0.001, decrease net realized and unrealized gains per share by $0.001, and increase the ratio of net investment income to average net assets from 4.33% to 4.34%. Per-share data and ratios for the p eriods prior to August 1, 2001 have not been restated to reflect this change in presentation.
(3) Returns are historical and are calculated by determining the percentage change in net asset value with all distributions reinvested. Total return is not computed on an annualized basis.
(4) Total return reflects an increase of 0.14% due to a change in the timing of the payment and reinvestment of distributions.
(5) Includes the Fund's share of its corresponding Portfolio's allocated expenses.
(7) Annualized.
(7) Portfolio turnover represents the rate of portfolio activity for the period while the Fund was making investments directly into the Portfolio.
See notes to financial statements
54
Eaton Vance Municipals Funds as of January 31, 2005
FINANCIAL STATEMENTS CONT'D
Financial Highlights
| | | Minnesota Fund - Class A | |
| | | Six Months Ended
January 31, 2005 | | Year Ended July 31, | |
| | | (Unaudited)(1) | | 2004(1) | | 2003(1) | | 2002(1)(2) | | 2001 | | 2000 | |
| Net asset value - Beginning of period | | $ | 9.110 | | | $ | 9.090 | | | $ | 9.310 | | | $ | 9.410 | | | $ | 9.070 | | | $ | 9.460 | | |
| Income (loss) from operations | | | | | | | | | | | | | | | | | | | | | | | | | |
| Net investment income | | $ | 0.215 | | | $ | 0.432 | | | $ | 0.449 | | | $ | 0.504 | | | $ | 0.488 | | | $ | 0.491 | | |
| Net realized and unrealized gain (loss) | | | 0.234 | | | | 0.029 | | | | (0.185 | ) | | | (0.118 | ) | | | 0.336 | | | | (0.395 | ) | |
| Total income from operations | | $ | 0.449 | | | $ | 0.461 | | | $ | 0.264 | | | $ | 0.386 | | | $ | 0.824 | | | $ | 0.096 | | |
| Less distributions | | | | | | | | | | | | | | | | | | | | | | | | | |
| From net investment income | | $ | (0.209 | ) | | $ | (0.441 | ) | | $ | (0.484 | ) | | $ | (0.486 | ) | | $ | (0.484 | ) | | $ | (0.486 | ) | |
| Total distributions | | $ | (0.209 | ) | | $ | (0.441 | ) | | $ | (0.484 | ) | | $ | (0.486 | ) | | $ | (0.484 | ) | | $ | (0.486 | ) | |
| Net asset value - End of period | | $ | 9.350 | | | $ | 9.110 | | | $ | 9.090 | | | $ | 9.310 | | | $ | 9.410 | | | $ | 9.070 | | |
| Total Return(3) | | | 4.99 | % | | | 5.12 | % | | | 2.86 | % | | | 4.22 | % | | | 9.29 | % | | | 1.21 | % | |
| Ratios/Supplemental Data | | | | | | | | | | | | | | | | | | | | | | | | | |
| Net assets, end of period (000's omitted) | | $ | 29,393 | | | $ | 29,369 | | | $ | 8,956 | | | $ | 7,370 | | | $ | 5,364 | | | $ | 5,079 | | |
| Ratios (As a percentage of average daily net assets): | | | | | | | | | | | | | | | | | | | | | | | | | |
| Expenses(4) | | | 0.75 | %(5) | | | 0.79 | % | | | 0.78 | % | | | 0.77 | % | | | 0.87 | % | | | 0.79 | % | |
| Expenses after custodian fee reduction(4) | | | 0.74 | %(5) | | | 0.79 | % | | | 0.76 | % | | | 0.75 | % | | | 0.82 | % | | | 0.77 | % | |
| Net investment income | | | 4.62 | %(5) | | | 4.71 | % | | | 4.83 | % | | | 5.41 | % | | | 5.26 | % | | | 5.48 | % | |
| Portfolio Turnover of the Portfolio(6) | | | 6 | % | | | 12 | % | | | 15 | % | | | 26 | % | | | 17 | % | | | 12 | % | |
| Portfolio Turnover of the Fund | | | 1 | % | | | - | | | | - | | | | - | | | | - | | | | - | | |
(1) Net investment income per share was computed using average shares outstanding.
(2) The Fund, through its investment in the Portfolio, has adopted the provisions of the revised AICPA Audit and Accounting Guide for Investment Companies and began using the interest method to amortize premiums on fixed-income securities. The effect of this change for the year ended July 31, 2002 was to increase net investment income per share by $0.002, increase net realized and unrealized losses per share by $0.002, and increase the ratio of net investment income to average net assets from 5.39% to 5.41%. Per-share data and ratios for the periods prior to August 1, 2001 have not been restated to reflect this change in presentation.
(3) Returns are historical and are calculated by determining the percentage change in net asset value with all distributions reinvested. Total return is not computed on an annualized basis.
(4) Includes the Fund's share of its corresponding Portfolio's allocated expenses.
(5) Annualized.
(6) Portfolio turnover represents the rate of portfolio activity for the period while the Fund was making investments directly into the Portfolio.
See notes to financial statements
55
Eaton Vance Municipals Funds as of January 31, 2005
FINANCIAL STATEMENTS CONT'D
Financial Highlights
| | | Minnesota Fund - Class B | |
| | | Six Months Ended
January 31, 2005 | | Year Ended July 31, | |
| | | (Unaudited)(1) | | 2004(1) | | 2003(1) | | 2002(1)(2) | | 2001 | | 2000 | |
| Net asset value - Beginning of period | | $ | 9.810 | | | $ | 9.790 | | | $ | 10.030 | | | $ | 10.130 | | | $ | 9.770 | | | $ | 10.170 | | |
| Income (loss) from operations | | | | | | | | | | | | | | | | | | | | | | | | | |
| Net investment income | | $ | 0.194 | | | $ | 0.390 | | | $ | 0.411 | | | $ | 0.470 | | | $ | 0.451 | | | $ | 0.453 | | |
| Net realized and unrealized gain (loss) | | | 0.244 | | | | 0.029 | | | | (0.204 | ) | | | (0.121 | ) | | | 0.352 | | | | (0.418 | ) | |
| Total income from operations | | $ | 0.438 | | | $ | 0.419 | | | $ | 0.207 | | | $ | 0.349 | | | $ | 0.803 | | | $ | 0.035 | | |
| Less distributions | | | | | | | | | | | | | | | | | | | | | | | | | |
| From net investment income | | $ | (0.188 | ) | | $ | (0.399 | ) | | $ | (0.447 | ) | | $ | (0.449 | ) | | $ | (0.443 | ) | | $ | (0.435 | ) | |
| Total distributions | | $ | (0.188 | ) | | $ | (0.399 | ) | | $ | (0.447 | ) | | $ | (0.449 | ) | | $ | (0.443 | ) | | $ | (0.435 | ) | |
| Net asset value - End of period | | $ | 10.060 | | | $ | 9.810 | | | $ | 9.790 | | | $ | 10.030 | | | $ | 10.130 | | | $ | 9.770 | | |
| Total Return(3) | | | 4.67 | %(4) | | | 4.33 | % | | | 2.07 | % | | | 3.52 | % | | | 8.36 | % | | | 0.52 | % | |
| Ratios/Supplemental Data | | | | | | �� | | | | | | | | | | | | | | | | | | | |
| Net assets, end of period (000's omitted) | | $ | 14,868 | | | $ | 15,212 | | | $ | 41,279 | | | $ | 44,110 | | | $ | 43,819 | | | $ | 43,660 | | |
| Ratios (As a percentage of average daily net assets): | | | | | | | | | | | | | | | | | | | | | | | | | |
| Expenses(5) | | | 1.50 | %(6) | | | 1.54 | % | | | 1.53 | % | | | 1.52 | % | | | 1.62 | % | | | 1.55 | % | |
| Expenses after custodian fee reduction(5) | | | 1.49 | %(6) | | | 1.54 | % | | | 1.51 | % | | | 1.50 | % | | | 1.57 | % | | | 1.53 | % | |
| Net investment income | | | 3.87 | %(6) | | | 3.92 | % | | | 4.11 | % | | | 4.68 | % | | | 4.52 | % | | | 4.74 | % | |
| Portfolio Turnover of the Portfolio(7) | | | 6 | % | | | 12 | % | | | 15 | % | | | 26 | % | | | 17 | % | | | 12 | % | |
| Portfolio Turnover of the Fund | | | 1 | % | | | - | | | | - | | | | - | | | | - | | | | - | | |
(1) Net investment income per share was computed using average shares outstanding.
(2) The Fund, through its investment in the Portfolio, has adopted the provisions of the revised AICPA Audit and Accounting Guide for Investment Companies and began using the interest method to amortize premiums on fixed-income securities. The effect of this change for the year ended July 31, 2002 was to increase net investment income per share by $0.002, increase net realized and unrealized losses per share by $0.002, and increase the ratio of net investment income to average net assets from 4.66% to 4.68%. Per-share data and ratios for the periods prior to August 1, 2001 have not been restated to reflect this change in presentation.
(3) Returns are historical and are calculated by determining the percentage change in net asset value with all distributions reinvested. Total return is not computed on an annualized basis.
(4) Total return reflects an increase of 0.13% due to a change in the timing of the payment and reinvestment of distributions.
(5) Includes the Fund's share of its corresponding Portfolio's allocated expenses.
(6) Annualized.
(7) Portfolio turnover represents the rate of portfolio activity for the period while the Fund was making investments directly into the Portfolio.
See notes to financial statements
56
Eaton Vance Municipals Funds as of January 31, 2005
FINANCIAL STATEMENTS CONT'D
Financial Highlights
| | | New Jersey Fund - Class A | |
| | | Six Months Ended
January 31, 2005 | | Year Ended July 31, | |
| | | (Unaudited) | | 2004 | | 2003 | | 2002(2) | | 2001 | | 2000 | |
| Net asset value - Beginning of period | | $ | 10.130 | | | $ | 10.070 | | | $ | 10.320 | | | $ | 10.340 | | | $ | 9.760 | | | $ | 10.190 | | |
| Income (loss) from operations | | | |
| Net investment income(1) | | $ | 0.244 | | | $ | 0.508 | | | $ | 0.527 | | | $ | 0.558 | | | $ | 0.542 | | | $ | 0.543 | | |
| Net realized and unrealized gain (loss) | | | 0.322 | | | | 0.082 | | | | (0.248 | ) | | | (0.043 | ) | | | 0.572 | | | | (0.430 | ) | |
| Total income from operations | | $ | 0.566 | | | $ | 0.590 | | | $ | 0.279 | | | $ | 0.515 | | | $ | 1.114 | | | $ | 0.113 | | |
| Less distributions | | | |
| From net investment income | | $ | (0.246 | ) | | $ | (0.530 | ) | | $ | (0.529 | ) | | $ | (0.535 | ) | | $ | (0.534 | ) | | $ | (0.543 | ) | |
| Total distributions | | $ | (0.246 | ) | | $ | (0.530 | ) | | $ | (0.529 | ) | | $ | (0.535 | ) | | $ | (0.534 | ) | | $ | (0.543 | ) | |
| Net asset value - End of period | | $ | 10.450 | | | $ | 10.130 | | | $ | 10.070 | | | $ | 10.320 | | | $ | 10.340 | | | $ | 9.760 | | |
| Total Return(3) | | | 5.65 | % | | | 5.89 | % | | | 2.67 | % | | | 5.16 | % | | | 11.71 | % | | | 1.34 | % | |
| Ratios/Supplemental Data | | | |
| Net assets, end of period (000's omitted) | | $ | 170,221 | | | $ | 161,964 | | | $ | 31,548 | | | $ | 27,736 | | | $ | 19,212 | | | $ | 14,690 | | |
| Ratios (As a percentage of average daily net assets): | | | | | | | | | | | | | | | | | | | | | | | | | |
| Expenses(4) | | | 0.80 | %(5) | | | 0.84 | % | | | 0.82 | % | | | 0.83 | % | | | 0.88 | % | | | 0.83 | % | |
| Expenses after custodian fee reduction(4) | | | 0.79 | %(5) | | | 0.83 | % | | | 0.82 | % | | | 0.83 | % | | | 0.87 | % | | | 0.83 | % | |
| Net investment income | | | 4.70 | %(5) | | | 4.99 | % | | | 5.07 | % | | | 5.46 | % | | | 5.39 | % | | | 5.64 | % | |
| Portfolio Turnover of the Portfolio(6) | | | 0 | % | | | 15 | % | | | 15 | % | | | 26 | % | | | 20 | % | | | 26 | % | |
| Portfolio Turnover of the Fund | | | 17 | % | | | - | | | | - | | | | - | | | | - | | | | - | | |
(1) Net investment income per share was computed using average shares outstanding.
(2) The Fund, through its investment in the Portfolio, has adopted the provisions of the revised AICPA Audit and Accounting Guide for Investment Companies and began using the interest method to amortize premiums on fixed-income securities. The effect of this change for the year ended July 31, 2002 was to increase net investment income per share by $0.001, increase net realized and unrealized losses per share by $0.001, and increase the ratio of net investment income to average net assets from 5.45% to 5.46%. Per-share data and ratios for the periods prior to August 1, 2001 have not been restated to reflect this change in presentation.
(3) Returns are historical and are calculated by determining the percentage change in net asset value with all distributions reinvested. Total return is not computed on an annualized basis.
(4) Includes the Fund's share of its corresponding Portfolio's allocated expenses.
(5) Annualized.
(6) Portfolio turnover represents the rate of portfolio activity for the period while the Fund was making investments directly into the Portfolio.
See notes to financial statements
57
Eaton Vance Municipals Funds as of January 31, 2005
FINANCIAL STATEMENTS CONT'D
Financial Highlights
| | | New Jersey Fund - Class B | |
| | | Six Months Ended
January 31, 2005 | | Year Ended July 31, | |
| | | (Unaudited) | | 2004 | | 2003 | | 2002(2) | | 2001 | | 2000 | |
| Net asset value - Beginning of period | | $ | 10.570 | | | $ | 10.510 | | | $ | 10.780 | | | $ | 10.790 | | | $ | 10.180 | | | $ | 10.610 | | |
| Income (loss) from operations | | | | | | | | | | | | | | | | | | | | | | | | | |
| Net investment income(1) | | $ | 0.214 | | | $ | 0.445 | | | $ | 0.470 | | | $ | 0.504 | | | $ | 0.494 | | | $ | 0.489 | | |
| Net realized and unrealized gain (loss) | | | 0.343 | | | | 0.086 | | | | (0.271 | ) | | | (0.039 | ) | | | 0.590 | | | | (0.443 | ) | |
| Total income from operations | | $ | 0.557 | | | $ | 0.531 | | | $ | 0.199 | | | $ | 0.465 | | | $ | 1.084 | | | $ | 0.046 | | |
| Less distributions | | | | | | | | | | | | | | | | | | | | | | | | | |
| From net investment income | | $ | (0.217 | ) | | $ | (0.471 | ) | | $ | (0.469 | ) | | $ | (0.475 | ) | | $ | (0.474 | ) | | $ | (0.476 | ) | |
| Total distributions | | $ | (0.217 | ) | | $ | (0.471 | ) | | $ | (0.469 | ) | | $ | (0.475 | ) | | $ | (0.474 | ) | | $ | (0.476 | ) | |
| Net asset value - End of period | | $ | 10.910 | | | $ | 10.570 | | | $ | 10.510 | | | $ | 10.780 | | | $ | 10.790 | | | $ | 10.180 | | |
| Total Return(3) | | | 5.49 | %(4) | | | 5.07 | % | | | 1.80 | % | | | 4.43 | % | | | 10.88 | % | | | 0.63 | % | |
| Ratios/Supplemental Data | | | | | | | | | | | | | | | | | | | | | | | | | |
| Net assets, end of period (000's omitted) | | $ | 77,655 | | | $ | 78,427 | | | $ | 228,575 | | | $ | 239,669 | | | $ | 238,445 | | | $ | 233,230 | | |
| Ratios (As a percentage of average daily net assets): | | | | | | | | | | | | | | | | | | | | | | | | | |
| Expenses(5) | | | 1.55 | %(6) | | | 1.59 | % | | | 1.57 | % | | | 1.58 | % | | | 1.63 | % | | | 1.60 | % | |
| Expenses after custodian fee reduction(5) | | | 1.54 | %(6) | | | 1.58 | % | | | 1.57 | % | | | 1.58 | % | | | 1.62 | % | | | 1.60 | % | |
| Net investment income | | | 3.95 | %(6) | | | 4.12 | % | | | 4.33 | % | | | 4.72 | % | | | 4.71 | % | | | 4.88 | % | |
| Portfolio Turnover of the Portfolio(7) | | | 0 | % | | | 15 | % | | | 15 | % | | | 26 | % | | | 20 | % | | | 26 | % | |
| Portfolio Turnover of the Fund | | | 17 | % | | | - | | | | - | | | | - | | | | - | | | | - | | |
(1) Net investment income per share was computed using average shares outstanding.
(2) The Fund, through its investment in the Portfolio, has adopted the provisions of the revised AICPA Audit and Accounting Guide for Investment Companies and began using the interest method to amortize premiums on fixed-income securities. The effect of this change for the year ended July 31, 2002 was to increase net investment income per share by $0.001, increase net realized and unrealized losses per share by $0.001, and increase the ratio of net investment income to average net assets from 4.71% to 4.72%. Per-share data and ratios for the periods prior to August 1, 2001 have not been restated to reflect this change in presentation.
(3) Returns are historical and are calculated by determining the percentage change in net asset value with all distributions reinvested. Total return is not computed on an annualized basis.
(4) Total return reflects an increase of 0.14% due to a change in the timing of the payment and reinvestment of distributions.
(5) Includes the Fund's share of its corresponding Portfolio's allocated expenses.
(6) Annualized.
(7) Portfolio turnover represents the rate of portfolio activity for the period while the Fund was making investments directly into the Portfolio.
See notes to financial statements
58
Eaton Vance Municipals Funds as of January 31, 2005
FINANCIAL STATEMENTS CONT'D
Financial Highlights
| | | Pennsylvania Fund - Class A | |
| | | Six Months Ended
January 31, 2005 | | Year Ended July 31, | |
| | | (Unaudited) | | 2004 | | 2003 | | 2002(2) | | 2001 | | 2000 | |
| Net asset value - Beginning of period | | $ | 9.730 | | | $ | 9.680 | | | $ | 9.870 | | | $ | 9.870 | | | $ | 9.480 | | | $ | 9.990 | | |
| Income (loss) from operations | | | | | | | | | | | | | | | | | | | | | | | | | |
| Net investment income(1) | | $ | 0.248 | | | $ | 0.513 | | | $ | 0.525 | | | $ | 0.565 | | | $ | 0.548 | | | $ | 0.534 | | |
| Net realized and unrealized gain (loss) | | | 0.226 | | | | 0.053 | | | | (0.171 | ) | | | (0.021 | ) | | | 0.381 | | | | (0.492 | ) | |
| Total income from operations | | $ | 0.474 | | | $ | 0.566 | | | $ | 0.354 | | | $ | 0.544 | | | $ | 0.929 | | | $ | 0.042 | | |
| Less distributions | | | | | | | | | | | | | | | | | | | | | | | | | |
| From net investment income | | $ | (0.254 | ) | | $ | (0.516 | ) | | $ | (0.544 | ) | | $ | (0.544 | ) | | $ | (0.539 | ) | | $ | (0.552 | ) | |
| Total distributions | | $ | (0.254 | ) | | $ | (0.516 | ) | | $ | (0.544 | ) | | $ | (0.544 | ) | | $ | (0.539 | ) | | $ | (0.552 | ) | |
| Net asset value - End of period | | $ | 9.950 | | | $ | 9.730 | | | $ | 9.680 | | | $ | 9.870 | | | $ | 9.870 | | | $ | 9.480 | | |
| Total Return(3) | | | 4.92 | % | | | 5.91 | % | | | 3.60 | % | | | 5.66 | % | | | 10.05 | % | | | 0.58 | % | |
| Ratios/Supplemental Data | | | | | | | | | | | | | | | | | | | | | | | | | |
| Net assets, end of period (000's omitted) | | $ | 165,049 | | | $ | 156,465 | | | $ | 17,109 | | | $ | 14,896 | | | $ | 11,411 | | | $ | 9,302 | | |
| Ratios (As a percentage of average daily net assets): | | | | | | | | | | | | | | | | | | | | | | | | | |
| Expenses(4) | | | 0.85 | %(5) | | | 0.85 | % | | | 0.83 | % | | | 0.87 | % | | | 0.89 | % | | | 0.90 | % | |
| Expenses after custodian fee reduction(4) | | | 0.84 | %(5) | | | 0.84 | % | | | 0.83 | % | | | 0.85 | % | | | 0.85 | % | | | 0.90 | % | |
| Net investment income | | | 5.00 | %(5) | | | 5.27 | % | | | 5.29 | % | | | 5.74 | % | | | 5.65 | % | | | 5.63 | % | |
| Portfolio Turnover of the Portfolio(6) | | | 1 | % | | | 14 | % | | | 23 | % | | | 15 | % | | | 15 | % | | | 18 | % | |
| Portfolio Turnover of the Fund | | | 8 | % | | | - | | | | - | | | | - | | | | - | | | | - | | |
(1) Net investment income per share was computed using average shares outstanding.
(2) The Fund, through its investment in the Portfolio, has adopted the provisions of the revised AICPA Audit and Accounting Guide for Investment Companies and began using the interest method to amortize premiums on fixed-income securities. The effect of this change for the year ended July 31, 2002 was to increase net investment income per share by $0.001, increase net realized and unrealized losses per share by $0.001, and increase the ratio of net investment income to average net assets by less than 0.01%. Per-share data and ratios for the p eriods prior to August 1, 2001 have not been restated to reflect this change in presentation.
(3) Returns are historical and are calculated by determining the percentage change in net asset value with all distributions reinvested. Total return is not computed on an annualized basis.
(4) Includes the Fund's share of its corresponding Portfolio's allocated expenses.
(5) Annualized.
(6) Portfolio turnover represents the rate of portfolio activity for the period while the Fund was making investments directly into the Portfolio.
See notes to financial statements
59
Eaton Vance Municipals Funds as of January 31, 2005
FINANCIAL STATEMENTS CONT'D
Financial Highlights
| | | Pennsylvania Fund - Class B | |
| | | Six Months Ended
January 31, 2005 | | Year Ended July 31, | |
| | | (Unaudited) | | 2004 | | 2003 | | 2002(2) | | 2001 | | 2000 | |
| Net asset value - Beginning of period | | $ | 10.060 | | | $ | 10.010 | | | $ | 10.210 | | | $ | 10.210 | | | $ | 9.800 | | | $ | 10.310 | | |
| Income (loss) from operations | | | | | | | | | | | | | | | | | | | | | | | | | |
| Net investment income(1) | | $ | 0.218 | | | $ | 0.458 | | | $ | 0.469 | | | $ | 0.510 | | | $ | 0.492 | | | $ | 0.477 | | |
| Net realized and unrealized gain (loss) | | | 0.236 | | | | 0.049 | | | | (0.182 | ) | | | (0.026 | ) | | | 0.392 | | | | (0.508 | ) | |
| Total income (loss) from operations | | $ | 0.454 | | | $ | 0.507 | | | $ | 0.287 | | | $ | 0.484 | | | $ | 0.884 | | | $ | (0.031 | ) | |
| Less distributions | | | | | | | | | | | | | | | | | | | | | | | | | |
| From net investment income | | $ | (0.224 | ) | | $ | (0.457 | ) | | $ | (0.487 | ) | | $ | (0.484 | ) | | $ | (0.474 | ) | | $ | (0.479 | ) | |
| Total distributions | | $ | (0.224 | ) | | $ | (0.457 | ) | | $ | (0.487 | ) | | $ | (0.484 | ) | | $ | (0.474 | ) | | $ | (0.479 | ) | |
| Net asset value - End of period | | $ | 10.290 | | | $ | 10.060 | | | $ | 10.010 | | | $ | 10.210 | | | $ | 10.210 | | | $ | 9.800 | | |
| Total Return(3) | | | 4.75 | %(4) | | | 5.10 | % | | | 2.81 | % | | | 4.83 | % | | | 9.21 | % | | | (0.15 | )% | |
| Ratios/Supplemental Data | | | | | | | | | | | | | | | | | | | | | | | | | |
| Net assets, end of period (000's omitted) | | $ | 50,776 | | | $ | 51,972 | | | $ | 204,087 | | | $ | 211,865 | | | $ | 218,068 | | | $ | 227,779 | | |
| Ratios (As a percentage of average daily net assets): | | | | | | | | | | | | | | | | | | | | | | | | | |
| Expenses(5) | | | 1.60 | %(6) | | | 1.60 | % | | | 1.58 | % | | | 1.62 | % | | | 1.65 | % | | | 1.66 | % | |
| Expenses after custodian fee reduction(5) | | | 1.59 | %(6) | | | 1.59 | % | | | 1.58 | % | | | 1.60 | % | | | 1.61 | % | | | 1.66 | % | |
| Net investment income | | | 4.26 | %(6) | | | 4.48 | % | | | 4.57 | % | | | 5.00 | % | | | 4.90 | % | | | 4.86 | % | |
| Portfolio Turnover of the Portfolio(7) | | | 1 | % | | | 14 | % | | | 23 | % | | | 15 | % | | | 15 | % | | | 18 | % | |
| Portfolio Turnover of the Fund | | | 8 | % | | | - | | | | - | | | | - | | | | - | | | | - | | |
(1) Net investment income per share was computed using average shares outstanding.
(2) The Fund, through its investment in the Portfolio, has adopted the provisions of the revised AICPA Audit and Accounting Guide for Investment Companies and began using the interest method to amortize premiums on fixed-income securities. The effect of this change for the year ended July 31, 2002 was to increase net investment income per share by $0.001, increase net realized and unrealized losses per share by $0.001, and increase the ratio of net investment income to average net assets by less than 0.01%. Per-share data and ratios for the p eriods prior to August 1, 2001 have not been restated to reflect this change in presentation.
(3) Returns are historical and are calculated by determining the percentage change in net asset value with all distributions reinvested. Total return is not computed on an annualized basis.
(4) Total return reflects an increase of 0.15% due to a change in the timing of the payment and reinvestment of distributions.
(5) Includes the Fund's share of its corresponding Portfolio's allocated expenses.
(6) Annualized.
See notes to financial statements
60
Eaton Vance Municipals Funds as of January 31, 2005
NOTES TO FINANCIAL STATEMENTS (Unaudited)
1 Significant Accounting Policies
Eaton Vance Municipals Trust (the Trust) is an entity of the type commonly known as a Massachusetts business trust and is registered under the Investment Company Act of 1940, as amended, as an open-end management investment company. The Trust presently consists of twenty-eight Funds, seven of which, each non-diversified, are included in these financial statements. They include Eaton Vance Arizona Municipals Fund (Arizona Fund), Eaton Vance Colorado Municipals Fund (Colorado Fund), Eaton Vance Connecticut Municipals Fund (Connecticut Fund), Eaton Vance Michigan Municipals Fund (Michigan Fund), Eaton Vance Minnesota Municipals Fund (Minnesota Fund), Eaton Vance New Jersey Municipals Fund (New Jersey Fund) and Eaton Vance Pennsylvania Municipals Fund (Pennsylvania Fund), individually, the Fund, collectively, the Funds. The Funds seek to achieve current income exempt from regular federal income tax and particular state or local income taxes by investing primarily in investment grade municipal obligations. The Funds offer two classes of shares. Class A shares are generally sold subject to a sales charge imposed at time of purchase. Class B shares are sold at net asset value and are subject to a declining contingent deferred sales charge (see Note 6). The Trustees have adopted a conversion feature pursuant to which Class B shares of each Fund automatically convert to Class A shares eight years after their purchase as described in each Fund's prospectus. Each class represents a pro-rata interest in the Fund, but votes separately on class-specific matters and (as noted below) is subject to different expenses. Realized and unrealized gains and losses are allocated daily to each class of shares based on the relative net assets of each class to the total net assets of the Fund. Net investment income, other than class-specific expenses, is allocated daily to each class of shares based upon the ratio of the value of each class's paid shares to the total value of all paid shares. Each class of shares differs in its distribution plan and certain other class specific expenses.
On September 17, 2004, the Arizona Fund, the Colorado Fund, the Connecticut Fund, the Michigan Fund, the Minnesota Fund, the New Jersey Fund and the Pennsylvania Fund received its pro rata share of cash and securities from the Arizona Municipals Portfolio (Arizona Portfolio), Colorado Municipals Portfolio (Colorado Portfolio), Connecticut Municipals Portfolio (Connecticut Portfolio), Michigan Municipals Portfolio (Michigan Portfolio), Minnesota Municipals Portfolio (Minnesota Portfolio), New Jersey Municipals Portfolio (New Jersey Portfolio) and Pennsylvania Municipals Portfolio (Pennsylvania Portfolio), in a complete liquidation of its interest in its corresponding Portfolio. Subsequent to September 17, 2004, each Fund invests directly in securities rather than through its co rresponding Portfolio and maintains the same investment objective.
The following is a summary of significant accounting policies consistently followed by the Trust in the preparation of its financial statements. The policies are in conformity with accounting principles generally accepted in the United States of America.
A Investment Valuations - Municipal bonds are normally valued on the basis of valuations furnished by a pricing service. Taxable obligations, if any, for which price quotations are readily available are normally valued at the mean between the latest bid and asked prices. Futures contracts and options on futures contracts listed on commodity exchanges are valued at closing settlement prices. Over-the-counter options on financial futures contracts are normally valued at the mean between the latest bid and asked prices. Interest rate swaps are normally valued on the basis of valuations furnished by a broker. Short-term obligations, maturing in sixty days or less, are value d at amortized cost, which approximates value. Investments for which valuations or market quotations are unavailable are valued at fair value using methods determined in good faith by or at the direction of the Trustees.
B Income - Interest income is determined on the basis of interest accrued, adjusted for amortization of premium or discount.
C Federal Taxes - Each Fund's policy is to comply with the provisions of the Internal Revenue Code applicable to regulated investment companies and to distribute to shareholders each year all of its taxable and tax-exempt income, including any net realized gain on investments. Accordingly, no provision for federal income or excise tax is necessary. At July 31, 2004, the following Funds, for federal income tax purposes, had capital loss carryovers, which will reduce each Fund's taxable income arising from future net realized gain on investments, if any, to the extent permitted by the Internal Revenue Code, and thus will reduce the amount of distributions to sharehol ders which would otherwise
61
Eaton Vance Municipals Funds as of January 31, 2005
NOTES TO FINANCIAL STATEMENTS (Unaudited) CONT'D
be necessary to relieve the Funds of any liability for federal income or excise tax. The amounts and expiration dates of the capital loss carryovers are as follows:
| Fund | | Amount | | Expires | |
| Arizona | | $ | 177,375 | | | July 31, 2008 | |
| | | | 589,819 | | | July 31, 2009 | |
| | | | 536,449 | | | July 31, 2010 | |
| | | | 353,624 | | | July 31, 2012 | |
| Colorado | | | 145,382 | | | July 31, 2009 | |
| | | | 146,689 | | | July 31, 2010 | |
| | | | 166,807 | | | July 31, 2012 | |
| Connecticut | | | 91,011 | | | July 31, 2005 | |
| | | | 242,814 | | | July 31, 2008 | |
| | | | 214,600 | | | July 31, 2010 | |
| | | | 502,297 | | | July 31, 2012 | |
| Michigan | | | 1,114,454 | | | July 31, 2008 | |
| | | | 226,944 | | | July 31, 2010 | |
| | | | 681,535 | | | July 31, 2011 | |
| Minnesota | | | 329,867 | | | July 31, 2005 | |
| | | | 340,808 | | | July 31, 2008 | |
| | | | 128,212 | | | July 31, 2009 | |
| | | | 214,916 | | | July 31, 2010 | |
| | | | 382,839 | | | July 31, 2012 | |
| New Jersey | | | 23,676 | | | July 31, 2005 | |
| | | | 1,190,382 | | | July 31, 2009 | |
| | | | 941,924 | | | July 31, 2011 | |
| | | | 3,296,401 | | | July 31, 2012 | |
| Pennsylvania | | | 1,809,455 | | | July 31, 2005 | |
| | | | 933,369 | | | July 31, 2009 | |
| | | | 1,301,218 | | | July 31, 2010 | |
| | | | 7,701,119 | | | July 31, 2011 | |
| | | | 1,108,751 | | | July 31, 2012 | |
Dividends paid by each Fund from net interest on tax-exempt municipal bonds are not includable by shareholders as gross income for federal income tax purposes because each Fund intends to meet certain requirements of the Internal Revenue Code applicable to regulated investment companies that will enable the Funds to pay tax-exempt interest dividends. The portion of such interest, if any, earned on private activity bonds issued after August 7, 1986 may be considered a tax preference item to shareholders.
Additionally, at July 31, 2004, Arizona Fund, Minnesota Fund, New Jersey Fund and Pennsylvania Fund had net capital losses of $173,763, $14,348, $590,062 and $1,134,215, respectively, attributable to security transactions incurred after October 31, 2003. These are treated as arising on the first day of each Fund's taxable year ending July 31, 2005.
D Financial Futures Contracts - Upon the entering of a financial futures contract, a Fund is required to deposit (initial margin) either in cash or securities an amount equal to a certain percentage of the purchase price indicated in the financial futures contract. Subsequent payments are made or received by a Fund (margin maintenance) each day, dependent on the daily fluctuations in the value of the underlying security, and are recorded for book purposes as unrealized gains or losses by a Fund. A Fund's investment in financial futures contracts is designed to hedge against anticipated future changes in interest rates. Should interest rates move unexpectedly, a Fund may not achieve the anticipated benefits of the financial futures contracts and may realize a loss.
E Options on Financial Futures Contracts - Upon the purchase of a put option on a financial futures contract by a Fund, the premium paid is recorded as an investment, the value of which is marked-to-market daily. When a purchased option expires, a Fund will realize a loss in the amount of the cost of the option. When a Fund enters into a closing sale transaction, a Fund will realize a gain or loss depending on whether the sales proceeds from the closing sale transaction are greater or less than the cost of the option. When a Fund exercises a put option, settlement is made in cash. The risk associated with purchasing options is limited to the premium originally paid.
F When-Issued and Delayed Delivery Transactions - The Funds may engage in when-issued and delayed delivery transactions. The Funds record when-issued securities on trade date and maintain security positions such that sufficient liquid assets will be available to make payments for the securities purchased. Securities purchased on a when-issued or delayed delivery basis are marked-to-market daily and begin earning interest on settlement date.
G Interest Rate Swaps - A Fund may enter into interest rate swap agreements to enhance return, to hedge against fluctuations in securities prices or interest rates or as substitution for the purchase or sale of securities. Pursuant to these agreements, the Fund makes semi-annual payments at a fixed interest rate. In exchange, a Fund receives payments based on the interest rate of a benchmark industry index. During the term of the outstanding swap agreement, changes in the underlying value of the swap are recorded as unrealized gains and losses. The value of the swap is determined by changes in the relationship between
62
Eaton Vance Municipals Funds as of January 31, 2005
NOTES TO FINANCIAL STATEMENTS (Unaudited) CONT'D
two rates of interest. The Fund is exposed to credit loss in the event of non-performance by the swap counterparty. However, the Fund does not anticipate non-performance by the counterparty. Risk may also arise from the unanticipated movements in value of interest rates.
H Expenses - The majority of expenses of the Trust are directly identifiable to an individual fund. Expenses which are not readily identifiable to a specific fund are allocated taking into consideration, among other things, the nature and type of expense and the relative size of the funds.
I Legal Fees - Legal fees and other related expenses incurred as part of negotiations of the terms and requirements of capital infusions, or that are expected to result in the restructuring of or a plan of reorganization for an investment are recorded as realized losses. Ongoing expenditures to protect or enhance an investment are treated as operating expenses.
J Expense Reduction - Investors Bank & Trust Company (IBT) serves as custodian of the Funds. Pursuant to the respective custodian agreements, IBT receives a fee reduced by credits which are determined based on the average daily cash balances each Fund maintains with IBT. All credit balances used to reduce the Funds' custodian fees are reported as a reduction of total expenses on the Statements of Operations.
K Use of Estimates - The preparation of the financial statements in conformity with accounting principles generally accepted in the United States of America requires management to make estimates and assumptions that affect the reported amounts of assets and liabilities at the date of the financial statements and the reported amounts of income and expense during the reporting period. Actual results could differ from those estimates.
L Indemnifications - Under the Trust's organizational documents, its officers and Trustees may be indemnified against certain liabilities and expenses arising out of the performance of their duties to the Funds and shareholders are indemnified against personal liability for obligations of the Trust. Additionally, in the normal course of business, the Funds enter into agreements with service providers that may contain indemnification clauses. The Funds' maximum exposure under these arrangements is unknown as this would involve future claims that may be made against the Funds that have not yet occurred.
M Other - Investment transactions are accounted for on a trade date basis. Realized gains and losses are computed based on the specific identification of the securities sold.
N Interim Financial Statements - The interim financial statements relating to January 31, 2005 and for the six months then ended have not been audited by an independent registered public accounting firm, but in the opinion of the Funds' management reflects all adjustments, consisting only of normal recurring adjustments, necessary for the fair presentation of the financial statements.
2 Distributions to Shareholders
The net income of each Fund is determined daily and substantially all of the net income so determined is declared as a dividend to shareholders of record at the time of declaration. Distributions are declared separately for each class of shares. Distributions are paid monthly. Distributions of realized capital gains, if any, are made at least annually. Shareholders may reinvest income and capital gain distributions in additional shares of the same class of a Fund at the net asset value as of the reinvestment date. Distributions are paid in the form of additional shares of the same class or, at the election of the shareholder, in cash. The Funds distinguish between distributions on a tax basis and a financial reporting basis. Accounting principles generally accepted in the United States of America require that only distributions in excess of tax basis earnings and profits be reported in the finan cial statements as a return of capital. Permanent differences between book and tax accounting relating to distributions are reclassified to paid-in capital.
3 Shares of Beneficial Interest
The Funds' Declaration of Trust permits the Trustees to issue an unlimited number of full and fractional shares of beneficial interest (without par value). Such shares may be issued in a number of different series (such as the Funds) and classes. Transactions in Fund shares were as follows:
| | | Arizona Fund | |
| Class A | | Six Months Ended
January 31, 2005
(Unaudited) | | Year Ended
July 31, 2004 | |
| Sales | | | 303,351 | | | | 2,733,332 | | |
Issued to shareholders electing to
receive payments of distributions
in Fund shares | | | 62,597 | | | | 58,866 | | |
| Redemptions | | | (531,363 | ) | | | (468,430 | ) | |
| Exchange from Class B shares | | | 72,866 | | | | 1,682,315 | | |
| Net increase (decrease) | | | (92,549 | ) | | | 4,006,083 | | |
63
Eaton Vance Municipals Funds as of January 31, 2005
NOTES TO FINANCIAL STATEMENTS (Unaudited) CONT'D
| | | Arizona Fund | |
| Class B | | Six Months Ended
January 31, 2005
(Unaudited) | | Year Ended
July 31, 2004 | |
| Sales | | | 45,599 | | | | 145,924 | | |
Issued to shareholders electing to
receive payments of distributions
in Fund shares | | | 17,666 | | | | 92,652 | | |
| Redemptions | | | (156,724 | ) | | | (2,487,952 | ) | |
| Exchange to Class A shares | | | (65,487 | ) | | | (1,530,200 | ) | |
| Net decrease | | | (158,946 | ) | | | (3,779,576 | ) | |
| | | Colorado Fund | |
| Class A | | Six Months Ended
January 31, 2005
(Unaudited) | | Year Ended
July 31, 2004 | |
| Sales | | | 98,011 | | | | 555,441 | | |
Issued to shareholders electing to
receive payments of distributions
in Fund shares | | | 32,659 | | | | 41,316 | | |
| Redemptions | | | (132,674 | ) | | | (386,904 | ) | |
| Exchange from Class B shares | | | 33,683 | | | | 925,644 | | |
| Net increase | | | 31,679 | | | | 1,135,497 | | |
| | | Colorado Fund | |
| Class B | | Six Months Ended
January 31, 2005
(Unaudited) | | Year Ended
July 31, 2004 | |
| Sales | | | 10,041 | | | | 157,284 | | |
Issued to shareholders electing to
receive payments of distributions
in Fund shares | | | 11,718 | | | | 44,100 | | |
| Redemptions | | | (49,196 | ) | | | (1,084,505 | ) | |
| Exchange to Class A shares | | | (30,936 | ) | | | (849,990 | ) | |
| Net decrease | | | (58,373 | ) | | | (1,733,111 | ) | |
| | | Connecticut Fund | |
| Class A | | Six Months Ended
January 31, 2005
(Unaudited) | | Year Ended
July 31, 2004 | |
| Sales | | | 675,062 | | | | 2,227,450 | | |
Issued to shareholders electing to
receive payments of distributions
in Fund shares | | | 119,132 | | | | 121,644 | | |
| Redemptions | | | (542,301 | ) | | | (1,383,098 | ) | |
| Exchange from Class B shares | | | 137,380 | | | | 5,743,654 | | |
| Net increase | | | 389,273 | | | | 6,709,650 | | |
| | | Connecticut Fund | |
| Class B | | Six Months Ended
January 31, 2005
(Unaudited) | | Year Ended
July 31, 2004 | |
| Sales | | | 73,068 | | | | 200,639 | | |
Issued to shareholders electing to
receive payments of distributions
in Fund shares | | | 37,428 | | | | 183,313 | | |
| Redemptions | | | (233,049 | ) | | | (2,861,054 | ) | |
| Exchange to Class A shares | | | (137,954 | ) | | | (5,769,498 | ) | |
| Net decrease | | | (260,507 | ) | | | (8,246,600 | ) | |
| | | Michigan Fund | |
| Class A | | Six Months Ended
January 31, 2005
(Unaudited) | | Year Ended
July 31, 2004 | |
| Sales | | | 161,281 | | | | 2,037,124 | | |
Issued to shareholders electing to
receive payments of distributions
in Fund shares | | | 76,364 | | | | 59,130 | | |
| Redemptions | | | (330,585 | ) | | | (408,206 | ) | |
| Exchange from Class B shares | | | 60,856 | | | | 3,611,969 | | |
| Net increase (decrease) | | | (32,084 | ) | | | 5,300,017 | | |
| | | Michigan Fund | |
| Class B | | Six Months Ended
January 31, 2005
(Unaudited) | | Year Ended
July 31, 2004 | |
| Sales | | | 6,357 | | | | 122,371 | | |
Issued to shareholders electing to
receive payments of distributions
in Fund shares | | | 10,155 | | | | 104,496 | | |
| Redemptions | | | (135,870 | ) | | | (2,282,823 | ) | |
| Exchange to Class A shares | | | (54,484 | ) | | | (3,234,210 | ) | |
| Net decrease | | | (173,842 | ) | | | (5,290,166 | ) | |
| | | Minnesota Fund | |
| Class A | | Six Months Ended
January 31, 2005
(Unaudited) | | Year Ended
July 31, 2004 | |
| Sales | | | 38,501 | | | | 1,133,734 | | |
Issued to shareholders electing to
receive payments of distributions
in Fund shares | | | 47,314 | | | | 51,053 | | |
| Redemptions | | | (196,318 | ) | | | (436,749 | ) | |
| Exchange from Class B shares | | | 30,847 | | | | 1,489,150 | | |
| Net increase (decrease) | | | (79,656 | ) | | | 2,237,188 | | |
64
Eaton Vance Municipals Funds as of January 31, 2005
NOTES TO FINANCIAL STATEMENTS (Unaudited) CONT'D
| | | Minnesota Fund | |
| Class B | | Six Months Ended
January 31, 2005
(Unaudited) | | Year Ended
July 31, 2004 | |
| Sales | | | 24,035 | | | | 154,579 | | |
Issued to shareholders electing to
receive payments of distributions
in Fund shares | | | 16,958 | | | | 89,614 | | |
| Redemptions | | | (86,026 | ) | | | (1,528,068 | ) | |
| Exchange to Class A shares | | | (28,664 | ) | | | (1,383,082 | ) | |
| Net decrease | | | (73,697 | ) | | | (2,666,957 | ) | |
| | | New Jersey Fund | |
| Class A | | Six Months Ended
January 31, 2005
(Unaudited) | | Year Ended
July 31, 2004 | |
| Sales | | | 631,506 | | | | 5,723,600 | | |
Issued to shareholders electing to
receive payments of distributions
in Fund shares | | | 240,930 | | | | 220,938 | | |
| Redemptions | | | (831,127 | ) | | | (1,745,009 | ) | |
| Exchange from Class B shares | | | 252,635 | | | | 8,660,337 | | |
| Net increase | | | 293,944 | | | | 12,859,866 | | |
| | | New Jersey Fund | |
| Class B | | Six Months Ended
January 31, 2005
(Unaudited) | | Year Ended
July 31, 2004 | |
| Sales | | | 380,705 | | | | 652,645 | | |
Issued to shareholders electing to
receive payments of distributions
in Fund shares | | | 91,722 | | | | 468,294 | | |
| Redemptions | | | (531,516 | ) | | | (7,151,002 | ) | |
| Exchange to Class A shares | | | (241,985 | ) | | | (8,291,619 | ) | |
| Net decrease | | | (301,074 | ) | | | (14,321,682 | ) | |
| | | Pennsylvania Fund | |
| Class A | | Six Months Ended
January 31, 2005
(Unaudited) | | Year Ended
July 31, 2004 | |
| Sales | | | 897,067 | | | | 5,365,005 | | |
Issued to shareholders electing to
receive payments of distributions
in Fund shares | | | 243,107 | | | | 193,952 | | |
| Redemptions | | | (803,135 | ) | | | (1,306,201 | ) | |
| Exchange from Class B shares | | | 166,500 | | | | 10,061,875 | | |
| Net increase | | | 503,539 | | | | 14,314,631 | | |
| | | Pennsylvania Fund | |
| Class B | | Six Months Ended
January 31, 2005
(Unaudited) | | Year Ended
July 31, 2004 | |
| Sales | | | 211,798 | | | | 564,034 | | |
Issued to shareholders electing to
receive payments of distributions
in Fund shares | | | 56,812 | | | | 360,250 | | |
| Redemptions | | | (339,355 | ) | | | (6,419,960 | ) | |
| Exchange to Class A shares | | | (161,025 | ) | | | (9,723,604 | ) | |
| Net decrease | | | (231,770 | ) | | | (15,219,280 | ) | |
4 Investment Adviser Fee and Other Transactions with Affiliates
The investment adviser fee is earned by Boston Management and Research (BMR), a wholly-owned subsidiary of Eaton Vance Management (EVM), as compensation for management and investment advisory services rendered to each Fund. The fee is based upon a percentage of average daily net assets plus a percentage of gross income (i.e., income other than gains from the sale of securities). For the period from August 1, 2004 to September 17, 2004, the advisory fee allocated from each Portfolio is as follows:
| Portfolio | | Amount | | Effective Rate* | |
| Arizona | | $ | 28,992 | | | | 0.33 | % | |
| Colorado | | | 8,234 | | | | 0.21 | % | |
| Connecticut | | | 67,401 | | | | 0.38 | % | |
| Michigan | | | 27,948 | | | | 0.32 | % | |
| Minnesota | | | 14,902 | | | | 0.25 | % | |
| New Jersey | | | 135,382 | | | | 0.42 | % | |
| Pennsylvania | | | 119,209 | | | | 0.43 | % | |
For the period from September 18, 2004 to January 31, 2005, each Fund paid advisory fees as follows:
| Fund | | Amount | | Effective Rate* | |
| Arizona | | $ | 79,935 | | | | 0.32 | % | |
| Colorado | | | 22,943 | | | | 0.20 | % | |
| Connecticut | | | 193,759 | | | | 0.38 | % | |
| Michigan | | | 77,036 | | | | 0.32 | % | |
| Minnesota | | | 41,253 | | | | 0.25 | % | |
| New Jersey | | | 384,607 | | | | 0.42 | % | |
| Pennsylvania | | | 340,276 | | | | 0.43 | % | |
* As a percentage of average daily net assets (annualized).
65
Eaton Vance Municipals Funds as of January 31, 2005
NOTES TO FINANCIAL STATEMENTS (Unaudited) CONT'D
Except as to Trustees of the Funds who are not members of EVM's or BMR's organization, officers and Trustees receive remuneration for their services to the Funds out of such investment adviser fee. EVM serves as the Administrator of each Fund, but receives no compensation. EVM serves as the sub-transfer agent of each Fund and receives from the transfer agent an aggregate fee based upon the actual expenses incurred by EVM in the performance of these services. For the six months ended January 31, 2005, EVM earned $1,222, $632, $3,172, $1,837, $1,227, $5,358, and $6,235 in sub-transfer agent fees from Arizona Fund, Colorado Fund, Connecticut Fund, Michigan Fund, Minnesota Fund, New Jersey Fund and Pennsylvania Fund, respectively. The Funds were informed that Eaton Vance Distributors, Inc. (EVD), a subsidiary of EVM and the Funds' principal underwriter, received $5,264, $812, $2,650, $1,701, $5 60, $7,234 and $9,638 as its portion of the sales charge on sales of Class A shares from the Arizona Fund, Colorado Fund, Connecticut Fund, Michigan Fund, Minnesota Fund, New Jersey Fund and Pennsylvania Fund, respectively, for the six months ended January 31, 2005.
Trustees of the Funds who are not affiliated with the Investment Adviser may elect to defer receipt of all or a percentage of their annual fees in accordance with the terms of the Trustees Deferred Compensation Plan. For the six months ended January 31, 2005, no significant amounts have been deferred.
Certain officers and Trustees of the Funds are officers of the above organizations.
5 Distribution and Service Plans
Each Fund has in effect a distribution plan for Class B (Class B Plan) pursuant to Rule 12b-1 under the Investment Company Act of 1940 and a service plan for Class A (Class A Plan) (collectively, the Plans). The Class B Plan requires each Fund to pay EVD amounts equal to 1/365 of 0.75% of each Fund's daily net assets attributable to Class B shares, for providing ongoing distribution services and facilities to the respective Fund. Each Fund will automatically discontinue payments to EVD during any period in which there are no outstanding Uncovered Distribution Charges, which are equivalent to the sum of (i) 5% of the aggregate amount received by the Fund for Class B shares sold plus (ii) interest calculated by applying the rate of 1% over the prevailing prime rate to the outstanding balance of Uncovered Distribution Charges of EVD reduced by the a ggregate amount of contingent deferred sales charges (see Note 6) and daily amounts theretofore paid to EVD. The amount payable to EVD with respect to each day is accrued on such day as a liability of each Fund's Class B shares and, accordingly, reduces each Fund's net assets. For the six months ended January 31, 2005, the Class B shares of the Arizona Fund, Colorado Fund, Connecticut Fund, Michigan Fund, Minnesota Fund, New Jersey Fund and Pennsylvania Fund paid or accrued $71,312, $39,440, $133,693, $39,506, $56,679, $295,260 and $194,777, respectively, to EVD, representing 0.75% of each Fund's Class B average daily net assets. At January 31, 2005, the amount of Uncovered Distribution Charges of EVD calculated under the Class B Plans for Arizona Fund, Colorado Fund, Connecticut Fund, Michigan Fund, Minnesota Fund, New Jersey Fund and Pennsylvania Fund were approximately $1 ,017,000, $875,000, $1,385,000, $97,000, $763,000, $1,007,000 and $1,808,000, respectively.
The Plans authorize each Fund to make payments of service fees to EVD, investment dealers and other persons in amounts equal to 0.20% of each Fund's average daily net assets attributable to Class A and Class B shares for each fiscal year. Service fee payments will be made for personal services and/or the maintenance of shareholder accounts. Service fees are separate and distinct from the sales commissions and distribution fees payable by each Fund to EVD, and as such are not subject to automatic discontinuance when there are no outstanding Uncovered Distribution Charges of EVD. For the six months ended January 31, 2005, Arizona Fund, Colorado Fund, Connecticut Fund, Michigan Fund, Minnesota Fund, New Jersey Fund and Pennsylvania Fund paid or accrued service fees to or payable to EVD in the amount of $48,052, $19,937, $100,441, $55,314, $29,510, $167,271 and $163,103, respecti vely, for Class A shares, and $19,016, $10,517, $35,652, $10,535, $15,114, $78,736 and $51,941, respectively, for Class B shares.
6 Contingent Deferred Sales Charge
A contingent deferred sales charge (CDSC) generally is imposed on redemptions of Class B shares made within six years of purchase. Class A shares may be subject to a 1% CDSC if redeemed within 18 months of purchase (depending on the circumstances of purchase). Generally, the CDSC is based upon the lower of the net asset value at date of redemption or date of purchase. No charge is levied on shares acquired by reinvestment of dividends or capital gains distributions. The Class B CDSC is imposed at declining rates that begin at 5% in the case of redemptions in the first and second year after purchase, declining one percentage point each subsequent year. No CDSC is levied on shares which have been sold to EVD or its affiliates or to their respective employees or clients and may be waived under certain other limited conditions. CDSC received on Class B redemptions are paid t o EVD to reduce the amount
66
Eaton Vance Municipals Funds as of January 31, 2005
NOTES TO FINANCIAL STATEMENTS (Unaudited) CONT'D
of Uncovered Distribution Charges calculated under each Fund's Class B Distribution Plan (see Note 5). CDSC received on Class B redemptions when no Uncovered Distribution Charges exist will be credited to each Fund. EVD received approximately $0, $0, $0, $0, $0, $2,000 and $4 of CDSC paid by Class A shareholders of Arizona Fund, Colorado Fund, Connecticut Fund, Michigan Fund, Minnesota Fund, New Jersey Fund and Pennsylvania Fund, respectively, for the six months ended January 31, 2005. EVD received approximately $32,000, $9,000, $40,000, $19,000, $11,000, $56,000 and $62,000 of CDSC paid by Class B shareholders of Arizona Fund, Colorado Fund, Connecticut Fund, Michigan Fund, Minnesota Fund, New Jersey Fund and Pennsylvania Fund, respectively, for the six months ended January 31, 2005.
7 Investments
Purchases and sales of investments by the Portfolio, other than U.S. Government securities, purchased options and short-term obligations, for the period from August 1, 2004 to September 17, 2004 were as follows:
| Arizona Portfolio | | | | | |
| Purchases | | $ | - | | |
| Sales | | | 1,136,442 | | |
| Colorado Portfolio | | | | | |
| Purchases | | $ | 1,024,030 | | |
| Sales | | | 1,565,407 | | |
| Connecticut Portfolio | | | | | |
| Purchases | | $ | 2,038,780 | | |
| Sales | | | 3,775,935 | | |
| Michigan Portfolio | | | | | |
| Purchases | | $ | 1,232,812 | | |
| Sales | | | 3,731,116 | | |
| Minnesota Portfolio | | | | | |
| Purchases | | $ | 2,572,885 | | |
| Sales | | | 3,383,615 | | |
| New Jersey Portfolio | | | | | |
| Purchases | | $ | - | | |
| Sales | | | 3,711,250 | | |
| Pennsylvania Portfolio | | | | | |
| Purchases | | $ | 1,669,930 | | |
| Sales | | | 3,845,660 | | |
Purchases and sales of investments by the Fund, other than U.S. Government securities, purchased options and short-term obligations, for the period from September 18, 2004 to January 31, 2005 were as follows:
| Arizona Fund | | | | | |
| Purchases | | $ | 4,717,861 | | |
| Sales | | | 7,194,385 | | |
| Colorado Fund | | | | | |
| Purchases | | $ | 2,367,598 | | |
| Sales | | | 2,225,325 | | |
| Connecticut Fund | | | | | |
| Purchases | | $ | 8,463,570 | | |
| Sales | | | 6,381,157 | | |
| Michigan Fund | | | | | |
| Purchases | | $ | 4,317,732 | | |
| Sales | | | 6,008,797 | | |
| Minnesota Fund | | | | | |
| Purchases | | $ | 549,744 | | |
| Sales | | | 1,389,223 | | |
| New Jersey Fund | | | | | |
| Purchases | | $ | 40,575,274 | | |
| Sales | | | 42,439,074 | | |
| Pennsylvania Fund | | | | | |
| Purchases | | $ | 16,929,468 | | |
| Sales | | | 18,287,012 | | |
67
Eaton Vance Municipals Funds as of January 31, 2005
NOTES TO FINANCIAL STATEMENTS (Unaudited) CONT'D
8 Federal Income Tax Basis of Unrealized Appreciation (Depreciation)
The cost and unrealized appreciation (depreciation) in value of the investments owned at January 31, 2005, as computed on a federal income tax basis, are as follows:
| Arizona Fund | | | | | |
| Aggregate Cost | | $ | 58,471,045 | | |
| Gross unrealized appreciation | | $ | 7,027,630 | | |
| Gross unrealized depreciation | | | (844,372 | ) | |
| Net unrealized appreciation | | $ | 6,183,258 | | |
| Colorado Fund | | | | | |
| Aggregate Cost | | $ | 28,227,112 | | |
| Gross unrealized appreciation | | $ | 2,381,972 | | |
| Gross unrealized depreciation | | | (208,039 | ) | |
| Net unrealized appreciation | | $ | 2,173,933 | | |
| Connecticut Fund | | | | | |
| Aggregate Cost | | $ | 124,972,369 | | |
| Gross unrealized appreciation | | $ | 10,768,213 | | |
| Gross unrealized depreciation | | | (13,970 | ) | |
| Net unrealized appreciation | | $ | 10,754,243 | | |
| Michigan Fund | | | | | |
| Aggregate Cost | | $ | 56,620,840 | | |
| Gross unrealized appreciation | | $ | 7,122,677 | | |
| Gross unrealized depreciation | | | - | | |
| Net unrealized appreciation | | $ | 7,122,677 | | |
| Minnesota Fund | | | | | |
| Aggregate Cost | | $ | 40,782,808 | | |
| Gross unrealized appreciation | | $ | 3,611,233 | | |
| Gross unrealized depreciation | | | (427,046 | ) | |
| Net unrealized appreciation | | $ | 3,184,187 | | |
| New Jersey Fund | | | | | |
| Aggregate Cost | | $ | 221,868,189 | | |
| Gross unrealized appreciation | | $ | 28,330,982 | | |
| Gross unrealized depreciation | | | (3,094,318 | ) | |
| Net unrealized appreciation | | $ | 25,236,664 | | |
| Pennsylvania Fund | | | | | |
| Aggregate Cost | | $ | 197,569,260 | | |
| Gross unrealized appreciation | | $ | 17,720,838 | | |
| Gross unrealized depreciation | | | (870,249 | ) | |
| Net unrealized appreciation | | $ | 16,850,589 | | |
9 Line of Credit
The Funds participate with other portfolios and funds managed by BMR and EVM and their affiliates in a $150 million unsecured line of credit agreement with a group of banks. The Funds may temporarily borrow from the line of credit to satisfy redemption requests or settle investment transactions. Interest is charged to each portfolio or fund based on its borrowings at an amount above either the Eurodollar rate or Federal Funds rate. In addition, a fee computed at an annual rate of 0.10% on the daily unused portion of the line of credit is allocated among the participating portfolios and funds at the end of each quarter. At January 31, 2005, the Colorado Fund, the Connecticut Fund, the Minnesota Fund, and the New Jersey Fund had a balance outstanding pursuant to this line of credit of $100,000, $200,000, $100,000, and $1,600,000 respectively. The Funds did not have any significant borrow ings or allocated fees during the six months ended January 31, 2005.
10 Overdraft Advances
Pursuant to the custodian agreement between the Funds and IBT, IBT may, in its discretion, advance funds to the Funds to make properly authorized payments. When such payments result in an overdraft by the Funds, the Funds are obligated to repay IBT at the current rate of interest charged by IBT for secured loans (currently, a rate above the federal funds rate). This obligation is payable on demand to IBT. IBT has lien on the Fund's assets to the extent of any overdraft. At January 31, 2005, the Colorado Fund's, Connecticut Fund's, Minnesota Fund's, and New Jersey Fund's payment due to IBT pursuant to the foregoing arrangement was $25,634, $69,070, $4,014 and $85,666, respectively.
68
Eaton Vance Municipals Funds as of January 31, 2005
NOTES TO FINANCIAL STATEMENTS (Unaudited) CONT'D
11 Financial Instruments
The Funds regularly trade in financial instruments with off-balance sheet risk in the normal course of their investing activities to assist in managing exposure to various market risks. These financial instruments include futures contracts, options on financial futures contracts and interest rate swaps and may involve, to a varying degree, elements of risk in excess of the amounts recognized for financial statement purposes. The notional or contractual amounts of these instruments represent the investment a Fund has in particular classes of financial instruments and does not necessarily represent the amounts potentially subject to risk. The measurement of the risks associated with these instruments is meaningful only when all related and offsetting transactions are considered.
A summary of obligations under these financial instruments at January 31, 2005 is as follows:
Futures Contracts
| Fund | | Expiration
Date | | Contracts | | Position | | Aggregate
Cost | | Value | | Net Unrealized
Depreciation | |
| Arizona | | 03/05
03/05 | | 103 U.S. Treasury Bond
29 U.S. Treasury Note | | Short
Short | | $(11,348,874)
(3,212,986) | | $(11,828,906)
(3,255,703) | | $(480,032)
(42,717) | |
| Colorado | | 03/05 | | 71 U.S. Treasury Bond | | Short | | $ | (7,937,216 | ) | | $ | (8,153,906 | ) | | $ | (216,690 | ) | |
| Connecticut | | 03/05
03/05 | | 218 U.S. Treasury Bond
28 U.S. Treasury Note | | Short
Short | | $(24,180,882)
(3,127,570) | | $(25,035,938)
(3,143,438) | | $(855,056)
(15,868) | |
| Michigan | | 03/05
03/05 | | 116 U.S. Treasury Bond
15 U.S. Treasury Note | | Short
Short | | $(12,905,581)
(1,675,483) | | $(13,321,875)
(1,683,984) | | $(416,294)
(8,501) | |
| Minnesota | | 03/05
03/05 | | 57 U.S. Treasury Bond
15 U.S. Treasury Note | | Short
Short | | $(6,280,570)
(1,661,889) | | $(6,546,094)
(1,683,984) | | $(265,524)
(22,095) | |
| New Jersey | | 03/05
03/05 | | 450 U.S. Treasury Bond
275 U.S. Treasury Note | | Short
Short | | $(49,582,462)
(30,437,894) | | $(51,679,687)
(30,873,048) | | $(2,097,225)
(435,154) | |
| Pennsylvania | | 03/05 | | 415 U.S. Treasury Bond | | Short | | $ | (45,797,377 | ) | | $ | (47,660,156 | ) | | $ | (1,862,779 | ) | |
At January 31, 2005, the Funds had sufficient cash and/or securities to cover margin requirements on open futures contracts.
69
Eaton Vance Municipals Funds
INVESTMENT MANAGEMENT
Eaton Vance Municipals Funds
Officers
Thomas J. Fetter
President
William H. Ahern, Jr.
Vice President and Portfolio
Manager of Colorado,
Connecticut and Michigan
Municipals Funds
Craig R. Brandon
Vice President and Portfolio
Manager of Minnesota
Municipals Fund
Cynthia J. Clemson
Vice President and Portfolio
Manager of Arizona and
Pennsyl vania Municipals Funds
James B. Hawkes
Vice President and Trustee
Robert B. MacIntosh
Vice President and Portfolio
Manager of New Jersey Municipals Fund
Thomas M. Metzold
Vice President
James L. O'Connor
Treasurer
Alan R. Dynner
Secretary
Paul M. O'Neil
Chief Compliance Officer | | Trustees
Samuel L. Hayes, III
William H. Park
Ronald A. Pearlman
Norton H. Reamer
Lynn A. Stout | |
|
70
Investment Adviser
Boston Management and Research
The Eaton Vance Building
255 State Street
Boston, MA 02109
Administrator of the Funds
Eaton Vance Management
The Eaton Vance Building
255 State Street
Boston, MA 02109
Principal Underwriter
Eaton Vance Distributors, Inc.
The Eaton Vance Building
255 State Street
Boston, MA 02109
Custodian
Investors Bank & Trust Company
200 Clarendon Street
Boston, MA 02116
Transfer Agent
PFPC Inc.
Attn: Eaton Vance Funds
P.O. Box 9653
Providence, RI 02940-9653
(800) 262-1122
Eaton Vance Municipals Trust
The Eaton Vance Building
255 State Street
Boston, MA 02109
This report must be preceded or accompanied by a current prospectus. Before investing, investors should consider carefully the Fund’s investment objective(s), risks, and charges and expenses. The Fund’s current prospectus contains this and other information about the Fund and is available through your financial advisor. Please read the prospectus carefully before you invest or send money. For further information please call 800-225-6265.
Item 2. Code of Ethics
The registrant has adopted a code of ethics applicable to its Principal Executive Officer, Principal Financial Officer and Principal Accounting Officer. The registrant undertakes to provide a copy of such code of ethics to any person upon request, without charge, by calling 1-800-262-1122.
Item 3. Audit Committee Financial Expert
The registrant’s Board has designated William H. Park, Samuel L. Hayes, III and Norton H. Reamer, each an independent trustee, as its audit committee financial experts. Mr. Park is a certified public accountant who is the President and Chief Executive Officer of Prizm Capital Management, LLC (a fixed income investment management firm). Previously, he served as Executive Vice President and Chief Financial Officer of United Asset Management Corporation (“UAM”) (a holding company owning institutional investment management firms). Mr. Hayes is the Jacob H. Schiff Professor of Investment Banking Emeritus of the Harvard University Graduate School of Business Administration. Mr. Reamer is the President, Chief Executive Officer and a Director of Asset Management Finance Corp. (a specialty finance company serving the investment management industry) and is President of Unicorn Corporation (an investment and financial advisory services company). Formerly, Mr. Reamer was Chairman of Hellman, Jordan Management Co., Inc. (an investment management company) and Advisory Director of Berkshire Capital Corporation (an investment banking firm), Chairman of the Board of UAM and Chairman, President and Director of the UAM Funds (mutual funds).
Item 4. Principal Accountant Fees and Services
Not required in this filing
Item 5. Audit Committee of Listed Registrants
Not required in this filing.
Item 6. Schedule of Investments
Please see schedule of investments contained in the Report to Stockholders included under Item 1 of this Form N-CSR.
Item 7. Disclosure of Proxy Voting Policies and Procedures for Closed-End Management Investment Companies
Not required in this filing.
Item 8. Purchases of Equity Securities by Closed-End Management Investment Company and Affiliated Purchasers.
Not required in this filing.
Item 9. Submission of Matters to a Vote of Security Holders.
Effective February 7, 2005, the Governance Committee of the Board of Trustees revised the procedures by which a Fund’s shareholders may recommend nominees to the registrant’s Board of Trustees to add the following (highlighted):
The Governance Committee shall, when identifying candidates for the position of Independent Trustee, consider any such candidate recommended by a shareholder of a Fund if such recommendation contains (i)sufficient background information concerning the candidate, including evidence the candidate is willing to serve as an Independent Trustee if selected for the position; and (ii) is received in a sufficiently timely manner (and in any event no later than the date specified for receipt of shareholder proposals in any applicable proxy statement with respect to a Fund). Shareholders shall be directed to address any such recommendations in writing to the attention of the Governance Committee, c/o the Secretary of the Fund. The Secretary shall retain copies of any shareholder recommendations which meet the foregoing requirements for a period of not more than 12 months following receipt. The Secretary shall have no obligation to acknowledge receipt of any shareholder recommendations.
Item 10. Controls and Procedures
(a) It is the conclusion of the registrant’s principal executive officer and principal financial officer that the effectiveness of the registrant’s current disclosure controls and procedures (such disclosure controls and procedures having been evaluated within 90 days of the date of this filing) provide reasonable assurance that the information required to be disclosed by the registrant has been recorded, processed, summarized and reported within the time period specified in the Commission’s rules and forms and that the information required to be disclosed by the registrant has been accumulated and communicated to the registrant’s principal executive officer and principal financial officer in order to allow timely decisions regarding required disclosure.
(b) There have been no changes in the registrant’s internal controls over financial reporting during the second fiscal quarter of the period covered by this report that has materially affected, or is reasonably likely to materially affect the registrant’s internal control over financial reporting.
Item 11. Exhibits
(a)(1) | Registrant’s Code of Ethics – Not applicable (please see Item 2). |
(a)(2)(i) | Treasurer’s Section 302 certification. |
(a)(2)(ii) | President’s Section 302 certification. |
(b) | Combined Section 906 certification. |
Signatures
Pursuant to the requirements of the Securities Exchange Act of 1934 and the Investment Company Act of 1940, the registrant has duly caused this report to be signed on its behalf by the undersigned, thereunto duly authorized.
Eaton Vance Municipals Trust | | |
| |
| |
By: | /s/ Thomas J. Fetter | | |
| Thomas J. Fetter | |
| President | |
| | |
| | |
Date: | March 22, 2005 | |
| | | | | |
Pursuant to the requirements of the Securities Exchange Act of 1934 and the Investment Company Act of 1940, this report has been signed below by the following persons on behalf of the registrant and in the capacities and on the dates indicated.
By: | /s/ James L. O’Connor | | |
| James L. O’Connor | | |
| Treasurer | | |
| | | |
| | | |
Date: | March 22, 2005 | | |
| | | |
| | | |
By: | /s/ Thomas J. Fetter | | |
| Thomas J. Fetter | |
| President | |
| | |
| | |
Date: | March 22, 2005 | |