Item 1. Reports to Stockholders
UNITED STATES
SECURITIES AND EXCHANGE COMMISSION
Washington, D.C. 20549
FORM N-CSR
CERTIFIED SHAREHOLDER REPORT OF REGISTERED
MANAGEMENT INVESTMENT COMPANIES
Investment Company Act file number | 811-04409 |
|
Eaton Vance Municipals Trust |
(Exact name of registrant as specified in charter) |
|
The Eaton Vance Building, 255 State Street, Boston, Massachusetts | | 02109 |
(Address of principal executive offices) | | (Zip code) |
|
Alan R. Dynner
The Eaton Vance Building, 255 State Street, Boston, Massachusetts 02109 |
(Name and address of agent for service) |
|
Registrant’s telephone number, including area code: | (617) 482-8260 | |
|
Date of fiscal year end: | August 31 | |
|
Date of reporting period: | February 28, 2005 | |
| | | | | | | | |
[EV LOGO] | | | | [GRAPHIC IMAGE] |
| | | | |
| | | | |
| | | | |
Semiannual Report February 28, 2005 | | |
| | | | Alabama |
| | EATON VANCE | | |
[GRAPHIC IMAGE] | | MUNICIPALS | | Arkansas |
| | TRUST | | |
| | | | Georgia |
| | | | |
[GRAPHIC IMAGE] | | | | Kentucky |
| | | | |
| | | | Louisiana |
| | | | |
| | | | Maryland |
| | | | |
| | | | Missouri |
| | | | |
| | | | North Carolina |
| | | | |
| | | | Oregon |
| | | | |
| | | | South Carolina |
| | | | |
| | | | Tennessee |
| | | | |
| | | | Virginia |
IMPORTANT NOTICES REGARDING PRIVACY,
DELIVERY OF SHAREHOLDER DOCUMENTS,
PORTFOLIO HOLDINGS AND PROXY VOTING
Privacy. The Eaton Vance organization is committed to ensuring your financial privacy. Each of the financial institutions identified below has in effect the following policy (“Privacy Policy”) with respect to nonpublic personal information about its customers:
• Only such information received from you, through application forms or otherwise, and information about your Eaton Vance fund transactions will be collected. This may include information such as name, address, social security number, tax status, account balances and transactions.
• None of such information about you (or former customers) will be disclosed to anyone, except as permitted by law (which includes disclosure to employees necessary to service your account). In the normal course of servicing a customer’s account, Eaton Vance may share information with unaffiliated third parties that perform various required services such as transfer agents, custodians and broker/dealers.
• Policies and procedures (including physical, electronic and procedural safeguards) are in place that are designed to protect the confidentiality of such information.
• We reserve the right to change our Privacy Policy at any time upon proper notification to you. Customers may want to review our Policy periodically for changes by accessing the link on our homepage: www.eatonvance.com.
Our pledge of privacy applies to the following entities within the Eaton Vance organization: the Eaton Vance Family of Funds, Eaton Vance Management, Eaton Vance Investment Counsel, Boston Management and Research, and Eaton Vance Distributors, Inc.
In addition, our Privacy Policy only applies to those Eaton Vance customers who are individuals and who have a direct relationship with us. If a customer’s account (i.e. fund shares) is held in the name of a third-party financial adviser/ broker-dealer, it is likely that only such adviser’s privacy policies apply to the customer. This notice supersedes all previously issued privacy disclosures.
For more information about Eaton Vance’s Privacy Policy, please call 1-800-262-1122.
Delivery of Shareholder Documents. The Securities and Exchange Commission permits funds to deliver only one copy of shareholder documents, including prospectuses, proxy statements and shareholder reports, to fund investors with multiple accounts at the same residential or post office box address. This practice is often called “householding” and it helps eliminate duplicate mailings to shareholders.
Eaton Vance, or your financial adviser, may household the mailing of your documents indefinitely unless you instruct Eaton Vance, or your financial adviser, otherwise.
If you would prefer that your Eaton Vance documents not be householded, please contact Eaton Vance at 1-800-262-1122, or contact your financial adviser.
Your instructions that householding not apply to delivery of your Eaton Vance documents will be effective within 30 days of receipt by Eaton Vance or your financial adviser.
Portfolio Holdings. Each Eaton Vance Fund and it’s underlying Portfolio will file a schedule of its portfolio holdings on Form N-Q with the SEC for the first and third quarters of each fiscal year. The Form N-Q will be available on the Eaton Vance website www.eatonvance.com, by calling Eaton Vance at 1-800-262-1122 or in the EDGAR database on the SEC’s website at www.sec.gov. Form N-Q may also be reviewed and copied at the SEC’s public reference room in Washington, D.C. (call 1-800-732-0330 for information on the operation of the public reference room).
Proxy Voting. From time to time, funds are required to vote proxies related to the securities held by the funds. The Eaton Vance Funds or their underlying Portfolios (if applicable) vote proxies according to a set of policies and procedures approved by the Funds’ and Portfolios’ Boards. You may obtain a description of these policies and procedures and information on how the Funds or Portfolios voted proxies relating to Portfolio securities during the 12 month period ended June 30, without charge, upon request, by calling
1-800-262-1122. This description is also available on the SEC’s website at www.sec.gov.
Eaton Vance Municipals Funds as of February 28, 2005
TABLE OF CONTENTS
President’s Letter to Shareholders | 2 |
| |
Market Recap | 3 |
| |
Fund Investment Updates | |
| |
Alabama | 4 |
Arkansas | 6 |
Georgia | 8 |
Kentucky | 10 |
Louisiana | 12 |
Maryland | 14 |
Missouri | 16 |
North Carolina | 18 |
Oregon | 20 |
South Carolina | 22 |
Tennessee | 24 |
Virginia | 26 |
| |
Disclosure of Fund Expenses | 28 |
| |
Financial Statements | 33 |
| |
Investment Management | 112 |
1
LETTER TO SHAREHOLDERS

Thomas J. Fetter
President
The municipal bond market is a center of capital formation for states, municipalities and, in some cases, private economic initiatives. In this edition of our continuing educational series, we will discuss industrial development revenue (IDR) bonds. IDR bonds have long been used as a financing mechanism by local governments to provide assistance to local employers and encourage job retention and creation within their communities.
IDR bonds finance private activities that benefit the public...
IDR bonds are issued by municipal authorities to finance projects and facilities used by private corporations. Historically, IDR bonds have represented a partnership between the private and public sectors – a source of dedicated funding for companies and a source of job creation in projects beneficial to local communities. The “Private-Activities” provision of the Tax Reform Act of 1986 permits issuance of tax-exempt bonds for specific activities, including pollution control; gas and electric service; water distribution; wastewater systems; solid waste disposal; airports and selected transportation projects; and other industrial projects.
The Act also placed a cap on the dollar amount that may be raised for IDR bonds in each state, limiting the amount to $50 per person/per state/per year, with a $150 million maximum. These limitations provide protection against potential abuse and ensure that tax-exempt IDR bonds will indeed be issued for projects that will benefit the public.
IDR bonds finance utility-related projects and other industrial initiatives...
Typically, IDR bond projects provide financing for manufacturing, processing or utility facilities. Historically, about one-half of these bonds have been issued to finance pollution control facilities for manufacturers and electric utilities. As many utilities and manufacturers have been ordered to comply with stricter environmental and fuel standards, pollution control bonds have helped finance the retrofits of existing plants. Other IDR bonds have served as inducements from state and local issuers to locate plants or build new facilities, in the hope that such construction might generate further economic growth for a community.
IDR bonds are secured by corporate revenues – not those of state or local governments...
IDR bond issues are secured by the credit of the underlying corporation. The municipal issuing authority acts solely as a conduit to permit tax-exempt financing. The corporation pledges to make payments sufficient to meet all debt service obligations. Unlike some revenue issues, IDR bonds are backed by revenues of the entire corporation, not solely by those of the project being financed.
Because IDR bonds are backed by corporate revenues and not by the taxing authority of a state or local jurisdiction, they have historically provided coupon premiums above those of general obligations and other more traditional revenue bonds. Bonds may be either collateralized or unsecured. Collateralized bonds have a lien against the company’s assets, which may provide bond holders enhanced bargaining power in the event of a bankruptcy. Unsecured bonds have no such lien.
While providing new opportunities, IDR bonds require rigorous analysis...
While IDR bonds may provide unusual investment opportunities, they also may entail increased risk and, therefore, demand especially intensive analysis. At Eaton Vance, we have credit analysts and resources dedicated to IDR bond research.
IDR bonds represent a key segment of the municipal bond market and should remain an important source of capital formation. In our view, the experience and resources needed to evaluate these issues further demonstrates the value of professional management. We will continue to look for opportunities in this sector of the municipal market.
Fund shares are not insured by the FDIC and are not deposits or other obligations of, or guaranteed by, any depository institution. Shares are subject to investment risks, including possible loss of principal invested.
| Sincerely, |
| |
| 
|
| |
| Thomas J. Fetter |
| President |
| April 6, 2005 |
2
MARKET RECAP
The U.S. economy continued to generate moderate growth during the six months ended February 28, 2005. However, the relentless hikes in gasoline and energy prices were increasingly felt by consumers. Meanwhile, the weak U.S. dollar kept U.S. exports competitive, but raised inflationary concerns and helped push interest rates higher.
The long-depressed manufacturing sector showed signs of life during the period...
The nation’s Gross Domestic Product grew by 3.8% in the fourth quarter of 2004, according to Commerce Department figures, following a 4.0% rise in the third quarter. Manufacturing activity expanded strongly, especially durable goods manufacturing, driven by the production of machine tools, trucks, defense-related products and selected technology products.
Despite higher gas and fuel prices, consumers remained active, although the pace of auto sales weakened somewhat. Travel and tourism activity was strong, benefiting the service and hospitality industries. Housing and residential construction remained robust, while commercial building gained new momentum in selected markets.
The economy enjoyed impressive job growth in late 2004 and early 2005...
The nation’s labor markets strengthened during the period. The pace of hiring picked up in areas that had suffered large technology sector layoffs in recent years. Manufacturing, financial services, business services, trucking, shipping, construction, energy, health care, and media also generated impressive new job creation, while temporary employment agencies witnessed strong demand. As a result of increased job growth, the nation’s unemployment rate fell to 5.2% in February 2005, down from 5.7% a year earlier.
Municipal bond yields equal 95% of Treasury yields
4.48% | | 6.89% |
| | |
30-Year AAA-rated | | Taxable equivalent yield |
General Obligation (GO) Bonds* | | in 35.0% tax bracket |
4.72% | | |
| | |
30-Year Treasury bond | | |
Pricipal and interest payments of Treasury securities are guaranteed by the U.S. government.
*GO yields are a compilation of a representative variety of general obligations and are not necessary representative of the Funds’ yield. Statistics as of February 28, 2005
Past performance is no guarantee of future results.
Source: Bloomberg, LP.
The Federal Reserve continued to raise short-term interest rates in 2005...
The Federal Reserve pushed short-term rates higher, suggesting it will continue to raise rates to keep the economy from growing too quickly and, thereby, reviving inflation. Beginning in June 2004, the Fed increased its Federal Funds rate – a key short-term interest rate barometer – on seven occasions, raising that benchmark from 1.00% to 2.75%, including its most recent rate hike in March 2005.
The municipal bond market managed a respectable gain for the six months, outperforming the Treasury market. For the six months ended February 28, 2005, the Lehman Brothers Municipal Bond Index had a total return of 2.40%.*
* It is not possible to invest directly in an Index. The Index’s total return does not reflect expenses that would have been incurred if an investor individually purchased or sold the securities represented in the Index.
The views expressed throughout this report are those of the portfolio managers and are current only through the end of the period of the report as stated on the cover. These views are subject to change at any time based upon market or other conditions, and the investment adviser disclaims any responsibility to update such views. These views may not be relied on as investment advice and, because investment decisions for a fund are based on many factors, may not be relied on as an indication of trading intent on behalf of any Eaton Vance fund.
3
Eaton Vance Alabama Municipals fund as of february 28, 2005
INVESTMENT UPDATE
The Fund
Performance for the Past Six Months
• The Fund’s Class A shares had a total return of 2.79% during the six months ended February 28, 2005.(1) This return was the result of an increase in net asset value (NAV) to $9.85 per share on February 28, 2005 from $9.80 on August 31, 2004, and the reinvestment of $0.221 in dividends.(2)
• The Fund’s Class B shares had a total return of 2.61% during the six months ended February 28, 2005.(1) This return was the result of an increase in NAV to $10.83 per share on February 28, 2005 from $10.77 on August 31, 2004, and the reinvestment of $0.219 in dividends.(2)
• For comparison, the Lehman Municipal Bond Index had a total return of 2.40% for the six months ended February 28, 2005.(3)
• Based on the Fund’s most recent dividends and NAVs on February 28, 2005 of $9.85 per share for Class A and $10.83 for Class B, the Fund’s distribution rates were 4.30% and 3.55%, respectively.(4) The distribution rates of Class A and Class B are equivalent to taxable rates of 6.96% and 5.75%, respectively.(5)
• The SEC 30-day yields for Class A and Class B shares at February 28, 2005 were 3.45% and 2.87%, respectively.(6) The SEC 30-day yields of Class A and Class B are equivalent to taxable yields of 5.59% and 4.65%, respectively.(5)

William H. Ahern
Portfolio Manager
Management Discussion
• Alabama experienced moderate economic growth in late 2004, although job growth remained sluggish. The exodus of apparel, textile, and paper production continued, although auto production benefited from direct investment by foreign manufacturers. The state’s jobless rate was 5.2% in February 2005, down from 5.6% a year ago.
• Insured* water and sewer bonds remained the Fund’s largest sector weighting at February 28, 2005. Alabama communities have increased the level of capital investment in recent years. Having suffered from drought in recent years, some communities have initiated programs aimed at watershed protection and drought-resistant facilities.
• In the Alabama hospital sector, the Fund remained very selective. Management focused on insured* bonds of hospitals it believes have a sound financial profile, as well as a competitive advantage due to in-demand health care services, such as rehabilitation, cancer care and children’s health services.
• Insured* general obligations (GOs) remained a significant investment. The Fund’s investments focused on cities and towns with a relatively strong tax base and sound economic underpinning, two key determinants for investors in general obligations.
• Management adjusted the Fund’s coupon mix to reflect changing market conditions. Management also continued its efforts to upgrade the Fund’s call protection. The Fund sold bonds with approaching call dates in favor of high quality, non-callable bonds and bonds with more attractive call characteristics.
* Private insurance does not decrease the risk of loss of principal associated with this investment.
Past performance is no guarantee of future results. Returns are historical and are calculated by determining the percentage change in net asset value or offering price (as applicable) with all distributions reinvested. Investment return and principal value will fluctuate so that shares, when redeemed, may be worth more or less than their original cost. Performance is for the stated time period only; due to market volatility, the Fund’s current performance may be lower or higher than the quoted return. For performance as of the most recent month end, please refer to www.eatonvance.com.
(1) These returns do not include the 4.75% maximum sales charge for the Fund’s Class A shares or the applicable contingent deferred sales charges (CDSC) for Class B shares. If the sales charge were deducted, returns would be lower.
(2) A portion of the Fund’s income may be subject to federal income and/or alternative minimum tax and state and local taxes.
(3) It is not possible to invest directly in an Index. The Index’s total return does not reflect the expenses that would have been incurred if an investor individually purchased or sold the securities represented in the Index.
(4) The Fund’s distribution rate represents actual distributions paid to shareholders and is calculated by dividing the last distribution per share (annualized) by the net asset value.
(5) Taxable-equivalent figures assume a maximum 38.25% combined federal and state income tax rate. A lower rate would result in lower tax-equivalent figures.
(6) The Fund’s SEC yield is calculated by dividing the net investment income per share for the 30-day period by the offering price at the end of the period and annualizing the result.
4
FUND PERFORMANCE
Performance(1) | | Class A | | Class B | |
| | | | | |
Average Annual Total Returns (at net asset value) | | | | | |
One Year | | 1.99 | % | 1.41 | % |
Five Years | | 6.85 | | 6.09 | |
Ten Years | | 5.53 | | 4.87 | |
Life of Fund† | | 4.86 | | 5.24 | |
| | | | | |
SEC Average Annual Total Returns (including sales charge or applicable CDSC) | | | | | |
One Year | | -2.81 | % | -3.47 | % |
Five Years | | 5.82 | | 5.78 | |
Ten Years | | 5.02 | | 4.87 | |
Life of Fund† | | 4.41 | | 5.24 | |
†Inception date: Class A: 12/7/93; Class B: 5/1/92
(1) Average annual total returns do not include the 4.75% maximum sales charge for Class A shares or the applicable contingent deferred sales charges (CDSC) for Class B shares. If sales charges were deducted, returns would be lower. SEC average annual total returns for Class A reflect the maximum 4.75% sales charge. SEC returns for Class B reflect applicable CDSC based on the following schedule: 5% - 1st and 2nd years; 4% - 3rd year; 3% - 4th year; 2% - 5th year; 1% - 6th year.
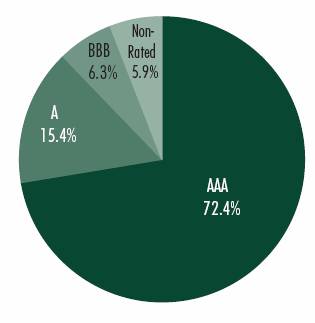
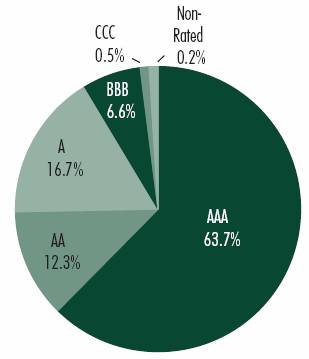
Diversification by Credit Quality(2)
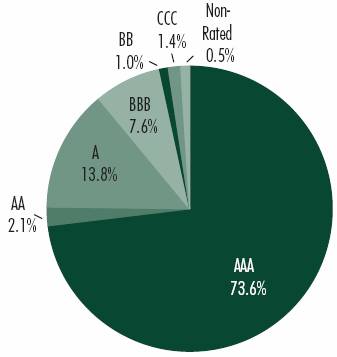
(2) As a percentage of total investments, as of February 28, 2005. Holdings subject to change due to active management.
5
Eaton Vance Arkansas Municipals Fund as of February 28, 2005
INVESTMENT UPDATE
The Fund
Performance for the Past Six Months
• The Fund’s Class A shares had a total return of 2.62% during the six months ended February 28, 2005.(1) This return was the result of an increase in net asset value (NAV) to $9.90 per share on February 28, 2005 from $9.88 on August 31, 2004, and the reinvestment of $0.236 in dividends.(2)
• The Fund’s Class B shares had a total return of 2.48% during the six months ended February 28, 2005.(1) This return was the result of an increase in NAV to $10.64 per share on February 28, 2005 from $10.61 on August 31, 2004, and the reinvestment of $0.231 in dividends.(2)
• For comparison, the Lehman Municipal Bond Index had a total return of 2.40% for the six months ended February 28, 2005.(3)
• Based on the Fund’s most recent dividends and NAVs on February 28, 2005 of $9.90 per share for Class A and $10.64 for Class B, the Fund’s distribution rates were 4.74% and 3.98%, respectively.(4) The distribution rates of Class A and Class B are equivalent to taxable rates of 7.84% and 6.58%, respectively.(5)
• The SEC 30-day yields for Class A and Class B shares at February 28, 2005 were 3.76% and 3.20%, respectively.(6) The SEC 30-day yields of Class A and Class B are equivalent to taxable yields of 6.22% and 5.29%, respectively.(5)
* Private insurance does not decrease the risk of loss of principal associated with this investment.

Thomas M. Metzold
Co-Portfolio Manager
William H. Ahern
Co-Portfolio Manager
Management Discussion
• Arkansas’ economic condition improved in 2004, as the state registered its fastest job growth since 2000. With the exception of the manufacturing sector, all major state employment sectors posted positive year-over-year growth. Leisure, education and health care paced new job creation. The state jobless rate was 5.5% in February 2005, down from 5.7% a year ago.
• Hospital bonds were the Fund’s largest sector weighting at February 28, 2005. The Fund’s investments included uninsured and insured* issues for geographically diverse facilities throughout the state. The Fund’s investments emphasized competitive hospitals with attractive health care specialties and strong underlying finances.
• Industrial development revenue bonds played a prominent role in the Fund, although management remained selective within the sector. The Fund’s investments included paper and airline bonds – areas that, in management’s view, are likely to enjoy stronger demand in sustained economic recovery.
• The Fund maintained a significant exposure to essential services bonds, including insured* water and sewer issues. Because the revenues for these issues are based on fees and water payments, they are considered less subject to economic fluctuations.
• The Fund continued to pursue broad diversification by sector, issuer and coupon distribution. In addition, management extended its efforts to update call protection, a key strategic consideration in a period of relatively low rates.
• Effective May 2, 2005, Thomas M. Metzold will be the Fund’s sole portfolio manager.
Past performance is no guarantee of future results. Returns are historical and are calculated by determining the percentage change in net asset value or offering price (as applicable) with all distributions reinvested. Investment return and principal value will fluctuate so that shares, when redeemed, may be worth more or less than their original cost. Performance is for the stated time period only; due to market volatility, the Fund’s current performance may be lower or higher than the quoted return. For performance as of the most recent month end, please refer to www.eatonvance.com.
(1) These returns do not include the 4.75% maximum sales charge for the Fund’s Class A shares or the applicable contingent deferred sales charges (CDSC) for Class B shares. If the sales charge were deducted, returns would be lower.
(2) A portion of the Fund’s income may be subject to federal income and/or alternative minimum tax and state and local taxes.
(3) It is not possible to invest directly in an Index. The Index’s total return does not reflect the expenses that would have been incurred if an investor individually purchased or sold the securities represented in the Index.
(4) The Fund’s distribution rate represents actual distributions paid to shareholders and is calculated by dividing the last distribution per share (annualized) by the net asset value.
(5) Taxable-equivalent figures assume a maximum 39.55% combined federal and state income tax rate. A lower rate would result in lower tax-equivalent figures.
(6) The Fund’s SEC yield is calculated by dividing the net investment income per share for the 30-day period by the offering price at the end of the period and annualizing the result.
6
FUND PERFORMANCE
Performance(1) | | Class A | | Class B | |
| | | | | |
Average Annual Total Returns (at net asset value) | | | | | |
One Year | | 1.94 | % | 1.32 | % |
Five Years | | 6.68 | | 5.94 | |
Ten Years | | 5.64 | | 4.95 | |
Life of Fund† | | 5.01 | | 5.11 | |
| | | | | |
SEC Average Annual Total Returns (including sales charge or applicable CDSC) | | | | | |
One Year | | -2.91 | % | -3.54 | % |
Five Years | | 5.64 | | 5.62 | |
Ten Years | | 5.12 | | 4.95 | |
Life of Fund† | | 4.55 | | 5.11 | |
†Inception date: Class A: 2/9/94; Class B: 10/2/92
(1) Average annual total returns do not include the 4.75% maximum sales charge for Class A shares or the applicable contingent deferred sales charges (CDSC) for Class B shares. If sales charges were deducted, returns would be lower. SEC average annual total returns for Class A reflect the maximum 4.75% sales charge. SEC returns for Class B reflect applicable CDSC based on the following schedule: 5% - 1st and 2nd years; 4% - 3rd year; 3% - 4th year; 2% - 5th year; 1% - 6th year.
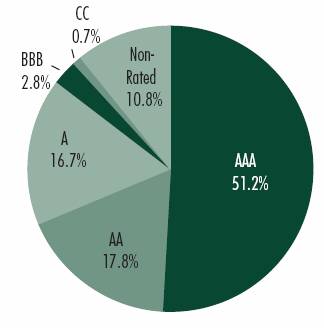
Diversification by Credit Quality(2)
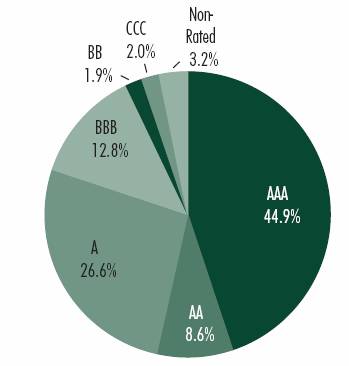
(2) As a percentage of total investments, as of February 28, 2005. Holdings subject to change due to active management.
7
Eaton Vance Georgia Municipals Fund as of February 28, 2005
INVESTMENT UPDATE
The Fund
Performance for the Past Six Months
• The Fund’s Class A shares had a total return of 2.65% during the six months ended February 28, 2005.(1) This return was the result of an increase in net asset value (NAV) to $9.50 per share on February 28, 2005 from $9.48 on August 31, 2004, and the reinvestment of $0.229 in dividends.(2)
• The Fund’s Class B shares had a total return of 2.34% during the six months ended February 28, 2005.(1) This return was the result of an increase in NAV to $10.14 per share on February 28, 2005 from $10.13 on August 31, 2004, and the reinvestment of $0.225 in dividends.(2)
• For comparison, the Lehman Municipal Bond Index had a total return of 2.40% for the six months ended February 28, 2005.(3)
• Based on the Fund’s most recent dividends and NAVs on February 28, 2005 of $9.50 per share for Class A and $10.14 for Class B, the Fund’s distribution rates were 4.80% and 4.04%, respectively.(4) The distribution rates of Class A and Class B are equivalent to taxable rates of 7.86% and 6.61%, respectively.(5)
• The SEC 30-day yields for Class A and Class B shares at February 28, 2005 were 4.02% and 3.47%, respectively.(6) The SEC 30-day yields of Class A and Class B are equivalent to taxable yields of 6.58% and 5.68%, respectively.(5)

Cynthia J. Clemson
Portfolio Manager
Management Discussion
• Georgia’s economy continued to expand during the fiscal year, although lagging the national pace, as the state’s manufacturing industries have seen continuing layoffs. Georgia’s Atlanta-based technology sector generated some gains, although it has not yet recovered to pre-recession levels of 2000. The state’s jobless rate was 5.1% in February 2005, up from 4.3% a year ago.
• Insured* water and sewer bonds were the Fund’s largest sector weighting at February 28, 2005. Revenues for essential services, including water utilities, have historically been less impacted by changes in the overall economy. Georgia’s population growth and surging residential and commercial development have necessitated major improvements in the state’s water infrastructure.
• Industrial development revenue bonds constituted large investments. The Fund’s investments represented economically sensitive companies, as well as defensive industries. Investments included paper manufacturers, consumer products, beverages, airlines and a maker of chemical catalysts used in oil refining.
• Insured* transportation bonds were a major commitment for the Fund. Investments focused predominantly on Atlanta’s rapid transit system. The bonds have helped finance the system’s expansion needed to accommodate the city’s urban sprawl.
• Management continued to update the Fund’s coupon distribution to reflect a changing interest rate outlook. In addition, management continued to upgrade call protection, where possible, to protect against untimely calls and improve the Fund’s appreciation potential.
* Private insurance does not decrease the risk of loss of principal associated with this investment.
Past performance is no guarantee of future results. Returns are historical and are calculated by determining the percentage change in net asset value or offering price (as applicable) with all distributions reinvested. Investment return and principal value will fluctuate so that shares, when redeemed, may be worth more or less than their original cost. Performance is for the stated time period only; due to market volatility, the Fund’s current performance may be lower or higher than the quoted return. For performance as of the most recent month end, please refer to www.eatonvance.com.
(1) These returns do not include the 4.75% maximum sales charge for the Fund’s Class A shares or the applicable contingent deferred sales charges (CDSC) for Class B shares. If the sales charge were deducted, returns would be lower.
(2) A portion of the Fund’s income may be subject to federal income and/or alternative minimum tax and state and local taxes.
(3) It is not possible to invest directly in an Index. The Index’s total return does not reflect the expenses that would have been incurred if an investor individually purchased or sold the securities represented in the Index.
(4) The Fund’s distribution rate represents actual distributions paid to shareholders and is calculated by dividing the last distribution per share (annualized) by the net asset value.
(5) Taxable-equivalent figures assume a maximum 38.90% combined federal and state income tax rate. A lower rate would result in lower tax-equivalent figures.
(6) The Fund’s SEC yield is calculated by dividing the net investment income per share for the 30-day period by the offering price at the end of the period and annualizing the result.
8
FUND PERFORMANCE
Performance(1) | | Class A | | Class B | |
| | | | | |
Average Annual Total Returns (at net asset value) | | | | | |
One Year | | 2.32 | % | 1.58 | % |
Five Years | | 7.32 | | 6.53 | |
Ten Years | | 5.63 | | 4.97 | |
Life of Fund† | | 4.69 | | 4.93 | |
| | | | | |
SEC Average Annual Total Returns (including sales charge or applicable CDSC) | | | | | |
One Year | | -2.57 | % | -3.29 | % |
Five Years | | 6.28 | | 6.22 | |
Ten Years | | 5.13 | | 4.97 | |
Life of Fund† | | 4.24 | | 4.93 | |
†Inception date: Class A: 12/7/93; Class B: 12/23/91
(1) Average annual total returns do not include the 4.75% maximum sales charge for Class A shares or the applicable contingent deferred sales charges (CDSC) for Class B shares. If sales charges were deducted, returns would be lower. SEC average annual total returns for Class A reflect the maximum 4.75% sales charge. SEC returns for Class B reflect applicable CDSC based on the following schedule: 5% - 1st and 2nd years; 4% - 3rd year; 3% - 4th year; 2% - 5th year; 1% - 6th year.
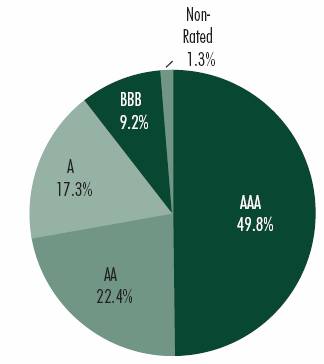
Diversification by Credit Quality(2)
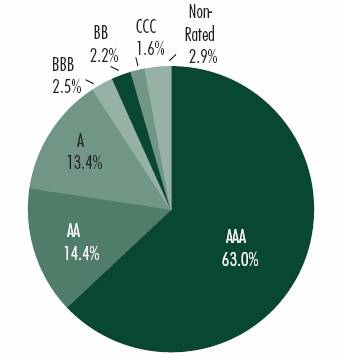
(2) As a percentage of total investments, as of February 28, 2005. Holdings subject to change due to active management.
9
Eaton Vance Kentucky Municipals Fund as of February 28, 2005
INVESTMENT UPDATE
The Fund
Performance for the Past Six Months
• The Fund’s Class A shares had a total return of 2.11% during the six months ended February 28, 2005.(1) This return was the result of a decrease in net asset value (NAV) to $9.30 per share on February 28, 2005 from $9.32 on August 31, 2004, and the reinvestment of $0.215 in dividends.(2)
• The Fund’s Class B shares had a total return of 1.91% during the six months ended February 28, 2005.(1) This return was the result of a decrease in NAV to $10.04 per share on February 28, 2005 from $10.06 on August 31, 2004, and the reinvestment of $0.210 in dividends.(2)
• For comparison, the Lehman Municipal Bond Index had a total return of 2.40% for the six months ended February 28, 2005.(3)
• Based on the Fund’s most recent dividends and NAVs on February 28, 2005 of $9.30 per share for Class A and $10.04 for Class B, the Fund’s distribution rates were 4.59% and 3.83%, respectively.(4) The distribution rates of Class A and Class B are equivalent to taxable rates of 7.51% and 6.27%, respectively.(5)
• The SEC 30-day yields for Class A and Class B shares at February 28, 2005 were 3.23% and 2.64%, respectively.(6) The SEC 30-day yields of Class A and Class B are equivalent to taxable yields of 5.29% and 4.32%, respectively.(5)
William H. Ahern
Portfolio Manager
Management Discussion
• Kentucky’s economy improved significantly in 2004 and early 2005, with employment gains at the fastest pace since the 2001 recession. Most major sectors saw impressive gains during the year. While manufacturing continued to shed jobs, the rate of job loss was markedly lower than that seen during the recession. The state’s jobless rate was 5.2% in February 2005, down from 5.7% a year ago.
• Insured* transportation bonds bonds were the Fund’s largest sector weighting at February 28, 2005. The Fund’s investments included issues for highway, turn-pike and regional airport authorities. With the region’s air passenger and freight traffic doubling in the past decade, these bonds have helped finance a much-needed expansion.
• Industrial development revenue bonds were significant holdings for the Fund. Amid signs of a stronger economy, the Fund’s investments included issues in economically sensitive areas such as the airline, chemical, retailing, energy and metals industries.
• Insured* lease revenue/certificates of participation (COPs) constituted prominent investments. COPs are an alternative financing tool employed by some communities to finance educational facilities and assorted public improvements.
• Management sought to diversify the Fund’s investments according to issuer, sector and insurer and coupon allocation. In addition, management continued to monitor call characteristics. Call features can have a significant influence on the Fund’s ability to respond to changes in interest rates.
* Private insurance does not decrease the risk of loss of principal associated with this investment.
Past performance is no guarantee of future results. Returns are historical and are calculated by determining the percentage change in net asset value or offering price (as applicable) with all distributions reinvested. Investment return and principal value will fluctuate so that shares, when redeemed, may be worth more or less than their original cost. Performance is for the stated time period only; due to market volatility, the Fund’s current performance may be lower or higher than the quoted return. For performance as of the most recent month end, please refer to www.eatonvance.com.
(1) These returns do not include the 4.75% maximum sales charge for the Fund’s Class A shares or the applicable contingent deferred sales charges (CDSC) for Class B shares. If the sales charge were deducted, returns would be lower.
(2) A portion of the Fund’s income may be subject to federal income and/or alternative minimum tax and state and local taxes.
(3) It is not possible to invest directly in an Index. The Index’s total return does not reflect the expenses that would have been incurred if an investor individually purchased or sold the securities represented in the Index.
(4) The Fund’s distribution rate represents actual distributions paid to shareholders and is calculated by dividing the last distribution per share (annualized) by the net asset value.
(5) Taxable-equivalent figures assume a maximum 38.90% combined federal and state income tax rate. A lower rate would result in lower tax-equivalent figures.
(6) The Fund’s SEC yield is calculated by dividing the net investment income per share for the 30-day period by the offering price at the end of the period and annualizing the result.
10
FUND PERFORMANCE
Performance(1) | | Class A | | Class B | |
| | | | | |
Average Annual Total Returns (at net asset value) | | | | | |
One Year | | 1.93 | % | 1.30 | % |
Five Years | | 5.72 | | 4.99 | |
Ten Years | | 5.30 | | 4.64 | |
Life of Fund† | | 4.47 | | 4.78 | |
| | | | | |
SEC Average Annual Total Returns (including sales charge or applicable CDSC) | | | | | |
One Year | | -2.94 | % | -3.57 | % |
Five Years | | 4.69 | | 4.66 | |
Ten Years | | 4.79 | | 4.64 | |
Life of Fund† | | 4.02 | | 4.78 | |
†Inception date: Class A: 12/7/93; Class B: 12/23/91
(1) Average annual total returns do not include the 4.75% maximum sales charge for Class A shares or the applicable contingent deferred sales charges (CDSC) for Class B shares. If sales charges were deducted, returns would be lower. SEC average annual total returns for Class A reflect the maximum 4.75% sales charge. SEC returns for Class B reflect applicable CDSC based on the following schedule: 5% - 1st and 2nd years; 4% - 3rd year; 3% - 4th year; 2% - 5th year; 1% - 6th year.
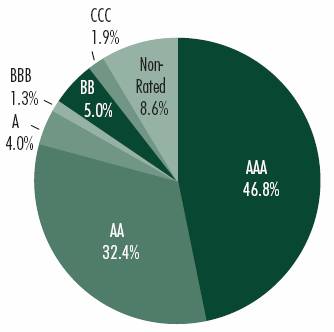
Diversification by Credit Quality(2)
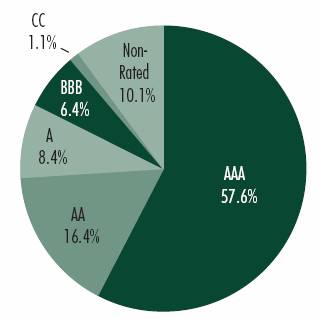
(2) As a percentage of total investments, as of February 28, 2005. Holdings subject to change due to active management.
11
Eaton Vance Louisiana Municipals Fund as of February 28, 2005
INVESTMENT UPDATE
The Fund
Performance for the Past Six Months
• The Fund’s Class A shares had a total return of 3.72% during the six months ended February 28, 2005.(1) This return was the result of an increase in net asset value (NAV) to $9.97 per share on February 28, 2005 from $9.84 on August 31, 2004, and the reinvestment of $0.233 in dividends.(2)
• The Fund’s Class B shares had a total return of 3.54% during the six months ended February 28, 2005.(1) This return was the result of an increase in NAV to $10.54 per share on February 28, 2005 from $10.40 on August 31, 2004, and the reinvestment of $0.225 in dividends.(2)
• For comparison, the Lehman Municipal Bond Index had a total return of 2.40% for the six months ended February 28, 2005.(3) As quality spreads tightened during the period, the Fund’s lower-investment-grade investments fared especially well, which accounted for its outperformance of the Index.
• Based on the Fund’s most recent dividends and NAVs on February 28, 2005 of $9.97 per share for Class A and $10.54 for Class B, the Fund’s distribution rates were 4.65% and 3.91%, respectively.(4) The distribution rates of Class A and Class B are equivalent to taxable rates of 7.61% and 6.40%, respectively.(5)
• The SEC 30-day yields for Class A and Class B shares at February 28, 2005 were 3.97% and 3.41%, respectively.(6) The SEC 30-day yields of Class A and Class B are equivalent to taxable yields of 6.50% and 5.58%, respectively.(5)

Robert B. MacIntosh
Portfolio Manager
Management Discussion
• Louisiana has seen uneven job growth in the past year. The state’s key chemical sector lost ground, as the industry was hurt by high natural gas prices. Education, health care, retail and telecommunications generated meaningful growth. Manufacturing was generally flat, although there was a pick-up in auto and ship building. The state’s jobless rate was 6.0% in February 2005, up from 5.7% a year ago.
• Insured* education bonds were the Fund’s largest sector weighting at February 28, 2005. The education sector has historically tended to be less sensitive to the vagaries of the economy. The Fund’s investments included state and local finance authority bonds that provided financing for the construction of student housing, classroom and lab facilities.
• Insured* general obligations (GOs) represented a large investment for the Fund. With the state’s key energy industry hurt by weather-related shutdowns and the chemical industry hurt by high natural gas prices, insured* state, parish and local GOs provided an attractive measure of revenue stability.
• Insured* special tax revenue bonds constituted a major commitment for the Fund. These issues gave Louisiana communities an alternative financing source for public facilities, with revenue streams generated by gas and fuel taxes and local district sales taxes.
• Management continued to update the Fund’s call protection, when possible, trading bonds with near-term calls for non-callable bonds or issues with longer-dated call provisions.
• From a coupon standpoint, management maintained a well-diversified allocation, balancing defensive, higher-coupon issues with interest-rate-sensitive, low- and zero-coupon issues for appreciation potential.
* Private insurance does not decrease the risk of loss of principal associated with this investment.
Past performance is no guarantee of future results. Returns are historical and are calculated by determining the percentage change in net asset value or offering price (as applicable) with all distributions reinvested. Investment return and principal value will fluctuate so that shares, when redeemed, may be worth more or less than their original cost. Performance is for the stated time period only; due to market volatility, the Fund’s current performance may be lower or higher than the quoted return. For performance as of the most recent month end, please refer to www.eatonvance.com.
(1) These returns do not include the 4.75% maximum sales charge for the Fund’s Class A shares or the applicable contingent deferred sales charges (CDSC) for Class B shares. If the sales charge were deducted, returns would be lower.
(2) A portion of the Fund’s income may be subject to federal income and/or alternative minimum tax and state and local taxes.
(3) It is not possible to invest directly in an Index. The Index’s total return does not reflect the expenses that would have been incurred if an investor individually purchased or sold the securities represented in the Index.
(4) The Fund’s distribution rate represents actual distributions paid to shareholders and is calculated by dividing the last distribution per share (annualized) by the net asset value.
(5) Taxable-equivalent figures assume a maximum 38.90% combined federal and state income tax rate. A lower rate would result in lower tax-equivalent figures.
(6) The Fund’s SEC yield is calculated by dividing the net investment income per share for the 30-day period by the offering price at the end of the period and annualizing the result.
12
FUND PERFORMANCE
Performance(1) | | Class A | | Class B | |
| | | | | |
Average Annual Total Returns (at net asset value) | | | | | |
One Year | | 4.48 | % | 3.87 | % |
Five Years | | 7.65 | | 6.88 | |
Ten Years | | 5.75 | | 5.07 | |
Life of Fund† | | 5.17 | | 5.21 | |
| | | | | |
SEC Average Annual Total Returns (including sales charge or applicable CDSC) | | | | | |
One Year | | -0.49 | % | -1.11 | % |
Five Years | | 6.60 | | 6.57 | |
Ten Years | | 5.24 | | 5.07 | |
Life of Fund† | | 4.70 | | 5.21 | |
†Inception date: Class A: 2/14/94; Class B: 10/2/92
(1) Average annual total returns do not include the 4.75% maximum sales charge for Class A shares or the applicable contingent deferred sales charges (CDSC) for Class B shares. If sales charges were deducted, returns would be lower. SEC average annual total returns for Class A reflect the maximum 4.75% sales charge. SEC returns for Class B reflect applicable CDSC based on the following schedule: 5% - 1st and 2nd years; 4% - 3rd year; 3% - 4th year; 2% - 5th year; 1% - 6th year.
Diversification by Credit Quality(2)
(2) As a percentage of total investments, as of February 28, 2005. Holdings subject to change due to active management.
13
Eaton Vance Maryland Municipals Fund as of February 28, 2005
INVESTMENT UPDATE
The Fund
Performance for the Past Six Months
• The Fund’s Class A shares had a total return of 3.19% during the six months ended February 28, 2005.(1) This return was the result of an increase in net asset value (NAV) to $9.57 per share on February 28, 2005 from $9.49 on August 31, 2004, and the reinvestment of $0.220 in dividends.(2)
• The Fund’s Class B shares had a total return of 3.00% during the six months ended February 28, 2005.(1) This return was the result of an increase in NAV to $10.44 per share on February 28, 2005 from $10.35 on August 31, 2004, and the reinvestment of $0.218 in dividends.(2)
• For comparison, the Lehman Municipal Bond Index had a total return of 2.40% for the six months ended February 28, 2005.(3) As quality spreads tightened during the period, the Fund’s lower-investment-grade investments fared especially well, which accounted for its outperformance of the Index.
• Based on the Fund’s most recent dividends and NAVs on February 28, 2005 of $9.57 per share for Class A and $10.44 for Class B, the Fund’s distribution rates were 4.48% and 3.75%, respectively.(4) The distribution rates of Class A and Class B are equivalent to taxable rates of 7.24% and 6.06%, respectively.(5)
• The SEC 30-day yields for Class A and Class B shares at February 28, 2005 were 4.06% and 3.51%, respectively.(6) The SEC 30-day yields of Class A and Class B are equivalent to taxable yields of 6.56% and 5.67%, respectively.(5)

Craig Brandon
Portfolio Manager
Management Discussion
• Maryland’s job growth outpaced that of the nation during the past year, helped, in part, by increased spending for homeland security. In addition, the region’s key tourism industry has recovered significantly since 2001, boosting the leisure, lodging and services sectors. Maryland’s jobless rate was 4.2% in February 2005, unchanged from a year ago.
• Education bonds were the Fund’s largest sector weighting at February 28, 2005. The education sector has generally been less sensitive to the vagaries of the economy. The Fund’s investments included public and private institutions that have relatively strong applicant demand and stable-to-rising tuition and fee income.
• Insured* and uninsured hospital issues played a major role in the Fund. Management remained very selective, focusing on the more competitive institutions that have sound management, favorable cost structures, good market share and low bed-vacancy rates.
• Insured* water and sewer bonds were large investments. Essential service revenues of water utilities tend to be relatively stable, generally unaffected by changes in the overall economy. The Fund’s investments included bonds for Baltimore’s water and wastewater systems, which include the city’s reservoir watersheds, wastewater treatment facilities and water filtration plants.
• The Fund had significant investments in insured* transportation bonds. Among the Fund’s investments were bonds that helped finance an ongoing $1.8 billion improvement project for Baltimore-Washington airport. Improvements included a terminal expansion, new parking lots, rental car facilities and widened access roads.
* Private insurance does not decrease the risk of loss of principal associated with this investment.
Past performance is no guarantee of future results. Returns are historical and are calculated by determining the percentage change in net asset value or offering price (as applicable) with all distributions reinvested. Investment return and principal value will fluctuate so that shares, when redeemed, may be worth more or less than their original cost. Performance is for the stated time period only; due to market volatility, the Fund’s current performance may be lower or higher than the quoted return. For performance as of the most recent month end, please refer to www.eatonvance.com.
(1) These returns do not include the 4.75% maximum sales charge for the Fund’s Class A shares or the applicable contingent deferred sales charges (CDSC) for Class B shares. If the sales charge were deducted, returns would be lower.
(2) A portion of the Fund’s income may be subject to federal income and/or alternative minimum tax and state and local taxes.
(3) It is not possible to invest directly in an Index. The Index’s total return does not reflect the expenses that would have been incurred if an investor individually purchased or sold the securities represented in the Index.
(4) The Fund’s distribution rate represents actual distributions paid to shareholders and is calculated by dividing the last distribution per share (annualized) by the net asset value.
(5) Taxable-equivalent figures assume a maximum 38.09% combined federal and state income tax rate. A lower rate would result in lower tax-equivalent figures.
(6) The Fund’s SEC yield is calculated by dividing the net investment income per share for the 30-day period by the offering price at the end of the period and annualizing the result.
14
FUND PERFORMANCE
Performance(1) | | Class A | | Class B | |
| | | | | |
Average Annual Total Returns (at net asset value) | | | | | |
One Year | | 2.34 | % | 1.71 | % |
Five Years | | 6.60 | | 5.79 | |
Ten Years | | 5.35 | | 4.67 | |
Life of Fund† | | 4.59 | | 4.93 | |
| | | | | |
SEC Average Annual Total Returns (including sales charge or applicable CDSC) | | | | | |
One Year | | -2.54 | % | -3.17 | % |
Five Years | | 5.57 | | 5.47 | |
Ten Years | | 4.84 | | 4.67 | |
Life of Fund† | | 4.14 | | 4.93 | |
†Inception date: Class A: 12/10/93; Class B: 2/3/92
(1) Average annual total returns do not include the 4.75% maximum sales charge for Class A shares or the applicable contingent deferred sales charges (CDSC) for Class B shares. If sales charges were deducted, returns would be lower. SEC average annual total returns for Class A reflect the maximum 4.75% sales charge. SEC returns for Class B reflect applicable CDSC based on the following schedule: 5% - 1st and 2nd years; 4% - 3rd year; 3% - 4th year; 2% - 5th year; 1% - 6th year.
Diversification by Credit Quality(2)
(2) As a percentage of total investments, as of February 28, 2005. Holdings subject to change due to active management.
15
Eaton Vance Missouri Municipals Fund as of February 28, 2005
INVESTMENT UPDATE
The Fund
Performance for the Past Six Months
• The Fund’s Class A shares had a total return of 2.65% during the six months ended February 28, 2005.(1) This return was the result of an increase in net asset value (NAV) to $10.10 per share on February 28, 2005 from $10.08 on August 31, 2004, and the reinvestment of $0.244 in dividends.(2)
• The Fund’s Class B shares had a total return of 2.43% during the six months ended February 28, 2005.(1) This return was the result of an increase in NAV to $11.16 per share on February 28, 2005 from $11.14 on August 31, 2004, and the reinvestment of $0.248 in dividends.(2)
• For comparison, the Lehman Municipal Bond Index had a total return of 2.40% for the six months ended February 28, 2005.(3)
• Based on the Fund’s most recent dividends and NAVs on February 28, 2005 of $10.10 per share for Class A and $11.16 for Class B, the Fund’s distribution rates were 4.70% and 3.96%, respectively.(4) The distribution rates of Class A and Class B are equivalent to taxable rates of 7.69% and 6.48%, respectively.(5)
• The SEC 30-day yields for Class A and Class B shares at February 28, 2005 were 3.43% and 2.84%, respectively.(6) The SEC 30-day yields of Class A and Class B are equivalent to taxable yields of 5.61% and 4.65%, respectively.(5)
Cynthia J. Clemson
Portfolio Manager
Management Discussion
• Missouri’s economy grew unevenly in the past year. Around 5,000 manufacturing jobs were generated, a modest recouping of the 57,000 such jobs lost in the past five years in the metals, machinery, and electronic equipment areas. Construction saw impressive growth, amid a stronger housing and commercial climate. The state’s jobless rate was 5.8% in February 2005, up from 5.5% a year ago.
• Insured* lease revenue/certificates of participation (COPs) were the Fund’s largest sector weightings at February 28, 2005. These bonds represented a financing alternative that gave Missouri issuers increased financial flexibility. The bonds financed a variety of public projects, including convention center and hotel construction, sports facilities and other capital improvement programs.
• Insured* and uninsured hospital issues were significant investments for the Fund. Amid rising costs and more stringent reimbursement rules, management emphasized hospitals with sound underlying fundamentals, and a reputation for quality care and marketable health care specialties.
• The Fund had investments in selected industrial development revenue bonds (IDRs). IDRs tend to be more sensitive to the economy and may be helped by a recovery in industrial activity. The Fund’s investments included retailing, consumer products, chemicals, air freight and beverages.
• The Fund continued its efforts at diversification. In addition to diversifying according to issuer, sector and insurer, management had a balanced coupon allocation. Management also emphasized good call protection, which remains a strategic priority.
* Private insurance does not decrease the risk of loss of principal associated with this investment.
Past performance is no guarantee of future results. Returns are historical and are calculated by determining the percentage change in net asset value or offering price (as applicable) with all distributions reinvested. Investment return and principal value will fluctuate so that shares, when redeemed, may be worth more or less than their original cost. Performance is for the stated time period only; due to market volatility, the Fund’s current performance may be lower or higher than the quoted return. For performance as of the most recent month end, please refer to www.eatonvance.com.
(1) These returns do not include the 4.75% maximum sales charge for the Fund’s Class A shares or the applicable contingent deferred sales charges (CDSC) for Class B shares. If the sales charge were deducted, returns would be lower.
(2) A portion of the Fund’s income may be subject to federal income and/or alternative minimum tax and state and local taxes.
(3) It is not possible to invest directly in an Index. The Index’s total return does not reflect the expenses that would have been incurred if an investor individually purchased or sold the securities represented in the Index.
(4) The Fund’s distribution rate represents actual distributions paid to shareholders and is calculated by dividing the last distribution per share (annualized) by the net asset value.
(5) Taxable-equivalent figures assume a maximum 38.90% combined federal and state income tax rate. A lower rate would result in lower tax-equivalent figures.
(6) The Fund’s SEC yield is calculated by dividing the net investment income per share for the 30-day period by the offering price at the end of the period and annualizing the result.
16
FUND PERFORMANCE
Performance(1) | | Class A | | Class B | |
| | | | | |
Average Annual Total Returns (at net asset value) | | | | | |
One Year | | 3.71 | % | 3.11 | % |
Five Years | | 7.42 | | 6.61 | |
Ten Years | | 6.09 | | 5.37 | |
Life of Fund† | | 5.28 | | 5.66 | |
| | | | | |
SEC Average Annual Total Returns (including sales charge or applicable CDSC) | | | | | |
One Year | | -1.20 | % | -1.81 | % |
Five Years | | 6.37 | | 6.30 | |
Ten Years | | 5.58 | | 5.37 | |
Life of Fund† | | 4.82 | | 5.66 | |
†Inception date: Class A: 12/7/93; Class B: 5/1/92
(1) Average annual total returns do not include the 4.75% maximum sales charge for Class A shares or the applicable contingent deferred sales charges (CDSC) for Class B shares. If sales charges were deducted, returns would be lower. SEC average annual total returns for Class A reflect the maximum 4.75% sales charge. SEC returns for Class B reflect applicable CDSC based on the following schedule: 5% - 1st and 2nd years; 4% - 3rd year; 3% - 4th year; 2% - 5th year; 1% - 6th year.
Diversification by Credit Quality(2)

(2) As a percentage of total investments, as of February 28, 2005. Holdings subject to change due to active management.
17
Eaton Vance North Carolina Municipals Fund as of February 28, 2005
INVESTMENT UPDATE
The Fund
Performance for the Past Six Months
• The Fund’s Class A shares had a total return of 2.39% during the six months ended February 28, 2005.(1) This return was the result of an increase in net asset value (NAV) to $9.40 per share on February 28, 2005 from $9.39 on August 31, 2004, and the reinvestment of $0.212 in dividends.(2)
• The Fund’s Class B shares had a total return of 2.07% during the six months ended February 28, 2005.(1) This return was the result of no change in NAV from $10.10 on August 31, 2004, and the reinvestment of $0.207 in dividends.(2)
• For comparison, the Lehman Municipal Bond Index had a total return of 2.40% for the six months ended February 28, 2005.(3)
• Based on the Fund’s most recent dividends and NAVs on February 28, 2005 of $9.40 per share for Class A and $10.10 for Class B, the Fund’s distribution rates were 4.36% and 3.62%, respectively.(4) The distribution rates of Class A and Class B are equivalent to taxable rates of 7.27% and 6.04%, respectively.(5)
• The SEC 30-day yields for Class A and Class B shares at February 28, 2005 were 3.57% and 2.99%, respectively.(6) The SEC 30-day yields of Class A and Class B are equivalent to taxable yields of 5.95% and 4.99%, respectively.(5)
* Private insurance does not decrease the risk of loss of principal associated with this investment.
Thomas M. Metzold
Co-Portfolio Manager
William H. Ahern
Co-Portfolio Manager
Management Discussion
• North Carolina’s economic recovery gained ground in the past year. The state’s technology sector was boosted by planned expansions and new facilities by computer manufacturers and suppliers. In contrast, the textile and furniture industries have been challenged by the removal of import quotas. The state jobless rate was 5.4% in February 2005, down from 5.8% a year ago.
• Electric utilities bonds were the Fund’s largest sector weighting at February 28, 2005. These essential services bonds are prized by investors for their stable revenues independent of the overall economy. The Fund’s investments included county and state issuers, as well as selected Puerto Rico zero coupon issues.
• Escrowed/prerefunded bonds were prominent investments for the Fund. Pre-refunded to maturity and backed by Treasury bonds, escrowed bonds are considered very high credit quality, have relatively stable trading characteristics and may have above-average coupons.
• The Fund maintained a significant exposure to education bonds. Investments included some of the state’s premier universities, which enjoy excellent academic reputations, strong applicant demand and very stable tuition-based revenues.
• Diversification has been a major emphasis of the Fund. Management has sought a broad representation within the Fund on an issue, sector, coupon and structural basis. Given the relatively low level of interest rates, call protection has remained another key consideration.
• Effective May 2, 2005, Thomas M. Metzold will be the Fund’s sole portfolio manager.
Past performance is no guarantee of future results. Returns are historical and are calculated by determining the percentage change in net asset value or offering price (as applicable) with all distributions reinvested. Investment return and principal value will fluctuate so that shares, when redeemed, may be worth more or less than their original cost. Performance is for the stated time period only; due to market volatility, the Fund’s current performance may be lower or higher than the quoted return. For performance as of the most recent month end, please refer to www.eatonvance.com.
(1) These returns do not include the 4.75% maximum sales charge for the Fund’s Class A shares or the applicable contingent deferred sales charges (CDSC) for Class B shares. If the sales charge were deducted, returns would be lower
(2) A portion of the Fund’s income may be subject to federal income and/or alternative minimum tax and state intangibles tax.
(3) It is not possible to invest directly in an Index. The Index’s total return does not reflect the expenses that would have been incurred if an investor individually purchased or sold the securities represented in the Index.
(4) The Fund’s distribution rate represents actual distributions paid to shareholders and is calculated by dividing the last distribution per share (annualized) by the net asset value.
(5) Taxable-equivalent figures assume a maximum 40.04% combined federal and state income tax rate. A lower rate would result in lower tax-equivalent figures.
(6) The Fund’s SEC yield is calculated by dividing the net investment income per share for the 30-day period by the offering price at the end of the period and annualizing the result.
18
FUND PERFORMANCE
Performance(1) | | Class A | | Class B | |
| | | | | |
Average Annual Total Returns (at net asset value) | | | | | |
One Year | | 1.46 | % | 0.75 | % |
Five Years | | 6.13 | | 5.36 | |
Ten Years | | 5.26 | | 4.56 | |
Life of Fund† | | 4.51 | | 4.80 | |
| | | | | |
SEC Average Annual Total Returns (including sales charge or applicable CDSC) | | | | | |
One Year | | -3.33 | % | -4.09 | % |
Five Years | | 5.11 | | 5.03 | |
Ten Years | | 4.75 | | 4.56 | |
Life of Fund† | | 4.06 | | 4.80 | |
†Inception date: Class A: 12/7/93; Class B: 10/23/91
(1) Average annual total returns do not include the 4.75% maximum sales charge for Class A shares or the applicable contingent deferred sales charges (CDSC) for Class B shares. If sales charges were deducted, returns would be lower. SEC average annual total returns for Class A reflect the maximum 4.75% sales charge. SEC returns for Class B reflect applicable CDSC based on the following schedule: 5% - 1st and 2nd years; 4% - 3rd year; 3% - 4th year; 2% - 5th year; 1% - 6th year.
Diversification by Credit Quality(2)
(2) As a percentage of total investments, as of February 28, 2005. Holdings subject to change due to active management.
19
Eaton Vance Oregon Municipals Fund as of February 28, 2005
INVESTMENT UPDATE
The Fund
Performance for the Past Six Months
• The Fund’s Class A shares had a total return of 2.69% during the six months ended February 28, 2005.(1) This return was the result of an increase in net asset value (NAV) to $9.49 per share on February 28, 2005 from $9.48 on August 31, 2004, and the reinvestment of $0.242 in dividends.(2)
• The Fund’s Class B shares had a total return of 2.39% during the six months ended February 28, 2005.(1) This return was the result of no change in NAV from $10.37 on August 31, 2004, and the reinvestment of $0.245 in dividends.(2)
• For comparison, the Lehman Municipal Bond Index had a total return of 2.40% for the six months ended February 28, 2005.(3)
• Based on the Fund’s most recent dividends and NAVs on February 28, 2005 of $9.49 per share for Class A and $10.37 for Class B, the Fund’s distribution rates were 5.01% and 4.26%, respectively.(4) The distribution rates of Class A and Class B are equivalent to taxable rates of 8.47% and 7.20%, respectively.(5)
• The SEC 30-day yields for Class A and Class B shares at February 28, 2005 were 4.26% and 3.72%, respectively.(6) The SEC 30-day yields of Class A and Class B are equivalent to taxable yields of 7.20% and 6.29%, respectively.(5)
* Private insurance does not decrease the risk of loss of principal associated with this investment.
Thomas M. Metzold
Co-Portfolio Manager
William H. Ahern
Co-Portfolio Manager
Management Discussion
• After a three-year downtrend, Oregon’s job growth outpaced the nation in 2004. Most sectors in the state generated job increases during this period, especially business services and manufacturing. The manufacturing sector received a boost from a rebound in semiconductor production. The state jobless rate was 6.6% in February 2005, down from 7.7% a year ago.
• Housing bonds were the Fund’s largest sector weighting at February 28, 2005. Housing bonds typically constitute a large portion of Oregon’s municipal issuance. The Fund’s investments were represented by city, county and state issuers, and included single- and multi-family housing projects.
• General obligations (GOs) played a prominent role in the Fund. The Fund’s GO investments included issues for the state’s board of education, local school districts, elderly and disabled housing and veterans’ welfare services.
• Industrial development revenue bonds (IDRs) provided the Fund an exposure to the economic cycle. The Fund’s IDR investments focused primarily on the state’s key paper industry and on airline bonds, each potential beneficiaries of a sustained economic recovery.
• The Fund had selected investments in Puerto Rico issues, providing diversification by issuer and coupon. The Fund’s Puerto Rico investments included GOs, electric utilities, education, IDRs, lease revenue and special tax revenue bonds.
• Effective May 2, 2005, Thomas M. Metzold will be the Fund’s sole portfolio manager.
Past performance is no guarantee of future results. Returns are historical and are calculated by determining the percentage change in net asset value or offering price (as applicable) with all distributions reinvested. Investment return and principal value will fluctuate so that shares, when redeemed, may be worth more or less than their original cost. Performance is for the stated time period only; due to market volatility, the Fund’s current performance may be lower or higher than the quoted return. For performance as of the most recent month end, please refer to www.eatonvance.com.
(1) These returns do not include the 4.75% maximum sales charge for the Fund’s Class A shares or the applicable contingent deferred sales charges (CDSC) for Class B shares. If the sales charge were deducted, returns would be lower.
(2) A portion of the Fund’s income may be subject to federal income and/or alternative minimum tax and state and local taxes.
(3) It is not possible to invest directly in an Index. The Index’s total return does not reflect the expenses that would have been incurred if an investor individually purchased or sold the securities represented in the Index.
(4) The Fund’s distribution rate represents actual distributions paid to shareholders and is calculated by dividing the last distribution per share (annualized) by the net asset value.
(5) Taxable-equivalent figures assume a maximum 40.85% combined federal and state income tax rate. A lower rate would result in lower tax-equivalent figures.
(6) The Fund’s SEC yield is calculated by dividing the net investment income per share for the 30-day period by the offering price at the end of the period and annualizing the result.
20
FUND PERFORMANCE
Performance(1) | | Class A | | Class B | |
| | | | | |
Average Annual Total Returns (at net asset value) | | | | | |
One Year | | 1.50 | % | 0.83 | % |
Five Years | | 6.45 | | 5.64 | |
Ten Years | | 5.43 | | 4.72 | |
Life of Fund† | | 4.69 | | 5.07 | |
| | | | | |
SEC Average Annual Total Returns (including sales charge or applicable CDSC) | | | | | |
One Year | | -3.31 | % | -3.98 | % |
Five Years | | 5.41 | | 5.32 | |
Ten Years | | 4.92 | | 4.72 | |
Life of Fund† | | 4.23 | | 5.07 | |
†Inception date: Class A: 12/28/93; Class B: 12/24/91
(1) Average annual total returns do not include the 4.75% maximum sales charge for Class A shares or the applicable contingent deferred sales charges (CDSC) for Class B shares. If sales charges were deducted, returns would be lower. SEC average annual total returns for Class A reflect the maximum 4.75% sales charge. SEC returns for Class B reflect applicable CDSC based on the following schedule: 5% - 1st and 2nd years; 4% - 3rd year; 3% - 4th year; 2% - 5th year; 1% - 6th year.
Diversification by Credit Quality(2)
(2) As a percentage of total investments, as of February 28, 2005. Holdings subject to change due to active management.
21
Eaton Vance South Carolina Municipals Fund as of February 28, 2005
INVESTMENT UPDATE
The Fund
Performance for the Past Six Months
• The Fund’s Class A shares had a total return of 4.87% during the six months ended February 28, 2005.(1) This return was the result of an increase in net asset value (NAV) to $9.93 per share on February 28, 2005 from $9.71 on August 31, 2004, and the reinvestment of $0.248 in dividends.(2)
• The Fund’s Class B shares had a total return of 4.65% during the six months ended February 28, 2005.(1) This return was the result of an increase in NAV to $10.53 per share on February 28, 2005 from $10.30 on August 31, 2004, and the reinvestment of $0.244 in dividends.(2)
• For comparison, the Lehman Municipal Bond Index had a total return of 2.40% for the six months ended February 28, 2005.(3) As quality spreads tightened during the period, the Fund’s lower-investment-grade investments fared especially well, which accounted for its outperformance of the Index.
• Based on the Fund’s most recent dividends and NAVs on February 28, 2005 of $9.93 per share for Class A and $10.53 for Class B, the Fund’s distribution rates were 4.79% and 4.05%, respectively.(4) The distribution rates of Class A and Class B are equivalent to taxable rates of 7.92% and 6.70%, respectively.(5)
• The SEC 30-day yields for Class A and Class B shares at February 28, 2005 were 4.01% and 3.45%, respectively.(6) The SEC 30-day yields of Class A and Class B are equivalent to taxable yields of 6.63% and 5.71%, respectively.(5)
Thomas J. Fetter
Portfolio Manager
Management Discussion
• South Carolina continued its economic recovery, despite a downturn in non-durable manufacturing, as the apparel and textile industries remained vulnerable to global outsourcing. However, the state’s auto sector remained a notable success story. Meanwhile, coastal regions were strong beneficiaries of growth in the tourism and leisure industries. The state’s jobless rate was 7.1% in February 2005, up from 6.7% a year ago.
• Insured* education bonds were the Fund’s largest sector weighting at February 28, 2005. Unlike more cyclical areas of the economy, demand within the education sector has tended to be less impacted by shifts in the overall economy. The Fund’s investments included some of South Carolina’s finest state-supported institutions.
• Insured* water and sewer bonds were significant investments. The demands imposed by widespread residential construction and large economic developments and manufacturing facilities have necessitated major new water infrastructure projects. Those initiatives have been supported in part by these insured* issues.
• Insured* utility bonds were prominent holdings in the Fund. As essential service bonds, these issues enjoy relatively stable revenues. The Fund’s investments included high quality issuers such as the state public service authority and a regional municipal power agency.
• Management adjusted the Fund’s coupon structure, where possible, to reflect the shift in interest rates. Management also continued to update call protection, eliminating issues with unfavorable call features in favor of bonds with longer-dated call provisions.
* Private insurance does not decrease the risk of loss of principal associated with this investment.
Past performance is no guarantee of future results. Returns are historical and are calculated by determining the percentage change in net asset value or offering price (as applicable) with all distributions reinvested. Investment return and principal value will fluctuate so that shares, when redeemed, may be worth more or less than their original cost. Performance is for the stated time period only; due to market volatility, the Fund’s current performance may be lower or higher than the quoted return. For performance as of the most recent month end, please refer to www.eatonvance.com.
(1) These returns do not include the 4.75% maximum sales charge for the Fund’s Class A shares or the applicable contingent deferred sales charges (CDSC) for Class B shares. If the sales charge were deducted, returns would be lower.
(2) A portion of the Fund’s income may be subject to federal income and/alternative minimum tax and state and local taxes.
(3) It is not possible to invest directly in an Index. The Index’s total return does not reflect the expenses that would have been incurred if an investor individually purchased or sold the securities represented in the Index.
(4) The Fund’s distribution rate represents actual distributions paid to shareholders and is calculated by dividing the last distribution per share (annualized) by the net asset value.
(5) Taxable-equivalent figures assume a maximum 39.55% combined federal and state income tax rate. A lower rate would result in lower tax-equivalent figures.
(6) The Fund’s SEC yield is calculated by dividing the net investment income per share for the 30-day period by the offering price at the end of the period and annualizing the result.
22
FUND PERFORMANCE
Performance(1) | | Class A | | Class B | |
| | | | | |
Average Annual Total Returns (at net asset value) | | | | | |
One Year | | 4.74 | % | 4.26 | % |
Five Years | | 7.67 | | 6.88 | |
Ten Years | | 5.89 | | 5.26 | |
Life of Fund† | | 5.12 | | 5.15 | |
| | | | | |
SEC Average Annual Total Returns (including sales charge or applicable CDSC) | | | | | |
One Year | | -0.25 | % | -0.72 | % |
Five Years | | 6.63 | | 6.57 | |
Ten Years | | 5.38 | | 5.26 | |
Life of Fund† | | 4.65 | | 5.15 | |
†Inception date: Class A: 2/14/94; Class B: 10/2/92
(1) Average annual total returns do not include the 4.75% maximum sales charge for Class A shares or the applicable contingent deferred sales charges (CDSC) for Class B shares. If sales charges were deducted, returns would be lower. SEC average annual total returns for Class A reflect the maximum 4.75% sales charge. SEC returns for Class B reflect applicable CDSC based on the following schedule: 5% - 1st and 2nd years; 4% - 3rd year; 3% - 4th year; 2% - 5th year; 1% - 6th year.
Diversification by Credit Quality(2)
(2) As a percentage of total investments, as of February 28, 2005. Holdings subject to change due to active management.
23
Eaton Vance Tennessee Municipals Fund as of February 28, 2005
INVESTMENT UPDATE
The Fund
Performance for the Past Six Months
• The Fund’s Class A shares had a total return of 2.25% during the six months ended February 28, 2005.(1) This return was the result of a decrease in net asset value (NAV) to $9.89 per share on February 28, 2005 from $9.90 on August 31, 2004, and the reinvestment of $0.230 in dividends.(2)
• The Fund’s Class B shares had a total return of 2.04% during the six months ended February 28, 2005.(1) This return was the result of a decrease in NAV to $10.77 per share on February 28, 2005 from $10.78 on August 31, 2004, and the reinvestment of $0.229 in dividends.(2)
• For comparison, the Lehman Municipal Bond Index had a total return of 2.40% for the six months ended February 28, 2005.(3)
• Based on the Fund’s most recent dividends and NAVs on February 28, 2005 of $9.89 per share for Class A and $10.77 for Class B, the Fund’s distribution rates were 4.51% and 3.76%, respectively.(4) The distribution rates of Class A and Class B are equivalent to taxable rates of 7.38% and 6.15%, respectively.(5)
• The SEC 30-day yields for Class A and Class B shares at February 28, 2005 were 3.26% and 2.67%, respectively.(6) The SEC 30-day yields of Class A and Class B are equivalent to taxable yields of 5.34% and 4.37%, respectively.(5)
Cynthia J. Clemson
Portfolio Manager
Management Discussion
• Tennessee’s economy generated job growth during the past year in selected sectors, including construction, education, health care and tourism. Manufacturing also gained momentum, led by the state’s growing auto sector and the plans announced by Japanese manufacturers for future plant locations. Nonetheless, the state’s jobless rate was 5.9% in February 2005, up from 5.4% a year ago.
• Insured* electric utility bonds were the Fund’s largest sector weighting at February 28, 2005. Amid very limited new issuance of Tennessee municipal bonds, the electric utility sector remained an area characterized by well-regarded and liquid state and local issuers with dependable revenue streams.
• Insured* general obligations (GOs) constituted a major commitment for the Fund. As part of management’s emphasis on high credit quality, these issues included county GOs, school district bonds and local building authority bonds. These issues are backed by the taxing power of the issuing authority and are not reliant on any single project.
• Insured* escrowed/prerefunded bonds were significant holdings for the Fund. Escrowed bonds are either pre-refunded or escrowed to maturity and backed by Treasury bonds, most often as the result of a refinancing of existing higher-coupon debt. Valued by investors for their high credit quality, escrowed bonds may carry above-average coupons.
• Management emphasized high quality, as quality spreads remained unusually narrow. The Fund maintained selective investments in Puerto Rico issues, which provided good quality as well as additional opportunities for coupon and sector diversification.
* Private insurance does not decrease the risk of loss of principal associated with this investment.
Past performance is no guarantee of future results. Returns are historical and are calculated by determining the percentage change in net asset value or offering price (as applicable) with all distributions reinvested. Investment return and principal value will fluctuate so that shares, when redeemed, may be worth more or less than their original cost. Performance is for the stated time period only; due to market volatility, the Fund’s current performance may be lower or higher than the quoted return. For performance as of the most recent month end, please refer to www.eatonvance.com.
(1) These returns do not include the 4.75% maximum sales charge for the Fund’s Class A shares or the applicable contingent deferred sales charges (CDSC) for Class B shares. If the sales charge were deducted, returns wuld be lower.
(2) A portion of the Fund’s income may be subject to federal income and/alternative minimum tax and state and local income taxes.
(3) It is not possible to invest directly in an Index. The Index’s total return does not reflect the expenses that would have been incurred if an investor individually purchased or sold the securities represented in the Index.
(4) The Fund’s distribution rate represents actual distributions paid to shareholders and is calculated by dividing the last distribution per share (annualized) by the net asset value.
(5) Taxable-equivalent figures assume a maximum 38.90% combined federal and state income tax rate. A lower rate would result in lower tax-equivalent figures.
(6) The Fund’s SEC yield is calculated by dividing the net investment income per share for the 30-day period by the offering price at the end of the period and annualizing the result.
24
FUND PERFORMANCE
Performance(1) | | Class A | | Class B | |
| | | | | |
Average Annual Total Returns (at net asset value) | | | | | |
One Year | | 2.16 | % | 1.46 | % |
Five Years | | 6.72 | | 5.96 | |
Ten Years | | 5.84 | | 5.13 | |
Life of Fund† | | 5.01 | | 5.27 | |
| | | | | |
SEC Average Annual Total Returns (including sales charge or applicable CDSC) | | | | | |
One Year | | -2.73 | % | -3.40 | % |
Five Years | | 5.70 | | 5.64 | |
Ten Years | | 5.33 | | 5.13 | |
Life of Fund† | | 4.55 | | 5.27 | |
†Inception date: Class A: 12/9/93; Class B: 8/25/92
(1) Average annual total returns do not include the 4.75% maximum sales charge for Class A shares or the applicable contingent deferred sales charges (CDSC) for Class B shares. If sales charges were deducted, returns would be lower. SEC average annual total returns for Class A reflect the maximum 4.75% sales charge. SEC returns for Class B reflect applicable CDSC based on the following schedule: 5% - 1st and 2nd years; 4% - 3rd year; 3% - 4th year; 2% - 5th year; 1% - 6th year.
Diversification by Credit Quality(2)
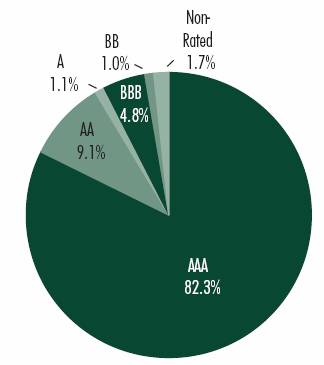
(2) As a percentage of total investments, as of February 28, 2005. Holdings subject to change due to active management.
25
Eaton Vance Virginia Municipals Fund as of February 28, 2005
INVESTMENT UPDATE
The Fund
Performance for the Past Six Months
• The Fund’s Class A shares had a total return of 3.34% during the six months ended February 28, 2005.(1) This return was the result of an increase in net asset value (NAV) to $9.69 per share on February 28, 2005 from $9.59 on August 31, 2004, and the reinvestment of $0.218 in dividends.(2)
• The Fund’s Class B shares had a total return of 3.12% during the six months ended February 28, 2005.(1) This return was the result of an increase in NAV to $10.72 per share on February 28, 2005 from $10.61 on August 31, 2004, and the reinvestment of $0.218 in dividends.(2)
• For comparison, the Lehman Municipal Bond Index had a total return of 2.40% for the six months ended February 28, 2005.(3) As quality spreads tightened during the period, the Fund’s lower-investment-grade investments fared especially well, which accounted for its outperformance of the Index.
• Based on the Fund’s most recent dividends and NAVs on February 28, 2005 of $9.69 per share for Class A and $10.72 for Class B, the Fund’s distribution rates were 4.37% and 3.62%, respectively.(4) The distribution rates of Class A and Class B are equivalent to taxable rates of 7.13% and 5.91%, respectively.(5)
• The SEC 30-day yields for Class A and Class B shares at February 28, 2005 were 3.73% and 3.16%, respectively.(6) The SEC 30-day yields of Class A and Class B are equivalent to taxable yields of 6.09% and 5.16%, respectively.(5)
Robert B. MacIntosh
Portfolio Manager
Management Discussion
• Virginia’s economy continued to expand in 2004, with the Common-wealth’s northern tier benefiting from defense and homeland security spending. The region’s technology sector continued its recovery and residential construction remained strong. The southern tier was hurt by layoffs in textile and furniture industries. Virginia’s jobless rate was 3.3% in February 2005, down from 3.7% a year ago.
• Insured* transportation bonds were the Fund’s largest sector weighting at February 28, 2005. Transportation plays a vital role in an area that serves as the nation’s political center and a major regional economic hub. The Fund’s investments included highways, bridge and tunnel authorities, and regional airport authorities.
• Insured* hospital bonds constituted a large focus for the Fund. As elsewhere in the nation, Virginia hospitals face growing pressures due to rising costs, Medicare reimbursement issues and increased competition. The Fund focused on selected institutions that have managed to contain costs and have adopted successful marketing strategies within their local markets.
• Insured* education bonds remained significant investments. Colleges and universities historically have enjoyed stable tuition income due to relatively consistent applicant demand. The Fund’s investments included state building authority bonds that financed dormitories and classrooms for Virginia universities.
• Management continued to adjust the Fund’s coupon structure, where possible, and upgrade call protection. Faced with the possibility of a quickened pace of refundings, call protection has become a more important strategic consideration.
* Private insurance does not decrease the risk of loss of principal associated with this investment.
Past performance is no guarantee of future results. Returns are historical and are calculated by determining the percentage change in net asset value or offering price (as applicable) with all distributions reinvested. Investment return and principal value will fluctuate so that shares, when redeemed, may be worth more or less than their original cost. Performance is for the stated time period only; due to market volatility, the Fund’s current performance may be lower or higher than the quoted return. For performance as of the most recent month end, please refer to www.eatonvance.com.
(1) These returns do not include the 4.75% maximum sales charge for the Fund’s Class A shares or the applicable contingent deferred sales charges (CDSC) for Class B shares. If the sales charge were deducted, returns would be lower.
(2) A portion of the Fund’s income may be subject to federal income and/alternative minimum tax and state and local income taxes.
(3) It is not possible to invest directly in an Index. The Index’s total return does not reflect the expenses that would have been incurred if an investor individually purchased or sold the securities represented in the Index.
(4) The Fund’s distribution rate represents actual distributions paid to shareholders and is calculated by dividing the last distribution per share (annualized) by the net asset value.
(5) Taxable-equivalent figures assume a maximum 38.74% combined federal and state income tax rate. A lower rate would result in lower tax-equivalent figures.
(6) The Fund’s SEC yield is calculated by dividing the net investment income per share for the 30-day period by the offering price at the end of the period and annualizing the result.
26
FUND PERFORMANCE
Performance(1) | | Class A | | Class B | |
| | | | | |
Average Annual Total Returns (at net asset value) | | | | | |
One Year | | 2.92 | % | 2.26 | % |
Five Years | | 6.82 | | 6.06 | |
Ten Years | | 5.68 | | 4.99 | |
Life of Fund† | | 4.87 | | 5.32 | |
| | | | | |
SEC Average Annual Total Returns (including sales charge or applicable CDSC) | | | | | |
One Year | | -1.95 | % | -2.65 | % |
Five Years | | 5.79 | | 5.74 | |
Ten Years | | 5.16 | | 4.99 | |
Life of Fund† | | 4.41 | | 5.32 | |
†Inception date: Class A: 12/17/93; Class B: 7/26/91
(1) Average annual total returns do not include the 4.75% maximum sales charge for Class A shares or the applicable contingent deferred sales charges (CDSC) for Class B shares. If sales charges were deducted, returns would be lower. SEC average annual total returns for Class A reflect the maximum 4.75% sales charge. SEC returns for Class B reflect applicable CDSC based on the following schedule: 5% - 1st and 2nd years; 4% - 3rd year; 3% - 4th year; 2% - 5th year; 1% - 6th year.
Diversification by Credit Quality(2)
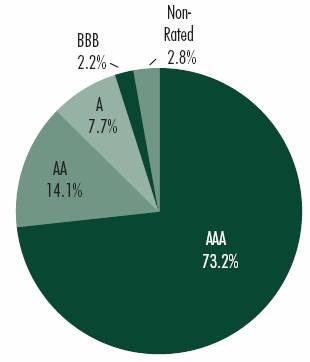
(2) As a percentage of total investments, as of February 28, 2005. Holdings subject to change due to active management.
27
Eaton Vance Municipals Funds as of February 28, 2005
DISCLOSURE OF FUND EXPENSES
Example: As a shareholder of a Fund, you incur two types of costs: (1) transaction costs, including sales charges (loads) on purchases and redemption fees (if applicable); and (2) ongoing costs, including management fees; distribution or service fees; and other Fund expenses. This Example is intended to help you understand your ongoing costs (in dollars) of investing in each Fund and to compare these costs with the ongoing costs of investing in other mutual funds. The Example is based on an investment of $1,000 invested at the beginning of the period and held for the entire period (September 1, 2004 – February 28, 2005).
Actual Expenses: The first section of the tables below provides information about actual account values and actual expenses. You may use the information in this line, together with the amount you invested, to estimate the expenses that you paid over the period. Simply divide your account value by $1,000 (for example, an $8,600 account value divided by $1,000 = 8.6), then multiply the result by the number in the first line under the heading entitled “Expenses Paid During Period” to estimate the expenses you paid on your account during this period.
Hypothetical Example for Comparison Purposes: The second section of the tables below provides information about hypothetical account values and hypothetical expenses based on a Fund’s actual expense ratios and an assumed rate of return of 5% per year before expenses, which is not the actual return of the Fund. The hypothetical account values and expenses may not be used to estimate the actual ending account balance or expenses you paid for the period. You may use this information to compare the ongoing costs of investing in the Funds and other funds. To do so, compare this 5% hypothetical example with the 5% hypothetical examples that appear in the shareholder reports of other funds.
Please note that the expenses shown in the table are meant to highlight your ongoing costs only and do not reflect any transactional costs, such as sales charges (loads) or redemption fees (if applicable). Therefore, the second section of the table is useful in comparing ongoing costs only, and will not help you determine the relative total costs of owning different funds. In addition, if these transactional costs were included, your costs would have been higher.
Eaton Vance Alabama Municipals Fund
| | Beginning Account Value | | Ending Account Value | | Expenses Paid During Period* | |
| | (9/1/04) | | (2/28/05) | | (9/1/04-2/28/05) | |
| | | | | | | |
Actual | | | | | | | |
Class A | | $ | 1,000.00 | | $ | 1,027.90 | | $ | 3.87 | |
Class B | | $ | 1,000.00 | | $ | 1,026.10 | | $ | 7.64 | |
| | | | | | | |
Hypothetical
(5% return per year before expenses) | | | | | | | |
Class A | | $ | 1,000.00 | | $ | 1,021.00 | | $ | 3.86 | |
Class B | | $ | 1,000.00 | | $ | 1,017.30 | | $ | 7.60 | |
* Expenses are equal to the Fund’s annualized expense ratio of 0.77% for Class A shares and 1.52% for Class B shares multiplied by the average account value over the period, multiplied by 181/365 (to reflect the one-half year period). The Example assumes that the $1,000 was invested at the net asset value per share determined at the close of business on August 31, 2004.
Eaton Vance Arkansas Municipals Fund
| | Beginning Account Value | | Ending Account Value | | Expenses Paid During Period* | |
| | (9/1/04) | | (2/28/05) | | (9/1/04-2/28/05) | |
| | | | | | | |
Actual | | | | | | | |
Class A | | $ | 1,000.00 | | $ | 1,026.20 | | $ | 3.82 | |
Class B | | $ | 1,000.00 | | $ | 1,024.80 | | $ | 7.58 | |
| | | | | | | |
Hypothetical
(5% return per year before expenses) | | | | | | | |
Class A | | $ | 1,000.00 | | $ | 1,021.00 | | $ | 3.81 | |
Class B | | $ | 1,000.00 | | $ | 1,017.30 | | $ | 7.55 | |
* Expenses are equal to the Fund’s annualized expense ratio of 0.76% for Class A shares and 1.51% for Class B shares multiplied by the average account value over the period, multiplied by 181/365 (to reflect the one-half year period). The Example assumes that the $1,000 was invested at the net asset value per share determined at the close of business on August 31, 2004.
28
Eaton Vance Georgia Municipals Fund
| | Beginning Account Value | | Ending Account Value | | Expenses Paid During Period* | |
| | (9/1/04) | | (2/28/05) | | (9/1/04-2/28/05) | |
| | | | | | | |
Actual | | | | | | | |
Class A | | $ | 1,000.00 | | $ | 1,026.50 | | $ | 3.92 | |
Class B | | $ | 1,000.00 | | $ | 1,023.40 | | $ | 7.68 | |
| | | | | | | |
Hypothetical
(5% return per year before expenses) | | | | | | | |
Class A | | $ | 1,000.00 | | $ | 1,020.90 | | $ | 3.91 | |
Class B | | $ | 1,000.00 | | $ | 1,017.20 | | $ | 7.65 | |
* Expenses are equal to the Fund’s annualized expense ratio of 0.78% for Class A shares and 1.53% for Class B shares multiplied by the average account value over the period, multiplied by 181/365 (to reflect the one-half year period). The Example assumes that the $1,000 was invested at the net asset value per share determined at the close of business on August 31, 2004.
Eaton Vance Kentucky Municipals Fund
| | Beginning Account Value | | Ending Account Value | | Expenses Paid During Period* | |
| | (9/1/04) | | (2/28/05) | | (9/1/04-2/28/05) | |
| | | | | | | |
Actual | | | | | | | |
Class A | | $ | 1,000.00 | | $ | 1,021.10 | | $ | 3.86 | |
Class B | | $ | 1,000.00 | | $ | 1,019.10 | | $ | 7.61 | |
| | | | | | | |
Hypothetical
(5% return per year before expenses) | | | | | | | |
Class A | | $ | 1,000.00 | | $ | 1,021.00 | | $ | 3.86 | |
Class B | | $ | 1,000.00 | | $ | 1,017.30 | | $ | 7.60 | |
* Expenses are equal to the Fund’s annualized expense ratio of 0.77% for Class A shares and 1.52% for Class B shares
multiplied by the average account value over the period, multiplied by 181/365 (to reflect the one-half year period). The Example assumes that the $1,000 was invested at the net asset value per share determined at the close of business on August 31, 2004.
Eaton Vance Louisiana Municipals Fund
| | Beginning Account Value | | Ending Account Value | | Expenses Paid During Period* | |
| | (9/1/04) | | (2/28/05) | | (9/1/04-2/28/05) | |
| | | | | | | |
Actual | | | | | | | |
Class A | | $ | 1,000.00 | | $ | 1,037.20 | | $ | 3.79 | |
Class B | | $ | 1,000.00 | | $ | 1,035.40 | | $ | 7.57 | |
| | | | | | | |
Hypothetical
(5% return per year before expenses) | | | | | | | |
Class A | | $ | 1,000.00 | | $ | 1,021.10 | | $ | 3.76 | |
Class B | | $ | 1,000.00 | | $ | 1,017.40 | | $ | 7.50 | |
* Expenses are equal to the Fund’s annualized expense ratio of 0.75% for Class A shares and 1.50% for Class B shares multiplied by the average account value over the period, multiplied by 181/365 (to reflect the one-half year period). The Example assumes that the $1,000 was invested at the net asset value per share determined at the close of business on August 31, 2004.
29
Eaton Vance Maryland Municipals Fund
| | Beginning Account Value | | Ending Account Value | | Expenses Paid During Period* | |
| | (9/1/04) | | (2/28/05) | | (9/1/04-2/28/05) | |
| | | | | | | |
Actual | | | | | | | |
Class A | | $ | 1,000.00 | | $ | 1,031.90 | | $ | 4.08 | |
Class B | | $ | 1,000.00 | | $ | 1,030.00 | | $ | 7.85 | |
| | | | | | | |
Hypothetical
(5% return per year before expenses) | | | | | | | |
Class A | | $ | 1,000.00 | | $ | 1,020.80 | | $ | 4.06 | |
Class B | | $ | 1,000.00 | | $ | 1,017.10 | | $ | 7.80 | |
* Expenses are equal to the Fund’s annualized expense ratio of 0.81% for Class A shares and 1.56% for Class B shares multiplied by the average account value over the period, multiplied by 181/365 (to reflect the one-half year period). The Example assumes that the $1,000 was invested at the net asset value per share determined at the close of business on August 31, 2004.
Eaton Vance Missouri Municipals Fund
| | Beginning Account Value | | Ending Account Value | | Expenses Paid During Period* | |
| | (9/1/04) | | (2/28/05) | | (9/1/04-2/28/05) | |
| | | | | | | |
Actual | | | | | | | |
Class A | | $ | 1,000.00 | | $ | 1,026.50 | | $ | 3.87 | |
Class B | | $ | 1,000.00 | | $ | 1,024.30 | | $ | 7.63 | |
| | | | | | | |
Hypothetical
(5% return per year before expenses) | | | | | | | |
Class A | | $ | 1,000.00 | | $ | 1,021.00 | | $ | 3.86 | |
Class B | | $ | 1,000.00 | | $ | 1,017.30 | | $ | 7.60 | |
* Expenses are equal to the Fund’s annualized expense ratio of 0.77% for Class A shares and 1.52% for Class B shares multiplied by the average account value over the period, multiplied by 181/365 (to reflect the one-half year period). The Example assumes that the $1,000 was invested at the net asset value per share determined at the close of business on August 31, 2004.
Eaton Vance North Carolina Municipals Fund
| | Beginning Account Value | | Ending Account Value | | Expenses Paid During Period* | |
| | (9/1/04) | | (2/28/05) | | (9/1/04-2/28/05) | |
| | | | | | | |
Actual | | | | | | | |
Class A | | $ | 1,000.00 | | $ | 1,023.90 | | $ | 4.01 | |
Class B | | $ | 1,000.00 | | $ | 1,020.70 | | $ | 7.77 | |
| | | | | | | |
Hypothetical
(5% return per year before expenses) | | | | | | | |
Class A | | $ | 1,000.00 | | $ | 1,020.80 | | $ | 4.01 | |
Class B | | $ | 1,000.00 | | $ | 1,017.10 | | $ | 7.75 | |
* Expenses are equal to the Fund’s annualized expense ratio of 0.80% for Class A shares and 1.55% for Class B shares multiplied by the average account value over the period, multiplied by 181/365 (to reflect the one-half year period). The Example assumes that the $1,000 was invested at the net asset value per share determined at the close of business on August 31, 2004.
30
Eaton Vance Oregon Municipals Fund
| | Beginning Account Value | | Ending Account Value | | Expenses Paid During Period* | |
| | (9/1/04) | | (2/28/05) | | (9/1/04-2/28/05) | |
| | | | | | | |
Actual | | | | | | | |
Class A | | $ | 1,000.00 | | $ | 1,026.90 | | $ | 3.92 | |
Class B | | $ | 1,000.00 | | $ | 1,023.90 | | $ | 7.68 | |
| | | | | | | |
Hypothetical
(5% return per year before expenses) | | | | | | | |
Class A | | $ | 1,000.00 | | $ | 1,020.90 | | $ | 3.91 | |
Class B | | $ | 1,000.00 | | $ | 1,017.20 | | $ | 7.65 | |
* Expenses are equal to the Fund’s annualized expense ratio of 0.78% for Class A shares and 1.53% for Class B shares multiplied by the average account value over the period, multiplied by 181/365 (to reflect the one-half year period). The Example assumes that the $1,000 was invested at the net asset value per share determined at the close of business on August 31, 2004.
Eaton Vance South Carolina Municipals Fund
| | Beginning Account Value | | Ending Account Value | | Expenses Paid During Period* | |
| | (9/1/04) | | (2/28/05) | | (9/1/04-2/28/05) | |
| | | | | | | |
Actual | | | | | | | |
Class A | | $ | 1,000.00 | | $ | 1,048.70 | | $ | 3.81 | |
Class B | | $ | 1,000.00 | | $ | 1,046.50 | | $ | 7.61 | |
| | | | | | | |
Hypothetical
(5% return per year before expenses) | | | | | | | |
Class A | | $ | 1,000.00 | | $ | 1,021.10 | | $ | 3.76 | |
Class B | | $ | 1,000.00 | | $ | 1,017.40 | | $ | 7.50 | |
* Expenses are equal to the Fund’s annualized expense ratio of 0.75% for Class A shares and 1.50% for Class B shares
multiplied by the average account value over the period, multiplied by 181/365 (to reflect the one-half year period). The Example assumes that the $1,000 was invested at the net asset value per share determined at the close of business on August 31, 2004.
Eaton Vance Tennessee Municipals Fund
| | Beginning Account Value | | Ending Account Value | | Expenses Paid During Period* | |
| | (9/1/04) | | (2/28/05) | | (9/1/04-2/28/05) | |
| | | | | | | �� |
Actual | | | | | | | |
Class A | | $ | 1,000.00 | | $ | 1,022.50 | | $ | 3.71 | |
Class B | | $ | 1,000.00 | | $ | 1,020.40 | | $ | 7.46 | |
| | | | | | | |
Hypothetical | | | | | | | |
(5% return per year before expenses) | | | | | | | |
Class A | | $ | 1,000.00 | | $ | 1,021.10 | | $ | 3.71 | |
Class B | | $ | 1,000.00 | | $ | 1,017.40 | | $ | 7.45 | |
* Expenses are equal to the Fund’s annualized expense ratio of 0.74% for Class A shares and 1.49% for Class B shares multiplied by the average account value over the period, multiplied by 181/365 (to reflect the one-half year period). The Example assumes that the $1,000 was invested at the net asset value per share determined at the close of business on August 31, 2004.
31
Eaton Vance Virginia Municipals Fund
| | Beginning Account Value | | Ending Account Value | | Expenses Paid During Period* | |
| | (9/1/04) | | (2/28/05) | | (9/1/04-2/28/05) | |
| | | | | | | |
Actual | | | | | | | |
Class A | | $ | 1,000.00 | | $ | 1,033.40 | | $ | 4.03 | |
Class B | | $ | 1,000.00 | | $ | 1,031.20 | | $ | 7.81 | |
| | | | | | | |
Hypothetical
(5% return per year before expenses) | | | | | | | |
Class A | | $ | 1,000.00 | | $ | 1,020.80 | | $ | 4.01 | |
Class B | | $ | 1,000.00 | | $ | 1,017.10 | | $ | 7.75 | |
* Expenses are equal to the Fund’s annualized expense ratio of 0.80% for Class A shares and 1.55% for Class B shares
multiplied by the average account value over the period, multiplied by 181/365 (to reflect the one-half year period). The Example assumes that the $1,000 was invested at the net asset value per share determined at the close of business on August 31, 2004.
32
Eaton Vance Alabama Municipals Fund as of February 28, 2005
PORTFOLIO OF INVESTMENTS (Unaudited)
| Tax-Exempt Investments - 98.7% | | | | | |
Principal Amount
(000's omitted) | |
Security | |
Value | |
| Electric Utilities - 3.6% | | | | | |
| $ | 1,000 | | | Puerto Rico Electric Power Authority, 5.125%, 7/1/29 | | $ | 1,047,970 | | |
| | 1,000 | | | Puerto Rico Electric Power Authority, 5.25%, 7/1/31 | | | 1,061,620 | | |
| | | | | | | $ | 2,109,590 | | |
| Escrowed / Prerefunded - 3.6% | | | | | |
| $ | 2,000 | | | Tallassee IDB, (United Technologies), Prerefunded to
8/1/06, 6.10%, 8/1/14 | | $ | 2,136,920 | | |
| | | | | | | $ | 2,136,920 | | |
| General Obligations - 4.5% | | | | | |
| $ | 1,125 | | | Huntsville, 5.25%, 5/1/31 | | $ | 1,203,930 | | |
| | 550 | | | Puerto Rico, 0.00%, 7/1/15 | | | 358,374 | | |
| | 1,000 | | | Puerto Rico Public Buildings Authority, Commonwealth
Guaranteed, 5.25%, 7/1/29 | | | 1,070,010 | | |
| | | | | | | $ | 2,632,314 | | |
| Hospital - 7.4% | | | | | |
| $ | 1,000 | | | Cullman Medical Clinic Board, (Cullman Regional
Medical Center), 6.50%, 2/15/23 | | $ | 1,000,480 | | |
| | 1,250 | | | Huntsville, Health Care Authority, 5.75%, 6/1/31 | | | 1,317,337 | | |
| | 1,000 | | | Marshall County, Health Care Authority, 5.75%, 1/1/32 | | | 1,050,400 | | |
| | 910 | | | Oneonta Eastern Healthcare Facility Financing Authority,
7.75%, 7/1/21 | | | 1,013,276 | | |
| | | | | | | $ | 4,381,493 | | |
| Industrial Development Revenue - 5.6% | | | | | |
| $ | 600 | | | Butler, Industrial Development Board, (Georgia-Pacific
Corp.), (AMT), 5.75%, 9/1/28 | | $ | 606,210 | | |
| | 1,000 | | | Courtland, Solid Waste Disposal, (Champion International
Corp.), (AMT), 6.70%, 11/1/29 | | | 1,093,450 | | |
| | 750 | | | Phenix County, Industrial Development Board Environmental
Improvements, 6.10%, 5/15/30 | | | 797,520 | | |
| | 1,180 | | | Puerto Rico Port Authority, (American Airlines), (AMT),
6.25%, 6/1/26 | | | 833,127 | | |
| | | | | | | $ | 3,330,307 | | |
| Insured-Education - 10.4% | | | | | |
| $ | 775 | | | Alabama Agricultural and Mechanical University, (MBIA),
5.00%, 11/1/25 | | $ | 800,064 | | |
| | 750 | | | Auburn University, (MBIA), 5.00%, 6/1/26 | | | 776,205 | | |
| | 7,500 | | | University of South Alabama, (AMBAC), 0.00%, 11/15/16 | | | 4,541,325 | | |
| | | | | | | $ | 6,117,594 | | |
Principal Amount
(000's omitted) | |
Security | |
Value | |
| | Insured-Electric Utilities - 0.3% | | | | | | | | |
| $ | 165 | | | Puerto Rico Electric Power Authority, (FSA), Variable Rate,
11.487%, 7/1/29(1)(2) | | $ | 203,950 | | |
| | | | | | | $ | 203,950 | | |
| | Insured-Escrowed / Prerefunded - 7.3% | | | | | | | | |
| $ | 1,060 | | | Alabama State University, (MBIA), Prerefunded to
1/1/12, 5.25%, 3/1/33(3) | | $ | 1,189,596 | | |
| | 1,310 | | | Jefferson County, Sewer, (FGIC), Prerefunded to 2/1/09,
5.00%, 2/1/33 | | | 1,420,747 | | |
| | 1,190 | | | Jefferson County, Sewer, (FGIC), Prerefunded to 2/1/09,
5.00%, 2/1/33 | | | 1,293,375 | | |
| | 330 | | | Puerto Rico Public Finance Corp., (AMBAC), Escrowed to
Maturity, 5.50%, 8/1/27 | | | 383,213 | | |
| | | | | | | $ | 4,286,931 | | |
| | Insured-General Obligations - 12.2% | | | | | | | | |
| $ | 1,500 | | | Etowah County, Board of Education, (FSA),
5.00%, 9/1/28 | | $ | 1,560,600 | | |
| | 2,000 | | | Gadsden, (AMBAC), 5.125%, 8/1/28 | | | 2,115,560 | | |
| | 1,000 | | | Homewood, (MBIA), 5.00%, 9/1/31 | | | 1,032,520 | | |
| | 700 | | | Puerto Rico, (FSA), Variable Rate,
16.243%, 7/1/27(1)(2) | | | 880,537 | | |
| | 1,495 | | | Tuscaloosa, (MBIA), 5.20%, 7/1/31 | | | 1,582,697 | | |
| | | | | | | $ | 7,171,914 | | |
| | Insured-Hospital - 12.8% | | | | | | | | |
| $ | 3,000 | | | Birmingham, Care Facility Financing Authority,
(Children's Hospital), (AMBAC), 5.00%, 6/1/32 | | $ | 3,087,300 | | |
| | 1,500 | | | East Alabama, Health Care Authority, (MBIA),
5.00%, 9/1/27 | | | 1,553,415 | | |
| | 1,000 | | | Huntsville, Health Care Authority, (MBIA),
5.40%, 6/1/22 | | | 1,093,600 | | |
| | 2,065 | | | Montgomery, BMC Special Care Facilities Financing
Authority, (Baptist Health Montgomery), (MBIA),
0.00%, 11/15/27 | | | 1,843,260 | | |
| | | | | | | $ | 7,577,575 | | |
| | Insured-Lease Revenue / Certificates of
Participation - 2.4% | | | | | | | | |
| $ | 770 | | | Puerto Rico Public Finance Corp., (AMBAC),
5.50%, 8/1/27 | | $ | 903,441 | | |
| | 400 | | | Puerto Rico Public Finance Corp., (AMBAC),
Variable Rate, 12.857%, 6/1/24(1)(2) | | | 536,224 | | |
| | | | | | | $ | 1,439,665 | | |
See notes to financial statements
33
Eaton Vance Alabama Municipals Fund as of February 28, 2005
PORTFOLIO OF INVESTMENTS (Unaudited) CONT'D
Principal Amount
(000's omitted) | |
Security | |
Value | |
| | Insured-Special Tax Revenue - 3.9% | | | | | | | | |
| $ | 1,825 | | | Birmingham Jefferson, Civic Center Authority, (MBIA),
0.00%, 9/1/18 | | $ | 997,801 | | |
| | 1,000 | | | Madison County, Board of Education, Sales Tax Revenue,
(AMBAC), 5.00%, 9/1/34 | | | 1,040,290 | | |
| | 250 | | | Puerto Rico Infrastructure Financing Authority, (AMBAC),
Variable Rate, 8.381%, 7/1/28(1)(4) | | | 272,095 | | |
| | | | | | | $ | 2,310,186 | | |
| | Insured-Transportation - 2.0% | | | | | | | | |
| $ | 500 | | | Huntsville-Madison County Airport, (AMT), (MBIA),
5.40%, 7/1/19 | | $ | 524,180 | | |
| | 1,000 | | | Puerto Rico Highway and Transportation Authority,
(AMBAC), 0.00%, 7/1/16 | | | 629,340 | | |
| | | | | | | $ | 1,153,520 | | |
| | Insured-Water and Sewer - 21.8% | | | | | | | | |
| $ | 2,000 | | | Alabaster, Sewer, (MBIA), 5.00%, 4/1/29 | | $ | 2,083,720 | | |
| | 2,500 | | | Birmingham, Waterworks and Sewer Board, (MBIA),
5.25%, 1/1/33 | | | 2,653,975 | | |
| | 1,000 | | | Helena, Utilities Board Water and Sewer, (MBIA),
5.25%, 4/1/33 | | | 1,059,190 | | |
| | 1,000 | | | Helena, Utilities Board Water and Sewer, (MBIA),
5.25%, 4/1/27 | | | 1,069,310 | | |
| | 1,000 | | | Opelika, Water Works Board Utility, (FSA),
5.125%, 6/1/31 | | | 1,042,100 | | |
| | 500 | | | Ozark, Utilities Board Water and Sewer, (AMBAC),
5.00%, 9/1/31 | | | 518,195 | | |
| | 3,075 | | | Prichard Water and Sewer, (AMBAC), 6.125%, 11/15/14 | | | 3,147,109 | | |
| | 1,195 | | | Warrior River, Water Authority, (FSA), 5.25%, 8/1/23 | | | 1,292,954 | | |
| | | | | | | $ | 12,866,553 | | |
| | Lease Revenue / Certificates of Participation - 0.9% | | | | | | | | |
| $ | 500 | | | Puerto Rico, (Guaynabo Municipal Government
Center Lease), 5.625%, 7/1/22 | | $ | 518,225 | | |
| | | | | | | $ | 518,225 | | |
| | Total Tax-Exempt Investments - 98.7%
(identified cost $54,495,010) | | | | | $ | 58,236,737 | | |
| | Other Assets, Less Liabilities - 1.3% | | | | | $ | 792,506 | | |
| | Net Assets - 100.0% | | | | | $ | 59,029,243 | | |
AMT - Interest earned from these securities may be considered a tax preference item for purposes of the Federal Alternative Minimum Tax.
AMBAC - AMBAC Financial Group, Inc.
FGIC - Financial Guaranty Insurance Company
FSA - Financial Security Assurance, Inc.
MBIA - Municipal Bond Insurance Association
The Fund invests primarily in debt securities issued by Alabama municipalities. The ability of the issuers of the debt securities to meet their obligations may be affected by economic developments in a specific industry or municipality. In order to reduce the risk associated with such economic developments, at February 28, 2005, 74.1% of the securities in the portfolio of investments are backed by bond insurance of various financial institutions and financial guaranty assurance agencies. The aggregate percentage insured by an individual financial institution ranged from 4.7% to 31.4% of total investments.
(1) Security exempt from registration under Rule 144A of the Securities Act of 1933. These securities may be sold in transactions exempt from registration, normally to qualified institutional buyers. At February 28, 2005, the aggregate value of the securities is $1,892,806 or 3.2% of the Fund net assets.
(2) Security has been issued as a leveraged inverse floater bond. The stated interest rate represents the rate in effect at February 28, 2005.
(3) Security (or a portion thereof) has been segregated to cover margin requirements on open financial futures contracts.
(4) Security has been issued as an inverse floater bond. The stated interest rate represents the rate in effect at February 28, 2005.
See notes to financial statements
34
Eaton Vance Arkansas Municipals Fund as of February 28, 2005
PORTFOLIO OF INVESTMENTS (Unaudited)
| | Tax-Exempt Investments - 97.1% | | | | | | | | |
Principal Amount
(000's omitted) | |
Security | |
Value | |
| | Education - 5.5% | | | | | | | | |
| $ | 2,250 | | | Conway, Public Facilities Board, (Hendrix College),
6.00%, 10/1/26 | | $ | 2,315,992 | | |
| | | | | | | $ | 2,315,992 | | |
| | Electric Utilities - 4.5% | | | | | | | | |
| $ | 550 | | | Jefferson, Pollution Control, (Entergy Arkansas),
6.30%, 6/1/18 | | $ | 557,991 | | |
| | 500 | | | Puerto Rico Electric Power Authority, 5.125%, 7/1/29 | | | 523,985 | | |
| | 750 | | | Puerto Rico Electric Power Authority, 5.25%, 7/1/31 | | | 796,215 | | |
| | | | | | | $ | 1,878,191 | | |
| | Escrowed / Prerefunded - 2.0% | | | | | | | | |
| $ | 750 | | | Northwest Arkansas Regional Airport Authority, (AMT),
Prerefunded to 2/1/08, 7.625%, 2/1/27 | | $ | 852,030 | | |
| | | | | | | $ | 852,030 | | |
| | General Obligations - 6.0% | | | | | | | | |
| $ | 2,750 | | | Arkansas State College Savings, 0.00%, 6/1/14 | | $ | 1,895,492 | | |
| | 250 | | | Arkansas, (Federal Highway) Grant Anticipation Tax
Revenue, 5.00%, 8/1/14 | | | 271,298 | | |
| | 350 | | | Puerto Rico Public Buildings Authority, 5.00%, 7/1/36 | | | 361,319 | | |
| | | | | | | $ | 2,528,109 | | |
| | Hospital - 13.3% | | | | | | | | |
| $ | 500 | | | Arkansas Development Finance Authority, (Washington
Regional Medical Center), 7.375%, 2/1/29 | | $ | 548,575 | | |
| | 800 | | | Arkansas Development Finance Authority, (White River
Medical Center), 5.60%, 6/1/24 | | | 823,264 | | |
| | 750 | | | Baxter County, Community Hospital District,
5.625%, 9/1/28 | | | 765,435 | | |
| | 1,000 | | | Conway, Health Facilities Board, (Conway Regional
Medical Center), 6.40%, 8/1/29 | | | 1,064,450 | | |
| | 250 | | | North Little Rock, Health Facilities Board, (Baptist Health),
5.70%, 7/1/22 | | | 263,060 | | |
| | 1,250 | | | Paragould Hospital, (Methodist Hospital Corp.),
6.375%, 10/1/17 | | | 1,300,350 | | |
| | 785 | | | Pulaski County, (Children's Hospital), 5.25%, 3/1/16 | | | 827,421 | | |
| | | | | | | $ | 5,592,555 | | |
| | Housing - 4.8% | | | | | | | | |
| $ | 500 | | | Arkansas Development Finance Authority, SFM, (GNMA),
(AMT), 5.125%, 7/1/24 | | $ | 519,035 | | |
Principal Amount
(000's omitted) | |
Security | |
Value | |
| Housing (continued) | | | | | |
| $ | 250 | | | Arkansas Development Finance Authority, SFM, (GNMA),
(AMT), 7.45%, 1/1/27 | | $ | 253,258 | | |
| | 210 | | | Arkansas Development Finance Authority, SFM,
(GNMA/FNMA), (AMT), 5.00%, 1/1/29 | | | 211,407 | | |
| | 580 | | | Arkansas Development Finance Authority, SFM,
(GNMA/FNMA), (AMT), 6.70%, 7/1/27 | | | 593,421 | | |
| | 470 | | | North Little Rock, Residential Housing Facilities,
(Parkstone Place), 6.50%, 8/1/21 | | | 437,077 | | |
| | | | | | | $ | 2,014,198 | | |
| Industrial Development Revenue - 10.8% | | | | | |
| $ | 400 | | | Arkansas Development Finance Authority, Industrial Facility
Revenue, (Potlatch Corp.), (AMT), 7.75%, 8/1/25 | | $ | 444,620 | | |
| | 2,000 | | | Baxter, (Aeroquip Corp.), 5.80%, 10/1/13 | | | 2,237,900 | | |
| | 750 | | | Calhoun County, Solid Waste Disposal Revenue,
(Georgia-Pacific Corp.), (AMT), 6.375%, 11/1/26 | | | 780,570 | | |
| | 250 | | | Pine Bluff, Environmental Improvements Revenue,
(International Paper Co.), (AMT), 6.70%, 8/1/20 | | | 274,138 | | |
| | 1,150 | | | Puerto Rico Port Authority, (American Airlines), (AMT),
6.25%, 6/1/26 | | | 811,946 | | |
| | | | | | | $ | 4,549,174 | | |
| Insured-Education - 7.6% | | | | | |
| $ | 310 | | | Arkansas State University, (Consolidated Building System),
(AMBAC), 5.10%, 4/1/24 | | $ | 324,319 | | |
| | 750 | | | University of Arkansas, (Fayetteville Campus), (FGIC),
5.00%, 12/1/32 | | | 774,030 | | |
| | 500 | | | University of Arkansas, (Fayetteville Campus), (MBIA),
4.75%, 11/1/24 | | | 517,825 | | |
| | 1,000 | | | University of Arkansas, (UAMS Campus), (MBIA),
5.00%, 11/1/34 | | | 1,041,600 | | |
| | 500 | | | University of Central Arkansas, (AMBAC),
6.125%, 4/1/26 | | | 527,830 | | |
| | | | | | | $ | 3,185,604 | | |
| Insured-Electric Utilities - 6.3% | | | | | |
| $ | 250 | | | North Little Rock, Electric System, (MBIA),
6.50%, 7/1/10 | | $ | 278,785 | | |
| | 1,000 | | | North Little Rock, Electric System, (MBIA),
6.50%, 7/1/15 | | | 1,200,950 | | |
| | 875 | | | Puerto Rico Electric Power Authority, (FSA),
Variable Rate, 8.39%, 7/1/29(1)(2) | | | 1,012,699 | | |
| | 135 | | | Puerto Rico Electric Power Authority, DRIVERS, (FSA),
Variable Rate, 12.902%, 7/1/29(1)(3) | | | 166,868 | | |
| | | | | | | $ | 2,659,302 | | |
See notes to financial statements
35
Eaton Vance Arkansas Municipals Fund as of February 28, 2005
PORTFOLIO OF INVESTMENTS (Unaudited) CONT'D
Principal Amount
(000's omitted) | |
Security | |
Value | |
| | Insured-Escrowed / Prerefunded - 3.0% | | | | | | | | |
| $ | 500 | | | Harrison, Residential Housing Facility Board, Single Family
Mortgage, (FGIC), Escrowed to Maturity, 7.40%, 9/1/11 | | $ | 607,585 | | |
| | 500 | | | Puerto Rico, (FGIC), Prerefunded to 7/1/12,
Variable Rate, 10.113%, 7/1/32(1)(3) | | | 659,330 | | |
| | | | | | | $ | 1,266,915 | | |
| | Insured-General Obligations - 3.2% | | | | | | | | |
| $ | 500 | | | Arkansas State College Savings, (FGIC), 0.00%, 6/1/17 | | $ | 292,915 | | |
| | 500 | | | Little Rock School District, (FSA), 5.25%, 2/1/33 | | | 529,365 | | |
| | 160 | | | Puerto Rico, (MBIA), Variable Rate,
12.295%, 7/1/20(1)(3) | | | 244,056 | | |
| | 250 | | | Springdale School District, (AMBAC), 4.50%, 6/1/24 | | | 251,075 | | |
| | | | | | | $ | 1,317,411 | | |
| | Insured-Hospital - 3.4% | | | | | | | | |
| $ | 500 | | | Arkansas Development Finance Authority, (Public Health
Laboratory), (AMBAC), 3.90%, 12/1/24 | | $ | 492,450 | | |
| | 500 | | | Arkansas Development Finance Authority, (Public Health
Laboratory), (AMBAC), 5.00%, 12/1/18 | | | 534,890 | | |
| | 400 | | | Saline County, Retirement Housing and Healthcare Facilities
Board, (Evan Lutheran Good Samaritan), (AMBAC),
5.80%, 6/1/11 | | | 411,412 | | |
| | | | | | | $ | 1,438,752 | | |
| | Insured-Housing - 2.5% | | | | | | | | |
| $ | 500 | | | Arkansas State University, (Housing System), (FGIC),
4.75%, 3/1/24 | | $ | 515,335 | | |
| | 500 | | | Arkansas State University, (Housing System), (FGIC),
5.00%, 3/1/34 | | | 519,660 | | |
| | | | | | | $ | 1,034,995 | | |
| | Insured-Lease Revenue / Certificates of
Participation - 3.3% | | | | | | | | |
| $ | 1,000 | | | Arkansas Development Finance Authority,SFM,
(Donaghey Plaza), (FSA), 5.00%, 6/1/29 | | $ | 1,042,450 | | |
| | 240 | | | Puerto Rico Public Finance Corp., (AMBAC),
Variable Rate, 12.857%, 6/1/24(1)(3) | | | 321,734 | | |
| | | | | | | $ | 1,364,184 | | |
| | Insured-Other Revenue - 2.5% | | | | | | | | |
| $ | 500 | | | Arkansas Development Finance Authority, (MT
Magazine), (FSA), 5.00%, 1/1/20 | | $ | 530,970 | | |
| | 500 | | | University of Arkansas Parking Revenue, (MBIA),
5.00%, 7/1/29 | | | 518,510 | | |
| | | | | | | $ | 1,049,480 | | |
Principal Amount
(000's omitted) | |
Security | |
Value | |
| Insured-Transportation - 0.5% | | | | | |
| $ | 200 | | | Puerto Rico Highway and Transportation Authority, (FSA),
Variable Rate, 10.795%, 7/1/32(1)(3) | | $ | 224,636 | | |
| | | | | | | $ | 224,636 | | |
| Insured-Water and Sewer - 7.7% | | | | | |
| $ | 500 | | | Arkansas Community Water System, Public Water Authority,
(MBIA), 5.00%, 10/1/42 | | $ | 513,800 | | |
| | 665 | | | Arkansas Community Water System, Public Water Authority,
(MBIA), 5.00%, 10/1/33 | | | 688,534 | | |
| | 500 | | | Conway, Water Revenue, (FGIC), 5.125%, 12/1/23 | | | 535,285 | | |
| | 1,395 | | | Fort Smith, Water and Sewer, (FSA), 5.00%, 10/1/23 | | | 1,471,390 | | |
| | | | | | | $ | 3,209,009 | | |
| Special Tax Revenue - 5.8% | | | | | |
| $ | 2,000 | | | Little Rock, Hotel and Restaurant Gross Receipts Tax,
7.375%, 8/1/15 | | $ | 2,443,700 | | |
| | | | | | | $ | 2,443,700 | | |
| Transportation - 1.2% | | | | | |
| $ | 500 | | | Northwest Arkansas Regional Airport Authority, (AMT),
5.00%, 2/1/18 | | $ | 513,810 | | |
| | | | | | | $ | 513,810 | | |
| Water and Sewer - 3.2% | | | | | |
| $ | 1,000 | | | Arkansas Development Finance Authority, (Waste Water
System), 5.00%, 6/1/22(4) | | $ | 1,052,340 | | |
| | 250 | | | Arkansas Development Finance Authority, (Waste Water
System), 5.50%, 12/1/19 | | | 288,903 | | |
| | | | | | | $ | 1,341,243 | | |
| | Total Tax-Exempt Investments - 97.1%
(identified cost $38,465,604) | | | | | $ | 40,779,290 | | |
| | Other Assets, Less Liabilities - 2.9% | | | | | $ | 1,223,258 | | |
| | Net Assets - 100.0% | | | | | $ | 42,002,548 | | |
See notes to financial statements
36
Eaton Vance Arkansas Municipals Fund as of February 28, 2005
PORTFOLIO OF INVESTMENTS (Unaudited) CONT'D
AMT - Interest earned from these securities may be considered a tax preference item for purposes of the Federal Alternative Minimum Tax.
AMBAC - AMBAC Financial Group, Inc.
FGIC - Financial Guaranty Insurance Company
FSA - Financial Security Assurance, Inc.
MBIA - Municipal Bond Insurance Association
The Fund invests primarily in debt securities issued by Arkansas municipalities. The ability of the issuers of the debt securities to meet their obligations may be affected by economic developments in a specific industry or municipality. In order to reduce the risk associated with such economic developments, at February 28, 2005, 41.1% of the securities in the portfolio of investments are backed by bond insurance of various financial institutions and financial guaranty assurance agencies. The aggregate percentage insured by an individual financial institution ranged from 7.0% to 12.3% of total investments.
(1) Security exempt from registration under Rule 144A of the Securities Act of 1933. These securities may be sold in transactions exempt from registration, normally to qualified institutional buyers. At February 28, 2005, the aggregate value of the securities is $2,629,323 or 6.3% of the Fund's net assets.
(2) Security has been issued as an inverse floater bond. The stated interest rate represents the rate in effect at February 28, 2005.
(3) Security has been issued as a leveraged inverse floater bond. The stated interest rate represents the rate in effect at February 28, 2005.
(4) Security (or a portion thereof) has been segregated to cover margin requirements on open financial futures contracts.
See notes to financial statements
37
Eaton Vance Georgia Municipals Fund as of February 28, 2005
PORTFOLIO OF INVESTMENTS (Unaudited)
| | Tax-Exempt Investments - 100.0% | | | | | | | | |
Principal Amount
(000's omitted) | |
Security | |
Value | |
| | Education - 2.8% | | | | | | | | |
| $ | 1,500 | | | Fulton County, Development Authority, (Georgia
Technology Foundation), 5.00%, 11/1/31 | | $ | 1,545,000 | | |
| | | | | | | $ | 1,545,000 | | |
| | Electric Utilities - 4.2% | | | | | | | | |
| $ | 1,000 | | | Georgia Municipal Electric Power Authority,
0.00%, 1/1/12 | | $ | 699,050 | | |
| | 1,000 | | | Georgia Municipal Electric Power Authority,
8.25%, 1/1/11 | | | 1,248,500 | | |
| | 665 | | | Puerto Rico Electric Power Authority, 0.00%, 7/1/17 | | | 397,657 | | |
| | | | | | | $ | 2,345,207 | | |
| | Escrowed / Prerefunded - 1.9% | | | | | | | | |
| $ | 800 | | | Forsyth County, Hospital Authority, (Georgia Baptist
Health Care System), Escrowed to Maturity,
6.375%, 10/1/28 | | $ | 1,031,696 | | |
| | | | | | | $ | 1,031,696 | | |
| | General Obligations - 2.7% | | | | | | | | |
| $ | 300 | | | Alpharetta, 6.50%, 5/1/10 | | $ | 337,244 | | |
| | 1,000 | | | Puerto Rico Aqueduct and Sewer Authority,
6.25%, 7/1/12 | | | 1,163,270 | | |
| | | | | | | $ | 1,500,514 | | |
| | Hospital - 2.7% | | | | | | | | |
| $ | 500 | | | Baldwin County, Hospital Authority, (Oconee Regional
Medical Center), 5.375%, 12/1/28 | | $ | 440,785 | | |
| | 1,000 | | | Gainesville and Hall County, Hospital Authority, (Northeast
Georgia Health System, Inc.), 5.50%, 5/15/31 | | | 1,035,570 | | |
| | | | | | | $ | 1,476,355 | | |
| | Housing - 3.8% | | | | | | | | |
| $ | 200 | | | Atlanta Urban Residential Finance Authority, (New
Community John Hope), (AMT), 7.25%, 6/1/07 | | $ | 202,868 | | |
| | 750 | | | Georgia Housing Finance Authority, (AMT),
5.85%, 12/1/28 | | | 775,185 | | |
| | 600 | | | Georgia Private Colleges and Universities Authority,
Student Housing Revenue, (Mercer Housing Corp.),
6.00%, 6/1/31 | | | 619,686 | | |
| | 500 | | | Milledgeville & Baldwin County, Development Authority,
(Georgia College and State University Funding),
5.625%, 9/1/30 | | | 524,220 | | |
| | | | | | | $ | 2,121,959 | | |
Principal Amount
(000's omitted) | |
Security | |
Value | |
| | Industrial Development Revenue - 13.6% | | | | | | | | |
| $ | 2,000 | | | Albany Dougherty, Payroll Development Authority, Solid
Waste Disposal, (Proctor and Gamble), (AMT),
5.20%, 5/15/28(1) | | $ | 2,150,580 | | |
| | 700 | | | Cartersville, Development Authority, (Anheuser-Busch),
(AMT), 5.95%, 2/1/32 | | | 747,691 | | |
| | 1,000 | | | Cartersville, Development Authority, (Anheuser-Busch),
(AMT), 7.375%, 5/1/09(2) | | | 1,150,700 | | |
| | 750 | | | Effingham County, Solid Waste Disposal, (Fort James),
(AMT), 5.625%, 7/1/18 | | | 764,745 | | |
| | 1,250 | | | Puerto Rico Port Authority, (American Airlines), (AMT),
6.25%, 6/1/26 | | | 882,550 | | |
| | 913 | | | Savannah EDA, (Intercat-Savannah, Inc.), (AMT),
9.00%, 1/1/15 | | | 847,963 | | |
| | 1,000 | | | Vienna Water and Sewer, (Cargill), (AMT),
6.00%, 9/1/14 | | | 1,009,370 | | |
| | | | | | | $ | 7,553,599 | | |
| | Insured-Education - 7.3% | | | | | | | | |
| $ | 1,000 | | | Carrollton, Payroll Development Authority, (University of
West Georgia), (MBIA), 4.75%, 8/1/30 | | $ | 1,011,710 | | |
| | 1,500 | | | Fulton County, Development Authority, (Tuff Morehouse),
(AMBAC), 5.00%, 2/1/34 | | | 1,548,195 | | |
| | 1,500 | | | Georgia Private Colleges and Universities Authority,
(Agnes Scott College), (MBIA), 4.75%, 6/1/28 | | | 1,518,120 | | |
| | | | | | | $ | 4,078,025 | | |
| | Insured-Electric Utilities - 6.3% | | | | | | | | |
| $ | 3,100 | | | Georgia Municipal Electric Power Authority, (MBIA),
5.50%, 1/1/20 | | $ | 3,520,918 | | |
| | | | | | | $ | 3,520,918 | | |
| | Insured-Escrowed / Prerefunded - 4.0% | | | | | | | | |
| $ | 1,000 | | | Atlanta Airport, (FGIC), Prerefunded to 1/1/10,
5.60%, 1/1/30 | | $ | 1,123,770 | | |
| | 1,000 | | | Atlanta, Water and Sewer, (FGIC), Prerefunded to
5/1/09, 5.00%, 11/1/38 | | | 1,091,460 | | |
| | | | | | | $ | 2,215,230 | | |
| | Insured-General Obligations - 3.4% | | | | | | | | |
| $ | 660 | | | Fayette County, School District, (FSA), 0.00%, 3/1/25 | | $ | 494,802 | | |
| | 900 | | | Puerto Rico, (FSA), Variable Rate,
16.243%, 7/1/27(3)(4) | | | 1,132,119 | | |
| | 160 | | | Puerto Rico, (MBIA), Variable Rate,
12.295%, 7/1/20(3)(4) | | | 244,056 | | |
| | | | | | | $ | 1,870,977 | | |
See notes to financial statements
38
Eaton Vance Georgia Municipals Fund as of February 28, 2005
PORTFOLIO OF INVESTMENTS (Unaudited) CONT'D
Principal Amount
(000's omitted) | |
Security | |
Value | |
| Insured-Hospital - 2.8% | | | | | |
| $ | 1,000 | | | Henry County, Hospital Authority Revenue, (Henry
Medical Center, Inc.), (AMBAC), 6.00%, 7/1/29 | | $ | 1,133,730 | | |
| | 400 | | | Medical Center Hospital Authority, (Columbus Regional
Healthcare System), (MBIA), Variable Rate,
10.574%, 8/1/10(3)(5) | | | 413,204 | | |
| | | | | | | $ | 1,546,934 | | |
Insured-Lease Revenue / Certificates of
Participation - 3.1% | | | | | |
| $ | 1,000 | | | Puerto Rico Public Finance Corp., (AMBAC),
Variable Rate, 7.84%, 6/1/26(3)(5) | | $ | 1,159,180 | | |
| | 400 | | | Puerto Rico Public Finance Corp., (AMBAC),
Variable Rate, 12.857%, 6/1/24(3)(4) | | | 536,224 | | |
| | | | | | | $ | 1,695,404 | | |
| Insured-Special Tax Revenue - 3.4% | | | | | |
| $ | 1,000 | | | George L. Smith, (Georgia World Congress Center-Domed
Stadium), (MBIA), (AMT), 5.50%, 7/1/20 | | $ | 1,086,330 | | |
| | 700 | | | Puerto Rico Infrastructure Financing Authority, (AMBAC),
Variable Rate, 10.286%, 7/1/28(3)(4) | | | 792,799 | | |
| | | | | | | $ | 1,879,129 | | |
| Insured-Transportation - 13.0% | | | | | |
| $ | 785 | | | Atlanta Airport Passenger Facility Charge, (FSA),
4.75%, 1/1/28 | | $ | 793,878 | | |
| | 1,000 | | | Atlanta, Airport Passenger Facility Charge, (FSA),
5.00%, 1/1/33 | | | 1,036,580 | | |
| | 1,000 | | | Metropolitan Atlanta Rapid Transit Authority, (AMBAC),
6.25%, 7/1/11 | | | 1,153,840 | | |
| | 1,000 | | | Metropolitan Atlanta Rapid Transit Authority, (AMBAC),
6.25%, 7/1/20 | | | 1,211,760 | | |
| | 1,500 | | | Metropolitan Atlanta Rapid Transit Authority, (MBIA),
Variable Rate, 8.535%, 7/1/20(3)(5) | | | 1,688,445 | | |
| | 750 | | | Puerto Rico Highway and Transportation Authority,
(AMBAC), 0.00%, 7/1/18 | | | 429,067 | | |
| | 300 | | | Puerto Rico Highway and Transportation Authority,
(MBIA), 5.00%, 7/1/36 | | | 316,938 | | |
| | 500 | | | Puerto Rico Highway and Transportation Authority,
(MBIA), Variable Rate, 10.862%, 7/1/36(3)(4) | | | 584,685 | | |
| | | | | | | $ | 7,215,193 | | |
| Insured-Water and Sewer - 14.6% | | | | | |
| $ | 1,180 | | | Atlanta, Water and Sewer, (FGIC), 5.00%, 11/1/38 | | $ | 1,211,105 | | |
| | 1,000 | | | Atlanta, Water and Wastewater, (FSA), 5.00%, 11/1/34 | | | 1,042,400 | | |
| | 500 | | | Atlanta, Water and Wastewater, (MBIA), 5.00%, 11/1/39 | | | 513,855 | | |
Principal Amount
(000's omitted) | |
Security | |
Value | |
| Insured-Water and Sewer (continued) | | | | | |
| $ | 2,000 | | | Augusta, Water and Sewer, (FSA), 5.00%, 10/1/32 | | $ | 2,069,480 | | |
| | 500 | | | Augusta, Water and Sewer, (FSA), 5.25%, 10/1/30 | | | 531,925 | | |
| | 1,000 | | | Henry County, Water and Sewer Authority, (FGIC),
5.625%, 2/1/30 | | | 1,099,480 | | |
| | 1,000 | | | Henry County, Water and Sewer Authority, (MBIA),
5.25%, 2/1/30(6) | | | 1,125,410 | | |
| | 500 | | | South Fulton, Water & Sewer Authority, (MBIA),
5.00%, 1/1/33 | | | 517,840 | | |
| | | | | | | $ | 8,111,495 | | |
| Lease Revenue / Certificates of Participation - 1.5% | | | | | |
| $ | 1,000 | | | Fulton County, Building Authority, Judicial Center,
0.00%, 1/1/10 | | $ | 852,230 | | |
| | | | | | | $ | 852,230 | | |
| Senior Living / Life Care - 1.0% | | | | | |
| $ | 1,385 | | | De Kalb County, Private Hospital Authority, (Atlanta, Inc.),
8.50%, 3/1/25(2)(7) | | $ | 564,997 | | |
| | | | | | | $ | 564,997 | | |
| Transportation - 0.4% | | | | | |
| $ | 250 | | | Augusta, Airport Passenger Facility Charge,
5.15%, 1/1/35(6) | | $ | 250,443 | | |
| | | | | | | $ | 250,443 | | |
| Water and Sewer - 7.5% | | | | | |
| $ | 1,000 | | | De Kalb County, Water and Sewer, 5.00%, 10/1/28 | | $ | 1,027,670 | | |
| | 1,000 | | | De Kalb County, Water and Sewer, 5.125%, 10/1/31 | | | 1,040,470 | | |
| | 1,000 | | | Forsyth County, Water and Sewer Authority,
5.00%, 4/1/32 | | | 1,037,330 | | |
| | 1,000 | | | Gwinnett County, Water and Sewer Authority,
5.25%, 8/1/24 | | | 1,082,860 | | |
| | | | | | | $ | 4,188,330 | | |
| | Total Tax-Exempt Investments - 100.0%
(identified cost $51,653,182) | | | | | $ | 55,563,635 | | |
| | Other Assets, Less Liabilities - (0.0)% | | | | | $ | (1,738 | ) | |
| | Net Assets - 100.0% | | | | | $ | 55,561,897 | | |
See notes to financial statements
39
Eaton Vance Georgia Municipals Fund as of February 28, 2005
PORTFOLIO OF INVESTMENTS (Unaudited) CONT'D
AMT - Interest earned from these securities may be considered a tax preference item for purposes of the Federal Alternative Minimum Tax.
AMBAC - AMBAC Financial Group, Inc.
FGIC - Financial Guaranty Insurance Company
FSA - Financial Security Assurance, Inc.
MBIA - Municipal Bond Insurance Association
The Fund invests primarily in debt securities issued by Georgia municipalities. The ability of the issuers of the debt securities to meet their obligations may be affected by economic developments in a specific industry or municipality. In order to reduce the risk associated with such economic developments, at February 28, 2005, 57.8% of the securities in the portfolio of investments are backed by bond insurance of various financial institutions and financial guaranty assurance agencies. The aggregate percentage insured by an individual financial institution ranged from 8.1% to 22.6% of total investments.
(1) Security (or a portion thereof) has been segregated to cover margin requirements on open financial futures contracts.
(2) Security (or a portion thereof) has been segregated to cover when-issued securities.
(3) Security exempt from registration under Rule 144A of the Securities Act of 1933. These securities may be sold in transactions exempt from registration, normally to qualified institutional buyers. At February 28, 2005, the aggregate value of the securities is $6,550,712 or 11.8% of the Fund's net assets.
(4) Security has been issued as a leveraged inverse floater bond. The stated interest rate represents the rate in effect at February 28, 2005.
(5) Security has been issued as an inverse floater bond. The stated interest rate represents the rate in effect at February 28, 2005.
(6) When-issued security.
(7) Security is in default and making only partial interest payments.
See notes to financial statements
40
Eaton Vance Kentucky Municipals Fund as of February 28, 2005
PORTFOLIO OF INVESTMENTS (Unaudited)
| | Tax-Exempt Investments - 97.2% | | | | | | | | |
Principal Amount
(000's omitted) | |
Security | |
Value | |
| | Education - 2.0% | | | | | | | | |
| $ | 1,280 | | | Campbellsville, (Campbellsville University),
5.70%, 3/1/34 | | $ | 1,285,606 | | |
| | | | | | | $ | 1,285,606 | | |
| | Electric Utilities - 5.0% | | | | | | | | |
| $ | 3,500 | | | Puerto Rico Electric Power Authority, 0.00%, 7/1/17 | | $ | 2,092,930 | | |
| | 1,000 | | | Puerto Rico Electric Power Authority, 5.125%, 7/1/29 | | | 1,047,970 | | |
| | | | | | | $ | 3,140,900 | | |
| | Escrowed / Prerefunded - 2.6% | | | | | | | | |
| $ | 1,200 | | | Florence, Housing Facilities, (Blue Grass Housing),
Prerefunded to 7/1/07, 7.625%, 5/1/27 | | $ | 1,345,020 | | |
| | 305 | | | Russell, Health Systems, Prerefunded to 7/1/06,
8.10%, 7/1/15 | | | 328,628 | | |
| | | | | | | $ | 1,673,648 | | |
| | General Obligations - 2.9% | | | | | | | | |
| $ | 1,465 | | | Bowling Green, 5.30%, 6/1/19 | | $ | 1,609,888 | | |
| | 250 | | | Lexington-Fayette Urban County, (County Detention
Center), 4.75%, 5/1/24 | | | 255,350 | | |
| | | | | | | $ | 1,865,238 | | |
| | Industrial Development Revenue - 14.2% | | | | | | | | |
| $ | 2,000 | | | Ashland, Solid Waste Disposal, (Ashland Oil), (AMT),
7.125%, 2/1/22 | | $ | 2,052,120 | | |
| | 1,500 | | | Hancock County, (Southwire Co.), (AMT),
7.75%, 7/1/25 | | | 1,508,130 | | |
| | 1,000 | | | Jefferson County, Pollution Control, (E.I. du Pont de
Nemours), 6.30%, 7/1/12 | | | 1,028,220 | | |
| | 900 | | | Kenton County Airport, (Delta Airlines), (AMT),
6.125%, 2/1/22 | | | 701,865 | | |
| | 1,500 | | | Perry County, Solid Waste Disposal, (TJI International),
(AMT), 6.80%, 5/1/26 | | | 1,558,875 | | |
| | 245 | | | Powderly, (KMart Corp.), 6.90%, 3/1/07 | | | 240,715 | | |
| | 1,820 | | | Wickliffe, Solid Waste Disposal, (Westvaco Corp.),
(AMT), 6.375%, 4/1/26 | | | 1,880,843 | | |
| | | | | | | $ | 8,970,768 | | |
| | Insured-Education - 4.4% | | | | | | | | |
| $ | 2,000 | | | Lexington-Fayette Urban County, (University of Kentucky,
Alumni Association, Inc.), (MBIA), 5.00%, 11/1/18 | | $ | 2,151,780 | | |
Principal Amount
(000's omitted) | |
Security | |
Value | |
| | Insured-Education (continued) | | | | | | | | |
| $ | 650 | | | Puerto Rico Industrial, Tourist, Educational, Medical &
Environmental Control Facilities Financing Authority,
(Inter American University), (MBIA), 4.50%, 10/1/29 | | $ | 650,728 | | |
| | | | | | | $ | 2,802,508 | | |
| | Insured-Electric Utilities - 1.6% | | | | | | | | |
| $ | 2,000 | | | Owensboro Electric Light & Power, (AMBAC),
0.00%, 1/1/20 | | $ | 1,009,500 | | |
| | | | | | | $ | 1,009,500 | | |
| | Insured-Escrowed / Prerefunded - 3.4% | | | | | | | | |
| $ | 1,000 | | | Kentucky Property and Buildings Commission, (FSA),
Prerefunded to 8/1/11, 5.00%, 8/1/21 | | $ | 1,048,340 | | |
| | 1,000 | | | University of Kentucky, University Consolidated Revenue,
(FGIC), Prerefunded to 5/1/10, 5.00%, 5/1/19 | | | 1,091,260 | | |
| | | | | | | $ | 2,139,600 | | |
| | Insured-General Obligations - 2.9% | | | | | | | | |
| $ | 350 | | | Puerto Rico, (FSA), Variable Rate, 16.243%, 7/1/27(1)(2) | | $ | 440,268 | | |
| | 200 | | | Puerto Rico, (MBIA), Variable Rate, 12.295%, 7/1/20(1)(2) | | | 305,070 | | |
| | 1,000 | | | Warren County, (Judicial Office Building and Parks),
(AMBAC), 5.20%, 9/1/29 | | | 1,058,610 | | |
| | | | | | | $ | 1,803,948 | | |
| | Insured-Hospital - 7.4% | | | | | | | | |
| $ | 850 | | | Jefferson County, Health Facilities Authority, (University
Medical Center), (MBIA), 5.25%, 7/1/22 | | $ | 893,019 | | |
| | 11,775 | | | Kentucky EDA, (Norton Healthcare, Inc.), (MBIA),
0.00%, 10/1/27 | | | 3,774,476 | | |
| | | | | | | $ | 4,667,495 | | |
| | Insured-Lease Revenue / Certificates of
Participation - 9.9% | | | | | | | | |
| $ | 1,350 | | | Hardin County, School District Finance Corp., School
Building, (FSA), 4.75%, 7/1/21 | | $ | 1,401,651 | | |
| | 1,000 | | | Letcher County, School District Finance Corp., School
Building, (FSA), 5.00%, 6/1/26 | | | 1,051,760 | | |
| | 1,000 | | | Louisville, Parking Authority, (MBIA), 5.00%, 6/1/32 | | | 1,030,910 | | |
| | 1,000 | | | Puerto Rico Public Building Authority, (AMBAC),
5.50%, 7/1/21 | | | 1,174,010 | | |
| | 1,000 | | | Puerto Rico Public Building Authority, (XLCA),
5.50%, 7/1/21 | | | 1,164,830 | | |
| | 300 | | | Puerto Rico Public Finance Corp., (AMBAC),
Variable Rate, 12.857%, 6/1/24(1)(2) | | | 402,168 | | |
| | | | | | | $ | 6,225,329 | | |
See notes to financial statements
41
Eaton Vance Kentucky Municipals Fund as of February 28, 2005
PORTFOLIO OF INVESTMENTS (Unaudited) CONT'D
Principal Amount
(000's omitted) | |
Security | |
Value | |
| Insured-Special Tax Revenue - 2.1% | | | | | |
| $ | 1,000 | | | Puerto Rico Infrastructure Financing Authority, (AMBAC),
5.00%, 7/1/28 | | $ | 1,044,190 | | |
| | 250 | | | Puerto Rico Infrastructure Financing Authority, (AMBAC),
Variable Rate, 8.381%, 7/1/28(1)(3) | | | 272,095 | | |
| | | | | | | $ | 1,316,285 | | |
| Insured-Transportation - 16.8% | | | | | |
| $ | 3,000 | | | Kenton County Airport, (MBIA), (AMT),
6.30%, 3/1/15(4) | | $ | 3,240,990 | | |
| | 1,195 | | | Kenton County Airport, (MBIA), (AMT), 6.45%, 3/1/15 | | | 1,324,168 | | |
| | 1,000 | | | Kentucky EDA, (State Turnpike Revitalization), (FGIC),
0.00%, 1/1/10 | | | 850,200 | | |
| | 750 | | | Louisville and Jefferson County, Regional Airport Authority,
(MBIA), (AMT), 5.00%, 7/1/25 | | | 762,420 | | |
| | 5,000 | | | Puerto Rico Highway and Transportation Authority,
(AMBAC), 0.00%, 7/1/18 | | | 2,860,450 | | |
| | 1,500 | | | Puerto Rico Highway and Transportation Authority,
(AMBAC), 5.00%, 7/1/28 | | | 1,566,405 | | |
| | | | | | | $ | 10,604,633 | | |
| Insured-Water and Sewer - 7.4% | | | | | |
| $ | 1,500 | | | Boone-Florence Water Commission, Water Supply System,
(FGIC), 5.00%, 12/1/27 | | $ | 1,564,545 | | |
| | 1,000 | | | Campbell and Kenton County, District No. 1, (FSA),
5.00%, 8/1/31 | | | 1,032,820 | | |
| | 2,000 | | | Louisville and Jefferson County, Metropolitan Sewer
District and Drainage System, (FGIC), 5.00%, 5/15/38 | | | 2,093,280 | | |
| | | | | | | $ | 4,690,645 | | |
| Lease Revenue / Certificates of Participation - 9.5% | | | | | |
| $ | 1,000 | | | Jefferson County, (Capital Projects Corp.),
0.00%, 8/15/12 | | $ | 751,740 | | |
| | 4,990 | | | Jefferson County, (Capital Projects Corp.),
0.00%, 8/15/15 | | | 3,185,367 | | |
| | 2,000 | | | Owensboro County, Airport Lease, (AMT),
5.875%, 6/1/15 | | | 2,043,100 | | |
| | | | | | | $ | 5,980,207 | | |
Principal Amount
(000's omitted) | |
Security | |
Value | |
| Senior Living / Life Care - 5.1% | | | | | |
| $ | 3,000 | | | Kenton County, (Highland Terrace), (AMT), FHA,
6.95%, 12/1/26 | | $ | 3,217,290 | | |
| | | | | $ | 3,217,290 | | |
Total Tax-Exempt Investments - 97.2%
(identified cost $55,930,499) | | | | $ | 61,393,600 | | |
| Other Assets, Less Liabilities - 2.8% | | | | $ | 1,740,631 | | |
| Net Assets - 100.0% | | | | $ | 63,134,231 | | |
AMT - Interest earned from these securities may be considered a tax preference item for purposes of the Federal Alternative Minimum Tax.
AMBAC - AMBAC Financial Group, Inc.
FGIC - Financial Guaranty Insurance Company
FSA - Financial Security Assurance, Inc.
MBIA - Municipal Bond Insurance Association
XLCA - XL Capital Assurance, Inc.
The Fund invests primarily in debt securities issued by Kentucky municipalities. The ability of the issuers of the debt securities to meet their obligations may be affected by economic developments in a specific industry or municipality. In order to reduce the risk associated with such economic developments, at February 28, 2005, 57.4% of the securities in the portfolio of investments are backed by bond insurance of various financial institutions and financial guaranty assurance agencies. The aggregate percentage insured by an individual financial institution ranged from 1.9% to 23.0% of total investments.
(1) Security exempt from registration under Rule 144A of the Securities Act of 1933. These securities may be sold in transactions exempt from registration, normally to qualified institutional buyers. At February 28, 2005, the aggregate value of the securities is $1,419,601 or 2.2% of the Fund's net assets.
(2) Security has been issued as a leveraged inverse floater bond. The stated interest rate represents the rate in effect at February 28, 2005.
(3) Security has been issued as an inverse floater bond. The stated interest rate represents the rate in effect at February 28, 2005.
(4) Security (or a portion thereof) has been segregated to cover margin requirements on open financial futures contracts.
See notes to financial statements
42
Eaton Vance Louisiana Municipals Fund as of February 28, 2005
PORTFOLIO OF INVESTMENTS (Unaudited)
Tax-Exempt Investments - 97.5% | | | | | |
Principal Amount
(000's omitted) | |
Security | |
Value | |
| Escrowed / Prerefunded - 2.1% | | | | | |
| $ | 560 | | | Louisiana Public Facilities Authority, (General Health Systems),
Prerefunded to 11/1/06, 6.80%, 11/1/16 | | $ | 591,797 | | |
| | | | | | | $ | 591,797 | | |
| Hospital - 1.8% | | | | | |
| $ | 500 | | | Louisiana Public Facilities Authority, (Tuoro Infirmary),
5.625%, 8/15/29 | | $ | 510,435 | | |
| | | | | | | $ | 510,435 | | |
| Housing - 5.0% | | | | | |
| $ | 155 | | | Louisiana HFA, Single Family, (GNMA), (AMT),
8.00%, 3/1/25 | | $ | 155,443 | | |
| | 855 | | | Louisiana HFA, Single Family, (GNMA/FNMA),
0.00%, 6/1/27 | | | 256,261 | | |
| | 390 | | | Louisiana Public Facilities Authority, (Eden Point),
6.25%, 3/1/34 | | | 338,196 | | |
| | 660 | | | New Orleans Home Mortgage Authority, Single Family,
(GNMA/FNMA), (AMT), 6.30%, 6/1/28 | | | 674,725 | | |
| | | | | | | $ | 1,424,625 | | |
| Industrial Development Revenue - 5.3% | | | | | |
| $ | 450 | | | Louisiana Environmental Facilities and Community
Development Authority, (Senior-Air Cargo), (AMT),
6.65%, 1/1/25 | | $ | 473,346 | | |
| | 500 | | | Saint Bernard Parish, (Mobil Oil), (AMT), 5.90%, 11/1/26 | | | 522,780 | | |
| | 500 | | | South Louisiana Port Commission, (Cargill), 5.85%, 4/1/17 | | | 525,510 | | |
| | | | | | | $ | 1,521,636 | | |
| Insured-Education - 16.4% | | | | | |
| $ | 500 | | | Lafayette Public Trust Financing Authority,
(Ragin Cajun Facility, Inc.), (MBIA), 5.00%, 10/1/32 | | $ | 519,085 | | |
| | 500 | | | Louisiana Environmental Facilities and Community
Development Authority, (Louisiana State University Student
Housing), (MBIA), 4.75%, 8/1/28 | | | 506,240 | | |
| | 1,000 | | | Louisiana Public Facilities Authority, (Dillard University),
(AMBAC), 5.30%, 8/1/26 | | | 1,076,120 | | |
| | 750 | | | Louisiana Public Facilities Authority, (Tulane University),
(AMBAC), 5.00%, 7/1/32 | | | 772,942 | | |
| | 500 | | | Louisiana Public Facilities Authority, (Tulane University),
(AMBAC), 5.00%, 2/15/26 | | | 518,275 | | |
| | 1,200 | | | New Orleans, Finance Authority, (Xavier University), (MBIA),
5.30%, 6/1/32 | | | 1,282,236 | | |
| | | | | | | $ | 4,674,898 | | |
Principal Amount
(000's omitted) | |
Security | |
Value | |
| | Insured-Electric Utilities - 2.7% | | | | | | | | |
| $ | 1,250 | | | Puerto Rico Electric Power Authority, (MBIA),
0.00%, 7/1/17 | | $ | 760,237 | | |
| | | | | | | $ | 760,237 | | |
| | Insured-Escrowed / Prerefunded - 6.7% | | | | | | | | |
| $ | 2,475 | | | Jefferson Parish, Home Mortgage Authority, Single Family,
(FGIC), Escrowed to Maturity, 0.00%, 5/1/17(1) | | $ | 1,453,493 | | |
| | 335 | | | Puerto Rico, (FGIC), Prerefunded to 7/1/12, Variable Rate,
10.113%, 7/1/32(2)(3) | | | 441,751 | | |
| | | | | | | $ | 1,895,244 | | |
| | Insured-General Obligations - 11.5% | | | | | | | | |
| $ | 250 | | | Calcasieu Parish, School District, (FGIC), 5.25%, 5/1/20 | | $ | 269,427 | | |
| | 500 | | | Louisiana, (FGIC), 5.00%, 11/15/20 | | | 530,795 | | |
| | 2,250 | | | New Orleans, (AMBAC), 0.00%, 9/1/15 | | | 1,437,840 | | |
| | 800 | | | New Orleans, (AMBAC), 0.00%, 9/1/16 | | | 483,872 | | |
| | 300 | | | Puerto Rico, (FSA), Variable Rate,
16.243%, 7/1/27(2)(3) | | | 377,373 | | |
| | 120 | | | Puerto Rico, (MBIA), Variable Rate,
12.295%, 7/1/20(2)(3) | | | 183,042 | | |
| | | | | | | $ | 3,282,349 | | |
| | Insured-Hospital - 2.9% | | | | | | | | |
| $ | 750 | | | Terrebonne Parish, Hospital Service District No. 1, (Terrebonne
General Medical Center), (AMBAC), 5.50%, 4/1/33 | | $ | 813,030 | | |
| | | | | | | $ | 813,030 | | |
| | Insured-Industrial Development
Revenue - 4.5% | | | | | | | | |
| $ | 1,250 | | | Louisiana Environmental Facilities and Community
Development Authority, (BRCC Facility Corp.), (MBIA),
5.00%, 12/1/32 | | $ | 1,290,050 | | |
| | | | | | | $ | 1,290,050 | | |
| | Insured-Lease Revenue / Certificates of
Participation - 4.5% | | | | | | | | |
| $ | 500 | | | Calcasieu Parish Public Trust Authority Student Lease,
(McNeese Student Housing), (MBIA), 5.25%, 5/1/33 | | $ | 529,565 | | |
| | 500 | | | Louisiana Environmental Facilities and Community
Development Authority, (Jefferson Parking Garage), (AMBAC),
5.00%, 9/1/31 | | | 514,395 | | |
| | 180 | | | Puerto Rico Public Finance Corp., (AMBAC),
Variable Rate, 12.857%, 6/1/24(2)(3) | | | 241,301 | | |
| | | | | | | $ | 1,285,261 | | |
See notes to financial statements
43
Eaton Vance Louisiana Municipals Fund as of February 28, 2005
PORTFOLIO OF INVESTMENTS (Unaudited) CONT'D
Principal Amount
(000's omitted) | |
Security | |
Value | |
| Insured-Other Revenue - 4.4% | | | | | |
| $ | 500 | | | Louisiana Environmental Facilities and Community
Development Authority, (Capital and Equipment Acquisition),
(AMBAC), 4.50%, 12/1/18 | | $ | 518,975 | | |
| | 700 | | | Louisiana Environmental Facilities and Community
Development Authority, (Parking Facility Corp. Garage),
(AMBAC), 5.375%, 10/1/31 | | | 748,860 | | |
| | | | | | | $ | 1,267,835 | | |
| Insured-Special Tax Revenue - 10.4% | | | | | |
| $ | 750 | | | Jefferson, District Sales Tax and Sales Tax Revenue, (AMBAC),
5.25%, 12/1/22 | | $ | 817,335 | | |
| | 1,000 | | | Louisiana Gas and Fuels Tax, (AMBAC), 5.00%, 6/1/32 | | | 1,030,290 | | |
| | 650 | | | Puerto Rico Infrastructure Financing Authority, (AMBAC),
Variable Rate, 8.381%, 7/1/28(2)(4) | | | 707,447 | | |
| | 350 | | | Puerto Rico Infrastructure Financing Authority, (AMBAC),
Variable Rate, 10.286%, 7/1/28(2)(3) | | | 396,400 | | |
| | | | | | | $ | 2,951,472 | | |
| Other Revenue - 6.5% | | | | | |
| $ | 350 | | | Puerto Rico Infrastructure Financing Authority,
Variable Rate, 17.229%, 10/1/32(2)(3) | | $ | 457,394 | | |
| | 1,425 | | | Tobacco Settlement Financing Corp., 5.875%, 5/15/39 | | | 1,404,181 | | |
| | | | | | | $ | 1,861,575 | | |
| Senior Living / Life Care - 4.5% | | | | | |
| $ | 500 | | | Louisiana HFA, (Saint Dominic Assisted Care Facility),
(GNMA), 6.85%, 9/1/25 | | $ | 520,645 | | |
| | 750 | | | Louisiana PFA, (Glen Retirement System), 6.70%, 12/1/25 | | | 775,133 | | |
| | | | | | | $ | 1,295,778 | | |
| Transportation - 8.3% | | | | | |
| $ | 1,000 | | | Louisiana Offshore Terminal Authority, Deepwater Port
Revenue, (Loop, LLC), 5.20%, 10/1/18 | | $ | 1,034,460 | | |
| | 1,000 | | | Puerto Rico Highway and Transportation Authority,
5.00%, 7/1/42 | | | 1,022,380 | | |
| | 295 | | | Puerto Rico Highway and Transportation Authority,
5.125%, 7/1/43 | | | 305,661 | | |
| | | | | | | $ | 2,362,501 | | |
| | Total Tax-Exempt Investments - 97.5%
(identified cost $25,806,793) | | | | | $ | 27,788,723 | | |
| | Other Assets, Less Liabilities - 2.5% | | | | | $ | 704,938 | | |
| | Net Assets - 100.0% | | | | | $ | 28,493,661 | | |
AMT - Interest earned from these securities may be considered a tax preference item for purposes of the Federal Alternative Minimum Tax.
AMBAC - AMBAC Financial Group, Inc.
FGIC - Financial Guaranty Insurance Company
FSA - Financial Security Assurance, Inc.
MBIA - Municipal Bond Insurance Association
The Fund invests primarily in debt securities issued by Louisiana municipalities. The ability of the issuers of the debt securities to meet their obligations may be affected by economic developments in a specific industry or municipality. In order to reduce the risk associated with such economic developments, at February 28, 2005, 65.6% of the securities in the portfolio of investments are backed by bond insurance of various financial institutions and financial guaranty assurance agencies. The aggregate percentage insured by an individual financial institution ranged from 1.4% to 36.3% of total investments.
(1) Security (or a portion thereof) has been segregated to cover margin requirements on open financial futures contracts.
(2) Security exempt from registration under Rule 144A of the Securities Act of 1933. These securities may be sold in transactions exempt from registration, normally to qualified institutional buyers. At February 28, 2005, the aggregate value of the securities is $2,804,708 or 9.8% of the Fund's net assets.
(3) Security has been issued as a leveraged inverse floater bond. The stated interest rate represents the rate in effect at February 28, 2005.
(4) Security has been issued as an inverse floater bond. The stated interest rate represents the rate in effect at February 28, 2005.
See notes to financial statements
44
Eaton Vance Maryland Municipals Fund as of February 28, 2005
PORTFOLIO OF INVESTMENTS (Unaudited)
| Tax-Exempt Investments - 99.0% | | | | | |
Principal Amount
(000's omitted) | |
Security | |
Value | |
| Cogeneration - 1.8% | | | | | |
| $ | 1,250 | | | Maryland Energy Cogeneration, (AES Warrior Run), (AMT),
7.40%, 9/1/19 | | $ | 1,277,412 | | |
| | | | | | | $ | 1,277,412 | | |
| Education - 9.4% | | | | | |
| $ | 4,000 | | | Maryland HEFA, (Johns Hopkins University),
5.00%, 7/1/32 | | $ | 4,137,520 | | |
| | 1,300 | | | Maryland HEFA, (Maryland Institute College of Art),
5.50%, 6/1/32 | | | 1,361,815 | | |
| | 500 | | | Maryland HEFA, (Maryland Institute College of Art),
5.50%, 6/1/21 | | | 529,065 | | |
| | 425 | | | Westminster, Educational Facilities, (McDaniel College),
5.50%, 4/1/27 | | | 450,236 | | |
| | | | | | | $ | 6,478,636 | | |
| Electric Utilities - 5.5% | | | | | |
| $ | 1,500 | | | Calvert, PCR, (Baltimore Gas and Electric),
5.55%, 7/15/14 | | $ | 1,531,935 | | |
| | 2,225 | | | Prince George's County, PCR, (Potomac Electric),
6.375%, 1/15/23 | | | 2,247,762 | | |
| | | | | | | $ | 3,779,697 | | |
| Escrowed / Prerefunded - 7.3% | | | | | |
| $ | 1,125 | | | Baltimore, SFMR, (Inner Harbor), Escrowed to Maturity,
8.00%, 12/1/10 | | $ | 1,400,329 | | |
| | 3,250 | | | Maryland HEFA, (Johns Hopkins University),
Prerefunded to 7/1/09, 6.00%, 7/1/39(1) | | | 3,681,795 | | |
| | | | | | | $ | 5,082,124 | | |
| General Obligations - 4.8% | | | | | |
| $ | 1,000 | | | Montgomery County, 5.25%, 10/1/19 | | $ | 1,101,390 | | |
| | 1,100 | | | Puerto Rico, 0.00%, 7/1/16 | | | 682,352 | | |
| | 1,500 | | | Puerto Rico, 5.00%, 7/1/25 | | | 1,564,740 | | |
| | | | | | | $ | 3,348,482 | | |
| Health Care - Miscellaneous - 2.0% | | | | | |
| $ | 1,305 | | | Baltimore County, Economic Development Revenue,
(Revisions, Inc.), 8.50%, 8/15/25 | | $ | 1,358,192 | | |
| | | | | | | $ | 1,358,192 | | |
Principal Amount
(000's omitted) | |
Security | |
Value | |
| Hospital - 8.0% | | | | | |
| $ | 1,000 | | | Maryland HEFA, (Calvert Health System),
5.50%, 7/1/36 | | $ | 1,051,590 | | |
| | 2,000 | | | Maryland HEFA, (Johns Hopkins Hospital),
5.125%, 11/15/34 | | | 2,081,840 | | |
| | 1,000 | | | Maryland HEFA, (Lifebridge Health), 5.125%, 7/1/34 | | | 1,029,560 | | |
| | 800 | | | Maryland HEFA, (University of Maryland Medical System),
6.75%, 7/1/30 | | | 900,192 | | |
| | 1,355 | | | Prince George's County, (Greater SouthEast Healthcare
System), 6.375%, 1/1/13(2) | | | 130,757 | | |
| | 3,800 | | | Prince George's County, (Greater SouthEast Healthcare
System), 6.375%, 1/1/23(2) | | | 366,700 | | |
| | | | | | | $ | 5,560,639 | | |
| Housing - 3.0% | | | | | |
| $ | 1,000 | | | Maryland Community Development Administration
Multifamily, FHA, (AMT), 6.70%, 5/15/36 | | $ | 1,022,760 | | |
| | 1,000 | | | Prince George's County, Housing Authority, (Langely Gardens),
(AMT), 5.875%, 2/20/39 | | | 1,042,920 | | |
| | | | | | | $ | 2,065,680 | | |
| Industrial Development Revenue - 1.7% | | | | | |
| $ | 1,000 | | | Maryland EDA, (AFCO Cargo), (AMT), 6.50%, 7/1/24 | | $ | 935,800 | | |
| | 240 | | | Maryland EDA, (Air Cargo), (AMT), 7.34%, 7/1/24 | | | 243,413 | | |
| | | | | | | $ | 1,179,213 | | |
| Insured-Education - 5.9% | | | | | |
| $ | 460 | | | Maryland HEFA, (College Of Notre Dame), (MBIA),
5.30%, 10/1/18 | | $ | 525,072 | | |
| | 2,000 | | | Maryland HEFA, (Loyola College), (MBIA),
5.375%, 10/1/26 | | | 2,109,760 | | |
| | 1,200 | | | Morgan State University, Academic and Facilities, (MBIA),
6.10%, 7/1/20 | | | 1,469,832 | | |
| | | | | | | $ | 4,104,664 | | |
| Insured-Electric Utilities - 5.1% | | | | | |
| $ | 1,500 | | | Puerto Rico Electric Power Authority, (FSA),
5.125%, 7/1/26 | | $ | 1,602,045 | | |
| | 1,550 | | | Puerto Rico Electric Power Authority, (FSA),
Variable Rate, 11.487%, 7/1/29(3)(4) | | | 1,915,893 | | |
| | | | | | | $ | 3,517,938 | | |
See notes to financial statements
45
Eaton Vance Maryland Municipals Fund as of February 28, 2005
PORTFOLIO OF INVESTMENTS (Unaudited) CONT'D
Principal Amount
(000's omitted) | |
Security | |
Value | |
| Insured-Escrowed / Prerefunded - 6.4% | | | | | |
| $ | 1,175 | | | Maryland HEFA, (Good Samaritan Hospital), (AMBAC),
Escrowed to Maturity, 5.75%, 7/1/19 | | $ | 1,202,577 | | |
| | 3,000 | | | Maryland HEFA, (Helix Health Issue), (AMBAC), Escrowed to
Maturity, 5.00%, 7/1/27 | | | 3,235,020 | | |
| | | | | | | $ | 4,437,597 | | |
| Insured-General Obligations - 2.3% | | | | | |
| $ | 350 | | | Puerto Rico, (FSA), Variable Rate, 16.243%, 7/1/27(3)(4) | | $ | 440,269 | | |
| | 1,000 | | | Puerto Rico, (MBIA), 5.50%, 7/1/29 | | | 1,170,730 | | |
| | | | | | | $ | 1,610,999 | | |
| Insured-Hospital - 8.4% | | | | | |
| $ | 1,280 | | | Maryland HEFA, (Medlantic), (AMBAC),
Variable Rate, 11.505%, 8/15/38(3)(4) | | $ | 1,764,736 | | |
| | 745 | | | Maryland HEFA, (Medlantic/Helix Issue), (AMBAC),
5.25%, 8/15/38 | | | 839,041 | | |
| | 3,150 | | | Puerto Rico ITEM & EC, (Auxilio Mutuo Obligated Group),
(MBIA), 6.25%, 7/1/24 | | | 3,233,664 | | |
| | | | | | | $ | 5,837,441 | | |
Insured-Lease Revenue / Certificates of
Participation - 1.0% | | | | | |
| $ | 500 | | | Puerto Rico Public Finance Corp., (AMBAC),
Variable Rate, 12.857%, 6/1/24(3)(4) | | $ | 670,280 | | |
| | | | | | | $ | 670,280 | | |
| Insured-Other Revenue - 1.5% | | | | | |
| $ | 1,000 | | | Maryland HEFA, (Johns Hopkins Hospital), Parking Revenue,
(AMBAC), 5.00%, 7/1/34 | | $ | 1,040,050 | | |
| | | | | | | $ | 1,040,050 | | |
| Insured-Special Tax Revenue - 1.6% | | | | | |
| $ | 1,000 | | | Puerto Rico Infrastructure Financing Authority, (AMBAC),
Variable Rate, 8.381%, 7/1/28(3)(5) | | $ | 1,088,380 | | |
| | | | | | | $ | 1,088,380 | | |
| Insured-Transportation - 7.5% | | | | | |
| $ | 1,000 | | | Maryland Transportation Authority, (FSA), 5.00%, 7/1/34 | | $ | 1,045,890 | | |
| | 1,500 | | | Maryland Transportation Authority, Baltimore-Washington
International Airport, (AMBAC), 5.00%, 3/1/27 | | | 1,572,690 | | |
| | 1,500 | | | Maryland Transportation Authority, Baltimore-Washington
International Airport, (AMBAC), (AMT), 5.25%, 3/1/27 | | | 1,585,830 | | |
Principal Amount
(000's omitted) | |
Security | |
Value | |
| | Insured-Transportation (continued) | | | | | | | | |
| $ | 500 | | | Puerto Rico Highway and Transportation Authority, (MBIA),
5.50%, 7/1/36 | | $ | 564,795 | | |
| | 335 | | | Puerto Rico Highway and Transportation Authority, (MBIA),
Variable Rate, 13.274%, 7/1/26(3)(4) | | | 390,111 | | |
| | | | | | | $ | 5,159,316 | | |
| | Insured-Water and Sewer - 8.0% | | | | | | | | |
| $ | 1,500 | | | Baltimore, (Water Projects), (FGIC), 5.00%, 7/1/23 | | $ | 1,596,990 | | |
| | 500 | | | Baltimore, (Water Projects), (FGIC), 5.125%, 7/1/42 | | | 520,625 | | |
| | 1,000 | | | Baltimore, Wastewater, (FGIC), 5.00%, 7/1/22 | | | 1,103,640 | | |
| | 2,000 | | | Baltimore, Wastewater, (MBIA), 5.65%, 7/1/20(6) | | | 2,321,720 | | |
| | | | | | | $ | 5,542,975 | | |
| | Other Revenue - 2.9% | | | | | | | | |
| $ | 895 | | | Maryland HEFA, (Board of Child Care), 5.375%, 7/1/32 | | $ | 940,305 | | |
| | 1,000 | | | Maryland HEFA, (Board of Child Care), 5.625%, 7/1/22 | | | 1,081,290 | | |
| | | | | | | $ | 2,021,595 | | |
| | Special Tax Revenue - 4.2% | | | | | | | | |
| $ | 845 | | | Anne Arundel County, (Consolidated Water and Sewer),
Limited Tax General Obligation, 4.375%, 3/1/31(7) | | $ | 825,734 | | |
| | 750 | | | Baltimore, (Clipper Mill), 6.25%, 9/1/33 | | | 745,545 | | |
| | 500 | | | Baltimore, (Strathdale Manor), 7.00%, 7/1/33 | | | 509,360 | | |
| | 800 | | | Frederick County, Urbana Community Development Authority,
6.625%, 7/1/25 | | | 830,672 | | |
| | | | | | | $ | 2,911,311 | | |
| | Water and Sewer - 0.7% | | | | | | | | |
| $ | 480 | | | Maryland Water Quality Financing Administration Revolving
Loan Fund, 6.55%, 9/1/14 | | $ | 481,862 | | |
| | | | | | | $ | 481,862 | | |
| | Total Tax-Exempt Investments - 99.0%
(identified cost $68,494,520) | | | | | $ | 68,554,483 | | |
| | Other Assets, Less Liabilities - 1.0% | | | | | $ | 689,491 | | |
| | Net Assets - 100.0% | | | | | $ | 69,243,974 | | |
See notes to financial statements
46
Eaton Vance Maryland Municipals Fund as of February 28, 2005
PORTFOLIO OF INVESTMENTS (Unaudited) CONT'D
AMT - Interest earned from these securities may be considered a tax preference item for purposes of the Federal Alternative Minimum Tax.
AMBAC - AMBAC Financial Group, Inc.
FGIC - Financial Guaranty Insurance Company
FSA - Financial Security Assurance, Inc.
MBIA - Municipal Bond Insurance Association
The Fund invests primarily in debt securities issued by Maryland municipalities. The ability of the issuers of the debt securities to meet their obligations may be affected by economic developments in a specific industry or municipality. In order to reduce the risk associated with such economic developments, at February 28, 2005, 48.2% of the securities in the portfolio of investments are backed by bond insurance of various financial institutions and financial guaranty assurance agencies. The aggregate percentage insured by an individual financial institution ranged from 4.7% to 19.0% of total investments.
(1) Security (or a portion thereof) has been segregated to cover margin requirements on open financial futures contracts.
(2) Defaulted bond.
(3) Security exempt from registration under Rule 144A of the Securities Act of 1933. These securities may be sold in transactions exempt from registration, normally to qualified institutional buyers. At February 28, 2005, the aggregate value of the securities is $6,269,669 or 9.1% of the Fund's net assets.
(4) Security has been issued as a leveraged inverse floater bond. The stated interest rate represents the rate in effect at February 28, 2005.
(5) Security has been issued as an inverse floater bond. The stated interest rate represents the rate in effect at February 28, 2005.
(6) Security (or a portion thereof) has been segregated to cover when-issued securities.
(7) When-issued security.
See notes to financial statements
47
Eaton Vance Missouri Municipals Fund as of February 28, 2005
PORTFOLIO OF INVESTMENTS (Unaudited)
| |
Tax-Exempt Investments - 98.0% | | | | | | | | |
Principal Amount
(000's omitted) | |
Security | |
Value | |
| | Education - 2.4% | | | | | | | | |
| $ | 1,500 | | | Missouri HEFA, (Washington University of St. Louis),
5.00%, 2/15/33 | | $ | 1,555,290 | | |
| | | | | | | $ | 1,555,290 | | |
| | Escrowed / Prerefunded - 3.5% | | | | | | | | |
| $ | 1,000 | | | Lake of the Ozarks, (Community Bridge Corp.), Prerefunded
to 12/1/06, 6.40%, 12/1/25 | | $ | 1,085,320 | | |
| | 1,000 | | | Saint Louis County, Mortgage Revenue, (GNMA), (AMT),
Escrowed to Maturity, 5.40%, 1/1/16 | | | 1,118,850 | | |
| | | | | | | $ | 2,204,170 | | |
| | General Obligations - 1.2% | | | | | | | | |
| $ | 750 | | | Puerto Rico Public Buildings Authority, 5.25%, 7/1/33 | | $ | 796,582 | | |
| | | | | | | $ | 796,582 | | |
| | Hospital - 11.2% | | | | | | | | |
| $ | 400 | | | Joplin, IDA, (Freeman Health Systems),
5.375%, 2/15/35 | | $ | 404,888 | | |
| | 1,950 | | | Missouri HEFA, (Barnes Jewish Christian),
5.25%, 5/15/14 | | | 2,138,233 | | |
| | 1,500 | | | Missouri HEFA, (Childrens Mercy Hospital),
5.30%, 5/15/28 | | | 1,537,965 | | |
| | 1,000 | | | Missouri HEFA, (Freeman Health Systems),
5.25%, 2/15/18 | | | 1,019,820 | | |
| | 495 | | | Missouri HEFA, (Lake of the Ozarks General Hospital),
6.50%, 2/15/21 | | | 511,261 | | |
| | 250 | | | Missouri HEFA, (Lake Regional Health System),
5.70%, 2/15/34 | | | 261,520 | | |
| | 1,250 | | | West Plains IDA, (Ozarks Medical Center),
5.65%, 11/15/22 | | | 1,241,450 | | |
| | | | | | | $ | 7,115,137 | | |
| | Housing - 2.7% | | | | | | | | |
| $ | 945 | | | Jefferson County IDA, Multifamily, (Riverview Bend
Apartments), (AMT), 6.75%, 11/1/29 | | $ | 923,265 | | |
| | 190 | | | Missouri Housing Development Authority, SFMR, (GNMA),
(AMT), 6.45%, 9/1/27 | | | 191,440 | | |
| | 70 | | | Missouri Housing Development Authority, SFMR, (GNMA),
(AMT), 7.25%, 9/1/26 | | | 70,100 | | |
| | 505 | | | Missouri Housing Development Commission, (AMT),
5.05%, 1/1/24 | | | 515,060 | | |
| | | | | | | $ | 1,699,865 | | |
Principal Amount
(000's omitted) | |
Security | |
Value | |
| | Industrial Development Revenue - 7.4% | | | | | | | | |
| $ | 675 | | | Jefferson County, (Kmart Corp.), 6.40%, 8/1/08 | | $ | 648,594 | | |
| | 625 | | | Kansas City IDA, (Airline Cargo Facilities), (AMT),
8.50%, 1/1/17 | | | 654,425 | | |
| | 1,000 | | | Missouri Development Finance Authority, Solid Waste
Disposal, (Proctor and Gamble Paper Products), (AMT),
5.20%, 3/15/29 | | | 1,079,850 | | |
| | 1,200 | | | Missouri Environmental Improvement and Energy
Resources Authority, (American Cyanamid),
5.80%, 9/1/09 | | | 1,289,220 | | |
| | 1,000 | | | Saint Louis, IDA, (Anheuser-Busch), (AMT),
5.875%, 11/1/26 | | | 1,029,070 | | |
| | | | | | | $ | 4,701,159 | | |
| | Insured-Education - 5.0% | | | | | | | | |
| $ | 1,000 | | | Missouri HEFA, (St. Louis University High School),
(AMBAC), 4.75%, 10/1/24 | | $ | 1,014,810 | | |
| | 1,000 | | | Northwest, Missouri State University, (Housing System),
(MBIA), 4.50%, 6/1/25 | | | 995,330 | | |
| | 1,190 | | | Northwest, Missouri State University, (Housing System),
(MBIA), 4.50%, 6/1/28 | | | 1,173,875 | | |
| | | | | | | $ | 3,184,015 | | |
| | Insured-Electric Utilities - 6.3% | | | | | | | | |
| $ | 2,250 | | | Missouri Environmental Improvement and Energy Resources
Authority, (Union Electric), (AMBAC), (AMT),
5.45%, 10/1/28 | | $ | 2,356,920 | | |
| | 1,000 | | | Puerto Rico Electric Power Authority, (MBIA),
5.00%, 7/1/32(1) | | | 1,045,720 | | |
| | 400 | | | Puerto Rico Electric Power Authority, (MBIA), Variable Rate,
12.295%, 7/1/16(2)(3) | | | 591,892 | | |
| | | | | | | $ | 3,994,532 | | |
| | Insured-Escrowed / Prerefunded - 4.3% | | | | | | | | |
| $ | 575 | | | Missouri HEFA, (Saint Louis Children's Hospital), (MBIA),
Escrowed to Maturity, 0.00%, 5/15/08 | | $ | 523,681 | | |
| | 2,000 | | | Puerto Rico, (FGIC), Prerefunded to 7/1/12,
5.00%, 7/1/32 | | | 2,212,440 | | |
| | | | | | | $ | 2,736,121 | | |
| | Insured-General Obligations - 3.7% | | | | | | | | |
| $ | 900 | | | Puerto Rico, (FSA), Variable Rate,
16.243%, 7/1/27(2)(3) | | $ | 1,132,119 | | |
| | 2,000 | | | Saint Charles County, (Francis Howell School District),
(FGIC), 0.00%, 3/1/16 | | | 1,245,080 | | |
| | | | | | | $ | 2,377,199 | | |
See notes to financial statements
48
Eaton Vance Missouri Municipals Fund as of February 28, 2005
PORTFOLIO OF INVESTMENTS (Unaudited) CONT'D
Principal Amount
(000's omitted) | |
Security | |
Value | |
| Insured-Hospital - 9.8% | | | | | |
| $ | 9,500 | | | Missouri HEFA, (Lester Cox Medical Center), (MBIA),
0.00%, 9/1/20 | | $ | 4,664,215 | | |
| | 1,500 | | | North Kansas City, (North Kansas City Memorial Hospital),
(FSA), 5.125%, 11/15/33 | | | 1,572,480 | | |
| | | | | | | $ | 6,236,695 | | |
Insured-Lease Revenue / Certificates of
Participation - 12.6% | | | | | |
| $ | 1,000 | | | Jackson County, Leasehold Revenue, (Truman Sports),
(AMBAC), 0.00%, 12/1/20 | | $ | 484,630 | | |
| | 2,000 | | | Jackson County, Leasehold Revenue, (Truman Sports),
(MBIA), 5.00%, 12/1/27 | | | 2,084,020 | | |
| | 1,830 | | | Kansas City, Leasehold Revenue, (Municipal Assistance),
(AMBAC), 0.00%, 4/15/26 | | | 637,938 | | |
| | 2,105 | | | Kansas City, Leasehold Revenue, (Municipal Assistance),
(AMBAC), 0.00%, 4/15/30 | | | 596,683 | | |
| | 300 | | | Puerto Rico Public Building Authority, (CIFG), Variable Rate,
11.545%, 7/1/36(2)(3) | | | 386,493 | | |
| | 1,000 | | | Puerto Rico Public Finance Corp., (AMBAC), Variable Rate,
7.84%, 6/1/26(2)(4) | | | 1,159,180 | | |
| | 400 | | | Puerto Rico Public Finance Corp., (AMBAC), Variable Rate,
12.857%, 6/1/24(2)(3) | | | 536,224 | | |
| | 2,000 | | | Saint Louis IDA, (Convention Center Hotel), (AMBAC),
0.00%, 7/15/19 | | | 1,038,440 | | |
| | 1,000 | | | Springfield County, Leasehold Revenue, (Capital
Improvement Program), (AMBAC), 5.00%, 3/1/24 | | | 1,056,030 | | |
| | | | | | | $ | 7,979,638 | | |
| Insured-Other Revenue - 1.3% | | | | | |
| $ | 750 | | | Missouri Development Finance Authority, Cultural Facility,
(Nelson Gallery Foundation), (MBIA), 5.25%, 12/1/22 | | $ | 813,398 | | |
| | | | | | | $ | 813,398 | | |
| Insured-Special Tax Revenue - 6.3% | | | | | |
| $ | 1,000 | | | Bi-State Development Agency, Illinois Metropolitan District,
(Metrolink Cross County), (FSA), 5.00%, 10/1/32 | | $ | 1,039,960 | | |
| | 1,500 | | | Bi-State Development Agency, Illinois Metropolitan District,
(Saint Clair County Metrolink Extension), (MBIA),
5.00%, 7/1/28 | | | 1,547,460 | | |
| | 600 | | | Kansas City, (Blue Parkway Town Center), (MBIA),
5.00%, 7/1/27 | | | 628,002 | | |
| | 700 | | | Puerto Rico Infrastructure Financing Authority, (AMBAC),
Variable Rate, 10.286%, 7/1/28(2)(3) | | | 792,799 | | |
| | | | | | | $ | 4,008,221 | | |
Principal Amount
(000's omitted) | |
Security | |
Value | |
| | Insured-Transportation - 3.8% | | | | | | | | |
| $ | 500 | | | Puerto Rico Highway and Transportation Authority, (MBIA),
Variable Rate, 13.274%, 7/1/26(2)(3) | | $ | 582,255 | | |
| | 750 | | | Saint Louis Airport, (Capital Improvement Program),
(MBIA), 5.00%, 7/1/32 | | | 772,943 | | |
| | 910 | | | Saint Louis Airport, (Lambert International Airport), (FGIC),
(AMT), 6.00%, 7/1/14 | | | 1,048,730 | | |
| | | | | | | $ | 2,403,928 | | |
| | Insured-Water and Sewer - 2.1% | | | | | | | | |
| $ | 1,300 | | | Metro Saint Louis, Metropolitan Waste Water System,
(MBIA), 5.00%, 5/1/34 | | $ | 1,353,794 | | |
| | | | | | | $ | 1,353,794 | | |
| | Other Revenue - 0.8% | | | | | | | | |
| $ | 500 | | | Saint Louis IDA, (Saint Louis Science Center),
6.40%, 11/1/19 | | $ | 507,345 | | |
| | | | | | | $ | 507,345 | | |
| | Pooled Loans - 4.4% | | | | | | | | |
| $ | 2,750 | | | Missouri Higher Education Loan Authority, Student Loan,
(AMT), 5.45%, 2/15/09 | | $ | 2,781,488 | | |
| | | | | | | $ | 2,781,488 | | |
| | Senior Living / Life Care - 6.5% | | | | | | | | |
| $ | 1,000 | | | Kansas City IDR, (Kingswood Manor), 5.80%, 11/15/17 | | $ | 955,750 | | |
| | 500 | | | Lees Summit IDA, Health Facility, (John Knox Village),
5.70%, 8/15/22 | | | 529,810 | | |
| | 1,500 | | | Missouri HEFA, (Lutheran Senior Services),
6.375%, 2/1/27 | | | 1,553,115 | | |
| | 1,000 | | | Saint Louis County, IDA Health Facilities Revenue, (Jewish
Center), 5.50%, 2/20/36 | | | 1,064,750 | | |
| | | | | | | $ | 4,103,425 | | |
| | Transportation - 0.8% | | | | | | | | |
| $ | 500 | | | Puerto Rico Highway and Transportation Authority,
5.00%, 7/1/42 | | $ | 511,190 | | |
| | | | | | | $ | 511,190 | | |
| | Water and Sewer - 1.9% | | | | | | | | |
| $ | 520 | | | Missouri Environmental Improvement and Energy Resources
Authority, (Revolving Fund Program), 7.20%, 7/1/16 | | $ | 532,802 | | |
See notes to financial statements
49
Eaton Vance Missouri Municipals Fund as of February 28, 2005
PORTFOLIO OF INVESTMENTS (Unaudited) CONT'D
Principal Amount
(000's omitted) | |
Security | |
Value | |
| Water and Sewer (continued) | | | | | |
| $ | 1,000 | | | Missouri Environmental Improvement and Energy Resources
Authority, (Revolving Fund Program), Water Pollution
Control, 0.00%, 1/1/14 | | $ | 699,090 | | |
| | | | | $ | 1,231,892 | | |
Total Tax-Exempt Investments - 98.0%
(identified cost $57,066,445) | | | | $ | 62,295,084 | | |
| Other Assets, Less Liabilities - 2.0% | | | | $ | 1,260,791 | | |
| Net Assets - 100.0% | | | | $ | 63,555,875 | | |
AMT - Interest earned from these securities may be considered a tax preference item for purposes of the Federal Alternative Minimum Tax.
AMBAC - AMBAC Financial Group, Inc.
CIFG - CDC IXIS Financial Guaranty North America, Inc.
FGIC - Financial Guaranty Insurance Company
FSA - Financial Security Assurance, Inc.
MBIA - Municipal Bond Insurance Association
The Fund invests primarily in debt securities issued by Missouri municipalities. The ability of the issuers of the debt securities to meet their obligations may be affected by economic developments in a specific industry or municipality. In order to reduce the risk associated with such economic developments, at February 28, 2005, 56.3% of the securities in the portfolio of investments are backed by bond insurance of various financial institutions and financial guaranty assurance agencies. The aggregate percentage insured by an individual financial institution ranged from 0.6% to 26.9% of total investments.
(1) Security (or a portion thereof) has been segregated to cover margin requirements on open financial futures contracts.
(2) Security exempt from registration under Rule 144A of the Securities Act of 1933. These securities may be sold in transactions exempt from registration, normally to qualified institutional buyers. At February 28, 2005, the aggregate value of the securities is $5,180,962 or 8.2% of the Fund's net assets.
(3) Security has been issued as a leveraged inverse floater bond. The stated interest rate represents the rate in effect at February 28, 2005.
(4) Security has been issued as an inverse floater bond. The stated interest rate represents the rate in effect at February 28, 2005.
See notes to financial statements
50
Eaton Vance North Carolina Municipals Fund as of February 28, 2005
PORTFOLIO OF INVESTMENTS (Unaudited)
| |
Tax-Exempt Investments - 98.0% | | | | | | | | |
Principal Amount
(000's omitted) | |
Security | |
Value | |
| | Education - 10.9% | | | | | | | | |
| $ | 2,950 | | | North Carolina Educational Facilities Finance Agency, (Duke
University), 5.125%, 10/1/41 | | $ | 3,038,942 | | |
| | 7,410 | | | University of North Carolina at Chapel Hill, 0.00%, 8/1/17 | | | 4,314,843 | | |
| | 1,980 | | | University of North Carolina at Chapel Hill, 0.00%, 8/1/21 | | | 932,105 | | |
| | | | | | | $ | 8,285,890 | | |
| | Electric Utilities - 21.6% | | | | | | | | |
| $ | 5,000 | | | North Carolina Eastern Municipal Power Agency,
6.125%, 1/1/09 | | $ | 5,468,650 | | |
| | 1,250 | | | North Carolina Eastern Municipal Power Agency,
6.75%, 1/1/26 | | | 1,397,012 | | |
| | 3,500 | | | North Carolina Municipal Power Agency, (Catawba),
6.50%, 1/1/20 | | | 3,935,855 | | |
| | 2,000 | | | Puerto Rico Electric Power Authority, 0.00%, 7/1/17 | | | 1,206,140 | | |
| | 2,000 | | | Puerto Rico Electric Power Authority, 0.00%, 7/1/17 | | | 1,195,960 | | |
| | 2,000 | | | Puerto Rico Electric Power Authority, Variable Rate,
7.70%, 7/1/29(1)(2) | | | 2,191,880 | | |
| | 1,000 | | | Wake County, Industrial Facilities and Pollution Control
Financing Authority, (Carolina Power and Light Co.),
5.375%, 2/1/17 | | | 1,074,630 | | |
| | | | | | | $ | 16,470,127 | | |
| | Escrowed / Prerefunded - 13.6% | | | | | | | | |
| $ | 1,000 | | | Charlotte, Water and Sewer, Prerefunded to 6/1/10,
5.25%, 6/1/25 | | $ | 1,114,000 | | |
| | 1,000 | | | New Hanover County, Prerefunded to 11/1/10,
5.75%, 11/1/17 | | | 1,151,870 | | |
| | 3,000 | | | North Carolina Eastern Municipal Power Agency, Escrowed
to Maturity, 4.00%, 1/1/18 | | | 3,019,380 | | |
| | 2,210 | | | North Carolina Eastern Municipal Power Agency, Escrowed
to Maturity, 5.00%, 1/1/17(3) | | | 2,454,868 | | |
| | 440 | | | North Carolina Eastern Municipal Power Agency, Escrowed
to Maturity, 5.00%, 1/1/21 | | | 489,210 | | |
| | 1,500 | | | North Carolina Medical Care Commission, (Annie Penn
Memorial Hospital), Prerefunded to 1/1/15,
5.375%, 1/1/22 | | | 1,624,710 | | |
| | 465 | | | North Carolina Medical Care Commission, (Gaston Health
Care), Prerefunded to 2/15/08, 5.00%, 2/15/29 | | | 499,559 | | |
| | | | | | | $ | 10,353,597 | | |
| | General Obligations - 4.1% | | | | | | | | |
| $ | 1,000 | | | Charlotte, 5.00%, 7/1/29 | | $ | 1,047,500 | | |
| | 1,000 | | | Charlotte, 5.60%, 6/1/20 | | | 1,125,430 | | |
| | 1,000 | | | North Carolina, 4.00%, 3/1/24 | | | 944,520 | | |
| | | | | | | $ | 3,117,450 | | |
Principal Amount
(000's omitted) | |
Security | |
Value | |
| | Hospital - 5.4% | | | | | | | | |
| $ | 1,750 | | | Charlotte-Mecklenberg Hospital Authority,
5.00%, 1/15/31 | | $ | 1,784,597 | | |
| | 535 | | | North Carolina Medical Care Commission, (Gaston Health
Care), 5.00%, 2/15/29 | | | 540,725 | | |
| | 250 | | | North Carolina Medical Care Commission, (Novant Health,
Inc.), 5.00%, 11/1/20 | | | 262,915 | | |
| | 1,000 | | | North Carolina Medical Care Commission, (Southeastern
Regional Medical Center), 5.375%, 6/1/32 | | | 1,032,960 | | |
| | 500 | | | North Carolina Medical Care Commission, (Union Regional
Medical Center), 5.375%, 1/1/32 | | | 515,680 | | |
| | | | | | | $ | 4,136,877 | | |
| | Housing - 3.6% | | | | | | | | |
| $ | 1,400 | | | Charlotte Housing Authority, (Double Oaks), FHA, (FNMA),
7.35%, 5/15/26 | | $ | 1,472,590 | | |
| | 285 | | | Guam Housing Corp., Single Family, (AMT),
5.75%, 9/1/31 | | | 314,640 | | |
| | 795 | | | North Carolina HFA, MFMR, (AMT), 6.45%, 9/1/27 | | | 819,248 | | |
| | 970 | | | Raleigh Housing Authority, Multifamily, (Cedar Point),
7.00%, 11/1/30(4) | | | 97,000 | | |
| | | | | | | $ | 2,703,478 | | |
| | Insured-Education - 3.8% | | | | | | | | |
| $ | 1,375 | | | East Carolina University, (AMBAC), 5.25%, 11/1/21 | | $ | 1,496,550 | | |
| | 1,320 | | | North Carolina Educational Facilities Finance Agency,
(Johnson & Wales University), (XLCA), 5.00%, 4/1/33 | | | 1,362,029 | | |
| | | | | | | $ | 2,858,579 | | |
| | Insured-General Obligations - 2.7% | | | | | | | | |
| $ | 500 | | | Puerto Rico Commonwealth, (FGIC), 5.50%, 7/1/22 | | $ | 587,270 | | |
| | 280 | | | Puerto Rico, (MBIA), Variable Rate,
12.295%, 7/1/20(1)(5) | | | 427,098 | | |
| | 995 | | | Smithville Township, Brunswick County, (MBIA),
5.00%, 6/1/24 | | | 1,059,446 | | |
| | | | | | | $ | 2,073,814 | | |
| | Insured-Hospital - 6.9% | | | | | | | | |
| $ | 1,200 | | | North Carolina Medical Care Commission, (Betsy Johnson),
(FSA), 5.375%, 10/1/24 | | $ | 1,314,456 | | |
| | 2,000 | | | North Carolina Medical Care Commission, (Cleveland
County Healthcare), (AMBAC), 5.00%, 7/1/35 | | | 2,073,920 | | |
| | 935 | | | North Carolina Medical Care Commission, (Memorial
Mission Hospital), (FSA), 0.00%, 10/1/06 | | | 898,610 | | |
| | 1,500 | | | North Carolina Medical Care Commission, (Wilson
Memorial Hospital), (AMBAC), 0.00%, 11/1/15 | | | 962,685 | | |
| | | | | | | $ | 5,249,671 | | |
See notes to financial statements
51
Eaton Vance North Carolina Municipals Fund as of February 28, 2005
PORTFOLIO OF INVESTMENTS (Unaudited) CONT'D
Principal Amount
(000's omitted) | |
Security | |
Value | |
| | Insured-Lease Revenue / Certificates of
Participation - 0.7% | | | | | | | | |
| $ | 420 | | | Puerto Rico Public Finance Corp., (AMBAC), Variable Rate,
12.857%, 6/1/24(1)(5) | | $ | 563,035 | | |
| | | | | | | $ | 563,035 | | |
| | Insured-Special Tax Revenue - 1.2% | | | | | | | | |
| $ | 800 | | | Puerto Rico Infrastructure Financing Authority, (AMBAC),
Variable Rate, 8.381%, 7/1/28(1)(2) | | $ | 870,704 | | |
| | | | | | | $ | 870,704 | | |
| | Insured-Transportation - 5.6% | | | | | | | | |
| $ | 500 | | | Charlotte Airport, (MBIA), (AMT), 5.25%, 7/1/21 | | $ | 533,620 | | |
| | 1,375 | | | Puerto Rico Highway and Transportation Authority, (MBIA),
5.50%, 7/1/36 | | | 1,553,186 | | |
| | 1,000 | | | Puerto Rico Highway and Transportation Authority, (MBIA),
Variable Rate, 10.862%, 7/1/36(1)(5) | | | 1,169,370 | | |
| | 1,000 | | | Raleigh Durham, Airport Authority, (FGIC),
5.00%, 11/1/31 | | | 1,032,470 | | |
| | | | | | | $ | 4,288,646 | | |
| | Insured-Water and Sewer - 5.3% | | | | | | | | |
| $ | 1,745 | | | Broad River, Water Authority Water System, (MBIA),
5.375%, 6/1/26 | | $ | 1,889,957 | | |
| | 500 | | | Brunswick County, (FSA), Enterprise System Water and
Sewer Revenue, 5.25%, 4/1/26 | | | 541,870 | | |
| | 1,500 | | | Kannapolis, Water and Sewer, (FSA), (AMT),
5.25%, 2/1/26 | | | 1,579,860 | | |
| | | | | | | $ | 4,011,687 | | |
| | Lease Revenue / Certificates of Participation - 3.4% | | | | | | | | |
| $ | 1,000 | | | Charlotte, (Government Facilities), 5.00%, 6/1/28 | | $ | 1,037,950 | | |
| | 1,500 | | | Charlotte, (Government Facilities), 5.00%, 6/1/33 | | | 1,548,540 | | |
| | | | | | | $ | 2,586,490 | | |
| | Other Revenue - 1.7% | | | | | | | | |
| $ | 1,000 | | | Puerto Rico Infrastructure Financing Authority, Variable Rate,
17.23%, 10/1/34(1)(5) | | $ | 1,306,840 | | |
| | | | | | | $ | 1,306,840 | | |
| | Transportation - 1.0% | | | | | | | | |
| $ | 750 | | | Puerto Rico Highway and Transportation Authority,
5.125%, 7/1/43 | | $ | 777,105 | | |
| | | | | | | $ | 777,105 | | |
Principal Amount
(000's omitted) | |
Security | |
Value | |
| Water and Sewer - 6.5% | | | | | |
| $ | 1,700 | | | Charlotte, Storm Water, 5.00%, 6/1/25 | | $ | 1,784,405 | | |
| | 2,975 | | | Charlotte, Water and Sewer, 5.125%, 6/1/26 | | | 3,141,451 | | |
| | | | | $ | 4,925,856 | | |
Total Tax-Exempt Investments - 98.0%
(identified cost $69,449,635) | | | | $ | 74,579,846 | | |
| Other Assets, Less Liabilities - 2.0% | | | | $ | 1,543,386 | | |
| Net Assets - 100.0% | | | | $ | 76,123,232 | | |
AMT - Interest earned from these securities may be considered a tax preference item for purposes of the Federal Alternative Minimum Tax.
AMBAC - AMBAC Financial Group, Inc.
FGIC - Financial Guaranty Insurance Company
FSA - Financial Security Assurance, Inc.
MBIA - Municipal Bond Insurance Association
XLCA - XL Capital Assurance, Inc.
The Fund invests primarily in debt securities issued by North Carolina municipalities. The ability of the issuers of the debt securities to meet their obligations may be affected by economic developments in a specific industry or municipality. In order to reduce the risk associated with such economic developments, at February 28, 2005, 26.7% of the securities in the portfolio of investments are backed by bond insurance of various financial institutions and financial guaranty assurance agencies. The aggregate percentage insured by an individual financial institution ranged from 1.8% to 8.9% of total investments.
(1) Security exempt from registration under Rule 144A of the Securities Act of 1933. These securities may be sold in transactions exempt from registration, normally to qualified institutional buyers. At February 28, 2005, the aggregate value of the securities is $6,528,927 or 8.6% of the Fund's net assets.
(2) Security has been issued as an inverse floater bond. The stated interest rate represents the rate in effect at February 28, 2005.
(3) Security (or a portion thereof) has been segregated to cover margin requirements on open financial futures contracts.
(4) Defaulted bond.
(5) Security has been issued as a leveraged inverse floater bond. The stated interest rate represents the rate in effect at February 28, 2005.
See notes to financial statements
52
Eaton Vance Oregon Municipals Fund as of February 28, 2005
PORTFOLIO OF INVESTMENTS (Unaudited)
| Tax-Exempt Investments - 97.6% | | | | | |
Principal Amount
(000's omitted) | |
Security | |
Value | |
| Cogeneration - 2.5% | | | | | |
| $ | 2,000 | | | Western Generation Agency, (Wauna Cogeneration),
(AMT), 7.40%, 1/1/16 | | $ | 2,050,780 | | |
| | | | | | | $ | 2,050,780 | | |
| Electric Utilities - 2.5% | | | | | |
| $ | 1,000 | | | Northern Wasco County, (Bonneville Power Administration),
5.20%, 12/1/24 | | $ | 1,011,790 | | |
| | 1,000 | | | Port of Morrow, Pollution Control, (Portland General Electric),
5.20%, 5/1/33 | | | 1,056,650 | | |
| | | | | | | $ | 2,068,440 | | |
| Escrowed / Prerefunded - 6.0% | | | | | |
| $ | 2,000 | | | Medford, Rogue Valley Memorial Hospital, Escrowed to
Maturity, 6.25%, 12/1/07 | | $ | 2,177,500 | | |
| | 1,000 | | | Portland Housing Authority, MFMR, Prerefunded to
1/1/07, (Village Court), 6.00%, 1/1/27 | | | 1,059,690 | | |
| | 1,500 | | | Umatilla County, Hospital Facility Authority, (Catholic
Health Initiatives), Escrowed to Maturity, 5.50%, 3/1/32 | | | 1,675,470 | | |
| | | | | | | $ | 4,912,660 | | |
| General Obligations - 14.2% | | | | | |
| $ | 1,565 | | | Oregon Board of Higher Education, 0.00%, 8/1/20 | | $ | 774,816 | | |
| | 4,425 | | | Oregon Elderly and Disabled Housing, (AMT),
5.65%, 8/1/26 | | | 4,463,896 | | |
| | 790 | | | Oregon Veterans Welfare, 5.25%, 10/1/42 | | | 802,356 | | |
| | 1,880 | | | Oregon Veterans Welfare, 5.50%, 12/1/42 | | | 1,940,912 | | |
| | 550 | | | Oregon Veterans Welfare, 5.90%, 10/1/17 | | | 551,727 | | |
| | 1,250 | | | Portland, Community College District, 5.00%, 6/1/21 | | | 1,309,012 | | |
| | 500 | | | Puerto Rico, 0.00%, 7/1/17 | | | 291,855 | | |
| | 1,500 | | | Puerto Rico, 5.00%, 7/1/25 | | | 1,564,740 | | |
| | | | | | | $ | 11,699,314 | | |
| Hospital - 2.7% | | | | | |
| $ | 2,105 | | | Hood River County, Health Facilities Authority, Elderly Housing,
(Down Manor), 6.50%, 1/1/17 | | $ | 2,204,524 | | |
| | | | | | | $ | 2,204,524 | | |
| Housing - 17.2% | | | | | |
| $ | 945 | | | Oregon Health Authority, (Trillium Affordable Housing),
(AMT), 6.75%, 2/15/29 | | $ | 841,626 | | |
| | 750 | | | Oregon Housing and Community Services Department,
MFMR, (AMT), 5.70%, 7/1/29 | | | 769,297 | | |
Principal Amount
(000's omitted) | | Security | | Value | |
| Housing (continued) | | | | | |
| $ | 1,500 | | | Oregon Housing and Community Services Department,
MFMR, (AMT), 6.20%, 7/1/28 | | $ | 1,549,710 | | |
| | 1,040 | | | Oregon Housing and Community Services Department,
SFMR, (AMT), 6.20%, 7/1/27 | | | 1,074,601 | | |
| | 735 | | | Oregon Housing and Community Services Department,
SFMR, (AMT), 6.40%, 7/1/26 | | | 752,691 | | |
| | 785 | | | Oregon Housing and Community Services Department,
SFMR, (AMT), 6.45%, 7/1/26 | | | 803,989 | | |
| | 3,710 | | | Portland Housing Authority, MFMR, (Berry Ridge),
(AMT), 6.30%, 5/1/29 | | | 3,803,381 | | |
| | 2,875 | | | Portland Housing Authority, MFMR, (Cherry Blossom),
(AMT), 6.20%, 12/20/36 | | | 3,001,184 | | |
| | 1,500 | | | Washington County Housing Authority, MFMR, (Bethany
Meadows), (AMT), 5.85%, 9/1/27 | | | 1,537,950 | | |
| | | | | | | $ | 14,134,429 | | |
| Industrial Development Revenue - 8.9% | | | | | |
| $ | 500 | | | Oregon EDA, (Georgia-Pacific), (AMT), 5.70%, 12/1/25 | | $ | 501,105 | | |
| | 3,500 | | | Port of Astoria, PCR, (James River Corp.),
6.55%, 2/1/15 | | | 3,504,480 | | |
| | 670 | | | Port of Portland, (North Portland Crown Zellerbach
Corp.), 6.125%, 5/15/08 | | | 673,290 | | |
| | 2,250 | | | Port of Portland, Special Obligation Revenue Bonds,
(Delta Airlines, Inc.), (AMT), 6.20%, 9/1/22 | | | 1,102,500 | | |
| | 1,250 | | | Puerto Rico Port Authority, (American Airlines), (AMT),
6.25%, 6/1/26 | | | 882,550 | | |
| | 920 | | | Puerto Rico Port Authority, (American Airlines), (AMT),
6.30%, 6/1/23 | | | 649,667 | | |
| | | | | | | $ | 7,313,592 | | |
| Insured-Education - 5.3% | | | | | |
| $ | 4,850 | | | Oregon Health Science University, (MBIA),
0.00%, 7/1/21 | | $ | 2,302,925 | | |
| | 1,500 | | | Oregon Health Science University, (MBIA),
5.00%, 7/1/32 | | | 1,557,540 | | |
| | 500 | | | Puerto Rico Industrial, Tourist, Educational, Medical &
Environmental Control Facilities Financing Authority,
(Inter American University), (MBIA), 4.50%, 10/1/29 | | | 500,560 | | |
| | | | | | | $ | 4,361,025 | | |
| Insured-Electric Utilities - 3.6% | | | | | |
| $ | 750 | | | Emerald People's Utility District, (FSA), 5.25%, 11/1/22 | | $ | 816,270 | | |
| | 1,000 | | | Eugene, Electric Utility, (FSA), 5.25%, 8/1/22 | | | 1,083,490 | | |
| | 1,000 | | | Puerto Rico Electric Power Authority, (FSA),
5.125%, 7/1/26 | | | 1,068,030 | | |
| | | | | | | $ | 2,967,790 | | |
See notes to financial statements
53
Eaton Vance Oregon Municipals Fund as of February 28, 2005
PORTFOLIO OF INVESTMENTS (Unaudited) CONT'D
Principal Amount
(000's omitted) | |
Security | |
Value | |
| | Insured-Escrowed / Prerefunded - 4.8% | | | | | | | | |
| $ | 1,300 | | | Puerto Rico, (FGIC), Prerefunded to 7/1/12,
Variable Rate, 10.113%, 7/1/32(1)(2) | | $ | 1,714,258 | | |
| | 1,000 | | | Salem-Keizer, School District No. 24J, Prerefunded to
6/1/09, (FGIC), 5.00%, 6/1/17 | | | 1,082,470 | | |
| | 950 | | | Umatilla County, School District No. 008R, Prerefunded to
6/15/09, (MBIA), Variable Rate, 8.23%, 6/15/19(1)(3) | | | 1,122,872 | | |
| | | | | | | $ | 3,919,600 | | |
| | Insured-General Obligations - 8.1% | | | | | | | | |
| $ | 2,000 | | | Clackamas County, School District No. 007J, (Lake
Oswego), (MBIA), 5.00%, 6/1/26(4) | | $ | 2,078,760 | | |
| | 1,000 | | | Columbia, School District No. 502, (FGIC),
0.00%, 6/1/17 | | | 587,240 | | |
| | 1,000 | | | Deschutes and Jefferson County, School District No. 2J,
(FGIC), 0.00%, 6/15/18 | | | 552,640 | | |
| | 3,420 | | | Deschutes and Jefferson County, School District No. 2J,
(FGIC), 0.00%, 6/15/24 | | | 1,356,475 | | |
| | 200 | | | Jefferson County, School District No. 509J, (FGIC),
5.00%, 6/15/22 | | | 211,682 | | |
| | 500 | | | Jefferson County, School District No. 509J, (FGIC),
5.25%, 6/15/19 | | | 548,335 | | |
| | 200 | | | Puerto Rico, (MBIA), Variable Rate, 12.295%, 7/1/20(1)(2) | | | 305,070 | | |
| | 1,000 | | | Yamhill County, School District No. 029J, (MBIA),
4.75%, 6/15/23 | | | 1,030,710 | | |
| | | | | | | $ | 6,670,912 | | |
| | Insured-Hospital - 0.6% | | | | | | | | |
| $ | 500 | | | Oregon Health, Housing, Educational and Cultural
Facilities Authority, (Peace Health), (AMBAC),
5.00%, 11/15/32 | | $ | 516,470 | | |
| | | | | | | $ | 516,470 | | |
| | Insured-Lease Revenue / Certificates of
Participation - 2.5% | | | | | | | | |
| $ | 1,500 | | | Oregon Department of Administration Services, (MBIA),
5.25%, 11/1/20 | | $ | 1,635,390 | | |
| | 300 | | | Puerto Rico Public Finance Corp., (AMBAC),
Variable Rate, 12.857%, 6/1/24(1)(2) | | | 402,168 | | |
| | | | | | | $ | 2,037,558 | | |
| | Insured-Special Tax Revenue - 2.5% | | | | | | | | |
| $ | 1,000 | | | Portland, Arena Natural Gas Tax Revenue, (AMBAC),
0.00%, 6/1/17 | | $ | 488,520 | | |
| | 1,400 | | | Puerto Rico Infrastructure Financing Authority, (AMBAC),
Variable Rate, 10.286%, 7/1/28(1)(2) | | | 1,585,598 | | |
| | | | | | | $ | 2,074,118 | | |
Principal Amount
(000's omitted) | | Security | | Value | |
| | Insured-Transportation - 0.9% | | | | | | | | |
| $ | 700 | | | Puerto Rico Highway and Transportation Authority, (FSA),
Variable Rate, 10.795%, 7/1/32(1)(2) | | $ | 786,226 | | |
| | | | | | | $ | 786,226 | | |
| | Insured-Water and Sewer - 4.3% | | | | | | | | |
| $ | 1,575 | | | Albany, Water Revenue, (FGIC), 5.125%, 8/1/26 | | $ | 1,672,713 | | |
| | 1,000 | | | Portland, Sewer System, (FSA), 5.00%, 6/1/23 | | | 1,058,070 | | |
| | 750 | | | Washington County, Clean Water Services, (Senior Lien),
(FGIC), 5.00%, 10/1/21 | | | 787,073 | | |
| | | | | | | $ | 3,517,856 | | |
| | Other Revenue - 0.5% | | | | | | | | |
| $ | 300 | | | Puerto Rico Infrastructure Financing Authority,
Variable Rate, 19.305%, 10/1/32(1)(2) | | $ | 453,420 | | |
| | | | | | | $ | 453,420 | | |
| | Senior Living / Life Care - 2.2% | | | | | | | | |
| $ | 1,750 | | | Clackamas County, Hospital Facility Authority,
(Homewoods), 5.15%, 10/20/37 | | $ | 1,811,443 | | |
| | | | | | | $ | 1,811,443 | | |
| | Special Tax Revenue - 4.1% | | | | | | | | |
| $ | 2,475 | | | Portland Limited Tax General Obligation, 0.00%, 6/1/22 | | $ | 1,106,399 | | |
| | 2,000 | | | Tri-County Metropolitan Transportation District,
Variable Rate, 7.82%, 8/1/19(1)(3) | | | 2,263,320 | | |
| | | | | | | $ | 3,369,719 | | |
| | Transportation - 4.2% | | | | | | | | |
| $ | 1,000 | | | Oregon Department of Transportation, (Highway User
Tax), 5.00%, 11/15/29 | | $ | 1,048,160 | | |
| | 2,000 | | | Oregon Department of Transportation, (Highway User
Tax), 5.125%, 11/15/26 | | | 2,115,160 | | |
| | 300 | | | Puerto Rico Highway and Transportation Authority,
5.125%, 7/1/43 | | | 310,842 | | |
| | | | | | | $ | 3,474,162 | | |
| | Total Tax-Exempt Investments - 97.6%
(identified cost $76,469,133) | | | | | $ | 80,344,038 | | |
| | Other Assets, Less Liabilities - 2.4% | | | | | $ | 2,008,898 | | |
| | Net Assets - 100.0% | | | | | $ | 82,352,936 | | |
See notes to financial statements
54
Eaton Vance Oregon Municipals Fund as of February 28, 2005
PORTFOLIO OF INVESTMENTS (Unaudited) CONT'D
AMT - Interest earned from these securities may be considered a tax preference item for purposes of the Federal Alternative Minimum Tax.
AMBAC - AMBAC Financial Group, Inc.
FGIC - Financial Guaranty Insurance Company
FSA - Financial Security Assurance, Inc.
MBIA - Municipal Bond Insurance Association
The Fund invests primarily in debt securities issued by Oregon municipalities. The ability of the issuers of the debt securities to meet their obligations may be affected by economic developments in a specific industry or municipality. In order to reduce the risk associated with such economic developments, at February 28, 2005, 33.4% of the securities in the portfolio of investments are backed by bond insurance of various financial institutions and financial guaranty assurance agencies. The aggregate percentage insured by an individual financial institution ranged from 3.7% to 13.1% of total investments.
(1) Security exempt from registration under Rule 144A of the Securities Act of 1933. These securities may be sold in transactions exempt from registration, normally to qualified institutional buyers. At February 28, 2005, the aggregate value of the securities is $8,632,932 or 10.5% of the Fund's net assets.
(2) Security has been issued as a leveraged inverse floater bond. The stated interest rate represents the rate in effect at February 28, 2005.
(3) Security has been issued as an inverse floater bond. The stated interest rate represents the rate in effect at February 28, 2005.
(4) Security (or a portion thereof) has been segregated to cover margin requirements on open financial futures contracts.
See notes to financial statements
55
Eaton Vance South Carolina Municipals Fund as of February 28, 2005
PORTFOLIO OF INVESTMENTS (Unaudited)
| Tax-Exempt Investments - 98.3% | | | | | |
Principal Amount
(000's omitted) | |
Security | |
Value | |
| Electric Utilities - 3.1% | | | | | |
| $ | 1,000 | | | Puerto Rico Electric Power Authority, 5.125%, 7/1/29 | | $ | 1,047,970 | | |
| | 750 | | | Puerto Rico Electric Power Authority, 5.25%, 7/1/31 | | | 796,215 | | |
| | | | | | | $ | 1,844,185 | | |
| Escrowed / Prerefunded - 2.1% | | | | | |
| $ | 1,000 | | | Medical University Hospital Authority, Prerefunded to
8/15/12, 6.50%, 8/15/32 | | $ | 1,201,730 | | |
| | | | | | | $ | 1,201,730 | | |
| General Obligations - 8.7% | | | | | |
| $ | 350 | | | Beaufort County, School District, 5.00%, 3/1/20 | | $ | 370,635 | | |
| | 1,500 | | | Charleston County, School District, 5.00%, 2/1/25 | | | 1,573,530 | | |
| | 695 | | | Kershaw County, School District, 5.00%, 2/1/18 | | | 742,580 | | |
| | 1,000 | | | Puerto Rico, Variable Rate, 9.289%, 7/1/29(1)(2) | | | 1,253,920 | | |
| | 1,085 | | | Richland County, General Obligation, Sewer System,
(Broad River), 5.125%, 3/1/29 | | | 1,141,344 | | |
| | | | | | | $ | 5,082,009 | | |
| Hospital - 5.0% | | | | | |
| $ | 1,000 | | | Lexington County, (Health Services District, Inc.),
5.50%, 11/1/32 | | $ | 1,047,460 | | |
| | 250 | | | South Carolina Jobs Economic Development Authority,
(Bon Secours Health System, Inc.), 5.625%, 11/15/30 | | | 259,165 | | |
| | 1,500 | | | South Carolina Jobs Economic Development Authority,
(Palmetto Health), 6.375%, 8/1/34 | | | 1,622,325 | | |
| | | | | | | $ | 2,928,950 | | |
| Housing - 3.4% | | | | | |
| $ | 1,280 | | | South Carolina Housing Finance Authority, MFMR,
(Runaway Bay Apartments), 6.20%, 12/1/20 | | $ | 1,321,178 | | |
| | 655 | | | South Carolina Housing Finance Authority, SFMR,
6.45%, 7/1/17 | | | 668,912 | | |
| | | | | | | $ | 1,990,090 | | |
| Industrial Development Revenue - 8.5% | | | | | |
| $ | 1,400 | | | Darlington County, (Sonoco Products), (AMT),
6.00%, 4/1/26(3) | | $ | 1,458,912 | | |
| | 135 | | | Florence County, (Stone Container), 7.375%, 2/1/07 | | | 136,204 | | |
| | 400 | | | Puerto Rico Port Authority, (American Airlines), (AMT),
6.25%, 6/1/26 | | | 282,416 | | |
| | 1,400 | | | Richland County, Environmental Improvement,
(International Paper Co.), (AMT), 6.10%, 4/1/23 | | | 1,505,742 | | |
Principal Amount
(000's omitted) | | Security | | Value | |
| | Industrial Development Revenue (continued) | | | | | | | | |
| $ | 1,500 | | | Spartanburg County, Solid Waste, (Bavarian Motor Works
Corp.), (AMT), 7.55%, 11/1/24 | | $ | 1,573,050 | | |
| | | | | | | $ | 4,956,324 | | |
| | Insured-Education - 12.6% | | | | | | | | |
| $ | 500 | | | Citadel Military College, (AMBAC), 4.50%, 4/1/23 | | $ | 509,125 | | |
| | 825 | | | Citadel Military College, (AMBAC), 4.50%, 4/1/24 | | | 836,005 | | |
| | 715 | | | Citadel Military College, (AMBAC), 4.50%, 4/1/25 | | | 721,621 | | |
| | 1,000 | | | College of Charleston, Academic and Administrative
Facilities, (XLCA), 5.125%, 4/1/30 | | | 1,042,380 | | |
| | 1,250 | | | College of Charleston, Academic and Administrative
Facilities, (XLCA), 5.375%, 4/1/25 | | | 1,354,587 | | |
| | 1,000 | | | Florence-Darlington Commission for Technical Education,
(MBIA), 4.50%, 3/1/30(4) | | | 974,350 | | |
| | 500 | | | Puerto Rico Industrial, Tourist, Educational, Medical and
Environmental, Residual Certificates, (MBIA),
Variable Rate, 10.855%, 7/1/33(1)(5) | | | 557,075 | | |
| | 1,345 | | | University of South Carolina, (AMBAC), 4.75%, 5/1/27 | | | 1,370,932 | | |
| | | | | | | $ | 7,366,075 | | |
| | Insured-Electric Utilities - 9.2% | | | | | | | | |
| $ | 7,500 | | | Piedmont Municipal Power Agency, (AMBAC),
0.00%, 1/1/29 | | $ | 2,210,700 | | |
| | 4,000 | | | Piedmont Municipal Power Agency, (AMBAC),
0.00%, 1/1/32 | | | 995,280 | | |
| | 750 | | | Puerto Rico Electric Power Authority, (FSA), Variable Rate,
8.39%, 7/1/29(1)(2) | | | 868,028 | | |
| | 250 | | | South Carolina Public Service Authority, (AMBAC),
4.75%, 1/1/32 | | | 251,783 | | |
| | 1,000 | | | South Carolina Public Service Authority, (FSA),
5.125%, 1/1/21 | | | 1,076,200 | | |
| | | | | | | $ | 5,401,991 | | |
| | Insured-Escrowed / Prerefunded - 0.7% | | | | | | | | |
| $ | 330 | | | Puerto Rico, (FGIC), Prerefunded to 7/1/12, Variable Rate,
10.113%, 7/1/32(1)(5) | | $ | 435,158 | | |
| | | | | | | $ | 435,158 | | |
| | Insured-General Obligations - 3.8% | | | | | | | | |
| $ | 1,300 | | | Berkeley County, (FSA), 2.00%, 9/1/25 | | $ | 882,037 | | |
| | 1,000 | | | Lancaster County, School District, (FSA), 4.75%, 3/1/18 | | | 1,043,830 | | |
| | 200 | | | Puerto Rico, (MBIA), Variable Rate,
12.295%, 7/1/20(1)(5) | | | 305,070 | | |
| | | | | | | $ | 2,230,937 | | |
See notes to financial statements
56
Eaton Vance South Carolina Municipals Fund as of February 28, 2005
PORTFOLIO OF INVESTMENTS (Unaudited) CONT'D
Principal Amount
(000's omitted) | |
Security | |
Value | |
| Insured-Hospital - 3.6% | | | | | |
| $ | 1,000 | | | Florence County, (McLeod Regional Medical Center), (FSA),
5.25%, 11/1/34 | | $ | 1,067,140 | | |
| | 1,000 | | | South Carolina Jobs Economic Development Authority,
(Oconee Memorial Hospital), (Connie Lee),
6.15%, 3/1/25 | | | 1,022,800 | | |
| | | | | | | $ | 2,089,940 | | |
Insured-Lease Revenue / Certificates of
Participation - 0.9% | | | | | |
| $ | 415 | | | Puerto Rico Public Finance Corp., (AMBAC), Variable Rate,
12.857%, 6/1/24(1)(5) | | $ | 556,332 | | |
| | | | | | | $ | 556,332 | | |
| Insured-Pooled Loans - 3.3% | | | | | |
| $ | 1,660 | | | Puerto Rico Municipal Finance Agency, (FSA),
Variable Rate, 10.795%, 8/1/27(1)(5) | | $ | 1,906,892 | | |
| | | | | | | $ | 1,906,892 | | |
| Insured-Special Tax Revenue - 2.4% | | | | | |
| $ | 1,000 | | | Myrtle Beach, (Hospitality Fee), (FGIC), 5.375%, 6/1/24 | | $ | 1,096,130 | | |
| | 260 | | | Puerto Rico Infrastructure Financing Authority, (AMBAC),
Variable Rate, 10.286%, 7/1/28(1)(5) | | | 294,468 | | |
| | | | | | | $ | 1,390,598 | | |
| Insured-Transportation - 2.9% | | | | | |
| $ | 330 | | | Puerto Rico Highway and Transportation Authority, (FSA),
Variable Rate, 10.795%, 7/1/32(1)(5) | | $ | 370,649 | | |
| | 1,250 | | | South Carolina Transportation Infrastructure, (AMBAC),
5.25%, 10/1/31 | | | 1,329,575 | | |
| | | | | | | $ | 1,700,224 | | |
| Insured-Utilities - 9.6% | | | | | |
| $ | 2,000 | | | Greer, Combined Utility System, (AMBAC),
5.50%, 9/1/32(6) | | $ | 2,324,240 | | |
| | 1,000 | | | Greer, Combined Utility System, (AMBAC),
5.50%, 9/1/27 | | | 1,165,270 | | |
| | 2,000 | | | South Carolina Jobs Economic Development Authority,
(South Carolina Electric and Gas Co.), (AMBAC),
5.20%, 11/1/27 | | | 2,118,100 | | |
| | | | | | | $ | 5,607,610 | | |
| Insured-Water and Sewer - 10.3% | | | | | |
| $ | 750 | | | Beaufort-Jasper, Water and Sewer Authority, (FSA),
5.00%, 3/1/26 | | $ | 779,408 | | |
Principal Amount
(000's omitted) | |
Security | |
Value | |
| Insured-Water and Sewer (continued) | | | | | |
| $ | 1,000 | | | Dorchester County, Water and Sewer System, (MBIA),
5.00%, 10/1/28 | | $ | 1,043,590 | | |
| | 1,000 | | | Easley, (FSA), 5.00%, 12/1/27 | | | 1,040,010 | | |
| | 1,500 | | | Grand Strand, Water and Sewer Authority, (FSA),
5.00%, 6/1/26 | | | 1,560,510 | | |
| | 500 | | | Spartanburg, Sanitary Sewer District, (MBIA),
5.00%, 3/1/26 | | | 521,015 | | |
| | 1,000 | | | Spartanburg, Sewer System, (MBIA), 5.25%, 3/1/30 | | | 1,071,490 | | |
| | | | | | | $ | 6,016,023 | | |
| Other Revenue - 6.5% | | | | | |
| $ | 550 | | | Puerto Rico Infrastructure Financing Authority,
Variable Rate, 17.229%, 10/1/32(1)(5) | | $ | 718,762 | | |
| | 50 | | | Tobacco Settlement Management Authority,
6.00%, 5/15/22 | | | 50,681 | | |
| | 2,360 | | | Tobacco Settlement Management Authority,
6.375%, 5/15/28 | | | 2,410,244 | | |
| | 575 | | | Tobacco Settlement Management Authority,
6.375%, 5/15/30 | | | 598,569 | | |
| | | | | | | $ | 3,778,256 | | |
| Pooled Loans - 1.7% | | | | | |
| $ | 1,000 | | | South Carolina Education Authority, Student Loan, (AMT),
6.30%, 9/1/08 | | $ | 1,012,080 | | |
| | | | | | | $ | 1,012,080 | | |
| | Total Tax-Exempt Investments - 98.3%
(identified cost $53,683,966) | | | | | $ | 57,495,404 | | |
| | Other Assets, Less Liabilities - 1.7% | | | | | $ | 1,006,362 | | |
| | Net Assets - 100.0% | | | | | $ | 58,501,766 | | |
See notes to financial statements
57
Eaton Vance South Carolina Municipals Fund as of February 28, 2005
PORTFOLIO OF INVESTMENTS (Unaudited) CONT'D
AMT - Interest earned from these securities may be considered a tax preference item for purposes of the Federal Alternative Minimum Tax.
AMBAC - AMBAC Financial Group, Inc.
FGIC - Financial Guaranty Insurance Company
FSA - Financial Security Assurance, Inc.
MBIA - Municipal Bond Insurance Association
XLCA - XL Capital Assurance, Inc.
The Fund invests primarily in debt securities issued by South Carolina municipalities. The ability of the issuers of the debt securities to meet their obligations may be affected by economic developments in a specific industry or municipality. In order to reduce the risk associated with such economic developments, at February 28, 2005, 60.4% of the securities in the portfolio of investments are backed by bond insurance of various financial institutions and financial guaranty assurance agencies. The aggregate percentage insured by an individual financial institution ranged from 1.8% to 25.5% of total investments.
(1) Security exempt from registration under Rule 144A of the Securities Act of 1933. These securities may be sold in transactions exempt from registration, normally to qualified institutional buyers. At February 28, 2005, the aggregate value of the securities is $7,266,354 or 12.4% of the Fund's net assets.
(2) Security has been issued as an inverse floater bond. The stated interest rate represents the rate in effect at February 28, 2005.
(3) Security (or a portion thereof) has been segregated to cover when-issued securities.
(4) When-issued security.
(5) Security has been issued as a leveraged inverse floater bond. The stated interest rate represents the rate in effect at February 28, 2005.
(6) Security (or a portion thereof) has been segregated to cover margin requirements on open financial futures contracts.
See notes to financial statements
58
Eaton Vance Tennessee Municipals Fund as of February 28, 2005
PORTFOLIO OF INVESTMENTS (Unaudited)
| Tax-Exempt Investments - 95.1% | | | | | |
Principal Amount
(000's omitted) | |
Security | | Value | |
| Education - 3.0% | | | | | |
| $ | 1,500 | | | Metropolitan Government of Nashville and Davidson
County, (Vanderbilt University), 5.00%, 10/1/28 | | $ | 1,540,605 | | |
| | | | | $ | 1,540,605 | | |
| Electric Utilities - 3.0% | | | | | |
| $ | 1,000 | | | Metropolitan Government of Nashville and Davidson
County, Electric Revenue, 5.125%, 5/15/26 | | $ | 1,045,000 | | |
| | 500 | | | Puerto Rico Electric Power Authority, 5.125%, 7/1/29 | | | 523,985 | | |
| | | | | $ | 1,568,985 | | |
| Escrowed / Prerefunded - 1.6% | | | | | |
| $ | 750 | | | Metropolitan Government of Nashville and Davidson
County, (Charity Obligated Group), Prerefunded to
11/1/10, 5.125%, 11/1/27 | | $ | 816,285 | | |
| | | | | $ | 816,285 | | |
| Hospital - 4.5% | | | | | |
| $ | 500 | | | Knox County, HEFA, (East Tennessee Hospital),
5.75%, 7/1/33 | | $ | 520,615 | | |
| | 1,000 | | | Montgomery County, (Clarksville Regional Health System),
5.375%, 1/1/28 | | | 1,001,400 | | |
| | 750 | | | Sullivan County, Health Education and Facility Board,
(Wellmont Health System), 6.25%, 9/1/22 | | | 814,980 | | |
| | | | | $ | 2,336,995 | | |
| Housing - 1.1% | | | | | |
| $ | 525 | | | Tennessee Housing Development Agency, (AMT),
5.375%, 7/1/23 | | $ | 544,042 | | |
| | | | | $ | 544,042 | | |
| Industrial Development Revenue - 4.5% | | | | | |
| $ | 750 | | | Chattanooga, (E.I. du Pont de Nemours),
6.35%, 7/1/22 | | $ | 770,295 | | |
| | 500 | | | Hardeman County, (Correctional Facilities Corp.),
7.75%, 8/1/17 | | | 522,570 | | |
| | 500 | | | Humphreys County, (E.I. du Pont de Nemours), (AMT),
6.70%, 5/1/24 | | | 511,395 | | |
| | 500 | | | McMinn County, (Calhoun Newsprint - Bowater), (AMT),
7.40%, 12/1/22 | | | 502,705 | | |
| | | | | $ | 2,306,965 | | |
Principal Amount
(000's omitted) | |
Security | |
Value | |
| | Insured-Cogeneration - 2.0% | | | | | | | | |
| $ | 1,000 | | | Metropolitan Government of Nashville and Davidson
County, (AMBAC), 5.00%, 10/1/33 | | $ | 1,032,790 | | |
| | | | | | | $ | 1,032,790 | | |
| | Insured-Education - 4.8% | | | | | | | | |
| $ | 1,000 | | | Metropolitan Government of Nashville and Davidson
County, (Meharry Medical College), (AMBAC),
5.00%, 12/1/24 | | $ | 1,024,950 | | |
| | 1,230 | | | Metropolitan Government of Nashville and Davidson
County, (Meharry Medical College), (AMBAC),
6.00%, 12/1/19 | | | 1,470,846 | | |
| | | | | | | $ | 2,495,796 | | |
| | Insured-Electric Utilities - 15.6% | | | | | | | | |
| $ | 1,000 | | | Lawrenceburg, Electric, (MBIA), 6.625%, 7/1/18 | | $ | 1,258,600 | | |
| | 1,750 | | | Madison County Suburban Utility District, (MBIA),
5.00%, 2/1/19 | | | 1,836,800 | | |
| | 400 | | | Memphis, Electric System, (MBIA), Variable Rate,
15.385%, 12/1/17(1)(2) | | | 517,752 | | |
| | 1,000 | | | Metropolitan Government of Nashville and Davidson
County, Electric Revenue, (AMBAC), 5.00%, 5/15/29 | | | 1,043,830 | | |
| | 2,000 | | | Metropolitan Government of Nashville and Davidson
County, Electric Revenue, (MBIA), 0.00%, 5/15/17 | | | 1,165,560 | | |
| | 1,000 | | | Pleasant View Utility District, (MBIA), 5.00%, 9/1/32 | | | 1,042,050 | | |
| | 500 | | | Puerto Rico Electric Power Authority, (FSA),
5.125%, 7/1/26 | | | 534,015 | | |
| | 250 | | | Puerto Rico Electric Power Authority, (MBIA),
5.00%, 7/1/32 | | | 261,430 | | |
| | 250 | | | Puerto Rico Electric Power Authority, (MBIA), Variable Rate,
12.295%, 7/1/16(1)(2) | | | 369,932 | | |
| | | | | | | $ | 8,029,969 | | |
| | Insured-Escrowed / Prerefunded - 11.6% | | | | | | | | |
| $ | 250 | | | Chattanooga, (Memorial Hospital), (MBIA), Escrowed to
Maturity, 6.625%, 9/1/09 | | $ | 288,460 | | |
| | 1,500 | | | Johnson City, Health and Educational Facilities Board,
(Johnson City Medical Center), (MBIA), Prerefunded to
7/1/23, 5.125%, 7/1/25 | | | 1,597,440 | | |
| | 750 | | | Johnson, School District Sales Tax, (AMBAC), Prerefunded
to 5/1/06, 6.70%, 5/1/21 | | | 786,795 | | |
| | 1,500 | | | Puerto Rico, (FGIC), Prerefunded to 7/1/12,
5.00%, 7/1/32 | | | 1,659,330 | | |
| | 1,500 | | | Shelby County, (Lebonheur Children's Hospital), (MBIA),
Escrowed to Maturity, 5.50%, 8/15/12 | | | 1,652,565 | | |
| | | | | | | $ | 5,984,590 | | |
See notes to financial statements
59
Eaton Vance Tennessee Municipals Fund as of February 28, 2005
PORTFOLIO OF INVESTMENTS (Unaudited) CONT'D
Principal Amount
(000's omitted) | |
Security | |
Value | |
| Insured-General Obligations - 13.2% | | | | | |
| $ | 1,425 | | | Franklin, Special School District, (FSA), 0.00%, 6/1/19 | | $ | 750,277 | | |
| | 2,500 | | | Franklin, Special School District, (FSA), 0.00%, 6/1/20 | | | 1,249,025 | | |
| | 500 | | | Greene County, (FGIC), 5.00%, 6/1/26 | | | 519,135 | | |
| | 500 | | | Lawrenceburg, Public Building Authority, (Electric
System-Public Works), (AMBAC), 5.00%, 7/1/26 | | | 549,645 | | |
| | 1,000 | | | Lawrenceburg, Public Building Authority, (Electric
System-Public Works), (FSA), 5.00%, 7/1/26 | | | 1,035,350 | | |
| | 500 | | | Lincoln County, (FGIC), 5.25%, 4/1/21 | | | 568,190 | | |
| | 700 | | | Puerto Rico, (FSA), Variable Rate, 16.243%, 7/1/27(1)(2) | | | 880,537 | | |
| | 250 | | | Putnam County, (FGIC), 5.25%, 4/1/20 | | | 283,468 | | |
| | 1,000 | | | Rutherford County, (MBIA), 4.50%, 4/1/30 | | | 987,370 | | |
| | | | | | | $ | 6,822,997 | | |
| Insured-Hospital - 4.1% | | | | | |
| $ | 500 | | | Bristol, (Bristol Memorial Hospital), (FGIC),
6.75%, 9/1/10 | | $ | 575,905 | | |
| | 1,500 | | | Knox County, HEFA, (Covenant Health), (FSA),
5.00%, 1/1/26 | | | 1,561,080 | | |
| | | | | | | $ | 2,136,985 | | |
Insured-Lease Revenue / Certificates of
Participation - 2.0% | | | | | |
| $ | 500 | | | Puerto Rico Public Finance Corp., (AMBAC), Variable Rate,
7.84%, 6/1/26(1)(3) | | $ | 579,590 | | |
| | 340 | | | Puerto Rico Public Finance Corp., (AMBAC), Variable Rate,
12.857%, 6/1/24(1)(2) | | | 455,790 | | |
| | | | | | | $ | 1,035,380 | | |
| Insured-Pooled Loans - 2.0% | | | | | |
| $ | 1,000 | | | Puerto Rico Municipal Finance Agency, (FSA),
5.00%, 8/1/27 | | $ | 1,049,570 | | |
| | | | | | | $ | 1,049,570 | | |
| Insured-Special Tax Revenue - 2.6% | | | | | |
| $ | 1,285 | | | Memphis-Shelby County Sports Authority, Inc.,
(Memphis Arena), (AMBAC), 5.125%, 11/1/29 | | $ | 1,345,896 | | |
| | | | | | | $ | 1,345,896 | | |
| Insured-Transportation - 6.1% | | | | | |
| $ | 1,500 | | | Memphis-Shelby County Airport Authority, (MBIA), (AMT),
6.00%, 3/1/24 | | $ | 1,661,265 | | |
| | 1,000 | | | Memphis-Shelby County Airport Authority, (MBIA), (AMT),
6.50%, 2/15/09 | | | 1,115,610 | | |
Principal Amount
(000's omitted) | |
Security | |
Value | |
| | Insured-Transportation (continued) | | | | | | | | |
| $ | 300 | | | Puerto Rico Highway and Transportation Authority, (MBIA),
Variable Rate, 13.274%, 7/1/26(1)(2) | | $ | 349,353 | | |
| | | | | | | $ | 3,126,228 | | |
| | Insured-Water and Sewer - 13.4% | | | | | | | | |
| $ | 1,000 | | | Clarksville, Water, Sewer and Gas, (FSA),
5.25%, 2/1/18 | | $ | 1,122,480 | | |
| | 1,500 | | | Davidson and Williamson Counties, Harpeth Valley Utilities
District, (MBIA), 5.00%, 9/1/34 | | | 1,562,805 | | |
| | 1,000 | | | Metropolitan Government of Nashville and Davidson County,
Water System, (FGIC), 5.20%, 1/1/13 | | | 1,112,390 | | |
| | 2,000 | | | West Wilson Utility District, Waterworks, (MBIA),
5.00%, 6/1/34(4) | | | 2,072,600 | | |
| | 1,000 | | | White House Utility District, Water and Wastewater,
(Robertson and Sumner Counties), (FSA), 5.00%, 1/1/32 | | | 1,033,570 | | |
| | | | | | | $ | 6,903,845 | | |
| | Total Tax-Exempt Investments - 95.1%
(identified cost $45,225,690) | | | | | $ | 49,077,923 | | |
| | Other Assets, Less Liabilities - 4.9% | | | | | $ | 2,535,627 | | |
| | Net Assets - 100.0% | | | | | $ | 51,613,550 | | |
AMT - Interest earned from these securities may be considered a tax preference item for purposes of the Federal Alternative Minimum Tax.
AMBAC - AMBAC Financial Group, Inc.
FGIC - Financial Guaranty Insurance Company
FSA - Financial Security Assurance, Inc.
MBIA - Municipal Bond Insurance Association
The Fund invests primarily in debt securities issued by Tennessee municipalities. The ability of the issuers of the debt securities to meet their obligations may be affected by economic developments in a specific industry or municipality. In order to reduce the risk associated with such economic developments, at February 28, 2005, 81.4% of the securities in the portfolio of investments are backed by bond insurance of various financial institutions and financial guaranty assurance agencies. The aggregate percentage insured by an individual financial institution ranged from 9.6% to 36.1% of total investments.
(1) Security exempt from registration under Rule 144A of the Securities Act of 1933. These securities may be sold in transactions exempt from registration, normally to qualified institutional buyers. At February 28, 2005, the aggregate value of the securities is $3,152,954 or 6.1% of the Fund's net assets.
(2) Security has been issued as a leveraged inverse floater bond. The stated interest rate represents the rate in effect at February 28, 2005.
(3) Security has been issued as an inverse floater bond. The stated interest rate represents the rate in effect at February 28, 2005.
(4) Security (or a portion thereof) has been segregated to cover margin requirements on open financial futures contracts.
See notes to financial statements
60
Eaton Vance Virginia Municipals Fund as of February 28, 2005
PORTFOLIO OF INVESTMENTS (Unaudited)
| Tax-Exempt Investments - 98.2% | | | | | |
Principal Amount
(000's omitted) | |
Security | |
Value | |
| Education - 3.2% | | | | | |
| $ | 3,320 | | | Virginia College Building Authority, 4.75%, 9/1/35 | | $ | 3,372,058 | | |
| | | | | | | $ | 3,372,058 | | |
| Electric Utilities - 1.0% | | | | | |
| $ | 1,000 | | | Puerto Rico Electric Power Authority, Variable Rate,
7.70%, 7/1/29(1)(2) | | $ | 1,095,940 | | |
| | | | | | | $ | 1,095,940 | | |
| Escrowed / Prerefunded - 1.2% | | | | | |
| $ | 1,165 | | | Arlington County, Prerefunded to 6/1/09,
5.25%, 6/1/18(3) | | $ | 1,273,636 | | |
| | | | | | | $ | 1,273,636 | | |
| General Obligations - 3.4% | | | | | |
| $ | 1,390 | | | Peninsula Airport Commission, (City Guaranteed), (AMT),
5.50%, 7/15/21 | | $ | 1,505,370 | | |
| | 2,000 | | | Virginia Public School Authority, 5.00%, 8/1/21 | | | 2,127,080 | | |
| | | | | | | $ | 3,632,450 | | |
| Hospital - 6.7% | | | | | |
| $ | 2,250 | | | Albemarle County IDA, (Martha Jefferson Hospital),
5.25%, 10/1/35 | | $ | 2,315,992 | | |
| | 1,500 | | | Fairfax County IDA, (Inova Health System),
5.00%, 8/15/14 | | | 1,637,580 | | |
| | 2,000 | | | Fairfax County IDA, (Inova Health System),
5.00%, 8/15/15 | | | 2,176,380 | | |
| | 1,000 | | | Prince William County IDA, (Potomac Hospital Corp.),
5.35%, 10/1/36 | | | 1,051,570 | | |
| | | | | | | $ | 7,181,522 | | |
| Housing - 3.0% | | | | | |
| $ | 1,000 | | | Alexandria Redevelopment and Housing Authority, MFMR,
(Buckingham Village Apartments), (AMT),
5.45%, 7/1/18 | | $ | 1,007,000 | | |
| | 2,130 | | | Multifamily Housing Bond Pass Through Certificates of
Beneficial Owners, (Prince William County), (AMT),
6.00%, 11/1/33 | | | 2,217,415 | | |
| | | | | | | $ | 3,224,415 | | |
Principal Amount
(000's omitted) | |
Security | |
Value | |
| Industrial Development Revenue - 3.4% | | | | | |
| $ | 1,250 | | | James City County IDA, (Anheuser Busch), (AMT),
6.00%, 4/1/32 | | $ | 1,298,863 | | |
| | 2,270 | | | Norfolk Airport Authority, (AMT), 6.25%, 1/1/30 | | | 2,331,267 | | |
| | | | | | | $ | 3,630,130 | | |
| Insured-Education - 10.0% | | | | | |
| $ | 3,000 | | | Virginia College Building Authority, (Regent University),
(MBIA), 5.125%, 10/1/31 | | $ | 3,124,890 | | |
| | 6,655 | | | Virginia College Building Authority, (Washington and Lee
University), (MBIA), 5.25%, 1/1/31 | | | 7,550,630 | | |
| | | | | | | $ | 10,675,520 | | |
| Insured-Electric Utilities - 3.4% | | | | | |
| $ | 165 | | | Puerto Rico Electric Power Authority, (FSA), Variable Rate,
11.487%, 7/1/29(1)(4) | | $ | 203,950 | | |
| | 700 | | | Puerto Rico Electric Power Authority, (MBIA),
Variable Rate, 12.295%, 7/1/16(1)(4) | | | 1,035,811 | | |
| | 1,000 | | | Puerto Rico Electric Power Authority, (XLCA),
5.375%, 7/1/18 | | | 1,148,300 | | |
| | 1,000 | | | Puerto Rico Electric Power Authority, RITES, (FSA),
Variable Rate, 12.555%, 7/1/29(1)(4) | | | 1,236,060 | | |
| | | | | | | $ | 3,624,121 | | |
| Insured-General Obligations - 2.8% | | | | | |
| $ | 1,170 | | | Fairfax, (MBIA), 4.50%, 1/15/36 | | $ | 1,153,409 | | |
| | 1,000 | | | Puerto Rico, (FSA), Variable Rate,
16.243%, 7/1/27(1)(4) | | | 1,257,910 | | |
| | 400 | | | Puerto Rico, (MBIA), Variable Rate,
12.295%, 7/1/20(1)(4) | | | 610,140 | | |
| | | | | | | $ | 3,021,459 | | |
| Insured-Hospital - 12.6% | | | | | |
| $ | 4,000 | | | Danville IDA, (Danville Regional Medical Center),
(AMBAC), 5.25%, 10/1/28 | | $ | 4,454,960 | | |
| | 1,500 | | | Henrico County, (Bon Secours Health Systems), (MBIA),
6.25%, 8/15/20 | | | 1,851,975 | | |
| | 5,000 | | | Virginia Beach, (Virginia Beach Memorial Hospital),
(AMBAC), 5.125%, 2/15/18 | | | 5,519,250 | | |
| | 1,500 | | | Winchester IDA, (Winchester Medical Center), (AMBAC),
Variable Rate, 10.919%, 1/21/14(1) | | | 1,629,855 | | |
| | | | | | | $ | 13,456,040 | | |
| Insured-Housing - 1.9% | | | | | |
| $ | 2,000 | | | Virginia HDA, (MBIA), 5.375%, 7/1/36 | | $ | 2,027,720 | | |
| | | | | | | $ | 2,027,720 | | |
See notes to financial statements
61
Eaton Vance Virginia Municipals Fund as of February 28, 2005
PORTFOLIO OF INVESTMENTS (Unaudited) CONT'D
Principal Amount
(000's omitted) | |
Security | |
Value | |
Insured-Lease Revenue / Certificates of
Participation - 4.1% | | | | | |
| $ | 2,500 | | | Front Royal and Warren County IDA, (FSA),
5.00%, 4/1/29 | | $ | 2,600,850 | | |
| | 900 | | | Powhatan County, EDA Lease Revenue, (AMBAC),
5.25%, 7/15/33 | | | 953,433 | | |
| | 600 | | | Puerto Rico Public Finance Corp., (AMBAC),
Variable Rate, 12.857%, 6/1/24(1)(4) | | | 804,336 | | |
| | | | | | | $ | 4,358,619 | | |
| Insured-Transportation - 16.0% | | | | | |
| $ | 5,000 | | | Chesapeake Bay Bridge and Tunnel Commission District,
(General Resolution), (MBIA), 5.50%, 7/1/25 | | $ | 5,826,400 | | |
| | 1,000 | | | Metro Washington, DC, Authority Airport System, (FGIC),
(AMT), 5.00%, 10/1/33 | | | 1,020,610 | | |
| | 1,000 | | | Metro Washington, DC, Authority Airport System, (FGIC),
(AMT), 5.25%, 10/1/32 | | | 1,041,860 | | |
| | 3,255 | | | Metro Washington, DC, Authority Airport System, (MBIA),
(AMT), 5.50%, 10/1/27 | | | 3,429,045 | | |
| | 1,000 | | | Norfolk Airport Authority, (FGIC), 5.125%, 7/1/31 | | | 1,035,820 | | |
| | 250 | | | Puerto Rico Highway and Transportation Authority, (MBIA),
Variable Rate, 10.862%, 7/1/36(1)(4) | | | 292,343 | | |
| | 3,900 | | | Richmond, Metropolitan Authority Expressway, (FGIC),
5.25%, 7/15/22 | | | 4,435,119 | | |
| | | | | | | $ | 17,081,197 | | |
| Insured-Utilities - 5.0% | | | | | |
| $ | 2,000 | | | Richmond, Public Utilities, (FSA), 5.00%, 1/15/27 | | $ | 2,078,300 | | |
| | 3,200 | | | Richmond, Public Utility, (FSA), 5.00%, 1/15/33 | | | 3,302,208 | | |
| | | | | | | $ | 5,380,508 | | |
| Insured-Water and Sewer - 6.1% | | | | | |
| $ | 1,000 | | | Henry County, Public Service Authority, Water and Sewer,
(FSA), 5.50%, 11/15/19 | | $ | 1,162,510 | | |
| | 1,495 | | | Spotsylvania County, Water and Sewer, (FSA),
4.75%, 6/1/32 | | | 1,512,237 | | |
| | 1,000 | | | Upper Occoquan Sewage Authority, (MBIA),
5.15%, 7/1/20 | | | 1,122,900 | | |
| | 2,500 | | | Virginia Resource Authority, (MBIA), 5.50%, 5/1/26 | | | 2,751,350 | | |
| | | | | | | $ | 6,548,997 | | |
Principal Amount
(000's omitted) | |
Security | |
Value | |
| Lease Revenue / Certificates of Participation - 3.7% | | | | | |
| $ | 4,020 | | | Fairfax County EDA, (School Board Central Administration
Building), 4.50%, 4/1/30 | | $ | 3,957,449 | | |
| | | | | | | $ | 3,957,449 | | |
| Other Revenue - 2.8% | | | | | |
| $ | 1,250 | | | Prince William County IDA, (Catholic Diocese Arlington),
5.50%, 10/1/33 | | $ | 1,309,225 | | |
| | 1,300 | | | Puerto Rico Infrastructure Financing Authority, Variable Rate,
17.23%, 10/1/34(1)(4) | | | 1,698,892 | | |
| | | | | | | $ | 3,008,117 | | |
| Special Tax Revenue - 0.7% | | | | | |
| $ | 700 | | | Heritage Hunt Community Development Authority,
6.85%, 3/1/19 | | $ | 731,612 | | |
| | | | | | | $ | 731,612 | | |
| Water and Sewer - 7.2% | | | | | |
| $ | 4,250 | | | Fairfax County Water Authority, 5.00%, 4/1/21 | | $ | 4,726,468 | | |
| | 1,000 | | | Fairfax County Water Authority, 5.00%, 4/1/32 | | | 1,036,480 | | |
| | 1,750 | | | Virginia Resource Authority, Clean Water, (Revolving Fund),
5.625%, 10/1/22 | | | 1,948,590 | | |
| | | | | | | $ | 7,711,538 | | |
| | Total Tax-Exempt Investments - 98.2%
(identified cost $95,683,537) | | | | | $ | 104,993,048 | | |
| | Other Assets, Less Liabilities - 1.8% | | | | | $ | 1,915,757 | | |
| | Net Assets - 100.0% | | | | | $ | 106,908,805 | | |
See notes to financial statements
62
Eaton Vance Virginia Municipals Fund as of February 28, 2005
PORTFOLIO OF INVESTMENTS (Unaudited) CONT'D
AMT - Interest earned from these securities may be considered a tax preference item for purposes of the Federal Alternative Minimum Tax.
AMBAC - AMBAC Financial Group, Inc.
FGIC - Financial Guaranty Insurance Company
FSA - Financial Security Assurance, Inc.
MBIA - Municipal Bond Insurance Association
XLCA - XL Capital Assurance, Inc.
The Fund invests primarily in debt securities issued by Virginia municipalities. The ability of the issuers of the debt securities to meet their obligations may be affected by economic developments in a specific industry or municipality. In order to reduce the risk associated with such economic developments, at February 28, 2005, 63.0% of the securities in the portfolio of investments are backed by bond insurance of various financial institutions and financial guaranty assurance agencies. The aggregate percentage insured by an individual financial institution ranged from 1.1% to 29.3% of total investments.
(1) Security exempt from registration under Rule 144A of the Securities Act of 1933. These securities may be sold in transactions exempt from registration, normally to qualified institutional buyers. At February 28, 2005, the aggregate value of the securities is $9,865,237 or 9.2% of the Fund's net assets.
(2) Security has been issued as an inverse floater bond. The stated interest rate represents the rate in effect at February 28, 2005.
(3) Security (or a portion thereof) has been segregated to cover margin requirements on open financial futures contracts.
(4) Security has been issued as a leveraged inverse floater bond. The stated interest rate represents the rate in effect at February 28, 2005.
See notes to financial statements
63
Eaton Vance Municipals Funds as of February 28, 2005
FINANCIAL STATEMENTS (Unaudited)
Statements of Assets and Liabilities
As of February 28, 2005
| | | Alabama Fund | | Arkansas Fund | | Georgia Fund | | Kentucky Fund | |
| Assets | | | |
| Investments - | | | | | | | | | | | | | | | | | |
| Identified cost | | $ | 54,495,010 | | | $ | 38,465,604 | | | $ | 51,653,182 | | | $ | 55,930,499 | | |
| Unrealized appreciation | | | 3,741,727 | | | | 2,313,686 | | | | 3,910,453 | | | | 5,463,101 | | |
| Investments, at value | | $ | 58,236,737 | | | $ | 40,779,290 | | | $ | 55,563,635 | | | $ | 61,393,600 | | |
| Cash | | $ | 243,699 | | | $ | 630,829 | | | $ | 1,749,788 | | | $ | 139,838 | | |
| Receivable for investments sold | | | - | | | | - | | | | - | | | | 1,100,000 | | |
| Receivable for Fund shares sold | | | 14,623 | | | | 44,905 | | | | 1,697 | | | | 119,869 | | |
| Interest receivable | | | 642,792 | | | | 572,750 | | | | 761,644 | | | | 705,500 | | |
| Receivable for daily variation margin on open financial futures contracts | | | 72,562 | | | | 93,125 | | | | 91,531 | | | | 87,937 | | |
| Total assets | | $ | 59,210,413 | | | $ | 42,120,899 | | | $ | 58,168,295 | | | $ | 63,546,744 | | |
| Liabilities | | | |
| Payable for investments purchased | | $ | - | | | $ | - | | | $ | 1,045,521 | | | $ | - | | |
| Payable for Fund shares redeemed | | | 34,954 | | | | 10,524 | | | | 33,072 | | | | 251,246 | | |
| Dividends payable | | | 91,604 | | | | 63,519 | | | | 87,781 | | | | 102,101 | | |
| Payable for when-issued securities | | | - | | | | - | | | | 1,383,719 | | | | - | | |
| Payable to affiliate for service fees | | | 19,155 | | | | 13,479 | | | | 17,869 | | | | 20,459 | | |
| Accrued expenses | | | 35,457 | | | | 30,829 | | | | 38,436 | | | | 38,707 | | |
| Total liabilities | | $ | 181,170 | | | $ | 118,351 | | | $ | 2,606,398 | | | $ | 412,513 | | |
| Net Assets | | $ | 59,029,243 | | | $ | 42,002,548 | | | $ | 55,561,897 | | | $ | 63,134,231 | | |
| Sources of Net Assets | | | |
| Paid-in capital | | $ | 56,457,252 | | | $ | 41,295,636 | | | $ | 52,934,453 | | | $ | 61,984,070 | | |
| Accumulated net realized loss (computed on the basis of identified cost) | | | (1,085,050 | ) | | | (1,636,252 | ) | | | (1,439,045 | ) | | | (4,279,041 | ) | |
| Accumulated undistributed (distributions in excess of) net investment income | | | (147,075 | ) | | | (55,808 | ) | | | 80,715 | | | | (109,577 | ) | |
| Net unrealized appreciation (computed on the basis of identified cost) | | | 3,804,116 | | | | 2,398,972 | | | | 3,985,774 | | | | 5,538,779 | | |
| Total | | $ | 59,029,243 | | | $ | 42,002,548 | | | $ | 55,561,897 | | | $ | 63,134,231 | | |
| Class A Shares | | | |
| Net Assets | | $ | 40,836,128 | | | $ | 32,095,192 | | | $ | 39,646,477 | | | $ | 48,748,988 | | |
| Shares Outstanding | | | 4,144,046 | | | | 3,241,424 | | | | 4,173,828 | | | | 5,241,211 | | |
Net Asset Value and Redemption Price Per Share
(net assets ÷ shares of beneficial interest outstanding) | | $ | 9.85 | | | $ | 9.90 | | | $ | 9.50 | | | $ | 9.30 | | |
Maximum Offering Price Per Share
(100 ÷ 95.25 of net asset value per share) | | $ | 10.34 | | | $ | 10.39 | | | $ | 9.97 | | | $ | 9.76 | | |
| Class B Shares | | | |
| Net Assets | | $ | 18,193,115 | | | $ | 9,907,356 | | | $ | 15,915,420 | | | $ | 14,385,243 | | |
| Shares Outstanding | | | 1,679,974 | | | | 931,498 | | | | 1,568,811 | | | | 1,433,480 | | |
Net Asset Value, Offering Price and Redemption Price Per Share
(net assets ÷ shares of beneficial interest outstanding) | | $ | 10.83 | | | $ | 10.64 | | | $ | 10.14 | | | $ | 10.04 | | |
On sales of $25,000 or more, the offering price of Class A shares is reduced.
See notes to financial statements
64
Eaton Vance Municipals Funds as of February 28, 2005
FINANCIAL STATEMENTS (Unaudited) CONT'D
Statements of Assets and Liabilities
As of February 28, 2005
| | | Louisiana Fund | | Maryland Fund | | Missouri Fund | | North Carolina Fund | |
| Assets | | | | | | | | | | | | | | | | | |
| Investments - | | | | | | | | | | | | | | | | | |
| Identified cost | | $ | 25,806,793 | | | $ | 68,494,520 | | | $ | 57,066,445 | | | $ | 69,449,635 | | |
| Unrealized appreciation | | | 1,981,930 | | | | 59,963 | | | | 5,228,639 | | | | 5,130,211 | | |
| Investments, at value | | $ | 27,788,723 | | | $ | 68,554,483 | | | $ | 62,295,084 | | | $ | 74,579,846 | | |
| Cash | | $ | 420,093 | | | $ | 1,001,093 | | | $ | 2,858,102 | | | $ | 895,641 | | |
| Receivable for investments sold | | | 4,486 | | | | - | | | | 5,000 | | | | - | | |
| Receivable for Fund shares sold | | | 64,280 | | | | 49,502 | | | | 145,696 | | | | 3,232 | | |
| Interest receivable | | | 358,746 | | | | 780,348 | | | | 647,568 | | | | 794,853 | | |
| Receivable for daily variation margin on open financial futures contracts | | | 63,437 | | | | 152,250 | | | | 91,531 | | | | 175,000 | | |
| Total assets | | $ | 28,699,765 | | | $ | 70,537,676 | | | $ | 66,042,981 | | | $ | 76,448,572 | | |
| Liabilities | | | | | | | | | | | | | | | | | |
| Payable for investments purchased | | $ | - | | | $ | 93,665 | | | $ | 2,182,282 | | | $ | - | | |
| Payable for Fund shares redeemed | | | 111,301 | | | | 233,766 | | | | 159,270 | | | | 146,790 | | |
| Dividends payable | | | 59,111 | | | | 82,155 | | | | 93,338 | | | | 109,250 | | |
| Payable for when-issued securities | | | - | | | | 822,256 | | | | - | | | | - | | |
| Payable to affiliate for service fees | | | 9,296 | | | | 22,456 | | | | 20,338 | | | | 24,723 | | |
| Accrued expenses | | | 26,396 | | | | 39,404 | | | | 31,878 | | | | 44,577 | | |
| Total liabilities | | $ | 206,104 | | | $ | 1,293,702 | | | $ | 2,487,106 | | | $ | 325,340 | | |
| Net Assets | | $ | 28,493,661 | | | $ | 69,243,974 | | | $ | 63,555,875 | | | $ | 76,123,232 | | |
| Sources of Net Assets | | | | | | | | | | | | | | | | | |
| Paid-in capital | | $ | 27,575,444 | | | $ | 69,299,455 | | | $ | 59,860,752 | | | $ | 71,546,867 | | |
| Accumulated net realized loss (computed on the basis of identified cost) | | | (1,164,717 | ) | | | (561,496 | ) | | | (1,574,560 | ) | | | (606,602 | ) | |
| Accumulated undistributed (distributions in excess of) net investment income | | | 39,038 | | | | 301,079 | | | | (34,277 | ) | | | (107,902 | ) | |
| Net unrealized appreciation (computed on the basis of identified cost) | | | 2,043,896 | | | | 204,936 | | | | 5,303,960 | | | | 5,290,869 | | |
| Total | | $ | 28,493,661 | | | $ | 69,243,974 | | | $ | 63,555,875 | | | $ | 76,123,232 | | |
| Class A Shares | | | | | | | | | | | | | | | | | |
| Net Assets | | $ | 19,377,907 | | | $ | 46,226,664 | | | $ | 50,751,648 | | | $ | 59,510,514 | | |
| Shares Outstanding | | | 1,942,850 | | | | 4,830,443 | | | | 5,023,377 | | | | 6,333,443 | | |
Net Asset Value and Redemption Price Per Share
(net assets ÷ shares of beneficial interest outstanding) | | $ | 9.97 | | | $ | 9.57 | | | $ | 10.10 | | | $ | 9.40 | | |
Maximum Offering Price Per Share
(100 ÷ 95.25 of net asset value per share) | | $ | 10.47 | | | $ | 10.05 | | | $ | 10.60 | | | $ | 9.87 | | |
| Class B Shares | | | | | | | | | | | | | | | | | |
| Net Assets | | $ | 9,115,754 | | | $ | 23,017,310 | | | $ | 12,804,227 | | | $ | 16,612,718 | | |
| Shares Outstanding | | | 865,111 | | | | 2,205,292 | | | | 1,146,986 | | | | 1,644,050 | | |
Net Asset Value, Offering Price and Redemption Price Per Share
(net assets ÷ shares of beneficial interest outstanding) | | $ | 10.54 | | | $ | 10.44 | | | $ | 11.16 | | | $ | 10.10 | | |
On sales of $25,000 or more, the offering price of Class A shares is reduced.
See notes to financial statements
65
Eaton Vance Municipals Funds as of February 28, 2005
FINANCIAL STATEMENTS (Unaudited) CONT'D
Statements of Assets and Liabilities
As of February 28, 2005
| | | Oregon Fund | | South Carolina Fund | | Tennessee Fund | | Virginia Fund | |
| Assets | | | |
| Investments - | | | | | | | | | | | | | | | | | |
| Identified cost | | $ | 76,469,133 | | | $ | 53,683,966 | | | $ | 45,225,690 | | | $ | 95,683,537 | | |
| Unrealized appreciation | | | 3,874,905 | | | | 3,811,438 | | | | 3,852,233 | | | | 9,309,511 | | |
| Investments, at value | | $ | 80,344,038 | | | $ | 57,495,404 | | | $ | 49,077,923 | | | $ | 104,993,048 | | |
| Cash | | $ | 601,627 | | | $ | 1,161,242 | | | $ | 1,491,023 | | | $ | 559,973 | | |
| Receivable for investments sold | | | 420,042 | | | | - | | | | 391,242 | | | | 200,000 | | |
| Receivable for Fund shares sold | | | 158,650 | | | | 45,005 | | | | 209,135 | | | | 51,299 | | |
| Interest receivable | | | 979,513 | | | | 883,197 | | | | 595,084 | | | | 1,338,917 | | |
| Receivable for daily variation margin on open financial futures contracts | | | 192,187 | | | | 108,750 | | | | 85,187 | | | | 226,562 | | |
| Total assets | | $ | 82,696,057 | | | $ | 59,693,598 | | | $ | 51,849,594 | | | $ | 107,369,799 | | |
| Liabilities | | | |
| Payable for investments purchased | | $ | 75,788 | | | $ | - | | | $ | - | | | $ | - | | |
| Payable for Fund shares redeemed | | | 84,925 | | | | 59,310 | | | | 116,280 | | | | 241,743 | | |
| Dividends payable | | | 119,431 | | | | 100,192 | | | | 74,088 | | | | 139,943 | | |
| Payable for when-issued securities | | | - | | | | 978,960 | | | | - | | | | - | | |
| Payable to affiliate for service fees | | | 26,446 | | | | 18,758 | | | | 16,694 | | | | 34,578 | | |
| Accrued expenses | | | 36,531 | | | | 34,612 | | | | 28,982 | | | | 44,730 | | |
| Total liabilities | | $ | 343,121 | | | $ | 1,191,832 | | | $ | 236,044 | | | $ | 460,994 | | |
| Net Assets | | $ | 82,352,936 | | | $ | 58,501,766 | | | $ | 51,613,550 | | | $ | 106,908,805 | | |
| Sources of Net Assets | | | |
| Paid-in capital | | $ | 82,171,720 | | | $ | 55,976,146 | | | $ | 49,077,199 | | | $ | 99,924,499 | | |
| Accumulated net realized loss (computed on the basis of identified cost) | | | (3,856,240 | ) | | | (1,310,250 | ) | | | (1,300,049 | ) | | | (2,619,431 | ) | |
| Accumulated undistributed (distributions in excess of) net investment income | | | (16,465 | ) | | | (79,120 | ) | | | (85,933 | ) | | | 68,735 | | |
| Net unrealized appreciation (computed on the basis of identified cost) | | | 4,053,921 | | | | 3,914,990 | | | | 3,922,333 | | | | 9,535,002 | | |
| Total | | $ | 82,352,936 | | | $ | 58,501,766 | | | $ | 51,613,550 | | | $ | 106,908,805 | | |
| Class A Shares | | | |
| Net Assets | | $ | 58,891,545 | | | $ | 39,484,636 | | | $ | 40,164,846 | | | $ | 76,958,461 | | |
| Shares Outstanding | | | 6,207,073 | | | | 3,975,402 | | | | 4,061,701 | | | | 7,943,234 | | |
Net Asset Value and Redemption Price Per Share
(net assets ÷ shares of beneficial interest outstanding) | | $ | 9.49 | | | $ | 9.93 | | | $ | 9.89 | | | $ | 9.69 | | |
Maximum Offering Price Per Share
(100 ÷ 95.25 of net asset value per share) | | $ | 9.96 | | | $ | 10.43 | | | $ | 10.38 | | | $ | 10.17 | | |
| Class B Shares | | | |
| Net Assets | | $ | 23,461,391 | | | $ | 19,017,130 | | | $ | 11,448,704 | | | $ | 29,950,344 | | |
| Shares Outstanding | | | 2,261,678 | | | | 1,806,325 | | | | 1,063,315 | | | | 2,793,745 | | |
Net Asset Value, Offering Price and Redemption Price Per Share
(net assets ÷ shares of beneficial interest outstanding) | | $ | 10.37 | | | $ | 10.53 | | | $ | 10.77 | | | $ | 10.72 | | |
On sales of $25,000 or more, the offering price of Class A shares is reduced.
See notes to financial statements
66
Eaton Vance Municipals Funds as of February 28, 2005
FINANCIAL STATEMENTS (Unaudited) CONT'D
Statements of Operations
For the Six Months Ended February 28, 2005
| | | Alabama Fund | | Arkansas Fund | | Georgia Fund | | Kentucky Fund | |
| Investment Income | | | |
| Interest | | $ | 1,325,308 | | | $ | 980,753 | | | $ | 1,300,020 | | | $ | 1,470,474 | | |
| Interest allocated from Portfolio | | | 210,941 | | | | 161,303 | | | | 251,424 | | | | 232,007 | | |
| Expenses allocated from Portfolio | | | (16,905 | ) | | | (11,187 | ) | | | (14,582 | ) | | | (18,296 | ) | |
| Total investment income | | $ | 1,519,344 | | | $ | 1,130,869 | | | $ | 1,536,862 | | | $ | 1,684,185 | | |
| Expenses | | | |
| Investment adviser fee | | $ | 77,793 | | | $ | 43,068 | | | $ | 69,567 | | | $ | 86,278 | | |
| Trustees fees and expenses | | | 2,559 | | | | 508 | | | | 2,560 | | | | 2,440 | | |
| Distribution and service fees | | | | | | | | | | | | | | | | | |
| Class A | | | 40,080 | | | | 31,362 | | | | 38,474 | | | | 47,312 | | |
| Class B | | | 91,365 | | | | 48,099 | | | | 74,469 | | | | 74,222 | | |
| Legal and accounting services | | | 21,612 | | | | 17,760 | | | | 21,338 | | | | 16,299 | | |
| Printing and postage | | | 2,641 | | | | 1,802 | | | | 3,054 | | | | 4,066 | | |
| Custodian fee | | | 24,468 | | | | 19,383 | | | | 25,135 | | | | 24,297 | | |
| Transfer and dividend disbursing agent fees | | | 18,086 | | | | 12,887 | | | | 17,902 | | | | 19,733 | | |
| Registration fees | | | - | | | | 785 | | | | 157 | | | | - | | |
| Miscellaneous | | | 7,609 | | | | 10,243 | | | | 7,057 | | | | 12,646 | | |
| Total expenses | | $ | 286,213 | | | $ | 185,897 | | | $ | 259,713 | | | $ | 287,293 | | |
Deduct -
Reduction of custodian fee | | $ | 3,027 | | | $ | 2,392 | | | $ | 4,072 | | | $ | 4,364 | | |
| Total expense reductions | | $ | 3,027 | | | $ | 2,392 | | | $ | 4,072 | | | $ | 4,364 | | |
| Net expenses | | $ | 283,186 | | | $ | 183,505 | | | $ | 255,641 | | | $ | 282,929 | | |
| Net investment income | | $ | 1,236,158 | | | $ | 947,364 | | | $ | 1,281,221 | | | $ | 1,401,256 | | |
| Realized and Unrealized Gain (Loss) | | | |
| Net realized gain (loss) - | | | | | | | | | | | | | | | | | |
| Investment transactions (identified cost basis) | | $ | 222,749 | | | $ | 216,720 | | | $ | 226,845 | | | $ | 406,385 | | |
| Investment transactions from Portfolio (identified cost basis) | | | - | | | | 63,495 | | | | 239,384 | | | | 51,803 | | |
| Financial futures contracts | | | (552,973 | ) | | | (358,221 | ) | | | (437,001 | ) | | | (684,619 | ) | |
| Interest rate swap contracts | | | - | | | | (99,280 | ) | | | - | | | | - | | |
| Net realized gain (loss) | | $ | (330,224 | ) | | $ | (177,286 | ) | | $ | 29,228 | | | $ | (226,431 | ) | |
| Change in unrealized appreciation (depreciation) - | | | | | | | | | | | | | | | | | |
| Investments (identified cost basis) | | $ | (200,063 | ) | | $ | (221,591 | ) | | $ | (393,551 | ) | | $ | (648,160 | ) | |
| Investments from Portfolio (identified cost basis) | | | 683,785 | | | | 301,844 | | | | 273,871 | | | | 506,378 | | |
| Financial futures contracts | | | 464,255 | | | | 362,607 | | | | 378,944 | | | | 496,461 | | |
| Financial futures contracts from Portfolio | | | (261,375 | ) | | | (235,079 | ) | | | (225,250 | ) | | | (274,125 | ) | |
| Interest rate swap contracts | | | - | | | | 85,232 | | | | - | | | | - | | |
| Interest rate swap contracts from Portfolio | | | - | | | | (29,410 | ) | | | - | | | | - | | |
| Net change in unrealized appreciation (depreciation) | | $ | 686,602 | | | $ | 263,603 | | | $ | 34,014 | | | $ | 80,554 | | |
| Net realized and unrealized gain (loss) | | $ | 356,378 | | | $ | 86,317 | | | $ | 63,242 | | | $ | (145,877 | ) | |
| Net increase in net assets from operations | | $ | 1,592,536 | | | $ | 1,033,681 | | | $ | 1,344,463 | | | $ | 1,255,379 | | |
See notes to financial statements
67
Eaton Vance Municipals Funds as of February 28, 2005
FINANCIAL STATEMENTS (Unaudited) CONT'D
Statements of Operations
For the Six Months Ended February 28, 2005
| | | Louisiana Fund | | Maryland Fund | | Missouri Fund | | North Carolina Fund | |
| Investment Income | | | |
| Interest | | $ | 668,757 | | | $ | 1,651,339 | | | $ | 1,447,792 | | | $ | 1,766,473 | | |
| Interest allocated from Portfolio | | | 102,101 | | | | 266,126 | | | | 214,872 | | | | 281,116 | | |
| Expenses allocated from Portfolio | | | (6,588 | ) | | | (20,621 | ) | | | (16,757 | ) | | | (25,209 | ) | |
| Total investment income | | $ | 764,270 | | | $ | 1,896,844 | | | $ | 1,645,907 | | | $ | 2,022,380 | | |
| Expenses | | | |
| Investment adviser fee | | $ | 24,352 | | | $ | 99,690 | | | $ | 82,866 | | | $ | 113,384 | | |
| Trustees fees and expenses | | | 554 | | | | 2,565 | | | | 2,555 | | | | 2,565 | | |
| Distribution and service fees | | | | | | | | | | | | | | | | | |
| Class A | | | 18,676 | | | | 45,566 | | | | 47,694 | | | | 59,833 | | |
| Class B | | | 44,276 | | | | 114,450 | | | | 61,169 | | | | 82,027 | | |
| Legal and accounting services | | | 13,891 | | | | 19,157 | | | | 19,549 | | | | 18,303 | | |
| Printing and postage | | | 1,552 | | | | 4,160 | | | | 3,540 | | | | 4,937 | | |
| Custodian fee | | | 15,159 | | | | 28,127 | | | | 24,462 | | | | 27,814 | | |
| Transfer and dividend disbursing agent fees | | | 6,123 | | | | 25,159 | | | | 18,888 | | | | 27,865 | | |
| Registration fees | | | 1,130 | | | | 4,830 | | | | 3,500 | | | | - | | |
| Miscellaneous | | | 8,776 | | | | 9,767 | | | | 7,600 | | | | 10,910 | | |
| Total expenses | | $ | 134,489 | | | $ | 353,471 | | | $ | 271,823 | | | $ | 347,638 | | |
Deduct -
Reduction of custodian fee | | $ | 1,173 | | | $ | 2,501 | | | $ | 7,205 | | | $ | 1,249 | | |
| Total expense reductions | | $ | 1,173 | | | $ | 2,501 | | | $ | 7,205 | | | $ | 1,249 | | |
| Net expenses | | $ | 133,316 | | | $ | 350,970 | | | $ | 264,618 | | | $ | 346,389 | | |
| Net investment income | | $ | 630,954 | | | $ | 1,545,874 | | | $ | 1,381,289 | | | $ | 1,675,991 | | |
| Realized and Unrealized Gain (Loss) | | | |
| Net realized gain (loss) - | | | | | | | | | | | | | | | | | |
| Investment transactions (identified cost basis) | | $ | 149,290 | | | $ | 1,118,749 | | | $ | 67,356 | | | $ | 799,091 | | |
| Investment transactions from Portfolio (identified cost basis) | | | (730 | ) | | | 186,140 | | | | 11,411 | | | | 88,943 | | |
| Financial futures contracts | | | (210,379 | ) | | | (792,520 | ) | | | (422,376 | ) | | | (699,333 | ) | |
| Interest rate swap contracts | | | - | | | | - | | | | - | | | | (297,840 | ) | |
| Net realized gain (loss) | | $ | (61,819 | ) | | $ | 512,369 | | | $ | (343,609 | ) | | $ | (109,139 | ) | |
| Change in unrealized appreciation (depreciation) - | | | | | | | | | | | | | | | | | |
| Investments (identified cost basis) | | $ | 5,484 | | | $ | (683,365 | ) | | $ | (692,060 | ) | | $ | (978,750 | ) | |
| Investments from Portfolio (identified cost basis) | | | 339,136 | | | | 417,888 | | | | 1,056,041 | | | | 745,614 | | |
| Financial futures contracts | | | 186,511 | | | | 722,894 | | | | 349,901 | | | | 686,934 | | |
| Financial futures contracts from Portfolio | | | (85,000 | ) | | | (378,250 | ) | | | (204,000 | ) | | | (452,345 | ) | |
| Interest rate swap contracts | | | - | | | | - | | | | - | | | | 255,696 | | |
| Interest rate swap contracts from Portfolio | | | - | | | | - | | | | - | | | | (88,229 | ) | |
| Net change in unrealized appreciation (depreciation) | | $ | 446,131 | | | $ | 79,167 | | | $ | 509,882 | | | $ | 168,920 | | |
| Net realized and unrealized gain | | $ | 384,312 | | | $ | 591,536 | | | $ | 166,273 | | | $ | 59,781 | | |
| Net increase in net assets from operations | | $ | 1,015,266 | | | $ | 2,137,410 | | | $ | 1,547,562 | | | $ | 1,735,772 | | |
See notes to financial statements
68
Eaton Vance Municipals Funds as of February 28, 2005
FINANCIAL STATEMENTS (Unaudited) CONT'D
Statements of Operations
For the Six Months Ended February 28, 2005
| | | Oregon Fund | | South Carolina Fund | | Tennessee Fund | | Virginia Fund | |
| Investment Income | | | |
| Interest | | $ | 2,045,573 | | | $ | 1,362,153 | | | $ | 1,156,621 | | | $ | 2,428,791 | | |
| Interest allocated from Portfolio | | | 320,101 | | | | 205,921 | | | | 179,153 | | | | 384,295 | | |
| Expenses allocated from Portfolio | | | (24,379 | ) | | | (14,809 | ) | | | (13,112 | ) | | | (32,621 | ) | |
| Total investment income | | $ | 2,341,295 | | | $ | 1,553,265 | | | $ | 1,322,662 | | | $ | 2,780,465 | | |
| Expenses | | | |
| Investment adviser fee | | $ | 125,046 | | | $ | 73,786 | | | $ | 61,719 | | | $ | 171,755 | | |
| Trustees fees and expenses | | | 2,556 | | | | 2,619 | | | | 2,837 | | | | 3,223 | | |
| Distribution and service fees | | | | | | | | | | | | | | | | | |
| Class A | | | 56,410 | | | | 37,019 | | | | 39,295 | | | | 74,773 | | |
| Class B | | | 114,314 | | | | 89,081 | | | | 55,346 | | | | 149,785 | | |
| Legal and accounting services | | | 17,900 | | | | 19,490 | | | | 14,732 | | | | 22,947 | | |
| Printing and postage | | | 4,628 | | | | 2,136 | | | | 4,200 | | | | 6,457 | | |
| Custodian fee | | | 29,885 | | | | 24,168 | | | | 21,969 | | | | 38,546 | | |
| Transfer and dividend disbursing agent fees | | | 24,680 | | | | 11,708 | | | | 13,954 | | | | 39,610 | | |
| Registration fees | | | 560 | | | | 157 | | | | 1,488 | | | | - | | |
| Miscellaneous | | | 9,493 | | | | 10,230 | | | | 7,450 | | | | 9,694 | | |
| Total expenses | | $ | 385,472 | | | $ | 270,394 | | | $ | 222,990 | | | $ | 516,790 | | |
Deduct -
Reduction of custodian fee | | $ | 3,986 | | | $ | 5,131 | | | $ | 3,079 | | | $ | 4,324 | | |
| Total expense reductions | | $ | 3,986 | | | $ | 5,131 | | | $ | 3,079 | | | $ | 4,324 | | |
| Net expenses | | $ | 381,486 | | | $ | 265,263 | | | $ | 219,911 | | | $ | 512,466 | | |
| Net investment income | | $ | 1,959,809 | | | $ | 1,288,002 | | | $ | 1,102,751 | | | $ | 2,267,999 | | |
| Realized and Unrealized Gain (Loss) | | | |
| Net realized gain (loss) - | | | | | | | | | | | | | | | | | |
| Investment transactions (identified cost basis) | | $ | 33,974 | | | $ | 468,902 | | | $ | 106,862 | | | $ | 1,054,743 | | |
| Investment transactions from Portfolio (identified cost basis) | | | 157,411 | | | | 12,713 | | | | 61 | | | | 74,740 | | |
| Financial futures contracts | | | (886,190 | ) | | | (526,102 | ) | | | (398,574 | ) | | | (752,113 | ) | |
| Interest rate swap contracts | | | (49,640 | ) | | | - | | | | - | | | | - | | |
| Net realized gain (loss) | | $ | (744,445 | ) | | $ | (44,487 | ) | | $ | (291,651 | ) | | $ | 377,370 | | |
| Change in unrealized appreciation (depreciation) - | | | | | | | | | | | | | | | | | |
| Investments (identified cost basis) | | $ | 283,832 | | | $ | 373,037 | | | $ | (341,803 | ) | | $ | (878,940 | ) | |
| Investments from Portfolio (identified cost basis) | | | 290,747 | | | | 771,804 | | | | 461,245 | | | | 1,250,636 | | |
| Financial futures contracts | | | 738,886 | | | | 451,875 | | | | 338,360 | | | | 739,239 | | |
| Financial futures contracts from Portfolio | | | (514,063 | ) | | | (255,000 | ) | | | (199,751 | ) | | | (350,624 | ) | |
| Interest rate swap contracts | | | 42,616 | | | | - | | | | - | | | | - | | |
| Interest rate swap contracts from Portfolio | | | (14,705 | ) | | | - | | | | - | | | | - | | |
| Net change in unrealized appreciation (depreciation) | | $ | 827,313 | | | $ | 1,341,716 | | | $ | 258,051 | | | $ | 760,311 | | |
| Net realized and unrealized gain (loss) | | $ | 82,868 | | | $ | 1,297,229 | | | $ | (33,600 | ) | | $ | 1,137,681 | | |
| Net increase in net assets from operations | | $ | 2,042,677 | | | $ | 2,585,231 | | | $ | 1,069,151 | | | $ | 3,405,680 | | |
See notes to financial statements
69
Eaton Vance Municipals Funds as of February 28, 2005
FINANCIAL STATEMENTS (Unaudited) CONT'D
Statements of Changes in Net Assets
For the Six Months Ended February 28, 2005
| Increase (Decrease) in Net Assets | | Alabama Fund | | Arkansas Fund | | Georgia Fund | | Kentucky Fund | |
| From operations - | | | | | | | | | | | | | | | | | |
| Net investment income | | $ | 1,236,158 | | | $ | 947,364 | | | $ | 1,281,221 | | | $ | 1,401,256 | | |
Net realized gain (loss) from investment transactions,
financial futures contracts and interest rate swap contracts | | | (330,224 | ) | | | (177,286 | ) | | | 29,228 | | | | (226,431 | ) | |
Net change in unrealized appreciation (depreciation)
from investments, financial futures contracts and interest
rate swap contracts | | | 686,602 | | | | 263,603 | | | | 34,014 | | | | 80,554 | | |
| Net increase in net assets from operations | | $ | 1,592,536 | | | $ | 1,033,681 | | | $ | 1,344,463 | | | $ | 1,255,379 | | |
| Distributions to shareholders - | | | | | | | | | | | | | | | | | |
| From net investment income | | | | | | | | | | | | | | | | | |
| Class A | | $ | (907,573 | ) | | $ | (754,283 | ) | | $ | (935,708 | ) | | $ | (1,100,421 | ) | |
| Class B | | | (363,455 | ) | | | (204,986 | ) | | | (322,319 | ) | | | (304,173 | ) | |
| Total distributions to shareholders | | $ | (1,271,028 | ) | | $ | (959,269 | ) | | $ | (1,258,027 | ) | | $ | (1,404,594 | ) | |
| Transactions in shares of beneficial interest - | | | | | | | | | | | | | | | | | |
| Proceeds from sale of shares | | | | | | | | | | | | | | | | | |
| Class A | | $ | 1,882,389 | | | $ | 2,119,332 | | | $ | 2,206,695 | | | $ | 803,718 | | |
| Class B | | | 204,011 | | | | 454,915 | | | | 970,026 | | | | 235,080 | | |
Net asset value of shares issued to shareholders in payment of
distributions declared | | | |
| Class A | | | 434,563 | | | | 406,807 | | | | 515,639 | | | | 583,270 | | |
| Class B | | | 222,337 | | | | 142,065 | | | | 181,360 | | | | 159,292 | | |
| Cost of shares redeemed | | | | | | | | | | | | | | | | | |
| Class A | | | (2,519,565 | ) | | | (4,008,654 | ) | | | (1,788,604 | ) | | | (1,735,755 | ) | |
| Class B | | | (1,687,879 | ) | | | (755,145 | ) | | | (698,420 | ) | | | (482,913 | ) | |
| Net asset value of shares exchanged | | | | | | | | | | | | | | | | | |
| Class A | | | 595,460 | | | | 309,081 | | | | 423,733 | | | | 1,922,329 | | |
| Class B | | | (595,460 | ) | | | (309,081 | ) | | | (423,733 | ) | | | (1,922,329 | ) | |
| Net increase (decrease) in net assets from Fund share transactions | | $ | (1,464,144 | ) | | $ | (1,640,680 | ) | | $ | 1,386,696 | | | $ | (437,308 | ) | |
| Net increase (decrease) in net assets | | $ | (1,142,636 | ) | | $ | (1,566,268 | ) | | $ | 1,473,132 | | | $ | (586,523 | ) | |
| Net Assets | | | | | | | | | | | | | | | | | |
| At beginning of period | | $ | 60,171,879 | | | $ | 43,568,816 | | | $ | 54,088,765 | | | $ | 63,720,754 | | |
| At end of period | | $ | 59,029,243 | | | $ | 42,002,548 | | | $ | 55,561,897 | | | $ | 63,134,231 | | |
Accumulated undistributed
(distributions in excess of) net
investment income included in net assets | | | | | | | | | | | | | | | | | |
| At end of period | | $ | (147,075 | ) | | $ | (55,808 | ) | | $ | 80,715 | | | $ | (109,577 | ) | |
See notes to financial statements
70
Eaton Vance Municipals Funds as of February 28, 2005
FINANCIAL STATEMENTS (Unaudited) CONT'D
Statements of Changes in Net Assets
For the Six Months Ended February 28, 2005
| Increase (Decrease) in Net Assets | | Louisiana Fund | | Maryland Fund | | Missouri Fund | | North Carolina Fund | |
| From operations - | | | | | | | | | | | | | | | | | |
| Net investment income | | $ | 630,954 | | | $ | 1,545,874 | | | $ | 1,381,289 | | | $ | 1,675,991 | | |
Net realized gain (loss) from investment transactions,
financial futures contracts and interest rate swap contracts | | | (61,819 | ) | | | 512,369 | | | | (343,609 | ) | | | (109,139 | ) | |
Net change in unrealized appreciation (depreciation)
from investments, financial futures contracts and
interest rate swap contracts | | | 446,131 | | | | 79,167 | | | | 509,882 | | | | 168,920 | | |
| Net increase in net assets from operations | | $ | 1,015,266 | | | $ | 2,137,410 | | | $ | 1,547,562 | | | $ | 1,735,772 | | |
| Distributions to shareholders - | | | | | | | | | | | | | | | | | |
| From net investment income | | | | | | | | | | | | | | | | | |
| Class A | | $ | (442,065 | ) | | $ | (1,060,469 | ) | | $ | (1,161,468 | ) | | $ | (1,364,466 | ) | |
| Class B | | | (186,349 | ) | | | (471,255 | ) | | | (266,318 | ) | | | (329,070 | ) | |
| Total distributions to shareholders | | $ | (628,414 | ) | | $ | (1,531,724 | ) | | $ | (1,427,786 | ) | | $ | (1,693,536 | ) | |
| Transactions in shares of beneficial interest - | | | | | | | | | | | | | | | | | |
| Proceeds from sale of shares | | | | | | | | | | | | | | | | | |
| Class A | | $ | 1,665,585 | | | $ | 977,084 | | | $ | 7,418,678 | | | $ | 1,023,753 | | |
| Class B | | | 158,347 | | | | 709,254 | | | | 641,435 | | | | 285,847 | | |
Net asset value of shares issued to shareholders in payment of
distributions declared | | | |
| Class A | | | 200,321 | | | | 678,374 | | | | 682,284 | | | | 762,392 | | |
| Class B | | | 51,540 | | | | 289,006 | | | | 164,108 | | | | 183,020 | | |
| Cost of shares redeemed | | | | | | | | | | | | | | | | | |
| Class A | | | (869,076 | ) | | | (3,521,942 | ) | | | (2,098,192 | ) | | | (4,934,901 | ) | |
| Class B | | | (337,396 | ) | | | (1,861,413 | ) | | | (660,394 | ) | | | (1,041,771 | ) | |
| Net asset value of shares exchanged | | | | | | | | | | �� | | | | | | | |
| Class A | | | 326,645 | | | | 1,781,701 | | | | 275,892 | | | | 923,531 | | |
| Class B | | | (326,645 | ) | | | (1,781,701 | ) | | | (275,892 | ) | | | (923,531 | ) | |
| Net increase (decrease) in net assets from Fund share transactions | | $ | 869,321 | | | $ | (2,729,637 | ) | | $ | 6,147,919 | | | $ | (3,721,660 | ) | |
| Net increase (decrease) in net assets | | $ | 1,256,173 | | | $ | (2,123,951 | ) | | $ | 6,267,695 | | | $ | (3,679,424 | ) | |
| Net Assets | | | | | | | | | | | | | | | | | |
| At beginning of period | | $ | 27,237,488 | | | $ | 71,367,925 | | | $ | 57,288,180 | | | $ | 79,802,656 | | |
| At end of period | | $ | 28,493,661 | | | $ | 69,243,974 | | | $ | 63,555,875 | | | $ | 76,123,232 | | |
Accumulated undistributed
(distributions in excess of) net
investment income included in net assets | | | | | | | | | | | | | | | | | |
| At end of period | | $ | 39,038 | | | $ | 301,079 | | | $ | (34,277 | ) | | $ | (107,902 | ) | |
See notes to financial statements
71
Eaton Vance Municipals Funds as of February 28, 2005
FINANCIAL STATEMENTS (Unaudited) CONT'D
Statements of Changes in Net Assets
For the Six Months Ended February 28, 2005
| Increase (Decrease) in Net Assets | | Oregon Fund | | South Carolina Fund | | Tennessee Fund | | Virginia Fund | |
| From operations - | | | | | | | | | | | | | | | | | |
| Net investment income | | $ | 1,959,809 | | | $ | 1,288,002 | | | $ | 1,102,751 | | | $ | 2,267,999 | | |
Net realized gain (loss) from investment transactions,
financial futures contracts and interest rate swap contracts | | | (744,445 | ) | | | (44,487 | ) | | | (291,651 | ) | | | 377,370 | | |
Net change in unrealized appreciation (depreciation)
from investments, financial futures contracts and
interest rate swap contracts | | | 827,313 | | | | 1,341,716 | | | | 258,051 | | | | 760,311 | | |
| Net increase in net assets from operations | | $ | 2,042,677 | | | $ | 2,585,231 | | | $ | 1,069,151 | | | $ | 3,405,680 | | |
| Distributions to shareholders - | | | | | | | | | | | | | | | | | |
| From net investment income | | | | | | | | | | | | | | | | | |
| Class A | | $ | (1,449,155 | ) | | $ | (939,199 | ) | | $ | (921,796 | ) | | $ | (1,701,483 | ) | |
| Class B | | | (530,254 | ) | | | (408,289 | ) | | | (229,742 | ) | | | (599,600 | ) | |
| Total distributions to shareholders | | $ | (1,979,409 | ) | | $ | (1,347,488 | ) | | $ | (1,151,538 | ) | | $ | (2,301,083 | ) | |
| Transactions in shares of beneficial interest - | | | | | | | | | | | | | | | | | |
| Proceeds from sale of shares | | | | | | | | | | | | | | | | | |
| Class A | | $ | 5,155,224 | | | $ | 5,183,221 | | | $ | 2,416,383 | | | $ | 3,291,590 | | |
| Class B | | | 1,394,154 | | | | 807,642 | | | | 521,412 | | | | 691,892 | | |
Net asset value of shares issued to shareholders in payment of
distributions declared | | | |
| Class A | | | 898,260 | | | | 484,325 | | | | 507,784 | | | | 1,026,025 | | |
| Class B | | | 309,770 | | | | 209,955 | | | | 153,863 | | | | 353,939 | | |
| Cost of shares redeemed | | | | | | | | | | | | | | | | | |
| Class A | | | (3,453,279 | ) | | | (2,142,290 | ) | | | (2,695,662 | ) | | | (3,926,357 | ) | |
| Class B | | | (2,405,675 | ) | | | (408,972 | ) | | | (417,259 | ) | | | (2,034,209 | ) | |
| Net asset value of shares exchanged | | | | | | | | | | | | | | | | | |
| Class A | | | 640,574 | | | | 539,484 | | | | 716,216 | | | | 1,861,959 | | |
| Class B | | | (640,574 | ) | | | (539,484 | ) | | | (716,216 | ) | | | (1,861,959 | ) | |
| Net increase (decrease) in net assets from Fund share transactions | | $ | 1,898,454 | | | $ | 4,133,881 | | | $ | 486,521 | | | $ | (597,120 | ) | |
| Net increase in net assets | | $ | 1,961,722 | | | $ | 5,371,624 | | | $ | 404,134 | | | $ | 507,477 | | |
| Net Assets | | | | | | | | | | | | | | | | | |
| At beginning of period | | $ | 80,391,214 | | | $ | 53,130,142 | | | $ | 51,209,416 | | | $ | 106,401,328 | | |
| At end of period | | $ | 82,352,936 | | | $ | 58,501,766 | | | $ | 51,613,550 | | | $ | 106,908,805 | | |
Accumulated undistributed
(distributions in excess of) net
investment income included in net assets | | | | | | | | | | | | | | | | | |
| At end of period | | $ | (16,465 | ) | | $ | (79,120 | ) | | $ | (85,933 | ) | | $ | 68,735 | | |
See notes to financial statements
72
Eaton Vance Municipals Funds as of February 28, 2005
FINANCIAL STATEMENTS CONT'D
Statements of Changes in Net Assets
For the Year Ended August 31, 2004
| Increase (Decrease) in Net Assets | | Alabama Fund | | Arkansas Fund | | Georgia Fund | | Kentucky Fund | |
| From operations - | | | | | | | | | | | | | | | | | |
| Net investment income | | $ | 2,640,758 | | | $ | 1,965,703 | | | $ | 2,491,356 | | | $ | 2,841,845 | | |
Net realized gain (loss) from investment transactions,
financial futures contracts and interest rate swap contracts | | | 399,869 | | | | (828,350 | ) | | | (971,937 | ) | | | (856,675 | ) | |
Net change in unrealized appreciation (depreciation)
from investments, financial futures contracts and
interest rate swap contracts | | | 130,197 | | | | 1,472,293 | | | | 2,171,090 | | | | 1,394,002 | | |
| Net increase in net assets from operations | | $ | 3,170,824 | | | $ | 2,609,646 | | | $ | 3,690,509 | | | $ | 3,379,172 | | |
| Distributions to shareholders - | | | | | | | | | | | | | | | | | |
| From net investment income | | | | | | | | | | | | | | | | | |
| Class A | | $ | (1,076,281 | ) | | $ | (977,985 | ) | | $ | (949,043 | ) | | $ | (1,117,129 | ) | |
| Class B | | | (1,578,485 | ) | | | (978,303 | ) | | | (1,488,841 | ) | | | (1,679,736 | ) | |
| Total distributions to shareholders | | $ | (2,654,766 | ) | | $ | (1,956,288 | ) | | $ | (2,437,884 | ) | | $ | (2,796,865 | ) | |
| Transactions in shares of beneficial interest - | | | | | | | | | | | | | | | | | |
| Proceeds from sale of shares | | | | | | | | | | | | | | | | | |
| Class A | | $ | 34,728,505 | | | $ | 26,358,958 | | | $ | 37,022,262 | | | $ | 47,111,274 | | |
| Class B | | | 1,725,404 | | | | 1,014,415 | | | | 1,761,503 | | | | 1,379,643 | | |
Net asset value of shares issued to shareholders in payment of
distributions declared | | | |
| Class A | | | 518,861 | | | | 581,135 | | | | 502,771 | | | | 574,003 | | |
| Class B | | | 856,655 | | | | 635,186 | | | | 819,267 | | | | 879,996 | | |
| Cost of shares redeemed | | | | | | | | | | | | | | | | | |
| Class A | | | (3,329,746 | ) | | | (2,663,661 | ) | | | (2,702,718 | ) | | | (3,533,589 | ) | |
| Class B | | | (39,332,206 | ) | | | (26,466,390 | ) | | | (38,574,431 | ) | | | (50,752,994 | ) | |
| Net decrease in net assets from Fund share transactions | | $ | (4,832,527 | ) | | $ | (540,357 | ) | | $ | (1,171,346 | ) | | $ | (4,341,667 | ) | |
| Net increase (decrease) in net assets | | $ | (4,316,469 | ) | | $ | 113,001 | | | $ | 81,279 | | | $ | (3,759,360 | ) | |
| Net Assets | | | | | | | | | | | | | | | | | |
| At beginning of year | | $ | 64,488,348 | | | $ | 43,455,815 | | | $ | 54,007,486 | | | $ | 67,480,114 | | |
| At end of year | | $ | 60,171,879 | | | $ | 43,568,816 | | | $ | 54,088,765 | | | $ | 63,720,754 | | |
Accumulated undistributed
(distributions in excess of) net
investment income included in net assets | | | | | | | | | | | | | | | | | |
| At end of year | | $ | (112,205 | ) | | $ | (43,903 | ) | | $ | 57,521 | | | $ | (106,239 | ) | |
See notes to financial statements
73
Eaton Vance Municipals Funds as of February 28, 2005
FINANCIAL STATEMENTS CONT'D
Statements of Changes in Net Assets
For the Year Ended August 31, 2004
| Increase (Decrease) in Net Assets | | Louisiana Fund | | Maryland Fund | | Missouri Fund | | North Carolina Fund | |
| From operations - | | | | | | | | | | | | | | | | | |
| Net investment income | | $ | 1,265,307 | | | $ | 3,228,889 | | | $ | 2,590,562 | | | $ | 3,572,016 | | |
Net realized gain (loss) from investment transactions and
financial futures contracts | | | (228,841 | ) | | | (807,841 | ) | | | (672,373 | ) | | | 331,838 | | |
Net change in unrealized appreciation (depreciation)
from investments, financial futures contracts and
interest rate swap contracts | | | 859,671 | | | | 1,028,030 | | | | 1,908,944 | | | | 316,769 | | |
| Net increase in net assets from operations | | $ | 1,896,137 | | | $ | 3,449,078 | | | $ | 3,827,133 | | | $ | 4,220,623 | | |
| Distributions to shareholders - | | | | | | | | | | | | | | | | | |
| From net investment income | | | | | | | | | | | | | | | | | |
| Class A | | $ | (528,741 | ) | | $ | (1,163,130 | ) | | $ | (1,208,893 | ) | | $ | (1,534,841 | ) | |
| Class B | | | (693,682 | ) | | | (1,980,264 | ) | | | (1,582,879 | ) | | | (2,008,939 | ) | |
| From net realized gain | | | | | | | | | | | | | | | | | |
| Class A | | | - | | | | (35,150 | ) | | | - | | | | - | | |
| Class B | | | - | | | | (276,795 | ) | | | - | | | | - | | |
| Total distributions to shareholders | | $ | (1,222,423 | ) | | $ | (3,455,339 | ) | | $ | (2,791,772 | ) | | $ | (3,543,780 | ) | |
| Transactions in shares of beneficial interest - | | | | | | | | | | | | | | | | | |
| Proceeds from sale of shares | | | | | | | | | | | | | | | | | |
| Class A | | $ | 13,079,035 | | | $ | 43,184,232 | | | $ | 39,972,134 | | | $ | 58,546,692 | | |
| Class B | | | 650,480 | | | | 2,944,774 | | | | 1,373,900 | | | | 1,220,150 | | |
Net asset value of shares issued to shareholders in payment of
distributions declared | | | |
| Class A | | | 258,940 | | | | 724,591 | | | | 769,013 | | | | 867,544 | | |
| Class B | | | 211,163 | | | | 1,464,032 | | | | 996,471 | | | | 1,123,774 | | |
| Cost of shares redeemed | | | | | | | | | | | | | | | | | |
| Class A | | | (1,541,205 | ) | | | (4,813,161 | ) | | | (3,261,284 | ) | | | (5,391,405 | ) | |
| Class B | | | (14,434,133 | ) | | | (50,646,063 | ) | | | (40,777,902 | ) | | | (66,524,182 | ) | |
| Net decrease in net assets from Fund share transactions | | $ | (1,775,720 | ) | | $ | (7,141,595 | ) | | $ | (927,668 | ) | | $ | (10,157,427 | ) | |
| Net increase (decrease) in net assets | | $ | (1,102,006 | ) | | $ | (7,147,856 | ) | | $ | 107,693 | | | $ | (9,480,584 | ) | |
| Net Assets | | | | | | | | | | | | | | | | | |
| At beginning of year | | $ | 28,339,494 | | | $ | 78,515,781 | | | $ | 57,180,487 | | | $ | 89,283,240 | | |
| At end of year | | $ | 27,237,488 | | | $ | 71,367,925 | | | $ | 57,288,180 | | | $ | 79,802,656 | | |
Accumulated undistributed
(distributions in excess of) net
investment income included in net assets | | | | | | | | | | | | | | | | | |
| At end of year | | $ | 36,498 | | | $ | 286,929 | | | $ | 12,220 | | | $ | (90,357 | ) | |
See notes to financial statements
74
Eaton Vance Municipals Funds as of February 28, 2005
FINANCIAL STATEMENTS CONT'D
Statements of Changes in Net Assets
For the Year Ended August 31, 2004
| Increase (Decrease) in Net Assets | | Oregon Fund | | South Carolina Fund | | Tennessee Fund | | Virginia Fund | |
| From operations - | | | | | | | | | | | | | | | | | |
| Net investment income | | $ | 3,901,674 | | | $ | 2,552,325 | | | $ | 2,097,910 | | | $ | 4,772,535 | | |
Net realized loss from investment transactions,
financial futures contracts and interest rate swap contracts | | | (1,660,696 | ) | | | (342,480 | ) | | | (754,099 | ) | | | (1,715,320 | ) | |
Net change in unrealized appreciation (depreciation)
from investments, financial futures contracts and
interest rate swap contracts | | | 2,178,663 | | | | 1,758,049 | | | | 1,456,925 | | | | 4,006,329 | | |
| Net increase in net assets from operations | | $ | 4,419,641 | | | $ | 3,967,894 | | | $ | 2,800,736 | | | $ | 7,063,544 | | |
| Distributions to shareholders - | | | | | | | | | | | | | | | | | |
| From net investment income | | | | | | | | | | | | | | | | | |
| Class A | | $ | (1,570,081 | ) | | $ | (1,172,998 | ) | | $ | (1,058,771 | ) | | $ | (1,841,596 | ) | |
| Class B | | | (2,330,359 | ) | | | (1,413,526 | ) | | | (1,130,341 | ) | | | (2,903,078 | ) | |
| Total distributions to shareholders | | $ | (3,900,440 | ) | | $ | (2,586,524 | ) | | $ | (2,189,112 | ) | | $ | (4,744,674 | ) | |
| Transactions in shares of beneficial interest - | | | | | | | | | | | | | | | | | |
| Proceeds from sale of shares | | | | | | | | | | | | | | | | | |
| Class A | | $ | 50,207,110 | | | $ | 27,905,370 | | | $ | 34,497,381 | | | $ | 71,511,664 | | |
| Class B | | | 2,338,769 | | | | 1,935,422 | | | | 1,279,974 | | | | 2,372,337 | | |
Net asset value of shares issued to shareholders in payment of
distributions declared | | | |
| Class A | | | 970,037 | | | | 624,288 | | | | 600,444 | | | | 1,084,271 | | |
| Class B | | | 1,463,789 | | | | 790,571 | | | | 677,818 | | | | 1,773,521 | | |
| Cost of shares redeemed | | | | | | | | | | | | | | | | | |
| Class A | | | (3,929,615 | ) | | | (4,330,931 | ) | | | (4,392,600 | ) | | | (6,480,567 | ) | |
| Class B | | | (53,590,332 | ) | | | (26,361,174 | ) | | | (30,298,379 | ) | | | (79,394,209 | ) | |
| Net increase (decrease) in net assets from Fund share transactions | | $ | (2,540,242 | ) | | $ | 563,546 | | | $ | 2,364,638 | | | $ | (9,132,983 | ) | |
| Net increase (decrease) in net assets | | $ | (2,021,041 | ) | | $ | 1,944,916 | | | $ | 2,976,262 | | | $ | (6,814,113 | ) | |
| Net Assets | | | | | | | | | | | | | | | | | |
| At beginning of year | | $ | 82,412,255 | | | $ | 51,185,226 | | | $ | 48,233,154 | | | $ | 113,215,441 | | |
| At end of year | | $ | 80,391,214 | | | $ | 53,130,142 | | | $ | 51,209,416 | | | $ | 106,401,328 | | |
Accumulated undistributed
(distributions in excess of) net
investment income included in net assets | | | | | | | | | | | | | | | | | |
| At end of year | | $ | 3,135 | | | $ | (19,634 | ) | | $ | (37,146 | ) | | $ | 101,819 | | |
See notes to financial statements
75
Eaton Vance Municipals Funds as of February 28, 2005
FINANCIAL STATEMENTS CONT'D
Financial Highlights
| | | Alabama Fund - Class A | |
| | | Six Months Ended
February 28, 2005 | | Year Ended August 31, | |
| | | (Unaudited)(1) | | 2004(1) | | 2003 | | 2002(1)(2) | | 2001(1) | | 2000(1) | |
| Net asset value - Beginning of period | | $ | 9.800 | | | $ | 9.720 | | | $ | 9.920 | | | $ | 9.960 | | | $ | 9.410 | | | $ | 9.430 | | |
| Income (loss) from operations | | | | | | | | | | | | | | | | | | | | | | | | | |
| Net investment income | | $ | 0.215 | | | $ | 0.454 | | | $ | 0.475 | | | $ | 0.471 | | | $ | 0.479 | | | $ | 0.481 | | |
| Net realized and unrealized gain (loss) | | | 0.056 | | | | 0.085 | | | | (0.206 | ) | | | (0.042 | ) | | | 0.548 | | | | (0.015 | ) | |
| Total income from operations | | $ | 0.271 | | | $ | 0.539 | | | $ | 0.269 | | | $ | 0.429 | | | $ | 1.027 | | | $ | 0.466 | | |
| Less distributions | | | | | | | | | | | | | | | | | | | | | | | | | |
| From net investment income | | $ | (0.221 | ) | | $ | (0.459 | ) | | $ | (0.469 | ) | | $ | (0.469 | ) | | $ | (0.477 | ) | | $ | (0.486 | ) | |
| Total distributions | | $ | (0.221 | ) | | $ | (0.459 | ) | | $ | (0.469 | ) | | $ | (0.469 | ) | | $ | (0.477 | ) | | $ | (0.486 | ) | |
| Net asset value - End of period | | $ | 9.850 | | | $ | 9.800 | | | $ | 9.720 | | | $ | 9.920 | | | $ | 9.960 | | | $ | 9.410 | | |
| Total Return(3) | | | 2.79 | % | | | 5.61 | % | | | 2.74 | % | | | 4.49 | % | | | 11.22 | % | | | 5.22 | % | |
| Ratios/Supplemental Data | | | | | | | | | | | | | | | | | | | | | | | | | |
| Net assets, end of period (000's omitted) | | $ | 40,836 | | | $ | 40,225 | | | $ | 9,226 | | | $ | 7,846 | | | $ | 6,256 | | | $ | 6,198 | | |
| Ratios (As a percentage of average daily net assets): | | | | | | | | | | | | | | | | | | | | | | | | | |
| Expenses(4) | | | 0.78 | %(5) | | | 0.76 | % | | | 0.76 | % | | | 0.82 | % | | | 0.83 | % | | | 0.81 | % | |
| Expenses after custodian fee reduction(4) | | | 0.77 | %(5) | | | 0.76 | % | | | 0.74 | % | | | 0.81 | % | | | 0.81 | % | | | 0.80 | % | |
| Net investment income | | | 4.41 | %(5) | | | 4.63 | % | | | 4.78 | % | | | 4.83 | % | | | 4.95 | % | | | 5.26 | % | |
| Portfolio Turnover of the Portfolio(6) | | | 0 | % | | | 23 | % | | | 10 | % | | | 25 | % | | | 14 | % | | | 8 | % | |
| Portfolio Turnover of the Fund | | | 6 | % | | | - | | | | - | | | | - | | | | - | | | | - | | |
(1) Net investment income per share was computed using average shares outstanding.
(2) The Fund, through its investment in the Portfolio, has adopted the provisions of the revised AICPA Audit and Accounting Guide for Investment Companies and began using the interest method to amortize premiums on fixed-income securities. The effect of this change for the year ended August 31, 2002 was to increase net investment income per share by $0.001, increase net realized and unrealized loss per share by $0.001 and increase the ratio of net investment income to average net assets from 4.82% to 4.83%. Per-share data and ratios for the p eriods prior to September 1, 2001 have not been restated to reflect this change in presentation.
(3) Returns are historical and are calculated by determining the percentage change in net asset value with all distributions reinvested. Total return is not computed on an annualized basis.
(4) Includes the Fund's share of its corresponding Portfolio's allocated expenses while the Fund was making investments directly into the Portfolio.
(5) Annualized.
(6) Portfolio turnover represents the rate of portfolio activity for the period while the Fund was making investments directly into the Portfolio.
See notes to financial statements
76
Eaton Vance Municipals Funds as of February 28, 2005
FINANCIAL STATEMENTS CONT'D
Financial Highlights
| | | Alabama Fund - Class B | |
| | | Six Months Ended
February 28, 2005 | | Year Ended August 31, | |
| | | (Unaudited)(1) | | 2004(1) | | 2003 | | 2002(1)(2) | | 2001(1) | | 2000(1) | |
| Net asset value - Beginning of period | | $ | 10.770 | | | $ | 10.690 | | | $ | 10.910 | | | $ | 10.960 | | | $ | 10.350 | | | $ | 10.370 | | |
| Income (loss) from operations | | | |
| Net investment income | | $ | 0.196 | | | $ | 0.423 | | | $ | 0.439 | | | $ | 0.440 | | | $ | 0.444 | | | $ | 0.449 | | |
| Net realized and unrealized gain (loss) | | | 0.066 | | | | 0.080 | | | | (0.219 | ) | | | (0.050 | ) | | | 0.611 | | | | (0.017 | ) | |
| Total income from operations | | $ | 0.262 | | | $ | 0.503 | | | $ | 0.220 | | | $ | 0.390 | | | $ | 1.055 | | | $ | 0.432 | | |
| Less distributions | | | |
| From net investment income | | $ | (0.202 | ) | | $ | (0.423 | ) | | $ | (0.440 | ) | | $ | (0.440 | ) | | $ | (0.445 | ) | | $ | (0.452 | ) | |
| Total distributions | | $ | (0.202 | ) | | $ | (0.423 | ) | | $ | (0.440 | ) | | $ | (0.440 | ) | | $ | (0.445 | ) | | $ | (0.452 | ) | |
| Net asset value - End of period | | $ | 10.830 | | | $ | 10.770 | | | $ | 10.690 | | | $ | 10.910 | | | $ | 10.960 | | | $ | 10.350 | | |
| Total Return(3) | | | 2.61 | %(7) | | | 4.77 | % | | | 2.02 | % | | | 3.70 | % | | | 10.45 | % | | | 4.38 | % | |
| Ratios/Supplemental Data | | | |
| Net assets, end of period (000's omitted) | | $ | 18,193 | | | $ | 19,947 | | | $ | 55,263 | | | $ | 56,363 | | | $ | 57,782 | | | $ | 59,904 | | |
| Ratios (As a percentage of average daily net assets): | | | | | | | | | | | | | | | | | | | | | | | | | |
| Expenses(4) | | | 1.53 | %(5) | | | 1.52 | % | | | 1.51 | % | | | 1.57 | % | | | 1.58 | % | | | 1.62 | % | |
| Expenses after custodian fee reduction(4) | | | 1.52 | %(5) | | | 1.52 | % | | | 1.49 | % | | | 1.56 | % | | | 1.56 | % | | | 1.61 | % | |
| Net investment income | | | 3.67 | %(5) | | | 3.88 | % | | | 4.04 | % | | | 4.09 | % | | | 4.20 | % | | | 4.48 | % | |
| Portfolio Turnover of the Portfolio(6) | | | 0 | % | | | 23 | % | | | 10 | % | | | 25 | % | | | 14 | % | | | 8 | % | |
| Portfolio Turnover of the Fund | | | 6 | % | | | - | | | | - | | | | - | | | | - | | | | - | | |
(1) Net investment income per share was computed using average shares outstanding.
(2) The Fund, through its investment in the Portfolio, has adopted the provisions of the revised AICPA Audit and Accounting Guide for Investment Companies and began using the interest method to amortize premiums on fixed-income securities. The effect of this change for the year ended August 31, 2002 was to increase net investment income per share by $0.001, increase net realized and unrealized loss per share by $0.001 and increase the ratio of net investment income to average net assets from 4.08% to 4.09%. Per-share data and ratios for the p eriods prior to September 1, 2001 have not been restated to reflect this change in presentation.
(3) Returns are historical and are calculated by determining the percentage change in net asset value with all distributions reinvested. Total return is not computed on an annualized basis.
(4) Includes the Fund's share of its corresponding Portfolio's allocated expenses while the Fund was making investments directly into the Portfolio.
(5) Annualized.
(6) Portfolio turnover represents the rate of portfolio activity for the period while the Fund was making investments directly into the Portfolio.
(7) Total return reflects an increase of 0.14% due to a change in the timing of payment and reinvestment of distributions.
See notes to financial statements
77
Eaton Vance Municipals Funds as of February 28, 2005
FINANCIAL STATEMENTS CONT'D
Financial Highlights
| | | Arkansas Fund - Class A | |
| | | Six Months Ended
February 28, 2005 | | Year Ended August 31, | |
| | | (Unaudited)(1) | | 2004(1) | | 2003 | | 2002(1)(2) | | 2001 | | 2000(1) | |
| Net asset value - Beginning of period | | $ | 9.880 | | | $ | 9.730 | | | $ | 9.980 | | | $ | 9.960 | | | $ | 9.520 | | | $ | 9.510 | | |
| Income (loss) from operations | | | | | | | | | | | | | | | | | | | | | | | | | |
| Net investment income | | $ | 0.233 | | | $ | 0.483 | | | $ | 0.490 | | | $ | 0.486 | | | $ | 0.495 | | | $ | 0.489 | | |
| Net realized and unrealized gain (loss) | | | 0.023 | | | | 0.150 | | | | (0.251 | ) | | | 0.023 | | | | 0.439 | | | | 0.020 | | |
| Total income from operations | | $ | 0.256 | | | $ | 0.633 | | | $ | 0.239 | | | $ | 0.509 | | | $ | 0.934 | | | $ | 0.509 | | |
| Less distributions | | | | | | | | | | | | | | | | | | | | | | | | | |
| From net investment income | | $ | (0.236 | ) | | $ | (0.483 | ) | | $ | (0.489 | ) | | $ | (0.489 | ) | | $ | (0.494 | ) | | $ | (0.499 | ) | |
| Total distributions | | $ | (0.236 | ) | | $ | (0.483 | ) | | $ | (0.489 | ) | | $ | (0.489 | ) | | $ | (0.494 | ) | | $ | (0.499 | ) | |
| Net asset value - End of period | | $ | 9.900 | | | $ | 9.880 | | | $ | 9.730 | | | $ | 9.980 | | | $ | 9.960 | | | $ | 9.520 | | |
| Total Return(3) | | | 2.62 | % | | | 6.58 | % | | | 2.42 | % | | | 5.31 | % | | | 10.08 | % | | | 5.62 | % | |
| Ratios/Supplemental Data | | | | | | | | | | | | | | | | | | | | | | | | | |
| Net assets, end of period (000's omitted) | | $ | 32,095 | | | $ | 33,215 | | | $ | 9,480 | | | $ | 7,383 | | | $ | 5,162 | | | $ | 4,757 | | |
| Ratios (As a percentage of average daily net assets): | | | | | | | | | | | | | | | | | | | | | | | | | |
| Expenses(4) | | | 0.76 | %(5) | | | 0.72 | % | | | 0.73 | % | | | 0.81 | % | | | 0.77 | % | | | 0.84 | % | |
| Expenses after custodian fee reduction(4) | | | 0.76 | %(5) | | | 0.72 | % | | | 0.71 | % | | | 0.80 | % | | | 0.75 | % | | | 0.83 | % | |
| Net investment income | | | 4.75 | %(5) | | | 4.86 | % | | | 4.90 | % | | | 4.95 | % | | | 5.11 | % | | | 5.25 | % | |
| Portfolio Turnover of the Portfolio(6) | | | 0 | % | | | 15 | % | | | 25 | % | | | 23 | % | | | 9 | % | | | 14 | % | |
| Portfolio Turnover of the Fund | | | 5 | % | | | - | | | | - | | | | - | | | | - | | | | - | | |
(1) Net investment income per share was computed using average shares outstanding.
(2) The Fund, through its investment in the Portfolio, has adopted the provisions of the revised AICPA Audit and Accounting Guide for Investment Companies and began using the interest method to amortize premiums on fixed-income securities. The effect of this change for the year ended August 31, 2002 was to increase net investment income per share by $0.001, decrease net realized and unrealized gain per share by $0.001 and increase the ratio of net investment income to average net assets from 4.94% to 4.95%. Per-share data and ratios for the p eriods prior to September 1, 2001 have not been restated to reflect this change in presentation.
(3) Returns are historical and are calculated by determining the percentage change in net asset value with all distributions reinvested. Total return is not computed on an annualized basis.
(4) Includes the Fund's share of its corresponding Portfolio's allocated expenses while the Fund was making investments directly into the Portfolio.
(5) Annualized.
(6) Portfolio turnover represents the rate of portfolio activity for the period while the Fund was making investments directly into the Portfolio.
See notes to financial statements
78
Eaton Vance Municipals Funds as of February 28, 2005
FINANCIAL STATEMENTS CONT'D
Financial Highlights
| | | Arkansas Fund - Class B | |
| | | Six Months Ended
February 28, 2005 | | Year Ended August 31, | |
| | | (Unaudited)(1) | | 2004(1) | | 2003 | | 2002(1)(2) | | 2001 | | 2000(1) | |
| Net asset value - Beginning of period | | $ | 10.610 | | | $ | 10.460 | | | $ | 10.720 | | | $ | 10.690 | | | $ | 10.210 | | | $ | 10.190 | | |
| Income (loss) from operations | | | | | | | | | | | | | | | | | | | | | | | | | |
| Net investment income | | $ | 0.211 | | | $ | 0.443 | | | $ | 0.444 | | | $ | 0.447 | | | $ | 0.453 | | | $ | 0.454 | | |
| Net realized and unrealized gain (loss) | | | 0.032 | | | | 0.145 | | | | (0.259 | ) | | | 0.028 | | | | 0.472 | | | | 0.011 | | |
| Total income from operations | | $ | 0.243 | | | $ | 0.588 | | | $ | 0.185 | | | $ | 0.475 | | | $ | 0.925 | | | $ | 0.465 | | |
| Less distributions | | | | | | | | | | | | | | | | | | | | | | | | | |
| From net investment income | | $ | (0.213 | ) | | $ | (0.438 | ) | | $ | (0.445 | ) | | $ | (0.445 | ) | | $ | (0.445 | ) | | $ | (0.445 | ) | |
| Total distributions | | $ | (0.213 | ) | | $ | (0.438 | ) | | $ | (0.445 | ) | | $ | (0.445 | ) | | $ | (0.445 | ) | | $ | (0.445 | ) | |
| Net asset value - End of period | | $ | 10.640 | | | $ | 10.610 | | | $ | 10.460 | | | $ | 10.720 | | | $ | 10.690 | | | $ | 10.210 | | |
| Total Return(3) | | | 2.48 | %(7) | | | 5.68 | % | | | 1.72 | % | | | 4.60 | % | | | 9.27 | % | | | 4.75 | % | |
| Ratios/Supplemental Data | | | | | | | | | | | | | | | | | | | | | | | | | |
| Net assets, end of period (000's omitted) | | $ | 9,907 | | | $ | 10,354 | | | $ | 33,975 | | | $ | 35,711 | | | $ | 37,059 | | | $ | 37,340 | | |
| Ratios (As a percentage of average daily net assets): | | | | | | | | | | | | | | | | | | | | | | | | | |
| Expenses(4) | | | 1.51 | %(5) | | | 1.47 | % | | | 1.48 | % | | | 1.56 | % | | | 1.52 | % | | | 1.58 | % | |
| Expenses after custodian fee reduction(4) | | | 1.51 | %(5) | | | 1.47 | % | | | 1.46 | % | | | 1.55 | % | | | 1.50 | % | | | 1.57 | % | |
| Net investment income | | | 4.00 | %(5) | | | 4.13 | % | | | 4.17 | % | | | 4.24 | % | | | 4.36 | % | | | 4.56 | % | |
| Portfolio Turnover of the Portfolio(6) | | | 0 | % | | | 15 | % | | | 25 | % | | | 23 | % | | | 9 | % | | | 14 | % | |
| Portfolio Turnover of the Fund | | | 5 | % | | | - | | | | - | | | | - | | | | - | | | | - | | |
(1) Net investment income per share was computed using average shares outstanding.
(2) The Fund, through its investment in the Portfolio, has adopted the provisions of the revised AICPA Audit and Accounting Guide for Investment Companies and began using the interest method to amortize premiums on fixed-income securities. The effect of this change for the year ended August 31, 2002 was to increase net investment income per share by $0.001, decrease net realized and unrealized gain per share by $0.001 and increase the ratio of net investment income to average net assets from 4.23% to 4.24%. Per-share data and ratios for the p eriods prior to September 1, 2001 have not been restated to reflect this change in presentation.
(3) Returns are historical and are calculated by determining the percentage change in net asset value with all distributions reinvested. Total return is not computed on an annualized basis.
(4) Includes the Fund's share of its corresponding Portfolio's allocated expenses while the Fund was making investments directly into the Portfolio.
(5) Annualized.
(6) Portfolio turnover represents the rate of portfolio activity for the period while the Fund was making investments directly inot the Portfolio.
(7) Total return reflects an increase of 0.15% due to a change in the timing of the payment and reinvestment of distributions.
See notes to financial statements
79
Eaton Vance Municipals Funds as of February 28, 2005
FINANCIAL STATEMENTS CONT'D
Financial Highlights
| | | Georgia Fund - Class A | |
| | | Six Months Ended
February 28, 2005 | | Year Ended August 31, | |
| | | (Unaudited)(1) | | 2004(1) | | 2003(1) | | 2002(1)(2) | | 2001(1) | | 2000 | |
| Net asset value - Beginning of period | | $ | 9.480 | | | $ | 9.260 | | | $ | 9.410 | | | $ | 9.480 | | | $ | 9.020 | | | $ | 8.990 | | |
| Income (loss) from operations | | | | | | | | | | | | | | | | | | | | | | | | | |
| Net investment income | | $ | 0.233 | | | $ | 0.473 | | | $ | 0.478 | | | $ | 0.485 | | | $ | 0.470 | | | $ | 0.479 | | |
| Net realized and unrealized gain (loss) | | | 0.016 | | | | 0.213 | | | | (0.162 | ) | | | (0.089 | ) | | | 0.463 | | | | 0.031 | | |
| Total income from operations | | $ | 0.249 | | | $ | 0.686 | | | $ | 0.316 | | | $ | 0.396 | | | $ | 0.933 | | | $ | 0.510 | | |
| Less distributions | | | | | | | | | | | | | | | | | | | | | | | | | |
| From net investment income | | $ | (0.229 | ) | | $ | (0.466 | ) | | $ | (0.466 | ) | | $ | (0.466 | ) | | $ | (0.473 | ) | | $ | (0.480 | ) | |
| Total distributions | | $ | (0.229 | ) | | $ | (0.466 | ) | | $ | (0.466 | ) | | $ | (0.466 | ) | | $ | (0.473 | ) | | $ | (0.480 | ) | |
| Net asset value - End of period | | $ | 9.500 | | | $ | 9.480 | | | $ | 9.260 | | | $ | 9.410 | | | $ | 9.480 | | | $ | 9.020 | | |
| Total Return(3) | | | 2.65 | % | | | 7.52 | % | | | 3.39 | % | | | 4.38 | % | | | 10.65 | % | | | 6.00 | % | |
| Ratios/Supplemental Data | | | | | | | | | | | | | | | | | | | | | | | | | |
| Net assets, end of period (000's omitted) | | $ | 39,646 | | | $ | 38,229 | | | $ | 4,234 | | | $ | 3,425 | | | $ | 8,441 | | | $ | 7,614 | | |
| Ratios (As a percentage of average daily net assets): | | | | | | | | | | | | | | | | | | | | | | | | | |
| Expenses(4) | | | 0.80 | %(5) | | | 0.78 | % | | | 0.77 | % | | | 0.85 | % | | | 0.80 | % | | | 0.79 | % | |
| Expenses after custodian fee reduction(4) | | | 0.78 | %(5) | | | 0.78 | % | | | 0.75 | % | | | 0.84 | % | | | 0.77 | % | | | 0.77 | % | |
| Net investment income | | | 4.95 | %(5) | | | 5.02 | % | | | 5.07 | % | | | 5.24 | % | | | 5.12 | % | | | 5.29 | % | |
| Portfolio Turnover of the Portfolio(6) | | | 2 | % | | | 3 | % | | | 16 | % | | | 18 | % | | | 8 | % | | | 13 | % | |
| Portfolio Turnover of the Fund | | | 4 | % | | �� | - | | | | - | | | | - | | | | - | | | | - | | |
(1) Net investment income per share was computed using average shares outstanding.
(2) The Fund, through its investment in the Portfolio, has adopted the provisions of the revised AICPA Audit and Accounting Guide for Investment Companies and began using the interest method to amortize premiums on fixed-income securities. The effect of this change for the year ended August 31, 2002 was to increase net investment income per share by $0.001, increase net realized and unrealized loss per share by $0.001 and increase the ratio of net investment income to average net assets from 5.23% to 5.24%. Per-share data and ratios for the p eriods prior to September 1, 2001 have not been restated to reflect this change in presentation.
(3) Returns are historical and are calculated by determining the percentage change in net asset value with all distributions reinvested. Total return is not computed on an annualized basis.
(4) Includes the Fund's share of its corresponding Portfolio's allocated expenses while the Fund was making investments directly into the Portfolio.
(5) Annualized.
(6) Portfolio turnover represents the rate of portfolio activity for the period while the Fund was making investments directly into the Portfolio.
See notes to financial statements
80
Eaton Vance Municipals Funds as of February 28, 2005
FINANCIAL STATEMENTS CONT'D
Financial Highlights
| | | Georgia Fund - Class B | |
| | | Six Months Ended
February 28, 2005 | | Year Ended August 31, | |
| | | (Unaudited)(1) | | 2004(1) | | 2003(1) | | 2002(1)(2) | | 2001(1) | | 2000 | |
| Net asset value - Beginning of period | | $ | 10.130 | | | $ | 9.900 | | | $ | 10.050 | | | $ | 10.120 | | | $ | 9.630 | | | $ | 9.600 | | |
| Income (loss) from operations | | | | | | | | | | | | | | | | | | | | | | | | | |
| Net investment income | | $ | 0.212 | | | $ | 0.435 | | | $ | 0.437 | | | $ | 0.439 | | | $ | 0.429 | | | $ | 0.426 | | |
| Net realized and unrealized gain (loss) | | | 0.006 | | | | 0.218 | | | | (0.164 | ) | | | (0.086 | ) | | | 0.493 | | | | 0.039 | | |
| Total income from operations | | $ | 0.218 | | | $ | 0.653 | | | $ | 0.273 | | | $ | 0.353 | | | $ | 0.922 | | | $ | 0.465 | | |
| Less distributions | | | | | | | | | | | | | | | | | | | | | | | | | |
| From net investment income | | $ | (0.208 | ) | | $ | (0.423 | ) | | $ | (0.423 | ) | | $ | (0.423 | ) | | $ | (0.432 | ) | | $ | (0.435 | ) | |
| Total distributions | | $ | (0.208 | ) | | $ | (0.423 | ) | | $ | (0.423 | ) | | $ | (0.423 | ) | | $ | (0.432 | ) | | $ | (0.435 | ) | |
| Net asset value - End of period | | $ | 10.140 | | | $ | 10.130 | | | $ | 9.900 | | | $ | 10.050 | | | $ | 10.120 | | | $ | 9.630 | | |
| Total Return(3) | | | 2.34 | %(4) | | | 6.69 | % | | | 2.72 | % | | | 3.64 | % | | | 9.82 | % | | | 5.09 | % | |
| Ratios/Supplemental Data | | | | | | | | | | | | | | | | | | | | | | | | | |
| Net assets, end of period (000's omitted) | | $ | 15,915 | | | $ | 15,860 | | | $ | 49,773 | | | $ | 52,400 | | | $ | 55,051 | | | $ | 55,245 | | |
| Ratios (As a percentage of average daily net assets): | | | | | | | | | | | | | | | | | | | | | | | | | |
| Expenses(5) | | | 1.55 | %(6) | | | 1.53 | % | | | 1.52 | % | | | 1.60 | % | | | 1.56 | % | | | 1.58 | % | |
| Expenses after custodian fee reduction(5) | | | 1.53 | %(6) | | | 1.53 | % | | | 1.50 | % | | | 1.59 | % | | | 1.53 | % | | | 1.56 | % | |
| Net investment income | | | 4.20 | %(6) | | | 4.27 | % | | | 4.34 | % | | | 4.43 | % | | | 4.38 | % | | | 4.64 | % | |
| Portfolio Turnover of the Portfolio(7) | | | 2 | % | | | 3 | % | | | 16 | % | | | 18 | % | | | 8 | % | | | 13 | % | |
| Portfolio Turnover of the Fund | | | 4 | % | | | - | | | | - | | | | - | | | | - | | | | - | | |
(1) Net investment income per share was computed using average shares outstanding.
(2) The Fund, through its investment in the Portfolio, has adopted the provisions of the revised AICPA Audit and Accounting Guide for Investment Companies and began using the interest method to amortize premiums on fixed-income securities. The effect of this change for the year ended August 31, 2002 was to increase net investment income per share by $0.001, increase net realized and unrealized loss per share by $0.001 and increase the ratio of net investment income to average net assets from 4.42% to 4.43%. Per-share data and ratios for the p eriods prior to September 1, 2001 have not been restated to reflect this change in presentation.
(3) Returns are historical and are calculated by determining the percentage change in net asset value with all distributions reinvested. Total return is not computed on an annualized basis.
(4) Total return reflects an increase of 0.15% due to a change in the timing of the payment and reinvestment of distributions.
(5) Includes the Fund's share of its corresponding Portfolio's allocated expenses while the Fund was making investments directly into the Portfolio.
(6) Annualized.
(7) Portfolio turnover represents the rate of portfolio activity for the period while the Fund was making investments directly into the Portfolio.
See notes to financial statements
81
Eaton Vance Municipals Funds as of February 28, 2005
FINANCIAL STATEMENTS CONT'D
Financial Highlights
| | | Kentucky Fund - Class A | |
| | | Six Months Ended
February 28, 2005 | | Year Ended August 31, | |
| | | (Unaudited)(1) | | 2004(1) | | 2003(1) | | 2002(1)(2) | | 2001(1) | | 2000 | |
| Net asset value - Beginning of period | | $ | 9.320 | | | $ | 9.240 | | | $ | 9.420 | | | $ | 9.500 | | | $ | 9.160 | | | $ | 9.410 | | |
| Income (loss) from operations | | | | | | | | | | | | | | | | | | | | | | | | | |
| Net investment income | | $ | 0.214 | | | $ | 0.442 | | | $ | 0.446 | | | $ | 0.463 | | | $ | 0.446 | | | $ | 0.498 | | |
| Net realized and unrealized gain (loss) | | | (0.019 | ) | | | 0.077 | | | | (0.174 | ) | | | (0.091 | ) | | | 0.378 | | | | (0.246 | ) | |
| Total income from operations | | $ | 0.195 | | | $ | 0.519 | | | $ | 0.272 | | | $ | 0.372 | | | $ | 0.824 | | | $ | 0.252 | | |
| Less distributions | | | | | | | | | | | | | | | | | | | | | | | | | |
| From net investment income | | $ | (0.215 | ) | | $ | (0.439 | ) | | $ | (0.452 | ) | | $ | (0.452 | ) | | $ | (0.484 | ) | | $ | (0.502 | ) | |
| Total distributions | | $ | (0.215 | ) | | $ | (0.439 | ) | | $ | (0.452 | ) | | $ | (0.452 | ) | | $ | (0.484 | ) | | $ | (0.502 | ) | |
| Net asset value - End of period | | $ | 9.300 | | | $ | 9.320 | | | $ | 9.240 | | | $ | 9.420 | | | $ | 9.500 | | | $ | 9.160 | | |
| Total Return(3) | | | 2.11 | % | | | 5.70 | % | | | 2.90 | % | | | 4.09 | % | | | 9.26 | % | | | 2.87 | % | |
| Ratios/Supplemental Data | | | | | | | | | | | | | | | | | | | | | | | | | |
| Net assets, end of period (000's omitted) | | $ | 48,749 | | | $ | 47,288 | | | $ | 4,248 | | | $ | 3,103 | | | $ | 7,645 | | | $ | 5,858 | | |
| Ratios (As a percentage of average daily net assets): | | | | | | | | | | | | | | | | | | | | | | | | | |
| Expenses(4) | | | 0.78 | %(5) | | | 0.78 | % | | | 0.77 | % | | | 0.80 | % | | | 0.85 | % | | | 0.82 | % | |
| Expenses after custodian fee reduction(4) | | | 0.77 | %(5) | | | 0.77 | % | | | 0.75 | % | | | 0.79 | % | | | 0.81 | % | | | 0.80 | % | |
| Net investment income | | | 4.64 | %(5) | | | 4.77 | % | | | 4.73 | % | | | 4.97 | % | | | 4.79 | % | | | 5.40 | % | |
| Portfolio Turnover of the Portfolio(6) | | | 0 | % | | | 3 | % | | | 10 | % | | | 5 | % | | | 15 | % | | | 11 | % | |
| Portfolio Turnover of the Fund | | | 8 | % | | | - | | | | - | | | | - | | | | - | | | | - | | |
(1) Net investment income per share was computed using average shares outstanding.
(2) The Fund, through its investment in the Portfolio, has adopted the provisions of the revised AICPA Audit and Accounting Guide for Investment Companies and began using the interest method to amortize premiums on fixed-income securities. The effect of this change for the year ended August 31, 2002 was to increase net investment income per share by $0.002, increase net realized and unrealized loss per share by $0.002 and increase the ratio of net investment income to average net assets from 4.95% to 4.97%. Per-share data and ratios for the p eriods prior to September 1, 2001 have not been restated to reflect this change in presentation.
(3) Returns are historical and are calculated by determining the percentage change in net asset value with all distributions reinvested. Total return is not computed on an annualized basis.
(4) Includes the Fund's share of its corresponding Portfolio's allocated expenses while the Fund was making investments directly into the Portfolio.
(5) Annualized.
(6) Portfolio turnover represents the rate of portfolio activity for the period while the Fund was making investments directly into the Portfolio.
See notes to financial statements
82
Eaton Vance Municipals Funds as of February 28, 2005
FINANCIAL STATEMENTS CONT'D
Financial Highlights
| | | Kentucky Fund - Class B | |
| | | Six Months Ended
February 28, 2005 | | Year Ended August 31, | |
| | | (Unaudited)(1) | | 2004(1) | | 2003(1) | | 2002(1)(2) | | 2001(1) | | 2000 | |
| Net asset value - Beginning of period | | $ | 10.060 | | | $ | 9.970 | | | $ | 10.160 | | | $ | 10.250 | | | $ | 9.870 | | | $ | 10.120 | | |
| Income (loss) from operations | | | |
| Net investment income | | $ | 0.194 | | | $ | 0.406 | | | $ | 0.408 | | | $ | 0.418 | | | $ | 0.406 | | | $ | 0.451 | | |
| Net realized and unrealized gain (loss) | | | (0.020 | ) | | | 0.081 | | | | (0.188 | ) | | | (0.098 | ) | | | 0.416 | | | | (0.241 | ) | |
| Total income from operations | | $ | 0.174 | | | $ | 0.487 | | | $ | 0.220 | | | $ | 0.320 | | | $ | 0.822 | | | $ | 0.210 | | |
| Less distributions | | | |
| From net investment income | | $ | (0.194 | ) | | $ | (0.397 | ) | | $ | (0.410 | ) | | $ | (0.410 | ) | | $ | (0.442 | ) | | $ | (0.460 | ) | |
| Total distributions | | $ | (0.194 | ) | | $ | (0.397 | ) | | $ | (0.410 | ) | | $ | (0.410 | ) | | $ | (0.442 | ) | | $ | (0.460 | ) | |
| Net asset value - End of period | | $ | 10.040 | | | $ | 10.060 | | | $ | 9.970 | | | $ | 10.160 | | | $ | 10.250 | | | $ | 9.870 | | |
| Total Return(3) | | | 1.91 | %(4) | | | 4.96 | % | | | 2.15 | % | | | 3.26 | % | | | 8.56 | % | | | 2.21 | % | |
| Ratios/Supplemental Data | | | |
| Net assets, end of period (000's omitted) | | $ | 14,385 | | | $ | 16,433 | | | $ | 63,232 | | | $ | 66,312 | | | $ | 72,000 | | | $ | 75,590 | | |
| Ratios (As a percentage of average daily net assets): | | | | | | | | | | | | | | | | | | | | | | | | | |
| Expenses(5) | | | 1.53 | %(6) | | | 1.53 | % | | | 1.52 | % | | | 1.55 | % | | | 1.59 | % | | | 1.62 | % | |
| Expenses after custodian fee reduction(5) | | | 1.52 | %(6) | | | 1.52 | % | | | 1.50 | % | | | 1.54 | % | | | 1.55 | % | | | 1.60 | % | |
| Net investment income | | | 3.89 | %(6) | | | 4.00 | % | | | 4.01 | % | | | 4.17 | % | | | 4.08 | % | | | 4.67 | % | |
| Portfolio Turnover of the Portfolio(7) | | | 0 | % | | | 3 | % | | | 10 | % | | | 5 | % | | | 15 | % | | | 11 | % | |
| Portfolio Turnover of the Fund | | | 8 | % | | | - | | | | - | | | | - | | | | - | | | | - | | |
(1) Net investment income per share was computed using average shares outstanding.
(2) The Fund, through its investment in the Portfolio, has adopted the provisions of the revised AICPA Audit and Accounting Guide for Investment Companies and began using the interest method to amortize premiums on fixed-income securities. The effect of this change for the year ended August 31, 2002 was to increase net investment income per share by $0.002, increase net realized and unrealized loss per share by $0.002 and increase the ratio of net investment income to average net assets from 4.15% to 4.17%. Per-share data and ratios for the p eriods prior to September 1, 2001 have not been restated to reflect this change in presentation.
(3) Returns are historical and are calculated by determining the percentage change in net asset value with all distributions reinvested. Total return is not computed on an annualized basis.
(4) Total return reflects an increase of 0.15% due to a change in the timing of the payment and reinvestment of distributions.
(5) Includes the Fund's share of its corresponding Portfolio's allocated expenses while the Fund was making investments directly into the Portfolio.
(6) Annualized.
(7) Portfolio turnover represents the rate of portfolio activity for the period while the Fund was making investments directly into the Portfolio.
See notes to financial statements
83
Eaton Vance Municipals Funds as of February 28, 2005
FINANCIAL STATEMENTS CONT'D
Financial Highlights
| | | Louisiana Fund - Class A | |
| | | Six Months Ended
February 28, 2005 | | Year Ended August 31, | |
| | | (Unaudited)(1) | | 2004(1) | | 2003 | | 2002(1)(2) | | 2001(1) | | 2000(1) | |
| Net asset value - Beginning of period | | $ | 9.840 | | | $ | 9.610 | | | $ | 9.790 | | | $ | 9.810 | | | $ | 9.240 | | | $ | 9.240 | | |
| Income (loss) from operations | | | |
| Net investment income | | $ | 0.234 | | | $ | 0.485 | | | $ | 0.490 | | | $ | 0.486 | | | $ | 0.463 | | | $ | 0.472 | | |
| Net realized and unrealized gain (loss) | | | 0.129 | | | | 0.217 | | | | (0.208 | ) | | | (0.047 | ) | | | 0.573 | | | | 0.001 | | |
| Total income from operations | | $ | 0.363 | | | $ | 0.702 | | | $ | 0.282 | | | $ | 0.439 | | | $ | 1.036 | | | $ | 0.473 | | |
| Less distributions | | | |
| From net investment income | | $ | (0.233 | ) | | $ | (0.472 | ) | | $ | (0.462 | ) | | $ | (0.459 | ) | | $ | (0.466 | ) | | $ | (0.473 | ) | |
| Total distributions | | $ | (0.233 | ) | | $ | (0.472 | ) | | $ | (0.462 | ) | | $ | (0.459 | ) | | $ | (0.466 | ) | | $ | (0.473 | ) | |
| Net asset value - End of period | | $ | 9.970 | | | $ | 9.840 | | | $ | 9.610 | | | $ | 9.790 | | | $ | 9.810 | | | $ | 9.240 | | |
| Total Return(3) | | | 3.72 | % | | | 7.44 | % | | | 2.89 | % | | | 4.66 | % | | | 11.51 | % | | | 5.43 | % | |
| Ratios/Supplemental Data | | | |
| Net assets, end of period (000's omitted) | | $ | 19,378 | | | $ | 17,793 | | | $ | 6,027 | | | $ | 5,885 | | | $ | 5,555 | | | $ | 4,566 | | |
| Ratios (As a percentage of average daily net assets): | | | | | | | | | | | | | | | | | | | | | | | | | |
| Expenses(4) | | | 0.76 | %(5) | | | 0.76 | % | | | 0.74 | % | | | 0.80 | % | | | 0.83 | % | | | 0.73 | % | |
| Expenses after custodian fee reduction(4) | | | 0.75 | %(5) | | | 0.75 | % | | | 0.72 | % | | | 0.78 | % | | | 0.80 | % | | | 0.69 | % | |
| Net investment income | | | 4.75 | %(5) | | | 4.98 | % | | | 5.00 | % | | | 5.05 | % | | | 4.88 | % | | | 5.28 | % | |
| Portfolio Turnover of the Portfolio(6) | | | 0 | % | | | 9 | % | | | 21 | % | | | 25 | % | | | 14 | % | | | 14 | % | |
| Portfolio Turnover of the Fund | | | 9 | % | | | - | | | | - | | | | - | | | | - | | | | - | | |
(1) Net investment income per share was computed using average shares outstanding.
(2) The Fund, through its investment in the Portfolio, has adopted the provisions of the revised AICPA Audit and Accounting Guide for Investment Companies and began using the interest method to amortize premiums on fixed-income securities. The effect of this change for the year ended August 31, 2002 was to increase net investment income per share by $0.015, increase net realized and unrealized loss per share by $0.015 and increase the ratio of net investment income to average net assets from 4.90% to 5.05%. Per-share data and ratios for the p eriods prior to September 1, 2001 have not been restated to reflect this change in presentation.
(3) Returns are historical and are calculated by determining the percentage change in net asset value with all distributions reinvested. Total return is not computed on an annualized basis.
(4) Includes the Fund's share of its corresponding Portfolio's allocated expenses while the Fund was making investments directly into the Portfolio.
(5) Annualized.
(6) Portfolio turnover represents the rate of portfolio activity for the period while the Fund was making investments directly into the Portfolio.
See notes to financial statements
84
Eaton Vance Municipals Funds as of February 28, 2005
FINANCIAL STATEMENTS CONT'D
Financial Highlights
| | | Louisiana Fund - Class B | |
| | | Six Months Ended
February 28, 2005 | | Year Ended August 31, | |
| | | (Unaudited)(1) | | 2004(1) | | 2003 | | 2002(1)(2) | | 2001(1) | | 2000(1) | |
| Net asset value - Beginning of period | | $ | 10.400 | | | $ | 10.150 | | | $ | 10.350 | | | $ | 10.380 | | | $ | 9.770 | | | $ | 9.760 | | |
| Income (loss) from operations | | | | | | | | | | | | | | | | | | | | | | | | | |
| Net investment income | | $ | 0.208 | | | $ | 0.438 | | | $ | 0.441 | | | $ | 0.438 | | | $ | 0.414 | | | $ | 0.424 | | |
| Net realized and unrealized gain (loss) | | | 0.140 | | | | 0.233 | | | | (0.227 | ) | | | (0.056 | ) | | | 0.615 | | | | 0.008 | | |
| Total income from operations | | $ | 0.348 | | | $ | 0.671 | | | $ | 0.214 | | | $ | 0.382 | | | $ | 1.029 | | | $ | 0.432 | | |
| Less distributions | | | | | | | | | | | | | | | | | | | | | | | | | |
| From net investment income | | $ | (0.208 | ) | | $ | (0.421 | ) | | $ | (0.414 | ) | | $ | (0.412 | ) | | $ | (0.419 | ) | | $ | (0.422 | ) | |
| Total distributions | | $ | (0.208 | ) | | $ | (0.421 | ) | | $ | (0.414 | ) | | $ | (0.412 | ) | | $ | (0.419 | ) | | $ | (0.422 | ) | |
| Net asset value - End of period | | $ | 10.540 | | | $ | 10.400 | | | $ | 10.150 | | | $ | 10.350 | | | $ | 10.380 | | | $ | 9.770 | | |
| Total Return(3) | | | 3.54 | %(4) | | | 6.72 | % | | | 2.05 | % | | | 3.82 | % | | | 10.78 | % | | | 4.66 | % | |
| Ratios/Supplemental Data | | | | | | | | | | | | | | | | | | | | | | | | | |
| Net assets, end of period (000's omitted) | | $ | 9,116 | | | $ | 9,444 | | | $ | 22,312 | | | $ | 23,393 | | | $ | 23,584 | | | $ | 23,779 | | |
| Ratios (As a percentage of average daily net assets): | | | | | | | | | | | | | | | | | | | | | | | | | |
| Expenses(5) | | | 1.51 | %(6) | | | 1.51 | % | | | 1.49 | % | | | 1.55 | % | | | 1.59 | % | | | 1.55 | % | |
| Expenses after custodian fee reduction(5) | | | 1.50 | %(6) | | | 1.50 | % | | | 1.47 | % | | | 1.53 | % | | | 1.56 | % | | | 1.51 | % | |
| Net investment income | | | 4.02 | %(6) | | | 4.23 | % | | | 4.25 | % | | | 4.30 | % | | | 4.14 | % | | | 4.49 | % | |
| Portfolio Turnover of the Portfolio(7) | | | 0 | % | | | 9 | % | | | 21 | % | | | 25 | % | | | 14 | % | | | 14 | % | |
| Portfolio Turnover of the Fund | | | 9 | % | | | - | | | | - | | | | - | | | | - | | | | - | | |
(1) Net investment income per share was computed using average shares outstanding.
(2) The Fund, through its investment in the Portfolio, has adopted the provisions of the revised AICPA Audit and Accounting Guide for Investment Companies and began using the interest method to amortize premiums on fixed-income securities. The effect of this change for the year ended August 31, 2002 was to increase net investment income per share by $0.015, increase net realized and unrealized loss per share by $0.015 and increase the ratio of net investment income to average net assets from 4.15% to 4.30%. Per-share data and ratios for the p eriods prior to September 1, 2001 have not been restated to reflect this change in presentation.
(3) Returns are historical and are calculated by determining the percentage change in net asset value with all distributions reinvested. Total return is not computed on an annualized basis.
(4) Total return reflects an increase of 0.14% due to a change in the timing of the payment and reinvestment of distributions.
(5) Includes the Fund's share of its corresponding Portfolio's allocated expenses while the Fund was making investments directly into the Portfolio.
(6) Annualized.
(7) Portfolio turnover represents the rate of portfolio activity for the period while the Fund was making investments directly into the Portfolio.
See notes to financial statements
85
Eaton Vance Municipals Funds as of February 28, 2005
FINANCIAL STATEMENTS CONT'D
Financial Highlights
| | | Maryland Fund - Class A | |
| | | Six Months Ended
February 28, 2005 | | Year Ended August 31, | |
| | | (Unaudited)(1) | | 2004(1) | | 2003(1) | | 2002(1)(2) | | 2001 | | 2000(1) | |
| Net asset value - Beginning of period | | $ | 9.490 | | | $ | 9.500 | | | $ | 9.700 | | | $ | 9.700 | | | $ | 9.160 | | | $ | 9.230 | | |
| Income (loss) from operations | | | | | | | | | | | | | | | | | | | | | | | | | |
| Net investment income | | $ | 0.222 | | | $ | 0.459 | | | $ | 0.454 | | | $ | 0.452 | | | $ | 0.462 | | | $ | 0.445 | | |
| Net realized and unrealized gain (loss) | | | 0.078 | | | | 0.022 | | | | (0.203 | ) | | | (0.003 | )(3) | | | 0.511 | | | | (0.065 | ) | |
| Total income from operations | | $ | 0.300 | | | $ | 0.481 | | | $ | 0.251 | | | $ | 0.449 | | | $ | 0.973 | | | $ | 0.380 | | |
| Less distributions | | | | | | | | | | | | | | | | | | | | | | | | | |
| From net investment income | | $ | (0.220 | ) | | $ | (0.449 | ) | | $ | (0.449 | ) | | $ | (0.449 | ) | | $ | (0.433 | ) | | $ | (0.450 | ) | |
| From net realized gain | | | - | | | | (0.042 | ) | | | (0.002 | ) | | | - | | | | - | | | | - | | |
| Total distributions | | $ | (0.220 | ) | | $ | (0.491 | ) | | $ | (0.451 | ) | | $ | (0.449 | ) | | $ | (0.433 | ) | | $ | (0.450 | ) | |
| Net asset value - End of period | | $ | 9.570 | | | $ | 9.490 | | | $ | 9.500 | | | $ | 9.700 | | | $ | 9.700 | | | $ | 9.160 | | |
| Total Return(4) | | | 3.19 | % | | | 5.14 | % | | | 2.58 | % | | | 4.80 | % | | | 10.88 | % | | | 4.35 | % | |
| Ratios/Supplemental Data | | | | | | | | | | | | | | | | | | | | | | | | | |
| Net assets, end of period (000's omitted) | | $ | 46,227 | | | $ | 45,913 | | | $ | 8,085 | | | $ | 10,820 | | | $ | 6,331 | | | $ | 3,200 | | |
| Ratios (As a percentage of average daily net assets): | | | | | | | | | | | | | | | | | | | | | | | | | |
| Expenses(5) | | | 0.82 | %(6) | | | 0.79 | % | | | 0.78 | % | | | 0.85 | % | | | 0.83 | % | | | 0.73 | % | |
| Expenses after custodian fee reduction(5) | | | 0.81 | %(6) | | | 0.79 | % | | | 0.76 | % | | | 0.83 | % | | | 0.78 | % | | | 0.71 | % | |
| Net investment income | | | 4.70 | %(6) | | | 4.84 | % | | | 4.67 | % | | | 4.73 | % | | | 4.99 | % | | | 4.98 | % | |
| Portfolio Turnover of the Portfolio(7) | | | 0 | % | | | 12 | % | | | 28 | % | | | 25 | % | | | 18 | % | | | 9 | % | |
| Portfolio Turnover of the Fund | | | 4 | % | | | - | | | | - | | | | - | | | | - | | | | - | | |
(1) Net investment income per share was computed using average shares outstanding.
(2) The Fund, through its investment in the Portfolio, has adopted the provisions of the revised AICPA Audit and Accounting Guide for Investment Companies and began using the interest method to amortize premiums on fixed-income securities. The effect of this change for the year ended August 31, 2002 was to increase net investment income per share by less than $0.001, increase net realized and unrealized loss per share by less than $0.001 and increase the ratio of net investment income to average net assets by less than 0.01%. Per-share data a nd ratios for the periods prior to September 1, 2001 have not been restated to reflect this change in presentation.
(3) Per share amount is not in accord with the net realized and unrealized gain (loss) on investments for the period because of the timing of sales of Fund shares and the amount of the per share realized and unrealized gains and losses at such time.
(4) Returns are historical and are calculated by determining the percentage change in net asset value with all distributions reinvested. Total return is not computed on an annualized basis.
(5) Includes the Fund's share of its corresponding Portfolio's allocated expenses while the Fund was making investments directly into the Portfolio.
(6) Annualized.
(7) Portfolio turnover represents the rate of portfolio activity for the period while the Fund was making investments directly into the Portfolio.
See notes to financial statements
86
Eaton Vance Municipals Funds as of February 28, 2005
FINANCIAL STATEMENTS CONT'D
Financial Highlights
| | | Maryland Fund - Class B | |
| | | Six Months Ended
February 28, 2005 | | Year Ended August 31, | |
| | | (Unaudited)(1) | | 2004(1) | | 2003(1) | | 2002(1)(2) | | 2001 | | 2000(1) | |
| Net asset value - Beginning of period | | $ | 10.350 | | | $ | 10.360 | | | $ | 10.580 | | | $ | 10.580 | | | $ | 10.000 | | | $ | 10.080 | | |
| Income (loss) from operations | | | | | | | | | | | | | | | | | | | | | | | | | |
| Net investment income | | $ | 0.203 | | | $ | 0.426 | | | $ | 0.416 | | | $ | 0.419 | | | $ | 0.431 | | | $ | 0.401 | | |
| Net realized and unrealized gain (loss) | | | 0.088 | | | | 0.018 | | | | (0.222 | ) | | | (0.007 | )(3) | | | 0.546 | | | | (0.067 | ) | |
| Total income from operations | | $ | 0.291 | | | $ | 0.444 | | | $ | 0.194 | | | $ | 0.412 | | | $ | 0.977 | | | $ | 0.334 | | |
| Less distributions | | | | | | | | | | | | | | | | | | | | | | | | | |
| From net investment income | | $ | (0.201 | ) | | $ | (0.412 | ) | | $ | (0.412 | ) | | $ | (0.412 | ) | | $ | (0.397 | ) | | $ | (0.414 | ) | |
| From net realized gain | | | - | | | | (0.042 | ) | | | (0.002 | ) | | | - | | | | - | | | | - | | |
| Total distributions | | $ | (0.201 | ) | | $ | (0.454 | ) | | $ | (0.414 | ) | | $ | (0.412 | ) | | $ | (0.397 | ) | | $ | (0.414 | ) | |
| Net asset value - End of period | | $ | 10.440 | | | $ | 10.350 | | | $ | 10.360 | | | $ | 10.580 | | | $ | 10.580 | | | $ | 10.000 | | |
| Total Return(4) | | | 3.00 | %(5) | | | 4.34 | % | | | 1.80 | % | | | 4.02 | % | | | 9.98 | % | | | 3.50 | % | |
| Ratios/Supplemental Data | | | | | | | | | | | | | | | | | | | | | | | | | |
| Net assets, end of period (000's omitted) | | $ | 23,017 | | | $ | 25,455 | | | $ | 70,431 | | | $ | 74,435 | | | $ | 75,790 | | | $ | 78,272 | | |
| Ratios (As a percentage of average daily net assets): | | | | | | | | | | | | | | | | | | | | | | | | | |
| Expenses(6) | | | 1.57 | %(7) | | | 1.54 | % | | | 1.53 | % | | | 1.60 | % | | | 1.57 | % | | | 1.60 | % | |
| Expenses after custodian fee reduction(6) | | | 1.56 | %(7) | | | 1.54 | % | | | 1.51 | % | | | 1.58 | % | | | 1.52 | % | | | 1.58 | % | |
| Net investment income | | | 3.95 | %(7) | | | 4.05 | % | | | 3.92 | % | | | 4.02 | % | | | 4.21 | % | | | 4.11 | % | |
| Portfolio Turnover of the Portfolio(8) | | | 0 | % | | | 12 | % | | | 28 | % | | | 25 | % | | | 18 | % | | | 9 | % | |
| Portfolio Turnover of the Fund | | | 4 | % | | | - | | | | - | | | | - | | | | - | | | | - | | |
(1) Net investment income per share was computed using average shares outstanding.
(2) The Fund, through its investment in the Portfolio, has adopted the provisions of the revised AICPA Audit and Accounting Guide for Investment Companies and began using the interest method to amortize premiums on fixed-income securities. The effect of this change for the year ended August 31, 2002 was to increase net investment income per share by less than $0.001, increase net realized and unrealized loss per share by less than $0.001 and increase the ratio of net investment income to average net assets by less than 0.01%. Per-share data a nd ratios for the periods prior to September 1, 2001 have not been restated to reflect this change in presentation.
(3) Per share amount is not in accord with the net realized and unrealized gain (loss) on investments for the period because of the timing of sales of Fund shares and the amount of the per share realized and unrealized gains and losses at such time.
(4) Returns are historical and are calculated by determining the percentage change in net asset value with all distributions reinvested. Total return is not computed on an annualized basis.
(5) Total return reflects an increase of 0.15% due to a change in the timing of the payment and reinvestment of distributions.
(6) Includes the Fund's share of its corresponding Portfolio's allocated expenses while the Fund was making investments directly into the Portfolio.
(7) Annualized.
(8) Portfolio turnover represents the rate of portfolio activity for the period while the Fund was making investments directly into the Portfolio.
See notes to financial statements
87
Eaton Vance Municipals Funds as of February 28, 2005
FINANCIAL STATEMENTS CONT'D
Financial Highlights
| | | Missouri Fund - Class A | |
| | | Six Months Ended
February 28, 2005 | | Year Ended August 31, | |
| | | (Unaudited)(1) | | 2004(1) | | 2003(1) | | 2002(1)(2) | | 2001 | | 2000 | |
| Net asset value - Beginning of period | | $ | 10.080 | | | $ | 9.890 | | | $ | 10.090 | | | $ | 10.130 | | | $ | 9.550 | | | $ | 9.630 | | |
| Income (loss) from operations | | | | | | | | | | | | | | | | | | | | | | | | | |
| Net investment income | | $ | 0.236 | | | $ | 0.497 | | | $ | 0.510 | | | $ | 0.520 | | | $ | 0.520 | | | $ | 0.520 | | |
| Net realized and unrealized gain (loss) | | | 0.028 | | | | 0.232 | | | | (0.192 | ) | | | (0.043 | ) | | | 0.561 | | | | (0.103 | ) | |
| Total income from operations | | $ | 0.264 | | | $ | 0.729 | | | $ | 0.318 | | | $ | 0.477 | | | $ | 1.081 | | | $ | 0.417 | | |
| Less distributions | | | | | | | | | | | | | | | | | | | | | | | | | |
| From net investment income | | $ | (0.244 | ) | | $ | (0.539 | ) | | $ | (0.518 | ) | | $ | (0.517 | ) | | $ | (0.501 | ) | | $ | (0.497 | ) | |
| Total distributions | | $ | (0.244 | ) | | $ | (0.539 | ) | | $ | (0.518 | ) | | $ | (0.517 | ) | | $ | (0.501 | ) | | $ | (0.497 | ) | |
| Net asset value - End of period | | $ | 10.100 | | | $ | 10.080 | | | $ | 9.890 | | | $ | 10.090 | | | $ | 10.130 | | | $ | 9.550 | | |
| Total Return(3) | | | 2.65 | % | | | 7.53 | % | | | 3.18 | % | | | 4.92 | % | | | 11.65 | % | | | 4.60 | % | |
| Ratios/Supplemental Data | | | | | | | | | | | | | | | | | | | | | | | | | |
| Net assets, end of period (000's omitted) | | $ | 50,752 | | | $ | 44,385 | | | $ | 7,311 | | | $ | 6,301 | | | $ | 4,378 | | | $ | 4,132 | | |
| Ratios (As a percentage of average daily net assets): | | | | | | | | | | | | | | | | | | | | | | | | | |
| Expenses(4) | | | 0.79 | %(5) | | | 0.81 | % | | | 0.79 | % | | | 0.80 | % | | | 0.82 | % | | | 0.81 | % | |
| Expenses after custodian fee reduction(4) | | | 0.77 | %(5) | | | 0.80 | % | | | 0.77 | % | | | 0.79 | % | | | 0.80 | % | | | 0.80 | % | |
| Net investment income | | | 4.71 | %(5) | | | 4.99 | % | | | 5.06 | % | | | 5.24 | % | | | 5.34 | % | | | 5.54 | % | |
| Portfolio Turnover of the Portfolio(6) | | | 0 | % | | | 10 | % | | | 20 | % | | | 8 | % | | | 8 | % | | | 8 | % | |
| Portfolio Turnover of the Fund | | | 3 | % | | | - | | | | - | | | | - | | | | - | | | | - | | |
(1) Net investment income per share was computed using average shares outstanding.
(2) The Fund, through its investment in the Portfolio, has adopted the provisions of the revised AICPA Audit and Accounting Guide for Investment Companies and began using the interest method to amortize premiums on fixed-income securities. The effect of this change for the year ended August 31, 2002 was to increase net investment income per share by $0.001, increase net realized and unrealized loss per share by $0.001 and increase the ratio of net investment income to average net assets from 5.23% to 5.24%. Per-share data and ratios for the p eriods prior to September 1, 2001 have not been restated to reflect this change in presentation.
(3) Returns are historical and are calculated by determining the percentage change in net asset value with all distributions reinvested. Total return is not computed on an annualized basis.
(4) Includes the Fund's share of its corresponding Portfolio's allocated expenses while the Fund was making investments directly into the Portfolio.
(5) Annualized.
(6) Portfolio turnover represents the rate of portfolio activity for the period while the Fund was making investments directly into the Portfolio.
See notes to financial statements
88
Eaton Vance Municipals Funds as of February 28, 2005
FINANCIAL STATEMENTS CONT'D
Financial Highlights
| | | Missouri Fund - Class B | |
| | | Six Months Ended
February 28, 2005 | | Year Ended August 31, | |
| | | (Unaudited)(1) | | 2004(1) | | 2003(1) | | 2002(1)(2) | | 2001 | | 2000 | |
| Net asset value - Beginning of period | | $ | 11.140 | | | $ | 10.930 | | | $ | 11.140 | | | $ | 11.190 | | | $ | 10.550 | | | $ | 10.650 | | |
| Income (loss) from operations | | | |
| Net investment income | | $ | 0.220 | | | $ | 0.474 | | | $ | 0.482 | | | $ | 0.494 | | | $ | 0.493 | | | $ | 0.486 | | |
| Net realized and unrealized gain (loss) | | | 0.029 | | | | 0.244 | | | | (0.201 | ) | | | (0.053 | ) | | | 0.622 | | | | (0.121 | ) | |
| Total income from operations | | $ | 0.249 | | | $ | 0.718 | | | $ | 0.281 | | | $ | 0.441 | | | $ | 1.115 | | | $ | 0.365 | | |
| Less distributions | | | |
| From net investment income | | $ | (0.229 | ) | | $ | (0.508 | ) | | $ | (0.491 | ) | | $ | (0.491 | ) | | $ | (0.475 | ) | | $ | (0.465 | ) | |
| Total distributions | | $ | (0.229 | ) | | $ | (0.508 | ) | | $ | (0.491 | ) | | $ | (0.491 | ) | | $ | (0.475 | ) | | $ | (0.465 | ) | |
| Net asset value - End of period | | $ | 11.160 | | | $ | 11.140 | | | $ | 10.930 | | | $ | 11.140 | | | $ | 11.190 | | | $ | 10.550 | | |
| Total Return(3) | | | 2.43 | %(4) | | | 6.71 | % | | | 2.52 | % | | | 4.09 | % | | | 10.84 | % | | | 3.62 | % | |
| Ratios/Supplemental Data | | | |
| Net assets, end of period (000's omitted) | | $ | 12,804 | | | $ | 12,903 | | | $ | 49,870 | | | $ | 52,305 | | | $ | 53,027 | | | $ | 54,531 | | |
| Ratios (As a percentage of average daily net assets): | | | | | | | | | | | | | | | | | | | | | | | | | |
| Expenses(5) | | | 1.54 | %(6) | | | 1.56 | % | | | 1.54 | % | | | 1.55 | % | | | 1.57 | % | | | 1.62 | % | |
| Expenses after custodian fee reduction(5) | | | 1.52 | %(6) | | | 1.55 | % | | | 1.52 | % | | | 1.54 | % | | | 1.55 | % | | | 1.61 | % | |
| Net investment income | | | 3.98 | %(6) | | | 4.26 | % | | | 4.32 | % | | | 4.50 | % | | | 4.54 | % | | | 4.69 | % | |
| Portfolio Turnover of the Portfolio(7) | | | 0 | % | | | 10 | % | | | 20 | % | | | 8 | % | | | 8 | % | | | 8 | % | |
| Portfolio Turnover of the Fund | | | 3 | % | | | - | | | | - | | | | - | | | | - | | | | - | | |
(1) Net investment income per share was computed using average shares outstanding.
(2) The Fund, through its investment in the Portfolio, has adopted the provisions of the revised AICPA Audit and Accounting Guide for Investment Companies and began using the interest method to amortize premiums on fixed-income securities. The effect of this change for the year ended August 31, 2002 was to increase net investment income per share by $0.001, increase net realized and unrealized loss per share by $0.001 and increase the ratio of net investment income to average net assets from 4.49% to 4.50%. Per-share data and ratios for the p eriods prior to September 1, 2001 have not been restated to reflect this change in presentation.
(3) Returns are historical and are calculated by determining the percentage change in net asset value with all distributions reinvested. Total return is not computed on an annualized basis.
(4) Total return reflects an increase of 0.14% due to a change in the timing of the payment and reinvestment of distributions.
(5) Includes the Fund's share of its corresponding Portfolio's allocated expenses while the Fund was making investments directly into the Portfolio.
(6) Annualized.
(7) Portfolio turnover represents the rate of portfolio activity for the period while the Fund was making investments directly into the Portfolio.
See notes to financial statements
89
Eaton Vance Municipals Funds as of February 28, 2005
FINANCIAL STATEMENTS CONT'D
Financial Highlights
| | | North Carolina Fund - Class A | |
| | | Six Months Ended
February 28, 2005 | | Year Ended August 31, | |
| | | (Unaudited)(1) | | 2004(1) | | 2003(1) | | 2002(1)(2) | | 2001(1) | | 2000(1) | |
| Net asset value - Beginning of period | | $ | 9.390 | | | $ | 9.320 | | | $ | 9.600 | | | $ | 9.670 | | | $ | 9.260 | | | $ | 9.260 | | |
| Income (loss) from operations | | | |
| Net investment income | | $ | 0.210 | | | $ | 0.436 | | | $ | 0.447 | | | $ | 0.467 | | | $ | 0.477 | | | $ | 0.481 | | |
| Net realized and unrealized gain (loss) | | | 0.012 | | | | 0.071 | | | | (0.275 | ) | | | (0.085 | ) | | | 0.403 | | | | 0.003 | | |
| Total income from operations | | $ | 0.222 | | | $ | 0.507 | | | $ | 0.172 | | | $ | 0.382 | | | $ | 0.880 | | | $ | 0.484 | | |
| Less distributions | | | |
| From net investment income | | $ | (0.212 | ) | | $ | (0.437 | ) | | $ | (0.452 | ) | | $ | (0.452 | ) | | $ | (0.470 | ) | | $ | (0.484 | ) | |
| Total distributions | | $ | (0.212 | ) | | $ | (0.437 | ) | | $ | (0.452 | ) | | $ | (0.452 | ) | | $ | (0.470 | ) | | $ | (0.484 | ) | |
| Net asset value - End of period | | $ | 9.400 | | | $ | 9.390 | | | $ | 9.320 | | | $ | 9.600 | | | $ | 9.670 | | | $ | 9.260 | | |
| Total Return(3) | | | 2.39 | % | | | 5.52 | % | | | 1.80 | % | | | 4.12 | % | | | 9.77 | % | | | 5.51 | % | |
| Ratios/Supplemental Data | | | |
| Net assets, end of period (000's omitted) | | $ | 59,511 | | | $ | 61,704 | | | $ | 9,351 | | | $ | 9,036 | | | $ | 7,917 | | | $ | 12,696 | | |
| Ratios (As a percentage of average daily net assets): | | | | | | | | | | | | | | | | | | | | | | | | | |
| Expenses(4) | | | 0.80 | %(5) | | | 0.79 | % | | | 0.79 | % | | | 0.83 | % | | | 0.84 | % | | | 0.85 | % | |
| Expenses after custodian fee reduction(4) | | | 0.80 | %(5) | | | 0.79 | % | | | 0.77 | % | | | 0.83 | % | | | 0.81 | % | | | 0.82 | % | |
| Net investment income | | | 4.52 | %(5) | | | 4.65 | % | | | 4.69 | % | | | 4.93 | % | | | 5.09 | % | | | 5.34 | % | |
| Portfolio Turnover of the Portfolio(6) | | | 0 | % | | | 19 | % | | | 21 | % | | | 21 | % | | | 28 | % | | | 17 | % | |
| Portfolio Turnover of the Fund | | | 6 | % | | | - | | | | - | | | | - | | | | - | | | | - | | |
(1) Net investment income per share was computed using average shares outstanding.
(2) The Fund, through its investment in the Portfolio, has adopted the provisions of the revised AICPA Audit and Accounting Guide for Investment Companies and began using the interest method to amortize premiums on fixed-income securities. The effect of this change for the year ended August 31, 2002 was to increase net investment income per share by $0.001, increase net realized and unrealized loss per share by $0.001 and increase the ratio of net investment income to average net assets from 4.92% to 4.93%. Per-share data and ratios for the p eriods prior to September 1, 2001 have not been restated to reflect this change in presentation.
(3) Returns are historical and are calculated by determining the percentage change in net asset value with all distributions reinvested. Total return is not computed on an annualized basis.
(4) Includes the Fund's share of its corresponding Portfolio's allocated expenses while the Fund was making investments directly into the Portfolio.
(5) Annualized.
(6) Portfolio turnover represents the rate of portfolio activity for the period while the Fund was making investments directly into the Portfolio.
See notes to financial statements
90
Eaton Vance Municipals Funds as of February 28, 2005
FINANCIAL STATEMENTS CONT'D
Financial Highlights
| | | North Carolina Fund - Class B | |
| | | Six Months Ended
February 28, 2005 | | Year Ended August 31, | |
| | | (Unaudited)(1) | | 2004(1) | | 2003(1) | | 2002(1)(2) | | 2001(1) | | 2000(1) | |
| Net asset value - Beginning of period | | $ | 10.100 | | | $ | 10.030 | | | $ | 10.310 | | | $ | 10.390 | | | $ | 9.970 | | | $ | 9.960 | | |
| Income (loss) from operations | | | | | | | | | | | | | | | | | | | | | | | | | |
| Net investment income | | $ | 0.188 | | | $ | 0.402 | | | $ | 0.405 | | | $ | 0.427 | | | $ | 0.431 | | | $ | 0.449 | | |
| Net realized and unrealized gain (loss) | | | 0.003 | | | | 0.062 | | | | (0.277 | ) | | | (0.099 | ) | | | 0.423 | | | | 0.006 | | |
| Total income from operations | | $ | 0.191 | | | $ | 0.464 | | | $ | 0.128 | | | $ | 0.328 | | | $ | 0.854 | | | $ | 0.455 | | |
| Less distributions | | | | | | | | | | | | | | | | | | | | | | | | | |
| From net investment income | | $ | (0.191 | ) | | $ | (0.394 | ) | | $ | (0.408 | ) | | $ | (0.408 | ) | | $ | (0.434 | ) | | $ | (0.445 | ) | |
| Total distributions | | $ | (0.191 | ) | | $ | (0.394 | ) | | $ | (0.408 | ) | | $ | (0.408 | ) | | $ | (0.434 | ) | | $ | (0.445 | ) | |
| Net asset value - End of period | | $ | 10.100 | | | $ | 10.100 | | | $ | 10.030 | | | $ | 10.310 | | | $ | 10.390 | | | $ | 9.970 | | |
| Total Return(3) | | | 2.07 | %(4) | | | 4.69 | % | | | 1.23 | % | | | 3.29 | % | | | 8.78 | % | | | 4.79 | % | |
| Ratios/Supplemental Data | | | | | | | | | | | | | | | | | | | | | | | | | |
| Net assets, end of period (000's omitted) | | $ | 16,613 | | | $ | 18,098 | | | $ | 79,932 | | | $ | 86,449 | | | $ | 92,747 | | | $ | 97,244 | | |
| Ratios (As a percentage of average daily net assets): | | | | | | | | | | | | | | | | | | | | | | | | | |
| Expenses(5) | | | 1.55 | %(6) | | | 1.54 | % | | | 1.54 | % | | | 1.58 | % | | | 1.59 | % | | | 1.57 | % | |
| Expenses after custodian fee reduction(5) | | | 1.55 | %(6) | | | 1.54 | % | | | 1.52 | % | | | 1.58 | % | | | 1.56 | % | | | 1.54 | % | |
| Net investment income | | | 3.76 | %(6) | | | 3.93 | % | | | 3.96 | % | | | 4.20 | % | | | 4.26 | % | | | 4.63 | % | |
| Portfolio Turnover of the Portfolio(7) | | | 0 | % | | | 19 | % | | | 21 | % | | | 21 | % | | | 28 | % | | | 17 | % | |
| Portfolio Turnover of the Fund | | | 6 | % | | | - | | | | - | | | | - | | | | - | | | | - | | |
(1) Net investment income per share was computed using average shares outstanding.
(2) The Fund, through its investment in the Portfolio, has adopted the provisions of the revised AICPA Audit and Accounting Guide for Investment Companies and began using the interest method to amortize premiums on fixed-income securities. The effect of this change for the year ended August 31, 2002 was to increase net investment income per share by $0.001, increase net realized and unrealized loss per share by $0.001 and increase the ratio of net investment income to average net assets from 4.19% to 4.20%. Per-share data and ratios for the p eriods prior to September 1, 2001 have not been restated to reflect this change in presentation.
(3) Returns are historical and are calculated by determining the percentage change in net asset value with all distributions reinvested. Total return is not computed on an annualized basis.
(4) Total return reflects an increase of 0.15% due to a change in the timing of the payment and reinvestment of distributions.
(5) Includes the Fund's share of its corresponding Portfolio's allocated expenses while the Fund was making investments directly into the Portfolio.
(6) Annualized.
(7) Portfolio turnover represents the rate of portfolio activity for the period while the Fund was making investments directly into the Portfolio.
See notes to financial statements
91
Eaton Vance Municipals Funds as of February 28, 2005
FINANCIAL STATEMENTS CONT'D
Financial Highlights
| | | Oregon Fund - Class A | |
| | | Six Months Ended
February 28, 2005 | | Year Ended August 31, | |
| | | (Unaudited)(1) | | 2004(1) | | 2003(1) | | 2002(1)(2) | | 2001 | | 2000(1) | |
| Net asset value - Beginning of period | | $ | 9.480 | | | $ | 9.420 | | | $ | 9.690 | | | $ | 9.720 | | | $ | 9.370 | | | $ | 9.380 | | |
| Income (loss) from operations | | | |
| Net investment income | | $ | 0.239 | | | $ | 0.497 | | | $ | 0.496 | | | $ | 0.489 | | | $ | 0.484 | | | $ | 0.490 | | |
| Net realized and unrealized gain (loss) | | | 0.013 | | | | 0.062 | | | | (0.278 | ) | | | (0.031 | ) | | | 0.354 | | | | (0.012 | ) | |
| Total income from operations | | $ | 0.252 | | | $ | 0.559 | | | $ | 0.218 | | | $ | 0.458 | | | $ | 0.838 | | | $ | 0.478 | | |
| Less distributions | | | |
| From net investment income | | $ | (0.242 | ) | | $ | (0.499 | ) | | $ | (0.488 | ) | | $ | (0.488 | ) | | $ | (0.488 | ) | | $ | (0.488 | ) | |
| Total distributions | | $ | (0.242 | ) | | $ | (0.499 | ) | | $ | (0.488 | ) | | $ | (0.488 | ) | | $ | (0.488 | ) | | $ | (0.488 | ) | |
| Net asset value - End of period | | $ | 9.490 | | | $ | 9.480 | | | $ | 9.420 | | | $ | 9.690 | | | $ | 9.720 | | | $ | 9.370 | | |
| Total Return(3) | | | 2.69 | % | | | 5.98 | % | | | 2.30 | % | | | 4.90 | % | | | 9.20 | % | | | 5.39 | % | |
| Ratios/Supplemental Data | | | |
| Net assets, end of period (000's omitted) | | $ | 58,892 | | | $ | 55,604 | | | $ | 9,778 | | | $ | 7,638 | | | $ | 5,367 | | | $ | 3,459 | | |
| Ratios (As a percentage of average daily net assets): | | | | | | | | | | | | | | | | | | | | | | | | | |
| Expenses(4) | | | 0.79 | %(5) | | | 0.81 | % | | | 0.80 | % | | | 0.81 | % | | | 0.83 | % | | | 0.75 | % | |
| Expenses after custodian fee reduction(4) | | | 0.78 | %(5) | | | 0.80 | % | | | 0.78 | % | | | 0.80 | % | | | 0.82 | % | | | 0.74 | % | |
| Net investment income | | | 5.09 | %(5) | | | 5.19 | % | | | 5.19 | % | | | 5.11 | % | | | 5.09 | % | | | 5.38 | % | |
| Portfolio Turnover of the Portfolio(6) | | | 0 | % | | | 6 | % | | | 16 | % | | | 21 | % | | | 13 | % | | | 25 | % | |
| Portfolio Turnover of the Fund | | | 5 | % | | | - | | | | - | | | | - | | | | - | | | | - | | |
(1) Net investment income per share was computed using average shares outstanding.
(2) The Fund, through its investment in the Portfolio, has adopted the provisions of the revised AICPA Audit and Accounting Guide for Investment Companies and began using the interest method to amortize premiums on fixed-income securities. The effect of this change for the year ended August 31, 2002 was to increase net investment income per share by $0.003, increase net realized and unrealized loss per share by $0.003 and increase the ratio of net investment income to average net assets from 5.08% to 5.11%. Per-share data and ratios for the p eriods prior to September 1, 2001 have not been restated to reflect this change in presentation.
(3) Returns are historical and are calculated by determining the percentage change in net asset value with all distributions reinvested. Total return is not computed on an annualized basis.
(4) Includes the Fund's share of its corresponding Portfolio's allocated expenses while the Fund was making investments directly into the Portfolio.
(5) Annualized.
(6) Portfolio turnover represents the rate of portfolio activity for the period while the Fund was making investments directly into the Portfolio.
See notes to financial statements
92
Eaton Vance Municipals Funds as of February 28, 2005
FINANCIAL STATEMENTS CONT'D
Financial Highlights
| | | Oregon Fund - Class B | |
| | | Six Months Ended
February 28, 2005 | | Year Ended August 31, | |
| | | (Unaudited)(1) | | 2004(1) | | 2003(1) | | 2002(1)(2) | | 2001 | | 2000(1) | |
| Net asset value - Beginning of period | | $ | 10.370 | | | $ | 10.300 | | | $ | 10.600 | | | $ | 10.630 | | | $ | 10.250 | | | $ | 10.260 | | |
| Income (loss) from operations | | | |
| Net investment income | | $ | 0.223 | | | $ | 0.470 | | | $ | 0.466 | | | $ | 0.459 | | | $ | 0.452 | | | $ | 0.452 | | |
| Net realized and unrealized gain (loss) | | | 0.003 | | | | 0.068 | | | | (0.309 | ) | | | (0.035 | ) | | | 0.380 | | | | (0.010 | ) | |
| Total income from operations | | $ | 0.226 | | | $ | 0.538 | | | $ | 0.157 | | | $ | 0.424 | | | $ | 0.832 | | | $ | 0.442 | | |
| Less distributions | | | |
| From net investment income | | $ | (0.226 | ) | | $ | (0.468 | ) | | $ | (0.457 | ) | | $ | (0.454 | ) | | $ | (0.452 | ) | | $ | (0.452 | ) | |
| Total distributions | | $ | (0.226 | ) | | $ | (0.468 | ) | | $ | (0.457 | ) | | $ | (0.454 | ) | | $ | (0.452 | ) | | $ | (0.452 | ) | |
| Net asset value - End of period | | $ | 10.370 | | | $ | 10.370 | | | $ | 10.300 | | | $ | 10.600 | | | $ | 10.630 | | | $ | 10.250 | | |
| Total Return(3) | | | 2.39 | %(7) | | | 5.26 | % | | | 1.49 | % | | | 4.13 | % | | | 8.32 | % | | | 4.52 | % | |
| Ratios/Supplemental Data | | | |
| Net assets, end of period (000's omitted) | | $ | 23,461 | | | $ | 24,787 | | | $ | 72,634 | | | $ | 75,861 | | | $ | 78,458 | | | $ | 79,756 | | |
| Ratios (As a percentage of average daily net assets): | | | | | | | | | | | | | | | | | | | | | | | | | |
| Expenses(4) | | | 1.54 | %(5) | | | 1.56 | % | | | 1.55 | % | | | 1.56 | % | | | 1.58 | % | | | 1.60 | % | |
| Expenses after custodian fee reduction(4) | | | 1.53 | %(5) | | | 1.55 | % | | | 1.53 | % | | | 1.55 | % | | | 1.57 | % | | | 1.59 | % | |
| Net investment income | | | 4.35 | %(5) | | | 4.45 | % | | | 4.45 | % | | | 4.39 | % | | | 4.37 | % | | | 4.56 | % | |
| Portfolio Turnover of the Portfolio(6) | | | 0 | % | | | 6 | % | | | 16 | % | | | 21 | % | | | 13 | % | | | 25 | % | |
| Portfolio Turnover of the Fund | | | 5 | % | | | - | | | | - | | | | - | | | | - | | | | - | | |
(1) Net investment income per share was computed using average shares outstanding.
(2) The Fund, through its investment in the Portfolio, has adopted the provisions of the revised AICPA Audit and Accounting Guide for Investment Companies and began using the interest method to amortize premiums on fixed-income securities. The effect of this change for the year ended August 31, 2002 was to increase net investment income per share by $0.003, increase net realized and unrealized loss per share by $0.003 and increase the ratio of net investment income to average net assets from 4.36% to 4.39%. Per-share data and ratios for the p eriods prior to September 1, 2001 have not been restated to reflect this change in presentation.
(3) Returns are historical and are calculated by determining the percentage change in net asset value with all distributions reinvested. Total return is not computed on an annualized basis.
(4) Includes the Fund's share of its corresponding Portfolio's allocated expenses while the Fund was making investments directly into the Portfolio.
(5) Annualized.
(6) Portfolio turnover represents the rate of portfolio activity for the period while the Fund was making investments directly into the Portfolio.
(7) Total return reflects an increase of 0.16% due to a change in the timing of the payment and reinvestment of distributions.
See notes to financial statements
93
Eaton Vance Municipals Funds as of February 28, 2005
FINANCIAL STATEMENTS CONT'D
Financial Highlights
| | | South Carolina Fund - Class A | |
| | | Six Months Ended
February 28, 2005 | | Year Ended August 31, | |
| | | (Unaudited)(1) | | 2004 | | 2003 | | 2002(1)(2) | | 2001(1) | | 2000 | |
| Net asset value - Beginning of period | | $ | 9.710 | | | $ | 9.450 | | | $ | 9.660 | | | $ | 9.710 | | | $ | 9.200 | | | $ | 9.320 | | |
| Income (loss) from operations | | | | | | | | | | | | | | | | | | | | | | | | | |
| Net investment income | | $ | 0.237 | | | $ | 0.508 | | | $ | 0.488 | | | $ | 0.483 | | | $ | 0.483 | | | $ | 0.502 | | |
| Net realized and unrealized gain (loss) | | | 0.231 | | | | 0.265 | | | | (0.213 | ) | | | (0.052 | ) | | | 0.520 | | | | (0.123 | ) | |
| Total income from operations | | $ | 0.468 | | | $ | 0.773 | | | $ | 0.275 | | | $ | 0.431 | | | $ | 1.003 | | | $ | 0.379 | | |
| Less distributions | | | | | | | | | | | | | | | | | | | | | | | | | |
| From net investment income | | $ | (0.248 | ) | | $ | (0.513 | ) | | $ | (0.485 | ) | | $ | (0.481 | ) | | $ | (0.493 | ) | | $ | (0.499 | ) | |
| Total distributions | | $ | (0.248 | ) | | $ | (0.513 | ) | | $ | (0.485 | ) | | $ | (0.481 | ) | | $ | (0.493 | ) | | $ | (0.499 | ) | |
| Net asset value - End of period | | $ | 9.930 | | | $ | 9.710 | | | $ | 9.450 | | | $ | 9.660 | | | $ | 9.710 | | | $ | 9.200 | | |
| Total Return(3) | | | 4.87 | % | | | 8.32 | % | | | 2.88 | % | | | 4.61 | % | | | 11.24 | % | | | 4.30 | % | |
| Ratios/Supplemental Data | | | | | | | | | | | | | | | | | | | | | | | | | |
| Net assets, end of period (000's omitted) | | $ | 39,485 | | | $ | 34,601 | | | $ | 10,727 | | | $ | 8,907 | | | $ | 4,236 | | | $ | 1,553 | | |
| Ratios (As a percentage of average daily net assets): | | | | | | | | | | | | | | | | | | | | | | | | | |
| Expenses(4) | | | 0.77 | %(5) | | | 0.75 | % | | | 0.73 | % | | | 0.80 | % | | | 0.75 | % | | | 0.70 | % | |
| Expenses after custodian fee reduction(4) | | | 0.75 | %(5) | | | 0.75 | % | | | 0.71 | % | | | 0.78 | % | | | 0.70 | % | | | 0.68 | % | |
| Net investment income | | | 4.86 | %(5) | | | 5.22 | % | | | 5.06 | % | | | 5.05 | % | | | 5.14 | % | | | 5.54 | % | |
| Portfolio Turnover of the Portfolio(6) | | | 0 | % | | | 59 | % | | | 37 | % | | | 15 | % | | | 21 | % | | | 12 | % | |
| Portfolio Turnover of the Fund | | | 13 | % | | | - | | | | - | | | | - | | | | - | | | | - | | |
(1) Net investment income per share was computed using average shares outstanding.
(2) The Fund, through its investment in the Portfolio, has adopted the provisions of the revised AICPA Audit and Accounting Guide for Investment Companies and began using the interest method to amortize premiums on fixed-income securities. The effect of this change for the year ended August 31, 2002 was to increase net investment income per share by $0.003, increase net realized and unrealized loss per share by $0.003 and increase the ratio of net investment income to average net assets from 5.02% to 5.05%. Per-share data and ratios for the p eriods prior to September 1, 2001 have not been restated to reflect this change in presentation.
(3) Returns are historical and are calculated by determining the percentage change in net asset value with all distributions reinvested. Total return is not computed on an annualized basis.
(4) Includes the Fund's share of its corresponding Portfolio's allocated expenses while the Fund was making investments directly into the Portfolio.
(5) Annualized.
(6) Portfolio turnover represents the rate of portfolio activity for the period while the Fund was making investments directly into the Portfolio.
See notes to financial statements
94
Eaton Vance Municipals Funds as of February 28, 2005
FINANCIAL STATEMENTS CONT'D
Financial Highlights
| | | South Carolina Fund - Class B | |
| | | Six Months Ended
February 28, 2005 | | Year Ended August 31, | |
| | | (Unaudited)(1) | | 2004 | | 2003 | | 2002(1)(2) | | 2001(1) | | 2000 | |
| Net asset value - Beginning of period | | $ | 10.300 | | | $ | 10.020 | | | $ | 10.250 | | | $ | 10.300 | | | $ | 9.760 | | | $ | 9.900 | | |
| Income (loss) from operations | | | |
| Net investment income | | $ | 0.213 | | | $ | 0.465 | | | $ | 0.441 | | | $ | 0.441 | | | $ | 0.445 | | | $ | 0.446 | | |
| Net realized and unrealized gain (loss) | | | 0.242 | | | | 0.283 | | | | (0.231 | ) | | | (0.057 | ) | | | 0.542 | | | | (0.134 | ) | |
| Total income from operations | | $ | 0.455 | | | $ | 0.748 | | | $ | 0.210 | | | $ | 0.384 | | | $ | 0.987 | | | $ | 0.312 | | |
| Less distributions | | | |
| From net investment income | | $ | (0.225 | ) | | $ | (0.468 | ) | | $ | (0.440 | ) | | $ | (0.434 | ) | | $ | (0.447 | ) | | $ | (0.452 | ) | |
| Total distributions | | $ | (0.225 | ) | | $ | (0.468 | ) | | $ | (0.440 | ) | | $ | (0.434 | ) | | $ | (0.447 | ) | | $ | (0.452 | ) | |
| Net asset value - End of period | | $ | 10.530 | | | $ | 10.300 | | | $ | 10.020 | | | $ | 10.250 | | | $ | 10.300 | | | $ | 9.760 | | |
| Total Return(3) | | | 4.65 | %(4) | | | 7.58 | % | | | 2.06 | % | | | 3.87 | % | | | 10.39 | % | | | 3.32 | % | |
| Ratios/Supplemental Data | | | |
| Net assets, end of period (000's omitted) | | $ | 19,017 | | | $ | 18,529 | | | $ | 40,459 | | | $ | 37,935 | | | $ | 35,378 | | | $ | 33,452 | | |
| Ratios (As a percentage of average daily net assets): | | | | | | | | | | | | | | | | | | | | | | | | | |
| Expenses(5) | | | 1.52 | %(6) | | | 1.50 | % | | | 1.48 | % | | | 1.56 | % | | | 1.49 | % | | | 1.59 | % | |
| Expenses after custodian fee reduction(5) | | | 1.50 | %(6) | | | 1.50 | % | | | 1.46 | % | | | 1.54 | % | | | 1.44 | % | | | 1.57 | % | |
| Net investment income | | | 4.13 | %(6) | | | 4.50 | % | | | 4.33 | % | | | 4.35 | % | | | 4.84 | % | | | 4.65 | % | |
| Portfolio Turnover of the Portfolio(7) | | | 0 | % | | | 59 | % | | | 37 | % | | | 15 | % | | | 21 | % | | | 12 | % | |
| Portfolio Turnover of the Fund | | | 13 | % | | | - | | | | - | | | | - | | | | - | | | | - | | |
(1) Net investment income per share was computed using average shares outstanding.
(2) The Fund, through its investment in the Portfolio, has adopted the provisions of the revised AICPA Audit and Accounting Guide for Investment Companies and began using the interest method to amortize premiums on fixed-income securities. The effect of this change for the year ended August 31, 2002 was to increase net investment income per share by $0.003, increase net realized and unrealized loss per share by $0.003 and increase the ratio of net investment income to average net assets from 4.32% to 4.35%. Per-share data and ratios for the p eriods prior to September 1, 2001 have not been restated to reflect this change in presentation.
(3) Returns are historical and are calculated by determining the percentage change in net asset value with all distributions reinvested. Total return is not computed on an annualized basis.
(4) Total return reflects an increase of 0.15% due to a change in the timing of the payment and reinvestment of distributions.
(5) Includes the Fund's share of its corresponding Portfolio's allocated expenses while the Fund was making investments directly into the Portfolio.
(6) Annualized.
(7) Portfolio turnover represents the rate of portfolio activity for the period while the Fund was making investments directly into the Portfolio.
See notes to financial statements
95
Eaton Vance Municipals Funds as of February 28, 2005
FINANCIAL STATEMENTS CONT'D
Financial Highlights
| | | Tennessee Fund - Class A | |
| | | Six Months Ended
February 28, 2005 | | Year Ended August 31, | |
| | | (Unaudited)(1) | | 2004(1) | | 2003 | | 2002(1)(2) | | 2001 | | 2000(1) | |
| Net asset value - Beginning of period | | $ | 9.900 | | | $ | 9.790 | | | $ | 9.910 | | | $ | 9.920 | | | $ | 9.480 | | | $ | 9.460 | | |
| Income (loss) from operations | | | | | | | | | | | | | | | | | | | | | | | | | |
| Net investment income | | $ | 0.221 | | | $ | 0.462 | | | $ | 0.469 | | | $ | 0.479 | | | $ | 0.484 | | | $ | 0.482 | | |
| Net realized and unrealized gain (loss) | | | (0.001 | ) | | | 0.133 | | | | (0.111 | ) | | | (0.011 | ) | | | 0.434 | | | | 0.020 | | |
| Total income from operations | | $ | 0.220 | | | $ | 0.595 | | | $ | 0.358 | | | $ | 0.468 | | | $ | 0.918 | | | $ | 0.502 | | |
| Less distributions | | | | | | | | | | | | | | | | | | | | | | | | | |
| From net investment income | | $ | (0.230 | ) | | $ | (0.485 | ) | | $ | (0.478 | ) | | $ | (0.478 | ) | | $ | (0.478 | ) | | $ | (0.482 | ) | |
| Total distributions | | $ | (0.230 | ) | | $ | (0.485 | ) | | $ | (0.478 | ) | | $ | (0.478 | ) | | $ | (0.478 | ) | | $ | (0.482 | ) | |
| Net asset value - End of period | | $ | 9.890 | | | $ | 9.900 | | | $ | 9.790 | | | $ | 9.910 | | | $ | 9.920 | | | $ | 9.480 | | |
| Total Return(3) | | | 2.25 | % | | | 6.17 | % | | | 3.65 | % | | | 4.91 | % | | | 9.94 | % | | | 5.57 | % | |
| Ratios/Supplemental Data | | | | | | | | | | | | | | | | | | | | | | | | | |
| Net assets, end of period (000's omitted) | | $ | 40,165 | | | $ | 39,285 | | | $ | 9,051 | | | $ | 6,672 | | | $ | 4,654 | | | $ | 3,557 | | |
| Ratios (As a percentage of average daily net assets): | | | | | | | | | | | | | | | | | | | | | | | | | |
| Expenses(4) | | | 0.75 | %(5) | | | 0.74 | % | | | 0.74 | % | | | 0.76 | % | | | 0.76 | % | | | 0.83 | % | |
| Expenses after custodian fee reduction(4) | | | 0.74 | %(5) | | | 0.73 | % | | | 0.71 | % | | | 0.74 | % | | | 0.72 | % | | | 0.81 | % | |
| Net investment income | | | 4.50 | %(5) | | | 4.69 | % | | | 4.72 | % | | | 4.91 | % | | | 5.03 | % | | | 5.23 | % | |
| Portfolio Turnover of the Portfolio(6) | | | 0 | % | | | 20 | % | | | 17 | % | | | 19 | % | | | 11 | % | | | 9 | % | |
| Portfolio Turnover of the Fund | | | 5 | % | | | - | | | | - | | | | - | | | | - | | | | - | | |
(1) Net investment income per share was computed using average shares outstanding.
(2) The Fund, through its investment in the Portfolio, has adopted the provisions of the revised AICPA Audit and Accounting Guide for Investment Companies and began using the interest method to amortize premiums on fixed-income securities. The effect of this change for the year ended August 31, 2002 was to increase net investment income per share by less than $0.001, increase net realized and unrealized loss per share by less than $0.001 and increase the ratio of net investment income to average net assets by less than 0.01%. Per-share data a nd ratios for the periods prior to September 1, 2001 have not been restated to reflect this change in presentation.
(3) Returns are historical and are calculated by determining the percentage change in net asset value with all distributions reinvested. Total return is not computed on an annualized basis.
(4) Includes the Fund's share of its corresponding Portfolio's allocated expenses while the Fund was making investments directly into the Portfolio.
(5) Annualized.
(6) Portfolio turnover represents the rate of portfolio activity for the period while the Fund was making investments directly into the Portfolio.
See notes to financial statements
96
Eaton Vance Municipals Funds as of February 28, 2005
FINANCIAL STATEMENTS CONT'D
Financial Highlights
| | | Tennessee Fund - Class B | |
| | | Six Months Ended
February 28, 2005 | | Year Ended August 31, | |
| | | (Unaudited)(1) | | 2004(1) | | 2003 | | 2002(1)(2) | | 2001 | | 2000(1) | |
| Net asset value - Beginning of period | | $ | 10.780 | | | $ | 10.660 | | | $ | 10.800 | | | $ | 10.800 | | | $ | 10.320 | | | $ | 10.280 | | |
| Income (loss) from operations | | | | | | | | | | | | | | | | | | | | | | | | | |
| Net investment income | | $ | 0.201 | | | $ | 0.429 | | | $ | 0.433 | | | $ | 0.444 | | | $ | 0.451 | | | $ | 0.452 | | |
| Net realized and unrealized gain (loss) | | | 0.000 | (3) | | | 0.137 | | | | (0.133 | ) | | | (0.004 | ) | | | 0.466 | | | | 0.023 | | |
| Total income from operations | | $ | 0.201 | | | $ | 0.566 | | | $ | 0.300 | | | $ | 0.440 | | | $ | 0.917 | | | $ | 0.475 | | |
| Less distributions | | | | | | | | | | | | | | | | | | | | | | | | | |
| From net investment income | | $ | (0.211 | ) | | $ | (0.446 | ) | | $ | (0.440 | ) | | $ | (0.440 | ) | | $ | (0.437 | ) | | $ | (0.435 | ) | |
| Total distributions | | $ | (0.211 | ) | | $ | (0.446 | ) | | $ | (0.440 | ) | | $ | (0.440 | ) | | $ | (0.437 | ) | | $ | (0.435 | ) | |
| Net asset value - End of period | | $ | 10.770 | | | $ | 10.780 | | | $ | 10.660 | | | $ | 10.800 | | | $ | 10.800 | | | $ | 10.320 | | |
| Total Return(4) | | | 2.04 | %(5) | | | 5.39 | % | | | 2.79 | % | | | 4.22 | % | | | 9.09 | % | | | 4.82 | % | |
| Ratios/Supplemental Data | | | | | | | | | | | | | | | | | | | | | | | | | |
| Net assets, end of period (000's omitted) | | $ | 11,449 | | | $ | 11,924 | | | $ | 39,182 | | | $ | 41,087 | | | $ | 42,550 | | | $ | 41,372 | | |
| Ratios (As a percentage of average daily net assets): | | | | | | | | | | | | | | | | | | | | | | | | | |
| Expenses(6) | | | 1.50 | %(7) | | | 1.49 | % | | | 1.49 | % | | | 1.51 | % | | | 1.51 | % | | | 1.57 | % | |
| Expenses after custodian fee reduction(6) | | | 1.49 | %(7) | | | 1.48 | % | | | 1.46 | % | | | 1.49 | % | | | 1.47 | % | | | 1.55 | % | |
| Net investment income | | | 3.75 | %(7) | | | 3.95 | % | | | 3.99 | % | | | 4.19 | % | | | 4.30 | % | | | 4.50 | % | |
| Portfolio Turnover of the Portfolio(8) | | | 0 | % | | | 20 | % | | | 17 | % | | | 19 | % | | | 11 | % | | | 9 | % | |
| Portfolio Turnover of the Fund | | | 5 | % | | | - | | | | - | | | | - | | | | - | | | | - | | |
(1) Net investment income per share was computed using average shares outstanding.
(2) The Fund, through its investment in the Portfolio, has adopted the provisions of the revised AICPA Audit and Accounting Guide for Investment Companies and began using the interest method to amortize premiums on fixed-income securities. The effect of this change for the year ended August 31, 2002 was to increase net investment income per share by less than $0.001, increase net realized and unrealized loss per share by less than $0.001 and increase the ratio of net investment income to average net assets by less than 0.01%. Per-share data a nd ratios for the periods prior to September 1, 2001 have not been restated to reflect this change in presentation.
(3) Amount represents less than $(0.0005) per share.
(4) Returns are historical and are calculated by determining the percentage change in net asset value with all distributions reinvested. Total return is not computed on an annualized basis.
(5) Total return reflects an increase of 0.13% due to a change in the timing of the payment and reinvestment of distributions.
(6) Includes the Fund's share of its corresponding Portfolio's allocated expenses while the Fund was making investments directly into the Portfolio.
(7) Annualized.
(8) Portfolio turnover represents the rate of portfolio activity for the period while the Fund was making investments directly into the Portfolio.
See notes to financial statements
97
Eaton Vance Municipals Funds as of February 28, 2005
FINANCIAL STATEMENTS CONT'D
Financial Highlights
| | | Virginia Fund - Class A | |
| | | Six Months Ended
February 28, 2005 | | Year Ended August 31, | |
| | | (Unaudited)(1) | | 2004(1) | | 2003(1) | | 2002(1)(2) | | 2001(1) | | 2000(1) | |
| Net asset value - Beginning of period | | $ | 9.590 | | | $ | 9.390 | | | $ | 9.600 | | | $ | 9.700 | | | $ | 9.220 | | | $ | 9.300 | | |
| Income (loss) from operations | | | | | | | | | | | | | | | | | | | | | | | | | |
| Net investment income | | $ | 0.215 | | | $ | 0.451 | | | $ | 0.463 | | | $ | 0.475 | | | $ | 0.464 | | | $ | 0.481 | | |
| Net realized and unrealized gain (loss) | | | 0.103 | | | | 0.202 | | | | (0.217 | ) | | | (0.119 | ) | | | 0.492 | | | | (0.072 | ) | |
| Total income from operations | | $ | 0.318 | | | $ | 0.653 | | | $ | 0.246 | | | $ | 0.356 | | | $ | 0.956 | | | $ | 0.409 | | |
| Less distributions | | | | | | | | | | | | | | | | | | | | | | | | | |
| From net investment income | | $ | (0.218 | ) | | $ | (0.453 | ) | | $ | (0.456 | ) | | $ | (0.456 | ) | | $ | (0.476 | ) | | $ | (0.489 | ) | |
| Total distributions | | $ | (0.218 | ) | | $ | (0.453 | ) | | $ | (0.456 | ) | | $ | (0.456 | ) | | $ | (0.476 | ) | | $ | (0.489 | ) | |
| Net asset value - End of period | | $ | 9.690 | | | $ | 9.590 | | | $ | 9.390 | | | $ | 9.600 | | | $ | 9.700 | | | $ | 9.220 | | |
| Total Return(3) | | | 3.34 | % | | | 7.06 | % | | | 2.58 | % | | | 3.82 | % | | | 10.66 | % | | | 4.66 | % | |
| Ratios/Supplemental Data | | | | | | | | | | | | | | | | | | | | | | | | | |
| Net assets, end of period (000's omitted) | | $ | 76,958 | | | $ | 73,924 | | | $ | 9,477 | | | $ | 8,357 | | | $ | 7,164 | | | $ | 3,632 | | |
| Ratios (As a percentage of average daily net assets): | | | | | | | | | | | | | | | | | | | | | | | | | |
| Expenses(4) | | | 0.80 | %(5) | | | 0.79 | % | | | 0.81 | % | | | 0.82 | % | | | 0.84 | % | | | 0.81 | % | |
| Expenses after custodian fee reduction(4) | | | 0.80 | %(5) | | | 0.79 | % | | | 0.80 | % | | | 0.82 | % | | | 0.82 | % | | | 0.80 | % | |
| Net investment income | | | 4.49 | %(5) | | | 4.75 | % | | | 4.83 | % | | | 4.99 | % | | | 4.89 | % | | | 5.34 | % | |
| Portfolio Turnover of the Portfolio(6) | | | 0 | % | | | 14 | % | | | 20 | % | | | 33 | % | | | 39 | % | | | 23 | % | |
| Portfolio Turnover of the Fund | | | 14 | % | | | - | | | | - | | | | - | | | | - | | | | - | | |
(1) Net investment income per share was computed using average shares outstanding.
(2) The Fund, through its investment in the Portfolio, has adopted the provisions of the revised AICPA Audit and Accounting Guide for Investment Companies and began using the interest method to amortize premiums on fixed-income securities. The effect of this change for the year ended August 31, 2002 was to increase net investment income per share by $0.001, increase net realized and unrealized loss per share by $0.001 and increase the ratio of net investment income to average net assets from 4.98% to 4.99%. Per-share data and ratios for the p eriods prior to September 1, 2001 have not been restated to reflect this change in presentation.
(3) Returns are historical and are calculated by determining the percentage change in net asset value with all distributions reinvested. Total return is not computed on an annualized basis.
(4) Includes the Fund's share of its corresponding Portfolio's allocated expenses while the Fund was making investments directly into the Portfolio.
(5) Annualized.
(6) Portfolio turnover represents the rate of portfolio activity for the period while the Fund was making investments directly into the Portfolio.
See notes to financial statements
98
Eaton Vance Municipals Funds as of February 28, 2005
FINANCIAL STATEMENTS CONT'D
Financial Highlights
| | | Virginia Fund - Class B | |
| | | Six Months Ended
February 28, 2005 | | Year Ended August 31, | |
| | | (Unaudited)(1) | | 2004(1) | | 2003(1) | | 2002(1)(2) | | 2001(1) | | 2000(1) | |
| Net asset value - Beginning of period | | $ | 10.610 | | | $ | 10.400 | | | $ | 10.630 | | | $ | 10.730 | | | $ | 10.200 | | | $ | 10.290 | | |
| Income (loss) from operations | | | |
| Net investment income | | $ | 0.198 | | | $ | 0.426 | | | $ | 0.434 | | | $ | 0.448 | | | $ | 0.435 | | | $ | 0.456 | | |
| Net realized and unrealized gain (loss) | | | 0.113 | | | | 0.204 | | | | (0.240 | ) | | | (0.124 | ) | | | 0.545 | | | | (0.083 | ) | |
| Total income from operations | | $ | 0.311 | | | $ | 0.630 | | | $ | 0.194 | | | $ | 0.324 | | | $ | 0.980 | | | $ | 0.373 | | |
| Less distributions | | | |
| From net investment income | | $ | (0.201 | ) | | $ | (0.420 | ) | | $ | (0.424 | ) | | $ | (0.424 | ) | | $ | (0.450 | ) | | $ | (0.463 | ) | |
| Total distributions | | $ | (0.201 | ) | | $ | (0.420 | ) | | $ | (0.424 | ) | | $ | (0.424 | ) | | $ | (0.450 | ) | | $ | (0.463 | ) | |
| Net asset value - End of period | | $ | 10.720 | | | $ | 10.610 | | | $ | 10.400 | | | $ | 10.630 | | | $ | 10.730 | | | $ | 10.200 | | |
| Total Return(3) | | | 3.12 | %(7) | | | 6.15 | % | | | 1.81 | % | | | 3.14 | % | | | 9.86 | % | | | 3.80 | % | |
| Ratios/Supplemental Data | | | |
| Net assets, end of period (000's omitted) | | $ | 29,950 | | | $ | 32,477 | | | $ | 103,739 | | | $ | 110,881 | | | $ | 114,367 | | | $ | 111,662 | | |
| Ratios (As a percentage of average daily net assets): | | | | | | | | | | | | | | | | | | | | | | | | | |
| Expenses(4) | | | 1.55 | %(5) | | | 1.54 | % | | | 1.56 | % | | | 1.57 | % | | | 1.60 | % | | | 1.60 | % | |
| Expenses after custodian fee reduction(4) | | | 1.55 | %(5) | | | 1.54 | % | | | 1.55 | % | | | 1.57 | % | | | 1.58 | % | | | 1.59 | % | |
| Net investment income | | | 3.74 | %(5) | | | 4.00 | % | | | 4.09 | % | | | 4.25 | % | | | 4.19 | % | | | 4.57 | % | |
| Portfolio Turnover of the Portfolio(6) | | | 0 | % | | | 14 | % | | | 20 | % | | | 33 | % | | | 39 | % | | | 23 | % | |
| Portfolio Turnover of the Fund | | | 14 | % | | | - | | | | - | | | | - | | | | - | | | | - | | |
(1) Net investment income per share was computed using average shares outstanding.
(2) The Fund, through its investment in the Portfolio, has adopted the provisions of the revised AICPA Audit and Accounting Guide for Investment Companies and began using the interest method to amortize premiums on fixed-income securities. The effect of this change for the year ended August 31, 2002 was to increase net investment income per share by $0.001, increase net realized and unrealized loss per share by $0.001 and increase the ratio of net investment income to average net assets from 4.24% to 4.25%. Per-share data and ratios for the p eriods prior to September 1, 2001 have not been restated to reflect this change in presentation.
(3) Returns are historical and are calculated by determining the percentage change in net asset value with all distributions reinvested. Total return is not computed on an annualized basis.
(4) Includes the Fund's share of its corresponding Portfolio's allocated expenses while the Fund was making investments directly into the Portfolio.
(5) Annualized.
(6) Portfolio turnover represents the rate of portfolio activity for the period while the Fund was making investments directly into the Portfolio.
(7) Total return reflects an increase of 0.15% due to a change in the timing of the payment and reinvestment of distributions.
See notes to financial statements
99
Eaton Vance Municipals Funds as of February 28, 2005
NOTES TO FINANCIAL STATEMENTS (Unaudited)
1 Significant Accounting Policies
Eaton Vance Municipals Trust (the Trust) is an entity of the type commonly known as a Massachusetts business trust and is registered under the Investment Company Act of 1940, as amended, as an open-end management investment company. The Trust presently consists of twenty-eight Funds, twelve of which, each non-diversified, are included in these financial statements. They include Eaton Vance Alabama Municipals Fund (Alabama Fund), Eaton Vance Arkansas Municipals Fund (Arkansas Fund), Eaton Vance Georgia Municipals Fund (Georgia Fund), Eaton Vance Kentucky Municipals Fund (Kentucky Fund), Eaton Vance Louisiana Municipals Fund (Louisiana Fund), Eaton Vance Maryland Municipals Fund (Maryland Fund), Eaton Vance Missouri Municipals Fund (Missouri Fund), Eaton Vance North Carolina Municipals Fund (North Carolina Fund), Eaton Vance Oregon Municipals Fund (Oregon Fund), Eaton Vance South Carolina Municipa ls Fund (South Carolina Fund), Eaton Vance Tennessee Municipals Fund (Tennessee Fund) and Eaton Vance Virginia Municipals Fund (Virginia Fund), (collectively, the Funds). The Funds seek to achieve current income exempt from regular federal income tax and particular state or local income or other taxes by investing primarily in investment grade municipal obligations. The Funds offer two classes of shares. Class A shares are generally sold subject to a sales charge imposed at time of purchase. Class B shares are sold at net asset value and are subject to a declining contingent deferred sales charge (see Note 6). The Trustees have adopted a conversion feature pursuant to which Class B shares of each Fund automatically convert to Class A shares eight years after their purchase as described in each Fund's prospectus. Each class represents a pro rata interest in the Fund, but votes separately on class-specific matters and (as noted below) is subject to different expenses. Realized and unrealize d gains and losses are allocated daily to each class of shares based on the relative net assets of each class to the total net assets of the Fund. Net investment income, other than class specific expenses, is allocated daily to each class of shares based upon the ratio of the value of each class' paid shares to the total value of all paid shares. Each class of shares differs in its distribution plan and certain other class specific expenses.
On September 24, 2004, the Alabama Fund, Arkansas Fund, Georgia Fund, Kentucky Fund, Louisiana Fund, Maryland Fund, Missouri Fund, North Carolina Fund, Oregon Fund, South Carolina Fund, Tennessee Fund, and Virginia Fund received its pro rata share of cash and securities from the Alabama Municipals Portfolio (Alabama Portfolio), the Arkansas Municipals Portfolio (Arkansas Portfolio), Georgia Municipals Portfolio (Georgia Portfolio), Kentucky Municipals Portfolio (Kentucky Portfolio), Louisiana Municipals Portfolio (Louisiana Portfolio), Maryland Municipals Portfolio (Maryland Portfolio), Missouri Municipals Portfolio (Missouri Portfolio), North Carolina Municipals Portfolio (North Carolina Portfolio), Oregon Municipals Portfolio (Oregon Portfolio), South Carolina Municipals Portfolio (So uth Carolina Portfolio), Tennessee Municipals Portfolio (Tennessee Portfolio) and Virginia Municipals Portfolio (Virginia Portfolio), respectively, in a complete liquidation of its interest in its corresponding Portfolio. Subsequent to September 24, 2004, each Fund invests directly in securities rather than through its corresponding Portfolio and maintains the same investment objective.The following is a summary of significant accounting policies consistently followed by the Trust in the preparation of its financial statements. The policies are in conformity with accounting principles generally accepted in the United States of America.
A Investment Valuations - Municipal bonds are normally valued on the basis of valuations furnished by a pricing service. Taxable obligations, if any, for which price quotations are readily available are normally valued at the mean between the latest bid and asked prices. Financial futures contracts and options on financial futures contracts listed on commodity exchanges are valued at closing settlement prices. Over-the-counter options on financial futures contracts are normally valued at the mean between the latest bid and asked prices. Interest rate swaps are norma lly valued on the basis of valuations furnished by a broker. Short-term obligations, maturing in sixty days or less, are valued at amortized cost, which approximates value. Investments for which valuations or market quotations are unavailable are valued at fair value using methods determined in good faith by or at the direction of the Trustees.
B Income - Interest income is determined on the basis of interest accrued, adjusted for amortization of premium or accretion of discount.
C Federal Taxes - Each Fund's policy is to comply with the provisions of the Internal Revenue Code applicable to regulated investment companies and to distribute to shareholders each year all of its taxable and tax-exempt income, including any net realized gain on investments. Accordingly, no provision for federal income or excise tax is necessary. At August 31, 2004, the Funds, for federal income tax purposes, had capital loss carryovers
100
Eaton Vance Municipals Funds as of February 28, 2005
NOTES TO FINANCIAL STATEMENTS (Unaudited) CONT'D
which will reduce taxable income arising from future net realized gain on investments, if any, to the extent permitted by the Internal Revenue Code, and thus will reduce the amount of the distributions to shareholders which would otherwise be necessary to relieve the Funds of any liability for federal income or excise tax. The amounts and expiration dates of the capital loss carryovers are as follows:
| Fund | | Amount | | Expires | |
| Alabama | | $ | 94,556 | | | August 31, 2005 | |
|
| | | | 272,583 | | | August 31, 2008 | |
|
| | | | 136,447 | | | August 31, 2010 | |
|
| | | | 405,357 | | | August 31, 2011 | |
|
| Arkansas | | | 251,575 | | | August 31, 2005 | |
|
| | | | 336,826 | | | August 31, 2009 | |
|
| Georgia | | | 41,652 | | | August 31, 2008 | |
|
| | | | 223,748 | | | August 31, 2009 | |
|
| | | | 295,816 | | | August 31, 2011 | |
|
| | | | 117,457 | | | August 31, 2012 | |
|
| Kentucky | | | 233,391 | | | August 31, 2005 | |
|
| | | | 134,770 | | | August 31, 2010 | |
|
| | | | 2,950,605 | | | August 31, 2012 | |
|
| Louisiana | | | 250,387 | | | August 31, 2005 | |
|
| | | | 527,106 | | | August 31, 2008 | |
|
| | | | 159,254 | | | August 31, 2009 | |
|
| | | | 183,393 | | | August 31, 2010 | |
|
| | | | 142,162 | | | August 31, 2012 | |
|
| Maryland | | | 290,437 | | | August 31, 2012 | |
|
| Missouri | | | 113,141 | | | August 31, 2005 | |
|
| | | | 475,094 | | | August 31, 2010 | |
|
| | | | 135,451 | | | August 31, 2012 | |
|
| North Carolina | | | 73,745 | | | August 31, 2005 | |
|
| | | | 595,722 | | | August 31, 2012 | |
|
| Oregon | | | 924,680 | | | August 31, 2005 | |
|
| | | | 147,651 | | | August 31, 2008 | |
|
| | | | 87,267 | | | August 31, 2009 | |
|
| South Carolina | | | 183,416 | | | August 31, 2005 | |
|
| | | | 25,336 | | | August 31, 2007 | |
|
| | | | 155,263 | | | August 31, 2008 | |
|
| | | | 347,930 | | | August 31, 2010 | |
|
| Tennessee | | | 246,996 | | | August 31, 2005 | |
|
| | | | 156,823 | | | August 31, 2012 | |
|
| Virginia | | | 168,858 | | | August 31, 2009 | |
|
| | | | 730,517 | | | August 31, 2010 | |
|
| | | | 1,040,829 | | | August 31, 2012 | |
|
Dividends paid by each Fund from net interest on tax-exempt municipal bonds are not includable by shareholders as gross income for federal income tax purposes because each Fund intends to meet certain requirements of the Internal Revenue Code applicable to regulated investment companies that will enable the Funds to pay tax-exempt interest dividends. The portion of such interest, if any, earned on private activity bonds issued after August 7, 1986 may be considered a tax preference item to shareholders.
Additionally, at August 31, 2004, Arkansas Fund, Georgia Fund, Kentucky Fund, Louisiana Fund, Maryland Fund, Missouri Fund, Oregon Fund, South Carolina Fund, Tennessee Fund and Virginia Fund had net capital losses of $923,764, $935,874, $797,286, $96,341, $1,012,091, $625,587, $2,081,699, $649,949, $680,309 and $1,301,841, respectively, attributable to security transactions incurred after October 31, 2003. These are treated as arising on the first day of each Fund's taxable year ending August 31, 2005.
D Interest Rate Swaps - A Fund may enter into interest rate swap agreements to enhance return, to hedge against fluctuations in securities prices or interest rates or as substitution for the purchase or sale of securities. Pursuant to these agreements, the Funds make semi-annual payments at a fixed interest rate. In exchange, a Fund receives payments based on the interest rate of a benchmark industry index. During the term of the outstanding swap agreement, changes in the underlying value of the swap are recorded as unrealized gains and losses. The value of the swap is determined by changes in the relationship between two rates of interest. The Fund is exposed to credit loss in the event of non-performance by the swap counterparty. However, the Fund does not anticipate non-performance by the counterparty. Risk may also arise from the unanticipated movements in value of interest rates.
E Financial Futures Contracts - Upon the entering of a financial futures contract, a Fund is required to deposit (initial margin) either in cash or securities an amount equal to a certain percentage of the purchase price indicated in the financial futures contract. Subsequent payments are made or received by a Fund (margin maintenance) each day, dependent on the daily fluctuations in the value of the underlying security, and are recorded for book purposes as unrealized gains or losses by a Fund. A Fund's investment in financial futures contracts is designed for both hedging against anticipated future changes in interest rates and investment purposes. Should interest rates move unexpectedly, a Fund may not achieve the anticipated benefits of the financial futures contracts and may realize a loss.
101
Eaton Vance Municipals Funds as of February 28, 2005
NOTES TO FINANCIAL STATEMENTS (Unaudited) CONT'D
F Options on Financial Futures Contracts - Upon the purchase of a put option on a financial futures contract by a Fund, the premium paid is recorded as an investment, the value of which is marked-to-market daily. When a purchased option expires, a Fund will realize a loss in the amount of the cost of the option. When a Fund enters into a closing sale transaction, a Fund will realize a gain or loss depending on whether the sales proceeds from the closing sale transaction are greater or less than the cost of the option. When a Fund exercises a put option, settlement i s made in cash. The risk associated with purchasing put options is limited to the premium originally paid.
G When-Issued and Delayed Delivery Transactions - The Funds may engage in when-issued and delayed delivery transactions. The Funds record when-issued securities on trade date and maintain security positions such that sufficient liquid assets will be available to make payments for the securities purchased. Securities purchased on a when-issued or delayed delivery basis are marked-to-market daily and begin earning interest on settlement date.
H Legal Fees - Legal fees and other related expenses incurred as part of negotiations of the terms and requirements of capital infusions, or that are expected to result in the restructuring of or a plan of reorganization for an investment are recorded as realized losses. Ongoing expenditures to protect or enhance an investment are treated as operating expenses.
I Expenses - The majority of expenses of the Trust are directly identifiable to an individual fund. Expenses which are not readily identifiable to a specific fund are allocated taking into consideration, among other things, the nature and type of expense and the relative size of the funds.
J Expense Reduction - Investors Bank & Trust Company (IBT) serves as custodian of the Funds. Pursuant to the respective custodian agreements, IBT receives a fee reduced by credits which are determined based on the average daily cash balances the Funds maintain with IBT. All credit balances used to reduce each Fund's custodian fees are reported as a reduction of operating expenses on the Statements of Operations.
K Use of Estimates - The preparation of the financial statements in conformity with accounting principles generally accepted in the United States of America requires management to make estimates and assumptions that affect the reported amounts of assets and liabilities at the date of the financial statements and the reported amounts of income and expense during the reporting period. Actual results could differ from those estimates.
L Indemnifications - Under the Trust's organizational documents, its officers and Trustees may be indemnified against certain liabilities and expenses arising out of the performance of their duties to the Funds and shareholders are indemnified against personal liability for obligations of the Trust. Additionally, in the normal course of business, the Funds enter into agreements with service providers that may contain indemnification clauses. The Funds' maximum exposure under these arrangements is unknown as this would involve future claims that may be made against t he Funds that have not yet occurred.
M Other - Investment transactions are accounted for on a trade date basis. Realized gains and losses are computed based on the specific identification of the securities sold.
N Interim Financial Statements - The interim financial statements relating to February 28, 2005 and for the six months then ended have not been audited by an independent registered public accounting firm, but in the opinion of the Funds' management reflect all adjustments, consisting only of normal recurring adjustments, necessary for the fair presentation of the financial statements.
2 Distributions to Shareholders
The net income of each Fund is determined daily, and substantially all of the net income so determined is declared as a dividend to shareholders of record at the time of declaration. Distributions are declared separately for each class of shares. Distributions are paid monthly. Distributions of realized capital gains, if any, are made at least annually. Shareholders may reinvest income and capital gain distributions in additional shares of the same class of a Fund at the net asset value as of the reinvestment date. Distributions are paid in the form of additional shares of the same class or, at the election of the shareholder, in cash. The Funds distinguish between distributions on a tax basis and a financial reporting basis. Accounting principles generally accepted in the United States of America require that only distributions in excess of tax basis earnings and profits be reported in the fina ncial statements as a return of capital. Permanent differences between book and tax accounting relating to distributions are reclassified to paid-in capital.
102
Eaton Vance Municipals Funds as of February 28, 2005
NOTES TO FINANCIAL STATEMENTS (Unaudited) CONT'D
3 Shares of Beneficial Interest
The Funds' Declaration of Trust permits the Trustees to issue an unlimited number of full and fractional shares of beneficial interest (without par value). Such shares may be issued in a number of different series (such as the Funds) and classes. Transactions in Fund shares were as follows:
| | | Alabama Fund | |
Class A | | Six Months Ended
February 28, 2005
(Unaudited) | | Year Ended
August 31, 2004 | |
| Sales | | | 191,678 | | | | 3,441,278 | | |
Issued to shareholders electing to
receive payments of distributions
in Fund shares | | | 44,203 | | | | 52,989 | | |
| Redemptions | | | (256,053 | ) | | | (339,331 | ) | |
| Exchange from Class B shares | | | 60,569 | | | | - | | |
| Net increase | | | 40,397 | | | | 3,154,936 | | |
| | | Alabama Fund | |
Class B | | Six Months Ended
February 28, 2005
(Unaudited) | | Year Ended
August 31, 2004 | |
| Sales | | | 18,888 | | | | 157,911 | | |
Issued to shareholders electing to
receive payments of distributions
in Fund shares | | | 20,581 | | | | 78,516 | | |
| Redemptions | | | (156,083 | ) | | | (3,554,701 | ) | |
| Exchange to Class A shares | | | (55,099 | ) | | | - | | |
| Net decrease | | | (171,713 | ) | | | (3,318,274 | ) | |
| | | Arkansas Fund | |
Class A | | Six Months Ended
February 28, 2005
(Unaudited) | | Year Ended
August 31, 2004 | |
| Sales | | | 214,047 | | | | 2,597,036 | | |
Issued to shareholders electing to
receive payments of distributions
in Fund shares | | | 41,162 | | | | 58,548 | | |
| Redemptions | | | (406,543 | ) | | | (268,210 | ) | |
| Exchange from Class B shares | | | 31,260 | | | | - | | |
| Net increase (decrease) | | | (120,074 | ) | | | 2,387,374 | | |
| | | Arkansas Fund | |
Class B | | Six Months Ended
February 28, 2005
(Unaudited) | | Year Ended
August 31, 2004 | |
| Sales | | | 42,840 | | | | 94,636 | | |
Issued to shareholders electing to
receive payments of distributions
in Fund shares | | | 13,381 | | | | 59,121 | | |
| Redemptions | | | (71,252 | ) | | | (2,427,295 | ) | |
| Exchange to Class A shares | | | (29,072 | ) | | | - | | |
| Net decrease | | | (44,103 | ) | | | (2,273,538 | ) | |
| | | Georgia Fund | |
Class A | | Six Months Ended
February 28, 2005
(Unaudited) | | Year Ended
August 31, 2004 | |
| Sales | | | 231,583 | | | | 3,809,018 | | |
Issued to shareholders electing to
receive payments of distributions
in Fund shares | | | 54,256 | | | | 53,478 | | |
| Redemptions | | | (188,197 | ) | | | (288,072 | ) | |
| Exchange from Class B shares | | | 44,557 | | | | - | | |
| Net increase | | | 142,199 | | | | 3,574,424 | | |
| | | Georgia Fund | |
Class B | | Six Months Ended
February 28, 2005
(Unaudited) | | Year Ended
August 31, 2004 | |
| Sales | | | 95,400 | | | | 172,924 | | |
Issued to shareholders electing to
receive payments of distributions
in Fund shares | | | 17,864 | | | | 80,326 | | |
| Redemptions | | | (68,842 | ) | | | (3,717,192 | ) | |
| Exchange to Class A shares | | | (41,714 | ) | | | - | | |
| Net increase (decrease) | | | 2,708 | | | | (3,463,942 | ) | |
| | | Kentucky Fund | |
Class A | | Six Months Ended
February 28, 2005
(Unaudited) | | Year Ended
August 31, 2004 | |
| Sales | | | 86,213 | | | | 4,934,148 | | |
Issued to shareholders electing to
receive payments of distributions
in Fund shares | | | 62,603 | | | | 62,001 | | |
| Redemptions | | | (186,232 | ) | | | (383,648 | ) | |
| Exchange from Class B shares | | | 206,450 | | | | - | | |
| Net increase | | | 169,034 | | | | 4,612,501 | | |
103
Eaton Vance Municipals Funds as of February 28, 2005
NOTES TO FINANCIAL STATEMENTS (Unaudited) CONT'D
| | | Kentucky Fund | |
Class B | | Six Months Ended
February 28, 2005
(Unaudited) | | Year Ended
August 31, 2004 | |
| Sales | | | 23,336 | | | | 136,429 | | |
Issued to shareholders electing to
receive payments of distributions
in Fund shares | | | 15,844 | | | | 86,461 | | |
| Redemptions | | | (48,140 | ) | | | (4,931,633 | ) | |
| Exchange to Class A shares | | | (191,383 | ) | | | - | | |
| Net decrease | | | (200,343 | ) | | | (4,708,743 | ) | |
| | | Louisiana Fund | |
Class A | | Six Months Ended
February 28, 2005
(Unaudited) | | Year Ended
August 31, 2004 | |
| Sales | | | 169,086 | | | | 1,312,424 | | |
Issued to shareholders electing to
receive payments of distributions
in Fund shares | | | 20,213 | | | | 26,514 | | |
| Redemptions | | | (87,184 | ) | | | (158,435 | ) | |
| Exchange from Class B shares | | | 32,915 | | | | - | | |
| Net increase | | | 135,030 | | | | 1,180,503 | | |
| | | Louisiana Fund | |
Class B | | Six Months Ended
February 28, 2005
(Unaudited) | | Year Ended
August 31, 2004 | |
| Sales | | | 15,124 | | | | 62,879 | | |
Issued to shareholders electing to
receive payments of distributions
in Fund shares | | | 4,923 | | | | 20,321 | | |
| Redemptions | | | (32,011 | ) | | | (1,372,843 | ) | |
| Exchange to Class A shares | | | (31,165 | ) | | | - | | |
| Net decrease | | | (43,129 | ) | | | (1,289,643 | ) | |
| | | Maryland Fund | |
Class A | | Six Months Ended
February 28, 2005
(Unaudited) | | Year Ended
August 31, 2004 | |
| Sales | | | 102,458 | | | | 4,417,879 | | |
Issued to shareholders electing to
receive payments of distributions
in Fund shares | | | 71,262 | | | | 76,543 | | |
| Redemptions | | | (369,951 | ) | | | (505,785 | ) | |
| Exchange from Class B shares | | | 187,136 | | | | - | | |
| Net increase (decrease) | | | (9,095 | ) | | | 3,988,637 | | |
| | | Maryland Fund | |
| Class B | | Six Months Ended
February 28, 2005
(Unaudited) | | Year Ended
August 31, 2004 | |
| Sales | | | 68,251 | | | | 280,780 | | |
Issued to shareholders electing to
receive payments of distributions
in Fund shares | | | 27,846 | | | | 139,162 | | |
| Redemptions | | | (179,394 | ) | | | (4,757,956 | ) | |
| Exchange to Class A shares | | | (171,469 | ) | | | - | | |
| Net decrease | | | (254,766 | ) | | | (4,338,014 | ) | |
| | | Missouri Fund | |
| Class A | | Six Months Ended
February 28, 2005
(Unaudited) | | Year Ended
August 31, 2004 | |
| Sales | | | 732,576 | | | | 3,915,910 | | |
Issued to shareholders electing to
receive payments of distributions
in Fund shares | | | 67,595 | | | | 77,114 | | |
| Redemptions | | | (207,800 | ) | | | (328,237 | ) | |
| Exchange from Class B shares | | | 27,339 | | | | - | | |
| Net increase | | | 619,710 | | | | 3,664,787 | | |
| | | Missouri Fund | |
| Class B | | Six Months Ended
February 28, 2005
(Unaudited) | | Year Ended
August 31, 2004 | |
| Sales | | | 57,606 | | | | 124,164 | | |
Issued to shareholders electing to
receive payments of distributions
in Fund shares | | | 14,710 | | | | 89,328 | | |
| Redemptions | | | (59,276 | ) | | | (3,618,793 | ) | |
| Exchange to Class A shares | | | (24,735 | ) | | | - | | |
| Net decrease | | | (11,695 | ) | | | (3,405,301 | ) | |
| | | North Carolina Fund | |
| Class A | | Six Months Ended
February 28, 2005
(Unaudited) | | Year Ended
August 31, 2004 | |
| Sales | | | 109,042 | | | | 6,049,954 | | |
Issued to shareholders electing to
receive payments of distributions
in Fund shares | | | 81,284 | | | | 92,621 | | |
| Redemptions | | | (526,389 | ) | | | (574,670 | ) | |
| Exchange from Class B shares | | | 98,460 | �� | | | - | | |
| Net increase (decrease) | | | (237,603 | ) | | | 5,567,905 | | |
104
Eaton Vance Municipals Funds as of February 28, 2005
NOTES TO FINANCIAL STATEMENTS (Unaudited) CONT'D
| | | North Carolina Fund | |
Class B | | Six Months Ended
February 28, 2005
(Unaudited) | | Year Ended
August 31, 2004 | |
| Sales | | | 28,296 | | | | 119,959 | | |
Issued to shareholders electing to
receive payments of distributions
in Fund shares | | | 18,140 | | | | 109,747 | | |
| Redemptions | | | (103,249 | ) | | | (6,408,757 | ) | |
| Exchange to Class A shares | | | (91,554 | ) | | | - | | |
| Net decrease | | | (148,367 | ) | | | (6,179,051 | ) | |
| | | Oregon Fund | |
Class A | | Six Months Ended
February 28, 2005
(Unaudited) | | Year Ended
August 31, 2004 | |
| Sales | | | 544,475 | | | | 5,137,223 | | |
Issued to shareholders electing to
receive payments of distributions
in Fund shares | | | 94,887 | | | | 101,583 | | |
| Redemptions | | | (365,181 | ) | | | (411,750 | ) | |
| Exchange from Class B shares | | | 67,656 | | | | - | | |
| Net increase | | | 341,837 | | | | 4,827,056 | | |
| | | Oregon Fund | |
Class B | | Six Months Ended
February 28, 2005
(Unaudited) | | Year Ended
August 31, 2004 | |
| Sales | | | 134,750 | | | | 221,149 | | |
Issued to shareholders electing to
receive payments of distributions
in Fund shares | | | 29,921 | | | | 138,368 | | |
| Redemptions | | | (232,291 | ) | | | (5,019,202 | ) | |
| Exchange to Class A shares | | | (61,887 | ) | | | - | | |
| Net decrease | | | (129,507 | ) | | | (4,659,685 | ) | |
| | | South Carolina Fund | |
Class A | | Six Months Ended
February 28, 2005
(Unaudited) | | Year Ended
August 31, 2004 | |
| Sales | | | 527,517 | | | | 2,812,465 | | |
Issued to shareholders electing to
receive payments of distributions
in Fund shares | | | 49,245 | | | | 64,664 | | |
| Redemptions | | | (217,985 | ) | | | (449,714 | ) | |
| Exchange from Class B shares | | | 54,448 | | | | - | | |
| Net increase | | | 413,225 | | | | 2,427,415 | | |
| | | South Carolina Fund | |
Class B | | Six Months Ended
February 28, 2005
(Unaudited) | | Year Ended
August 31, 2004 | |
| Sales | | | 77,431 | | | | 187,182 | | |
Issued to shareholders electing to
receive payments of distributions
in Fund shares | | | 20,161 | | | | 76,584 | | |
| Redemptions | | | (39,383 | ) | | | (2,501,759 | ) | |
| Exchange to Class A shares | | | (51,367 | ) | | | - | | |
| Net increase (decrease) | | | 6,842 | | | | (2,237,993 | ) | |
| | | Tennessee Fund | |
Class A | | Six Months Ended
February 28, 2005
(Unaudited) | | Year Ended
August 31, 2004 | |
| Sales | | | 244,092 | | | | 3,425,997 | | |
Issued to shareholders electing to
receive payments of distributions
in Fund shares | | | 51,307 | | | | 60,910 | | |
| Redemptions | | | (272,325 | ) | | | (445,480 | ) | |
| Exchange from Class B shares | | | 72,344 | | | | - | | |
| Net increase | | | 95,418 | | | | 3,041,427 | | |
| | | Tennessee Fund | |
Class B | | Six Months Ended
February 28, 2005
(Unaudited) | | Year Ended
August 31, 2004 | |
| Sales | | | 48,487 | | | | 118,454 | | |
Issued to shareholders electing to
receive payments of distributions
in Fund shares | | | 14,273 | | | | 62,291 | | |
| Redemptions | | | (38,720 | ) | | | (2,752,063 | ) | |
| Exchange to Class A shares | | | (66,398 | ) | | | - | | |
| Net decrease | | | (42,358 | ) | | | (2,571,318 | ) | |
| | | Virginia Fund | |
Class A | | Six Months Ended
February 28, 2005
(Unaudited) | | Year Ended
August 31, 2004 | |
| Sales | | | 342,374 | | | | 7,267,037 | | |
Issued to shareholders electing to
receive payments of distributions
in Fund shares | | | 106,373 | | | | 114,239 | | |
| Redemptions | | | (407,209 | ) | | | (681,112 | ) | |
| Exchange from Class B shares | | | 192,711 | | | | - | | |
| Net increase | | | 234,249 | | | | 6,700,164 | | |
105
Eaton Vance Municipals Funds as of February 28, 2005
NOTES TO FINANCIAL STATEMENTS (Unaudited) CONT'D
| | | Virginia Fund | |
Class B | | Six Months Ended
February 28, 2005
(Unaudited) | | Year Ended
August 31, 2004 | |
| Sales | | | 64,820 | | | | 223,390 | | |
Issued to shareholders electing to
receive payments of distributions
in Fund shares | | | 33,175 | | | | 166,192 | | |
| Redemptions | | | (190,863 | ) | | | (7,307,255 | ) | |
| Exchange to Class A shares | | | (174,160 | ) | | | | | |
| Net decrease | | | (267,028 | ) | | | (6,917,673 | ) | |
4 Investment Adviser Fee and Other Transactions with Affiliates
The investment adviser fee is earned by Boston Management and Research (BMR), a wholly-owned subsidiary of Eaton Vance Management (EVM), as compensation for management and investment advisory services rendered to each Fund. The fee is based upon a percentage of average daily net assets plus a percentage of gross income (i.e., income other than gains from the sale of securities). For the period from September 1, 2004 to September 24, 2004, advisory fees allocated from the Portfolios were as follows:
| Portfolio | | Amount | | Effective Rate* | |
| Alabama | | $ | 12,132 | | | | 0.31 | % | |
| Arkansas | | | 7,267 | | | | 0.25 | % | |
| Georgia | | | 10,466 | | | | 0.29 | % | |
| Kentucky | | | 13,334 | | | | 0.32 | % | |
| Louisiana | | | 3,555 | | | | 0.20 | % | |
| Maryland | | | 15,845 | | | | 0.34 | % | |
| Missouri | | | 12,085 | | | | 0.32 | % | |
| North Carolina | | | 18,019 | | | | 0.34 | % | |
| Oregon | | | 19,044 | | | | 0.36 | % | |
| South Carolina | | | 10,429 | | | | 0.30 | % | |
| Tennessee | | | 9,286 | | | | 0.28 | % | |
| Virginia | | | 26,382 | | | | 0.37 | % | |
For the period from September 25, 2004 to February 28, 2005, advisory fees incurred by the Funds were as follows:
| Fund | | Amount | | Effective Rate* | |
| Alabama | | $ | 77,793 | | | | 0.30 | % | |
| Arkansas | | | 43,068 | | | | 0.24 | % | |
| Georgia | | | 69,567 | | | | 0.29 | % | |
| Fund | | Amount | | Effective Rate* | |
| Kentucky | | $ | 86,278 | | | | 0.32 | % | |
| Louisiana | | | 24,352 | | | | 0.20 | % | |
| Maryland | | | 99,690 | | | | 0.33 | % | |
| Missouri | | | 82,866 | | | | 0.31 | % | |
| North Carolina | | | 113,384 | | | | 0.34 | % | |
| Oregon | | | 125,046 | | | | 0.36 | % | |
| South Carolina | | | 73,786 | | | | 0.30 | % | |
| Tennessee | | | 61,719 | | | | 0.28 | % | |
| Virginia | | | 171,755 | | | | 0.37 | % | |
* As a percentage of average daily net assets (annualized).
Except as to Trustees of the Funds who are not members of EVM's or BMR's organization, officers and Trustees receive remuneration for their services to the Funds out of such investment adviser fee. EVM serves as the Administrator of each Fund, but receives no compensation. EVM serves as the sub-transfer agent of each Fund and receives from the transfer agent an aggregate fee based upon the actual expenses incurred by EVM in the performance of those services. For the six months ended February 28, 2005, EVM earned $1,172, $1,090, $1,232, $1,903, $479, $1,714, $1,599, $2,191, $1,955, $911, $1,168 and $2,699 in sub-transfer agent fees from Alabama Fund, Arkansas Fund, Georgia Fund, Kentucky Fund, Louisiana Fund, Maryland Fund, Missouri Fund, North Carolina Fund, Oregon Fund, South Carolina Fund, Tennessee Fund and Virginia Fund, respectively. The Funds were informed that Eaton Vance Distributor s, Inc. (EVD), a subsidiary of EVM and the Funds' principal underwriter, received $969, $4,835, $3,896, $1,747, $1,312, $1,258, $6,583, $1,097, $12,594, $5,785, $5,817 and $3,984 from the Alabama Fund, Arkansas Fund, Georgia Fund, Kentucky Fund, Louisiana Fund, Maryland Fund, Missouri Fund, North Carolina Fund, Oregon Fund, South Carolina Fund, Tennessee Fund and Virginia Fund, respectively, as its portion of the sales charge on sales of Class A shares for the six months ended February 28, 2005.
Trustees of the Funds that are not affiliated with the Investment Adviser may elect to defer receipt of all or a percentage of their annual fees in accordance with the terms of the Trustees Deferred Compensation Plan. For the six months ended February 28, 2005, no significant amounts have been deferred.
Certain officers and Trustees of the Funds are officers of the above organizations.
106
Eaton Vance Municipals Funds as of February 28, 2005
NOTES TO FINANCIAL STATEMENTS (Unaudited) CONT'D
5 Distribution and Service Plans
Each Fund has in effect a distribution plan for Class B (Class B Plan) pursuant to Rule 12b-1 under the Investment Company Act of 1940 and a service plan for Class A (Class A Plans) (collectively, the Plans). The Plans requires the Class B shares to pay EVD amounts equal to 1/365 of 0.75% of each Fund's daily net assets attributable to Class B shares for providing ongoing distribution services and facilities to the respective Fund. Each Fund will automatically discontinue payments to EVD during any period in which there are no outstanding Uncovered Distribution Charges, which are equivalent to the sum of (i) 5% of the aggregate amount received by the Fund for Class B shares sold plus (ii) interest calculated by applying the rate of 1% over the prevailing prime rate to the outstanding balance of Uncovered Distribution Charges of EVD reduced by the aggregate amount of contingent deferred sales charges (see Note 6) and amounts theretofore paid to EVD by Class B. The amount payable to EVD with respect to each day is accrued on such day as a liability of each Fund's Class B shares and, accordingly, reduces each Fund's Class B net assets. For the six months ended February 28, 2005, the Class B shares of the Alabama Fund, Arkansas Fund, Georgia Fund, Kentucky Fund, Louisiana Fund, Maryland Fund, Missouri Fund, North Carolina Fund, Oregon Fund, South Carolina Fund, Tennessee Fund and Virginia Fund paid $72,130, $37,973, $58,791, $58,596, $34,955, $90,355, $48,291, $64,758, $90,248, $70,327, $43,694 and $118,251, respectively, to EVD, representing 0.75% (annualized) of each Fund's Class B average daily net assets. At February 28, 2005, the amount of Uncovered Distribution Charges of EVD calculated under the Class B Plans for Alabama Fund, Arkansas Fund, Georgia Fund, Kentucky Fund, Louisiana Fund, Maryland Fund, Missou ri Fund, North Carolina Fund, Oregon Fund, South Carolina Fund, Tennessee Fund and Virginia Fund were approximately $1,180,000, $962,000, $1,500,000, $1,143,000, $662,000, $2,976,000, $520,000, $1,497,000, $1,512,000, $1,187,000, $706,000 and $1,217,000, respectively.
The Plans authorize each Fund to make payments of service fees to EVD, investment dealers and other persons in amounts equal to 0.20% (annualized) of each Fund's average daily net assets attributable to Class A and Class B shares for each fiscal year. Service fee payments will be made for personal services and/or the maintenance of shareholder accounts. Service fees paid to EVD and investment dealers are separate and distinct from the sales commissions and distribution fees payable by each Fund to EVD, and as such are not subject to automatic discontinuance when there are no outstanding Uncovered Distribution Charges of EVD. For the six months ended February 28, 2005, Alabama Fund, Arkansas Fund, Georgia Fund, Kentucky Fund, Louisiana Fund, Maryland Fund, Missouri Fund, North Carolina Fund, Oregon Fund, South Carolina Fund, Tennessee Fund and Virginia Fund paid or accrued service fees to or payable to EVD in the amount of $40,080, $31,362, $38,474, $47,312, $18,676, $45,566, $47,694, $59,833, $56,410, $37,019, $39,295 and $74,773, respectively, for Class A shares, and $19,235, $10,126, $15,678, $15,626, $9,321, $24,095, $12,878, $17,269, $24,066, $18,754, $11,652 and $31,534, respectively, for Class B shares.
6 Contingent Deferred Sales Charge
A contingent deferred sales charge (CDSC) generally is imposed on redemptions of Class B shares made within six years of purchase. Class A shares may be subject to a 1% CDSC if redeemed within 18 months of purchase (depending on the circumstances of purchase). Generally, the CDSC is based upon the lower of the net asset value at date of redemption or date of purchase. No charge is levied on shares acquired by reinvestment of dividends or capital gains distributions. The Class B CDSC is imposed at declining rates that begin at 5% in the case of redemptions in the first and second year after purchase, declining one percentage point each subsequent year. No CDSC is levied on shares which have been sold to EVD or its affiliates or to their respective employees or clients and may be waived under certain other limited conditions. CDSC charges received on Class B redemptions ar e paid to EVD to reduce the amount of Uncovered Distribution Charges calculated under each Fund's Class B Plan (see Note 5). CDSC charges received on Class B redemptions when no Uncovered Distribution Charges exist for Class B will be credited to the Fund. EVD received approximately $14,000, $6,000, $11,000, $6,000, $4,000, $26,000, $6,000, $10,000, $30,000, $8,000, $4,000 and $31,000 of CDSC paid by Class B shareholders of Alabama Fund, Arkansas Fund, Georgia Fund, Kentucky Fund, Louisiana Fund, Maryland Fund, Missouri Fund, North Carolina Fund, Oregon Fund, South Carolina Fund, Tennessee Fund and Virginia Fund, respectively, for the six months ended February 28, 2005. EVD received approximately $1,000 of CDSC paid by Class A shareholders of Maryland Fund and no CDSC paid by Class A shareholders of Alabama Fund, Arkansas Fund, Georgia Fund, Kentucky Fund, Louisiana Fund, Missouri Fund, North Carolina Fund, Oregon Fund, South Carolina Fund, Tennessee Fund and Virginia Fund for the six months ended February 28, 2005.
107
Eaton Vance Municipals Funds as of February 28, 2005
NOTES TO FINANCIAL STATEMENTS (Unaudited) CONT'D
7 Investments
Purchases and sales of investments by the Portfolios, other than U.S. Government securities, purchased options and short-term obligations, for the period from September 1, 2004 to September 24, 2004, were as follows:
| Alabama Portfolio | | | | | |
| Purchases | | $ | - | | |
| Sales | | | - | | |
| Arkansas Portfolio | | | | | |
| Purchases | | $ | - | | |
| Sales | | | 1,228,890 | | |
| Georgia Portfolio | | | |
| Purchases | | $ | 1,015,810 | | |
| Sales | | | 1,458,104 | | |
| Kentucky Portfolio | | | | | |
| Purchases | | $ | - | | |
| Sales | | | 615,185 | | |
| Louisiana Portfolio | | | | | |
| Purchases | | $ | - | | |
| Sales | | | 10,000 | | |
| Maryland Portfolio | | | | | |
| Purchases | | $ | 148,000 | | |
| Sales | | | 2,792,218 | | |
| Missouri Portfolio | | | | | |
| Purchases | | $ | - | | |
| Sales | | | 256,047 | | |
| North Carolina Portfolio | | | | | |
| Purchases | | $ | - | | |
| Sales | | | 2,072,200 | | |
| Oregon Portfolio | | | | | |
| Purchases | | $ | - | | |
| Sales | | | 992,280 | | |
| South Carolina Portfolio | | | | | |
| Purchases | | $ | - | | |
| Sales | | | 255,525 | | |
| Tennessee Portfolio | | | | | |
| Purchases | | $ | - | | |
| Sales | | | 65,000 | | |
| Virginia Portfolio | | | | | |
| Purchases | | $ | - | | |
| Sales | | | 1,770,282 | | |
Purchases and sales of investments by the Funds, other than U.S. Government securities, purchased options and short-term obligations, for the period from September 25, 2004 to February 28, 2005, were as follows:
| Alabama Fund | | | | | |
| Purchases | | $ | 3,393,782 | | |
| Sales | | | 5,074,660 | | |
| Arkansas Fund | | | | | |
| Purchases | | $ | 2,039,805 | | |
| Sales | | | 3,501,900 | | |
| Georgia Fund | | | | | |
| Purchases | | $ | 4,663,303 | | |
| Sales | | | 2,380,050 | | |
| Kentucky Fund | | | | | |
| Purchases | | $ | 5,182,400 | | |
| Sales | | | 6,628,670 | | |
| Louisiana Fund | | | | | |
| Purchases | | $ | 2,745,873 | | |
| Sales | | | 2,558,665 | | |
| Maryland Fund | | | | | |
| Purchases | | $ | 3,475,646 | | |
| Sales | | | 3,023,480 | | |
108
Eaton Vance Municipals Funds as of February 28, 2005
NOTES TO FINANCIAL STATEMENTS (Unaudited) CONT'D
| Missouri Fund | | | |
| Purchases | | $ | 7,365,141 | | |
| Sales | | | 1,968,948 | | |
| North Carolina Fund | | | |
| Purchases | | $ | 4,696,853 | | |
| Sales | | | 8,835,316 | | |
| Oregon Fund | | | |
| Purchases | | $ | 4,721,012 | | |
| Sales | | | 3,910,510 | | |
| South Carolina Fund | | | |
| Purchases | | $ | 10,914,577 | | |
| Sales | | | 7,064,644 | | |
| Tennessee Fund | | | |
| Purchases | | $ | 2,502,675 | | |
| Sales | | | 3,545,023 | | |
| Virginia Fund | | | |
| Purchases | | $ | 14,957,050 | | |
| Sales | | | 15,892,171 | | |
8 Federal Income Tax Basis of Unrealized Appreciation (Depreciation)
The cost and unrealized appreciation (depreciation) in value of the investments owned by each Fund at February 28, 2005, as computed on a federal income tax basis, are as follows:
| Alabama Fund | | | |
| Aggregate Cost | | $ | 54,479,249 | | |
| Gross unrealized appreciation | | $ | 4,070,532 | | |
| Gross unrealized depreciation | | | (313,044 | ) | |
| Net unrealized appreciation | | $ | 3,757,488 | | |
| Arkansas Fund | | | |
| Aggregate Cost | | $ | 38,453,572 | | |
| Gross unrealized appreciation | | $ | 2,668,090 | | |
| Gross unrealized depreciation | | | (342,372 | ) | |
| Net unrealized appreciation | | $ | 2,325,718 | | |
| Georgia Fund | | | |
| Aggregate Cost | | $ | 51,577,872 | | |
| Gross unrealized appreciation | | $ | 5,201,805 | | |
| Gross unrealized depreciation | | | (1,216,042 | ) | |
| Net unrealized appreciation | | $ | 3,985,763 | | |
| Kentucky Fund | | | |
| Aggregate Cost | | $ | 55,854,749 | | |
| Gross unrealized appreciation | | $ | 5,579,830 | | |
| Gross unrealized depreciation | | | (40,978 | ) | |
| Net unrealized appreciation | | $ | 5,538,852 | | |
| Louisiana Fund | | | |
| Aggregate Cost | | $ | 25,589,723 | | |
| Gross unrealized appreciation | | $ | 2,257,888 | | |
| Gross unrealized depreciation | | | (58,888 | ) | |
| Net unrealized appreciation | | $ | 2,199,000 | | |
| Maryland Fund | | | |
| Aggregate Cost | | $ | 68,446,334 | | |
| Gross unrealized appreciation | | $ | 4,580,066 | | |
| Gross unrealized depreciation | | | (4,471,917 | ) | |
| Net unrealized appreciation | | $ | 108,149 | | |
| Missouri Fund | | | |
| Aggregate Cost | | $ | 57,002,351 | | |
| Gross unrealized appreciation | | $ | 5,403,220 | | |
| Gross unrealized depreciation | | | (110,487 | ) | |
| Net unrealized appreciation | | $ | 5,292,733 | | |
| North Carolina Fund | | | |
| Aggregate Cost | | $ | 69,341,257 | | |
| Gross unrealized appreciation | | $ | 6,097,751 | | |
| Gross unrealized depreciation | | | (859,162 | ) | |
| Net unrealized appreciation | | $ | 5,238,589 | | |
109
Eaton Vance Municipals Funds as of February 28, 2005
NOTES TO FINANCIAL STATEMENTS (Unaudited) CONT'D
| Oregon Fund | | | | | |
| Aggregate Cost | | $ | 76,382,589 | | |
| Gross unrealized appreciation | | $ | 5,101,423 | | |
| Gross unrealized depreciation | | | (1,139,974 | ) | |
| Net unrealized appreciation | | $ | 3,961,449 | | |
| South Carolina Fund | | | |
| Aggregate Cost | | $ | 53,671,933 | | |
| Gross unrealized appreciation | | $ | 3,893,102 | | |
| Gross unrealized depreciation | | | (69,631 | ) | |
| Net unrealized appreciation | | $ | 3,823,471 | | |
| Tennessee Fund | | | |
| Aggregate Cost | | $ | 45,215,804 | | |
| Gross unrealized appreciation | | $ | 3,871,570 | | |
| Gross unrealized depreciation | | | (9,451 | ) | |
| Net unrealized appreciation | | $ | 3,862,119 | | |
| Virginia Fund | | | |
| Aggregate Cost | | $ | 95,588,159 | | |
| Gross unrealized appreciation | | $ | 9,486,672 | | |
| Gross unrealized depreciation | | | (81,783 | ) | |
| Net unrealized appreciation | | $ | 9,404,889 | | |
9 Line of Credit
The Funds participate with other portfolios and funds managed by BMR and EVM and their affiliates in a $150 million unsecured line of credit agreement with a group of banks. The Funds may temporarily borrow from the line of credit to satisfy redemption requests or settle investment transactions. Interest is charged to each participating portfolio or fund based on its borrowings at an amount above either the Eurodollar rate or federal funds rate. In addition, a fee computed at an annual rate of 0.10% on the daily unused portion of the line of credit is allocated among the participating portfolios and funds at the end of each quarter. The Funds did not have any significant borrowings or allocated fees during the six months ended February 28, 2005.
10 Financial Instruments
The Funds regularly trade in financial instruments with off-balance sheet risk in the normal course of their investing activities to assist in managing exposure to various market risks. These financial instruments include futures contracts and interest rate swaps and may involve, to a varying degree, elements of risk in excess of the amounts recognized for financial statement purposes. The notional or contractual amounts of these instruments represent the investment a Fund has in particular classes of financial instruments and does not necessarily represent the amounts potentially subject to risk. The measurement of the risks associated with these instruments is meaningful only when all related and offsetting transactions are considered.
110
Eaton Vance Municipals Funds as of February 28, 2005
NOTES TO FINANCIAL STATEMENTS (Unaudited) CONT'D
A summary of obligations held under these financial instruments at February 28, 2005, is as follows:
| Futures Contracts | | | | | | | | | | | | | | | |
| Fund | | Expiration
Date | | Contracts | | Position | | Aggregate
Cost | | Value | | Net Unrealized
Appreciation | |
Alabama
| | 06/05
06/05 | | 72 U.S. Treasury Bond
13 U.S. Treasury Note | | Short
Short | | | $(8,144,694)
(1,434,820) | | | | $(8,088,750)
(1,428,375) | | | | $55,944
6,445 | | |
Arkansas
| | 06/05
06/05 | | 50 U.S. Treasury Bond
85 U.S. Treasury Note | | Short
Short | | | $(5,660,334)
(9,381,514) | | | | $(5,617,187)
(9,339,375) | | | | $43,147
42,139 | | |
| Georgia | | 06/05 | | 101 U.S. Treasury Bond | | Short | | $ | (11,422,040 | ) | | $ | (11,346,719 | ) | | $ | 75,321 | | |
Kentucky
| | 06/05
06/05 | | 84 U.S. Treasury Bond
21 U.S. Treasury Note | | Short
Short | | | $(9,502,143)
(2,317,785) | | | | $(9,436,875)
(2,307,375) | | | | $65,268
10,410 | | |
| Louisiana | | 06/05 | | 70 U.S. Treasury Bond | | Short | | $ | (7,926,028 | ) | | $ | (7,864,062 | ) | | $ | 61,966 | | |
| Maryland | | 06/05 | | 168 U.S. Treasury Bond | | Short | | $ | (19,018,723 | ) | | $ | (18,873,750 | ) | | $ | 144,973 | | |
| Missouri | | 06/05 | | 101 U.S. Treasury Bond | | Short | | $ | (11,422,040 | ) | | $ | (11,346,719 | ) | | $ | 75,321 | | |
North Carolina
| | 06/05
06/05 | | 100 U.S. Treasury Bond
150 U.S. Treasury Note | | Short
Short | | | $(11,320,669)
(16,555,613) | | | | $(11,234,375)
(16,481,250) | | | | $86,294
74,363 | | |
Oregon
| | 06/05
06/05 | | 150 U.S. Treasury Bond
100 U.S. Treasury Note | | Short
Short | | | $(16,981,003)
(11,037,075) | | | | $(16,851,562)
(10,987,500) | | | | $129,441
49,575 | | |
| South Carolina | | 06/05 | | 120 U.S. Treasury Bond | | Short | | $ | (13,584,802 | ) | | $ | (13,481,250 | ) | | $ | 103,552 | | |
| Tennessee | | 06/05 | | 94 U.S. Treasury Bond | | Short | | $ | (10,630,412 | ) | | $ | (10,560,312 | ) | | $ | 70,100 | | |
| Virginia | | 06/05 | | 250 U.S. Treasury Bond | | Short | | $ | (28,311,428 | ) | | $ | (28,085,937 | ) | | $ | 225,491 | | |
At February 28, 2005, the Funds had sufficient cash and/or securities to cover margin requirements on open futures contracts.
111
Eaton Vance Municipals Funds
INVESTMENT MANAGEMENT
Eaton Vance Municipals Funds
Officers
Thomas J. Fetter
President and Portfolio
Manager of South Carolina
Municipals Fund
William H. Ahern, Jr.
Vice President and Portfolio Manager of Alabama and Kentucky Municipals Funds
Craig R. Brandon
Vice President and Portfolio Manager of Maryland Municipals Fund
Cynthia J. Clemson
Vice President and Portfolio Manager of Georgia, Missouri and Tennessee Municipals Funds
James B. Hawkes
Vice President and Trustee
Robert B. MacIntosh
Vice President and Portfolio Manager of Louisiana and Virginia Municipals Funds
Thomas M. Metzold
Vice President and Portfolio Manager of Arkansas, North Carolina and Oregon Municipals Funds
Alan R. Dynner
Secretary
James L. O'Connor
Treasurer
Paul M. O'Neil
Chief Compliance Officer | | Trustees
Samuel L. Hayes, III
William H. Park
Ronald A. Pearlman
Norton H. Reamer
Lynn A. Stout | |
|
112
This Page Intentionally Left Blank
Investment Adviser
Boston Management and Research
The Eaton Vance Building
255 State Street
Boston, MA 02109
Fund Administrator
Eaton Vance Management
The Eaton Vance Building
255 State Street
Boston, MA 02109
Principal Underwriter
Eaton Vance Distributors, Inc.
The Eaton Vance Building
255 State Street
Boston, MA 02109
(617) 482-8260
Custodian
Investors Bank & Trust Company
200 Clarendon Street
Boston, MA 02116
Transfer Agent
PFPC Inc.
P.O. Box 9653
Providence, RI 02940-9653
1-800-262-1122
Eaton Vance Municipals Trust
The Eaton Vance Building
255 State Street
Boston, MA 02109
This report must be preceded or accompanied by a current prospectus. Before investing, investors should consider carefully the Fund’s investment objective(s), risks, and charges and expenses. The Fund’s current prospectus contains this and other information about the Fund and is available through your financial advisor. Please read the prospectus carefully before you invest or send money. For further information please call 800-225-6265.
Item 2. Code of Ethics
The registrant has adopted a code of ethics applicable to its Principal Executive Officer, Principal Financial Officer and Principal Accounting Officer. The registrant undertakes to provide a copy of such code of ethics to any person upon request, without charge, by calling 1–800–262–1122.
Item 3. Audit Committee Financial Expert
The registrant’s Board has designated William H. Park, Samuel L. Hayes, III and Norton H. Reamer, each an independent trustee, as its audit committee financial experts. Mr. Park is a certified public accountant who is the President and Chief Executive Officer of Prizm Capital Management, LLC (a fixed income investment management firm). Previously, he served as Executive Vice President and Chief Financial Officer of United Asset Management Corporation (“UAM”) (a holding company owning institutional investment management firms). Mr. Hayes is the Jacob H. Schiff Professor of Investment Banking Emeritus of the Harvard University Graduate School of Business Administration. Mr. Reamer is the President, Chief Executive Officer and a Director of Asset Management Finance Corp. (a specialty finance company serving the investment management industry) and is President of Unicorn Corporation (an investment and financial advisory services company). Formerly, Mr. Reamer was Chairman of Hellman, Jordan Management Co., Inc. (an investment management company) and Advisory Director of Berkshire Capital Corporation (an investment banking firm), Chairman of the Board of UAM and Chairman, President and Director of the UAM Funds (mutual funds).
Item 4. Principal Accountant Fees and Services
Not required in this filing
Item 5. Audit Committee of Listed Registrants
Not required in this filing.
Item 6. Schedule of Investments
Please see schedule of investments contained in the Report to Stockholders included under Item 1 of this Form N-CSR.
Item 7. Disclosure of Proxy Voting Policies and Procedures for Closed-End Management Investment Companies
Not required in this filing.
Item 8. Purchases of Equity Securities by Closed-End Management Investment Company and Affiliated Purchasers.
Not required in this filing.
Item 9. Submission of Matters to a Vote of Security Holders.
Effective February 7, 2005, the Governance Committee of the Board of Trustees revised the procedures by which a Fund’s shareholders may recommend nominees to the registrant’s Board of Trustees to add the following (highlighted):
The Governance Committee shall, when identifying candidates for the position of Independent Trustee, consider any such candidate recommended by a shareholder of a Fund if such recommendation contains (i)sufficient background information concerning the candidate, including evidence the candidate is willing to serve as an Independent Trustee if selected for the position; and (ii) is received in a sufficiently timely manner (and in any event no later than the date specified for receipt of shareholder proposals in any applicable proxy statement with respect to a Fund). Shareholders shall be directed to address any such recommendations in writing to the attention of the Governance Committee, c/o the Secretary of the Fund. The Secretary shall retain copies of any shareholder recommendations which meet the foregoing requirements for a period of not more than 12 months following receipt. The Secretary shall have no obligation to acknowledge receipt of any shareholder recommendations.
Item 10. Controls and Procedures
(a) It is the conclusion of the registrant’s principal executive officer and principal financial officer that the effectiveness of the registrant’s current disclosure controls and procedures (such disclosure controls and procedures having been evaluated within 90 days of the date of this filing) provide reasonable assurance that the information required to be disclosed by the registrant has been recorded, processed, summarized and reported within the time period specified in the Commission’s rules and forms and that the information required to be disclosed by the registrant has been accumulated and communicated to the registrant’s principal executive officer and principal financial officer in order to allow timely decisions regarding required disclosure.
(b) There have been no changes in the registrant’s internal controls over financial reporting during the second fiscal quarter of the period covered by this report that has materially affected, or is reasonably likely to materially affect, the registrant’s internal control over financial reporting.
Item 11. Exhibits
(a)(1) | | Registrant’s Code of Ethics – Not applicable (please see Item 2). |
(a)(2)(i) | | Treasurer’s Section 302 certification. |
(a)(2)(ii) | | President’s Section 302 certification. |
(b) | | Combined Section 906 certification. |
Signatures
Pursuant to the requirements of the Securities Exchange Act of 1934 and the Investment Company Act of 1940, the registrant has duly caused this report to be signed on its behalf by the undersigned, thereunto duly authorized.
Eaton Vance Municipals Trust | |
| |
|
By: | /s/ Thomas J. Fetter | |
| Thomas J. Fetter | |
| President | |
| | |
| | |
Date: | April 14, 2005 | |
| | | |
Pursuant to the requirements of the Securities Exchange Act of 1934 and the Investment Company Act of 1940, this report has been signed below by the following persons on behalf of the registrant and in the capacities and on the dates indicated.
By: | /s/ James L. O’Connor | |
| James L. O’Connor | |
| Treasurer | |
| | |
| | |
Date: | April 14, 2005 | |
By: | /s/ Thomas J. Fetter | |
| Thomas J. Fetter | |
| President | |
| | |
| | |
Date: | April 14, 2005 | |