UNITED STATES
SECURITIES AND EXCHANGE COMMISSION
Washington, D.C. 20549
FORM N-CSR
CERTIFIED SHAREHOLDER REPORT OF REGISTERED
MANAGEMENT INVESTMENT COMPANIES
Investment Company Act file number | 811-04409 |
|
Eaton Vance Municipals Trust |
(Exact name of registrant as specified in charter) |
|
The Eaton Vance Building, 255 State Street, Boston, Massachusetts | | 02109 |
(Address of principal executive offices) | | (Zip code) |
|
Alan R. Dynner
The Eaton Vance Building, 255 State Street, Boston, Massachusetts 02109 |
(Name and address of agent for service) |
|
Registrant’s telephone number, including area code: | (617) 482-8260 | |
|
Date of fiscal year end: | July 31 | |
|
Date of reporting period: | January 31, 2006 | |
| | | | | | | | |
Item 1. Reports to Stockholders

Semiannual Report January 31, 2006


EATON VANCE
MUNICIPALS
TRUST
Arizona
Colorado
Connecticut
Michigan
Minnesota
New Jersey
Pennsylvania
IMPORTANT NOTICES REGARDING PRIVACY,
DELIVERY OF SHAREHOLDER DOCUMENTS,
PORTFOLIO HOLDINGS, AND PROXY VOTING
Privacy. The Eaton Vance organization is committed to ensuring your financial privacy. Each of the financial institutions identified below has in effect the following policy ("Privacy Policy") with respect to nonpublic personal information about its customers:
• Only such information received from you, through application forms or otherwise, and information about your Eaton Vance fund transactions will be collected. This may include information such as name, address, social security number, tax status, account balances and transactions.
• None of such information about you (or former customers) will be disclosed to anyone, except as permitted by law (which includes disclosure to employees necessary to service your account). In the normal course of servicing a customer's account, Eaton Vance may share information with unaffiliated third parties that perform various required services such as transfer agents, custodians and broker/dealers.
• Policies and procedures (including physical, electronic and procedural safeguards) are in place that are designed to protect the confidentiality of such information.
• We reserve the right to change our Privacy Policy at any time upon proper notification to you. Customers may want to review our Policy periodically for changes by accessing the link on our homepage: www.eatonvance.com.
Our pledge of privacy applies to the following entities within the Eaton Vance organization: the Eaton Vance Family of Funds, Eaton Vance Management, Eaton Vance Investment Counsel, Boston Management and Research, and Eaton Vance Distributors, Inc.
In addition, our Privacy Policy only applies to those Eaton Vance customers who are individuals and who have a direct relationship with us. If a customer's account (i.e., fund shares) is held in the name of a third-party financial adviser/broker-dealer, it is likely that only such adviser's privacy policies apply to the customer. This notice supersedes all previously issued privacy disclosures.
For more information about Eaton Vance's Privacy Policy, please call 1-800-262-1122.
Delivery of Shareholder Documents. The Securities and Exchange Commission (the "SEC") permits funds to deliver only one copy of shareholder documents, including prospectuses, proxy statements and shareholder reports, to fund investors with multiple accounts at the same residential or post office box address. This practice is often called "householding" and it helps eliminate duplicate mailings to shareholders.
Eaton Vance, or your financial adviser, may household the mailing of your documents indefinitely unless you instruct Eaton Vance, or your financial adviser, otherwise.
If you would prefer that your Eaton Vance documents not be householded, please contact Eaton Vance at 1-800-262-1122, or contact your financial adviser.
Your instructions that householding not apply to delivery of your Eaton Vance documents will be effective within 30 days of receipt by Eaton Vance or your financial adviser.
Portfolio Holdings. Each Eaton Vance Fund and its underlying Portfolio (if applicable) will file a schedule of its portfolio holdings on Form N-Q with the SEC for the first and third quarters of each fiscal year. The Form N-Q will be available on the Eaton Vance website www.eatonvance.com, by calling Eaton Vance at 1-800-262-1122 or in the EDGAR database on the SEC's website at www.sec.gov. Form N-Q may also be reviewed and copied at the SEC's public reference room in Washington, D.C. (call 1-800-732-0330 for information on the operation of the public reference room).
Proxy Voting. From time to time, funds are required to vote proxies related to the securities held by the funds. The Eaton Vance Funds or their underlying Portfolios (if applicable) vote proxies according to a set of policies and procedures approved by the Funds' and Portfolios' Boards. You may obtain a description of these policies and procedures and information on how the Funds or Portfolios voted proxies relating to portfolio securities during the most recent 12 month period ended June 30, without charge, upon request, by calling 1-800-262-1122. This description is also available on the SEC's website at www.sec.gov.
EATON VANCE MUNICIPALS FUNDS as of January 31, 2006
TABLE OF CONTENTS
Investment Update | 2 |
| |
Fund Investment Updates | |
Arizona | 3 |
Colorado | 4 |
Connecticut. | 5 |
Michigan | 6 |
Minnesota | 7 |
New Jersey | 8 |
Pennsylvania | 9 |
| |
Fund Expenses | 10 |
| |
Financial Statements | 13 |
| |
Board of Trustees Annual Approval of the Investment Advisory Agreements | 66 |
| |
Management and Organization | 68 |
1
Eaton Vance Municipals Funds as of January 31, 2006
INVESTMENT UPDATE
The investment objective of each Eaton Vance Municipals Fund (the “Funds”) is to provide current income exempt from regular federal income tax and particular state income taxes or other taxes. The Funds primarily invest in investment-grade municipal obligations.
Portfolio Managers:
Arizona Municipals Fund: Craig R. Brandon, CFA
Colorado Municipals Fund: William H. Ahern, Jr., CFA
Connecticut Municipals Fund: William H. Ahern, Jr., CFA
Michigan Municipals Fund: William H. Ahern, Jr., CFA
Minnesota Municipals Fund: Craig R. Brandon, CFA
New Jersey Municipals Fund: Robert B. MacIntosh, CFA
Pennsylvania Municipals Fund: Thomas M. Metzold, CFA
Economic and Market Conditions
The economy expanded at a 1.6% pace in the fourth quarter of 2005, a decline from the 4.1% rate in the third quarter. Even with a weak finish, the economy generated respectable growth in 2005. Despite high energy prices, rising mortgage rates and a persistent tightening by the Federal Reserve (the “Fed”), the economy continued to create jobs – 193,000 in January 2006. Recent economic data suggest that the Gulf Coast hurricanes did not have a significant effect on the nation’s overall economy. The economy appeared to be sustaining growth in both the manufacturing and service sectors, with little evidence of inflationary pressures. Moreover, worries about a pickup in inflation have waned recently, as prices for crude oil, gasoline and jet fuel have eased from their previous highs.
Investor sentiment regarding the Fed’s monetary policy appears to have shifted in recent months, as investors have begun to anticipate the end of the Fed’s series of interest rate hikes (which began in June 2004). The improved investor sentiment has likely accounted, in part, for the improved performance of the financial markets in late 2005.
The municipal market continued to be adversely affected by strong primary market supply. Boosted by lower-than anticipatedlong-term interest rates, the municipal market saw record supply in 2005, more than $400 billion in new issuance. Combined with lackluster retail demand, the large supply pressures pushed tax-exempt yields to more attractive levels. At January 31, 2006, long-term AAA-rated insured municipal bonds yielded 96% of U.S. Treasury bonds with similar maturities.*
For the six months ended January 31, 2006, the Lehman Brothers Municipal Bond Index† (the “Index”), a broadbased, unmanaged municipal market index, posted amodest gain of 1.33%. For more information about each Fund’s performance and the performance of funds in the same Lipper Classification, on the following page.
Management Discussion
The Funds invest primarily in bonds with maturities of 10 years or longer, as longer-maturity bonds historically have provided greater tax-exempt income for investors than shorter-maturity bonds. Given the flattening of the yield curve for fixed-income securities over the past 18 months — with shorter-maturity yields rising as longer-maturity yields declined slightly — the long end of the curve was an attractive place to be positioned.
During the six months ended January 31, 2006, the Federal Reserve raised short-term interest rates at regular intervals, and commodities prices rose significantly. However, the economy grew at a solid pace, with low to moderate inflation. In this climate, we continued to maintain a somewhat cautious outlook on interest rates and adjusted the Funds’ duration accordingly. Duration measures a bond fund’s sensitivity to changes in interest rates.
During the past six months, when prudent, management invested in bonds with attractive coupons and long call protection. These strategies contributed to the Funds’ outperformanceof their respective Lipper state Classification averages over the six-month period. Management also took advantage of narrow credit spreads in an effort to lower the Funds’ exposure to credit risk.
We continued to focus on finding relative value within the marketplace — in issuer names, coupons, maturities and sectors. Relative value trading, which seeks to capitalize on undervalued securities that may have been overlooked, has enhanced the returns of the Funds during the period. Finally, we continued to closely monitor call protection in the Funds. Call protection remains an important strategic consideration for municipal bond investors, especially because refinancing activity has continued to increase over the past six months.
Fund shares are not insured by the FDIC and are not deposits or other obligations of, or guaranteed by, any depository institution. Shares are subject to investment risks, including possible loss of principal invested.
* Source: Bloomberg L.P. Yields are a compilation of a representative variety of general obligations and are not necessarily representative of a Fund’s yield.
† It is not possible to invest directly in an Index. The Index’s total return does not reflect expenses that would have been incurred if an investor individually purchased or sold the securities represented in the Index.
Past performance is no guarantee of future results.
The views expressed throughout this report are those of the portfolio managers and are current only through the end of the period of the report as stated on the cover. These views are subject to change at any time based upon market or other conditions, and the investment adviser disclaims any responsibility to update such views. These views may not be relied on as investment advice and, because investment decisions for a fund are based on many factors, may not be relied on as an indication of trading intent on behalf of any Eaton Vance fund.
2
Eaton Vance Arizon Municipals Funds as of January 31, 2006
MARKET RECAP
Performance(1) | | Class A | | Class B | | Class C | |
| | | | | | | |
Average Annual Total Returns (at net asset value) | | | | | | | |
Six Months | | 1.75 | % | 1.42 | % | N/A | |
One Year | | 3.72 | | 2.95 | | N/A | |
Five Years | | 4.80 | | 4.07 | | N/A | |
Ten Years | | 4.86 | | 4.12 | | N/A | |
Life of Fund† | | 4.88 | | 5.54 | | 0.99 | %* |
SEC Average Annual Total Returns (including sales charge or applicable CDSC) | | | | | | | |
Six Months | | -3.10 | % | -3.56 | % | N/A | |
One Year | | -1.21 | | -2.01 | | N/A | |
Five Years | | 3.78 | | 3.73 | | N/A | |
Ten Years | | 4.35 | | 4.12 | | N/A | |
Life of Fund† | | 4.46 | | 5.54 | | -0.01 | %* |
†Inception date: Class A: 12/13/93; Class B: 7/25/91; Class C: 12/16/05
*Returns shown are cumulative since inception of share class.
(1) Average annual total returns do not include the 4.75% maximum sales charge for Class A shares or the applicable contingent deferred sales charges (CDSC) for Class B and Class C shares. If sales charges were deducted, returns would be lower. SEC average annual total returns for Class A reflect the maximum 4.75% sales charge. SEC returns for Class B reflect applicable CDSC based on the following schedule: 5% - 1st and 2nd years; 4% - 3rd year; 3% - 4th year; 2% - 5th year; 1% - 6th year. SEC returns for Class C reflect a 1% CDSC for the first year.
Index Performance(2) | | | |
Lehman Brothers Municipal Bond Index | | | |
Six Months | | 1.33 | % |
One Year | | 2.83 | |
Five Years | | 5.44 | |
Ten Years | | 5.66 | |
Lipper Averages(3) | | | |
Lipper Arizona Municipal Debt Funds Classification | | | |
Six Months | | 0.95 | % |
One Year | | 1.75 | |
Five Years | | 4.45 | |
Ten Years | | 4.53 | |
Distribution Rates(4) | | Class A | | Class B | | Class C | |
| | | | | | | |
Distribution Rate | | 4.42 | % | 3.66 | % | 3.66 | % |
Taxable-Equivalent Distribution Rate(5) | | 7.16 | | 5.93 | | 5.93 | |
SEC 30-day Yield(6) | | 3.46 | | 2.88 | | 2.89 | |
Taxable-Equivalent SEC 30-day Yield(5) | | 5.61 | | 4.67 | | 4.68 | |
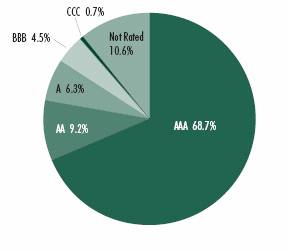
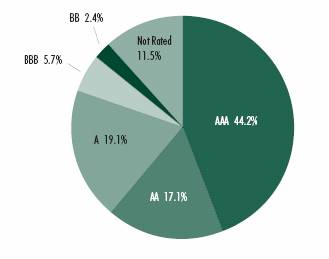
Rating Distribution(7),(8)
By total investments
Fund Statistics(8) | | | |
| | | |
• Number of Issues: | | 65 | |
• Average Maturity: | | 18.8 years | |
• Effective Maturity: | | 9.5 years | |
• Average Rating: | | AA | |
• Average Call: | | 7.6 years | |
• Average Dollar Price: | | $ | 99.38 | |
| | | | |
Past performance is no guarantee of future results. Returns are historical and are calculated by determining the percentage change in net asset value or offering price (as applicable) with all distributions reinvested. Investment return and principal value will fluctuate so that shares, when redeemed, may be worth more or less than their original cost. Performance is for the stated time period only; due to market volatility, the Fund’s current performance may be lower or higher than the quoted return. For performance as of the most recent month end, please refer to www.eatonvance.com.
(2) It is not possible to invest directly in an Index. The Index’s total return does not reflect the expenses that would have been incurred if an investor individually purchased or sold the securities represented in the Index. Index performance is available as of month end only. (3) The Lipper Averages are the average total returns of the funds that are in the same Lipper Classification as the Fund. It is not possible to invest in a Lipper Classification. Lipper Classifications may include insured and uninsured funds, as well as leveraged and unleveraged funds. The Lipper Arizona Municipal Debt Funds Classification contained 32, 32, 32, and 23 funds for the 6-month, 1-year, 5-year and 10-year time periods, respectively. Lipper Averages are available as of month end only. (4) The Fund’s distribution rate represents actual distributions paid to shareholders and is calculated by dividing the last distribution per share (annualized) by the net asset value. (5) Taxable-equivalent figure assumes a maximum 38.28% combined federal and state income tax rate. A lower tax rate would result in lower tax-equivalent figures. (6) The Fund’s SEC yield is calculated by dividing the net investment income per share for the 30-day period by the offering price at the end of the period and annualizing the result. (7) As of 1/31/06. Rating Distribution is determined by dividing the total market value of the issues by the total investments of the Fund. (8) Portfolio information may not be representative of the Fund’s current or future investments and may change due to active management.
3
Eaton Vance Colorado Municipals Funds as of January 31, 2006
MARKET RECAP
Performance(1) | | Class A | | Class B | |
| | | | | |
Average Annual Total Returns (at net asset value) | | | | | |
Six Months | | 2.09 | % | 1.71 | % |
One Year | | 3.74 | | 3.03 | |
Five Years | | 5.29 | | 4.54 | |
Ten Years | | 5.17 | | 4.41 | |
Life of Fund† | | 4.91 | | 5.10 | |
SEC Average Annual Total Returns (including sales charge or applicable CDSC) | | | | | |
Six Months | | -2.73 | % | -3.28 | % |
One Year | | -1.22 | | -1.94 | |
Five Years | | 4.28 | | 4.21 | |
Ten Years | | 4.66 | | 4.41 | |
Life of Fund† | | 4.49 | | 5.10 | |
†Inception date: Class A: 12/10/93; Class B: 8/25/92
(1) Average annual total returns do not include the 4.75% maximum sales charge for Class A shares or the applicable contingent deferred sales charges (CDSC) for Class B shares. If sales charges were deducted, returns would be lower. SEC average annual total returns for Class A reflect the maximum 4.75% sales charge. SEC returns for Class B reflect applicable CDSC based on the following schedule: 5% - 1st and 2nd years; 4% - 3rd year; 3% - 4th year; 2% - 5th year; 1% - 6th year.
Index Performance(2) | | | |
| | | |
Lehman Brothers Municipal Bond Index | | | |
Six Months | | 1.33 | % |
One Year | | 2.83 | |
Five Years | | 5.44 | |
Ten Years | | 5.66 | |
Lipper Averages(3) | | | |
| | | |
Lipper Colorado Municipal Debt Funds Classification | | | |
Six Months | | 1.18 | % |
One Year | | 2.18 | |
Five Years | | 4.89 | |
Ten Years | | 4.95 | |
Distribution Rates(4) | | Class A | | Class B | |
| | | | | |
Distribution Rate | | 4.29 | % | 3.53 | % |
Taxable-Equivalent Distribution Rate (5) | | 6.92 | | 5.69 | |
SEC 30-day Yield (6) | | 3.74 | | 3.18 | |
Taxable-Equivalent SEC 30-day Yield (5) | | 6.03 | | 5.13 | |
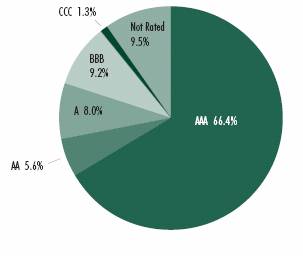
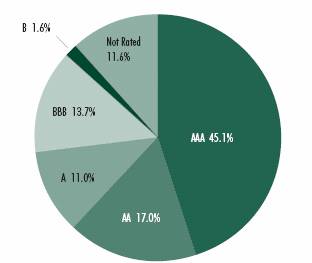
Rating Distribution(7),(8)
By total investments
Fund Statistics(8) | | | |
| | | |
• Number of Issues: | | 42 | |
| | | |
• Average Maturity: | | 19.5 years | |
| | | |
• Effective Maturity: | | 9.8 years | |
| | | |
• Average Rating: | | AA | |
| | | |
• Average Call: | | 8.2 years | |
| | | |
• Average Dollar Price: | | $ | 96.25 | |
| | | | |
Past performance is no guarantee of future results. Returns are historical and are calculated by determining the percentage change in net asset value or offering price (as applicable) with all distributions reinvested. Investment return and principal value will fluctuate so that shares, when redeemed, may be worth more or less than their original cost. Performance is for the stated time period only; due to market volatility, the Fund’s current performance may be lower or higher than the quoted return. For performance as of the most recent month end, please refer to www.eatonvance.com.
(2) It is not possible to invest directly in an Index. The Index’s total return does not reflect the expenses that would have been incurred if an investor individually purchased or sold the securities represented in the Index. Index performance is available as of month end only. (3) The Lipper Averages are the average total returns of the funds that are in the same Lipper Classification as the Fund. It is not possible to invest in a Lipper Classification. Lipper Classifications may include insured and uninsured funds, as well as leveraged and unleveraged funds. The Lipper Colorado Municipal Debt Funds Classification contained 27, 27, 26, and 17 funds for the 6-month, 1-year, 5-year and 10-year time periods, respectively. Lipper Averages are available as of month end only. (4) The Fund’s distribution rate represents actual distributions paid to shareholders and is calculated by dividing the last distribution per share (annualized) by the net asset value. (5) Taxable-equivalent figure assumes a maximum 38.01% combined federal and state income tax rate. A lower tax rate would result in lower tax-equivalent figures. (6) The Fund’s SEC yield is calculated by dividing the net investment income per share for the 30-day period by the offering price at the end of the period and annualizing the result. (7) As of 1/31/06. Rating Distribution is determined by dividing the total market value of the issues by the total investments of the Fund. (8) Portfolio information may not be representative of the Fund’s current or future investments and may change due to active management.
4
Eaton Vance Connecticut Municipals Fund as of January 31, 2006
MARKET RECAP
Performance(1) | | Class A | | Class B | |
Average Annual Total Returns (at net asset value) | | | | | |
Six Months | | 1.34 | % | 0.95 | % |
One Year | | 2.35 | | 1.66 | |
Five Years | | 4.74 | | 3.99 | |
Ten Years | | 5.05 | | 4.24 | |
Life of Fund† | | 5.63 | | 4.91 | |
SEC Average Annual Total Returns (including sales charge or applicable CDSC) | | | | | |
Six Months | | -3.46 | % | -4.01 | % |
One Year | | -2.53 | | -3.25 | |
Five Years | | 3.72 | | 3.65 | |
Ten Years | | 4.53 | | 4.24 | |
Life of Fund† | | 5.20 | | 4.91 | |
†Inception date: Class A: 4/19/94; Class B: 5/1/92
(1) Average annual total returns do not include the 4.75% maximum sales charge for Class A shares or the applicable contingent deferred sales charges (CDSC) for Class B shares. If sales charges were deducted, returns would be lower. SEC average annual total returns for Class A reflect the maximum 4.75% sales charge. SEC returns for Class B reflect applicable CDSC based on the following schedule: 5% - 1st and 2nd years; 4% - 3rd year; 3% - 4th year; 2% - 5th year; 1% - 6th year.
Index Performance(2) | | | |
| | | |
Lehman Brothers Municipal Bond Index | | | |
Six Months | | 1.33 | % |
One Year | | 2.83 | |
Five Years | | 5.44 | |
Ten Years | | 5.66 | |
Lipper Averages(3) | | | |
| | | |
Lipper Connecticut Municipal Debt Funds Classification | | | |
Six Months | | 0.90 | % |
One Year | | 1.75 | |
Five Years | | 4.59 | |
Ten Years | | 4.78 | |
Distribution Rates(4) | | Class A | | Class B | |
Distribution Rate | | 4.13 | % | 3.37 | % |
Taxable-Equivalent Distribution Rate (5) | | 6.69 | | 5.46 | |
SEC 30-day Yield (6) | | 3.45 | | 2.88 | |
Taxable-Equivalent SEC 30-day Yield (5) | | 5.59 | | 4.66 | |
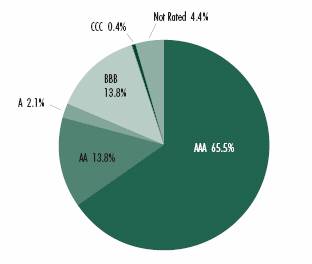
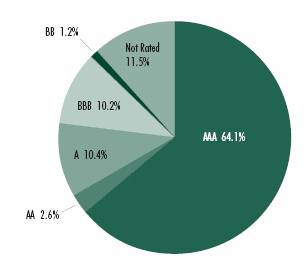
Rating Distribution(7),(8)
By total investments
Fund Statistics (8) | | | |
| | | |
• Number of Issues: | | 75 | |
| | | |
• Average Maturity: | | 17.9 years | |
| | | |
• Effective Maturity: | | 9.5 years | |
| | | |
• Average Rating: | | AA+ | |
| | | |
• Average Call: | | 8.7 years | |
| | | |
• Average Dollar Price: | | $ | 106.85 | |
| | | | |
Past performance is no guarantee of future results. Returns are historical and are calculated by determining the percentage change in net asset value or offering price (as applicable) with all distributions reinvested. Investment return and principal value will fluctuate so that shares, when redeemed, may be worth more or less than their original cost. Performance is for the stated time period only; due to market volatility, the Fund’s current performance may be lower or higher than the quoted return. For performance as of the most recent month end, please refer to www.eatonvance.com.
(2) It is not possible to invest directly in an Index. The Index’s total return does not reflect the expenses that would have been incurred if an investor individually purchased or sold the securities represented in the Index. Index performance is available as of month end only. (3) The Lipper Averages are the average total returns of the funds that are in the same Lipper Classification as the Fund. It is not possible to invest in a Lipper Classification. Lipper Classifications may include insured and uninsured funds, as well as leveraged and unleveraged funds. The Lipper Connecticut Municipal Debt Funds Classification contained 22, 22, 21, and 15 funds for the 6-month, 1-year, 5-year and 10-year time periods, respectively. Lipper Averages are available as of month end only. (4) The Fund’s distribution rate represents actual distributions paid to shareholders and is calculated by dividing the last distribution per share (annualized) by the net asset value. (5) Taxable-equivalent figure assumes a maximum 38.25% combined federal and state income tax rate. A lower tax rate would result in lower tax-equivalent figures. (6) The Fund’s SEC yield is calculated by dividing the net investment income per share for the 30-day period by the offering price at the end of the period and annualizing the result. (7) As of 1/31/06. Rating Distribution is determined by dividing the total market value of the issues by the total investments of the Fund. (8) Portfolio information may not be representative of the Fund’s current or future investments and may change due to active management.
5
Eaton Vance Michigan Municipals Fund as of January 31, 2006
MARKET RECAP
Performance(1) | | Class A | | Class B | |
| | | | | |
Average Annual Total Returns (at net asset value) | | | | | |
Six Months | | 1.33 | % | 1.00 | % |
One Year | | 3.28 | | 2.49 | |
Five Years | | 5.04 | | 4.28 | |
Ten Years | | 4.87 | | 4.19 | |
Life of Fund† | | 4.70 | | 5.31 | |
| | | | | |
SEC Average Annual Total Returns (including sales charge or applicable CDSC) | | | | | |
Six Months | | -3.48 | % | -3.97 | % |
One Year | | -1.61 | | -2.45 | |
Five Years | | 4.03 | | 3.94 | |
Ten Years | | 4.36 | | 4.19 | |
Life of Fund† | | 4.28 | | 5.31 | |
†Inception date: Class A: 12/7/93; Class B: 4/19/91
(1) Average annual total returns do not include the 4.75% maximum sales charge for Class A shares or the applicable contingent deferred sales charges (CDSC) for Class B shares. If sales charges were deducted, returns would be lower. SEC average annual total returns for Class A reflect the maximum 4.75% sales charge. SEC returns for Class B reflect applicable CDSC based on the following schedule: 5% - 1st and 2nd years; 4% - 3rd year; 3% - 4th year; 2% - 5th year; 1% - 6th year.
Index Performance (2) | | | |
| | | |
Lehman Brothers Municipal Bond Index | | | |
Six Months | | 1.33 | % |
One Year | | 2.83 | |
Five Years | | 5.44 | |
Ten Years | | 5.66 | |
Lipper Averages(3) | | | |
| | | |
Lipper Michigan Municipal Debt Funds Classification | | | |
Six Months | | 0.73 | % |
One Year | | 1.63 | |
Five Years | | 4.41 | |
Ten Years | | 4.62 | |
Distribution Rates(4) | | Class A | | Class B | |
| | | | | |
Distribution Rate | | 4.24 | % | 3.50 | % |
Taxable-Equivalent Distribution Rate (5) | | 6.79 | | 5.60 | |
SEC 30-day Yield (6) | | 3.63 | | 3.06 | |
Taxable-Equivalent SEC 30-day Yield (5) | | 5.81 | | 4.90 | |
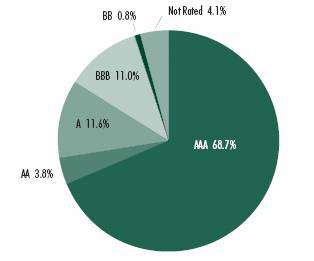
Rating Distribution(7),(8)
By total investments
Fund Statistics(8)
• Number of Issues: | | 50 | |
• Average Maturity: | | 20.3 years | |
• Effective Maturity: | | 8.4 years | |
• Average Rating: | | AA | |
• Average Call: | | 8.2 years | |
• Average Dollar Price: | | $ | 101.07 | |
| | | | |
Past performance is no guarantee of future results. Returns are historical and are calculated by determining the percentage change in net asset value or offering price (as applicable) with all distributions reinvested. Investment return and principal value will fluctuate so that shares, when redeemed, may be worth more or less than their original cost. Performance is for the stated time period only; due to market volatility, the Fund’s current performance may be lower or higher than the quoted return. For performance as of the most recent month end, please refer to www.eatonvance.com.
(2) It is not possible to invest directly in an Index. The Index’s total return does not reflect the expenses that would have been incurred if an investor individually purchased or sold the securities represented in the Index. Index performance is available as of month end only. (3) The Lipper Averages are the average total returns of the funds that are in the same Lipper Classification as the Fund. It is not possible to invest in a Lipper Classification. Lipper Classifications may include insured and uninsured funds, as well as leveraged and unleveraged funds. The Lipper Michigan Municipal Debt Funds Classification contained 38, 37, 37, and 30 funds for the 6-month, 1-year, 5-year and 10-year time periods, respectively. Lipper Averages are available as of month end only. (4) The Fund’s distribution rate represents actual distributions paid to shareholders and is calculated by dividing the last distribution per share (annualized) by the net asset value. (5) Taxable-equivalent figure assumes a maximum 37.54% combined federal and state income tax rate. A lower tax rate would result in lower tax-equivalent figures. (6) The Fund’s SEC yield is calculated by dividing the net investment income per share for the 30-day period by the offering price at the end of the period and annualizing the result. (7) As of 1/31/06. Rating Distribution is determined by dividing the total market value of the issues by the total investments of the Fund. (8) Portfolio information may not be representative of the Fund’s current or future investments and may change due to active management.
6
Eaton Vance Minnesota Municipals Fund as of January 31, 2006
MARKET RECAP
Performance(1) | | Class A | | Class B | | Class C | |
| | | | | | | |
Average Annual Total Returns (at net asset value) | | | | | | | |
Six Months | | 2.05 | % | 1.68 | % | N/A | |
One Year | | 4.02 | | 3.19 | | N/A | |
Five Years | | 4.89 | | 4.11 | | N/A | |
Ten Years | | 4.76 | | 3.96 | | N/A | |
Life of Fund† | | 4.58 | | 4.80 | | 1.13 | %* |
| | | | | | | |
SEC Average Annual Total Returns (including sales charge or applicable CDSC) | | | | | | | |
Six Months | | -2.75 | % | -3.31 | % | N/A | |
One Year | | -0.96 | | -1.78 | | N/A | |
Five Years | | 3.86 | | 3.77 | | N/A | |
Ten Years | | 4.25 | | 3.96 | | N/A | |
Life of Fund† | | 4.16 | | 4.80 | | 0.13 | %* |
†Inception date: Class A: 12/9/93; Class B: 7/29/91; Class C: 12/21/05
*Returns shown are cumulative since inception of share class.
(1) Average annual total returns do not include the 4.75% maximum sales charge for Class A shares or the applicable contingent deferred sales charges (CDSC) for Class B and Class C shares. If sales charges were deducted, returns would be lower. SEC average annual total returns for Class A reflect the maximum 4.75% sales charge. SEC returns for Class B reflect applicable CDSC based on the following schedule: 5% - 1st and 2nd years; 4% - 3rd year; 3% - 4th year; 2% - 5th year; 1% - 6th year. SEC returns for Class C reflect a 1% CDSC for the first year.
Index Performance(2) | | | |
| | | |
Lehman Brothers Municipal Bond Index | | | |
Six Months | | 1.33 | % |
One Year | | 2.83 | |
Five Years | | 5.44 | |
Ten Years | | 5.66 | |
Lipper Averages(3) | | | |
| | | |
Lipper Minnesota Municipal Debt Funds Classification | | | |
Six Months | | 1.02 | % |
One Year | | 2.25 | |
Five Years | | 4.72 | |
Ten Years | | 4.57 | |
Distribution Rates(4) | | Class A | | Class B | | Class C | |
| | | | | | | |
Distribution Rate | | 4.41 | % | 3.66 | % | 3.66 | % |
Taxable-Equivalent Distribution Rate (5) | | 7.36 | | 6.11 | | 6.11 | |
SEC 30-day Yield (6) | | 3.82 | | 3.26 | | 2.93 | |
Taxable-Equivalent SEC 30-day Yield (5) | | 6.38 | | 5.44 | | 4.89 | |
Rating Distribution(7),(8)
By total investments
Fund Statistics(8)
• Number of Issues: | | 39 | |
• Average Maturity: | | 21.2 years | |
• Effective Maturity: | | 7.4 years | |
• Average Rating: | | AA- | |
• Average Call: | | 6.5 years | |
• Average Dollar Price: | | $ | 95.94 | |
| | | | |
Past performance is no guarantee of future results. Returns are historical and are calculated by determining the percentage change in net asset value or offering price (as applicable) with all distributions reinvested. Investment return and principal value will fluctuate so that shares, when redeemed, may be worth more or less than their original cost. Performance is for the stated time period only; due to market volatility, the Fund’s current performance may be lower or higher than the quoted return. For performance as of the most recent month end, please refer to www.eatonvance.com.
(2) It is not possible to invest directly in an Index. The Index’s total return does not reflect the expenses that would have been incurred if an investor individually purchased or sold the securities represented in the Index. Index performance is available as of month end only. (3) The Lipper Averages are the average total returns of the funds that are in the same Lipper Classification as the Fund. It is not possible to invest in a Lipper Classification. Lipper Classifications may include insured and uninsured funds, as well as leveraged and unleveraged funds. The Lipper Minnesota Municipal Debt Funds Classification contained 51, 49, 45, and 38 funds for the 6-month, 1-year, 5-year and 10-year time periods, respectively. Lipper Averages are available as of month end only. (4) The Fund’s distribution rate represents actual distributions paid to shareholders and is calculated by dividing the last distribution per share (annualized) by the net asset value. (5) Taxable-equivalent figure assumes a maximum 40.10% combined federal and state income tax rate. A lower tax rate would result in lower tax-equivalent figures. (6) The Fund’s SEC yield is calculated by dividing the net investment income per share for the 30-day period by the offering price at the end of the period and annualizing the result. (7) As of 1/31/06. Rating Distribution is determined by dividing the total market value of the issues by the total investments of the Fund. (8) Portfolio information may not be representative of the Fund’s current or future investments and may change due to active management.
7
Eaton Vance New Jersey Municipals Fund as of January 31, 2006
MARKET RECAP
Performance(1) | | Class A | | Class B | | Class C | |
| | | | | | | |
Average Annual Total Returns (at net asset value) | | | | | | | |
Six Months | | 1.45 | % | 1.01 | % | N/A | |
One Year | | 3.95 | | 3.10 | | N/A | |
Five Years | | 5.63 | | 4.86 | | N/A | |
Ten Years | | 5.36 | | 4.55 | | N/A | |
Life of Fund† | | 5.84 | | 5.59 | | 1.41 | %* |
| | | | | | | |
SEC Average Annual Total Returns (including sales charge or applicable CDSC) | | | | | | | |
Six Months | | -3.34 | % | -3.95 | % | N/A | |
One Year | | -0.98 | | -1.87 | | N/A | |
Five Years | | 4.60 | | 4.53 | | N/A | |
Ten Years | | 4.85 | | 4.55 | | N/A | |
Life of Fund† | | 5.40 | | 5.59 | | 0.41 | %* |
†Inception date: Class A: 4/13/94; Class B: 1/8/91; Class C: 12/14/05
*Returns shown are cumulative since inception of share class.
(1) Average annual total returns do not include the 4.75% maximum sales charge for Class A shares or the applicable contingent deferred sales charges (CDSC) for Class B and Class C shares. If sales charges were deducted, returns would be lower. SEC average annual total returns for Class A reflect the maximum 4.75% sales charge. SEC returns for Class B reflect applicable CDSC based on the following schedule: 5% - 1st and 2nd years; 4% - 3rd year; 3% - 4th year; 2% - 5th year; 1% - 6th year. SEC returns for Class C reflect a 1% CDSC for the first year.
Index Performance(2) | | | |
| | | |
Lehman Brothers Municipal Bond Index | | | |
Six Months | | 1.33 | % |
One Year | | 2.83 | |
Five Years | | 5.44 | |
Ten Years | | 5.66 | |
Lipper Averages(3) | | | |
| | | |
Lipper New Jersey Municipal Debt Funds Classification | | | |
Six Months | | 0.95 | % |
One Year | | 2.45 | |
Five Years | | 4.67 | |
Ten Years | | 4.71 | |
Distribution Rates(4) | | Class A | | Class B | | Class C | |
| | | | | | | |
Distribution Rate | | 4.42 | % | 3.68 | % | 3.68 | % |
Taxable-Equivalent Distribution Rate (5) | | 7.47 | | 6.22 | | 6.22 | |
SEC 30-day Yield (6) | | 4.11 | | 3.57 | | 3.46 | |
Taxable-Equivalent SEC 30-day Yield (5) | | 6.95 | | 6.03 | | 5.85 | |
Rating Distribution(7),(8)
By total investments
Fund Statistics(8)
• Number of Issues: | | 86 | |
• Average Maturity: | | 27.7 years | |
• Effective Maturity: | | 11.9 years | |
• Average Rating: | | AA- | |
• Average Call: | | 10.6 years | |
• Average Dollar Price: | | $ | 96.63 | |
| | | | |
Past performance is no guarantee of future results. Returns are historical and are calculated by determining the percentage change in net asset value or offering price (as applicable) with all distributions reinvested. Investment return and principal value will fluctuate so that shares, when redeemed, may be worth more or less than their original cost. Performance is for the stated time period only; due to market volatility, the Fund’s current performance may be lower or higher than the quoted return. For performance as of the most recent month end, please refer to www.eatonvance.com.
(2) It is not possible to invest directly in an Index. The Index’s total return does not reflect the expenses that would have been incurred if an investor individually purchased or sold the securities represented in the Index. Index performance is available as of month end only. (3) The Lipper Averages are the average total returns of the funds that are in the same Lipper Classification as the Fund. It is not possible to invest in a Lipper Classification. Lipper Classifications may include insured and uninsured funds, as well as leveraged and unleveraged funds. The Lipper New Jersey Municipal Debt Funds Classification contained 57, 56, 50, and 41 funds for the 6-month, 1-year, 5-year and 10-year time periods, respectively. Lipper Averages are available as of month end only. (4) The Fund’s distribution rate represents actual distributions paid to shareholders and is calculated by dividing the last distribution per share (annualized) by the net asset value. (5) Taxable-equivalent figure assumes a maximum 40.83% combined federal and state income tax rate. A lower tax rate would result in lower tax-equivalent figures. (6) The Fund’s SEC yield is calculated by dividing the net investment income per share for the 30-day period by the offering price at the end of the period and annualizing the result. (7) As of 1/31/06. Rating Distribution is determined by dividing the total market value of the issues by the total investments of the Fund. (8) Portfolio information may not be representative of the Fund’s current or future investments and may change due to active management.
8
Eaton Vance Pennsylvania Municipals Fund as of January 31, 2006
MARKET RECAP
Performance | | Class A | | Class B | | Class C | |
| | | | | | | |
Average Annual Total Returns (at net asset value) | | | | | | | |
Six Months | | 2.27 | % | 1.89 | % | N/A | |
One Year | | 4.44 | | 3.66 | | N/A | |
Five Years | | 5.63 | | 4.88 | | N/A | |
Ten Years | | 5.04 | | 4.23 | | N/A | |
Life of Fund† | | 5.57 | | 5.36 | | 0.26 | %* |
| | | | | | | |
SEC Average Annual Total Returns (including sales charge or applicable CDSC) | | | | | | | |
Six Months | | -2.54 | % | -3.11 | % | N/A | |
One Year | | -0.56 | | -1.32 | | N/A | |
Five Years | | 4.60 | | 4.55 | | N/A | |
Ten Years | | 4.53 | | 4.23 | | N/A | |
Life of Fund† | | 5.13 | | 5.36 | | -0.74 | %* |
† Inception date: Class A: 6/1/94; Class B: 1/8/91; Class C: 1/13/06
* Returns shown are cumulative since inception of share class.
(1) Average annual total returns do not include the 4.75% maximum sales charge for Class A shares or the applicable contingent deferred sales charges (CDSC) for Class B and Class C shares. If sales charges were deducted, returns would be lower. SEC average annual total returns for Class A reflect the maximum 4.75% sales charge. SEC returns for Class B reflect applicable CDSC based on the following schedule: 5% - 1st and 2nd years; 4% - 3rd year; 3% - 4th year; 2% - 5th year; 1% - 6th year. SEC returns for Class C reflect a 1% CDSC for the first year.
Index Performance(2) | | | |
| | | |
Lehman Brothers Municipal Bond Index | | | |
Six Months | | 1.33 | % |
One Year | | 2.83 | |
Five Years | | 5.44 | |
Ten Years | | 5.66 | |
Lipper Averages(3) | | | |
| | | |
Lipper Pennsylvania Municipal Debt Funds Classification | | | |
Six Months | | 1.04 | % |
One Year | | 2.38 | |
Five Years | | 4.75 | |
Ten Years | | 4.65 | |
Distribution Rates(4) | | Class A | | Class B | | Class C* | |
| | | | | | | |
Distribution Rate | | 4.64 | % | 3.88 | % | — | |
Taxable-Equivalent Distribution Rate (5) | | 7.37 | | 6.16 | | — | |
SEC 30-day Yield (6) | | 4.02 | | 3.48 | | — | |
Taxable-Equivalent SEC 30-day Yield (5) | | 6.38 | | 5.52 | | — | |
* Not available as of 1/31/06.
Rating Distribution(7),(8)
By total investments
Fund Statistics(8)
• Number of Issues: | | 100 | |
• Average Maturity: | | 20.9 years | |
• Effective Maturity: | | 9.2 years | |
• Average Rating: | | AA | |
• Average Call: | | 8.3 years | |
• Average Dollar Price: | | $ | 98.02 | |
| | | | |
Past performance is no guarantee of future results. Returns are historical and are calculated by determining the percentage change in net asset value or offering price (as applicable) with all distributions reinvested. Investment return and principal value will fluctuate so that shares, when redeemed, may be worth more or less than their original cost. Performance is for the stated time period only; due to market volatility, the Fund’s current performance may be lower or higher than the quoted return. For performance as of the most recent month end, please refer to www.eatonvance.com.
(2) It is not possible to invest directly in an Index. The Index’s total return does not reflect the expenses that would have been incurred if an investor individually purchased or sold the securities represented in the Index. Index performance is available as of month end only. (3) The Lipper Averages are the average total returns of the funds that are in the same Lipper Classification as the Fund. It is not possible to invest in a Lipper Classification. Lipper Classifications may include insured and uninsured funds, as well as leveraged and unleveraged funds. The Lipper Pennsylvania Municipal Debt Funds Classification contained 61, 61, 60, and 53 funds for the 6-month, 1-year, 5-year and 10-year time periods, respectively. Lipper Averages are available as of month end only. (4) The Fund’s distribution rate represents actual distributions paid to shareholders and is calculated by dividing the last distribution per share (annualized) by the net asset value. (5) Taxable-equivalent figure assumes a maximum 37.00% combined federal and state income tax rate. A lower tax rate would result in lower tax-equivalent figures. (6) The Fund’s SEC yield is calculated by dividing the net investment income per share for the 30-day period by the offering price at the end of the period and annualizing the result. (7) As of 1/31/06. Rating Distribution is determined by dividing the total market value of the issues by the total investments of the Fund. (8) Portfolio information may not be representative of the Fund’s current or future investments and may change due to active management.
9
Eaton Vance Municipals Funds as of January 31, 2006
FUND EXPENSES
Example: As a shareholder of a Fund, you incur two types of costs: (1) transaction costs, including sales charges (loads) on purchases and redemption fees (if applicable); and (2) ongoing costs, including management fees; distribution or service fees; and other Fund expenses. This Example is intended to help you understand your ongoing costs (in dollars) of investing in a Fund and to compare these costs with the ongoing costs of investing in other mutual funds. The Example is based on an investment of $1,000 invested at the beginning of the period and held for the entire period (August 1, 2005 – January 31, 2006).
Actual Expenses: The first section of each table below provides information about actual account values and actual expenses. You may use the information in this line, together with the amount you invested, to estimate the expenses that you paid over the period. Simply divide your account value by $1,000 (for example, an $8,600 account value divided by $1,000 = 8.6), then multiply the result by the number in the first line under the heading entitled “Expenses Paid During Period” to estimate the expenses you paid on your account during this period.
Hypothetical Example for Comparison Purposes: The second section of each table below provides information about hypothetical account values and hypothetical expenses based on a Fund’s actual expense ratio and an assumed rate of return of 5% per year (before expenses), which is not the actual return of the Fund. The hypothetical account values and expenses may not be used to estimate the actual ending account balance or expenses you paid for the period. You may use this information to compare the ongoing costs of investing in the Funds and other funds. To do so, compare this 5% hypothetical example with the 5% hypothetical examples that appear in the shareholder reports of the other funds.
Please note that the expenses shown in the table are meant to highlight your ongoing costs only and do not reflect any transactional costs, such as sales charges (loads) or redemption fees (if applicable). Therefore, the second section of the table is useful in comparing ongoing costs only, and will not help you determine the relative total costs of owning different funds. In addition, if these transactional costs were included, your costs would have been higher.
Eaton Vance Arizona Municipals Fund
| | | | | |
| | Beginning Account Value | | Ending Account Value | | Expenses Paid During Period* | |
| | (8/1/05) | | (1/31/06) | | (8/1/05 - 1/31/06) | |
Actual | | | | | | | |
Class A | | $ | 1,000.00 | | $ | 1,017.50 | | $ | 3.71 | |
Class B | | $ | 1,000.00 | | $ | 1,014.20 | | $ | 7.51 | |
Hypothetical | | | | | | | |
(5% return per year before expenses) | | | | | | | |
Class A | | $ | 1,000.00 | | $ | 1,021.50 | | $ | 3.72 | |
Class B | | $ | 1,000.00 | | $ | 1,017.70 | | $ | 7.53 | |
* Expenses are equal to the Fund’s annualized expense ratio of 0.73% for Class A shares 1.48% for Class B shares, and 1.48% for Class C shares multiplied by the average account value over the period, multiplied by 184/365 (to reflect the one-half year period). The Example assumes that the $1,000 was invested at the net asset value per share determined at the close of business on July 31, 2005. Class C is not reflected because it commenced operations after August 1, 2005.
Eaton Vance Colorado Municipals Fund
| | Beginning Account Value | | Ending Account Value | | Expenses Paid During Period* | |
| | (8/1/05) | | (1/31/06) | | (8/1/05 - 1/31/06) | |
Actual | | | | | | | |
Class A | | $ | 1,000.00 | | $ | 1,020.90 | | $ | 3.67 | |
Class B | | $ | 1,000.00 | | $ | 1,017.10 | | $ | 7.47 | |
Hypothetical | | | | | | | |
(5% return per year before expenses) | | | | | | | |
Class A | | $ | 1,000.00 | | $ | 1,021.60 | | $ | 3.67 | |
Class B | | $ | 1,000.00 | | $ | 1,017.80 | | $ | 7.48 | |
* Expenses are equal to the Fund’s annualized expense ratio of 0.72% for Class A shares and 1.47% for Class B shares multiplied by the average account value over the period, multiplied by 184/365 (to reflect the one-half year period). The Example assumes that the $1,000 was invested at the net asset value per share determined at the close of business on July 31, 2005.
10
Eaton Vance Connecticut Municipals Fund
| | Beginning Account Value | | Ending Account Value | | Expenses Paid During Period* | |
| | (8/1/05) | | (1/31/06) | | (8/1/05 - 1/31/06) | |
Actual | | | | | | | |
Class A | | $ | 1,000.00 | | $ | 1,013.40 | | $ | 3.86 | |
Class B | | $ | 1,000.00 | | $ | 1,009.50 | | $ | 7.65 | |
| | | | | | | |
Hypothetical | | | | | | | |
(5% return per year before expenses) | | | | | | | |
Class A | | $ | 1,000.00 | | $ | 1,021.40 | | $ | 3.87 | |
Class B | | $ | 1,000.00 | | $ | 1.017.60 | | $ | 7.68 | |
* Expenses are equal to the Fund’s annualized expense ratio of 0.76% for Class A shares and 1.51% for Class B shares multiplied by the average account value over the period, multiplied by 184/365 (to reflect the one-half year period). The Example assumes that the $1,000 was invested at the net asset value per share determined at the close of business on July 31, 2005.
Eaton Vance Michigan Municipals Fund
| | Beginning Account Value | | Ending Account Value | | Expenses Paid During Period* | |
| | (8/1/05) | | (1/31/06) | | (8/1/05 - 1/31/06) | |
Actual | | | | | | | |
Class A | | $ | 1,000.00 | | $ | 1,013.30 | | $ | 4.01 | |
Class B | | $ | 1,000.00 | | $ | 1,010.00 | | $ | 7.80 | |
| | | | | | | | | | |
Hypothetical | | | | | | | |
(5% return per year before expenses) | | | | | | | |
Class A | | $ | 1,000.00 | | $ | 1,021.20 | | $ | 4.02 | |
Class B | | $ | 1,000.00 | | $ | 1,017.40 | | $ | 7.83 | |
* Expenses are equal to the Fund’s annualized expense ratio of 0.79% for Class A shares and 1.54% for Class B shares multiplied by the average account value over the period, multiplied by 184/365 (to reflect the one-half year period). The Example assumes that the $1,000 was invested at the net asset value per share determined at the close of business on July 31, 2005.
Eaton Vance Minnesota Municipals Fund
| | Beginning Account Value | | Ending Account Value | | Expenses Paid During Period* | |
| | (8/1/05) | | (1/31/06) | | (8/1/05 - 1/31/06) | |
Actual | | | | | | | |
Class A | | $ | 1,000.00 | | $ | 1,020.50 | | $ | 3.82 | |
Class B | | $ | 1,000.00 | | $ | 1,016.80 | | $ | 7.63 | |
| | | | | | | |
Hypothetical | | | | | | | |
(5% return per year before expenses) | | | | | | | |
Class A | | $ | 1,000.00 | | $ | 1,021.40 | | $ | 3.82 | |
Class B | | $ | 1,000.00 | | $ | 1,017.60 | | $ | 7.63 | |
* Expenses are equal to the Fund’s annualized expense ratio of 0.75% for Class A shares, 1.50% for Class B shares, and 1.50% for Class C shares multiplied by the average account value over the period, multiplied by 184/365 (to reflect the one-half year period). The Example assumes that the $1,000 was invested at the net asset value per share determined at the close of business on July 31, 2005. Class C is not reflected because it commenced operations after August 1, 2005.
11
Eaton Vance New Jersey Municipals Fund
| | Beginning Account Value | | Ending Account Value | | Expenses Paid During Period* | |
| | (8/1/05) | | (1/31/06) | | (8/1/05 - 1/31/06) | |
Actual | | | | | | | |
Class A | | $ | 1,000.00 | | $ | 1,014.50 | | $ | 4.01 | |
Class B | | $ | 1,000.00 | | $ | 1,010.10 | | $ | 7.80 | |
| | | | | | | | | | |
Hypothetical | | | | | | | |
(5% return per year before expenses) | | | | | | | |
Class A | | $ | 1,000.00 | | $ | 1,021.20 | | $ | 4.02 | |
Class B | | $ | 1,000.00 | | $ | 1,017.40 | | $ | 7.83 | |
* Expenses are equal to the Fund’s annualized expense ratio of 0.79% for Class A shares, 1.54% for Class B shares, and 1.54% for Class C shares multiplied by the average account value over the period, multiplied by 184/365 (to reflect the one-half year period). The Example assumes that the $1,000 was invested at the net asset value per share determined at the close of business on July 31, 2005. Class C is not reflected because it commenced operations after August 1, 2005.
Eaton Vance Pennsylvania Municipals Fund
| | Beginning Account Value | | Ending Account Value | | Expenses Paid During Period* | |
| | (8/1/05) | | (1/31/06) | | (8/1/05 - 1/31/06) | |
Actual | | | | | | | |
Class A | | $ | 1,000.00 | | $ | 1,022.70 | | $ | 4.13 | |
Class B | | $ | 1,000.00 | | $ | 1,018.90 | | $ | 7.94 | |
| | | | | | | | | | |
Hypothetical | | | | | | | |
(5% return per year before expenses) | | | | | | | |
Class A | | $ | 1,000.00 | | $ | 1,021.10 | | $ | 4.13 | |
Class B | | $ | 1,000.00 | | $ | 1,017.30 | | $ | 7.93 | |
* Expenses are equal to the Fund’s annualized expense ratio of 0.81% for Class A shares, 1.56% for Class B shares, and 1.56% for Class C shares multiplied by the average account value over the period, multiplied by 184/365 (to reflect the one-half year period). The Example assumes that the $1,000 was invested at the net asset value per share determined at the close of business on July 31, 2005. Class C is not reflected because it commenced operations after August 1, 2005.
12
Eaton Vance Arizona Municipals Fund as of January 31, 2006
PORTFOLIO OF INVESTMENTS (Unaudited)
| Tax-Exempt Investments — 99.4% | | | |
Principal Amount
(000's omitted) | |
Security | |
Value | |
| Education — 0.7% | | | |
| $ | 500 | | | Glendale, IDA, (Midwestern University),
5.75%, 5/15/21 | | $ | 539,035 | | |
| | | | | | | $ | 539,035 | | |
| Electric Utilities — 4.0% | | | |
| $ | 1,000 | | | Salt River, Agriculture Improvements and Power District,
5.00%, 1/1/31 | | $ | 1,035,110 | | |
| | 2,000 | | | Salt River, Project Agriculture Improvement and Power District,
4.75%, 1/1/35 | | | 2,021,220 | | |
| | | | | | | $ | 3,056,330 | | |
| Escrowed / Prerefunded — 14.4% | | | |
| $ | 1,250 | | | Maricopa County, IDA, (Place Five and The Greenery),
Escrowed to Maturity, 8.625%, 1/1/27 | | $ | 1,362,662 | | |
| | 7,500 | | | Maricopa County, Single Family, Escrowed to Maturity,
0.00%, 2/1/16 | | | 4,957,575 | | |
| | 6,500 | | | Phoenix, IDA, Single Family, Escrowed to Maturity,
0.00%, 12/1/14 | | | 4,538,560 | | |
| | | | | | | $ | 10,858,797 | | |
| General Obligations — 3.3% | | | |
| $ | 1,125 | | | Puerto Rico, 0.00%, 7/1/18 | | $ | 659,722 | | |
| | 1,600 | | | Tucson, 5.375%, 7/1/21 | | | 1,815,424 | | |
| | | | | | | $ | 2,475,146 | | |
| Health Care-Miscellaneous — 0.6% | | | |
| $ | 500 | | | Yavapai County, IDA, Health Care Institution,
(West Yavapai Guidance), 6.625%, 8/15/24 | | $ | 473,735 | | |
| | | | | | | $ | 473,735 | | |
| Hospital — 7.8% | | | |
| $ | 650 | | | Arizona Health Facilities Authority,
(John C. Lincoln Health Network), 5.75%, 12/1/32 | | $ | 685,321 | | |
| | 1,275 | | | Glendale, IDA, (John C. Lincoln Health Network),
5.00%, 12/1/28 | | | 1,275,408 | | |
| | 500 | | | Glendale, IDA, (John C. Lincoln Health Network),
5.00%, 12/1/37 | | | 495,635 | | |
| | 1,350 | | | Maricopa County, IDA, (Catholic Healthcare),
5.50%, 7/1/26 | | | 1,420,956 | | |
| | 1,000 | | | Scottsdale, IDA, (Scottsdale Healthcare),
5.70%, 12/1/21 | | | 1,074,840 | | |
| | 1,000 | | | Winslow, IDA, (Winslow Memorial Hospital),
5.50%, 6/1/22 | | | 954,310 | | |
| | | | | | | $ | 5,906,470 | | |
Principal Amount
(000's omitted) | |
Security | |
Value | |
| Housing — 0.9% | | | |
| $ | 835 | | | Maricopa County, IDA, (National Health Facilities II),
6.375%, 1/1/19(1) | | $ | 697,116 | | |
| | | | | | | $ | 697,116 | | |
| Industrial Development Revenue — 2.1% | | | |
| $ | 1,000 | | | Casa Grande, (Frito Lay, Inc.), 6.60%, 12/1/10 | | $ | 1,009,100 | | |
| | 650 | | | Phoenix Airport Authority, (America West Airlines, Inc.),
(AMT), 6.25%, 6/1/19 | | | 541,359 | | |
| | | | | | | $ | 1,550,459 | | |
| Insured-Education — 2.5% | | | |
| $ | 1,800 | | | Northern Arizona University, (Research Projects),
(AMBAC), 5.00%, 9/1/30 | | $ | 1,866,672 | | |
| | | | | | | $ | 1,866,672 | | |
| Insured-Electric Utilities — 6.8% | | | |
| $ | 1,500 | | | Maricopa County, Pollution Control Corp.,
(El Paso Electric Co.), (FGIC), 4.80%, 8/1/40 | | $ | 1,500,450 | | |
| | 1,205 | | | Mesa, Utility System, (FSA), 4.25%, 7/1/29 | | | 1,138,110 | | |
| | 635 | | | Pima County, IDA, (Tucson Electric Power Co.), (FSA),
7.25%, 7/15/10 | | | 644,112 | | |
| | 670 | | | Puerto Rico Electric Power Authority, (FSA),
Variable Rate, 9.27%, 7/1/29(2)(3) | | | 804,007 | | |
| | 500 | | | Puerto Rico Electric Power Authority, (MBIA),
5.00%, 7/1/32 | | | 518,950 | | |
| | 400 | | | Puerto Rico Electric Power Authority, (MBIA),
Variable Rate, 10.075%, 7/1/16(2)(3) | | | 565,240 | | |
| | | | | | | $ | 5,170,869 | | |
| Insured-Escrowed / Prerefunded — 10.1% | | | |
| $ | 1,000 | | | Maricopa County, IDA, (Samaritan Health Services),
(MBIA), Escrowed to Maturity, 7.00%, 12/1/16 | | $ | 1,234,630 | | |
| | 1,000 | | | Mesa IDA, (Discovery Health System), (MBIA),
Prerefunded to 1/1/10, 5.625%, 1/1/29 | | | 1,084,120 | | |
| | 1,000 | | | Pima County, IDA, (Carondolet Health Care Corp.),
(MBIA), Escrowed to Maturity, 5.25%, 7/1/11 | | | 1,080,260 | | |
| | 1,400 | | | Puerto Rico Infrastructure Financing Authority,
(AMBAC), Prerefunded to 1/1/08, Variable Rate,
8.225%, 7/1/28(2)(3) | | | 1,565,004 | | |
| | 1,000 | | | Puerto Rico Public Finance Corp., (AMBAC),
Prerefunded to 6/1/08, Variable Rate,
6.73%, 6/1/26(2)(4) | | | 1,091,810 | | |
| | 500 | | | Tucson Street and Highway Revenue, (FGIC),
Prerefunded to 7/1/10, 5.00%, 7/1/18 | | | 531,165 | | |
| | 1,000 | | | Yuma, IDA, (Yuma Regional Medical Center), (FSA),
Prerefunded to 8/1/11, 5.00%, 8/1/31 | | | 1,076,890 | | |
| | | | | | | $ | 7,663,879 | | |
See notes to financial statements
13
Eaton Vance Arizona Municipals Fund as of January 31, 2006
PORTFOLIO OF INVESTMENTS (Unaudited) CONT'D
Principal Amount
(000's omitted) | |
Security | |
Value | |
| Insured-General Obligations — 2.1% | | | |
| $ | 1,000 | | | Goodyear Community Facilities Utilities District No. 1,
(MBIA), 4.50%, 7/15/29 | | $ | 1,006,490 | | |
| | 500 | | | Puerto Rico, (FSA), Variable Rate, 9.42%, 7/1/27(2)(3) | | | 594,210 | | |
| | | | | | | $ | 1,600,700 | | |
| Insured-Hospital — 7.9% | | | |
| $ | 1,195 | | | Arizona Health Facilities Authority, (Arizona Healthcare
Systems), (FGIC), 5.50%, 6/1/15 | | $ | 1,332,222 | | |
| | 1,000 | | | Arizona Health Facilities Authority, (Northern Arizona
Healthcare System), (AMBAC), 4.75%, 10/1/30 | | | 1,007,640 | | |
| | 2,000 | | | Maricopa County, IDA, (Mayo Clinic Hospital),
(AMBAC), 5.25%, 11/15/37(5) | | | 2,080,780 | | |
| | 1,500 | | | Scottsdale, IDA, (Scottsdale Memorial Hospital),
(AMBAC), 6.125%, 9/1/17 | | | 1,586,610 | | |
| | | | | | | $ | 6,007,252 | | |
Insured-Lease Revenue / Certificates of
Participation — 4.0% | | | |
| $ | 1,000 | | | Arizona State University, (Research Infrastructure Projects),
(AMBAC), 5.00%, 9/1/30 | | $ | 1,037,040 | | |
| | 550 | | | Marana, Municipal Facilities, (Municipal Property Corp.),
(AMBAC), 5.00%, 7/1/28 | | | 570,493 | | |
| | 480 | | | Prescott Municipal Property Corp., (MBIA), 5.00%, 7/1/34 | | | 498,178 | | |
| | 290 | | | Puerto Rico Public Finance Corp., (AMBAC), Variable Rate,
8.88%, 6/1/24(2)(3) | | | 386,805 | | |
| | 500 | | | University of Arizona, COP, (AMBAC), 5.00%, 6/1/24 | | | 524,880 | | |
| | | | | | | $ | 3,017,396 | | |
| Insured-Special Tax Revenue — 5.2% | | | |
| $ | 1,000 | | | Arizona Tourism and Sports Authority, (Multipurpose
Stadium Facility), (MBIA), 5.00%, 7/1/25 | | $ | 1,049,650 | | |
| | 750 | | | Arizona Tourism and Sports Authority, (Multipurpose
Stadium Facility), (MBIA), 5.00%, 7/1/28 | | | 780,353 | | |
| | 200 | | | Phoenix Civic Improvement Corp., (Civic Plaza
Expansion Project), (FGIC), 4.25%, 7/1/30 | | | 188,528 | | |
| | 600 | | | Puerto Rico Infrastructure Financing Authority, (AMBAC),
5.50%, 7/1/28 | | | 704,334 | | |
| | 500 | | | San Luis, Civic Improvements Corp., (XLCA),
4.50%, 7/1/30 | | | 492,335 | | |
| | 750 | | | Scottsdale, (Municipal Property Corp.), (AMBAC),
4.50%, 7/1/35 | | | 737,355 | | |
| | | | | | | $ | 3,952,555 | | |
Principal Amount
(000's omitted) | |
Security | |
Value | |
| Insured-Transportation — 11.1% | | | |
| $ | 3,000 | | | Phoenix Civic Improvements Corp., Airport Revenue,
(FGIC), (AMT), 5.25%, 7/1/27 | | $ | 3,113,910 | | |
| | 500 | | | Pima County, (MBIA), 3.50%, 7/1/19 | | | 460,730 | | |
| | 750 | | | Puerto Rico Highway and Transportation Authority,
(AGC), 5.00%, 7/1/45 | | | 772,980 | | |
| | 1,000 | | | Puerto Rico Highway and Transportation Authority,
(AMBAC), 5.25%, 7/1/38 | | | 1,145,070 | | |
| | 900 | | | Puerto Rico Highway and Transportation Authority,
(CIFG), 5.25%, 7/1/41 | | | 1,007,712 | | |
| | 1,700 | | | Puerto Rico Highway and Transportation Authority,
(MBIA), 5.50%, 7/1/36 | | | 1,888,632 | | |
| | | | | | | $ | 8,389,034 | | |
| Insured-Water and Sewer — 4.2% | | | |
| $ | 1,000 | | | Cottonwood, Property Corp., Water Revenue, (XLCA),
5.00%, 7/1/29 | | $ | 1,036,450 | | |
| | 1,000 | | | Phoenix Civic Improvements Corp., Water System Revenue,
(FGIC), 5.00%, 7/1/22 | | | 1,053,930 | | |
| | 1,000 | | | Phoenix, Civic Improvement Corp., Wastewater System,
(MBIA), 5.00%, 7/1/29 | | | 1,043,580 | | |
| | | | | | | $ | 3,133,960 | | |
| Other Revenue — 2.8% | | | |
| $ | 1,750 | | | Arizona Health Facilities Authority, (Blood Systems, Inc.),
4.75%, 4/1/25 | | $ | 1,731,433 | | |
| | 4,400 | | | Children's Trust Fund, PR, Tobacco Settlement,
0.00%, 5/15/50 | | | 278,784 | | |
| | 3,700 | | | Children's Trust Fund, PR, Tobacco Settlement,
0.00%, 5/15/55 | | | 125,652 | | |
| | | | | | | $ | 2,135,869 | | |
| Pooled Loans — 5.4% | | | |
| $ | 2,000 | | | Arizona Educational Loan Marketing Corp., (AMT),
6.25%, 6/1/06 | | $ | 2,011,300 | | |
| | 2,000 | | | Arizona Educational Loan Marketing Corp., (AMT),
6.30%, 12/1/08 | | | 2,051,240 | | |
| | | | | | | $ | 4,062,540 | | |
| Senior Living / Life Care — 2.1% | | | |
| $ | 1,800 | | | Arizona Health Facilities Authority, (Care Institute,
Inc. - Mesa), 7.625%, 1/1/26(6) | | $ | 1,598,094 | | |
| | | | | | | $ | 1,598,094 | | |
See notes to financial statements
14
Eaton Vance Arizona Municipals Fund as of January 31, 2006
PORTFOLIO OF INVESTMENTS (Unaudited) CONT'D
Principal Amount
(000's omitted) | |
Security | |
Value | |
| Water and Sewer — 1.4% | |
| $ | 1,000 | | | Central Arizona Water Conservation District,
5.50%, 11/1/09 | | $ | 1,073,370 | | |
| | | | | $ | 1,073,370 | | |
Total Tax-Exempt Investments — 99.4%
(identified cost $69,963,307) | | | | $ | 75,229,278 | | |
| Other Assets, Less Liabilities — 0.6% | | | | $ | 469,107 | | |
| Net Assets — 100.0% | | | | $ | 75,698,385 | | |
AGC - Assured Guaranty Corp.
AMBAC - AMBAC Financial Group, Inc.
AMT - Interest earned from these securities may be considered a tax preference item for purposes of the Federal Alternative Minimum Tax.
CIFG - CDC IXIS Financial Guaranty North America, Inc.
FGIC - Financial Guaranty Insurance Company
FSA - Financial Security Assurance, Inc.
MBIA - Municipal Bond Insurance Association
XLCA - XL Capital Assurance, Inc.
The Fund invests primarily in debt securities issued by Arizona municipalities. The ability of the issuers of the debt securities to meet their obligations may be affected by economic developments in a specific industry or municipality. In order to reduce the risk associated with such economic developments, at January 31, 2006, 54.2% of the securities in the portfolio of investments are backed by bond insurance of various financial institutions and financial guaranty assurance agencies. The aggregate percentage insured by an individual financial institution ranged from 1.0% to 19.0% of total investments.
(1) Defaulted bond.
(2) Security exempt from registration under Rule 144A of the Securities Act of 1933. These securities may be sold in transactions exempt from registration, normally to qualified institutional buyers. At January 31, 2006, the aggregate value of the securities is $5,007,076 or 6.6% of the Fund's net assets.
(3) Security has been issued as a leveraged inverse floater bond. The stated interest rate represents the rate in effect at January 31, 2006.
(4) Security has been issued as an inverse floater bond. The stated interest rate represents the rate in effect at January 31, 2006.
(5) Security (or a portion thereof) has been segregated to cover margin requirements on open financial futures contracts.
(6) Security is in default and making only partial interest payments.
See notes to financial statements
15
Eaton Vance Colorado Municipals Fund as of January 31, 2006
PORTFOLIO OF INVESTMENTS (Unaudited)
| Tax-Exempt Investments — 98.0% | | | |
Principal Amount
(000's omitted) | |
Security | |
Value | |
| Education — 3.3% | | | |
| $ | 1,000 | | | Colorado Educational and Cultural Facilities Authority,
(Alexander Dawson School), 5.30%, 2/15/29 | | $ | 1,030,800 | | |
| | | | | | | $ | 1,030,800 | | |
| Electric Utilities — 1.6% | | | |
| $ | 500 | | | Colorado Springs, Utilities, 4.75%, 11/15/34 | | $ | 503,000 | | |
| | | | | | | $ | 503,000 | | |
| Escrowed / Prerefunded — 9.7% | | | |
| $ | 500 | | | Colorado Health Facilities Authority, (Portercare
Adventist Health), Prerefunded to 11/15/11,
6.50%, 11/15/31 | | $ | 577,350 | | |
| | 975 | | | Colorado Water Resources, Power Development
Authority, Prerefunded to 9/1/11, 5.00%, 9/1/21 | | | 1,047,130 | | |
| | 3,000 | | | Dawson Ridge, Metropolitan District #1,
Escrowed to Maturity, 0.00%, 10/1/22 | | | 1,401,270 | | |
| | | | | | | $ | 3,025,750 | | |
| Hospital — 10.1% | | | |
| $ | 350 | | | Aspen Valley, Hospital District, 6.80%, 10/15/24 | | $ | 374,209 | | |
| | 650 | | | Colorado Health Facilities Authority, (Catholic Health
Initiatives), 5.25%, 9/1/21 | | | 679,679 | | |
| | 500 | | | Colorado Health Facilities Authority, (Parkview Medical
Center), 5.00%, 9/1/25 | | | 506,750 | | |
| | 320 | | | Colorado Health Facilities Authority, (Parkview Medical
Center), 5.00%, 9/1/25 | | | 327,699 | | |
| | 500 | | | Colorado Health Facilities Authority, (Vail Valley Medical
Center), 5.80%, 1/15/27 | | | 525,595 | | |
| | 715 | | | University of Colorado Hospital Authority, 5.60%, 11/15/25 | | | 749,184 | | |
| | | | | | | $ | 3,163,116 | | |
| Housing — 4.4% | | | |
| $ | 1,000 | | | Denver, Multifamily, (Bank Lofts), (FHA), (AMT),
6.15%, 12/1/16 | | $ | 1,020,840 | | |
| | 340 | | | Lake Creek, (Affordable Housing Corp.), Multifamily,
6.25%, 12/1/23 | | | 345,845 | | |
| | | | | | | $ | 1,366,685 | | |
Principal Amount
(000's omitted) | |
Security | |
Value | |
| Industrial Development Revenue — 7.0% | | | |
| $ | 500 | | | Colorado HFA, (Waste Management, Inc.), (AMT),
5.70%, 7/1/18 | | $ | 529,685 | | |
| | 500 | | | Denver Airport Special Facilities, (United Airlines), (AMT),
6.875%, 10/1/32(1) | | | 498,060 | | |
| | 750 | | | Puerto Rico Industrial, Medical and Environmental
Pollution Control Facility Finance Authority, (American
Home Products), 5.10%, 12/1/18 | | | 765,945 | | |
| | 500 | | | Puerto Rico Port Authority, (American Airlines), (AMT),
6.25%, 6/1/26 | | | 391,935 | | |
| | | | | | | $ | 2,185,625 | | |
| Insured-Education — 2.6% | | | |
| $ | 610 | | | Colorado School of Mines, (MBIA), 0.00%, 12/1/21 | | $ | 299,662 | | |
| | 500 | | | University of Colorado, (FGIC), 5.00%, 6/1/27 | | | 517,655 | | |
| | | | | | | $ | 817,317 | | |
| Insured-General Obligations — 12.7% | | | |
| $ | 1,000 | | | El Paso County, School District #20, (MBIA),
5.00%, 12/15/25 | | $ | 1,058,670 | | |
| | 1,000 | | | Garfield, Pitkin and Eagle Counties School District (FSA),
5.00%, 12/15/27 | | | 1,049,250 | | |
| | 510 | | | Larimer Weld and Boulder Counties School District R-2J
Thompson, (MBIA), 5.00%, 12/15/24 | | | 540,763 | | |
| | 1,000 | | | Pueblo County, School District #70, (FGIC),
5.00%, 12/1/19 | | | 1,100,360 | | |
| | 200 | | | Puerto Rico, (FSA), Variable Rate, 9.42%, 7/1/27(2)(3) | | | 237,684 | | |
| | | | | | | $ | 3,986,727 | | |
| Insured-Hospital — 2.5% | | | |
| $ | 750 | | | Adams County, (Brighton Community Hospital Association),
(MBIA), 5.00%, 2/1/31 | | $ | 772,298 | | |
| | | | | | | $ | 772,298 | | |
Insured-Lease Revenue / Certificates of
Participation — 1.7% | | | |
| $ | 400 | | | Puerto Rico Public Finance Corp., (AMBAC), Variable Rate,
8.88%, 6/1/24(2)(3) | | $ | 533,524 | | |
| | | | | | | $ | 533,524 | | |
| Insured-Special Tax Revenue — 5.2% | | | |
| $ | 500 | | | Aspen, Sales Tax Revenue, (FSA), 5.25%, 11/1/25 | | $ | 541,825 | | |
| | 1,000 | | | Sand Creek, Metropolitan District, (XLCA),
5.375%, 12/1/27 | | | 1,075,960 | | |
| | | | | | | $ | 1,617,785 | | |
See notes to financial statements
16
Eaton Vance Colorado Municipals Fund as of January 31, 2006
PORTFOLIO OF INVESTMENTS (Unaudited) CONT'D
Principal Amount
(000's omitted) | |
Security | |
Value | |
| Insured-Transportation — 22.4% | | | |
| $ | 3,500 | | | E-470 Colorado Public Highway Authority, (MBIA),
0.00%, 9/1/16 | | $ | 2,229,500 | | |
| | 1,750 | | | Northwest Parkway Public Highway Authority, (FSA),
5.25%, 6/15/41 | | | 1,838,760 | | |
| | 3,095 | | | Puerto Rico Highway and Transportation Authority, (AMBAC),
0.00%, 7/1/18 | | | 1,839,389 | | |
| | 1,000 | | | Puerto Rico Highway and Transportation Authority, (MBIA),
5.50%, 7/1/36(4) | | | 1,110,960 | | |
| | | | | | | $ | 7,018,609 | | |
| Insured-Water and Sewer — 4.9% | | | |
| $ | 500 | | | Colorado Water Resources, Power Development Authority,
(Colorado UTE Electric Association), (FSA),
4.375%, 8/1/35 | | $ | 476,505 | | |
| | 1,000 | | | Widefield, Water and Sanitation District, (MBIA),
5.00%, 12/1/25 | | | 1,053,570 | | |
| | | | | | | $ | 1,530,075 | | |
| Senior Living / Life Care — 2.3% | | | |
| $ | 400 | | | Colorado Health Facilities Authority, (Covenant Retirement
Communities, Inc.), 5.00%, 12/1/35 | | $ | 393,572 | | |
| | 425 | | | Logan County, Industrial Development, (TLC Care
Choices, Inc.), 6.875%, 12/1/23 | | | 344,820 | | |
| | | | | | | $ | 738,392 | | |
| Special Tax Revenue — 4.2% | | | |
| $ | 400 | | | Bachelor Gulch, Metropolitan District, 6.70%, 11/15/19 | | $ | 424,344 | | |
| | 360 | | | Bell Mountain Ranch, Metropolitan District,
6.625%, 11/15/25 | | | 367,348 | | |
| | 500 | | | Cottonwood, Water and Sanitation District,
7.75%, 12/1/20 | | | 516,650 | | |
| | | | | | | $ | 1,308,342 | | |
| Transportation — 1.3% | | | |
| $ | 400 | | | Eagle County, (Eagle County Airport Terminal), (AMT),
7.50%, 5/1/21 | | $ | 405,836 | | |
| | | | | | | $ | 405,836 | | |
Principal Amount
(000's omitted) | |
Security | |
Value | |
| Water and Sewer — 2.1% | |
| $ | 25 | | | Colorado Water Resources, Power Development Authority,
5.00%, 9/1/21 | | $ | 26,606 | | |
| | 540 | | | Colorado Water Resources, Power Development Authority,
5.50%, 9/1/22 | | | 623,576 | | |
| | | | | $ | 650,182 | | |
Total Tax-Exempt Investments — 98.0%
(identified cost $28,843,955) | | | | $ | 30,654,063 | | |
| Other Assets, Less Liabilities — 2.0% | | | | $ | 621,686 | | |
| Net Assets — 100.0% | | | | $ | 31,275,749 | | |
AMBAC - AMBAC Financial Group, Inc.
AMT - Interest earned from these securities may be considered a tax preference item for purposes of the Federal Alternative Minimum Tax.
FGIC - Financial Guaranty Insurance Company
FHA - Federal Housing Administration
FSA - Financial Security Assurance, Inc.
MBIA - Municipal Bond Insurance Association
XLCA - XL Capital Assurance, Inc.
The Fund invests primarily in debt securities issued by Colorado municipalities. The ability of the issuers of the debt securities to meet their obligations may be affected by economic developments in a specific industry or municipality. In order to reduce the risk associated with such economic developments, at January 31, 2006, 53.1% of the securities in the portfolio of investments are backed by bond insurance of various financial institutions and financial guaranty assurance agencies. The aggregate percentage insured by an individual financial institution ranged from 3.5% to 23.0% of total investments.
(1) Defaulted bond.
(2) Security exempt from registration under Rule 144A of the Securities Act of 1933. These securities may be sold in transactions exempt from registration, normally to qualified institutional buyers. At January 31, 2006, the aggregate value of the securities is $771,208 or 2.5% of the Fund's net assets.
(3) Security has been issued as a leveraged inverse floater bond. The stated interest rate represents the rate in effect at January 31, 2006.
(4) Security (or a portion thereof) has been segregated to cover margin requirements on open financial futures contracts.
See notes to financial statements
17
Eaton Vance Connecticut Municipals Fund as of January 31, 2006
PORTFOLIO OF INVESTMENTS (Unaudited)
| Tax-Exempt Investments — 98.3% | | | |
Principal Amount
(000's omitted) | |
Security | |
Value | |
| Education — 6.6% | | | |
| $ | 2,050 | | | Connecticut HEFA, (Loomis Chaffee School),
5.25%, 7/1/31 | | $ | 2,320,026 | | |
| | 2,500 | | | Connecticut HEFA, (University of Hartford),
5.25%, 7/1/32 | | | 2,614,350 | | |
| | 2,000 | | | Connecticut HEFA, (Yale University), 5.00%, 7/1/42 | | | 2,066,860 | | |
| | 1,350 | | | University of Connecticut, 5.00%, 5/15/23 | | | 1,421,955 | | |
| | | | | | | $ | 8,423,191 | | |
| Electric Utilities — 3.4% | | | |
| $ | 3,135 | | | Connecticut Development Authority, (Connecticut Light
and Power), 5.85%, 9/1/28 | | $ | 3,323,413 | | |
| | 1,000 | | | Puerto Rico Electric Power Authority, 5.125%, 7/1/29 | | | 1,032,640 | | |
| | | | | | | $ | 4,356,053 | | |
| Escrowed / Prerefunded — 4.5% | | | |
| $ | 3,010 | | | Connecticut Clean Water Fund, Prerefunded to 10/1/11,
5.50%, 10/1/19 | | $ | 3,314,401 | | |
| | 1,500 | | | Connecticut HEFA, (Loomis Chaffee School),
Prerefunded to 7/1/11, 5.25%, 7/1/31 | | | 1,639,725 | | |
| | 170 | | | Puerto Rico Public Finance Corp., Escrowed to Maturity,
6.00%, 8/1/26 | | | 210,309 | | |
| | 545 | | | University of Connecticut, Prerefunded to 4/1/12,
5.375%, 4/1/18 | | | 599,151 | | |
| | | | | | | $ | 5,763,586 | | |
| General Obligations — 6.8% | | | |
| $ | 1,750 | | | Connecticut, 0.00%, 11/1/09 | | $ | 1,535,747 | | |
| | 1,270 | | | Danbury, 4.50%, 2/1/14 | | | 1,339,977 | | |
| | 1,065 | | | Puerto Rico, 0.00%, 7/1/15 | | | 724,381 | | |
| | 1,000 | | | Puerto Rico, 5.00%, 7/1/25 | | | 1,028,320 | | |
| | 400 | | | Redding, 5.50%, 10/15/18 | | | 459,932 | | |
| | 650 | | | Redding, 5.625%, 10/15/19 | | | 758,693 | | |
| | 1,400 | | | Suffield, 5.00%, 6/15/21 | | | 1,550,178 | | |
| | 535 | | | Wilton, 5.25%, 7/15/18 | | | 605,994 | | |
| | 535 | | | Wilton, 5.25%, 7/15/19 | | | 608,546 | | |
| | | | | | | $ | 8,611,768 | | |
| Housing — 0.8% | | | |
| $ | 1,000 | | | Connecticut HFA, 4.70%, 5/15/28 | | $ | 1,005,770 | | |
| | | | | | | $ | 1,005,770 | | |
Principal Amount
(000's omitted) | |
Security | |
Value | |
| Industrial Development Revenue — 7.5% | | | |
| $ | 3,065 | | | Connecticut Development Authority, Airport Facility,
(Signature Flight), (AMT), 6.625%, 12/1/14 | | $ | 3,070,057 | | |
| | 4,500 | | | Eastern Connecticut Resource Recovery Authority,
(Wheelabrator Lisbon), (AMT), 5.50%, 1/1/20 | | | 4,496,850 | | |
| | 700 | | | Puerto Rico Port Authority, (American Airlines), (AMT),
6.25%, 6/1/26 | | | 548,709 | | |
| | 1,350 | | | Sprague, Environmental Improvement, (International
Paper Co.), (AMT), 5.70%, 10/1/21 | | | 1,395,306 | | |
| | | | | | | $ | 9,510,922 | | |
| Insured-Education — 9.4% | | | |
| $ | 1,550 | | | Connecticut HEFA, (Connecticut College), (MBIA),
5.00%, 7/1/32 | | $ | 1,607,753 | | |
| | 1,000 | | | Connecticut HEFA, (Greenwich Academy), (FSA),
5.00%, 3/1/32 | | | 1,032,490 | | |
| | 1,970 | | | Connecticut HEFA, (Trinity College), (MBIA),
5.00%, 7/1/22 | | | 2,087,156 | | |
| | 5,305 | | | Connecticut HEFA, (Trinity College), (MBIA),
5.50%, 7/1/21 | | | 6,177,142 | | |
| | 1,000 | | | Connecticut HEFA, (Westminster School), (MBIA),
5.00%, 7/1/29 | | | 1,034,350 | | |
| | | | | | | $ | 11,938,891 | | |
| Insured-Electric Utilities — 1.9% | | | |
| $ | 1,000 | | | Puerto Rico Electric Power Authority, (MBIA),
Variable Rate, 10.075%, 7/1/16(1)(2) | | $ | 1,413,100 | | |
| | 830 | | | Puerto Rico Electric Power Authority, DRIVERS, (FSA),
Variable Rate, 9.27%, 7/1/29(1)(2) | | | 996,008 | | |
| | | | | | | $ | 2,409,108 | | |
| Insured-Escrowed / Prerefunded — 6.7% | | | |
| $ | 2,500 | | | Connecticut HEFA, (Fairfield University), (MBIA),
Prerefunded to 7/1/09, 5.25%, 7/1/25 | | $ | 2,669,800 | | |
| | 1,000 | | | Connecticut Special Tax Transportation Infrastructure,
(FSA), Prerefunded to 10/1/11, 5.00%, 10/1/21 | | | 1,074,590 | | |
| | 2,000 | | | Connecticut, (FSA), Prerefunded to 10/15/12,
5.00%, 10/15/19 | | | 2,167,740 | | |
| | 10 | | | New Haven, (FGIC), Escrowed to Maturity,
5.00%, 11/1/18 | | | 10,835 | | |
| | 375 | | | Puerto Rico Infrastructure Financing Authority,
(AMBAC), Prerefunded to 1/1/08, Variable Rate,
6.824%, 7/1/28(1)(3) | | | 406,016 | | |
| | 515 | | | Puerto Rico, (FGIC), Prerefunded to 7/1/12,
5.00%, 7/1/32 | | | 557,348 | | |
| | 1,500 | | | Suffield, (MBIA), Prerefunded to 6/15/11,
4.75%, 6/15/21 | | | 1,590,060 | | |
| | | | | | | $ | 8,476,389 | | |
See notes to financial statements
18
Eaton Vance Connecticut Municipals Fund as of January 31, 2006
PORTFOLIO OF INVESTMENTS (Unaudited) CONT'D
Principal Amount
(000's omitted) | |
Security | |
Value | |
| Insured-General Obligations — 9.9% | | | |
| $ | 3,870 | | | Bridgeport, (FGIC), 4.75%, 8/15/21 | | $ | 3,996,355 | | |
| | 2,305 | | | Bridgeport, (FGIC), 5.375%, 8/15/19 | | | 2,507,148 | | |
| | 1,000 | | | Connecticut, (AMBAC), 5.25%, 6/1/20 | | | 1,132,380 | | |
| | 1,000 | | | Connecticut, (FGIC), 5.00%, 4/1/24 | | | 1,055,830 | | |
| | 1,000 | | | New Britain, (MBIA), 6.00%, 3/1/12 | | | 1,108,950 | | |
| | 2,240 | | | New Haven, (FGIC), 5.00%, 11/1/18 | | | 2,388,490 | | |
| | 350 | | | Puerto Rico, (FSA), Variable Rate, 9.42%, 7/1/27(1)(2) | | | 415,947 | | |
| | | | | | | $ | 12,605,100 | | |
| Insured-Hospital — 4.6% | | | |
| $ | 2,000 | | | Connecticut HEFA, (Children's Medical Center), (MBIA),
5.00%, 7/1/21 | | $ | 2,118,940 | | |
| | 1,350 | | | Connecticut HEFA, (Lawrence and Memorial Hospital),
(MBIA), 5.00%, 7/1/22 | | | 1,351,431 | | |
| | 2,335 | | | Connecticut HEFA, (William W. Backus Hospital), (FSA),
5.00%, 7/1/26 | | | 2,449,322 | | |
| | | | | | | $ | 5,919,693 | | |
Insured-Lease Revenue / Certificates of
Participation — 3.8% | | | |
| $ | 3,250 | | | Puerto Rico Public Building Authority, (AMBAC),
5.50%, 7/1/21 | | $ | 3,743,837 | | |
| | 800 | | | Puerto Rico Public Finance Corp., (AMBAC), Variable Rate,
8.88%, 6/1/24(1)(2) | | | 1,067,048 | | |
| | | | | | | $ | 4,810,885 | | |
| Insured-Other Revenue — 1.4% | | | |
| $ | 550 | | | Connecticut HEFA, (Child Care Facility Program), (AMBAC),
5.00%, 7/1/31 | | $ | 567,787 | | |
| | 1,150 | | | Connecticut HEFA, (Village Families & Children), (AMBAC),
5.00%, 7/1/32 | | | 1,190,641 | | |
| | | | | | | $ | 1,758,428 | | |
| Insured-Pooled Loans — 1.3% | | | |
| $ | 250 | | | Connecticut Higher Education Supplemental Loan Authority,
(Family Education Loan Program), (MBIA), (AMT),
4.375%, 11/15/21 | | $ | 248,718 | | |
| | 1,300 | | | Connecticut Higher Education Supplemental Loan Authority,
(MBIA), (AMT), 5.25%, 11/15/21 | | | 1,352,130 | | |
| | | | | | | $ | 1,600,848 | | |
Principal Amount
(000's omitted) | |
Security | |
Value | |
| Insured-Special Tax Revenue — 3.5% | | | |
| $ | 2,000 | | | Connecticut Special Tax Transportation Infrastructure,
(AMBAC), 5.00%, 7/1/24 | | $ | 2,120,920 | | |
| | 1,250 | | | Puerto Rico Infrastructure Financing Authority, (AMBAC),
5.50%, 7/1/23 | | | 1,450,113 | | |
| | 800 | | | Puerto Rico Infrastructure Financing Authority, (AMBAC),
5.50%, 7/1/28 | | | 939,112 | | |
| | | | | | | $ | 4,510,145 | | |
| Insured-Transportation — 10.7% | | | |
| $ | 5,500 | | | Connecticut Airport, (Bradley International Airport),
(FGIC), (AMT), 5.125%, 10/1/26 | | $ | 5,645,145 | | |
| | 500 | | | Guam International Airport Authority, (MBIA),
5.25%, 10/1/23 | | | 540,205 | | |
| | 1,750 | | | Puerto Rico Highway and Transportation Authority, (AMBAC),
0.00%, 7/1/16 | | | 1,139,653 | | |
| | 3,000 | | | Puerto Rico Highway and Transportation Authority, (AMBAC),
5.25%, 7/1/38 | | | 3,435,210 | | |
| | 1,630 | | | Puerto Rico Highway and Transportation Authority, (AMBAC),
Variable Rate, 8.663%, 7/1/28(1)(2) | | | 1,804,182 | | |
| | 900 | | | Puerto Rico Highway and Transportation Authority, (CIFG),
5.25%, 7/1/41 | | | 1,007,712 | | |
| | | | | | | $ | 13,572,107 | | |
| Insured-Water and Sewer — 4.0% | | | |
| $ | 1,340 | | | South Central Connecticut Regional Water Authority, (FGIC),
5.125%, 8/1/29 | | $ | 1,410,913 | | |
| | 1,530 | | | South Central Connecticut Regional Water Authority, (MBIA),
5.00%, 8/1/25 | | | 1,614,303 | | |
| | 2,000 | | | South Central Connecticut Regional Water Authority, (MBIA),
5.00%, 8/1/28 | | | 2,099,520 | | |
| | | | | | | $ | 5,124,736 | | |
Lease Revenue / Certificates of
Participation — 1.7% | | | |
| $ | 1,830 | | | Puerto Rico Public Finance Corp., (Commonwealth
Appropriation), 6.00%, 8/1/26 | | $ | 2,174,498 | | |
| | | | | | | $ | 2,174,498 | | |
| Other Revenue — 0.6% | | | |
| $ | 8,700 | | | Children's Trust Fund, PR, Tobacco Settlement,
0.00%, 5/15/50 | | $ | 551,232 | | |
| | 7,400 | | | Children's Trust Fund, PR, Tobacco Settlement,
0.00%, 5/15/55 | | | 251,304 | | |
| | | | | | | $ | 802,536 | | |
See notes to financial statements
19
Eaton Vance Connecticut Municipals Fund as of January 31, 2006
PORTFOLIO OF INVESTMENTS (Unaudited) CONT'D
Principal Amount
(000's omitted) | |
Security | |
Value | |
| Solid Waste — 2.2% | | | |
| $ | 2,750 | | | Connecticut Resources Recovery Authority, (American
REF-FUEL Co.), (AMT), 6.45%, 11/15/22 | | $ | 2,770,103 | | |
| | | | | | | $ | 2,770,103 | | |
| Special Tax Revenue — 4.6% | | | |
| $ | 3,180 | | | Connecticut Special Tax Transportation Infrastructure,
6.125%, 9/1/12(4) | | $ | 3,563,699 | | |
| | 2,000 | | | Connecticut Special Tax Transportation Infrastructure,
6.50%, 10/1/12 | | | 2,325,480 | | |
| | | | | | | $ | 5,889,179 | | |
| Transportation — 0.4% | | | |
| $ | 500 | | | Puerto Rico Highway and Transportation Authority,
5.50%, 7/1/15 | | $ | 550,925 | | |
| | | | | | | $ | 550,925 | | |
| Water and Sewer — 2.0% | | | |
| $ | 1,250 | | | Connecticut Clean Water Fund, 6.00%, 10/1/12 | | $ | 1,402,488 | | |
| | 1,100 | | | Stamford, Water Pollution Control System and Facilities,
5.00%, 11/15/32 | | | 1,143,417 | | |
| | | | | | | $ | 2,545,905 | | |
| | Total Tax-Exempt Investments — 98.3%
(identified cost $117,915,870) | | | | | $ | 125,130,766 | | |
| | Other Assets, Less Liabilities — 1.7% | | | | | $ | 2,218,095 | | |
| | Net Assets — 100.0% | | | | | $ | 127,348,861 | | |
AMBAC - AMBAC Financial Group, Inc.
AMT - Interest earned from these securities may be considered a tax preference item for purposes of the Federal Alternative Minimum Tax.
CIFG - CDC IXIS Financial Guaranty North America, Inc.
FGIC - Financial Guaranty Insurance Company
FSA - Financial Security Assurance, Inc.
MBIA - Municipal Bond Insurance Association
The Fund invests primarily in debt securities issued by Connecticut municipalities. The ability of the issuers of the debt securities to meet their obligations may be affected by economic developments in a specific industry or municipality. In order to reduce the risk associated with such economic developments, at January 31, 2006, 58.1% of the securities in the portfolio of investments are backed by bond insurance of various financial institutions and financial guaranty assurance agencies. The aggregate percentage insured by an individual financial institution ranged from 0.8% to 21.6% of total investments.
(1) Security exempt from registration under Rule 144A of the Securities Act of 1933. These securities may be sold in transactions exempt from registration, normally to qualified institutional buyers. At January 31, 2006, the aggregate value of the securities is $6,102,301 or 4.8% of the Fund's net assets.
(2) Security has been issued as a leveraged inverse floater bond. The stated interest rate represents the rate in effect at January 31, 2006.
(3) Security has been issued as an inverse floater bond. The stated interest rate represents the rate in effect at January 31, 2006.
(4) Security (or a portion thereof) has been segregated to cover margin requirements on open financial futures contracts.
See notes to financial statements
20
Eaton Vance Michigan Municipals Fund as of January 31, 2006
PORTFOLIO OF INVESTMENTS (Unaudited)
| Tax-Exempt Investments — 99.8% | | | |
Principal Amount
(000's omitted) | |
Security | |
Value | |
| Education — 3.4% | | | |
| $ | 1,250 | | | Michigan Higher Education Facilities Authority, (Creative
Studies), 5.85%, 12/1/22 | | $ | 1,286,137 | | |
| | 750 | | | Michigan Higher Education Facilities Authority, (Hillsdale
College), 5.00%, 3/1/35 | | | 762,938 | | |
| | | | | | | $ | 2,049,075 | | |
| Electric Utilities — 1.7% | | | |
| $ | 1,000 | | | Puerto Rico Electric Power Authority, 5.125%, 7/1/29 | | $ | 1,032,640 | | |
| | | | | | | $ | 1,032,640 | | |
| General Obligations — 3.1% | | | |
| $ | 500 | | | Kent County Building Authority, 5.50%, 6/1/26 | | $ | 584,870 | | |
| | 1,250 | | | Puerto Rico Public Buildings Authority, Commonwealth
Guaranteed, 5.25%, 7/1/29 | | | 1,308,788 | | |
| | | | | | | $ | 1,893,658 | | |
| Health Care-Miscellaneous — 1.1% | | | |
| $ | 615 | | | Pittsfield Township EDC, (Arbor Hospice),
7.875%, 8/15/27 | | $ | 641,236 | | |
| | | | | | | $ | 641,236 | | |
| Hospital — 14.4% | | | |
| $ | 500 | | | Allegan Hospital Finance Authority, (Allegan
General Hospital), 7.00%, 11/15/21 | | $ | 530,740 | | |
| | 275 | | | Gaylord Hospital Finance Authority, (Otsego Memorial
Hospital Association), 6.20%, 1/1/25 | | | 282,865 | | |
| | 500 | | | Macomb County Hospital Finance Authority, (Mount Clemens
General Hospital) , 5.875%, 11/15/34 | | | 507,495 | | |
| | 610 | | | Mecosta County, (Michigan General Hospital),
5.75%, 5/15/09 | | | 626,250 | | |
| | 2,000 | | | Michigan Hospital Finance Authority, (Central Michigan
Community Hospital), 6.25%, 10/1/27 | | | 2,035,800 | | |
| | 1,250 | | | Michigan Hospital Finance Authority, (McLaren Healthcare),
5.00%, 8/1/35 | | | 1,273,188 | | |
| | 1,500 | | | Michigan Hospital Finance Authority, (Oakwood Hospital),
5.75%, 4/1/32 | | | 1,592,445 | | |
| | 750 | | | Michigan Hospital Finance Authority, (Sparrow
Obligation Group), 5.625%, 11/15/36 | | | 788,753 | | |
| | 1,000 | | | Michigan Hospital Finance Authority, (Trinity Health),
5.00%, 8/15/34 | | | 1,025,920 | | |
| | | | | | | $ | 8,663,456 | | |
Principal Amount
(000's omitted) | |
Security | |
Value | |
| Industrial Development Revenue — 1.7% | | | |
| $ | 1,000 | | | Michigan Strategic Fund, (Waste Management, Inc.),
(AMT), 4.625%, 12/1/12 | | $ | 1,004,130 | | |
| | | | | | | $ | 1,004,130 | | |
| Insured-Education — 4.2% | | | |
| $ | 1,000 | | | Ferris State University, (AMBAC), 5.00%, 10/1/23(1) | | $ | 1,028,040 | | |
| | 1,500 | | | Western Michigan University, (FGIC), 5.125%, 11/15/22 | | | 1,539,810 | | |
| | | | | | | $ | 2,567,850 | | |
| Insured-Electric Utilities — 4.0% | | | |
| $ | 2,000 | | | Michigan Strategic Fund Resource Recovery, (Detroit
Edison Co.), (MBIA), (AMT), 5.55%, 9/1/29 | | $ | 2,099,960 | | |
| | 300 | | | Michigan Strategic Fund, (Detroit Edison Co.), (FGIC),
6.95%, 5/1/11 | | | 345,525 | | |
| | | | | | | $ | 2,445,485 | | |
| Insured-Escrowed / Prerefunded — 21.1% | | | |
| $ | 2,000 | | | Detroit School District, (FGIC), Prerefunded to 5/1/13,
5.25%, 5/1/28 | | $ | 2,189,840 | | |
| | 3,000 | | | Lake Orion, Community School District, (FGIC),
Prerefunded to 5/1/08, 5.125%, 5/1/23 | | | 3,112,470 | | |
| | 1,000 | | | Novi Building Authority, (FSA), Prerefunded to 10/1/10,
5.50%, 10/1/25 | | | 1,091,840 | | |
| | 345 | | | Puerto Rico Highway and Transportation Authority,
(MBIA), Prerefunded to 7/1/06, Variable Rate,
10.163%, 7/1/26(2)(3) | | | 370,333 | | |
| | 2,165 | | | Warren, Water and Sewer, (FSA), Prerefunded to
11/1/11, 5.25%, 11/1/26 | | | 2,349,869 | | |
| | 2,500 | | | Wyoming Public Schools, (FGIC), Prerefunded to 5/1/08,
5.125%, 5/1/23 | | | 2,593,725 | | |
| | 1,000 | | | Zeeland Public Schools, (FGIC), Prerefunded to 5/1/09,
5.25%, 5/1/22 | | | 1,055,630 | | |
| | | | | | | $ | 12,763,707 | | |
| Insured-General Obligations — 28.0% | | | |
| $ | 1,000 | | | Ann Arbor, School District, (MBIA), 4.75%, 5/1/29 | | $ | 1,014,590 | | |
| | 1,005 | | | Brighton School District, (AMBAC), 0.00%, 5/1/18 | | | 594,437 | | |
| | 1,000 | | | Detroit, City School District, (FSA), 6.00%, 5/1/29 | | | 1,235,550 | | |
| | 1,000 | | | East Lansing, School District, (MBIA), 5.00%, 5/1/30 | | | 1,046,290 | | |
| | 1,000 | | | Grand Blanc Community Schools, (FSA), 5.00%, 5/1/28 | | | 1,043,530 | | |
| | 1,000 | | | Healthsource Saginaw, Inc., (MBIA), 5.00%, 5/1/29 | | | 1,046,290 | | |
| | 1,900 | | | Holland School District, (AMBAC), 0.00%, 5/1/17 | | | 1,178,988 | | |
| | 1,000 | | | Hudsonville Public Schools, (FSA), 5.00%, 5/1/27 | | | 1,049,390 | | |
| | 1,000 | | | Hudsonville Public Schools, (FSA), 5.00%, 5/1/29 | | | 1,042,120 | | |
| | 2,410 | | | Okemos Public Schools, (MBIA), 0.00%, 5/1/16 | | | 1,570,308 | | |
See notes to financial statements
21
Eaton Vance Michigan Municipals Fund as of January 31, 2006
PORTFOLIO OF INVESTMENTS (Unaudited) CONT'D
Principal Amount
(000's omitted) | |
Security | |
Value | |
| Insured-General Obligations (continued) | | | |
| $ | 2,790 | | | Parchment School District, (MBIA), 5.00%, 5/1/25 | | $ | 3,064,982 | | |
| | 1,000 | | | Plymouth-Canton, Community School District, (FGIC),
5.00%, 5/1/29 | | | 1,042,120 | | |
| | 350 | | | Puerto Rico, (FSA), Variable Rate, 9.42%, 7/1/27(2)(3) | | | 415,947 | | |
| | 1,400 | | | Redford Union School District No.1, (AMBAC),
5.00%, 5/1/22 | | | 1,531,726 | | |
| | | | | | | $ | 16,876,268 | | |
| Insured-Housing — 0.6% | | | |
| $ | 385 | | | Michigan HDA, Rental Housing, (MBIA), (AMT),
5.30%, 10/1/37 | | $ | 389,354 | | |
| | | | | | | $ | 389,354 | | |
| Insured-Transportation — 7.9% | | | |
| $ | 1,000 | | | Puerto Rico Highway and Transportation Authority,
(AMBAC), 5.25%, 7/1/38 | | $ | 1,145,070 | | |
| | 2,000 | | | Wayne Charter County Airport, Residual Certificates, (MBIA),
(AMT), Variable Rate, 6.72%, 12/1/28(2)(4) | | | 2,046,780 | | |
| | 1,500 | | | Wayne County, Airport Authority, (MBIA), (AMT),
5.25%, 12/1/26 | | | 1,579,365 | | |
| | | | | | | $ | 4,771,215 | | |
| Insured-Water and Sewer — 0.9% | | | |
| $ | 500 | | | Detroit, Sewer Disposal, (MBIA), 5.00%, 7/1/30 | | $ | 520,755 | | |
| | | | | | | $ | 520,755 | | |
| Special Tax Revenue — 4.7% | | | |
| $ | 3,050 | | | Detroit, Downtown Tax Increment, 0.00%, 7/1/16 | | $ | 1,840,187 | | |
| | 2,000 | | | Detroit, Downtown Tax Increment, 0.00%, 7/1/20 | | | 970,380 | | |
| | | | | | �� | $ | 2,810,567 | | |
| Transportation — 3.0% | | | |
| $ | 750 | | | Kent County Airport Facility, Variable Rate,
10.16%, 1/1/25(2)(4) | | $ | 803,205 | | |
| | 1,000 | | | Puerto Rico Highway and Transportation Authority,
5.00%, 7/1/36 | | | 1,017,850 | | |
| | | | | | | $ | 1,821,055 | | |
| | Total Tax-Exempt Investments — 99.8%
(identified cost $54,857,390) | | | | | $ | 60,250,451 | | |
| | Other Assets, Less Liabilities — 0.2% | | | | | $ | 98,248 | | |
| | Net Assets — 100.0% | | | | | $ | 60,348,699 | | |
AMBAC - AMBAC Financial Group, Inc.
AMT - Interest earned from these securities may be considered a tax preference item for purposes of the Federal Alternative Minimum Tax.
FGIC - Financial Guaranty Insurance Company
FSA - Financial Security Assurance, Inc.
MBIA - Municipal Bond Insurance Association
The Fund invests primarily in debt securities issued by Michigan municipalities. The ability of the issuers of the debt securities to meet their obligations may be affected by economic developments in a specific industry or municipality. In order to reduce the risk associated with such economic developments, at January 31, 2006, 66.9% of the securities in the portfolio of investments are backed by bond insurance of various financial institutions and financial guaranty assurance agencies. The aggregate percentage insured by an individual financial institution ranged from 9.1% to 24.5% of total investments.
(1) Security (or a portion thereof) has been segregated to cover margin requirements on open financial futures contracts.
(2) Security exempt from registration under Rule 144A of the Securities Act of 1933. These securities may be sold in transactions exempt from registration, normally to qualified institutional buyers. At January 31, 2006, the aggregate value of the securities is $3,636,265 or 6.0% of the Fund's net assets.
(3) Security has been issued as a leveraged inverse floater bond. The stated interest rate represents the rate in effect at January 31, 2006.
(4) Security has been issued as an inverse floater bond. The stated interest rate represents the rate in effect at January 31, 2006.
See notes to financial statements
22
Eaton Vance Minnesota Municipals Fund as of January 31, 2006
PORTFOLIO OF INVESTMENTS (Unaudited)
| Tax-Exempt Investments — 98.2% | | | |
Principal Amount
(000's omitted) | |
Security | |
Value | |
| Education — 10.1% | | | |
| $ | 1,000 | | | Hopkins, (Blake School), 5.50%, 9/1/24 | | $ | 1,027,040 | | |
| | 1,250 | | | Minnesota Higher Education Facilities Authority,
(Hamline University), 6.00%, 10/1/29 | | | 1,305,550 | | |
| | 575 | | | Minnesota Higher Education Facilities Authority, (Minneapolis
College of Art), 5.375%, 5/1/21 | | | 595,665 | | |
| | 1,380 | | | St. Cloud Housing and Redevelopment Authority, (University
Foundation), 5.00%, 5/1/23 | | | 1,438,126 | | |
| | | | | | | $ | 4,366,381 | | |
| Electric Utilities — 7.5% | | | |
| $ | 750 | | | Minnesota Municipal Power Agency, 5.00%, 10/1/34 | | $ | 764,745 | | |
| | 400 | | | Puerto Rico Electric Power Authority, Variable Rate,
6.976%, 7/1/29(1)(2) | | | 426,112 | | |
| | 1,980 | | | Rochester Electric, 5.25%, 12/1/30 | | | 2,052,884 | | |
| | | | | | | $ | 3,243,741 | | |
| Escrowed / Prerefunded — 5.1% | | | |
| $ | 1,980 | | | Chaska, Electric, Prerefunded to 10/1/10,
6.10%, 10/1/30 | | $ | 2,198,948 | | |
| | | | | | | $ | 2,198,948 | | |
| General Obligations — 6.0% | | | |
| $ | 750 | | | Dakota County, Community Development Agency,
(Senior Housing Facilities), 5.00%, 1/1/21 | | $ | 782,115 | | |
| | 825 | | | Minneapolis and St. Paul General Obligation, Metropolitan
Airport Commission, (AMT), 4.50%, 1/1/15 | | | 843,034 | | |
| | 950 | | | Minnesota State, (Duluth Airport), (AMT), 6.25%, 8/1/14 | | | 952,081 | | |
| | | | | | | $ | 2,577,230 | | |
| Hospital — 11.5% | | | |
| $ | 1,000 | | | Maple Grove Health Care, (North Memorial Health Care),
5.00%, 9/1/35 | | $ | 1,022,270 | | |
| | 700 | | | Martin County, (Fairmont Community Hospital Association),
6.625%, 9/1/22 | | | 745,423 | | |
| | 1,500 | | | Rochester Health Care Facilities, (Mayo Clinic), Variable Rate,
7.71%, 11/15/27(1)(2) | | | 1,634,760 | | |
| | 500 | | | Shakopee Health Care Facilities, (St. Francis Regional Medical
Center), 5.25%, 9/1/34 | | | 511,595 | | |
| | 1,000 | | | St. Louis Park, Health Care Facilities Revenue, (Nicollet
Health Services), 5.25%, 7/1/30 | | | 1,030,470 | | |
| | | | | | | $ | 4,944,518 | | |
Principal Amount
(000's omitted) | |
Security | |
Value | |
| Housing — 6.4% | | | |
| $ | 500 | | | Columbia Heights, Multifamily, (Housing Crest),
6.625%, 4/20/43 | | $ | 537,760 | | |
| | 500 | | | Minneapolis, Multifamily, (Bottineau Commons), (AMT),
5.45%, 4/20/43 | | | 513,230 | | |
| | 1,650 | | | Minnetonka, Multifamily, (Archer Heights Apartments),
(AMT), 6.00%, 1/20/27 | | | 1,700,639 | | |
| | | | | | | $ | 2,751,629 | | |
| Industrial Development Revenue — 2.3% | | | |
| $ | 1,000 | | | Cloquet, (Potlach Corp.), 5.90%, 10/1/26 | | $ | 1,012,300 | | |
| | | | | | | $ | 1,012,300 | | |
| Insured-Education — 3.7% | | | |
| $ | 1,000 | | | Minnesota State Colleges and University, (MBIA),
5.00%, 10/1/32 | | $ | 1,045,570 | | |
| | 500 | | | Minnesota State Colleges and University, (St. Cloud
St. University), (FSA), 5.00%, 10/1/19 | | | 532,775 | | |
| | | | | | | $ | 1,578,345 | | |
| Insured-Electric Utilities — 12.6% | | | |
| $ | 500 | | | Puerto Rico Electric Power Authority, RITES, (FSA),
Variable Rate, 9.453%, 7/1/29(1)(3) | | $ | 600,005 | | |
| | 950 | | | Southern Minnesota Municipal Power Agency, (MBIA),
0.00%, 1/1/21(4) | | | 498,513 | | |
| | 10,000 | | | Southern Minnesota Municipal Power Agency, (MBIA),
0.00%, 1/1/25 | | | 4,309,300 | | |
| | | | | | | $ | 5,407,818 | | |
| Insured-General Obligations — 2.9% | | | |
| $ | 500 | | | Belle Plaine, Independent School District No. 716, (FSA),
4.50%, 2/1/17 | | $ | 520,389 | | |
| | 2,245 | | | Cambridge, Independent School District No. 911, (MBIA),
0.00%, 2/1/29 | | | 724,866 | | |
| | | | | | | $ | 1,245,255 | | |
| Insured-Hospital — 3.5% | | | |
| $ | 1,000 | | | Minneapolis Health Care System, (Fairview Health
Services), (AMBAC), 5.00%, 11/15/34 | | $ | 1,035,960 | | |
| | 450 | | | Plymouth, (Westhealth), (FSA), 6.25%, 6/1/16 | | | 463,455 | | |
| | | | | | | $ | 1,499,415 | | |
See notes to financial statements
23
Eaton Vance Minnesota Municipals Fund as of January 31, 2006
PORTFOLIO OF INVESTMENTS (Unaudited) CONT'D
Principal Amount
(000's omitted) | |
Security | |
Value | |
Insured-Lease Revenue / Certificates of
Participation — 3.1% | | | |
| $ | 1,270 | | | Hopkins, Housing and Redevelopment Authority, (Public
Works and Fire Station), (MBIA), 5.00%, 2/1/20 | | $ | 1,346,949 | | |
| | | | | | | $ | 1,346,949 | | |
| Insured-Other Revenue — 2.0% | | | |
| $ | 800 | | | St. Paul, Housing and Redevelopment Authority, (Block 19),
(FSA), 5.35%, 8/1/29 | | $ | 854,968 | | |
| | | | | | | $ | 854,968 | | |
| Insured-Special Tax Revenue — 2.5% | | | |
| $ | 1,000 | | | Washington County, Housing and Redevelopment Authority,
(Annual Appropriation), (MBIA), 5.50%, 2/1/32 | | $ | 1,059,890 | | |
| | | | | | | $ | 1,059,890 | | |
| Insured-Transportation — 4.8% | | | |
| $ | 475 | | | Minneapolis and St. Paul Metropolitan Airport Commission,
(AMBAC), 5.00%, 1/1/27 | | $ | 495,995 | | |
| | 1,500 | | | Minneapolis and St. Paul Metropolitan Airport Commission,
(FGIC), 5.25%, 1/1/32 | | | 1,571,085 | | |
| | | | | | | $ | 2,067,080 | | |
| Miscellaneous — 4.9% | | | |
| $ | 2,000 | | | Minneapolis, Art Center Facilities, (Walker Art Center),
5.125%, 7/1/21 | | $ | 2,089,520 | | |
| | | | | | | $ | 2,089,520 | | |
| Pooled Loans — 3.7% | | | |
| $ | 1,605 | | | Minneapolis, Community Development Agency,
Common Bond Fund, (AMT), 6.80%, 12/1/24 | | $ | 1,613,474 | | |
| | | | | | | $ | 1,613,474 | | |
Principal Amount
(000's omitted) | |
Security | |
Value | |
| Senior Living / Life Care — 5.6% | | | |
| $ | 1,000 | | | Columbia Heights, Multifamily, (Crestview Corp.),
6.00%, 3/1/33 | | $ | 1,005,170 | | |
| | 670 | | | Minneapolis, (Walker Methodist Senior Services),
6.00%, 11/15/28 | | | 661,739 | | |
| | 975 | | | St. Paul, Housing and Redevelopment, (Care Institute,
Inc.- Highland), 8.75%, 11/1/24(5) | | | 751,218 | | |
| | | | | | | $ | 2,418,127 | | |
| | Total Tax-Exempt Investments — 98.2%
(identified cost $39,614,077) | | | | | $ | 42,275,588 | | |
| | Other Assets, Less Liabilities — 1.8% | | | | | $ | 793,801 | | |
| | Net Assets — 100.0% | | | | | $ | 43,069,389 | | |
AMBAC - AMBAC Financial Group, Inc.
AMT - Interest earned from these securities may be considered a tax preference item for purposes of the Federal Alternative Minimum Tax.
FGIC - Financial Guaranty Insurance Company
FSA - Financial Security Assurance, Inc.
MBIA - Municipal Bond Insurance Association
The Fund invests primarily in debt securities issued by Minnesota municipalities. The ability of the issuers of the debt securities to meet their obligations may be affected by economic developments in a specific industry or municipality. In order to reduce the risk associated with such economic developments, at January 31, 2006, 35.6% of the securities in the portfolio of investments are backed by bond insurance of various financial institutions and financial guaranty assurance agencies. The aggregate percentage insured by an individual financial institution ranged from 3.6% to 21.3% of total investments.
(1) Security exempt from registration under Rule 144A of the Securities Act of 1933. These securities may be sold in transactions exempt from registration, normally to qualified institutional buyers. At January 31, 2006, the aggregate value of the securities is $2,660,877 or 6.2% of the Fund's net assets.
(2) Security has been issued as an inverse floater bond. The stated interest rate represents the rate in effect at January 31, 2006.
(3) Security has been issued as a leveraged inverse floater bond. The stated interest rate represents the rate in effect at January 31, 2006.
(4) Security (or a portion thereof) has been segregated to cover margin requirements on open financial futures contracts.
(5) Security is in default and making only partial interest payments.
See notes to financial statements
24
Eaton Vance New Jersey Municipals Fund as of January 31, 2006
PORTFOLIO OF INVESTMENTS (Unaudited)
| Tax-Exempt Investments — 98.8% | | | |
Principal Amount
(000's omitted) | |
Security | |
Value | |
| Cogeneration — 0.4% | | | |
| $ | 1,000 | | | New Jersey EDA, (Trigen Trenton), (AMT),
6.20%, 12/1/07 | | $ | 1,007,150 | �� | |
| | | | | | | $ | 1,007,150 | | |
| Education — 0.4% | | | |
| $ | 1,000 | | | New Jersey Educational Facilities Authority, (Stevens
Institute of Technology), 5.25%, 7/1/32 | | $ | 1,033,750 | | |
| | | | | | | $ | 1,033,750 | | |
| Electric Utilities — 4.8% | | | |
| $ | 9,000 | | | Puerto Rico Electric Power Authority, 0.00%, 7/1/17 | | $ | 5,599,530 | | |
| | 2,000 | | | Puerto Rico Electric Power Authority, 0.00%, 7/1/17 | | | 1,244,340 | | |
| | 2,000 | | | Puerto Rico Electric Power Authority, Variable Rate,
6.976%, 7/1/29(1)(2) | | | 2,130,560 | | |
| | 2,500 | | | Salem County, Pollution Control Financing, (Public Services
Enterprise Group, Inc.), (AMT), 5.75%, 4/1/31 | | | 2,652,475 | | |
| | | | | | | $ | 11,626,905 | | |
| General Obligations — 1.1% | | | |
| $ | 3,000 | | | Mercer County Improvement Authority, 0.00%, 4/1/10 | | $ | 2,583,450 | | |
| | | | | | | $ | 2,583,450 | | |
| Health Care-Miscellaneous — 0.5% | | | |
| $ | 1,205 | | | New Jersey EDA, (Hudson County Occupational Center),
6.50%, 7/1/18 | | $ | 1,244,476 | | |
| | | | | | | $ | 1,244,476 | | |
| Hospital — 12.6% | | | |
| $ | 600 | | | Camden County, Improvement Authority, (Cooper Health
System), 5.00%, 2/15/25 | | $ | 602,802 | | |
| | 1,350 | | | Camden County, Improvement Authority, (Cooper Health
System), 5.00%, 2/15/35 | | | 1,332,652 | | |
| | 1,200 | | | Camden County, Improvement Authority, (Cooper Health
System), 5.25%, 2/15/27 | | | 1,222,884 | | |
| | 2,250 | | | Camden County, Improvement Authority, (Cooper Health
System), 5.75%, 2/15/34 | | | 2,368,462 | | |
| | 2,000 | | | New Jersey Health Care Facilities Financing Authority,
(Atlantic City Medical Center), 5.75%, 7/1/25 | | | 2,151,180 | | |
| | 3,000 | | | New Jersey Health Care Facilities Financing Authority,
(Capital Health System), 5.25%, 7/1/17 | | | 3,081,870 | | |
| | 2,625 | | | New Jersey Health Care Facilities Financing Authority,
(Capital Health System), 5.375%, 7/1/33 | | | 2,705,745 | | |
Principal Amount
(000's omitted) | |
Security | |
Value | |
| Hospital (continued) | | | |
| $ | 1,505 | | | New Jersey Health Care Facilities Financing Authority,
(Hackensack University Medical Center), 6.00%, 1/1/34 | | $ | 1,601,997 | | |
| | 2,700 | | | New Jersey Health Care Facilities Financing Authority,
(Hackensack University Medical Center), 6.00%, 1/1/25 | | | 2,886,084 | | |
| | 1,020 | | | New Jersey Health Care Facilities Financing Authority,
(Hunterdon Medical Center), 5.125%, 7/1/35 | | | 1,038,921 | | |
| | 2,000 | | | New Jersey Health Care Facilities Financing Authority,
(Robert Wood Johnson University Hospital),
5.75%, 7/1/31 | | | 2,127,440 | | |
| | 1,800 | | | New Jersey Health Care Facilities Financing Authority,
(Saint Peters University Hospital), 6.875%, 7/1/30 | | | 1,962,648 | | |
| | 1,800 | | | New Jersey Health Care Facilities Financing Authority,
(Saint Peters University Hospital), 6.875%, 7/1/20 | | | 1,988,370 | | |
| | 550 | | | New Jersey Health Care Facilities Financing Authority,
(St. Elizabeth's Hospital), 6.00%, 7/1/20 | | | 572,005 | | |
| | 2,000 | | | New Jersey Health Care Facilities Financing Authority,
(St. Elizabeth's Hospital), 6.00%, 7/1/27 | | | 2,071,620 | | |
| | 2,500 | | | New Jersey Health Care Facilities Financing Authority,
(Trinitas Hospital), 7.50%, 7/1/30 | | | 2,783,275 | | |
| | | | | | | $ | 30,497,955 | | |
| Housing — 3.2% | | | |
| $ | 7,640 | | | New Jersey Housing & Mortgage Finance Agency, (AMT),
5.00%, 10/1/36 | | $ | 7,717,852 | | |
| | | | | | | $ | 7,717,852 | | |
| Industrial Development Revenue — 4.1% | | | |
| $ | 1,875 | | | New Jersey EDA, (Continental Airlines), (AMT),
6.25%, 9/15/29 | | $ | 1,740,337 | | |
| | 1,875 | | | New Jersey EDA, (Continental Airlines), (AMT),
9.00%, 6/1/33 | | | 2,049,787 | | |
| | 1,500 | | | New Jersey EDA, (Holt Hauling), (AMT),
7.90%, 3/1/27(3) | | | 1,448,250 | | |
| | 5,640 | | | New Jersey EDA, (Holt Hauling), (AMT),
8.95%, 12/15/18(3) | | | 4,799,640 | | |
| | | | | | | $ | 10,038,014 | | |
| Insured-Electric Utilities — 1.3% | | | |
| $ | 1,300 | | | Puerto Rico Electric Power Authority, (MBIA), Variable Rate,
10.075%, 7/1/16(1)(4) | | $ | 1,837,030 | | |
| | 1,180 | | | Puerto Rico Electric Power Authority, DRIVERS, (FSA),
Variable Rate, 9.27%, 7/1/29(1)(4) | | | 1,416,012 | | |
| | | | | | | $ | 3,253,042 | | |
See notes to financial statements
25
Eaton Vance New Jersey Municipals Fund as of January 31, 2006
PORTFOLIO OF INVESTMENTS (Unaudited) CONT'D
Principal Amount
(000's omitted) | |
Security | |
Value | |
| Insured-Escrowed / Prerefunded — 3.5% | | | |
| $ | 2,155 | | | New Jersey EDA, RITES, (FSA), Prerefunded to 5/1/09,
Variable Rate, 8.584%, 5/1/18(1)(4) | | $ | 2,471,397 | | |
| | 110 | | | New Jersey Turnpike Authority, (MBIA), Escrowed to
Maturity, 6.50%, 1/1/16 | | | 129,688 | | |
| | 1,565 | | | New Jersey Turnpike Authority, (MBIA), Escrowed to
Maturity, 6.50%, 1/1/16 | | | 1,841,489 | | |
| | 3,775 | | | Puerto Rico Infrastructure Financing Authority,
(AMBAC), Prerefunded to 1/1/08, Variable Rate,
6.824%, 7/1/28(1)(2) | | | 4,087,230 | | |
| | | | | | | $ | 8,529,804 | | |
| Insured-Gas Utilities — 4.2% | | | |
| $ | 10,000 | | | New Jersey EDA, New Jersey Natural Gas Co., (FGIC),
4.90%, 10/1/40 | | $ | 10,109,100 | | |
| | | | | | | $ | 10,109,100 | | |
| Insured-General Obligations — 6.7% | | | |
| $ | 2,000 | | | Branchburg Township Board of Education, (FSA),
5.00%, 2/1/26 | | $ | 2,067,380 | | |
| | 1,325 | | | Colts Neck Township Board of Education, (FSA),
5.00%, 2/1/23 | | | 1,440,752 | | |
| | 1,650 | | | Colts Neck Township Board of Education, (FSA),
5.00%, 2/1/27 | | | 1,775,202 | | |
| | 2,132 | | | Elmwood Park Board of Education, (FSA),
4.50%, 8/1/29 | | | 2,130,465 | | |
| | 1,000 | | | High Bridge Board of Education, (FSA), 5.00%, 2/15/26 | | | 1,112,700 | | |
| | 5,350 | | | Irvington Township, (FSA), 0.00%, 7/15/22 | | | 2,588,918 | | |
| | 5,350 | | | Irvington Township, (FSA), 0.00%, 7/15/23 | | | 2,464,531 | | |
| | 2,000 | | | Irvington Township, (FSA), 0.00%, 7/15/24 | | | 874,980 | | |
| | 1,750 | | | Madison Boro Board of Education, (MBIA),
4.75%, 7/15/35 | | | 1,771,910 | | |
| | | | | | | $ | 16,226,838 | | |
| Insured-Hospital — 5.7% | | | |
| $ | 4,250 | | | New Jersey EDA, (Hillcrest Health Services), (AMBAC),
0.00%, 1/1/19 | | $ | 2,419,313 | | |
| | 3,000 | | | New Jersey EDA, (Hillcrest Health Services), (AMBAC),
0.00%, 1/1/21 | | | 1,544,670 | | |
| | 10,970 | | | New Jersey EDA, (St. Barnabas Medical Center), (MBIA),
0.00%, 7/1/26 | | | 4,283,017 | | |
| | 2,890 | | | New Jersey Health Care Facilities Financing Authority,
(St. Barnabas Health Center), (MBIA), Variable Rate,
7.834%, 7/1/28(1)(4) | | | 2,976,064 | | |
| | 6,000 | | | New Jersey Health Care Facilities Financing Authority,
(St. Barnabas Medical Center), (MBIA), 0.00%, 7/1/23 | | | 2,726,640 | | |
| | | | | | | $ | 13,949,704 | | |
Principal Amount
(000's omitted) | |
Security | |
Value | |
Insured-Lease Revenue / Certificates of
Participation — 0.9% | | | |
| $ | 2,255 | | | Gloucester County Improvement Authority, (MBIA),
4.75%, 9/1/30 | | $ | 2,290,516 | | |
| | | | | | | $ | 2,290,516 | | |
| Insured-Private Education — 1.0% | | | |
| $ | 2,450 | | | New Jersey Educational Facilities Authority,
(Kean University), (MBIA), 4.50%, 7/1/37 | | $ | 2,385,590 | | |
| | | | | | | $ | 2,385,590 | | |
| Insured-Special Tax Revenue — 4.3% | | | |
| $ | 10,620 | | | Garden State Preservation Trust, (FSA), 0.00%, 11/1/24 | | $ | 4,585,185 | | |
| | 10,000 | | | Garden State Preservation Trust, (FSA), 0.00%, 11/1/27 | | | 3,695,200 | | |
| | 2,000 | | | New Jersey EDA, (Motor Vehicle Surcharges), (MBIA),
5.25%, 7/1/26 | | | 2,260,800 | | |
| | | | | | | $ | 10,541,185 | | |
| Insured-Transportation — 16.4% | | | |
| $ | 1,675 | | | Delaware River Port Authority, (FSA), 5.20%, 1/1/25 | | $ | 1,777,376 | | |
| | 3,250 | | | Delaware River Port Authority, (FSA), 5.20%, 1/1/27 | | | 3,435,315 | | |
| | 5,500 | | | Delaware River Port Authority, (FSA), 5.75%, 1/1/26 | | | 5,901,170 | | |
| | 325 | | | New Jersey Turnpike Authority, (MBIA), 6.50%, 1/1/16 | | | 381,557 | | |
| | 5,000 | | | New Jersey Turnpike Authority, RITES, (MBIA),
Variable Rate, 9.354%, 1/1/16(2) | | | 6,740,400 | | |
| | 1,500 | | | Newark Housing Authority, (Newark Marine Terminal),
(MBIA), 5.00%, 1/1/25 | | | 1,567,215 | | |
| | 2,500 | | | Newark Housing Authority, (Newark Marine Terminal),
(MBIA), 5.00%, 1/1/37 | | | 2,584,900 | | |
| | 2,100 | | | Puerto Rico Highway and Transportation Authority, (AGC),
5.00%, 7/1/45 | | | 2,164,344 | | |
| | 4,635 | | | Puerto Rico Highway and Transportation Authority, (CIFG),
5.25%, 7/1/41 | | | 5,189,717 | | |
| | 3,000 | | | Puerto Rico Highway and Transportation Authority, (XLCA),
5.50%, 7/1/36 | | | 3,327,540 | | |
| | 5,800 | | | South Jersey Transportation Authority, (FGIC),
4.50%, 11/1/35 | | | 5,701,516 | | |
| | 1,100 | | | South Jersey Transportation Authority, (FGIC),
5.00%, 11/1/33 | | | 1,143,780 | | |
| | | | | | | $ | 39,914,830 | | |
| Insured-Water and Sewer — 3.4% | | | |
| $ | 2,285 | | | Middlesex County Utilities Authority, (MBIA),
6.25%, 8/15/10 | | $ | 2,432,817 | | |
| | 13,840 | | | North Hudson Sewer Authority, (MBIA), 0.00%, 8/1/25 | | | 5,751,627 | | |
| | | | | | | $ | 8,184,444 | | |
See notes to financial statements
26
Eaton Vance New Jersey Municipals Fund as of January 31, 2006
PORTFOLIO OF INVESTMENTS (Unaudited) CONT'D
Principal Amount
(000's omitted) | |
Security | |
Value | |
| Lease Revenue / Certificates of Participation — 4.0% | | | |
| $ | 720 | | | Atlantic City, Public Facilities Lease Agreement,
8.875%, 1/15/14 | | $ | 928,900 | | |
| | 785 | | | Atlantic City, Public Facilities Lease Agreement,
8.875%, 1/15/15 | | | 1,032,424 | | |
| | 2,591 | | | New Jersey Building Authority, (Garden State Savings
Bonds), 0.00%, 6/15/10 | | | 2,205,563 | | |
| | 1,650 | | | New Jersey EDA, (Economic Recovery), Contract Lease,
0.00%, 9/15/09 | | | 1,448,519 | | |
| | 5,500 | | | New Jersey EDA, (Economic Recovery), Contract Lease,
0.00%, 3/15/13 | | | 4,160,970 | | |
| | | | | | | $ | 9,776,376 | | |
| Other Revenue — 3.9% | | | |
| $ | 16,000 | | | Children's Trust Fund, PR, Tobacco Settlement,
0.00%, 5/15/50 | | $ | 1,013,760 | | |
| | 13,600 | | | Children's Trust Fund, PR, Tobacco Settlement,
0.00%, 5/15/55 | | | 461,856 | | |
| | 2,000 | | | Puerto Rico Infrastructure Financing Authority,
Variable Rate, 10.168%, 10/1/34(1)(4) | | | 2,483,780 | | |
| | 3,175 | | | Tobacco Settlement Financing Corp., 6.75%, 6/1/39 | | | 3,567,208 | | |
| | 1,500 | | | Tobacco Settlement Financing Corp., Variable Rate,
10.555%, 6/1/39(1)(2) | | | 1,870,605 | | |
| | | | | | | $ | 9,397,209 | | |
| Pooled Loans — 0.3% | | | |
| $ | 800 | | | New Jersey Higher Educational Student Loan Bonds,
(AMT), 0.00%, 7/1/10 | | $ | 604,216 | | |
| | | | | | | $ | 604,216 | | |
| Senior Living / Life Care — 2.8% | | | |
| $ | 2,650 | | | New Jersey EDA, (Fellowship Village), 5.50%, 1/1/18 | | $ | 2,688,478 | | |
| | 2,115 | | | New Jersey EDA, (Fellowship Village), 5.50%, 1/1/25 | | | 2,129,319 | | |
| | 3,390 | | | New Jersey EDA, (Forsgate), (AMT), 8.625%, 6/1/25(5) | | | 2,036,000 | | |
| | | | | | | $ | 6,853,797 | | |
| Special Tax Revenue — 1.6% | | | |
| $ | 3,500 | | | New Jersey EDA, (Cigarette Tax), Variable Rate,
7.89%, 6/15/34(1)(2) | | $ | 3,862,460 | | |
| | | | | | | $ | 3,862,460 | | |
| Transportation — 9.3% | | | |
| $ | 19,000 | | | Port Authority of New York and New Jersey,
6.125%, 6/1/94(6) | | $ | 22,653,130 | | |
| | | | | | | $ | 22,653,130 | | |
Principal Amount
(000's omitted) | |
Security | |
Value | |
| Water and Sewer — 2.4% | |
| $ | 5,565 | | | New Jersey EDA, (Atlantic City Sewer), (AMT),
5.45%, 4/1/28 | | $ | 5,740,854 | | |
| | | | | $ | 5,740,854 | | |
Total Tax-Exempt Investments — 98.8%
(identified cost $221,255,559) | | | | $ | 240,022,647 | | |
| Other Assets, Less Liabilities — 1.2% | | | | $ | 2,903,266 | | |
| Net Assets — 100.0% | | | | $ | 242,925,913 | | |
AGC - Assured Guaranty Corp.
AMBAC - AMBAC Financial Group, Inc.
AMT - Interest earned from these securities may be considered a tax preference item for purposes of the Federal Alternative Minimum Tax.
CIFG - CDC IXIS Financial Guaranty North America, Inc.
FGIC - Financial Guaranty Insurance Company
FSA - Financial Security Assurance, Inc.
MBIA - Municipal Bond Insurance Association
XLCA - XL Capital Assurance, Inc.
The Fund invests primarily in debt securities issued by New Jersey municipalities. The ability of the issuers of the debt securities to meet their obligations may be affected by economic developments in a specific industry or municipality. In order to reduce the risk associated with such economic developments, at January 31, 2006, 48.1% of the securities in the portfolio of investments are backed by bond insurance of various financial institutions and financial guaranty assurance agencies. The aggregate percentage insured by an individual financial institution ranged from 0.9% to 17.5% of total investments.
(1) Security exempt from registration under Rule 144A of the Securities Act of 1933. These securities may be sold in transactions exempt from registration, normally to qualified institutional buyers. At January 31, 2006, the aggregate value of the securities is $23,135,138 or 9.5% of the Fund's net assets.
(2) Security has been issued as an inverse floater bond. The stated interest rate represents the rate in effect at January 31, 2006.
(3) Defaulted bond.
(4) Security has been issued as a leveraged inverse floater bond. The stated interest rate represents the rate in effect at January 31, 2006.
(5) Security is in default and making only partial interest payments.
(6) Security (or a portion thereof) has been segregated to cover margin requirements on open financial futures contracts.
See notes to financial statements
27
Eaton Vance Pennsylvania Municipals Fund as of January 31, 2006
PORTFOLIO OF INVESTMENTS (Unaudited)
| Tax-Exempt Investments — 100.6% | | | |
Principal Amount
(000's omitted) | | Security | | Value | |
| Cogeneration — 3.5% | | | |
| $ | 1,435 | | | Carbon County IDA, (Panther Creek Partners), (AMT),
6.65%, 5/1/10 | | $ | 1,538,162 | | |
| | 5,000 | | | Pennsylvania EDA, (Northampton Generating), (AMT),
6.50%, 1/1/13 | | | 4,999,550 | | |
| | 1,000 | | | Pennsylvania EDA, (Northampton Generating), (AMT),
6.60%, 1/1/19 | | | 1,009,830 | | |
| | | | | | | $ | 7,547,542 | | |
| Education — 0.5% | | | |
| $ | 1,100 | | | Lehigh County, General Purpose Authority, (Cedar Crest
College), 6.70%, 4/1/26 | | $ | 1,126,213 | | |
| | | | | | | $ | 1,126,213 | | |
| Electric Utilities — 2.1% | | | |
| $ | 2,000 | | | Pennsylvania EDA, (Reliant Energy, Inc.), (AMT),
6.75%, 12/1/36 | | $ | 2,132,240 | | |
| | 2,250 | | | York County IDA, Pollution Control, (Public Service
Enterprise Group, Inc.), 5.50%, 9/1/20 | | | 2,376,427 | | |
| | | | | | | $ | 4,508,667 | | |
| Escrowed / Prerefunded — 0.9% | | | |
| $ | 1,835 | | | Grove City, Area Hospital Authority, (Grove Manor),
Prerefunded to 8/15/08, 6.625%, 8/15/29 | | $ | 1,921,410 | | |
| | | | | | | $ | 1,921,410 | | |
| General Obligations — 0.5% | | | |
| $ | 1,000 | | | Radnor Township, 5.125%, 7/15/34 | | $ | 1,047,830 | | |
| | | | | | | $ | 1,047,830 | | |
| Health Care-Miscellaneous — 3.0% | | | |
| $ | 2,000 | | | Allegheny County IDA, (Residual Resources, Inc.),
6.50%, 9/1/21 | | $ | 2,123,000 | | |
| | 700 | | | Allegheny County, (Residential Resources, Inc.),
6.60%, 9/1/31 | | | 737,471 | | |
| | 3,500 | | | Chester County HEFA, (Devereux Foundation),
6.00%, 11/1/29 | | | 3,667,265 | | |
| | | | | | | $ | 6,527,736 | | |
Principal Amount
(000's omitted) | |
Security | |
Value | |
| Hospital — 12.5% | | | |
| $ | 3,060 | | | Hazelton Health Service Authority, (Hazelton General
Hospital), 5.50%, 7/1/27 | | $ | 2,797,636 | | |
| | 1,150 | | | Horizon Hospital Systems Authority, (Horizon Hospital
Systems, Inc.), 6.35%, 5/15/26 | | | 1,179,394 | | |
| | 2,500 | | | Lancaster County, Hospital Authority, 5.50%, 3/15/26 | | | 2,617,775 | | |
| | 2,150 | | | Lebanon County Health Facility Authority, (Good Samaritan
Hospital), 6.00%, 11/15/35 | | | 2,307,552 | | |
| | 5,000 | | | Lehigh County, General Purpose Authority, (Lehigh Valley
Health Network), 5.25%, 7/1/32 | | | 5,136,200 | | |
| | 2,000 | | | Monroe County, Hospital Authority, (Pocono Medical Center),
6.00%, 1/1/43 | | | 2,127,720 | | |
| | 1,110 | | | Montgomery County Higher Education and Health Authority,
(Catholic Health East), 5.375%, 11/15/34 | | | 1,160,505 | | |
| | 4,100 | | | Pennsylvania HEFA, (UPMC Health System),
6.00%, 1/15/31 | | | 4,480,562 | | |
| | 2,850 | | | St. Mary Hospital Authority, (Catholic Health East),
5.375%, 11/15/34 | | | 2,979,675 | | |
| | 1,885 | | | Washington County Hospital Authority, (Monongahela
Hospital), 5.50%, 6/1/17 | | | 2,009,806 | | |
| | | | | | | $ | 26,796,825 | | |
| Industrial Development Revenue — 1.6% | | | |
| $ | 500 | | | Erie IDA, (International Paper), (AMT), 5.85%, 12/1/20 | | $ | 516,555 | | |
| | 1,500 | | | New Morgan IDA, (Browning-Ferris Industries, Inc.), (AMT),
6.50%, 4/1/19 | | | 1,496,415 | | |
| | 1,500 | | | Pennsylvania EDA, (Waste Management, Inc.), (AMT),
5.10%, 10/1/27 | | | 1,505,790 | | |
| | | | | | | $ | 3,518,760 | | |
| Insured-Education — 2.1% | | | |
| $ | 1,000 | | | Chester County, IDA Educational Facility, (Westtown School),
(AMBAC), 5.00%, 1/1/31 | | $ | 1,028,560 | | |
| | 1,350 | | | Lycoming County Authority, (Pennsylvania College of
Technology), (AMBAC), 5.25%, 5/1/32(1) | | | 1,426,963 | | |
| | 2,000 | | | Pennsylvania HEFA, (University of the Science in
Philadelphia), (XLCA), 4.75%, 11/1/33 | | | 2,015,500 | | |
| | | | | | | $ | 4,471,023 | | |
| Insured-Electric Utilities — 8.3% | | | |
| $ | 8,000 | | | Beaver IDA, (Ohio Edison Co.), (AMBAC), 7.05%, 10/1/20 | | $ | 8,183,280 | | |
| | 2,000 | | | Lehigh County IDA, (PPL Electric Utilities Corp.), (FGIC),
4.70%, 9/1/29 | | | 2,016,260 | | |
| | 5,500 | | | Lehigh County IDA, (PPL Electric Utilities Corp.), (FGIC),
4.75%, 2/15/27 | | | 5,586,790 | | |
| | 1,665 | | | Puerto Rico Electric Power Authority, (FSA), Variable Rate,
9.27%, 7/1/29(2)(3) | | | 1,998,017 | | |
| | | | | | | $ | 17,784,347 | | |
See notes to financial statements
28
Eaton Vance Pennsylvania Municipals Fund as of January 31, 2006
PORTFOLIO OF INVESTMENTS (Unaudited) CONT'D
Principal Amount
(000's omitted) | |
Security | |
Value | |
| Insured-Escrowed / Prerefunded — 12.8% | | | |
| $ | 2,540 | | | Allegheny County Sanitation Authority, (MBIA),
Prerefunded to 12/1/10, 5.50%, 12/1/30 | | $ | 2,767,101 | | |
| | 2,500 | | | Erie School District, (MBIA), Escrowed to Maturity,
0.00%, 5/1/19 | | | 1,411,700 | | |
| | 2,625 | | | Erie School District, (MBIA), Escrowed to Maturity,
0.00%, 5/1/20 | | | 1,407,892 | | |
| | 2,625 | | | Erie School District, (MBIA), Escrowed to Maturity,
0.00%, 5/1/21 | | | 1,335,652 | | |
| | 3,625 | | | Erie School District, (MBIA), Escrowed to Maturity,
0.00%, 5/1/22 | | | 1,750,585 | | |
| | 1,750 | | | Lower Moreland, Township Authority, Sewer Revenue,
(FSA), Prefefunded to 8/1/09, 5.00%, 8/1/29 | | | 1,840,772 | | |
| | 1,430 | | | Mars Area, School District, (MBIA), Escrowed to Maturity,
0.00%, 3/1/14 | | | 1,033,561 | | |
| | 2,320 | | | McKeesport Area School District, (AMBAC), Escrowed to
Maturity, 0.00%, 10/1/25 | | | 946,699 | | |
| | 1,365 | | | Pennsylvania Turnpike Commission, (AMBAC), Escrowed to
Maturity, 4.75%, 12/1/27 | | | 1,382,376 | | |
| | 2,750 | | | Pennsylvania Turnpike Commission, (AMBAC),
Prerefunded to 7/15/11, 5.00%, 7/15/41 | | | 2,973,547 | | |
| | 1,000 | | | Philadelphia School District, (FSA), Prerefunded to 2/1/12,
5.50%, 2/1/31 | | | 1,104,260 | | |
| | 865 | | | Puerto Rico Highway and Transportation Authority,
(MBIA), Prerefunded to 7/1/06, Variable Rate,
10.163%, 7/1/26(2)(3) | | | 928,517 | | |
| | 4,845 | | | Westmoreland Municipal Authority, (FGIC), Escrowed to
Maturity, 0.00%, 8/15/19 | | | 2,698,423 | | |
| | 5,400 | | | Westmoreland Municipal Authority, (FGIC), Escrowed to
Maturity, 0.00%, 8/15/20 | | | 2,859,894 | | |
| | 5,780 | | | Westmoreland Municipal Authority, (FGIC), Escrowed to
Maturity, 0.00%, 8/15/20 | | | 3,056,753 | | |
| | | | | | | $ | 27,497,732 | | |
| Insured-General Obligations — 19.6% | | | |
| $ | 2,170 | | | Elizabeth Forward School District, (MBIA),
0.00%, 9/1/20 | | $ | 1,138,859 | | |
| | 2,170 | | | Elizabeth Forward School District, (MBIA), 0.00%, 9/1/21 | | | 1,081,333 | | |
| | 2,170 | | | Elizabeth Forward School District, (MBIA), 0.00%, 9/1/22 | | | 1,027,386 | | |
| | 2,170 | | | Elizabeth Forward School District, (MBIA), 0.00%, 9/1/23 | | | 975,372 | | |
| | 4,350 | | | Erie School District, (AMBAC), 0.00%, 9/1/30 | | | 1,371,773 | | |
| | 1,075 | | | Greater Nanticoke Area School District, (MBIA),
0.00%, 10/15/28 | | | 373,799 | | |
| | 1,075 | | | Greater Nanticoke Area School District, (MBIA),
0.00%, 10/15/29 | | | 356,148 | | |
| | 2,365 | | | Harrisburg, (AMBAC), 0.00%, 3/15/17 | | | 1,466,395 | | |
| | 5,175 | | | Hazelton School District, (FGIC), 0.00%, 3/1/21 | | | 2,637,077 | | |
| | 1,000 | | | Hopewell School District, (FSA), 0.00%, 9/1/22 | | | 472,220 | | |
| | 2,000 | | | Hopewell School District, (FSA), 0.00%, 9/1/26 | | | 766,220 | | |
Principal Amount
(000's omitted) | |
Security | |
Value | |
| Insured-General Obligations (continued) | | | |
| $ | 1,315 | | | Lake Lehman School District, (MBIA), 0.00%, 4/1/26 | | $ | 513,060 | | |
| | 1,100 | | | McKeesport Area School District, (AMBAC), 0.00%, 10/1/25 | | | 443,718 | | |
| | 2,340 | | | McKeesport Area School District, (AMBAC), 0.00%, 10/1/27 | | | 853,398 | | |
| | 5,400 | | | Northampton County, (FSA), 5.25%, 10/1/30 | | | 5,747,058 | | |
| | 7,000 | | | Philadelphia School District, (FGIC), 5.125%, 6/1/34 | | | 7,295,890 | | |
| | 2,530 | | | Philadelphia, (FSA), 5.00%, 3/15/28 | | | 2,595,426 | | |
| | 3,355 | | | Philadelphia, (FSA), 5.25%, 9/15/25 | | | 3,556,266 | | |
| | 3,300 | | | Puerto Rico, (FSA), Variable Rate, 9.42%, 7/1/27(2)(3) | | | 3,921,786 | | |
| | 500 | | | Puerto Rico, (MBIA), Variable Rate, 10.075%, 7/1/20(2)(3) | | | 727,710 | | |
| | 655 | | | Rochester Area School District, (AMBAC), 0.00%, 5/1/10 | | | 561,715 | | |
| | 4,000 | | | Spring Ford School District, (FGIC), 4.75%, 3/1/25 | | | 4,036,960 | | |
| | | | | | | $ | 41,919,569 | | |
| Insured-Hospital — 4.4% | | | |
| $ | 3,750 | | | Allegheny County Hospital Authority, (Magee-Womens
Hospital), (FGIC), 0.00%, 10/1/15 | | $ | 2,496,638 | | |
| | 4,000 | | | Pennsylvania Higher Educational Facilities Authority,
(UPMC Health System), (FSA), 5.00%, 8/1/29 | | | 4,110,760 | | |
| | 1,250 | | | Sharon Health System Authority, (Sharon Regional Health
System), (MBIA), 5.00%, 12/1/28 | | | 1,276,263 | | |
| | 1,310 | | | Washington County Hospital Authority, (Washington
Hospital), (AMBAC), 5.50%, 7/1/17 | | | 1,466,309 | | |
| | | | | | | $ | 9,349,970 | | |
Insured-Lease Revenue / Certificates of
Participation — 0.3% | | | |
| $ | 500 | | | Puerto Rico Public Finance Corp., (AMBAC), Variable Rate,
8.88%, 6/1/24(2)(3) | | $ | 666,905 | | |
| | | | | | | $ | 666,905 | | |
| Insured-Special Tax Revenue — 0.3% | | | |
| $ | 635 | | | Pennsylvania Turnpike Commission, Franchise Tax Revenue,
(AMBAC), 4.75%, 12/1/27 | | $ | 639,896 | | |
| | | | | | | $ | 639,896 | | |
| Insured-Transportation — 9.4% | | | |
| $ | 1,600 | | | Allegheny County Port Authority, (FGIC), 5.00%, 3/1/29 | | $ | 1,650,256 | | |
| | 5,000 | | | Pennsylvania Turnpike Commission, (FSA), 5.25%, 7/15/30 | | | 5,677,300 | | |
| | 2,810 | | | Pennsylvania Turnpike Commission, (FSA), Variable Rate,
9.20%, 1/15/23(2)(3) | | | 3,933,326 | | |
| | 2,100 | | | Puerto Rico Highway and Transportation Authority, (AGC),
5.00%, 7/1/45 | | | 2,164,344 | | |
| | 6,000 | | | Puerto Rico Highway and Transportation Authority, (CIFG),
5.25%, 7/1/41 | | | 6,718,080 | | |
| | | | | | | $ | 20,143,306 | | |
See notes to financial statements
29
Eaton Vance Pennsylvania Municipals Fund as of January 31, 2006
PORTFOLIO OF INVESTMENTS (Unaudited) CONT'D
Principal Amount
(000's omitted) | |
Security | |
Value | |
| Insured-Utilities — 4.3% | | | |
| $ | 5,500 | | | Philadelphia Gas Works Revenue, (FSA), 5.00%, 7/1/28 | | $ | 5,630,405 | | |
| | 2,700 | | | Philadelphia Gas Works Revenue, (FSA), Variable Rate,
9.64%, 7/1/17(2)(3) | | | 3,614,193 | | |
| | | | | | | $ | 9,244,598 | | |
| Insured-Water and Sewer — 3.5% | | | |
| $ | 460 | | | Allegheny County Sanitation Authority, (MBIA),
5.50%, 12/1/30 | | $ | 496,391 | | |
| | 1,000 | | | Harrisburg Authority Water Revenue, (FSA),
5.00%, 7/15/29 | | | 1,033,100 | | |
| | 2,500 | | | Philadelphia Water and Wastewater, (FGIC), Variable Rate,
8.535%, 11/1/31(2)(3) | | | 2,735,550 | | |
| | 3,000 | | | Pittsburgh Water and Sewer Authority, (AMBAC),
5.125%, 12/1/27 | | | 3,174,630 | | |
| | | | | | | $ | 7,439,671 | | |
| Nursing Home — 4.0% | | | |
| $ | 2,000 | | | Allegheny County HDA, (Villa St. Joseph),
6.00%, 8/15/28 | | $ | 1,982,860 | | |
| | 620 | | | Chartiers Valley IDA, (Beverly Enterprises, Inc.),
5.375%, 6/1/07 | | | 620,223 | | |
| | 1,510 | | | Green County IDA, (Beverly Enterprises, Inc.),
5.75%, 3/1/13 | | | 1,512,295 | | |
| | 3,060 | | | Montgomery IDA, (Advancement of Geriatric Health Care
Institute), 8.375%, 7/1/23 | | | 3,068,170 | | |
| | 1,280 | | | Westmoreland County IDA, (Highland Health Systems, Inc.),
9.25%, 6/1/22 | | | 1,280,717 | | |
| | | | | | | $ | 8,464,265 | | |
| Senior Living / Life Care — 5.7% | | | |
| $ | 1,210 | | | Bucks County IDA, (Pennswood), 6.00%, 10/1/27 | | $ | 1,283,411 | | |
| | 2,500 | | | Cliff House Trust, (AMT), 6.625%, 6/1/27 | | | 1,469,050 | | |
| | 1,700 | | | Crawford County Hospital Authority, (Wesbury United
Methodist Community), 6.25%, 8/15/29 | | | 1,759,126 | | |
| | 4,050 | | | Delaware County, (White Horse Village), 7.50%, 7/1/18 | | | 4,159,229 | | |
| | 1,835 | | | Lancaster County, Hospital Authority, (Willow Valley
Retirement Communities), 5.875%, 6/1/31 | | | 1,927,539 | | |
| | 500 | | | Montgomery County Higher Education and Health Authority,
(Faulkeways at Gwynedd), 6.75%, 11/15/24 | | | 529,790 | | |
| | 1,100 | | | Philadelphia HEFA, (The Philadelphia Protestant Home),
6.50%, 7/1/27 | | | 1,109,812 | | |
| | | | | | | $ | 12,237,957 | | |
Principal Amount
(000's omitted) | |
Security | |
Value | |
| Transportation — 1.3% | | | |
| $ | 1,000 | | | Delaware River Joint Toll Bridge Commission,
5.00%, 7/1/28 | | $ | 1,029,920 | | |
| | 1,000 | | | Erie Municipal Airport Authority, (AMT), 5.875%, 7/1/16 | | | 1,003,000 | | |
| | 750 | | | Pennsylvania EDA, (Amtrak), (AMT), 6.25%, 11/1/31 | | | 806,625 | | |
| | | | | | | $ | 2,839,545 | | |
| | Total Tax-Exempt Investments — 100.6%
(identified cost $201,419,087) | | | | | $ | 215,693,767 | | |
| | Other Assets, Less Liabilities — (0.6)% | | | | | $ | (1,360,117 | ) | |
| | Net Assets — 100.0% | | | | | $ | 214,333,650 | | |
AGC - Assured Guaranty Corp.
AMBAC - AMBAC Financial Group, Inc.
AMT - Interest earned from these securities may be considered a tax preference item for purposes of the Federal Alternative Minimum Tax.
CIFG - CDC IXIS Financial Guaranty North America, Inc.
FGIC - Financial Guaranty Insurance Company
FSA - Financial Security Assurance, Inc.
MBIA - Municipal Bond Insurance Association
XLCA - XL Capital Assurance, Inc.
The Fund invests primarily in debt securities issued by Pennsylvania municipalities. The ability of the issuers of the debt securities to meet their obligations may be affected by economic developments in a specific industry or municipality. In order to reduce the risk associated with such economic developments, at January 31, 2006, 64.5% of the securities in the portfolio of investments are backed by bond insurance of various financial institutions and financial guaranty assurance agencies. The aggregate percentage insured by an individual financial institution ranged from 0.9% to 21.3% of total investments.
(1) Security (or a portion thereof) has been segregated to cover margin requirements on open financial futures contracts.
(2) Security exempt from registration under Rule 144A of the Securities Act of 1933. These securities may be sold in transactions exempt from registration, normally to qualified institutional buyers. At January 31, 2006, the aggregate value of the securities is $18,526,004 or 8.6% of the Fund's net assets.
(3) Security has been issued as a leveraged inverse floater bond. The stated interest rate represents the rate in effect at January 31, 2006.
See notes to financial statements
30
Eaton Vance Municipals Funds as of January 31, 2006
FINANCIAL STATEMENTS (Unaudited)
Statements of Assets and Liabilities
As of January 31, 2006
| | Arizona Fund | | Colorado Fund | | Connecticut Fund | | Michigan Fund | |
| Assets | |
| Investments — | |
| Identified cost | | $ | 69,963,307 | | | $ | 28,843,955 | | | $ | 117,915,870 | | | $ | 54,857,390 | | |
| Unrealized appreciation | | | 5,265,971 | | | | 1,810,108 | | | | 7,214,896 | | | | 5,393,061 | | |
| Investments, at value | | $ | 75,229,278 | | | $ | 30,654,063 | | | $ | 125,130,766 | | | $ | 60,250,451 | | |
| Cash | | $ | 222,170 | | | $ | 272,359 | | | $ | 1,093,813 | | | $ | — | | |
| Receivable for Fund shares sold | | | 17,668 | | | | 95,000 | | | | 218,122 | | | | 21,430 | | |
| Interest receivable | | | 553,711 | | | | 354,114 | | | | 1,331,776 | | | | 683,590 | | |
| Total assets | | $ | 76,022,827 | | | $ | 31,375,536 | | | $ | 127,774,477 | | | $ | 60,955,471 | | |
| Liabilities | |
| Payable for Fund shares redeemed | | $ | 131,332 | | | $ | 11,699 | | | $ | 67,676 | | | $ | 55,665 | | |
| Payable for daily variation margin on open financial futures contracts | | | 24,375 | | | | 12,937 | | | | 34,312 | | | | 10,734 | | |
| Demand note payable | | | — | | | | — | | | | — | | | | 300,000 | | |
| Dividends payable | | | 93,742 | | | | 34,014 | | | | 194,073 | | | | 91,231 | | |
| Due to custodian | | | — | | | | — | | | | — | | | | 81,217 | | |
| Payable to affiliate for investment advisory fees | | | 21,115 | | | | 5,242 | | | | 39,915 | | | | 15,347 | | |
| Payable to affiliate for distribution and service fees | | | 22,387 | | | | 10,179 | | | | 39,344 | | | | 15,225 | | |
| Accrued expenses | | | 31,491 | | | | 25,716 | | | | 50,296 | | | | 37,353 | | |
| Total liabilities | | $ | 324,442 | | | $ | 99,787 | | | $ | 425,616 | | | $ | 606,772 | | |
| Net Assets | | $ | 75,698,385 | | | $ | 31,275,749 | | | $ | 127,348,861 | | | $ | 60,348,699 | | |
| Sources of Net Assets | |
| Paid-in capital | | $ | 73,937,430 | | | $ | 30,256,113 | | | $ | 121,914,041 | | | $ | 56,104,796 | | |
Accumulated net realized loss (computed on the basis
of identified cost) | | | (3,494,487 | ) | | | (722,574 | ) | | | (1,534,166 | ) | | | (1,134,301 | ) | |
Undistributed (distributions in excess of) net
investment income | | | 32,680 | | | | (44,964 | ) | | | (201,234 | ) | | | (4,479 | ) | |
| Net unrealized appreciation (computed on the basis of identified cost) | | | 5,222,762 | | | | 1,787,174 | | | | 7,170,220 | | | | 5,382,683 | | |
| Total | | $ | 75,698,385 | | | $ | 31,275,749 | | | $ | 127,348,861 | | | $ | 60,348,699 | | |
| Class A Shares | |
| Net Assets | | $ | 61,015,173 | | | $ | 23,715,108 | | | $ | 99,736,963 | | | $ | 52,699,753 | | |
| Shares Outstanding | | | 6,268,627 | | | | 2,449,036 | | | | 9,424,210 | | | | 5,517,814 | | |
Net Asset Value, Price and Redemption Price Per Share
(net assets ÷ shares of beneficial interest outstanding) | | $ | 9.73 | | | $ | 9.68 | | | $ | 10.58 | | | $ | 9.55 | | |
Maximum Offering Price Per Share
(100 ÷ 95.25 of net assets value per share) | | $ | 10.22 | | | $ | 10.16 | | | $ | 11.11 | | | $ | 10.03 | | |
| Class B Shares | |
| Net Assets | | $ | 14,482,112 | | | $ | 7,560,641 | | | $ | 27,611,898 | | | $ | 7,648,946 | | |
| Shares Outstanding | | | 1,338,482 | | | | 717,504 | | | | 2,622,315 | | | | 800,750 | | |
Net Asset Value, Offering Price and Redemption Price Per Share
(net assets ÷ shares of beneficial interest outstanding) | | $ | 10.82 | | | $ | 10.54 | | | $ | 10.53 | | | $ | 9.55 | | |
| Class C Shares | |
| Net Assets | | $ | 201,100 | | | | | | | | | | | | | | |
| Shares Outstanding | | | 18,587 | | | | | | | | | | | | | | |
Net Asset Value, Offering Price and Redemption Price Per Share
(net assets ÷ shares of beneficial interest outstanding) | | $ | 10.82 | | | | | | | | | | | | | | |
On sales of $25,000 or more, the offering price of Class A shares is reduced.
See notes to financial statements
31
Eaton Vance Municipals Funds as of January 31, 2006
FINANCIAL STATEMENTS (Unaudited) CONT'D
Statements of Assets and Liabilities
As of January 31, 2006
| | | Minnesota Fund | | New Jersey Fund | | Pennsylvania Fund | |
| Assets | |
| Investments — | |
| Identified cost | | $ | 39,614,077 | | | $ | 221,255,559 | | | $ | 201,419,087 | | |
| Unrealized appreciation | | | 2,661,511 | | | | 18,767,088 | | | | 14,274,680 | | |
| Investments, at value | | $ | 42,275,588 | | | $ | 240,022,647 | | | $ | 215,693,767 | | |
| Cash | | $ | 855,100 | | | $ | 517,612 | | | $ | — | | |
| Receivable for investments sold | | | — | | | | 618,456 | | | | — | | |
| Receivable for Fund shares sold | | | 162,955 | | | | 280,231 | | | | 298,554 | | |
| Interest receivable | | | 521,359 | | | | 2,405,924 | | | | 2,181,295 | | |
| Total assets | | $ | 43,815,002 | | | $ | 243,844,870 | | | $ | 218,173,616 | | |
| Liabilities | |
| Payable for Fund shares redeemed | | $ | 627,478 | | | $ | 207,323 | | | $ | 246,527 | | |
| Payable for daily variation margin on open financial futures contracts | | | 15,000 | | | | 126,562 | | | | 112,500 | | |
| Demand note payable | | | — | | | | — | | | | 2,900,000 | | |
| Dividends payable | | | 49,187 | | | | 338,674 | | | | 362,039 | | |
| Due to custodian | | | — | | | | — | | | | 1,490 | | |
| Payable to affiliate for investment advisory fees | | | 8,874 | | | | 85,502 | | | | 74,442 | | |
| Payable to affiliate for distribution and service fees | | | 14,751 | | | | 83,924 | | | | 65,087 | | |
| Accrued expenses | | | 30,323 | | | | 76,972 | | | | 77,881 | | |
| Total liabilities | | $ | 745,613 | | | $ | 918,957 | | | $ | 3,839,966 | | |
| Net Assets | | $ | 43,069,389 | | | $ | 242,925,913 | | | $ | 214,333,650 | | |
| Sources of Net Assets | |
| Paid-in capital | | $ | 41,836,776 | | | $ | 228,835,717 | | | $ | 213,545,249 | | |
| Accumulated net realized loss (computed on the basis of identified cost) | | | (1,360,743 | ) | | | (4,709,072 | ) | | | (12,853,046 | ) | |
| Undistributed (distributions in excess of) net investment income | | | (41,565 | ) | | | 127,431 | | | | (147,871 | ) | |
| Net unrealized appreciation (computed on the basis of identified cost) | | | 2,634,921 | | | | 18,671,837 | | | | 13,789,318 | | |
| Total | | $ | 43,069,389 | | | $ | 242,925,913 | | | $ | 214,333,650 | | |
| Class A Shares | |
| Net Assets | | $ | 31,949,444 | | | $ | 176,252,935 | | | $ | 168,450,144 | | |
| Shares Outstanding | | | 3,436,538 | | | | 16,963,963 | | | | 16,994,235 | | |
Net Asset Value, Price and Redemption Price Per Share
(net assets ÷ shares of beneficial interest outstanding) | | $ | 9.30 | | | $ | 10.39 | | | $ | 9.91 | | |
Maximum Offering Price Per Share
(100 ÷ 95.25 of net assets value per share) | | $ | 9.76 | | | $ | 10.91 | | | $ | 10.40 | | |
| Class B Shares | |
| Net Assets | | $ | 11,053,581 | | | $ | 66,456,576 | | | $ | 45,685,242 | | |
| Shares Outstanding | | | 1,105,048 | | | | 6,128,264 | | | | 4,456,215 | | |
Net Asset Value, Offering Price and Redemption Price Per Share
(net assets ÷ shares of beneficial interest outstanding) | | $ | 10.00 | | | $ | 10.84 | | | $ | 10.25 | | |
| Class C Shares | |
| Net Assets | | $ | 66,364 | | | $ | 216,402 | | | $ | 198,264 | | |
| Shares Outstanding | | | 6,629 | | | | 19,959 | | | | 19,333 | | |
Net Asset Value, Offering Price and Redemption Price Per Share
(net assets ÷ shares of beneficial interest outstanding) | | $ | 10.01 | | | $ | 10.84 | | | $ | 10.26 | | |
On sales of $25,000 or more, the offering price of Class A shares is reduced.
See notes to financial statements
32
Eaton Vance Municipals Funds as of January 31, 2006
FINANCIAL STATEMENTS (Unaudited) CONT'D
Statements of Operations
For the Six Months Ended January 31, 2006
| | | Arizona Fund | | Colorado Fund | | Connecticut Fund | | Michigan Fund | |
| Investment Income | |
| Interest | | $ | 1,983,391 | | | $ | 765,346 | | | $ | 3,208,793 | | | $ | 1,583,748 | | |
| Total investment income | | $ | 1,983,391 | | | $ | 765,346 | | | $ | 3,208,793 | | | $ | 1,583,748 | | |
| Expenses | |
| Investment adviser fee | | $ | 125,176 | | | $ | 30,687 | | | $ | 245,603 | | | $ | 93,008 | | |
| Trustees fees and expenses | | | 3,559 | | | | 878 | | | | 4,614 | | | | 3,559 | | |
| Distribution and service fees | |
| Class A | | | 59,967 | | | | 22,737 | | | | 101,298 | | | | 53,373 | | |
| Class B | | | 74,406 | | | | 37,830 | | | | 140,486 | | | | 38,301 | | |
| Class C | | | 245 | | | | — | | | | — | | | | — | | |
| Legal and accounting services | | | 22,099 | | | | 17,690 | | | | 21,244 | | | | 21,066 | | |
| Printing and postage | | | 3,859 | | | | 3,104 | | | | 7,170 | | | | 5,535 | | |
| Custodian fee | | | 29,075 | | | | 17,495 | | | | 47,417 | | | | 25,474 | | |
| Transfer and dividend disbursing agent | | | 16,120 | | | | 7,265 | | | | 33,393 | | | | 22,456 | | |
| Registration fees | | | 3,943 | | | | 700 | | | | 1,000 | | | | 3,400 | | |
| Miscellaneous | | | 7,857 | | | | 6,049 | | | | 13,313 | | | | 10,243 | | |
| Total expenses | | $ | 346,306 | | | $ | 144,435 | | | $ | 615,538 | | | $ | 276,415 | | |
Deduct —
Reduction of custodian fee | | $ | 10,512 | | | $ | 4,326 | | | $ | 8,982 | | | $ | 3,598 | | |
| Total expense reductions | | $ | 10,512 | | | $ | 4,326 | | | $ | 8,982 | | | $ | 3,598 | | |
| Net expenses | | $ | 335,794 | | | $ | 140,109 | | | $ | 606,556 | | | $ | 272,817 | | |
| Net investment income | | $ | 1,647,597 | | | $ | 625,237 | | | $ | 2,602,237 | | | $ | 1,310,931 | | |
| Realized and Unrealized Gain (Loss) | |
| Net realized gain (loss) — | |
| Investment transactions (identified cost basis) | | $ | (26,771 | ) | | $ | 68,091 | | | $ | 302,258 | | | $ | 124,931 | | |
| Financial futures contracts | | | 451,853 | | | | 250,550 | | | | 694,243 | | | | 265,998 | | |
| Net realized gain | | $ | 425,082 | | | $ | 318,641 | | | $ | 996,501 | | | $ | 390,929 | | |
| Change in unrealized appreciation (depreciation) — | |
| Investments (identified cost basis) | | $ | (578,155 | ) | | $ | (207,428 | ) | | $ | (1,609,493 | ) | | $ | (722,504 | ) | |
| Financial futures contracts | | | (205,824 | ) | | | (138,000 | ) | | | (400,082 | ) | | | (174,590 | ) | |
| Net change in unrealized appreciation (depreciation) | | $ | (783,979 | ) | | $ | (345,428 | ) | | $ | (2,009,575 | ) | | $ | (897,094 | ) | |
| Net realized and unrealized loss | | $ | (358,897 | ) | | $ | (26,787 | ) | | $ | (1,013,074 | ) | | $ | (506,165 | ) | |
| Net increase in net assets from operations | | $ | 1,288,700 | | | $ | 598,450 | | | $ | 1,589,163 | | | $ | 804,766 | | |
See notes to financial statements
33
Eaton Vance Municipals Funds as of January 31, 2006
FINANCIAL STATEMENTS (Unaudited) CONT'D
Statements of Operations
For the Six Months Ended January 31, 2006
| | | Minnesota Fund | | New Jersey Fund | | Pennsylvania Fund | |
| Investment Income | |
| Interest | | $ | 1,160,097 | | | $ | 6,474,762 | | | $ | 5,860,495 | | |
| Total investment income | | $ | 1,160,097 | | | $ | 6,474,762 | | | $ | 5,860,495 | | |
| Expenses | |
| Investment adviser fee | | $ | 54,495 | | | $ | 519,964 | | | $ | 448,375 | | |
| Trustees fees and expenses | | | 879 | | | | 7,136 | | | | 7,075 | | |
| Distribution and service fees | |
| Class A | | | 31,449 | | | | 176,468 | | | | 167,469 | | |
| Class B | | | 60,200 | | | | 331,336 | | | | 222,238 | | |
| Class C | | | 34 | | | | 152 | | | | 6 | | |
| Legal and accounting services | | | 22,201 | | | | 29,771 | | | | 27,232 | | |
| Printing and postage | | | 3,908 | | | | 12,441 | | | | 13,311 | | |
| Custodian fee | | | 21,972 | | | | 74,397 | | | | 65,046 | | |
| Transfer and dividend disbursing agent | | | 13,343 | | | | 68,120 | | | | 73,513 | | |
| Registration fees | | | 53 | | | | 1,420 | | | | 2,255 | | |
| Miscellaneous | | | 9,002 | | | | 24,292 | | | | 33,134 | | |
| Total expenses | | $ | 217,536 | | | $ | 1,245,497 | | | $ | 1,059,654 | | |
Deduct —
Reduction of custodian fee | | $ | 5,367 | | | $ | 6,757 | | | $ | 14,740 | | |
| Total expense reductions | | $ | 5,367 | | | $ | 6,757 | | | $ | 14,740 | | |
| Net expenses | | $ | 212,169 | | | $ | 1,238,740 | | | $ | 1,044,914 | | |
| Net investment income | | $ | 947,928 | | | $ | 5,236,022 | | | $ | 4,815,581 | | |
| Realized and Unrealized Gain (Loss) | |
| Net realized gain (loss) — | |
| Investment transactions (identified cost basis) | | $ | 162,557 | | | $ | 2,966,125 | | | $ | (76,228 | ) | |
| Financial futures contracts | | | 284,890 | | | | 1,342,240 | | | | 2,672,464 | | |
| Net realized gain | | $ | 447,447 | | | $ | 4,308,365 | | | $ | 2,596,236 | | |
| Change in unrealized appreciation (depreciation) — | |
| Investments (identified cost basis) | | $ | (416,681 | ) | | $ | (5,185,720 | ) | | $ | (1,108,011 | ) | |
| Financial futures contracts | | | (135,000 | ) | | | (1,103,249 | ) | | | (1,548,288 | ) | |
| Net change in unrealized appreciation (depreciation) | | $ | (551,681 | ) | | $ | (6,288,969 | ) | | $ | (2,656,299 | ) | |
| Net realized and unrealized loss | | $ | (104,234 | ) | | $ | (1,980,604 | ) | | $ | (60,063 | ) | |
| Net increase in net assets from operations | | $ | 843,694 | | | $ | 3,255,418 | | | $ | 4,755,518 | | |
See notes to financial statements
34
Eaton Vance Municipals Funds as of January 31, 2006
FINANCIAL STATEMENTS (Unaudited) CONT'D
Statements of Changes in Net Assets
For the Six Months Ended January 31, 2006
| Increase (Decrease) in Net Assets | | Arizona Fund | | Colorado Fund | | Connecticut Fund | | Michigan Fund | |
| From operations — | |
| Net investment income | | $ | 1,647,597 | | | $ | 625,237 | | | $ | 2,602,237 | | | $ | 1,310,931 | | |
| Net realized gain from invesment transactions and financial futures contracts | | | 425,082 | | | | 318,641 | | | | 996,501 | | | | 390,929 | | |
Net change in unrealized appreciation (depreciation) from invesments and
financial futures contracts | | | (783,979 | ) | | | (345,428 | ) | | | (2,009,575 | ) | | | (897,094 | ) | |
| Net increase in net assets from operations | | $ | 1,288,700 | | | $ | 598,450 | | | $ | 1,589,163 | | | $ | 804,766 | | |
| Distributions to shareholders — | |
| From net investment income | |
| Class A | | $ | (1,340,467 | ) | | $ | (490,279 | ) | | $ | (2,098,685 | ) | | $ | (1,143,460 | ) | |
| Class B | | | (291,946 | ) | | | (141,804 | ) | | | (500,714 | ) | | | (142,676 | ) | |
| Class C | | | (827 | ) | | | — | | | | — | | | | — | | |
| Total distributions to shareholders | | $ | (1,633,240 | ) | | $ | (632,083 | ) | | $ | (2,599,399 | ) | | $ | (1,286,136 | ) | |
| Transactions in shares of beneficial interest — | |
| Proceeds from sale of shares | |
| Class A | | $ | 4,194,183 | | | $ | 2,058,992 | | | $ | 5,199,159 | | | $ | 3,584,074 | | |
| Class B | | | 267,040 | | | | 157,753 | | | | 468,694 | | | | 300,942 | | |
| Class C | | | 200,000 | | | | — | | | | — | | | | — | | |
Net asset value of shares issued to shareholders in payment of
distributions declared | | | |
| Class A | | | 883,244 | | | | 329,112 | | | | 1,122,697 | | | | 676,919 | | |
| Class B | | | 188,701 | | | | 81,940 | | | | 272,427 | | | | 72,817 | | |
| Cost of shares redeemed | |
| Class A | | | (2,978,770 | ) | | | (1,382,115 | ) | | | (9,275,692 | ) | | | (5,005,732 | ) | |
| Class B | | | (2,243,674 | ) | | | (314,618 | ) | | | (2,597,430 | ) | | | (780,852 | ) | |
| Net asset value of shares exchanged | |
| Class A | | | 580,926 | | | | 687,138 | | | | 1,093,783 | | | | 337,717 | | |
| Class B | | | (580,926 | ) | | | (687,138 | ) | | | (1,093,783 | ) | | | (337,717 | ) | |
| Net increase (decrease) in net assets from Fund share transactions | | $ | 510,724 | | | $ | 931,064 | | | $ | (4,810,145 | ) | | $ | (1,151,832 | ) | |
| Net increase (decrease) in net assets | | $ | 166,184 | | | $ | 897,431 | | | $ | (5,820,381 | ) | | $ | (1,633,202 | ) | |
| Net Assets | |
| At beginning of period | | $ | 75,532,201 | | | $ | 30,378,318 | | | $ | 133,169,242 | | | $ | 61,981,901 | | |
| At end of period | | $ | 75,698,385 | | | $ | 31,275,749 | | | $ | 127,348,861 | | | $ | 60,348,699 | | |
Undistributed
(distributions in excess of) net
investment income included in net assets | |
| At end of period | | $ | 32,680 | | | $ | (44,964 | ) | | $ | (201,234 | ) | | $ | (4,479 | ) | |
See notes to financial statements
35
Eaton Vance Municipals Funds as of January 31, 2006
FINANCIAL STATEMENTS (Unaudited) CONT'D
Statements of Changes in Net Assets
For the Six Months Ended January 31, 2006
| Increase (Decrease) in Net Assets | | Minnesota Fund | | New Jersey Fund | | Pennsylvania Fund | |
| From operations — | |
| Net investment income | | $ | 947,928 | | | $ | 5,236,022 | | | $ | 4,815,581 | | |
| Net realized gain from invesment transactions and financial futures contracts | | | 447,447 | | | | 4,308,365 | | | | 2,596,236 | | |
| Net change in unrealized appreciation (depreciation) from investments and financial futures contracts | | | (551,681 | ) | | | (6,288,969 | ) | | | (2,656,299 | ) | |
| Net increase in net assets from operations | | $ | 843,694 | | | $ | 3,255,418 | | | $ | 4,755,518 | | |
| Distributions to shareholders — | |
| From net investment income | |
| Class A | | $ | (701,694 | ) | | $ | (3,876,551 | ) | | $ | (3,919,022 | ) | |
| Class B | | | (235,877 | ) | | | (1,270,386 | ) | | | (915,794 | ) | |
| Class C | | | (90 | ) | | | (507 | ) | | | (18 | ) | |
| Total distributions to shareholders | | $ | (937,661 | ) | | $ | (5,147,444 | ) | | $ | (4,834,834 | ) | |
| Transactions in shares of beneficial interest — | |
| Proceeds from sale of shares | |
| Class A | | $ | 3,068,660 | | | $ | 8,319,062 | | | $ | 7,995,258 | | |
| Class B | | | 540,041 | | | | 2,298,220 | | | | 2,064,439 | | |
| Class C | | | 66,318 | | | | 215,006 | | | | 198,355 | | |
| Net asset value of shares issued to shareholders in payment of distributions declared | |
| Class A | | | 491,291 | | | | 2,413,829 | | | | 2,217,222 | | |
| Class B | | | 148,019 | | | | 730,557 | | | | 454,091 | | |
| Class C | | | 90 | | | | 507 | | | | 18 | | |
| Cost of shares redeemed | |
| Class A | | | (3,346,486 | ) | | | (12,398,322 | ) | | | (10,347,069 | ) | |
| Class B | | | (2,620,411 | ) | | | (4,613,486 | ) | | | (2,650,100 | ) | |
| Net asset value of shares exchanged | |
| Class A | | | 548,771 | | | | 3,629,287 | | | | 1,911,170 | | |
| Class B | | | (548,771 | ) | | | (3,629,287 | ) | | | (1,911,170 | ) | |
| Net decrease in net assets from Fund share transactions | | $ | (1,652,478 | ) | | $ | (3,034,627 | ) | | $ | (67,786 | ) | |
| Net decrease in net assets | | $ | (1,746,445 | ) | | $ | (4,926,653 | ) | | $ | (147,102 | ) | |
| Net Assets | |
| At beginning of period | | $ | 44,815,834 | | | $ | 247,852,566 | | | $ | 214,480,752 | | |
| At end of period | | $ | 43,069,389 | | | $ | 242,925,913 | | | $ | 214,333,650 | | |
Undistributed
(distributions in excess) of net
investment income included in net assets | |
| At end of period | | $ | (41,565 | ) | | $ | 127,431 | | | $ | (147,871 | ) | |
See notes to financial statements
36
Eaton Vance Municipals Funds as of January 31, 2006
FINANCIAL STATEMENTS CONT'D
Statements of Changes in Net Assets
For the Year Ended July 31, 2005
| Increase (Decrease) in Net Assets | | Arizona Fund | | Colorado Fund | | Connecticut Fund | | Michigan Fund | |
| From operations — | |
| Net investment income | | $ | 3,062,839 | | | $ | 1,287,035 | | | $ | 5,549,917 | | | $ | 2,835,745 | | |
| Net realized gain (loss) from invesment transactions and financial futures contracts | | | (2,733,234 | ) | | | (594,387 | ) | | | (1,728,024 | ) | | | 390,820 | | |
Net change in unrealized appreciation (depreciation) from invesments and
financial futures contracts | | | 3,581,581 | | | | 1,005,952 | | | | 2,489,546 | | | | 677,070 | | |
| Net increase in net assets from operations | | $ | 3,911,186 | | | $ | 1,698,600 | | | $ | 6,311,439 | | | $ | 3,903,635 | | |
| Distributions to shareholders — | |
| From net investment income | |
| Class A | | $ | (2,318,469 | ) | | $ | (939,386 | ) | | $ | (4,412,818 | ) | | $ | (2,504,865 | ) | |
| Class B | | | (739,505 | ) | | | (379,270 | ) | | | (1,234,451 | ) | | | (371,803 | ) | |
| Total distributions to shareholders | | $ | (3,057,974 | ) | | $ | (1,318,656 | ) | | $ | (5,647,269 | ) | | $ | (2,876,668 | ) | |
| Transactions in shares of beneficial interest — | |
| Proceeds from sale of shares | |
| Class A | | $ | 16,305,155 | | | $ | 2,304,958 | | | $ | 10,399,553 | | | $ | 2,725,461 | | |
| Class B | | | 1,075,844 | | | | 211,095 | | | | 1,210,830 | | | | 412,231 | | |
Net asset value of shares issued to shareholders in payment of
distributions declared | | | |
| Class A | | | 1,269,346 | | | | 584,624 | | | | 2,492,243 | | | | 1,415,999 | | |
| Class B | | | 394,407 | | | | 220,659 | | | | 713,567 | | | | 190,907 | | |
| Cost of shares redeemed | |
| Class A | | | (8,961,301 | ) | | | (1,828,830 | ) | | | (10,509,495 | ) | | | (6,873,400 | ) | |
| Class B | | | (2,820,787 | ) | | | (1,773,895 | ) | | | (4,878,507 | ) | | | (2,394,086 | ) | |
| Net asset value of shares exchanged | |
| Class A | | | 1,427,399 | | | | 1,036,501 | | | | 2,977,357 | | | | 1,063,145 | | |
| Class B | | | (1,427,399 | ) | | | (1,036,501 | ) | | | (2,977,357 | ) | | | (1,063,145 | ) | |
| Net increase (decrease) in net assets from Fund share transactions | | $ | 7,262,664 | | | $ | (281,389 | ) | | $ | (571,809 | ) | | $ | (4,522,888 | ) | |
| Net increase (decrease) in net assets | | $ | 8,115,876 | | | $ | 98,555 | | | $ | 92,361 | | | $ | (3,495,921 | ) | |
| Net Assets | |
| At beginning of year | | $ | 67,416,325 | | | $ | 30,279,763 | | | $ | 133,076,881 | | | $ | 65,477,822 | | |
| At end of year | | $ | 75,532,201 | | | $ | 30,378,318 | | | $ | 133,169,242 | | | $ | 61,981,901 | | |
Undistributed
(distributions in excess of) net
investment income included in net assets | |
| At end of year | | $ | 18,323 | | | $ | (38,118 | ) | | $ | (204,072 | ) | | $ | (29,274 | ) | |
See notes to financial statements
37
Eaton Vance Municipals Funds as of January 31, 2006
FINANCIAL STATEMENTS CONT'D
Statements of Changes in Net Assets
For the Year Ended July 31, 2005
| Increase (Decrease) in Net Assets | | Minnesota Fund | | New Jersey Fund | | Pennsylvania Fund | |
| From operations — | |
| Net investment income | | $ | 1,902,281 | | | $ | 10,740,548 | | | $ | 10,227,557 | | |
| Net realized loss from invesment transactions and financial futures contracts | | | (1,124,039 | ) | | | (5,489,132 | ) | | | (5,104,797 | ) | |
| Net change in unrealized appreciation (depreciation) from investments and financial futures contracts | | | 2,066,399 | | | | 13,637,689 | | | | 9,139,575 | | |
| Net increase in net assets from operations | | $ | 2,844,641 | | | $ | 18,889,105 | | | $ | 14,262,335 | | |
| Distributions to shareholders — | |
| From net investment income | |
| Class A | | $ | (1,334,488 | ) | | $ | (7,803,321 | ) | | $ | (8,116,130 | ) | |
| Class B | | | (548,401 | ) | | | (2,968,623 | ) | | | (2,120,355 | ) | |
| Total distributions to shareholders | | $ | (1,882,889 | ) | | $ | (10,771,944 | ) | | $ | (10,236,485 | ) | |
| Transactions in shares of beneficial interest — | |
| Proceeds from sale of shares | |
| Class A | | $ | 2,226,851 | | | $ | 14,343,249 | | | $ | 16,263,298 | | |
| Class B | | | 425,259 | | | | 5,865,563 | | | | 3,613,105 | | |
| Net asset value of shares issued to shareholders in payment of distributions declared | |
| Class A | | | 896,290 | | | | 4,883,466 | | | | 4,675,845 | | |
| Class B | | | 322,746 | | | | 1,788,115 | | | | 1,060,125 | | |
| Cost of shares redeemed | |
| Class A | | | (2,956,675 | ) | | | (16,512,623 | ) | | | (17,079,460 | ) | |
| Class B | | | (1,640,730 | ) | | | (11,023,369 | ) | | | (6,515,383 | ) | |
| Net asset value of shares exchanged | |
| Class A | | | 1,072,987 | | | | 5,418,284 | | | | 3,353,532 | | |
| Class B | | | (1,072,987 | ) | | | (5,418,284 | ) | | | (3,353,532 | ) | |
| Net increase (decrease) in net assets from Fund share transactions | | $ | (726,259 | ) | | $ | (655,599 | ) | | $ | 2,017,530 | | |
| Net increase in net assets | | $ | 235,493 | | | $ | 7,461,562 | | | $ | 6,043,380 | | |
| Net Assets | |
| At beginning of year | | $ | 44,580,341 | | | $ | 240,391,004 | | | $ | 208,437,372 | | |
| At end of year | | $ | 44,815,834 | | | $ | 247,852,566 | | | $ | 214,480,752 | | |
Undistributed
(distributions in excess of) net
investment income included in net assets | |
| At end of year | | $ | (51,832 | ) | | $ | 38,853 | | | $ | (128,618 | ) | |
See notes to financial statements
38
Eaton Vance Municipals Funds as of January 31, 2006
FINANCIAL STATEMENTS CONT'D
Financial Highlights
| | | Arizona Fund — Class A | |
| | | Six Months Ended
January 31, 2006 | | Year Ended July 31, | |
| | | (Unaudited)(1) | | 2005(1) | | 2004(1) | | 2003(1) | | 2002(1)(2) | | 2001(1) | |
| Net asset value — Beginning of period | | $ | 9.780 | | | $ | 9.650 | | | $ | 9.550 | | | $ | 9.730 | | | $ | 9.680 | | | $ | 9.480 | | |
| Income (loss) from operations | |
| Net investment income | | $ | 0.221 | | | $ | 0.467 | | | $ | 0.493 | | | $ | 0.482 | | | $ | 0.485 | | | $ | 0.529 | | |
| Net realized and unrealized gain (loss) | | | 0.022 | | | | 0.131 | | | | 0.088 | | | | (0.182 | ) | | | 0.045 | | | | 0.163 | | |
| Total income from operations | | $ | 0.243 | | | $ | 0.598 | | | $ | 0.581 | | | $ | 0.300 | | | $ | 0.530 | | | $ | 0.692 | | |
| Less distributions | |
| From net investment income | | $ | (0.293 | ) | | $ | (0.468 | ) | | $ | (0.481 | ) | | $ | (0.480 | ) | | $ | (0.480 | ) | | $ | (0.492 | ) | |
| Total distributions | | $ | (0.293 | ) | | $ | (0.468 | ) | | $ | (0.481 | ) | | $ | (0.480 | ) | | $ | (0.480 | ) | | $ | (0.492 | ) | |
| Net asset value — End of period | | $ | 9.730 | | | $ | 9.780 | | | $ | 9.650 | | | $ | 9.550 | | | $ | 9.730 | | | $ | 9.680 | | |
| Total Return(3) | | | 1.75 | % | | | 6.31 | % | | | 6.15 | % | | | 3.06 | % | | | 5.67 | % | | | 7.46 | % | |
| Ratios/Supplemental Data | |
| Net assets, end of period (000's omitted) | | $ | 61,015 | | | $ | 58,597 | | | $ | 47,945 | | | $ | 9,174 | | | $ | 7,342 | | | $ | 5,413 | | |
| Ratios (As a percentage of average daily net assets): | |
| Expenses(4) | | | 0.76 | %(6) | | | 0.78 | % | | | 0.78 | % | | | 0.76 | % | | | 0.78 | % | | | 0.84 | % | |
| Expenses after custodian fee reduction(4) | | | 0.73 | %(6) | | | 0.76 | % | | | 0.77 | % | | | 0.75 | % | | | 0.78 | % | | | 0.82 | % | |
| Net investment income | | | 4.51 | %(6) | | | 4.79 | % | | | 5.10 | % | | | 4.90 | % | | | 5.05 | % | | | 5.50 | % | |
| Portfolio Turnover of the Portfolio(5) | | | — | | | | 0 | % | | | 10 | % | | | 6 | % | | | 27 | % | | | 26 | % | |
| Portfolio Turnover of the Fund | | | 11 | % | | | 16 | % | | | — | | | | — | | | | — | | | | — | | |
(1) Net investment income per share was computed using average shares outstanding.
(2) The Fund, through its investment in the Portfolio, has adopted the provisions of the revised AICPA Audit and Accounting Guide for Investment Companies and began using the interest method to amortize premiums on fixed-income securities. The effect of this change for the year ended July 31, 2002 was to increase net investment income per share by $0.001, decrease net realized and unrealized gains per share by $0.001 and increase the ratio of net investment income to average net assets from 5.04% to 5.05%. Per-share data and ratios for the periods prior to August 1, 2001 have not been restated to reflect this change in presentation.
(3) Returns are historical and are calculated by determining the percentage change in net asset value with all distributions reinvested. Total return is not computed on an annualized basis.
(4) Includes the Fund's share of its corresponding Portfolio's allocated expenses while the Fund was making investments directly into the Portfolio.
(5) Portfolio turnover represents the rate of portfolio activity for the period while the Fund was making investments directly into the Portfolio.
(6) Annualized.
See notes to financial statements
39
Eaton Vance Municipals Funds as of January 31, 2006
FINANCIAL STATEMENTS CONT'D
Financial Highlights
| | | Arizona Fund — Class B | |
| | | Six Months Ended
January 31, 2006 | | Year Ended July 31, | |
| | | (Unaudited)(1) | | 2005(1) | | 2004(1) | | 2003(1) | | 2002(1)(2) | | 2001(1) | |
| Net asset value — Beginning of period | | $ | 10.870 | | | $ | 10.730 | | | $ | 10.620 | | | $ | 10.830 | | | $ | 10.770 | | | $ | 10.540 | | |
| Income (loss) from operations | |
| Net investment income | | $ | 0.206 | | | $ | 0.441 | | | $ | 0.470 | | | $ | 0.456 | | | $ | 0.461 | | | $ | 0.494 | | |
| Net realized and unrealized gain (loss) | | | (0.054 | ) | | | 0.139 | | | | 0.096 | | | | (0.211 | ) | | | 0.054 | | | | 0.203 | | |
| Total income from operations | | $ | 0.152 | | | $ | 0.580 | | | $ | 0.566 | | | $ | 0.245 | | | $ | 0.515 | | | $ | 0.697 | | |
| Less distributions | |
| From net investment income | | $ | (0.202 | ) | | $ | (0.440 | ) | | $ | (0.456 | ) | | $ | (0.455 | ) | | $ | (0.455 | ) | | $ | (0.467 | ) | |
| Total distributions | | $ | (0.202 | ) | | $ | (0.440 | ) | | $ | (0.456 | ) | | $ | (0.455 | ) | | $ | (0.455 | ) | | $ | (0.467 | ) | |
| Net asset value — End of period | | $ | 10.820 | | | $ | 10.870 | | | $ | 10.730 | | | $ | 10.620 | | | $ | 10.830 | | | $ | 10.770 | | |
| Total Return(3) | | | 1.42 | % | | | 5.68 | %(4) | | | 5.38 | % | | | 2.22 | % | | | 4.92 | % | | | 6.73 | % | |
| Ratios/Supplemental Data | |
| Net assets, end of period (000's omitted) | | $ | 14,482 | | | $ | 16,935 | | | $ | 19,471 | | | $ | 59,399 | | | $ | 63,117 | | | $ | 66,376 | | |
| Ratios (As a percentage of average daily net assets): | |
| Expenses(5) | | | 1.51 | %(7) | | | 1.53 | % | | | 1.53 | % | | | 1.51 | % | | | 1.53 | % | | | 1.59 | % | |
| Expenses after custodian fee reduction(5) | | | 1.48 | %(7) | | | 1.51 | % | | | 1.52 | % | | | 1.50 | % | | | 1.53 | % | | | 1.57 | % | |
| Net investment income | | | 3.77 | %(7) | | | 4.07 | % | | | 4.33 | % | | | 4.17 | % | | | 4.32 | % | | | 4.62 | % | |
| Portfolio Turnover of the Portfolio(6) | | | — | | | | 0 | % | | | 10 | % | | | 6 | % | | | 27 | % | | | 26 | % | |
| Portfolio Turnover of the Fund | | | 11 | % | | | 16 | % | | | — | | | | — | | | | — | | | | — | | |
(1) Net investment income per share was computed using average shares outstanding.
(2) The Fund, through its investment in the Portfolio, has adopted the provisions of the revised AICPA Audit and Accounting Guide for Investment Companies and began using the interest method to amortize premiums on fixed-income securities. The effect of this change for the year ended July 31, 2002 was to increase net investment income per share by $0.001, decrease net realized and unrealized gains per share by $0.001 and increase the ratio of net investment income to average net assets from 4.31% to 4.32%. Per-share data and ratios for the periods prior to August 1, 2001 have not been restated to reflect this change in presentation.
(3) Returns are historical and are calculated by determining the percentage change in net asset value with all distributions reinvested. Total return is not computed on an annualized basis.
(4) Total return reflects an increase of 0.18% due to a change in the timing of the payment and reinvestment of distributions.
(5) Includes the Fund's share of its corresponding Portfolio's allocated expenses while the Fund was making investments directly into the Portfolio.
(6) Portfolio turnover represents the rate of portfolio activity for the period while the Fund was making investments directly into the Portfolio.
(7) Annualized.
See notes to financial statements
40
Eaton Vance Municipals Funds as of January 31, 2006
FINANCIAL STATEMENTS CONT'D
Financial Highlights
| | | Arizona Fund — Class C | |
| | | Period Ended
January 31, 2006
(Unaudited)(1)(2) | |
| Net asset value — Beginning of period | | $ | 10.760 | | |
| Income (loss) from operations | |
| Net investment income | | $ | 0.044 | | |
| Net realized and unrealized gain | | | 0.064 | | |
| Total income from operations | | $ | 0.108 | | |
| Less distributions | |
| From net investment income | | $ | (0.048 | ) | |
| Total distributions | | $ | (0.048 | ) | |
| Net asset value — End of period | | $ | 10.820 | | |
| Total Return(3) | | | 0.99 | % | |
| Ratios/Supplemental Data | |
| Net assets, end of period (000's omitted) | | $ | 201 | | |
| Ratios (As a percentage of average daily net assets): | |
| Expenses | | | 1.51 | %(4) | |
| Expenses after custodian fee reduction | | | 1.48 | %(4) | |
| Net investment income | | | 3.15 | %(4) | |
| Portfolio Turnover of the Fund | | | 11 | %(5) | |
(1) Net investment income per share was computed using average shares outstanding.
(2) For the period from the start of business on December 16, 2005 to January 31, 2006.
(3) Returns are historical and are calculated by determining the percentage change in net asset value with all distributions reinvested. Total return is not computed on an annualized basis.
(4) Annualized.
(5) For the Fund fiscal period, August 1, 2005 to January 31, 2006.
See notes to financial statements
41
Eaton Vance Municipals Funds as of January 31, 2006
FINANCIAL STATEMENTS CONT'D
Financial Highlights
| | | Colorado Fund — Class A | |
| | | Six Months Ended
January 31, 2006 | | Year Ended July 31, | |
| | | (Unaudited)(1) | | 2005(1) | | 2004(1) | | 2003(1) | | 2002(1)(2) | | 2001 | |
| Net asset value — Beginning of period | | $ | 9.690 | | | $ | 9.570 | | | $ | 9.440 | | | $ | 9.680 | | | $ | 9.680 | | | $ | 9.160 | | |
| Income (loss) from operations | |
| Net investment income | | $ | 0.207 | | | $ | 0.435 | | | $ | 0.460 | | | $ | 0.464 | | | $ | 0.481 | | | $ | 0.479 | | |
| Net realized and unrealized gain (loss) | | | (0.007 | ) | | | 0.131 | | | | 0.132 | | | | (0.228 | ) | | | (0.001 | )(3) | | | 0.535 | | |
| Total income from operations | | $ | 0.200 | | | $ | 0.566 | | | $ | 0.592 | | | $ | 0.236 | | | $ | 0.480 | | | $ | 1.014 | | |
| Less distributions | |
| From net investment income | | $ | (0.210 | ) | | $ | (0.446 | ) | | $ | (0.462 | ) | | $ | (0.476 | ) | | $ | (0.480 | ) | | $ | (0.494 | ) | |
| Total distributions | | $ | (0.210 | ) | | $ | (0.446 | ) | | $ | (0.462 | ) | | $ | (0.476 | ) | | $ | (0.480 | ) | | $ | (0.494 | ) | |
| Net asset value — End of period | | $ | 9.680 | | | $ | 9.690 | | | $ | 9.570 | | | $ | 9.440 | | | $ | 9.680 | | | $ | 9.680 | | |
| Total Return(4) | | | 2.09 | % | | | 6.02 | % | | | 6.33 | % | | | 2.42 | % | | | 5.13 | % | | | 11.35 | % | |
| Ratios/Supplemental Data | |
| Net assets, end of period (000's omitted) | | $ | 23,715 | | | $ | 22,044 | | | $ | 19,700 | | | $ | 8,709 | | | $ | 6,379 | | | $ | 2,726 | | |
| Ratios (As a percentage of average daily net assets): | |
| Expenses(5) | | | 0.75 | %(6) | | | 0.75 | % | | | 0.75 | % | | | 0.73 | % | | | 0.80 | % | | | 0.86 | % | |
| Expenses after custodian fee reduction(5) | | | 0.72 | %(6) | | | 0.74 | % | | | 0.75 | % | | | 0.71 | % | | | 0.78 | % | | | 0.82 | % | |
| Net investment income | | | 4.26 | %(6) | | | 4.50 | % | | | 4.78 | % | | | 4.78 | % | | | 5.01 | % | | | 5.06 | % | |
| Portfolio Turnover of the Portfolio(7) | | | — | | | | 3 | % | | | 6 | % | | | 21 | % | | | 18 | % | | | 18 | % | |
| Portfolio Turnover of the Fund | | | 14 | % | | | 16 | % | | | — | | | | — | | | | — | | | | — | | |
(1) Net investment income per share was computed using average shares outstanding.
(2) The Fund, through its investment in the Portfolio, has adopted the provisions of the revised AICPA Audit and Accounting Guide for Investment Companies and began using the interest method to amortize premiums on fixed-income securities. The effect of this change for the year ended July 31, 2002 was to increase net investment income per share by $0.001, increase net realized and unrealized losses per share by $0.001 and increase the ratio of net investment income to average net assets from 4.99% to 5.01%. Per-share data and ratios for the periods prior to August 1, 2001 have not been restated to reflect this change in presentation.
(3) Per share amount is not in accord with the net realized and unrealized gain (loss) on investments for the period because of the timing of sales of Fund shares and the amount of the per share realized and unrealized gains and losses at such time.
(4) Returns are historical and are calculated by determining the percentage change in net asset value with all distributions reinvested. Total return is not computed on an annualized basis.
(5) Includes the Fund's share of its corresponding Portfolio's allocated expenses while the Fund was making investments directly into the Portfolio.
(6) Annualized.
(7) Portfolio turnover represents the rate of portfolio activity for the period while the Fund was making investments directly into the Portfolio.
See notes to financial statements
42
Eaton Vance Municipals Funds as of January 31, 2006
FINANCIAL STATEMENTS CONT'D
Financial Highlights
| | | Colorado Fund — Class B | |
| | | Six Months Ended
January 31, 2006 | | Year Ended July 31, | |
| | | (Unaudited)(1) | | 2005(1) | | 2004(1) | | 2003(1) | | 2002(1)(2) | | 2001 | |
| Net asset value — Beginning of period | | $ | 10.550 | | | $ | 10.420 | | | $ | 10.280 | | | $ | 10.540 | | | $ | 10.540 | | | $ | 9.970 | | |
| Income (loss) from operations | |
| Net investment income | | $ | 0.186 | | | $ | 0.398 | | | $ | 0.421 | | | $ | 0.427 | | | $ | 0.447 | | | $ | 0.444 | | |
| Net realized and unrealized gain (loss) | | | (0.008 | ) | | | 0.138 | | | | 0.143 | | | | (0.244 | ) | | | 0.001 | | | | 0.588 | | |
| Total income from operations | | $ | 0.178 | | | $ | 0.536 | | | $ | 0.564 | | | $ | 0.183 | | | $ | 0.448 | | | $ | 1.032 | | |
| Less distributions | |
| From net investment income | | $ | (0.188 | ) | | $ | (0.406 | ) | | $ | (0.424 | ) | | $ | (0.443 | ) | | $ | (0.448 | ) | | $ | (0.462 | ) | |
| Total distributions | | $ | (0.188 | ) | | $ | (0.406 | ) | | $ | (0.424 | ) | | $ | (0.443 | ) | | $ | (0.448 | ) | | $ | (0.462 | ) | |
| Net asset value — End of period | | $ | 10.540 | | | $ | 10.550 | | | $ | 10.420 | | | $ | 10.280 | | | $ | 10.540 | | | $ | 10.540 | | |
| Total Return(3) | | | 1.71 | % | | | 5.41 | %(4) | | | 5.53 | % | | | 1.70 | % | | | 4.37 | % | | | 10.58 | % | |
| Ratios/Supplemental Data | | | | | |
| Net assets, end of period (000's omitted) | | $ | 7,561 | | | $ | 8,334 | | | $ | 10,579 | | | $ | 28,242 | | | $ | 30,116 | | | $ | 27,730 | | |
| Ratios (As a percentage of average daily net assets): | |
| Expenses(5) | | | 1.50 | %(6) | | | 1.50 | % | | | 1.50 | % | | | 1.48 | % | | | 1.55 | % | | | 1.62 | % | |
| Expenses after custodian fee reduction(5) | | | 1.47 | %(6) | | | 1.49 | % | | | 1.50 | % | | | 1.46 | % | | | 1.53 | % | | | 1.58 | % | |
| Net investment income | | | 3.52 | %(6) | | | 3.78 | % | | | 4.00 | % | | | 4.04 | % | | | 4.28 | % | | | 4.33 | % | |
| Portfolio Turnover of the Portfolio(7) | | | — | | | | 3 | % | | | 6 | % | | | 21 | % | | | 18 | % | | | 18 | % | |
| Portfolio Turnover of the Fund | | | 14 | % | | | 16 | % | | | — | | | | — | | | | — | | | | — | | |
(1) Net investment income per share was computed using average shares outstanding.
(2) The Fund, through its investment in the Portfolio, has adopted the provisions of the revised AICPA Audit and Accounting Guide for Investment Companies and began using the interest method to amortize premiums on fixed-income securities. The effect of this change for the year ended July 31, 2002 was to increase net investment income per share by $0.001, decrease net realized and unrealized gains per share by $0.001 and increase the ratio of net investment income to average net assets from 4.26% to 4.28%. Per-share data and ratios for the periods prior to August 1, 2001 have not been restated to reflect this change in presentation.
(3) Returns are historical and are calculated by determining the percentage change in net asset value with all distributions reinvested. Total return is not computed on an annualized basis.
(4) Total return reflects an increase of 0.16% due to a change in the timing of the payment and reinvestment of distributions.
(5) Includes the Fund's share of its corresponding Portfolio's allocated expenses while the Fund was making investments directly into the Portfolio.
(6) Annualized.
(7) Portfolio turnover represents the rate of portfolio activity for the period while the Fund was making investments directly into the Portfolio.
See notes to financial statements
43
Eaton Vance Municipals Funds as of January 31, 2006
FINANCIAL STATEMENTS CONT'D
Financial Highlights
| | | Connecticut Fund — Class A | |
| | | Six Months Ended
January 31, 2006 | | Year Ended July 31, | |
| | | (Unaudited)(1) | | 2005(1) | | 2004(1) | | 2003(1) | | 2002(1)(2) | | 2001(1) | |
| Net asset value — Beginning of period | | $ | 10.660 | | | $ | 10.610 | | | $ | 10.540 | | | $ | 10.750 | | | $ | 10.750 | | | $ | 10.140 | | |
| Income (loss) from operations | |
| Net investment income | | $ | 0.221 | | | $ | 0.461 | | | $ | 0.488 | | | $ | 0.494 | | | $ | 0.508 | | | $ | 0.518 | | |
| Net realized and unrealized gain (loss) | | | (0.080 | ) | | | 0.057 | | | | 0.070 | | | | (0.195 | ) | | | 0.007 | | | | 0.601 | | |
| Total income from operations | | $ | 0.141 | | | $ | 0.518 | | | $ | 0.558 | | | $ | 0.299 | | | $ | 0.515 | | | $ | 1.119 | | |
| Less distributions | |
| From net investment income | | $ | (0.221 | ) | | $ | (0.468 | ) | | $ | (0.488 | ) | | $ | (0.509 | ) | | $ | (0.515 | ) | | $ | (0.509 | ) | |
| Total distributions | | $ | (0.221 | ) | | $ | (0.468 | ) | | $ | (0.488 | ) | | $ | (0.509 | ) | | $ | (0.515 | ) | | $ | (0.509 | ) | |
| Net asset value — End of period | | $ | 10.580 | | | $ | 10.660 | | | $ | 10.610 | | | $ | 10.540 | | | $ | 10.750 | | | $ | 10.750 | | |
| Total Return(3) | | | 1.34 | % | | | 4.96 | % | | | 5.34 | % | | | 2.76 | % | | | 4.92 | % | | | 11.30 | % | |
| Ratios/Supplemental Data | |
| Net assets, end of period (000's omitted) | | $ | 99,737 | | | $ | 102,378 | | | $ | 96,559 | | | $ | 25,210 | | | $ | 22,436 | | | $ | 12,752 | | |
| Ratios (As a percentage of average daily net assets): | |
| Expenses(4) | | | 0.77 | %(5) | | | 0.78 | % | | | 0.79 | % | | | 0.77 | % | | | 0.82 | % | | | 0.86 | % | |
| Expenses after custodian fee reduction(4) | | | 0.76 | %(5) | | | 0.77 | % | | | 0.79 | % | | | 0.77 | % | | | 0.80 | % | | | 0.83 | % | |
| Net investment income | | | 4.15 | %(5) | | | 4.31 | % | | | 4.58 | % | | | 4.55 | % | | | 4.76 | % | | | 4.95 | % | |
| Portfolio Turnover of the Portfolio(6) | | | — | | | | 2 | % | | | 15 | % | | | 19 | % | | | 22 | % | | | 14 | % | |
| Portfolio Turnover of the Fund | | | 13 | % | | | 14 | % | | | — | | | | — | | | | — | | | | — | | |
(1) Net investment income per share was computed using average shares outstanding.
(2) The Fund, through its investment in the Portfolio, has adopted the provisions of the revised AICPA Audit and Accounting Guide for Investment Companies and began using the interest method to amortize premiums on fixed-income securities. The effect of this change for the year ended July 31, 2002 was to increase net investment income per share by $0.001, decrease net realized and unrealized gains per share by $0.001 and increase the ratio of net investment income to average net assets from 4.75% to 4.76%. Per-share data and ratios for the periods prior to August 1, 2001 have not been restated to reflect this change in presentation.
(3) Returns are historical and are calculated by determining the percentage change in net asset value with all distributions reinvested. Total return is not computed on an annualized basis.
(4) Includes the Fund's share of its corresponding Portfolio's allocated expenses while the Fund was making investments directly into the Portfolio.
(5) Annualized.
(6) Portfolio turnover represents the rate of portfolio activity for the period while the Fund was making investments directly into the Portfolio.
See notes to financial statements
44
Eaton Vance Municipals Funds as of January 31, 2006
FINANCIAL STATEMENTS CONT'D
Financial Highlights
| | | Connecticut Fund — Class B | |
| | | Six Months Ended
January 31, 2006 | | Year Ended July 31, | |
| | | (Unaudited)(1) | | 2005(1) | | 2004(1) | | 2003(1) | | 2002(1)(2) | | 2001(1) | |
| Net asset value — Beginning of period | | $ | 10.610 | | | $ | 10.560 | | | $ | 10.490 | | | $ | 10.700 | | | $ | 10.700 | | | $ | 10.090 | | |
| Income (loss) from operations | |
| Net investment income | | $ | 0.181 | | | $ | 0.380 | | | $ | 0.404 | | | $ | 0.411 | | | $ | 0.429 | | | $ | 0.440 | | |
| Net realized and unrealized gain (loss) | | | (0.081 | ) | | | 0.056 | | | | 0.071 | | | | (0.194 | ) | | | 0.004 | | | | 0.598 | | |
| Total income from operations | | $ | 0.100 | | | $ | 0.436 | | | $ | 0.475 | | | $ | 0.217 | | | $ | 0.433 | | | $ | 1.038 | | |
| Less distributions | |
| From net investment income | | $ | (0.180 | ) | | $ | (0.386 | ) | | $ | (0.405 | ) | | $ | (0.427 | ) | | $ | (0.433 | ) | | $ | (0.428 | ) | |
| Total distributions | | $ | (0.180 | ) | | $ | (0.386 | ) | | $ | (0.405 | ) | | $ | (0.427 | ) | | $ | (0.433 | ) | | $ | (0.428 | ) | |
| Net asset value — End of period | | $ | 10.530 | | | $ | 10.610 | | | $ | 10.560 | | | $ | 10.490 | | | $ | 10.700 | | | $ | 10.700 | | |
| Total Return(3) | | | 0.95 | % | | | 4.36 | %(4) | | | 4.55 | % | | | 1.99 | % | | | 4.13 | % | | | 10.48 | % | |
| Ratios/Supplemental Data | |
| Net assets, end of period (000's omitted) | | $ | 27,612 | | | $ | 30,791 | | | $ | 36,518 | | | $ | 122,822 | | | $ | 128,349 | | | $ | 126,304 | | |
| Ratios (As a percentage of average daily net assets): | |
| Expenses(5) | | | 1.52 | %(6) | | | 1.53 | % | | | 1.54 | % | | | 1.52 | % | | | 1.57 | % | | | 1.60 | % | |
| Expenses after custodian fee reduction(5) | | | 1.51 | %(6) | | | 1.52 | % | | | 1.54 | % | | | 1.52 | % | | | 1.55 | % | | | 1.57 | % | |
| Net investment income | | | 3.40 | %(6) | | | 3.57 | % | | | 3.77 | % | | | 3.82 | % | | | 4.03 | % | | | 4.24 | % | |
| Portfolio Turnover of the Portfolio(7) | | | — | | | | 2 | % | | | 15 | % | | | 19 | % | | | 22 | % | | | 14 | % | |
| Portfolio Turnover of the Fund | | | 13 | % | | | 14 | % | | | — | | | | — | | | | — | | | | — | | |
(1) Net investment income per share was computed using average shares outstanding.
(2) The Fund, through its investment in the Portfolio, has adopted the provisions of the revised AICPA Audit and Accounting Guide for Investment Companies and began using the interest method to amortize premiums on fixed-income securities. The effect of this change for the year ended July 31, 2002 was to increase net investment income per share by $0.001, decrease net realized and unrealized gains per share by $0.001 and increase the ratio of net investment income to average net assets from 4.02% to 4.03%. Per-share data and ratios for the periods prior to August 1, 2001 have not been restated to reflect this change in presentation.
(3) Returns are historical and are calculated by determining the percentage change in net asset value with all distributions reinvested. Total return is not computed on an annualized basis.
(4) Total return reflects an increase of 0.16% due to a change in the timing of the payment and reinvestment of distributions.
(5) Includes the Fund's share of its corresponding Portfolio's allocated expenses while the Fund was making investments directly into the Portfolio.
(6) Annualized.
(7) Portfolio turnover represents the rate of portfolio activity for the period while the Fund was making investments directly into the Portfolio.
See notes to financial statements
45
Eaton Vance Municipals Funds as of January 31, 2006
FINANCIAL STATEMENTS CONT'D
Financial Highlights
| | | Michigan Fund — Class A | |
| | | Six Months Ended
January 31, 2006 | | Year Ended July 31, | |
| | | (Unaudited)(1) | | 2005(1) | | 2004(1) | | 2003(1) | | 2002(1)(2) | | 2001(1) | |
| Net asset value — Beginning of period | | $ | 9.630 | | | $ | 9.480 | | | $ | 9.400 | | | $ | 9.590 | | | $ | 9.570 | | | $ | 9.040 | | |
| Income (loss) from operations | |
| Net investment income | | $ | 0.211 | | | $ | 0.435 | | | $ | 0.456 | | | $ | 0.476 | | | $ | 0.486 | | | $ | 0.479 | | |
| Net realized and unrealized gain (loss) | | | (0.084 | ) | | | 0.156 | | | | 0.086 | | | | (0.190 | ) | | | 0.010 | | | | 0.526 | | |
| Total income from operations | | $ | 0.127 | | | $ | 0.591 | | | $ | 0.542 | | | $ | 0.286 | | | $ | 0.496 | | | $ | 1.005 | | |
| Less distributions | |
| From net investment income | | $ | (0.207 | ) | | $ | (0.441 | ) | | $ | (0.462 | ) | | $ | (0.476 | ) | | $ | (0.476 | ) | | $ | (0.475 | ) | |
| Total distributions | | $ | (0.207 | ) | | $ | (0.441 | ) | | $ | (0.462 | ) | | $ | (0.476 | ) | | $ | (0.476 | ) | | $ | (0.475 | ) | |
| Net asset value — End of period | | $ | 9.550 | | | $ | 9.630 | | | $ | 9.480 | | | $ | 9.400 | | | $ | 9.590 | | | $ | 9.570 | | |
| Total Return(3) | | | 1.33 | % | | | 6.34 | % | | | 5.83 | % | | | 2.96 | % | | | 5.34 | % | | | 11.37 | % | |
| Ratios/Supplemental Data | |
| Net assets, end of period (000's omitted) | | $ | 52,700 | | | $ | 53,522 | | | $ | 54,332 | | | $ | 4,079 | | | $ | 3,308 | | | $ | 2,838 | | |
| Ratios (As a percentage of average daily net assets): | |
| Expenses(4) | | | 0.80 | %(5) | | | 0.80 | % | | | 0.81 | % | | | 0.79 | % | | | 0.80 | % | | | 0.86 | % | |
| Expenses after custodian fee reduction(4) | | | 0.79 | %(5) | | | 0.79 | % | | | 0.80 | % | | | 0.78 | % | | | 0.80 | % | | | 0.85 | % | |
| Net investment income | | | 4.37 | %(5) | | | 4.53 | % | | | 4.81 | % | | | 4.92 | % | | | 5.11 | % | | | 5.12 | % | |
| Portfolio Turnover of the Portfolio(6) | | | — | | | | 2 | % | | | 16 | % | | | 12 | % | | | 7 | % | | | 8 | % | |
| Portfolio Turnover of the Fund | | | 7 | % | | | 21 | % | | | — | | | | — | | | | — | | | | — | | |
(1) Net investment income per share was computed using average shares outstanding.
(2) The Fund, through its investment in the Portfolio, has adopted the provisions of the revised AICPA Audit and Accounting Guide for Investment Companies and began using the interest method to amortize premiums on fixed-income securities. The effect of this change for the year ended July 31, 2002 was to increase net investment income per share by $0.001, decrease net realized and unrealized gains per share by $0.001, and increase the ratio of net investment income to average net assets from 5.10% to 5.11%. Per-share data and ratios for the periods prior to August 1, 2001 have not been restated to reflect this change in presentation.
(3) Returns are historical and are calculated by determining the percentage change in net asset value with all distributions reinvested. Total return is not computed on an annualized basis.
(4) Includes the Fund's share of its corresponding Portfolio's allocated expenses while the Fund was making investments directly into the Portfolio.
(5) Annualized.
(6) Portfolio turnover represents the rate of portfolio activity for the period while the Fund was making investments directly into the Portfolio.
See notes to financial statements
46
Eaton Vance Municipals Funds as of January 31, 2006
FINANCIAL STATEMENTS CONT'D
Financial Highlights
| | | Michigan Fund - Class B | |
| | | Six Months Ended
January 31, 2006 | | Year Ended July 31, | |
| | | (Unaudited)(1)(2) | | 2005(1)(2) | | 2004(1)(2) | | 2003(1)(2) | | 2002(1)(2)(3) | | 2001(1)(2) | |
| Net asset value — Beginning of period | | $ | 9.630 | | | $ | 9.480 | | | $ | 9.400 | | | $ | 9.590 | | | $ | 9.570 | | | $ | 9.040 | | |
| Income (loss) from operations | |
| Net investment income | | $ | 0.175 | | | $ | 0.364 | | | $ | 0.398 | | | $ | 0.406 | | | $ | 0.413 | | | $ | 0.409 | | |
| Net realized and unrealized gain (loss) | | | (0.084 | ) | | | 0.154 | | | | 0.072 | | | | (0.193 | ) | | | 0.010 | | | | 0.523 | | |
| Total income (loss) from operations | | $ | 0.091 | | | $ | 0.518 | | | $ | 0.470 | | | $ | 0.213 | | | $ | 0.423 | | | $ | 0.932 | | |
| Less distributions | |
| From net investment income | | $ | (0.171 | ) | | $ | (0.368 | ) | | $ | (0.390 | ) | | $ | (0.403 | ) | | $ | (0.403 | ) | | $ | (0.402 | ) | |
| Total distributions | | $ | (0.171 | ) | | $ | (0.368 | ) | | $ | (0.390 | ) | | $ | (0.403 | ) | | $ | (0.403 | ) | | $ | (0.402 | ) | |
| Net asset value — End of period | | $ | 9.550 | | | $ | 9.630 | | | $ | 9.480 | | | $ | 9.400 | | | $ | 9.590 | | | $ | 9.570 | | |
| Total Return(4) | | | 1.00 | % | | | 5.76 | %(5) | | | 4.96 | % | | | 2.19 | % | | | 4.50 | % | | | 10.59 | % | |
| Ratios/Supplemental Data | |
| Net assets, end of period (000's omitted) | | $ | 7,649 | | | $ | 8,460 | | | $ | 11,146 | | | $ | 66,608 | | | $ | 73,107 | | | $ | 77,957 | | |
| Ratios (As a percentage of average daily net assets): | |
| Expenses(6) | | | 1.55 | %(7) | | | 1.55 | % | | | 1.56 | % | | | 1.54 | % | | | 1.55 | % | | | 1.60 | % | |
| Expenses after custodian fee reduction(6) | | | 1.54 | %(7) | | | 1.54 | % | | | 1.55 | % | | | 1.53 | % | | | 1.55 | % | | | 1.59 | % | |
| Net investment income | | | 3.62 | %(7) | | | 3.80 | % | | | 4.14 | % | | | 4.20 | % | | | 4.34 | % | | | 4.38 | % | |
| Portfolio Turnover of the Portfolio(8) | | | — | | | | 2 | % | | | 16 | % | | | 12 | % | | | 7 | % | | | 8 | % | |
| Portfolio Turnover of the Fund | | | 7 | % | | | 21 | % | | | — | | | | — | | | | — | | | | — | | |
(1) Net investment income per share was computed using average shares outstanding.
(2) Per share data have ben restated to reflect the effects of a 1.1167883-for-1 stock split effective on November 11, 2005.
(3) The Fund, through its investment in the Portfolio, has adopted the provisions of the revised AICPA Audit and Accounting Guide for Investment Companies and began using the interest method to amortize premiums on fixed-income securities. The effect of this change for the year ended July 31, 2002 was to increase net investment income per share by $0.001, decrease net realized and unrealized gains per share by $0.001, and increase the ratio of net investment income to average net assets from 4.33% to 4.34%. Per-share data and ratios for the periods prior to August 1, 2001 have not been restated to reflect this change in presentation.
(4) Returns are historical and are calculated by determining the percentage change in net asset value with all distributions reinvested. Total return is not computed on an annualized basis.
(5) Total return reflects an increase of 0.17% due to a change in the timing of the payment and reinvestment of distributions.
(6) Includes the Fund's share of its corresponding Portfolio's allocated expenses while the Fund was making investments directly into the Portfolio.
(7) Annualized.
(8) Portfolio turnover represents the rate of portfolio activity for the period while the Fund was making investments directly into the Portfolio.
See notes to financial statements
47
Eaton Vance Municipals Funds as of January 31, 2006
FINANCIAL STATEMENTS CONT'D
Financial Highlights
| | | Minnesota Fund — Class A | |
| | | Six Months Ended
January 31, 2006 | | Year Ended July 31, | |
| | | (Unaudited)(1) | | 2005(1) | | 2004(1) | | 2003(1) | | 2002(1)(2) | | 2001 | |
| Net asset value — Beginning of period | | $ | 9.320 | | | $ | 9.110 | | | $ | 9.090 | | | $ | 9.310 | | | $ | 9.410 | | | $ | 9.070 | | |
| Income (loss) from operations | |
| Net investment income | | $ | 0.211 | | | $ | 0.422 | | | $ | 0.432 | | | $ | 0.449 | | | $ | 0.504 | | | $ | 0.488 | | |
| Net realized and unrealized gain (loss) | | | (0.023 | ) | | | 0.206 | | | | 0.029 | | | | (0.185 | ) | | | (0.118 | ) | | | 0.336 | | |
| Total income from operations | | $ | 0.188 | | | $ | 0.628 | | | $ | 0.461 | | | $ | 0.264 | | | $ | 0.386 | | | $ | 0.824 | | |
| Less distributions | |
| From net investment income | | $ | (0.208 | ) | | $ | (0.418 | ) | | $ | (0.441 | ) | | $ | (0.484 | ) | | $ | (0.486 | ) | | $ | (0.484 | ) | |
| Total distributions | | $ | (0.208 | ) | | $ | (0.418 | ) | | $ | (0.441 | ) | | $ | (0.484 | ) | | $ | (0.486 | ) | | $ | (0.484 | ) | |
| Net asset value — End of period | | $ | 9.300 | | | $ | 9.320 | | | $ | 9.110 | | | $ | 9.090 | | | $ | 9.310 | | | $ | 9.410 | | |
| Total Return(3) | | | 2.05 | % | | | 7.02 | % | | | 5.12 | % | | | 2.86 | % | | | 4.22 | % | | | 9.29 | % | |
| Ratios/Supplemental Data | |
| Net assets, end of period (000's omitted) | | $ | 31,949 | | | $ | 31,245 | | | $ | 29,369 | | | $ | 8,956 | | | $ | 7,370 | | | $ | 5,364 | | |
| Ratios (As a percentage of average daily net assets): | |
| Expenses(4) | | | 0.77 | %(5) | | | 0.78 | % | | | 0.79 | % | | | 0.78 | % | | | 0.77 | % | | | 0.87 | % | |
| Expenses after custodian fee reduction(4) | | | 0.75 | %(5) | | | 0.77 | % | | | 0.79 | % | | | 0.76 | % | | | 0.75 | % | | | 0.82 | % | |
| Net investment income | | | 4.51 | %(5) | | | 4.55 | % | | | 4.71 | % | | | 4.83 | % | | | 5.41 | % | | | 5.26 | % | |
| Portfolio Turnover of the Portfolio(6) | | | — | | | | 6 | % | | | 12 | % | | | 15 | % | | | 26 | % | | | 17 | % | |
| Portfolio Turnover of the Fund | | | 7 | % | | | 14 | % | | | — | | | | — | | | | — | | | | — | | |
(1) Net investment income per share was computed using average shares outstanding.
(2) The Fund, through its investment in the Portfolio, has adopted the provisions of the revised AICPA Audit and Accounting Guide for Investment Companies and began using the interest method to amortize premiums on fixed-income securities. The effect of this change for the year ended July 31, 2002 was to increase net investment income per share by $0.002, increase net realized and unrealized losses per share by $0.002, and increase the ratio of net investment income to average net assets from 5.39% to 5.41%. Per-share data and ratios for the periods prior to August 1, 2001 have not been restated to reflect this change in presentation.
(3) Returns are historical and are calculated by determining the percentage change in net asset value with all distributions reinvested. Total return is not computed on an annualized basis.
(4) Includes the Fund's share of its corresponding Portfolio's allocated expenses while the Fund was making investments directly into the Portfolio.
(5) Annualized.
(6) Portfolio turnover represents the rate of portfolio activity for the period while the Fund was making investments directly into the Portfolio.
See notes to financial statements
48
Eaton Vance Municipals Funds as of January 31, 2006
FINANCIAL STATEMENTS CONT'D
Financial Highlights
| | | Minnesota Fund — Class B | |
| | | Six Months Ended
January 31, 2006 | | Year Ended July 31, | |
| | | (Unaudited)(1) | | 2005(1) | | 2004(1) | | 2003(1) | | 2002(1)(2) | | 2001 | |
| Net asset value — Beginning of period | | $ | 10.020 | | | $ | 9.810 | | | $ | 9.790 | | | $ | 10.030 | | | $ | 10.130 | | | $ | 9.770 | | |
| Income (loss) from operations | |
| Net investment income | | $ | 0.190 | | | $ | 0.380 | | | $ | 0.390 | | | $ | 0.411 | | | $ | 0.470 | | | $ | 0.451 | | |
| Net realized and unrealized gain (loss) | | | (0.023 | ) | | | 0.205 | | | | 0.029 | | | | (0.204 | ) | | | (0.121 | ) | | | 0.352 | | |
| Total income from operations | | $ | 0.167 | | | $ | 0.585 | | | $ | 0.419 | | | $ | 0.207 | | | $ | 0.349 | | | $ | 0.803 | | |
| Less distributions | |
| From net investment income | | $ | (0.187 | ) | | $ | (0.375 | ) | | $ | (0.399 | ) | | $ | (0.447 | ) | | $ | (0.449 | ) | | $ | (0.443 | ) | |
| Total distributions | | $ | (0.187 | ) | | $ | (0.375 | ) | | $ | (0.399 | ) | | $ | (0.447 | ) | | $ | (0.449 | ) | | $ | (0.443 | ) | |
| Net asset value — End of period | | $ | 10.000 | | | $ | 10.020 | | | $ | 9.810 | | | $ | 9.790 | | | $ | 10.030 | | | $ | 10.130 | | |
| Total Return(3) | | | 1.68 | % | | | 6.23 | %(4) | | | 4.33 | % | | | 2.07 | % | | | 3.52 | % | | | 8.36 | % | |
| Ratios/Supplemental Data | |
| Net assets, end of period (000's omitted) | | $ | 11,054 | | | $ | 13,571 | | | $ | 15,212 | | | $ | 41,279 | | | $ | 44,110 | | | $ | 43,819 | | |
| Ratios (As a percentage of average daily net assets): | |
| Expenses(5) | | | 1.52 | %(6) | | | 1.53 | % | | | 1.54 | % | | | 1.53 | % | | | 1.52 | % | | | 1.62 | % | |
| Expenses after custodian fee reduction(5) | | | 1.50 | %(6) | | | 1.52 | % | | | 1.54 | % | | | 1.51 | % | | | 1.50 | % | | | 1.57 | % | |
| Net investment income | | | 3.77 | %(6) | | | 3.81 | % | | | 3.92 | % | | | 4.11 | % | | | 4.68 | % | | | 4.52 | % | |
| Portfolio Turnover of the Portfolio(7) | | | — | | | | 6 | % | | | 12 | % | | | 15 | % | | | 26 | % | | | 17 | % | |
| Portfolio Turnover of the Fund | | | 7 | % | | | 14 | % | | | — | | | | — | | | | — | | | | — | | |
(1) Net investment income per share was computed using average shares outstanding.
(2) The Fund, through its investment in the Portfolio, has adopted the provisions of the revised AICPA Audit and Accounting Guide for Investment Companies and began using the interest method to amortize premiums on fixed-income securities. The effect of this change for the year ended July 31, 2002 was to increase net investment income per share by $0.002, increase net realized and unrealized losses per share by $0.002, and increase the ratio of net investment income to average net assets from 4.66% to 4.68%. Per-share data and ratios for the periods prior to August 1, 2001 have not been restated to reflect this change in presentation.
(3) Returns are historical and are calculated by determining the percentage change in net asset value with all distributions reinvested. Total return is not computed on an annualized basis.
(4) Total return reflects an increase of 0.18% due to a change in the timing of the payment and reinvestment of distributions.
(5) Includes the Fund's share of its corresponding Portfolio's allocated expenses while the Fund was making investments directly into the Portfolio.
(6) Annualized.
(7) Portfolio turnover represents the rate of portfolio activity for the period while the Fund was making investments directly into the Portfolio.
See notes to financial statements
49
Eaton Vance Municipals Funds as of January 31, 2006
FINANCIAL STATEMENTS CONT'D
Financial Highlights
| | | Minnesota Fund — Class C | |
| | | Period Ended
January 31, 2006
(Unaudited)(1)(2) | |
| Net asset value — Beginning of period | | $ | 9.940 | | |
| Income (loss) from operations | |
| Net investment income | | $ | 0.023 | | |
| Net realized and unrealized gain | | | 0.087 | (3) | |
| Total income from operations | | $ | 0.110 | | |
| Less distributions | |
| From net investment income | | $ | (0.040 | ) | |
| Total distributions | | $ | (0.040 | ) | |
| Net asset value — End of period | | $ | 10.010 | | |
| Total Return(4) | | | 1.13 | % | |
| Ratios/Supplemental Data | |
| Net assets, end of period (000's omitted) | | $ | 66 | | |
| Ratios (As a percentage of average daily net assets): | |
| Expenses | | | 1.52 | %(5) | |
| Expenses after custodian fee reduction | | | 1.50 | %(5) | |
| Net investment income | | | 1.91 | %(5) | |
| Portfolio Turnover of the Fund | | | 7 | %(6) | |
(1) Net investment income per share was computed using average shares outstanding.
(2) For the period from the start of business, December 21, 2005 to January 31, 2006.
(3) The per share amount is not in accord with the net realized and unrealized gain (loss) on investments for the period because of the timing of sales of Fund shares and the amount of the per share realized and unrealized gains and losses at such time.
(4) Returns are historical and are calculated by determining the percentage change in net asset value with all distributions reinvested. Total return is not computed on an annualized basis.
(5) Annualized.
(6) For the Fund fiscal period, August 1, 2005, to January 31, 2006.
See notes to financial statements
50
Eaton Vance Municipals Funds as of January 31, 2006
FINANCIAL STATEMENTS CONT'D
Financial Highlights
| | | New Jersey Fund — Class A | |
| | | Six Months Ended
January 31, 2006 | | Year Ended July 31, | |
| | | (Unaudited)(1) | | 2005(1) | | 2004(1) | | 2003(1) | | 2002(1)(2) | | 2001(1) | |
| Net asset value — Beginning of period | | $ | 10.470 | | | $ | 10.130 | | | $ | 10.070 | | | $ | 10.320 | | | $ | 10.340 | | | $ | 9.760 | | |
| Income (loss) from operations | |
| Net investment income | | $ | 0.233 | | | $ | 0.478 | | | $ | 0.508 | | | $ | 0.527 | | | $ | 0.558 | | | $ | 0.542 | | |
| Net realized and unrealized gain (loss) | | | (0.083 | ) | | | 0.342 | | | | 0.082 | | | | (0.248 | ) | | | (0.043 | ) | | | 0.572 | | |
| Total income from operations | | $ | 0.150 | | | $ | 0.820 | | | $ | 0.590 | | | $ | 0.279 | | | $ | 0.515 | | | $ | 1.114 | | |
| Less distributions | |
| From net investment income | | $ | (0.230 | ) | | $ | (0.480 | ) | | $ | (0.530 | ) | | $ | (0.529 | ) | | $ | (0.535 | ) | | $ | (0.534 | ) | |
| Total distributions | | $ | (0.230 | ) | | $ | (0.480 | ) | | $ | (0.530 | ) | | $ | (0.529 | ) | | $ | (0.535 | ) | | $ | (0.534 | ) | |
| Net asset value — End of period | | $ | 10.390 | | | $ | 10.470 | | | $ | 10.130 | | | $ | 10.070 | | | $ | 10.320 | | | $ | 10.340 | | |
| Total Return(3) | | | 1.45 | % | | | 8.24 | % | | | 5.89 | % | | | 2.67 | % | | | 5.16 | % | | | 11.71 | % | |
| Ratios/Supplemental Data | |
| Net assets, end of period (000's omitted) | | $ | 176,253 | | | $ | 175,624 | | | $ | 161,964 | | | $ | 31,548 | | | $ | 27,736 | | | $ | 19,212 | | |
| Ratios (As a percentage of average daily net assets): | |
| Expenses(4) | | | 0.80 | %(5) | | | 0.81 | % | | | 0.84 | % | | | 0.82 | % | | | 0.83 | % | | | 0.88 | % | |
| Expenses after custodian fee reduction(4) | | | 0.79 | %(5) | | | 0.80 | % | | | 0.83 | % | | | 0.82 | % | | | 0.83 | % | | | 0.87 | % | |
| Net investment income | | | 4.46 | %(5) | | | 4.61 | % | | | 4.99 | % | | | 5.07 | % | | | 5.46 | % | | | 5.39 | % | |
| Portfolio Turnover of the Portfolio(6) | | | — | | | | 0 | % | | | 15 | % | | | 15 | % | | | 26 | % | | | 20 | % | |
| Portfolio Turnover of the Fund | | | 18 | % | | | 30 | % | | | — | | | | — | | | | — | | | | — | | |
(1) Net investment income per share was computed using average shares outstanding.
(2) The Fund, through its investment in the Portfolio, has adopted the provisions of the revised AICPA Audit and Accounting Guide for Investment Companies and began using the interest method to amortize premiums on fixed-income securities. The effect of this change for the year ended July 31, 2002 was to increase net investment income per share by $0.001, increase net realized and unrealized losses per share by $0.001, and increase the ratio of net investment income to average net assets from 5.45% to 5.46%. Per-share data and ratios for the periods prior to August 1, 2001 have not been restated to reflect this change in presentation.
(3) Returns are historical and are calculated by determining the percentage change in net asset value with all distributions reinvested. Total return is not computed on an annualized basis.
(4) Includes the Fund's share of its corresponding Portfolio's allocated expenses while the Fund was making investments directly into the Portfolio.
(5) Annualized.
(6) Portfolio turnover represents the rate of portfolio activity for the period while the Fund was making investments directly into the Portfolio.
See notes to financial statements
51
Eaton Vance Municipals Funds as of January 31, 2006
FINANCIAL STATEMENTS CONT'D
Financial Highlights
| | | New Jersey Fund — Class B | |
| | | Six Months Ended
January 31, 2006 | | Year Ended July 31, | |
| | | (Unaudited)(1) | | 2005(1) | | 2004(1) | | 2003(1) | | 2002(1)(2) | | 2001(1) | |
| Net asset value — Beginning of period | | $ | 10.930 | | | $ | 10.570 | | | $ | 10.510 | | | $ | 10.780 | | | $ | 10.790 | | | $ | 10.180 | | |
| Income (loss) from operations | |
| Net investment income | | $ | 0.203 | | | $ | 0.419 | | | $ | 0.445 | | | $ | 0.470 | | | $ | 0.504 | | | $ | 0.494 | | |
| Net realized and unrealized gain (loss) | | | (0.094 | ) | | | 0.361 | | | | 0.086 | | | | (0.271 | ) | | | (0.039 | ) | | | 0.590 | | |
| Total income from operations | | $ | 0.109 | | | $ | 0.780 | | | $ | 0.531 | | | $ | 0.199 | | | $ | 0.465 | | | $ | 1.084 | | |
| Less distributions | |
| From net investment income | | $ | (0.199 | ) | | $ | (0.420 | ) | | $ | (0.471 | ) | | $ | (0.469 | ) | | $ | (0.475 | ) | | $ | (0.474 | ) | |
| Total distributions | | $ | (0.199 | ) | | $ | (0.420 | ) | | $ | (0.471 | ) | | $ | (0.469 | ) | | $ | (0.475 | ) | | $ | (0.474 | ) | |
| Net asset value — End of period | | $ | 10.840 | | | $ | 10.930 | | | $ | 10.570 | | | $ | 10.510 | | | $ | 10.780 | | | $ | 10.790 | | |
| Total Return(3) | | | 1.01 | %(4) | | | 7.68 | %(4) | | | 5.07 | % | | | 1.80 | % | | | 4.43 | % | | | 10.88 | % | |
| Ratios/Supplemental Data | |
| Net assets, end of period (000's omitted) | | $ | 66,457 | | | $ | 72,228 | | | $ | 78,427 | | | $ | 228,575 | | | $ | 239,669 | | | $ | 238,445 | | |
| Ratios (As a percentage of average daily net assets): | |
| Expenses(5) | | | 1.55 | %(6) | | | 1.56 | % | | | 1.59 | % | | | 1.57 | % | | | 1.58 | % | | | 1.63 | % | |
| Expenses after custodian fee reduction(5) | | | 1.54 | %(6) | | | 1.55 | % | | | 1.58 | % | | | 1.57 | % | | | 1.58 | % | | | 1.62 | % | |
| Net investment income | | | 3.72 | %(6) | | | 3.87 | % | | | 4.12 | % | | | 4.33 | % | | | 4.72 | % | | | 4.71 | % | |
| Portfolio Turnover of the Portfolio(7) | | | — | | | | 0 | % | | | 15 | % | | | 15 | % | | | 26 | % | | | 20 | % | |
| Portfolio Turnover of the Fund | | | 18 | % | | | 30 | % | | | — | | | | — | | | | — | | | | — | | |
(1) Net investment income per share was computed using average shares outstanding.
(2) The Fund, through its investment in the Portfolio, has adopted the provisions of the revised AICPA Audit and Accounting Guide for Investment Companies and began using the interest method to amortize premiums on fixed-income securities. The effect of this change for the year ended July 31, 2002 was to increase net investment income per share by $0.001, increase net realized and unrealized losses per share by $0.001, and increase the ratio of net investment income to average net assets from 4.71% to 4.72%. Per-share data and ratios for the periods prior to August 1, 2001 have not been restated to reflect this change in presentation.
(3) Returns are historical and are calculated by determining the percentage change in net asset value with all distributions reinvested. Total return is not computed on an annualized basis.
(4) Total return reflects an increase of 0.17% due to a change in the timing of the payment and reinvestment of distributions.
(5) Includes the Fund's share of its corresponding Portfolio's allocated expenses while the Fund was making investments directly into the Portfolio.
(6) Annualized.
(7) Portfolio turnover represents the rate of portfolio activity for the period while the Fund was making investments directly into the Portfolio.
See notes to financial statements
52
Eaton Vance Municipals Funds as of January 31, 2006
FINANCIAL STATEMENTS CONT'D
Financial Highlights
| | | New Jersey Fund — Class C | |
| | | Period Ended
January 31, 2006
(Unaudited)(1)(2) | |
| Net asset value — Beginning of period | | $ | 10.74 | | |
| Income (loss) from operations | |
| Net investment income | | $ | 0.042 | | |
| Net realized and unrealized gain | | | 0.123 | (3) | |
| Total income from operations | | $ | 0.165 | | |
| Less distributions | |
| From net investment income | | $ | (0.055 | ) | |
| Total distributions | | $ | (0.055 | ) | |
| Net asset value — End of period | | $ | 10.840 | | |
| Total Return(4) | | | 1.41 | % | |
| Ratios/Supplemental Data | |
| Net assets, end of period (000's omitted) | | $ | 216 | | |
| Ratios (As a percentage of average daily net assets): | |
| Expenses | | | 1.55 | %(5) | |
| Expenses after custodian fee reduction | | | 1.54 | %(5) | |
| Net investment income | | | 2.83 | %(5) | |
| Portfolio Turnover | | | 18 | %(6) | |
(1) Net investment income per share was computed using average shares outstanding.
(2) For the period from the start of business on December 14, 2005, to Januaury 31, 2006.
(3) The per share amount is not in accord with the net realized and unrealized gain (loss) for the period because of the timing of sales of Fund shares and the amount of the per share realized and unrealized gains and losses at such time.
(4) Returns are historical and are calculated by determining the percentage change in net asset value with all distributions reinvested. Total return is not calculated on an annualized basis.
(5) Annualized.
(6) For the Fund fiscal period, August 1, 2005, to January 31, 2006.
See notes to financial statements
53
Eaton Vance Municipals Funds as of January 31, 2006
FINANCIAL STATEMENTS CONT'D
Financial Highlights
| | | Pennsylvania Fund — Class A | |
| | | Six Months Ended
January 31, 2006 | | Year Ended July 31, | |
| | | (Unaudited) | | 2005(1) | | 2004(1) | | 2003(1) | | 2002(1)(2) | | 2001(1) | |
| Net asset value — Beginning of period | | $ | 9.920 | | | $ | 9.730 | | | $ | 9.680 | | | $ | 9.870 | | | $ | 9.870 | | | $ | 9.480 | | |
| Income (loss) from operations | |
| Net investment income | | $ | 0.232 | | | $ | 0.490 | | | $ | 0.513 | | | $ | 0.525 | | | $ | 0.565 | | | $ | 0.548 | | |
| Net realized and unrealized gain (loss) | | | (0.009 | ) | | | 0.191 | | | | 0.053 | | | | (0.171 | ) | | | (0.021 | ) | | | 0.381 | | |
| Total income from operations | | $ | 0.223 | | | $ | 0.681 | | | $ | 0.566 | | | $ | 0.354 | | | $ | 0.544 | | | $ | 0.929 | | |
| Less distributions | |
| From net investment income | | $ | (0.233 | ) | | $ | (0.491 | ) | | $ | (0.516 | ) | | $ | (0.544 | ) | | $ | (0.544 | ) | | $ | (0.539 | ) | |
| Total distributions | | $ | (0.233 | ) | | $ | (0.491 | ) | | $ | (0.516 | ) | | $ | (0.544 | ) | | $ | (0.544 | ) | | $ | (0.539 | ) | |
| Net asset value — End of period | | $ | 9.910 | | | $ | 9.920 | | | $ | 9.730 | | | $ | 9.680 | | | $ | 9.870 | | | $ | 9.870 | | |
| Total Return(3) | | | 2.27 | % | | | 7.14 | % | | | 5.91 | % | | | 3.60 | % | | | 5.66 | % | | | 10.05 | % | |
| Ratios/Supplemental Data | |
| Net assets, end of period (000's omitted) | | $ | 168,450 | | | $ | 166,734 | | | $ | 156,465 | | | $ | 17,109 | | | $ | 14,896 | | | $ | 11,411 | | |
| Ratios (As a percentage of average daily net assets): | |
| Expenses(4) | | | 0.82 | %(5) | | | 0.85 | % | | | 0.85 | % | | | 0.83 | % | | | 0.87 | % | | | 0.89 | % | |
| Expenses after custodian fee reduction(4) | | | 0.81 | %(5) | | | 0.84 | % | | | 0.84 | % | | | 0.83 | % | | | 0.85 | % | | | 0.85 | % | |
| Net investment income | | | 4.65 | %(5) | | | 4.97 | % | | | 5.27 | % | | | 5.29 | % | | | 5.74 | % | | | 5.65 | % | |
| Portfolio Turnover of the Portfolio(6) | | | — | | | | 1 | % | | | 14 | % | | | 23 | % | | | 15 | % | | | 15 | % | |
| Portfolio Turnover of the Fund | | | 14 | % | | | 16 | % | | | — | | | | — | | | | — | | | | — | | |
(1) Net investment income per share was computed using average shares outstanding.
(2) The Fund, through its investment in the Portfolio, has adopted the provisions of the revised AICPA Audit and Accounting Guide for Investment Companies and began using the interest method to amortize premiums on fixed-income securities. The effect of this change for the year ended July 31, 2002 was to increase net investment income per share by $0.001, increase net realized and unrealized losses per share by $0.001, and increase the ratio of net investment income to average net assets by less than 0.01%. Per-share data and ratios for the periods prior to August 1, 2001 have not been restated to reflect this change in presentation.
(3) Returns are historical and are calculated by determining the percentage change in net asset value with all distributions reinvested. Total return is not computed on an annualized basis.
(4) Includes the Fund's share of its corresponding Portfolio's allocated expenses while the Fund was making investments directly into the Portfolio.
(5) Annualized.
(6) Portfolio turnover represents the rate of portfolio activity for the period while the Fund was making investments directly into the Portfolio.
See notes to financial statements
54
Eaton Vance Municipals Funds as of January 31, 2006
FINANCIAL STATEMENTS CONT'D
Financial Highlights
| | | Pennsylvania Fund — Class B | |
| | | Six Months Ended
January 31, 2006 | | Year Ended July 31, | |
| | | (Unaudited) | | 2005(1) | | 2004(1) | | 2003(1) | | 2002(1)(2) | | 2001(1) | |
| Net asset value — Beginning of period | | $ | 10.260 | | | $ | 10.060 | | | $ | 10.010 | | | $ | 10.210 | | | $ | 10.210 | | | $ | 9.800 | | |
| Income (loss) from operations | |
| Net investment income | | $ | 0.201 | | | $ | 0.431 | | | $ | 0.458 | | | $ | 0.469 | | | $ | 0.510 | | | $ | 0.492 | | |
| Net realized and unrealized gain (loss) | | | (0.009 | ) | | | 0.200 | | | | 0.049 | | | | (0.182 | ) | | | (0.026 | ) | | | 0.392 | | |
| Total income from operations | | $ | 0.192 | | | $ | 0.631 | | | $ | 0.507 | | | $ | 0.287 | | | $ | 0.484 | | | $ | 0.884 | | |
| Less distributions | |
| From net investment income | | $ | (0.202 | ) | | $ | (0.431 | ) | | $ | (0.457 | ) | | $ | (0.487 | ) | | $ | (0.484 | ) | | $ | (0.474 | ) | |
| Total distributions | | $ | (0.202 | ) | | $ | (0.431 | ) | | $ | (0.457 | ) | | $ | (0.487 | ) | | $ | (0.484 | ) | | $ | (0.474 | ) | |
| Net asset value — End of period | | $ | 10.250 | | | $ | 10.260 | | | $ | 10.060 | | | $ | 10.010 | | | $ | 10.210 | | | $ | 10.210 | | |
| Total Return(3) | | | 1.89 | % | | | 6.58 | %(4) | | | 5.10 | % | | | 2.81 | % | | | 4.83 | % | | | 9.21 | % | |
| Ratios/Supplemental Data | |
| Net assets, end of period (000's omitted) | | $ | 45,685 | | | $ | 47,747 | | | $ | 51,972 | | | $ | 204,087 | | | $ | 211,865 | | | $ | 218,068 | | |
| Ratios (As a percentage of average daily net assets): | |
| Expenses(5) | | | 1.57 | %(6) | | | 1.60 | % | | | 1.60 | % | | | 1.58 | % | | | 1.62 | % | | | 1.65 | % | |
| Expenses after custodian fee reduction(5) | | | 1.56 | %(6) | | | 1.59 | % | | | 1.59 | % | | | 1.58 | % | | | 1.60 | % | | | 1.61 | % | |
| Net investment income | | | 3.90 | %(6) | | | 4.22 | % | | | 4.48 | % | | | 4.57 | % | | | 5.00 | % | | | 4.90 | % | |
| Portfolio Turnover of the Portfolio(7) | | | — | | | | 1 | % | | | 14 | % | | | 23 | % | | | 15 | % | | | 15 | % | |
| Portfolio Turnover of the Fund | | | 14 | % | | | 16 | % | | | — | | | | — | | | | — | | | | — | | |
(1) Net investment income per share was computed using average shares outstanding.
(2) The Fund, through its investment in the Portfolio, has adopted the provisions of the revised AICPA Audit and Accounting Guide for Investment Companies and began using the interest method to amortize premiums on fixed-income securities. The effect of this change for the year ended July 31, 2002 was to increase net investment income per share by $0.001, increase net realized and unrealized losses per share by $0.001, and increase the ratio of net investment income to average net assets by less than 0.01%. Per-share data and ratios for the periods prior to August 1, 2001 have not been restated to reflect this change in presentation.
(3) Returns are historical and are calculated by determining the percentage change in net asset value with all distributions reinvested. Total return is not computed on an annualized basis.
(4) Total return reflects an increase of 0.18% due to a change in the timing of the payment and reinvestment of distributions.
(5) Includes the Fund's share of its corresponding Portfolio's allocated expenses while the Fund was making investments directly into the Portfolio.
(6) Annualized.
(7) Portfolio turnover represents the rate of portfolio activity for the period while the Fund was making investments directly into the Portfolio.
See notes to financial statements
55
Eaton Vance Municipals Funds as of January 31, 2006
FINANCIAL STATEMENTS CONT'D
Financial Highlights
| | | Pennsylvania Fund — Class C | |
| | | Period Ended
January 31, 2006
(Unaudited)(1) | |
| Net asset value — Beginning of period | | $ | 10.250 | | |
| Income (loss) from operations | |
| Net investment income | | $ | 0.022 | | |
| Net realized and unrealized gain | | | 0.010 | | |
| Total income from operations | | $ | 0.032 | | |
| Less distributions | |
| From net investment income | | $ | (0.022 | ) | |
| Total distributions | | $ | (0.022 | ) | |
| Net asset value — End of period | | $ | 10.260 | | |
| Total Return(3) | | | 0.26 | %(2) | |
| Ratios/Supplemental Data | |
| Net assets, end of period (000's omitted) | | $ | 198 | | |
| Ratios (As a percentage of average daily net assets): | |
| Expenses | | | 1.57 | %(3) | |
| Expenses after custodian fee reduction | | | 1.56 | %(3) | |
| Net investment income | | | 2.25 | %(3) | |
| Portfolio Turnover of the Fund | | | 14 | %(4) | |
(1) For the period from the start of business on January 13, 2006, to January 31, 2006.
(2) Returns are historical and are calculated by determining the percentage change in net asset value with all distributions reinvested. Total return is not computed on an annualized basis.
(3) Annualized.
(4) For the Fund fiscal period, August 1, 2005 to January 31, 2006.
See notes to financial statements
56
Eaton Vance Municipals Funds as of January 31, 2006
NOTES TO FINANCIAL STATEMENTS (Unaudited)
1 Significant Accounting Policies
Eaton Vance Municipals Trust (the Trust) is an entity of the type commonly known as a Massachusetts business trust and is registered under the Investment Company Act of 1940, as amended, as an open-end management investment company. The Trust presently consists of twenty-eight Funds, seven of which, each non-diversified, are included in these financial statements. They include Eaton Vance Arizona Municipals Fund (Arizona Fund), Eaton Vance Colorado Municipals Fund (Colorado Fund), Eaton Vance Connecticut Municipals Fund (Connecticut Fund), Eaton Vance Michigan Municipals Fund (Michigan Fund), Eaton Vance Minnesota Municipals Fund (Minnesota Fund), Eaton Vance New Jersey Municipals Fund (New Jersey Fund) and Eaton Vance Pennsylvania Municipals Fund (Pennsylvania Fund), individually, the Fund, collectively, the Funds. The Funds seek to achieve current income exempt from regular federal income tax and particular state or local inco me taxes by investing primarily in investment grade municipal obligations. The Arizona Fund, the Colorado Fund, the Connecticut Fund, the Michigan Fund, the Minnesota Fund, the New Jersey Fund and the Pennsylvania Fund offer three classes of shares. Class A shares are generally sold subject to a sales charge imposed at time of purchase. Class B and Class C shares are sold at net asset value and are subject to a declining contingent deferred sales charge (see Note 6). The Trustees have adopted a conversion feature pursuant to which Class B shares of each Fund automatically convert to Class A shares eight years after their purchase as described in each Fund's prospectus. Each class represents a pro-rata interest in the Fund, but votes separately on class-specific matters and (as noted below) is subject to different expenses. Realized and unrealized gains and losses are allocated daily to each class of shares based on the relative net assets of each class to the total net assets of the Fund. Net investment inco me, other than class-specific expenses, is allocated daily to each class of shares based upon the ratio of the value of each class's paid shares to the total value of all paid shares. Each class of shares differs in its distribution plan and certain other class specific expenses.
The following is a summary of significant accounting policies consistently followed by the Trust in the preparation of its financial statements. The policies are in conformity with accounting principles generally accepted in the United States of America.
A Investment Valuations — Municipal bonds, and taxable obligations, if any, are normally valued on the basis of valuations furnished by a pricing service. Financial Futures contracts and options on financial futures contracts listed on commodity exchanges are valued at closing settlement prices. Over-the-counter options on financial futures contracts are normally valued at the mean between the latest bid and asked prices. Interest rate swaps are normally valued on the basis of valuations furnished by a broker. Short-term obligations, maturing in sixty days or less, are valued at amortized cost, which approximates value. Investment s for which valuations or market quotations are not readily available, and investments for which the price of a security is not believed to represent its fair market value, are valued at fair value using methods determined in good faith by or at the direction of the Trustees.
B Income — Interest income is determined on the basis of interest accrued, adjusted for amortization of premium or discount.
C Federal Taxes — Each Fund's policy is to comply with the provisions of the Internal Revenue Code applicable to regulated investment companies and to distribute to shareholders each year all of its taxable and tax-exempt income, including any net realized gain on investments. Accordingly, no provision for federal income or excise tax is necessary. At July 31, 2005, the following Funds, for federal income tax purposes, had capital loss carryovers, which will reduce each Fund's taxable income arising from future net realized gain on investments, if any, to the extent permitted by the Internal Revenue Code, and thus will reduce the amount of distributions to shareholders which would otherwise be necessa ry to relieve the Funds of any liability for federal income or excise tax. The amounts and expiration dates of the capital loss carryovers are as follows:
| Fund | | Amount | | Expires | |
| Arizona | | $ | 177,375 | | | July 31, 2008 | |
|
| | | | 589,819 | | | July 31, 2009 | |
|
| | | | 536,449 | | | July 31, 2010 | |
|
| | | | 353,624 | | | July 31, 2012 | |
|
| | | | 691,155 | | | July 31, 2013 | |
|
| Colorado | | | 145,382 | | | July 31, 2009 | |
|
| | | | 146,689 | | | July 31, 2010 | |
|
| | | | 166,807 | | | July 31, 2012 | |
|
| | | | 350,515 | | | July 31, 2013 | |
|
| Connecticut | | | 242,814 | | | July 31, 2008 | |
|
| | | | 214,600 | | | July 31, 2010 | |
|
| | | | 502,297 | | | July 31, 2012 | |
|
| | | | 1,173,100 | | | July 31, 2013 | |
|
| Michigan | | | 562,654 | | | July 31, 2008 | |
|
| | | | 226,944 | | | July 31, 2010 | |
|
| | | | 681,536 | | | July 31, 2011 | |
|
57
Eaton Vance Municipals Funds as of January 31, 2006
NOTES TO FINANCIAL STATEMENTS (Unaudited) CONT'D
| Fund | | Amount | | Expires | |
| Minnesota | | $ | 340,808 | | | July 31, 2008 | |
|
| | | | 128,212 | | | July 31, 2009 | |
|
| | | | 214,916 | | | July 31, 2010 | |
|
| | | | 382,839 | | | July 31, 2012 | |
|
| | | | 504,289 | | | July 31, 2013 | |
|
| New Jersey | | | 1,190,382 | | | July 31, 2009 | |
|
| | | | 941,924 | | | July 31, 2011 | |
|
| | | | 3,296,401 | | | July 31, 2012 | |
|
| | | | 2,944,993 | | | July 31, 2013 | |
|
| Pennsylvania | | | 933,369 | | | July 31, 2009 | |
|
| | | | 1,301,218 | | | July 31, 2010 | |
|
| | | | 7,701,119 | | | July 31, 2011 | |
|
| | | | 1,108,751 | | | July 31, 2012 | |
|
| | | | 3,349,896 | | | July 31, 2013 | |
|
Dividends paid by each Fund from net interest on tax-exempt municipal bonds are not includable by shareholders as gross income for federal income tax purposes because each Fund intends to meet certain requirements of the Internal Revenue Code applicable to regulated investment companies that will enable the Funds to pay tax-exempt interest dividends. The portion of such interest, if any, earned on private activity bonds issued after August 7, 1986 may be considered a tax preference item to shareholders.
Additionally, at July 31, 2005, Arizona Fund, Colorado Fund, Connecticut Fund, Minnesota Fund and Pennsylvania Fund had net capital losses of $1,552,491, $130,465, $191,617, $202,624 and $272,384 respectively, attributable to security transactions incurred after October 31, 2004. These are treated as arising on the first day of each Fund's taxable year ending July 31, 2006.
D Financial Futures Contracts — Upon the entering of a financial futures contract, a Fund is required to deposit (initial margin) either in cash or securities an amount equal to a certain percentage of the purchase price indicated in the financial futures contract. Subsequent payments are made or received by a Fund (margin maintenance) each day, dependent on the daily fluctuations in the value of the underlying security, and are recorded for book purposes as unrealized gains or losses by a Fund. A Fund's investment in financial futures contracts is designed to hedge against anticipated future changes in interest rates. Should interest rates move unexpectedly, a Fund may not achieve the anticipated ben efits of the financial futures contracts and may realize a loss.
E Options on Financial Futures Contracts — Upon the purchase of a put option on a financial futures contract by a Fund, the premium paid is recorded as an investment, the value of which is marked-to-market daily. When a purchased option expires, a Fund will realize a loss in the amount of the cost of the option. When a Fund enters into a closing sale transaction, a Fund will realize a gain or loss depending on whether the sales proceeds from the closing sale transaction are greater or less than the cost of the option. When a Fund exercises a put option, settlement is made in cash. The risk associated with purchasing options is limited to the premium originally paid.
F When-Issued and Delayed Delivery Transactions — The Funds may engage in when-issued and delayed delivery transactions. The Funds record when-issued securities on trade date and maintain security positions such that sufficient liquid assets will be available to make payments for the securities purchased. Securities purchased on a when-issued or delayed delivery basis are marked-to-market daily and begin earning interest on settlement date.
G Interest Rate Swaps — A Fund may enter into interest rate swap agreements to enhance return, to hedge against fluctuations in securities prices or interest rates or as substitution for the purchase or sale of securities. Pursuant to these agreements, the Fund makes semi-annual payments at a fixed interest rate. In exchange, a Fund receives payments based on the interest rate of a benchmark industry index. During the term of the outstanding swap agreement, changes in the underlying value of the swap are recorded as unrealized gains and losses. The value of the swap is determined by changes in the relationship between two rates of interest. The Fund is exposed to credit loss in the event of non-perfor mance by the swap counterparty. However, the Fund does not anticipate non-performance by the counterparty. Risk may also arise from the unanticipated movements in value of interest rates.
H Legal Fees — Legal fees and other related expenses incurred as part of negotiations of the terms and requirements of capital infusions, or that are expected to result in the restructuring of or a plan of reorganization for an investment are recorded as realized losses. Ongoing expenditures to protect or enhance an investment are treated as operating expenses.
I Expenses — The majority of expenses of the Trust are directly identifiable to an individual fund. Expenses which are not readily identifiable to a specific fund are allocated
58
Eaton Vance Municipals Funds as of January 31, 2006
NOTES TO FINANCIAL STATEMENTS (Unaudited) CONT'D
taking into consideration, among other things, the nature and type of expense and the relative size of the Funds.
J Expense Reduction — Investors Bank & Trust Company (IBT) serves as custodian of the Funds. Pursuant to the respective custodian agreements, IBT receives a fee reduced by credits which are determined based on the average daily cash balance each Fund maintains with IBT. All credit balances used to reduce the Funds' custodian fees are reported as a reduction of total expenses on the Statements of Operations.
K Use of Estimates — The preparation of the financial statements in conformity with accounting principles generally accepted in the United States of America requires management to make estimates and assumptions that affect the reported amounts of assets and liabilities at the date of the financial statements and the reported amounts of income and expense during the reporting period. Actual results could differ from those estimates.
L Indemnifications — Under the Trust's organizational documents, its officers and Trustees may be indemnified against certain liabilities and expenses arising out of the performance of their duties to the Funds and shareholders are indemnified against personal liability for obligations of the Trust. Additionally, in the normal course of business, the Funds enter into agreements with service providers that may contain indemnification clauses. The Funds' maximum exposure under these arrangements is unknown as this would involve future claims that may be made against the Funds that have not yet occurred.
M Other — Investment transactions are accounted for on a trade date basis. Realized gains and losses are computed based on the specific identification of the securities sold.
N Interim Financial Statements — The interim financial statements relating to January 31, 2006 and for the six months then ended have not been audited by an independent registered public accounting firm, but in the opinion of the Funds' management reflect all adjustments, consisting only of normal recurring adjustments, necessary for the fair presentation of the financial statements.
2 Distributions to Shareholders
The net income of each Fund is determined daily and substantially all of the net income so determined is declared as a dividend to shareholders of record at the time of declaration. Distributions are declared separately for each class of shares. Distributions are paid monthly. Distributions of realized capital gains, if any, are made at least annually. Shareholders may reinvest income and capital gain distributions in additional shares of the same class of a Fund at the net asset value as of the reinvestment date. Distributions are paid in the form of additional shares of the same class or, at the election of the shareholder, in cash. The Funds distinguish between distributions on a tax basis and a financial reporting basis. Accounting principles generally accepted in the United States of America require that only distributions in excess of tax basis earning s and profits be reported in the financial statements as a return of capital. Permanent differences between book and tax accounting relating to distributions are reclassified to paid-in capital.
3 Shares of Beneficial Interest
The Funds' Declaration of Trust permits the Trustees to issue an unlimited number of full and fractional shares of beneficial interest (without par value). Such shares may be issued in a number of different series (such as the Funds) and classes. Transactions in Fund shares were as follows:
| | | Arizona Fund | |
| Class A | | Six Months Ended
January 31, 2006
(Unaudited) | | Year Ended
July 31, 2005 | |
| Sales | | | 432,764 | | | | 1,667,472 | | |
Issued to shareholders electing to
receive payments of distributions
in Fund shares | | | 90,850 | | | | 130,065 | | |
| Redemptions | | | (306,831 | ) | | | (918,393 | ) | |
| Exchange from Class B shares | | | 59,935 | | | | 146,155 | | |
| Net increase | | | 276,718 | | | | 1,025,299 | | |
| | | Arizona Fund | |
| Class B | | Six Months Ended
January 31, 2006
(Unaudited) | | Year Ended
July 31, 2005 | |
| Sales | | | 24,726 | | | | 98,780 | | |
Issued to shareholders electing to
receive payments of distributions
in Fund shares | | | 17,462 | | | | 36,349 | | |
| Redemptions | | | (207,706 | ) | | | (260,060 | ) | |
| Exchange to Class A shares | | | (53,926 | ) | | | (131,415 | ) | |
| Net decrease | | | (219,444 | ) | | | (256,346 | ) | |
59
Eaton Vance Municipals Funds as of January 31, 2006
NOTES TO FINANCIAL STATEMENTS (Unaudited) CONT'D
| | | Arizona Fund | |
| Class C | | Six Months Ended
January 31, 2006
(Unaudited)(1) | | Year Ended
July 31, 2005 | |
| Sales | | | 18,587 | | | | — | | |
| Net increase | | | 18,587 | | | | — | | |
| | | Colorado Fund | |
| Class A | | Six Months Ended
January 31, 2006
(Unaudited) | | Year Ended
July 31, 2005 | |
| Sales | | | 213,233 | | | | 237,480 | | |
Issued to shareholders electing to
receive payments of distributions
in Fund shares | | | 34,117 | | | | 60,402 | | |
| Redemptions | | | (143,245 | ) | | | (188,956 | ) | |
| Exchange from Class B shares | | | 71,098 | | | | 107,020 | | |
| Net increase | | | 175,203 | | | | 215,946 | | |
| | | Colorado Fund | |
| Class B | | Six Months Ended
January 31, 2006
(Unaudited) | | Year Ended
July 31, 2005 | |
| Sales | | | 14,999 | | | | 20,034 | | |
Issued to shareholders electing to
receive payments of distributions
in Fund shares | | | 7,806 | | | | 20,950 | | |
| Redemptions | | | (29,937 | ) | | | (168,078 | ) | |
| Exchange to Class A shares | | | (65,321 | ) | | | (98,315 | ) | |
| Net decrease | | | (72,453 | ) | | | (225,409 | ) | |
| | | Connecticut Fund | |
| Class A | | Six Months Ended
January 31, 2006
(Unaudited) | | Year Ended
July 31, 2005 | |
| Sales | | | 490,386 | | | | 972,824 | | |
Issued to shareholders electing to
receive payments of distributions
in Fund shares | | | 105,962 | | | | 233,072 | | |
| Redemptions | | | (877,411 | ) | | | (983,152 | ) | |
| Exchange from Class B shares | | | 103,305 | | | | 278,219 | | |
| Net increase (decrease) | | | (177,758 | ) | | | 500,963 | | |
| | | Connecticut Fund | |
| Class B | | Six Months Ended
January 31, 2006
(Unaudited) | | Year Ended
July 31, 2005 | |
| Sales | | | 44,438 | | | | 113,716 | | |
Issued to shareholders electing to
receive payments of distributions
in Fund shares | | | 25,845 | | | | 67,072 | | |
| Redemptions | | | (246,780 | ) | | | (458,189 | ) | |
| Exchange to Class A shares | | | (103,832 | ) | | | (279,446 | ) | |
| Net decrease | | | (280,329 | ) | | | (556,847 | ) | |
| | | Michigan Fund | |
| Class A | | Six Months Ended
January 31, 2006
(Unaudited) | | Year Ended
July 31, 2005 | |
| Sales | | | 374,100 | | | | 283,684 | | |
Issued to shareholders electing to
receive payments of distributions
in Fund shares | | | 70,795 | | | | 147,435 | | |
| Redemptions | | | (522,407 | ) | | | (715,396 | ) | |
| Exchange from Class B shares | | | 35,226 | | | | 110,676 | | |
| Net decrease | | | (42,286 | ) | | | (173,601 | ) | |
| | | Michigan Fund | |
| Class B | | Six Months Ended
January 31, 2006
(Unaudited)(2) | | Year Ended
July 31, 2005(2) | |
| Sales | | | 31,478 | | | | 42,813 | | |
Issued to shareholders electing to
receive payments of distributions
in Fund shares | | | 7,612 | | | | 19,880 | | |
| Redemptions | | | (84,291 | ) | | | (249,488 | ) | |
| Exchange to Class A shares | | | (32,736 | ) | | | (110,634 | ) | |
| Net decrease | | | (77,937 | ) | | | (297,429 | ) | |
| | | Minnesota Fund | |
| Class A | | Six Months Ended
January 31, 2006
(Unaudited) | | Year Ended
July 31, 2005 | |
| Sales | | | 331,458 | | | | 239,377 | | |
Issued to shareholders electing to
receive payments of distributions
in Fund shares | | | 52,978 | | | | 96,720 | | |
| Redemptions | | | (361,242 | ) | | | (319,918 | ) | |
| Exchange from Class B shares | | | 59,142 | | | | 115,717 | | |
| Net increase | | | 82,336 | | | | 131,896 | | |
60
Eaton Vance Municipals Funds as of January 31, 2006
NOTES TO FINANCIAL STATEMENTS (Unaudited) CONT'D
| | | Minnesota Fund | |
| Class B | | Six Months Ended
January 31, 2006
(Unaudited) | | Year Ended
July 31, 2005 | |
| Sales | | | 53,926 | | | | 42,675 | | |
Issued to shareholders electing to
receive payments of distributions
in Fund shares | | | 14,833 | | | | 32,379 | | |
| Redemptions | | | (262,890 | ) | | | (164,612 | ) | |
| Exchange to Class A shares | | | (54,927 | ) | | | (107,506 | ) | |
| Net decrease | | | (249,058 | ) | | | (197,064 | ) | |
| | | Minnesota Fund | |
| Class C | | Six Months Ended
January 31, 2006
(Unaudited)(3) | | Year Ended
July 31, 2005 | |
| Sales | | | 6,620 | | | | — | | |
Issued to shareholders electing to
receive payments of distributions
in Fund shares | | | 9 | | | | — | | |
| Net increase | | | 6,629 | | | | — | | |
| | | New Jersey Fund | |
| Class A | | Six Months Ended
January 31, 2006
(Unaudited) | | Year Ended
July 31, 2005 | |
| Sales | | | 802,863 | | | | 1,382,887 | | |
Issued to shareholders electing to
receive payments of distributions
in Fund shares | | | 232,880 | | | | 470,709 | | |
| Redemptions | | | (1,198,353 | ) | | | (1,592,561 | ) | |
| Exchange from Class B shares | | | 350,276 | | | | 522,226 | | |
| Net increase | | | 187,666 | | | | 783,261 | | |
| | | New Jersey Fund | |
| Class B | | Six Months Ended
January 31, 2006
(Unaudited) | | Year Ended
July 31, 2005 | |
| Sales | | | 212,668 | | | | 543,847 | | |
Issued to shareholders electing to
receive payments of distributions
in Fund shares | | | 67,537 | | | | 165,276 | | |
| Redemptions | | | (426,938 | ) | | | (1,018,290 | ) | |
| Exchange to Class A shares | | | (335,510 | ) | | | (500,175 | ) | |
| Net decrease | | | (482,243 | ) | | | (809,342 | ) | |
| | | New Jersey Fund | |
| Class C | | Six Months Ended
January 31, 2006
(Unaudited)(4) | | Year Ended
July 31, 2005 | |
| Sales | | | 19,912 | | | | — | | |
Issued to shareholders electing to
receive payments of distributions
in Fund shares | | | 47 | | | | — | | |
| Net increase | | | 19,959 | | | | — | | |
| | | Pennsylvania Fund | |
| Class A | | Six Months Ended
January 31, 2006
(Unaudited) | | Year Ended
July 31, 2005 | |
| Sales | | | 807,738 | | | | 1,649,277 | | |
Issued to shareholders electing to
receive payments of distributions
in Fund shares | | | 224,067 | | | | 473,908 | | |
| Redemptions | | | (1,045,828 | ) | | | (1,730,461 | ) | |
| Exchange from Class B shares | | | 193,018 | | | | 340,006 | | |
| Net increase | | | 178,995 | | | | 732,730 | | |
| | | Pennsylvania Fund | |
| Class B | | Six Months Ended
January 31, 2006
(Unaudited) | | Year Ended
July 31, 2005 | |
| Sales | | | 201,894 | | | | 354,275 | | |
Issued to shareholders electing to
receive payments of distributions
in Fund shares | | | 44,371 | | | | 103,906 | | |
| Redemptions | | | (259,374 | ) | | | (638,905 | ) | |
| Exchange to Class A shares | | | (186,568 | ) | | | (328,737 | ) | |
| Net decrease | | | (199,677 | ) | | | (509,461 | ) | |
| | | Pennsylvania Fund | |
| Class C | | Six Months Ended
January 31, 2006
(Unaudited)(5) | | Year Ended
July 31, 2005 | |
| Sales | | | 19,333 | | | | — | | |
| Net increase | | | 19,333 | | | | — | | |
(1) Class C shares of the Arizona Fund commenced operations on December 16, 2005.
(2) Transactions have been restated to reflect the effects of a 1.1167883-for-1 stock split effective on November 11, 2005.
(3) Class C shares of the Minnesota Fund commenced operations on December 21, 2005.
(4) Class C shares of the New Jersey Fund commenced operations on December 14, 2005.
(5) Class C shares of the Pennsylvania Fund commenced operations on January 13, 2006.
61
Eaton Vance Municipals Funds as of January 31, 2006
NOTES TO FINANCIAL STATEMENTS (Unaudited) CONT'D
4 Investment Adviser Fee and Other Transactions with Affiliates
The investment adviser fee is earned by Boston Management and Research (BMR), a wholly-owned subsidiary of Eaton Vance Management (EVM), as compensation for management and investment advisory services rendered to each Fund. The fee is based upon a percentage of average daily net assets plus a percentage of gross income (i.e., income other than gains from the sale of securities). For the six months ended January 31, 2006, the advisory fee allocated from each Fund is as follows:
| Portfolio | | Amount | | Effective Rate* | |
| Arizona Fund | | $ | 125,176 | | | | 0.33 | % | |
| Colorado Fund | | | 30,687 | | | | 0.20 | % | |
| Connecticut Fund | | | 245,603 | | | | 0.38 | % | |
| Michigan Fund | | | 93,008 | | | | 0.30 | % | |
| Minnesota Fund | | | 54,495 | | | | 0.25 | % | |
| New Jersey Fund | | | 519,964 | | | | 0.42 | % | |
| Pennsylvania Fund | | | 448,375 | | | | 0.42 | % | |
* As a percentage of average daily net assets (annualized).
Except as to Trustees of the Funds who are not members of EVM's or BMR's organization, officers and Trustees receive remuneration for their services to the Funds out of such investment adviser fee. EVM serves as the Administrator of each Fund, but receives no compensation. EVM serves as the sub-transfer agent of each Fund and receives from the transfer agent an aggregate fee based upon the actual expenses incurred by EVM in the performance of these services. For the six months ended January 31, 2006, EVM earned $713, $378, $1,420, $1,052, $676, $916, and $933 in sub-transfer agent fees from Arizona Fund, Colorado Fund, Connecticut Fund, Michigan Fund, Minnesota Fund, New Jersey Fund and Pennsylvania Fund, respectively. The Funds were informed that Eaton Vance Distributors, Inc. (EVD), a subsidiary of EVM and the Funds' principal underwriter, received $8,809, $4,494, $8,752, $4,559, $5,178, $20,231 and $22,950 as its portion of t he sales charge on sales of Class A shares from the Arizona Fund, Colorado Fund, Connecticut Fund, Michigan Fund, Minnesota Fund, New Jersey Fund and Pennsylvania Fund, respectively, for the six months ended January 31, 2006.
Trustees of the Funds who are not affiliated with the Investment Adviser may elect to defer receipt of all or a percentage of their annual fees in accordance with the terms of the Trustees Deferred Compensation Plan. For the six months ended January 31, 2006, no significant amounts have been deferred.
Certain officers and Trustees of the Funds are officers of the above organizations.
5 Distribution and Service Plans
Each Fund has in effect a distribution plan for Class B (Class B Plan) and Class C shares (Class C Plan) pursuant to Rule 12b-1 under the Investment Company Act of 1940 and a service plan for Class A (Class A Plan) (collectively, the Plans). The Class B and Class C Plans require each Fund to pay EVD amounts equal to 1/365 of 0.75% of each Fund's daily net assets attributable to Class B and Class C shares, for providing ongoing distribution services and facilities to the respective Fund. Each Fund will automatically discontinue payments to EVD during any period in which there are no outstanding Uncovered Distribution Charges, which are equivalent to the sum of (i) 5% of the aggregate amount received by the Fund for Class B and Class C shares sold, respectively, plus (ii) interest calculated by applying the rate of 1% over the prevailing prime rate to the outstanding balance of Uncovered Distribution Charges of EVD reduced by the aggregate amount of contingent deferred sales charges (see Note 6) and daily amounts theretofore paid to EVD. The amount payable to EVD with respect to each day is accrued on such day as a liability of each Fund's Class B and Class C shares and, accordingly, reduces each Fund's Class B and Class C net assets. For the six months ended January 31, 2006, the Class B shares of the Arizona Fund, Colorado Fund, Connecticut Fund, Michigan Fund, Minnesota Fund, New Jersey Fund and Pennsylvania Fund paid or accrued $58,752, $29,866, $110,910, $30,238, $47,526, $261,581 and $175,540, respectively, to EVD, representing 0.75% of each Fund's Class B average daily net assets. For the six months ended January 31, 2006, the Arizona Fund, Minnesota Fund, New Jersey Fund and Pennsylvania Fund paid or accrued $194, $27, $120, and $6, respectively, to EVD, representing 0.75% (annualized) of the Fund's Class C average daily net assets. At January 31, 2006, the amount of Uncovered Distribution Charges of EVD calculated under the Class B Plans for Arizona Fund, Colorado Fund, Connecticut Fund, Michigan Fund, Minnesota Fund, New Jersey Fund and Pennsylvania Fund were approximately $921,000, $869,000, $1,218,000, $28,000, $713,000, $578,000 and $1,648,000, respectively, and approximately $12,000, $4,000 and $13,000 calculated over the Class C Plans for Arizona, Minnesota and New Jersey, respectively.
The Plans authorize each Fund to make payments of service fees to EVD, investment dealers and other persons in amounts equal to 0.20% of each Fund's average daily
62
Eaton Vance Municipals Funds as of January 31, 2006
NOTES TO FINANCIAL STATEMENTS (Unaudited) CONT'D
net assets attributable to Class A and Class B, and if applicable, Class C shares for each fiscal year. Service fee payments will be made for personal services and/or the maintenance of shareholder accounts. Service fees are separate and distinct from the sales commissions and distribution fees payable by each Fund to EVD, and as such are not subject to automatic discontinuance when there are no outstanding Uncovered Distribution Charges of EVD. For the six months ended January 31, 2006, Arizona Fund, Colorado Fund, Connecticut Fund, Michigan Fund, Minnesota Fund, New Jersey Fund and Pennsylvania Fund paid or accrued service fees to or payable to EVD in the amount of $59,967, $22,737, $101,298, $53,373, $31,449, $176,468 and $167,469, respectively, for Class A shares, and $15,667, $7,964, $29,576, $8,063, $12,674, $69,755 and $46,698, respectively, for Class B shares, and $49, $7, $32, $2 for Class C shares for the Arizona Fund, the Minnesota Fund, the New Jersey Fund and the Pennsylvania fund, respectively.
6 Contingent Deferred Sales Charge
A contingent deferred sales charge (CDSC) generally is imposed on redemptions of Class B shares made within six years of purchase and on redemptions of Class C shares made within one year of purchase. Class A shares may be subject to a 1% CDSC if redeemed within 18 months of purchase (depending on the circumstances of purchase). Generally, the CDSC is based upon the lower of the net asset value at date of redemption or date of purchase. No charge is levied on shares acquired by reinvestment of dividends or capital gains distributions. The Class B CDSC is imposed at declining rates that begin at 5% in the case of redemptions in the first and second year after purchase, declining one percentage point each subsequent year. Class C shares are subject to a 1% CDSC if redeemed within one year of purchase. No CDSC is levied on shares which have been sold to EVD or its affiliates or to their respective employees or clients and may be wa ived under certain other limited conditions. CDSC received on Class B redemptions are paid to EVD to reduce the amount of Uncovered Distribution Charges calculated under each Fund's Class B and if applicable, Class C Distribution Plan (see Note 5). CDSC received on Class B and Class C redemptions when no Uncovered Distribution Charges exist will be credited to each Fund. EVD received approximately $500, $9,000, $1,000 and $2,000 of CDSC paid by Class A shareholders of Arizona Fund, Connecticut Fund, Michigan Fund and Pennsylvania Fund, respectively, for the six months ended January 31, 2006. EVD received approximately $44,000, $4,000, $18,000, $11,000, $14,000, $41,000 and $30,000 of CDSC paid by Class B shareholders of Arizona Fund, Colorado Fund, Connecticut Fund, Michigan Fund, Minnesota Fund, New Jersey Fund and Pennsylvania Fund, respectively, for the six months ended January 31, 2006.
7 Investments
Purchases and sales of investments by the Portfolio, other than U.S. Government securities, purchased options and short-term obligations, for the six months ended January 31, 2006 were as follows:
| Arizona Fund | | | |
| Purchases | | $ | 9,678,128 | | |
| Sales | | | 8,300,050 | | |
| Colorado Fund | | | |
| Purchases | | $ | 5,052,775 | | |
| Sales | | | 4,265,595 | | |
| Connecticut Fund | | | |
| Purchases | | $ | 16,963,948 | | |
| Sales | | | 22,261,780 | | |
| Michigan Fund | | | |
| Purchases | | $ | 4,475,973 | | |
| Sales | | | 6,029,193 | | |
| Minnesota Fund | | | |
| Purchases | | $ | 3,112,290 | | |
| Sales | | | 5,529,857 | | |
| New Jersey Fund | | | |
| Purchases | | $ | 43,949,725 | | |
| Sales | | | 48,593,634 | | |
| Pennsylvania Fund | | | |
| Purchases | | $ | 39,015,877 | | |
| Sales | | | 30,082,678 | | |
63
Eaton Vance Municipals Funds as of January 31, 2006
NOTES TO FINANCIAL STATEMENTS (Unaudited) CONT'D
8 Federal Income Tax Basis of Unrealized Appreciation (Depreciation)
The cost and unrealized appreciation (depreciation) in value of the investments owned at January 31, 2006, as computed on a federal income tax basis, are as follows:
| Arizona Fund | |
| Aggregate Cost | | $ | 69,772,709 | | |
| Gross unrealized appreciation | | $ | 5,944,159 | | |
| Gross unrealized depreciation | | | (487,482 | ) | |
| Net unrealized appreciation | | $ | 5,456,677 | | |
| Colorado Fund | |
| Aggregate Cost | | $ | 28,820,865 | | |
| Gross unrealized appreciation | | $ | 2,027,344 | | |
| Gross unrealized depreciation | | | (194,146 | ) | |
| Net unrealized appreciation | | $ | 1,833,198 | | |
| Connecticut Fund | |
| Aggregate Cost | | $ | 117,751,338 | | |
| Gross unrealized appreciation | | $ | 7,461,366 | | |
| Gross unrealized depreciation | | | (81,938 | ) | |
| Net unrealized appreciation | | $ | 7,379,428 | | |
| Michigan Fund | |
| Aggregate Cost | | $ | 54,731,780 | | |
| Gross unrealized appreciation | | $ | 5,521,010 | | |
| Gross unrealized depreciation | | | (2,339 | ) | |
| Net unrealized appreciation | | $ | 5,518,671 | | |
| Minnesota Fund | |
| Aggregate Cost | | $ | 39,536,463 | | |
| Gross unrealized appreciation | | $ | 2,942,819 | | |
| Gross unrealized depreciation | | | (203,694 | ) | |
| Net unrealized appreciation | | $ | 2,739,125 | | |
| New Jersey Fund | |
| Aggregate Cost | | $ | 220,882,262 | | |
| Gross unrealized appreciation | | $ | 21,671,803 | | |
| Gross unrealized depreciation | | | (2,531,418 | ) | |
| Net unrealized appreciation | | $ | 19,140,385 | | |
| Pennsylvania Fund | |
| Aggregate Cost | | $ | 201,064,959 | | |
| Gross unrealized appreciation | | $ | 15,711,088 | | |
| Gross unrealized depreciation | | | (1,082,280 | ) | |
| Net unrealized appreciation | | $ | 14,628,808 | | |
9 Line of Credit
The Funds participate with other portfolios and funds managed by BMR and EVM and their affiliates in a $150 million unsecured line of credit agreement with a group of banks. Borrowings will be made by the portfolios or Funds solely to facilitate the handling of unusual and/or unanticipated short-term cash requirements. Interest is charged to each portfolio or fund based on its borrowings at an amount above either the Eurodollar rate or Federal Funds rate. In addition, a fee computed at an annual rate of 0.10% on the daily unused portion of the line of credit is allocated among the participating portfolios and funds at the end of each quarter. At January 31, 2006, the Michigan Fund had a balance outstanding pursuant to this line of credit of $300,000. The Funds did not have any significant borrowings or allocated fees during the six months ended January 31, 2006.
10 Financial Instruments
The Funds regularly trade in financial instruments with off-balance sheet risk in the normal course of their investing activities to assist in managing exposure to various market risks. These financial instruments include futures contracts, options on financial futures contracts and interest rate swaps and may involve, to a varying degree, elements of risk in excess of the amounts recognized for financial statement purposes. The notional or contractual amounts of these instruments represent the investment a Fund has in particular classes of financial instruments and does not necessarily represent the amounts potentially subject to risk. The measurement of the risks associated with these instruments is meaningful only when all related and offsetting transactions are considered.
64
Eaton Vance Municipals Funds as of January 31, 2006
NOTES TO FINANCIAL STATEMENTS (Unaudited) CONT'D
A summary of obligations under these financial instruments at January 31, 2006 is as follows:
Futures Contracts
| Fund | | Expiration
Date | | Contracts | | Position | | Aggregate
Cost | | Value | | Net Unrealized
Appreciation
(Depreciation) | |
| Arizona | | 03/06 | | 130 U.S. Treasury Bond | | Short | | $ | (14,626,479 | ) | | $ | (14,669,688 | ) | | $ | (43,209 | ) | |
| Colorado | | 03/06 | | 357 U.S. Treasury Bond | | Short | | $ | (7,763,285 | ) | | $ | (7,786,219 | ) | | $ | (22,934 | ) | |
| Connecticut | | 03/06
03/06 | | 190 U.S. Treasury Bond
28 U.S. Treasury Note | | Short
Short | | | $(21,377,161)
(3,054,725) | | | | $(21,440,312)
(3,036,250) | | | | $(63,151)
18,475 | | |
| Michigan | | 03/06
03/06 | | 61 U.S. Treasury Bond
15 U.S. Treasury Note | | Short
Short | | | $(6,863,194)
(1,636,459) | | | | $(6,883,469)
(1,626,562) | | | | $(20,275)
9,897 | | |
| Minnesota | | 03/06 | | 80 U.S. Treasury Bond | | Short | | $ | (9,000,910 | ) | | $ | (9,027,500 | ) | | $ | (26,590 | ) | |
| New Jersey | | 03/06 | | 675 U.S. Treasury Bond | | Short | | $ | (76,074,280 | ) | | $ | (76,169,531 | ) | | $ | (95,251 | ) | |
| Pennsylvania | | 03/06 | | 600 U.S. Treasury Bond | | Short | | $ | (67,220,888 | ) | | $ | (67,706,250 | ) | | $ | (485,362 | ) | |
At January 31, 2006, the Funds had sufficient cash and/or securities to cover margin requirements on open futures contracts.
11 Overdraft Advances
Pursuant to the custodian agreement between the Funds and IBT, IBT may in its discretion advance funds to the Funds to make properly authorized payments. When such payments result in an overdraft by the Funds, the Funds are obligated to repay IBT at the current rate of interest charged by IBT for secured loans (currently, a rate above the Federal Funds rate). This obligation is payable on demand to IBT. IBT has a lien on the Fund's assets to the extent of any overdraft. At January 31, 2006, the Michigan Fund and the Pennsylvania Fund had a payment due to IBT pursuant to the foregoing arrangement of $81,217 and $1,490, respectively.
12 Stock Split
On October 17, 2005, The Trustees of the Michigan Fund approved a 1.1167883-for-1 stock split for Class B shares, effective November 11, 2005. The stock split had no impact on the overall value of a shareholder's investment in the Fund.
65
Eaton Vance Municipals Funds
BOARD OF TRUSTEES' ANNUAL APPROVAL OF THE INVESTMENT ADVISORY AGREEMENTS
The investment advisory agreements between each of Eaton Vance Arizona Municipals Fund, Eaton Vance Colorado Municipals Fund, Eaton Vance Connecticut Municipals Fund, Eaton Vance Michigan Municipals Fund, Eaton Vance Minnesota Municipals Fund, Eaton Vance New Jersey Municipals Fund and Eaton Vance Pennsylvania Municipals Fund (collectively the "Funds" and each individually a "Fund"), and the investment adviser, Boston Management and Research, each provide that the advisory agreement will continue in effect from year to year so long as its continuance is approved at least annually (i) by a vote of a majority of the noninterested Trustees of the Fund cast in person at a meeting called for the purpose of voting on such approval and (ii) by the Trustees of the Fund or by vote of a majority of the outstanding interests of the Fund.
In considering the annual approval of the investment advisory agreements between the Funds and the investment adviser, the Special Committee of the Board of Trustees considered information that had been provided throughout the year at regular Board meetings, as well as information furnished for a series of meetings held in February and March in preparation for a Board meeting held on March 21, 2005 to specifically consider the renewal of the investment advisory agreements. Such information included, among other things, the following:
• An independent report comparing the advisory fees of each Fund with those of comparable funds;
• An independent report comparing the expense ratio of each Fund to those of comparable funds;
• Information regarding Fund investment performance in comparison to relevant peer groups of funds and appropriate indices;
• The economic outlook and the general investment outlook in relevant investment markets;
• Eaton Vance Management's ("Eaton Vance") results and financial condition and the overall organization of the investment adviser;
• The procedures and processes used to determine the fair value of Fund assets and actions taken to monitor and test the effectiveness of such procedures and processes;
• Eaton Vance's management of the relationship with the custodian, subcustodians and fund accountants;
• The resources devoted to compliance efforts undertaken by Eaton Vance on behalf of the funds it manages and the record of compliance with the investment policies and restrictions and with policies on personal securities transactions;
• The quality, nature, cost and character of the administrative and other non-investment management services provided by Eaton Vance and its affiliates; and
• The terms of each advisory agreement and the reasonableness and appropriateness of the particular fee paid by each Fund for the services described therein.
The Special Committee also considered the nature, extent and quality of the management services provided by the investment adviser. In so doing, the Special Committee considered the investment adviser's management capabilities with respect to the types of investments held by each Fund, including information relating to the education, experience and number of investment professionals and other personnel who provide services under the investment advisory agreements. Specifically, the Special Committee considered the investment adviser's 30-person municipal bond team, which includes six portfolio managers and nine credit specialists who provide services to each Fund. The Special Committee noted that the investment adviser's municipal bond team affords the investment adviser extensive in-house research capabilities in addition to the other resources available to the investment adviser. The Special Committee also took into
66
Eaton Vance Municipals Funds
BOARD OF TRUSTEES' ANNUAL APPROVAL OF THE INVESTMENT ADVISORY AGREEMENTS CONT'D
account the time and attention to be devoted by senior management to the Funds and the other funds in the complex. The Special Committee evaluated the level of skill required to manage each Fund and concluded that the human resources available at the investment adviser were appropriate to fulfill effectively its duties on behalf of each Fund.
In its review of comparative information with respect to each Fund's investment performance, the Special Committee concluded that each Fund has performed within a range that the Special Committee deemed competitive. With respect to its review of investment advisory fees, the Special Committee concluded that the fees paid by each Fund are within the range of those paid by comparable funds within the mutual fund industry. In reviewing the information regarding the expense ratio of each Fund, the Special Committee concluded that each Fund's expense ratio is within a range that is competitive with comparable funds.
In addition to the factors mentioned above, the Special Committee reviewed the level of the investment adviser's profits in providing investment management services for each Fund and for all Eaton Vance funds as a group. The Special Committee also reviewed the benefits to Eaton Vance and its affiliates in providing administration services for the Fund and for all Eaton Vance funds as a group. In addition, the Special Committee considered the fiduciary duty assumed by the investment adviser in connection with the services rendered to each Fund and the business reputation of the investment adviser and its financial resources. The Trustees concluded that in light of the services rendered, the profits realized by the investment adviser are not unreasonable. The Special Committee also considered the extent to which the investment adviser appears to be realizing benefits from economies of scale in managing the Funds, and concluded tha t the fee breakpoints which are in place will allow for an equitable sharing of such benefits, when realized, with the shareholders of the Funds.
The Special Committee did not consider any single factor as controlling in determining whether or not to renew the investment advisory agreements. Nor are the items described herein all the matters considered by the Special Committee. In assessing the information provided by Eaton Vance and its affiliates, the Special Committee also took into consideration the benefits to shareholders of investing in a fund that is a part of a large family of funds which provides a large variety of shareholder services.
Based on its consideration of the foregoing factors and conclusions, and such other factors and conclusions as it deemed relevant, and assisted by independent counsel, the Special Committee concluded that the renewal of the investment advisory agreements, including the fee structures, is in the interests of shareholders.
67
Eaton Vance Municipals Funds
INVESTMENT MANAGEMENT
Eaton Vance Municipals Funds
Officers
Robert B. MacIntosh
President and Portfolio
Manager of New Jersey Municipals Fund
William H. Ahern, Jr.
Vice President and Portfolio
Manager of Colorado,
Connecticut and Michigan
Municipals Funds
Craig R. Brandon
Vice President and Portfolio
Manager of Arizona and
Minnesota Municipals Funds
Cynthia J. Clemson
Vice President
James B. Hawkes
Vice President and Trustee
Thomas M. Metzold
Vice President and Portfolio
Manager of Pennsylvania
Municipals Fund
Barbara E. Campbell
Treasurer
Alan R. Dynner
Secretary
Paul M. O'Neil
Chief Compliance Officer | | Trustees
Samuel L. Hayes, III
Chairman
Benjamin C. Esty
William H. Park
Ronald A. Pearlman
Norton H. Reamer
Lynn A. Stout
Ralph F. Verni | |
|
68
Investment Adviser
Boston Management and Research
The Eaton Vance Building
255 State Street
Boston, MA 02109
Administrator of the Funds
Eaton Vance Management
The Eaton Vance Building
255 State Street
Boston, MA 02109
Principal Underwriter
Eaton Vance Distributors, Inc.
The Eaton Vance Building
255 State Street
Boston, MA 02109
Custodian
Investors Bank & Trust Company
200 Clarendon Street
Boston, MA 02116
Transfer Agent
PFPC Inc.
Attn: Eaton Vance Funds
P.O. Box 9653
Providence, RI 02940-9653
(800) 262-1122
Eaton Vance Municipals Trust
The Eaton Vance Building
255 State Street
Boston, MA 02109
This report must be preceded or accompanied by a current prospectus. Before investing, investors should consider carefully a Fund's investment objective(s), risks, and charges and expenses. The Funds' current prospectus contains this and other information about each Fund and is available through your financial advisor. Please read the prospectus carefully before you invest or send money. For further information please call 1-800-225-6265.
313-3/06 7CSRC
Item 2. Code of Ethics
The registrant has adopted a code of ethics applicable to its Principal Executive Officer, Principal Financial Officer and Principal Accounting Officer. The registrant undertakes to provide a copy of such code of ethics to any person upon request, without charge, by calling 1-800-262-1122.
Item 3. Audit Committee Financial Expert
The registrant’s Board has designated William H. Park, Samuel L. Hayes, III and Norton H. Reamer, each an independent trustee, as its audit committee financial experts. Mr. Park is a certified public accountant who is the Vice Chairman of Commercial Industrial Finance Corp (specialty financial company). Previously he served as President and Chief Executive Officer of Prizm Capital Management, LLC (investment management firm) and as Executive Vice President and Chief Financial Officer of United Asset Management Corporation (“UAM”) (a holding company owning institutional investment management firms). Mr. Hayes is the Jacob H. Schiff Professor of Investment Banking Emeritus of the Harvard University Graduate School of Business Administration. Mr. Reamer is the President, Chief Executive Officer and a Director of Asset Management Finance Corp. (a specialty finance company serving the investment management industry) and is President of Unicorn Corporation (an investment and financial advisory services company). Formerly, Mr. Reamer was Chairman of Hellman, Jordan Management Co., Inc. (an investment management company) and Advisory Director of Berkshire Capital Corporation (an investment banking firm), Chairman of the Board of UAM and Chairman, President and Director of the UAM Funds (mutual funds).
Item 4. Principal Accountant Fees and Services
Not required in this filing
Item 5. Audit Committee of Listed registrants
Not required in this filing.
Item 6. Schedule of Investments
Please see schedule of investments contained in the Report to Stockholders included under Item 1 of this Form N-CSR.
Item 7. Disclosure of Proxy Voting Policies and Procedures for Closed-End Management Investment Companies
Not required in this filing.
Item 8. Portfolio Managers of Closed-End Management Investment Companies
Not required in this filing.
Item 9. Purchase of Equity Securities by Closed-End Management Investment Company and Affiliated Purchases.
Not required in this filing.
Item 10. Submission of Matters to a Vote of Security Holders.
Effective February 7, 2005, the Governance Committee of the Board of Trustees revised the procedures by which a Fund’s shareholders may recommend nominees to the registrant’s Board of Trustees to add the following (highlighted):
The Governance Committee shall, when identifying candidates for the position of Independent Trustee, consider any such candidate recommended by a shareholder of a Fund if such recommendation contains (i)sufficient background information concerning the candidate, including evidence the candidate is willing to serve as an Independent Trustee if selected for the position; and (ii) is received in a sufficiently timely manner (and in any event no later than the date specified for receipt of shareholder proposals in any applicable proxy statement with respect to a Fund). Shareholders shall be directed to address any such recommendations in writing to the attention of the Governance Committee, c/o the Secretary of the Fund. The Secretary shall retain copies of any shareholder recommendations which meet the foregoing requirements for a period of not more than 12 months following receipt. The Secretary shall have no obligation to acknowledge receipt of any shareholder recommendations.
Item 11. Controls and Procedures
(a) It is the conclusion of the registrant’s principal executive officer and principal financial officer that the effectiveness of the registrant’s current disclosure controls and procedures (such disclosure controls and procedures having been evaluated within 90 days of the date of this filing) provide reasonable assurance that the information required to be disclosed by the registrant has been recorded, processed, summarized and reported within the time period specified in the Commission’s rules and forms and that the information required to be disclosed by the registrant has been accumulated and communicated to the registrant’s principal executive officer and principal financial officer in order to allow timely decisions regarding required disclosure.
(b) There have been no changes in the registrant’s internal controls over financial reporting during the second fiscal quarter of the period covered by this report that has materially affected, or is reasonably likely to materially affect the registrant’s internal control over financial reporting.
Item 12. Exhibits
(a)(1) Registrant’s Code of Ethics – Not applicable (please see Item 2).
(a)(2)(i) Treasurer’s Section 302 certification.
(a)(2)(ii) President’s Section 302 certification.
(b) Combined Section 906 certification.
Signatures
Pursuant to the requirements of the Securities Exchange Act of 1934 and the Investment Company Act of 1940, the registrant has duly caused this report to be signed on its behalf by the undersigned, thereunto duly authorized.
Eaton Vance Municipals Trust
| By: | /s/ Robert B. MacIntosh | |
| Robert B. MacIntosh |
| President |
| |
| |
Date: | March 16, 2006 |
Pursuant to the requirements of the Securities Exchange Act of 1934 and the Investment Company Act of 1940, this report has been signed below by the following persons on behalf of the registrant and in the capacities and on the dates indicated.
| By: | /s/ Barbara E. Campbell | |
| Barbara E. Campbell |
| Treasurer |
| |
| |
Date: | March 16, 2006 |
By: | /s/ Robert B. MacIntosh | |
| Robert B. MacIntosh |
| President |
| |
| |
Date: | March 16, 2006 |